UNITED STATES
SECURITIES AND EXCHANGE COMMISSION
Washington, D.C. 20549
FORM N-CSR
CERTIFIED SHAREHOLDER REPORT OF REGISTERED
MANAGEMENT INVESTMENT COMPANIES
Investment Company Act file number 811-07883
ICON Funds
(Exact name of registrant as specified in charter)
5299 DTC Blvd. Suite 1200 Greenwood Village, CO 80111
(Address of principal executive offices) (Zip code)
Erik L. Jonson 5299 DTC Blvd. Suite 1200 Greenwood Village, CO 80111
(Name and address of agent for service)
Registrant’s telephone number, including area code: 303-790-1600
Date of fiscal year end: September 30, 2011
Date of reporting period: September 30, 2011
TABLE OF CONTENTS
Item 1. Reports to Stockholders.

2011 ANNUAL REPORT
ICON DIVERSIFIED FUNDS
INVESTMENT UPDATE
ICON Bond Fund
ICON Core Equity Fund
ICON Equity Income Fund
ICON Long/Short Fund
ICON Risk-Managed Equity Fund

1-800-764-0442 | www.iconfunds.com
AR-DIV-11 K21585

You can now sign up for electronic delivery of ICON Fund shareholder reports, including prospectuses, annual reports, semiannual reports and proxy statements.
When these materials are available, you will receive an email from ICON with instructions on how to view the documents. Statements, transaction confirmations and other documents that are not available online will continue to be sent to you by U.S. mail.
Visit ICON’s website at www.iconfunds.com to learn more and sign up.
You may change or cancel your participation in eDelivery by visiting www.iconfunds.com, or you can request a hard copy of any of the materials free of charge by calling ICON Funds at 1-800-764-0442.
1-800-764-0442 • www.iconfunds.com
TABLEOF CONTENTS
ABOUT THIS REPORT (UNAUDITED)
Historical Returns
All total returns mentioned in this Report account for the change in a Fund’s per-share price and the reinvestment of any dividends, capital gain distributions and adjustments for financial statement purposes. If your account is set up to receive Fund distributions in cash rather than to reinvest them, your actual return may differ from these figures. The Funds’ performance results do not reflect the deduction of taxes that a shareholder would pay on Fund distributions or on the redemption of Fund shares. The Adviser may have reimbursed certain fees or expenses of some of the Funds. If not for these reimbursements, performance would have been lower. Fund results shown, unless otherwise indicated, are at net asset value. If a sales charge (maximum 5.75%) had been deducted, results would have been lower.
Past performance does not guarantee future results. Investment return and principal value will fluctuate so that an investor’s shares, when redeemed, may be worth more or less than their original cost. Performance results represent past performance, and current performance may be higher or lower. Please call 1-800-764-0442 or visit www.iconfunds.com for performance results current to the most recent month-end.
Portfolio Data
This Report reflects ICON’s views, opinions and portfolio holdings as of September 30, 2011, the end of the reporting period. The information is not a complete analysis of every aspect of any sector, industry, security or the Funds.
Opinions and forecasts regarding industries, companies and/or themes, and portfolio composition and holdings are subject to change at any time based on market and other conditions, and should not be construed as a recommendation of any specific security, industry or sector. Each Fund’s holdings as of September 30, 2011 are included in each Fund’s Schedule of Investments.
According to ICON, value investing is an analytical approach to investing that employs various factors, including projecting earnings growth estimates, in an effort to determine whether securities are over- or underpriced relative to ICON’s estimates of their intrinsic value. Value investing involves risks and uncertainties and does not guarantee better performance or lower costs than other investment methodologies. ICON’s value-to-price ratio (“V/P”) is a ratio of intrinsic value, as calculated using ICON’s proprietary valuation methodology, of a broad range of domestic and international securities within ICON’s system as compared to the current market price of those securities. The ICON system relies on the integrity of financial statements released to the market as part of our analysis.
This Report contains statements regarding industry or sector themes, new market themes, investment outlook, relative strength, value-to-price ratios, and investment team expectations, beliefs, goals and the like that are based on current expectations, recent individual stock performance relative to current market prices, estimates of company values and other information supplied to the market by the companies we follow. Words such as “expects,” “suggests,” “anticipates,” “targets,” “goals,” “value,” “intrinsic value,” “indicates,” “believes,” “considers,” “estimates,” variations of such words and similar expressions are intended to identify forward looking statements, which are not statements of historical fact. Forward looking statements are not guarantees of future performance and involve certain risks, uncertainties and assumptions that are difficult to assess. These risks and uncertainties are based on a number of important factors, including, among others: stock price fluctuations; the integrity and accuracy of historical and projected financial and other information supplied by companies to the public or assumptions based on such information supplied; interest rates; bond yields; future earnings growth rates; the risks noted in this Report and other factors beyond the control of our investment team but used by the investment team to influence their assumptions. Therefore, actual outcome may differ materially from what is expressed in such forward looking statements.
There are risks associated with mutual fund investing, including the loss of principal. The likelihood of loss may be greater if you invest for a shorter period of time. There is no assurance that the investment process will consistently lead to successful results.
There are risks associated with selling short, including the risk that the ICON Long/Short Fund may have to cover its short position at a higher price than the short price, resulting in a loss. The ICON Long/Short Fund’s loss on a short sale is potentially unlimited as a loss occurs when the value of a security sold short increases. Call options involve certain risks, such as limited gains and lack of liquidity in the underlying securities, and are not suitable for all investors.
Investing in fixed income securities such as bonds involves interest rate risk. When interest rates rise, the value of fixed income securities generally decreases. The ICON Bond Fund may invest up to 25% of its assets in high-yield bonds that are below investment grade. High-yield bonds involve a greater risk of default and price volatility than U.S. Government and other higher-quality bonds.
An investment concentrated in sectors and industries may involve greater risk and volatility than a more diversified investment.
Investments in foreign securities may entail unique risks, including political, market, and currency risks. Financial statements of foreign companies are governed by different accounting, auditing, and financial standards than U.S. companies and may be less transparent and uniform than in the United States. Many corporate governance standards, which help ensure the integrity of public information in the United States, do not exist in foreign countries. In general, there may be less governmental supervision of foreign stock exchanges and securities brokers and issuers. The ICON system relies on the integrity of financial statements released to the market as part of our analysis.
The prospectus and statement of additional information contain this and other information about the Funds and are available by visiting www.iconfunds.com or calling 1-800-764-0442. Please read the prospectus and statement of additional information carefully.
Comparative Indexes
The comparative indexes discussed in this Report are meant to provide a basis for judging a Fund’s performance against specific securities indexes. Each index shown accounts for both change in the security price and reinvestment of dividends and distributions (except as noted), but does not reflect the costs of managing a mutual fund. The Funds’ portfolios may significantly differ in holdings and composition from the index. Individuals cannot invest directly in an index.
| • | | The unmanaged Standard & Poor’s (“S&P”) Composite 1500 Index (“S&P Composite 1500 Index”) is a broad-based capitalization-weighted index comprising 1,500 stocks of large-cap, mid-cap, and small-cap U.S. companies. |
| • | | The unmanaged Barclays Capital U.S. Universal Index represents the union of the U.S. Aggregate Index, the U.S. High-Yield Corporate Index, the 144A Index, the Eurodollar Index, the Emerging Markets Index, the non-ERISA portion of the Commercial Mortgage-Backed Securities (“CMBS”) Index and the CMBS High-Yield Index. All securities in this market-value weighted index have at least one year remaining to maturity and meet certain minimum issue size criteria. |
| • | | The unmanaged Barclays Capital U.S. Universal Index (ex-MBS) represents the Barclays Capital U.S. Universal Index without including the CMBS Index and the CMBS High-Yield Index. |
Index returns and statistical data included in this Report are provided by FactSet Research Systems.
Financial Intermediary
If you purchase the Fund through a broker-dealer or other financial intermediary (such as a bank), the Fund and its related companies may pay the intermediary for the sale of Fund shares and related services. These payments may influence the broker-dealer or other intermediary and your salesperson to recommend the Fund over another investment. Ask your salesperson or visit your financial intermediary’s website for more information.
MESSAGE FROM ICON FUNDS
Dear Shareholder,
As valuation investors, we look for quality companies priced below our estimate of intrinsic value. We will buy stocks we believe are “on sale” when investors get distracted by a particular news story or headline and worry about its potential impact on the economy in general and the markets in particular. When this happens, stocks are temporarily priced based on worst-case scenario projections, not on their fundamentals. As concerns subside, prices often move up toward the stock’s intrinsic value and may even exceed ICON’s estimate of value when excessive worry is replaced with excessive optimism. Implementing our valuation strategy does not require an information edge; it simply requires discipline. Our system needs discipline to filter out news headlines, concentrate on value, and, frequently, buy when most are selling and sell when most are buying. ICON’s discipline requires also the willingness to take strong industry and sector tilts. We see industries and sectors becoming overpriced and underpriced through cycles as investors change their views of the economy and migrate around the universe of stocks.
In spite of a volatile 12 months, we believe the stock market is in a multi-year recovery from the financial crisis and recession of 2008-2009. Stocks were generally priced far below our estimate of their fair value when the market hit its recent low in March 2009, but their ascent toward fair value has been choppy and severely interrupted at least twice; first in the summer of 2010 and then again during the summer of 2011. Both times, sharp drops in stock prices were precipitated by concerns over the European sovereign debt crisis. Investors were especially wary of the situation in Greece, but also, to a lesser extent, investors worried about the economies of Ireland, Spain and Italy. We thought these concerns were excessive in 2010 and we continue to believe the concern is unwarranted. We expect fears to subside and, when that happens, we believe stocks will resume their recovery path.
The interruptions experienced during the summers of 2010 and 2011 have been frustrating for value investors like ICON, as we see a very different world than many other investors. Where others see a negative macroeconomic outlook, we see positive earnings and solid company fundamentals. When 2011 second quarter earnings were announced, companies in the S&P 500 Index reported earnings that were, on average, 16.24% higher than a year earlier. In fact, 75% of those companies reported earnings that exceeded analysts’ estimates by 4.67% on average. This growth in earnings is more robust than the earnings we saw coming out of any of the previous four recessions (that is, 1974, 1982, 1992 and 2001 recessions). Strong earnings and a low interest rate environment contribute to what we
| | |
| 6 | | MESSAGE FROM ICON FUNDS |
believe are attractive valuations, but skittish investors, concerned with debt problems in Europe, continue to shy away from equities.
We have seen investors turn their backs on solid fundamentals many times before. Historically, however, investors have come to gradually embrace these fundamentals and stock prices generally rise again to meet intrinsic value. In 1990, 1998 and 2010, for example, the market experienced a decline similar in magnitude and duration to that seen during the summer of 2011. Each market bottom led to anxiety over a worsening recession, but, months later, these fears proved unfounded. Stock prices rebounded and resumed their prior upward path. As we head into a new fiscal year, we are anticipating a similar rebound. Having two major market interruptions in two consecutive summers is unusual, unsettling and has admittedly made it difficult for investors to stay the course to recovery. The volatile environment also presented problems for money managers like ICON who struggled with abrupt and extreme industry and sector theme reversals.
As fiscal year 2011 comes to an end, we still believe cyclical, economically sensitive industries are the long term leaders for this multi-year recovery. Unfortunately, these same industries can be subject to dramatic market swings when investors, worried about the economy, panic and jump out of the market. We believe the old Wall Street adage still applies: “Stocks climb a wall of worry.” The climb back from the recession and financial crisis of 2008 and 2009 has been and will continue to be riddled with worry.
As always, we remain focused on value and company fundamentals as we try to filter out the conjecture and emotions that typically contribute to market volatility. Experienced sailors will tell someone who is seasick: “Don’t look at the waves; look at the horizon.” Lately, it seems, most investors have been focused on the waves. At ICON, we like to focus on a horizon that includes quality companies, with growing earnings, priced far below our estimate of their fair value. We will continue to stay this course.
Yours truly,

Craig T Callahan, DBA
Chairman of the Board of Trustees and President of the Adviser
| | | | |
| MESSAGE FROM ICON FUNDS | | | 7 | |
| | | | |
MANAGEMENT OVERVIEW ICON BOND FUND | | Class I Class C Class Z Class A | | IOBIX IOBCX IOBZX IOBAX |
| Q. | How did the Fund perform relative to its benchmark? |
| A. | For the Fund’s fiscal year ended September 30, 2011, the ICON Bond Fund underperformed its benchmark, the Barclays Capital US Universal ex MBS Index. For the fiscal year the Fund returned -0.19% for the Class I shares, -0.68% for the Class C shares (and -1.53% with maximum sales charge), -0.02% for the Class A shares (and -4.77% with maximum sales charge) and 0.15% for the Class Z shares, while the Barclays Capital US Universal ex MBS Index returned 4.47% and the Barclays Capital US Universal Index returned 4.77%.1 Total returns for other periods as of September 30, 2011 appear in the subsequent pages of this Fund’s Management Overview. |
| 1 | The Fund changed its benchmark to the Barclays Capital US Universal ex MBS Index on January 24, 2011 because the Fund has not significantly invested in asset-backed securities in the past and has no present intent to do so in the immediate future. |
| Q. | What primary factors were behind the Fund’s relative performance? |
| A. | While the majority of headline news has been focused on volatility in the equity market, the fixed income market experienced similar movement, creating a challenging environment for the ICON Bond Fund. The fiscal year can be broken down into two distinct time periods based on the differences in performance between corporate bonds and the “risk free” safe haven of Treasury securities. Utilizing ICON’s valuation system, which is quantitatively based on comparing historical relationships across the credit curve to current relationships, the Fund began the fiscal year with an overweight position in corporate bonds and underweight position in Treasury securities as historical risk-return relationships pointed to a continuation of corporate credit spread tightening amidst an environment of rising interest rates. Because of the Fund’s overweight position in corporate bonds, the Fund did well during the first half of the fiscal year as investors sold off Treasury securities, increasing the yield on the 10-Year Treasury from 2.51% on 09/30/10 to 3.47% on 03/31/11. At the same time corporate credit spreads, as measured by comparing Moody’s Baa Index Yields to the US 10-year Constant Maturity Treasury yield, tightened from 307 bps. to 258 bps. During the first half of the fiscal year, corporate bonds with lower credit quality also fared well with the Barclays Capital US High Yield Corporate Index posting gains in excess of 7%. |
The second half of the fiscal year saw investors shift their focus away from improving corporate fundamentals and towards European sovereign debt concerns and slowing domestic economic growth. Initially, safe haven buying of Treasury securities was relatively muted as 10-year yields fell by 47 bps. to 3% from 03/31/11 to 06/30/11. However, increasing fears surrounding European debt combined with additional monetary stimulus from the Federal Reserve, in the form of “Operation Twist,” caused Treasury yields to collapse, finishing the fiscal year at 1.92%. Inversely, corporate bond spreads, again measured by comparing Moody’s Baa Index Yields to the US 10-year Constant Maturity Treasury yield, widened significantly from 258 bps on 03/31/11 to finish the year at 330 bps on 09/30/11. This reversal resulted in the Fund underperforming as our valuation methodology indicated that corporate bonds were undervalued while Treasuries were overvalued throughout the entire fiscal year.
| Q. | How did the Fund’s composition affect performance? |
| A. | As stated above, the Fund’s overweight position in corporate bonds during the fiscal year affected performance negatively. Further, although the Fund’s significant underweight position in perceived “risk free” Treasuries benefitted the Fund’s performance relative to the benchmark during the first half of the fiscal year, the strong reversal during the second half of the year resulted in negative overall allocation effect. The Fund’s corporate bond allocation also resulted in underperformance relative to the benchmark as our methodology pointed us towards both the Financial sector and the high yield segment of the market. Both of these areas underperformed during the fiscal year. Finally, while the Fund’s exposure to floating rate notes aided relative performance in the face of rising yields at the outset of the fiscal year, this overweight exposure negatively impacted relative performance in the second half of the year as the Federal Reserve’s announcement that it intended to maintain low interest rates into 2013 made variable rate investments unattractive. |
| Q. | What is your investment outlook for the bond market? |
| A. | ICON’s valuation system continues to see significant value in intermediate to long term corporate bonds. On the Treasury side, continued purchases by the Federal Reserve should provide enough support to aid further economic expansion. However, this action has lowered interest rates to a level that makes investment in these securities unattractive from a valuation perspective. On the corporate side, credit spreads widened over the fiscal year due to a barrage of economic concerns. However, default rates continue to decline across all |
| | credit qualities. This environment of declining default rates coupled with widening credit spreads creates very attractive valuation disconnects which have historically resulted in positive returns for patient investors. We believe once economic concerns subside, corporate bond spreads will resume the tightening trend that began in 2009. |
ICON Bond Fund
Credit Diversification
September 30, 2011
| | | | |
A1 | | | 1.7% | |
A2 | | | 4.7% | |
A3 | | | 12.6% | |
Aa2 | | | 2.6% | |
Aa3 | | | 2.5% | |
B1 | | | 6.0% | |
B2 | | | 1.2% | |
B3 | | | 1.6% | |
Ba1 | | | 4.6% | |
Ba2 | | | 4.4% | |
| | | | |
Baa1 | | | 9.1% | |
Baa2 | | | 14.1% | |
Baa3 | | | 22.8% | |
| | | | |
| | | 87.9% | |
| | | | |
Percentages are based upon corporate and foreign corporate bond investments as a percentage of net assets.
Ratings based on Moody’s Investors Service, Inc.
ICON Bond Fund
Average Annual Total Return
as of September 30, 2011
| | | | | | | | | | | | | | | | | | | | | | | | |
| | | Inception
Date | | | 1 Year | | | 5 Years | | | Since
Inception | | | Gross
Expense
Ratio* | | | Net
Expense
Ratio* | |
ICON Bond Fund - Class I | | | 9/30/02 | | | | -0.19% | | | | 5.21% | | | | 4.80% | | | | 1.13% | | | | 1.00% | |
Barclays Capital U.S. Universal Index | | | | | | | 4.77% | | | | 6.40% | | | | 5.66% | | | | N/A | | | | N/A | |
Barclays Capital U.S. Universal Index (ex-MBS) | | | | | | | 4.47% | | | | 6.17% | | | | 5.72% | | | | N/A | | | | N/A | |
ICON Bond Fund - Class C | | | 10/21/02 | | | | -0.68% | | | | 4.59% | | | | 4.48% | | | | 2.46% | | | | 1.60% | |
Barclays Capital U.S. Universal Index | | | | | | | 4.77% | | | | 6.40% | | | | 5.92% | | | | N/A | | | | N/A | |
Barclays Capital U.S. Universal Index (ex-MBS) | | | | | | | 4.47% | | | | 6.17% | | | | 6.06% | | | | N/A | | | | N/A | |
ICON Bond Fund - Class Z | | | 5/6/04 | | | | 0.15% | | | | 5.46% | | | | 4.84% | | | | 1.39% | | | | 0.75% | |
Barclays Capital U.S. Universal Index | | | | | | | 4.77% | | | | 6.40% | | | | 5.91% | | | | N/A | | | | N/A | |
Barclays Capital U.S. Universal Index (ex-MBS) | | | | | | | 4.47% | | | | 6.17% | | | | 5.78% | | | | N/A | | | | N/A | |
ICON Bond Fund - Class A | | | 9/30/10 | | | | -0.02% | | | | N/A | | | | -0.02% | | | | 1.13% | | | | 1.00% | |
ICON Bond Fund - Class A (including maximum sales charge of 4.75%) | | | 9/30/10 | | | | -4.77% | | | | N/A | | | | -4.76% | | | | 1.13% | | | | 1.00% | |
Barclays Capital U.S. Universal Index | | | | | | | 4.77% | | | | N/A | | | | 4.77% | | | | N/A | | | | N/A | |
Barclays Capital U.S. Universal Index (ex-MBS) | | | | | | | 4.47% | | | | N/A | | | | 4.47% | | | | N/A | | | | N/A | |
Past performance is not a guarantee of future results. Information about these performance results and the comparative indexes can be found in the About This Report section. The Adviser has agreed to limit certain Fund expenses; without these limitations, returns would have been lower. The limitation provisions may be terminated in the future. Class Z shares are available only to institutional investors.
| * | Please see the most recent prospectus for details. |
Class C total returns exclude applicable sales charges. If sales charges were included returns would be lower.
ICON Bond Fund
Value of a $10,000 Investment
through September 30, 2011
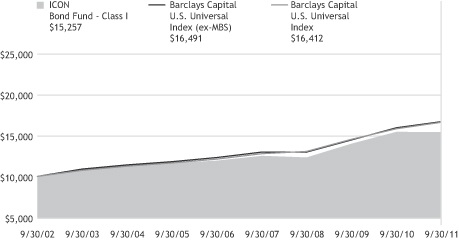
Past performance is not a guarantee of future results. The above graph compares a $10,000 investment made in the Fund’s Class I shares on the Class’ inception date of 9/30/02 to a $10,000 investment made in an unmanaged securities index on that date. Performance for the Fund’s other share classes will vary due to differences in charges and expenses. The Fund’s performance in this chart and the performance table assumes the reinvestment of dividends and capital gain distributions but does not reflect the deduction of taxes that a shareholder would pay on Fund distributions or on the redemption of Fund shares.
ICON BOND FUND
SCHEDULEOF INVESTMENTS
SEPTEMBER 30, 2011
| | | | | | | | | | | | | | | | |
| Shares or Principal Amount | | Interest
Rate | | | Maturity
Date | | | Value | |
| | | | | | | | | | | | | | | | |
| | Corporate Bonds (80.2%) | |
| $ | 220,000 | | | ACE INA Holdings, Inc. | | | 8.88 | % | | | 08/15/29 | | | $ | 308,157 | |
| | 800,000 | | | AES Corp. | | | 7.75 | % | | | 10/15/15 | | | | 812,000 | |
| | 1,000,000 | | | Alcoa, Inc. | | | 6.75 | % | | | 07/15/18 | | | | 1,071,104 | |
| | 950,000 | | | Alcoa, Inc. | | | 5.72 | % | | | 02/23/19 | | | | 953,448 | |
| | 1,000,000 | | | Alcoa, Inc. | | | 6.75 | % | | | 01/15/28 | | | | 1,034,944 | |
| | 1,000,000 | | | Allied Waste North America, Inc. | | | 6.88 | % | | | 06/01/17 | | | | 1,068,750 | |
| | 2,000,000 | | | Ally Financial, Inc. | | | 6.75 | % | | | 12/01/14 | | | | 1,938,732 | |
| | 1,000,000 | | | Ameren Energy Generating Co.(a) | | | 7.00 | % | | | 04/15/18 | | | | 1,012,500 | |
| | 1,440,000 | | | American Express Bank FSB(b) | | | 0.53 | % | | | 06/12/17 | | | | 1,323,238 | |
| | 1,000,000 | | | American Express Co. | | | 7.00 | % | | | 03/19/18 | | | | 1,183,027 | |
| | 400,000 | | | American International Group, Inc. | | | 5.38 | % | | | 10/18/11 | | | | 399,500 | |
| | 900,000 | | | American International Group, Inc. | | | 4.25 | % | | | 05/15/13 | | | | 897,831 | |
| | 900,000 | | | American International Group, Inc. | | | 8.25 | % | | | 08/15/18 | | | | 997,602 | |
| | 800,000 | | | Avnet, Inc. | | | 6.00 | % | | | 09/01/15 | | | | 864,858 | |
| | 250,000 | | | Bank of America Corp. | | | 5.42 | % | | | 03/15/17 | | | | 217,191 | |
| | 900,000 | | | Bank of America Corp. | | | 5.63 | % | | | 07/01/20 | | | | 828,956 | |
| | 1,000,000 | | | Bank of America Corp. | | | 6.80 | % | | | 03/15/28 | | | | 975,829 | |
| | 950,000 | | | Bank of America NA(b) | | | 0.65 | % | | | 06/15/17 | | | | 698,668 | |
| | 1,000,000 | | | BB&T Corp. | | | 5.25 | % | | | 11/01/19 | | | | 1,089,943 | |
| | 850,000 | | | Best Buy Co., Inc. | | | 5.50 | % | | | 03/15/21 | | | | 772,330 | |
| | 401,000 | | | Bill Barrett Corp. | | | 9.88 | % | | | 07/15/16 | | | | 437,090 | |
| | 950,000 | | | Citigroup, Inc. | | | 6.00 | % | | | 08/15/17 | | | | 1,008,173 | |
| | 1,000,000 | | | Citigroup, Inc. | | | 6.13 | % | | | 05/15/18 | | | | 1,072,604 | |
| | 500,000 | | | Comcast Cable Holdings LLC | | | 9.80 | % | | | 02/01/12 | | | | 513,491 | |
| | 1,000,000 | | | Commercial Metals Co. | | | 7.35 | % | | | 08/15/18 | | | | 1,017,166 | |
| | 1,000,000 | | | Computer Sciences Corp. | | | 6.50 | % | | | 03/15/18 | | | | 1,080,137 | |
| | 900,000 | | | Cooper Tire & Rubber Co. | | | 7.63 | % | | | 03/15/27 | | | | 792,000 | |
| | 114,000 | | | Cox Communications, Inc. | | | 7.63 | % | | | 06/15/25 | | | | 149,041 | |
| | 450,000 | | | Dean Foods Co. | | | 6.90 | % | | | 10/15/17 | | | | 420,750 | |
| | 950,000 | | | Delphi Financial Group, Inc. | | | 7.88 | % | | | 01/31/20 | | | | 1,090,151 | |
| | 500,000 | | | Denbury Resources, Inc. | | | 9.75 | % | | | 03/01/16 | | | | 540,000 | |
| | 450,000 | | | Exelon Generation Co. LLC | | | 5.35 | % | | | 01/15/14 | | | | 481,640 | |
| | 750,000 | | | Exelon Generation Co. LLC | | | 6.20 | % | | | 10/01/17 | | | | 845,688 | |
| | 900,000 | | | Exelon Generation Co. LLC | | | 4.00 | % | | | 10/01/20 | | | | 894,757 | |
| | 23,000 | | | FirstEnergy Corp., Series B | | | 6.45 | % | | | 11/15/11 | | | | 23,125 | |
| | | | |
| SCHEDULEOF INVESTMENTS | | | 13 | |
| | | | | | | | | | | | | | | | |
| Shares or Principal Amount | | Interest
Rate | | | Maturity
Date | | | Value | |
| | | | | | | | | | | | | | | | |
| $ | 1,000,000 | | | Ford Motor Credit Co. LLC | | | 5.63 | % | | | 09/15/15 | | | $ | 1,005,915 | |
| | 600,000 | | | Freeport-McMoRan Copper & Gold, Inc. | | | 8.38 | % | | | 04/01/17 | | | | 643,500 | |
| | 1,000,000 | | | Frontier Communications Corp. | | | 8.13 | % | | | 10/01/18 | | | | 980,000 | |
| | 900,000 | | | Gap, Inc. | | | 5.95 | % | | | 04/12/21 | | | | 846,528 | |
| | 500,000 | | | General Electric Capital Corp. | | | 4.75 | % | | | 09/15/14 | | | | 535,444 | |
| | 1,000,000 | | | General Electric Capital Corp.(a)(b) | | | 0.48 | % | | | 05/11/16 | | | | 922,515 | |
| | 397,000 | | | Genworth Financial, Inc. | | | 5.65 | % | | | 06/15/12 | | | | 401,410 | |
| | 1,000,000 | | | Goldman Sachs Group, Inc.(b) | | | 0.81 | % | | | 03/22/16 | | | | 857,593 | |
| | 1,000,000 | | | Goldman Sachs Group, Inc. | | | 5.95 | % | | | 01/15/27 | | | | 974,468 | |
| | 900,000 | | | Goodyear Tire & Rubber Co.(a) | | | 8.25 | % | | | 08/15/20 | | | | 915,750 | |
| | 1,000,000 | | | Hartford Financial Services Group, Inc. | | | 6.30 | % | | | 03/15/18 | | | | 1,033,682 | |
| | 1,000,000 | | | HCP, Inc. | | | 5.65 | % | | | 12/15/13 | | | | 1,050,297 | |
| | 1,500,000 | | | HCP, Inc. | | | 6.30 | % | | | 09/15/16 | | | | 1,604,880 | |
| | 500,000 | | | HCP, Inc. | | | 6.70 | % | | | 01/30/18 | | | | 540,245 | |
| | 1,000,000 | | | Horace Mann Educators Corp. | | | 6.85 | % | | | 04/15/16 | | | | 1,086,839 | |
| | 500,000 | | | HSBC Finance Corp. | | | 4.75 | % | | | 07/15/13 | | | | 516,915 | |
| | 474,700 | | | JC Penney Corp., Inc. | | | 7.95 | % | | | 04/01/17 | | | | 505,556 | |
| | 450,000 | | | John Hancock Life Insurance Co.(c)(d) | | | 7.38 | % | | | 02/15/24 | | | | 528,110 | |
| | 1,000,000 | | | JPMorgan Chase Bank NA(b) | | | 0.67 | % | | | 06/13/16 | | | | 917,509 | |
| | 1,000,000 | | | Lincoln National Corp. | | | 7.00 | % | | | 03/15/18 | | | | 1,145,875 | |
| | 1,000,000 | | | Lincoln National Corp. | | | 8.75 | % | | | 07/01/19 | | | | 1,185,269 | |
| | 1,400,000 | | | Lorillard Tobacco Co.(a) | | | 6.88 | % | | | 05/01/20 | | | | 1,552,499 | |
| | 1,000,000 | | | Masco Corp. | | | 6.13 | % | | | 10/03/16 | | | | 975,183 | |
| | 350,000 | | | Merrill Lynch & Co., Inc. | | | 5.45 | % | | | 02/05/13 | | | | 346,859 | |
| | 1,500,000 | | | Morgan Stanley(a) | | | 4.75 | % | | | 04/01/14 | | | | 1,425,478 | |
| | 900,000 | | | Morgan Stanley(b) | | | 0.73 | % | | | 10/15/15 | | | | 760,029 | |
| | 950,000 | | | Morgan Stanley | | | 3.50 | % | | | 10/15/20 | | | | 866,875 | |
| | 1,000,000 | | | National City Bank(b) | | | 0.70 | % | | | 06/07/17 | | | | 915,629 | |
| | 1,000,000 | | | National City Corp. | | | 6.88 | % | | | 05/15/19 | | | | 1,148,928 | |
| | 500,000 | | | Newfield Exploration Co. | | | 7.13 | % | | | 05/15/18 | | | | 517,500 | |
| | 122,000 | | | NLV Financial Corp.(c)(d) | | | 6.50 | % | | | 03/15/35 | | | | 109,236 | |
| | 1,000,000 | | | NRG Energy, Inc. | | | 7.38 | % | | | 01/15/17 | | | | 1,031,250 | |
| | 600,000 | | | Pitney Bowes, Inc. | | | 4.75 | % | | | 05/15/18 | | | | 601,389 | |
| | 750,000 | | | PPL Energy Supply LLC | | | 6.50 | % | | | 05/01/18 | | | | 877,314 | |
| | 180,000 | | | Provident Cos., Inc. | | | 7.00 | % | | | 07/15/18 | | | | 202,908 | |
| | 1,000,000 | | | Reynolds American, Inc. | | | 7.25 | % | | | 06/01/12 | | | | 1,039,499 | |
| | 900,000 | | | Reynolds American, Inc. | | | 7.25 | % | | | 06/01/13 | | | | 981,886 | |
| | 1,000,000 | | | Rowan Cos., Inc. | | | 7.88 | % | | | 08/01/19 | | | | 1,180,730 | |
| | 500,000 | | | RR Donnelley & Sons Co. | | | 4.95 | % | | | 04/01/14 | | | | 472,500 | |
| | 1,350,000 | | | RR Donnelley & Sons Co. | | | 6.13 | % | | | 01/15/17 | | | | 1,171,125 | |
| | 900,000 | | | RR Donnelley & Sons Co.(a) | | | 6.63 | % | | | 04/15/29 | | | | 722,250 | |
| | |
| 14 | | SCHEDULEOF INVESTMENTS |
| | | | | | | | | | | | | | | | |
| Shares or Principal Amount | | Interest
Rate | | | Maturity
Date | | | Value | |
| | | | | | | | | | | | | | | | |
| $ | 500,000 | | | Ryder System, Inc. | | | 5.85 | % | | | 03/01/14 | | | $ | 546,577 | |
| | 1,350,000 | | | Southern Copper Corp. | | | 5.38 | % | | | 04/16/20 | | | | 1,377,000 | |
| | 500,000 | | | State Street Bank & Trust Co.(b) | | | 0.54 | % | | | 12/08/15 | | | | 479,969 | |
| | 1,000,000 | | | Suntrust Banks, Inc.(b) | | | 0.55 | % | | | 04/01/15 | | | | 926,260 | |
| | 500,000 | | | Tennessee Gas Pipeline Co. | | | 7.00 | % | | | 10/15/28 | | | | 585,269 | |
| | 500,000 | | | Tesoro Corp.(a) | | | 6.63 | % | | | 11/01/15 | | | | 503,125 | |
| | 1,000,000 | | | Torchmark Corp. | | | 6.38 | % | | | 06/15/16 | | | | 1,092,700 | |
| | 1,800,000 | | | Toys R Us, Inc. | | | 7.38 | % | | | 10/15/18 | | | | 1,530,000 | |
| | 1,000,000 | | | UIL Holdings Corp. | | | 4.63 | % | | | 10/01/20 | | | | 1,033,207 | |
| | 1,000,000 | | | United States Steel Corp.(a) | | | 6.05 | % | | | 06/01/17 | | | | 910,000 | |
| | 850,000 | | | Valmont Industries, Inc. | | | 6.63 | % | | | 04/20/20 | | | | 988,162 | |
| | 500,000 | | | Wachovia Corp. | | | 5.25 | % | | | 08/01/14 | | | | 524,558 | |
| | 900,000 | | | Wells Fargo Bank NA(b) | | | 0.50 | % | | | 05/16/16 | | | | 797,677 | |
| | 1,000,000 | | | Whirlpool Corp. | | | 7.75 | % | | | 07/15/16 | | | | 1,205,879 | |
| | 1,000,000 | | | Willis North America, Inc. | | | 6.20 | % | | | 03/28/17 | | | | 1,091,987 | |
| | | | | | | | | | | | | | | | |
| Total Corporate Bonds
(Cost $75,795,150) |
| | | 77,504,158 | |
| | U.S. Treasury Obligations (5.7%) | |
| | 2,000,000 | | | U.S. Treasury Note | | | 2.38 | % | | | 07/31/17 | | | | 2,136,250 | |
| | 1,000,000 | | | U.S. Treasury Note | | | 1.88 | % | | | 08/31/17 | | | | 1,038,750 | |
| | 2,000,000 | | | U.S. Treasury Note | | | 3.63 | % | | | 02/15/20 | | | | 2,308,750 | |
| | | | | | | | | | | | | | | | |
| Total U.S. Treasury Obligations
(Cost $5,031,283) |
| | | 5,483,750 | |
| | Foreign Corporate Bonds (7.7%) | |
| | 900,000 | | | AngloGold Holdings PLC | | | 5.38 | % | | | 04/15/20 | | | | 881,749 | |
| | 900,000 | | | ArcelorMittal(a) | | | 5.50 | % | | | 03/01/21 | | | | 806,445 | |
| | 900,000 | | | Aspen Insurance Holdings, Ltd.(a) | | | 6.00 | % | | | 12/15/20 | | | | 920,447 | |
| | 1,000,000 | | | Gold Fields Orogen Holding BVI, Ltd.(d) | | | 4.88 | % | | | 10/07/20 | | | | 920,672 | |
| | 900,000 | | | Petrobras International Finance Co. | | | 5.38 | % | | | 01/27/21 | | | | 909,900 | |
| | 1,900,000 | | | UBS AG | | | 5.88 | % | | | 12/20/17 | | | | 1,955,161 | |
| | 900,000 | | | Vale Overseas, Ltd. | | | 8.25 | % | | | 01/17/34 | | | | 1,096,200 | |
| | | | | | | | | | | | | | | | |
| Total Foreign Corporate Bonds
(Cost $7,748,949) |
| | | 7,490,574 | |
| | Foreign Government Bond (0.6%) | |
| | 500,000 | | | Republic of South Africa, YD | | | 6.50 | % | | | 06/02/14 | | | | 553,750 | |
| | | | | | | | | | | | | | | | |
| Total Foreign Government Bonds
(Cost $508,558) |
| | | 553,750 | |
| | Collateral for Securities on Loan (6.8%) | |
| | 6,560,230 | | | State Street Navigator Prime Portfolio | | | | | | | | | | | 6,560,230 | |
| | | | | | | | | | | | | | | | |
| Total Collateral for Securities on Loan
(Cost $6,560,230) |
| | | 6,560,230 | |
| | | | |
| SCHEDULEOF INVESTMENTS | | | 15 | |
| | | | | | | | | | | | |
| Shares or Principal Amount | | Interest
Rate | | Maturity
Date | | Value | |
| | | | | | | | | | | | |
| | Short-Term Investment (4.5%) | |
| $ | 4,326,005 | | | State Street Euro Dollar Time Deposit (USD), 0.01%, 10/03/11 | | | | | | $ | 4,326,005 | |
| | | | | | | | | | | | |
| Total Short-Term Investments
(Cost $4,326,005) | | | 4,326,005 | |
| Total Investments 105.5%
(Cost $99,970,175) | | | 101,918,467 | |
| | Liabilities Less Other Assets (5.5)% | | | (5,350,682 | ) |
| | | | | | | | | | | | |
| | Net Assets 100.0% | | $ | 96,567,785 | |
| | | | | | | | | | | | |
The accompanying notes are an integral part of the financial statements.
| (a) | All or a portion of the security was on loan as of September 30, 2011. |
| (b) | Floating Rate Security. Rate disclosed is as of September 30, 2011. |
| (c) | These securities are considered to be illiquid. The aggregate value of these securities at September 30, 2011 was $637,346, which represent 0.7% of the Fund’s Net Assets. |
| (d) | Security was acquired pursuant to Rule 144A of the Securities Act of 1933 and may be deemed to be restricted for resale. |
| | |
| 16 | | SCHEDULEOF INVESTMENTS |
| | | | |
MANAGEMENT OVERVIEW ICON CORE EQUITY FUND | | Class I Class C Class Z Class A | | ICNIX ICNCX ICNZX ICNAX |
| Q. | How did the Fund perform relative to its benchmark? |
| A. | The ICON Core Equity Fund lost -1.33% for the Class I shares, -2.27% for the Class C shares (-3.27% with maximum sales charge), -2.43% for the Class Z shares, and -2.42% for the Class A shares (-8.04% with maximum sales charge) for the fiscal year ended September 30, 2011. The Fund’s benchmark, the S&P Composite 1500 Index, gained 0.92% over the fiscal year. Total returns for other periods as of September 30, 2011 appear in the subsequent pages of this Fund’s Management Overview. |
| Q. | What primary factors influenced the Fund’s relative performance during the period? |
| A. | During fiscal year 2011, the stock market exhibited two extreme behaviors. Stock prices surged higher for the first seven months of the fiscal year. Between May and September 2011, however, prices dropped over European sovereign debt concerns and the potential fallout on the economy in general and European banks in particular. While the Fund rose 24.83% through April 2011, outperforming its benchmark, those gains were offset by the Fund’s declining 20.95% versus benchmark losses of 17.02% between May and September. As we did not see overpriced valuation readings typical of market peaks in April, we remained largely invested and had too much exposure during the ensuing five-month retreat. |
| Q. | How did the Fund’s composition affect performance? |
| A. | The Fund is heavily weighted in economically sensitive, cyclical stocks - the very stocks investors worried about recessions or economic slowdowns tend to avoid. We continued to hold on to many of these stocks even through the market downturn in the last half of the fiscal year because they had attractive valuation readings under the ICON system. |
In that regard, the Fund was adversely affected by its holdings in the industrial conglomerates, industrial machinery, coal & consumable fuels, electronic components and steel industries. Nonetheless, we continue to hold positions in these last five industries at fiscal year end, believing them to be good values, and anticipating that these laggards will emerge as leaders in the next market upturn.
The top five industries that contributed positively to Fund performance are retail apparel, diversified metals & mining, computer hardware, consumer finance, and life & health insurance.
| Q. | What is your investment outlook for the overall market? |
| A. | As the fiscal year closes, we estimate the overall market has a value-to-price ratio of 1.48, giving us confidence about the prospect for future opportunities. We believe the fears that drove the market lower will prove to be unwarranted and that the market will resume its recovery off the March 2009 low. As one fiscal year closes and another begins, we will continue to rely upon our disciplined methodology to guide us through these challenging times. |
ICON Core Equity Fund
Sector Composition
September 30, 2011
| | | | |
Industrials | | | 25.8% | |
Consumer Discretionary | | | 25.2% | |
Information Technology | | | 13.6% | |
Energy | | | 12.2% | |
Materials | | | 8.5% | |
Financial | | | 7.4% | |
Health Care | | | 7.3% | |
| | | | |
| | | 100.0% | |
| | | | |
Percentages are based upon common stocks as a percentage of net assets.
ICON Core Equity Fund
Industry Composition
September 30, 2011
| | | | |
Integrated Oil & Gas | | | 7.4% | |
IT Consulting & Other Services | | | 7.2% | |
Cable & Satellite | | | 7.1% | |
Apparel Retail | | | 6.8% | |
Industrial Conglomerates | | | 6.0% | |
Footwear | | | 5.5% | |
Electrical Components & Equipment | | | 5.2% | |
Industrial Machinery | | | 5.0% | |
Computer Hardware | | | 4.5% | |
Steel | | | 4.4% | |
Industrial Gases | | | 4.1% | |
Movies & Entertainment | | | 3.8% | |
Railroads | | | 3.5% | |
Construction & Farm Machinery & Heavy Trucks | | | 3.5% | |
Biotechnology | | | 2.9% | |
Consumer Finance | | | 2.9% | |
| | | | |
Health Care Equipment | | | 2.3% | |
Specialized Finance | | | 2.1% | |
Health Care Services | | | 2.1% | |
General Merchandise Stores | | | 2.1% | |
Oil & Gas Drilling | | | 2.0% | |
Electronic Components | | | 1.8% | |
Other Diversified Financial Services | | | 1.8% | |
Trading Companies & Distributors | | | 1.7% | |
Coal & Consumable Fuels | | | 1.4% | |
Oil & Gas Refining & Marketing | | | 1.4% | |
Other Industries (each less
than 1%) | | | 1.5% | |
| | | | |
| | | 100.0% | |
| | | | |
Percentages are based upon common stocks as a percentage of net assets.
ICON Core Equity Fund
Average Annual Total Return
as of September 30, 2011
| | | | | | | | | | | | | | | | | | | | | | | | | | | | |
| | | Inception
Date | | | 1 Year | | | 5 Years | | | 10 Years | | | Since
Inception | | | Gross
Expense
Ratio* | | | Net
Expense
Ratio* | |
ICON Core Equity Fund - Class I | | | 10/12/00 | | | | -1.33% | | | | -6.82% | | | | 1.23% | | | | 1.16% | | | | 1.35% | | | | 1.35% | |
S&P Composite 1500 Index | | | | | | | 0.92% | | | | -0.86% | | | | 3.34% | | | | 1.01% | | | | N/A | | | | N/A | |
ICON Core Equity Fund - Class C | | | 11/28/00 | | | | -2.27% | | | | -7.62% | | | | 0.40% | | | | -0.20% | | | | 2.25% | | | | 2.25% | |
S&P Composite 1500 Index | | | | | | | 0.92% | | | | -0.86% | | | | 3.34% | | | | 0.96% | | | | N/A | | | | N/A | |
ICON Core Equity Fund - Class Z | | | 5/6/04 | | | | -2.43% | | | | -7.17% | | | | N/A | | | | -1.37% | | | | 1.90% | | | | 1.90% | |
S&P Composite 1500 Index | | | | | | | 0.92% | | | | -0.86% | | | | N/A | | | | 2.62% | | | | N/A | | | | N/A | |
ICON Core Equity Fund - Class A | | | 5/31/06 | | | | -2.42% | | | | -7.82% | | | | N/A | | | | -8.14% | | | | 2.68% | | | | 2.68% | |
ICON Core Equity Fund - Class A (including maximum sales charge of 5.75%) | | | 5/31/06 | | | | -8.04% | | | | -8.90% | | | | N/A | | | | -9.15% | | | | 2.68% | | | | 2.68% | |
S&P Composite 1500 Index | | | | | | | 0.92% | | | | -0.86% | | | | N/A | | | | 0.10% | | | | N/A | | | | N/A | |
Past performance is not a guarantee of future results. Information about these performance results and the comparative indexes can be found in the About This Report section. The Since Inception performance results for Class C shares include returns for certain time periods that were restarted as of June 8, 2004. Class Z shares are available only to institutional investors.
| * | Please see the most recent prospectus for details. |
Class C total returns exclude applicable sales charges. If sales charges were included returns would be lower.
ICON Core Equity Fund
Value of a $10,000 Investment
through September 30, 2011
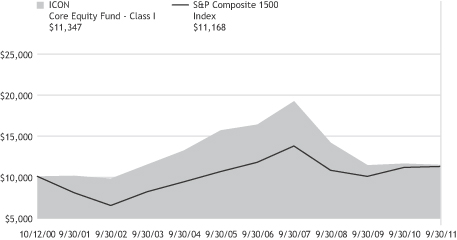
Past performance is not a guarantee of future results. The above graph compares a $10,000 investment made in the Fund’s Class I shares on the Class’ inception date of 10/12/00 to a $10,000 investment made in an unmanaged securities index on that date. Performance for the Fund’s other share classes will vary due to differences in charges and expenses. The Fund’s performance in this chart and the performance table assumes the reinvestment of dividends and capital gain distributions but does not reflect the deduction of taxes that a shareholder would pay on Fund distributions or on the redemption of Fund shares.
ICON CORE EQUITY FUND
SCHEDULEOF INVESTMENTS
SEPTEMBER 30, 2011
| | | | | | | | |
| Shares or Principal Amount | | Value | |
| | | | | | | | |
| | Common Stocks (100.0%) | |
| | 22,100 | | | Accenture PLC, Class A | | $ | 1,164,228 | |
| | 53,800 | | | Alpha Natural Resources, Inc.† | | | 951,722 | |
| | 7,900 | | | Apple, Inc.† | | | 3,011,322 | |
| | 75,100 | | | Bio-Reference Labs, Inc.†(a) | | | 1,382,591 | |
| | 29,000 | | | CACI International, Inc., Class A† | | | 1,448,260 | |
| | 15,800 | | | Cash America International, Inc. | | | 808,328 | |
| | 31,000 | | | Caterpillar, Inc. | | | 2,289,040 | |
| | 31,400 | | | Celgene Corp.† | | | 1,944,288 | |
| | 27,100 | | | Chevron Corp. | | | 2,507,292 | |
| | 13,500 | | | Cliffs Natural Resources, Inc. | | | 690,795 | |
| | 5,700 | | | CME Group, Inc. | | | 1,404,480 | |
| | 114,700 | | | Comcast Corp., Class A | | | 2,397,230 | |
| | 31,800 | | | Cooper Industries PLC | | | 1,466,616 | |
| | 98,400 | | | Corning, Inc. | | | 1,216,224 | |
| | 61,800 | | | CSX Corp. | | | 1,153,806 | |
| | 18,200 | | | Dollar Tree, Inc.† | | | 1,367,002 | |
| | 18,400 | | | Dover Corp. | | | 857,440 | |
| | 21,600 | | | Eaton Corp. | | | 766,800 | |
| | 48,100 | | | Emerson Electric Co. | | | 1,987,011 | |
| | 33,200 | | | Exxon Mobil Corp. | | | 2,411,316 | |
| | 38,700 | | | Ezcorp, Inc., Class A† | | | 1,104,498 | |
| | 11,800 | | | General Dynamics Corp. | | | 671,302 | |
| | 126,400 | | | General Electric Co. | | | 1,926,336 | |
| | 31,000 | | | Illinois Tool Works, Inc. | | | 1,289,600 | |
| | 12,500 | | | International Business Machines Corp. | | | 2,187,875 | |
| | 39,000 | | | JPMorgan Chase & Co. | | | 1,174,680 | |
| | | | | | | | |
| Shares or Principal Amount | | Value | |
| | | | | | | | |
| | 35,500 | | | Nike, Inc., Class B | | $ | 3,035,605 | |
| | 44,100 | | | Noble Corp.† | | | 1,294,335 | |
| | 26,400 | | | Nucor Corp. | | | 835,296 | |
| | 6,300 | | | Parker Hannifin Corp. | | | 397,719 | |
| | 29,200 | | | Praxair, Inc. | | | 2,729,616 | |
| | 52,500 | | | ResMed, Inc.†(a) | | | 1,511,475 | |
| | 22,600 | | | Ross Stores, Inc. | | | 1,778,394 | |
| | 22,900 | | | Siemens AG, ADR | | | 2,056,191 | |
| | 137,900 | | | Steel Dynamics, Inc. | | | 1,367,968 | |
| | 37,300 | | | Time Warner Cable, Inc. | | | 2,337,591 | |
| | 48,600 | | | TJX Cos., Inc. | | | 2,695,842 | |
| | 14,500 | | | Union Pacific Corp. | | | 1,184,215 | |
| | 50,900 | | | Valero Energy Corp. | | | 905,002 | |
| | 30,200 | | | Viacom, Inc., Class B | | | 1,169,948 | |
| | 44,100 | | | Walt Disney Co. | | | 1,330,056 | |
| | 17,100 | | | Wells Fargo & Co. | | | 412,452 | |
| | 18,500 | | | Wolverine World Wide, Inc. | | | 615,125 | |
| | 7,700 | | | WW Grainger, Inc. | | | 1,151,458 | |
| | | | | | | | |
| Total Common Stocks
(Cost $67,135,739) | | | 66,388,370 | |
| Collateral for Securities on
Loan (2.8%) | | | | |
| | 1,841,798 | | | State Street Navigator Prime Portfolio | | | 1,841,798 | |
| | | | | | | | |
| Total Collateral for Securities
on Loan
(Cost $1,841,798) | | | 1,841,798 | |
| Total Investments 102.8%
(Cost $68,977,537) | | | 68,230,168 | |
| Liabilities Less Other Assets
(2.8)% | | | (1,875,937 | ) |
| | | | | | | | |
| | Net Assets 100.0% | | $ | 66,354,231 | |
| | | | | | | | |
The accompanying notes are an integral part of the financial statements.
| † | Non-income producing security. |
| (a) | All or a portion of the security was on loan as of September 30, 2011. |
| ADR | American Depository Receipt |
| | | | |
| SCHEDULEOF INVESTMENTS | | | 21 | |
| | | | |
MANAGEMENT OVERVIEW ICON EQUITY INCOME FUND | | Class I Class C Class Z Class A | | IOEIX IOECX IOEZX IEQAX |
| Q. | How did the Fund perform relative to its benchmark? |
| A. | The ICON Equity Income Fund, Class I, returned -2.73% for the fiscal year ending September 30, 2011, underperforming the Fund’s benchmark, the S&P Composite 1500 Index, which returned 0.92% during the same period. Class A shares of the Fund returned -2.66% (and -8.22% with maximum sales charge) during the same period. Class C shares of the Fund returned -3.47% (and –4.47% with maximum sales charge) for the fiscal year, while Class Z shares returned -2.40%. Total returns for other periods as of September 30, 2011 appear in the subsequent pages of this Fund’s Management Overview. |
| Q. | What primary factors were behind the Fund’s relative performance? |
| A. | In the first half of the fiscal year, the S&P 1500 rose over 18% while the ICON Equity Income Fund returned approximately 14%. The Fund’s cash and non-equity holdings, as well as weak performance from the Fund’s dividend paying stocks in general, help account for the Fund’s underperforming the benchmark by 4% during this period. For the 12-months ended September 30, 2011, the Fund’s composition, on average, included an allocation of approximately 15% cash, preferred stock, convertible bonds, and other fixed income instruments. In a six-month period marked by an 18% return in the benchmark, the Fund’s cash and fixed income holdings proved detrimental to performance. The Fund’s dividend-paying stocks likewise dragged on performance. Within the S&P 1500, stocks that pay a dividend yield of less than 2% gained over 20% during the first half of the fiscal year while stocks that pay more than 2% returned about 15% for the same time period. Over the course of the fiscal year, 78% of the stocks in the ICON Equity Income Fund, on average, had a dividend of 2% or more. |
In the last half of the fiscal year, however, the market reversed course, and both the market and the Fund experienced significant losses that offset earlier gains. Although the Fund’s equity positions lagged the benchmark, this time the Fund’s non-equity exposure benefitted Fund performance during the market downturn.
| Q. | How did the Fund’s composition affect performance? |
| A. | The fund was overweight Energy and Industrials stocks with a dividend yield of 2% or more. These higher yielding stocks returned considerably |
| | less during the fiscal year than stocks that paid a dividend yield of less than 2%. Moreover, the Fund’s Energy and Industrials holdings had losses of 20% or more compared to an overall 6.5% loss for similar yielding stocks in the S&P 1500. |
The Fund’s overweight position in the Industrials sector was the biggest detractor from performance, with the Fund’s railroads holdings in particular contributing significantly to those losses. Over the course of the fiscal year, Industrials made up on average around 13.8% of the Fund compared to 11.5% of the benchmark. On the other hand, the Fund’s overweight Utilities holdings were up approximately 19.5% over the fiscal year, outperforming the 11.9% return by the Utilities stocks held by the S&P 1500. Still, the Fund’s Utilities returns could not overcome losses by the Fund’s Industrials and other cyclical holdings.
| Q. | What is your investment outlook for the market? |
| A. | As the fiscal year ends, we estimate the overall domestic market has a V/P of approximately 1.48 under the ICON system, suggesting many opportunities exist for investors. We believe also that investors will seek out high dividend securities as they look to generate income in the coming year. Guided by our valuation and relative strength metrics, we will continue to try to take advantage of changing market conditions so as to benefit the Fund. |
ICON Equity Income Fund
Sector Composition
September 30, 2011
| | | | |
Industrials | | | 17.8% | |
Financial | | | 15.3% | |
Information Technology | | | 14.7% | |
Consumer Discretionary | | | 11.6% | |
Energy | | | 10.9% | |
Materials | | | 7.4% | |
Health Care | | | 6.7% | |
Telecommunication & Utilities | | | 4.7% | |
Consumer Staples | | | 2.7% | |
| | | | |
| | | 91.8% | |
| | | | |
Percentages are based upon common, preferred and convertible preferred stocks as a percentage of net assets.
ICON Equity Income Fund
Industry Composition
September 30, 2011
| | | | |
Integrated Oil & Gas | | | 7.9% | |
Industrial Conglomerates | | | 3.9% | |
Pharmaceuticals | | | 3.7% | |
IT Consulting & Other Services | | | 3.0% | |
Apparel Retail | | | 2.9% | |
Railroads | | | 2.9% | |
Systems Software | | | 2.8% | |
Industrial Machinery | | | 2.6% | |
Office Services & Supplies | | | 2.4% | |
Semiconductors | | | 2.3% | |
Regional Banks | | | 2.3% | |
Diversified Chemicals | | | 2.3% | |
Aerospace & Defense | | | 2.1% | |
Diversified Banks | | | 2.0% | |
Oil & Gas Drilling | | | 1.8% | |
Specialty Chemicals | | | 1.8% | |
Restaurants | | | 1.8% | |
Asset Management & Custody Banks | | | 1.8% | |
Mortgage REIT’s | | | 1.7% | |
Data Processing & Outsourced Services | | | 1.7% | |
Other Diversified Financial Services | | | 1.7% | |
Life & Health Insurance | | | 1.6% | |
| | | | |
Construction & Farm Machinery & Heavy Trucks | | | 1.6% | |
Industrial Gases | | | 1.5% | |
Health Care Equipment | | | 1.3% | |
Computer Hardware | | | 1.3% | |
Home Improvement Retail | | | 1.3% | |
Coal & Consumable Fuels | | | 1.2% | |
Specialized Consumer Services | | | 1.2% | |
Specialized Finance | | | 1.1% | |
General Merchandise Stores | | | 1.1% | |
Semiconductor Equipment | | | 1.1% | |
Internet Software & Services | | | 1.1% | |
Cable & Satellite | | | 1.1% | |
Movies & Entertainment | | | 1.0% | |
Consumer Finance | | | 1.0% | |
Thrifts & Mortgage Finance | | | 1.0% | |
Multi-Utilities | | | 1.0% | |
Commercial Printing | | | 1.0% | |
Steel | | | 1.0% | |
Property & Casualty Insurance | | | 1.0% | |
Other Industries (each less
than 1%) | | | 12.9% | |
| | | | |
| | | 91.8% | |
| | | | |
Percentages are based upon common, preferred and convertible preferred stocks as a percentage of net assets.
ICON Equity Income Fund
Average Annual Total Return
as of September 30, 2011
| | | | | | | | | | | | | | | | | | | | | | | | |
| | | Inception
Date | | | 1 Year | | | 5 Years | | | Since
Inception | | | Gross
Expense
Ratio* | | | Net
Expense
Ratio* | |
ICON Equity Income Fund - Class I | | | 9/30/02 | | | | -2.73% | | | | -1.12% | | | | 5.75% | | | | 1.55% | | | | 1.47% | |
S&P Composite 1500 Index | | | | | | | 0.92% | | | | -0.86% | | | | 6.16% | | | | N/A | | | | N/A | |
ICON Equity Income Fund - Class C | | | 11/8/02 | | | | -3.47% | | | | -1.98% | | | | 4.18% | | | | 2.99% | | | | 2.22% | |
S&P Composite 1500 Index | | | | | | | 0.92% | | | | -0.86% | | | | 5.18% | | | | N/A | | | | N/A | |
ICON Equity Income Fund - Class Z | | | 5/10/04 | | | | -2.40% | | | | -0.97% | | | | 2.60% | | | | 7.68% | | | | 1.22% | |
S&P Composite 1500 Index | | | | | | | 0.92% | | | | -0.86% | | | | 2.99% | | | | N/A | | | | N/A | |
ICON Equity Income Fund - Class A | | | 5/31/06 | | | | -2.66% | | | | -1.25% | | | | -1.09% | | | | 4.61% | | | | 1.47% | |
ICON Equity Income Fund - Class A (including maximum sales charge of 5.75%) | | | 5/31/06 | | | | -8.22% | | | | -2.41% | | | | -2.18% | | | | 4.61% | | | | 1.47% | |
S&P Composite 1500 Index | | | | | | | 0.92% | | | | -0.86% | | | | 0.10% | | | | N/A | | | | N/A | |
Past performance is not a guarantee of future results. Information about these performance results and the comparative indexes can be found in the About This Report section. The Adviser has agreed to limit certain Fund expenses; without these limitations, returns would have been lower. The limitation provisions may be terminated in the future. Class Z shares are available only to institutional investors.
| * | Please see the most recent prospectus for details. |
Class C total returns exclude applicable sales charges. If sales charges were included returns would be lower.
ICON Equity Income Fund
Value of a $10,000 Investment
through September 30, 2011
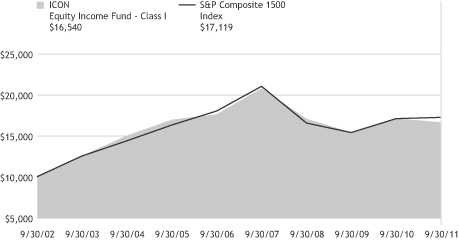
Past performance is not a guarantee of future results. The above graph compares a $10,000 investment made in the Fund’s Class I shares on the Class’ inception date of 9/30/02 to a $10,000 investment made in an unmanaged securities index on that date. Performance for the Fund’s other share classes will vary due to differences in charges and expenses. The Fund’s performance in this chart and the performance table assumes the reinvestment of dividends and capital gain distributions but does not reflect the deduction of taxes that a shareholder would pay on Fund distributions or on the redemption of Fund shares.
ICON EQUITY INCOME FUND
SCHEDULEOF INVESTMENTS
SEPTEMBER 30, 2011
| | | | | | | | |
| Shares or Principal Amount | | Value | |
| | | | | | | | |
| | Common Stocks (88.0%) | |
| | 8,500 | | | 3M Co. | | $ | 610,215 | |
| | 15,500 | | | A Schulman, Inc. | | | 263,345 | |
| | 6,500 | | | Air Products & Chemicals, Inc. | | | 496,405 | |
| | 5,900 | | | Alliance Resource Partners L.P. | | | 386,804 | |
| | 31,700 | | | American Eagle Outfitters, Inc. | | | 371,524 | |
| | 8,500 | | | American States Water Co. | | | 288,405 | |
| | 19,500 | | | Annaly Capital Management, Inc., REIT | | | 324,285 | |
| | 42,800 | | | Apollo Investment Corp. | | | 321,856 | |
| | 6,400 | | | Automatic Data Processing, Inc. | | | 301,760 | |
| | 5,200 | | | Avery Dennison Corp. | | | 130,416 | |
| | 7,000 | | | Bank of Montreal(a) | | | 390,950 | |
| | 7,800 | | | Baxter International, Inc. | | | 437,892 | |
| | 19,300 | | | BB&T Corp. | | | 411,669 | |
| | 11,400 | | | Best Buy Co., Inc. | | | 265,620 | |
| | 1,700 | | | BlackRock, Inc. | | | 251,617 | |
| | 8,000 | | | Buckle, Inc.(a) | | | 307,680 | |
| | 6,900 | | | Caterpillar, Inc. | | | 509,496 | |
| | 11,100 | | | CEC Entertainment, Inc. | | | 316,017 | |
| | 7,400 | | | Chevron Corp. | | | 684,648 | |
| | 1,500 | | | CME Group, Inc. | | | 369,600 | |
| | 9,700 | | | Computer Sciences Corp. | | | 260,445 | |
| | 13,000 | | | ConocoPhillips | | | 823,160 | |
| | 17,700 | | | CSX Corp. | | | 330,459 | |
| | 3,900 | | | Cullen/Frost Bankers, Inc. | | | 178,854 | |
| | 15,400 | | | Diebold, Inc. | | | 423,654 | |
| | 14,100 | | | Dow Chemical Co. | | | 316,686 | |
| | 10,700 | | | E.I. du Pont de Nemours & Co. | | | 427,679 | |
| | 8,000 | | | Eaton Corp. | | | 284,000 | |
| | | | | | | | |
| Shares or Principal Amount | | Value | |
| | | | | | | | |
| | 7,100 | | | Eli Lilly & Co. | | $ | 262,487 | |
| | 9,300 | | | ENI SpA, ADR(a) | | | 326,709 | |
| | 7,900 | | | Ensco PLC, ADR | | | 319,397 | |
| | 10,300 | | | Exxon Mobil Corp. | | | 748,089 | |
| | 36,800 | | | First Niagara Financial Group, Inc. | | | 336,720 | |
| | 43,900 | | | General Electric Co. | | | 669,036 | |
| | 9,100 | | | Guess?, Inc. | | | 259,259 | |
| | 28,600 | | | H&R Block, Inc. | | | 380,666 | |
| | 6,900 | | | Harris Corp. | | | 235,773 | |
| | 13,500 | | | Harsco Corp. | | | 261,765 | |
| | 12,800 | | | Home Depot, Inc. | | | 420,736 | |
| | 7,400 | | | Illinois Tool Works, Inc. | | | 307,840 | |
| | 21,800 | | | Intel Corp. | | | 464,994 | |
| | 5,600 | | | International Business Machines Corp. | | | 980,168 | |
| | 4,300 | | | Johnson & Johnson | | | 273,953 | |
| | 18,500 | | | JPMorgan Chase & Co. | | | 557,220 | |
| | 3,600 | | | Kimberly-Clark Corp. | | | 255,636 | |
| | 9,300 | | | KLA-Tencor Corp. | | | 356,004 | |
| | 13,400 | | | Leggett & Platt, Inc. | | | 265,186 | |
| | 10,800 | | | Linear Technology Corp. | | | 298,620 | |
| | 3,600 | | | Lockheed Martin Corp. | | | 261,504 | |
| | 21,300 | | | Manulife Financial Corp. | | | 241,329 | |
| | 11,900 | | | Merck & Co., Inc. | | | 389,249 | |
| | 8,400 | | | Mercury General Corp. | | | 322,140 | |
| | 36,600 | | | Microsoft Corp. | | | 910,974 | |
| | 7,000 | | | Norfolk Southern Corp. | | | 427,140 | |
| | 4,400 | | | Northrop Grumman Corp. | | | 229,504 | |
| | 10,200 | | | Nucor Corp. | | | 322,728 | |
| | 7,100 | | | Omnicom Group, Inc. | | | 261,564 | |
| | 55,300 | | | PDL BioPharma, Inc. | | | 306,915 | |
| | 5,000 | | | PepsiCo, Inc. | | | 309,500 | |
| | 15,900 | | | Pfizer, Inc. | | | 281,112 | |
| | 34,200 | | | Pitney Bowes, Inc.(a) | | | 642,960 | |
| | 11,800 | | | Pool Corp. | | | 308,924 | |
| | | | |
| SCHEDULEOF INVESTMENTS | | | 27 | |
| | | | | | | | |
| Shares or Principal Amount | | Value | |
| | | | | | | | |
| | 22,000 | | | Redwood Trust, Inc., REIT(a) | | $ | 245,740 | |
| | 23,300 | | | RR Donnelley & Sons Co. | | | 328,996 | |
| | 5,800 | | | Ryder System, Inc. | | | 217,558 | |
| | 8,300 | | | SCANA Corp. | | | 335,735 | |
| | 20,600 | | | Seagate Technology PLC | | | 211,768 | |
| | 10,400 | | | Southern Copper Corp. | | | 259,896 | |
| | 12,100 | | | Sun Life Financial, Inc. | | | 287,859 | |
| | 46,000 | | | SUPERVALU, Inc.(a) | | | 306,360 | |
| | 7,500 | | | Target Corp. | | | 367,800 | |
| | 19,800 | | | Texas Roadhouse, Inc. | | | 261,756 | |
| | 5,600 | | | Transocean, Ltd. | | | 267,344 | |
| | 9,300 | | | UGI Corp. | | | 244,311 | |
| | 2,200 | | | Union Pacific Corp. | | | 179,674 | |
| | 67,200 | | | United Online, Inc. | | | 351,456 | |
| | | | | | | | |
| Shares or Principal Amount | | Value | |
| | | | | | | | |
| | 3,900 | | | United Parcel Service, Inc., Class B | | $ | 246,285 | |
| | 2,800 | | | United Technologies Corp. | | | 197,008 | |
| | 15,700 | | | Valley National Bancorp | | | 166,263 | |
| | 10,200 | | | Valspar Corp. | | | 318,342 | |
| | 11,000 | | | Wells Fargo & Co. | | | 265,320 | |
| | | | | | | | |
| Total Common Stocks
(Cost $31,605,601) | | | 28,740,413 | |
| | Preferred Stocks (3.1%) | | | | |
| | 13,400 | | | Capital One Capital II(a) | | | 338,350 | |
| | 13,400 | | | Comcast Corp. | | | 343,308 | |
| | 13,400 | | | Viacom, Inc. | | | 341,834 | |
| | | | | | | | |
| Total Preferred Stocks
(Cost $1,034,833) | | | 1,023,492 | |
| | | | | | | | | | | | | | | | |
| Shares or Principal Amount | | Interest
Rate | | | Maturity
Date | | | Value | |
| | Corporate Bonds (6.2%) | | | | | | | | | | | | |
| $ | 240,000 | | | Archer-Daniels-Midland Co. | | | 6.63 | % | | | 05/01/29 | | | $ | 314,287 | |
| | 600,000 | | | Bank of America Corp. | | | 5.42 | % | | | 03/15/17 | | | | 521,258 | |
| | 350,000 | | | Commercial Metals Co. | | | 7.35 | % | | | 08/15/18 | | | | 356,008 | |
| | 300,000 | | | Delphi Financial Group, Inc. | | | 7.88 | % | | | 01/31/20 | | | | 344,258 | |
| | 500,000 | | | Goldman Sachs Group, Inc. | | | 5.38 | % | | | 03/15/20 | | | | 496,538 | |
| | | | | | | | | | | | | | | | |
| Total Corporate Bonds
(Cost $2,081,063) | | | | | | | | | | | 2,032,349 | |
| | Convertible Corporate Bonds (0.8%) | | | | | | | | | | | | |
| | 350,000 | | | Central European Distribution Corp. | | | 3.00 | % | | | 03/15/13 | | | | 239,750 | |
| | | | | | | | | | | | | | | | |
| Total Convertible Corporate Bonds
(Cost $323,507) | | | | | | | | | | | 239,750 | |
| | Convertible Preferred Stock (0.7%) | | | | | | | | | | | | |
| | 6,100 | | | Omnicare Capital Trust II, Series B | | | 4.00 | % | | | 06/15/33 | | | | 231,800 | |
| | | | | | | | | | | | | | | | |
| Total Convertible Preferred Stocks
(Cost $265,165) | | | | | | | | | | | 231,800 | |
| | | | |
| | 28 | | | SCHEDULEOF INVESTMENTS |
| | | | | | | | |
Underlying Security/ Expiration Date/
Exercise Price | | Contracts* | | | Value | |
| Call Options Purchased (0.1%) | |
Archer-Daniels-Midland Co., January 2013, $35.00 | | | 69 | | | $ | 7,141 | |
Bank Of America Corp., January 2012, $17.50 | | | 343 | | | | 343 | |
Bank Of America Corp., January 2012, $9.00 | | | 667 | | | | 15,341 | |
Commercial Metals Co., March 2012, $14.00 | | | 250 | | | | 6,250 | |
Computer Sciences Corp., January 2012, $60.00 | | | 58 | | | | 290 | |
Delphi Financial Group, Inc., January 2012, $30.00 | | | 100 | | | | 2,500 | |
Goldman Sachs Group, Inc., January 2012, $185.00 | | | 27 | | | | 135 | |
Hewlett Packard Co., January 2012, $50.00 | | | 50 | | | | 125 | |
Valero Energy Corp., January 2012, $30.00 | | | 117 | | | | 1,287 | |
| | | | | | | | |
Total Call Options Purchased (Cost $228,380) | | | | 33,412 | |
| | | | | | | | |
Shares or Principal Amount | | Value | |
| | Collateral for Securities on Loan (6.6%) | |
| | 2,154,862 | | | State Street Navigator Prime Portfolio | | $ | 2,154,862 | |
| | | | | | | | |
| Total Collateral for Securities
on Loan
(Cost $2,154,862) | | | 2,154,862 | |
| Total Investments 105.5%
(Cost $37,693,411) | | | 34,456,078 | |
| Liabilities Less Other Assets
(5.5)% | | | (1,794,482 | ) |
| | | | | | | | |
| | Net Assets 100.0% | | $ | 32,661,596 | |
| | | | | | | | |
The accompanying notes are an integral part of the financial statements.
| * | All Options have 100 shares per contract. |
| (a) | All or a portion of the security was on loan as of September 30, 2011. |
| ADR | American Depository Receipt |
| REIT | Real Estate Investment Trust |
| | | | |
| SCHEDULEOF INVESTMENTS | | | 29 | |
| | | | |
MANAGEMENT OVERVIEW ICON LONG/SHORT FUND | | Class I Class C Class Z Class A | | IOLIX IOLCX IOLZX ISTAX |
| Q. | How did the Fund perform relative to its benchmark? |
| A. | For the 12-months ended September 30, 2011, the ICON Long/Short Fund returned -2.78% for Class I shares, -3.54% for Class C shares (-4.54% with maximum sales charge), -2.44% for Class Z shares, and -2.80% for Class A shares (-8.41% with maximum sales charge), underperforming the 0.92% return for the Fund’s stated benchmark, the S&P 1500 Composite Index. The Fund underperformed the 0.27% return for the Bank of America/Merrill Lynch US Dollar 3 month Constant Maturity benchmark which is often traditionally used with long/short funds. Total returns and other performance statistics for other periods as of September 30, 2011 appear in the subsequent pages of this Fund’s Management Overview. |
| Q. | What primary factors influenced the Fund’s relative performance during the period? |
| A. | Between September 30, 2010 and September 30, 2011, the stock market exhibited two very different behaviors. The market rallied from the beginning of the fiscal year, surging higher through the end of April 2011. From May through the end of September, however, the S&P 1500 fell 16.22%, as investors grew concerned over Europe’s sovereign debt crisis and its impact on Europe’s banks in particular and the economy in general. The Fund did not keep pace with its benchmark as the market rallied through April, but, by design, the Fund declined less than the market during the May-September retreat. |
The ICON system did not uncover many overvalued companies during the fiscal year, making it difficult to find stocks we believed were overpriced to sell short. In fact, on September 22, 2011, we calculated an overall market V/P of 1.59 – one of the highest V/Ps we’ve ever recorded. Negative investor sentiment and high valuations make for attractive bargains under the ICON system, and we saw few places to profit from short selling in this environment.
| Q. | How did the Fund’s composition affect performance? |
| A. | The Fund had a heavy, long position tilt in economically sensitive, cyclical stocks during the fiscal year. In spite of our high valuation readings, investors avoided these shares as they became wary of an economic slowdown or recession. The Fund’s exposure to cyclical industries and sectors, combined with what we believed to be a dearth of short opportunities, negatively impacted performance. |
The industries that benefitted Fund performance during the fiscal year included IT consulting, life & health Insurance, diversified metals & mining, apparel retail and homefurnishing retail. By contrast, the Fund’s holdings in railroads, industrial machinery, steel, electronic components and coal & consumable fuels adversely affected Fund performance. Nonetheless, at fiscal year-end the Fund continued to hold positions in these five industries, as we believe these laggards may well become this fiscal year’s leaders.
| Q. | What is your investment outlook for the overall market? |
| A. | As the fiscal year ends, we estimate the overall market has a V/P of 1.48, giving us confidence about the prospect for future opportunities. We believe the fears that drove the market lower will prove to be unwarranted and that the market will resume its recovery off the March 2009 low. As one fiscal year closes and another begins, we will continue to rely upon our disciplined methodology to guide us through these challenging times. |
ICON Long/Short Fund
Sector Composition
September 30, 2011
| | | | |
Industrials | | | 24.6% | |
Information Technology | | | 21.0% | |
Consumer Discretionary | | | 18.8% | |
Financial | | | 11.1% | |
Energy | | | 9.6% | |
Health Care | | | 7.8% | |
Materials | | | 7.2% | |
| | | | |
| | | 100.1% | |
| | | | |
Percentages are based upon long positions as a percentage of net assets.
ICON Long/Short Fund
Industry Composition
September 30, 2011
| | | | |
IT Consulting & Other Services | | | 12.7% | |
Integrated Oil & Gas | | | 8.7% | |
Industrial Machinery | | | 7.6% | |
Apparel Retail | | | 7.0% | |
Cable & Satellite | | | 5.7% | |
Computer Hardware | | | 4.6% | |
Industrial Conglomerates | | | 4.3% | |
Consumer Finance | | | 4.2% | |
| | | | |
Railroads | | | 3.5% | |
Construction & Farm Machinery & Heavy Trucks | | | 3.4% | |
Health Care Equipment | | | 3.2% | |
Industrial Gases | | | 3.0% | |
Footwear | | | 3.0% | |
Biotechnology | | | 2.9% | |
ICON Long/Short Fund
Industry Composition (continued)
September 30, 2011
| | | | |
Electrical Components & Equipment | | | 2.8% | |
Diversified Banks | | | 2.1% | |
Specialty Chemicals | | | 2.1% | |
Specialized Finance | | | 2.1% | |
Steel | | | 2.0% | |
Electronic Components | | | 2.0% | |
Aerospace & Defense | | | 2.0% | |
Other Diversified Financial Services | | | 1.8% | |
Health Care Services | | | 1.8% | |
| | | | |
Data Processing & Outsourced Services | | | 1.7% | |
General Merchandise Stores | | | 1.6% | |
Home Improvement Retail | | | 1.5% | |
Trading Companies & Distributors | | | 1.0% | |
Other Industries (each less
than 1%) | | | 1.8% | |
| | | | |
| | | 100.1% | |
| | | | |
Percentages are based upon long positions as a percentage of net assets.
ICON Long/Short Fund
Average Annual Total Return
as of September 30, 2011
| | | | | | | | | | | | | | | | | | | | | | | | |
| | | Inception
Date | | | 1 Year | | | 5 Years | | | Since
Inception | | | Gross
Expense
Ratio* | | | Net
Expense
Ratio* | |
ICON Long/Short Fund - Class I | | | 9/30/02 | | | | -2.78% | | | | -5.65% | | | | 3.34% | | | | 2.90% | | | | 2.45% | |
S&P Composite 1500 Index | | | | | | | 0.92% | | | | -0.86% | | | | 6.16% | | | | N/A | | | | N/A | |
ICON Long/Short Fund - Class C | | | 10/17/02 | | | | -3.54% | | | | -6.40% | | | | 1.88% | | | | 3.60% | | | | 3.19% | |
S&P Composite 1500 Index | | | | | | | 0.92% | | | | -0.86% | | | | 5.35% | | | | N/A | | | | N/A | |
ICON Long/Short Fund - Class Z | | | 5/6/04 | | | | -2.44% | | | | -5.51% | | | | -0.52% | | | | 5.80% | | | | 2.15% | |
S&P Composite 1500 Index | | | | | | | 0.92% | | | | -0.86% | | | | 2.62% | | | | N/A | | | | N/A | |
ICON Long/Short Fund - Class A | | | 5/31/06 | | | | -2.80% | | | | -5.72% | | | | -5.71% | | | | 3.65% | | | | 2.45% | |
ICON Long/Short Fund - Class A (including maximum sales charge of 5.75%) | | | 5/31/06 | | | | -8.41% | | | | -6.83% | | | | -6.75% | | | | 3.65% | | | | 2.45% | |
S&P Composite 1500 Index | | | | | | | 0.92% | | | | -0.86% | | | | 0.10% | | | | N/A | | | | N/A | |
Past performance is not a guarantee of future results. Information about these performance results and the comparative indexes can be found in the About This Report section. The Adviser has agreed to limit certain Fund expenses; without these limitations, returns would have been lower. The limitation provisions may be terminated in the future. Class Z shares are available only to institutional investors.
| * | Please see the most recent prospectus for details. |
Class C total returns exclude applicable sales charges. If sales charges were included returns would be lower.
ICON Long/Short Fund
Value of a $10,000 Investment
through September 30, 2011
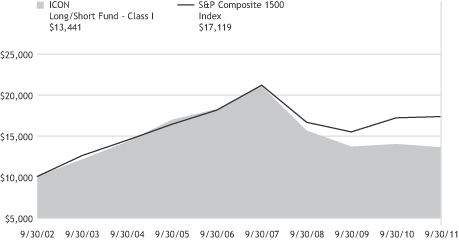
Past performance is not a guarantee of future results. The above graph compares a $10,000 investment made in the Fund’s Class I shares on the Class’ inception date of 9/30/02 to a $10,000 investment made in an unmanaged securities index on that date. Performance for the Fund’s other share classes will vary due to differences in charges and expenses. The Fund’s performance in this chart and the performance table assumes the reinvestment of dividends and capital gain distributions but does not reflect the deduction of taxes that a shareholder would pay on Fund distributions or on the redemption of Fund shares.
ICON LONG/SHORT FUND
SCHEDULEOF INVESTMENTS
SEPTEMBER 30, 2011
| | | | | | | | |
| Shares or Principal Amount | | Value | |
| | | | | | | | |
| | Common Stocks (100.1%) | |
| | 9,500 | | | Accenture PLC, Class Ax | | $ | 500,460 | |
| | 7,300 | | | Alpha Natural Resources, Inc.†x | | | 129,137 | |
| | 1,700 | | | Apple, Inc.†x | | | 648,006 | |
| | 4,400 | | | Automatic Data Processing, Inc.x | | | 207,460 | |
| | 13,700 | | | Bio-Reference Labs, Inc.†(a) | | | 252,217 | |
| | 6,400 | | | CACI International, Inc., Class A† | | | 319,616 | |
| | 4,700 | | | Capital One Financial Corp.x | | | 186,261 | |
| | 5,500 | | | Caterpillar, Inc.x | | | 406,120 | |
| | 6,600 | | | Celgene Corp.†x | | | 408,672 | |
| | 3,200 | | | Chevron Corp.x | | | 296,064 | |
| | 2,700 | | | Cliffs Natural Resources, Inc. | | | 138,159 | |
| | 1,200 | | | CME Group, Inc. | | | 295,680 | |
| | 5,800 | | | Cognizant Technology Solutions Corp., Class A† | | | 363,660 | |
| | 21,500 | | | Comcast Corp., Class Ax | | | 449,350 | |
| | 1,300 | | | Computer Sciences Corp. | | | 34,905 | |
| | 3,500 | | | Cooper Industries PLC | | | 161,420 | |
| | 22,900 | | | Corning, Inc. | | | 283,044 | |
| | 1,300 | | | Covidien PLCx | | | 57,330 | |
| | 18,600 | | | CSX Corp.x | | | 347,262 | |
| | 10,500 | | | Danaher Corp.x | | | 440,370 | |
| | 1,300 | | | Deere & Co. | | | 83,941 | |
| | 3,100 | | | Dollar Tree, Inc.† | | | 232,841 | |
| | 8,600 | | | Dover Corp. | | | 400,760 | |
| | 6,100 | | | Ecolab, Inc. | | | 298,229 | |
| | 5,600 | | | Emerson Electric Co. | | | 231,336 | |
| | | | | | | | |
| Shares or Principal Amount | | Value | |
| | | | | | | | |
| | 10,000 | | | Exxon Mobil Corp.x | | $ | 726,300 | |
| | 14,300 | | | Ezcorp, Inc., Class A† | | | 408,122 | |
| | 2,500 | | | General Dynamics Corp. | | | 142,225 | |
| | 40,400 | | | General Electric Co.x | | | 615,696 | |
| | 4,800 | | | Guess?, Inc. | | | 136,752 | |
| | 4,600 | | | HCC Insurance Holdings, Inc. | | | 124,430 | |
| | 3,600 | | | Home Depot, Inc. | | | 118,332 | |
| | 5,700 | | | Illinois Tool Works, Inc. | | | 237,120 | |
| | 3,600 | | | International Business Machines Corp.x | | | 630,108 | |
| | 8,500 | | | JPMorgan Chase & Co. | | | 256,020 | |
| | 5,100 | | | Lowe’s Cos., Inc. | | | 98,634 | |
| | 10,200 | | | Marathon Oil Corp.x | | | 220,116 | |
| | 1,000 | | | Medtronic, Inc.x | | | 33,240 | |
| | 5,000 | | | Nike, Inc., Class B | | | 427,550 | |
| | 2,400 | | | Norfolk Southern Corp. | | | 146,448 | |
| | 2,600 | | | Northrop Grumman Corp. | | | 135,616 | |
| | 4,600 | | | Praxair, Inc. | | | 430,008 | |
| | 4,500 | | | Reliance Steel & Aluminum Co. | | | 153,045 | |
| | 11,400 | | | ResMed, Inc.† | | | 328,206 | |
| | 4,000 | | | Ross Stores, Inc. | | | 314,760 | |
| | 700 | | | Stryker Corp. | | | 32,991 | |
| | 5,700 | | | Time Warner Cable, Inc.x | | | 357,219 | |
| | 9,700 | | | TJX Cos., Inc. | | | 538,059 | |
| | 12,600 | | | Wells Fargo & Co. | | | 303,912 | |
| | 1,000 | | | WW Grainger, Inc. | | | 149,540 | |
| | | | | | | | |
| Total Common Stocks
(Cost $14,659,396) | | | 14,236,749 | |
| | |
| SCHEDULEOF INVESTMENTS | | 35 |
| | | | | | | | |
| Shares or Principal Amount | | Value | |
| | Collateral for Securities on Loan (0.0%) | |
| | 5,194 | | | State Street Navigator Prime Portfolio | | $ | 5,194 | |
| | | | | | | | |
| Total Collateral for Securities
on Loan (Cost $5,194) | | | 5,194 | |
| | | | | | |
| Shares or Principal Amount | | Value | |
| Total Investments 100.1% (Cost $14,664,590) | | $ | 14,241,943 | |
| Liabilities Less Other Assets (0.1)% | | | (17,812 | ) |
| | | | | | |
| Net Assets 100.0% | | $ | 14,224,131 | |
| | | | | | |
The accompanying notes are an integral part of the financial statements.
| † | Non-income producing security. |
| x | All or a portion of the security is pledged as collateral for securities sold short. |
| (a) | All or a portion of the security was on loan as of September 30, 2011. |
| | |
| 36 | | SCHEDULEOF INVESTMENTS |
ICON LONG/SHORT FUND
SCHEDULEOF SECURITIES SOLD SHORT
SEPTEMBER 30, 2011
| | | | | | | | |
| Shares | | | Short Security | | Value | |
| | 1,500 | | | Blue Nile, Inc.† | | $ | 52,920 | |
| | 1,000 | | | Salesforce.com, Inc.† | | | 114,280 | |
| | 2,000 | | | SL Green Realty Corp., REIT | | | 116,300 | |
| | 3,900 | | | SPDR S&P 500 ETF Trust | | | 441,363 | |
| | 3,300 | | | Texas Industries, Inc. | | | 104,742 | |
| | | | | | | | |
| Total Securities Sold Short
(Proceeds $871,963) | | $ | 829,605 | |
| | | | | | | | |
The accompanying notes are an integral part of the financial statements.
| † | Non-income producing security. |
| REIT | Real Estate Investment Trust |
| | | | |
| SCHEDULEOF INVESTMENTS | | | 37 | |
| | | | |
MANAGEMENT OVERVIEW RISK MANAGED EQUITY FUND | | Class I Class C Class Z Class A | | IOCIX IOCCX IOCZX IOCAX |
| Q. | How did the Fund Perform relative to its benchmark? |
| A. | The ICON Risk Managed Equity Fund, Class I, slightly underperformed its benchmark for the fiscal year ended September 30, 2011, gaining 0.31% versus the 0.92% increase in the S&P 1500 Composite Index. The Fund’s Class A shares returned 0.32% (and -5.41% with maximum sales charge) during the same period, the Fund’s Class Z shares returned 0.51% and the Fund’s Class C shares returned -0.45% for the fiscal year (-1.45% with maximum sales charge). Total returns for other periods as of September 30, 2011 appear in the subsequent pages of this Fund’s Management Overview. |
| Q. | What primary factors influenced the Fund’s relative performance during the period? |
| A. | The fiscal year was marked by concern over macro economic factors. A stubbornly high unemployment rate in the U.S., ongoing malaise in the domestic housing market, worries over a potential sharp decline in consumer spending and Europe’s sovereign debt crisis weighed heavily on investors. Global efforts to redress debts that amounted to trillions of dollars did little to assuage investor skittishness. |
The resulting “risk on, risk off” trading led to wild swings in the equity indices. Good economic news generally had investors rushing in to buy stocks while bad economic data sent investors rushing out of the global equity markets. This choppy investment environment can prove challenging for ICON’s value-driven investment methodology.
The global debt crisis contributed to a volatile year characterized by a dramatic rally and a subsequent equally dramatic decline. Between October 1, 2010 and April 30, 2011, the S&P 1500 rose 21.63%. Subsequent concerns over Europe’s sovereign debt crisis and increasing recessionary fears in the U.S. proved too much for the market to bear, however, and the S&P 1500 benchmark fell 17.02% between April 30, 2011 and September 30, 2011.
While both the Fund and its benchmark eked out a nominal return at the end of the 12-month period, the Fund, with a beta 0.53, navigated the volatility in somewhat less dramatic fashion. The Fund’s low beta was the result of a disciplined implementation of option puts and calls. Specifically, the Fund wrote S&P 500 Index call options and used some of the proceeds to buy S&P 500 Index out-of-the-money put options.
Although this hedge, by design, may have reduced the Fund’s upside potential, it also helped offset losses throughout the fiscal year – particularly during the freefall that took place between roughly May 1, 2011 and August 8, 2011. During that timeframe the Fund’s options hedge eliminated just over 600 basis points of the dramatic sell-off relative to its benchmark.
Q. How did the Fund’s composition affect performance?
| A. | The Fund’s overweight position in the IT consulting & services industry benefitted Fund performance. The industry rose almost 25% during the fiscal year and made up an average of around 5% of the Fund versus 1.9% of the benchmark. Fund performance benefitted also from an underweight position in the other diversified financial services industry. Although the industry made up an average of 3% of the benchmark, it represented only 1% of the Fund. This underweighting proved advantageous, as the industry declined more than 30% over the 12-month period. |
In contrast, the Fund’s industrial conglomerates holdings adversely affected performance. The Fund was overweight this industry (5.2% versus 2.4% of the benchmark), which declined 4.2% during the fiscal year. An underweight position in the systems software industry likewise detracted from relative performance as the industry rose 4.3% during the fiscal period - significantly more than the 0.92% rise in the benchmark.
Q. What is your investment outlook for the overall Market?
| A. | As of September 30, 2011, the overall domestic market has a V/P ratio of 1.48 under the ICON system, suggesting significant upside potential. We believe anxious investors have helped depress stock prices to levels below the stocks’ intrinsic worth. If investor fears abate, as we anticipate they will, investors will likely turn their attention to corporate profits that have been steadily growing. This new focus should be a strong catalyst for higher stock prices. We believe negative investor sentiment will give way to an improved economy in the next 12 months and we hope to take advantage of any market rally. |
ICON Risk-Managed Equity Fund
Sector Composition
September 30, 2011
| | | | |
Information Technology | | | 19.0% | |
Industrials | | | 13.1% | |
Consumer Discretionary | | | 12.8% | |
Health Care | | | 12.3% | |
Financial | | | 11.4% | |
Consumer Staples | | | 10.6% | |
Energy | | | 10.4% | |
Telecommunication & Utilities | | | 5.4% | |
Materials | | | 5.3% | |
| | | | |
| | | 100.3% | |
| | | | |
Percentages are based upon common stocks as a percentage of net assets.
ICON Risk-Managed Equity Fund
Industry Composition
September 30, 2011
| | | | |
Integrated Oil & Gas | | | 10.0% | |
IT Consulting & Other Services | | | 7.1% | |
Health Care Equipment | | | 4.9% | |
Computer Hardware | | | 4.7% | |
Apparel Retail | | | 4.1% | |
Household Products | | | 3.9% | |
Railroads | | | 3.8% | |
Pharmaceuticals | | | 2.7% | |
Industrial Conglomerates | | | 2.7% | |
Life & Health Insurance | | | 2.6% | |
Semiconductors | | | 2.5% | |
Cable & Satellite | | | 2.4% | |
Construction & Farm Machinery & Heavy Trucks | | | 2.3% | |
Industrial Gases | | | 2.3% | |
Tobacco | | | 2.2% | |
Regional Banks | | | 2.1% | |
Industrial Machinery | | | 2.0% | |
Health Care Distributors | | | 1.9% | |
Soft Drinks | | | 1.9% | |
Data Processing & Outsourced Services | | | 1.8% | |
General Merchandise Stores | | | 1.8% | |
Systems Software | | | 1.7% | |
Diversified Banks | | | 1.6% | |
| | | | |
Health Care Services | | | 1.6% | |
Electric Utilities | | | 1.5% | |
Automotive Retail | | | 1.4% | |
Aerospace & Defense | | | 1.4% | |
Packaged Foods & Meats | | | 1.3% | |
Hypermarkets & Super Centers | | | 1.3% | |
Multi-Utilities | | | 1.3% | |
Movies & Entertainment | | | 1.2% | |
Diversified Chemicals | | | 1.2% | |
Biotechnology | | | 1.2% | |
Asset Management & Custody Banks | | | 1.2% | |
Consumer Finance | | | 1.1% | |
Specialized Finance | | | 1.1% | |
Gas Utilities | | | 1.0% | |
Integrated Telecommunication Services | | | 1.0% | |
Other Diversified Financial Services | | | 1.0% | |
Paper Packaging | | | 1.0% | |
Other Industries (each less
than 1%) | | | 6.5% | |
| | | | |
| | | 100.3% | |
| | | | |
Percentages are based upon common stocks as a percentage of net assets.
ICON Risk-Managed Equity Fund
Average Annual Total Return
as of September 30, 2011
| | | | | | | | | | | | | | | | | | | | | | | | |
| | | Inception
Date | | | 1 Year | | | 5 Years | | | Since
Inception | | | Gross
Expense
Ratio* | | | Net
Expense
Ratio* | |
ICON Risk-Managed Equity Fund - Class I | | | 9/30/02 | | | | 0.31% | | | | -0.23% | | | | 4.48% | | | | 1.82% | | | | 1.56% | |
S&P Composite 1500 Index | | | | | | | 0.92% | | | | -0.86% | | | | 6.16% | | | | N/A | | | | N/A | |
ICON Risk-Managed Equity Fund - Class C | | | 11/21/02 | | | | -0.45% | | | | -1.05% | | | | 2.89% | | | | 3.36% | | | | 2.30% | |
S&P Composite 1500 Index | | | | | | | 0.92% | | | | -0.86% | | | | 4.68% | | | | N/A | | | | N/A | |
ICON Risk-Managed Equity Fund - Class Z | | | 5/6/04 | | | | 0.51% | | | | -0.03% | | | | 1.75% | | | | 10.41% | | | | 1.31% | |
S&P Composite 1500 Index | | | | | | | 0.92% | | | | -0.86% | | | | 2.62% | | | | N/A | | | | N/A | |
ICON Risk-Managed Equity Fund - Class A | | | 5/31/06 | | | | 0.32% | | | | -0.25% | | | | -0.14% | | | | 2.62% | | | | 1.59% | |
ICON Risk-Managed Equity Fund - Class A (including maximum sales charge of 5.75%) | | | 5/31/06 | | | | -5.41% | | | | -1.42% | | | | -1.24% | | | | 2.62% | | | | 1.59% | |
S&P Composite 1500 Index | | | | | | | 0.92% | | | | -0.86% | | | | 0.10% | | | | N/A | | | | N/A | |
Past performance is not a guarantee of future results. Information about these performance results and the comparative indexes can be found in the About This Report section. The Adviser has agreed to limit certain Fund expenses; without these limitations, returns would have been lower. The limitation provisions may be terminated in the future. Class Z shares are available only to institutional investors.
| * | Please see the most recent prospectus for details. |
Class C total returns exclude applicable sales charges. If sales charges were included returns would be lower.
ICON Risk-Managed Equity Fund
Value of a $10,000 Investment
through September 30, 2011
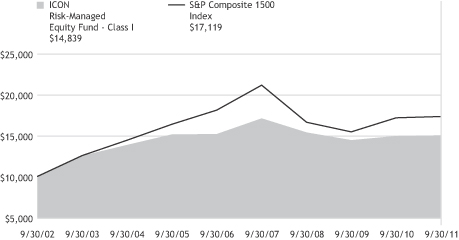
Past performance is not a guarantee of future results. The above graph compares a $10,000 investment made in the Fund’s Class I shares on the Class’ inception date of 9/30/02 to a $10,000 investment made in an unmanaged securities index on that date. Performance for the Fund’s other share classes will vary due to differences in charges and expenses. The Fund’s performance in this chart and the performance table assumes the reinvestment of dividends and capital gain distributions but does not reflect the deduction of taxes that a shareholder would pay on Fund distributions or on the redemption of Fund shares.
ICON RISK-MANAGED EQUITY FUND
SCHEDULEOF INVESTMENTS
SEPTEMBER 30, 2011
| | | | | | | | |
| Shares or Principal Amount | | Value | |
| | | | | | | | |
| | Common Stocks (100.3%) | |
| | 4,400 | | | 3M Co.x | | $ | 315,876 | |
| | 5,800 | | | Accenture PLC, Class Ax | | | 305,544 | |
| | 2,900 | | | AGL Resources, Inc.x | | | 118,146 | |
| | 2,900 | | | Air Products & Chemicals, Inc. | | | 221,473 | |
| | 9,400 | | | Altria Group, Inc.x | | | 252,014 | |
| | 1,700 | | | American Financial Group, Inc.x | | | 52,819 | |
| | 4,000 | | | American Water Works Co., Inc. | | | 120,720 | |
| | 1,800 | | | Ameriprise Financial, Inc.x | | | 70,848 | |
| | 5,100 | | | Amerisource-Bergen Corp.x | | | 190,077 | |
| | 4,400 | | | Amgen, Inc. | | | 241,780 | |
| | 2,500 | | | Apple, Inc.†,x | | | 952,950 | |
| | 2,800 | | | Arrow Electronics, Inc.†,x | | | 77,784 | |
| | 2,000 | | | Assurant, Inc. | | | 71,600 | |
| | 3,600 | | | AT&T, Inc. | | | 102,672 | |
| | 5,000 | | | Automatic Data Processing, Inc.x | | | 235,750 | |
| | 900 | | | AutoZone, Inc.†,x | | | 287,271 | |
| | 8,700 | | | Bank of New York Mellon Corp. | | | 161,733 | |
| | 9,500 | | | BB&T Corp. | | | 202,635 | |
| | 2,300 | | | Becton, Dickinson & Co. | | | 168,636 | |
| | 8,400 | | | Bristol-Myers Squibb Co.x | | | 263,592 | |
| | 3,200 | | | Campbell Soup Co. | | | 103,584 | |
| | 4,600 | | | Cardinal Health, Inc.x | | | 192,648 | |
| | 3,000 | | | Cash America International, Inc. | | | 153,480 | |
| | 4,300 | | | Caterpillar, Inc.x | | | 317,512 | |
| | 5,800 | | | Chevron Corp.x | | | 536,616 | |
| | 700 | | | China Petroleum & Chemical Corp., ADR | | | 67,060 | |
| | | | | | | | |
| Shares or Principal Amount | | Value | |
| | | | | | | | |
| | 400 | | | CME Group, Inc. | | $ | 98,560 | |
| | 2,900 | | | Cognizant Technology Solutions Corp., Class A† | | | 181,830 | |
| | 2,100 | | | Colgate-Palmolive Co. | | | 186,228 | |
| | 8,000 | | | ConocoPhillipsx | | | 506,560 | |
| | 2,100 | | | Cooper Industries PLC | | | 96,852 | |
| | 3,800 | | | CR Bard, Inc.x | | | 332,652 | |
| | 20,400 | | | CSX Corp.x | | | 380,868 | |
| | 900 | | | Cummins, Inc. | | | 73,494 | |
| | 3,700 | | | Danaher Corp. | | | 155,178 | |
| | 1,000 | | | Deere & Co.x | | | 64,570 | |
| | 3,200 | | | DIRECTV, Class A†,x | | | 135,200 | |
| | 5,300 | | | Dover Corp. | | | 246,980 | |
| | 2,800 | | | Dr. Pepper Snapple Group, Inc. | | | 108,584 | |
| | 6,100 | | | E.I. du Pont de Nemours & Co. | | | 243,817 | |
| | 7,600 | | | Eli Lilly & Co.x | | | 280,972 | |
| | 2,200 | | | Express Scripts, Inc.†,x | | | 81,554 | |
| | 7,100 | | | Exxon Mobil Corp.x | | | 515,673 | |
| | 2,700 | | | Ezcorp, Inc., Class A†,x | | | 77,058 | |
| | 1,300 | | | FedEx Corp. | | | 87,984 | |
| | 14,500 | | | General Electric Co.x | | | 220,980 | |
| | 2,900 | | | Genuine Parts Co. | | | 147,320 | |
| | 300 | | | Google, Inc., Class A† | | | 154,314 | |
| | 6,000 | | | Guess?, Inc. | | | 170,940 | |
| | 8,900 | | | Intel Corp.x | | | 189,837 | |
| | 500 | | | IntercontinentalExchange, Inc.† | | | 59,130 | |
| | 5,400 | | | International Business Machines Corp.x | | | 945,162 | |
| | 2,150 | | | Jos. A. Bank Clothiers, Inc.†,x | | | 100,254 | |
| | 6,800 | | | JPMorgan Chase & Co. | | | 204,816 | |
| | 3,000 | | | Kellogg Co. | | | 159,570 | |
| | 3,600 | | | Kimberly-Clark Corp. | | | 255,636 | |
| | 1,500 | | | Laboratory Corp. of America Holdings† | | | 118,575 | |
| | | | |
| SCHEDULEOF INVESTMENTS | | | 43 | |
| | | | | | | | |
| Shares or Principal Amount | | Value | |
| | | | | | | | |
| | 5,300 | | | Lincare Holdings, Inc. | | $ | 119,250 | |
| | 7,200 | | | Lowe’s Cos., Inc. | | | 139,248 | |
| | 3,200 | | | M&T Bank Corp. | | | 223,680 | |
| | 6,800 | | | Medtronic, Inc.x | | | 226,032 | |
| | 13,600 | | | Microsoft Corp.x | | | 338,504 | |
| | 2,500 | | | Murphy Oil Corp. | | | 110,400 | |
| | 2,600 | | | NASDAQ OMX Group, Inc.†,x | | | 60,164 | |
| | 1,300 | | | Nike, Inc., Class B | | | 111,163 | |
| | 3,900 | | | Occidental Petroleum Corp.x | | | 278,850 | |
| | 5,000 | | | Paychex, Inc. | | | 131,850 | |
| | 4,300 | | | PepsiCo, Inc.x | | | 266,170 | |
| | 3,200 | | | Philip Morris International, Inc. | | | 199,616 | |
| | 4,400 | | | PPL Corp. | | | 125,576 | |
| | 2,500 | | | Praxair, Inc. | | | 233,700 | |
| | 5,600 | | | Procter & Gamble Co.x | | | 353,808 | |
| | 5,800 | | | Prudential Financial, Inc.x | | | 271,788 | |
| | 4,000 | | | Rock-Tenn Co., Class Ax | | | 194,720 | |
| | 1,200 | | | Ross Stores, Inc. | | | 94,428 | |
| | 2,200 | | | Sempra Energy | | | 113,300 | |
| | 8,100 | | | Skyworks Solutions, Inc.† | | | 145,314 | |
| | | | | | | | |
| Shares or Principal Amount | | Value | |
| | | | | | | | |
| | 4,100 | | | Southern Co. | | $ | 173,717 | |
| | 7,300 | | | Target Corp.x | | | 357,992 | |
| | 6,200 | | | Texas Instruments, Inc. | | | 165,230 | |
| | 5,400 | | | Time Warner Cable, Inc.x | | | 338,418 | |
| | 8,200 | | | TJX Cos., Inc.x | | | 454,854 | |
| | 7,200 | | | Torchmark Corp.x | | | 250,992 | |
| | 4,600 | | | U.S. Bancorp | | | 108,284 | |
| | 3,500 | | | UGI Corp. | | | 91,945 | |
| | 4,800 | | | Union Pacific Corp.x | | | 392,016 | |
| | 4,000 | | | United Technologies Corp.x | | | 281,440 | |
| | 4,900 | | | Valero Energy Corp. | | | 87,122 | |
| | 5,400 | | | Valspar Corp. | | | 168,534 | |
| | 4,900 | | | Varian Medical Systems, Inc.†,x | | | 255,584 | |
| | 2,800 | | | Verizon Communications, Inc. | | | 103,040 | |
| | 4,900 | | | Wal-Mart Stores, Inc. | | | 254,310 | |
| | 8,100 | | | Walt Disney Co. | | | 244,296 | |
| | 9,300 | | | Wells Fargo & Co. | | | 224,316 | |
| | 5,700 | | | Xcel Energy, Inc. | | | 140,733 | |
| | | | | | | | |
| Total Common Stocks
(Cost $19,303,535) | | | 20,196,352 | |
| | | | | | | | |
Underlying Security/
Expiration Date/
Exercise Price | | Contracts* | | Value | |
| Put Option Purchased (1.1%) | |
| S+P 500 Index, November 2011, $1,090.00 | | 45 | | | 216,225 | |
| | | | | | | | |
Total Put Options Purchased
(Cost $179,251) | | | 216,225 | |
| | | | | | | | |
| |
| Shares or Principal Amount | | Value | |
| | Short-Term Investment (1.5%) | | | | |
| $ | 305,123 | | | State Street Euro Dollar Time Deposit (USD), 0.01%, 10/03/11 | | | 305,123 | |
| | | | | | | | |
| Total Short-Term Investments
(Cost $305,123) | | | 305,123 | |
| Total Investments 102.9%
(Cost $19,787,909) | | | 20,717,700 | |
| Liabilities Less Other Assets
(2.9)% | | | (579,939 | ) |
| | | | | | | | |
| | Net Assets 100.0% | | $ | 20,137,761 | |
| | | | | | | | |
The accompanying notes are an integral part of the financial statements.
| † | Non-income producing security. |
| x | All or a portion of the security is pledged as collateral for call options written. |
| * | All options have 100 shares per contract. |
| ADR | American Depository Receipt |
| | |
| 44 | | SCHEDULEOF INVESTMENTS |
ICON RISK-MANAGED EQUITY FUND
SCHEDULEOF WRITTEN CALL OPTIONS
SEPTEMBER 30, 2011
| | | | | | | | |
Underlying Security/ Expiration Date/ Exercise Price | | Contracts* | | | Value | |
S+P 500 Index, November 2011, $1,200.00 | | | 75 | | | $ | 186,750 | |
| | | | | | | | |
| Total Options Written (Premiums received $250,738) | | | | | | | $186,750 | |
| | | | | | | | |
The accompanying notes are an integral part of the financial statements.
| * | All options have 100 shares per contract. |
| | | | |
| SCHEDULEOF INVESTMENTS | | | 45 | |
STATEMENTSOF ASSETSAND LIABILITIES
SEPTEMBER 30, 2011
| | | | | | | | | | | | | | | | | | | | |
| | | ICON
Bond Fund | | | ICON
Core Equity
Fund | | | ICON Equity
Income
Fund | | | ICON
Long/Short
Fund | | | ICON Risk-
Managed
Equity Fund | |
Assets | | | | | | | | | | | | | | | | | | | | |
Investments, at cost | | $ | 99,970,175 | | | $ | 68,977,537 | | | $ | 37,693,411 | | | $ | 14,664,590 | | | $ | 19,787,909 | |
| | | | | | | | | | | | | | | | | | | | |
Investments, at value† | | | 101,918,467 | | | | 68,230,168 | | | | 34,456,078 | | | | 14,241,943 | | | | 20,717,700 | |
Deposits for short sales | | | – | | | | – | | | | - | | | | 867,087 | | | | – | |
Receivables: | | | | | | | | | | | | | | | | | | | | |
Fund shares sold | | | 146,280 | | | | 33,020 | | | | 55,471 | | | | 8,336 | | | | 53,496 | |
Investments sold | | | – | | | | 120,290 | | | | 1,041,162 | | | | 52,627 | | | | 1,125,604 | |
Interest | | | 1,347,152 | | | | – | | | | 16,956 | | | | – | | | | – | |
Dividends | | | – | | | | 91,821 | | | | 128,957 | | | | 15,502 | | | | 30,002 | |
Expense reimbursements by Adviser | | | 31,590 | | | | – | | | | 14,842 | | | | 8,919 | | | | 9,773 | |
Foreign tax reclaims | | | – | | | | 476 | | | | 12,299 | | | | – | | | | – | |
Other assets | | | 31,617 | | | | 27,376 | | | | 18,891 | | | | 14,953 | | | | 14,893 | |
| | | | | | | | | | | | | | | | | | | | |
Total Assets | | | 103,475,106 | | | | 68,503,151 | | | | 35,744,656 | | | | 15,209,367 | | | | 21,951,468 | |
| | | | | | | | | | | | | | | | | | | | |
Liabilities | | | | | | | | | | | | | | | | | | | | |
Options written, at value (premiums received $250,738) | | | – | | | | – | | | | – | | | | – | | | | 186,750 | |
Securities sold short, at value (proceeds of $871,963) | | | – | | | | – | | | | – | | | | 829,605 | | | | – | |
Payables: | | | | | | | | | | | | | | | | | | | | |
Due to custodian bank | | | – | | | | 87,898 | | | | 5,518 | | | | 61,381 | | | | 7,679 | |
Due to prime broker | | | – | | | | – | | | | – | | | | – | | | | 381,638 | |
Expense recoupments due to adviser | | | 404 | | | | – | | | | 844 | | | | 1,501 | | | | 1,314 | |
Investments purchased | | | – | | | | – | | | | 745,218 | | | | – | | | | 1,136,732 | |
Payable for collateral received on securities loaned | | | 6,560,230 | | | | 1,841,798 | | | | 2,154,862 | | | | 5,194 | | | | – | |
Fund shares redeemed | | | 214,252 | | | | 90,896 | | | | 75,520 | | | | 27,800 | | | | 37,818 | |
Dividends from short positions | | | – | | | | – | | | | – | | | | 2,637 | | | | – | |
Distributions due to shareholders | | | 10,886 | | | | – | | | | 29,564 | | | | – | | | | 2,881 | |
Advisory fees | | | 48,751 | | | | 43,809 | | | | 21,262 | | | | 10,592 | | | | 12,556 | |
Accrued distribution fees | | | 22,057 | | | | 26,308 | | | | 9,561 | | | | 6,729 | | | | 5,453 | |
Fund accounting fees | | | 1,674 | | | | 1,188 | | | | 573 | | | | 257 | | | | 340 | |
Transfer agent fees | | | 8,486 | | | | 10,414 | | | | 6,340 | | | | 5,351 | | | | 4,725 | |
Administration fees | | | 3,909 | | | | 2,802 | | | | 1,290 | | | | 241 | | | | 669 | |
Trustee fees | | | 927 | | | | 639 | | | | 327 | | | | 132 | | | | 163 | |
Accrued expenses | | | 35,745 | | | | 43,168 | | | | 32,181 | | | | 33,816 | | | | 34,989 | |
| | | | | | | | | | | | | | | | | | | | |
Total Liabilities | | | 6,907,321 | | | | 2,148,920 | | | | 3,083,060 | | | | 985,236 | | | | 1,813,707 | |
| | | | | | | | | | | | | | | | | | | | |
Net Assets - all share classes | | $ | 96,567,785 | | | $ | 66,354,231 | | | $ | 32,661,596 | | | $ | 14,224,131 | | | $ | 20,137,761 | |
| | | | | | | | | | | | | | | | | | | | |
Net Assets - Class I | | $ | 91,558,138 | | | $ | 47,091,659 | | | $ | 25,774,771 | | | $ | 7,422,783 | | | $ | 15,996,634 | |
| | | | | | | | | | | | | | | | | | | | |
Net Assets - Class C | | $ | 3,878,927 | | | $ | 17,884,471 | | | $ | 3,873,558 | | | $ | 5,545,931 | | | $ | 2,099,332 | |
| | | | | | | | | | | | | | | | | | | | |
Net Assets - Class Z | | $ | 881,250 | | | $ | 132,765 | | | $ | 141,917 | | | $ | 42,195 | | | $ | 59,526 | |
| | | | | | | | | | | | | | | | | | | | |
Net Assets - Class A | | $ | 249,470 | | | $ | 1,245,336 | | | $ | 2,871,350 | | | $ | 1,213,222 | | | $ | 1,982,269 | |
| | | | | | | | | | | | | | | | | | | | |
| | | | | | | | | | | | | | | | | | | | |
| | | ICON
Bond Fund | | | ICON
Core Equity
Fund | | | ICON Equity
Income
Fund | | | ICON
Long/Short
Fund | | | ICON Risk-
Managed
Equity Fund | |
Net Assets Consist of | | | | | | | | | | | | | | | | | | | | |
Paid-in capital | | $ | 93,262,692 | | | $ | 110,488,686 | | | $ | 64,552,538 | | | $ | 77,256,824 | | | $ | 39,449,871 | |
Accumulated undistributed net investment income/(loss) | | | (329,386 | ) | | | 161,462 | | | | (42,834 | ) | | | - | | | | - | |
Accumulated undistributed net realized gain/(loss) from investments, written options, securities sold short and foreign currency transactions | | | 1,686,187 | | | | (43,548,548 | ) | | | (28,610,560 | ) | | | (62,652,404 | ) | | | (20,305,889 | ) |
Unrealized appreciation/(depreciation) on investments, written options, securities sold short and foreign currency transactions | | | 1,948,292 | | | | (747,369 | ) | | | (3,237,548 | ) | | | (380,289 | ) | | | 993,779 | |
| | | | | | | | | | | | | | | | | | | | |
Net Assets | | $ | 96,567,785 | | | $ | 66,354,231 | | | $ | 32,661,596 | | | $ | 14,224,131 | | | $ | 20,137,761 | |
| | | | | | | | | | | | | | | | | | | | |
Shares outstanding (unlimited shares authorized, no par value) | | | | | | | | | | | | | | | | | | | | |
Class I | | | 9,044,012 | | | | 5,266,439 | | | | 2,509,863 | | | | 644,401 | | | | 1,496,041 | |
Class C | | | 382,322 | | | | 2,188,186 | | | | 381,093 | | | | 509,318 | | | | 208,064 | |
Class Z | | | 87,192 | | | | 15,044 | | | | 13,902 | | | | 3,635 | | | | 5,470 | |
Class A | | | 24,681 | | | | 147,161 | | | | 282,921 | | | | 106,031 | | | | 185,969 | |
Net asset value (offering and redemption price per share) | | | | | | | | | | | | | | | | | | | | |
Class I | | $ | 10.12 | | | $ | 8.94 | | | $ | 10.27 | | | $ | 11.52 | | | $ | 10.69 | |
Class C | | $ | 10.15 | | | $ | 8.17 | | | $ | 10.16 | | | $ | 10.89 | | | $ | 10.09 | |
Class Z | | $ | 10.11 | | | $ | 8.82 | | | $ | 10.21 | | | $ | 11.61 | | | $ | 10.88 | |
Class A | | $ | 10.11 | | | $ | 8.46 | | | $ | 10.15 | | | $ | 11.44 | | | $ | 10.66 | |
Class A maximum offering price (100%/(100%-maximum sales charge)) of net asset value adjusted to the nearest cent per share | | $ | 10.61 | | | $ | 8.98 | | | $ | 10.77 | | | $ | 12.14 | | | $ | 11.31 | |
| | | | | |
† Includes securities on loan of | | $ | 6,216,808 | | | $ | 1,788,475 | | | $ | 2,031,367 | | | $ | 5,100 | | | $ | – | |
The accompanying notes are an integral part of the financial statements.
STATEMENTSOF OPERATIONS
FORTHEYEARENDED SEPTEMBER 30, 2011
| | | | | | | | | | | | | | | | | | | | |
| | | ICON
Bond
Fund | | | ICON Core
Equity Fund | | | ICON
Equity
Income Fund | | | ICON
Long/Short
Fund | | | ICON
Risk-Managed
Equity Fund | |
Investment Income | | | | | | | | | | | | | | | | | | | | |
Interest | | $ | 6,959,739 | | | $ | 103 | | | $ | 277,602 | | | $ | 2,665 | | | $ | 38 | |
Dividends | | | – | | | | 1,620,001 | | | | 2,228,348 | | | | 324,896 | | | | 543,333 | |
Income from securities lending, net | | | 51,983 | | | | 32,102 | | | | 40,123 | | | | 8,631 | | | | 8,485 | |
Foreign taxes withheld | | | – | | | | (5,866 | ) | | | (48,165) | | | | (2,109 | ) | | | (1,618 | ) |
| | | | | | | | | | | | | | | | | | | | |
Total Investment Income | | | 7,011,722 | | | | 1,646,340 | | | | 2,497,908 | | | | 334,083 | | | | 550,238 | |
| | | | | | | | | | | | | | | | | | | | |
Expenses | | | | | | | | | | | | | | | | | | | | |
Advisory fees | | | 801,143 | | | | 691,698 | | | | 352,723 | | | | 161,286 | | | | 180,450 | |
Distribution fees: | | | | | | | | | | | | | | | | | | | | |
Class I | | | 321,055 | | | | 167,126 | | | | 99,382 | | | | 24,525 | | | | 45,172 | |
Class C | | | 34,536 | | | | 236,860 | | | | 42,512 | | | | 76,991 | | | | 25,788 | |
Class A | | | 135 | | | | 3,666 | | | | 7,240 | | | | 3,506 | | | | 8,374 | |
Fund accounting fees | | | 14,766 | | | | 11,024 | | | | 6,326 | | | | 1,743 | | | | 2,427 | |
Transfer agent fees | | | 91,127 | | | | 123,774 | | | | 64,609 | | | | 52,392 | | | | 50,752 | |
Administration fees | | | 66,074 | | | | 45,663 | | | | 23,274 | | | | 9,395 | | | | 11,913 | |
Prime broker expense | | | – | | | | – | | | | – | | | | 14,383 | | | | – | |
Custody fees | | | 5,725 | | | | 3,290 | | | | 7,309 | | | | 1,155 | | | | 1,970 | |
Registration fees: | | | | | | | | | | | | | | | | | | | | |
Class I | | | 22,385 | | | | 19,621 | | | | 16,536 | | | | 12,545 | | | | 14,030 | |
Class C | | | 9,738 | | | | 12,624 | | | | 9,872 | | | | 11,211 | | | | 9,408 | |
Class A | | | 2 | | | | 12,598 | | | | 12,705 | | | | 12,850 | | | | 13,317 | |
Insurance expense | | | 23,473 | | | | 14,227 | | | | 6,013 | | | | 4,312 | | | | 5,029 | |
Trustee fees and expenses | | | 13,019 | | | | 9,196 | | | | 4,414 | | | | 1,789 | | | | 2,204 | |
Audit and Tax Service expense | | | 37,231 | | | | 34,743 | | | | 36,448 | | | | 40,834 | | | | 40,909 | |
Interest expense | | | 3,244 | | | | 3,880 | | | | 1,254 | | | | 3,085 | | | | 8,474 | |
Recoupment of previously reimbursed expenses | | | 404 | | | | – | | | | 9,657 | | | | 1,501 | | | | 1,314 | |
Other expenses | | | 83,887 | | | | 94,885 | | | | 52,948 | | | | 29,070 | | | | 50,011 | |
Dividends on Short positions | | | – | | | | – | | | | – | | | | 56,694 | | | | – | |
| | | | | | | | | | | | | | | | | | | | |
Total expenses before expense reimbursement | | | 1,527,944 | | | | 1,484,875 | | | | 753,222 | | | | 519,267 | | | | 471,542 | |
Expense reimbursement by Adviser due to expense limitation agreement | | | (167,544 | ) | | | – | | | | (38,479) | | | | (93,442 | ) | | | (95,012 | ) |
| | | | | | | | | | | | | | | | | | | | |
Net Expenses | | | 1,360,400 | | | | 1,484,875 | | | | 714,743 | | | | 425,825 | | | | 376,530 | |
| | | | | | | | | | | | | | | | | | | | |
Net Investment Income/(Loss) | | | 5,651,322 | | | | 161,465 | | | | 1,783,165 | | | | (91,742 | ) | | | 173,708 | |
| | | | | | | | | | | | | | | | | | | | |
| | | | | | | | | | | | | | | | | | | | |
| | | ICON
Bond
Fund | | | ICON Core
Equity Fund | | | ICON
Equity
Income Fund | | | ICON
Long/Short
Fund | | | ICON
Risk-Managed
Equity Fund | |
Net Realized and Unrealized Gain/(Loss) on Investments, written options, securities sold short and foreign currency transactions | | | | | | | | | | | | | | | | | | | | |
Net realized gain/(loss) from investment transactions | | $ | 3,288,516 | | | $ | 10,265,342 | | | $ | 5,489,334 | | | $ | 2,239,395 | | | $ | 2,436,117 | |
Net realized gain/(loss) from foreign currency transactions | | | – | | | | – | | | | 668 | | | | 28 | | | | – | |
Net realized gain/(loss) from written option transactions | | | – | | | | – | | | | – | | | | – | | | | (327,694 | ) |
Net realized gain/(loss) from securities sold short | | | – | | | | – | | | | – | | | | (708,407 | ) | | | – | |
Change in unrealized net appreciation/(depreciation) on investments and foreign currency transactions | | | (8,196,071 | ) | | | (5,953,813 | ) | | | (7,090,202 | ) | | | (1,379,785 | ) | | | (1,810,906 | ) |
Change in unrealized net appreciation/(depreciation) on written options | | | – | | | | – | | | | – | | | | – | | | | 71,420 | |
Change in unrealized net appreciation/(depreciation) on securities sold short | | | – | | | | – | | | | – | | | | 1,399 | | | | – | |
| | | | | | | | | | | | | | | | | | | | |
Net Realized and Unrealized Gain/(Loss) on Investments, written options, securities sold short and foreign currency transactions | | | (4,907,555 | ) | | | 4,311,529 | | | | (1,600,200 | ) | | | 152,630 | | | | 368,937 | |
| | | | | | | | | | | | | | | | | | | | |
Net Increase/(Decrease) in Net Assets Resulting From Operations | | $ | 743,767 | | | $ | 4,472,994 | | | $ | 182,965 | | | $ | 60,888 | | | $ | 542,645 | |
| | | | | | | | | | | | | | | | | | | | |
The accompanying notes are an integral part of the financial statements.
STATEMENTSOF CHANGESIN NET ASSETS
| | | | | | | | | | | | | | | | |
| | | ICON Bond Fund | | | ICON Core Equity Fund | |
| | | Year Ended
September 30,
2011 | | | Year Ended
September 30,
2010 | | | Year Ended
September 30,
2011 | | | Year Ended
September 30,
2010 | |
Operations | | | | | | | | | | | | | | | | |
Net investment income/(loss) | | $ | 5,651,322 | | | $ | 7,192,155 | | | $ | 161,465 | | | $ | 168,491 | |
Net realized gain/(loss) on investment transactions, foreign currency transactions, written options, and securities sold short | | | 3,288,516 | | | | 3,917,555 | | | | 10,265,342 | | | | 14,090,952 | |
Change in net unrealized appreciation/(depreciation) on investments, foreign currency translations, written options and securities sold short | | | (8,196,071 | ) | | | 4,715,381 | | | | (5,953,813 | ) | | | (13,188,272 | ) |
| | | | | | | | | | | | | | | | |
Net increase/(decrease) in net assets resulting from operations | | | 743,767 | | | | 15,825,091 | | | | 4,472,994 | | | | 1,071,171 | |
| | | | | | | | | | | | | | | | |
Dividends and Distributions to Shareholders | | | | | | | | | | | | | | | | |
Net investment income | | | | | | | | | | | | | | | | |
Class I | | | (5,454,987 | ) | | | (7,018,728 | ) | | | (168,477 | ) | | | (1,206,894 | ) |
Class C | | | (148,880 | ) | | | (171,690 | ) | | | – | | | | (306,237 | ) |
Class Z | | | (44,454 | ) | | | (47,033 | ) | | | – | | | | (12,403 | ) |
Class A | | | (2,400 | ) | | | – | | | | – | | | | (17,821 | ) |
Net realized gains | | | | | | | | | | | | | | | | |
Class I | | | (2,996,875 | ) | | | (558,064 | ) | | | – | | | | – | |
Class C | | | (86,038 | ) | | | (15,108 | ) | | | – | | | | – | |
Class Z | | | (21,226 | ) | | | (3,365 | ) | | | – | | | | – | |
Class A | | | (723 | ) | | | – | | | | – | | | | – | |
| | | | | | | | | | | | | | | | |
Net decrease from dividends and distributions | | | (8,755,583 | ) | | | (7,813,988 | ) | | | (168,477 | ) | | | (1,543,355 | ) |
| | | | | | | | | | | | | | | | |
Fund Share Transactions | | | | | | | | | | | | | | | | |
Shares sold | | | | | | | | | �� | | | | | | | |
Class I | | | 32,580,297 | | | | 32,845,451 | | | | 12,906,410 | | | | 32,073,401 | |
Class C | | | 750,410 | | | | 1,213,265 | | | | 1,201,294 | | | | 1,562,483 | |
Class Z | | | 19,196 | | | | 20,785 | | | | 39,438 | | | | 72,404 | |
Class A | | | 267,330 | | | | 10 | | | | 572,831 | | | | 259,338 | |
Reinvested dividends and distributions | | | | | | | | | | | | | | | | |
Class I | | | 8,265,981 | | | | 7,377,916 | | | | 164,558 | | | | 1,185,449 | |
Class C | | | 213,732 | | | | 177,601 | | | | – | | | | 292,854 | |
Class Z | | | 1,620 | | | | 1,117 | | | | – | | | | 6,842 | |
Class A | | | 2,562 | | | | – | | | | – | | | | 15,412 | |
Shares repurchased | | | | | | | | | | | | | | | | |
Class I | | | (87,891,304 | ) | | | (67,826,327 | ) | | | (43,843,823 | ) | | | (21,796,993 | ) |
Class C | | | (1,362,160 | ) | | | (1,511,408 | ) | | | (8,294,982 | ) | | | (10,352,418 | ) |
Class Z | | | (126,205 | ) | | | (111,600 | ) | | | (345,913 | ) | | | (561,889 | ) |
Class A | | | (12,669 | ) | | | – | | | | (660,978 | ) | | | (880,468 | ) |
| | | | | | | | | | | | | | | | |
Net Increase/(decrease) from fund share transactions | | | (47,291,210 | ) | | | (27,813,190 | ) | | | (38,261,165 | ) | | | 1,876,415 | |
| | | | | | | | | | | | | | | | |
Total net increase/(decrease) in net assets | | | (55,303,026 | ) | | | (19,802,087 | ) | | | (33,956,648 | ) | | | 1,404,231 | |
Net Assets | | | | | | | | | | | | | | | | |
Beginning of year | | | 151,870,811 | | | | 171,672,898 | | | | 100,310,879 | | | | 98,906,648 | |
| | | | | | | | | | | | | | | | |
End of year | | $ | 96,567,785 | | | $ | 151,870,811 | | | $ | 66,354,231 | | | $ | 100,310,879 | |
| | | | | | | | | | | | | | | | |
| | | | | | | | | | | | | | | | | | | | | | |
| ICON Equity Income Fund | | | ICON Long/Short Fund | | | ICON Risk-Managed Equity Fund | |
Year Ended September 30, 2011 | | | Year Ended
September 30,
2010 | | | Year Ended
September 30,
2011 | | | Year Ended
September 30,
2010 | | | Year Ended
September 30,
2011 | | | Year Ended
September 30,
2010 | |
| | | | | | | | | | | | | | | | | | | | | | |
| $ | 1,783,165 | | | $ | 1,767,561 | | | $ | (91,742 | ) | | $ | (89,691 | ) | | $ | 173,708 | | | $ | 156,568 | |
| 5,490,002 | | | | 8,290,828 | | | | 1,531,016 | | | | 2,734,750 | | | | 2,108,423 | | | | 5,402,433 | |
| (7,090,202 | ) | | | (5,642,176 | ) | | | (1,378,386 | ) | | | (2,082,344 | ) | | | (1,739,486 | ) | | | (4,101,512 | ) |
| | | | | | | | | | | | | | | | | | | | | | |
| 182,965 | | | | 4,416,213 | | | | 60,888 | | | | 562,715 | | | | 542,645 | | | | 1,457,489 | |
| | | | | | | | | | | | | | | | | | | | | | |
| | | | | | | | | | | | | | | | | | | | | | |
| | | | | | | | | | | | | | | | | | | | | | |
| | (1,549,373 | ) | | | (1,394,021 | ) | | | – | | | | (226,189 | ) | | | (171,775 | ) | | | (113,070 | ) |
| | (125,340 | ) | | | (94,130 | ) | | | – | | | | (108,323 | ) | | | (3,673 | ) | | | – | |
| | (6,010 | ) | | | (2,847 | ) | | | – | | | | (2,537 | ) | | | (807 | ) | | | (331 | ) |
| | (124,650 | ) | | | (20,940 | ) | | | – | | | | (33,034 | ) | | | (27,376 | ) | | | (16,623 | ) |
| | | | | | | | | | | | | | | | | | | | | | |
| | – | | | | – | | | | – | | | | – | | | | – | | | | – | |
| | – | | | | – | | | | – | | | | – | | | | – | | | | – | |
| | – | | | | – | | | | – | | | | – | | | | – | | | | – | |
| | – | | | | – | | | | – | | | | – | | | | – | | | | – | |
| | | | | | | | | | | | | | | | | | | | | | |
| (1,805,373 | ) | | | (1,511,938 | ) | | | – | | | | (370,083 | ) | | | (203,631 | ) | | | (130,024 | ) |
| | | | | | | | | | | | | | | | | | | | | | |
| | | | | | | | | | | | | | | | | | | | | | |
| | | | | | | | | | | | | | | | | | | | | | |
| | 12,707,420 | | | | 6,439,261 | | | | 2,207,397 | | | | 7,069,126 | | | | 4,921,371 | | | | 3,611,409 | |
| | 1,345,156 | | | | 820,363 | | | | 172,641 | | | | 563,229 | | | | 495,568 | | | | 901,343 | |
| | 80,077 | | | | 20,499 | | | | 5,994 | | | | 48,904 | | | | 9,665 | | | | 18,551 | |
| | 2,446,198 | | | | 1,691,037 | | | | 378,445 | | | | 517,157 | | | | 454,303 | | | | 3,131,899 | |
| | | | | | | | | | | | | | | | | | | | | | |
| | 1,486,514 | | | | 1,365,429 | | | | – | | | | 207,415 | | | | 162,601 | | | | 110,939 | |
| | 101,343 | | | | 87,134 | | | | – | | | | 99,955 | | | | 3,600 | | | | – | |
| | 5,779 | | | | 2,847 | | | | – | | | | 2,472 | | | | 807 | | | | 331 | |
| | 88,433 | | | | 15,489 | | | | – | | | | 28,090 | | | | 24,439 | | | | 15,056 | |
| | | | | | | | | | | | | | | | | | | | | | |
| | (25,184,721 | ) | | | (14,371,467 | ) | | | (6,096,500 | ) | | | (11,219,022 | ) | | | (7,970,159 | ) | | | (23,642,476 | ) |
| | (843,467 | ) | | | (901,740 | ) | | | (4,226,492 | ) | | | (6,341,689 | ) | | | (1,039,898 | ) | | | (1,591,293 | ) |
| | (16,701 | ) | | | (6,334 | ) | | | (99,121 | ) | | | (47,144 | ) | | | (12,896 | ) | | | (31,188 | ) |
| | (840,365 | ) | | | (431,805 | ) | | | (1,018,297 | ) | | | (1,102,767 | ) | | | (2,709,760 | ) | | | (639,913 | ) |
| | | | | | | | | | | | | | | | | | | | | | |
| (8,624,334 | ) | | | (5,269,287 | ) | | | (8,675,933 | ) | | | (10,174,274 | ) | | | (5,660,359 | ) | | | (18,115,342 | ) |
| | | | | | | | | | | | | | | | | | | | | | |
| (10,246,742 | ) | | | (2,365,012 | ) | | | (8,615,045 | ) | | | (9,981,642 | ) | | | (5,321,345 | ) | | | (16,787,877 | ) |
| | | | | | | | | | | | | | | | | | | | | | |
| | 42,908,338 | | | | 45,273,350 | | | | 22,839,176 | | | | 32,820,818 | | | | 25,459,106 | | | | 42,246,983 | |
| | | | | | | | | | | | | | | | | | | | | | |
| $ | 32,661,596 | | | $ | 42,908,338 | | | $ | 14,224,131 | | | $ | 22,839,176 | | | $ | 20,137,761 | | | $ | 25,459,106 | |
| | | | | | | | | | | | | | | | | | | | | | |
STATEMENTS OF CHANGES IN NET ASSETS (CONTINUED)
| | | | | | | | | | | | | | | | |
| | | ICON Bond
Fund | | | ICON
Core Equity Fund | |
| | | Year Ended
September 30,
2011 | | | Year Ended
September 30,
2010 | | | Year Ended
September 30,
2011 | | | Year Ended
September 30,
2010 | |
Transactions in Fund Shares | | | | | | | | | | | | | | | | |
Shares sold | | | | | | | | | | | | | | | | |
Class I | | | 3,096,208 | | | | 3,125,554 | | | | 1,260,372 | | | | 3,491,672 | |
Class C | | | 71,019 | | | | 114,827 | | | | 125,482 | | | | 183,620 | |
Class Z | | | 1,835 | | | | 1,975 | | | | 3,786 | | | | 7,898 | |
Class A | | | 25,660 | | | | 0.925 | | | | 56,844 | | | | 29,488 | |
Reinvested dividends and distributions | | | | | | | | | | | | | | | | |
Class I | | | 795,208 | | | | 700,903 | | | | 16,133 | | | | 128,576 | |
Class C | | | 20,535 | | | | 16,834 | | | | – | | | | 34,209 | |
Class Z | | | 156 | | | | 106 | | | | – | | | | 740 | |
Class A | | | 249 | | | | – | | | | – | | | | 1,726 | |
Shares repurchased | | | | | | | | | | | | | | | | |
Class I | | | (8,382,077 | ) | | | (6,448,096 | ) | | | (4,156,795 | ) | | | (2,411,026 | ) |
Class C | | | (128,801 | ) | | | (143,069 | ) | | | (877,121 | ) | | | (1,230,820 | ) |
Class Z | | | (12,029 | ) | | | (10,776 | ) | | | (33,715 | ) | | | (61,378 | ) |
Class A | | | (1,229 | ) | | | – | | | | (66,713 | ) | | | (99,609 | ) |
| | | | | | | | | | | | | | | | |
Net increase/(decrease) | | | (4,513,266 | ) | | | (2,641,741 | ) | | | (3,671,727 | ) | | | 75,096 | |
| | | | | | | | | | | | | | | | |
Shares outstanding, beginning of year | | | 14,051,473 | | | | 16,693,214 | | | | 11,288,557 | | | | 11,213,461 | |
| | | | | | | | | | | | | | | | |
Shares outstanding, end of year | | | 9,538,207 | | | | 14,051,473 | | | | 7,616,830 | | | | 11,288,557 | |
| | | | | | | | | | | | | | | | |
Accumulated undistributed net investment income/(loss) | | $ | (329,386 | ) | | $ | (329,987 | ) | | $ | 161,462 | | | $ | 168,474 | |
| | | | | | | | | | | | | | | | |
The accompanying notes are an integral part of the financial statements.
| | | | | | | | | | | | | | | | | | | | |
ICON Equity Income Fund | | | ICON
Long/Short Fund | | | ICON
Risk-Managed Equity Fund | |
Year Ended
September 30,
2011 | | Year Ended
September 30,
2010 | | | Year Ended
September 30,
2011 | | | Year Ended
September 30,
2010 | | | Year Ended
September 30,
2011 | | | Year Ended
September 30,
2010 | |
| | | | | | | | | | | | | | | | | | | | |
| | | | | | | | | | | | | | | | | | | | |
| 1,070,619 | | | 600,784 | | | | 168,947 | | | | 586,428 | | | | 431,144 | | | | 335,464 | |
| 116,234 | | | 77,154 | | | | 14,038 | | | | 49,342 | | | | 47,099 | | | | 89,178 | |
| 6,846 | | | 1,894 | | | | 480 | | | | 4,041 | | | | 834 | | | | 1,688 | |
| 209,444 | | | 156,113 | | | | 31,066 | | | | 43,946 | | | | 40,810 | | | | 288,848 | |
| | | | | | | | | | | | | | | | | | | | |
| 128,303 | | | 129,419 | | | | – | | | | 17,015 | | | | 14,135 | | | | 10,089 | |
| 8,989 | | | 8,411 | | | | – | | | | 8,558 | | | | 330 | | | | – | |
| 508 | | | 269 | | | | – | | | | 202 | | | | 69 | | | | 30 | |
| 7,833 | | | 1,454 | | | | – | | | | 2,320 | | | | 2,138 | | | | 1,379 | |
| | | | | | | | | | | | | | | | | | | | |
| (2,120,602) | | | (1,345,972 | ) | | | (478,602 | ) | | | (946,546 | ) | | | (693,438 | ) | | | (2,195,558 | ) |
| (73,121) | | | (86,142 | ) | | | (350,539 | ) | | | (560,432 | ) | | | (96,498 | ) | | | (155,945 | ) |
| (1,444) | | | (582 | ) | | | (7,938 | ) | | | (4,033 | ) | | | (1,092 | ) | | | (2,874 | ) |
| (73,851) | | | (41,307 | ) | | | (82,587 | ) | | | (93,559 | ) | | | (232,103 | ) | | | (59,543 | ) |
| | | | | | | | | | | | | | | | | | | | |
| (720,242) | | | (498,505 | ) | | | (705,135 | ) | | | (892,718 | ) | | | (486,572 | ) | | | (1,687,244 | ) |
| | | | | | | | | | | | | | | | | | | | |
3,908,021 | | | 4,406,526 | | | | 1,968,520 | | | | 2,861,238 | | | | 2,382,116 | | | | 4,069,360 | |
| | | | | | | | | | | | | | | | | | | | |
| 3,187,779 | | | 3,908,021 | | | | 1,263,385 | | | | 1,968,520 | | | | 1,895,544 | | | | 2,382,116 | |
| | | | | | | | | | | | | | | | | | | | |
$ (42,834) | | $ | 28,158 | | | $ | - | | | $ | (6 | ) | | $ | - | | | $ | 29,973 | |
| | | | | | | | | | | | | | | | | | | | |
FINANCIAL HIGHLIGHTS
| | | | | | | | | | | | | | | | | | | | | | | | |
| | | | | | Income/(loss) from investment operations | | | Less dividends and | |
| | | Net asset
value,
beginning
of period | | | Net
investment
income/
(loss)(x) | | | Net realized
and unrealized
gains/(losses)
on investments | | | Total from
investment
operations | | | Dividends
from net
investment
income | | | Distributions
from net
realized
gains | |
ICON Bond Fund | | | | | | | | | | | | | | | | | | | | | | | | |
Class I | | | | | | | | | | | | | | | | | | | | | | | | |
Year Ended September 30, 2011 | | $ | 10.81 | | | $ | 0.45 | | | $ | (0.47 | ) | | $ | (0.02 | ) | | $ | (0.45 | ) | | $ | (0.22 | ) |
Year Ended September 30, 2010 | | | 10.28 | | | | 0.46 | | | | 0.56 | | | | 1.02 | | | | (0.45 | ) | | | (0.04 | ) |
Year Ended September 30, 2009 | | | 9.44 | | | | 0.40 | | | | 0.84 | | | | 1.24 | | | | (0.40 | ) | | | - | |
Year Ended September 30, 2008 | | | 10.02 | | | | 0.42 | | | | (0.55 | ) | | | (0.13 | ) | | | (0.45 | ) | | | - | |
Year Ended September 30, 2007 | | | 10.00 | | | | 0.44 | | | | 0.03 | | | | 0.47 | | | | (0.45 | ) | | | - | |
Class C | | | | | | | | | | | | | | | | | | | | | | | | |
Year Ended September 30, 2011 | | | 10.83 | | | | 0.39 | | | | (0.46 | ) | | | (0.07 | ) | | | (0.39 | ) | | | (0.22 | ) |
Year Ended September 30, 2010 | | | 10.30 | | | | 0.39 | | | | 0.57 | | | | 0.96 | | | | (0.39 | ) | | | (0.04 | ) |
Year Ended September 30, 2009 | | | 9.46 | | | | 0.34 | | | | 0.84 | | | | 1.18 | | | | (0.34 | ) | | | - | |
Year Ended September 30, 2008 | | | 10.05 | | | | 0.35 | | | | (0.55 | ) | | | (0.20 | ) | | | (0.39 | ) | | | - | |
Year Ended September 30, 2007 | | | 10.02 | | | | 0.38 | | | | 0.04 | | | | 0.42 | | | | (0.39 | ) | | | - | |
Class Z | | | | | | | | | | | | | | | | | | | | | | | | |
Year Ended September 30, 2011 | | | 10.79 | | | | 0.47 | | | | (0.46 | ) | | | 0.01 | | | | (0.47 | ) | | | (0.22 | ) |
Year Ended September 30, 2010 | | | 10.26 | | | | 0.48 | | | | 0.57 | | | | 1.05 | | | | (0.48 | ) | | | (0.04 | ) |
Year Ended September 30, 2009 | | | 9.42 | | | | 0.45 | | | | 0.81 | | | | 1.26 | | | | (0.42 | ) | | | - | |
Year Ended September 30, 2008 | | | 10.02 | | | | 0.44 | | | | (0.57 | ) | | | (0.13 | ) | | | (0.47 | ) | | | - | |
Year Ended September 30, 2007 | | | 10.00 | | | | 0.46 | | | | 0.03 | | | | 0.49 | | | | (0.47 | ) | | | - | |
Class A | | | | | | | | | | | | | | | | | | | | | | | | |
Year Ended September 30, 2011 | | | 10.81 | | | | 0.46 | | | | (0.46 | ) | | | 0.00 | | | | (0.48 | ) | | | (0.22 | ) |
| | | | | | | | | | | | | | | | | | | | | | | | | | | | | | | | | | |
| distributions | | | | | | | | | | | | Ratio of expenses
to average net assets | | | Ratio of net investment
income/(loss)
to average net assets | | | | |
Total
dividends
and
distributions | | | Net asset
value, end
of period | | | Total
return* | | | Net assets,
end of
period (in
thousands) | | | Before
expense
limitation
and transfer
agent
earnings
credit | | | After
expense
limitation
and transfer
agent
earnings
credit(b) | | | Before
expense
limitation
and transfer
agent
earnings
credit | | | After
expense
limitation
and transfer
agent
earnings
credit | | | Portfolio
turnover
rate(a) | |
| | | | | | | | | | | | | | | | | | | | | | | | | | | | | | | | | | |
| | | | | | | | | | | | | | | | | | | | | | | | | | | | | | | | | | |
| $ | (0.67 | ) | | $ | 10.12 | | | | (0.19 | )% | | $ | 91,558 | | | | 1.11 | % | | | 1.00 | % | | | 4.14 | % | | | 4.25 | % | | | 32.13 | % |
| | (0.49 | ) | | | 10.81 | | | | 10.20 | % | | | 146,277 | | | | 1.13 | % | | | 1.00 | % | | | 4.21 | % | | | 4.34 | % | | | 63.47 | % |
| | (0.40 | ) | | | 10.28 | | | | 13.50 | % | | | 166,145 | | | | 1.09 | % | | | 1.00 | % | | | 4.08 | % | | | 4.17 | % | | | 73.71 | % |
| | (0.45 | ) | | | 9.44 | | | | (1.48 | )% | | | 100,985 | | | | 1.08 | % | | | 1.00 | % | | | 4.06 | % | | | 4.14 | % | | | 73.47 | % |
| | (0.45 | ) | | | 10.02 | | | | 4.80 | % | | | 123,102 | | | | 1.09 | % | | | 1.00 | % | | | 4.34 | % | | | 4.42 | % | | | 34.40 | % |
| | | | | | | | | | | | | | | | | | | | | | | | | | | | | | | | | | |
| | (0.61 | ) | | | 10.15 | | | | (0.68 | )% | | | 3,879 | | | | 2.16 | % | | | 1.60 | % | | | 3.11 | % | | | 3.67 | % | | | 32.13 | % |
| | (0.43 | ) | | | 10.83 | | | | 9.52 | % | | | 4,544 | | | | 2.46 | % | | | 1.60 | % | | | 2.88 | % | | | 3.74 | % | | | 63.47 | % |
| | (0.34 | ) | | | 10.30 | | | | 12.80 | % | | | 4,441 | | | | 2.40 | % | | | 1.60 | % | | | 2.75 | % | | | 3.55 | % | | | 73.71 | % |
| | (0.39 | ) | | | 9.46 | | | | (2.16 | )% | | | 2,725 | | | | 2.42 | % | | | 1.60 | % | | | 2.71 | % | | | 3.53 | % | | | 73.47 | % |
| | (0.39 | ) | | | 10.05 | | | | 4.27 | % | | | 1,491 | | | | 3.15 | % | | | 1.60 | % | | | 2.28 | % | | | 3.82 | % | | | 34.40 | % |
| | | | | | | | | | | | | | | | | | | | | | | | | | | | | | | | | | |
| | (0.69 | ) | | | 10.11 | | | | 0.15 | % | | | 881 | | | | 1.18 | % | | | 0.75 | % | | | 4.08 | % | | | 4.51 | % | | | 32.13 | % |
| | (0.52 | ) | | | 10.79 | | | | 10.45 | % | | | 1,049 | | | | 1.39 | % | | | 0.75 | % | | | 3.95 | % | | | 4.59 | % | | | 63.47 | % |
| | (0.42 | ) | | | 10.26 | | | | 13.79 | % | | | 1,087 | | | | 1.91 | % | | | 0.75 | % | | | 3.34 | % | | | 4.50 | % | | | 73.71 | % |
| | (0.47 | ) | | | 9.42 | | | | (1.43 | )% | | | 8 | | | | 186.00 | % | | | 0.75 | % | | | (180.79 | )% | | | 4.46 | % | | | 73.47 | % |
| | (0.47 | ) | | | 10.02 | | | | 5.02 | % | | | 11 | | | | 31.60 | % | | | 0.75 | % | | | (26.18 | )% | | | 4.67 | % | | | 34.40 | % |
| | | | | | | | | | | | | | | | | | | | | | | | | | | | | | | | | | |
| | (0.70 | ) | | | 10.11 | | | | (0.02 | )% | | | 249 | | | | 5.83 | % | | | 1.01 | % | | | (0.38 | )% | | | 4.44 | % | | | 32.13 | % |
FINANCIAL HIGHLIGHTS (CONTINUED)
| | | | | | | | | | | | | | | | | | | | | | | | |
| | | | | | Income/(loss) from investment operations | | | Less dividends and | |
| | | Net asset
value,
beginning
of period | | | Net
investment
income/
(loss)(x) | | | Net realized
and unrealized
gains/(losses)
on investments | | | Total from
investment
operations | | | Dividends
from net
investment
income | | | Distributions
from net
realized
gains | |
ICON Core Equity Fund | | | | | | | | | | | | | | | | | | | | | | | | |
Class I | | | | | | | | | | | | | | | | | | | | | | | | |
Year Ended September 30, 2011 | | $ | 9.08 | | | $ | 0.04 | | | $ | (0.16 | ) | | $ | (0.12 | ) | | $ | (0.02 | ) | | $ | - | |
Year Ended September 30, 2010 | | | 9.08 | | | | 0.04 | | | | 0.12 | | | | 0.16 | | | | (0.16 | ) | | | - | |
Year Ended September 30, 2009 | | | 11.24 | | | | 0.10 | | | | (2.26 | ) | | | (2.16 | ) | | | - | | | | - | |
Year Ended September 30, 2008 | | | 16.59 | | | | 0.09 | | | | (4.07 | ) | | | (3.98 | ) | | | - | | | | (1.37 | ) |
Year Ended September 30, 2007 | | | 15.22 | | | | 0.02 | | | | 2.46 | | | | 2.48 | | | | - | | | | (1.11 | ) |
Class C | | | | | | | | | | | | | | | | | | | | | | | | |
Year Ended September 30, 2011 | | | 8.36 | | | | (0.05 | ) | | | (0.14 | ) | | | (0.19 | ) | | | - | | | | - | |
Year Ended September 30, 2010 | | | 8.37 | | | | (0.04 | ) | | | 0.11 | | | | 0.07 | | | | (0.08 | ) | | | - | |
Year Ended September 30, 2009 | | | 10.46 | | | | 0.03 | | | | (2.12 | ) | | | (2.09 | ) | | | - | | | | - | |
Year Ended September 30, 2008 | | | 15.66 | | | | (0.01 | ) | | | (3.82 | ) | | | (3.83 | ) | | | - | | | | (1.37 | ) |
Year Ended September 30, 2007 | | | 14.52 | | | | (0.10 | ) | | | 2.35 | | | | 2.25 | | | | - | | | | (1.11 | ) |
Class Z | | | | | | | | | | | | | | | | | | | | | | | | |
Year Ended September 30, 2011 | | | 9.04 | | | | (0.07 | ) | | | (0.15 | ) | | | (0.22 | ) | | | - | | | | - | |
Year Ended September 30, 2010 | | | 9.07 | | | | (0.01 | ) | | | 0.11 | | | | 0.10 | | | | (0.13 | ) | | | - | |
Year Ended September 30, 2009 | | | 11.24 | | | | 0.10 | | | | (2.27 | ) | | | (2.17 | ) | | | - | | | | - | |
Year Ended September 30, 2008 | | | 16.62 | | | | 0.09 | | | | (4.10 | ) | | | (4.01 | ) | | | - | | | | (1.37 | ) |
Year Ended September 30, 2007 | | | 15.23 | | | | 0.03 | | | | 2.47 | | | | 2.50 | | | | - | | | | (1.11 | ) |
Class A | | | | | | | | | | | | | | | | | | | | | | | | |
Year Ended September 30, 2011 | | | 8.67 | | | | (0.07 | ) | | | (0.14 | ) | | | (0.21 | ) | | | - | | | | - | |
Year Ended September 30, 2010 | | | 8.73 | | | | (0.08 | ) | | | 0.10 | | | | 0.02 | | | | (0.08 | ) | | | - | |
Year Ended September 30, 2009 | | | 10.92 | | | | 0.01 | | | | (2.20 | ) | | | (2.19 | ) | | | - | | | | - | |
Year Ended September 30, 2008 | | | 16.32 | | | | (0.01 | ) | | | (4.02 | ) | | | (4.03 | ) | | | - | | | | (1.37 | ) |
Year Ended September 30, 2007 | | | 15.09 | | | | (0.06 | ) | | | 2.40 | | | | 2.34 | | | | - | | | | (1.11 | ) |
| | | | | | | | | | | | | | | | | | | | | | | | | | | | | | | | | | |
| distributions | | | | | | | | | | | | Ratio of expenses
to average net assets | | | Ratio of net investment
income/(loss)
to average net assets | | | | |
Total
dividends
and
distributions | | | Net asset
value, end
of period | | | Total
return* | | | Net assets,
end of
period (in
thousands) | | | Before
expense
limitation
and transfer
agent
earnings
credit | | | After
expense
limitation
and transfer
agent
earnings
credit | | | Before
expense
limitation
and transfer
agent
earnings
credit | | | After
expense
limitation
and transfer
agent
earnings
credit | | | Portfolio
turnover
rate(a) | |
| | | | | | | | | | | | | | | | | | | | | | | | | | | | | | | | | | |
| | | | | | | | | | | | | | | | | | | | | | | | | | | | | | | | | | |
| $ | (0.02 | ) | | $ | 8.94 | | | | (1.33 | )% | | $ | 47,092 | | | | 1.35 | % | | | 1.35 | % | | | 0.44 | % | | | 0.44 | % | | | 57.93 | % |
| | (0.16 | ) | | | 9.08 | | | | 1.70 | % | | | 73,969 | | | | 1.35 | % | | | 1.35 | % | | | 0.45 | % | | | 0.45 | % | | | 123.12 | % |
| | - | | | | 9.08 | | | | (19.22 | )% | | | 62,963 | | | | 1.37 | % | | | 1.37 | % | | | 1.23 | % | | | 1.23 | % | | | 208.48 | % |
| | (1.37 | ) | | | 11.24 | | | | (25.99 | )% | | | 76,606 | | | | 1.27 | % | | | 1.27 | % | | | 0.67 | % | | | 0.67 | % | | | 173.81 | % |
| | (1.11 | ) | | | 16.59 | | | | 17.05 | % | | | 88,246 | | | | 1.24 | % | | | 1.23 | % | | | 0.12 | % | | | 0.13 | % | | | 116.81 | % |
| | | | | | | | | | | | | | | | | | | | | | | | | | | | | | | | | | |
| | - | | | | 8.17 | | | | (2.27 | )% | | | 17,884 | | | | 2.27 | % | | | 2.27 | % | | | (0.50 | )% | | | (0.50 | )% | | | 57.93 | % |
| | (0.08 | ) | | | 8.36 | | | | 0.84 | % | | | 24,573 | | | | 2.25 | % | | | 2.25 | % | | | (0.45 | )% | | | (0.45 | )% | | | 123.12 | % |
| | - | | | | 8.37 | | | | (19.98 | )% | | | 33,089 | | | | 2.25 | % | | | 2.25 | % | | | 0.44 | % | | | 0.44 | % | | | 208.48 | % |
| | (1.37 | ) | | | 10.46 | | | | (26.61 | )% | | | 55,364 | | | | 2.05 | % | | | 2.05 | % | | | (0.09 | )% | | | (0.09 | )% | | | 173.81 | % |
| | (1.11 | ) | | | 15.66 | | | | 16.25 | % | | | 92,350 | | | | 2.02 | % | | | 2.02 | % | | | (0.68 | )% | | | (0.67 | )% | | | 116.81 | % |
| | | | | | | | | | | | | | | | | | | | | | | | | | | | | | | | | | |
| | - | | | | 8.82 | | | | (2.43 | )% | | | 133 | | | | 2.52 | % | | | 2.52 | % | | | (0.72 | )% | | | (0.72 | )% | | | 57.93 | % |
| | (0.13 | ) | | | 9.04 | | | | 1.10 | % | | | 406 | | | | 1.90 | % | | | 1.90 | % | | | (0.06 | )% | | | (0.06 | )% | | | 123.12 | % |
| | - | | | | 9.07 | | | | (19.31 | )% | | | 887 | | | | 1.45 | % | | | 1.45 | % | | | 1.27 | % | | | 1.27 | % | | | 208.48 | % |
| | (1.37 | ) | | | 11.24 | | | | (26.11 | )% | | | 1,222 | | | | 1.34 | % | | | 1.34 | % | | | 0.65 | % | | | 0.65 | % | | | 173.81 | % |
| | (1.11 | ) | | | 16.62 | | | | 17.18 | % | | | 1,320 | | | | 1.18 | % | | | 1.18 | % | | | 0.17 | % | | | 0.17 | % | | | 116.81 | % |
| | | | | | | | | | | | | | | | | | | | | | | | | | | | | | | | | | |
| | - | | | | 8.46 | | | | (2.42 | )% | | | 1,245 | | | | 2.52 | % | | | 2.52 | % | | | (0.75 | )% | | | (0.75 | )% | | | 57.93 | % |
| | (0.08 | ) | | | 8.67 | | | | 0.22 | % | | | 1,362 | | | | 2.68 | % | | | 2.68 | % | | | (0.88 | )% | | | (0.88 | )% | | | 123.12 | % |
| | - | | | | 8.73 | | | | (20.05 | )% | | | 1,969 | | | | 2.43 | % | | | 2.43 | % | | | 0.11 | % | | | 0.11 | % | | | 208.48 | % |
| | (1.37 | ) | | | 10.92 | | | | (26.76 | )% | | | 1,878 | | | | 2.09 | % | | | 2.09 | % | | | (0.08 | )% | | | (0.08 | )% | | | 173.81 | % |
| | (1.11 | ) | | | 16.32 | | | | 16.25 | % | | | 1,390 | | | | 1.66 | % | | | 1.65 | % | | | (0.42 | )% | | | (0.41 | )% | | | 116.81 | % |
FINANCIAL HIGHLIGHTS (CONTINUED)
| | | | | | | | | | | | | | | | | | | | | | | | |
| | | | | |
Income/(loss) from investment operations | | | Less dividends and | |
| | | Net asset
value,
beginning
of period | | | Net
investment
income/
(loss)(x) | | | Net realized
and unrealized
gains/(losses)
on investments | | | Total from
investment
operations | | | Dividends
from net
investment
income | | | Distributions
from net
realized
gains | |
ICON Equity Income Fund | | | | | | | | | | | | | | | | | | | | | | | | |
Class I | | | | | | | | | | | | | | | | | | | | | | | | |
Year Ended September 30, 2011 | | $ | 11.00 | | | $ | 0.45 | | | $ | (0.71 | ) | | $ | (0.26 | ) | | $ | (0.47 | ) | | $ | - | |
Year Ended September 30, 2010 | | | 10.28 | | | | 0.45 | | | | 0.66 | | | | 1.11 | | | | (0.39 | ) | | | - | |
Year Ended September 30, 2009 | | | 11.87 | | | | 0.40 | | | | (1.59 | ) | | | (1.19 | ) | | | (0.40 | ) | | | - | |
Year Ended September 30, 2008 | | | 16.48 | | | | 0.34 | | | | (3.00 | ) | | | (2.66 | ) | | | (0.31 | ) | | | (1.64 | ) |
Year Ended September 30, 2007 | | | 14.94 | | | | 0.29 | | | | 2.26 | | | | 2.55 | | | | (0.34 | ) | | | (0.67 | ) |
Class C | | | | | | | | | | | | | | | | | | | | | | | | |
Year Ended September 30, 2011 | | | 10.85 | | | | 0.37 | | | | (0.72 | ) | | | (0.35 | ) | | | (0.34 | ) | | | - | |
Year Ended September 30, 2010 | | | 10.16 | | | | 0.36 | | | | 0.64 | | | | 1.00 | | | | (0.31 | ) | | | - | |
Year Ended September 30, 2009 | | | 11.73 | | | | 0.32 | | | | (1.56 | ) | | | (1.24 | ) | | | (0.33 | ) | | | - | |
Year Ended September 30, 2008 | | | 16.33 | | | | 0.21 | | | | (2.97 | ) | | | (2.76 | ) | | | (0.20 | ) | | | (1.64 | ) |
Year Ended September 30, 2007 | | | 14.85 | | | | 0.14 | | | | 2.23 | | | | 2.37 | | | | (0.22 | ) | | | (0.67 | ) |
Class Z | | | | | | | | | | | | | | | | | | | | | | | | |
Year Ended September 30, 2011 | | | 10.96 | | | | 0.50 | | | | (0.71 | ) | | | (0.21 | ) | | | (0.54 | ) | | | - | |
Year Ended September 30, 2010 | | | 10.26 | | | | 0.47 | | | | 0.64 | | | | 1.11 | | | | (0.41 | ) | | | - | |
Year Ended September 30, 2009 | | | 11.84 | | | | 0.41 | | | | (1.57 | ) | | | (1.16 | ) | | | (0.42 | ) | | | - | |
Year Ended September 30, 2008 | | | 16.46 | | | | 0.38 | | | | (3.04 | ) | | | (2.66 | ) | | | (0.32 | ) | | | (1.64 | ) |
Year Ended September 30, 2007 | | | 14.94 | | | | 0.30 | | | | 2.26 | | | | 2.56 | | | | (0.37 | ) | | | (0.67 | ) |
Class A | | | | | | | | | | | | | | | | | | | | | | | | |
Year Ended September 30, 2011 | | | 10.90 | | | | 0.47 | | | | (0.71 | ) | | | (0.24 | ) | | | (0.51 | ) | | | - | |
Year Ended September 30, 2010 | | | 10.21 | | | | 0.46 | | | | 0.63 | | | | 1.09 | | | | (0.40 | ) | | | - | |
Year Ended September 30, 2009 | | | 11.80 | | | | 0.38 | | | | (1.57 | ) | | | (1.19 | ) | | | (0.40 | ) | | | - | |
Year Ended September 30, 2008 | | | 16.40 | | | | 0.31 | | | | (2.99 | ) | | | (2.68 | ) | | | (0.28 | ) | | | (1.64 | ) |
Year Ended September 30, 2007 | | | 14.92 | | | | 0.27 | | | | 2.22 | | | | 2.49 | | | | (0.34 | ) | | | (0.67 | ) |
| | | | | | | | | | | | | | | | | | | | | | | | | | | | | | | | | | |
| distributions | | | | | | | | | | | | Ratio of expenses
to average net assets | | | Ratio of net investment
income/(loss)
to average net assets | | | | |
Total
dividends
and
distributions | | | Net asset
value, end
of period | | | Total
return* | | | Net assets,
end of
period (in
thousands) | | | Before
expense
limitation
and transfer
agent
earnings
credit | | | After
expense
limitation
and transfer
agent
earnings
credit(b) | | | Before
expense
limitation
and transfer
agent
earnings
credit | | | After
expense
limitation
and transfer
agent
earnings
credit | | | Portfolio
turnover
rate(a) | |
$ | (0.47 | ) | | $ | 10.27 | | | | (2.73 | )% | | $ | 25,775 | | | | 1.47 | % | | | 1.45 | % | | | 3.82 | % | | | 3.84 | % | | | 142.75 | % |
| | (0.39 | ) | | | 11.00 | | | | 10.93 | % | | | 37,731 | | | | 1.53 | % | | | 1.45 | % | | | 4.12 | % | | | 4.20 | % | | | 123.33 | % |
| | (0.40 | ) | | | 10.28 | | | | (9.48 | )% | | | 41,623 | | | | 1.40 | % | | | 1.40 | % | | | 4.58 | % | | | 4.58 | % | | | 148.56 | % |
| | (1.95 | ) | | | 11.87 | | | | (17.76 | )% | | | 98,501 | | | | 1.23 | %(d) | | | 1.23 | % | | | 2.48 | % | | | 2.48 | % | | | 132.93 | % |
| | (1.01 | ) | | | 16.48 | | | | 17.67 | % | | | 124,668 | | | | 1.23 | %(e) | | | 1.22 | % | | | 1.86 | % | | | 1.86 | % | | | 121.30 | % |
| | | | | | | | | | | | | | | | | | | | | | | | | | | | | | | | | | |
| | (0.34 | ) | | | 10.16 | | | | (3.47 | )% | | | 3,874 | | | | 2.53 | % | | | 2.20 | % | | | 2.85 | % | | | 3.18 | % | | | 142.75 | % |
| | (0.31 | ) | | | 10.85 | | | | 9.99 | % | | | 3,569 | | | | 2.97 | % | | | 2.20 | % | | | 2.68 | % | | | 3.46 | % | | | 123.33 | % |
| | (0.33 | ) | | | 10.16 | | | | (10.12 | )% | | | 3,348 | | | | 2.69 | % | | | 2.21 | % | | | 3.21 | % | | | 3.69 | % | | | 148.56 | % |
| | (1.84 | ) | | | 11.73 | | | | (18.60 | )% | | | 4,461 | | | | 2.34 | %(d) | | | 2.20 | % | | | 1.40 | % | | | 1.54 | % | | | 132.93 | % |
| | (0.89 | ) | | | 16.33 | | | | 16.45 | % | | | 5,331 | | | | 2.33 | %(e) | | | 2.21 | % | | | 0.75 | % | | | 0.87 | % | | | 121.30 | % |
| | | | | | | | | | | | | | | | | | | | | | | | | | | | | | | | | | |
| | (0.54 | ) | | | 10.21 | | | | (2.40 | )% | | | 142 | | | | 3.99 | % | | | 1.20 | % | | | 1.45 | % | | | 4.24 | % | | | 142.75 | % |
| | (0.41 | ) | | | 10.96 | | | | 11.04 | % | | | 88 | | | | 7.66 | % | | | 1.20 | % | | | (2.01 | )% | | | 4.45 | % | | | 123.33 | % |
| | (0.42 | ) | | | 10.26 | | | | (9.20 | )% | | | 66 | | | | 8.73 | % | | | 1.21 | % | | | (2.83 | )% | | | 4.69 | % | | | 148.56 | % |
| | (1.96 | ) | | | 11.84 | | | | (17.81 | )% | | | 81 | | | | 11.18 | %(d) | | | 1.20 | % | | | (7.14 | )% | | | 2.84 | % | | | 132.93 | % |
| | (1.04 | ) | | | 16.46 | | | | 17.74 | % | | | 40 | | | | 11.08 | %(e) | | | 1.21 | % | | | (7.96 | )% | | | 1.92 | % | | | 121.30 | % |
| | | | | | | | | | | | | | | | | | | | | | | | | | | | | | | | | | |
| | (0.51 | ) | | | 10.15 | | | | (2.66 | )% | | | 2,871 | | | | 1.91 | % | | | 1.45 | % | | | 3.55 | % | | | 4.01 | % | | | 142.75 | % |
| | (0.40 | ) | | | 10.90 | | | | 10.84 | % | | | 1,521 | | | | 4.59 | % | | | 1.45 | % | | | 1.19 | % | | | 4.32 | % | | | 123.33 | % |
| | (0.40 | ) | | | 10.21 | | | | (9.53 | )% | | | 237 | | | | 5.68 | % | | | 1.46 | % | | | 0.26 | % | | | 4.48 | % | | | 148.56 | % |
| | (1.92 | ) | | | 11.80 | | | | (17.98 | )% | | | 281 | | | | 5.40 | %(d) | | | 1.44 | % | | | (1.67 | )% | | | 2.29 | % | | | 132.93 | % |
| | (1.01 | ) | | | 16.40 | | | | 17.29 | % | | | 322 | | | | 3.77 | %(e) | | | 1.45 | % | | | (0.60 | )% | | | 1.73 | % | | | 121.30 | % |
FINANCIAL HIGHLIGHTS (CONTINUED)
| | | | | | | | | | | | | | | | | | | | | | | | |
| | | | | | Income/(loss) from investment operations | | | Less dividends and | |
| | | Net asset
value,
beginning
of period | | | Net
investment
income/
(loss)(x) | | | Net realized
and unrealized
gains/(losses)
on investments | | | Total from
investment
operations | | | Dividends
from net
investment
income | | | Distributions
from net
realized
gains | |
ICON Long/Short Fund(c) | | | | | | | | | | | | | | | | | | | | | | | | |
Class I | | | | | | | | | | | | | | | | | | | | | | | | |
Year Ended September 30, 2011 | | $ | 11.85 | | | $ | (0.02 | ) | | $ | (0.31 | ) | | $ | (0.33 | ) | | $ | - | | | $ | - | |
Year Ended September 30, 2010 | | | 11.73 | | | | - | | | | 0.28 | | | | 0.28 | | | | (0.16 | ) | | | - | |
Year Ended September 30, 2009 | | | 13.76 | | | | 0.16 | | | | (1.91 | ) | | | (1.75 | ) | | | (0.28 | ) | | | - | |
Year Ended September 30, 2008 | | | 19.26 | | | | 0.13 | | | | (4.86 | ) | | | (4.73 | ) | | | (0.03 | ) | | | (0.74 | ) |
Year Ended September 30, 2007 | | | 17.19 | | | | 0.07 | | | | 2.47 | | | | 2.54 | | | | (0.04 | ) | | | (0.43 | ) |
Class C | | | | | | | | | | | | | | | | | | | | | | | | |
Year Ended September 30, 2011 | | | 11.29 | | | | (0.11 | ) | | | (0.29 | ) | | | (0.40 | ) | | | - | | | | - | |
Year Ended September 30, 2010 | | | 11.19 | | | | (0.08 | ) | | | 0.27 | | | | 0.19 | | | | (0.09 | ) | | | - | |
Year Ended September 30, 2009 | | | 13.13 | | | | 0.06 | | | | (1.81 | ) | | | (1.75 | ) | | | (0.19 | ) | | | - | |
Year Ended September 30, 2008 | | | 18.54 | | | | - | | | | (4.67 | ) | | | (4.67 | ) | | | - | | | | (0.74 | ) |
Year Ended September 30, 2007 | | | 16.67 | | | | (0.08 | ) | | | 2.38 | | | | 2.30 | | | | - | | | | (0.43 | ) |
Class Z | | | | | | | | | | | | | | | | | | | | | | | | |
Year Ended September 30, 2011 | | | 11.90 | | | | 0.02 | | | | (0.31 | ) | | | (0.29 | ) | | | - | | | | - | |
Year Ended September 30, 2010 | | | 11.80 | | | | 0.03 | | | | 0.29 | | | | 0.32 | | | | (0.22 | ) | | | - | |
Year Ended September 30, 2009 | | | 13.81 | | | | 0.17 | | | | (1.89 | ) | | | (1.72 | ) | | | (0.29 | ) | | | - | |
Year Ended September 30, 2008 | | | 19.30 | | | | 0.18 | | | | (4.93 | ) | | | (4.75 | ) | | | - | | | | (0.74 | ) |
Year Ended September 30, 2007 | | | 17.29 | | | | 0.10 | | | | 2.41 | | | | 2.51 | | | | (0.07 | ) | | | (0.43 | ) |
Class A | | | | | | | | | | | | | | | | | | | | | | | | |
Year Ended September 30, 2011 | | | 11.77 | | | | (0.02 | ) | | | (0.31 | ) | | | (0.33 | ) | | | - | | | | - | |
Year Ended September 30, 2010 | | | 11.67 | | | | - | | | | 0.28 | | | | 0.28 | | | | (0.18 | ) | | | - | |
Year Ended September 30, 2009 | | | 13.69 | | | | 0.14 | | | | (1.88 | ) | | | (1.74 | ) | | | (0.28 | ) | | | - | |
Year Ended September 30, 2008 | | | 19.20 | | | | 0.10 | | | | (4.85 | ) | | | (4.75 | ) | | | (0.02 | ) | | | (0.74 | ) |
Year Ended September 30, 2007 | | | 17.18 | | | | 0.05 | | | | 2.46 | | | | 2.51 | | | | (0.06 | ) | | | (0.43 | ) |
| | | | | | | | | | | | | | | | | | | | | | | | | | | | | | | | | | |
| distributions | | | | | | | | | | | | Ratio of expenses
to average net assets | | | Ratio of net investment
income/(loss)
to average net assets | | | | |
Total
dividends
and
distributions | | | Net asset
value, end
of period | | | Total
return* | | | Net assets,
end of
period (in
thousands) | | | Before
expense
limitation
and transfer
agent
earnings
credit | | | After
expense
limitation
and transfer
agent
earnings
credit(b) | | | Before
expense
limitation
and transfer
agent
earnings
credit | | | After
expense
limitation
and transfer
agent
earnings
credit | | | Portfolio
turnover
rate(a) | |
$ | - | | | $ | 11.52 | | | | (2.78 | )% | | $ | 7,423 | | | | 2.32 | % | | | 1.94 | % | | | (0.56 | )% | | | (0.18 | )% | | | 67.28 | % |
| | (0.16 | ) | | | 11.85 | | | | 2.32 | % | | | 11,306 | | | | 2.90 | % | | | 2.45 | % | | | (0.44 | )% | | | 0.01 | % | | | 136.50 | % |
| | (0.28 | ) | | | 11.73 | | | | (12.40 | )% | | | 15,209 | | | | 2.03 | % | | | 1.97 | % | | | 1.44 | % | | | 1.50 | % | | | 131.79 | % |
| | (0.77 | ) | | | 13.76 | | | | (25.43 | )% | | | 93,243 | | | | 1.47 | % | | | 1.47 | % | | | 0.78 | % | | | 0.78 | % | | | 174.59 | % |
| | (0.47 | ) | | | 19.26 | | | | 15.05 | % | | | 238,943 | | | | 1.46 | % | | | 1.46 | % | | | 0.39 | % | | | 0.39 | % | | | 105.00 | % |
| - | | | | 10.89 | | | | (3.54 | )% | | | 5,546 | | | | 3.14 | % | | | 2.70 | % | | | (1.38 | )% | | | (0.94 | )% | | | 67.28 | % |
| | (0.09 | ) | | | 11.29 | | | | 1.65 | % | | | 9,547 | | | | 3.60 | % | | | 3.19 | % | | | (1.14 | )% | | | (0.73 | )% | | | 136.50 | % |
| | (0.19 | ) | | | 11.19 | | | | (13.10 | )% | | | 15,093 | | | | 2.95 | % | | | 2.81 | % | | | 0.44 | % | | | 0.58 | % | | | 131.79 | % |
| | (0.74 | ) | | | 13.13 | | | | (26.09 | )% | | | 27,148 | | | | 2.31 | % | | | 2.31 | % | | | (0.01 | )% | | | (0.01 | )% | | | 174.59 | % |
| | (0.43 | ) | | | 18.54 | | | | 14.05 | % | | | 43,986 | | | | 2.33 | % | | | 2.32 | % | | | (0.48 | )% | | | (0.47 | )% | | | 105.00 | % |
| - | | | | 11.61 | | | | (2.44 | )% | | | 42 | | | | 7.76 | % | | | 1.65 | % | | | (5.96 | )% | | | 0.15 | % | | | 67.28 | % |
| | (0.22 | ) | | | 11.90 | | | | 2.63 | % | | | 132 | | | | 5.80 | % | | | 2.15 | % | | | (3.39 | )% | | | 0.25 | % | | | 136.50 | % |
| | (0.29 | ) | | | 11.80 | | | | (12.10 | )% | | | 128 | | | | 4.40 | % | | | 1.73 | % | | | (1.12 | )% | | | 1.55 | % | | | 131.79 | % |
| | (0.74 | ) | | | 13.81 | | | | (25.45 | )% | | | 540 | | | | 2.37 | % | | | 1.44 | % | | | 0.16 | % | | | 1.09 | % | | | 174.59 | % |
| | (0.50 | ) | | | 19.30 | | | | 14.81 | % | | | 447 | | | | 1.25 | % | | | 1.25 | % | | | 0.55 | % | | | 0.55 | % | | | 105.00 | % |
| - | | | | 11.44 | | | | (2.80 | )% | | | 1,213 | | | | 3.23 | % | | | 1.91 | % | | | (1.46 | )% | | | (0.14 | )% | | | 67.28 | % |
| | (0.18 | ) | | | 11.77 | | | | 2.34 | % | | | 1,855 | | | | 3.65 | % | | | 2.45 | % | | | (1.21 | )% | | | (0.01 | )% | | | 136.50 | % |
| | (0.28 | ) | | | 11.67 | | | | (12.39 | )% | | | 2,390 | | | | 2.64 | % | | | 2.06 | % | | | 0.76 | % | | | 1.34 | % | | | 131.79 | % |
| | (0.76 | ) | | | 13.69 | | | | (25.61 | )% | | | 4,859 | | | | 1.72 | % | | | 1.72 | % | | | 0.63 | % | | | 0.63 | % | | | 174.59 | % |
| | (0.49 | ) | | | 19.20 | | | | 14.94 | % | | | 6,481 | | | | 1.68 | % | | | 1.67 | % | | | 0.27 | % | | | 0.26 | % | | | 105.00 | % |
FINANCIAL HIGHLIGHTS (CONTINUED)
| | | | | | | | | | | | | | | | | | | | | | | | |
| | | | | | Income/(loss) from investment operations | | | Less dividends and | |
| | | Net asset
value,
beginning
of period | | | Net
investment
income/
(loss)(x) | | | Net realized
and unrealized
gains/(losses)
on investments | | | Total from
investment
operations | | | Dividends
from net
investment
income | | | Distributions
from net
realized
gains | |
ICON Risk-Managed Equity Fund | | | | | | | | | | | | | | | | | | | | | | | | |
Class I | | | | | | | | | | | | | | | | | | | | | | | | |
Year Ended September 30, 2011 | | $ | 10.76 | | | $ | 0.09 | | | $ | (0.05 | ) | | $ | 0.04 | | | $ | (0.11 | ) | | $ | - | |
Year Ended September 30, 2010 | | | 10.43 | | | | 0.06 | | | | 0.31 | | | | 0.37 | | | | (0.04 | ) | | | - | |
Year Ended September 30, 2009 | | | 11.28 | | | | 0.15 | | | | (0.85 | ) | | | (0.70 | ) | | | (0.15 | ) | | | - | |
Year Ended September 30, 2008 | | | 13.18 | | | | 0.12 | | | | (1.39 | ) | | | (1.27 | ) | | | (0.10 | ) | | | (0.53 | ) |
Year Ended September 30, 2007 | | | 13.80 | | | | (0.02 | ) | | | 1.64 | | | | 1.62 | | | | (0.01 | ) | | | (2.23 | ) |
Class C | | | | | | | | | | | | | | | | | | | | | | | | |
Year Ended September 30, 2011 | | | 10.15 | | | | 0.01 | | | | (0.05 | ) | | | (0.04 | ) | | | (0.02 | ) | | | - | |
Year Ended September 30, 2010 | | | 9.88 | | | | (0.02 | ) | | | 0.29 | | | | 0.27 | | | | - | | | | - | |
Year Ended September 30, 2009 | | | 10.72 | | | | 0.05 | | | | (0.79 | ) | | | (0.74 | ) | | | (0.10 | ) | | | - | |
Year Ended September 30, 2008 | | | 12.61 | | | | 0.01 | | | | (1.32 | ) | | | (1.31 | ) | | | (0.05 | ) | | | (0.53 | ) |
Year Ended September 30, 2007 | | | 13.39 | | | | (0.11 | ) | | | 1.56 | | | | 1.45 | | | | - | | | | (2.23 | ) |
Class Z | | | | | | | | | | | | | | | | | | | | | | | | |
Year Ended September 30, 2011 | | | 10.96 | | | | 0.12 | | | | (0.05 | ) | | | 0.07 | | | | (0.15 | ) | | | - | |
Year Ended September 30, 2010 | | | 10.61 | | | | 0.08 | | | | 0.33 | | | | 0.41 | | | | (0.06 | ) | | | - | |
Year Ended September 30, 2009 | | | 11.46 | | | | 0.22 | | | | (0.91 | ) | | | (0.69 | ) | | | (0.16 | ) | | | - | |
Year Ended September 30, 2008 | | | 13.37 | | | | 0.15 | | | | (1.43 | ) | | | (1.28 | ) | | | (0.10 | ) | | | (0.53 | ) |
Year Ended September 30, 2007 | | | 13.94 | | | | 0.01 | | | | 1.65 | | | | 1.66 | | | | - | | | | (2.23 | ) |
Class A | | | | | | | | | | | | | | | | | | | | | | | | |
Year Ended September 30, 2011 | | | 10.72 | | | | 0.09 | | | | (0.05 | ) | | | 0.04 | | | | (0.10 | ) | | | - | |
Year Ended September 30, 2010 | | | 10.39 | | | | 0.05 | | | | 0.33 | | | | 0.38 | | | | (0.05 | ) | | | - | |
Year Ended September 30, 2009 | | | 11.25 | | | | 0.09 | | | | (0.80 | ) | | | (0.71 | ) | | | (0.15 | ) | | | - | |
Year Ended September 30, 2008 | | | 13.15 | | | | 0.10 | | | | (1.38 | ) | | | (1.28 | ) | | | (0.09 | ) | | | (0.53 | ) |
Year Ended September 30, 2007 | | | 13.80 | | | | (0.03 | ) | | | 1.65 | | | | 1.62 | | | | (0.04 | ) | | | (2.23 | ) |
| (x) | Calculated using the average shares method. | |
| * | The total return calculation is for the period indicated and excludes any sales charges. | |
| (a) | Portfolio turnover is calculated at the Fund level. | |
| (b) | The Fund’s operating expenses, not including interest expense, are contractually limited to the amounts discussed in Note 3. The ratios in these financial highlights reflect the limitation, including the interest expense. | |
| (c) | The Fund’s operating expenses, not including dividends on short positions, are contractually limited to 1.55% for Class I, 2.30% for Class C, 1.25% for Class Z and 1.55% for Class A. The ratios in these financial highlights reflect the limitation, including the dividends on short positions. | |
| (d) | The ratio of expenses to average net assets before expense limitation and transfer agent earnings credit including expenses that were paid on behalf of the Fund by a third party related to a tax matter were 1.43%, 2.54%, 11.38% and 5.60% for Class I, C, Z and A, respectively. | |
| (e) | The ratio of expenses to average net assets before expense limitation and transfer agent earnings credit including a potential Internal Revenue Code section 860 deficiency dividend expense were 1.81%, 2.91%, 11.66% and 4.35% for Class I, C, Z and A, respectively. | |
The accompanying notes are an integral part of the financial statements.
| | | | | | | | | | | | | | | | | | | | | | | | | | | | | | | | | | |
| distributions | | | | | | | | | | | | Ratio of expenses
to average net assets | | | Ratio of net investment
income/(loss)
to average net assets | | | | |
Total
dividends
and
distributions | | | Net asset
value, end
of period | | | Total
return* | | | Net assets,
end of
period (in
thousands) | | | Before
expense
limitation
and transfer
agent
earnings
credit | | | After
expense
limitation
and transfer
agent
earnings
credit(b) | | | Before
expense
limitation
and transfer
agent
earnings
credit | | | After
expense
limitation
and transfer
agent
earnings
credit | | | Portfolio
turnover
rate(a) | |
$ | (0.11 | ) | | $ | 10.69 | | | | 0.31 | % | | $ | 15,997 | | | | 1.78 | % | | | 1.49 | % | | | 0.51 | % | | | 0.80 | % | | | 67.61 | % |
| | (0.04 | ) | | | 10.76 | | | | 3.56 | % | | | 18,768 | | | | 1.82 | % | | | 1.56 | % | | | 0.26 | % | | | 0.52 | % | | | 114.34 | % |
| | (0.15 | ) | | | 10.43 | | | | (5.98 | )% | | | 37,475 | | | | 1.44 | % | | | 1.44 | % | | | 1.62 | % | | | 1.62 | % | | | 194.31 | % |
| | (0.63 | ) | | | 11.28 | | | | (10.04 | )% | | | 82,599 | | | | 1.30 | % | | | 1.30 | % | | | 0.93 | % | | | 0.93 | % | | | 184.47 | % |
| | (2.24 | ) | | | 13.18 | | | | 12.51 | % | | | 77,195 | | | | 1.50 | % | | | 1.50 | % | | | (0.11 | )% | | | (0.11 | )% | | | 150.42 | % |
| | | | | | | | | | | | | | | | | | | | | | | | | | | | | | | | | | |
| | (0.02 | ) | | | 10.09 | | | | (0.45 | )% | | | 2,099 | | | | 2.95 | % | | | 2.23 | % | | | (0.66 | )% | | | 0.06 | % | | | 67.61 | % |
| | - | | | | 10.15 | | | | 2.73 | % | | | 2,609 | | | | 3.36 | % | | | 2.30 | % | | | (1.27 | )% | | | (0.21 | )% | | | 114.34 | % |
| | (0.10 | ) | | | 9.88 | | | | (6.69 | )% | | | 3,199 | | | | 2.72 | % | | | 2.24 | % | | | 0.06 | % | | | 0.54 | % | | | 194.31 | % |
| | (0.58 | ) | | | 10.72 | | | | (10.85 | )% | | | 4,207 | | | | 2.52 | % | | | 2.21 | % | | | (0.24 | )% | | | 0.07 | % | | | 184.47 | % |
| | (2.23 | ) | | | 12.61 | | | | 11.53 | % | | | 2,291 | | | | 2.76 | % | | | 2.25 | % | | | (1.34 | )% | | | (0.83 | )% | | | 150.42 | % |
| | | | | | | | | | | | | | | | | | | | | | | | | | | | | | | | | | |
| | (0.15 | ) | | | 10.88 | | | | 0.51 | % | | | 60 | | | | 7.22 | % | | | 1.23 | % | | | (4.94 | )% | | | 1.05 | % | | | 67.61 | % |
| | (0.06 | ) | | | 10.96 | | | | 3.90 | % | | | 62 | | | | 10.41 | % | | | 1.31 | % | | | (8.34 | )% | | | 0.75 | % | | | 114.34 | % |
| | (0.16 | ) | | | 10.61 | | | | (5.79 | )% | | | 72 | | | | 3.55 | % | | | 1.24 | % | | | (0.10 | )% | | | 2.21 | % | | | 194.31 | % |
| | (0.63 | ) | | | 11.46 | | | | (9.99 | )% | | | 422 | | | | 4.39 | % | | | 1.21 | % | | | (1.98 | )% | | | 1.20 | % | | | 184.47 | % |
| | (2.23 | ) | | | 13.37 | | | | 12.67 | % | | | 37 | | | | 17.99 | % | | | 1.25 | % | | | (16.64 | )% | | | 0.10 | % | | | 150.42 | % |
| | | | | | | | | | | | | | | | | | | | | | | | | | | | | | | | | | |
| | (0.10 | ) | | | 10.66 | | | | 0.32 | % | | | 1,982 | | | | 2.08 | % | | | 1.48 | % | | | 0.20 | % | | | 0.80 | % | | | 67.61 | % |
| | (0.05 | ) | | | 10.72 | | | | 3.69 | % | | | 4,020 | | | | 2.62 | % | | | 1.59 | % | | | (0.57 | )% | | | 0.46 | % | | | 114.34 | % |
| | (0.15 | ) | | | 10.39 | | | | (6.05 | )% | | | 1,501 | | | | 2.87 | % | | | 1.49 | % | | | (0.43 | )% | | | 0.95 | % | | | 194.31 | % |
| | (0.62 | ) | | | 11.25 | | | | (10.18 | )% | | | 863 | | | | 3.75 | % | | | 1.46 | % | | | (1.44 | )% | | | 0.85 | % | | | 184.47 | % |
| | (2.27 | ) | | | 13.15 | | | | 12.51 | % | | | 294 | | | | 7.12 | % | | | 1.49 | % | | | (5.85 | )% | | | (0.22 | )% | | | 150.42 | % |
NOTESTO FINANCIAL STATEMENTS
SEPTEMBER 30, 2011
1. Organization
The ICON Bond Fund (“Bond Fund”), ICON Core Equity Fund (“Core Equity Fund”), ICON Equity Income Fund (“Equity Income Fund”), ICON Long/Short Fund (“Long/Short Fund”) and ICON Risk-Managed Equity Fund (“Risk-Managed Equity Fund”) are series funds (individually a “Fund” and collectively, the “Funds”). The Funds are part of the ICON Funds (the “Trust”), a Massachusetts business trust registered under the Investment Company Act of 1940, as amended (the “1940 Act”) as an open-end investment management company. Each Fund has four classes of shares: Class I, Class C, Class Z and Class A. All classes have equal rights as to earnings, assets and voting privileges except that each Class may bear different distribution fees, registration costs, legal costs, mailing and printing costs and shareholder servicing costs and each Class has exclusive voting rights with respect to its distribution plan. There are currently twelve other active Funds within the Trust. Those Funds are covered by separate prospectuses and shareholder reports.
Each Fund is authorized to issue an unlimited number of no par shares. The investment objective of the Bond Fund is maximum total return. The investment objective of the Core Equity Fund is long-term capital appreciation with a secondary objective of capital preservation. The investment objective of the Equity Income Fund is modest capital appreciation and income. The investment objective of the Long/Short Fund is capital appreciation. The investment objective of the Risk-Managed Equity Fund is modest capital appreciation and to maximize realized gains.
The Funds may have elements of risk, including the risk of loss of principal. There is no assurance that the investment process will consistently lead to successful results. An investment concentrated in sectors and industries may involve greater risk and volatility than a more diversified investment. Investing in fixed income securities such as bonds involves interest rate risk. When interest rates rise, the value of fixed income securities generally decreases. Additionally, the Bond Fund may invest in medium-and lower-quality debt securities. High-yield bonds involve a greater risk of default and price volatility than U.S. government and other high-quality bonds. The Long/Short Fund engages in short selling; there are risks associated with selling short, including the risk that the Long/Short Fund may have to cover its short position at a higher price than the short sale, resulting in a loss. The Long/Short Fund’s loss on a short sale is potentially unlimited as a loss occurs when the value of a security sold short increases. The Risk-Managed
| | |
| 64 | | NOTESTO FINANCIAL STATEMENTS |
Equity Fund invests in call options; call options involve certain risks, such as limited gains and lack of liquidity of the underlying securities, and are not suitable for all investors. Investments in foreign securities and currency transactions may involve certain considerations and risks not typically associated with those of U.S. dollar-denominated transactions as a result of, among other factors, the possibility of lower government supervision and regulation of foreign securities markets and the possibility of political or economic instability. Financial statements of foreign companies are governed by different accounting, auditing, and financial standards than U.S. companies and may be less transparent and uniform than in the United States. Many corporate governance standards, which help ensure the integrity of public information in the United States, may not exist in some foreign countries. In general, there may be less governmental supervision of foreign stock exchanges and securities brokers and issuers. There are also risks associated with small- and mid-cap investing, including limited product lines, less liquidity and small market share.
The Core Equity Fund has a significant weighting in the Industrials sector and the Consumer Discretionary sector which may cause the Fund’s performance to be susceptible to the economic, business and/or other developments that may affect those sectors.
In the normal course of business, the Funds may enter into various agreements that provide for general indemnifications. Each Fund’s maximum exposure under these arrangements is unknown as any potential exposure involving future claims that may be made against each Fund is unknown. However, based on experience, the Funds expect the risk of loss to be minimal.
2. Significant Accounting Policies
The following is a summary of significant accounting policies consistently followed by the Funds in the preparation of their financial statements. The preparation of financial statements in conformity with accounting principles generally accepted in the United States of America requires management to make certain estimates and assumptions that affect the reported amounts of assets and liabilities, disclosure of contingent assets and liabilities at the date of the financial statements, and the reported amounts of income and expenses during the reporting period. Actual results may differ from these estimates.
| | | | |
| NOTESTO FINANCIAL STATEMENTS | | | 65 | |
NOTESTO FINANCIAL STATEMENTS (CONTINUED)
Investment Valuation
The Funds’ securities and other assets, excluding options on securities indexes, are valued as of the closing price at the close of regular trading on the New York Stock Exchange (the “NYSE”) (normally 4 p.m. Eastern Standard Time) each day the NYSE is open, except that securities traded primarily on the NASDAQ Stock Market (“NASDAQ”) are normally valued by the Funds at the NASDAQ Official Closing Price provided by NASDAQ each business day. Options on securities indexes are valued at the close of the Chicago Board Options Exchange (normally 4:15 p.m. Eastern Standard Time) on each day the New York Stock Exchange is open for trading.
The Funds use pricing services to obtain the market value of securities in their portfolios; if a pricing service is not able to provide a price, or the pricing service’s valuation quote is considered inaccurate or does not reflect the market value of the security, prices may be obtained through market quotations from independent broker/dealers. If market quotations from these sources are not readily available, the Funds’ securities or other assets are valued at fair value as determined in good faith by the Funds’ Board of Trustees (“Board”) or pursuant to procedures approved by the Board.
Lacking any sales that day, a security is valued at the current closing bid price (or yield equivalent thereof) or based on quotes obtained from dealers making a market for the security. Options are valued at their closing mid-price on the market with the most volume. Mid-price is the average of the closing bid and closing ask prices. Debt securities with a remaining maturity of greater than 60 days are valued in accordance with the evaluated bid price supplied by the pricing service. The evaluated bid price supplied by the pricing service is based upon a matrix valuation system which considers such factors as security prices, yields, maturities and ratings. Short-term debt securities with remaining maturities of 60 days or less are generally valued at amortized cost or original cost plus accrued interest, which approximates market value. Currency rates as of the close of the NYSE are used to convert foreign security values into U.S. dollars.
The Funds’ securities that traded in countries outside of the Western Hemisphere are fair valued daily by utilizing the quotations of an independent pricing service, unless the Board determines that use of another valuation methodology is appropriate. The purposes of daily fair valuation are to avoid stale prices and to take into account, among other things, any significant events occurring after the close of foreign markets. The pricing service uses statistical analyses and quantitative models to adjust local
| | |
| 66 | | NOTESTO FINANCIAL STATEMENTS |
market prices using factors such as subsequent movements and changes in the prices of indexes, securities and exchange rates in other markets to determine fair value as of the time a Fund calculates its net asset value (“NAV”). The valuation assigned to fair-value securities for purposes of calculating a Fund’s NAV may differ from the security’s most recent closing market price and from the prices used by other mutual funds to calculate their NAVs.
Investments in other open-end investment companies are valued at net asset value.
Various inputs are used to determine the value of the Funds’ investments. These inputs are summarized in the three broad levels listed below:
Level 1 — quoted prices in active markets for identical securities.
Level 2 — significant observable inputs other than Level 1 quoted prices (including, but not limited to, quoted prices for similar securities, interest rates, prepayment speeds, and credit risk).
Level 3 — significant unobservable inputs.
Observable inputs are those based on market data obtained from sources independent of the Funds, and unobservable inputs reflect the Funds’ own assumptions based on the best information available. The input levels are not necessarily an indication of the risk or liquidity associated with investments at that level. For example, non-U.S. equity securities actively traded in foreign markets generally are reflected in Level 2 despite the availability of closing prices, because the Funds evaluate and determine whether those closing prices reflect fair value at the close of the NYSE or require adjustment, as described above. The following table summarizes the Funds’ investments, based on the inputs used to determine their values on September 30, 2011:
| | | | | | | | | | | | |
| | | Level 1 | | | Level 2 | | | Total | |
| | | | | | | | | | | | |
ICON Bond Fund* | | | | | | | | | | | | |
Assets | | | | | | | | | | | | |
Corporate Bonds | | $ | - | | | $ | 77,504,158 | | | $ | 77,504,158 | |
U.S. Treasury Obligations | | | - | | | | 5,483,750 | | | | 5,483,750 | |
Foreign Corporate Bonds | | | - | | | | 7,490,574 | | | | 7,490,574 | |
Foreign Government Bond | | | - | | | | 553,750 | | | | 553,750 | |
Collateral for Securities on Loan | | | - | | | | 6,560,230 | | | | 6,560,230 | |
Short-Term Investments | | | - | | | | 4,326,005 | | | | 4,326,005 | |
| | | | | | | | | | | | |
Total | | $ | - | | | $ | 101,918,467 | | | $ | 101,918,467 | |
| | | | | | | | | | | | |
| | | | |
| NOTESTO FINANCIAL STATEMENTS | | | 67 | |
NOTESTO FINANCIAL STATEMENTS (CONTINUED)
| | | | | | | | | | | | |
| | | Level 1 | | | Level 2 | | | Total | |
| | | | | | | | | | | | |
ICON Core Equity Fund* | | | | | | | | | | | | |
Assets | | | | | | | | | | | | |
Common Stocks | | $ | 66,388,370 | | | $ | - | | | $ | 66,388,370 | |
Collateral for Securities on Loan | | | - | | | | 1,841,798 | | | | 1,841,798 | |
| | | | | | | | | | | | |
Total | | $ | 66,388,370 | | | $ | 1,841,798 | | | $ | 68,230,168 | |
| | | | | | | | | | | | |
ICON Equity Income Fund* | | | | | | | | | | | | |
Assets | | | | | | | | | | | | |
Common Stocks | | $ | 28,740,413 | | | $ | - | | | $ | 28,740,413 | |
Preferred Stocks | | | 1,023,492 | | | | - | | | | 1,023,492 | |
Corporate Bonds | | | - | | | | 2,032,349 | | | | 2,032,349 | |
Convertible Corporate Bonds | | | - | | | | 239,750 | | | | 239,750 | |
Convertible Preferred Stock | | | 231,800 | | | | - | | | | 231,800 | |
Call Options Purchased | | | 33,412 | | | | - | | | | 33,412 | |
Collateral for Securities on Loan | | | - | | | | 2,154,862 | | | | 2,154,862 | |
| | | | | | | | | | | | |
Total | | $ | 30,029,117 | | | $ | 4,426,961 | | | $ | 34,456,078 | |
| | | | | | | | | | | | |
ICON Long/Short Fund* | | | | | | | | | | | | |
Assets | | | | | | | | | | | | |
Common Stocks | | $ | 14,236,749 | | | $ | - | | | $ | 14,236,749 | |
Collateral for Securities on Loan | | | - | | | | 5,194 | | | | 5,194 | |
| | | | | | | | | | | | |
Total | | $ | 14,236,749 | | | $ | 5,194 | | | $ | 14,241,943 | |
| | | | | | | | | | | | |
Liabilities | | | | | | | | | | | | |
Securities Sold Short | | | | | | | | | | | | |
Common Stock | | $ | (388,242 | ) | | $ | - | | | $ | (388,242 | ) |
Exchange Traded Funds | | | (441,363 | ) | | | - | | | | (441,363 | ) |
| | | | | | | | | | | | |
Total | | $ | (829,605 | ) | | $ | - | | | $ | (829,605 | ) |
| | | | | | | | | | | | |
ICON Risk-Managed Equity Fund* | | | | | | | | | | | | |
Assets | | | | | | | | | | | | |
Common Stocks | | $ | 20,196,352 | | | $ | - | | | $ | 20,196,352 | |
Put Option Purchased | | | 216,225 | | | | - | | | | 216,225 | |
Short-Term Investments | | | - | | | | 305,123 | | | | 305,123 | |
| | | | | | | | | | | | |
Total | | $ | 20,412,577 | | | $ | 305,123 | | | $ | 20,717,700 | |
| | | | | | | | | | | | |
Liabilities | | | | | | | | | | | | |
Written Call Options | | $ | (186,750 | ) | | $ | - | | | $ | (186,750 | ) |
| | | | | | | | | | | | |
Total | | $ | (186,750 | ) | | $ | - | | | $ | (186,750 | ) |
| | | | | | | | | | | | |
| * | Please refer to the Schedule of Investments and the Sector/Industry Classification and Credit Diversification tables for additional security details. |
| | |
| 68 | | NOTESTO FINANCIAL STATEMENTS |
There were no Level 3 securities held in any of the Funds at September 30, 2011.
For the year ended September 30, 2011, there was no significant security transfer activity between Level 1 and Level 2.
Foreign Currency Translation
The accounting records of the Funds are maintained in U.S. dollars. Investment securities and other assets and liabilities denominated in a foreign currency are translated daily into U.S. dollars at the prevailing rates of exchange. Income and expenses are translated into U.S. dollars at the prevailing exchange rate on the respective dates of the transactions. Purchases and sales of securities are translated into U.S. dollars at the contractual currency exchange rates established at the time of each trade.
The Funds do not isolate that portion of the results of operations resulting from changes in foreign exchange rates on investments from the fluctuations arising from changes in market prices of securities held. Net unrealized appreciation or depreciation on investments and foreign currency translations arise from changes in the value of assets and liabilities, resulting from changes in the exchange rates and changes in market prices of securities held.
Options Transactions
The Funds’ use of derivatives for the year ended September 30, 2011 was limited to purchased and written options.
The Risk-Managed Equity Fund’s primary investment strategy involves the use of options. Each of the other Funds may also purchase and/or write (sell) call and put options on any security in which it may invest. The Funds utilize options to hedge against changes in market conditions or to provide market exposure while trying to reduce transaction costs.
Option contracts involve market risk and can be highly volatile. Should prices of securities or securities indexes move in an unexpected manner, the Funds may not achieve the desired benefits and may realize losses and thus be in a worse position than if such strategies had not been utilized.
When a Fund writes a put or call option, an amount equal to the premium received is included on the Statement of Assets and Liabilities as a liability. The amount of the liability is subsequently marked-to-market to reflect the
| | | | |
| NOTESTO FINANCIAL STATEMENTS | | | 69 | |
NOTESTO FINANCIAL STATEMENTS (CONTINUED)
current market value of the option. If an option expires on its stipulated expiration date or if the Fund enters into a closing purchase transaction, a gain or loss is realized. If a written call option on an individual security is exercised, a gain or loss is realized for the sale of the underlying security, and the proceeds from the sale are increased by the premium originally received. If a written call option on a securities index is exercised, a gain or loss is realized as determined by the premium originally received, the exercise price and the market value of the index. If a written put option on an individual security is exercised, the cost of the security acquired is decreased by the premium originally received. As a writer of an option, a Fund bears the market risk of an unfavorable change in the price of the individual security or securities index underlying the written option. Additionally, written call options may involve the risk of limited gains, lack of liquidity for the option and lack of liquidity for the security or securities index.
Each Fund may also purchase put and call options. When a Fund purchases a put or call option, an amount equal to the premium paid is included on the Fund’s Statement of Assets and Liabilities as an investment, and is subsequently marked-to-market to reflect the current market value of the option. If an option expires on the stipulated expiration date or if the Fund enters into a closing sale transaction, a gain or loss is realized. If the Fund exercises a call option on an individual security, the cost of the security acquired is increased by the premium paid for the call. If the Fund exercises a put option on an individual security, a gain or loss is realized from the sale of the underlying security, and the proceeds from such a sale are decreased by the premium originally paid. If the Fund exercises a put or a call option on a security index, a gain or loss is realized as determined by the premium originally paid, the exercise price and the market value of the index. Written and purchased options are non-income producing securities.
As of September 30, 2011, the Equity Income Fund engaged in purchased call option transactions and the Risk-Managed Equity Fund engaged in written call and purchased put options transactions. All open option contracts are included on each Fund’s Schedule of Investments.
The Risk-Managed Equity Fund’s written options are collateralized by cash and/or securities held in a segregated account at the Fund’s custodian. The securities pledged as collateral are included on the Schedule of Investments. Such collateral is restricted from the Fund’s use. The cash collateral held for the prime broker and/or borrowings from the prime broker are included on the Statement of Assets and Liabilities.
| | |
| 70 | | NOTESTO FINANCIAL STATEMENTS |
The number of options contracts written and the premiums received by the Risk-Managed Equity Fund during the year ended September 30, 2011, were as follows:
| | | | | | | | |
| | | Risk-Managed Equity Fund | |
| | | Number of
Contracts | | | Premiums
Received | |
Options outstanding, beginning of period | | | 130 | | | $ | 247,668 | |
Options written during period | | | 2,470 | | | | 6,221,851 | |
Options closed during period | | | (2,525 | ) | | | (6,218,781 | ) |
| | | | | | | | |
Options outstanding, end of period | | | 75 | | | $ | 250,738 | |
| | | | | | | | |
The following is a summary of how these derivatives are treated in the financial statements and their impact on the Funds:
Fair Values of Derivative Instruments as of September 30, 2011
| | | | | | | | | | | | |
| | | Asset Derivatives | | | Liability Derivatives | |
Derivatives not accounted for as
hedging instruments | | Statement of
Assets and
Liabilities
Location | | Fair Value | | | Statement of
Assets and
Liabilities
Location | | Fair Value | |
Purchased option contracts | | | | | | | | | | | | |
Equity risk | | | | | | | | | | | | |
ICON Equity Income Fund | | Investments, at value | | $ | 33,412 | | | Investments, at value | | $ | - | |
ICON Risk-Managed Equity Fund | | | | 216,225 | | | | | - | |
Written option contracts | | | | | | | | | | | | |
Equity risk | | | | | | | | | | | | |
ICON Risk-Managed Equity Fund | | Options written, at value | | $ | - | | | Options written, at value | | $ | 186,750 | |
Amount of Realized Gain or (Loss) on Derivatives Recognized in Operations
| | | | | | |
Derivatives not accounted for as hedging instruments | | Location of Gain/(Loss) on Derivatives
Recognized in Operations | | Amount | |
Purchased option contracts | | | | | | |
Equity risk | | | | | | |
ICON Equity Income Fund | | Net realized gain/(loss) from | | $ | (324,613 | ) |
ICON Risk-Managed Equity Fund | | investment transactions | | | (432,358 | ) |
Written option contracts | | | | | | |
Equity risk | | | | | | |
ICON Risk-Managed Equity Fund | | Net realized gain/(loss) from written option transactions | | $ | (327,694 | ) |
| | | | |
| NOTESTO FINANCIAL STATEMENTS | | | 71 | |
NOTESTO FINANCIAL STATEMENTS (CONTINUED)
Change in Unrealized Appreciation/(Depreciation) on Derivatives Recognized in Operations
| | | | | | |
Derivatives not accounted for as hedging instruments | | Location of Gain/(Loss) on Derivatives
Recognized in Operations | | Amount | |
Purchased option contracts | | | | | | |
Equity risk | | | | | | |
ICON Equity Income Fund | | Change in unrealized net | | $ | 173,495 | |
ICON Risk-Managed Equity Fund | | appreciation/(depreciation) on investments | | | 105,919 | |
Written option contracts | | | | | | |
Equity risk | | | | | | |
ICON Risk-Managed Equity Fund | | Change in unrealized net appreciation/(depreciation) on written options | | $ | 71,420 | |
For the year ended September 30, 2011, the Funds’ quarterly holdings of options contracts were as follows:
| | | | | | | | | | | | |
| | | ICON Equity
Income Fund | | | ICON Risk-
Managed
Equity Fund | | | ICON Risk-
Managed
Equity Fund | |
| Quarter Ended | | Number of Options Purchased
Contracts Outstanding | | | Number of
Options Written
Contracts
Outstanding | |
December 31, 2010 | | | 871 | | | | 200 | | | | 180 | |
March 31, 2011 | | | 820 | | | | 50 | | | | 150 | |
June 30, 2011 | | | 819 | | | | 35 | | | | 120 | |
September 30, 2011 | | | 1,681 | | | | 45 | | | | 75 | |
The Funds value derivatives at fair value, as described below, and recognize changes in fair value currently in the results of operations. Accordingly, the Funds do not follow hedge accounting, even for derivatives employed as economic hedges.
Short Sales
The Long/Short Fund may engage in short sales (selling securities it does not own) as part of its normal investment activities. The Long/Short Fund enters into short positions in equity securities identified as being overvalued.
Short sales involve market risk. If a security sold short increases in price, the Long/Short Fund may have to cover its short position at a higher price than the short sale price, resulting in a loss. These short sales are collateralized
| | |
| 72 | | NOTESTO FINANCIAL STATEMENTS |
by cash and/or securities held with the Fund’s prime broker and in a segregated account at the Fund’s custodian. The collateral required is determined daily by reference to the market value of the short positions. Such collateral for the Fund is restricted from use. The cash collateral that is restricted from use is included on the Statement of Assets and Liabilities as “Deposits for short sales.” The securities pledged as collateral that are restricted from use are included on the Schedule of Investments. Dividends received on short sales are treated as an expense on the Statement of Operations. Liabilities for securities sold short are closed out by purchasing the applicable securities for delivery to the Fund’s prime broker. As of September 30, 2011, the Long/Short Fund engaged in short selling. The short positions are included in the Schedule of Securities Sold Short on the Schedule of Investments.
Securities Lending
Under procedures adopted by the Board, the Funds may lend securities to non-affiliated qualified parties. The Funds seek to earn additional income through securities lending. There is the risk of delay in recovering a loaned security. The Funds do not have the right to vote on securities while they are on loan; however, the Funds may attempt to call back the loan and vote the proxy.
All loans will be continuously secured by collateral which consists of cash. The cash collateral is invested in the State Street Navigator Prime Portfolio and is disclosed on the Schedule of Investments. The lending fees received and the Funds’ portion of the interest income earned on cash collateral are included on the Statement of Operations, if applicable.
As of September 30, 2011, the following Funds had securities with the following values on loan:
| | | | | | | | |
| Fund | | Value of
Loaned Securities | | | Value of
Collateral | |
ICON Bond Fund | | $ | 6,216,808 | | | $ | 6,560,230 | |
ICON Core Equity Fund | | | 1,788,475 | | | | 1,841,798 | |
ICON Equity Income Fund | | | 2,031,367 | | | | 2,154,862 | |
ICON Long/Short Fund | | | 5,100 | | | | 5,194 | |
ICON Risk-Managed Equity Fund | | | - | | | | - | |
The value of the collateral above could include collateral held for securities that were sold on or before September 30, 2011. It may also include collateral received from the pre-funding of loans.
| | | | |
| NOTESTO FINANCIAL STATEMENTS | | | 73 | |
NOTESTO FINANCIAL STATEMENTS (CONTINUED)
Income Taxes
The Funds intend to qualify as regulated investment companies under Subchapter M of the Internal Revenue Code and, accordingly, the Funds will generally not be subject to federal and state income taxes, or federal excise taxes to the extent that they intend to make sufficient distributions of net investment income and net realized capital gains.
Dividends paid by the Funds from net investment income and distributions of net realized short-term gains are, for federal income tax purposes, taxable as ordinary income to shareholders.
Dividends and distributions to shareholders are recorded by the Funds on the ex-dividend/distribution date. The Bond Fund distributes net investment income, if any, to shareholders monthly. The Equity Income Fund and the Risk-Managed Equity Fund intend to distribute net investment income, if any, to shareholders quarterly. The other Funds distribute income, if any, annually. The Funds distribute net realized capital gains, if any, to shareholders at least annually, if not offset by capital loss carryforwards. The Funds may utilize equalization accounting for tax purposes and designate earnings and profits, including net realized gains distributed to shareholders on redemption of shares, as part of the dividends paid deduction for income tax purposes. Income distributions and capital gain distributions are determined in accordance with income tax regulations, which may differ from accounting principles generally accepted in the United States of America.
Management has analyzed the Funds’ tax positions taken on federal income tax returns for all open tax periods and has concluded that no provision for federal income tax is required in the Funds’ financial statements.
The Funds file U.S. tax returns. While the statute of limitations remains open to examine the Funds’ U.S. tax returns filed for the past four years, no examinations are in progress or anticipated at this time. The Funds are not aware of any tax positions for which it is reasonably possible that the total amounts of unrecognized tax benefits will significantly change in the next twelve months.
Investment Income
Dividend income is recorded on the ex-dividend date. Non-cash dividends included in dividend income, if any, are recorded at the fair value of the securities received. Interest income is accrued as earned. Certain dividends from foreign securities are recorded as soon as the Funds are informed of the
| | |
| 74 | | NOTESTO FINANCIAL STATEMENTS |
dividend if such information is obtained subsequent to the ex-dividend date. Discounts and premiums on securities purchased are amortized over the life of the respective securities.
Investment Transactions
Security transactions are accounted for no later than one business day after the trade date. However, for financial reporting purposes, security transactions are accounted for on the trade date. Gains and losses on securities sold are determined on the basis of identified cost.
Allocation of Expenses
Each class of a Fund’s shares bears expenses incurred specifically on its behalf and, in addition, each class bears a portion of general expenses, based upon relative net assets of each class. Expenses which cannot be directly attributed to a specific Fund in the Trust are apportioned between all Funds in the Trust based upon relative net assets. In calculating the net asset value per share of each class, investment income, realized and unrealized gains and losses and expenses other than class-specific expenses are allocated daily to each class of shares based upon the proportion of net assets.
Below are the class level expenses that are included on the Statement of Operations:
| | | | | | | | | | | | |
| Fund | | Legal
Expense | | | Printing
And Postage
Expense | | | Transfer
Agent
Expense | |
ICON Bond Fund | | | | | | | | | | | | |
Class I | | $ | 16,173 | | | $ | 20,089 | | | $ | 73,565 | |
Class C | | | 512 | | | | 599 | | | | 11,475 | |
Class Z | | | 124 | | | | 152 | | | | 3,500 | |
Class A | | | 7 | | | | 5 | | | | 2,587 | |
ICON Core Equity Fund | | | | | | | | | | | | |
Class I | | | 8,655 | | | | 36,708 | | | | 59,873 | |
Class C | | | 3,149 | | | | 13,416 | | | | 54,305 | |
Class Z | | | 27 | | | | 113 | | | | 3,454 | |
Class A | | | 200 | | | | 870 | | | | 6,142 | |
ICON Equity Income Fund | | | | | | | | | | | | |
Class I | | | 4,953 | | | | 17,733 | | | | 45,239 | |
Class C | | | 530 | | | | 1,880 | | | | 10,858 | |
Class Z | | | 16 | | | | 56 | | | | 3,302 | |
Class A | | | 361 | | | | 1,276 | | | | 5,210 | |
| | | | |
| NOTESTO FINANCIAL STATEMENTS | | | 75 | |
NOTESTO FINANCIAL STATEMENTS (CONTINUED)
| | | | | | | | | | | | |
| Fund | | Legal
Expense | | | Printing
And Postage
Expense | | | Transfer
Agent
Expense | |
ICON Long/Short Fund | | | | | | | | | | | | |
Class I | | $ | 1,554 | | | $ | 3,285 | | | $ | 22,723 | |
Class C | | | 1,219 | | | | 3,050 | | | | 20,859 | |
Class Z | | | 10 | | | | 30 | | | | 3,325 | |
Class A | | | 222 | | | | 486 | | | | 5,485 | |
ICON Risk-Managed Equity Fund | | | | | | | | | | | | |
Class I | | | 2,832 | | | | 17,251 | | | | 33,230 | |
Class C | | | 404 | | | | 2,430 | | | | 8,392 | |
Class Z | | | 10 | | | | 59 | | | | 3,226 | |
Class A | | | 525 | | | | 3,089 | | | | 5,904 | |
3. Fees and Other Transactions with Affiliates
Investment Advisory Fees
ICON Advisers, Inc. (“ICON Advisers”) serves as investment adviser to the Funds and is responsible for managing the Funds’ portfolios of securities. ICON Advisers receives a monthly management fee that is computed daily at an annual rate of 0.60% of average daily net assets of the Bond Fund, 0.75% of average daily net assets of the Core Equity, Equity Income and Risk-Managed Equity Funds, and 0.85% of average daily net assets of the Long/Short Fund.
ICON Advisers has contractually agreed to limit the Funds’ expenses (exclusive of brokerage, interest, taxes, dividends on short sales and extraordinary expenses) to the extent necessary to ensure that the Funds’ expenses do not exceed the following amounts:
| | | | | | | | | | | | | | | | |
| Fund | | Class I | | | Class C | | | Class Z | | | Class A | |
ICON Bond Fund | | | 1.00% | | | | 1.60% | | | | 0.75% | | | | 1.00% | |
ICON Equity Income Fund | | | 1.45% | | | | 2.20% | | | | 1.20% | | | | 1.45% | |
ICON Long/Short Fund | | | 1.55% | | | | 2.30% | | | | 1.25% | | | | 1.55% | |
ICON Risk-Managed Equity Fund | | | 1.45% | | | | 2.20% | | | | 1.20% | | | | 1.45% | |
The Funds’ expense limitations, excluding the Bond Fund Class A, will continue in effect until at least January 31, 2021. The Bond Fund Class A will continue in effect until at least January 31, 2013. To the extent ICON Advisers reimburses or absorbs fees and expenses, it may seek payment of such amounts for up to three years after the expenses were reimbursed or absorbed. A Fund will make no such payment, however, if the total Fund
| | |
| 76 | | NOTESTO FINANCIAL STATEMENTS |
operating expenses exceed the expense limits in effect at the time the expenses were reimbursed or at the time these payments are proposed.
As of September 30, 2011 the following amounts were still available for recoupment by ICON Advisers based upon their potential expiration dates:
| | | | | | | | | | | | |
| Fund | | 2012 | | | 2013 | | | 2014 | |
ICON Bond Fund | | $ | 143,964 | | | $ | 245,979 | | | $ | 167,544 | |
ICON Equity Income Fund | | | 35,498 | | | | 73,119 | | | | 38,479 | |
ICON Long/Short Fund | | | 60,531 | | | | 150,441 | | | | 93,442 | |
ICON Risk-Managed Equity Fund | | | 33,743 | | | | 138,234 | | | | 95,012 | |
Accounting, Custody and Transfer Agent Fees
State Street Bank and Trust Company (“State Street”) serves as the fund accounting agent for the funds. For its services, the Trust pays State Street a fee that is calculated daily and paid monthly at an annual rate based on the aggregate average daily assets of the Trust.
State Street is the custodian of the Trust’s investments. For its services, the Trust pays State Street asset-based fees that vary according to the number of positions and transactions, plus out-of-pocket expenses.
Boston Financial Data Services, Inc. (“BFDS”) is the Trust’s transfer agent. For these services, the Trust pays a per account fee, plus certain other transaction cusip charges. BFDS may pay each Fund transfer agent earnings credits. Transfer agent earnings credits are credits received for interest which results from overnight balances used by BFDS for clearing shareholder transactions.
Administrative Services
The Trust has entered into an administrative services agreement with ICON Advisers pursuant to which ICON Advisers oversees the administration of the Trust’s business and affairs. This agreement provides for an annual fee of 0.05% on the Trust’s first $1.5 billion of average daily net assets, 0.045% on the next $1.5 billion of average daily net assets, 0.040% on the next $2 billion of average daily net assets and 0.030% on average daily net assets over $5 billion. For the year ended September 30, 2011, each Funds’ payment for administrative services to ICON Advisers is included on the Statement of Operations. The administrative services agreement provides that ICON Advisers will not be liable for any error of judgment, mistake of law, or any loss suffered by the Trust in connection with matters to which
| | | | |
| NOTESTO FINANCIAL STATEMENTS | | | 77 | |
NOTESTO FINANCIAL STATEMENTS (CONTINUED)
the administrative services agreement relates, except for a loss resulting from willful misfeasance, bad faith or negligence by ICON Advisers in the performance of its duties.
ICON Advisers has a sub-administration agreement with State Street to which State Street assists ICON Advisers with the administration and business affairs of the Trust. For its services, ICON Advisers pays State Street a fee that is calculated daily and paid monthly at an annual rate based on the aggregate average daily assets of the Trust.
Distribution Fees
The Funds have adopted a Distribution Plan pursuant to Rule 12b-1 under the 1940 Act (“12b-1 Plan”) under which the Funds are authorized to compensate the Funds’ distributor, ICON Distributors, Inc. (“IDI”) (an affiliate of the adviser) for the sale and distribution of shares and for other shareholder services. Under the 12b-1 Plan, Bond Fund Class C shareholders pay an annual distribution and service fee of 0.85% of average daily net assets and Class I and Class A shareholders pay an annual distribution and service fee of 0.25% of average daily net assets. The shareholders of the other Funds pay an annual distribution and service fee of 1.00% of average daily net assets for Class C shares and an annual distribution and service fee of 0.25% of average daily net assets for Class I shares and Class A shares. The total amount paid under the 12b-1 plans by the Funds is shown on the Statement of Operations.
Other Related Parties
Certain Officers and Directors of ICON Advisers are also Officers and Trustees of the Funds; however, such Officers and Trustees (with the exception of the Chief Compliance Officer, “CCO”) receive no compensation from the Funds. The CCO’s salary is paid 86% by the Trust and 14% by ICON Advisers. For the year ended September 30, 2011, the total related amounts paid by the Funds under this arrangement are included in Other Expenses on the Statements of Operations.
Some of the distribution amounts received by IDI, discussed in the Distribution Fees section above, have been used to offset various shareholder servicing costs incurred by ICON Advisers. For the year ended September 30, 2011, this amount was $7,992.
| | |
| 78 | | NOTESTO FINANCIAL STATEMENTS |
4. Borrowings
The Trust has entered into Lines of Credit agreements with State Street to provide temporary funding for redemption requests. The maximum borrowing is limited to $150 million. Interest on domestic borrowings is charged at the higher of the Federal Funds Rate effective on that day and the Overnight LIBOR Rate effective on that day plus 1.25%. The Funds may have borrowings with the prime broker as a result of brokerage requirements. Interest on domestic borrowing with the prime broker is charged at the Fed Funds rate plus 0.50%. The average interest rate charged for ICON Bond Fund, ICON Core Equity Fund and ICON Equity Income Fund for the year ended September 30, 2011 was 1.44%. The average interest rate charged for ICON Long/Short Fund for the year ended September 30, 2011 was 2.02%. The average interest rate charged for ICON Risk-Managed Equity Fund for the year ended September 30, 2011 was 2.08%.
| | | | |
| Fund | | Average Borrowing (10/1/10-9/30/11) | |
ICON Bond Fund | | $ | 226,534 | |
ICON Core Equity Fund* | | | 265,663 | |
ICON Equity Income Fund* | | | 88,878 | |
ICON Long/Short Fund* | | | 369,075 | |
ICON Risk-Managed Equity Fund* | | | 1,184,941 | |
| * | Fund had outstanding borrowings under these agreements as of September 30, 2011. |
5. Purchases and Sales of Investment Securities
For the year ended September 30, 2011, the aggregate cost of purchases and proceeds from sales of investment securities (excluding securities sold short, short-term securities and written options contracts) was as follows:
| | | | | | | | | | | | | | | | |
| Fund | | Purchases of Securities | | | Proceeds from Sales of
Securities | | | Purchases of
Long-Term U.S.
Government
Obligations | | | Proceeds from Sales of Long-Term U.S. Government Obligations | |
ICON Bond Fund | | $ | 35,808,316 | | | $ | 76,458,099 | | | $ | 5,555,955 | | | $ | 14,349,341 | |
ICON Core Equity Fund | | | 52,733,314 | | | | 90,956,093 | | | | - | | | | - | |
ICON Equity Income Fund | | | 63,932,443 | | | | 71,155,482 | | | | 1,003,930 | | | | 1,869,806 | |
ICON Long/Short Fund | | | 12,270,147 | | | | 22,897,943 | | | | - | | | | - | |
ICON Risk-Managed Equity Fund | | | 16,862,018 | | | | 22,832,093 | | | | - | | | | - | |
| | | | |
| NOTESTO FINANCIAL STATEMENTS | | | 79 | |
NOTESTO FINANCIAL STATEMENTS (CONTINUED)
6. Federal Income Tax
Income and capital gain distributions are determined in accordance with income tax regulations that may differ from accounting principles that are generally accepted in the United States of America. These differences are due to differing treatments for items such as net short-term gains, deferrals of wash sale losses, foreign currency transactions, net investment losses, and capital loss carryforwards.
The tax components of capital shown in the following tables include losses the Funds may be able to offset against gains recognized in future years. The accumulated losses noted represent net capital loss carryforwards as of September 30, 2011 and post-October losses that may be available to offset future realized capital gains and thereby reduce future taxable income distributions.
For the year ended September 30, 2011 the following Funds had capital loss carryforwards:
| | | | | | | | |
| Fund | | Amounts | | | Expires | |
| | | | | | | | |
ICON Core Equity Fund | | $ | 23,715,124 | | | | 2017 | |
| | | 19,833,424 | | | | 2018 | |
ICON Equity Income Fund | | | 9,397,439 | | | | 2017 | |
| | | 19,089,764 | | | | 2018 | |
ICON Long/Short Fund | | | 43,306,180 | | | | 2017 | |
| | | 19,325,857 | | | | 2018 | |
ICON Risk-Managed Equity Fund | | | 5,993,077 | | | | 2017 | |
| | | 14,212,596 | | | | 2018 | |
Future capital loss carryforward utilization in any given year may be limited if there are substantial shareholder redemptions or contributions. During the year ended September 30, 2011 the Funds utilized capital loss carryforwards:
| | | | |
| Fund | | Amount | |
ICON Core Equity Fund | | $ | 10,265,321 | |
ICON Equity Income Fund | | | 5,627,077 | |
ICON Long/Short Fund | | | 853,303 | |
ICON Risk-Managed Equity Fund | | | 2,242,574 | |
| | |
| 80 | | NOTESTO FINANCIAL STATEMENTS |
The tax characteristics of distributions paid to shareholders during the fiscal year ended September 30, 2011, were as follows:
| | | | | | | | | | | | |
| | | Distributions Paid from | | | Total
Distributions
Paid | |
| Fund | | Ordinary Income | | | Net Long-Term Gains | | |
| | | | | | | | | | | | |
ICON Bond Fund | | $ | 7,853,451 | | | $ | 1,064,414 | | | $ | 8,917,865 | |
ICON Core Equity Fund | | | 168,477 | | | | - | | | | 168,477 | |
ICON Equity Income Fund | | | 1,710,940 | | | | - | | | | 1,710,940 | |
ICON Long/Short Fund | | | - | | | | - | | | | - | |
ICON Risk-Managed Equity Fund | | | 203,631 | | | | - | | | | 203,631 | |
The tax characteristics of distributions paid to shareholders during the fiscal year ended September 30, 2010, were as follows:
| | | | | | | | | | | | |
| | | Distributions Paid from | | | Total
Distributions
Paid | |
| Fund | | Ordinary Income | | | Net Long-Term Gains | | |
ICON Bond Fund | | $ | 7,731,554 | | | $ | 158,909 | | | $ | 7,890,463 | |
ICON Core Equity Fund | | | 1,543,355 | | | | - | | | | 1,543,355 | |
ICON Equity Income Fund | | | 1,655,386 | | | | - | | | | 1,655,386 | |
ICON Long/Short Fund | | | 370,083 | | | | - | | | | 370,083 | |
ICON Risk-Managed Equity Fund | | | 130,024 | | | | - | | | | 130,024 | |
| | | | |
| NOTESTO FINANCIAL STATEMENTS | | | 81 | |
NOTESTO FINANCIAL STATEMENTS (CONTINUED)
As of September 30, 2011, the components of accumulated earnings/(deficit) on a tax basis were as follows:
| | | | | | | | | | | | | | | | | | | | | | | | | | | | |
| Fund | | Undistributed Ordinary Income | | | Undistributed
Net Long-
Term-Gains | | | Accumulated Earnings | | | Distributions Payable* | | | Accumulated Capital and Other Losses | | | Unrealized Appreciation/ (Depreciation)** | | | Total
Accumulated
Earnings/
(Deficit) | |
| | | | | | | | | | | | | | | | | | | | | | | | | | | | |
ICON Bond Fund | | $ | 29,622 | | | $ | 1,686,187 | | | $ | 1,715,809 | | | $ | (359,008 | ) | | $ | - | | | $ | 1,948,292 | | | $ | 3,305,093 | |
ICON Core Equity Fund | | | 161,462 | | | | - | | | | 161,462 | | | | - | | | | (43,548,548 | ) | | | (747,369 | ) | | | (44,134,455 | ) |
ICON Equity Income Fund | | | 314,548 | | | | - | | | | 314,548 | | | | (357,382 | ) | | | (28,487,200 | ) | | | (3,360,908 | ) | | | (31,890,942 | ) |
ICON Long/Short Fund | | | - | | | | - | | | | - | | | | - | | | | (62,632,037 | ) | | | (400,656 | ) | | | (63,032,693 | ) |
ICON Risk-Managed Equity Fund | | | - | | | | - | | | | - | | | | - | | | | (20,205,673 | ) | | | 893,563 | | | | (19,312,110 | ) |
| * | Differences between the financial statement distribution payable and the tax basis distribution payable are a result of accrual based accounting and cash basis accounting used for federal tax reporting purposes. |
| ** | Differences between the book-basis and tax-basis unrealized appreciation/(depreciation) are attributable primarily to tax deferral of losses on wash sales. |
As of September 30, 2011, cost on investments for federal income tax purposes and the amount of net unrealized appreciation/(depreciation) were as follows:
| | | | | | | | | | | | | | | | |
| Fund | | Cost | | | Unrealized Appreciation | | | Unrealized (Depreciation) | | | Net
Appreciation/ (Depreciation) | |
ICON Bond Fund | | $ | 99,970,175 | | | $ | 4,063,592 | | | $ | (2,115,300 | ) | | $ | 1,948,292 | |
ICON Core Equity Fund | | | 68,977,537 | | | | 7,225,049 | | | | (7,972,418 | ) | | | (747,369 | ) |
ICON Equity Income Fund | | | 37,816,771 | | | | 1,050,301 | | | | (4,410,994 | ) | | | (3,360,693 | ) |
ICON Long/Short Fund | | | 14,684,957 | | | | 1,189,185 | | | | (1,632,199 | ) | | | (443,014 | ) |
ICON Risk-Managed
Equity Fund | | | 19,787,165 | | | | 2,264,378 | | | | (1,269,855 | ) | | | 994,523 | |
The Regulated Investment Company Modernization Act of 2010 (the “Act”) was signed into law on December 22, 2010. The Act makes changes to a number of tax rules impacting the Funds. Under the Act, future capital
| | |
| 82 | | NOTESTO FINANCIAL STATEMENTS |
losses generated by a fund may be carried over indefinitely, but these losses must be used prior to the utilization of any pre-enactment capital losses. Since pre-enactment capital losses may only be carried forward for eight years, there may be a greater likelihood that all or a portion of each fund’s pre-enactment capital losses will expire unused. In general, the provisions of the Act will be effective for each Fund’s fiscal year ending 2012.
7. Subsequent Events
The Board of Trustees has decided to merge Class I shares into Class A shares of all Diversified Funds effective January 23, 2012. Please visit www.iconfunds.com for additional information regarding these share class mergers.
Class Z shares of each Fund will be renamed Class S shares effective January 23, 2012. The Class S shares will be offered to platform sales and to investment representatives through fee-based products or accounts, as well as institutional investors. ICON reserves the right to change or waive the investment criteria for the Class S shares.
Effective January 23, 2012, the Core Equity Fund will change its name to the ICON Fund and enter into an expense limitation agreement with ICON Advisers contractually limiting expenses (exclusive of brokerage, interest, taxes, dividends on short sales and extraordinary expenses) to 1.25%, 1.50% and 2.25% of average net assets for Class S, Class A and Class C, respectively.
Subsequent to year end, the ICON Funds suspended participation in the securities lending program.
| | | | |
| NOTESTO FINANCIAL STATEMENTS | | | 83 | |
REPORTOF INDEPENDENT REGISTERED PUBLIC
ACCOUNTING FIRM
To the Board of Trustees and Shareholders of the ICON Funds:
In our opinion, the accompanying statements of assets and liabilities, including the schedules of investments, and the related statements of operations and of changes in net assets and the financial highlights present fairly, in all material respects, the financial position of ICON Bond Fund, ICON Core Equity Fund, ICON Equity Income Fund, ICON Long/Short Fund, and ICON Risk-Managed Equity Fund (five of the portfolios constituting ICON Funds, hereafter referred to as the “Funds”) at September 30, 2011, and the results of each of their operations for the year then ended, the changes in each of their net assets for each of the two years in the period then ended and the financial highlights for each of the periods presented, in conformity with accounting principles generally accepted in the United States of America. These financial statements and financial highlights (hereafter referred to as “financial statements”) are the responsibility of the Funds’ management; our responsibility is to express an opinion on these financial statements based on our audits. We conducted our audits of these financial statements in accordance with the standards of the Public Company Accounting Oversight Board (United States). Those standards require that we plan and perform the audit to obtain reasonable assurance about whether the financial statements are free of material misstatement. An audit includes examining, on a test basis, evidence supporting the amounts and disclosures in the financial statements, assessing the accounting principles used and significant estimates made by management, and evaluating the overall financial statement presentation. We believe that our audits, which included confirmation of securities at September 30, 2011 by correspondence with the custodian and brokers, provide a reasonable basis for our opinion.

Denver, Colorado
November 18, 2011
| | |
| 84 | | REPORTOF ACCOUNTING FIRM |
SIX MONTH HYPOTHETICAL EXPENSE EXAMPLE
SEPTEMBER 30, 2011 (UNAUDITED)
Example
As a shareholder of a Fund you may pay two types of fees: transaction fees and fund-related fees. Certain funds charge transaction fees, including sales charges (loads) on purchase payments, reinvested dividends, or other distributions; redemption fees; and exchange fees. Funds also incur various ongoing expenses, including management fees, distribution and/or service fees, and other fund expenses, which are indirectly paid by shareholders.
This Example is intended to help you understand your ongoing costs (in dollars) of investing in the various ICON Funds and to compare these costs with the ongoing costs of investing in other mutual funds. This Example is based on an investment of $1,000 invested at the beginning of the six-month period and held for the six-month period (4/1/11 – 9/30/11).
Actual Expenses
The first line in the table for each Fund provides information about actual account values and actual expenses. The Example includes, but is not limited to, management fees, 12b-1 fees, fund accounting, custody and transfer agent fees. However, the Example does not include client specific fees, such as the $15 fee charged to IRA accounts, or the $15 fee charged for wire redemptions. You may use this information, together with the amount you invested, to estimate the expenses that you paid over the period. Simply divide your account value by $1,000 (for example, an $8,600 account value divided by $1,000 = 8.6), then multiply the result by the number in the first line for each Fund under the heading entitled “Expenses Paid During Period” to estimate the expenses you paid on your account during this period.
Hypothetical Example for Comparison Purposes
The second line in the table for each Fund provides information about hypothetical account values and hypothetical expenses based on the Fund’s actual expense ratio and an assumed rate of return of 5% per year before expenses, which is not the Fund’s actual return. The hypothetical account values and expenses may not be used to estimate the actual ending account balance or expenses you paid for the period. You may use this information to compare the ongoing costs of investing in the Fund and other funds. To do so, compare this 5% hypothetical example with the 5% hypothetical examples that appear in the shareholder reports of the other funds. Please note that the expenses shown in the table are meant to highlight your ongoing costs only and do not reflect any transactional costs, such as sales charges (loads),
redemption fees, or exchange fees that may be charged by other funds. Therefore, this information is useful in comparing ongoing costs only, and will not help you determine the relative total costs of owning different funds.
| | | | | | | | | | | | | | | | |
| | | Beginning
Account
Value 4/1/11 | | | Ending
Account
Value
9/30/11 | | | Expenses Paid
During Period
4/1/11-9/30/11* | | | Annualized
Expense Ratio
4/1/11 - 9/30/11 | |
Actual Expenses | | | | | | | | | | | | | | | | |
ICON Bond Fund | | | | | | | | | | | | | | | | |
Class I | | $ | 1,000.00 | | | $ | 994.80 | | | $ | 5.02 | | | | 1.00% | |
Class C | | | 1,000.00 | | | | 992.90 | | | | 8.02 | | | | 1.60% | |
Class Z | | | 1,000.00 | | | | 997.00 | | | | 3.78 | | | | 0.75% | |
Class A | | | 1,000.00 | | | | 995.80 | | | | 5.04 | | | | 1.00% | |
ICON Core Equity Fund | | | | | | | | | | | | | | | | |
Class I | | | 1,000.00 | | | | 812.70 | | | | 6.42 | | | | 1.41% | |
Class C | | | 1,000.00 | | | | 808.90 | | | | 10.46 | | | | 2.31% | |
Class Z | | | 1,000.00 | | | | 812.90 | | | | 6.90 | | | | 1.52% | |
Class A | | | 1,000.00 | | | | 808.00 | | | | 11.55 | | | | 2.55% | |
ICON Equity Income Fund | | | | | | | | | | | | | | | | |
Class I | | | 1,000.00 | | | | 853.70 | | | | 6.74 | | | | 1.45% | |
Class C | | | 1,000.00 | | | | 850.20 | | | | 10.20 | | | | 2.20% | |
Class Z | | | 1,000.00 | | | | 855.20 | | | | 5.58 | | | | 1.20% | |
Class A | | | 1,000.00 | | | | 854.10 | | | | 6.74 | | | | 1.45% | |
ICON Long/Short Fund | | | | | | | | | | | | | | | | |
Class I | | | 1,000.00 | | | | 861.00 | | | | 7.89 | | | | 1.69% | |
Class C | | | 1,000.00 | | | | 857.50 | | | | 11.36 | | | | 2.44% | |
Class Z | | | 1,000.00 | | | | 862.60 | | | | 6.50 | | | | 1.39% | |
Class A | | | 1,000.00 | | | | 860.80 | | | | 7.91 | | | | 1.69% | |
ICON Risk-Managed Equity Fund | | | | | | | | | | | | | |
Class I | | | 1,000.00 | | | | 910.40 | | | | 7.11 | | | | 1.48% | |
Class C | | | 1,000.00 | | | | 907.00 | | | | 10.68 | | | | 2.23% | |
Class Z | | | 1,000.00 | | | | 911.20 | | | | 5.92 | | | | 1.24% | |
Class A | | | 1,000.00 | | | | 910.10 | | | | 7.11 | | | | 1.48% | |
Hypothetical (assuming a 5% return before expenses) | |
ICON Bond Fund | | | | | | | | | | | | | | | | |
Class I | | | 1,000.00 | | | | 1,020.03 | | | | 5.09 | | | | | |
Class C | | | 1,000.00 | | | | 1,017.02 | | | | 8.11 | | | | | |
Class Z | | | 1,000.00 | | | | 1,021.28 | | | | 3.82 | | | | | |
Class A | | | 1,000.00 | | | | 1,020.02 | | | | 5.10 | | | | | |
ICON Core Equity Fund | | | | | | | | | | | | | | | | |
Class I | | | 1,000.00 | | | | 1,017.98 | | | | 7.15 | | | | | |
Class C | | | 1,000.00 | | | | 1,013.50 | | | | 11.64 | | | | | |
Class Z | | | 1,000.00 | | | | 1,017.45 | | | | 7.68 | | | | | |
Class A | | | 1,000.00 | | | | 1,012.29 | | | | 12.86 | | | | | |
| | | | | | | | | | | | | | |
| | | Beginning
Account
Value
4/1/11 | | | Ending
Account
Value
9/30/11 | | | Expenses Paid
During Period
4/1/11-9/30/11* | | | Annualized
Expense Ratio
4/1/11 - 9/30/11 |
ICON Equity Income Fund | | | | | | | | | | | | | | |
Class I | | $ | 1,000.00 | | | $ | 1,017.80 | | | $ | 7.33 | | | |
Class C | | | 1,000.00 | | | | 1,014.04 | | | | 11.11 | | | |
Class Z | | | 1,000.00 | | | | 1,019.05 | | | | 6.07 | | | |
Class A | | | 1,000.00 | | | | 1,017.80 | | | | 7.33 | | | |
ICON Long/Short Fund | | | | | | | | | | | | | | |
Class I | | | 1,000.00 | | | | 1,016.59 | | | | 8.55 | | | |
Class C | | | 1,000.00 | | | | 1,012.84 | | | | 12.31 | | | |
Class Z | | | 1,000.00 | | | | 1,018.09 | | | | 7.04 | | | |
Class A | | | 1,000.00 | | | | 1,016.57 | | | | 8.57 | | | |
ICON Risk-Managed Equity Fund | | | | | | | | | | | |
Class I | | | 1,000.00 | | | | 1,017.62 | | | | 7.51 | | | |
Class C | | | 1,000.00 | | | | 1,013.86 | | | | 11.28 | | | |
Class Z | | | 1,000.00 | | | | 1,018.87 | | | | 6.26 | | | |
Class A | | | 1,000.00 | | | | 1,017.63 | | | | 7.51 | | | |
| * | Expenses are equal to the Fund’s six month expense ratio annualized, multiplied by the average account value over the period, multiplied by 183/365 to reflect the one-half year period. |
Total returns exclude applicable sales charges. If sales charges were included (maximum 5.75%), returns would be lower.
BOARDOF TRUSTEESAND FUND OFFICERS (UNAUDITED)
The ICON Funds Board of Trustees (“Board”) consists of four Trustees who oversee the 17 ICON Funds (the “Funds”). The Board is responsible for general oversight of the Funds’ business and for assuring that the Funds are managed in the best interest of the Funds’ shareholders. The Trustees, and their ages, and principal occupations are set forth below. The address of the Trustees is 5299 DTC Blvd., Suite 1200, Greenwood Village, CO 80111. Trustees have no official term of office and generally serve until they resign or are not re-elected.
Interested Trustee
Craig T. Callahan, 60, Chairman of the Board. Dr. Callahan has been a Trustee of the Funds since their inception. Dr. Callahan also serves as President (1998 to present) and Chairman of the Investment Committee (2005 to present) and served as the Chief Investment Officer (1991 to 2004) of ICON Advisers. Dr. Callahan is also Executive Vice President (2005 to present); Director (1991 to present); and was previously President (1998 to 2005) and Chief Compliance Officer (2005) of IDI. Dr. Callahan also serves as the President (1998 to present) and Chairman of the Board of Directors (1994 to present) of ICON Management & Research Corporation (“IM&R”), the parent company of ICON Advisers and IDI.
Independent Trustees
Glen F. Bergert, 61. Mr. Bergert has been a Trustee of the Funds since 1999. Mr. Bergert is President of Venture Capital Management LLC (1997 to present), General Partner of SOGNO Partners LP, a venture capital company (2001 to present), General Partner of Bergert Properties, LLP, a real estate holding company (1997 to present), General Partner of Pyramid Real Estate Partnership, a real estate development company (1998 to present), General Partner of Chamois Partners, LP, a venture capital company (2004 to present) and was previously a General Partner with KPMG Peat Marwick, LLP (1979 to 1997). Mr. Bergert is also a Director of Delta Dental of California, an insurance company (2006 to present), Delta Dental of Pennsylvania, an insurance company (1998 to 2009 and 2010 to present), Dentegra Group, Inc, an insurance holding company (2010 to present) and Delta Reinsurance Corporation (2000 to 2009 and 2011 to present). Mr. Bergert was a Director of Herre Bros, Inc., a contracting company (1998 to 2011).
John C. Pomeroy, Jr., 64. Mr. Pomeroy has been a Trustee of the Funds since November 2002. Mr. Pomeroy is Chief Investment Officer and Director
of Investments, Pennsylvania State University (2001 to present) and was Portfolio Manager and Product Manager, Trinity Investment Management Corporation (1989 to 2001).
R. Michael Sentel, 63. Mr. Sentel has been a Trustee of the Funds since their inception. Mr. Sentel is a Senior Attorney with the U.S. Department of Education (1996 to present). Mr. Sentel also provides legal representation as a sole practitioner with an emphasis on corporate and transactional law. He served as general counsel to numerous public companies and served on the board of directors of one of these clients. Mr. Sentel began his legal career with the U.S. Securities and Exchange Commission’s Division of Enforcement and served as a Branch Chief (1980 to 1981). Later he served as the Section Chief for the Professional Liability Section of the Federal Deposit Insurance Corp. with responsibility for the Rocky Mountain Region (1991 to 1994).
The Officers of the Funds are:
Craig T. Callahan, 60, Chairman of the Board. Dr. Callahan has been a Trustee of the Funds since their inception. Dr. Callahan also serves as President (1998 to present) and Chairman of the Investment Committee (2005 to present) and served as the Chief Investment Officer (1991 to 2004) of ICON Advisers. Dr. Callahan is also Executive Vice President (2005 to present); Director (1991 to present); and was previously President (1998 to 2005) and Chief Compliance Officer (2005) of IDI. Dr. Callahan also serves as the President (1998 to present) and Chairman of the Board of Directors (1994 to present) of IM&R, the parent company of ICON Advisers and IDI.
Erik L. Jonson, 62. Mr. Jonson has been a Vice President and Principal Financial Officer/Treasurer of the Funds since their inception in 1996. Mr. Jonson is also Chief Financial Officer (1996 to present) and Executive Vice President (2004 to present) and was previously Vice President (1998 to 2004) and Secretary (2005 and 1998 to 2002) of ICON Advisers; Chief Financial Officer, Secretary and Director (1998 to present) of IM&R; and Executive Vice President and Treasurer/Financial Principal (1996 to present) of IDI.
Jessica Seidlitz, 33. Ms. Seidlitz serves as the Assistant Treasurer of the Funds (2007 to present). She also serves as the Mutual Fund Controller of ICON Advisers (2005 to present). Previously, she was a Senior Associate/Associate at PricewaterhouseCoopers LLP (2001 to 2004).
Donald Salcito, 58. Mr. Salcito serves as Vice President and Secretary of the Funds (November 15, 2006 to present). Mr. Salcito is also Executive Vice President and General Counsel (September 2005 to present) of ICON Advisers; Director of IM&R (2005 to present); Executive Vice President, Secretary, General Counsel of IDI (2005 to present). Previously, he was a Partner in various national law firms, practicing in the securities law area. (1980 to 2005).
Brian Harding, 32. Mr. Harding serves as Chief Compliance Officer and Anti-Money Laundering Officer of the Funds (2008 to present). Mr. Harding also serves as Chief Compliance Officer of ICON Advisers (2011 to present). Previously, he was a Manager (2007 to 2008) and a Senior Associate/Associate (2001 to 2007) at PricewaterhouseCoopers LLP.
OTHER INFORMATION
Renewal of Investment Advisory Agreements
On August 15, 2011, the Board of Trustees, including a majority of the Trustees that are not “interested persons” of the Trust (the “Independent Trustees”), approved continuation of the Advisory Agreements with the Adviser for each Fund for an additional one-year term commencing October 1, 2011.
In determining to renew the investment advisory agreements between ICON Funds (the “Trust”) and ICON Advisers, Inc. (“ICON” or the “Adviser”) the Board requested, was provided with and reviewed data with respect to ICON, its personnel, and the services provided and to be provided to each Fund by ICON under the Trust’s Investment Advisory Agreement dated October 9, 1996, as amended (related to the Sector, International and Core Equity Funds) and under the Trust’s Investment Advisory Agreement dated July 9, 2002 and effective October 1, 2002, as amended (related to the U.S. Diversified Funds — Bond, Risk-Managed Equity, Equity Income and Long/Short Funds) (collectively, the “Advisory Agreements”). The data included information concerning advisory, distribution and administrative services provided to the Funds by ICON and its related companies; information concerning other businesses of those companies; comparative data related to exchange traded funds versus the Sector Funds; and comparative data obtained from Lipper Analytical Services related to Fund performance and Fund expenses (the “Lipper report”). The data also included an analysis of the Funds’ ratings on the AthenaInvest system (the “AthenaInvest data”) and a presentation on ICON’s investment model. AthenaInvest is an affiliate of the Adviser. The Board of Trustees met on August 4 and 19, 2011 to discuss the data. Management personnel discussed the data for and with those present. Included in the discussion was a briefing on the sales and marketing initiatives, the different classes of shares being offered by the Trust and efficiencies in connection with administering services to the Funds/various classes of shares.
The Independent Trustees were represented by independent legal counsel throughout the process. Prior to acting on the matter, the Independent Trustees met separately as a group in private sessions with their independent legal counsel to review and discuss the foregoing information. Based on these discussions, independent legal counsel and/or the Lead Independent Trustee also contacted management to request additional information and to discuss responses to questions raised during the process. In addition, the Independent Trustees received materials from their independent legal counsel discussing the legal standards applicable to their consideration of the agreement.
In considering the nature, extent and quality of the services provided by the Adviser, the Board reviewed information relating to ICON’s operations and personnel. Among other things, the Adviser provided biographical information on its professional staff and descriptions of its organizational and management structure. In the course of their deliberations the Board evaluated, among other things, information relating to the investment philosophy, strategies and techniques used in managing each Fund, the qualifications and experience of ICON’s investment personnel, ICON’s compliance programs, ICON’s brokerage practices, including the extent to which the Adviser obtains research through “soft dollar” arrangements with the Funds’ brokerage, compliance reports on the foregoing, and the financial and non-financial resources available to provide services required under the Advisory Agreement.
During the discussion, the Lipper report and the AthenaInvest data were discussed and management personnel showed performance for each fund and discussed the factors affecting performance. Management noted that ICON modified the valuation methodology at the end of 2008 to better account for systemic risk. ICON implemented the modified valuation methodology in February 2009. During the discussion, management personnel noted that the markets continue to experience volatility and that when the markets are volatile, relative strength readings are also more volatile and less reliable It was also noted that volatility has affected ICON’s performance; that this had been the case for much of the last two years for the Funds; that poor quality stocks with low relative strength led the market whereas higher quality stocks with higher relative strength have not performed as well; that the market volatility and the relative strength component to our methodology have produced mixed results; and that many other value managers have had challenges in this market. The Adviser discussed its continuing assessment of its “investment model” – including steps taken to test the relative strength components of the system and methodology. Overall, the Board of Trustees concluded that the Adviser continues to believe the adjustments to the system have been functioning as intended; and that, notwithstanding that belief, the Adviser is constantly evaluating the system and will modify it as needed.
In connection with reviewing data bearing upon the nature, quality, and extent of services furnished by ICON to each Fund, the Board assessed data concerning ICON’s staffing, systems and facilities. The Board also assessed ICON’s non-Trust business to see if there are any initiatives that would dilute service to the Trust. The Board noted:
A. That the breadth and the quality of investment advisory and other services being provided to each Fund is satisfactory, as evidenced in part by efforts to address and improve the performance record of each Fund when compared with the performance records of a peer group of comparable funds and markets in general;
B. That the breadth and the quality of investment advisory and other services being provided to each Fund is satisfactory, as evidenced in part by the AthenaInvest data (ratings based on an assessment of fund strategy) reflects that all Funds are rated 3 or higher and that, unlike many other fund groups, ICON Funds has no fund rated 1 or 2 (where 1 is the lowest and 5 is the highest).
C. That ICON has made significant expenditures in the past year and in prior years to ensure that it has the sophisticated systems and the highly trained personnel necessary for it to be able to continue to provide quality service to the Funds’ shareholders, including the dedication of substantial resources to ICON’s investment and trading departments;
D. That the Board, after considering compliance reports and compliance initiatives undertaken during the year and conducting individual interviews with selected portfolio managers, is satisfied with the research, portfolio management, and trading services, among others, being provided by ICON to the Funds, and is charging fair, reasonable, and competitive fees; and
E. The risks assumed by ICON in providing investment advisory services to each Fund including the capital commitments which have been made in the past and which continue to be made by ICON to ensure the continuation of the highest quality of service to the Trust is made with the recognition that the Trust’s advisory relationship with ICON be terminated at any time and must be renewed on an annual basis.
In considering the reasonableness of the fee payable to the Adviser for managing each Fund, the Board reviewed, among other things, data concerning other funds from the Lipper report, financial statements of the Adviser and an analysis of the profitability to the Adviser and its affiliates of their relationship with each Fund over various time periods, which analysis identified all revenues and other benefits received by the Adviser and its affiliates from managing each Fund, the costs associated with providing such services and the resulting profitability to the Adviser and its affiliates.
The Board considered the current and anticipated asset levels of each Fund and the willingness of the Adviser to waive fees and pay expenses of the Funds from time to time to limit the total expenses of the Funds. In this regard the Board discussed significantly reduced asset levels in each fund covered by the Advisory Agreements due to the tumultuous markets during the past three and a half years, to relative poor Fund performance, and to industry wide net-redemptions in reaction to the tumultuous markets. ICON’s ability to provide the services called for under the Advisory Agreements was assessed in light of current and projected asset levels. Fund expenses and expense ratios were also assessed in light of current and projected asset
levels. The Board concluded that the Adviser has the resources necessary to provide the services called for under the Advisory Agreements; that profitability to the Adviser and its affiliates from their relationship with the Funds is not excessive; and that the Adviser is not realizing material benefits from economies of scale that would warrant adjustments to the fees for any Fund at this time. The Board of Trustees concluded that, in light of the nature, extent and quality of the services provided by the Adviser and the levels of profitability associated with providing these services, the fees charged by the Adviser under the Advisory Agreements to each Fund are reasonable.
In connection with assessing data bearing the fairness of fee arrangements, the Board used data from Lipper report concerning funds of similar size and funds of larger size, as well as data concerning ICON’s other clients and noted that:
A. the advisory fee structures of the Funds were considered in comparison with advisory fees and expense ratios of other similarly managed funds as set forth in the comparative data;
B. expense ratios for 10 of the 17 Funds are above average, 4 are equal to the median, 2 are below both the average and the median, and 1 is equal to the average.;
C. in 16 of the 17 Funds, the assets under management are significantly below either the average or the median and that when the fund size approaches industry average our expenses also approach or are less than industry average.;
D. ICON has contractually agreed to impose expense limitations on certain Funds at a cost to ICON;
E. the advisory and other fees payable by the Funds to ICON are essentially fees which would be similar to those which would have resulted solely from “arm’s-length” bargaining, and may well be lower than fees arrived at solely from such arm’s-length negotiation;
F. the fees paid to ICON for managing other institutional accounts (such as pension plans) are not lower than the fees paid by similarly-managed funds; indeed, some institutional accounts have been encouraged to, and have in fact used, the Funds Z share class, but to the extent some fees of those accounts are lower, the reasons why such accounts are less costly for ICON to manage; and
G. ICON has contractually committed to break points in its fees so that economies of scale could be realized as a Fund grows in assets, for the benefit of Fund shareholders.
In connection with the direct and indirect benefits to ICON from serving as the Funds’ adviser, the Board discussed and noted that:
A. ICON benefits from serving directly or through affiliates as the principal underwriter and administrative agent for the Funds; that services provided by ICON and its affiliates to the Funds are satisfactory, and that fees derived from providing the services are competitive and reasonable; and
B. ICON receives research assistance (primarily in the form of data) from the use of soft dollars generated from Fund portfolio transactions; that such research assists ICON in providing quality advisory services; that Trust and Adviser compliance personnel continuously evaluate and report on the soft-dollar arrangements and related costs; and that the Board concluded that the arrangements are consistent with Fund brokerage practices and benefit the Funds and their shareholders.
Based on these considerations, among others, the Board, including a majority of the Independent Trustees, concluded that: 1) the continuation of the Advisory Agreement was in the best interests of each Fund and its shareholders, 2) the services to be performed under the Advisory Agreement were required for the operation of the Funds, 3) the advisory services were satisfactory to the Funds in the past, and 4) the fees for the advisory services and other benefits from the relationship with the Trust received by ICON were consistent with fees paid by similar funds, other clients of ICON, reasonable in light of the comparative data, and within the range of what would have been negotiated at arm’s length in light of all the circumstances.
Supplemental Tax Information
For corporate shareholders, the following percentage of the total ordinary income dividends paid during the fiscal year ended September 30, 2011, qualifies for the corporate dividends received deduction for the following Funds:
| | | | |
| Fund | | Dividends Received
Deduction | |
ICON Core Equity Fund | | | 88 | % |
ICON Equity Income Fund | | | 48 | % |
ICON Risk-Managed Equity Fund | | | 100 | % |
For the fiscal year ended September 30, 2011, the following funds paid qualified dividend income:
| | | | |
| Fund | | Amount | |
ICON Core Equity Fund | | | 76% | |
ICON Equity Income Fund | | | 54% | |
ICON Risk-Managed Equity Fund | | | 100% | |
The Funds designate the following amounts, or the maximum amount needed, as long-term capital gain distributions qualifying for the maximum 15% income tax rate for individuals:
| | | | |
| Fund | | Amount | |
ICON Bond Fund | | | 1,674,209 | |
Portfolio Holdings
Information related to the 10 largest portfolio holdings of each Fund is made available at www.iconfunds.com within approximately 10 business days after month-end. Additionally, a complete list of each Fund’s holdings is made available approximately 30 days after month-end. Each ICON Fund also files a complete schedule of portfolio holdings for the first and third quarters of its fiscal year with the Securities and Exchange Commission (the “Commission”) on Form N-Q. The ICON Funds’ Forms N-Q are available at www.sec.gov or may be reviewed and copied at the Commission’s Public Reference Room in Washington, DC. Information about the Public Reference Room may be obtained by calling 1-800-SEC-0330.
Proxy Voting
A summarized description of the policies and procedures the ICON Funds use to vote proxies is available free of charge at www.iconfunds.com or by calling 1-800-764-0442.
Information about how the ICON Funds voted proxies related to each Fund’s portfolio securities during the 12-month period ended June 30 is available free of charge at www.iconfunds.com or on the Commission’s website at www.sec.gov.
Cost Basis Information
Effective January 1, 2012, federal law requires mutual fund companies to maintain and report a shareholder’s cost basis by tax lot, gain/loss information and holding period of covered shares to the Internal Revenue Service on Form 1099. Covered shares are mutual fund shares acquired on or after January 1, 2012. A fund is not required to maintain and report information for shares not deemed as covered.
The new law requires each fund to elect a default tax identification methodology in order to perform the required reporting. As a result, the Trust has chosen Average Cost as its default tax identification methodology. This is the method each Fund will use. However, at the time of purchase or upon the sale of covered shares, shareholders may choose a different tax identification method. Furthermore, if you purchase shares through a financial intermediary, please contact the intermediary to find out what default tax identification method they will use. We recommend that you consult your tax adviser to determine which tax identification methodology best suits your individual tax situation.
For More Information
This report is for the general information of the Funds’ shareholders and is not authorized for distribution to prospective investors unless preceded or accompanied by a current prospectus. You may obtain a copy of the prospectus, which contains information about the investment objectives, risks, charges, expenses, and share classes of each ICON Fund, by visiting www.iconfunds.com or by calling 1-800-764-0442. Please read the prospectus carefully before investing.
ICON Distributors, Inc., Distributor.
IMPORTANT NOTICE TO ALL SHAREHOLDERS OF THE ICON FUNDS:
The Trustees of the ICON Funds (the “Trust”) have amended the ICON Funds Master Trust Agreement dated September 19, 1996 as previously amended (the “MTA”), to expressly state that the Trustees have absolute power to reclassify shares of a Fund, or close a class of shares by merging or consolidating one class with another class of shares within a Fund, without seeking shareholder approval. The amendments state that this Trustee power is subject to the same limitation applicable to any Trustee amendment by providing that “the reclassification, merger or consolidation does not adversely affect the rights of the shareholders.” The amendments are focused on the classes of shares within a Fund, not the Fund itself. A copy of the Amended and Restated Master Trust Agreement (the “Amended and Restated MTA”), marked to show changes can be viewed at: www.iconfunds.com.
As provided in the MTA, the Trustees have authorized the offering of shares of seventeen Funds (sometimes referred to as series or Sub-Trusts). The Trustees have also authorized the offering of classes of shares of the Funds with an expense allocation plan. The expense allocation plan provides that the expenses of the respective share classes are: costs and charges that correspond to the differing distribution and service expenses of the sales and marketing channels used by investors to invest in the Funds; filing and/or registration fees charged by most states for offering or selling each class; and other class specific costs.
During the past year and a half, ICON management and the Trustees have discussed methods to reduce existing share class expenses and to increase Trust assets. ICON management proposed streamlining the existing class structure, which proposal called for a change in the number and type of share classes offered by certain of the ICON Funds. For example, certain ICON Diversified Funds have two similar classes: Class I & A. ICON management proposed merging Class I into Class A. Class A shares are strategically flexible because they can be marketed in both a load structure on a commission platform and a load-waived structure on no-load or NTF platforms. A similar issue exists with Class Z and S shares, where the primary difference between the two classes is Class S shares can be sold on platforms. ICON Management proposed a structure where, in general, each ICON Fund would have three share classes: Class A, C and S. Management proposed merging Class I with Class A, Class S with Class Z and renaming Class Z to Class S with all the attending rights of Class S. For information
| | |
| 98 | | IMPORTANT NOTICETO ALL SHAREHOLDERS |
concerning share class structure, see Explanation of Share Classes at: www.iconfunds.com. The list of currently authorized classes of shares is also set forth in Section 4.1 of the Amended and Restated MTA.
The Trustees and their representatives questioned and debated whether the Trustees had the power to reclassify shares of a Fund, or close a class of shares by merging or consolidating one class with another class of shares within a Fund, without shareholder approval. The MTA gave shareholders limited voting rights. Shareholders can vote on an amendment to the MTA only if Section 7.3 of the MTA requires it; and, Section 7.3 has not required shareholder approval to reclassify shares of a Fund, or close a class of shares by merging or consolidating one class with another class of shares within a Fund.
On the other hand, the Trustees have the implied power and authority to merge or consolidate classes, but no expressed power. Section 3.2 of the MTA gives the Trustees all the powers necessary to conduct the business of the Trust. The Trustees have had specific authority to establish classes of shares or divide the shares of any Sub-Trust. The Trustees decided to exercise their specific power and amend the MTA to state explicitly that that they can merge or consolidate share classes without shareholder approval. Section 7.3 of the MTA specifically provides the Trustees with the power to amend the MTA, without shareholder approval, whether or not related to the rights of shareholders, as long as the amendment does not adversely affect the rights of any shareholder and is not in contravention of applicable law.
Based on the above, the Trustees believe it was unnecessary to seek shareholder approval to amend the MTA to clarify the Trustees’ powers. Never the less, ICON management requested outside cost estimates for seeking shareholder approval. Costs estimates ranged between $450,000 and $550,000. The Trustees rejected spending shareholder assets to seek approval.
Critically, no shareholder would be adversely affected under the proposed amendment. The dollar value of a shareholder’s interest in the eliminated class will be the same as the dollar value of that shareholder’s interest in the substitute class. It is, for all intents and purposes, only a reclassification of shares. If a shareholder does not like the new share class for any reason, a shareholder can simply redeem his/her shares.
Please read the Amended and Restated MTA carefully. If you have any questions, please call us at 1-800-764-0442, or email the ICON Funds at: info@iconadvisers.com.
| | | | |
| IMPORTANT NOTICETO ALL SHAREHOLDERS | | | 99 | |
ICON FUNDS PRIVACY INFORMATION
| | |
| FACTS | | WHAT DOES ICON DO
WITH YOUR PERSONAL INFORMATION? |
| | |
| Why? | | Financial companies choose how they share your personal information. Federal law gives consumers the right to limit some but not all sharing. Federal law also requires us to tell you how we collect, share, and protect your personal information. Please read this notice carefully to understand what we do. |
| | |
| What? | | The types of personal information we collect and share depend on the product or service you have with us. This information can include: n Social Security number and account balances n income and transaction history n checking account information and wire transfer instructions When you are no longer our customer, we continue to share your information as described in this notice. |
| | |
| How? | | All financial companies need to share customers’ personal information to run their everyday business. In the section below, we list the reasons financial companies can share their customers’ personal information; the reasons ICON chooses to share; and whether you can limit this sharing. |
| | | | |
| Reasons we can share your personal information | | Does ICON share? | | Can you limit this sharing? |
For our everyday business purposes — such as to process your transactions, maintain your account(s), respond to court orders and legal investigations, or report to credit bureaus | | Yes | | No |
For our marketing purposes — to offer our products and services to you | | No | | We don’t share |
| For joint marketing with other financial companies | | No | | We don’t share |
For our affiliates’ everyday business purposes — information about your transactions and experiences | | No | | We don’t share |
For our affiliates’ everyday business purposes — information about your creditworthiness | | No | | We don’t share |
| For nonaffiliates to market to you | | No | | We don’t share |
| | |
| Questions? | | Call 1-800-764-0442 for the ICON Funds and 1-800-828-4881 for ICON Advisers, Inc. and ICON Distributors, Inc. |
| | |
| 100 | | ICON FUNDS PRIVACY INFORMATION |
| | |
| Who we are | | |
| Who is providing this notice? | | ICON Funds, ICON Advisers, Inc., and ICON Distributors, Inc. (collectively “ICON”) |
| What we do | | |
| How does ICON protect my personal information? | | To protect your personal information from unauthorized access and use, we use security measures that comply with federal law. These measures include computer safeguards and secured files and buildings. Contracts with our service providers require them to restrict access to your non-public personal information, and to maintain physical, electronic and procedural safeguards against unintended disclosure. |
| How does ICON collect my personal information? | | We collect your personal information, for example, when you n open an account or enter into an investment advisory contract n provide account information or give us your contact information n make a wire transfer We also collect your personal information from others, such as credit bureaus, affiliates, or other companies. |
| Why can’t I limit all sharing? | | Federal law gives you the right to limit only n sharing for affiliates’ everyday business purposes — information about your creditworthiness n affiliates from using your information to market to you n sharing for nonaffiliates to market to you State laws and individual companies may give you additional rights to limit sharing. |
| Definitions | | |
| Affiliates | | Companies related by common ownership or control. They can be financial and nonfinancial companies. n Our affiliates include financial companies such as ICON Funds, ICON Advisers, Inc., and ICON Distributors, Inc. |
| Nonaffiliates | | Companies not related by common ownership or control. They can be financial and nonfinancial companies. n Nonaffiliates we share with can include financial companies such as custodians, transfer agents, registered representatives, financial advisers and nonfinancial companies such as fulfillment, proxy voting, and class action service providers |
| Joint marketing | | A formal agreement between nonaffiliated financial companies that together market financial products or services to you. n ICON doesn’t jointly market |
| | | | |
| ICON FUNDS PRIVACY INFORMATION | | | 101 | |
For more information about the ICON Funds, contact us:
| | |
| |
| By Telephone | | 1-800-764-0442 |
| |
| By Mail | | ICON Funds P.O. Box 55452 Boston, MA 02205-8165 |
| |
| In Person | | ICON Funds 5299 DTC Boulevard, 12th Floor Greenwood Village, CO 80111 |
| |
| On the Internet | | www.iconfunds.com |
| |
| By E-Mail | | info@iconadvisers.com |

2011 ANNUAL REPORT
ICON INTERNATIONAL FUNDS
INVESTMENT UPDATE
ICON Asia-Pacific Region Fund
ICON Europe Fund
ICON International Equity Fund

1-800-764-0442 | www.iconfunds.com
AR-INTL-11 K21583

You can now sign up for electronic delivery of ICON Fund shareholder reports, including prospectuses, annual reports, semiannual reports and proxy statements.
When these materials are available, you will receive an email from ICON with instructions on how to view the documents. Statements, transaction confirmations and other documents that are not available online will continue to be sent to you by U.S. mail.
Visit ICON’s website at www.iconfunds.com to learn more and sign up.
You may change or cancel your participation in eDelivery by visiting www.iconfunds.com, or you can request a hard copy of any of the materials free of charge by calling ICON Funds at 1-800-764-0442.
1-800-764-0442 • www.iconfunds.com
TABLEOF CONTENTS
ABOUT THIS REPORT (UNAUDITED)
Historical Returns
All total returns mentioned in this Report account for the change in a Fund’s per-share price and the reinvestment of any dividends, capital gain distributions and adjustments for financial statement purposes. If your account is set up to receive Fund distributions in cash rather than to reinvest them, your actual return may differ from these figures. The Funds’ performance results do not reflect the deduction of taxes that a shareholder would pay on Fund distributions or on the redemption of Fund shares. The Adviser may have reimbursed certain fees or expenses of some of the Funds. If not for these reimbursements, performance would have been lower. Fund results shown, unless otherwise indicated, are at net asset value. If a sales charge (maximum 5.75%) had been deducted, results would have been lower.
Past performance does not guarantee future results. Investment return and principal value will fluctuate so that an investor’s shares, when redeemed, may be worth more or less than their original cost. Performance results represent past performance, and current performance may be higher or lower. Please call 1-800-764-0442 or visit www.iconfunds.com for performance results current to the most recent month-end.
Portfolio Data
This Report reflects ICON’s views, opinions and portfolio holdings as of September 30, 2011, the end of the reporting period. The information is not a complete analysis of every aspect of any sector, industry, security or the Funds.
Opinions and forecasts regarding industries, companies and/or themes, and portfolio composition and holdings are subject to change at any time based on market and other conditions, and should not be construed as a recommendation of any specific security, industry or sector. Each Fund’s holdings as of September 30, 2011 are included in each Fund’s Schedule of Investments.
According to ICON, value investing is an analytical approach to investing that employs various factors, including projecting earnings growth estimates, in an effort to determine whether securities are over- or underpriced relative to ICON’s estimates of their intrinsic value. Value investing involves risks and uncertainties and does not guarantee better performance or lower costs than other investment methodologies. ICON’s value-to-price ratio (“V/P”) is a ratio of intrinsic value, as calculated using ICON’s proprietary valuation
methodology, of a broad range of domestic and international securities within ICON’s system as compared to the current market price of those securities. The ICON system relies on the integrity of financial statements released to the market as part of our analysis.
This Report contains statements regarding industry or sector themes, new market themes, investment outlook, relative strength, value-to-price ratios, and investment team expectations, beliefs, goals and the like that are based on current expectations, recent individual stock performance relative to current market prices, estimates of company values and other information supplied to the market by the companies we follow. Words such as “expects,” “suggests,” “anticipates,” “targets,” “goals,” “value,” “intrinsic value,” “indicates,” “believes,” “considers,” “estimates,” variations of such words and similar expressions are intended to identify forward looking statements, which are not statements of historical fact. Forward looking statements are not guarantees of future performance and involve certain risks, uncertainties and assumptions that are difficult to assess. These risks and uncertainties are based on a number of important factors, including, among others: stock price fluctuations; the integrity and accuracy of historical and projected financial and other information supplied by companies to the public or assumptions based on such information supplied; interest rates; bond yields; future earnings growth rates; the risks noted in this report and other factors beyond the control of our investment team but used by the investment team to influence their assumptions. Therefore, actual outcome may differ materially from what is expressed in such forward looking statements.
There are risks associated with mutual fund investing, including the loss of principal. The likelihood of loss may be greater if you invest for a shorter period of time. There is no assurance that the investment process will consistently lead to successful results.
An investment in a region fund may involve greater risk and volatility than a diversified fund. An investment concentrated in sectors and industries may involve greater risk and volatility than a more diversified investment.
Investments in foreign securities may entail unique risks, including political, market, and currency risks. Financial statements of foreign companies are governed by different accounting, auditing, and financial standards than U.S. companies and may be less transparent and uniform than in the United States. Many corporate governance standards, which help ensure the integrity of public information in the United States, do not exist in foreign countries. In general, there may be less governmental supervision of foreign stock exchanges and securities brokers and issuers.
The prospectus and statement of additional information contain this and other information about the Funds and are available by visiting www.iconfunds.com or calling 1-800-764-0442. Please read the prospectus and statement of additional information carefully.
Comparative Indexes
The comparative indexes discussed in this Report are meant to provide a basis for judging a Fund’s performance against specific securities indexes. Each index shown accounts for both change in the security price and reinvestment of dividends and distributions (except as noted), but does not reflect the costs of managing a mutual fund. The total return figures for the Morgan Stanley Capital International (“MSCI”) indexes assume change in security prices and the deduction of local taxes. The Funds’ portfolios may significantly differ in holdings and composition from the indexes. Individuals cannot invest directly in an index.
| • | | The unmanaged MSCI All Country Pacific Index is a free float-adjusted market capitalization weighted index that is designed to measure the equity market performance of the developed and emerging markets in the Pacific Region (Australia, China, Hong Kong, Indonesia, Japan, Korea, Malaysia, New Zealand, Philippines, Singapore, Taiwan and Thailand). |
| • | | The unmanaged MSCI All Country Asia-Pacific Index is a free float-adjusted market capitalization weighted index that is designed to measure the equity market performance of the developed and emerging markets in the Pacific region (Australia, China, Hong Kong, India, Indonesia, Japan, Korea, Malaysia, New Zealand, Philippines, Singapore, Taiwan and Thailand). |
| • | | The unmanaged MSCI Europe Index is a free float-adjusted market capitalization weighted index that is designed to measure the equity market performance of the developed markets in Europe (Austria, Belgium, Denmark, Finland, France, Germany, Greece, Ireland, Italy, the Netherlands, Norway, Portugal, Spain, Sweden, Switzerland and the United Kingdom). |
| • | | The MSCI All Country World Index ex-United States (“ACWI ex-U.S.”) is a leading unmanaged benchmark of international stock performance. The capitalization-weighted index is representative of the performance of securities of companies located in developed and emerging markets outside of the United States. |
Index returns and statistical data included in this Report are provided by FactSet Research Systems.
Financial Intermediary
If you purchase the Fund through a broker-dealer or other financial intermediary (such as a bank), the Fund and its related companies may pay the intermediary for the sale of Fund shares and related services. These payments may influence the broker-dealer or other intermediary and your salesperson to recommend the Fund over another investment. Ask your salesperson or visit your financial intermediary’s website for more information.
MESSAGE FROM ICON FUNDS
Dear Shareholder,
As valuation investors, we look for quality companies priced below our estimate of intrinsic value. We will buy stocks we believe are “on sale” when investors get distracted by a particular news story or headline and worry about its potential impact on the economy in general and the markets in particular. When this happens, stocks are temporarily priced based on worst-case scenario projections, not on their fundamentals. As concerns subside, prices often move up toward the stock’s intrinsic value and may even exceed ICON’s estimate of value when excessive worry is replaced with excessive optimism. Implementing our valuation strategy does not require an information edge; it simply requires discipline. Our system needs discipline to filter out news headlines, concentrate on value, and, frequently, buy when most are selling and sell when most are buying. ICON’s discipline requires also the willingness to take strong industry and sector tilts. We see industries and sectors becoming overpriced and underpriced through cycles as investors change their views of the economy and migrate around the universe of stocks.
In spite of a volatile 12 months, we believe the stock market is in a multi-year recovery from the financial crisis and recession of 2008-2009. Stocks were generally priced far below our estimate of their fair value when the market hit its recent low in March 2009, but their ascent toward fair value has been choppy and severely interrupted at least twice: first in the summer of 2010 and then again during the summer of 2011. Both times, sharp drops in stock prices were precipitated by concerns over the European sovereign debt crisis. Investors were especially wary of the situation in Greece, but also, to a lesser extent, investors worried about the economies of Ireland, Spain and Italy. We thought these concerns were excessive in 2010 and we continue to believe the concern is unwarranted. We expect fears to subside and, when that happens, we believe stocks will resume their recovery path.
The interruptions experienced during the summers of 2010 and 2011 have been frustrating for value investors like ICON, as we see a very different world than many other investors. Where others see a negative macroeconomic outlook, we see positive earnings and solid company fundamentals. When 2011 second quarter earnings were announced, companies in the S&P 500 Index reported earnings that were, on average, 16.24% higher than a year earlier. In fact, 75% of those companies reported earnings that exceeded analysts’ estimates by 4.67% on average. This growth in earnings is more robust than the earnings we saw coming out of any of the previous four recessions (that is, 1974, 1982, 1992 and 2001 recessions).
| | |
| 6 | | MESSAGE FROM ICON FUNDS |
Strong earnings and a low interest rate environment contribute to what we believe are attractive valuations, but skittish investors, concerned with debt problems in Europe, continue to shy away from equities.
We have seen investors turn their backs on solid fundamentals many times before. Historically, however, investors have come to gradually embrace these fundamentals and stock prices generally rise again to meet intrinsic value. In 1990, 1998 and 2010, for example, the market experienced a decline similar in magnitude and duration to that seen during the summer of 2011. Each market bottom led to anxiety over a worsening recession, but, months later, these fears proved unfounded. Stock prices rebounded and resumed their prior upward path. As we head into a new fiscal year, we are anticipating a similar rebound. Having two major market interruptions in two consecutive summers is unusual, unsettling and has admittedly made it difficult for investors to stay the course to recovery. The volatile environment also presented problems for money managers like ICON who struggled with abrupt and extreme industry and sector theme reversals.
As fiscal year 2011 comes to an end, we still believe cyclical, economically sensitive industries are the long term leaders for this multi-year recovery. Unfortunately, these same industries can be subject to dramatic market swings when investors, worried about the economy, panic and jump out of the market. We believe the old Wall Street adage still applies: “Stocks climb a wall of worry.” The climb back from the recession and financial crisis of 2008 and 2009 has been and will continue to be riddled with worry.
As always, we remain focused on value and company fundamentals as we try to filter out the conjecture and emotions that typically contribute to market volatility. Experienced sailors will tell someone who is seasick: “Don’t look at the waves; look at the horizon.” Lately, it seems, most investors have been focused on the waves. At ICON, we like to focus on a horizon that includes quality companies, with growing earnings, priced far below our estimate of their fair value. We will continue to stay this course.
Yours truly,

Craig T. Callahan, DBA
Chairman of the Board of Trustees and President of the Adviser
| | | | |
| MESSAGE FROM ICON FUNDS | | | 7 | |
| | | | |
MANAGEMENT OVERVIEW ICON ASIA-PACIFIC REGION FUND | | Class S Class C Class A | | ICARX ICPCX IPCAX |
| Q. | How did the Fund perform relative to its benchmark? |
| A. | The ICON Asia-Pacific Region Fund returned -18.06% for Class S shares for the fiscal year ended September 30, 2011, underperforming its benchmark, the MSCI All Country Asia-Pacific Index, which returned -7.90% and the MSCI All Country Pacific Index which returned -6.93%.1 Class A shares of the Fund returned -18.22% (and -22.90% with maximum sales charge) during the same period while Class C shares returned -18.82% (and -19.82% with maximum sales charge). Total returns for other periods as of September 30, 2011, appear in the subsequent pages of this Fund’s Management Overview. |
| 1 | The Fund changed its benchmark to the MSCI All Country Asia-Pacific Index on January 24, 2011 because the Fund invests in India, which is included in the new benchmark. |
| Q. | What primary factors were behind the Fund’s relative performance? |
| A. | During the fiscal year 2011, investors experienced two investment environments across global markets. First, investors saw a recovery-based rally that dominated the majority of the period. This rally was followed by a sudden and significant fear-based flight to perceived safety. The Asia-Pacific region was no exception. |
The majority of fiscal year 2011, roughly through the end of July 2011, was marked by a continuation of the recovery-based rally that began in early September 2010. The Asia-Pacific region’s performance during this time was dominated by cyclical sectors and emerging markets, areas where the Fund was overweight.
However, going into August 2011, fears over future global growth prospects and the European sovereign debt crisis reemerged and dominated the final two months of the period. As in previous fear-based market moves since 2008, volatility spiked as investors worried about global demand and a return to the frozen credit environment that followed the collapse of Lehman Brothers. As a result, the cyclical, economically-sensitive sectors and emerging market countries that had led through July 2011 were hit hardest as investors fled to perceived safety.
| Q. | How did the Fund’s composition affect performance? |
| A. | In general, the Fund’s overweighting in cyclical, economically sensitive sectors and emerging market countries - both market segments expected |
| | to benefit the most as the global economy recovers - contributed most to the Fund’s underperformance. |
In terms of sector-level moves during the fiscal year 2011, the Fund reduced exposure to the Information Technology, Utilities, and Health Care sectors while increasing weightings in the Materials, Energy, and Financial sectors. The primary drivers of negative performance relative to the benchmark were overweight positions in the Materials and Consumer Discretionary sectors along with an underweight position in the Consumer Staples sector.
At the country-level, the most notable increases during the fiscal year were to South Korea, Singapore, Australia, Thailand, and Indonesia. Positions in Japan, China, Taiwan, Hong Kong, and India were reduced during the period. The primary drivers of negative performance relative to the benchmark came from the Fund’s overweight positions in China and India and underweight positions in Japan. Further, because of investors’ sudden and significant shift out of emerging markets, the Fund’s emerging market currency exposure contributed to the Fund’s underperformance.
As a multi-cap manager, we are not limited by restrictions on market capitalization. Similar to fiscal year 2010, our valuation metrics during the period led us away from mid- and small-cap companies and towards large-cap companies. Despite this shift, the Fund remains significantly underweight in large-cap stocks, the dominant market cap allocation of the benchmark, and significantly overweight in mid- and small-cap stocks relative to the benchmark.
| Q. | What is your investment outlook for the Asia-Pacific equity market? |
| A. | As investor fears have spiked recently, equity markets have declined virtually in unison. Whether investors are looking at developed markets vs. emerging markets, country vs. country or region vs. region, there has been virtually no safe place to hide since late July 2011. We view the decline since the end of July 2011 as a prime example of investor overreaction, a situation that can open up value opportunities. |
When the dust starts to settle from gut-wrenching periods like this, we believe investors may regain their focus and start looking for bargains. In the past, we have seen investors drawn to the growth potential of emerging Asia-Pacific countries along with their relatively low levels of debt. In our experience, these markets have tended to recover at a faster clip relative to their developed counterparts following periods of high volatility and market setbacks.
With a V/P of 1.35 for the Asia-Pacific region as a whole, we see opportunity in the region. As investors regain their focus, we expect the cyclical, economically-sensitive sectors that have been hurt the most recently to regain the leadership position they held for most of the fiscal year 2011. Specifically, we see value in the Materials, Industrials, Energy, and Consumer Discretionary sectors. Also, our system sees significant value in the emerging market countries of the Asia-Pacific region relative to their developed counterparts. In particular, we see great value in Korea, China, Thailand and Indonesia - the Fund maintains an overweight position in each of these countries and in emerging markets as a whole. We believe it is nearly impossible to accurately time bottoms and, further, that rallies do not offer invitations. Given this philosophy, and the valuations we see in the market at fiscal year-end, we remain heavily invested, ready to reallocate and adapt as market conditions dictate.
ICON Asia-Pacific Region Fund
Country Composition
September 30, 2011
| | | | |
South Korea | | | 22.0% | |
Japan | | | 19.2% | |
Australia | | | 12.2% | |
China | | | 11.2% | |
Singapore | | | 8.1% | |
India | | | 7.2% | |
Thailand | | | 5.9% | |
Hong Kong | | | 5.3% | |
Indonesia | | | 3.8% | |
Malaysia | | | 2.6% | |
| | | | |
| | | 97.5% | |
| | | | |
Percentages are based upon common stocks as a percentage of net assets.
ICON Asia-Pacific Region Fund
Sector Composition
September 30, 2011
| | | | |
Financial | | | 25.9% | |
Materials | | | 19.2% | |
Industrials | | | 16.9% | |
Consumer Discretionary | | | 12.9% | |
Energy | | | 9.3% | |
Information Technology | | | 6.0% | |
Consumer Staples | | | 3.6% | |
Telecommunication & Utilities | | | 2.9% | |
Health Care | | | 0.8% | |
| | | | |
| | | 97.5% | |
| | | | |
Percentages are based upon common stocks as a percentage of net assets.
ICON Asia-Pacific Region Fund
Industry Composition
September 30, 2011
| | | | |
Diversified Banks | | | 16.7% | |
Automobile Manufacturers | | | 6.9% | |
Trading Companies & Distributors | | | 5.2% | |
Diversified Metals & Mining | | | 5.2% | |
Property & Casualty Insurance | | | 3.9% | |
Integrated Oil & Gas | | | 3.8% | |
Industrial Conglomerates | | | 3.5% | |
Commodity Chemicals | | | 3.4% | |
Real Estate Development | | | 3.2% | |
Auto Parts & Equipment | | | 3.2% | |
Construction Materials | | | 2.8% | |
Diversified Chemicals | | | 2.6% | |
Steel | | | 2.6% | |
Electronic Equipment & Instruments | | | 2.1% | |
Industrial Machinery | | | 2.0% | |
Internet Software & Services | | | 1.9% | |
Oil & Gas Refining & Marketing | | | 1.9% | |
Construction & Engineering | | | 1.9% | |
| | | | |
Wireless Telecommunication Services | | | 1.7% | |
Tires & Rubber | | | 1.6% | |
Food Distributors | | | 1.5% | |
Oil & Gas Equipment & Services | | | 1.3% | |
Specialty Chemicals | | | 1.3% | |
IT Consulting & Other Services | | | 1.2% | |
Electrical Components & Equipment | | | 1.2% | |
Oil & Gas Exploration & Production | | | 1.1% | |
Coal & Consumable Fuels | | | 1.1% | |
Agricultural Products | | | 1.1% | |
Other Industries (each less than 1%) | | | 11.6% | |
| | | | |
| | | 97.5% | |
| | | | |
Percentages are based upon common stocks as a percentage of net assets.
ICON Asia-Pacific Region Fund
Average Annual Total Return
as of September 30, 2011
| | | | | | | | | | | | | | | | | | | | | | | | | | | | |
| | | Inception
Date | | | 1 Year | | | 5 Years | | | 10 Years | | | Since
Inception | | | Gross
Expense
Ratio* | | | Net
Expense
Ratio* | |
ICON Asia-Pacific Region Fund - Class S | | | 2/25/97 | | | | -18.06% | | | | -1.47% | | | | 6.15% | | | | 1.47% | | | | 1.63% | | | | 1.63% | |
MSCI All Country Pacific Index | | | | | | | -6.93% | | | | -0.16% | | | | 7.49% | | | | 1.88% | | | | N/A | | | | N/A | |
MSCI All Country Asia-Pacific Index | | | | | | | -7.90% | | | | -0.01% | | | | 7.74% | | | | 2.06% | | | | N/A | | | | N/A | |
ICON Asia-Pacific Region Fund - Class C | | | 1/25/08 | | | | -18.82% | | | | N/A | | | | N/A | | | | -7.97% | | | | 9.04% | | | | 2.57% | |
MSCI All Country Pacific Index | | | | | | | -6.93% | | | | N/A | | | | N/A | | | | -3.78% | | | | N/A | | | | N/A | |
MSCI All Country Asia-Pacific Index | | | | | | | -7.90% | | | | N/A | | | | N/A | | | | -4.04% | | | | N/A | | | | N/A | |
ICON Asia-Pacific Region Fund - Class A | | | 5/31/06 | | | | -18.22% | | | | -1.74% | | | | N/A | | | | -2.13% | | | | 5.17% | | | | 1.82% | |
ICON Asia-Pacific Region Fund - Class A (including maximum sales charge of 5.75%) | | | 5/31/06 | | | | -22.90% | | | | -2.89% | | | | N/A | | | | -3.21% | | | | 5.17% | | | | 1.82% | |
MSCI All Country Pacific Index | | | | | | | -6.93% | | | | -0.16% | | | | N/A | | | | 0.01% | | | | N/A | | | | N/A | |
MSCI All Country Asia-Pacific Index | | | | | | | -7.90% | | | | -0.01% | | | | N/A | | | | 0.24% | | | | N/A | | | | N/A | |
Past performance is not a guarantee of future results. Information about these performance results and the comparative indexes can be found in the About This Report section. The Adviser has agreed to limit certain Fund expenses on Class C and Class A shares; without these limitations, returns would have been lower. The limitation provisions may be terminated in the future.
| * | Please see the most recent prospectus for details. |
Class C total returns exclude applicable sales charges. If sales charges were included returns would be lower.
ICON Asia-Pacific Region Fund
Value of a $10,000 Investment
through September 30, 2011
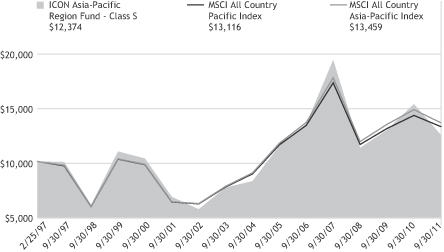
Past performance is not a guarantee of future results. The above graph compares a $10,000 investment made in the Fund’s Class S shares on the Class’ inception date of 2/25/97 to a $10,000 investment made in an unmanaged securities index on that date. The Fund’s performance in this chart and the performance table assumes the reinvestment of dividends, capital gain distributions and tax return of capital, but does not reflect the deduction of taxes that a shareholder would pay on Fund distributions or on the redemption of Fund shares.
ICON ASIA-PACIFIC REGION FUND
SCHEDULEOF INVESTMENTS
SEPTEMBER 30, 2011
| | | | | | | | |
| Shares or Principal Amount | | Value | |
| | | | | | | | |
| | Common Stocks (97.5%) | |
| | 648,000 | | | Agricultural Bank of China, Ltd., Class H | | $ | 211,583 | |
| | 20,200 | | | Aisin Seiki Co., Ltd.(a) | | | 672,568 | |
| | 364,000 | | | Alliance Financial Group Bhd. | | | 373,077 | |
| | 62,100 | | | Australia & New Zealand Banking Group, Ltd. | | | 1,152,650 | |
| | 397,000 | | | Axiata Group Bhd.† | | | 567,811 | |
| | 5,600 | | | Baidu, Inc., ADR†** | | | 598,696 | |
| | 620,000 | | | Bank Danamon Indonesia Tbk PT | | | 321,314 | |
| | 1,144,000 | | | Bank of Ayudhya PCL | | | 730,042 | |
| | 1,083,500 | | | Bank of China, Ltd., Class H | | | 335,041 | |
| | 29,300 | | | Bank of India | | | 187,076 | |
| | 362,000 | | | Bank Rakyat Indonesia Persero Tbk PT | | | 237,026 | |
| | 833,000 | | | BBMG Corp. | | | 614,378 | |
| | 42,700 | | | BHP Billiton, Ltd. | | | 1,413,815 | |
| | 40,700 | | | BS Financial Group, Inc.† | | | 443,759 | |
| | 18,000 | | | Caltex Australia, Ltd. | | | 185,518 | |
| | 650,000 | | | Chaoda Modern Agriculture Holdings, Ltd.*** | | | 91,815 | |
| | 32,000 | | | Cheung Kong Holdings, Ltd. | | | 347,913 | |
| | 1,434,870 | | | China Construction Bank Corp., Class H | | | 867,861 | |
| | 221,000 | | | China Lilang Ltd. | | | 215,755 | |
| | 466,000 | | | China National Materials Co., Ltd., Class H | | | 168,720 | |
| | 761,000 | | | China Petroleum & Chemical Corp., Class H | | | 731,861 | |
| | | | | | | | |
| Shares or Principal Amount | | Value | |
| | | | | | | | |
| | 496,000 | | | China Resources Cement Holdings, Ltd. | | $ | 325,315 | |
| | 120,000 | | | China Shineway Pharmaceutical Group, Ltd. | | | 146,818 | |
| | 526,909 | | | China Vanke Co., Ltd. | | | 452,713 | |
| | 177,000 | | | China Yurun Food Group, Ltd. | | | 188,776 | |
| | 117,800 | | | Dah Sing Financial Group, Ltd. | | | 325,586 | |
| | 78,000 | | | DBS Group Holdings, Ltd. | | | 699,430 | |
| | 10,600 | | | Doosan Corp. | | | 1,196,350 | |
| | 8,800 | | | Doosan Heavy Industries and Construction Co., Ltd. | | | 410,648 | |
| | 45,200 | | | Doosan Infracore Co., Ltd.† | | | 680,302 | |
| | 2,105,000 | | | Ezion Holdings, Ltd. | | | 760,163 | |
| | 333,000 | | | Gamuda Bhd. | | | 297,701 | |
| | 45,000 | | | Glenmark Pharmaceuticals, Ltd. | | | 295,745 | |
| | 134,000 | | | Goodpack, Ltd. | | | 154,657 | |
| | 356,000 | | | Guangzhou Automobile Group Co., Ltd., Class H | | | 342,370 | |
| | 25,700 | | | Hana Financial Group, Inc. | | | 747,266 | |
| | 11,850 | | | Hankook Tire Co., Ltd. | | | 398,840 | |
| | 14,200 | | | Hanwha Corp. | | | 396,817 | |
| | 45,200 | | | HCL Technologies, Ltd. | | | 373,452 | |
| | 238,000 | | | Hitachi, Ltd.(a) | | | 1,181,447 | |
| | 24,200 | | | Honda Motor Co., Ltd.(a) | | | 708,936 | |
| | 138,500 | | | Housing Development & Infrastructure, Ltd.† | | | 274,460 | |
| | |
| 14 | | SCHEDULEOF INVESTMENTS |
| | | | | | | | |
| Shares or Principal Amount | | Value | |
| | | | | | | | |
| | 14,800 | | | Hyosung Corp. | | $ | 681,652 | |
| | 2,790 | | | Hyundai Mobis | | | 790,230 | |
| | 7,500 | | | Hyundai Motor Co. | | | 1,311,133 | |
| | 1,698,000 | | | Indika Energy Tbk PT | | | 428,993 | |
| | 425,000 | | | Indocement Tunggal Prakarsa Tbk PT | | | 669,229 | |
| | 288,000 | | | Insurance Australia Group, Ltd. | | | 833,709 | |
| | 132,000 | | | ITOCHU Corp.(a) | | | 1,261,369 | |
| | 14,000 | | | JSR Corp.(a) | | | 240,880 | |
| | 65,000 | | | Kasikornbank PCL | | | 242,394 | |
| | 99,000 | | | Kingboard Chemical Holdings, Ltd. | | | 266,669 | |
| | 13,500 | | | Kintetsu World Express, Inc. | | | 386,113 | |
| | 7,400 | | | Korea Gas Corp. | | | 192,229 | |
| | 41,000 | | | Korea Life Insurance Co., Ltd. | | | 191,950 | |
| | 22,500 | | | Kuraray Co., Ltd. | | | 306,857 | |
| | 1,131,000 | | | KWG Property Holding, Ltd. | | | 417,882 | |
| | 11,000 | | | LG Display Co., Ltd. | | | 179,403 | |
| | 7,730 | | | LS Corp. | | | 476,451 | |
| | 85,407 | | | Meritz Fire & Marine Insurance Co., Ltd. | | | 757,502 | |
| | 137,000 | | | Minebea Co., Ltd.(a) | | | 459,925 | |
| | 80,000 | | | Mitsubishi Gas Chemical Co., Inc. | | | 491,120 | |
| | 117,000 | | | Mitsubishi Materials Corp. | | | 284,899 | |
| | 66,400 | | | Mitsui & Co., Ltd.(a) | | | 961,822 | |
| | 222,000 | | | MobileOne, Ltd. | | | 414,490 | |
| | 52,400 | | | National Australia Bank, Ltd. | | | 1,113,046 | |
| | 10,800 | | | Newcrest Mining, Ltd. | | | 355,980 | |
| | 39,000 | | | NHK Spring Co., Ltd. | | | 344,597 | |
| | 2,700 | | | NHN Corp.† | | | 514,395 | |
| | 12,300 | | | Nitto Denko Corp.(a) | | | 484,086 | |
| | 771,000 | | | Noble Group, Ltd.(a) | | | 769,200 | |
| | | | | | | | |
| Shares or Principal Amount | | Value | |
| | | | | | | | |
| | 2,375 | | | OCI Co., Ltd. | | $ | 405,502 | |
| | 486,000 | | | Olam International Ltd. | | | 828,172 | |
| | 301,000 | | | OneSteel, Ltd. | | | 352,753 | |
| | 11,000 | | | Orica, Ltd. | | | 246,864 | |
| | 4,800 | | | Otsuka Corp. | | | 330,867 | |
| | 119,000 | | | Oversea-Chinese Banking Corp., Ltd. | | | 733,420 | |
| | 590,000 | | | PetroChina Co., Ltd., Class H | | | 713,186 | |
| | 32,000 | | | Ping An Insurance Group Co. | | | 178,112 | |
| | 2,405 | | | POSCO | | | 741,135 | |
| | 734,000 | | | Pruksa Real Estate PCL | | | 334,881 | |
| | 97,000 | | | PTT Chemical PCL | | | 306,425 | |
| | 146,000 | | | PTT Exploration & Production PCL | | | 651,562 | |
| | 85,400 | | | PTT PCL | | | 709,579 | |
| | 22,000 | | | Reliance Industries, Ltd. | | | 359,699 | |
| | 10,600 | | | Rio Tinto, Ltd. | | | 620,879 | |
| | 140,000 | | | Sakari Resources, Ltd.(a) | | | 208,807 | |
| | 68,000 | | | Seek, Ltd.(a) | | | 344,964 | |
| | 54,500 | | | Sesa Goa, Ltd. | | | 220,907 | |
| | 1,350,000 | | | Shenzhen Expressway Co., Ltd., Class H | | | 483,463 | |
| | 17,400 | | | Shinhan Financial Group Co., Ltd. | | | 606,679 | |
| | 33,000 | | | Shriram Transport Finance Co., Ltd. | | | 408,326 | |
| | 100,000 | | | Sime Darby Bhd. | | | 262,714 | |
| | 132,000 | | | Singapore Technologies Engineering, Ltd. | | | 280,988 | |
| | 1,295,000 | | | Sino Thai Engineering & Construction PCL | | | 380,511 | |
| | 4,700 | | | SK Holdings Co., Ltd. | | | 520,486 | |
| | 4,790 | | | SK Innovation Co., Ltd. | | | 560,436 | |
| | 293,000 | | | Sterlite Industries India, Ltd. | | | 670,614 | |
| | | | |
| SCHEDULEOF INVESTMENTS | | | 15 | |
| | | | | | | | |
| Shares or Principal Amount | | Value | |
| | | | | | | | |
| | 155,000 | | | Sumitomo Chemical Co., Ltd.(a) | | $ | 598,073 | |
| | 40,000 | | | Sumitomo Rubber Industries, Ltd. | | | 511,457 | |
| | 142,500 | | | Tata Motors, Ltd. | | | 447,997 | |
| | 20,500 | | | Tata Steel, Ltd. | | | 172,643 | |
| | 741,000 | | | Techtronic Industries Co. | | | 497,243 | |
| | 587,000 | | | Telekomunikasi Indonesia Tbk PT | | | 500,638 | |
| | 24,300 | | | Tokio Marine Holdings, Inc. | | | 615,834 | |
| | 32,600 | | | Toyota Motor Corp. | | | 1,117,501 | |
| | 58,400 | | | Union Bank of India | | | 288,452 | |
| | 143,000 | | | United Phosphorus, Ltd. | | | 397,868 | |
| | 134,000 | | | Wilmar International, Ltd.(a) | | | 533,222 | |
| | 16,000 | | | Woolworths, Ltd. | | | 382,345 | |
| | 46,400 | | | Woori Finance Holdings Co., Ltd. | | | 393,443 | |
| | 110,000 | | | Zhuzhou CSR Times Electric Co., Ltd. | | | 180,293 | |
| | | | | | | | |
| Total Common Stocks
(Cost $67,505,105) | | | 55,753,216 | |
| | | | | | | | |
| Shares or Principal Amount | | Value | |
| | Collateral for Securities on Loan (11.9%) | |
| | 6,792,269 | | | State Street Navigator Prime Portfolio | | $ | 6,792,269 | |
| | | | | | | | |
| Total Collateral for
Securities on Loan
(Cost $6,792,269) | | | 6,792,269 | |
| | Short-Term Investment (1.7%) | |
| $ | 1,009,895 | | | State Street Euro Dollar Time Deposit (USD), 0.01%, 10/03/11 | | | 1,009,895 | |
| | | | | | | | |
| Total Short-Term Investments
(Cost $1,009,895) | | | 1,009,895 | |
| Total Investments 111.1%*
(Cost $75,307,269) | | | 63,555,380 | |
| Liabilities Less Other Assets
(11.1)% | | | (6,357,653 | ) |
| | | | | | | | |
| | Net Assets 100.0% | | $ | 57,197,727 | |
| | | | | | | | |
The accompanying notes are an integral part of the financial statements.
| † | Non-income producing security. |
| * | The value of foreign securities fair valued (Note 2) as of September 30, 2011 was 96.27% of net assets. |
| ** | This security is considered a Level 1 security. Please see Note 2 for further details. |
| *** | This security is considered a Level 3 security. Please see Note 2 for further details. |
| (a) | All or a portion of the security was on loan as of September 30, 2011. |
| ADR | American Depository Receipt |
| | |
| 16 | | SCHEDULEOF INVESTMENTS |
| | | | |
MANAGEMENT OVERVIEW ICON EUROPE FUND | | Class S Class C Class A | | ICSEX ICUCX IERAX |
| Q. | How did the Fund perform relative to its benchmark? |
| A. | The ICON Europe Fund returned -19.90% for Class S shares for the fiscal year ended September 30, 2011, underperforming its benchmark, the MSCI Europe Index, which returned -11.26%. Class A shares of the Fund returned -20.04% (and -24.63% with maximum sales charge) during the same period while Class C shares returned -20.73% (and -21.73% with maximum sales charge). Total returns for other periods as of September 30, 2011 appear in the subsequent pages of this Fund’s Management Overview. |
| Q. | What primary factors were behind the Fund’s relative performance? |
| A. | Europe spent much of the year dealing with the sovereign debt issues of many Eurozone member countries. Fraught with high debt to GDP levels, large budget deficits, and slow economic growth, countries like Greece, Portugal, Italy, and Spain are at the center of the crisis and are dependent on additional bailouts from stronger neighbor countries such as Germany and France. As the sovereign debt crisis developed, concerns over a regional and global contagion began, increasing investors’ overall risk aversion. While Europe participated in the global recovery over the past year, the pace of its economic expansion was rather tepid and lackluster. As the fiscal year 2011 came to an end, growth slowed and central banks came together in an effort to solve the debt crisis amidst the backdrop of slowing global demand. |
As the fiscal year 2011 began, the European region was priced at 27% below our calculation of intrinsic value. The region’s equity markets continued the upward advances which began in May 2010, and ultimately peaked at the end of April 2011. Just as Ireland’s bailout issues seemed to be resolved towards the end of 2010, Portugal joined Greece in the fray as government bond rating downgrades preceded Portugal’s formal request for a bailout. Late spring through early summer of 2011 brought a generally choppy, sideways market as signs started to emerge that global growth would be moderate. Further adding to concerns about global growth, inflation was advancing at a faster than desired pace, causing the European Central Bank to raise its main refinancing rate in both April and July 2011.
August and September 2011 brought massive global equity selloffs as risk aversion and volatility spiked. Rumors swirled and the overall health of
the single currency European bloc was brought into question as warnings of the sovereign debt crisis spread beyond the periphery of the Eurozone. Spanish and Italian bond yields rose sharply, while those of Germany decreased amidst a global flight to perceived safety. With global markets reeling, Germany approved measures which would expand the European Financial Stability Facility, yet markets remained skeptical of the plan’s overall effectiveness in bringing the crisis to a close. Amidst this volatility, company earnings remained generally healthy. Further, while corporate credit spreads have risen, it has not led to a dramatic deterioration of our intrinsic value calculations for the region’s underlying equities. As such, we ended this period with stocks trading at a 31% discount to our estimate of intrinsic value, representing the best bargains of all regions across the globe.
Both the Euro and the Pound rallied at the beginning of the fiscal year 2011, but during the last two months of the period the U.S. dollar strengthened relative to most of the major European currencies as investors fled to perceived safe havens amidst the region’s economic and fiscal difficulties.
| Q. | How did the Fund’s composition affect performance? |
| A. | The Fund’s positions in economically sensitive sectors such as Industrials and Materials contributed positively through April 2011, yet detracted more dramatically as the selloff continued into the end of the fiscal year 2011. Defensive based sectors experienced more muted losses. The Fund’s underweight position in the Financial sector (specifically banks) contributed positively to performance relative to the benchmark as the Financial sector saw the deepest losses. The Fund’s exposure to the Telecommunication & Utilities sector also contributed to portfolio returns over the fiscal year 2011. |
As fears of global contagion spread through the summer of 2011, the Fund’s overweight position in the Industrials sector proved to be the biggest contributor to the Fund’s underperformance relative to the benchmark as economically sensitive industries such as industrial machinery and construction & engineering suffered losses. The Fund’s underweight position in the defensive Consumer Staples sector also contributed to underperformance relative to the benchmark as industries such as tobacco and packaged foods & meats posted positive net benchmark returns over the fiscal year 2011. Additionally, underweight exposure to the pharmaceutical industry proved to be detrimental to the Fund as Health Care stocks posted gains over the period.
Regarding country composition, an overweight position in Norway, and underweight positions in embattled countries of Italy, Greece, and Spain contributed positively to performance relative to the benchmark. The Fund’s underweight position in the United Kingdom and overweight position in France detracted from relative performance.
| Q. | What is your investment outlook for the European equity market? |
| A. | Our analysis suggests there is still value in the European region in spite of the palpable fear that has gripped the global markets. We estimate that, on average, fair value for European equities is 45% higher than where prices are currently trading. According to our calculations, Europe has the best values when compared to all other regions we track globally. We believe the economically sensitive sectors will eventually emerge again as future leaders as their stock prices have been overly punished given the underlying company fundamentals. Sectors such as Materials and Industrials are showing some of the best bargains and we remain tilted towards these sectors. Defensive sectors such as Consumer Staples and Telecommunication & Utilities are showing relative strength under our system but lack value relative to the broad market. |
We believe it is nearly impossible to accurately time market bottoms and that rallies do not issue invitations. Guided by our disciplined, systematic and non-emotional approach to investing, we see opportunities amidst the turbulence and volatility. We continue to seek out industries that our system identifies as trading at a discount to fair value and showing relative strength in the markets. Our valuations at the end of the fiscal year dictate that we remain nearly fully invested, but as market conditions dictate we will adjust accordingly.
ICON Europe Fund
Country Composition
September 30, 2011
| | | | |
Germany | | | 33.2% | |
France | | | 17.9% | |
Switzerland | | | 11.4% | |
United Kingdom | | | 10.5% | |
Norway | | | 6.7% | |
Netherlands | | | 4.3% | |
Finland | | | 2.6% | |
Russia | | | 2.5% | |
Austria | | | 1.7% | |
Sweden | | | 1.6% | |
Denmark | | | 1.6% | |
Luxembourg | | | 1.4% | |
Bermuda | | | 1.1% | |
Mauritius | | | 0.8% | |
| | | | |
| | | 97.3% | |
| | | | |
Percentages are based upon common and preferred stocks as a percentage of net assets.
ICON Europe Fund
Sector Composition
September 30, 2011
| | | | |
Industrials | | | 24.8% | |
Materials | | | 19.6% | |
Energy | | | 19.4% | |
Financial | | | 10.4% | |
Consumer Discretionary | | | 6.8% | |
Consumer Staples | | | 5.7% | |
Information Technology | | | 4.5% | |
Telecommunication & Utilities | | | 3.1% | |
Health Care | | | 3.0% | |
| | | | |
| | | 97.3% | |
| | | | |
Percentages are based upon common and preferred stocks as a percentage of net assets.
ICON Europe Fund
Industry Composition
September 30, 2011
| | | | |
Integrated Oil & Gas | | | 15.6% | |
Industrial Machinery | | | 7.7% | |
Industrial Conglomerates | | | 5.7% | |
Diversified Metals & Mining | | | 4.7% | |
Application Software | | | 4.5% | |
Multi-line Insurance | | | 4.5% | |
Packaged Foods & Meats | | | 3.8% | |
Life & Health Insurance | | | 3.8% | |
Specialty Chemicals | | | 3.2% | |
Integrated Telecommunication Services | | | 3.1% | |
Pharmaceuticals | | | 3.0% | |
Fertilizers & Agricultural Chemicals | | | 2.9% | |
Industrial Gases | | | 2.4% | |
Tires & Rubber | | | 2.3% | |
Diversified Chemicals | | | 2.3% | |
Construction & Engineering | | | 2.1% | |
Trading Companies & Distributors | | | 2.1% | |
| | | | |
Oil & Gas Drilling | | | 1.9% | |
Air Freight & Logistics | | | 1.9% | |
Hypermarkets & Super Centers | | | 1.8% | |
Automobile Manufacturers | | | 1.7% | |
Building Products | | | 1.6% | |
Steel | | | 1.3% | |
Trucking | | | 1.2% | |
Catalog Retail | | | 1.2% | |
Oil & Gas Refining & Marketing | | | 1.1% | |
Diversified Banks | | | 1.1% | |
Heavy Electrical Equipment | | | 1.0% | |
Construction & Farm Machinery & Heavy Trucks | | | 1.0% | |
Other Industries (each less than 1%) | | | 6.8% | |
| | | | |
| | | 97.3% | |
| | | | |
Percentages are based upon common and preferred stocks as a percentage of net assets.
ICON Europe Fund
Average Annual Total Return
as of September 30, 2011
| | | | | | | | | | | | | | | | | | | | | | | | | | | | |
| | | Inception
Date | | | 1 Year | | | 5 Years | | | 10 Years | | | Since
Inception | | | Gross
Expense
Ratio* | | | Net
Expense
Ratio* | |
ICON Europe Fund - Class S | | | 2/20/97 | | | | -19.90% | | | | -7.72% | | | | 5.10% | | | | 4.01% | | | | 1.58% | | | | 1.58% | |
MSCI Europe Index | | | | | | | -11.26% | | | | -3.55% | | | | 5.34% | | | | 4.58% | | | | N/A | | | | N/A | |
ICON Europe Fund - Class C | | | 1/25/08 | | | | -20.73% | | | | N/A | | | | N/A | | | | -13.71% | | | | 40.14% | | | | 2.55% | |
MSCI Europe Index | | | | | | | -11.26% | | | | N/A | | | | N/A | | | | -8.02% | | | | N/A | | | | N/A | |
ICON Europe Fund - Class A | | | 5/31/06 | | | | -20.04% | | | | -8.01% | | | | N/A | | | | -7.15% | | | | 17.22% | | | | 1.80% | |
ICON Europe Fund - Class A (including maximum sales charge of 5.75%) | | | 5/31/06 | | | | -24.63% | | | | -9.10% | | | | N/A | | | | -8.18% | | | | 17.22% | | | | 1.80% | |
MSCI Europe Index | | | | | | | -11.26% | | | | -3.55% | | | | N/A | | | | -2.26% | | | | N/A | | | | N/A | |
Past performance is not a guarantee of future results. Information about these performance results and the comparative indexes can be found in the About This Report section. The Fund’s name and investment strategy changed effective January 29, 2004. The Fund’s past performance would have been different if the current strategy had been in effect. The Adviser has agreed to limit certain expenses on Class C and Class A shares; without these limitations, returns would have been lower. The limitation provisions may be terminated in the future.
| * | Please see the most recent prospectus for details. |
Class C total returns exclude applicable sales charges. If sales charges were included returns would be lower.
ICON Europe Fund
Value of a $10,000 Investment
through September 30, 2011
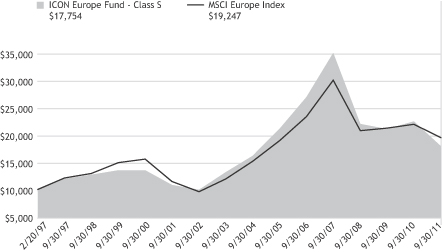
Past performance is not a guarantee of future results. The above graph compares a $10,000 investment made in the Fund’s Class S shares on the Class’ inception date of 2/20/97 to a $10,000 investment made in an unmanaged securities index on that date. The Fund’s performance in this chart and the performance table assumes the reinvestment of dividends, capital gain distributions and tax return of capital, but does not reflect the deduction of taxes that a shareholder would pay on Fund distributions or on the redemption of Fund shares.
ICON EUROPE FUND
SCHEDULEOF INVESTMENTS
SEPTEMBER 30, 2011
| | | | | | | | |
| Shares or Principal Amount | | Value | |
| | | | | | | | |
| | Common Stocks (96.9%) | |
| | 16,200 | | | ABB, Ltd.† | | $ | 277,115 | |
| | 2,100 | | | Adidas AG | | | 127,797 | |
| | 3,900 | | | Air Liquide S.A. | | | 455,426 | |
| | 18,900 | | | Alliance Oil Co. Ltd.† | | | 200,149 | |
| | 6,600 | | | Allianz SE | | | 618,613 | |
| | 24,000 | | | ArcelorMittal | | | 383,443 | |
| | 2,500 | | | Arkema S.A. | | | 144,772 | |
| | 10,700 | | | Assa Abloy AB, Class B | | | 220,147 | |
| | 50,200 | | | AXA S.A. | | | 653,096 | |
| | 5,150 | | | BASF SE | | | 313,972 | |
| | 3,900 | | | Bauer AG | | | 89,094 | |
| | 3,130 | | | Bayer AG | | | 172,725 | |
| | 2,500 | | | Bayerische Motoren Werke AG | | | 165,153 | |
| | 27,900 | | | BHP Billiton PLC | | | 745,318 | |
| | 5,478 | | | BNP Paribas | | | 215,957 | |
| | 123,300 | | | BP PLC | | | 739,267 | |
| | 3,860 | | | Brenntag AG | | | 334,853 | |
| | 10,100 | | | Carrefour S.A. | | | 229,997 | |
| | 5,800 | | | Cie de St-Gobain | | | 221,278 | |
| | 10,834 | | | Cie Generale des Etablissements Michelin, Class B | | | 647,959 | |
| | 26,800 | | | CNP Assurances | | | 394,603 | |
| | 1,700 | | | Continental AG† | | | 98,124 | |
| | 41,400 | | | Deutsche Post AG | | | 530,036 | |
| | 19,100 | | | DSV A/S | | | 343,654 | |
| | 12,300 | | | Duerr AG | | | 396,345 | |
| | 5,800 | | | ElringKlinger AG(a) | | | 135,598 | |
| | 56,300 | | | Essar Energy PLC† | | | 218,118 | |
| | 41,800 | | | GEA Group AG | | | 975,725 | |
| | 21,600 | | | ING Groep NV† | | | 152,363 | |
| | 12,600 | | | K+S AG | | | 659,598 | |
| | 20,200 | | | Kloeckner & Co. SE | | | 248,692 | |
| | 5,400 | | | Konecranes Oyj | | | 108,526 | |
| | 6,900 | | | Lanxess AG | | | 330,992 | |
| | | | | | | | |
| Shares or Principal Amount | | Value | |
| | | | | | | | |
| | 154,000 | | | Legal & General Group PLC | | $ | 230,002 | |
| | 1,600 | | | Linde AG | | | 214,101 | |
| | 10,000 | | | LUKOIL OAO, ADR(a)** | | | 501,900 | |
| | 3,500 | | | MAN SE | | | 271,307 | |
| | 1,800 | | | Mayr Melnhof Karton AG | | | 162,102 | |
| | 6,700 | | | Metro AG | | | 284,406 | |
| | 1,150 | | | Muenchener Rueckversicherungs Gesellschaft AG | | | 142,826 | |
| | 12,480 | | | Neste Oil Oyj | | | 108,309 | |
| | 19,700 | | | Nestle S.A. | | | 1,084,538 | |
| | 11,900 | | | Novartis AG | | | 664,754 | |
| | 270,100 | | | Old Mutual PLC | | | 438,279 | |
| | 10,900 | | | OMV AG | | | 324,454 | |
| | 15,200 | | | Pandora A/S(a) | | | 101,343 | |
| | 6,200 | | | Renault S.A. | | | 205,365 | |
| | 47,000 | | | Rexam PLC | | | 226,010 | |
| | 7,800 | | | Rheinmetall AG | | | 365,866 | |
| | 6,600 | | | Rio Tinto PLC | | | 292,698 | |
| | 34,000 | | | Royal Dutch Shell PLC, Class B | | | 1,057,901 | |
| | 19,600 | | | SAP AG | | | 997,292 | |
| | 3,600 | | | Schneider Electric S.A. | | | 192,656 | |
| | 10,800 | | | Seadrill, Ltd.(a) | | | 298,256 | |
| | 13,700 | | | Siemens AG | | | 1,232,594 | |
| | 385 | | | Sika AG | | | 681,661 | |
| | 3,664 | | | Societe Generale | | | 95,915 | |
| | 40,300 | | | Statoil ASA | | | 864,752 | |
| | 20,000 | | | Svenska Cellulosa AB, Class B | | | 243,520 | |
| | 27,700 | | | Takkt AG | | | 333,235 | |
| | 57,400 | | | Telenor ASA | | | 885,293 | |
| | 20,800 | | | Temenos Group AG† | | | 280,905 | |
| | 20,900 | | | Total S.A. | | | 922,095 | |
| | 4,900 | | | Transocean, Ltd. | | | 236,251 | |
| | 12,018 | | | Vallourec S.A. | | | 688,232 | |
| | | | |
| SCHEDULEOF INVESTMENTS | | | 23 | |
| | | | | | | | |
| Shares or Principal Amount | | Value | |
| | | | | | | | |
| | 17,600 | | | Vedanta Resources PLC | | $ | 299,173 | |
| | 2,600 | | | Wacker Chemie AG(a) | | | 230,828 | |
| | 4,000 | | | Yara International ASA | | | 152,602 | |
| | 33,600 | | | YIT Oyj | | | 504,682 | |
| | | | | | | | |
| Total Common Stocks
(Cost $34,938,530) | | | 27,364,608 | |
| | Preferred Stock (0.4%) | | | | |
| | 2,400 | | | Porsche Automobil Holding SE | | | 114,315 | |
| | | | | | | | |
| Total Preferred Stocks
(Cost $164,631) | | | 114,315 | |
| | | | | | | | |
| Shares or Principal Amount | | Value | |
| | | | | | | | |
| Collateral for Securities on
Loan (2.9%) | | | | |
| | 826,916 | | | State Street Navigator Prime Portfolio | | $ | 826,916 | |
| | | | | | | | |
| Total Collateral for Securities
on Loan
(Cost $826,916) | | | 826,916 | |
| Total Investments 100.2%*
(Cost $35,930,077) | | | 28,305,839 | |
| Liabilities Less Other Assets
(0.2)% | | | (46,680 | ) |
| | | | | | | | |
| | Net Assets 100.0% | | $ | 28,259,159 | |
| | | | | | | | |
The accompanying notes are an integral part of the financial statements.
| † | Non-income producing security. |
| * | The value of foreign securities fair valued (Note 2) as of September 30, 2011 was 95.46% of net assets. |
| ** | This security is considered a Level 1 security. See Note 2 for further details. |
| (a) | All or a portion of the security was on loan as of September 30, 2011. |
| ADR | American Depository Receipt |
| | |
| 24 | | SCHEDULEOF INVESTMENTS |
| | | | |
MANAGEMENT OVERVIEW ICON INTERNATIONAL EQUITY FUND | | Class S Class I Class C Class Z Class A | | ICESX IIQIX IIQCX ICNEX IIQAX |
| Q. | How did the Fund perform relative to its benchmark? |
| A. | For the fiscal year ended September 30, 2011, the ICON International Equity Fund returned -23.62% for Class I shares, -23.32% for Class S shares and -23.38% for Class Z shares, underperforming the -10.42% return of the MSCI All Country World Index (ACWI) ex-U.S., the Fund’s benchmark. Class A shares of the Fund returned -23.65% (and -28.01% with maximum sales charge) during the same period while Class C shares of the Fund returned -24.25% (and -25.25% with maximum sales charge). Total returns for other periods as of September 30, 2011 appear in the subsequent pages of this Fund’s Management Overview. |
| Q. | What primary factors were behind the Fund’s relative performance? |
| A. | The fiscal year 2011 can be split into two distinct periods starting with the continuation of the recovery based rally from the prior year and ending with heavy selling pressure amidst a volatile and risk averse backdrop. Europe found itself facing benign growth and renewed fears about a sovereign debt crisis involving deteriorated fiscal situations in countries such as Greece, Portugal, and Italy. Meanwhile, the Asia-Pacific region experienced moderate growth as central bankers enacted policies to combat the fear of rising inflation. As the year unfolded and global contagion fears increased, those emerging economies in the Asia-Pacific region that experienced growth during the first half of the fiscal year 2011 generally suffered the largest losses as indiscriminate selling and heightened risk aversion led to lower returns. Despite their geographical distance from the troubled Eurozone countries, China, India, and Brazil were all hit hard during this latest episode of volatility. In general, the period was highlighted by a risk-on, risk-off environment with negative investor sentiment ultimately prevailing by the end of the fiscal year 2011. |
The most significant reallocation in the Fund during the period was a decrease in the Financial sector, specifically in European banks. The rotation out of the Financial sector was allocated mostly to industries within the Materials and Energy sectors in emerging market countries in the Asia-Pacific region and the Western Hemisphere. By the end of the period, fears about the health of the global economy hurt the performance of the cyclical sectors while defensive sectors fared better.
As a multi-cap manager, we are not limited by restrictions on market capitalization. However, our valuation metrics resulted in a concentration in large-cap companies during the period. Despite this concentration in large-cap stocks, the Fund remained underweight in large-cap stocks relative to the benchmark. This underweight position in large-cap stocks, combined with an overweight position in mid-cap stocks relative to the benchmark, detracted from performance as large-cap stocks outperformed the overall benchmark during the period.
Currency movements worldwide throughout the fiscal year 2011 had a slightly negative effect on returns. The U.S. dollar experienced a choppy, yet generally downward movement as riskier assets appreciated, leading to increased demand for foreign currencies. As fear increased, primarily in July and August 2011, this trend reversed. This reversal ultimately hurt the Fund as portfolio currencies in the Asia-Pacific region and Western Hemisphere suffered losses versus the U.S. dollar amidst the global flight to safety.
| Q. | How did the Fund’s composition affect performance? |
| A. | The Fund’s underweight position in the Financial sector proved to be the most beneficial contributor to performance relative to the benchmark as banks and capital market stocks, primarily in Europe, suffered steep losses amidst the sovereign debt crisis concerns. Additionally, an overweight position relative to the benchmark in the gold industry contributed positively as the underlying spot price of the base metal increased throughout the fiscal year 2011. |
Conversely, the Materials sector was a detractor, suffering losses during the fiscal year 2011. Further, the Fund’s underweight position in the defensive Consumer Staples sector relative to its benchmark also hindered returns as stocks within this sector outperformed the benchmark amidst the overall downturn.
Emerging markets underperformed over the entire period after strong participation in the prior year’s recovery-based rally. As such, the Fund’s positions in countries like China, India, and Brazil detracted from performance. Meanwhile, South Korea, Norway, Belgium, and Indonesia contributed positively to performance relative to the benchmark. As the fiscal year 2011 ended, heightened risk aversion permeated through the global markets and the Fund’s positions in cyclically oriented sectors and higher growth emerging countries brought the majority of the year’s Fund losses during August and September 2011.
| Q. | What is your investment outlook for the international equity market? |
| A. | Amidst the volatility seen over the past year, we still see opportunity in the worldwide equity markets. These markets have experienced periods of both turmoil and jubilation over the past three years and the representative companies have adjusted to ever-changing economic conditions. Interest rates remain low, monetary policy is loose and accommodative, and corporate earnings and balance sheets have improved despite the negative headlines. We believe these are all positive signs for stocks going forward. However, these positive signs come at a time of heightened risk aversion and general fear as investor sentiment has declined for all but the safest of assets. We see bargains in the international equity market and as of the end of the fiscal year 2011 we estimate that, on average, fair value for international equities is 39% higher than where prices are currently trading. Europe, where equities are trading with a 45% upside to our estimate of fair value, is showing the best bargains globally. |
We believe that the market is in the midst of correction within the broader recovery-based market theme that began in 2009. Despite the recent selloff, we remain tilted towards the Industrials, Materials, and Energy sectors as they are showing some of the best bargains around the equity markets according to our system. We feel that the areas that have held up the best from a relative strength standpoint, aren’t offering enough upside relative to the aforementioned cyclicals and that our preferred positioning focuses more on what we feel will lead the market out of this turbulence.
In the Asia-Pacific region, countries like South Korea, China and Singapore remain the most attractive within the region according to our valuation metrics. Within the Western Hemisphere, Canada and Brazil look attractive to our system with Germany currently showing the most value in the European region.
At ICON we continue to seek out industries that our system identifies as trading at a discount to fair value and showing relative strength in the markets. Guided by our disciplined, systematic and non-emotional approach to investing, we see numerous opportunities amidst the recent turbulence and volatility. We believe it is nearly impossible to accurately time market bottoms and we believe rallies do not offer invitations. Therefore, given our current valuations, we remain almost fully invested. As market conditions dictate, we will adjust accordingly.
ICON International Equity Fund
Country Composition
September 30, 2011
| | | | |
South Korea | | | 14.7% | |
Germany | | | 13.4% | |
France | | | 8.6% | |
Canada | | | 8.4% | |
China | | | 8.0% | |
Brazil | | | 7.1% | |
India | | | 4.4% | |
Switzerland | | | 3.6% | |
Australia | | | 3.2% | |
Norway | | | 3.1% | |
Japan | | | 3.0% | |
Singapore | | | 2.8% | |
Hong Kong | | | 2.7% | |
United Kingdom | | | 2.3% | |
Netherlands | | | 1.9% | |
Finland | | | 1.6% | |
Thailand | | | 1.5% | |
Mexico | | | 1.3% | |
Russia | | | 1.2% | |
Israel | | | 1.2% | |
Indonesia | | | 0.9% | |
Taiwan | | | 0.8% | |
Bermuda | | | 0.7% | |
South Africa | | | 0.6% | |
Mauritius | | | 0.5% | |
Denmark | | | 0.1% | |
| | | | |
| | | 97.6% | |
| | | | |
Percentages are based upon common and preferred stocks as a percentage of net assets.
ICON International Equity Fund
Sector Composition
September 30, 2011
| | | | |
Materials | | | 22.6% | |
Industrials | | | 20.4% | |
Energy | | | 18.8% | |
Financial | | | 14.7% | |
Consumer Discretionary | | | 8.3% | |
Consumer Staples | | | 5.1% | |
Information Technology | | | 4.1% | |
Telecommunication & Utilities | | | 2.1% | |
Health Care | | | 1.5% | |
| | | | |
| | | 97.6% | |
| | | | |
Percentages are based upon common and preferred stocks as a percentage of net assets.
ICON International Equity Fund
Industry Composition
September 30, 2011
| | | | |
Integrated Oil & Gas | | | 11.1% | |
Diversified Banks | | | 10.1% | |
Industrial Machinery | | | 6.5% | |
Industrial Conglomerates | | | 5.4% | |
Steel | | | 5.1% | |
Trading Companies & Distributors | | | 5.0% | |
Automobile Manufacturers | | | 4.6% | |
Fertilizers & Agricultural Chemicals | | | 4.6% | |
Commodity Chemicals | | | 3.5% | |
Diversified Metals & Mining | | | 3.2% | |
Oil & Gas Equipment & Services | | | 2.7% | |
Life & Health Insurance | | | 2.6% | |
Application Software | | | 2.6% | |
Oil & Gas Exploration & Production | | | 2.3% | |
Packaged Foods & Meats | | | 2.3% | |
| | | | |
Multi-line Insurance | | | 1.9% | |
Precious Metals & Minerals | | | 1.6% | |
Oil & Gas Refining & Marketing | | | 1.5% | |
Building Products | | | 1.5% | |
Pharmaceuticals | | | 1.5% | |
Auto Parts & Equipment | | | 1.5% | |
Integrated Telecommunication Services | | | 1.4% | |
Hypermarkets & Super Centers | | | 1.4% | |
Construction Materials | | | 1.2% | |
Specialty Chemicals | | | 1.2% | |
Internet Software & Services | | | 1.1% | |
Other Industries (each less than 1%) | | | 10.2% | |
| | | | |
| | | 97.6% | |
| | | | |
Percentages are based upon common and preferred stocks as a percentage of net assets.
ICON International Equity Fund
Average Annual Total Return
as of September 30, 2011
| | | | | | | | | | | | | | | | | | | | | | | | | | | | |
| | | Inception
Date | | | 1 Year | | | 5 Years | | | 10 Years | | | Since
Inception | | | Gross
Expense
Ratio* | | | Net
Expense
Ratio* | |
ICON International Equity Fund - Class S | | | 1/25/08 | | | | -23.32% | | | | N/A | | | | N/A | | | | -11.88% | | | | 1.42% | | | | 1.42% | |
MSCI ACWI ex-U.S. | | | | | | | -10.42% | | | | N/A | | | | N/A | | | | -5.80% | | | | N/A | | | | N/A | |
ICON International Equity Fund - Class I | | | 2/6/04 | | | | -23.62% | | | | -5.75% | | | | N/A | | | | 1.92% | | | | 1.84% | | | | 1.80% | |
MSCI ACWI ex-U.S. | | | | | | | -10.42% | | | | -1.12% | | | | N/A | | | | 5.37% | | | | N/A | | | | N/A | |
ICON International Equity Fund - Class C | | | 2/19/04 | | | | -24.25% | | | | -6.55% | | | | N/A | | | | 0.48% | | | | 2.69% | | | | 2.55% | |
MSCI ACWI ex-U.S. | | | | | | | -10.42% | | | | -1.12% | | | | N/A | | | | 4.99% | | | | N/A | | | | N/A | |
ICON International Equity Fund - Class Z | | | 2/18/97 | | | | -23.38% | | | | -5.40% | | | | 6.33% | | | | 4.48% | | | | 1.43% | | | | 1.36% | |
MSCI ACWI ex-U.S. | | | | | | | -10.42% | | | | -1.12% | | | | 7.27% | | | | 4.21% | | | | N/A | | | | N/A | |
ICON International Equity Fund - Class A | | | 5/31/06 | | | | -23.65% | | | | -5.81% | | | | N/A | | | | -5.58% | | | | 2.16% | | | | 1.80% | |
ICON International Equity Fund - Class A (including maximum sales charge of 5.75%) | | | 5/31/06 | | | | -28.01% | | | | -6.92% | | | | N/A | | | | -6.63% | | | | 2.16% | | | | 1.80% | |
MSCI ACWI ex-U.S. | | | | | | | -10.42% | | | | -1.12% | | | | N/A | | | | -0.35% | | | | N/A | | | | N/A | |
Past performance is not a guarantee of future results. Information about these performance results and the comparative indexes can be found in the About This Report section. The Fund’s name and investment strategy changed effective January 29, 2004. The Fund’s past performance would have been different if the current strategy had been in effect. The Adviser has agreed to limit certain Fund expenses; without these limitations, returns would have been lower. The limitation provisions may be terminated in the future. Class Z shares are available only to institutional investors.
| * | Please see the most recent prospectus for details. |
Class C total returns exclude applicable sales charges. If sales charges were included returns would be lower.
ICON International Equity Fund
Value of a $10,000 Investment
through September 30, 2011
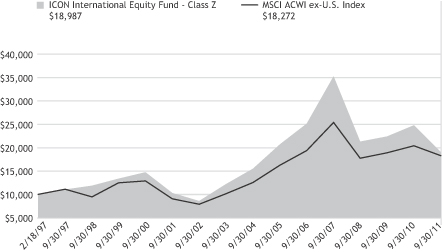
Past performance is not a guarantee of future results. The above graph compares a $10,000 investment made in the Fund’s Class Z shares on the Class’ inception date of 2/18/97 to a $10,000 investment made in an unmanaged securities index on that date. Performance for the Fund’s other share classes will vary due to differences in charges and expenses. The Fund’s performance in this chart and the performance table assumes the reinvestment of dividends, capital gain distributions and tax return of capital, but does not reflect the deduction of taxes that a shareholder would pay on Fund distributions or on the redemption of Fund shares.
ICON INTERNATIONAL EQUITY FUND
SCHEDULEOF INVESTMENTS
SEPTEMBER 30, 2011
| | | | | | | | |
| Shares or Principal Amount | | Value | |
| | | | | | | | |
| | Common Stocks (91.5%) | | | | |
| | 727,000 | | | Agricultural Bank of China, Ltd., Class H | | $ | 237,378 | |
| | 6,000 | | | Air Liquide S.A. | | | 700,655 | |
| | 93,100 | | | Alliance Oil Co. Ltd.† | | | 985,919 | |
| | 7,400 | | | Allianz SE | | | 693,596 | |
| | 480,000 | | | America Movil S.A.B. de C.V., Series L** | | | 529,893 | |
| | 12,300 | | | Arkema S.A. | | | 712,280 | |
| | 65,000 | | | AXA S.A. | | | 845,642 | |
| | 7,900 | | | Baidu, Inc., ADR†** | | | 844,589 | |
| | 645,000 | | | Bank Danamon Indonesia Tbk PT | | | 334,270 | |
| | 1,853,500 | | | Bank of China, Ltd., Class H | | | 573,142 | |
| | 16,000 | | | Bank of Nova Scotia** | | | 804,962 | |
| | 5,700 | | | BASF SE | | | 347,503 | |
| | 1,025,500 | | | BBMG Corp. | | | 756,357 | |
| | 33,700 | | | BHP Billiton, Ltd. | | | 1,115,822 | |
| | 158,400 | | | Billabong International, Ltd.(a) | | | 499,851 | |
| | 123,410 | | | BP PLC | | | 739,927 | |
| | 10,300 | | | Brenntag AG | | | 893,520 | |
| | 6,200 | | | Carrefour S.A. | | | 141,186 | |
| | 56,000 | | | Catcher Technology Co., Ltd. | | | 320,623 | |
| | 1,702,000 | | | Chaoda Modern Agriculture Holdings, Ltd.*** | | | 240,414 | |
| | 1,055,020 | | | China Construction Bank Corp., Class H | | | 638,114 | |
| | 1,121,000 | | | China Green Holdings, Ltd. | | | 210,439 | |
| | 455,000 | | | China International Marine Containers Group Co., Ltd., Class B | | | 459,319 | |
| | | | | | | | |
| Shares or Principal Amount | | Value | |
| | | | | | | | |
| | 406,000 | | | China Minsheng Banking Corp., Ltd., Class H | | $ | 246,960 | |
| | 1,168,000 | | | China National Materials Co., Ltd., Class H | | | 422,885 | |
| | 1,736,000 | | | China Petroleum & Chemical Corp., Class H | | | 1,669,527 | |
| | 240,000 | | | China Resources Cement Holdings, Ltd. | | | 157,410 | |
| | 192,000 | | | China Shineway Pharmaceutical Group, Ltd. | | | 234,909 | |
| | 240,000 | | | China Yurun Food Group, Ltd. | | | 255,967 | |
| | 39,700 | | | Cia Siderurgica Nacional S.A.** | | | 311,646 | |
| | 19,400 | | | Cie de St-Gobain | | | 740,135 | |
| | 10,400 | | | Cie Generale des Etablissements Michelin, Class B | | | 622,002 | |
| | 44,800 | | | CNP Assurances | | | 659,634 | |
| | 8,600 | | | Continental AG† | | | 496,392 | |
| | 41,300 | | | Deutsche Post AG | | | 528,756 | |
| | 11,300 | | | Doosan Corp. | | | 1,275,354 | |
| | 11,000 | | | Duerr AG | | | 354,455 | |
| | 96,000 | | | Duratex S.A.** | | | 439,601 | |
| | 112,000 | | | Essar Energy PLC† | | | 433,912 | |
| | 4,136,000 | | | Ezion Holdings, Ltd. | | | 1,493,602 | |
| | 5,600 | | | Fugro, NV | | | 282,416 | |
| | 72,600 | | | GEA Group AG | | | 1,694,681 | |
| | 28,000 | | | Hana Financial Group, Inc. | | | 814,142 | |
| | 42,000 | | | Hiwin Technologies Corp. | | | 284,797 | |
| | 23,900 | | | Hyosung Corp. | | | 1,100,776 | |
| | 2,300 | | | Hyundai Mobis | | | 651,444 | |
| | 13,000 | | | Hyundai Motor Co. | | | 2,272,630 | |
| | |
| 32 | | SCHEDULEOF INVESTMENTS |
| | | | | | | | |
| Shares or Principal Amount | | Value | |
| | | | | | | | |
| | 1,380,000 | | | Indika Energy Tbk PT | | $ | 348,652 | |
| | 29,100 | | | Industrial Bank of Korea | | | 337,835 | |
| | 26,000 | | | JSW Steel, Ltd. | | | 312,185 | |
| | 22,700 | | | K+S AG | | | 1,188,324 | |
| | 11,000 | | | KB Financial Group, Inc. | | | 363,463 | |
| | 2,500 | | | KCC Corp. | | | 467,061 | |
| | 29,000 | | | Kloeckner & Co. SE | | | 357,033 | |
| | 33,500 | | | Konecranes Oyj | | | 673,265 | |
| | 149,000 | | | Korea Life Insurance Co., Ltd. | | | 697,574 | |
| | 9,700 | | | Metro AG | | | 411,752 | |
| | 117,000 | | | Mitsui & Co., Ltd.(a) | | | 1,694,776 | |
| | 28,700 | | | Nestle S.A. | | | 1,580,012 | |
| | 1,003,181 | | | Noble Group, Ltd.(a) | | | 1,000,839 | |
| | 113,000 | | | Northam Platinum, Ltd. | | | 458,193 | |
| | 2,200 | | | OCI Co., Ltd. | | | 375,623 | |
| | 92,000 | | | Oil & Natural Gas Corp., Ltd. | | | 498,921 | |
| | 400,000 | | | Olam International Ltd. | | | 681,623 | |
| | 451,000 | | | Old Mutual PLC | | | 731,817 | |
| | 460,000 | | | OneSteel, Ltd. | | | 539,091 | |
| | 29,500 | | | Pan American Silver Corp.(a)** | | | 794,718 | |
| | 17,400 | | | Pandora A/S(a) | | | 116,011 | |
| | 57,400 | | | PetroBakken Energy, Ltd., Class A(a)** | | | 369,740 | |
| | 5,240 | | | POSCO | | | 1,614,780 | |
| | 41,500 | | | Potash Corp. of Saskatchewan, Inc.** | | | 1,801,937 | |
| | 344,000 | | | PTT Aromatics & Refining PCL | | | 269,772 | |
| | 292,000 | | | PTT Chemical PCL | | | 922,433 | |
| | 6,300 | | | Rio Tinto, Ltd. | | | 369,013 | |
| | 39,500 | | | Royal Dutch Shell PLC, Class B | | | 1,229,032 | |
| | 33,400 | | | SAP AG | | | 1,699,466 | |
| | 19,300 | | | Seadrill, Ltd.(a) | | | 532,994 | |
| | 21,000 | | | Siemens AG | | | 1,889,378 | |
| | | | | | | | |
| Shares or Principal Amount | | Value | |
| | | | | | | | |
| | 515 | | | Sika AG | | $ | 911,832 | |
| | 9,900 | | | SK Holdings Co., Ltd. | | | 1,096,344 | |
| | 4,400 | | | SK Innovation Co., Ltd. | | | 514,806 | |
| | 61,300 | | | Statoil ASA | | | 1,315,368 | |
| | 293,000 | | | Sterlite Industries India, Ltd. | | | 670,614 | |
| | 137,000 | | | Sumitomo Heavy Industries, Ltd. | | | 700,597 | |
| | 29,500 | | | Suncor Energy, Inc.(a)** | | | 753,335 | |
| | 430,000 | | | Tata Motors, Ltd. | | | 1,351,852 | |
| | 800,000 | | | Techtronic Industries Co. | | | 536,834 | |
| | 71,000 | | | Telenor ASA | | | 1,095,048 | |
| | 28,300 | | | Temenos Group AG†,(a) | | | 382,192 | |
| | 25,000 | | | Teva Pharmaceutical Industries, Ltd., ADR** | | | 930,500 | |
| | 24,800 | | | Toronto-Dominion Bank** | | | 1,765,275 | |
| | 31,155 | | | Total S.A. | | | 1,374,540 | |
| | 24,400 | | | Trican Well Service, Ltd.** | | | 346,010 | |
| | 218,000 | | | United Phosphorus, Ltd. | | | 606,540 | |
| | 17,070 | | | Vallourec S.A.(a) | | | 977,543 | |
| | 21,400 | | | Vedanta Resources PLC | | | 363,768 | |
| | 230,000 | | | Wal-Mart de Mexico S.A.B. de C.V., Series V** | | | 527,384 | |
| | 38,300 | | | YIT Oyj(a) | | | 575,277 | |
| | | | | | | | |
| Total Common Stocks
(Cost $98,003,272) | | | 72,192,406 | |
| | Preferred Stocks (6.1%) | | | | |
| | 62,340 | | | Banco Bradesco S.A.** | | | 918,730 | |
| | 184,000 | | | Investimentos Itau S.A.** | | | 932,599 | |
| | 168,000 | | | Petroleo Brasileiro S.A.** | | | 1,706,582 | |
| | 61,000 | | | Vale S.A., Class A** | | | 1,272,719 | |
| | | | | | | | |
| Total Preferred Stocks
(Cost $6,046,638) | | | 4,830,630 | |
| | | | |
| SCHEDULEOF INVESTMENTS | | | 33 | |
| | | | | | | | |
| Shares or Principal Amount | | Value | |
| | | | | | | | |
| Collateral for Securities on
Loan (6.5%) | | | | |
| | 5,156,672 | | | State Street Navigator Prime Portfolio | | $ | 5,156,672 | |
| | | | | | | | |
| Total Collateral for Securities
on Loan
(Cost $5,156,672) | | | 5,156,672 | |
| | | | | | | | |
| Shares or Principal Amount | | Value | |
| | | | | | | | |
| | Short-Term Investment (0.5%) | |
| $ | 416,675 | | | State Street Euro Dollar Time Deposit (USD), 0.01%, 10/03/11 | | $ | 416,675 | |
| | | | | | | | |
| Total Short-Term Investments
(Cost $416,675) | | | 416,675 | |
| Total Investments 104.6%*
(Cost $109,623,257) | | | 82,596,383 | |
| Liabilities Less Other Assets
(4.6)% | | | (3,669,659 | ) |
| | | | | | | | |
| | Net Assets 100.0% | | $ | 78,926,724 | |
| | | | | | | | |
The accompanying notes are an integral part of the financial statements.
| † | Non-income producing security. |
| * | The value of foreign securities fair valued (Note 2) as of September 30, 2011 was 78.21% of net assets. |
| ** | This security is considered a Level 1 security. See Note 2 for further details. |
| *** | This security is considered a Level 3 security. Please see Note 2 for further details. |
| (a) | All or a portion of the security was on loan as of September 30, 2011. |
| ADR | American Depository Receipt |
| | |
| 34 | | SCHEDULEOF INVESTMENTS |
(This page is intentionally left blank)
STATEMENTSOF ASSETSAND LIABILITIES
SEPTEMBER 30, 2011
| | | | | | | | | | | | |
| | | ICON
Asia-Pacific
Region
Fund | | | ICON
Europe
Fund | | | ICON
International
Equity Fund | |
Assets | | | | | | | | | | | | |
Investments, at cost | | $ | 75,307,269 | | | $ | 35,930,077 | | | $ | 109,623,257 | |
| | | | | | | | | | | | |
Investments, at value† | | | 63,555,380 | | | | 28,305,839 | | | | 82,596,383 | |
Foreign currency, at value(a) | | | 429,319 | | | | – | | | | 234,012 | |
Receivables: | | | | | | | | | | | | |
Fund shares sold | | | 51,315 | | | | 11,020 | | | | 21,730 | |
Investments sold | | | – | | | | 810,959 | | | | 1,299,498 | |
Dividends | | | 210,877 | | | | 7,431 | | | | 104,868 | |
Expense reimbursements by Adviser | | | 22,193 | | | | 18,787 | | | | 8,974 | |
Foreign tax reclaims | | | 397 | | | | 106,449 | | | | 98,490 | |
Other assets | | | 11,671 | | | | 11,031 | | | | 81,599 | |
| | | | | | | | | | | | |
Total Assets | | | 64,281,152 | | | | 29,271,516 | | | | 84,445,554 | |
| | | | | | | | | | | | |
Liabilities | | | | | | | | | | | | |
Payables: | | | | | | | | | | | | |
Due to custodian bank | | | – | | | | 78,996 | | | | – | |
Expense recoupment due to adviser | | | – | | | | – | | | | 2,457 | |
Payable for collateral received on securities loaned | | | 6,792,269 | | | | 826,916 | | | | 5,156,672 | |
Fund shares redeemed | | | 159,769 | | | | 35,982 | | | | 200,218 | |
Advisory fees | | | 53,372 | | | | 25,552 | | | | 74,552 | |
Accrued distribution fees | | | 897 | | | | 77 | | | | 14,112 | |
Fund accounting fees | | | 1,093 | | | | 525 | | | | 837 | |
Transfer agent fees | | | 7,843 | | | | 4,905 | | | | 11,487 | |
Administration fees | | | 2,629 | | | | 1,037 | | | | 3,742 | |
Trustee fees | | | 491 | | | | 302 | | | | 712 | |
Capital gains tax | | | 12,612 | | | | – | | | | – | |
Accrued expenses | | | 52,450 | | | | 38,065 | | | | 54,041 | |
| | | | | | | | | | | | |
Total Liabilities | | | 7,083,425 | | | | 1,012,357 | | | | 5,518,830 | |
| | | | | | | | | | | | |
Net Assets - all share classes | | $ | 57,197,727 | | | $ | 28,259,159 | | | $ | 78,926,724 | |
| | | | | | | | | | | | |
Net Assets - Class S | | $ | 55,637,142 | | | $ | 28,095,258 | | | $ | 36,493,913 | |
| | | | | | | | | | | | |
Net Assets - Class I | | $ | – | | | $ | – | | | $ | 24,916,776 | |
| | | | | | | | | | | | |
Net Assets - Class C | | $ | 792,272 | | | $ | 58,877 | | | $ | 8,050,050 | |
| | | | | | | | | | | | |
Net Assets - Class Z | | $ | – | | | $ | – | | | $ | 6,826,384 | |
| | | | | | | | | | | | |
Net Assets - Class A | | $ | 768,313 | | | $ | 105,024 | | | $ | 2,639,601 | |
| | | | | | | | | | | | |
| | | | | | | | | | | | |
| | | ICON
Asia-Pacific
Region
Fund | | | ICON
Europe
Fund | | | ICON
International
Equity Fund | |
Net Assets Consist of | | | | | | | | | | | | |
Paid-in capital | | $ | 79,479,805 | | | $ | 86,125,694 | | | $ | 186,185,943 | |
Accumulated undistributed net investment income/(loss) | | | 217,349 | | | | 459,347 | | | | 560,902 | |
Accumulated undistributed net realized gain/(loss) from investments and foreign currency transactions | | | (10,719,331 | ) | | | (50,705,371 | ) | | | (80,794,382 | ) |
Unrealized appreciation/(depreciation) on investments and foreign currency transactions | | | (11,780,096 | ) | | | (7,620,511 | ) | | | (27,025,739 | ) |
| | | | | | | | | | | | |
Net Assets | | $ | 57,197,727 | | | $ | 28,259,159 | | | $ | 78,926,724 | |
| | | | | | | | | | | | |
Shares outstanding (unlimited shares authorized, no par value) | | | | | | | | | | | | |
Class S | | | 5,495,259 | | | | 2,734,569 | | | | 3,906,231 | |
Class I | | | – | | | | – | | | | 2,742,006 | |
Class C | | | 80,178 | | | | 5,845 | | | | 940,143 | |
Class Z | | | – | | | | – | | | | 740,274 | |
Class A | | | 76,036 | | | | 10,221 | | | | 288,199 | |
Net asset value (offering and redemption price per share) | | | | | | | | | | | | |
Class S | | $ | 10.12 | | | $ | 10.27 | | | $ | 9.34 | |
Class I | | $ | – | | | $ | – | | | $ | 9.09 | |
Class C | | $ | 9.88 | | | $ | 10.07 | | | $ | 8.56 | |
Class Z | | $ | – | | | $ | – | | | $ | 9.22 | |
Class A | | $ | 10.10 | | | $ | 10.28 | | | $ | 9.16 | |
Class A maximum offering price (100%/(100%-maximum sales charge)) of net asset value adjusted to the nearest cent per share | | $ | 10.72 | | | $ | 10.91 | | | $ | 9.72 | |
| | | |
† Includes securities on loan of | | $ | 6,291,167 | | | $ | 737,761 | | | $ | 4,790,217 | |
| | | |
(a) Foreign currency, at cost | | $ | 450,505 | | | $ | – | | | $ | 234,564 | |
The accompanying notes are an integral part of the financial statements.
STATEMENTSOF OPERATIONS
FORTHEYEARENDED SEPTEMBER 30, 2011
| | | | | | | | | | | | |
| | | ICON
Asia-Pacific
Region
Fund | | | ICON
Europe
Fund | | | ICON
International
Equity Fund | |
Investment Income | | | | | | | | | | | | |
Interest | | $ | 104 | | | $ | 120 | | | $ | 234 | |
Dividends | | | 1,637,690 | | | | 1,356,131 | | | | 2,952,587 | |
Income from securities lending, net | | | 11,092 | | | | 78,046 | | | | 109,511 | |
Foreign taxes withheld | | | (107,956 | ) | | | (158,231 | ) | | | (302,909 | ) |
| | | | | | | | | | | | |
Total Investment Income | | | 1,540,930 | | | | 1,276,066 | | | | 2,759,423 | |
| | | | | | | | | | | | |
Expenses | | | | | | | | | | | | |
Advisory fees | | | 717,471 | | | | 433,847 | | | | 1,072,619 | |
Distribution fees: | | | | | | | | | | | | |
Class I | | | - | | | | - | | | | 86,172 | |
Class C | | | 8,354 | | | | 791 | | | | 127,551 | |
Class A | | | 3,131 | | | | 402 | | | | 12,621 | |
Fund accounting fees | | | 9,502 | | | | 5,066 | | | | 12,516 | |
Transfer agent fees | | | 89,639 | | | | 55,668 | | | | 123,437 | |
Administration fees | | | 35,525 | | | | 21,477 | | | | 53,082 | |
Custody fees | | | 79,345 | | | | 18,769 | | | | 99,696 | |
Registration fees: | | | | | | | | | | | | |
Class S | | | 30,123 | | | | 22,147 | | | | 16,021 | |
Class I | | | - | | | | - | | | | 18,316 | |
Class C | | | 11,700 | | | | 11,177 | | | | 13,549 | |
Class A | | | 12,658 | | | | 12,310 | | | | 13,390 | |
Class Q* | | | - | | | | - | | | | 502 | |
Insurance expense | | | 11,283 | | | | 7,312 | | | | 16,752 | |
Trustee fees and expenses | | | 6,597 | | | | 4,242 | | | | 9,814 | |
Audit and tax service expense | | | 64,678 | | | | 41,216 | | | | 62,656 | |
Recoupment of previously reimbursed expenses | | | - | | | | - | | | | 10,350 | |
Interest expense | | | 3,432 | | | | 1,088 | | | | 990 | |
Other expenses | | | 100,524 | | | | 63,526 | | | | 102,133 | |
| | | | | | | | | | | | |
Total expenses before expense reimbursement | | | 1,183,962 | | | | 699,038 | | | | 1,852,167 | |
Expense reimbursement by Adviser due to expense limitation agreement | | | (31,078 | ) | | | (29,163 | ) | | | (25,510 | ) |
| | | | | | | | | | | | |
Net Expenses | | | 1,152,884 | | | | 669,875 | | | | 1,826,657 | |
| | | | | | | | | | | | |
Net Investment Income/(Loss) | | | 388,046 | | | | 606,191 | | | | 932,766 | |
| | | | | | | | | | | | |
Net Realized and Unrealized Gain/(Loss) on Investments, Foreign Currency and Capital Gains Tax | | | | | | | | | | | | |
Net realized gain/(loss) from investment transactions | | | 9,874,630 | | | | 4,703,346 | | | | 11,896,021 | |
Net realized gain/(loss) from foreign currency transactions | | | 287,624 | | | | (367,632 | ) | | | 58,537 | |
Net realized capital gains tax | | | (28,063 | ) | | | - | | | | (33,954 | ) |
Change in unrealized net appreciation/(depreciation) on investments and foreign currency transactions | | | (23,378,425 | ) | | | (11,104,476 | ) | | | (37,453,624 | ) |
| | | | | | | | | | | | |
Net realized and unrealized gain/(loss) on investments, foreign currency and capital gains tax | | | (13,244,234 | ) | | | (6,768,762 | ) | | | (25,533,020 | ) |
| | | | | | | | | | | | |
Net Increase/(Decrease) in Net Assets Resulting From Operations | | $ | (12,856,188 | ) | | $ | (6,162,571 | ) | | $ | (24,600,254 | ) |
| | | | | | | | | | | | |
| * | Class Q shares of the International Equity Fund closed on April 12, 2011. |
The accompanying notes are an integral part of the financial statements.
(This page is intentionally left blank)
STATEMENTSOF CHANGESIN NET ASSETS
| | | | | | | | |
| | | ICON Asia-Pacific Region Fund | |
| | | Year ended
September 30,
2011 | | | Year ended
September 30,
2010 | |
Operations | | | | | | | | |
Net investment income/(loss) | | $ | 388,046 | | | $ | 99,732 | |
Net realized gain/(loss) on investment transactions | | | 9,874,630 | | | | 16,265,852 | |
Net realized gain/(loss) from foreign currency transactions | | | 287,624 | | | | (418,749 | ) |
Net realized capital gains tax | | | (28,063 | ) | | | (111,185 | ) |
Change in net unrealized appreciation/(depreciation) on investments and foreign currency transactions | | | (23,378,425 | ) | | | (3,881,126 | ) |
| | | | | | | | |
Net increase/(decrease) in net assets resulting from operations | | | (12,856,188 | ) | | | 11,954,524 | |
| | | | | | | | |
Dividends to Shareholders | | | | | | | | |
Net investment income | | | | | | | | |
Class S | | | - | | | | (2,047,982 | ) |
Class I | | | - | | | | (299 | ) |
Class C | | | - | | | | (3,704 | ) |
Class Z | | | - | | | | (115 | ) |
Class A | | | - | | | | (8,693 | ) |
Class Q* | | | - | | | | - | |
| | | | | | | | |
Net decrease from dividends | | | - | | | | (2,060,793 | ) |
| | | | | | | | |
Fund Share Transactions | | | | | | | | |
Shares sold | | | | | | | | |
Class S | | | 24,830,854 | | | | 36,256,247 | |
Class I | | | - | | | | 98,494 | |
Class C | | | 858,994 | | | | 231,787 | |
Class Z | | | - | | | | 1,200 | |
Class A | | | 832,245 | | | | 1,406,633 | |
Class Q* | | | - | | | | - | |
Reinvested dividends and distributions | | | | | | | | |
Class S | | | - | | | | 1,969,593 | |
Class I | | | - | | | | 299 | |
Class C | | | - | | | | 3,127 | |
Class Z | | | - | | | | 115 | |
Class A | | | - | | | | 7,199 | |
Class Q* | | | - | | | | - | |
Shares repurchased | | | | | | | | |
Class S | | | (27,570,610 | ) | | | (85,400,255 | ) |
Class I | | | - | | | | (116,205 | ) |
Class C | | | (286,152 | ) | | | (112,028 | ) |
Class Z | | | - | | | | (7,660 | ) |
Class A | | | (1,054,975 | ) | | | (938,570 | ) |
Class Q* | | | - | | | | - | |
| | | | | | | | |
Net Increase/(decrease) from fund share transactions | | | (2,389,644 | ) | | | (46,600,024 | ) |
| | | | | | | | |
Total net increase/(decrease) in net assets | | | (15,245,832 | ) | | | (36,706,293 | ) |
Net Assets | | | | | | | | |
Beginning of year | | | 72,443,559 | | | | 109,149,852 | |
| | | | | | | | |
End of year | | $ | 57,197,727 | | | $ | 72,443,559 | |
| | | | | | | | |
| | | | | | | | | | | | | | |
| ICON Europe Fund | | | ICON International Equity Fund | |
Year ended
September 30,
2011 | | | Year ended
September 30,
2010 | | | Year ended
September 30,
2011 | | | Year ended
September 30,
2010 | |
| | | | | | | | | | | | | | |
| $ | 606,191 | | | $ | 766,263 | | | $ | 932,766 | | | $ | 928,060 | |
| | 4,703,346 | | | | 6,397,943 | | | | 11,896,021 | | | | 21,040,500 | |
| (367,632 | ) | | | 87,772 | | | | 58,537 | | | | (479,441 | ) |
| | - | | | | - | | | | (33,954 | ) | | | (80,639 | ) |
| (11,104,476 | ) | | | (4,393,093 | ) | | | (37,453,624 | ) | | | (11,081,438 | ) |
| | | | | | | | | | | | | | |
| (6,162,571 | ) | | | 2,858,885 | | | | (24,600,254 | ) | | | 10,327,042 | |
| | | | | | | | | | | | | | |
| | | | | | | | | | | | | | |
| | | | | | | | | | | | | | |
| | (453,210 | ) | | | (491,915 | ) | | | (209,215 | ) | | | (630,736 | ) |
| | - | | | | (20 | ) | | | (118,029 | ) | | | (558,189 | ) |
| | (410 | ) | | | (67 | ) | | | - | | | | (143,688 | ) |
| | - | | | | (40 | ) | | | (82,032 | ) | | | (482,631 | ) |
| | (1,567 | ) | | | (889 | ) | | | (20,141 | ) | | | (79,858 | ) |
| | - | | | | - | | | | (52,806 | ) | | | (157,568 | ) |
| | | | | | | | | | | | | | |
| | (455,187 | ) | | | (492,931 | ) | | | (482,223 | ) | | | (2,052,670 | ) |
| | | | | | | | | | | | | | |
| | | | | | | | | | | | | | |
| | | | | | | | | | | | | | |
| | 7,568,313 | | | | 6,692,968 | | | | 28,322,716 | | | | 6,126,691 | |
| | - | | | | - | | | | 13,088,283 | | | | 11,426,534 | |
| | 5,475 | | | | 60,123 | | | | 918,923 | | | | 1,409,676 | |
| | - | | | | - | | | | 2,581,160 | | | | 6,771,576 | |
| | 10,420 | | | | 19,813 | | | | 1,383,795 | | | | 1,948,858 | |
| | - | | | | - | | | | 23,892 | | | | 417,260 | |
| | | | | | | | | | | | | | |
| | 440,889 | | | | 484,255 | | | | 204,055 | | | | 628,823 | |
| | - | | | | 20 | | | | 101,764 | | | | 491,814 | |
| | 410 | | | | 67 | | | | - | | | | 127,039 | |
| | - | | | | 40 | | | | 79,707 | | | | 439,510 | |
| | 1,511 | | | | 692 | | | | 17,213 | | | | 70,683 | |
| | - | | | | - | | | | 52,676 | | | | 157,214 | |
| | | | | | | | | | | | | | |
| | (21,885,777 | ) | | | (17,663,442 | ) | | | (11,610,081 | ) | | | (12,511,313 | ) |
| | - | | | | (3,632 | ) | | | (17,474,596 | ) | | | (14,836,993 | ) |
| | (2,563 | ) | | | (14,990 | ) | | | (4,428,987 | ) | | | (4,462,878 | ) |
| | - | | | | (3,677 | ) | | | (6,802,428 | ) | | | (24,426,405 | ) |
| | (30,619 | ) | | | (38,218 | ) | | | (3,354,216 | ) | | | (2,257,800 | ) |
| | - | | | | - | | | | (9,287,654 | ) | | | (1,324,612 | ) |
| | | | | | | | | | | | | | |
| | (13,891,941 | ) | | | (10,465,981 | ) | | | (6,183,778 | ) | | | (29,804,323 | ) |
| | | | | | | | | | | | | | |
| | (20,509,699 | ) | | | (8,100,027 | ) | | | (31,266,255 | ) | | | (21,529,951 | ) |
| | | | | | | | | | | | | | |
| | 48,768,858 | | | | 56,868,885 | | | | 110,192,979 | | | | 131,722,930 | |
| | | | | | | | | | | | | | |
| $ | 28,259,159 | | | $ | 48,768,858 | | | $ | 78,926,724 | | | $ | 110,192,979 | |
| | | | | | | | | | | | | | |
STATEMENTSOF CHANGESIN NET ASSETS (CONTINUED)
| | | | | | | | |
| | | ICON Asia-Pacific Region Fund | |
| | | Year ended
September 30,
2011 | | | Year ended
September 30,
2010 | |
Transactions in Fund Shares | | | | | | | | |
Shares sold | | | | | | | | |
Class S | | | 1,912,320 | | | | 3,291,708 | |
Class I | | | - | | | | 8,567 | |
Class C | | | 66,475 | | | | 21,226 | |
Class Z | | | - | | | | 110 | |
Class A | | | 64,370 | | | | 127,018 | |
Class Q* | | | - | | | | - | |
Reinvested dividends and distributions | | | | | | | | |
Class S | | | - | | | | 182,201 | |
Class I | | | - | | | | 28 | |
Class C | | | - | | | | 292 | |
Class Z | | | - | | | | 10 | |
Class A | | | - | | | | 666 | |
Class Q* | | | - | | | | - | |
Shares repurchased | | | | | | | | |
Class S | | | (2,154,565 | ) | | | (7,912,830 | ) |
Class I | | | - | | | | (10,129 | ) |
Class C | | | (22,566 | ) | | | (9,887 | ) |
Class Z | | | - | | | | (650 | ) |
Class A | | | (81,339 | ) | | | (85,752 | ) |
Class Q* | | | - | | | | - | |
| | | | | | | | |
Net increase/(decrease) | | | (215,305 | ) | | | (4,387,422 | ) |
Shares outstanding, beginning of year | | | 5,866,778 | | | | 10,254,200 | |
| | | | | | | | |
Shares outstanding, end of year | | | 5,651,473 | | | | 5,866,778 | |
| | | | | | | | |
Accumulated undistributed net investment income/(loss) | | $ | 217,349 | | | $ | (430,258 | ) |
| | | | | | | | |
| * | Class Q shares of the International Equity Fund closed on April 12, 2011. |
The accompanying notes are an integral part of the financial statements.
| | | | | | | | | | | | | | |
| ICON Europe Fund | | | ICON International Equity Fund | |
Year ended
September 30,
2011 | | | Year ended
September 30,
2010 | | | Year ended
September 30,
2011 | | | Year ended
September 30,
2010 | |
| | | | | | | | | | | | | | |
| | | | | | | | | | | | | | |
| | 540,432 | | | | 548,122 | | | | 2,179,451 | | | | 531,628 | |
| | - | | | | - | | | | 1,070,213 | | | | 1,039,598 | |
| | 402 | | | | 5,033 | | | | 77,449 | | | | 133,245 | |
| | - | | | | - | | | | 206,375 | | | | 591,916 | |
| | 765 | | | | 1,639 | | | | 109,312 | | | | 172,608 | |
| | - | | | | - | | | | 1,884 | | | | 37,359 | |
| | | | | | | | | | | | | | |
| | 32,418 | | | | 38,927 | | | | 16,118 | | | | 55,015 | |
| | - | | | | 2 | | | | 8,240 | | | | 44,069 | |
| | 31 | | | | 6 | | | | - | | | | 11,962 | |
| | - | | | | 3 | | | | 6,377 | | | | 38,963 | |
| | 111 | | | | 55 | | | | 1,382 | | | | 6,283 | |
| | - | | | | - | | | | 4,218 | | | | 13,950 | |
| | | | | | | | | | | | | | |
| | (1,585,829 | ) | | | (1,453,831 | ) | | | (933,083 | ) | | | (1,115,347 | ) |
| | - | | | | (289 | ) | | | (1,434,870 | ) | | | (1,344,907 | ) |
| | (183 | ) | | | (1,276 | ) | | | (375,566 | ) | | | (423,072 | ) |
| | - | | | | (292 | ) | | | (529,937 | ) | | | (2,217,806 | ) |
| | (2,203 | ) | | | (3,065 | ) | | | (267,603 | ) | | | (204,963 | ) |
| | - | | | | - | | | | (718,870 | ) | | | (120,384 | ) |
| | | | | | | | | | | | | | |
| | (1,014,056 | ) | | | (864,966 | ) | | | (578,910 | ) | | | (2,749,883 | ) |
| | 3,764,691 | | | | 4,629,657 | | | | 9,195,763 | | | | 11,945,646 | |
| | | | | | | | | | | | | | |
| | 2,750,635 | | | | 3,764,691 | | | | 8,616,853 | | | | 9,195,763 | |
| | | | | | | | | | | | | | |
$ | 459,347 | | | $ | 675,975 | | | $ | 560,902 | | | $ | 85,776 | |
| | | | | | | | | | | | | | |
FINANCIAL HIGHLIGHTS
| | | | | | | | | | | | | | | | | | | | | | | | |
| | | | | | Income/(loss) from investment operations | | | Less dividends and | |
| | | Net asset
value,
beginning
of period | | | Net
investment
income/
(loss)(x) | | | Net realized
and unrealized
gains/(losses)
on investments | | | Total from
investment
operations | | | Dividends
from net
investment
income | | | Distributions
from net
realized
gains | |
ICON Asia-Pacific Region Fund | | | | | | | | | | | | | | | | | | | | | | | | |
Class S | | | | | | | | | | | | | | | | | | | | | | | | |
Year ended September 30, 2011 | | $ | 12.35 | | | $ | 0.07 | | | $ | (2.30 | ) | | $ | (2.23 | ) | | $ | - | | | $ | - | |
Year ended September 30, 2010 | | | 10.64 | | | | 0.01 | | | | 1.89 | | | | 1.90 | | | | (0.19 | ) | | | - | |
Year ended September 30, 2009 | | | 9.47 | | | | 0.08 | | | | 1.20 | | | | 1.28 | | | | (0.11 | ) | | | - | |
Year ended September 30, 2008 | | | 18.82 | | | | 0.10 | | | | (6.99 | ) | | | (6.89 | ) | | | (0.12 | ) | | | (2.34 | ) |
Year ended September 30, 2007 | | | 13.19 | | | | 0.15 | | | | 5.51 | | | | 5.66 | | | | (0.03 | ) | | | - | |
Class C | | | | | | | | | | | | | | | | | | | | | | | | |
Year ended September 30, 2011 | | | 12.17 | | | | (0.02 | ) | | | (2.27 | ) | | | (2.29 | ) | | | - | | | | - | |
Year ended September 30, 2010 | | | 10.54 | | | | (0.05 | ) | | | 1.82 | | | | 1.77 | | | | (0.14 | ) | | | - | |
Year ended September 30, 2009 | | | 9.41 | | | | 0.02 | | | | 1.18 | | | | 1.20 | | | | (0.07 | ) | | | - | |
January 25, 2008 (inception) to September 30, 2008 | | | 13.73 | | | | 0.05 | | | | (4.37 | ) | | | (4.32 | ) | | | - | | | | - | |
Class A | | | | | | | | | | | | | | | | | | | | | | | | |
Year ended September 30, 2011 | | | 12.35 | | | | 0.04 | | | | (2.29 | ) | | | (2.25 | ) | | | - | | | | - | |
Year ended September 30, 2010 | | | 10.63 | | | | 0.02 | | | | 1.86 | | | | 1.88 | | | | (0.16 | ) | | | - | |
Year ended September 30, 2009 | | | 9.38 | | | | 0.05 | | | | 1.25 | | | | 1.30 | | | | (0.05 | ) | | | - | |
Year ended September 30, 2008 | | | 18.72 | | | | 0.03 | | | | (6.93 | ) | | | (6.90 | ) | | | (0.10 | ) | | | (2.34 | ) |
Year ended September 30, 2007 | | | 13.18 | | | | 0.27 | | | | 5.30 | | | | 5.57 | | | | (0.03 | ) | | | - | |
ICON Europe Fund | | | | | | | | | | | | | | | | | | | | | | | | |
Class S | | | | | | | | | | | | | | | | | | | | | | | | |
Year ended September 30, 2011 | | | 12.95 | | | | 0.19 | | | | (2.73 | ) | | | (2.54 | ) | | | (0.14 | ) | | | - | |
Year ended September 30, 2010 | | | 12.28 | | | | 0.18 | | | | 0.60 | | | | 0.78 | | | | (0.11 | ) | | | - | |
Year ended September 30, 2009 | | | 13.23 | | | | 0.15 | | | | (0.79 | ) | | | (0.64 | ) | | | (0.31 | ) | | | - | |
Year ended September 30, 2008 | | | 24.04 | | | | 0.36 | | | | (8.21 | ) | | | (7.85 | ) | | | (0.21 | ) | | | (2.75 | ) |
Year ended September 30, 2007 | | | 18.82 | | | | 0.21 | | | | 5.33 | | | | 5.54 | | | | (0.05 | ) | | | (0.27 | ) |
Class C | | | | | | | | | | | | | | | | | | | | | | | | |
Year ended September 30, 2011 | | | 12.77 | | | | 0.07 | | | | (2.70 | ) | | | (2.63 | ) | | | (0.07 | ) | | | - | |
Year ended September 30, 2010 | | | 12.15 | | | | 0.09 | | | | 0.56 | | | | 0.65 | | | | (0.03 | ) | | | - | |
Year ended September 30, 2009 | | | 13.12 | | | | 0.07 | | | | (0.80 | ) | | | (0.73 | ) | | | (0.24 | ) | | | - | |
January 25, 2008 (inception) to September 30, 2008 | | | 17.91 | | | | 0.07 | | | | (4.86 | ) | | | (4.79 | ) | | | - | | | | - | |
Class A | | | | | | | | | | | | | | | | | | | | | | | | |
Year ended September 30, 2011 | | | 12.98 | | | | 0.18 | | | | (2.75 | ) | | | (2.57 | ) | | | (0.13 | ) | | | - | |
Year ended September 30, 2010 | | | 12.30 | | | | 0.15 | | | | 0.60 | | | | 0.75 | | | | (0.07 | ) | | | - | |
Year ended September 30, 2009 | | | 13.14 | | | | 0.12 | | | | (0.75 | ) | | | (0.63 | ) | | | (0.21 | ) | | | - | |
Year ended September 30, 2008 | | | 23.91 | | | | 0.26 | | | | (8.17 | ) | | | (7.91 | ) | | | (0.11 | ) | | | (2.75 | ) |
Year ended September 30, 2007 | | | 18.79 | | | | 0.15 | | | | 5.28 | | | | 5.43 | | | | (0.04 | ) | | | (0.27 | ) |
| | | | | | | | | | | | | | | | | | | | | | | | | | | | | | | | | | |
| distributions | | | | | | | | | | | | Ratio of expenses
to average net assets(a) | | | Ratio of net investment
income/(loss)
to average net assets(a) | | | | |
Total
dividends
and
distributions | | | Net asset
value, end
of period | | | Total
return* | | | Net assets,
end of
period (in
thousands) | | | Before
expense
limitation
and transfer
agent
earnings
credit | | | After
expense
limitation
and transfer
agent
earnings
credit | | | Before
expense
limitation
and transfer
agent
earnings
credit | | | After
expense
limitation
and transfer
agent
earnings
credit | | | Portfolio
turnover
rate(b) | |
| | | | | | | | | | | | | | | | | | | | | | | | | | | | | | | | | | |
| | | | | | | | | | | | | | | | | | | | | | | | | | | | | | | | | | |
| $ | - | | | $ | 10.12 | | | | (18.06 | )% | | $ | 55,637 | | | | 1.59 | % | | | 1.59 | % | | | 0.55 | % | | | 0.55 | % | | | 71.03 | % |
| | (0.19 | ) | | | 12.35 | | | | 18.02 | % | | | 70,854 | | | | 1.63 | % | | | 1.63 | % | | | 0.13 | % | | | 0.13 | % | | | 100.41 | % |
| | (0.11 | ) | | | 10.64 | | | | 14.18 | % | | | 108,325 | | | | 1.54 | % | | | 1.54 | % | | | 1.00 | % | | | 1.00 | % | | | 171.05 | % |
| | (2.46 | ) | | | 9.47 | | | | (41.26 | )% | | | 69,519 | | | | 1.42 | % | | | 1.42 | % | | | 0.70 | % | | | 0.70 | % | | | 168.42 | % |
| | (0.03 | ) | | | 18.82 | | | | 43.03 | % | | | 205,332 | | | | 1.38 | % | | | 1.38 | % | | | 0.96 | % | | | 0.97 | % | | | 130.84 | % |
| | | | | | | | | | | | | | | | | | | | | | | | | | | | | | | | | | |
| | - | | | | 9.88 | | | | (18.82 | )% | | | 792 | | | | 4.40 | % | | | 2.55 | %(c) | | | (2.02 | )% | | | (0.17 | )% | | | 71.03 | % |
| | (0.14 | ) | | | 12.17 | | | | 17.02 | % | | | 441 | | | | 9.04 | % | | | 2.57 | %(c) | | | (6.91 | )% | | | (0.44 | )% | | | 100.41 | % |
| | (0.07 | ) | | | 10.54 | | | | 13.10 | % | | | 260 | | | | 19.80 | % | | | 2.55 | %(c) | | | (17.06 | )% | | | 0.19 | % | | | 171.05 | % |
| - | | | | 9.41 | | | | (31.46 | )% | | | 33 | | | | 23.58 | % | | | 2.64 | %(c) | | | (20.28 | )% | | | 0.66 | % | | | 168.42 | % |
| | | | | | | | | | | | | | | | | | | | | | | | | | | | | | | | | | |
| | - | | | | 10.10 | | | | (18.22 | )% | | | 768 | | | | 3.05 | % | | | 1.81 | %(c) | | | (0.97 | )% | | | 0.27 | % | | | 71.03 | % |
| | (0.16 | ) | | | 12.35 | | | | 17.91 | % | | | 1,149 | | | | 5.17 | % | | | 1.82 | %(c) | | | (3.13 | )% | | | 0.22 | % | | | 100.41 | % |
| | (0.05 | ) | | | 10.63 | | | | 14.11 | % | | | 543 | | | | 5.89 | % | | | 1.82 | %(c) | | | (3.41 | )% | | | 0.66 | % | | | 171.05 | % |
| | (2.44 | ) | | | 9.38 | | | | (41.53 | )% | | | 412 | | | | 2.94 | % | | | 1.88 | %(c) | | | (0.82 | )% | | | 0.24 | % | | | 168.42 | % |
| | (0.03 | ) | | | 18.72 | | | | 42.38 | % | | | 973 | | | | 3.26 | % | | | 1.85 | %(c) | | | 0.24 | % | | | 1.65 | % | | | 130.84 | % |
| | | | | | | | | | | | | | | | | | | | | | | | | | | | | | | | | | |
| | | | | | | | | | | | | | | | | | | | | | | | | | | | | | | | | | |
| | (0.14 | ) | | | 10.27 | | | | (19.90 | )% | | | 28,095 | | | | 1.54 | % | | | 1.54 | % | | | 1.40 | % | | | 1.40 | % | | | 51.94 | % |
| | (0.11 | ) | | | 12.95 | | | | 6.40 | % | | | 48,547 | | | | 1.58 | % | | | 1.58 | % | | | 1.48 | % | | | 1.48 | % | | | 105.08 | % |
| | (0.31 | ) | | | 12.28 | | | | (4.13 | )% | | | 56,681 | | | | 1.57 | % | | | 1.57 | % | | | 1.52 | % | | | 1.52 | % | | | 129.97 | % |
| | (2.96 | ) | | | 13.23 | | | | (36.83 | )% | | | 84,320 | | | | 1.35 | % | | | 1.35 | % | | | 1.89 | % | | | 1.89 | % | | | 181.83 | % |
| | (0.32 | ) | | | 24.04 | | | | 29.69 | % | | | 139,069 | | | | 1.35 | % | | | 1.35 | % | | | 0.97 | % | | | 0.97 | % | | | 133.36 | % |
| | | | | | | | | | | | | | | | | | | | | | | | | | | | | | | | | | |
| | (0.07 | ) | | | 10.07 | | | | (20.73 | )% | | | 59 | | | | 19.88 | % | | | 2.52 | %(c) | | | (16.84 | )% | | | 0.52 | % | | | 51.94 | % |
| | (0.03 | ) | | | 12.77 | | | | 5.37 | % | | | 71 | | | | 40.14 | % | | | 2.55 | %(c) | | | (36.86 | )% | | | 0.73 | % | | | 105.08 | % |
| | (0.24 | ) | | | 12.15 | | | | (5.04 | )% | | | 22 | | | | 75.12 | % | | | 2.57 | %(c) | | | (71.83 | )% | | | 0.72 | % | | | 129.97 | % |
| - | | | | 13.12 | | | | (26.74 | )% | | | 16 | | | | 51.24 | % | | | 2.58 | %(c) | | | (48.03 | )% | | | 0.63 | % | | | 181.83 | % |
| | | | | | | | | | | | | | | | | | | | | | | | | | | | | | | | | | |
| | (0.13 | ) | | | 10.28 | | | | (20.04 | )% | | | 105 | | | | 11.29 | % | | | 1.80 | %(c) | | | (8.20 | )% | | | 1.29 | % | | | 51.94 | % |
| | (0.07 | ) | | | 12.98 | | | | 6.16 | % | | | 150 | | | | 17.22 | % | | | 1.80 | %(c) | | | (14.22 | )% | | | 1.21 | % | | | 105.08 | % |
| | (0.21 | ) | | | 12.30 | | | | (4.32 | )% | | | 159 | | | | 11.15 | % | | | 1.82 | %(c) | | | (8.08 | )% | | | 1.25 | % | | | 129.97 | % |
| | (2.86 | ) | | | 13.14 | | | | (37.17 | )% | | | 370 | | | | 4.36 | % | | | 1.83 | %(c) | | | (1.18 | )% | | | 1.35 | % | | | 181.83 | % |
| | (0.31 | ) | | | 23.91 | | | | 29.14 | % | | | 666 | | | | 2.43 | % | | | 1.84 | %(c) | | | 0.09 | % | | | 0.69 | % | | | 133.36 | % |
FINANCIAL HIGHLIGHTS (CONTINUED)
| | | | | | | | | | | | | | | | | | | | | | | | |
| | | | | | Income/(loss) from investment operations | | | Less dividends and | |
| | | Net asset
value,
beginning
of period | | | Net
investment
income/
(loss)(x) | | | Net realized
and unrealized
gains/(losses)
on investments | | | Total from
investment
operations | | | Dividends
from net
investment
income | | | Distributions
from net
realized
gains | |
ICON International Equity Fund | | | | | | | | | | | | | | | | | | | | | | | | |
Class S | | | | | | | | | | | | | | | | | | | | | | | | |
Year ended September 30, 2011 | | $ | 12.26 | | | $ | 0.16 | | | $ | (3.00 | ) | | $ | (2.84 | ) | | $ | (0.08 | ) | | $ | - | |
Year ended September 30, 2010 | | | 11.27 | | | | 0.12 | | | | 1.08 | | | | 1.20 | | | | (0.21 | ) | | | - | |
Year ended September 30, 2009 | | | 10.84 | | | | 0.13 | | | | 0.30 | | | | 0.43 | | | | - | | | | - | |
January 25, 2008 (inception) to September 30, 2008 | | | 15.25 | | | | 0.20 | | | | (4.61 | ) | | | (4.41 | ) | | | - | | | | - | |
Class I | | | | | | | | | | | | | | | | | | | | | | | | |
Year ended September 30, 2011 | | | 11.94 | | | | 0.09 | | | | (2.90 | ) | | | (2.81 | ) | | | (0.04 | ) | | | - | |
Year ended September 30, 2010 | | | 10.97 | | | | 0.07 | | | | 1.06 | | | | 1.13 | | | | (0.16 | ) | | | - | |
Year ended September 30, 2009 | | | 10.71 | | | | 0.05 | | | | 0.37 | | | | 0.42 | | | | (0.16 | ) | | | - | |
Year ended September 30, 2008 | | | 20.09 | | | | 0.22 | | | | (7.48 | ) | | | (7.26 | ) | | | (0.13 | ) | | | (1.99 | ) |
Year ended September 30, 2007 | | | 14.94 | | | | 0.18 | | | | 5.63 | | | | 5.81 | | | | - | (d) | | | (0.66 | ) |
Class C | | | | | | | | | | | | | | | | | | | | | | | | |
Year ended September 30, 2011 | | | 11.30 | | | | - | (d) | | | (2.74 | ) | | | (2.74 | ) | | | - | | | | - | |
Year ended September 30, 2010 | | | 10.40 | | | | (0.01 | ) | | | 1.01 | | | | 1.00 | | | | (0.10 | ) | | | - | |
Year ended September 30, 2009 | | | 10.10 | | | | - | (d) | | | 0.36 | | | | 0.36 | | | | (0.06 | ) | | | - | |
Year ended September 30, 2008 | | | 19.09 | | | | 0.07 | | | | (7.07 | ) | | | (7.00 | ) | | | - | (d) | | | (1.99 | ) |
Year ended September 30, 2007 | | | 14.36 | | | | - | (d) | | | 5.39 | | | | 5.39 | | | | - | | | | (0.66 | ) |
Class Z | | | | | | | | | | | | | | | | | | | | | | | | |
Year ended September 30, 2011 | | | 12.11 | | | | 0.14 | | | | (2.95 | ) | | | (2.81 | ) | | | (0.08 | ) | | | - | |
Year ended September 30, 2010 | | | 11.13 | | | | 0.13 | | | | 1.06 | | | | 1.19 | | | | (0.21 | ) | | | - | |
Year ended September 30, 2009 | | | 10.87 | | | | 0.11 | | | | 0.35 | | | | 0.46 | | | | (0.20 | ) | | | - | |
Year ended September 30, 2008 | | | 20.34 | | | | 0.22 | | | | (7.53 | ) | | | (7.31 | ) | | | (0.17 | ) | | | (1.99 | ) |
Year ended September 30, 2007 | | | 15.07 | | | | 0.20 | | | | 5.73 | | | | 5.93 | | | | - | | | | (0.66 | ) |
Class A | | | | | | | | | | | | | | | | | | | | | | | | |
Year ended September 30, 2011 | | | 12.04 | | | | 0.10 | | | | (2.94 | ) | | | (2.84 | ) | | | (0.04 | ) | | | - | |
Year ended September 30, 2010 | | | 11.07 | | | | 0.08 | | | | 1.06 | | | | 1.14 | | | | (0.17 | ) | | | - | |
Year ended September 30, 2009 | | | 10.78 | | | | 0.06 | | | | 0.37 | | | | 0.43 | | | | (0.14 | ) | | | - | |
Year ended September 30, 2008 | | | 20.24 | | | | 0.18 | | | | (7.52 | ) | | | (7.34 | ) | | | (0.13 | ) | | | (1.99 | ) |
Year ended September 30, 2007 | | | 15.06 | | | | 0.17 | | | | 5.67 | | | | 5.84 | | | | - | | | | (0.66 | ) |
| (x) | Calculated using the average shares method. | |
| * | The total return calculation is for the period indicated and excludes any sales charges. | |
| (a) | Annualized for periods less than a year. | |
| (b) | Portfolio turnover is calculated at the Fund level and is not annualized for periods less than a year. | |
| (c) | The Fund’s operating expenses, not including interest expense, are contractually limited to the amounts discussed in Note 3. The ratios in these financial highlights reflect the limitation, including interest expense. | |
| (d) | Amount less than $0.005. | |
| (e) | The ratio of expenses to average net assets after the contractual expense limitation and voluntary expense waiver and transfer agent earnings credit is 1.29%, 1.73%, 2.52%, 1.25% and 1.76% for Class S, Class I, Class C, Class Z and Class A, respectively. | |
| (f) | The ratio of net investment income/(loss) to average net assets after the contractual expense limitation and voluntary expense waiver and transfer agent earnings credit is 1.47%, 0.62%, (0.01%), 1.25% and 0.74% for Class S, Class I, Class C, Class Z and Class A, respectively. | |
The accompanying notes are an integral part of the financial statements.
| | | | | | | | | | | | | | | | | | | | | | | | | | | | | | | | | | |
| distributions | | | | | | | | | | | | Ratio of expenses
to average net assets(a) | | | Ratio of net investment
income/(loss)
to average net assets(a) | | | | |
Total
dividends
and
distributions | | | Net asset
value, end
of period | | | Total
return* | | | Net assets,
end of
period (in
thousands) | | | Before
expense
limitation
and transfer
agent
earnings
credit | | | After
expense
limitation
and transfer
agent
earnings
credit(C) | | | Before
expense
limitation
and transfer
agent
earnings
credit | | | After
expense
limitation
and transfer
agent
earnings
credit | | | Portfolio
turnover
rate(b) | |
| | | | | | | | | | | | | | | | | | | | | | | | | | | | | | | | | | |
| | | | | | | | | | | | | | | | | | | | | | | | | | | | | | | | | | |
| $ | (0.08 | ) | | $ | 9.34 | | | | (23.32 | )% | | $ | 36,494 | | | | 1.44 | % | | | 1.44 | % | | | 1.28 | % | | | 1.28 | % | | | 91.46 | % |
| | (0.21 | ) | | | 12.26 | | | | 10.78 | % | | | 32,424 | | | | 1.42 | % | | | 1.42 | % | | | 1.08 | % | | | 1.08 | % | | | 111.29 | % |
| | - | | | | 11.27 | | | | 3.97 | % | | | 35,748 | | | | 1.34 | % | | | 1.34 | %(e) | | | 1.42 | % | | | 1.42 | %(f) | | | 182.73 | % |
| - | | | | 10.84 | | | | (28.92 | )% | | | 1,515 | | | | 1.62 | % | | | 1.62 | % | | | 2.08 | % | | | 2.08 | % | | | 188.73 | % |
| | | | | | | | | | | | | | | | | | | | | | | | | | | | | | | | | | |
| | (0.04 | ) | | | 9.09 | | | | (23.62 | )% | | | 24,917 | | | | 1.81 | % | | | 1.80 | % | | | 0.73 | % | | | 0.74 | % | | | 91.46 | % |
| | (0.16 | ) | | | 11.94 | | | | 10.44 | % | | | 36,993 | | | | 1.84 | % | | | 1.80 | % | | | 0.63 | % | | | 0.66 | % | | | 111.29 | % |
| | (0.16 | ) | | | 10.97 | | | | 4.60 | % | | | 36,860 | | | | 1.76 | % | | | 1.76 | %(e) | | | 0.59 | % | | | 0.59 | %(f) | | | 182.73 | % |
| | (2.12 | ) | | | 10.71 | | | | (39.85 | )% | | | 110,029 | | | | 1.55 | % | | | 1.55 | % | | | 1.39 | % | | | 1.39 | % | | | 188.73 | % |
| | (0.66 | ) | | | 20.09 | | | | 40.11 | % | | | 170,383 | | | | 1.54 | % | | | 1.54 | % | | | 1.02 | % | | | 1.03 | % | | | 132.30 | % |
| | | | | | | | | | | | | | | | | | | | | | | | | | | | | | | | | | |
| | - | | | | 8.56 | | | | (24.25 | )% | | | 8,050 | | | | 2.64 | % | | | 2.55 | % | | | (0.11 | )% | | | (0.02 | )% | | | 91.46 | % |
| | (0.10 | ) | | | 11.30 | | | | 9.65 | % | | | 13,990 | | | | 2.69 | % | | | 2.55 | % | | | (0.21 | )% | | | (0.07 | )% | | | 111.29 | % |
| | (0.06 | ) | | | 10.40 | | | | 3.79 | % | | | 15,774 | | | | 2.64 | % | | | 2.55 | %(e) | | | (0.13 | )% | | | (0.04 | )%(f) | | | 182.73 | % |
| | (1.99 | ) | | | 10.10 | | | | (40.38 | )% | | | 22,194 | | | | 2.44 | % | | | 2.44 | % | | | 0.47 | % | | | 0.47 | % | | | 188.73 | % |
| | (0.66 | ) | | | 19.09 | | | | 38.74 | % | | | 29,274 | | | | 2.57 | % | | | 2.56 | % | | | (0.04 | )% | | | (0.03 | )% | | | 132.30 | % |
| | | | | | | | | | | | | | | | | | | | | | | | | | | | | | | | | | |
| | (0.08 | ) | | | 9.22 | | | | (23.38 | )% | | | 6,826 | | | | 1.45 | % | | | 1.45 | % | | | 1.12 | % | | | 1.12 | % | | | 91.46 | % |
| | (0.21 | ) | | | 12.11 | | | | 10.87 | % | | | 12,806 | | | | 1.43 | % | | | 1.36 | % | | | 1.06 | % | | | 1.12 | % | | | 111.29 | % |
| | (0.20 | ) | | | 11.13 | | | | 5.16 | % | | | 29,437 | | | | 1.43 | % | | | 1.25 | %(e) | | | 1.07 | % | | | 1.25 | %(f) | | | 182.73 | % |
| | (2.16 | ) | | | 10.87 | | | | (39.66 | )% | | | 13,580 | | | | 1.27 | % | | | 1.27 | % | | | 1.31 | % | | | 1.31 | % | | | 188.73 | % |
| | (0.66 | ) | | | 20.34 | | | | 40.56 | % | | | 37,619 | | | | 1.26 | % | | | 1.26 | % | | | 1.16 | % | | | 1.16 | % | | | 132.30 | % |
| | | | | | | | | | | | | | | | | | | | | | | | | | | | | | | | | | |
| | (0.04 | ) | | | 9.16 | | | | (23.65 | )% | | | 2,640 | | | | 2.03 | % | | | 1.80 | % | | | 0.56 | % | | | 0.79 | % | | | 91.46 | % |
| | (0.17 | ) | | | 12.04 | | | | 10.38 | % | | | 5,358 | | | | 2.16 | % | | | 1.80 | % | | | 0.33 | % | | | 0.68 | % | | | 111.29 | % |
| | (0.14 | ) | | | 11.07 | | | | 4.65 | % | | | 5,214 | | | | 2.08 | % | | | 1.80 | %(e) | | | 0.42 | % | | | 0.70 | %(f) | | | 182.73 | % |
| | (2.12 | ) | | | 10.78 | | | | (39.95 | )% | | | 7,001 | | | | 1.73 | % | | | 1.73 | % | | | 1.17 | % | | | 1.17 | % | | | 188.73 | % |
| | (0.66 | ) | | | 20.24 | | | | 39.97 | % | | | 6,744 | | | | 1.70 | % | | | 1.69 | % | | | 0.98 | % | | | 0.99 | % | | | 132.30 | % |
NOTESTO FINANCIAL STATEMENTS
SEPTEMBER 30, 2011
1. Organization
The ICON Asia-Pacific Region Fund (“Asia-Pacific Region Fund”), ICON Europe Fund (“Europe Fund”) and ICON International Equity Fund (“International Equity Fund”) are series funds (individually a “Fund” and collectively, the “Funds”). The Funds are part of the ICON Funds (the “Trust”), a Massachusetts business trust registered under the Investment Company Act of 1940, as amended (the “1940 Act”) as an open-end investment management company. The Asia-Pacific Region Fund and the Europe Fund each have three classes of shares: Class S, Class C and Class A. The International Equity Fund has five classes of shares: Class S, Class I, Class C, Class Z and Class A. All classes have equal rights as to earnings, assets and voting privileges except that each Class may bear different distribution fees, registration costs, legal costs, mailing and printing costs and shareholder servicing costs and each Class has exclusive voting rights with respect to its distribution plan. There are currently fourteen other active Funds within the Trust. Those Funds are covered by separate prospectuses and shareholder reports.
Each Fund is authorized to issue an unlimited number of no par shares. The Funds primarily invest in foreign securities; the Asia-Pacific Region Fund and the Europe Fund primarily invest in companies whose principal business activities fall within specific regions. The investment objective of each Fund is to provide long-term capital appreciation.
The Funds may have elements of risk, including the risk of loss of principal. There is no assurance that the investment process will consistently lead to successful results. An investment concentrated in sectors and industries may involve greater risk and volatility than a more diversified investment. Investments in foreign securities and currency transactions may involve certain considerations and risks not typically associated with those of U.S. dollar-denominated transactions as a result of, among other factors, the possibility of lower government supervision and regulation of foreign securities markets and the possibility of political or economic instability. Financial statements of foreign companies are governed by different accounting, auditing, and financial standards than U.S. companies and may be less transparent and uniform than in the United States. Many corporate governance standards, which help ensure the integrity of public information in the United States, may not exist in some foreign countries. In general, there may be less governmental supervision of foreign stock exchanges and securities brokers and issuers. There are also risks associated with small- and
| | |
| 48 | | NOTESTO FINANCIAL STATEMENTS |
mid-cap investing, including limited product lines, less liquidity, and small market share.
The Asia-Pacific Region Fund has a significant weighting in the Financial sector and the Europe Fund has a significant weighting in Germany which may cause each Fund’s performance to be susceptible to the economic, business and/or other developments that may affect that country and/or sector.
In the normal course of business, the Funds may enter into various agreements that provide for general indemnifications. Each Fund’s maximum exposure under these arrangements is unknown as any potential exposure involving future claims that may be made against each Fund is unknown. However, based on experience, the Funds expect the risk of loss to be minimal.
2. Significant Accounting Policies
The following is a summary of significant accounting policies consistently followed by the Funds in the preparation of their financial statements. The preparation of financial statements in conformity with accounting principles generally accepted in the United States of America requires management to make certain estimates and assumptions that affect the reported amounts of assets and liabilities, disclosure of contingent assets and liabilities at the date of the financial statements, and the reported amounts of income and expenses during the reporting period. Actual results may differ from these estimates.
Investment Valuation
The Funds’ securities and other assets, excluding options on securities indexes, are valued as of the closing price at the close of regular trading on the New York Stock Exchange (the “NYSE”) (normally 4 p.m. Eastern Standard Time) each day the NYSE is open, except that securities traded primarily on the NASDAQ Stock Market (“NASDAQ”) are normally valued by the Funds at the NASDAQ Official Closing Price provided by NASDAQ each business day. Options on securities indexes are valued at the close of the Chicago Board Options Exchange (normally 4:15 p.m. Eastern Standard Time) on each day the New York Stock Exchange is open for trading.
The Funds use pricing services to obtain the market value of securities in their portfolios; if a pricing service is not able to provide a price, or the pricing service’s valuation quote is considered inaccurate or does not reflect
| | | | |
| NOTESTO FINANCIAL STATEMENTS | | | 49 | |
NOTESTO FINANCIAL STATEMENTS (CONTINUED)
the market value of the security, prices may be obtained through market quotations from independent broker/dealers. If market quotations from these sources are not readily available, the Funds’ securities or other assets are valued at fair value as determined in good faith by the Funds’ Board of Trustees (“Board”) or pursuant to procedures approved by the Board.
Lacking any sales that day, a security is valued at the current closing bid price (or yield equivalent thereof) or based on quotes obtained from dealers making a market for the security. Options are valued at their closing mid-price on the market with the most volume. Mid-price is the average of the closing bid and closing ask prices. Debt securities with a remaining maturity of greater than 60 days are valued in accordance with the evaluated bid price supplied by the pricing service. The evaluated bid price supplied by the pricing service is based upon a matrix valuation system which considers such factors as security prices, yields, maturities and ratings. Short-term debt securities with remaining maturities of 60 days or less are generally valued at amortized cost or original cost plus accrued interest, which approximates market value. Currency rates as of the close of the NYSE are used to convert foreign security values into U.S. dollars.
The Funds’ securities that traded in countries outside of the Western Hemisphere are fair valued daily by utilizing the quotations of an independent pricing service, unless the Board determines that use of another valuation methodology is appropriate. The purposes of daily fair valuation are to avoid stale prices and to take into account, among other things, any significant events occurring after the close of foreign markets. The pricing service uses statistical analyses and quantitative models to adjust local market prices using factors such as subsequent movements and changes in the prices of indexes, securities and exchange rates in other markets to determine fair value as of the time a Fund calculates its net asset value (“NAV”). The valuation assigned to fair-value securities for purposes of calculating a Fund’s NAV may differ from the security’s most recent closing market price and from the prices used by other mutual funds to calculate their NAVs.
Investments in other open-end investment companies are valued at net asset value.
Various inputs are used to determine the value of the Funds’ investments. These inputs are summarized in the three broad levels listed below:
Level 1 — quoted prices in active markets for identical securities.
| | |
| 50 | | NOTESTO FINANCIAL STATEMENTS |
Level 2 — significant observable inputs other than Level 1 quoted prices (including, but not limited to, quoted prices for similar securities, interest rates, prepayment speeds, and credit risk).
Level 3 — significant unobservable inputs.
Observable inputs are those based on market data obtained from sources independent of the Funds, and unobservable inputs reflect the Funds’ own assumptions based on the best information available. The input levels are not necessarily an indication of the risk or liquidity associated with investments at that level. For example, non-U.S. equity securities actively traded in foreign markets generally are reflected in Level 2 despite the availability of closing prices, because the Funds evaluate and determine whether those closing prices reflect fair value at the close of the NYSE or require adjustment, as described above. The following table summarizes the Funds’ investments, based on the inputs used to determine their values on September 30, 2011:
| | | | | | | | | | | | | | | | |
| | | Level 1 | | | Level 2 | | | Level 3 | | | Total | |
ICON Asia-Pacific Region Fund* | | | | | | | | | | | | | | | | |
Assets | | | | | | | | | | | | | | | | |
Common Stocks | | | | | | | | | | | | | | | | |
South Korea | | $ | - | | | $ | 12,596,608 | | | $ | - | | | $ | 12,596,608 | |
Japan | | | - | | | | 10,958,351 | | | | - | | | | 10,958,351 | |
Australia | | | - | | | | 7,002,523 | | | | - | | | | 7,002,523 | |
China | | | 598,696 | | | | 5,830,930 | | | | - | | | | 6,429,626 | |
Singapore | | | - | | | | 4,613,349 | | | | - | | | | 4,613,349 | |
India | | | - | | | | 4,097,239 | | | | - | | | | 4,097,239 | |
Thailand | | | - | | | | 3,355,394 | | | | - | | | | 3,355,394 | |
Hong Kong | | | - | | | | 2,949,808 | | | | 91,815 | | | | 3,041,623 | |
Other Countries | | | - | | | | 3,658,503 | | | | - | | | | 3,658,503 | |
Collateral for Securities on Loan | | | - | | | | 6,792,269 | | | | - | | | | 6,792,269 | |
Short-Term Investments | | | - | | | | 1,009,895 | | | | - | | | | 1,009,895 | |
| | | | | | | | | | | | | | | | |
Total | | $ | 598,696 | | | $ | 62,864,869 | | | $ | 91,815 | | | $ | 63,555,380 | |
| | | | | | | | | | | | | | | | |
| | | | |
| NOTESTO FINANCIAL STATEMENTS | | | 51 | |
NOTESTO FINANCIAL STATEMENTS (CONTINUED)
| | | | | | | | | | | | | | | | |
| | | Level 1 | | | Level 2 | | | Level 3 | | | Total | |
ICON Europe Fund* | | | | | | | | | | | | | | | | |
Assets | | | | | | | | | | | | | | | | |
Common Stocks | | | | | | | | | | | | | | | | |
Germany | | $ | - | | | $ | 9,269,772 | | | $ | - | | | $ | 9,269,772 | |
France | | | - | | | | 5,067,351 | | | | - | | | | 5,067,351 | |
Switzerland | | | - | | | | 3,225,224 | | | | - | | | | 3,225,224 | |
United Kingdom | | | - | | | | 2,970,747 | | | | - | | | | 2,970,747 | |
Norway | | | - | | | | 1,902,647 | | | | - | | | | 1,902,647 | |
Other Countries | | | 501,900 | | | | 4,426,967 | | | | - | | | | 4,928,867 | |
Preferred Stock | | | | | | | | | | | | | | | | |
Germany | | | - | | | | 114,315 | | | | - | | | | 114,315 | |
Collateral for Securities on Loan | | | - | | | | 826,916 | | | | - | | | | 826,916 | |
| | | | | | | | | | | | | | | | |
Total | | $ | 501,900 | | | $ | 27,803,939 | | | $ | - | | | $ | 28,305,839 | |
| | | | | | | | | | | | | | | | |
ICON International Equity Fund* | | | | | | | | | | | | | | | | |
Assets | | | | | | | | | | | | | | | | |
Common Stocks | | | | | | | | | | | | | | | | |
South Korea | | $ | - | | | $ | 11,581,832 | | | $ | - | | | $ | 11,581,832 | |
Germany | | | - | | | | 10,554,856 | | | | - | | | | 10,554,856 | |
France | | | - | | | | 6,773,617 | | | | - | | | | 6,773,617 | |
Canada | | | 6,635,977 | | | | - | | | | - | | | | 6,635,977 | |
China | | | 844,589 | | | | 5,494,558 | | | | - | | | | 6,339,147 | |
Brazil | | | 751,247 | | | | - | | | | - | | | | 751,247 | |
Other Countries | | | 1,987,777 | | | | 27,327,539 | | | | 240,414 | | | | 29,555,730 | |
Preferred Stocks | | | | | | | | | | | | | | | | |
Brazil | | | 4,830,630 | | | | - | | | | - | | | | 4,830,630 | |
Collateral for Securities on Loan | | | - | | | | 5,156,672 | | | | - | | | | 5,156,672 | |
Short-Term Investments | | | - | | | | 416,675 | | | | - | | | | 416,675 | |
| | | | | | | | | | | | | | | | |
Total | | $ | 15,050,220 | | | $ | 67,305,749 | | | $ | 240,414 | | | $ | 82,596,383 | |
| | | | | | | | | | | | | | | | |
| * | Please refer to the Schedule of Investments and the Sector/Industry Classification and Country Composition tables for additional security details. |
For the year ended September 30, 2011, there was no significant transfer activity between Level 1 and Level 2.
| | |
| 52 | | NOTESTO FINANCIAL STATEMENTS |
A roll forward of fair value measurements using significant unobservable inputs (Level 3) for the year ended September, 2011 for the Asia-Pacific Region Fund and the International Equity Fund, was as follows:
| | | | |
| | | Common Stocks
Hong Kong | |
ICON Asia-Pacific Region Fund | | | | |
Beginning balance 9/30/10 | | $ | - | |
Net purchases (sales) | | | - | |
Accrued discounts (premiums) | | | - | |
Total realized gains (losses) | | | - | |
Total change in unrealized appreciation (depreciation) | | | - | |
Transfers in to Level 3* | | | 91,815 | |
Transfers out of Level 3 | | | - | |
| | | | |
Ending balance 9/30/11 | | $ | 91,815 | |
| | | | |
Net change in unrealized appreciation (depreciation) on investments held at 9/30/11 | | $ | (449,104 | ) |
| | | | |
| |
| | | Common Stocks
Hong Kong | |
ICON International Equity Fund | | | | |
Beginning balance 9/30/10 | | $ | - | |
Net purchases (sales) | | | - | |
Accrued discounts (premiums) | | | - | |
Total realized gains (losses) | | | - | |
Total change in unrealized appreciation (depreciation) | | | - | |
Transfers in to Level 3* | | | 240,414 | |
Transfers out of Level 3 | | | - | |
| | | | |
Ending balance 9/30/11 | | $ | 240,414 | |
| | | | |
Net change in unrealized appreciation (depreciation) on investments held at 9/30/11 | | $ | (1,133,353 | ) |
| | | | |
| * | Transferred out of Level 2 into Level 3 because sufficient observable inputs were not available. |
Net realized gain/(loss) and net change in unrealized appreciation/depreciation is reflected on the Statement of Operations.
Foreign Currency Translation
The accounting records of the Funds are maintained in U.S. dollars. Investment securities and other assets and liabilities denominated in a foreign currency are translated daily into U.S. dollars at the prevailing rates
| | | | |
| NOTESTO FINANCIAL STATEMENTS | | | 53 | |
NOTESTO FINANCIAL STATEMENTS (CONTINUED)
of exchange. Income and expenses are translated into U.S. dollars at the prevailing exchange rate on the respective dates of the transactions. Purchases and sales of securities are translated into U.S. dollars at the contractual currency exchange rates established at the time of each trade.
The Funds do not isolate that portion of the results of operations resulting from changes in foreign exchange rates on investments from the fluctuations arising from changes in market prices of securities held. Net unrealized appreciation or depreciation on investments and foreign currency translations arise from changes in the value of assets and liabilities, resulting from changes in the exchange rates and changes in market prices of securities held.
Forward Foreign Currency Contracts
The Funds may enter into short-term forward foreign currency contracts. A forward foreign currency contract is an agreement between contracting parties to exchange an amount of currency at some future time at an agreed upon rate. The Funds may use forward foreign currency contracts to manage foreign currency exposure with respect to transactional hedging, positional hedging, cross hedging and proxy hedging.
These contracts involve market risk and do not eliminate fluctuations in the prices of portfolio securities or prevent losses if the prices of those securities decline. The Funds could be exposed to risk if the value of the currency changes unfavorably. Additionally, the Funds could be exposed to counterparty risk if the counterparties are unable to meet the terms of the contracts.
These contracts are marked-to-market daily. Net realized gains and losses on foreign currency transactions represent disposition of foreign currencies, and the difference between the amount recorded at the time of the transaction and the U.S. dollar amount actually received. Any realized gain or loss incurred by the Funds due to foreign currency translation is included on the Statement of Operations. At September 30, 2011, the Asia-Pacific Region Fund, Europe Fund and International Equity Fund had no outstanding forward foreign currency contracts.
| | |
| 54 | | NOTESTO FINANCIAL STATEMENTS |
The following is a summary of how these derivatives are treated in the financial statements and their impact on the Funds:
Amount of Realized Gain or (Loss) on Derivatives Recognized in Operations
| | | | | | |
Derivatives not accounted for as hedging
instruments | | Location of Gain/(Loss)
on Derivatives
Recognized in Operations | | Amount | |
Foreign exchange contracts | | | | | | |
Foreign exchange risk | | | | | | |
ICON Asia-Pacific Region Fund | | Net realized gain/(loss) from | | $ | 232,585 | |
ICON Europe Fund | | foreign currency transactions | | | (296,220 | ) |
ICON International Equity Fund | | | | | 267,566 | |
Change in Unrealized Appreciation/(Depreciation) on Derivatives Recognized in Operations
| | | | | | |
Derivatives not accounted for as hedging
instruments | | Location of Gain/(Loss)
on Derivatives
Recognized in Operations | | Amount | |
Foreign exchange contracts | | | | | | |
Foreign exchange risk | | | | | | |
ICON Asia-Pacific Region Fund | | Change in unrealized net | | $ | (224,856 | ) |
ICON Europe Fund | | appreciation/(depreciation) on | | | 220,789 | |
ICON International Equity Fund | | foreign currency transactions | | | (312,473 | ) |
The number of contracts open during the year ended September 30, 2011 for the Asia-Pacific Region Fund, Europe Fund, and International Equity Fund were 1, 2, and 4, respectively.
The Funds value derivatives at fair value, as described above, and recognize changes in fair value currently in the results of operations. Accordingly, the Funds do not follow hedge accounting even for derivatives employed as economic hedges.
Securities Lending
Under procedures adopted by the Board, the Funds may lend securities to non-affiliated qualified parties. The Funds seek to earn additional income through securities lending. There is the risk of delay in recovering a loaned security. The Funds do not have the right to vote on securities while they are on loan; however, the Funds may attempt to call back the loan and vote the proxy.
| | | | |
| NOTESTO FINANCIAL STATEMENTS | | | 55 | |
NOTESTO FINANCIAL STATEMENTS (CONTINUED)
All loans will be continuously secured by collateral which consists of cash. The cash collateral is invested in the State Street Navigator Prime Portfolio and is disclosed on the Schedule of Investments. The lending fees received and the Funds’ portion of the interest income earned on cash collateral are included on the Statement of Operations, if applicable.
As of September 30, 2011, the following Funds had securities with the following values on loan:
| | | | | | | | |
| Fund | | Value of
Loaned Securities | | | Value of
Collateral | |
ICON Asia-Pacific Region Fund | | $ | 6,291,167 | | | $ | 6,792,269 | |
ICON Europe Fund | | | 737,761 | | | | 826,916 | |
ICON International Equity Fund | | | 4,790,217 | | | | 5,156,672 | |
The value of the collateral above could include collateral held for securities that were sold on or before September 30, 2011. It may also include collateral received from the pre-funding of loans.
Income Taxes
The Funds intend to qualify as regulated investment companies under Subchapter M of the Internal Revenue Code and, accordingly, the Funds will generally not be subject to federal and state income taxes, or federal excise taxes to the extent that they intend to make sufficient distributions of net investment income and net realized capital gains.
Dividends paid by the Funds from net investment income and distributions of net realized short-term gains are, for federal income tax purposes, taxable as ordinary income to shareholders.
Dividends and distributions to shareholders are recorded by the Funds on the ex-dividend/distribution date. The Funds distribute income and net realized capital gains, if any, to shareholders at least annually, if not offset by capital loss carryforward. The Funds may utilize equalization accounting for tax purposes and designate earnings and profits, including net realized gains distributed to shareholders on redemption of shares, as part of the dividends paid deduction for income tax purposes. Income distributions and capital gain distributions are determined in accordance with income tax regulations, which may differ from accounting principles generally accepted in the United States of America.
| | |
| 56 | | NOTESTO FINANCIAL STATEMENTS |
Management has analyzed the Funds’ tax positions taken on federal income tax returns for all open tax years and has concluded that no provision for federal income tax is required in the Funds’ financial statements.
The Funds file U.S. tax returns. While the statute of limitations remains open to examine the Funds’ U.S. tax returns filed for the past four years, no examinations are in progress or anticipated at this time. The Funds are not aware of any tax positions for which it is reasonably possible that the total amounts of unrecognized tax benefits will significantly change in the next twelve months.
Certain foreign countries impose a tax on capital gains which is accrued by the Funds based on the unrealized appreciation, if any, on affected securities. Any accrual would reduce a Fund’s NAV. The tax is paid when the gain is realized.
Investment Income
Dividend income is recorded on the ex-dividend date. Non-cash dividends included in dividend income, if any, are recorded at the fair value of the securities received. Interest income is accrued as earned. Certain dividends from foreign securities are recorded as soon as the Funds are informed of the dividend if such information is obtained subsequent to the ex-dividend date. Discounts and premiums on securities purchased are amortized over the life of the respective securities.
Investment Transactions
Security transactions are accounted for no later than one business day after the trade date. However, for financial reporting purposes, security transactions are accounted for on the trade date. Gains and losses on securities sold are determined on the basis of identified cost.
Allocation of Expenses
Each class of a Fund’s shares bears expenses incurred specifically on its behalf and, in addition, each class bears a portion of general expenses, based upon relative net assets of each class. Expenses which cannot be directly attributed to a specific Fund in the Trust are apportioned between all Funds in the Trust based upon relative net assets. In calculating the net asset value per share of each class, investment income, realized and unrealized gains and
| | | | |
| NOTESTO FINANCIAL STATEMENTS | | | 57 | |
NOTESTO FINANCIAL STATEMENTS (CONTINUED)
losses and expenses other than class-specific expenses are allocated daily to each class of shares based upon the proportion of net assets.
Below are the class level expenses that are included on the Statement of Operations:
| | | | | | | | | | | | |
| Fund | | Legal
Expense | | | Printing
And Postage
Expense | | | Transfer
Agent
Expense | |
ICON Asia-Pacific Region Fund | | | | | | | | | | | | |
Class S | | $ | 8,272 | | | $ | 50,655 | | | $ | 80,386 | |
Class C | | | 99 | | | | 624 | | | | 4,780 | |
Class A | | | 149 | | | | 899 | | | | 4,473 | |
ICON Europe Fund | | | | | | | | | | | | |
Class S | | | 5,426 | | | | 25,899 | | | | 49,570 | |
Class C | | | 10 | | | | 48 | | | | 2,882 | |
Class A | | | 20 | | | | 101 | | | | 3,216 | |
ICON International Equity Fund | | | | | | | | | | | | |
Class S | | | 4,873 | | | | 15,298 | | | | 20,130 | |
Class I | | | 4,089 | | | | 12,869 | | | | 49,827 | |
Class C | | | 1,486 | | | | 4,794 | | | | 26,198 | |
Class Z | | | 1,400 | | | | 4,503 | | | | 14,607 | |
Class A | | | 579 | | | | 1,895 | | | | 9,354 | |
Class Q* | | | 333 | | | | 1,013 | | | | 3,321 | |
| * | Class Q shares of the International Equity Fund were closed on April 12, 2011. |
3. Fees and Other Transactions with Affiliates
Investment Advisory Fees
ICON Advisers, Inc. (“ICON Advisers”) serves as investment adviser to the Funds and is responsible for managing the Funds’ portfolios of securities. ICON Advisers receives a monthly management fee that is computed daily at an annual rate of 1.00% of each Fund’s average daily net assets.
ICON Advisers has contractually agreed to limit the Funds’ operating expenses (exclusive of brokerage, interest, taxes, and extraordinary expenses) to the extent necessary to ensure that the Funds’ expenses do not exceed the following amounts:
| | | | | | | | | | | | | | | | | | | | |
| Fund | | Class S | | | Class I | | | Class C | | | Class Z | | | Class A | |
ICON Asia-Pacific Region Fund | | | - | | | | N/A | | | | 2.55% | | | | N/A | | | | 1.80% | |
ICON Europe Fund | | | - | | | | N/A | | | | 2.55% | | | | N/A | | | | 1.80% | |
ICON International Equity Fund | | | 1.55% | | | | 1.80% | | | | 2.55% | | | | 1.55% | | | | 1.80% | |
| | |
| 58 | | NOTESTO FINANCIAL STATEMENTS |
Effective February 18, 2011, the expense limitation for Class S shares of ICON International Equity Fund decreased from 1.80% to 1.55%.
The Funds’ expense limitations will continue in effect until at least January 31, 2021. To the extent ICON Advisers reimburses or absorbs fees and expenses, it may seek payment of such amounts for up to three years after the expenses were reimbursed or absorbed. A Fund will make no such payment, however, if the total Fund operating expenses exceed the expense limits in effect at the time the expenses were reimbursed or at the time these payments are proposed.
As of September 30, 2011 the following amounts were still available for recoupment by ICON Advisers based upon their potential expiration dates:
| | | | | | | | | | | | |
| Fund | | 2012 | | | 2013 | | | 2014 | |
ICON Asia-Pacific Region Fund | | $ | 27,778 | | | $ | 47,207 | | | $ | 31,078 | |
ICON Europe Fund | | | 26,513 | | | | 42,776 | | | | 29,163 | |
ICON International Equity Fund | | | 61,349 | | | | 53,159 | | | | 25,510 | |
Accounting, Custody and Transfer Agent Fees
State Street Bank and Trust Company, (“State Street”) serves as the fund accounting agent for the funds. For its services, the Trust pays State Street a fee that is calculated daily and paid monthly at an annual rate based on the aggregate average daily assets of the Trust.
State Street is the custodian of the Trust’s investments. For its services, the Trust pays State Street asset-based fees that vary according to the number of positions and transactions, plus out-of-pocket expenses.
Boston Financial Data Services, Inc. (“BFDS”) is the Trust’s transfer agent. For these services, the Trust pays a per account fee, plus certain other transaction cusip charges and out-of-pocket expenses. BFDS may pay each Fund transfer agent earnings credits. Transfer agent earnings credits are credits received for interest which results from overnight balances used by BFDS for clearing shareholder transactions.
Administrative Services
The Trust has entered into an administrative services agreement with ICON Advisers pursuant to which ICON Advisers oversees the administration of the Trust’s business and affairs. This agreement provides for an annual fee of 0.05% on the Trust’s first $1.5 billion of average daily net assets, 0.045% on the next $1.5 billion of average daily net assets, 0.040% on the next $2 billion
| | | | |
| NOTESTO FINANCIAL STATEMENTS | | | 59 | |
NOTESTO FINANCIAL STATEMENTS (CONTINUED)
of average daily net assets and 0.030% on average daily net assets over $5 billion. For the year ended September 30, 2011, each Funds’ payment for administrative services to ICON Advisers is included on the Statement of Operations. The administrative services agreement provides that ICON Advisers will not be liable for any error of judgment, mistake of law, or any loss suffered by the Trust in connection with matters to which the administrative services agreement relates, except for a loss resulting from willful misfeasance, bad faith or negligence by ICON Advisers in the performance of its duties.
ICON Advisers has a sub-administration agreement with State Street to which State Street assists ICON Advisers with the administration and business affairs of the Trust. For its services, ICON Advisers pays State Street a fee that is calculated daily and paid monthly at an annual rate based on the aggregate average daily assets of the Trust.
Distribution Fees
The Funds have adopted a Distribution Plan pursuant to Rule 12b-1 under the 1940 Act (“12b-1 Plan”) under which the Funds are authorized to compensate the Funds’ distributor, ICON Distributors, Inc. (“IDI”) (an affiliate of the adviser) for the sale and distribution of shares. Under the 12b-1 Plan, Class I and Class A shareholders pay an annual distribution and service fee of 0.25% of average daily net assets. The Class C shareholders pay an annual distribution and service fee of 1.00% of average daily net assets. The total amount paid under the 12b-1 plans by the Funds is shown on the Statement of Operations.
Other Related Parties
Certain Officers and Directors of ICON Advisers are also Officers and Trustees of the Funds; however, such Officers and Trustees (with the exception of the Chief Compliance Officer, “CCO”) receive no compensation from the Funds. The CCO’s salary is paid 86% by the Trust and 14% by ICON Advisers. For the year ended September 30, 2011, the total related amounts paid by the Funds under this arrangement are included in Other Expenses on the Statements of Operations.
Some of the distribution amounts received by IDI, discussed in the Distribution Fees section above, have been used to offset various shareholder servicing costs incurred by ICON Advisers. For the year ended September 30, 2011, this amount was $7,992.
| | |
| 60 | | NOTESTO FINANCIAL STATEMENTS |
4. Borrowings
The Trust has entered into Lines of Credit agreements with State Street to provide temporary funding for redemption requests. The maximum borrowing is limited to $150 million. Interest on domestic borrowings is charged at the higher of the Federal Funds Rate effective on that day and the Overnight LIBOR Rate effective on that day plus 1.25%. The average interest rate charged for the year ended September 30, 2011 was 1.44%.
| | | | |
| Fund | | Average Borrowing
(10/1/10-9/30/11) | |
ICON Asia-Pacific Region Fund | | $ | 235,233 | |
ICON Europe Fund* | | | 77,220 | |
ICON International Equity Fund | | | 68,525 | |
| * | Fund had outstanding borrowings under these agreements as of September 30, 2011. |
5. Purchases and Sales of Investment Securities
For the year ended September 30, 2011, the aggregate cost of purchases and proceeds from sales of investment securities (excluding short-term securities) was as follows:
| | | | | | | | |
| Fund | | Purchases of
Securities | | | Proceeds
from Sales of
Securities | |
ICON Asia-Pacific Region Fund | | $ | 49,418,483 | | | $ | 52,266,151 | |
ICON Europe Fund | | | 21,696,800 | | | | 35,314,841 | |
ICON International Equity Fund | | | 95,080,491 | | | | 100,507,298 | |
6. Federal Income Tax
Income and capital gain distributions are determined in accordance with income tax regulations that may differ from accounting principles that are generally accepted in the United States of America. These differences are due to differing treatments for items such as net short-term gains, deferrals of wash sale losses, foreign currency transactions, net investment losses, and capital loss carryforwards.
The tax components of capital shown in the following tables include losses the Funds may be able to offset against gains recognized in future years. The accumulated losses noted represent net capital loss carryforwards as of September 30, 2011 and post-October losses that may be available to offset future realized capital gains and thereby reduce future taxable income distributions.
| | | | |
| NOTESTO FINANCIAL STATEMENTS | | | 61 | |
NOTESTO FINANCIAL STATEMENTS (CONTINUED)
For the year ended September 30, 2011 the following Funds had capital loss carryforwards:
| | | | | | | | |
| Fund | | Amounts | | | Expires | |
ICON Asia-Pacific Region Fund | | $ | 10,719,331 | | | | 2017 | |
ICON Europe Fund | | | 24,032,405 | | | | 2017 | |
| | | 26,614,409 | | | | 2018 | |
ICON International Equity Fund | | | 53,195,839 | | | | 2017 | |
| | | 27,012,993 | | | | 2018 | |
Future capital loss carryforward utilization in any given year may be limited if there are substantial shareholder redemptions or contributions. During the year ended September 30, 2011, the Funds utilized capital loss carryforwards:
| | | | |
| Fund | | Amount | |
ICON Asia-Pacific Region Fund | | $ | 9,873,592 | |
ICON Europe Fund | | | 4,703,346 | |
ICON International Equity Fund | | | 11,896,021 | |
The tax characteristics of distributions paid to shareholders during the fiscal year ended September 30, 2011, were as follows:
| | | | | | | | |
| Fund | | Distributions
Paid from
Ordinary Income | | | Total
Distributions
Paid | |
ICON Asia-Pacific Region Fund | | $ | - | | | $ | - | |
ICON Europe Fund | | | 455,187 | | | | 455,187 | |
ICON International Equity Fund | | | 482,223 | | | | 482,223 | |
The tax characteristics of distributions paid to shareholders during the fiscal year ended September 30, 2010, were as follows:
| | | | | | | | |
| Fund | | Distributions
Paid from
Ordinary Income | | | Total
Distributions
Paid | |
ICON Asia-Pacific Region Fund | | $ | 2,060,793 | | | $ | 2,060,793 | |
ICON Europe Fund | | | 492,931 | | | | 492,931 | |
ICON International Equity Fund | | | 2,052,670 | | | | 2,052,670 | |
| | |
| 62 | | NOTESTO FINANCIAL STATEMENTS |
As of September 30, 2011, the components of accumulated earnings/(deficit) on a tax basis were as follows:
| | | | | | | | | | | | | | | | |
| Fund | | Undistributed
Ordinary
Income | | | Accumulated
Capital and
Other Losses | | | Unrealized
Appreciation/
(Depreciation)* | | | Total
Accumulated
Earnings/
(Deficit) | |
ICON Asia-Pacific Region Fund | | $ | 217,349 | | | $ | (10,719,331 | ) | | $ | (11,780,096 | ) | | $ | (22,282,078 | ) |
ICON Europe Fund | | | 460,661 | | | | (50,646,814 | ) | | | (7,680,382 | ) | | | (57,866,535 | ) |
ICON International Equity Fund | | | 560,902 | | | | (80,208,832 | ) | | | (27,611,289 | ) | | | (107,259,219 | ) |
| * | Differences between the book-basis and tax-basis unrealized appreciation/(depreciation) are attributable primarily to tax deferral of losses on wash sales. |
As of September 30, 2011, cost on investments for federal income tax purposes and the amount of net unrealized appreciation/(depreciation) were as follows:
| | | | | | | | | | | | | | | | |
| Fund | | Cost | | | Unrealized Appreciation | | | Unrealized (Depreciation) | | | Net
Appreciation/ (Depreciation) | |
ICON Asia-Pacific Region Fund | | $ | 75,307,269 | | | $ | 2,781,079 | | | $ | (14,532,968 | ) | | $ | (11,751,889 | ) |
ICON Europe Fund | | | 35,988,634 | | | | 919,277 | | | | (8,602,072 | ) | | | (7,682,795 | ) |
ICON International Equity Fund | | | 110,208,806 | | | | 2,771,355 | | | | (30,383,778 | ) | | | (27,612,423 | ) |
The Regulated Investment Company Modernization Act of 2010 (the “Act”) was signed into law on December 22, 2010. The Act makes changes to a number of tax rules impacting the Funds. Under the Act, future capital losses generated by a fund may be carried over indefinitely, but these losses must be used prior to the utilization of any pre-enactment capital losses. Since pre-enactment capital losses may only be carried forward for eight years, there may be a greater likelihood that all or a portion of each fund’s pre-enactment capital losses will expire unused. In general, the provisions of the Act will be effective for each Fund’s fiscal year ending 2012.
7. Subsequent Events
The Board of Trustees has decided to merge Class I shares into Class A shares of the ICON International Equity Fund effective January 23, 2012.
The Board of Trustees has also decided to merge the Class S shares into the Class Z shares of the International Equity Fund and to rename the resultant share class Class S effective January 23, 2012. Immediately upon completion of this share class merger, the expense limitation agreement will be amended so that expenses (exclusive of brokerage, interest, taxes, dividends
| | | | |
| NOTESTO FINANCIAL STATEMENTS | | | 63 | |
NOTESTO FINANCIAL STATEMENTS (CONTINUED)
on short sales and extraordinary expenses) will be contractually limited to 1.55% of average net assets. As with the other ICON Funds Class S shares, the resultant Class S for the International Equity Fund will be offered to platform sales and investment representatives through fee-based products or accounts, as well as institutional investors. ICON reserves the right to change or waive the investment criteria for the Class S shares. Please visit www.iconfunds.com for additional important information regarding these share class mergers.
Subsequent to year end, the ICON Funds suspended participation in the securities lending program.
| | |
| 64 | | NOTESTO FINANCIAL STATEMENTS |
REPORTOF INDEPENDENT REGISTERED PUBLIC
ACCOUNTING FIRM
To the Board of Trustees and Shareholders of the ICON Funds:
In our opinion, the accompanying statements of assets and liabilities, including the schedules of investments, and the related statements of operations and of changes in net assets and the financial highlights present fairly, in all material respects, the financial position of ICON Asia-Pacific Region Fund, ICON Europe Fund, and ICON International Equity Fund (three of the portfolios constituting ICON Funds, hereafter referred to as the “Funds”) at September 30, 2011, and the results of each of their operations for the year then ended, the changes in each of their net assets for each of the two years in the period then ended and the financial highlights for each of the periods presented, in conformity with accounting principles generally accepted in the United States of America. These financial statements and financial highlights (hereafter referred to as “financial statements”) are the responsibility of the Funds’ management; our responsibility is to express an opinion on these financial statements based on our audits. We conducted our audits of these financial statements in accordance with the standards of the Public Company Accounting Oversight Board (United States). Those standards require that we plan and perform the audit to obtain reasonable assurance about whether the financial statements are free of material misstatement. An audit includes examining, on a test basis, evidence supporting the amounts and disclosures in the financial statements, assessing the accounting principles used and significant estimates made by management, and evaluating the overall financial statement presentation. We believe that our audits, which included confirmation of securities at September 30, 2011 by correspondence with the custodian and brokers, provide a reasonable basis for our opinion.

Denver, Colorado
November 18, 2011
| | | | |
| REPORTOF ACCOUNTING FIRM | | | 65 | |
SIX MONTH HYPOTHETICAL EXPENSE EXAMPLE
SEPTEMBER 30, 2011 (UNAUDITED)
Example
As a shareholder of a Fund you may pay two types of fees: transaction fees and fund-related fees. Certain funds charge transaction fees, including sales charges (loads) on purchase payments, reinvested dividends, or other distributions; redemption fees; and exchange fees. Funds also incur various ongoing expenses, including management fees, distribution and/or service fees, and other fund expenses, which are indirectly paid by shareholders.
This Example is intended to help you understand your ongoing costs (in dollars) of investing in the various ICON Funds and to compare these costs with the ongoing costs of investing in other mutual funds. This Example is based on an investment of $1,000 invested at the beginning of the six-month period and held for the six-month period (4/1/11 – 9/30/11).
Actual Expenses
The first line in the table for each Fund provides information about actual account values and actual expenses. The Example includes, but is not limited to, management fees, 12b-1 fees, fund accounting, custody and transfer agent fees. However, the Example does not include client specific fees, such as the $15 fee charged to IRA accounts, or the $15 fee charged for wire redemptions. You may use this information, together with the amount you invested, to estimate the expenses that you paid over the period. Simply divide your account value by $1,000 (for example, an $8,600 account value divided by $1,000 = 8.6), then multiply the result by the number in the first line for each Fund under the heading entitled “Expenses Paid During Period” to estimate the expenses you paid on your account during this period.
Hypothetical Example for Comparison Purposes
The second line in the table for each Fund provides information about hypothetical account values and hypothetical expenses based on the Fund’s actual expense ratio and an assumed rate of return of 5% per year before expenses, which is not the Fund’s actual return. The hypothetical account values and expenses may not be used to estimate the actual ending account balance or expenses you paid for the period. You may use this information to compare the ongoing costs of investing in the Fund and other funds. To do so, compare this 5% hypothetical example with the 5% hypothetical examples that appear in the shareholder reports of the other funds. Please note that the expenses shown in the table are meant to highlight your ongoing costs only and do not reflect any transactional costs, such as sales charges (loads),
redemption fees, or exchange fees that may be charged by other funds. Therefore, this information is useful in comparing ongoing costs only, and will not help you determine the relative total costs of owning different funds.
| | | | | | | | | | | | | | | | |
| | | Beginning
Account
Value 4/1/11 | | | Ending
Account
Value
9/30/11 | | | Expenses Paid
During Period
4/1/11 - 9/30/11* | | | Annualized
Expense Ratio
4/1/11 - 9/30/11 | |
Actual Expenses | | | | | | | | | | | | | | | | |
ICON Asia-Pacific Region Fund | | | | | | | | | | | | | | | | |
Class S | | $ | 1,000.00 | | | $ | 759.20 | | | $ | 7.31 | | | | 1.66% | |
Class C | | | 1,000.00 | | | | 755.90 | | | | 11.24 | | | | 2.55% | |
Class A | | | 1,000.00 | | | | 758.80 | | | | 7.96 | | | | 1.80% | |
ICON Europe Fund | | | | | | | | | | | | | | | | |
Class S | | | 1,000.00 | | | | 707.30 | | | | 6.77 | | | | 1.58% | |
Class C | | | 1,000.00 | | | | 703.70 | | | | 10.91 | | | | 2.55% | |
Class A | | | 1,000.00 | | | | 707.00 | | | | 7.73 | | | | 1.81% | |
ICON International Equity Fund | | | | | | | | | | | | | | | | |
Class S | | | 1,000.00 | | | | 698.60 | | | | 6.45 | | | | 1.52% | |
Class I | | | 1,000.00 | | | | 698.20 | | | | 7.67 | | | | 1.80% | |
Class C | | | 1,000.00 | | | | 694.80 | | | | 10.84 | | | | 2.55% | |
Class Z | | | 1,000.00 | | | | 699.00 | | | | 6.31 | | | | 1.48% | |
Class A | | | 1,000.00 | | | | 697.60 | | | | 7.66 | | | | 1.80% | |
Hypothetical (assuming a 5% return before expenses) | | | | | | | | | | | | | | | | |
ICON Asia-Pacific Region Fund | | | | | | | | | | | | | | | | |
Class S | | | 1,000.00 | | | | 1,016.76 | | | | 8.38 | | | | | |
Class C | | | 1,000.00 | | | | 1,012.26 | | | | 12.88 | | | | | |
Class A | | | 1,000.00 | | | | 1,016.02 | | | | 9.12 | | | | | |
ICON Europe Fund | | | | | | | | | | | | | | | | |
Class S | | | 1,000.00 | | | | 1,017.13 | | | | 8.00 | | | | | |
Class C | | | 1,000.00 | | | | 1,012.26 | | | | 12.89 | | | | | |
Class A | | | 1,000.00 | | | | 1,016.01 | | | | 9.13 | | | | | |
ICON International Equity Fund | | | | | | | | | | | | | | | | |
Class S | | | 1,000.00 | | | | 1,017.47 | | | | 7.67 | | | | | |
Class I | | | 1,000.00 | | | | 1,016.04 | | | | 9.10 | | | | | |
Class C | | | 1,000.00 | | | | 1,012.28 | | | | 12.87 | | | | | |
Class Z | | | 1,000.00 | | | | 1,017.64 | | | | 7.50 | | | | | |
Class A | | | 1,000.00 | | | | 1,016.04 | | | | 9.10 | | | | | |
| * | Expenses are equal to the Fund’s six month expense ratio annualized, multiplied by the average account value over the period, multiplied by 183/365 to reflect the one-half year period. |
Total returns exclude applicable sales charges. If sales charges were included (maximum 5.75%), returns would be lower.
BOARDOF TRUSTEESAND FUND OFFICERS (UNAUDITED)
The ICON Funds Board of Trustees (“Board”) consists of four Trustees who oversee the 17 ICON Funds (the “Funds”). The Board is responsible for general oversight of the Funds’ business and for assuring that the Funds are managed in the best interest of the Funds’ shareholders. The Trustees, and their ages, and principal occupations are set forth below. The address of the Trustees is 5299 DTC Blvd., Suite 1200, Greenwood Village, CO 80111. Trustees have no official term of office and generally serve until they resign or are not re-elected.
Interested Trustee
Craig T. Callahan, 60, Chairman of the Board. Dr. Callahan has been a Trustee of the Funds since their inception. Dr. Callahan also serves as President (1998 to present) and Chairman of the Investment Committee (2005 to present) and served as the Chief Investment Officer (1991 to 2004) of ICON Advisers. Dr. Callahan is also Executive Vice President (2005 to present); Director (1991 to present); and was previously President (1998 to 2005) and Chief Compliance Officer (2005) of IDI. Dr. Callahan also serves as the President (1998 to present) and Chairman of the Board of Directors (1994 to present) of ICON Management & Research Corporation (“IM&R”), the parent company of ICON Advisers and IDI.
Independent Trustees
Glen F. Bergert, 61. Mr. Bergert has been a Trustee of the Funds since 1999. Mr. Bergert is President of Venture Capital Management LLC (1997 to present), General Partner of SOGNO Partners LP, a venture capital company (2001 to present), General Partner of Bergert Properties, LLP, a real estate holding company (1997 to present), General Partner of Pyramid Real Estate Partnership, a real estate development company (1998 to present), General Partner of Chamois Partners, LP, a venture capital company (2004 to present) and was previously a General Partner with KPMG Peat Marwick, LLP (1979 to 1997). Mr. Bergert is also a Director of Delta Dental of California, an insurance company (2006 to present), Delta Dental of Pennsylvania, an insurance company (1998 to 2009 and 2010 to present), Dentegra Group, Inc, an insurance holding company (2010 to present) and Delta Reinsurance Corporation (2000 to 2009 and 2011 to present). Mr. Bergert was a Director of Herre Bros, Inc., a contracting company (1998 to 2011).
John C. Pomeroy, Jr., 64. Mr. Pomeroy has been a Trustee of the Funds since November 2002. Mr. Pomeroy is Chief Investment Officer and Director
of Investments, Pennsylvania State University (2001 to present) and was Portfolio Manager and Product Manager, Trinity Investment Management Corporation (1989 to 2001).
R. Michael Sentel, 63. Mr. Sentel has been a Trustee of the Funds since their inception. Mr. Sentel is a Senior Attorney with the U.S. Department of Education (1996 to present). Mr. Sentel also provides legal representation as a sole practitioner with an emphasis on corporate and transactional law. He served as general counsel to numerous public companies and served on the board of directors of one of these clients. Mr. Sentel began his legal career with the U.S. Securities and Exchange Commission’s Division of Enforcement and served as a Branch Chief (1980 to 1981). Later he served as the Section Chief for the Professional Liability Section of the Federal Deposit Insurance Corp. with responsibility for the Rocky Mountain Region (1991 to 1994).
The Officers of the Funds are:
Craig T. Callahan, 60, Chairman of the Board. Dr. Callahan has been a Trustee of the Funds since their inception. Dr. Callahan also serves as President (1998 to present) and Chairman of the Investment Committee (2005 to present) and served as the Chief Investment Officer (1991 to 2004) of ICON Advisers. Dr. Callahan is also Executive Vice President (2005 to present); Director (1991 to present); and was previously President (1998 to 2005) and Chief Compliance Officer (2005) of IDI. Dr. Callahan also serves as the President (1998 to present) and Chairman of the Board of Directors (1994 to present) of IM&R, the parent company of ICON Advisers and IDI.
Erik L. Jonson, 62. Mr. Jonson has been a Vice President and Principal Financial Officer/Treasurer of the Funds since their inception in 1996. Mr. Jonson is also Chief Financial Officer (1996 to present) and Executive Vice President (2004 to present) and was previously Vice President (1998 to 2004) and Secretary (2005 and 1998 to 2002) of ICON Advisers; Chief Financial Officer, Secretary and Director (1998 to present) of IM&R; and Executive Vice President and Treasurer/Financial Principal (1996 to present) of IDI.
Jessica Seidlitz, 33. Ms. Seidlitz serves as the Assistant Treasurer of the Funds (2007 to present). She also serves as the Mutual Fund Controller of ICON Advisers (2005 to present). Previously, she was a Senior Associate/Associate at PricewaterhouseCoopers LLP (2001 to 2004).
Donald Salcito, 58. Mr. Salcito serves as Vice President and Secretary of the Funds (November 15, 2006 to present). Mr. Salcito is also Executive Vice President and General Counsel (September 2005 to present) of ICON Advisers; Director of IM&R (2005 to present); Executive Vice President, Secretary, General Counsel of IDI (2005 to present). Previously, he was a
Partner in various national law firms, practicing in the securities law area. (1980 to 2005).
Brian Harding, 32. Mr. Harding serves as Chief Compliance Officer and Anti-Money Laundering Officer of the Funds (2008 to present). Mr. Harding also serves as Chief Compliance Officer of ICON Advisers (2011 to present). Previously, he was a Manager (2007 to 2008) and a Senior Associate/Associate (2001 to 2007) at PricewaterhouseCoopers LLP.
OTHER INFORMATION (UNAUDITED)
Renewal of Investment Advisory Agreement
On August 15, 2011, the Board of Trustees, including a majority of the Trustees that are not “interested persons” of the Trust (the “Independent Trustees”), approved continuation of the Advisory Agreements with the Adviser for each Fund for an additional one-year term commencing October 1, 2011.
In determining to renew the investment advisory agreements between ICON Funds (the “Trust”) and ICON Advisers, Inc. (“ICON” or the “Adviser”) the Board requested, was provided with and reviewed data with respect to ICON, its personnel, and the services provided and to be provided to each Fund by ICON under the Trust’s Investment Advisory Agreement dated October 9, 1996, as amended (related to the Sector, International and Core Equity Funds) and under the Trust’s Investment Advisory Agreement dated July 9, 2002 and effective October 1, 2002, as amended (related to the U.S. Diversified Funds - Bond, Risk-Managed Equity, Equity Income and Long/Short Funds) (collectively, the “Advisory Agreements”). The data included information concerning advisory, distribution and administrative services provided to the Funds by ICON and its related companies; information concerning other businesses of those companies; comparative data related to exchange traded funds versus the Sector Funds; and comparative data obtained from Lipper Analytical Services related to Fund performance and Fund expenses (the “Lipper report”). The data also included an analysis of the Funds’ ratings on the AthenaInvest system (the “AthenaInvest data”) and a presentation on ICON’s investment model. AthenaInvest is an affiliate of the Adviser. The Board of Trustees met on August 4 and 19, 2011 to discuss the data. Management personnel discussed the data for and with those present. Included in the discussion was a briefing on the sales and marketing initiatives, the different classes of shares being offered by the Trust and efficiencies in connection with administering services to the Funds/various classes of shares.
The Independent Trustees were represented by independent legal counsel throughout the process. Prior to acting on the matter, the Independent Trustees met separately as a group in private sessions with their independent legal counsel to review and discuss the foregoing information. Based on these discussions, independent legal counsel and/or the Lead Independent Trustee also contacted management to request additional information and to discuss responses to questions raised during the process. In addition, the Independent Trustees received materials from their independent legal counsel discussing the legal standards applicable to their consideration of the agreement.
In considering the nature, extent and quality of the services provided by the Adviser, the Board reviewed information relating to ICON’s operations and personnel. Among other things, the Adviser provided biographical information on its professional staff and descriptions of its organizational and management structure. In the course of their deliberations the Board evaluated, among other things, information relating to the investment philosophy, strategies and techniques used in managing each Fund, the qualifications and experience of ICON’s investment personnel, ICON’s compliance programs, ICON’s brokerage practices, including the extent to which the Adviser obtains research through “soft dollar” arrangements with the Funds’ brokerage, compliance reports on the foregoing, and the financial and non-financial resources available to provide services required under the Advisory Agreement.
During the discussion, the Lipper report and the AthenaInvest data were discussed and management personnel showed performance for each fund and discussed the factors affecting performance. Management noted that ICON modified the valuation methodology at the end of 2008 to better account for systemic risk. ICON implemented the modified valuation methodology in February 2009. During the discussion, management personnel noted that the markets continue to experience volatility and that when the markets are volatile, relative strength readings are also more volatile and less reliable It was also noted that volatility has affected ICON’s performance; that this had been the case for much of the last two years for the Funds; that poor quality stocks with low relative strength led the market whereas higher quality stocks with higher relative strength have not performed as well; that the market volatility and the relative strength component to our methodology have produced mixed results; and that many other value managers have had challenges in this market. The Adviser discussed its continuing assessment of its “investment model” - including steps taken to test the relative strength components of the system and methodology. Overall, the Board of Trustees concluded that the Adviser continues to believe the adjustments to the system have been functioning as intended; and that, notwithstanding that belief, the Adviser is constantly evaluating the system and will modify it as needed.
In connection with reviewing data bearing upon the nature, quality, and extent of services furnished by ICON to each Fund, the Board assessed data concerning ICON’s staffing, systems and facilities. The Board also assessed ICON’s non-Trust business to see if there are any initiatives that would dilute service to the Trust. The Board noted:
A. That the breadth and the quality of investment advisory and other services being provided to each Fund is satisfactory, as evidenced in part by efforts to address and improve the performance record of each
Fund when compared with the performance records of a peer group of comparable funds and markets in general;
B. That the breadth and the quality of investment advisory and other services being provided to each Fund is satisfactory, as evidenced in part by the AthenaInvest data (ratings based on an assessment of fund strategy) reflects that all Funds are rated 3 or higher and that, unlike many other fund groups, ICON Funds has no fund rated 1 or 2 (where 1 is the lowest and 5 is the highest).
C. That ICON has made significant expenditures in the past year and in prior years to ensure that it has the sophisticated systems and the highly trained personnel necessary for it to be able to continue to provide quality service to the Funds’ shareholders, including the dedication of substantial resources to ICON’s investment and trading departments;
D. That the Board, after considering compliance reports and compliance initiatives undertaken during the year and conducting individual interviews with selected portfolio managers, is satisfied with the research, portfolio management, and trading services, among others, being provided by ICON to the Funds, and is charging fair, reasonable, and competitive fees; and
E. The risks assumed by ICON in providing investment advisory services to each Fund including the capital commitments which have been made in the past and which continue to be made by ICON to ensure the continuation of the highest quality of service to the Trust is made with the recognition that the Trust’s advisory relationship with ICON be terminated at any time and must be renewed on an annual basis.
In considering the reasonableness of the fee payable to the Adviser for managing each Fund, the Board reviewed, among other things, data concerning other funds from the Lipper report, financial statements of the Adviser and an analysis of the profitability to the Adviser and its affiliates of their relationship with each Fund over various time periods, which analysis identified all revenues and other benefits received by the Adviser and its affiliates from managing each Fund, the costs associated with providing such services and the resulting profitability to the Adviser and its affiliates.
The Board considered the current and anticipated asset levels of each Fund and the willingness of the Adviser to waive fees and pay expenses of the Funds from time to time to limit the total expenses of the Funds. In this regard the Board discussed significantly reduced asset levels in each fund covered by the Advisory Agreements due to the tumultuous markets during the past three and a half years, to relative poor Fund performance, and to industry wide net-redemptions in reaction to the tumultuous markets. ICON’s
ability to provide the services called for under the Advisory Agreements was assessed in light of current and projected asset levels. Fund expenses and expense ratios were also assessed in light of current and projected asset levels. The Board concluded that the Adviser has the resources necessary to provide the services called for under the Advisory Agreements; that profitability to the Adviser and its affiliates from their relationship with the Funds is not excessive; and that the Adviser is not realizing material benefits from economies of scale that would warrant adjustments to the fees for any Fund at this time. The Board of Trustees concluded that, in light of the nature, extent and quality of the services provided by the Adviser and the levels of profitability associated with providing these services, the fees charged by the Adviser under the Advisory Agreements to each Fund are reasonable.
In connection with assessing data bearing the fairness of fee arrangements, the Board used data from Lipper report concerning funds of similar size and funds of larger size, as well as data concerning ICON’s other clients and noted that:
A. the advisory fee structures of the Funds were considered in comparison with advisory fees and expense ratios of other similarly managed funds as set forth in the comparative data;
B. expense ratios for 10 of the 17 Funds are above average, 4 are equal to the median, 2 are below both the average and the median, and 1 is equal to the average.;
C. in 16 of the 17 Funds, the assets under management are significantly below either the average or the median and that when the fund size approaches industry average our expenses also approach or are less than industry average.;
D. ICON has contractually agreed to impose expense limitations on certain Funds at a cost to ICON;
E. the advisory and other fees payable by the Funds to ICON are essentially fees which would be similar to those which would have resulted solely from “arm’s-length” bargaining, and may well be lower than fees arrived at solely from such arm’s-length negotiation;
F. the fees paid to ICON for managing other institutional accounts (such as pension plans) are not lower than the fees paid by similarly-managed funds; indeed, some institutional accounts have been encouraged to, and have in fact used, the Funds Z share class, but to the extent some fees of those accounts are lower, the reasons why such accounts are less costly for ICON to manage; and
G. ICON has contractually committed to break points in its fees so that economies of scale could be realized as a Fund grows in assets, for the benefit of Fund shareholders.
In connection with the direct and indirect benefits to ICON from serving as the Funds’ adviser, the Board discussed and noted that:
A. ICON benefits from serving directly or through affiliates as the principal underwriter and administrative agent for the Funds; that services provided by ICON and its affiliates to the Funds are satisfactory, and that fees derived from providing the services are competitive and reasonable; and
B. ICON receives research assistance (primarily in the form of data) from the use of soft dollars generated from Fund portfolio transactions; that such research assists ICON in providing quality advisory services; that Trust and Adviser compliance personnel continuously evaluate and report on the soft-dollar arrangements and related costs; and that the Board concluded that the arrangements are consistent with Fund brokerage practices and benefit the Funds and their shareholders.
Based on these considerations, among others, the Board, including a majority of the Independent Trustees, concluded that: 1) the continuation of the Advisory Agreement was in the best interests of each Fund and its shareholders, 2) the services to be performed under the Advisory Agreement were required for the operation of the Funds, 3) the advisory services were satisfactory to the Funds in the past, and 4) the fees for the advisory services and other benefits from the relationship with the Trust received by ICON were consistent with fees paid by similar funds, other clients of ICON, reasonable in light of the comparative data, and within the range of what would have been negotiated at arm’s length in light of all the circumstances.
Supplemental Tax Information
For corporate shareholders, none of the total ordinary income dividends paid during the fiscal year ended September 30, 2011, qualified for the corporate dividends received deduction.
For the fiscal year ended September 30, 2011, the following funds paid qualified dividend income:
| | | | |
| Fund | | Amount | |
ICON Asia-Pacific Region Fund | | | - | |
ICON Europe Fund | | | 100 | % |
ICON International Fund | | | 100 | % |
The Funds had no long-term capital gain distributions qualifying for the maximum 15% income tax rate for individuals.
Portfolio Holdings
Information related to the 10 largest portfolio holdings of each Fund is made available at www.iconfunds.com within approximately 10 business days after month-end. Additionally, a complete list of each Fund’s holdings is made available approximately 30 days after month-end. Each ICON Fund also files a complete schedule of portfolio holdings for the first and third quarters of its fiscal year with the Securities and Exchange Commission (the “Commission”) on Form N-Q. The ICON Funds’ Forms N-Q are available at www.sec.gov or may be reviewed and copied at the Commission’s Public Reference Room in Washington, DC. Information about the Public Reference Room may be obtained by calling 1-800-SEC-0330.
Proxy Voting
A summarized description of the policies and procedures the ICON Funds use to vote proxies is available free of charge at www.iconfunds.com or by calling 1-800-764-0442.
Information about how the ICON Funds voted proxies related to each Fund’s portfolio securities during the 12-month period ended June 30 is available free of charge at www.iconfunds.com or on the Commission’s website at www.sec.gov.
Cost Basis Information
Effective January 1, 2012, federal law requires mutual fund companies to maintain and report a shareholder’s cost basis by tax lot, gain/loss information and holding period of covered shares to the Internal Revenue Service on Form 1099. Covered shares are mutual fund shares acquired on or after January 1, 2012. A fund is not required to maintain and report information for shares not deemed as covered.
The new law requires each fund to elect a default tax identification methodology in order to perform the required reporting. As a result, the Trust has chosen Average Cost as its default tax identification methodology. This is the method each Fund will use. However, at the time of purchase or upon the sale of covered shares, shareholders may choose a different tax identification method. Furthermore, if you purchase shares through a financial intermediary, please contact the intermediary to find out what default tax identification method they will use. We recommend that you consult your tax adviser to determine which tax identification methodology best suits your individual tax situation.
For More Information
This report is for the general information of the Funds’ shareholders and is not authorized for distribution to prospective investors unless preceded or accompanied by a current prospectus. You may obtain a copy of the prospectus, which contains information about the investment objectives, risks, charges, expenses, and share classes of each ICON Fund, by visiting www.iconfunds.com or by calling 1-800-764-0442. Please read the prospectus carefully before investing.
ICON Distributors, Inc., Distributor.
IMPORTANT NOTICE TO ALL SHAREHOLDERS OF THE ICON FUNDS:
The Trustees of the ICON Funds (the “Trust”) have amended the ICON Funds Master Trust Agreement dated September 19, 1996 as previously amended (the “MTA”), to expressly state that the Trustees have absolute power to reclassify shares of a Fund, or close a class of shares by merging or consolidating one class with another class of shares within a Fund, without seeking shareholder approval. The amendments state that this Trustee power is subject to the same limitation applicable to any Trustee amendment by providing that “the reclassification, merger or consolidation does not adversely affect the rights of the shareholders.” The amendments are focused on the classes of shares within a Fund, not the Fund itself. A copy of the Amended and Restated Master Trust Agreement (the “Amended and Restated MTA”), marked to show changes can be viewed at: www.iconfunds.com.
As provided in the MTA, the Trustees have authorized the offering of shares of seventeen Funds (sometimes referred to as series or Sub-Trusts). The Trustees have also authorized the offering of classes of shares of the Funds with an expense allocation plan. The expense allocation plan provides that the expenses of the respective share classes are: costs and charges that correspond to the differing distribution and service expenses of the sales and marketing channels used by investors to invest in the Funds; filing and/or registration fees charged by most states for offering or selling each class; and other class specific costs.
During the past year and a half, ICON management and the Trustees have discussed methods to reduce existing share class expenses and to increase Trust assets. ICON management proposed streamlining the existing class structure, which proposal called for a change in the number and type of share classes offered by certain of the ICON Funds. For example, certain ICON Diversified Funds have two similar classes: Class I & A. ICON management proposed merging Class I into Class A. Class A shares are strategically flexible because they can be marketed in both a load structure on a commission platform and a load-waived structure on no-load or NTF platforms. A similar issue exists with Class Z and S shares, where the primary difference between the two classes is Class S shares can be sold on platforms. ICON Management proposed a structure where, in general, each ICON Fund would have three share classes: Class A, C and S. Management proposed merging Class I with Class A, Class S with Class Z and renaming Class Z to Class S with all the attending rights of Class S. For information
| | |
| 78 | | IMPORTANT NOTICETO ALL SHAREHOLDERS |
concerning share class structure, see Explanation of Share Classes at: www.iconfunds.com. The list of currently authorized classes of shares is also set forth in Section 4.1 of the Amended and Restated MTA.
The Trustees and their representatives questioned and debated whether the Trustees had the power to reclassify shares of a Fund, or close a class of shares by merging or consolidating one class with another class of shares within a Fund, without shareholder approval. The MTA gave shareholders limited voting rights. Shareholders can vote on an amendment to the MTA only if Section 7.3 of the MTA requires it; and, Section 7.3 has not required shareholder approval to reclassify shares of a Fund, or close a class of shares by merging or consolidating one class with another class of shares within a Fund.
On the other hand, the Trustees have the implied power and authority to merge or consolidate classes, but no expressed power. Section 3.2 of the MTA gives the Trustees all the powers necessary to conduct the business of the Trust. The Trustees have had specific authority to establish classes of shares or divide the shares of any Sub-Trust. The Trustees decided to exercise their specific power and amend the MTA to state explicitly that that they can merge or consolidate share classes without shareholder approval. Section 7.3 of the MTA specifically provides the Trustees with the power to amend the MTA, without shareholder approval, whether or not related to the rights of shareholders, as long as the amendment does not adversely affect the rights of any shareholder and is not in contravention of applicable law.
Based on the above, the Trustees believe it was unnecessary to seek shareholder approval to amend the MTA to clarify the Trustees’ powers. Never the less, ICON management requested outside cost estimates for seeking shareholder approval. Costs estimates ranged between $450,000 and $550,000. The Trustees rejected spending shareholder assets to seek approval.
Critically, no shareholder would be adversely affected under the proposed amendment. The dollar value of a shareholder’s interest in the eliminated class will be the same as the dollar value of that shareholder’s interest in the substitute class. It is, for all intents and purposes, only a reclassification of shares. If a shareholder does not like the new share class for any reason, a shareholder can simply redeem his/her shares.
Please read the Amended and Restated MTA carefully. If you have any questions, please call us at 1-800-764-0442, or email the ICON Funds at: info@iconadvisers.com.
| | | | |
| IMPORTANT NOTICETO ALL SHAREHOLDERS | | | 79 | |
ICON FUNDS PRIVACY INFORMATION
| | |
| FACTS | | WHAT DOES ICON DO WITH YOUR PERSONAL INFORMATION? |
| | |
| Why? | | Financial companies choose how they share your personal information. Federal law gives consumers the right to limit some but not all sharing. Federal law also requires us to tell you how we collect, share, and protect your personal information. Please read this notice carefully to understand what we do. |
| | |
| What? | | The types of personal information we collect and share depend on the product or service you have with us. This information can include: n Social Security number and account balances n income and transaction history n checking account information and wire transfer instructions When you are no longer our customer, we continue to share your information as described in this notice. |
| | |
| How? | | All financial companies need to share customers’ personal information to run their everyday business. In the section below, we list the reasons financial companies can share their customers’ personal information; the reasons ICON chooses to share; and whether you can limit this sharing. |
| | | | |
| Reasons we can share your personal information | | Does ICON share? | | Can you limit this sharing? |
For our everyday business purposes — such as to process your transactions, maintain your account(s), respond to court orders and legal investigations, or report to credit bureaus | | Yes | | No |
For our marketing purposes — to offer our products and services to you | | No | | We don’t share |
| For joint marketing with other financial companies | | No | | We don’t share |
For our affiliates’ everyday business purposes — information about your transactions and experiences | | No | | We don’t share |
For our affiliates’ everyday business purposes — information about your creditworthiness | | No | | We don’t share |
| For nonaffiliates to market to you | | No | | We don’t share |
| | |
| Questions? | | Call 1-800-764-0442 for the ICON Funds and 1-800-828-4881 for ICON Advisers, Inc. and ICON Distributors, Inc. |
| | |
| 80 | | FUNDS PRIVACY INFORMATION |
| | |
| Who we are | | |
| Who is providing this notice? | | ICON Funds, ICON Advisers, Inc., and ICON Distributors, Inc. (collectively “ICON”) |
| What we do | | |
| How does ICON protect my personal information? | | To protect your personal information from unauthorized access and use, we use security measures that comply with federal law. These measures include computer safeguards and secured files and buildings. Contracts with our service providers require them to restrict access to your non-public personal information, and to maintain physical, electronic and procedural safeguards against unintended disclosure. |
| How does ICON collect my personal information? | | We collect your personal information, for example, when you n open an account or enter into an investment advisory contract n provide account information or give us your contact information n make a wire transfer We also collect your personal information from others, such as credit bureaus, affiliates, or other companies. |
| Why can’t I limit all sharing? | | Federal law gives you the right to limit only n sharing for affiliates’ everyday business purposes — information about your creditworthiness n affiliates from using your information to market to you n sharing for nonaffiliates to market to you State laws and individual companies may give you additional rights to limit sharing. |
| Definitions | | |
| Affiliates | | Companies related by common ownership or control. They can be financial and nonfinancial companies. n Our affiliates include financial companies such as ICON Funds, ICON Advisers, Inc., and ICON Distributors, Inc. |
| Nonaffiliates | | Companies not related by common ownership or control. They can be financial and nonfinancial companies. n Nonaffiliates we share with can include financial companies such as custodians, transfer agents, registered representatives, financial advisers and nonfinancial companies such as fulfillment, proxy voting, and class action service providers |
| Joint marketing | | A formal agreement between nonaffiliated financial companies that together market financial products or services to you. n ICON doesn’t jointly market |
| | | | |
| FUNDS PRIVACY INFORMATION | | | 81 | |
(This page is intentionally left blank)
For more information about the ICON Funds, contact us:
| | |
| |
| By Telephone | | 1-800-764-0442 |
| |
| By Mail | | ICON Funds
P.O. Box 55452
Boston, MA 02205-8165 |
| |
| In Person | | ICON Funds
5299 DTC Boulevard, 12th Floor
Greenwood Village, CO 80111 |
| |
| On the Internet | | www.iconfunds.com |
| |
| By E-Mail | | info@iconadvisers.com |

2011 ANNUAL REPORT
ICON SECTOR FUNDS
INVESTMENT UPDATE
ICON Consumer Discretionary Fund
ICON Consumer Staples Fund
ICON Energy Fund
ICON Financial Fund
ICON Healthcare Fund
ICON Industrials Fund
ICON Information Technology Fund
ICON Materials Fund
ICON Telecommunication & Utilities Fund

1-800-764-0442 | www.iconfunds.com
AR-SECT-11 K21580

You can now sign up for electronic delivery of ICON Fund shareholder reports, including prospectuses, annual reports, semiannual reports and proxy statements.
When these materials are available, you will receive an email from ICON with instructions on how to view the documents. Statements, transaction confirmations and other documents that are not available online will continue to be sent to you by U.S. mail.
Visit ICON’s website at www.iconfunds.com to learn more and sign up.
You may change or cancel your participation in eDelivery by visiting www.iconfunds.com, or you can request a hard copy of any of the materials free of charge by calling ICON Funds at 1-800-764-0442.
1-800-764-0442 • www.iconfunds.com
TABLEOF CONTENTS
ABOUT THIS REPORT (UNAUDITED)
Historical Returns
All total returns mentioned in this Report account for the change in a Fund’s per-share price and the reinvestment of any dividends, capital gain distributions and adjustments for financial statement purposes. If your account is set up to receive Fund distributions in cash rather than to reinvest them, your actual return may differ from these figures. The Funds’ performance results do not reflect the deduction of taxes that a shareholder would pay on Fund distributions or on the redemption of Fund shares. The Adviser may have reimbursed certain fees or expenses of some of the Funds. If not for these reimbursements, performance would have been lower. Fund results shown, unless otherwise indicated, are at net asset value. If a sales charge (maximum 5.75%) had been deducted, results would have been lower.
Past performance does not guarantee future results. Investment return and principal value will fluctuate so that an investor’s shares, when redeemed, may be worth more or less than their original cost. Performance results represent past performance, and current performance may be higher or lower. Please call 1-800-764-0442 or visit www.iconfunds.com for performance results current to the most recent month-end.
Portfolio Data
This Report reflects ICON’s views, opinions and portfolio holdings as of September 30, 2011, the end of the reporting period. The information is not a complete analysis of every aspect of any sector, industry, security or the Funds.
Opinions and forecasts regarding industries, companies and/or themes, and portfolio composition and holdings are subject to change at any time based on market and other conditions, and should not be construed as a recommendation of any specific security, industry or sector. Each Fund’s holdings as of September 30, 2011 are included in each Fund’s Schedule of Investments.
According to ICON, value investing is an analytical approach to investing that employs various factors, including projecting earnings growth estimates, in an effort to determine whether securities are over- or underpriced relative to ICON’s estimates of their intrinsic value. Value investing involves risks and uncertainties and does not guarantee better performance or lower costs than other investment methodologies. ICON’s value-to-price ratio (“V/P”) is a ratio of intrinsic value, as calculated using ICON’s proprietary valuation
methodology, of a broad range of domestic and international securities within ICON’s system as compared to the current market price of those securities. The ICON system relies on the integrity of financial statements released to the market as part of our analysis.
This Report contains statements regarding industry or sector themes, new market themes, investment outlook, relative strength, value-to-price ratios, and investment team expectations, beliefs, goals and the like that are based on current expectations, recent individual stock performance relative to current market prices, estimates of company values and other information supplied to the market by the companies we follow. Words such as “expects,” “suggests,” “anticipates,” “targets,” “goals,” “value,” “intrinsic value,” “indicates,” “believes,” “considers,” “estimates,” variations of such words and similar expressions are intended to identify forward looking statements, which are not statements of historical fact. Forward looking statements are not guarantees of future performance and involve certain risks, uncertainties and assumptions that are difficult to assess. These risks and uncertainties are based on a number of important factors, including, among others: stock price fluctuations; the integrity and accuracy of historical and projected financial and other information supplied by companies to the public or assumptions based on such information supplied; interest rates; bond yields; future earnings growth rates; the risks noted in this Report and other factors beyond the control of our investment team but used by the investment team to influence their assumptions. Therefore, actual outcome may differ materially from what is expressed in such forward looking statements.
There are risks associated with mutual fund investing, including the loss of principal. The likelihood of loss may be greater if you invest for a shorter period of time. There is no assurance that the investment process will consistently lead to successful results.
An investment concentrated in sectors and industries may involve greater risk and volatility than a more diversified investment. Investments in foreign securities may entail unique risks, including political, market, and currency risks. Financial statements of foreign companies are governed by different accounting, auditing, and financial standards than U.S. companies and may be less transparent and uniform than in the United States. Many corporate governance standards, which help ensure the integrity of public information in the United States, do not exist in foreign countries. In general, there may be less governmental supervision of foreign stock exchanges and securities brokers and issuers.
The prospectus and statement of additional information contain this and other information about the Funds and are available by visiting
www.iconfunds.com or calling 1-800-764-0442. Please read the prospectus and statement of additional information carefully.
Comparative Indexes
The comparative indexes discussed in this Report are meant to provide a basis for judging the Funds’ performance against specific securities indexes. Each index shown accounts for both change in security price and reinvestment of dividends and distributions (except as noted), but does not reflect the costs of managing a mutual fund. The Funds’ portfolios may significantly differ in holdings and composition from the indexes. Individuals cannot invest directly in an index.
| • | | The unmanaged Standard & Poor’s (“S&P”) Composite 1500 Index (“S&P Composite 1500 Index”) is a broad-based capitalization-weighted index comprising 1,500 stocks of large-cap, mid-cap, and small-cap U.S. companies. |
| • | | The capitalization-weighted S&P 1500 Sector and Industry Indexes are based on specific classifications determined by S&P. |
| • | | The unmanaged NASDAQ Composite (“NASDAQ”) Index is a broad-based capitalization-weighted index of all NASDAQ National Market and Small-Cap stocks. |
| • | | Total returns for the S&P 1500 Consumer Discretionary Index and the S&P 1500 Industrials Index include the reinvestment of dividends and capital gain distributions beginning on January 1, 2002. Index returns with reinvested dividends and distributions are unavailable prior to that date. |
Index returns and statistical data included in this Report are provided by FactSet Research Systems.
Financial Intermediary
If you purchase the Fund through a broker-dealer or other financial intermediary (such as a bank), the Fund and its related companies may pay the intermediary for the sale of Fund shares and related services. These payments may influence the broker-dealer or other intermediary and your salesperson to recommend the Fund over another investment. Ask your salesperson or visit your financial intermediary’s website for more information.
MESSAGE FROM ICON FUNDS
Dear Shareholders,
As valuation investors, we look for quality companies priced below our estimate of intrinsic value. We will buy stocks we believe are “on sale” when investors get distracted by a particular news story or headline and worry about its potential impact on the economy in general and the markets in particular. When this happens, stocks are temporarily priced based on worst-case scenario projections, not on their fundamentals. As concerns subside, prices often move up toward the stock’s intrinsic value and may even exceed ICON’s estimate of value when excessive worry is replaced with excessive optimism. Implementing our valuation strategy does not require an information edge; it simply requires discipline. Our system needs discipline to filter out news headlines, concentrate on value, and, frequently, buy when most are selling and sell when most are buying. ICON’s discipline requires also the willingness to take strong industry and sector tilts. We see industries and sectors becoming overpriced and underpriced through cycles as investors change their views of the economy and migrate around the universe of stocks.
In spite of a volatile 12 months, we believe the stock market is in a multi-year recovery from the financial crisis and recession of 2008-2009. Stocks were generally priced far below our estimate of their fair value when the market hit its recent low in March 2009, but their ascent toward fair value has been choppy and severely interrupted at least twice; first in the summer of 2010 and then again during the summer of 2011. Both times, sharp drops in stock prices were precipitated by concerns over the European sovereign debt crisis. Investors were especially wary of the situation in Greece, but also, to a lesser extent, investors worried about the economies of Ireland, Spain and Italy. We thought these concerns were excessive in 2010 and we continue to believe the concern is unwarranted. We expect fears to subside and, when that happens, we believe stocks will resume their recovery path.
The interruptions experienced during the summers of 2010 and 2011 have been frustrating for value investors like ICON, as we see a very different world than many other investors. Where others see a negative macroeconomic outlook, we see positive earnings and solid company fundamentals. When 2011 second quarter earnings were announced, companies in the S&P 500 Index reported earnings that were, on average, 16.24% higher than a year earlier. In fact, 75% of those companies reported earnings that exceeded analysts’ estimates by 4.67% on average. This growth in earnings is more robust than the earnings we saw coming out of any of the previous four recessions (that is, 1974, 1982, 1992 and 2001 recessions).
| | | | |
| MESSAGE FROM ICON FUNDS | | | 5 | |
Strong earnings and a low interest rate environment contribute to what we believe are attractive valuations, but skittish investors, concerned with debt problems in Europe, continue to shy away from equities.
We have seen investors turn their backs on solid fundamentals many times before. Historically, however, investors have come to gradually embrace these fundamentals and stock prices generally rise again to meet intrinsic value. In 1990, 1998 and 2010, for example, the market experienced a decline similar in magnitude and duration to that seen during the summer of 2011. Each market bottom led to anxiety over a worsening recession, but, months later, these fears proved unfounded. Stock prices rebounded and resumed their prior upward path. As we head into a new fiscal year, we are anticipating a similar rebound. Having two major market interruptions in two consecutive summers is unusual, unsettling and has admittedly made it difficult for investors to stay the course to recovery. The volatile environment also presented problems for money managers like ICON who struggled with abrupt and extreme industry and sector theme reversals.
As fiscal year 2011 comes to an end, we still believe cyclical, economically sensitive industries are the long term leaders for this multi-year recovery. Unfortunately, these same industries can be subject to dramatic market swings when investors, worried about the economy, panic and jump out of the market. We believe the old Wall Street adage still applies: “Stocks climb a wall of worry.” The climb back from the recession and financial crisis of 2008 and 2009 has been and will continue to be riddled with worry.
As always, we remain focused on value and company fundamentals as we try to filter out the conjecture and emotions that typically contribute to market volatility. Experienced sailors will tell someone who is seasick: “Don’t look at the waves; look at the horizon.” Lately, it seems, most investors have been focused on the waves. At ICON, we like to focus on a horizon that includes quality companies, with growing earnings, priced far below our estimate of their fair value. We will continue to stay this course.
Yours truly,

Craig T. Callahan, DBA
Chairman of the Board of Trustees and President of the Adviser
| | |
| 6 | | MESSAGE FROM ICON FUNDS |
| | | | |
MANAGEMENT OVERVIEW ICON CONSUMER DISCRETIONARY FUND | | Class S Class C Class A | | ICCCX ICCEX ICCAX |
| Q. | How did the Fund Perform relative to its benchmark? |
| A. | The ICON Consumer Discretionary Fund outperformed both its sector-specific benchmark and its broad-based benchmark for the fiscal year ended September 30, 2011. The Fund’s Class S shares rose 10.98%, while the S&P 1500 Consumer Discretionary Index rose 5.40 % and the broad S&P Composite 1500 Index returned 0.92% during the fiscal year. The Fund’s Class A shares returned 10.48% (and 4.17% with maximum sales charge) during the same period and the Fund’s Class C shares returned 10.10% for the fiscal year (9.10% with maximum sales charge). Total returns for other periods as of September 30, 2011 appear in the subsequent pages of this Fund’s Management Overview. |
| Q. | What primary factors influenced the Fund’s relative performance during the period? |
| A. | The Consumer Discretionary sector showed gains in spite of a difficult economic environment. The global debt crisis not only weighed on equity markets worldwide, but also led to considerable market volatility. Between October 1, 2010 and April 30, 2011, the S&P 1500 rose 21.63%. In the wake of recessionary concerns, stubbornly high unemployment and potential sovereign debt defaults in Portugal, Spain, Italy and Greece, the S&P 1500 Index plummeted 11.23% in just two weeks between July 25, 2011 and August 5, 2011. Volatility and negative investor sentiment notwithstanding, the S&P 1500 eked out a small gain of 0.92%. As noted above, Consumer Discretionary stocks fared even better, rising 5.40%. |
Perhaps surprisingly, and in spite of investors’ evident skittishness, consumer confidence held steady during the fiscal year. The Consumer Board Confidence Index, which measures and attempts to quantify consumer confidence in the economy, ended the 12-month period at 45.4 - just slightly below its reading at the beginning of the period of 48.6. The Index remained well above its all time low of 25.3, reached on February 28, 2009, just before the U.S. equity markets hit a multi-year low following the collapse of the global financial system. According to recent estimates, consumer spending comprises approximately 70% of U.S. gross domestic product. The stability of the Consumer Board Confidence Index may help explain why stocks in this sector managed to rise moderately over the period.
| Q. | How did the Fund’s composition affect performance? |
| A. | The Fund’s overweight position in the apparel retail industry benefitted Fund performance. The Fund had an average apparel retail weight of approximately 18% versus 5.8% in its sector-specific benchmark. This overweighting accounted for 1.6% of the Fund’s outperformance. The Fund’s overweight position in footwear (approximately 11.3% versus 2.9% in its sector-specific benchmark) likewise accounted for approximately 1.5% of the Fund’s outperformance. The Fund’s underweighting in certain industry laggards also proved beneficial. Homebuilding, for example, was down 26% during the fiscal year. While the industry made up 1.3% of the benchmark, the Fund held no positions in this industry. |
The Fund’s underweight positions in both the internet retail and apparel accessories & luxury goods industries negatively impacted Fund performance. The Fund’s underweight internet retail position detracted 1.2% from benchmark relative performance. The Fund’s underweight position in the apparel accessories & luxury goods industry detracted .50%. The restaurant industry proved to be the single worst detractor to Fund performance, accounting for a 2% drag relative to the Fund’s benchmark.
| Q. | What is your investment outlook for the Consumer Discretionary sector? |
| A. | As we head into the new fiscal year, the Consumer Discretionary sector looks even more attractive under the ICON system than it did 12 months ago. As of September 30, 2011, the sector has a V/P of 1.43, suggesting significant upside potential. We see opportunities throughout the Consumer Discretionary sector and remain overweight the cable & satellite, footwear, apparel retail and apparel accessories & luxury goods industries. We believe negative investor sentiment will give way to an improved economy in the next 12 months and we hope to take advantage of any market rally. |
ICON Consumer Discretionary Fund
Industry Composition
September 30, 2011
| | | | |
Apparel Retail | | | 22.9% | |
Cable & Satellite | | | 17.7% | |
General Merchandise Stores | | | 14.2% | |
Footwear | | | 10.9% | |
Automotive Retail | | | 6.5% | |
Home Improvement Retail | | | 6.4% | |
Movies & Entertainment | | | 4.5% | |
Distributors | | | 4.1% | |
Restaurants | | | 2.1% | |
Broadcasting | | | 1.9% | |
Specialty Stores | | | 1.6% | |
Apparel, Accessories & Luxury Goods | | | 1.5% | |
Other Industries (each less than 1%) | | | 1.4% | |
| | | | |
| | | 95.7% | |
| | | | |
Percentages are based upon common stocks as a percentage of net assets.
ICON Consumer Discretionary Fund
Sector Composition
September 30, 2011
| | | | |
Consumer Discretionary | | | 95.7% | |
| | | | |
| | | 95.7% | |
| | | | |
Percentages are based upon common stocks as a percentage of net assets.
ICON Consumer Discretionary Fund
Average Annual Total Return
as of September 30, 2011
| | | | | | | | | | | | | | | | | | | | | | | | | | | | |
| | | Inception
Date | | | 1 Year | | | 5 Years | | | 10 Years | | | Since
Inception | | | Gross
Expense
Ratio* | | | Net
Expense
Ratio* | |
ICON Consumer Discretionary
Fund - Class S | | | 7/9/97 | | | | 10.98% | | | | 0.35% | | | | 5.08% | | | | 2.92% | | | | 2.02% | | | | 1.74% | |
S&P 1500 Consumer Discretionary Index | | | | | | | 5.40% | | | | 1.29% | | | | 4.79% | | | | 4.99% | | | | N/A | | | | N/A | |
S&P Composite 1500 Index | | | | | | | 0.92% | | | | -0.86% | | | | 3.34% | | | | 3.84% | | | | N/A | | | | N/A | |
ICON Consumer Discretionary
Fund - Class C | | | 9/30/10 | | | | 10.10% | | | | N/A | | | | N/A | | | | 10.07% | | | | 3.02% | | | | 2.74% | |
S&P 1500 Consumer Discretionary Index | | | | | | | 5.40% | | | | N/A | | | | N/A | | | | 5.40% | | | | N/A | | | | N/A | |
S&P Composite 1500 Index | | | | | | | 0.92% | | | | N/A | | | | N/A | | | | 0.92% | | | | N/A | | | | N/A | |
ICON Consumer Discretionary
Fund - Class A | | | 9/30/10 | | | | 10.48% | | | | N/A | | | | N/A | | | | 10.45% | | | | 2.27% | | | | 1.99% | |
ICON Consumer Discretionary
Fund - Class A (including maximum sales charge
of 5.75%) | | | 9/30/10 | | | | 4.17% | | | | N/A | | | | N/A | | | | 4.16% | | | | 2.27% | | | | 1.99% | |
S&P 1500 Consumer Discretionary Index | | | | | | | 5.40% | | | | N/A | | | | N/A | | | | 5.40% | | | | N/A | | | | N/A | |
S&P Composite 1500 Index | | | | | | | 0.92% | | | | N/A | | | | N/A | | | | 0.92% | | | | N/A | | | | N/A | |
Past performance is not a guarantee of future results. The performance of the S&P 1500 Consumer Discretionary Index includes the reinvestment of the dividends and capital gain distributions beginning on January 1, 2002. Additional information about these performance results and the comparative indexes can be found in the About This Report section. The Adviser has agreed to limit certain Fund expenses; without these limitations, returns would have been lower. The limitation provisions may be terminated in the future.
| * | Please see the most recent prospectus for details. |
Class C total returns exclude applicable sales charges. If sales charges were included returns would be lower.
ICON Consumer Discretionary Fund
Value of a $10,000 Investment
through September 30, 2011
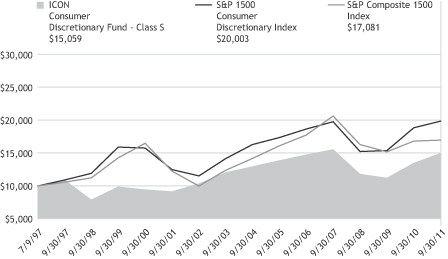
Past performance is not a guarantee of future results. The above graph compares a $10,000 investment made in the Fund’s Class S shares on the Class’ inception date of 7/9/97 to a $10,000 investment made in unmanaged securities indexes on that date. The Fund’s performance in this chart and the performance table assumes the reinvestment of dividends and capital gain distributions but does not reflect the deduction of taxes that a shareholder would pay on Fund distributions or on the redemption of Fund shares.
ICON CONSUMER DISCRETIONARY FUND
SCHEDULEOF INVESTMENTS
SEPTEMBER 30, 2011
| | | | | | | | |
| Shares or Principal Amount | | Value | |
| | | | | | | | |
| | Common Stocks (95.7%) | |
| | 9,600 | | | Aaron’s, Inc. | | $ | 242,400 | |
| | 13,800 | | | Advance Auto Parts, Inc. | | | 801,780 | |
| | 14,900 | | | Ascena Retail Group, Inc.† | | | 403,343 | |
| | 4,400 | | | AutoZone, Inc.† | | | 1,404,436 | |
| | 46,000 | | | Big Lots, Inc.† | | | 1,602,180 | |
| | 21,200 | | | Buckle, Inc.(a) | | | 815,352 | |
| | 161,200 | | | Comcast Corp., Class A | | | 3,369,080 | |
| | 10,700 | | | Darden Restaurants, Inc. | | | 457,425 | |
| | 5,100 | | | Deckers Outdoor Corp.† | | | 475,626 | |
| | 32,600 | | | DIRECTV, Class A† | | | 1,377,350 | |
| | 17,500 | | | Discovery Communications, Inc., Class A† | | | 658,350 | |
| | 29,500 | | | Gap, Inc. | | | 479,080 | |
| | 18,300 | | | Genuine Parts Co. | | | 929,640 | |
| | 19,200 | | | Gildan Activewear, Inc.(a) | | | 496,128 | |
| | 15,400 | | | Guess?, Inc. | | | 438,746 | |
| | 18,000 | | | H&R Block, Inc. | | | 239,580 | |
| | 21,600 | | | Home Depot, Inc. | | | 709,992 | |
| | 19,149 | | | JOS A. Bank Clothiers, Inc.† | | | 892,918 | |
| | 76,400 | | | Lowe’s Cos., Inc. | | | 1,477,576 | |
| | 2,900 | | | McDonald’s Corp. | | | 254,678 | |
| | 21,620 | | | Nike, Inc., Class B | | | 1,848,726 | |
| | 18,100 | | | Pool Corp. | | | 473,858 | |
| | | | | | | | |
| Shares or Principal Amount | | Value | |
| | | | | | | | |
| | 10,800 | | | Ross Stores, Inc. | | $ | 849,852 | |
| | 41,300 | | | Staples, Inc. | | | 549,290 | |
| | 66,600 | | | Target Corp. | | | 3,266,064 | |
| | 20,800 | | | Time Warner Cable, Inc. | | | 1,303,536 | |
| | 63,500 | | | TJX Cos., Inc. | | | 3,522,345 | |
| | 19,100 | | | Urban Outfitters, Inc.†(a) | | | 426,312 | |
| | 50,900 | | | Walt Disney Co. | | | 1,535,144 | |
| | 42,300 | | | Wolverine World Wide, Inc. | | | 1,406,475 | |
| | | | | | | | |
| Total Common Stocks
(Cost $33,873,896) | | | 32,707,262 | |
| Collateral for Securities on
Loan (3.9%) | | | | |
| | 1,322,350 | | | State Street Navigator Prime Portfolio | | | 1,322,350 | |
| | | | | | | | |
| Total Collateral for
Securities on Loan
(Cost $1,322,350) | | | 1,322,350 | |
| | Short-Term Investment (3.9%) | |
| $ | 1,320,613 | | | State Street Euro Dollar Time Deposit (USD), 0.01%, 10/03/11 | | | 1,320,613 | |
| | | | | | | | |
| Total Short-Term Investments
(Cost $1,320,613) | | | 1,320,613 | |
| Total Investments 103.5%
(Cost $36,516,859) | | | 35,350,225 | |
| Liabilities Less
Other Assets (3.5)% | | | (1,183,985 | ) |
| | | | | | | | |
| | Net Assets 100.0% | | $ | 34,166,240 | |
| | | | | | | | |
The accompanying notes are an integral part of the financial statements.
| † | Non-income producing security. |
| (a) | All or a portion of the security was on loan as of September 30, 2011. |
| | |
| 12 | | SCHEDULEOF INVESTMENTS |
| | | | |
MANAGEMENT OVERVIEW ICON CONSUMER STAPLES FUND | | Class S Class C Class A | | ICLEX ICLCX ICRAX |
| Q. | How did the Fund Perform relative to its benchmark? |
| A. | The ICON Consumer Staples Fund underperformed its sector-specific benchmark for the period. The Fund’s Class S shares rose 7.64%, while the benchmark S&P 1500 Consumer Staples Index rose 10.65%. However the Fund outperformed its broad-based benchmark, the S&P Composite 1500 Index, which returned 0.92% over the course of the fiscal year. The Fund’s Class A shares returned 8.52% (and 2.31% with maximum sales charge) during the same period and the Fund’s Class C shares returned 6.65% for the fiscal year (5.65% with maximum sales charge). Total returns for other periods as of September 30, 2011 appear in the subsequent pages of this Fund’s Management Overview. |
| Q. | What primary factors influenced the Fund’s relative performance during the period? |
| A. | The fiscal year was marked by concern over macro economic factors. A stubbornly high unemployment rate in the U.S., ongoing malaise in the domestic housing market, worries over a potential sharp decline in consumer spending and Europe’s sovereign debt crisis weighed heavily on investors. |
The resulting “risk on, risk off” trading led to wide swings in the equity indices. Good economic news generally had investors rushing in to buy stocks while bad economic data sent investors rushing out of the global equity markets. This choppy investment environment can prove challenging for ICON’s value-driven investment methodology.
If one theme emerged during this volatile year, we would describe it as a flight to safety. The uncertainty surrounding worldwide economic conditions led investors to steady, stable, supposedly “recession proof” or “defensive” industries, many of which make up the Consumer Staples sector. These include the household products, soft drinks and food distributors industries, all of which were held by the Fund.
The Consumer Staples sector was the second best performing of the 10 sectors tracked by S&P, just behind Utilities.
| Q. | How did the Fund’s composition affect performance? |
| A. | The Fund’s overweight positions in the movies & entertainment and distillers & vintners industries contributed about 2.0% to positive relative performance. |
In contrast, the Fund’s drug retail and agricultural products industries holdings detracted from the Fund’s relative performance. The Fund’s overweight positions in these two industries, both of which had negative returns, accounted for an approximately 1.9% decline in the Fund’s relative performance.
| Q. | What is your investment outlook for the Consumer Staples sector? |
| A. | As we enter the new fiscal year, the Consumer Staples sector is trading at a deep discount to our estimate of the sector’s fair value. We believe this sector could rally in the coming months and, therefore, we remain largely invested. We are not aggressively over or underweight any particular industry since our system indicates virtually all industries in this sector are undervalued. We will continue to use our systematic approach to investing in an effort to uncover sector bargains. |
ICON Consumer Staples Fund
Industry Composition
September 30, 2011
| | | | |
Household Products | | | 22.1% | |
Soft Drinks | | | 20.7% | |
Packaged Foods & Meats | | | 17.1% | |
Tobacco | | | 16.6% | |
Hypermarkets & Super Centers | | | 10.1% | |
Drug Retail | | | 3.1% | |
Food Distributors | | | 2.9% | |
General Merchandise Stores | | | 2.3% | |
Food Retail | | | 1.7% | |
Distillers & Vintners | | | 1.2% | |
Agricultural Products | | | 1.1% | |
Personal Products | | | 0.8% | |
| | | | |
| | | 99.7% | |
| | | | |
Percentages are based upon common stocks as a percentage of net assets.
ICON Consumer Staples Fund
Sector Composition
September 30, 2011
| | | | |
Consumer Staples | | | 97.4% | |
Consumer Discretionary | | | 2.3% | |
| | | | |
| | | 99.7% | |
| | | | |
Percentages are based upon common stocks as a percentage of net assets.
ICON Consumer Staples Fund
Average Annual Total Return
as of September 30, 2011
| | | | | | | | | | | | | | | | | | | | | | | | | | | | |
| | | Inception
Date | | | 1 Year | | | 5
Years | | | 10
Years | | | Since
Inception | | | Gross
Expense
Ratio* | | | Net
Expense
Ratio* | |
ICON Consumer Staples
Fund - Class S | | | 5/9/97 | | | | 7.64% | | | | 2.65% | | | | 6.32% | | | | 7.13% | | | | 1.54% | | | | 1.50% | |
S&P 1500 Consumer Discretionary Index | | | | | | | 5.40% | | | | 1.29% | | | | 4.79% | | | | 5.51% | | | | N/A | | | | N/A | |
S&P 1500 Consumer Staples Index | | | | | | | 10.65% | | | | 6.51% | | | | 6.66% | | | | 6.00% | | | | N/A | | | | N/A | |
S&P Composite 1500 Index | | | | | | | 0.92% | | | | -0.86% | | | | 3.34% | | | | 4.51% | | | | N/A | | | | N/A | |
ICON Consumer Staples
Fund - Class C | | | 9/30/10 | | | | 6.65% | | | | N/A | | | | N/A | | | | 6.63% | | | | 2.54% | | | | 2.50% | |
S&P 1500 Consumer Discretionary Index | | | | | | | 5.40% | | | | N/A | | | | N/A | | | | 5.40% | | | | N/A | | | | N/A | |
S&P 1500 Consumer Staples Index | | | | | | | 10.65% | | | | N/A | | | | N/A | | | | 10.65% | | | | N/A | | | | N/A | |
S&P Composite 1500 Index | | | | | | | 0.92% | | | | N/A | | | | N/A | | | | 0.92% | | | | N/A | | | | N/A | |
ICON Consumer Staples
Fund - Class A | | | 9/30/10 | | | | 8.52% | | | | N/A | | | | N/A | | | | 8.49% | | | | 1.79% | | | | 1.75% | |
ICON Consumer Staples Fund - Class A (including maximum sales charge of 5.75%) | | | 9/30/10 | | | | 2.31% | | | | N/A | | | | N/A | | | | 2.31% | | | | 1.79% | | | | 1.75% | |
S&P 1500 Consumer Discretionary Index | | | | | | | 5.40% | | | | N/A | | | | N/A | | | | 5.40% | | | | N/A | | | | N/A | |
S&P 1500 Consumer Staples Index | | | | | | | 10.65% | | | | N/A | | | | N/A | | | | 10.65% | | | | N/A | | | | N/A | |
S&P Composite 1500 Index | | | | | | | 0.92% | | | | N/A | | | | N/A | | | | 0.92% | | | | N/A | | | | N/A | |
Past performance is not a guarantee of future results. The performance of the S&P 1500 Consumer Discretionary Index includes the reinvestment of the dividends and capital gain distributions beginning on January 1, 2002. Additional information about these performance results and the comparative indexes can be found in the About This Report section. The Adviser has agreed to limit certain Fund expenses; without
these limitations, returns would have been lower. The limitation provisions may be terminated in the future.
| * | Please see the most recent prospectus for details. |
Class C total returns exclude applicable sales charges. If sales charges were included returns would be lower.
ICON Consumer Staples Fund
Value of a $10,000 Investment
through September 30, 2011
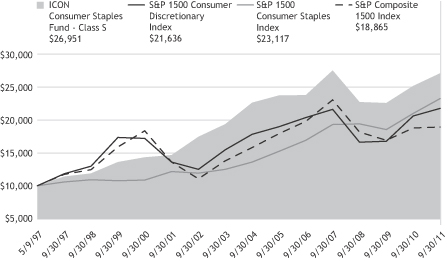
Past performance is not a guarantee of future results. The above graph compares a $10,000 investment made in the Fund’s Class S shares on the Class’ inception date of 5/9/97 to a $10,000 investment made in unmanaged securities indexes on that date. The Fund’s performance in this chart and the performance table assumes the reinvestment of dividends and capital gain distributions but does not reflect the deduction of taxes that a shareholder would pay on Fund distributions or on the redemption of Fund shares.
ICON CONSUMER STAPLES FUND
SCHEDULEOF INVESTMENTS
SEPTEMBER 30, 2011
| | | | | | | | |
| Shares or Principal Amount | | Value | |
| | | | | | | | |
| | Common Stocks (99.7%) | |
| | 39,900 | | | Altria Group, Inc. | | $ | 1,069,719 | |
| | 9,100 | | | Andersons, Inc. | | | 306,306 | |
| | 5,700 | | | Archer-Daniels-Midland Co. | | | 141,417 | |
| | 8,400 | | | Avon Products, Inc. | | | 164,640 | |
| | 9,700 | | | Campbell Soup Co. | | | 313,989 | |
| | 22,800 | | | Coca-Cola Co. | | | 1,540,368 | |
| | 17,900 | | | Coca-Cola Enterprises, Inc. | | | 445,352 | |
| | 11,500 | | | Colgate-Palmolive Co. | | | 1,019,820 | |
| | 13,700 | | | Constellation Brands, Inc., Class A† | | | 246,600 | |
| | 2,400 | | | Corn Products International, Inc. | | | 94,176 | |
| | 8,400 | | | CVS Caremark Corp. | | | 282,072 | |
| | 10,100 | | | Dr. Pepper Snapple Group, Inc. | | | 391,678 | |
| | 18,500 | | | General Mills, Inc. | | | 711,695 | |
| | 7,200 | | | HJ Heinz Co. | | | 363,456 | |
| | 16,800 | | | Hormel Foods Corp. | | | 453,936 | |
| | 6,000 | | | J.M. Smucker Co. | | | 437,340 | |
| | 15,200 | | | Kellogg Co. | | | 808,488 | |
| | 17,900 | | | Kimberly-Clark Corp.(a) | | | 1,271,079 | |
| | 10,500 | | | Kraft Foods, Inc., Class A | | | 352,590 | |
| | 15,500 | | | Kroger Co. | | | 340,380 | |
| | 4,800 | | | Lorillard, Inc. | | | 531,360 | |
| | | | | | | | |
| Shares or Principal Amount | | Value | |
| | | | | | | | |
| | 2,200 | | | McCormick & Co., Inc. | | $ | 101,552 | |
| | 30,800 | | | PepsiCo, Inc. | | | 1,906,520 | |
| | 29,300 | | | Philip Morris International, Inc. | | | 1,827,734 | |
| | 36,100 | | | Procter & Gamble Co. | | | 2,280,798 | |
| | 11,700 | | | Sysco Corp. | | | 303,030 | |
| | 9,600 | | | Target Corp. | | | 470,784 | |
| | 40,300 | | | Wal-Mart Stores, Inc. | | | 2,091,570 | |
| | 10,900 | | | Walgreen Co. | | | 358,501 | |
| | | | | | | | |
| Total Common Stocks
(Cost $20,584,837) | | | 20,626,950 | |
| Collateral for Securities on
Loan (0.2%) | | | | |
| | 42,195 | | | State Street Navigator Prime Portfolio | | | 42,195 | |
| | | | | | | | |
| Total Collateral for Securities
on Loan
(Cost $42,195) | | | 42,195 | |
| | Short-Term Investment (7.7%) | |
| $ | 1,592,203 | | | State Street Euro Dollar Time Deposit (USD), 0.01%, 10/03/11 | | | 1,592,203 | |
| | | | | | | | |
| Total Short-Term Investments
(Cost $1,592,203) | | | 1,592,203 | |
| Total Investments 107.6%
(Cost $22,219,235) | | | 22,261,348 | |
| Liabilities Less Other Assets
(7.6)% | | | (1,568,571 | ) |
| | | | | | | | |
| | Net Assets 100.0% | | $ | 20,692,777 | |
| | | | | | | | |
The accompanying notes are an integral part of the financial statements.
| † | Non-income producing security. |
| (a) | All or a portion of the security was on loan as of September 30, 2011. |
| | | | |
| SCHEDULEOF INVESTMENTS | | | 17 | |
| | | | |
MANAGEMENT OVERVIEW ICON ENERGY FUND | | Class S Class C Class A | | ICENX ICEEX ICEAX |
| Q. | How did the Fund perform relative to its benchmarks? |
| A. | For the fiscal year ended September 30, 2011, the ICON Energy Fund returned 0.8%, lagging its sector-specific benchmark, the S&P 1500 Energy Index, which gained 7.13%, and its broad benchmark, the S&P Composite 1500 Index, which rose 0.92%. The Fund’s Class A shares returned 0.49% (and -5.29% with maximum sales charge) during the same period and the Fund’s Class C shares returned -0.23% for the fiscal year (-1.23% with maximum sales charge). Total returns for other periods as of September 30, 2011 appear in the subsequent pages of this Fund’s Management Overview. |
| Q. | What primary factors were behind the Fund’s relative performance? |
| A. | While Fund returns were in-line with the broad benchmark, the Fund experienced significant volatility over the course of the fiscal year. The price of oil, measured by West Texas Intermediate Crude, was partially responsible for this volatility. Unrest in the Middle East, notably discord in Egypt, Syria and Libya, led to concerns over distribution. Meanwhile, the sovereign debt crisis in Europe resulted in the paring back of global economic growth estimates. Crude prices saw dramatic swings during the last 12-months, ranging between a high of $113.93 per barrel on April 29, 2011 and a low of $79.20 per barrel on September 30, 2011 - very close to where crude prices sat when the fiscal year began. |
The Fund’s use of options negatively impacted performance. In December 2010, concerned about a possible selloff in the sector, the Fund purchased put options in the hope of paring potential losses. The options’ value eroded, however, as the Fund’s holdings rose an additional 18% between December 15, 2010 and April 29, 2011. On the other hand, the options contributed positively to performance as the market declined after April 29, 2011. Net, however, this positive contribution was not enough to offset the losses sustained prior to that date and, overall, the Fund’s use of derivatives was responsible for nearly a 1% drag on performance.
While the price of oil declined over the fiscal year, the crack spread (that is, the difference between the price of crude oil and the petroleum products extracted from the crude) rose sharply. The Gulf Coast 3:2:1 benchmark, which measures the crack spread, gained over 275% between October 1, 2010 and September 30, 2011. The rise in the crack spread
saw a corresponding rise in the profit margins of many companies in the oil & gas refining & marketing industry.
| Q. | How did the Fund’s composition affect performance? |
| A. | The Fund’s oil & gas refining & marketing holdings contributed positively to relative performance. Over the course of the fiscal year the Fund held a nearly 6% position in this industry, significantly overweight the roughly 2% position reflected in the sector-specific benchmark. The Fund’s oil & gas refining & marketing holdings were up around 32% over the last 12-months. Unfortunately, these gains were not sufficient to offset the relative underperformance created by the Fund’s integrated oil & gas industry holdings. Moreover, the Fund’s underweight position in Exxon Mobil negatively impacted performance. Exxon Mobil had a total return of 20% over the 12-month period, but while Exxon Mobil made up approximately 25% of the S&P 1500 Energy Sector Index, it had an average weight of only 20% in the Fund during that time. The Fund’s underweight exposure to the oil & gas storage & transportation industry likewise detracted from performance. The industry returned an average of about 24% during the fiscal year, but made up only 1% of the Fund versus 3.28% of the benchmark. |
| Q. | What is your investment outlook for the Energy sector? |
| A. | As of fiscal year-end, we estimate the Energy sector has an overall V/P of 1.57, with several industries within the sector showing even greater value. Accordingly, and as of this writing, we are optimistic that we will continue to find investing opportunities within the Energy sector in the coming year. |
ICON Energy Fund
Industry Composition
September 30, 2011
| | | | |
Integrated Oil & Gas | | | 55.8% | |
Oil & Gas Equipment & Services | | | 17.6% | |
Oil & Gas Refining & Marketing | | | 12.1% | |
Oil & Gas Exploration & Production | | | 5.7% | |
Oil & Gas Drilling | | | 5.4% | |
Coal & Consumable Fuels | | | 2.2% | |
| | | | |
| | | 98.8% | |
| | | | |
Percentages are based upon common stocks as a percentage of net assets.
ICON Energy Fund
Sector Composition
September 30, 2011
Percentages are based upon common stocks as a percentage of net assets.
ICON Energy Fund
Average Annual Total Return
as of September 30, 2011
| | | | | | | | | | | | | | | | | | | | | | | | | | | | |
| | | Inception
Date | | | 1 Year | | | 5 Years | | | 10 Years | | | Since
Inception | | | Gross
Expense
Ratio* | | | Net
Expense
Ratio* | |
ICON Energy Fund - Class S | | | 11/5/97 | | | | 0.80% | | | | 3.93% | | | | 13.44% | | | | 11.26% | | | | 1.24% | | | | 1.24% | |
S&P 1500 Energy Index | | | | | | | 7.13% | | | | 3.56% | | | | 10.82% | | | | 8.25% | | | | N/A | | | | N/A | |
S&P Composite 1500 Index | | | | | | | 0.92% | | | | -0.86% | | | | 3.34% | | | | 3.53% | | | | N/A | | | | N/A | |
ICON Energy
Fund - Class C | | | 9/30/10 | | | | -0.23% | | | | N/A | | | | N/A | | | | -0.23% | | | | 2.24% | | | | 2.24% | |
S&P 1500 Energy Index | | | | | | | 7.13% | | | | N/A | | | | N/A | | | | 7.13% | | | | N/A | | | | N/A | |
S&P Composite 1500 Index | | | | | | | 0.92% | | | | N/A | | | | N/A | | | | 0.92% | | | | N/A | | | | N/A | |
ICON Energy
Fund - Class A | | | 9/30/10 | | | | 0.49% | | | | N/A | | | | N/A | | | | 0.49% | | | | 1.49% | | | | 1.49% | |
ICON Energy
Fund - Class A (including maximum sales charge of 5.75%) | | | 9/30/10 | | | | -5.29% | | | | N/A | | | | N/A | | | | -5.28% | | | | 1.49% | | | | 1.49% | |
S&P 1500 Energy Index | | | | | | | 7.13% | | | | N/A | | | | N/A | | | | 7.13% | | | | N/A | | | | N/A | |
S&P Composite 1500 Index | | | | | | | 0.92% | | | | N/A | | | | N/A | | | | 0.92% | | | | N/A | | | | N/A | |
Past performance is not a guarantee of future results. Information about these performance results and the comparative indexes can be found in the About This Report section. The Adviser has agreed to limit certain Fund expenses; without these limitations, returns would have been lower. The limitation provisions may be terminated in the future.
| * | Please see the most recent prospectus for details. |
Class C total returns exclude applicable sales charges. If sales charges were included returns would be lower.
ICON Energy Fund
Value of a $10,000 Investment
through September 30, 2011
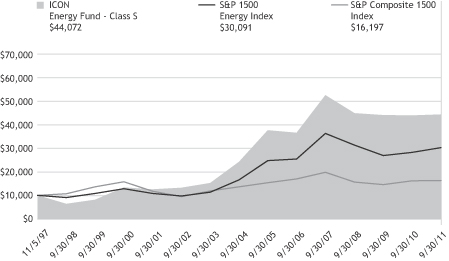
Past performance is not a guarantee of future results. The above graph compares a $10,000 investment made in the Fund’s Class S shares on the Class’ inception date of 11/5/97 to a $10,000 investment made in unmanaged securities indexes on that date. The Fund’s performance in this chart and the performance table assumes the reinvestment of dividends and capital gain distributions but does not reflect the deduction of taxes that a shareholder would pay on Fund distributions or on the redemption of Fund shares.
ICON ENERGY FUND
SCHEDULEOF INVESTMENTS
SEPTEMBER 30, 2011
| | | | | | | | |
| Shares or Principal Amount | | Value | |
| | | | | | | | |
| | Common Stocks (98.8%) | |
| | 84,900 | | | Alliance Resource Partners L.P. | | $ | 5,566,044 | |
| | 133,900 | | | Apache Corp. | | | 10,744,136 | |
| | 318,500 | | | Baker Hughes, Inc. | | | 14,701,960 | |
| | 118,100 | | | Cameron International Corp.† | | | 4,905,874 | |
| | 896,200 | | | Chevron Corp. | | | 82,916,424 | |
| | 638,100 | | | ConocoPhillips | | | 40,404,492 | |
| | 101,800 | | | Consol Energy, Inc. | | | 3,454,074 | |
| | 18,000 | | | Core Laboratories NV | | | 1,616,940 | |
| | 192,000 | | | Devon Energy Corp. | | | 10,644,480 | |
| | 92,800 | | | Diamond Offshore Drilling, Inc.(a) | | | 5,079,872 | |
| | 139,100 | | | Dril-Quip, Inc.† | | | 7,498,881 | |
| | 152,100 | | | Ensco PLC, ADR | | | 6,149,403 | |
| | 1,738,500 | | | Exxon Mobil Corp. | | | 126,267,255 | |
| | 584,900 | | | Halliburton Co. | | | 17,851,148 | |
| | 172,100 | | | Helmerich & Payne, Inc. | | | 6,987,260 | |
| | 238,300 | | | Hess Corp. | | | 12,501,218 | |
| | 345,400 | | | Marathon Oil Corp. | | | 7,453,732 | |
| | 182,500 | | | Marathon Petroleum Corp. | | | 4,938,450 | |
| | 238,600 | | | Murphy Oil Corp. | | | 10,536,576 | |
| | 349,400 | | | National Oilwell Varco, Inc. | | | 17,896,268 | |
| | 133,400 | | | Newfield Exploration Co.† | | | 5,294,646 | |
| | 288,500 | | | Noble Corp.† | | | 8,467,475 | |
| | 290,400 | | | Occidental Petroleum Corp. | | | 20,763,600 | |
| | 103,900 | | | Peabody Energy Corp. | | | 3,520,132 | |
| | 59,300 | | | PetroChina Co., Ltd. | | | 7,145,057 | |
| | | | | | | | |
| Shares or Principal Amount | | Value | |
| | | | | | | | |
| | 441,400 | | | Schlumberger, Ltd. | | $ | 26,364,822 | |
| | 175,800 | | | Southwestern Energy Co.† | | | 5,859,414 | |
| | 331,400 | | | Suncor Energy, Inc. | | | 8,430,816 | |
| | 173,500 | | | Sunoco, Inc. | | | 5,380,235 | |
| | 740,000 | | | Tesoro Corp.† | | | 14,407,800 | |
| | 104,500 | | | Tidewater, Inc. | | | 4,394,225 | |
| | 78,700 | | | Transocean, Ltd. | | | 3,757,138 | |
| | 1,381,900 | | | Valero Energy Corp. | | | 24,570,182 | |
| | 397,200 | | | Weatherford International, Ltd.† | | | 4,849,812 | |
| | 318,000 | | | Western Refining, Inc.†(a) | | | 3,962,280 | |
| | 467,800 | | | World Fuel Services Corp.(a) | | | 15,273,670 | |
| | | | | | | | |
| Total Common Stocks
(Cost $617,804,499) | | | 560,555,791 | |
| Collateral for Securities on
Loan (3.0%) | | | | |
| | 16,866,358 | | | State Street Navigator Prime Portfolio | | | 16,866,358 | |
| | | | | | | | |
| Total Collateral for
Securities on Loan
(Cost $16,866,358) | | | 16,866,358 | |
| | Short-Term Investment (0.3%) | |
| $ | 1,692,020 | | | State Street Euro Dollar Time Deposit (USD), 0.01%, 10/03/11 | | | 1,692,020 | |
| | | | | | | | |
| Total Short-Term
Investments
(Cost $1,692,020) | | | 1,692,020 | |
| Total Investments 102.1%
(Cost $636,362,877) | | | 579,114,169 | |
| Liabilities Less
Other Assets (2.1)% | | | (11,998,317 | ) |
| | | | | | | | |
| | Net Assets 100.0% | | $ | 567,115,852 | |
| | | | | | | | |
| | |
| 22 | | SCHEDULEOF INVESTMENTS |
The accompanying notes are an integral part of the financial statements.
| † | Non-income producing security. |
| (a) | All or a portion of the security was on loan as of September 30, 2011. |
| ADR | American Depository Receipt |
| | | | |
| SCHEDULEOF INVESTMENTS | | | 23 | |
| | | | |
MANAGEMENT OVERVIEW ICON FINANCIAL FUND | | Class S Class C Class A | | ICFSX ICOCX ICFAX |
| Q. | How did the Fund perform relative to its benchmarks? |
| A. | The ICON Financial Fund Class S lost 15.18% for the fiscal year ending September 30, 2011, about in-line with the Fund’s sector-specific benchmark, the S&P 1500 Financials Index, which declined 15.24%. Class A shares of the Fund returned -15.36% (and -20.25% with maximum sales charge) during the same period while the Fund’s Class C shares returned -16.08% (-17.08% with maximum sales charge). The broad-based S&P Composite 1500 Index gained 0.92% during the fiscal year. Total returns for other periods as of September 30, 2011 appear in the subsequent pages of this Fund’s Management Overview. |
| Q. | What primary factors were behind the Fund’s relative performance? |
| A. | The Financials sector lagged the broader equity market for a third year in a row as the sector struggled to regain momentum. We believe a dismal global economic outlook (and, in particular, sovereign debt concerns among the Eurozone nations referred to in the press under the “PIIGS” acronym (Portugal, Italy, Ireland, Greece and Spain)) combined with the uncertainties surrounding litigation for key players within the sector have proven unsettling for most Financials investors. Bank of America (“BOA”), for example, paid nearly $3 billion to settle claims with Fannie Mae and Freddie Mac early in the fiscal year. Fannie Mae recently announced, however, that it may exercise its right to have BOA buy back faulty loans – a move that could cost BOA billions of dollars. Over the course of the fiscal year, BOA’s stock has declined by 53%. JP Morgan Chase & Co. also struggled with shareholder lawsuits, declining 19.8% between September 30, 2010 and September 30, 2011. |
Investors are troubled by the potential fallout of the sovereign debt crisis and pending litigation. The resulting selloff helps explain the sector’s weak performance relative to the broader market.
| Q. | How did the Fund’s composition affect performance? |
| A. | During the first half of the fiscal year, as of March 31, 2011, the ICON Financial Fund returned 12.7% versus 15.0% for its benchmark, the S&P 1500 Financials Index. The Fund’s overweight exposure to insurance industries detracted from performance, as the slow housing market had an adverse affect on insurance companies that derive income from title and mortgage insurance. For example, the Fund held positions in both |
| | Fidelity National Financial and Allstate Insurance, both of which detracted from performance. Fidelity National missed its 3rd quarter earnings estimates by more than 27% due in part to reduced demand for title insurance. These disappointing results caused Fidelity National to reduce its dividend as well. Allstate likewise missed 3rd quarter estimates as the number of homeowner insurance policies it issued fell. Our significant positions in both Allstate and Fidelity National at the time of their earnings announcements proved to be a drag on performance during the first half of the fiscal year. |
The Fund’s consumer finance and credit card processing company holdings (specifically, Visa and MasterCard) contributed to the Fund’s positive performance in the second half of the fiscal year. On average during the fiscal year, the Fund held a 10% position in consumer finance companies, compared with a 4.5% weighting in the sector-specific S&P 1500 Financials Index benchmark. On June 29, 2011, Visa and MasterCard rallied 11% and 15% respectively, buoyed by the Federal government’s higher than expected cap on debit card fees. Companies in the specialized finance industry also contributed positively to the Fund’s performance on news in April 2011 that the NASDAQ and Intercontinental Exchange would be making a joint bid to purchase NYSE Euronext. The Fund’s approximate 18.7% return in specialized finance holdings outperformed the sector-specific index’s return of 1.12% for this industry The Fund was also overweight this industry, holding a 6.7% position on average between March 31, 2011 and September 30, 2011 versus the benchmark’s 2.6% position. An underweight in REIT industry holdings also hindered the Fund’s performance.
| Q. | What is your investment outlook for the Financials sector? |
| A. | As of September 30, 2011, we calculate an overall V/P of 1.48 for the domestic market, suggesting to us that many opportunities remain available to investors. We calculate a V/P of 1.59 for the Financials sector as of September 30, 2011, indicating even greater potential under the ICON system for investors interested in Financials. We are optimistic that the economy will continue to improve, and as that occurs, we hope to be positioned to take advantage of any rally. |
ICON Financial Fund
Industry Composition
September 30, 2011
| | | | |
Other Diversified Financial Services | | | 14.2% | |
Specialized Finance | | | 11.9% | |
Diversified Banks | | | 11.8% | |
Asset Management & Custody Banks | | | 10.8% | |
Property & Casualty Insurance | | | 9.6% | |
Regional Banks | | | 8.0% | |
Life & Health Insurance | | | 7.7% | |
Investment Banking & Brokerage | | | 6.1% | |
Consumer Finance | | | 5.5% | |
Multi-line Insurance | | | 3.3% | |
Thrifts & Mortgage Finance | | | 2.9% | |
Reinsurance | | | 2.8% | |
Mortgage REIT’s | | | 1.6% | |
Specialized REIT’s | | | 1.1% | |
Data Processing & Outsourced Services | | | 1.0% | |
Diversified Capital Markets | | | 0.9% | |
| | | | |
| | | 99.2% | |
| | | | |
Percentages are based upon common stocks as a percentage of net assets.
ICON Financial Fund
Sector Composition
September 30, 2011
| | | | |
Financial | | | 98.2% | |
Information Technology | | | 1.0% | |
| | | | |
| | | 99.2% | |
| | | | |
Percentages are based upon common stocks as a percentage of net assets.
ICON Financial Fund
Average Annual Total Return
as of September 30, 2011
| | | | | | | | | | | | | | | | | | | | | | | | | | | | |
| | | Inception
Date | | | 1 Year | | | 5 Years | | | 10 Years | | | Since
Inception | | | Gross
Expense
Ratio* | | | Net
Expense
Ratio* | |
ICON Financial Fund - Class S | | | 7/1/97 | | | | -15.18% | | | | -16.07% | | | | -3.51% | | | | 0.65% | | | | 1.43% | | | | 1.43% | |
S&P 1500 Financials Index | | | | | | | -15.24% | | | | -16.14% | | | | -3.91% | | | | -0.05% | | | | N/A | | | | N/A | |
S&P Composite 1500 Index | | | | | | | 0.92% | | | | -0.86% | | | | 3.34% | | | | 3.96% | | | | N/A | | | | N/A | |
ICON Financial Fund - Class C | | | 9/30/10 | | | | -16.08% | | | | N/A | | | | N/A | | | | -16.04% | | | | 2.43% | | | | 2.43% | |
S&P 1500 Financials Index | | | | | | | -15.24% | | | | N/A | | | | N/A | | | | -15.24% | | | | N/A | | | | N/A | |
S&P Composite 1500 Index | | | | | | | 0.92% | | | | N/A | | | | N/A | | | | 0.92% | | | | N/A | | | | N/A | |
ICON Financial Fund - Class A | | | 9/30/10 | | | | -15.36% | | | | N/A | | | | N/A | | | | -15.32% | | | | 1.68% | | | | 1.68% | |
ICON Financial Fund - Class A (including maximum sales charge of 5.75%) | | | 9/30/10 | | | | -20.25% | | | | N/A | | | | N/A | | | | -20.20% | | | | 1.68% | | | | 1.68% | |
S&P 1500 Financials Index | | | | | | | -15.24% | | | | N/A | | | | N/A | | | | -15.24% | | | | N/A | | | | N/A | |
S&P Composite 1500 Index | | | | | | | 0.92% | | | | N/A | | | | N/A | | | | 0.92% | | | | N/A | | | | N/A | |
Past performance is not a guarantee of future results. Information about these performance results and the comparative indexes can be found in the About This Report section. The Adviser has agreed to limit certain Fund expenses; without these limitations, returns would have been lower. The limitation provisions may be terminated in the future.
| * | Please see the most recent prospectus for details. |
Class C total returns exclude applicable sales charges. If sales charges were included returns would be lower.
ICON Financial Fund
Value of a $10,000 Investment
through September 30, 2011
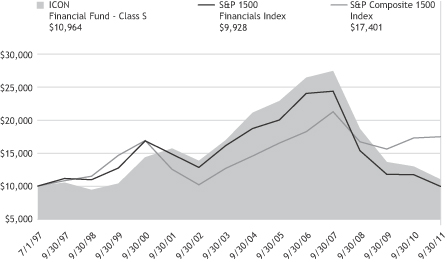
Past performance is not a guarantee of future results. The above graph compares a $10,000 investment made in the Fund’s Class S shares on the Class’ inception date of 7/1/97 to a $10,000 investment made in unmanaged securities indexes on that date. The Fund’s performance in this chart and the performance table assumes the reinvestment of dividends and capital gain distributions but does not reflect the deduction of taxes that a shareholder would pay on Fund distributions or on the redemption of Fund shares.
ICON FINANCIAL FUND
SCHEDULEOF INVESTMENTS
SEPTEMBER 30, 2011
| | | | | | | | |
| Shares or Principal Amount | | Value | |
| | | | | | | | |
| | Common Stocks (99.2%) | |
| | 11,100 | | | ACE, Ltd. | | $ | 672,660 | |
| | 8,600 | | | Aflac, Inc. | | | 300,570 | |
| | 11,900 | | | Allied World Assurance Co. Holdings, Ltd. | | | 639,149 | |
| | 7,200 | | | American Express Co. | | | 323,280 | |
| | 5,900 | | | American Financial Group, Inc. | | | 183,313 | |
| | 11,200 | | | Ameriprise Financial, Inc. | | | 440,832 | |
| | 9,600 | | | Annaly Capital Management, Inc., REIT | | | 159,648 | |
| | 23,800 | | | Anworth Mortgage Asset Corp., REIT | | | 161,840 | |
| | 8,400 | | | Assurant, Inc. | | | 300,720 | |
| | 209,000 | | | Bank of America Corp. | | | 1,279,080 | |
| | 24,500 | | | Bank of New York Mellon Corp. | | | 455,455 | |
| | 40,700 | | | BB&T Corp. | | | 868,131 | |
| | 2,700 | | | BlackRock, Inc. | | | 399,627 | |
| | 8,700 | | | Capital One Financial Corp. | | | 344,781 | |
| | 7,200 | | | Cash America International, Inc. | | | 368,352 | |
| | 57,100 | | | Charles Schwab Corp. | | | 643,517 | |
| | 7,500 | | | Chubb Corp. | | | 449,925 | |
| | 60,590 | | | Citigroup, Inc. | | | 1,552,316 | |
| | 4,100 | | | CME Group, Inc. | | | 1,010,240 | |
| | 6,600 | | | Cullen/Frost Bankers, Inc. | | | 302,676 | |
| | 19,100 | | | Delphi Financial Group, Inc., Class A | | | 411,032 | |
| | 8,200 | | | Deutsche Bank AG | | | 283,802 | |
| | 4,500 | | | Everest Re Group, Ltd. | | | 357,210 | |
| | 12,000 | | | Ezcorp, Inc., Class A† | | | 342,480 | |
| | 14,100 | | | Federated Investors, Inc., Class B | | | 247,173 | |
| | | | | | | | |
| Shares or Principal Amount | | Value | |
| | | | | | | | |
| | 44,800 | | | First Niagara Financial Group, Inc. | | $ | 409,920 | |
| | 6,600 | | | Franklin Resources, Inc. | | | 631,224 | |
| | 7,500 | | | Goldman Sachs Group, Inc. | | | 709,125 | |
| | 20,300 | | | Hancock Holding Co. | | | 543,634 | |
| | 14,300 | | | Hartford Financial Services Group, Inc. | | | 230,802 | |
| | 12,800 | | | HCC Insurance Holdings, Inc. | | | 346,240 | |
| | 16,200 | | | Hospitality Properties Trust, REIT | | | 343,926 | |
| | 6,600 | | | IntercontinentalExchange, Inc.† | | | 780,516 | |
| | 9,300 | | | Invesco, Ltd. | | | 144,243 | |
| | 59,200 | | | JPMorgan Chase & Co. | | | 1,783,104 | |
| | 5,400 | | | M&T Bank Corp. | | | 377,460 | |
| | 28,200 | | | Manulife Financial Corp. | | | 319,506 | |
| | 26,500 | | | MetLife, Inc. | | | 742,265 | |
| | 11,800 | | | Moody’s Corp. | | | 359,310 | |
| | 27,000 | | | Morgan Stanley | | | 364,500 | |
| | 48,400 | | | NASDAQ OMX Group, Inc.† | | | 1,119,976 | |
| | 46,000 | | | People’s United Financial, Inc. | | | 524,400 | |
| | 10,500 | | | PNC Financial Services Group, Inc. | | | 505,995 | |
| | 9,500 | | | Portfolio Recovery Associates, Inc.† | | | 591,090 | |
| | 18,000 | | | Progressive Corp. | | | 319,680 | |
| | 9,600 | | | Prudential Financial, Inc. | | | 449,856 | |
| | 17,600 | | | Redwood Trust, Inc., REIT | | | 196,592 | |
| | 12,400 | | | Reinsurance Group of America, Inc. | | | 569,780 | |
| | 19,700 | | | State Street Corp. | | | 633,552 | |
| | 11,400 | | | Sun Life Financial, Inc. | | | 271,206 | |
| | 8,200 | | | T Rowe Price Group, Inc. | | | 391,714 | |
| | | | |
| SCHEDULEOF INVESTMENTS | | | 29 | |
| | | | | | | | |
| Shares or Principal Amount | | Value | |
| | | | | | | | |
| | 18,100 | | | TD Ameritrade Holding Corp. | | $ | 266,160 | |
| | 15,500 | | | Tower Group, Inc. | | | 354,330 | |
| | 14,000 | | | Travelers Cos., Inc. | | | 682,220 | |
| | 38,000 | | | U.S. Bancorp | | | 894,520 | |
| | 3,900 | | | Visa, Inc., Class A | | | 334,308 | |
| | 6,500 | | | Waddell & Reed Financial, Inc., Class A | | | 162,565 | |
| | | | | | | | |
| Shares or Principal Amount | | Value | |
| | 122,100 | | | Wells Fargo & Co. | | $ | 2,945,052 | |
| | 7,400 | | | World Acceptance Corp.† | | | 414,030 | |
| | | | | | | | |
| Total Common Stocks
(Cost $38,302,481) | | | 32,210,610 | |
| Total Investments 99.2%
(Cost $38,302,481) | | | 32,210,610 | |
| Other Assets Less Liabilities
0.8% | | | 254,232 | |
| | | | | | | | |
| | Net Assets 100.0% | | $ | 32,464,842 | |
| | | | | | | | |
The accompanying notes are an integral part of the financial statements.
| † | Non-income producing security. |
| REIT | Real Estate Investment Trust |
| | |
| 30 | | SCHEDULEOF INVESTMENTS |
| | | | |
MANAGEMENT OVERVIEW ICON HEALTHCARE FUND | | Class S Class C Class A | | ICHCX ICHEX ICHAX |
| Q. | How did the Fund perform relative to its benchmarks? |
| A. | For the fiscal year ended September 30, 2011, the Fund’s sector-specific benchmark, the S&P 1500 Health Care Index, returned 6.45%, and its broad benchmark, the S&P Composite 1500 Index, returned 0.92%. The ICON Healthcare Fund Class S outperformed both benchmarks, gaining 6.66% during the same period. Class A shares of the Fund returned 6.42% (and 0.30% with maximum sales charge) during the same period while the Fund’s Class C shares returned 5.64% for the fiscal year (4.64% with maximum sales charge). Total returns for other periods as of September 30, 2011 appear in the subsequent pages of this Fund’s Management Overview. |
| Q. | What primary factors were behind the Fund’s relative performance? |
| A. | The Healthcare sector fared relatively well in 2011. After lagging the broad market for the first half of the fiscal year, the sector resisted the market declines of the last fiscal quarter caused by sovereign debt worries in Greece, the Moody’s downgrade of the U.S. debt rating, and a deadlocked Congress. The Consumer Staples, Utilities, and Healthcare sectors were more resistant to the sharp declines that took a greater toll on Materials, Financials and other sectors. However, the Congressional debates over the debt ceiling reintroduced worry and speculation about future cuts to Medicare and Medicaid and caused some Healthcare industries to take a hit. |
While there were no immediate cuts, health care analysts predicted the 12-member “super committee” charged with slashing federal spending by $1.5 trillion could make significant changes to the programs, including cuts to Medigap insurance, which would limit supplemental insurance plans for the elderly. The industries hit the hardest over this news were health care facilities, life sciences tools & services, and managed health care. Hospitals and doctor groups warned that cuts to Medicare and Medicaid would decrease revenues and crowd underfunded emergency rooms. Medical research funding could also face large cuts, which would take a heavy toll on life sciences and biotech companies receiving federal aid. Rampant speculation over potential funding troubles led to certain industries faring worse than others in the last few months of the fiscal year.
| Q. | How did the Fund’s composition affect performance? |
| A. | The Fund’s concentrations in the pharmaceutical and managed health care industries contributed positively to the returns relative to the benchmark. Several small-cap pharmaceutical companies held in the Fund saw substantial gains after better than expected earnings releases and acquisition deals. The Fund’s performance also benefitted from a strong underweight in the health care facilities industry. Several companies in the industry saw sharp two day losses between 25% and 40% after the announcement of the Congressional budget reductions. In many cases, quarterly earnings forecasts were lowered to reflect these expected income shortfalls. |
The Fund’s health care services industry holdings detracted from performance because of regulation changes. Gentiva Health Services, for example, declined over 65% between July 29, 2011 and August 10, 2011 amid speculation that it would suffer a mandated reduction in government reimbursements. Other detractors to performance came from biotechnology firms failing to get approval for new drugs in development. Heavy weights in companies such as United Therapeutics and Salix Pharmaceuticals detracted from the Fund’s performance when the companies announced that drugs in development had failed to pass trial testing.
| Q. | What is your investment outlook for the Healthcare sector? |
| A. | Under ICON’s valuation methodology, the Healthcare sector ranks among the most undervalued of the sectors we track. As of fiscal year end, our calculations indicate the Healthcare sector continues to have significant potential upside, trading at a 49% discount to our measurement of the sector’s intrinsic value. We are optimistic that the economy will continue to expand and that the market will continue to move higher. The Fund ends its fiscal year overweight in the biotechnology and health care distributors industries, with significant positions in both large and small-cap pharmaceuticals. |
ICON Healthcare Fund
Industry Composition
September 30, 2011
| | | | |
Pharmaceuticals | | | 43.1% | |
Biotechnology | | | 14.8% | |
Health Care Equipment | | | 13.2% | |
Health Care Distributors | | | 10.1% | |
Managed Health Care | | | 6.9% | |
Health Care Services | | | 5.7% | |
Life Sciences Tools & Services | | | 3.1% | |
Industrial Conglomerates | | | 1.8% | |
Life & Health Insurance | | | 0.9% | |
| | | | |
| | | 99.6% | |
| | | | |
Percentages are based upon common stocks as a percentage of net assets.
ICON Healthcare Fund
Sector Composition
September 30, 2011
| | | | |
Health Care | | | 96.9% | |
Industrials | | | 1.8% | |
Financial | | | 0.9% | |
| | | | |
| | | 99.6% | |
| | | | |
Percentages are based upon common stocks as a percentage of net assets.
ICON Healthcare Fund
Average Annual Total Return
as of September 30, 2011
| | | | | | | | | | | | | | | | | | | | | | | | | | | | |
| | | Inception
Date | | | 1
Year | | | 5
Years | | | 10
Years | | | Since
Inception | | | Gross
Expense
Ratio* | | | Net
Expense
Ratio* | |
ICON Healthcare Fund - Class S | | | 2/24/97 | | | | 6.66% | | | | -1.71% | | | | 4.33% | | | | 7.41% | | | | 1.36% | | | | 1.36% | |
S&P 1500 Health Care Index | | | | | | | 6.45% | | | | 1.60% | | | | 2.10% | | | | 5.86% | | | | N/A | | | | N/A | |
S&P Composite 1500 Index | | | | | | | 0.92% | | | | -0.86% | | | | 3.34% | | | | 4.59% | | | | N/A | | | | N/A | |
ICON Healthcare Fund - Class C | | | 9/30/10 | | | | 5.64% | | | | N/A | | | | N/A | | | | 5.62% | | | | 2.36% | | | | 2.36% | |
S&P 1500 Health Care Index | | | | | | | 6.45% | | | | N/A | | | | N/A | | | | 6.45% | | | | N/A | | | | N/A | |
S&P Composite 1500 Index | | | | | | | 0.92% | | | | N/A | | | | N/A | | | | 0.92% | | | | N/A | | | | N/A | |
ICON Healthcare
Fund - Class A | | | 9/30/10 | | | | 6.42% | | | | N/A | | | | N/A | | | | 6.40% | | | | 1.61% | | | | 1.61% | |
ICON Healthcare Fund - Class A (including maximum sales charge of 5.75%) | | | 9/30/10 | | | | 0.30% | | | | N/A | | | | N/A | | | | 0.30% | | | | 1.61% | | | | 1.61% | |
S&P 1500 Health Care Index | | | | | | | 6.45% | | | | N/A | | | | N/A | | | | 6.45% | | | | N/A | | | | N/A | |
S&P Composite 1500 Index | | | | | | | 0.92% | | | | N/A | | | | N/A | | | | 0.92% | | | | N/A | | | | N/A | |
Past performance is not a guarantee of future results. Information about these performance results and the comparative indexes can be found in the About This Report section. The Adviser has agreed to limit certain Fund expenses; without these limitations, returns would have been lower. The limitation provisions may be terminated in the future.
| * | Please see the most recent prospectus for details. |
Class C total returns exclude applicable sales charges. If sales charges were included returns would be lower.
ICON Healthcare Fund
Value of a $10,000 Investment
through September 30, 2011
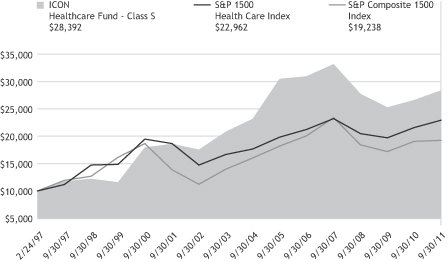
Past performance is not a guarantee of future results. The above graph compares a $10,000 investment made in the Fund’s Class S shares on the Class’ inception date of 2/24/97 to a $10,000 investment made in unmanaged securities indexes on that date. The Fund’s performance in this chart and the performance table assumes the reinvestment of dividends and capital gain distributions but does not reflect the deduction of taxes that a shareholder would pay on Fund distributions or on the redemption of Fund shares.
ICON HEALTHCARE FUND
SCHEDULEOF INVESTMENTS
SEPTEMBER 30, 2011
| | | | | | | | |
| Shares or Principal Amount | | Value | |
| | | | | | | | |
| | Common Stocks (99.6%) | |
| | 10,200 | | | 3M Co. | | $ | 732,258 | |
| | 83,000 | | | Abbott Laboratories | | | 4,244,620 | |
| | 21,400 | | | Aetna, Inc. | | | 777,890 | |
| | 18,600 | | | Allergan, Inc. | | | 1,532,268 | |
| | 46,200 | | | Amerisource-Bergen Corp. | | | 1,721,874 | |
| | 57,600 | | | Amgen, Inc. | | | 3,165,120 | |
| | 21,400 | | | AstraZeneca PLC, ADR | | | 949,304 | |
| | 30,100 | | | Baxter International, Inc. | | | 1,689,814 | |
| | 10,100 | | | Becton, Dickinson & Co. | | | 740,532 | |
| | 38,500 | | | Bio-Reference Labs, Inc.†(a) | | | 708,785 | |
| | 73,500 | | | Bristol-Myers Squibb Co. | | | 2,306,430 | |
| | 42,700 | | | Cardinal Health, Inc. | | | 1,788,276 | |
| | 45,800 | | | Celgene Corp.† | | | 2,835,936 | |
| | 13,500 | | | CIGNA Corp. | | | 566,190 | |
| | 20,900 | | | Covance, Inc.† | | | 949,905 | |
| | 14,400 | | | Covidien PLC | | | 635,040 | |
| | 64,600 | | | Eli Lilly & Co. | | | 2,388,262 | |
| | 30,600 | | | Express Scripts, Inc.† | | | 1,134,342 | |
| | 31,000 | | | Forest Laboratories, Inc.† | | | 954,490 | |
| | 67,200 | | | Gilead Sciences, Inc.† | | | 2,607,360 | |
| | 22,100 | | | GlaxoSmithKline PLC, ADR | | | 912,509 | |
| | 20,100 | | | Henry Schein, Inc.† | | | 1,246,401 | |
| | 92,300 | | | Johnson & Johnson | | | 5,880,433 | |
| | 13,600 | | | Laboratory Corp. of America Holdings† | | | 1,075,080 | |
| | 33,900 | | | Lincare Holdings, Inc. | | | 762,750 | |
| | 21,700 | | | McKesson Corp. | | | 1,577,590 | |
| | 10,000 | | | Mednax, Inc.† | | | 626,400 | |
| | 69,600 | | | Medtronic, Inc. | | | 2,313,504 | |
| | | | | | | | |
| Shares or Principal Amount | | Value | |
| | | | | | | | |
| | 158,100 | | | Merck & Co., Inc. | | $ | 5,171,451 | |
| | 19,600 | | | Mylan, Inc.† | | | 333,200 | |
| | 43,900 | | | Patterson Cos., Inc. | | | 1,256,857 | |
| | 277,400 | | | PDL BioPharma, Inc. | | | 1,539,570 | |
| | 358,800 | | | Pfizer, Inc. | | | 6,343,584 | |
| | 41,800 | | | Protective Life Corp. | | | 653,334 | |
| | 51,700 | | | ResMed, Inc.† | | | 1,488,443 | |
| | 49,100 | | | Salix Pharmaceuticals, Ltd.† | | | 1,453,360 | |
| | 7,100 | | | Siemens AG, ADR | | | 637,509 | |
| | 20,100 | | | St Jude Medical, Inc. | | | 727,419 | |
| | 15,900 | | | Stryker Corp. | | | 749,367 | |
| | 86,300 | | | SurModics, Inc.†(a) | | | 785,330 | |
| | 13,500 | | | Thermo Fisher Scientific, Inc.† | | | 683,640 | |
| | 27,200 | | | United Therapeutics Corp.† | | | 1,019,728 | |
| | 52,000 | | | UnitedHealth Group, Inc. | | | 2,398,240 | |
| | 15,000 | | | Varian Medical Systems, Inc.† | | | 782,400 | |
| | 8,900 | | | Waters Corp.† | | | 671,861 | |
| | 22,400 | | | WellPoint, Inc. | | | 1,462,272 | |
| | | | | | | | |
| Total Common Stocks
(Cost $79,899,878) | | | 74,980,928 | |
| Collateral for Securities on
Loan (1.5%) |
|
| | 1,139,111 | | | State Street Navigator Prime Portfolio | | | 1,139,111 | |
| | | | | | | | |
| Total Collateral for Securities
on Loan
(Cost $1,139,111) | | | 1,139,111 | |
| Total Investments 101.1%
(Cost $81,038,989) | | | 76,120,039 | |
| Liabilities Less Other Assets
(1.1)% | | | (856,946 | ) |
| | | | | | | | |
| | Net Assets 100.0% | | $ | 75,263,093 | |
| | | | | | | | |
| | |
| 36 | | SCHEDULEOF INVESTMENTS |
The accompanying notes are an integral part of the financial statements.
| † | Non-income producing security. |
| (a) | All or a portion of the security was on loan as of September 30, 2011. |
| ADR | American Depository Receipt |
| | | | |
| SCHEDULEOF INVESTMENTS | | | 37 | |
| | | | |
MANAGEMENT OVERVIEW ICON INDUSTRIALS FUND | | Class S Class C
Class A | | ICTRX ICICX ICIAX |
| Q. | How did the Fund perform relative to its benchmarks? |
| A. | The ICON Industrials Fund, Class S shares, fell 8.21% for the fiscal year ended September 30, 2011, while its sector-specific benchmark, the S&P 1500 Industrials Index, fell 4.50% and the S&P Composite 1500 Index gained 0.92%. Class A shares of the Fund returned -8.75% (and -14.04% with maximum sales charge) during the same period while Class C shares returned -9.29% (-10.29% with maximum sales charge). Total returns for other periods as of September 30, 2011 appear in the subsequent pages of this Fund’s Management Overview. |
| Q. | What primary factors were behind the Fund’s relative performance? |
| A. | Continuing a now familiar pattern of volatility and uncertainty, fiscal year 2011 proved to be a challenging environment for the manufacturing based and cyclically focused Industrials sector. The year began with a strong rally as investors responded positively to domestic growth and solid company fundamentals. Domestic manufacturing (as measured by the ISM Manufacturing Purchasing Managers Index) reached a high of 61.4 in February 2011 as the economy continued to recover. This growth directly benefitted the Industrials sector as the S&P 1500 Industrials Index returned approximately 23% during the first half of the fiscal year. Halfway through the fiscal year, however, investors evidently became anxious over European sovereign debt issues and slowing domestic economic growth. Additionally, growth in the manufacturing sector of the domestic economy slowed, raising concerns about the strength of the recovery. Economic uncertainty and sovereign debt worries sparked an aggressive sell-off and the S&P 1500 Industrials Index fell into negative territory by the end of the fiscal year. |
| Q. | How did the Fund’s composition affect performance? |
| A. | Industry returns in the S&P 1500 Industrials Index show the volatile nature of this past fiscal year, as the best performing industry, marine, outperformed the worst performing industry, airlines, by over 51%. |
The top industry contributors to the Fund’s performance during fiscal year 2011 were aerospace & defense, trading companies & distributors, electrical components & equipment, airlines (which the Fund held early in the fiscal year when the industry was still strong), and construction & engineering. Overweight positions in strong performing industries contributed positively to overall performance.
Top industry detractors from performance during fiscal year 2011 were industrial machinery, construction & farm machinery & heavy trucks, railroads, commercial printing, and air freight & logistics. All of these industries are heavily tied to economic growth and were sold off aggressively during the second half of the year.
| Q. | What is your investment outlook for the Industrials sector? |
| A. | At the close of the fiscal year, the Industrials sector had a V/P of 1.47 under the ICON system, giving us confidence about the sector’s potential. We believe investors have priced in a great deal of negative economic news. Company specific fundamentals remain solid, however, as many firms responded to the last recession by building up strong balance sheets and cash stockpiles. We like the way many of these companies are positioned, as we contend the manufacturing and cyclically oriented firms within the Industrials sector have a better ability than many other companies to withstand near term economic uncertainty and invest in future growth opportunities. We will continue to follow our systematic approach to investing in our search for opportunities within the Industrials sector. |
ICON Industrials Fund
Industry Composition
September 30, 2011
| | | | |
Railroads | | | 19.5% | |
Industrial Conglomerates | | | 16.7% | |
Industrial Machinery | | | 14.8% | |
Construction & Farm Machinery & Heavy Trucks | | | 14.0% | |
Aerospace & Defense | | | 13.6% | |
Air Freight & Logistics | | | 8.9% | |
Commercial Printing | | | 4.2% | |
Electrical Components & Equipment | | | 3.1% | |
Office Services & Supplies | | | 2.1% | |
Human Resource & Employment Services | | | 1.5% | |
Other Industries (each less than 1%) | | | 1.4% | |
| | | | |
| | | 99.8% | |
| | | | |
Percentages are based upon common stocks as a percentage of net assets.
ICON Industrials Fund
Sector Composition
September 30, 2011
Percentages are based upon common stocks as a percentage of net assets.
ICON Industrials Fund
Average Annual Total Return
as of September 30, 2011
| | | | | | | | | | | | | | | | | | | | | | | | | | | | |
| | | Inception
Date | | | 1 Year | | | 5 Years | | | 10 Years | | | Since Inception | | | Gross Expense Ratio* | | | Net Expense Ratio* | |
ICON Industrials
Fund - Class S | | | 5/9/97 | | | | -8.21% | | | | -2.75% | | | | 3.34% | | | | 2.45% | | | | 1.40% | | | | 1.40% | |
S&P 1500 Industrials Index | | | | | | | -4.50% | | | | -0.85% | | | | 3.90% | | | | 4.59% | | | | N/A | | | | N/A | |
S&P Composite 1500 Index | | | | | | | 0.92% | | | | -0.86% | | | | 3.34% | | | | 4.51% | | | | N/A | | | | N/A | |
ICON Industrials
Fund - Class C | | | 9/30/10 | | | | -9.29% | | | | N/A | | | | N/A | | | | -9.27% | | | | 2.40% | | | | 2.40% | |
S&P 1500 Industrials Index | | | | | | | -4.50% | | | | N/A | | | | N/A | | | | -4.50% | | | | N/A | | | | N/A | |
S&P Composite 1500 Index | | | | | | | 0.92% | | | | N/A | | | | N/A | | | | 0.92% | | | | N/A | | | | N/A | |
ICON Industrials
Fund - Class A | | | 9/30/10 | | | | -8.75% | | | | N/A | | | | N/A | | | | -8.73% | | | | 1.65% | | | | 1.65% | |
ICON Industrials
Fund - Class A (including maximum sales charge
of 5.75%) | | | 9/30/10 | | | | -14.04% | | | | N/A | | | | N/A | | | | -14.01% | | | | 1.65% | | | | 1.65% | |
S&P 1500 Industrials Index | | | | | | | -4.50% | | | | N/A | | | | N/A | | | | -4.50% | | | | N/A | | | | N/A | |
S&P Composite 1500 Index | | | | | | | 0.92% | | | | N/A | | | | N/A | | | | 0.92% | | | | N/A | | | | N/A | |
Past performance is not a guarantee of future results. Information about these performance results and the comparative indexes can be found in the About This Report section. The Adviser has agreed to limit certain Fund expenses; without these limitations, returns would have been lower. The limitation provisions may be terminated in the future.
| * | Please see the most recent prospectus for details. |
Class C total returns exclude applicable sales charges. If sales charges were included returns would be lower.
ICON Industrials Fund
Value of a $10,000 Investment
through September 30, 2011
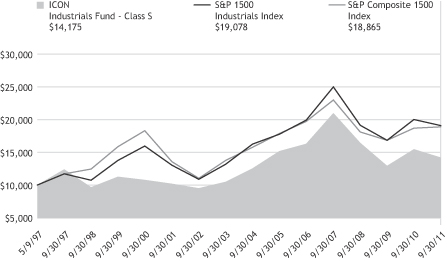
Past performance is not a guarantee of future results. The above graph compares a $10,000 investment made in the Fund’s Class S shares on the Class’ inception date of 5/9/97 to a $10,000 investment made in unmanaged securities indexes on that date. The Fund’s performance in this chart and the performance table assumes the reinvestment of dividends and capital gain distributions but does not reflect the deduction of taxes that a shareholder would pay on Fund distributions or on the redemption of Fund shares.
ICON INDUSTRIALS FUND
SCHEDULEOF INVESTMENTS
SEPTEMBER 30, 2011
| | | | | | | | |
| Shares or Principal Amount | | Value | |
| | | | | | | | |
| | Common Stocks (99.8%) | |
| | 25,000 | | | 3M Co. | | $ | 1,794,750 | |
| | 10,000 | | | Avery Dennison Corp. | | | 250,800 | |
| | 30,000 | | | Boeing Co. | | | 1,815,300 | |
| | 10,000 | | | Canadian National Railway Co. | | | 665,800 | |
| | 20,000 | | | Canadian Pacific Railway, Ltd.(a) | | | 961,800 | |
| | 52,000 | | | Caterpillar, Inc. | | | 3,839,680 | |
| | 20,000 | | | Cooper Industries PLC | | | 922,400 | |
| | 105,000 | | | CSX Corp. | | | 1,960,350 | |
| | 10,000 | | | Cummins, Inc. | | | 816,600 | |
| | 45,000 | | | Danaher Corp. | | | 1,887,300 | |
| | 25,000 | | | Deere & Co. | | | 1,614,250 | |
| | 25,000 | | | Dover Corp. | | | 1,165,000 | |
| | 20,000 | | | Eaton Corp. | | | 710,000 | |
| | 10,000 | | | Emerson Electric Co. | | | 413,100 | |
| | 20,000 | | | FedEx Corp. | | | 1,353,600 | |
| | 15,000 | | | General Dynamics Corp. | | | 853,350 | |
| | 350,000 | | | General Electric Co. | | | 5,334,000 | |
| | 5,000 | | | Hubbell, Inc., Class B | | | 247,700 | |
| | 40,000 | | | Illinois Tool Works, Inc. | | | 1,664,000 | |
| | 20,000 | | | Ingersoll-Rand PLC | | | 561,800 | |
| | 25,000 | | | Kforce, Inc.†(a) | | | 245,250 | |
| | 8,000 | | | Lockheed Martin Corp. | | | 581,120 | |
| | 15,000 | | | Manpower, Inc. | | | 504,300 | |
| | 10,000 | | | Navistar International Corp.† | | | 321,200 | |
| | 50,000 | | | Norfolk Southern Corp. | | | 3,051,000 | |
| | | | | | | | |
| Shares or Principal Amount | | Value | |
| | | | | | | | |
| | 15,000 | | | PACCAR, Inc. | | $ | 507,300 | |
| | 12,000 | | | Parker Hannifin Corp. | | | 757,560 | |
| | 15,000 | | | Pitney Bowes, Inc.(a) | | | 282,000 | |
| | 15,000 | | | Raytheon Co. | | | 613,050 | |
| | 5,000 | | | Rockwell Collins, Inc. | | | 263,800 | |
| | 150,000 | | | RR Donnelley & Sons Co. | | | 2,118,000 | |
| | 10,000 | | | Ryder System, Inc. | | | 375,100 | |
| | 15,000 | | | Siemens AG, ADR | | | 1,346,850 | |
| | 10,000 | | | SPX Corp. | | | 453,100 | |
| | 40,000 | | | Union Pacific Corp. | | | 3,266,800 | |
| | 50,000 | | | United Parcel Service, Inc., Class B | | | 3,157,500 | |
| | 20,000 | | | United Stationers, Inc. | | | 545,000 | |
| | 40,000 | | | United Technologies Corp. | | | 2,814,400 | |
| | 4,000 | | | Valmont Industries, Inc. | | | 311,760 | |
| | 2,500 | | | WW Grainger, Inc. | | | 373,850 | |
| | | | | | | | |
| Total Common Stocks
(Cost $52,756,916) | | | 50,720,520 | |
| Collateral for Securities on
Loan (3.1%) | | | | |
| | 1,563,306 | | | State Street Navigator Prime Portfolio | | | 1,563,306 | |
| | | | | | | | |
| Total Collateral for
Securities on Loan
(Cost $1,563,306) | | | 1,563,306 | |
| Total Investments 102.9%
(Cost $54,320,222) | | | 52,283,826 | |
| Liabilities Less
Other Assets (2.9)% | | | (1,493,712 | ) |
| | | | | | | | |
| | Net Assets 100.0% | | $ | 50,790,114 | |
| | | | | | | | |
The accompanying notes are an integral part of the financial statements.
| † | Non-income producing security. |
| (a) | All or a portion of the security was on loan as of September 30, 2011. |
| ADR | American Depository Receipt |
| | |
| 42 | | SCHEDULEOF INVESTMENTS |
| | | | |
MANAGEMENT OVERVIEW ICON INFORMATION TECHNOLOGY FUND | | Class S Class C Class A | | ICTEX ICTFX ICTTX |
| Q. | How did the Fund perform relative to its benchmark? |
| A. | The ICON Information Technology Fund, Class S, underperformed its benchmark for the fiscal year ended September 30, 2011 by 0.81%. The Fund Class S shares returned 2.11%, while its sector-specific benchmark, the S&P 1500 Information Technology Composite Index, rose 2.92%. The Fund outperformed the broad index, the S&P Composite 1500, which gained 0.92% for the fiscal year. Class A shares of the Fund returned 1.86% (and -3.98% with maximum sales charge) during the same period, while the Fund’s Class C shares returned 0.99% for the fiscal year (-0.01% with maximum sales charge). Total returns for other periods as of September 30, 2011 appear in the subsequent pages of this Fund’s Management Overview. |
| Q. | What primary factors influenced the Fund’s relative performance during the period? |
| A. | In 2011, technology companies experienced some major shifts from years past. Apple surpassed Exxon Mobil to become the largest company in the world based on market cap, and then experienced an historic shift as its co-founder, Steve Jobs, stepped down as CEO. Hewlett Packard, the world’s largest PC manufacturer, shook up the sector when it announced it would discontinue the manufacturing of many of its computer hardware products. Consumer payment networks, such as Visa and MasterCard, received a huge boost in revenues after government regulation capped debit card transaction fees. In a sector where over 60% of market cap is made up of its ten largest companies, these events made quite an impact on investment returns. |
Company earnings also provided a significant boost to the sector. Technology companies saw an average increase in earnings of 43% over the previous year. While some Information Technology companies’ earnings announcements fell short of expectations, these announcements were greatly outnumbered by positive reports from companies that met or exceeded analysts’ estimates.
| Q. | How did the Fund’s composition affect performance? |
| A. | The Fund’s greatest detractor in performance came from an overweight position in the semiconductor equipment and electronic manufacturing services industries. The solar power industry failed to meet high |
| | expectations for rapid growth, and many solar panel manufacturers such as MEMC Electronic Materials and First Solar Inc. saw their shares plummet as demand dried up. The ICON Information Technology Fund had a strong position in these solar energy related companies, which negatively impacted Fund performance. The Fund also suffered losses from positions in the data processing & outsourced services industry, primarily from an overweight position in Lender Processing Services Inc. which announced large downward revisions in its earnings forecasts in June of 2011. |
Fortunately, the Fund’s positions in the sector’s large-cap companies helped minimize losses. Apple, IBM, Accenture PLC, MasterCard, and Visa all had successful years and brought significant gains to the portfolio. These large-cap names continue to make up a significant portion of the Fund’s composition.
| Q. | What is your investment outlook for the Information Technology Sector? |
| A. | Going into the new fiscal year, ICON’s methodology leads us to believe the Information Technology sector, as well as the market as a whole, has considerable value. Technology stocks are trading, on average, at around 47% below our calculation of fair value. We view the sharp declines in the last quarter of 2011 to be an overreaction to worries over Europe’s sovereign debt crisis and domestic congressional deadlock. While the ride over the last 12-months has certainly been unpleasant at times, we believe these declines provide investors a good opportunity to purchase stocks at a discount. |
At the close of the fiscal year, the ICON Information Technology Fund is overweight in IT consulting & other services and technology distributors. The Fund also sees value in the sector’s major large-cap names and continues to hold close-to-benchmark positions in these stocks.
ICON Information Technology Fund
Industry Composition
September 30, 2011
| | | | |
IT Consulting & Other Services | | | 24.7% | |
Computer Hardware | | | 15.2% | |
Systems Software | | | 9.7% | |
Data Processing & Outsourced Services | | | 9.1% | |
Internet Software & Services | | | 8.9% | |
Semiconductors | | | 8.2% | |
Communications Equipment | | | 8.1% | |
Technology Distributors | | | 6.9% | |
Electronic Manufacturing Services | | | 5.8% | |
Semiconductor Equipment | | | 3.3% | |
| | | | |
| | | 99.9% | |
| | | | |
Percentages are based upon common stocks as a percentage of net assets.
ICON Information Technology Fund
Sector Composition
September 30, 2011
| | | | |
Information Technology | | | 99.9% | |
| | | | |
| | | 99.9% | |
| | | | |
Percentages are based upon common stocks as a percentage of net assets.
ICON Information Technology Fund
Average Annual Total Return
as of September 30, 2011
| | | | | | | | | | | | | | | | | | | | | | | | | | | | |
| | | Inception
Date | | | 1 Year | | | 5
Years | | | 10
Years | | | Since
Inception | | | Gross
Expense
Ratio* | | | Net
Expense
Ratio* | |
ICON Information Technology Fund - Class S | | | 2/19/97 | | | | 2.11% | | | | -1.07% | | | | 0.58% | | | | 6.11% | | | | 1.37% | | | | 1.37% | |
S&P 1500 Information Technology Index | | | | | | | 2.92% | | | | 3.22% | | | | 4.53% | | | | 4.62% | | | | N/A | | | | N/A | |
NASDAQ Composite Index | | | | | | | 1.97% | | | | 1.35% | | | | 4.89% | | | | 3.98% | | | | N/A | | | | N/A | |
S&P Composite 1500 Index | | | | | | | 0.92% | | | | -0.86% | | | | 3.34% | | | | 4.55% | | | | N/A | | | | N/A | |
ICON Information Technology
Fund - Class C | | | 9/30/10 | | | | 0.99% | | | | N/A | | | | N/A | | | | 0.99% | | | | 2.37% | | | | 2.37% | |
S&P 1500 Information Technology Index | | | | | | | 2.92% | | | | N/A | | | | N/A | | | | 2.92% | | | | N/A | | | | N/A | |
NASDAQ Composite Index | | | | | | | 1.97% | | | | N/A | | | | N/A | | | | 1.97% | | | | N/A | | | | N/A | |
S&P Composite 1500 Index | | | | | | | 0.92% | | | | N/A | | | | N/A | | | | 0.92% | | | | N/A | | | | N/A | |
ICON Information Technology
Fund - Class A | | | 9/30/10 | | | | 1.86% | | | | N/A | | | | N/A | | | | 1.86% | | | | 1.62% | | | | 1.62% | |
ICON Information Technology Fund - Class A (including maximum sales charge of 5.75%) | | | 9/30/10 | | | | -3.98% | | | | N/A | | | | N/A | | | | -3.97% | | | | 1.62% | | | | 1.62% | |
S&P 1500 Information Technology Index | | | | | | | 2.92% | | | | N/A | | | | N/A | | | | 2.92% | | | | N/A | | | | N/A | |
NASDAQ Composite Index | | | | | | | 1.97% | | | | N/A | | | | N/A | | | | 1.97% | | | | N/A | | | | N/A | |
S&P Composite 1500 Index | | | | | | | 0.92% | | | | N/A | | | | N/A | | | | 0.92% | | | | N/A | | | | N/A | |
Past performance is not a guarantee of future results. Information about these performance results and the comparative indexes can be found in the About This Report section. The Adviser has agreed to limit certain Fund expenses; without these limitations, returns would have been lower. The limitation provisions may be terminated in the future.
| * | Please see the most recent prospectus for details. |
Class C total returns exclude applicable sales charges. If sales charges were included returns would be lower.
ICON Information Technology Fund
Value of a $10,000 Investment
through September 30, 2011
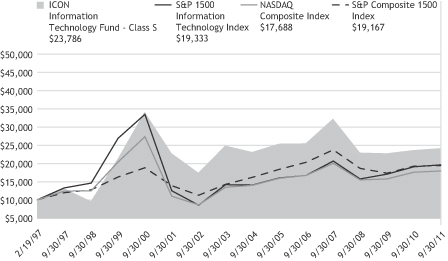
Past performance is not a guarantee of future results. The above graph compares a $10,000 investment made in the Fund’s Class S shares on the Class’ inception date of 2/19/97 to a $10,000 investment made in unmanaged securities indexes on that date. The Fund’s performance in this chart and the performance table assumes the reinvestment of dividends and capital gain distributions but does not reflect the deduction of taxes that a shareholder would pay on Fund distributions or on the redemption of Fund shares.
ICON INFORMATION TECHNOLOGY FUND
SCHEDULEOF INVESTMENTS
SEPTEMBER 30, 2011
| | | | | | | | |
| Shares or Principal Amount | | Value | |
| | | | | | | | |
| | Common Stocks (99.9%) | |
| | 30,000 | | | Accenture PLC, Class A | | $ | 1,580,400 | |
| | 61,000 | | | Amdocs, Ltd.† | | | 1,654,320 | |
| | 5,600 | | | Anixter International, Inc. | | | 265,664 | |
| | 23,100 | | | Apple, Inc.† | | | 8,805,258 | |
| | 25,200 | | | Arrow Electronics, Inc.† | | | 700,056 | |
| | 41,400 | | | Automatic Data Processing, Inc. | | | 1,952,010 | |
| | 22,800 | | | Avnet, Inc.† | | | 594,624 | |
| | 4,700 | | | Baidu, Inc., ADR† | | | 502,477 | |
| | 17,900 | | | CACI International, Inc., Class A† | | | 893,926 | |
| | 130,100 | | | Cisco Systems, Inc. | | | 2,015,249 | |
| | 20,300 | | | Cognizant Technology Solutions Corp., Class A† | | | 1,272,810 | |
| | 52,700 | | | Convergys Corp.† | | | 494,326 | |
| | 25,800 | | | CSG Systems International, Inc.† | | | 326,112 | |
| | 23,100 | | | eBay, Inc.† | | | 681,219 | |
| | 4,300 | | | First Solar, Inc.†(a) | | | 271,803 | |
| | 205,700 | | | Flextronics International, Ltd.† | | | 1,158,091 | |
| | 7,200 | | | Google, Inc., Class A† | | | 3,703,536 | |
| | 20,700 | | | Hewlett-Packard Co. | | | 464,715 | |
| | 17,600 | | | Infosys Technologies, Ltd., ADR(a) | | | 898,832 | |
| | 85,900 | | | Ingram Micro, Inc., Class A† | | | 1,385,567 | |
| | 163,500 | | | Intel Corp. | | | 3,487,455 | |
| | 47,500 | | | International Business Machines Corp. | | | 8,313,925 | |
| | 15,100 | | | KLA-Tencor Corp. | | | 578,028 | |
| | 24,400 | | | Lender Processing Services, Inc. | | | 334,036 | |
| | | | | | | | |
| Shares or Principal Amount | | Value | |
| | | | | | | | |
| | 13,000 | | | Linear Technology Corp. | | $ | 359,450 | |
| | 3,900 | | | Mastercard, Inc., Class A | | | 1,236,924 | |
| | 136,500 | | | MEMC Electronic Materials, Inc.† | | | 715,260 | |
| | 53,300 | | | Methode Electronics, Inc. | | | 396,019 | |
| | 142,800 | | | Microsoft Corp. | | | 3,554,292 | |
| | 15,600 | | | Multi-Fineline Electronix, Inc.† | | | 311,064 | |
| | 81,500 | | | Oracle Corp. | | | 2,342,310 | |
| | 71,000 | | | Perficient, Inc.† | | | 519,720 | |
| | 28,200 | | | Plexus Corp.† | | | 637,884 | |
| | 60,800 | | | QUALCOMM, Inc. | | | 2,956,704 | |
| | 42,300 | | | SAIC, Inc.† | | | 499,563 | |
| | 25,600 | | | SYNNEX Corp.† | | | 670,720 | |
| | 36,800 | | | TE Connectivity, Ltd. | | | 1,035,552 | |
| | 13,800 | | | Tech Data Corp.† | | | 596,574 | |
| | 46,800 | | | Teradyne, Inc.† | | | 515,268 | |
| | 19,900 | | | Tessera Technologies, Inc.† | | | 237,606 | |
| | 33,500 | | | Texas Instruments, Inc. | | | 892,775 | |
| | 14,100 | | | Visa, Inc., Class A | | | 1,208,652 | |
| | | | | | | | |
| Total Common Stocks
(Cost $58,819,117) | | | 61,020,776 | |
| Collateral for Securities on
Loan (2.0%) | | | | |
| | 1,204,705 | | | State Street Navigator Prime Portfolio | | | 1,204,705 | |
| | | | | | | | |
| Total Collateral for
Securities on Loan
(Cost $1,204,705) | | | 1,204,705 | |
| Total Investments 101.9%
(Cost $60,023,822) | | | 62,225,481 | |
| Liabilities Less
Other Assets (1.9)% | | | (1,141,718 | ) |
| | | | | | | | |
| | Net Assets 100.0% | | $ | 61,083,763 | |
| | | | | | | | |
| | |
| 48 | | SCHEDULEOF INVESTMENTS |
The accompanying notes are an integral part of the financial statements.
| † | Non-income producing security. |
| (a) | All or a portion of the security was on loan as of September 30, 2011. |
| ADR | American Depository Receipt |
| | | | |
| SCHEDULEOF INVESTMENTS | | | 49 | |
| | | | |
MANAGEMENT OVERVIEW ICON MATERIALS FUND | | Class S Class C Class A | | ICBMX ICBCX ICBAX |
| Q. | How did the Fund perform relative to its benchmarks? |
| A. | The ICON Materials Fund, Class S shares, fell 10.07% for the fiscal year ended September 30, 2011, while its sector-specific benchmark, the S&P 1500 Materials Index, fell 6.87%. Class A shares of the Fund returned -10.37% (and -15.50% with maximum sales charge) during the same period while the Fund’s Class C shares returned -10.87% (-11.87% with maximum sales charge). The broad-based S&P Composite 1500 Index gained 0.92% during the fiscal year. Total returns for other periods as of September 30, 2011 appear in the subsequent pages of this Fund’s Management Overview. |
| Q. | What primary factors were behind the Fund’s relative performance? |
| A. | Continuing an all too familiar pattern of volatility and uncertainty, fiscal year 2011 proved to be a challenging environment for the cyclically focused Materials sector. The year began with a strong rally as investors responded favorably to continued domestic economic growth and solid company fundamentals. Halfway through the fiscal year, however, European sovereign debt concerns and fears over slowing domestic economic growth sparked an aggressive sell-off. The sell-off caused the S&P 1500 Materials Index to fall into negative territory by the end of the fiscal year. |
No industry better reflected investor sentiment and relative performance of the ICON Materials Fund during the fiscal year than the gold industry. During the first half of the year, as the equity market rallied, gold mining stocks sold off aggressively as positive investor sentiment reduced demand for this segment of the market. While the ICON Materials Fund participated in the overall equity rally, we lagged the S&P 1500 Materials Index due to an overweight in these gold mining equities. As economic fears increased during the second half of the fiscal year, investors flocked towards gold and gold mining equities, hoping to find a safe haven during uncertain times. We pared back our gold mining industry positions during the first half of the year, believing the industry lacked strength. When many of these same companies rallied during the second half of the fiscal year, our underweight position in gold and gold mining equities hurt relative overall performance.
| Q. | How did the Fund’s composition affect performance? |
| A. | Industry returns in the S&P 1500 Materials Index reflect the volatility of this past fiscal year, as the best performing industry, fertilizers & agricultural chemicals, outperformed the worst industry, commodity chemicals, by over 50%. This divergence contributed positively to the performance of the ICON Materials Fund as we were overweight fertilizers & agricultural chemicals during the year. |
The top industry contributors to performance during fiscal year 2011 were specialty chemicals, fertilizers & agricultural chemicals, and railroads. While the railroad industry is considered part of the Industrials sector, the industry’s strong ties to commodity products and its relative outperformance made railroads an attractive addition to the Materials Fund.
Top industry detractors from performance included diversified chemicals, steel, gold, diversified metals & mining, and aluminum.
| Q. | What is your investment outlook for the Materials sector? |
| A. | At the close of the fiscal year, the Materials sector had a V/P of 1.51 under the ICON system, giving us confidence about the sector’s potential as we begin a new year. We believe investors have already priced in a great deal of negative economic news. Company specific fundamentals remain solid, however, as many firms responded to the last recession by building up strong balance sheets and cash stockpiles. We like the way many of these firms are positioned, as we contend the cyclically oriented companies within the Materials sector have a better ability than many other companies to both withstand near term economic uncertainty and invest for future growth. We will continue to follow our systematic approach to investing and look for opportunities within the Materials sector where stocks are trading below our calculation of intrinsic value. |
ICON Materials Fund
Industry Composition
September 30, 2011
| | | | |
Diversified Chemicals | | | 25.8% | |
Industrial Gases | | | 15.2% | |
Fertilizers & Agricultural Chemicals | | | 12.6% | |
Steel | | | 11.0% | |
Specialty Chemicals | | | 9.3% | |
Diversified Metals & Mining | | | 7.4% | |
Paper Packaging | | | 6.2% | |
Railroads | | | 3.4% | |
Aluminum | | | 3.2% | |
Commodity Chemicals | | | 2.8% | |
Agricultural Products | | | 1.0% | |
Paper Products | | | 1.0% | |
| | | | |
| | | 98.9% | |
| | | | |
Percentages are based upon common stocks as a percentage of net assets.
ICON Materials Fund
Sector Composition
September 30, 2011
| | | | |
Materials | | | 94.5% | |
Industrials | | | 3.4% | |
Consumer Staples | | | 1.0% | |
| | | | |
| | | 98.9% | |
| | | | |
Percentages are based upon common stocks as a percentage of net assets.
ICON Materials Fund
Average Annual Total Return
as of September 30, 2011
| | | | | | | | | | | | | | | | | | | | | | | | | | | | |
| | | Inception
Date | | | 1 Year | | | 5
Years | | | 10
Years | | | Since
Inception | | | Gross
Expense
Ratio* | | | Net
Expense
Ratio* | |
ICON Materials
Fund - Class S | | | 5/5/97 | | | | -10.07% | | | | 1.35% | | | | 9.08% | | | | 2.53% | | | | 1.38% | | | | 1.38% | |
S&P 1500 Materials Index | | | | | | | -6.87% | | | | 1.72% | | | | 7.31% | | | | 4.50% | | | | N/A | | | | N/A | |
S&P Composite 1500 Index | | | | | | | 0.92% | | | | -0.86% | | | | 3.34% | | | | 4.46% | | | | N/A | | | | N/A | |
ICON Materials Fund - Class C | | | 9/30/10 | | | | -10.87% | | | | N/A | | | | N/A | | | | -10.84% | | | | 2.38% | | | | 2.38% | |
S&P 1500 Materials Index | | | | | | | -6.87% | | | | N/A | | | | N/A | | | | -6.87% | | | | N/A | | | | N/A | |
S&P Composite 1500 Index | | | | | | | 0.92% | | | | N/A | | | | N/A | | | | 0.92% | | | | N/A | | | | N/A | |
ICON Materials
Fund - Class A | | | 9/30/10 | | | | -10.37% | | | | N/A | | | | N/A | | | | -10.35% | | | | 1.63% | | | | 1.63% | |
ICON Materials
Fund - Class A (including maximum sales charge of 5.75%) | | | 9/30/10 | | | | -15.50% | | | | N/A | | | | N/A | | | | -15.46% | | | | 1.63% | | | | 1.63% | |
S&P 1500 Materials Index | | | | | | | -6.87% | | | | N/A | | | | N/A | | | | -6.87% | | | | N/A | | | | N/A | |
S&P Composite 1500 Index | | | | | | | 0.92% | | | | N/A | | | | N/A | | | | 0.92% | | | | N/A | | | | N/A | |
Past performance is not a guarantee of future results. Information about these performance results and the comparative indexes can be found in the About This Report section. The Adviser has agreed to limit certain Fund expenses; without these limitations, returns would have been lower. The limitation provisions may be terminated in the future.
| * | Please see the most recent prospectus for details. |
Class C total returns exclude applicable sales charges. If sales charges were included returns would be lower.
ICON Materials Fund
Value of a $10,000 Investment
through September 30, 2011
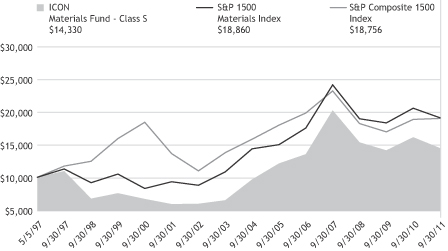
Past performance is not a guarantee of future results. The above graph compares a $10,000 investment made in the Fund’s Class S shares on the Class’ inception date of 5/5/97 to a $10,000 investment made in unmanaged securities indexes on that date. The Fund’s performance in this chart and the performance table assumes the reinvestment of dividends and capital gain distributions but does not reflect the deduction of taxes that a shareholder would pay on Fund distributions or on the redemption of Fund shares.
ICON MATERIALS FUND
SCHEDULEOF INVESTMENTS
SEPTEMBER 30, 2011
| | | | | | | | |
| Shares or Principal Amount | | Value | |
| | | | | | | | |
| | Common Stocks (98.9%) | |
| | 50,000 | | | A Schulman, Inc. | | $ | 849,500 | |
| | 25,000 | | | Agrium, Inc. | | | 1,666,500 | |
| | 45,000 | | | Air Products & Chemicals, Inc. | | | 3,436,650 | |
| | 150,000 | | | Alcoa, Inc. | | | 1,435,500 | |
| | 45,000 | | | ArcelorMittal | | | 715,950 | |
| | 25,000 | | | Archer-Daniels-Midland Co. | | | 620,250 | |
| | 20,000 | | | Ashland, Inc. | | | 882,800 | |
| | 20,000 | | | Cabot Corp. | | | 495,600 | |
| | 25,000 | | | Calgon Carbon Corp.† | | | 364,250 | |
| | 50,000 | | | Century Aluminum Co.† | | | 447,000 | |
| | 10,000 | | | CF Industries Holdings, Inc. | | | 1,233,900 | |
| | 23,000 | | | Cliffs Natural Resources, Inc. | | | 1,176,910 | |
| | 220,000 | | | Dow Chemical Co. | | | 4,941,200 | |
| | 175,000 | | | E.I. du Pont de Nemours & Co. | | | 6,994,750 | |
| | 35,000 | | | Ecolab, Inc. | | | 1,711,150 | |
| | 10,000 | | | FMC Corp. | | | 691,600 | |
| | 145,000 | | | Freeport-McMoRan Copper & Gold, Inc. | | | 4,415,250 | |
| | 25,000 | | | International Paper Co. | | | 581,250 | |
| | 50,000 | | | Koppers Holdings, Inc. | | | 1,280,500 | |
| | | | | | | | |
| Shares or Principal Amount | | Value | |
| | | | | | | | |
| | 40,000 | | | Monsanto Co. | | $ | 2,401,600 | |
| | 15,000 | | | Mosaic Co. | | | 734,550 | |
| | 20,000 | | | Norfolk Southern Corp. | | | 1,220,400 | |
| | 55,000 | | | Nucor Corp. | | | 1,740,200 | |
| | 10,000 | | | POSCO, ADR | | | 760,100 | |
| | 35,000 | | | Potash Corp. of Saskatchewan, Inc. | | | 1,512,700 | |
| | 20,000 | | | PPG Industries, Inc. | | | 1,413,200 | |
| | 60,000 | | | Praxair, Inc. | | | 5,608,800 | |
| | 25,000 | | | Reliance Steel & Aluminum Co. | | | 850,250 | |
| | 45,000 | | | Rock-Tenn Co., Class A | | | 2,190,600 | |
| | 35,000 | | | RPM International, Inc. | | | 654,500 | |
| | 40,000 | | | Sealed Air Corp. | | | 668,000 | |
| | 30,000 | | | Sonoco Products Co. | | | 846,900 | |
| | 100,000 | | | Steel Dynamics, Inc. | | | 992,000 | |
| | 10,000 | | | Union Pacific Corp. | | | 816,700 | |
| | 15,000 | | | Vale S.A., ADR | | | 342,000 | |
| | 75,000 | | | Valspar Corp. | | | 2,340,750 | |
| | | | | | | | |
| Total Common Stocks
(Cost $63,242,194) | | | 59,033,760 | |
| Total Investments 98.9%
(Cost $63,242,194) | | | 59,033,760 | |
| Other Assets Less Liabilities
1.1% | | | 640,621 | |
| | | | | | | | |
| | Net Assets 100.0% | | $ | 59,674,381 | |
| | | | | | | | |
The accompanying notes are an integral part of the financial statements.
| † | Non-income producing security. |
| ADR | American Depository Receipt |
| | | | |
| SCHEDULEOF INVESTMENTS | | | 55 | |
| | | | |
MANAGEMENT OVERVIEW ICON TELECOMMUNICATION &
UTILITIES FUND | | Class S Class C Class A | | ICTUX ICTZX ICTVX |
| Q. | How did the Fund Perform relative to its benchmark? |
| A. | The Fund’s Class S shares gained 9.16% for the fiscal year ended September 30, 2011. The Fund outperformed its broad based benchmark, the S&P Composite 1500 Index, which returned just 0.92% for the same time period. The Fund underperformed one of its sector specific benchmarks, the S&P 1500 Utilities Index, which returned 12.03%, but outperformed another sector specific benchmark, the S&P 1500 Telecommunications Services Index, which returned 5.20%. Class A shares of the Fund returned 8.56% (and 2.24% with maximum sales charge) during the same period while Class C shares returned 7.77% for the fiscal year (6.77% with maximum sales charge). Total returns for other periods as of September 30, 2011 appear in the subsequent pages of this Fund’s Management Overview. |
| Q. | What primary factors influenced the Fund’s relative performance during the period? |
| A. | The fiscal year was marked by concern over macro economic factors. A stubbornly high unemployment rate in the U.S., ongoing malaise in the domestic housing market, worries over a potential sharp decline in consumer spending and Europe’s sovereign debt crisis weighed heavily on investors. The resulting “risk on, risk off” trading created wide swings in the equity indices. Good economic news generally had investors rushing in to buy stocks while bad economic data sent investors rushing out of the global equity markets. This choppy investment environment can be difficult for the ICON value-driven investment methodology. While the Fund was able to outperform its Telecommunications benchmark, the sudden swings in the market made it difficult for our system to identify sustainable industry themes. |
If one overarching theme emerged during this volatile year, we would describe it as a flight to safety. Uncertainty over worldwide economic conditions led investors to steady, stable, supposedly “recession proof” companies, many of which make up the Telecommunications and Utilities sectors. The Fund held positions in many equities characterized by low betas and high dividend yields relative to the broader market as measured by the S&P 1500 Composite Index.
| Q. | How did the Fund’s composition affect performance? |
| A. | The Fund’s underweight position in the integrated telecommunication services industry negatively impacted performance. In contrast, the Fund’s exposure to the electric utilities industry provided the largest boost to performance relative to its benchmarks. Still, this charge from electric utilities was not enough to overcome the Fund’s underweight position in integrated telecommunication services, which helps explain the Fund’s underperforming its Telecommunications benchmark. In particular, performance was adversely affected by underweight positions in both AT&T and Verizon. |
| Q. | What is your investment outlook for the Utilities sector? |
| A. | As we enter the new fiscal year, the Utilities sector is trading at a deep discount to our estimate of the sector’s fair value. Our model suggests all five industries within the sector are bargains and we believe the sector may present many opportunities for investors in the coming months. In addition to the sector’s attractive valuations, we also see several undervalued companies paying relatively high dividends. Accordingly, as the fiscal year ended we increased our Fund holdings in Utilities stocks that had high dividend yields and were undervalued under the ICON system. |
ICON Telecommunication & Utilities Fund
Industry Composition
September 30, 2011
| | | | |
Electric Utilities | | | 49.5% | |
Multi-Utilities | | | 37.0% | |
Gas Utilities | | | 7.2% | |
Water Utilities | | | 0.9% | |
| | | | |
| | | 94.6% | |
| | | | |
Percentages are based upon common stocks as a percentage of net assets.
ICON Telecommunication & Utilities Fund
Sector Composition
September 30, 2011
| | | | |
Telecommunication & Utilities | | | 94.6% | |
| | | | |
| | | 94.6% | |
| | | | |
Percentages are based upon common stocks as a percentage of net assets.
ICON Telecommunication & Utilities Fund
Average Annual Total Return
as of September 30, 2011
| | | | | | | | | | | | | | | | | | | | | | | | | | | | |
| | | Inception
Date | | | 1 Year | | | 5
Years | | | 10
Years | | | Since
Inception | | | Gross
Expense
Ratio* | | | Net
Expense
Ratio* | |
ICON Telecommunication & Utilities
Fund - Class S | | | 7/9/97 | | | | 9.16% | | | | 3.29% | | | | 5.86% | | | | 7.25% | | | | 1.67% | | | | 1.50% | |
S&P 1500 Telecommunications Services Index | | | | | | | 5.20% | | | | 1.26% | | | | -0.44% | | | | 2.03% | | | | N/A | | | | N/A | |
S&P 1500 Utilities Index | | | | | | | 12.03% | | | | 4.34% | | | | 5.96% | | | | 6.91% | | | | N/A | | | | N/A | |
S&P Composite 1500 Index | | | | | | | 0.92% | | | | -0.86% | | | | 3.34% | | | | 3.84% | | | | N/A | | | | N/A | |
ICON Telecommunication & Utilities
Fund - Class C | | | 9/30/10 | | | | 7.77% | | | | N/A | | | | N/A | | | | 7.74% | | | | 2.67% | | | | 2.50% | |
S&P 1500 Telecommunications Services Index | | | | | | | 5.20% | | | | N/A | | | | N/A | | | | 5.20% | | | | N/A | | | | N/A | |
S&P 1500 Utilities Index | | | | | | | 12.03% | | | | N/A | | | | N/A | | | | 12.03% | | | | N/A | | | | N/A | |
S&P Composite 1500 Index | | | | | | | 0.92% | | | | N/A | | | | N/A | | | | 0.92% | | | | N/A | | | | N/A | |
ICON Telecommunication & Utilities
Fund - Class A | | | 9/30/10 | | | | 8.56% | | | | N/A | | | | N/A | | | | 8.53% | | | | 1.92% | | | | 1.75% | |
ICON Telecommunication & Utilities
Fund - Class A (including maximum sales charge of 5.75%) | | | 9/30/10 | | | | 2.24% | | | | N/A | | | | N/A | | | | 2.23% | | | | 1.92% | | | | 1.75% | |
S&P 1500 Telecommunications Services Index | | | | | | | 5.20% | | | | N/A | | | | N/A | | | | 5.20% | | | | N/A | | | | N/A | |
ICON Telecommunication & Utilities Fund
Average Annual Total Return (continued)
as of September 30, 2011
| | | | | | | | | | | | | | | | | | | | | | | | | | |
| | | Inception
Date | | 1 Year | | | 5
Years | | | 10
Years | | | Since
Inception | | | Gross
Expense
Ratio* | | | Net
Expense
Ratio* | |
S&P 1500 Utilities Index | | | | | 12.03% | | | | N/A | | | | N/A | | | | 12.03% | | | | N/A | | | | N/A | |
S&P Composite 1500 Index | | | | | 0.92% | | | | N/A | | | | N/A | | | | 0.92% | | | | N/A | | | | N/A | |
Past performance is not a guarantee of future results. Information about these performance results and the comparative indexes can be found in the About This Report section. The Adviser has agreed to limit certain Fund expenses; without these limitations, returns would have been lower. The limitation provisions may be terminated in the future.
| * | Please see the most recent prospectus for details. |
Class C total returns exclude applicable sales charges. If sales charges were included returns would be lower.
ICON Telecommunication & Utilities Fund
Value of a $10,000 Investment
through September 30, 2011
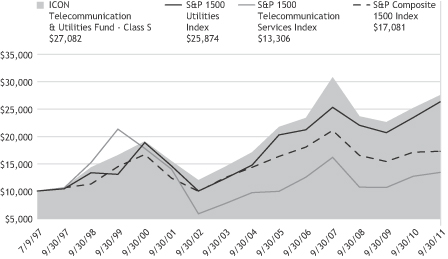
Past performance is not a guarantee of future results. The above graph compares a $10,000 investment made in the Fund’s Class S shares on the Class’ inception date of 7/9/97 to a $10,000 investment made in unmanaged securities indexes on that date. The Fund’s performance in this chart and the performance table assumes the reinvestment of dividends and capital gain distributions but does not reflect the deduction of taxes that a shareholder would pay on Fund distributions or on the redemption of Fund shares.
ICON TELECOMMUNICATION & UTILITIES FUND
SCHEDULEOF INVESTMENTS
SEPTEMBER 30, 2011
| | | | | | | | |
| Shares or Principal Amount | | Value | |
| | | | | | | | |
| | Common Stocks (94.6%) | |
| | 9,200 | | | AGL Resources, Inc. | | $ | 374,808 | |
| | 7,300 | | | Allete, Inc. | | | 267,399 | |
| | 26,800 | | | American Electric Power Co., Inc. | | | 1,018,936 | |
| | 6,800 | | | American Water Works Co., Inc. | | | 205,224 | |
| | 8,100 | | | Atmos Energy Corp. | | | 262,845 | |
| | 11,500 | | | DTE Energy Co. | | | 563,730 | |
| | 55,300 | | | Duke Energy Corp. | | | 1,105,447 | |
| | 19,900 | | | Edison International | | | 761,175 | |
| | 14,300 | | | Entergy Corp. | | | 947,947 | |
| | 20,000 | | | Exelon Corp. | | | 852,200 | |
| | 19,500 | | | Integrys Energy Group, Inc. | | | 948,090 | |
| | 7,900 | | | Laclede Group, Inc. | | | 306,125 | |
| | 15,200 | | | MDU Resources Group, Inc. | | | 291,688 | |
| | 20,700 | | | NextEra Energy, Inc. | | | 1,118,214 | |
| | 10,900 | | | Pepco Holdings, Inc. | | | 206,228 | |
| | 23,200 | | | PG&E Corp. | | | 981,592 | |
| | 5,400 | | | Piedmont Natural Gas Co., Inc. | | | 156,006 | |
| | 44,500 | | | PPL Corp. | | | 1,270,030 | |
| | 19,700 | | | Progress Energy, Inc. | | | 1,018,884 | |
| | | | | | | | |
| Shares or Principal Amount | | Value | |
| | | | | | | | |
| | 32,000 | | | Public Service Enterprise Group, Inc. | | $ | 1,067,840 | |
| | 30,400 | | | SCANA Corp. | | | 1,229,680 | |
| | 19,100 | | | Sempra Energy | | | 983,650 | |
| | 52,100 | | | Southern Co. | | | 2,207,477 | |
| | 9,500 | | | UGI Corp. | | | 249,565 | |
| | 37,800 | | | Vectren Corp. | | | 1,023,624 | |
| | 5,300 | | | WGL Holdings, Inc. | | | 207,071 | |
| | 39,600 | | | Xcel Energy, Inc. | | | 977,724 | |
| | | | | | | | |
| Total Common Stocks
(Cost $19,966,374) | | | 20,603,199 | |
| | Short-Term Investment (2.3%) | |
| $ | 500,770 | | | State Street Euro Dollar Time
Deposit (USD),
0.01%, 10/03/11 | | | 500,770 | |
| | | | | | | | |
| Total Short-Term
Investments
(Cost $500,770) | | | 500,770 | |
| Total Investments 96.9%
(Cost $20,467,144) | | | 21,103,969 | |
| Other Assets Less Liabilities
3.1% | | | 681,307 | |
| | | | | | | | |
| | Net Assets 100.0% | | $ | 21,785,276 | |
| | | | | | | | |
| | | | |
| SCHEDULEOF INVESTMENTS | | | 61 | |
STATEMENTSOF ASSETSAND LIABILITIES
SEPTEMBER 30, 2011
| | | | | | | | | | | | |
| | | ICON
Consumer
Discretionary
Fund | | | ICON
Consumer
Staples
Fund | | | ICON
Energy
Fund | |
Assets | | | | | | | | | | | | |
Investments, at cost | | $ | 36,516,859 | | | $ | 22,219,235 | | | $ | 636,362,877 | |
| | | | | | | | | | | | |
Investments, at value† | | | 35,350,225 | | | | 22,261,348 | | | | 579,114,169 | |
Receivables: | | | | | | | | | | | | |
Fund shares sold | | | 2,980 | | | | 1,652 | | | | 748,342 | |
Investments sold | | | 747,561 | | | | 646,981 | | | | 14,058,382 | |
Dividends | | | 19,561 | | | | 56,653 | | | | 261,477 | |
Expense reimbursements by Adviser | | | 921 | | | | 7,739 | | | | – | |
Foreign tax reclaims | | | – | | | | 3,207 | | | | 29,517 | |
Other assets | | | 6,629 | | | | 5,184 | | | | 111,580 | |
| | | | | | | | | | | | |
Total Assets | | | 36,127,877 | | | | 22,982,764 | | | | 594,323,467 | |
| | | | | | | | | | | | |
Liabilities | | | | | | | | | | | | |
Payables: | | | | | | | | | | | | |
Investments purchased | | | 516,869 | | | | 2,180,155 | | | | 9,088,850 | |
Payable for collateral received on securities loaned | | | 1,322,350 | | | | 42,195 | | | | 16,866,358 | |
Fund shares redeemed | | | 67,685 | | | | 27,555 | | | | 543,072 | |
Advisory fees | | | 28,094 | | | | 16,350 | | | | 515,229 | |
Accrued distribution fees | | | 29 | | | | 54 | | | | 5,455 | |
Fund accounting fees | | | 562 | | | | 335 | | | | 10,338 | |
Transfer agent fees | | | 5,502 | | | | 3,915 | | | | 49,135 | |
Administration fees | | | 1,405 | | | | 817 | | | | 26,035 | |
Trustee fees | | | 195 | | | | 175 | | | | 4,642 | |
Accrued expenses | | | 18,946 | | | | 18,436 | | | | 98,501 | |
| | | | | | | | | | | | |
Total Liabilities | | | 1,961,637 | | | | 2,289,987 | | | | 27,207,615 | |
| | | | | | | | | | | | |
Net Assets - all share classes | | $ | 34,166,240 | | | $ | 20,692,777 | | | $ | 567,115,852 | |
| | | | | | | | | | | | |
Net Assets - Class S | | $ | 34,123,253 | | | $ | 20,614,140 | | | $ | 556,392,865 | |
| | | | | | | | | | | | |
Net Assets - Class C | | $ | 31,801 | | | $ | 54,916 | | | $ | 4,718,303 | |
| | | | | | | | | | | | |
Net Assets - Class A | | $ | 11,186 | | | $ | 23,721 | | | $ | 6,004,684 | |
| | | | | | | | | | | | |
| | | | | | | | | | | | |
| | | ICON
Consumer
Discretionary
Fund | | | ICON
Consumer
Staples
Fund | | | ICON
Energy
Fund | |
Net Assets Consist of | | | | | | | | | | | | |
Paid-in capital | | $ | 55,155,417 | | | $ | 24,040,825 | | | $ | 631,686,223 | |
Accumulated undistributed net investment income/(loss) | | | - | | | | 279,768 | | | | 5,562,115 | |
Accumulated undistributed net realized gain/(loss) from investments and foreign currency transactions | | | (19,822,543 | ) | | | (3,669,929 | ) | | | (12,883,778 | ) |
Unrealized appreciation/(depreciation) on investments and foreign currency transactions | | | (1,166,634 | ) | | | 42,113 | | | | (57,248,708 | ) |
| | | | | | | | | | | | |
Net Assets | | $ | 34,166,240 | | | $ | 20,692,777 | | | $ | 567,115,852 | |
| | | | | | | | | | | | |
Shares outstanding (unlimited shares authorized, no par value) | | | | | | | | | | | | |
Class S | | | 3,883,903 | | | | 2,393,053 | | | | 33,431,450 | |
Class C | | | 3,646 | | | | 6,437 | | | | 286,524 | |
Class A | | | 1,278 | | | | 2,733 | | | | 361,916 | |
Net asset value (offering and redemption price per share) | | | | | | | | | | | | |
Class S | | $ | 8.79 | | | $ | 8.61 | | | $ | 16.64 | |
Class C | | $ | 8.72 | | | $ | 8.53 | | | $ | 16.47 | |
Class A | | $ | 8.75 | | | $ | 8.68 | | | $ | 16.59 | |
Class A maximum offering price (100%/(100%-maximum sales charge)) of net asset value adjusted to the nearest cent per share | | $ | 9.28 | | | $ | 9.21 | | | $ | 17.60 | |
| | | |
† Includes securities on loan of | | $ | 1,246,832 | | | $ | 41,186 | | | $ | 16,037,468 | |
The accompanying notes are an integral part of the financial statements.
STATEMENTSOF ASSETSAND LIABILITIES
SEPTEMBER 30, 2011
| | | | | | | | | | | | |
| | | ICON
Financial
Fund | | | ICON
Healthcare
Fund | | | ICON
Industrials
Fund | |
Assets | | | | | | | | | | | | |
Investments, at cost | | $ | 38,302,481 | | | $ | 81,038,989 | | | $ | 54,320,222 | |
| | | | | | | | | | | | |
Investments, at value† | | | 32,210,610 | | | | 76,120,039 | | | | 52,283,826 | |
Receivables: | | | | | | | | | | | | |
Fund shares sold | | | 5,113 | | | | 44,512 | | | | 7,973 | |
Investments sold | | | 401,705 | | | | 335,860 | | | | 765,713 | |
Dividends | | | 37,860 | | | | 104,499 | | | | 121,548 | |
Expense reimbursements by Adviser | | | 992 | | | | 1,829 | | | | 1,339 | |
Foreign tax reclaims | | | 11,544 | | | | 1,563 | | | | – | |
Other assets | | | 7,484 | | | | 13,315 | | | | 12,113 | |
| | | | | | | | | | | | |
Total Assets | | | 32,675,308 | | | | 76,621,617 | | | | 53,192,512 | |
| | | | | | | | | | | | |
Liabilities | | | | | | | | | | | | |
Payables: | | | | | | | | | | | | |
Due to custodian bank | | | 111,219 | | | | 10,417 | | | | 664,811 | |
Payable for collateral received on securities loaned | | | – | | | | 1,139,111 | | | | 1,563,306 | |
Fund shares redeemed | | | 40,353 | | | | 101,692 | | | | 96,215 | |
Advisory fees | | | 28,483 | | | | 63,804 | | | | 45,087 | |
Accrued distribution fees | | | 13 | | | | 45 | | | | 40 | |
Fund accounting fees | | | 588 | | | | 1,297 | | | | 911 | |
Transfer agent fees | | | 6,398 | | | | 11,874 | | | | 6,835 | |
Administration fees | | | 1,424 | | | | 3,190 | | | | 2,254 | |
Trustee fees | | | 348 | | | | 522 | | | | 460 | |
Accrued expenses | | | 21,640 | | | | 26,572 | | | | 22,479 | |
| | | | | | | | | | | | |
Total Liabilities | | | 210,466 | | | | 1,358,524 | | | | 2,402,398 | |
| | | | | | | | | | | | |
Net Assets - all share classes | | $ | 32,464,842 | | | $ | 75,263,093 | | | $ | 50,790,114 | |
| | | | | | | | | | | | |
Net Assets - Class S | | $ | 32,432,314 | | | $ | 75,115,545 | | | $ | 50,652,939 | |
| | | | | | | | | | | | |
Net Assets - Class C | | $ | 8,808 | | | $ | 21,913 | | | $ | 14,708 | |
| | | | | | | | | | | | |
Net Assets - Class A | | $ | 23,720 | | | $ | 125,635 | | | $ | 122,467 | |
| | | | | | | | | | | | |
| | | | | | | | | | | | |
| | | ICON
Financial
Fund | | | ICON
Healthcare
Fund | | | ICON
Industrials
Fund | |
Net Assets Consist of | | | | | | | | | | | | |
Paid-in capital | | $ | 141,245,100 | | | $ | 84,424,286 | | | $ | 91,954,582 | |
Accumulated undistributed net investment income/(loss) | | | 210,720 | | | | 663,354 | | | | 535,609 | |
Accumulated undistributed net realized gain/(loss) from investments and foreign currency transactions | | | (102,898,904 | ) | | | (4,905,597 | ) | | | (39,663,402 | ) |
Unrealized appreciation/(depreciation) on investments and foreign currency transactions | | | (6,092,074 | ) | | | (4,918,950 | ) | | | (2,036,675 | ) |
| | | | | | | | | | | | |
Net Assets | | $ | 32,464,842 | | | $ | 75,263,093 | | | $ | 50,790,114 | |
| | | | | | | | | | | | |
Shares outstanding (unlimited shares authorized, no par value) | | | | | | | | | | | | |
Class S | | | 6,913,061 | | | | 5,539,845 | | | | 7,454,007 | |
Class C | | | 1,899 | | | | 1,632 | | | | 2,188 | |
Class A | | | 5,070 | | | | 9,287 | | | | 18,117 | |
Net asset value (offering and redemption price per share) | | | | | | | | | | | | |
Class S | | $ | 4.69 | | | $ | 13.56 | | | $ | 6.80 | |
Class C | | $ | 4.64 | | | $ | 13.43 | | | $ | 6.72 | |
Class A | | $ | 4.68 | | | $ | 13.53 | | | $ | 6.76 | |
Class A maximum offering price (100%/(100%-maximum sales charge)) of net asset value adjusted to the nearest cent per share | | $ | 4.97 | | | $ | 14.36 | | | $ | 7.17 | |
| | | |
† Includes securities on loan of | | $ | – | | | $ | 1,107,726 | | | $ | 1,471,117 | |
The accompanying notes are an integral part of the financial statements.
STATEMENTSOF ASSETSAND LIABILITIES
SEPTEMBER 30, 2011
| | | | | | | | | | | | |
| | | ICON
Information
Technology
Fund | | | ICON
Materials
Fund | | | ICON
Telecommunication
& Utilities Fund | |
Assets | | | | | | | | | | | | |
Investments, at cost | | $ | 60,023,822 | | | $ | 63,242,194 | | | $ | 20,467,144 | |
| | | | | | | | | | | | |
Investments, at value† | | | 62,225,481 | | | | 59,033,760 | | | | 21,103,969 | |
Cash | | | – | | | | 89 | | | | – | |
Receivables: | | | | | | | | | | | | |
Fund shares sold | | | 9,304 | | | | 57,400 | | | | 926,948 | |
Investments sold | | | 281,642 | | | | 756,158 | | | | – | |
Dividends | | | 17,388 | | | | 142,412 | | | | 75,183 | |
Expense reimbursements by Adviser | | | 1,048 | | | | 2,708 | | | | 10,832 | |
Foreign tax reclaims | | | – | | | | – | | | | 18,307 | |
Other assets | | | 14,145 | | | | 14,952 | | | | 4,649 | |
| | | | | | | | | | | | |
Total Assets | | | 62,549,008 | | | | 60,007,479 | | | | 22,139,888 | |
| | | | | | | | | | | | |
Liabilities | | | | | | | | | | | | |
Payables: | | | | | | | | | | | | |
Due to custodian bank | | | 97,844 | | | | 155,146 | | | | – | |
Investments purchased | | | – | | | | – | | | | 269,432 | |
Payable for collateral received on securities loaned | | | 1,204,705 | | | | – | | | | – | |
Fund shares redeemed | | | 73,585 | | | | 80,045 | | | | 30,180 | |
Distributions due to shareholders | | | – | | | | – | | | | 13,286 | |
Advisory fees | | | 52,297 | | | | 56,239 | | | | 16,410 | |
Accrued distribution fees | | | 1 | | | | 229 | | | | 6 | |
Fund accounting fees | | | 1,060 | | | | 1,137 | | | | 340 | |
Transfer agent fees | | | 7,657 | | | | 9,290 | | | | 4,559 | |
Administration fees | | | 2,615 | | | | 2,812 | | | | 821 | |
Trustee fees | | | 541 | | | | 619 | | | | 168 | |
Accrued expenses | | | 24,940 | | | | 27,581 | | | | 19,410 | |
| | | | | | | | | | | | |
Total Liabilities | | | 1,465,245 | | | | 333,098 | | | | 354,612 | |
| | | | | | | | | | | | |
Net Assets - all share classes | | $ | 61,083,763 | | | $ | 59,674,381 | | | $ | 21,785,276 | |
| | | | | | | | | | | | |
Net Assets - Class S | | $ | 61,081,142 | | | $ | 59,067,736 | | | $ | 21,312,561 | |
| | | | | | | | | | | | |
Net Assets - Class C | | $ | 1,303 | | | $ | 120,053 | | | $ | 23,932 | |
| | | | | | | | | | | | |
Net Assets - Class A | | $ | 1,318 | | | $ | 486,592 | | | $ | 448,783 | |
| | | | | | | | | | | | |
| | | | | | | | | | | | |
| | | ICON
Information
Technology
Fund | | | ICON
Materials
Fund | | | ICON
Telecommunication
& Utilities Fund | |
Net Assets Consist of | | | | | | | | | | | | |
Paid-in capital | | $ | 88,594,363 | | | $ | 83,715,680 | | | $ | 30,898,870 | |
Accumulated undistributed net investment income/(loss) | | | - | | | | 651,006 | | | | 148,439 | |
Accumulated undistributed net realized gain/(loss) from investments and foreign currency transactions | | | (29,712,259 | ) | | | (20,483,871 | ) | | | (9,898,858 | ) |
Unrealized appreciation/(depreciation) on investments and foreign currency transactions | | | 2,201,659 | | | | (4,208,434 | ) | | | 636,825 | |
| | | | | | | | | | | | |
Net Assets | | $ | 61,083,763 | | | $ | 59,674,381 | | | $ | 21,785,276 | |
| | | | | | | | | | | | |
Shares outstanding (unlimited shares authorized, no par value) | | | | | | | | | | | | |
Class S | | | 7,429,749 | | | | 6,560,121 | | | | 3,389,492 | |
Class C | | | 160 | | | | 13,464 | | | | 3,856 | |
Class A | | | 161 | | | | 54,228 | | | | 71,891 | |
Net asset value (offering and redemption price per share) | | | | | | | | | | | | |
Class S | | $ | 8.22 | | | $ | 9.00 | | | $ | 6.29 | |
Class C | | $ | 8.13 | | | $ | 8.92 | | | $ | 6.21 | |
Class A | | $ | 8.20 | | | $ | 8.97 | | | $ | 6.24 | |
Class A maximum offering price (100%/(100%-maximum sales charge)) of net asset value adjusted to the nearest cent per share | | $ | 8.70 | | | $ | 9.52 | | | $ | 6.62 | |
| | | |
† Includes securities on loan of | | $ | 1,157,101 | | | $ | – | | | $ | – | |
The accompanying notes are an integral part of the financial statements.
STATEMENTSOF OPERATIONS
FORTHEYEARENDED SEPTEMBER 30, 2011
| | | | | | | | | | | | |
| | | ICON
Consumer
Discretionary
Fund | | | ICON
Consumer
Staples
Fund | | | ICON
Energy
Fund | |
Investment Income | | | | | | | | | | | | |
Interest | | $ | 91 | | | $ | 56 | | | $ | 1,513 | |
Dividends | | | 365,551 | | | | 648,933 | | | | 13,424,461 | |
Income from securities lending, net | | | 16,748 | | | | 11,940 | | | | 131,354 | |
Foreign taxes withheld | | | - | | | | (2,405 | ) | | | (136,771 | ) |
| | | | | | | | | | | | |
Total Investment Income | | | 382,390 | | | | 658,524 | | | | 13,420,557 | |
| | | | | | | | | | | | |
Expenses | | | | | | | | | | | | |
Advisory fees | | | 291,593 | �� | | | 252,803 | | | | 6,706,331 | |
Distribution fees: | | | | | | | | | | | | |
Class C | | | 141 | | | | 291 | | | | 24,599 | |
Class A | | | 19 | | | | 54 | | | | 10,625 | |
Fund accounting fees | | | 4,706 | | | | 2,641 | | | | 95,908 | |
Transfer agent fees | | | 52,627 | | | | 41,166 | | | | 459,782 | |
Administration fees | | | 14,426 | | | | 12,514 | | | | 336,328 | |
Custody fees | | | 634 | | | | 2,636 | | | | 23,747 | |
Registration fees: | | | | | | | | | | | | |
Class S | | | 22,231 | | | | 21,694 | | | | 81,210 | |
Class C | | | - | | | | - | | | | 2,324 | |
Class A | | | 1 | | | | - | | | | 3,558 | |
Insurance expense | | | 2,086 | | | | 4,503 | | | | 80,700 | |
Trustee fees and expenses | | | 2,200 | | | | 2,601 | | | | 57,642 | |
Audit and tax service expense | | | 24,931 | | | | 25,226 | | | | 33,040 | |
Interest expense | | | 1,202 | | | | 1,261 | | | | 2,850 | |
Other expenses | | | 34,492 | | | | 32,536 | | | | 305,149 | |
| | | | | | | | | | | | |
Total expenses before expense reimbursement | | | 451,289 | | | | 399,926 | | | | 8,223,793 | |
Expense reimbursement by Adviser due to expense limitation agreement | | | (2,712 | ) | | | (21,170 | ) | | | - | |
| | | | | | | | | | | | |
Net Expenses | | | 448,577 | | | | 378,756 | | | | 8,223,793 | |
| | | | | | | | | | | | |
Net Investment Income/(Loss) | | | (66,187 | ) | | | 279,768 | | | | 5,196,764 | |
| | | | | | | | | | | | |
Net Realized and Unrealized Gain/(Loss) on Investments and Foreign Currency Transactions | | | | | | | | | | | | |
Net realized gain/(loss) from investment transactions | | | 3,958,013 | | | | 6,056,213 | | | | 56,908,887 | |
Net realized gain/(loss) from foreign currency transactions | | | - | | | | - | | | | (1,756 | ) |
Change in unrealized net appreciation/ (depreciation) on investments and foreign currency translations | | | (2,613,003 | ) | | | (3,689,577 | ) | | | (79,499,501 | ) |
| | | | | | | | | | | | |
Net realized and unrealized gain/(loss) on investments and foreign currency transactions | | | 1,345,010 | | | | 2,366,636 | | | | (22,592,370 | ) |
| | | | | | | | | | | | |
Net Increase/(Decrease) in Net Assets Resulting From Operations | | $ | 1,278,823 | | | $ | 2,646,404 | | | $ | (17,395,606 | ) |
| | | | | | | | | | | | |
The accompanying notes are an integral part of the financial statements.
| | | | | | | | | | | | | | | | | | | | | | |
ICON Financial Fund | | | ICON
Healthcare
Fund | | | ICON
Industrials
Fund | | | ICON
Information
Technology
Fund | | | ICON
Materials
Fund | | | ICON
Telecommunication
& Utilities Fund | |
| | | | | | | | | | | | | | | | | | | | | | |
| $ | 39 | | | $ | 94 | | | $ | 164 | | | $ | 111 | | | $ | 197 | | | $ | 13 | |
| | 933,792 | | | | 1,698,058 | | | | 1,420,598 | | | | 699,342 | | | | 1,826,920 | | | | 1,334,638 | |
| | 348 | | | | 40,435 | | | | 29,230 | | | | 43,973 | | | | 29,836 | | | | - | |
| | (14,312 | ) | | | (16,996 | ) | | | (9,112 | ) | | | - | | | | (10,940 | ) | | | (26,715 | ) |
| | | | | | | | | | | | | | | | | | | | | | |
| | 919,867 | | | | 1,721,591 | | | | 1,440,880 | | | | 743,426 | | | | 1,846,013 | | | | 1,307,936 | |
| | | | | | | | | | | | | | | | | | | | | | |
| | | | | | | | | | | | | | | | | | | | | | |
| | 498,520 | | | | 776,497 | | | | 666,581 | | | | 783,790 | | | | 893,928 | | | | 244,118 | |
| | | | | | | | | | | | | | | | | | | | | | |
| | 39 | | | | 63 | | | | 114 | | | | 12 | | | | 940 | | | | 12 | |
| | 56 | | | | 74 | | | | 233 | | | | 2 | | | | 1,158 | | | | 2 | |
| | 5,681 | | | | 6,943 | | | | 8,593 | | | | 9,438 | | | | 11,576 | | | | 2,886 | |
| | 59,592 | | | | 108,678 | | | | 75,017 | | | | 89,735 | | | | 95,844 | | | | 43,084 | |
| | 24,679 | | | | 38,448 | | | | 32,998 | | | | 38,799 | | | | 44,247 | | | | 12,089 | |
| | 4,822 | | | | 3,626 | | | | 3,459 | | | | 3,642 | | | | 3,959 | | | | 3,484 | |
| | | | | | | | | | | | | | | | | | | | | | |
| | 24,038 | | | | 27,420 | | | | 26,920 | | | | 27,346 | | | | 26,158 | | | | 22,070 | |
| | - | | | | 442 | | | | - | | | | - | | | | 1 | | | | - | |
| | 1 | | | | 364 | | | | 442 | | | | - | | | | 1,098 | | | | - | |
| | 8,705 | | | | 17,612 | | | | 9,044 | | | | 13,868 | | | | 12,476 | | | | 3,539 | |
| | 5,042 | | | | 6,133 | | | | 6,413 | | | | 7,244 | | | | 8,517 | | | | 2,615 | |
| | 25,638 | | | | 26,735 | | | | 25,671 | | | | 26,262 | | | | 26,029 | | | | 25,127 | |
| | 1,821 | | | | 1,381 | | | | 3,745 | | | | 2,287 | | | | 3,031 | | | | 2,447 | |
| | 44,038 | | | | 47,228 | | | | 49,110 | | | | 54,014 | | | | 69,819 | | | | 33,425 | |
| | | | | | | | | | | | | | | | | | | | | | |
| | | | | | | | | | | | | | | | | | | | | | |
| | 702,672 | | | | 1,061,644 | | | | 908,340 | | | | 1,056,439 | | | | 1,198,781 | | | | 394,898 | |
| | | | | | | | | | | | | | | | | | | | | | |
| | (2,512 | ) | | | (3,414 | ) | | | (2,849 | ) | | | (2,606 | ) | | | (3,934 | ) | | | (25,886 | ) |
| | | | | | | | | | | | | | | | | | | | | | |
| | 700,160 | | | | 1,058,230 | | | | 905,491 | | | | 1,053,833 | | | | 1,194,847 | | | | 369,012 | |
| | | | | | | | | | | | | | | | | | | | | | |
| | 219,707 | | | | 663,361 | | | | 535,389 | | | | (310,407 | ) | | | 651,166 | | | | 938,924 | |
| | | | | | | | | | | | | | | | | | | | | | |
| | | | | | | | | | | | | | | | | | | | | | |
| | | | | | | | | | | | | | | | | | | | | | |
| | | | | | | | | | | | | | | | | | | | | | |
| | | | | | | | | | | | | | | | | | | | | | |
| | 4,264,982 | | | | 16,832,522 | | | | 4,947,342 | | | | 10,930,880 | | | | 14,037,245 | | | | 3,030,171 | |
| | | | | | | | | | | | | | | | | | | | | | |
| | (29 | ) | | | - | | | | 225 | | | | - | | | | 2 | | | | 253 | |
| | | | | | | | | | | | | | | | | | | | | | |
| | | | | | | | | | | | | | | | | | | | | | |
| | (8,169,704 | ) | | | (14,799,677 | ) | | | (9,247,082 | ) | | | (7,722,736 | ) | | | (18,663,236 | ) | | | (1,633,228 | ) |
| | | | | | | | | | | | | | | | | | | | | | |
| | | | | | | | | | | | | | | | | | | | | | |
| | | | | | | | | | | | | | | | | | | | | | |
| | (3,904,751 | ) | | | 2,032,845 | | | | (4,299,515 | ) | | | 3,208,144 | | | | (4,625,989 | ) | | | 1,397,196 | |
| | | | | | | | | | | | | | | | | | | | | | |
| | | | | | | | | | | | | | | | | | | | | | |
| $ | (3,685,044 | ) | | $ | 2,696,206 | | | $ | (3,764,126 | ) | | $ | 2,897,737 | | | $ | (3,974,823 | ) | | $ | 2,336,120 | |
| | | | | | | | | | | | | | | | | | | | | | |
STATEMENTSOF CHANGESIN NET ASSETS
| | | | | | | | |
| | | ICON Consumer Discretionary Fund | |
| | | Year ended
September 30,
2011 | | | Year ended
September 30,
2010 | |
Operations | | | | | | | | |
Net investment income/(loss) | | $ | (66,187 | ) | | $ | (93,189 | ) |
Net realized gain/(loss) on investment transactions and foreign currency transactions | | | 3,958,013 | | | | 2,071,670 | |
Change in net unrealized appreciation/(depreciation) on investments and foreign currency transactions | | | (2,613,003 | ) | | | (738,123 | ) |
| | | | | | | | |
Net increase/(decrease) in net assets resulting from operations | | | 1,278,823 | | | | 1,240,358 | |
| | | | | | | | |
Dividends and Distributions to Shareholders | | | | | | | | |
Net investment income | | | | | | | | |
Class S | | | - | | | | (376,917 | ) |
Class C | | | - | | | | - | |
Class A | | | - | | | | - | |
| | | | | | | | |
Net decrease from dividends and distributions | | | - | | | | (376,917 | ) |
| | | | | | | | |
Fund Share Transactions | | | | | | | | |
Shares sold | | | | | | | | |
Class S | | | 35,997,921 | | | | 25,144,641 | |
Class C | | | 34,449 | | | | 10 | |
Class A | | | 13,977 | | | | 10 | |
Reinvested dividends and distributions | | | | | | | | |
Class S | | | - | | | | 370,245 | |
Class C | | | - | | | | - | |
Class A | | | - | | | | - | |
Shares repurchased | | | | | | | | |
Class S | | | (20,906,184 | ) | | | (22,833,765 | ) |
Class C | | | - | | | | - | |
Class A | | | (2,421 | ) | | | - | |
| | | | | | | | |
Net Increase/(decrease) from fund share transactions | | | 15,137,742 | | | | 2,681,141 | |
| | | | | | | | |
Total net increase/(decrease) in net assets | | | 16,416,565 | | | | 3,544,582 | |
Net Assets | | | | | | | | |
Beginning of year | | | 17,749,675 | | | | 14,205,093 | |
| | | | | | | | |
End of year | | $ | 34,166,240 | | | $ | 17,749,675 | |
| | | | | | | | |
| | | | | | | | | | | | | | | | | | | | | | |
| ICON Consumer Staples Fund | | | ICON Energy Fund | | | ICON Financial Fund | |
Year ended
September 30,
2011 | | | Year ended
September 30,
2010 | | | Year ended
September 30,
2011 | | | Year ended
September 30,
2010 | | | Year ended
September 30,
2011 | | | Year ended
September 30,
2010 | |
| | | | | | | | | | | | | | | | | | | | | | |
| $ | 279,768 | | | $ | 315,209 | | | $ | 5,196,764 | | | $ | 7,066,956 | | | $ | 219,707 | | | $ | 224,427 | |
| | | | | | | | | | | | | | | | | | | | | | |
| | 6,056,213 | | | | 1,411,171 | | | | 56,907,131 | | | | 70,562,544 | | | | 4,264,953 | | | | 14,551,608 | |
| | | | | | | | | | | | | | | | | | | | | | |
| | (3,689,577 | ) | | | 1,507,065 | | | | (79,499,501 | ) | | | (83,867,728 | ) | | | (8,169,704 | ) | | | (20,022,696 | ) |
| | | | | | | | | | | | | | | | | | | | | | |
| | | | | | | | | | | | | | | | | | | | | | |
| | 2,646,404 | | | | 3,233,445 | | | | (17,395,606 | ) | | | (6,238,228 | ) | | | (3,685,044 | ) | | | (5,246,661 | ) |
| | | | | | | | | | | | | | | | | | | | | | |
| | | | | | | | | | | | | | | | | | | | | | |
| | | | | | | | | | | | | | | | | | | | | | |
| | (315,201 | ) | | | (383,505 | ) | | | (6,512,391 | ) | | | (7,077,474 | ) | | | (214,079 | ) | | | (1,136,088 | ) |
| | - | * | | | - | | | | (2,299 | ) | | | - | | | | - | * | | | - | |
| | - | * | | | - | | | | (2,050 | ) | | | - | | | | - | * | | | - | |
| | | | | | | | | | | | | | | | | | | | | | |
| | (315,201 | ) | | | (383,505 | ) | | | (6,516,740 | ) | | | (7,077,474 | ) | | | (214,079 | ) | | | (1,136,088 | ) |
| | | | | | | | | | | | | | | | | | | | | | |
| | | | | | | | | | | | | | | | | | | | | | |
| | | | | | | | | | | | | | | | | | | | | | |
| | 4,430,851 | | | | 12,417,351 | | | | 292,023,538 | | | | 178,922,949 | | | | 5,449,823 | | | | 23,666,480 | |
| | 64,933 | | | | 10 | | | | 6,473,169 | | | | 10 | | | | 11,500 | | | | 10 | |
| | 58,829 | | | | 10 | | | | 13,691,961 | | | | 10 | | | | 43,528 | | | | 10 | |
| | | | | | | | | | | | | | | | | | | | | | |
| | 307,247 | | | | 379,975 | | | | 6,151,455 | | | | 6,772,496 | | | | 205,345 | | | | 1,109,429 | |
| | - | | | | - | | | | 2,134 | | | | - | | | | - | | | | - | |
| | - | | | | - | | | | 1,303 | | | | - | | | | - | | | | - | |
| | | | | | | | | | | | | | | | | | | | | | |
| | (17,099,046 | ) | | | (11,080,889 | ) | | | (231,307,972 | ) | | | (222,753,588 | ) | | | (28,086,279 | ) | | | (41,710,196 | ) |
| | (8,325 | ) | | | - | | | | (481,687 | ) | | | - | | | | - | | | | - | |
| | (33,053 | ) | | | - | | | | (5,707,105 | ) | | | - | | | | (10,223 | ) | | | - | |
| | | | | | | | | | | | | | | | | | | | | | |
| | (12,278,564 | ) | | | 1,716,457 | | | | 80,846,796 | | | | (37,058,123 | ) | | | (22,386,306 | ) | | | (16,934,267 | ) |
| | | | | | | | | | | | | | | | | | | | | | |
| | (9,947,361 | ) | | | 4,566,397 | | | | 56,934,450 | | | | (50,373,825 | ) | | | (26,285,429 | ) | | | (23,317,016 | ) |
| | | | | | | | | | | | | | | | | | | | | | |
| | 30,640,138 | | | | 26,073,741 | | | | 510,181,402 | | | | 560,555,227 | | | | 58,750,271 | | | | 82,067,287 | |
| | | | | | | | | | | | | | | | | | | | | | |
| $ | 20,692,777 | | | $ | 30,640,138 | | | $ | 567,115,852 | | | $ | 510,181,402 | | | $ | 32,464,842 | | | $ | 58,750,271 | |
| | | | | | | | | | | | | | | | | | | | | | |
STATEMENTSOF CHANGESIN NET ASSETS (CONTINUED)
| | | | | | | | |
| | | ICON Consumer Discretionary Fund | |
| | | Year ended
September 30,
2011 | | | Year ended
September 30,
2010 | |
Transactions in Fund Shares | | | | | | | | |
Shares sold | | | | | | | | |
Class S | | | 3,902,028 | | | | 3,179,590 | |
Class C | | | 3,645 | | | | 1 | |
Class A | | | 1,549 | | | | 1 | |
Reinvested dividends and distributions | | | | | | | | |
Class S | | | - | | | | 52,892 | |
Class C | | | - | | | | - | |
Class A | | | - | | | | - | |
Shares repurchased | | | | | | | | |
Class S | | | (2,259,195 | ) | | | (3,071,715 | ) |
Class C | | | - | | | | - | |
Class A | | | (272 | ) | | | - | |
| | | | | | | | |
Net increase/(decrease) | | | 1,647,755 | | | | 160,769 | |
Shares outstanding, beginning of year | | | 2,241,072 | | | | 2,080,303 | |
| | | | | | | | |
Shares outstanding, end of year | | | 3,888,827 | | | | 2,241,072 | |
| | | | | | | | |
Accumulated undistributed net investment income/(loss) | | $ | - | | | $ | - | |
| | | | | | | | |
The accompanying notes are an integral part of the financial statements.
| | | | | | | | | | | | | | | | | | | | | | |
| ICON Consumer Staples Fund | | | ICON Energy Fund | | | ICON Financial Fund | |
Year ended
September 30,
2011 | | | Year ended
September 30,
2010 | | | Year ended
September 30,
2011 | | | Year ended
September 30,
2010 | | | Year ended
September 30,
2011 | | | Year ended
September 30,
2010 | |
| | | | | | | | | | | | | | | | | | | | | | |
| | | | | | | | | | | | | | | | | | | | | | |
| | 502,481 | | | | 1,605,672 | | | | 13,946,024 | | | | 10,555,692 | | | | 964,735 | | | | 3,866,691 | |
| | 7,402 | | | | 1 | | | | 310,026 | | | | 1 | | | | 1,897 | | | | 2 | |
| | 6,526 | | | | 1 | | | | 634,607 | | | | 1 | | | | 7,154 | | | | 2 | |
| | | | | | | | | | | | | | | | | | | | | | |
| | 35,644 | | | | 49,931 | | | | 315,298 | | | | 395,124 | | | | 34,396 | | | | 197,759 | |
| | - | | | | - | | | | 109 | | | | - | | | | - | | | | - | |
| | - | | | | - | | | | 66 | | | | - | | | | - | | | | - | |
| | | | | | | | | | | | | | | | | | | | | | |
| | (1,937,424 | ) | | | (1,426,850 | ) | | | (11,397,070 | ) | | | (13,514,630 | ) | | | (4,672,640 | ) | | | (7,233,233 | ) |
| | (966 | ) | | | - | | | | (23,612 | ) | | | - | | | | - | | | | - | |
| | (3,794 | ) | | | - | | | | (272,758 | ) | | | - | | | | (2,086 | ) | | | - | |
| | | | | | | | | | | | | | | | | | | | | | |
| | (1,390,131 | ) | | | 228,755 | | | | 3,512,690 | | | | (2,563,812 | ) | | | (3,666,544 | ) | | | (3,168,779 | ) |
| | 3,792,354 | | | | 3,563,599 | | | | 30,567,200 | | | | 33,131,012 | | | | 10,586,574 | | | | 13,755,353 | |
| | | | | | | | | | | | | | | | | | | | | | |
| | 2,402,223 | | | | 3,792,354 | | | | 34,079,890 | | | | 30,567,200 | | | | 6,920,030 | | | | 10,586,574 | |
| | | | | | | | | | | | | | | | | | | | | | |
| | | | | | | | | | | | | | | | | | | | | | |
| $ | 279,768 | | | $ | 315,201 | | | $ | 5,562,115 | | | $ | 7,390,361 | | | $ | 210,720 | | | $ | 214,041 | |
| | | | | | | | | | | | | | | | | | | | | | |
STATEMENTSOF CHANGESIN NET ASSETS (CONTINUED)
| | | | | | | | |
| | |
ICON Healthcare Fund | |
| | | Year ended
September 30,
2011 | | | Year ended
September 30,
2010 | |
Operations | | | | | | | | |
Net investment income/(loss) | | $ | 663,361 | | | $ | 368,451 | |
Net realized gain/(loss) on investment transactions and foreign currency transactions | | | 16,832,522 | | | | 11,603,009 | |
Change in net unrealized appreciation/(depreciation) on investments and foreign currency transactions | | | (14,799,677 | ) | | | (5,724,798 | ) |
| | | | | | | | |
Net increase/(decrease) in net assets resulting from operations | | | 2,696,206 | | | | 6,246,662 | |
| | | | | | | | |
Dividends and Distributions to Shareholders | | | | | | | | |
Net investment income | | | | | | | | |
Class S | | | (368,446 | ) | | | (1,948,725 | ) |
Class C | | | - | * | | | - | |
Class A | | | - | * | | | - | |
| | | | | | | | |
Net decrease from dividends and distributions | | | (368,446 | ) | | | (1,948,725 | ) |
| | | | | | | | |
Fund Share Transactions | | | | | | | | |
Shares sold | | | | | | | | |
Class S | | | 34,364,122 | | | | 60,674,398 | |
Class C | | | 24,350 | | | | 10 | |
Class A | | | 139,248 | | | | 10 | |
Reinvested dividends and distributions | | | | | | | | |
Class S | | | 339,364 | | | | 1,861,774 | |
Class C | | | - | | | | - | |
Class A | | | - | | | | - | |
Shares repurchased | | | | | | | | |
Class S | | | (34,486,108 | ) | | | (104,885,201 | ) |
Class C | | | - | | | | - | |
Class A | | | - | | | | - | |
| | | | | | | | |
Net Increase/(decrease) from fund share transactions | | | 380,976 | | | | (42,349,009 | ) |
| | | | | | | | |
Total net increase/(decrease) in net assets | | | 2,708,736 | | | | (38,051,072 | ) |
Net Assets | | | | | | | | |
Beginning of year | | | 72,554,357 | | | | 110,605,429 | |
| | | | | | | | |
End of year | | $ | 75,263,093 | | | $ | 72,554,357 | |
| | | | | | | | |
| | | | | | | | | | | | | | | | | | | | | | |
| ICON Industrials Fund | | | ICON Information
Technology Fund | | | ICON Materials Fund | |
Year ended
September 30,
2011 | | | Year ended
September 30,
2010 | | | Year ended
September 30,
2011 | | | Year ended
September 30,
2010 | | | Year ended
September 30,
2011 | | | Year ended
September 30,
2010 | |
| | | | | | | | | | | | | | | | | | | | | | |
| $ | 535,389 | | | $ | 481,375 | | | $ | (310,407 | ) | | $ | (558,858 | ) | | $ | 651,166 | | | $ | 478,057 | |
|
4,947,567 |
| | | 5,748,298 | | | | 10,930,880 | | | | 15,864,394 | | | | 14,037,247 | | | | 9,069,867 | |
|
(9,247,082 |
) | | | 5,287,288 | | | | (7,722,736 | ) | | | (11,556,229 | ) | | | (18,663,236 | ) | | | 1,094,273 | |
| | | | | | | | | | | | | | | | | | | | | | |
|
(3,764,126 |
) | | | 11,516,961 | | | | 2,897,737 | | | | 3,749,307 | | | | (3,974,823 | ) | | | 10,642,197 | |
| | | | | | | | | | | | | | | | | | | | | | |
| | | | | | | | | | | | | | | | | | | | | | |
| | | | | | | | | | | | | | | | | | | | | | |
| | (478,530 | ) | | | (1,217,973 | ) | | | - | | | | (631,045 | ) | | | (477,527 | ) | | | (1,039,736 | ) |
| | - | * | | | - | | | | - | | | | - | | | | - | * | | | - | |
| | (24 | ) | | | - | | | | - | | | | - | | | | (659 | ) | | | - | |
| | | | | | | | | | | | | | | | | | | | | | |
| | (478,554 | ) | | | (1,217,973 | ) | | | - | | | | (631,045 | ) | | | (478,186 | ) | | | (1,039,736 | ) |
| | | | | | | | | | | | | | | | | | | | | | |
| | | | | | | | | | | | | | | | | | | | | | |
| | | | | | | | | | | | | | | | | | | | | | |
| | 25,861,382 | | | | 20,401,204 | | | | 21,159,024 | | | | 11,238,244 | | | | 23,865,539 | | | | 34,039,868 | |
| | 28,866 | | | | 10 | | | | 2,731 | | | | 10 | | | | 191,926 | | | | 10 | |
| | 583,511 | | | | 10 | | | | 1,500 | | | | 10 | | | | 1,071,934 | | | | 10 | |
| | | | | | | | | | | | | | | | | | | | | | |
| | 466,250 | | | | 1,207,851 | | | | - | | | | 623,163 | | | | 429,088 | | | | 961,442 | |
| | - | | | | - | | | | - | | | | - | | | | - | | | | - | |
| | 24 | | | | - | | | | - | | | | - | | | | 518 | | | | - | |
| | | | | | | | | | | | | | | | | | | | | | |
| | (43,113,233 | ) | | | (30,836,480 | ) | | | (40,245,229 | ) | | | (56,960,109 | ) | | | (48,822,526 | ) | | | (51,775,985 | ) |
| | (8,746 | ) | | | - | | | | (1,175 | ) | | | - | | | | (35,925 | ) | | | - | |
| | (392,087 | ) | | | - | | | | - | | | | - | | | | (428,748 | ) | | | - | |
| | | | | | | | | | | | | | | | | | | | | | |
| | (16,574,033 | ) | | | (9,227,405 | ) | | | (19,083,149 | ) | | | (45,098,682 | ) | | | (23,728,194 | ) | | | (16,774,655 | ) |
| | | | | | | | | | | | | | | | | | | | | | |
| | (20,816,713 | ) | | | 1,071,583 | | | | (16,185,412 | ) | | | (41,980,420 | ) | | | (28,181,203 | ) | | | (7,172,194 | ) |
| | | | | | | | | | | | | | | | | | | | | | |
| | 71,606,827 | | | | 70,535,244 | | | | 77,269,175 | | | | 119,249,595 | | | | 87,855,584 | | | | 95,027,778 | |
| | | | | | | | | | | | | | | | | | | | | | |
| $ | 50,790,114 | | | $ | 71,606,827 | | | $ | 61,083,763 | | | $ | 77,269,175 | | | $ | 59,674,381 | | | $ | 87,855,584 | |
| | | | | | | | | | | | | | | | | | | | | | |
STATEMENTSOF CHANGESIN NET ASSETS (CONTINUED)
| | | | | | | | |
| | |
ICON Healthcare Fund | |
| | | Year ended
September 30,
2011 | | | Year ended
September 30,
2010 | |
Transactions in Fund Shares | | | | | | | | |
Shares sold | | | | | | | | |
Class S | | | 2,280,950 | | | | 4,673,714 | |
Class C | | | 1,631 | | | | 1 | |
Class A | | | 9,286 | | | | 1 | |
Reinvested dividends and distributions | | | | | | | | |
Class S | | | 25,045 | | | | 141,580 | |
Class C | | | - | | | | - | |
Class A | | | - | | | | - | |
Shares repurchased | | | | | | | | |
Class S | | | (2,443,847 | ) | | | (8,133,721 | ) |
Class C | | | - | | | | - | |
Class A | | | - | | | | - | |
| | | | | | | | |
Net increase/(decrease) | | | (126,935 | ) | | | (3,318,425 | ) |
Shares outstanding, beginning of year | | | 5,677,699 | | | | 8,996,124 | |
| | | | | | | | |
Shares outstanding, end of year | | | 5,550,764 | | | | 5,677,699 | |
| | | | | | | | |
Accumulated undistributed net investment income/(loss) | | $ | 663,354 | | | $ | 368,439 | |
| | | | | | | | |
The accompanying notes are an integral part of the financial statements.
| | | | | | | | | | | | | | | | | | | | | | |
| ICON Industrials Fund | | | ICON Information
Technology Fund | | | ICON Materials Fund | |
Year ended
September 30,
2011 | | | Year ended
September 30,
2010 | | | Year ended
September 30,
2011 | | | Year ended
September 30,
2010 | | | Year ended
September 30,
2011 | | | Year ended
September 30,
2010 | |
| | | | | | | | | | | | | | | | | | | | | | |
| | | | | | | | | | | | | | | | | | | | | | |
| | 3,033,834 | | | | 2,856,226 | | | | 2,272,423 | | | | 1,388,002 | | | | 2,072,102 | | | | 3,610,598 | |
| | 3,349 | | | | 1 | | | | 289 | | | | 1 | | | | 16,427 | | | | 1 | |
| | 67,174 | | | | 1 | | | | 160 | | | | 1 | | | | 92,217 | | | | 1 | |
| | | | | | | | | | | | | | | | | | | | | | |
| | 56,790 | | | | 180,008 | | | | - | | | | 76,839 | | | | 37,972 | | | | 103,381 | |
| | - | | | | - | | | | - | | | | - | | | | - | | | | - | |
| | 3 | | | | - | | | | - | | | | - | | | | 46 | | | | - | |
| | | | | | | | | | | | | | | | | | | | | | |
| | (5,217,067 | ) | | | (4,504,290 | ) | | | (4,436,744 | ) | | | (7,172,818 | ) | | | (4,284,985 | ) | | | (5,619,157 | ) |
| | (1,162 | ) | | | - | | | | (130 | ) | | | - | | | | (2,964 | ) | | | - | |
| | (49,061 | ) | | | - | | | | - | | | | - | | | | (38,036 | ) | | | - | |
| | | | | | | | | | | | | | | | | | | | | | |
| | (2,106,140 | ) | | | (1,468,054 | ) | | | (2,164,002 | ) | | | (5,707,975 | ) | | | (2,107,221 | ) | | | (1,905,176 | ) |
| | 9,580,452 | | | | 11,048,506 | | | | 9,594,072 | | | | 15,302,047 | | | | 8,735,034 | | | | 10,640,210 | |
| | | | | | | | | | | | | | | | | | | | | | |
| | 7,474,312 | | | | 9,580,452 | | | | 7,430,070 | | | | 9,594,072 | | | | 6,627,813 | | | | 8,735,034 | |
| | | | | | | | | | | | | | | | | | | | | | |
$ |
535,609 |
| | $ | 478,549 | | | $ | - | | | $ | - | | | $ | 651,006 | | | $ | 478,024 | |
| | | | | | | | | | | | | | | | | | | | | | |
STATEMENTSOF CHANGESIN NET ASSETS (CONTINUED)
| | | | | | | | |
| | | ICON Telecommunication &
Utilities Fund | |
| | | Year ended
September 30,
2011 | | | Year ended
September 30,
2010 | |
Operations | | | | | | | | |
Net investment income/(loss) | | $ | 938,924 | | | $ | 867,140 | |
Net realized gain/(loss) on investment transactions and foreign currency transactions | | | 3,030,424 | | | | (482,505 | ) |
Change in net unrealized appreciation/(depreciation) on investments and foreign currency transactions | | | (1,633,228 | ) | | | 2,392,792 | |
| | | | | | | | |
Net increase/(decrease) in net assets resulting from operations | | | 2,336,120 | | | | 2,777,427 | |
| | | | | | | | |
Dividends and Distributions to Shareholders | | | | | | | | |
Net investment income | | | | | | | | |
Class S | | | (1,565,042 | ) | | | (595,082 | ) |
Class C | | | (445 | ) | | | - | |
Class A | | | (4,387 | ) | | | - | |
| | | | | | | | |
Net decrease from dividends and distributions | | | (1,569,874 | ) | | | (595,082 | ) |
| | | | | | | | |
Fund Share Transactions | | | | | | | | |
Shares sold | | | | | | | | |
Class S | | | 8,448,631 | | | | 18,118,349 | |
Class C | | | 24,131 | | | | 10 | |
Class A | | | 450,760 | | | | 10 | |
Reinvested dividends and distributions | | | | | | | | |
Class S | | | 1,508,702 | | | | 581,406 | |
Class C | | | 320 | | | | - | |
Class A | | | 4,387 | | | | - | |
Shares repurchased | | | | | | | | |
Class S | | | (21,453,429 | ) | | | (11,393,241 | ) |
Class C | | | - | | | | - | |
Class A | | | - | | | | - | |
| | | | | | | | |
Net Increase/(decrease) from fund share transactions | | | (11,016,498 | ) | | | 7,306,534 | |
| | | | | | | | |
Total net increase/(decrease) in net assets | | | (10,250,252 | ) | | | 9,488,879 | |
Net Assets | | | | | | | | |
Beginning of year | | | 32,035,528 | | | | 22,546,649 | |
| | | | | | | | |
End of year | | $ | 21,785,276 | | | $ | 32,035,528 | |
| | | | | | | | |
| | | | | | | | |
| | | ICON Telecommunication &
Utilities Fund | |
| | | Year ended
September 30,
2011 | | | Year ended
September 30,
2010 | |
Transactions in Fund Shares | | | | | | | | |
Shares sold | | | | | | | | |
Class S | | | 1,349,348 | | | | 3,124,533 | |
Class C | | | 3,803 | | | | 2 | |
Class A | | | 71,186 | | | | 2 | |
Reinvested dividends and distributions | | | | | | | | |
Class S | | | 244,079 | | | | 98,710 | |
Class C | | | 51 | | | | - | |
Class A | | | 703 | | | | - | |
Shares repurchased | | | | | | | | |
Class S | | | (3,416,187 | ) | | | (1,991,136 | ) |
Class C | | | - | | | | - | |
Class A | | | - | | | | - | |
| | | | | | | | |
Net increase/(decrease) | | | (1,747,017 | ) | | | 1,232,111 | |
Shares outstanding, beginning of year | | | 5,212,256 | | | | 3,980,145 | |
| | | | | | | | |
Shares outstanding, end of year | | | 3,465,239 | | | | 5,212,256 | |
| | | | | | | | |
Accumulated undistributed net investment income/(loss) | | $ | 148,439 | | | $ | 779,136 | |
| | | | | | | | |
The accompanying notes are an integral part of the financial statements.
FINANCIAL HIGHLIGHTS
| | | | | | | | | | | | | | | | | | | | | | | | |
| | | | | | Income/(loss) from investment operations | | | Less dividends and | |
| | | Net asset
value,
beginning
of period | | | Net
investment
income/
(loss)(x) | | | Net realized
and unrealized
gains/(losses)
on investments | | | Total from
investment
operations | | | Dividends
from net
investment
income | | | Distributions
from net
realized
gains | |
ICON Consumer Discretionary Fund | | | | | | | | | | | | | | | | | | | | | | | | |
Class S | | | | | | | | | | | | | | | | | | | | | | | | |
Year ended September 30, 2011 | | $ | 7.92 | | | $ | (0.02 | ) | | $ | 0.89 | | | $ | 0.87 | | | $ | - | | | $ | - | |
Year ended September 30, 2010 | | | 6.83 | | | | (0.05 | ) | | | 1.42 | | | | 1.37 | | | | (0.28 | ) | | | - | |
Year ended September 30, 2009 | | | 7.19 | | | | 0.01 | | | | (0.37 | ) | | | (0.36 | ) | | | - | | | | - | |
Year ended September 30, 2008 | | | 12.79 | | | | - | (c) | | | (2.61 | ) | | | (2.61 | ) | | | - | | | | (2.99 | ) |
Year ended September 30, 2007 | | | 12.11 | | | | (0.04 | ) | | | 0.72 | | | | 0.68 | | | | - | | | | - | |
Class C | | | | | | | | | | | | | | | | | | | | | | | | |
Year ended September 30, 2011 | | | 7.92 | | | | (0.12 | ) | | | 0.92 | | | | 0.80 | | | | - | | | | - | |
Class A | | | | | | | | | | | | | | | | | | | | | | | | |
Year ended September 30, 2011 | | | 7.92 | | | | (0.06 | ) | | | 0.89 | | | | 0.83 | | | | - | | | | - | |
ICON Consumer Staples Fund | | | | | | | | | | | | | | | | | | | | | | | | |
Class S | | | | | | | | | | | | | | | | | | | | | | | | |
Year ended September 30, 2011 | | | 8.08 | | | | 0.10 | | | | 0.52 | | | | 0.62 | | | | (0.09 | ) | | | - | |
Year ended September 30, 2010 | | | 7.32 | | | | 0.08 | | | | 0.76 | | | | 0.84 | | | | (0.08 | ) | | | - | |
Year ended September 30, 2009 | | | 7.37 | | | | 0.04 | | | | (0.09 | ) | | | (0.05 | ) | | | - | | | | - | (c) |
Year ended September 30, 2008 | | | 10.62 | | | | 0.03 | | | | (1.60 | ) | | | (1.57 | ) | | | (0.13 | ) | | | (1.55 | ) |
Year ended September 30, 2007 | | | 9.21 | | | | 0.10 | | | | 1.33 | | | | 1.43 | | | | (0.02 | ) | | | - | (c) |
Class C | | | | | | | | | | | | | | | | | | | | | | | | |
Year ended September 30, 2011 | | | 8.08 | | | | 0.04 | | | | 0.50 | | | | 0.54 | | | | (0.09 | ) | | | - | |
Class A | | | | | | | | | | | | | | | | | | | | | | | | |
Year ended September 30, 2011 | | | 8.08 | | | | 0.11 | | | | 0.58 | | | | 0.69 | | | | (0.09 | ) | | | - | |
ICON Energy Fund | | | | | | | | | | | | | | | | | | | | | | | | |
Class S | | | | | | | | | | | | | | | | | | | | | | | | |
Year ended September 30, 2011 | | | 16.69 | | | | 0.16 | | | | - | | | | 0.16 | | | | (0.21 | ) | | | - | |
Year ended September 30, 2010 | | | 16.92 | | | | 0.21 | | | | (0.23 | ) | | | (0.02 | ) | | | (0.21 | ) | | | - | |
Year ended September 30, 2009 | | | 27.06 | | | | 0.21 | | | | (2.41 | ) | | | (2.20 | ) | | | (0.12 | ) | | | (7.82 | ) |
Year ended September 30, 2008 | | | 41.46 | | | | 0.20 | | | | (4.82 | ) | | | (4.62 | ) | | | (0.11 | ) | | | (9.67 | ) |
Year ended September 30, 2007 | | | 31.88 | | | | 0.08 | | | | 12.86 | | | | 12.94 | | | | - | | | | (3.36 | ) |
Class C | | | | | | | | | | | | | | | | | | | | | | | | |
Year ended September 30, 2011 | | | 16.69 | | | | (0.10 | ) | | | 0.09 | | | | (0.01 | ) | | | (0.21 | ) | | | - | |
Class A | | | | | | | | | | | | | | | | | | | | | | | | |
Year ended September 30, 2011 | | | 16.69 | | | | 0.08 | | | | 0.03 | | | | 0.11 | | | | (0.21 | ) | | | - | |
ICON Financial Fund | | | | | | | | | | | | | | | | | | | | | | | | |
Class S | | | | | | | | | | | | | | | | | | | | | | | | |
Year ended September 30, 2011 | | | 5.55 | | | | 0.03 | | | | (0.87 | ) | | | (0.84 | ) | | | (0.02 | ) | | | - | |
Year ended September 30, 2010 | | | 5.97 | | | | 0.02 | | | | (0.32 | ) | | | (0.30 | ) | | | (0.12 | ) | | | - | |
Year ended September 30, 2009 | | | 8.55 | | | | 0.09 | | | | (2.43 | ) | | | (2.34 | ) | | | (0.24 | ) | | | - | |
Year ended September 30, 2008 | | | 14.30 | | | | 0.21 | | | | (4.29 | ) | | | (4.08 | ) | | | (0.14 | ) | | | (1.53 | ) |
Year ended September 30, 2007 | | | 14.47 | | | | 0.13 | | | | 0.45 | | | | 0.58 | | | | (0.15 | ) | | | (0.60 | ) |
Class C | | | | | | | | | | | | | | | | | | | | | | | | |
Year ended September 30, 2011 | | | 5.55 | | | | (0.02 | ) | | | (0.87 | ) | | | (0.89 | ) | | | (0.02 | ) | | | - | |
Class A | | | | | | | | | | | | | | | | | | | | | | | | |
Year ended September 30, 2011 | | | 5.55 | | | | 0.01 | | | | (0.86 | ) | | | (0.85 | ) | | | (0.02 | ) | | | - | |
| | | | | | | | | | | | | | | | | | | | | | | | | | | | | | | | | | |
| distributions | | | | | | | | | | | | Ratio of expenses
to average net assets | | | Ratio of net investment
income/(loss)
to average net assets | | | | |
Total
dividends
and
distributions | | | Net asset
value, end
of period | | | Total
return* | | | Net assets,
end of
period (in
thousands) | | | Before
expense
limitation
and transfer
agent
earnings
credit | | | After
expense
limitation
and transfer
agent
earnings
credit | | | Before
expense
limitation
and transfer
agent
earnings
credit | | | After
expense
limitation
and transfer
agent
earnings
credit | | | Portfolio
turnover
rate(a) | |
| | | | | | | | | | | | | | | | | | | | | | | | | | | | | | | | | | |
| | | | | | | | | | | | | | | | | | | | | | | | | | | | | | | | | | |
| $ | - | | | $ | 8.79 | | | | 10.98 | % | | $ | 34,123 | | | | 1.54 | % | | | 1.54 | %(b) | | | (0.23 | )% | | | (0.23 | )% | | | 107.57 | % |
| | (0.28 | ) | | | 7.92 | | | | 20.61 | % | | | 17,750 | | | | 2.02 | % | | | 2.02 | % | | | (0.62 | )% | | | (0.62 | )% | | | 194.84 | % |
| | - | | | | 6.83 | | | | (5.01 | )% | | | 14,205 | | | | 1.63 | % | | | 1.63 | % | | | 0.14 | % | | | 0.14 | % | | | 200.23 | % |
| | (2.99 | ) | | | 7.19 | | | | (24.21 | )% | | | 72,242 | | | | 1.38 | % | | | 1.38 | % | | | (0.04 | )% | | | (0.04 | )% | | | 218.32 | % |
| | - | | | | 12.79 | | | | 5.62 | % | | | 94,477 | | | | 1.30 | % | | | 1.30 | % | | | (0.31 | )% | | | (0.31 | )% | | | 144.89 | % |
| | | | | | | | | | | | | | | | | | | | | | | | | | | | | | | | | | |
| | - | | | | 8.72 | | | | 10.10 | % | | | 32 | | | | 13.14 | % | | | 2.75 | %(b) | | | (11.73 | )% | | | (1.34 | )% | | | 107.57 | % |
| | | | | | | | | | | | | | | | | | | | | | | | | | | | | | | | | | |
| | - | | | | 8.75 | | | | 10.48 | % | | | 11 | | | | 18.49 | % | | | 1.98 | %(b) | | | (17.17 | )% | | | (0.66 | )% | | | 107.57 | % |
| | | | | | | | | | | | | | | | | | | | | | | | | | | | | | | | | | |
| | | | | | | | | | | | | | | | | | | | | | | | | | | | | | | | | | |
| | (0.09 | ) | | | 8.61 | | | | 7.64 | % | | | 20,614 | | | | 1.57 | % | | | 1.50 | %(b) | | | 1.03 | % | | | 1.10 | % | | | 109.56 | % |
| | (0.08 | ) | | | 8.08 | | | | 11.56 | % | | | 30,640 | | | | 1.54 | % | | | 1.54 | % | | | 0.98 | % | | | 0.98 | % | | | 86.31 | % |
| | - | (c) | | | 7.32 | | | | (0.64 | )% | | | 26,074 | | | | 1.58 | % | | | 1.58 | % | | | 0.72 | % | | | 0.72 | % | | | 134.29 | % |
| | (1.68 | ) | | | 7.37 | | | | (17.40 | )% | | | 42,139 | | | | 1.46 | % | | | 1.46 | % | | | 0.31 | % | | | 0.31 | % | | | 132.40 | % |
| | (0.02 | ) | | | 10.62 | | | | 15.61 | % | | | 31,571 | | | | 1.41 | % | | | 1.41 | % | | | 1.02 | % | | | 1.02 | % | | | 150.72 | % |
| | | | | | | | | | | | | | | | | | | | | | | | | | | | | | | | | | |
| | (0.09 | ) | | | 8.53 | | | | 6.65 | % | | | 55 | | | | 7.00 | % | | | 2.50 | %(b) | | | (4.09 | )% | | | 0.41 | % | | | 109.56 | % |
| | | | | | | | | | | | | | | | | | | | | | | | | | | | | | | | | | |
| | (0.09 | ) | | | 8.68 | | | | 8.52 | % | | | 24 | | | | 7.60 | % | | | 1.75 | %(b) | | | (4.60 | )% | | | 1.25 | % | | | 109.56 | % |
| | | | | | | | | | | | | | | | | | | | | | | | | | | | | | | | | | |
| | | | | | | | | | | | | | | | | | | | | | | | | | | | | | | | | | |
| | (0.21 | ) | | | 16.64 | | | | 0.80 | % | | | 556,393 | | | | 1.20 | % | | | 1.20 | %(b) | | | 0.77 | % | | | 0.77 | % | | | 88.31 | % |
| | (0.21 | ) | | | 16.69 | | | | (0.17 | )% | | | 510,181 | | | | 1.24 | % | | | 1.24 | % | | | 1.26 | % | | | 1.26 | % | | | 169.86 | % |
| | (7.94 | ) | | | 16.92 | | | | (1.73 | )% | | | 560,555 | | | | 1.24 | % | | | 1.24 | % | | | 1.39 | % | | | 1.39 | % | | | 186.47 | % |
| | (9.78 | ) | | | 27.06 | | | | (14.62 | )% | | | 492,637 | | | | 1.16 | % | | | 1.16 | % | | | 0.59 | % | | | 0.59 | % | | | 119.87 | % |
| | (3.36 | ) | | | 41.46 | | | | 43.64 | % | | | 816,075 | | | | 1.17 | %(d) | | | 1.17 | %(d) | | | 0.24 | %(d) | | | 0.24 | %(d) | | | 54.75 | % |
| | | | | | | | | | | | | | | | | | | | | | | | | | | | | | | | | | |
| | (0.21 | ) | | | 16.47 | | | | (0.23 | )% | | | 4,718 | | | | 2.47 | % | | | 2.47 | %(b) | | | (0.47 | )% | | | (0.47 | )% | | | 88.31 | % |
| | | | | | | | | | | | | | | | | | | | | | | | | | | | | | | | | | |
| | (0.21 | ) | | | 16.59 | | | | 0.49 | % | | | 6,005 | | | | 1.70 | % | | | 1.70 | %(b) | | | 0.38 | % | | | 0.38 | % | | | 88.31 | % |
| | | | | | | | | | | | | | | | | | | | | | | | | | | | | | | | | | |
| | | | | | | | | | | | | | | | | | | | | | | | | | | | | | | | | | |
| | (0.02 | ) | | | 4.69 | | | | (15.18 | )% | | | 32,432 | | | | 1.40 | % | | | 1.40 | %(b) | | | 0.44 | % | | | 0.44 | % | | | 100.23 | % |
| | (0.12 | ) | | | 5.55 | | | | (5.11 | )% | | | 58,750 | | | | 1.43 | % | | | 1.43 | % | | | 0.36 | % | | | 0.36 | % | | | 143.36 | % |
| | (0.24 | ) | | | 5.97 | | | | (26.80 | )% | | | 82,067 | | | | 1.42 | % | | | 1.42 | % | | | 1.70 | % | | | 1.70 | % | | | 194.00 | % |
| | (1.67 | ) | | | 8.55 | | | | (31.93 | )% | | | 128,175 | | | | 1.22 | % | | | 1.22 | % | | | 1.94 | % | | | 1.94 | % | | | 220.83 | % |
| | (0.75 | ) | | | 14.30 | | | | 3.84 | % | | | 200,089 | | | | 1.21 | % | | | 1.21 | % | | | 0.86 | % | | | 0.86 | % | | | 93.04 | % |
| | | | | | | | | | | | | | | | | | | | | | | | | | | | | | | | | | |
| | (0.02 | ) | | | 4.64 | | | | (16.08 | )% | | | 9 | | | | 35.28 | % | | | 2.50 | %(b) | | | (33.22 | )% | | | (0.44 | )% | | | 100.23 | % |
| | | | | | | | | | | | | | | | | | | | | | | | | | | | | | | | | | |
| | (0.02 | ) | | | 4.68 | | | | (15.36 | )% | | | 24 | | | | 7.37 | % | | | 1.75 | %(b) | | | (5.50 | )% | | | 0.12 | % | | | 100.23 | % |
FINANCIAL HIGHLIGHTS (CONTINUED)
| | | | | | | | | | | | | | | | | | | | | | | | |
| | | | | | Income/(loss) from investment operations | | | Less dividends and | |
| | | Net asset
value,
beginning
of period | | | Net
investment
income/
(loss)(x) | | | Net realized
and unrealized
gains/(losses)
on investments | | | Total from
investment
operations | | | Dividends
from net
investment
income | | | Distributions
from net
realized
gains | |
ICON Healthcare Fund | | | | | | | | | | | | | | | | | | | | | | | | |
Class S | | | | | | | | | | | | | | | | | | | | | | | | |
Year ended September 30, 2011 | | $ | 12.78 | | | $ | 0.12 | | | $ | 0.73 | | | $ | 0.85 | | | $ | (0.07 | ) | | $ | - | |
Year ended September 30, 2010 | | | 12.29 | | | | 0.04 | | | | 0.63 | | | | 0.67 | | | | (0.18 | ) | | | - | |
Year ended September 30, 2009 | | | 13.49 | | | | 0.08 | | | | (1.28 | ) | | | (1.20 | ) | | | - | | | | - | |
Year ended September 30, 2008 | | | 17.68 | | | | (0.02 | ) | | | (2.65 | ) | | | (2.67 | ) | | | - | | | | (1.52 | ) |
Year ended September 30, 2007 | | | 17.95 | | | | - | (c) | | | 1.19 | | | | 1.19 | | | | - | | | | (1.46 | ) |
Class C | | | | | | | | | | | | | | | | | | | | | | | | |
Year ended September 30, 2011 | | | 12.78 | | | | (0.01 | ) | | | 0.73 | | | | 0.72 | | | | (0.07 | ) | | | - | |
Class A | | | | | | | | | | | | | | | | | | | | | | | | |
Year ended September 30, 2011 | | | 12.78 | | | | 0.12 | | | | 0.70 | | | | 0.82 | | | | (0.07 | ) | | | - | |
ICON Industrials Fund | | | | | | | | | | | | | | | | | | | | | | | | |
Class S | | | | | | | | | | | | | | | | | | | | | | | | |
Year ended September 30, 2011 | | | 7.47 | | | | 0.07 | | | | (0.67 | ) | | | (0.60 | ) | | | (0.07 | ) | | | - | |
Year ended September 30, 2010 | | | 6.38 | | | | 0.05 | | | | 1.17 | | | | 1.22 | | | | (0.13 | ) | | | - | |
Year ended September 30, 2009 | | | 8.16 | | | | 0.08 | | | | (1.82 | ) | | | (1.74 | ) | | | (0.04 | ) | | | - | |
Year ended September 30, 2008 | | | 10.77 | | | | 0.05 | | | | (2.32 | ) | | | (2.27 | ) | | | (0.01 | ) | | | (0.33 | ) |
Year ended September 30, 2007 | | | 13.22 | | | | 0.02 | | | | 2.63 | | | | 2.65 | | | | - | (c) | | | (5.10 | ) |
Class C | | | | | | | | | | | | | | | | | | | | | | | | |
Year ended September 30, 2011 | | | 7.47 | | | | (0.02 | ) | | | (0.66 | ) | | | (0.68 | ) | | | (0.07 | ) | | | - | |
Class A | | | | | | | | | | | | | | | | | | | | | | | | |
Year ended September 30, 2011 | | | 7.47 | | | | 0.05 | | | | (0.69 | ) | | | (0.64 | ) | | | (0.07 | ) | | | - | |
ICON Information Technology Fund | | | | | | | | | | | | | | | | | | | | | | | | |
Class S | | | | | | | | | | | | | | | | | | | | | | | | |
Year ended September 30, 2011 | | | 8.05 | | | | (0.04 | ) | | | 0.21 | | | | 0.17 | | | | - | | | | - | |
Year ended September 30, 2010 | | | 7.79 | | | | (0.05 | ) | | | 0.35 | | | | 0.30 | | | | (0.04 | ) | | | - | |
Year ended September 30, 2009 | | | 7.86 | | | | (0.01 | ) | | | (0.06 | ) | | | (0.07 | ) | | | - | | | | - | |
Year ended September 30, 2008 | | | 11.02 | | | | (0.04 | ) | | | (3.12 | ) | | | (3.16 | ) | | | - | | | | - | |
Year ended September 30, 2007 | | | 8.72 | | | | (0.05 | ) | | | 2.35 | | | | 2.30 | | | | - | | | | - | |
Class C | | | | | | | | | | | | | | | | | | | | | | | | |
Year ended September 30, 2011 | | | 8.05 | | | | (0.13 | ) | | | 0.21 | | | | 0.08 | | | | - | | | | - | |
Class A | | | | | | | | | | | | | | | | | | | | | | | | |
Year ended September 30, 2011 | | | 8.05 | | | | (0.05 | ) | | | 0.20 | | | | 0.15 | | | | - | | | | - | |
ICON Materials Fund | | | | | | | | | | | | | | | | | | | | | | | | |
Class S | | | | | | | | | | | | | | | | | | | | | | | | |
Year ended September 30, 2011 | | | 10.06 | | | | 0.08 | | | | (1.08 | ) | | | (1.00 | ) | | | (0.06 | ) | | | - | |
Year ended September 30, 2010 | | | 8.93 | | | | 0.05 | | | | 1.18 | | | | 1.23 | | | | (0.10 | ) | | | - | |
Year ended September 30, 2009 | | | 9.81 | | | | 0.11 | | | | (0.91 | ) | | | (0.80 | ) | | | (0.08 | ) | | | - | |
Year ended September 30, 2008 | | | 15.39 | | | | 0.08 | | | | (3.23 | ) | | | (3.15 | ) | | | (0.06 | ) | | | (2.37 | ) |
Year ended September 30, 2007 | | | 11.67 | | | | 0.08 | | | | 5.10 | | | | 5.18 | | | | (0.15 | ) | | | (1.31 | ) |
Class C | | | | | | | | | | | | | | | | | | | | | | | | |
Year ended September 30, 2011 | | | 10.06 | | | | (0.03 | ) | | | (1.05 | ) | | | (1.08 | ) | | | (0.06 | ) | | | - | |
Class A | | | | | | | | | | | | | | | | | | | | | | | | |
Year ended September 30, 2011 | | | 10.06 | | | | 0.05 | | | | (1.08 | ) | | | (1.03 | ) | | | (0.06 | ) | | | - | |
| | | | | | | | | | | | | | | | | | | | | | | | | | | | | | | | | | |
| distributions | | | | | | | | | | | | Ratio of expenses
to average net assets | | | Ratio of net investment
income/(loss)
to average net assets | | | | |
Total
dividends
and
distributions | | | Net asset
value, end
of period | | | Total
return* | | | Net assets,
end of
period (in
thousands) | | | Before
expense
limitation
and transfer
agent
earnings
credit | | | After
expense
limitation
and transfer
agent
earnings
credit | | | Before
expense
limitation
and transfer
agent
earnings
credit | | | After
expense
limitation
and transfer
agent
earnings
credit | | | Portfolio
turnover
rate(a) | |
| | | | | | | | | | | | | | | | | | | | | | | | | | | | | | | | | | |
| | | | | | | | | | | | | | | | | | | | | | | | | | | | | | | | | | |
| $ | (0.07 | ) | | $ | 13.56 | | | | 6.66 | % | | $ | 75,116 | | | | 1.36 | % | | | 1.36 | %(b) | | | 0.85 | % | | | 0.85 | % | | | 83.63 | % |
| | (0.18 | ) | | | 12.78 | | | | 5.39 | % | | | 72,554 | | | | 1.36 | % | | | 1.36 | % | | | 0.31 | % | | | 0.31 | % | | | 102.42 | % |
| | - | | | | 12.29 | | | | (8.90 | )% | | | 110,605 | | | | 1.37 | % | | | 1.37 | % | | | 0.74 | % | | | 0.74 | % | | | 105.75 | % |
| | (1.52 | ) | | | 13.49 | | | | (16.43 | )% | | | 160,083 | | | | 1.25 | % | | | 1.25 | % | | | (0.12 | )% | | | (0.12 | )% | | | 61.44 | % |
| | (1.46 | ) | | | 17.68 | | | | 7.17 | % | | | 473,287 | | | | 1.20 | %(d) | | | 1.20 | %(d) | | | 0.01 | %(d) | | | 0.01 | %(d) | | | 24.56 | % |
| | | | | | | | | | | | | | | | | | | | | | | | | | | | | | | | | | |
| | (0.07 | ) | | | 13.43 | | | | 5.64 | % | | | 22 | | | | 31.38 | % | | | 2.50 | %(b) | | | (28.98 | )% | | | (0.10 | )% | | | 83.63 | % |
| | | | | | | | | | | | | | | | | | | | | | | | | | | | | | | | | | |
| | (0.07 | ) | | | 13.53 | | | | 6.42 | % | | | 126 | | | | 7.15 | % | | | 1.75 | %(b) | | | (4.58 | )% | | | 0.82 | % | | | 83.63 | % |
| | | | | | | | | | | | | | | | | | | | | | | | | | | | | | | | | | |
| | | | | | | | | | | | | | | | | | | | | | | | | | | | | | | | | | |
| | (0.07 | ) | | | 6.80 | | | | (8.21 | )% | | | 50,653 | | | | 1.36 | % | | | 1.36 | %(b) | | | 0.80 | % | | | 0.80 | % | | | 55.87 | % |
| | (0.13 | ) | | | 7.47 | | | | 19.40 | % | | | 71,607 | | | | 1.40 | % | | | 1.40 | % | | | 0.73 | % | | | 0.73 | % | | | 54.34 | % |
| | (0.04 | ) | | | 6.38 | | | | (21.25 | )% | | | 70,535 | | | | 1.37 | % | | | 1.37 | % | | | 1.39 | % | | | 1.39 | % | | | 96.24 | % |
| | (0.34 | ) | | | 8.16 | | | | (21.72 | )% | | | 125,286 | | | | 1.25 | % | | | 1.25 | % | | | 0.55 | % | | | 0.55 | % | | | 143.40 | % |
| | (5.10 | ) | | | 10.77 | | | | 28.73 | % | | | 155,739 | | | | 1.27 | %(d) | | | 1.27 | %(d) | | | 0.16 | %(d) | | | 0.16 | %(d) | | | 125.44 | % |
| | | | | | | | | | | | | | | | | | | | | | | | | | | | | | | | | | |
| | (0.07 | ) | | | 6.72 | | | | (9.29 | )% | | | 15 | | | | 13.56 | % | | | 2.50 | %(b) | | | (11.29 | )% | | | (0.23 | )% | | | 55.87 | % |
| | | | | | | | | | | | | | | | | | | | | | | | | | | | | | | | | | |
| | (0.07 | ) | | | 6.76 | | | | (8.75 | )% | | | 122 | | | | 3.46 | % | | | 1.75 | %(b) | | | (1.12 | )% | | | 0.59 | % | | | 55.87 | % |
| | | | | | | | | | | | | | | | | | | | | | | | | | | | | | | | | | |
| | | | | | | | | | | | | | | | | | | | | | | | | | | | | | | | | | |
| | - | | | | 8.22 | | | | 2.11 | % | | | 61,081 | | | | 1.34 | % | | | 1.34 | %(b) | | | (0.40 | )% | | | (0.40 | )% | | | 44.84 | % |
| | (0.04 | ) | | | 8.05 | | | | 3.91 | % | | | 77,269 | | | | 1.37 | % | | | 1.37 | % | | | (0.58 | )% | | | (0.58 | )% | | | 68.32 | % |
| | - | | | | 7.79 | | | | (0.89 | )% | | | 119,250 | | | | 1.38 | % | | | 1.38 | % | | | (0.09 | )% | | | (0.09 | )% | | | 89.87 | % |
| | - | | | | 7.86 | | | | (28.68 | )% | | | 178,450 | | | | 1.24 | % | | | 1.24 | % | | | (0.41 | )% | | | (0.41 | )% | | | 171.22 | % |
| | - | | | | 11.02 | | | | 26.38 | % | | | 266,965 | | | | 1.23 | % | | | 1.23 | % | | | (0.49 | )% | | | (0.49 | )% | | | 78.66 | % |
| | | | | | | | | | | | | | | | | | | | | | | | | | | | | | | | | | |
| | - | | | | 8.13 | | | | 0.99 | % | | | 1 | | | | 115.00 | % | | | 2.51 | %(b) | | | (113.96 | )% | | | (1.47 | )% | | | 44.84 | % |
| | | | | | | | | | | | | | | | | | | | | | | | | | | | | | | | | | |
| | - | | | | 8.20 | | | | 1.86 | % | | | 1 | | | | 215.56 | % | | | 1.75 | %(b) | | | (214.36 | )% | | | (0.55 | )% | | | 44.84 | % |
| | | | | | | | | | | | | | | | | | | | | | | | | | | | | | | | | | |
| | | | | | | | | | | | | | | | | | | | | | | | | | | | | | | | | | |
| | (0.06 | ) | | | 9.00 | | | | (10.07 | )% | | | 59,068 | | | | 1.33 | % | | | 1.33 | %(b) | | | 0.73 | % | | | 0.73 | % | | | 62.97 | % |
| | (0.10 | ) | | | 10.06 | | | | 13.92 | % | | | 87,856 | | | | 1.38 | % | | | 1.38 | % | | | 0.54 | % | | | 0.54 | % | | | 70.80 | % |
| | (0.08 | ) | | | 8.93 | | | | (7.87 | )% | | | 95,028 | | | | 1.40 | % | | | 1.40 | % | | | 1.50 | % | | | 1.50 | % | | | 134.88 | % |
| | (2.43 | ) | | | 9.81 | | | | (23.79 | )% | | | 118,522 | | | | 1.26 | % | | | 1.26 | % | | | 0.60 | % | | | 0.60 | % | | | 111.26 | % |
| | (1.46 | ) | | | 15.39 | | | | 48.63 | % | | | 131,321 | | | | 1.33 | % | | | 1.33 | % | | | 0.59 | % | | | 0.59 | % | | | 109.10 | % |
| | | | | | | | | | | | | | | | | | | | | | | | | | | | | | | | | | |
| | (0.06 | ) | | | 8.92 | | | | (10.87 | )% | | | 120 | | | | 4.11 | % | | | 2.50 | %(b) | | | (1.91 | )% | | | (0.30 | )% | | | 62.97 | % |
| | | | | | | | | | | | | | | | | | | | | | | | | | | | | | | | | | |
| | (0.06 | ) | | | 8.97 | | | | (10.37 | )% | | | 487 | | | | 2.26 | % | | | 1.74 | %(b) | | | (0.07 | )% | | | 0.45 | % | | | 62.97 | % |
FINANCIAL HIGHLIGHTS (CONTINUED)
| | | | | | | | | | | | | | | | | | | | | | | | |
| | | | | | Income/(loss) from investment operations | | | Less dividends and | |
| | | Net asset
value,
beginning
of period | | | Net
investment
income/
(loss)(x) | | | Net realized
and unrealized
gains/(losses)
on investments | | | Total from
investment
operations | | | Dividends
from net
investment
income | | | Distributions
from net
realized
gains | |
ICON Telecommunication & Utilities Fund | | | | | | | | | | | | | | | | | | | | | | | | |
Class S | | | | | | | | | | | | | | | | | | | | | | | | |
Year ended September 30, 2011 | | $ | 6.15 | | | $ | 0.24 | | | $ | 0.31 | | | $ | 0.55 | | | $ | (0.41 | ) | | $ | - | |
Year ended September 30, 2010 | | | 5.66 | | | | 0.19 | | | | 0.44 | | | | 0.63 | | | | (0.14 | ) | | | - | |
Year ended September 30, 2009 | | | 6.34 | | | | 0.14 | | | | (0.44 | ) | | | (0.30 | ) | | | (0.38 | ) | | | - | |
Year ended September 30, 2008 | | | 9.20 | | | | 0.14 | | | | (2.03 | ) | | | (1.89 | ) | | | (0.06 | ) | | | (0.91 | ) |
Year ended September 30, 2007 | | | 7.66 | | | | 0.10 | | | | 2.18 | | | | 2.28 | | | | (0.11 | ) | | | (0.63 | ) |
Class C | | | | | | | | | | | | | | | | | | | | | | | | |
Year ended September 30, 2011 | | | 6.15 | | | | 0.25 | | | | 0.22 | | | | 0.47 | | | | (0.41 | ) | | | - | |
Class A | | | | | | | | | | | | | | | | | | | | | | | | |
Year ended September 30, 2011 | | | 6.15 | | | | 0.34 | | | | 0.17 | | | | 0.51 | | | | (0.42 | ) | | | - | |
| (x) | Calculated using the average shares method. | |
| * | The total return calculation is for the period indicated and excludes any sales charges. | |
| (a) | Portfolio turnover is calculated at the Fund level. | |
| (b) | Effective January 1, 2011, the Fund’s operating expenses, not including interest expense, are contractually limited to the amounts discussed in Note 3. The ratios in these financial highlights reflect the limitation, including interest expense. | |
| (c) | Amount less than $0.005. | |
| (d) | Ratios include transfer agent earnings credits received. These earnings credits reduced the net expense ratio and increased the net income ratio by 0.01%. | |
The accompanying notes are an integral part of the financial statements.
| | | | | | | | | | | | | | | | | | | | | | | | | | | | | | | | | | |
| distributions | | | | | | | | | | | | Ratio of expenses
to average net assets | | | Ratio of net investment
income/(loss)
to average net assets | | | | |
Total
dividends
and
distributions | | | Net asset
value, end
of period | | | Total
return* | | | Net assets,
end of
period (in
thousands) | | | Before
expense
limitation
and transfer
agent
earnings
credit | | | After
expense
limitation
and transfer
agent
earnings
credit | | | Before
expense
limitation
and transfer
agent
earnings
credit | | | After
expense
limitation
and transfer
agent
earnings
credit | | | Portfolio
turnover
rate(a) | |
| | | | | | | | | | | | | | | | | | | | | | | | | | | | | | | | | | |
| | | | | | | | | | | | | | | | | | | | | | | | | | | | | | | | | | |
| $ | (0.41 | ) | | $ | 6.29 | | | | 9.16 | % | | $ | 21,313 | | | | 1.61 | % | | | 1.51 | %(b) | | | 3.75 | % | | | 3.85 | % | | | 114.73 | % |
| | (0.14 | ) | | | 6.15 | | | | 11.16 | % | | | 32,036 | | | | 1.67 | % | | | 1.67 | % | | | 3.28 | % | | | 3.28 | % | | | 84.45 | % |
| | (0.38 | ) | | | 5.66 | | | | (4.39 | )% | | | 22,547 | | | | 1.70 | % | | | 1.70 | % | | | 2.70 | % | | | 2.70 | % | | | 90.27 | % |
| | (0.97 | ) | | | 6.34 | | | | (23.01 | )% | | | 30,335 | | | | 1.35 | % | | | 1.35 | % | | | 1.74 | % | | | 1.74 | % | | | 102.65 | % |
| | (0.74 | ) | | | 9.20 | | | | 31.60 | % | | | 109,509 | | | | 1.33 | % | | | 1.33 | % | | | 1.20 | % | | | 1.20 | % | | | 154.99 | % |
| | | | | | | | | | | | | | | | | | | | | | | | | | | | | | | | | | |
| | (0.41 | ) | | | 6.21 | | | | 7.77 | % | | | 24 | | | | 122.08 | % | | | 2.50 | %(b) | | | (115.58 | )% | | | 4.00 | % | | | 114.73 | % |
| | | | | | | | | | | | | | | | | | | | | | | | | | | | | | | | | | |
| | (0.42 | ) | | | 6.24 | | | | 8.56 | % | | | 449 | | | | 185.34 | % | | | 1.75 | %(b) | | | (178.27 | )% | | | 5.32 | % | | | 114.73 | % |
NOTESTO FINANCIAL STATEMENTS
SEPTEMBER 30, 2011
1. Organization
The ICON Consumer Discretionary Fund, ICON Consumer Staples Fund (formerly, ICON Leisure and Consumer Staples Fund), ICON Energy Fund, ICON Financial Fund, ICON Healthcare Fund, ICON Industrials Fund, ICON Information Technology Fund, ICON Materials Fund, and ICON Telecommunication & Utilities Fund are series funds (individually a “Fund” and collectively, the “Funds”). The Funds are part of the ICON Funds (the “Trust”), a Massachusetts business trust registered under the Investment Company Act of 1940, as amended (the “1940 Act”) as an open-end investment management company. As of September 30, 2011, each Fund has three classes of shares: Class S, Class C and Class A. Class A and Class C shares commenced operations on September 30, 2010. All classes have equal rights as to earnings, assets, and voting privileges except that each Class may bear different distribution fees, registration costs, legal costs, mailing and printing costs and shareholder servicing costs and each Class has exclusive voting rights with respect to its distribution plan. There are currently eight other active Funds within the Trust. Those Funds are covered by separate prospectuses and shareholder reports.
Each Fund is authorized to issue an unlimited number of no par shares. The Funds invest primarily in securities of companies whose principal business activities fall within specific sectors and industries. The investment objective of each Fund is to provide long-term capital appreciation.
The Funds may have elements of risk, including the risk of loss of principal. There is no assurance that the investment process will consistently lead to successful results. An investment in a non-diversified sector fund may involve greater risk and volatility than a more diversified fund. Investments in foreign securities and currency transactions may involve certain considerations and risks not typically associated with those of U.S. dollar-denominated transactions as a result of, among other factors, the possibility of lower government supervision and regulation of foreign securities markets and the possibility of political or economic instability. Financial statements of foreign companies are governed by different accounting, auditing, and financial standards than U.S. companies and may be less transparent and uniform than in the United States. Many corporate governance standards, which help ensure the integrity of public information in the United States, may not exist in some foreign countries. In general, there may be less governmental supervision of foreign stock exchanges and securities brokers and issuers. There are also risks associated with small-and mid-cap investing, including limited product lines, less liquidity and small market share.
| | |
| 86 | | NOTESTO FINANCIAL STATEMENTS |
In the normal course of business, the Funds may enter into various agreements that provide for general indemnifications. Each Fund’s maximum exposure under these arrangements is unknown as any potential exposure involving future claims that may be made against each Fund is unknown. However, based on experience, the Funds expect the risk of loss to be minimal.
2. Significant Accounting Policies
The following is a summary of significant accounting policies consistently followed by the Funds in the preparation of their financial statements. The preparation of financial statements in conformity with accounting principles generally accepted in the United States of America requires management to make certain estimates and assumptions that affect the reported amounts of assets and liabilities, disclosure of contingent assets and liabilities at the date of the financial statements, and the reported amounts of income and expenses during the reporting period. Actual results may differ from these estimates.
Investment Valuation
The Funds’ securities and other assets, excluding options on securities indexes, are valued as of the closing price at the close of regular trading on the New York Stock Exchange (the “NYSE”) (normally 4 p.m. Eastern Standard Time) each day the NYSE is open, except that securities traded primarily on the NASDAQ Stock Market (“NASDAQ”) are normally valued by the Funds at the NASDAQ Official Closing Price provided by NASDAQ each business day. Options on securities indexes are valued at the close of the Chicago Board Options Exchange (normally 4:15 p.m. Eastern Standard Time) on each day the New York Stock Exchange is open for trading.
The Funds use pricing services to obtain the market value of securities in their portfolios; if a pricing service is not able to provide a price, or the pricing service’s valuation quote is considered inaccurate or does not reflect the market value of the security, prices may be obtained through market quotations from independent broker/dealers. If market quotations from these sources are not readily available, the Funds’ securities or other assets are valued at fair value as determined in good faith by the Funds’ Board of Trustees (“Board”) or pursuant to procedures approved by the Board.
Lacking any sales that day, a security is valued at the current closing bid price (or yield equivalent thereof) or based on quotes obtained from dealers
| | | | |
| NOTESTO FINANCIAL STATEMENTS | | | 87 | |
NOTESTO FINANCIAL STATEMENTS (CONTINUED)
making a market for the security. Options are valued at their closing mid-price on the market with the most volume. Mid-price is the average of the closing bid and closing ask prices. Debt securities with a remaining maturity of greater than 60 days are valued in accordance with the evaluated bid price supplied by the pricing service. The evaluated bid price supplied by the pricing service is based upon a matrix valuation system which considers such factors as security prices, yields, maturities and ratings. Short-term debt securities with remaining maturities of 60 days or less are generally valued at amortized cost or original cost plus accrued interest, which approximates market value. Currency rates as of the close of the NYSE are used to convert foreign security values into U.S. dollars.
The Funds’ securities that traded in countries outside of the Western Hemisphere are fair valued daily by utilizing the quotations of an independent pricing service, unless the Board determines that use of another valuation methodology is appropriate. The purposes of daily fair valuation are to avoid stale prices and to take into account, among other things, any significant events occurring after the close of foreign markets. The pricing service uses statistical analyses and quantitative models to adjust local market prices using factors such as subsequent movements and changes in the prices of indexes, securities and exchange rates in other markets to determine fair value as of the time a Fund calculates its net asset value (“NAV”). The valuation assigned to fair-value securities for purposes of calculating a Fund’s NAV may differ from the security’s most recent closing market price and from the prices used by other mutual funds to calculate their NAVs.
Investments in other open-end investment companies are valued at net asset value.
Various inputs are used to determine the value of the Funds’ investments. These inputs are summarized in the three broad levels listed below:
Level 1 — quoted prices in active markets for identical securities.
Level 2 — significant observable inputs other than Level 1 quoted prices (including, but not limited to, quoted prices for similar securities, interest rates, prepayment speeds, and credit risk).
Level 3 — significant unobservable inputs.
Observable inputs are those based on market data obtained from sources independent of the Funds, and unobservable inputs reflect the Funds’ own assumptions based on the best information available. The input levels are
| | |
| 88 | | NOTESTO FINANCIAL STATEMENTS |
not necessarily an indication of the risk or liquidity associated with investments at that level. For example, non-U.S. equity securities actively traded in foreign markets generally are reflected in Level 2 despite the availability of closing prices, because the Funds evaluate and determine whether those closing prices reflect fair value at the close of the NYSE or require adjustment, as described above. The following table summarizes the Funds’ investments, based on the inputs used to determine their values on September 30, 2011:
| | | | | | | | | | | | |
| | | Level 1 | | | Level 2 | | | Total | |
ICON Consumer Discretionary Fund* | | | | | | | | | | | | |
Assets | | | | | | | | | | | | |
Common Stocks | | $ | 32,707,262 | | | $ | - | | | $ | 32,707,262 | |
Collateral for Securities on Loan | | | - | | | | 1,322,350 | | | | 1,322,350 | |
Short-Term Investments | | | - | | | | 1,320,613 | | | | 1,320,613 | |
| | | | | | | | | | | | |
Total | | $ | 32,707,262 | | | $ | 2,642,963 | | | $ | 35,350,225 | |
| | | | | | | | | | | | |
ICON Consumer Staples Fund* | | | | | | | | | | | | |
Assets | | | | | | | | | | | | |
Common Stocks | | $ | 20,626,950 | | | $ | - | | | $ | 20,626,950 | |
Collateral for Securities on Loan | | | - | | | | 42,195 | | | | 42,195 | |
Short-Term Investments | | | - | | | | 1,592,203 | | | | 1,592,203 | |
| | | | | | | | | | | | |
Total | | $ | 20,626,950 | | | $ | 1,634,398 | | | $ | 22,261,348 | |
| | | | | | | | | | | | |
ICON Energy Fund* | | | | | | | | | | | | |
Assets | | | | | | | | | | | | |
Common Stocks | | $ | 560,555,791 | | | $ | - | | | $ | 560,555,791 | |
Collateral for Securities on Loan | | | - | | | | 16,866,358 | | | | 16,866,358 | |
Short-Term Investments | | | - | | | | 1,692,020 | | | | 1,692,020 | |
| | | | | | | | | | | | |
Total | | $ | 560,555,791 | | | $ | 18,558,378 | | | $ | 579,114,169 | |
| | | | | | | | | | | | |
ICON Financial Fund* | | | | | | | | | | | | |
Assets | | | | | | | | | | | | |
Common Stocks | | $ | 32,210,610 | | | $ | - | | | $ | 32,210,610 | |
| | | | | | | | | | | | |
Total | | $ | 32,210,610 | | | $ | - | | | $ | 32,210,610 | |
| | | | | | | | | | | | |
ICON Healthcare Fund* | | | | | | | | | | | | |
Assets | | | | | | | | | | | | |
Common Stocks | | $ | 74,980,928 | | | $ | - | | | $ | 74,980,928 | |
Collateral for Securities on Loan | | | - | | | | 1,139,111 | | | | 1,139,111 | |
| | | | | | | | | | | | |
Total | | $ | 74,980,928 | | | $ | 1,139,111 | | | $ | 76,120,039 | |
| | | | | | | | | | | | |
| | | | |
| NOTESTO FINANCIAL STATEMENTS | | | 89 | |
NOTESTO FINANCIAL STATEMENTS (CONTINUED)
| | | | | | | | | | | | |
| | | Level 1 | | | Level 2 | | | Total | |
ICON Industrials Fund* | | | | | | | | | | | | |
Assets | | | | | | | | | | | | |
Common Stocks | | $ | 50,720,520 | | | $ | - | | | $ | 50,720,520 | |
Collateral for Securities on Loan | | | - | | | | 1,563,306 | | | | 1,563,306 | |
| | | | | | | | | | | | |
Total | | $ | 50,720,520 | | | $ | 1,563,306 | | | $ | 52,283,826 | |
| | | | | | | | | | | | |
ICON Information Technology Fund* | | | | | | | | | | | | |
Assets | | | | | | | | | | | | |
Common Stocks | | $ | 61,020,776 | | | $ | - | | | $ | 61,020,776 | |
Collateral for Securities on Loan | | | - | | | | 1,204,705 | | | | 1,204,705 | |
| | | | | | | | | | | | |
Total | | $ | 61,020,776 | | | $ | 1,204,705 | | | $ | 62,225,481 | |
| | | | | | | | | | | | |
ICON Materials Fund* | | | | | | | | | | | | |
Assets | | | | | | | | | | | | |
Common Stocks | | $ | 59,033,760 | | | $ | - | | | $ | 59,033,760 | |
| | | | | | | | | | | | |
Total | | $ | 59,033,760 | | | $ | - | | | $ | 59,033,760 | |
| | | | | | | | | | | | |
ICON Telecommunication & Utilities Fund* | | | | | | | | | |
Assets | | | | | | | | | | | | |
Common Stocks | | $ | 20,603,199 | | | $ | - | | | $ | 20,603,199 | |
Short-Term Investments | | | - | | | | 500,770 | | | | 500,770 | |
| | | | | | | | | | | | |
Total | | $ | 20,603,199 | | | $ | 500,770 | | | $ | 21,103,969 | |
| | | | | | | | | | | | |
| * | Please refer to the Schedule of Investments and the Sector/Industry Classification tables for additional security details. |
There were no Level 3 securities held in any of the Funds at September 30, 2011.
For the year ended September 30, 2011, there was no significant security transfer activity between Level 1 and Level 2.
Foreign Currency Translation
The accounting records of the Funds are maintained in U.S. dollars. Investment securities and other assets and liabilities denominated in a foreign currency are translated daily into U.S. dollars at the prevailing rates of exchange. Income and expenses are translated into U.S. dollars at the prevailing exchange rate on the respective dates of the transactions. Purchases and sales of securities are translated into U.S. dollars at the contractual currency exchange rates established at the time of each trade.
The Funds do not isolate that portion of the results of operations resulting from changes in foreign exchange rates on investments from the fluctuations
| | |
| 90 | | NOTESTO FINANCIAL STATEMENTS |
arising from changes in market prices of securities held. Net unrealized appreciation or depreciation on investments and foreign currency translations arise from changes in the value of assets and liabilities, resulting from changes in the exchange rates and changes in market prices of securities held.
Options Transactions
The Funds’ use of derivatives for the year ended September 30, 2011 was limited to purchased put options.
Each Fund may purchase and/or write (sell) call and put options on any security in which it may invest. The Funds utilize options to hedge against changes in market conditions and to provide market exposure while trying to reduce transaction costs.
Option contracts involve market risk, liquidity risk and can be highly volatile. Should prices of securities or securities indexes move in an unexpected manner, the Funds may not achieve the desired benefits and may realize losses and thus be in a worse position than if such strategies had not been utilized.
When a Fund writes a put or call option, an amount equal to the premium received is included on the Statement of Assets and Liabilities as a liability. The amount of the liability is subsequently marked-to-market to reflect the current market value of the option. If an option expires on its stipulated expiration date or if the Fund enters into a closing purchase transaction, a gain or loss is realized. If a written call option on an individual security is exercised, a gain or loss is realized for the sale of the underlying security, and the proceeds from the sale are increased by the premium originally received. If a written call option on a securities index is exercised, a gain or loss is realized as determined by the premium originally received, the exercise price and the market value of the index. If a written put option on an individual security is exercised, the cost of the security acquired is decreased by the premium originally received. As a writer of an option, a Fund bears the market risk of an unfavorable change in the price of the individual security or securities index underlying the written option. Additionally, written call options may involve the risk of limited gains.
Each Fund may also purchase put and call options. When a Fund purchases a put or call option, an amount equal to the premium paid is included on the Fund’s Statement of Assets and Liabilities as an investment, and is
| | | | |
| NOTESTO FINANCIAL STATEMENTS | | | 91 | |
NOTESTO FINANCIAL STATEMENTS (CONTINUED)
subsequently marked-to-market to reflect the current market value of the option. If an option expires on the stipulated expiration date or if the Fund enters into a closing sale transaction, a gain or loss is realized. If the Fund exercises a call option on an individual security, the cost of the security acquired is increased by the premium paid for the call. If the Fund exercises a put option on an individual security, a gain or loss is realized from the sale of the underlying security, and the proceeds from such a sale are decreased by the premium originally paid. If the Fund exercises a put or a call option on a security index, a gain or loss is realized as determined by the premium originally paid, the exercise price and the market value of the index. Written and purchased options are non-income producing securities.
The following is a summary of how these derivatives are treated in the financial statements and their impact on the Funds:
Amount of Realized Gain or (Loss) on Derivatives Recognized in Operations
| | | | | | |
Derivatives not accounted for as hedging
instruments | | Location of Gain/(loss)
on Derivatives
Recognized in Operations | | Amount | |
Purchased option contracts | | | | | | |
Equity risk
ICON Energy Fund | |
Net realized gain/(loss) from investment transactions | | $ | (3,487,118 | ) |
Change in Unrealized Appreciation/Depreciation on Derivatives Recognized in Operations
| | | | | | |
Derivatives not accounted for as hedging
instruments | | Location of Gain/(loss)
on Derivatives
Recognized in Operations | | Amount | |
Purchased option contracts | | | | | | |
Equity risk
ICON Energy Fund | | Change in unrealized net appreciation/(depreciation) on investments | | $ | 4,644 | |
| | |
| 92 | | NOTESTO FINANCIAL STATEMENTS |
For the year ended September 30, 2011, the Fund’s quarterly holdings of options contracts were as follows:
| | | | |
| | | ICON Energy Fund | |
| Quarter Ended | | Number of Options
Purchased Contracts
Outstanding | |
December 31, 2010 | | | 14,630 | |
March 31, 2011 | | | 10,000 | |
June 30, 2011 | | | - | |
September 30, 2011 | | | - | |
The Funds value derivatives at fair value, as described above, and recognize changes in fair value currently in the results of operations. Accordingly, the Funds do not follow hedge accounting, even for derivatives employed as economic hedges.
Securities Lending
Under procedures adopted by the Board, the Funds may lend securities to non-affiliated qualified parties. The Funds seek to earn additional income through securities lending. There is the risk of delay in recovering a loaned security. The Funds do not have the right to vote on securities while they are on loan; however, the Funds may attempt to call back the loan and vote the proxy.
All loans will be continuously secured by collateral which consists of cash. The cash collateral is invested in the State Street Navigator Prime Portfolio and is disclosed on the Schedule of Investments. The lending fees received and the Funds’ portion of the interest income earned on cash collateral are included on the Statement of Operations, if applicable.
As of September 30, 2011, the following Funds had securities with the following values on loan:
| | | | | | | | |
| Fund | | Value of
Loaned Securities | | | Value of
Collateral | |
ICON Consumer Discretionary Fund | | $ | 1,246,832 | | | $ | 1,322,350 | |
ICON Consumer Staples Fund | | | 41,186 | | | | 42,195 | |
ICON Energy Fund | | | 16,037,468 | | | | 16,866,358 | |
ICON Healthcare Fund | | | 1,107,726 | | | | 1,139,111 | |
ICON Industrials Fund | | | 1,471,117 | | | | 1,563,306 | |
ICON Information Technology Fund | | | 1,157,101 | | | | 1,204,705 | |
| | | | |
| NOTESTO FINANCIAL STATEMENTS | | | 93 | |
NOTESTO FINANCIAL STATEMENTS (CONTINUED)
The value of the collateral above could include collateral held for securities that were sold on or before September 30, 2011. It may also include collateral received from the pre-funding of loans.
Income Taxes
The Funds intend to qualify as regulated investment companies under Subchapter M of the Internal Revenue Code and, accordingly, the Funds will generally not be subject to federal and state income taxes or federal excise taxes to the extent that they intend to make sufficient distributions of net investment income and net realized capital gains.
Dividends paid by the Funds from net investment income and distributions of net realized short-term gains are, for federal income tax purposes, taxable as ordinary income to shareholders.
Dividends and distributions to shareholders are recorded by the Funds on the ex-dividend/distribution date. The Funds distribute income and net realized capital gains, if any, to shareholders at least annually, if not offset by capital loss carryforward. The Funds may utilize equalization accounting for tax purposes and designate earnings and profits, including net realized gains distributed to shareholders on redemption of shares, as part of the dividends paid deduction for income tax purposes. Income distributions and capital gain distributions are determined in accordance with income tax regulations, which may differ from accounting principles generally accepted in the United States of America.
Management has analyzed the Funds’ tax positions taken on federal income tax returns for all open tax periods and has concluded that no provision for federal income tax is required in the Funds’ financial statements.
The Funds file U.S. tax returns. While the statute of limitations remains open to examine the Funds’ U.S. tax returns filed for the past four years, no examinations are in progress or anticipated at this time. The Funds are not aware of any tax positions for which it is reasonably possible that the total amounts of unrecognized tax benefits will significantly change in the next twelve months.
Investment Income
Dividend income is recorded on the ex-dividend date. Non-cash dividends included in dividend income, if any, are recorded at the fair value of the securities received. Interest income is accrued as earned. Certain dividends
| | |
| 94 | | NOTESTO FINANCIAL STATEMENTS |
from foreign securities are recorded as soon as the Funds are informed of the dividend if such information is obtained subsequent to the ex-dividend date. Discounts and premiums on securities purchased are amortized over the life of the respective securities.
Investment Transactions
Security transactions are accounted for no later than one business day after the trade date. However, for financial reporting purposes, security transactions are accounted for on the trade date. Gains and losses on securities sold are determined on the basis of identified cost.
Allocation of Expenses
Each class of a Fund’s shares bears expenses incurred specifically on its behalf and, in addition, each class bears a portion of general expenses, based upon relative net assets of each class. Expenses which cannot be directly attributed to a specific Fund in the Trust are apportioned between all Funds in the Trust based upon relative net assets. In calculating the net asset value per share of each class, investment income, realized and unrealized gains and losses and expenses other than class-specific expenses are allocated daily to each class of shares based upon the proportion of net assets.
Below are the class level expenses that are included on the Statement of Operations:
| | | | | | | | | | | | |
| Fund | | Legal
Expense | | | Printing
And Postage
Expense | | | Transfer
Agent
Expense | |
ICON Consumer Discretionary Fund | | | | | | | | | | | | |
Class S | | $ | 2,967 | | | $ | 18,567 | | | $ | 49,820 | |
Class C | | | 1 | | | | 8 | | | | 1,537 | |
Class A | | | 1 | | | | 7 | | | | 1,270 | |
ICON Consumer Staples Fund | | | | | | | | | | | | |
Class S | | | 3,351 | | | | 12,534 | | | | 38,535 | |
Class C | | | 4 | | | | 23 | | | | 1,349 | |
Class A | | | 3 | | | | 19 | | | | 1,282 | |
ICON Energy Fund | | | | | | | | | | | | |
Class S | | | 85,327 | | | | 105,101 | | | | 443,272 | |
Class C | | | 312 | | | | 365 | | | | 6,234 | |
Class A | | | 539 | | | | 637 | | | | 10,276 | |
| | | | |
| NOTESTO FINANCIAL STATEMENTS | | | 95 | |
NOTESTO FINANCIAL STATEMENTS (CONTINUED)
| | | | | | | | | | | | |
| Fund | | Legal
Expense | | | Printing
And Postage
Expense | | | Transfer
Agent
Expense | |
ICON Financial Fund | | | | | | | | | | | | |
Class S | | $ | 6,637 | | | $ | 15,872 | | | $ | 57,016 | |
Class C | | | 1 | | | | 2 | | | | 1,280 | |
Class A | | | 3 | | | | 9 | | | | 1,296 | |
ICON Healthcare Fund | | | | | | | | | | | | |
Class S | | | 7,706 | | | | 19,248 | | | | 105,948 | |
Class C | | | 1 | | | | - | | | | 1,394 | |
Class A | | | 3 | | | | - | | | | 1,336 | |
ICON Industrials Fund | | | | | | | | | | | | |
Class S | | | 8,276 | | | | 16,746 | | | | 72,309 | |
Class C | | | 1 | | | | 4 | | | | 1,296 | |
Class A | | | 12 | | | | 29 | | | | 1,412 | |
ICON Information Technology Fund | | | | | | | | | | | | |
Class S | | | 9,600 | | | | 20,458 | | | | 87,124 | |
Class C | | | - | | | | - | | | | 1,360 | |
Class A | | | - | | | | - | | | | 1,251 | |
ICON Materials Fund | | | | | | | | | | | | |
Class S | | | 12,263 | | | | 31,151 | | | | 91,405 | |
Class C | | | 13 | | | | 37 | | | | 1,793 | |
Class A | | | 64 | | | | 181 | | | | 2,646 | |
ICON Telecommunication & Utilities Fund | | | | | | | | | | | | |
Class S | | | 3,325 | | | | 13,595 | | | | 40,449 | |
Class C | | | - | | | | 1 | | | | 1,353 | |
Class A | | | - | | | | 1 | | | | 1,282 | |
3. Fees and Other Transactions with Affiliates
Investment Advisory Fees
ICON Advisers, Inc. (“ICON Advisers”) serves as investment adviser to the Funds and is responsible for managing the Funds’ portfolios of securities. ICON Advisers receives a monthly management fee that is computed daily at an annual rate of 1.00% on the first $500 million of average daily net assets, 0.95% on the next $250 million, 0.925% on the next $750 million, 0.90% on the next $3.5 billion, and 0.875% on average daily net assets over $5 billion.
Effective January 1, 2011, ICON Advisers has contractually agreed to limit its Fund’s expenses (exclusive of brokerage, interest, taxes, dividends on short
| | |
| 96 | | NOTESTO FINANCIAL STATEMENTS |
sales and extraordinary expenses) to the extent necessary to ensure that the Funds’ expenses do not exceed the following amounts:
| | | | | | | | | | | | |
| Fund | | Class S | | | Class C | | | Class A | |
ICON Consumer Discretionary Fund | | | 1.74% | | | | 2.74% | | | | 1.99% | |
ICON Consumer Staples Fund | | | 1.50% | | | | 2.50% | | | | 1.75% | |
ICON Energy Fund | | | 1.50% | | | | 2.50% | | | | 1.75% | |
ICON Financial Fund | | | 1.50% | | | | 2.50% | | | | 1.75% | |
ICON Healthcare Fund | | | 1.50% | | | | 2.50% | | | | 1.75% | |
ICON Industrials Fund | | | 1.50% | | | | 2.50% | | | | 1.75% | |
ICON Information Technology Fund | | | 1.50% | | | | 2.50% | | | | 1.75% | |
ICON Materials Fund | | | 1.50% | | | | 2.50% | | | | 1.75% | |
ICON Telecommunication & Utilities Fund | | | 1.50% | | | | 2.50% | | | | 1.75% | |
The Funds’ expense limitations will continue in effect until at least January 31, 2013. To the extent ICON Advisers reimburses or absorbs fees and expenses, it may seek payment of such amounts for up to three years after the expenses were reimbursed or absorbed. A Fund will make no such payment, however, if the total Fund operating expenses exceed the expense limits in effect at the time the expenses were reimbursed or at the time these payments are proposed.
As of September 30, 2011 the following amounts were still available for recoupment by ICON Advisers based upon their potential expiration dates:
| | | | |
| Fund | | 2014 | |
ICON Consumer Discretionary Fund | | $ | 2,712 | |
ICON Consumer Staples Fund | | | 21,170 | |
ICON Financial Fund | | | 2,512 | |
ICON Healthcare Fund | | | 3,414 | |
ICON Industrials Fund | | | 2,849 | |
ICON Information Technology Fund | | | 2,606 | |
ICON Materials Fund | | | 3,934 | |
ICON Telecommunication & Utilities Fund | | | 25,886 | |
Accounting, Custody and Transfer Agent Fees
State Street Bank and Trust Company (“State Street”) serves as the fund accounting agent for the funds. For its services, the Trust pays State Street a fee that is calculated daily and paid monthly at an annual rate based on the aggregate average daily assets of the Trust.
| | | | |
| NOTESTO FINANCIAL STATEMENTS | | | 97 | |
NOTESTO FINANCIAL STATEMENTS (CONTINUED)
State Street is the custodian of the Trust’s investments. For its services, the Trust pays State Street asset-based fees that vary according to the number of positions and transactions, plus out-of-pocket expenses.
Boston Financial Data Services, Inc. (“BFDS”) is the Trust’s transfer agent. For these services, the Trust pays a per account fee, plus certain other transaction cusip charges and out-of-pocket expenses. BFDS may pay each Fund transfer agent earnings credits. Transfer agent earnings credits are credits received for interest which results from overnight balances used by BFDS for clearing shareholder transactions.
Administrative Services
The Trust has entered into an administrative services agreement with ICON Advisers pursuant to which ICON Advisers oversees the administration of the Trust’s business and affairs. This agreement provides for an annual fee of 0.05% on the Trust’s first $1.5 billion of average daily net assets, 0.045% on the next $1.5 billion of average daily net assets, 0.040% on the next $2 billion of average daily net assets and 0.030% on average daily net assets over $5 billion. For the year ended September 30, 2011, each Funds’ payment for administrative services to ICON Advisers is included on the Statement of Operations. The administrative services agreement provides that ICON Advisers will not be liable for any error of judgment, mistake of law, or any loss suffered by the Trust in connection with matters to which the administrative services agreement relates, except for a loss resulting from willful misfeasance, bad faith or negligence by ICON Advisers in the performance of its duties.
ICON Advisers has a sub-administration agreement with State Street to which State Street assists ICON Advisers with the administration and business affairs of the Trust. For its services, ICON Advisers pays State Street a fee that is calculated daily and paid monthly at an annual rate based on the aggregate average daily assets of the Trust.
Distribution Fees
The Funds have adopted a Distribution Plan pursuant to Rule 12b-1 under the 1940 Act (“12b-1 Plan”) under which the Funds are authorized to compensate the Funds’ distributor, ICON Distributors, Inc. (“IDI”) (an affiliate of the adviser) for the sale and distribution of shares. Under the 12b-1 Plan, Class A shareholders pay an annual distribution and service fee of 0.25% of average daily net assets. The Class C shareholders pay an annual
| | |
| 98 | | NOTESTO FINANCIAL STATEMENTS |
distribution and service fee of 1.00% of average daily net assets. The total amount paid under the 12b-1 plans, if any, by the Funds is shown on the Statement of Operations.
Other Related Parties
Certain Officers and Directors of ICON Advisers are also Officers and Trustees of the Funds; however, such Officers and Trustees (with the exception of the Chief Compliance Officer, “CCO”) receive no compensation from the Funds. The CCO’s salary is paid 86% by the Trust and 14% by ICON Advisers. For the year ended September 30, 2011, the total related amounts paid by each Fund are included in Other Expenses on the Statement of Operations.
Some of the distribution amounts received by IDI, discussed in the Distribution Fees section above, have been used to offset various shareholder servicing costs incurred by ICON Advisers. For the year ended September 30, 2011, this amount was $7,992.
4. Borrowings
The Trust has entered into Lines of Credit agreements with State Street to provide temporary funding for redemption requests. The maximum borrowing is limited to $150 million. Interest on domestic borrowings is charged at the higher of the Federal Funds Rate effective on that day and the Overnight LIBOR Rate effective on that day plus 1.25%. The average interest rate charged for the year ended September 30, 2011 was 1.44%.
| | | | |
| Fund | | Average Borrowing (10/1/10-9/30/11) | |
ICON Consumer Discretionary Fund | | $ | 85,077 | |
ICON Consumer Staples Fund | | | 85,042 | |
ICON Energy Fund | | | 202,114 | |
ICON Financial Fund* | | | 128,374 | |
ICON Healthcare Fund* | | | 90,718 | |
ICON Industrials Fund* | | | 255,117 | |
ICON Information Technology Fund* | | | 162,375 | |
ICON Materials Fund* | | | 213,567 | |
ICON Telecommunication & Utilities Fund | | | 166,745 | |
| * | Fund had outstanding borrowings under these agreements as of September 30, 2011. |
| | | | |
| NOTESTO FINANCIAL STATEMENTS | | | 99 | |
NOTESTO FINANCIAL STATEMENTS (CONTINUED)
5. Purchases and Sales of Investment Securities
For the year ended September 30, 2011, the aggregate cost of purchases and proceeds from sales of investment securities (excluding short-term securities) was as follows:
| | | | | | | | |
| Fund | | Purchases of
Securities | | | Proceeds
from Sales of
Securities | |
ICON Consumer Discretionary Fund | | $ | 44,674,050 | | | $ | 31,057,364 | |
ICON Consumer Staples Fund | | | 26,983,194 | | | | 39,136,853 | |
ICON Energy Fund | | | 656,949,667 | | | | 585,023,178 | |
ICON Financial Fund | | | 48,922,698 | | | | 70,954,301 | |
ICON Healthcare Fund | | | 65,078,100 | | | | 64,212,426 | |
ICON Industrials Fund | | | 36,232,458 | | | | 52,056,869 | |
ICON Information Technology Fund | | | 34,471,368 | | | | 52,418,715 | |
ICON Materials Fund | | | 54,579,645 | | | | 78,210,619 | |
ICON Telecommunication & Utilities Fund | | | 27,809,126 | | | | 40,297,317 | |
6. Federal Income Tax
Income and capital gain distributions are determined in accordance with income tax regulations that may differ from accounting principles that are generally accepted in the United States of America. These differences are due to differing treatments for items such as net short-term gains, deferrals of wash sale losses, foreign currency transactions, net investment losses, and capital loss carryforwards.
The tax components of capital shown in the following tables include losses the Funds may be able to offset against gains recognized in future years. The accumulated losses noted represent net capital loss carryforwards as of September 30, 2011 and post-October losses that may be available to offset future realized capital gains and thereby reduce future taxable income distributions.
For the year ended September 30, 2011 the following Funds had capital loss carryforwards:
| | | | | | | | |
| Fund | | Amounts | | | Expires | |
ICON Consumer Discretionary Fund | | $ | 11,308,112 | | | | 2017 | |
| | | 8,355,189 | | | | 2018 | |
ICON Consumer Staples Fund | | | 1,764,198 | | | | 2017 | |
| | | 1,888,341 | | | | 2018 | |
ICON Energy Fund | | | 240,766 | | | | 2018 | |
| | |
| 100 | | NOTESTO FINANCIAL STATEMENTS |
| | | | | | | | |
| Fund | | Amounts | | | Expires | |
ICON Financial Fund | | $ | 58,696,031 | | | | 2017 | |
| | | 43,715,782 | | | | 2018 | |
ICON Healthcare Fund | | | 4,557,995 | | | | 2018 | |
ICON Industrials Fund | | | 11,618,296 | | | | 2017 | |
| | | 28,045,106 | | | | 2018 | |
ICON Information Technology Fund | | | 21,080 | | | | 2016 | |
| | | 22,796,772 | | | | 2017 | |
| | | 6,573,259 | | | | 2018 | |
ICON Materials Fund | | | 12,782,639 | | | | 2017 | |
| | | 7,349,690 | | | | 2018 | |
ICON Telecommunication & Utilities Fund | | | 6,027,677 | | | | 2017 | |
| | | 3,844,832 | | | | 2018 | |
Future capital loss carryover utilization in any given year may be limited if there are substantial shareholder redemptions or contributions. During the year ended September 30, 2011 the Funds utilized capital loss carryforwards:
| | | | |
| Fund | | Amount | |
ICON Consumer Discretionary Fund | | $ | 3,855,294 | |
ICON Consumer Staples Fund | | | 5,999,632 | |
ICON Energy Fund | | | 66,984,362 | |
ICON Financial Fund | | | 4,644,695 | |
ICON Healthcare Fund | | | 16,982,763 | |
ICON Industrials Fund | | | 4,771,025 | |
ICON Information Technology Fund | | | 10,930,880 | |
ICON Materials Fund | | | 13,969,617 | |
ICON Telecommunication & Utilities Fund | | | 2,166,913 | |
The tax characteristics of distributions paid to shareholders during the fiscal year ended September 30, 2011, were as follows:
| | | | | | | | |
| Fund | | Distributions
Paid from
Ordinary Income | | | Total
Distributions
Paid | |
ICON Consumer Staples Fund | | $ | 315,201 | | | $ | 315,201 | |
ICON Energy Fund | | | 6,516,740 | | | | 6,516,740 | |
ICON Financial Fund | | | 214,079 | | | | 214,079 | |
ICON Healthcare Fund | | | 368,446 | | | | 368,446 | |
ICON Industrials Fund | | | 478,554 | | | | 478,554 | |
ICON Materials Fund | | | 478,186 | | | | 478,186 | |
ICON Telecommunication & Utilities Fund | | | 1,194,876 | | | | 1,194,876 | |
| | | | |
| NOTESTO FINANCIAL STATEMENTS | | | 101 | |
NOTESTO FINANCIAL STATEMENTS (CONTINUED)
The tax characteristics of distributions paid to shareholders during the fiscal year ended September 30, 2010, were as follows:
| | | | | | | | |
| Fund | | Distributions
Paid from
Ordinary Income | | | Total
Distributions
Paid | |
ICON Consumer Discretionary Fund | | $ | 376,917 | | | $ | 376,917 | |
ICON Consumer Staples Fund | | | 383,505 | | | | 383,505 | |
ICON Energy Fund | | | 7,077,474 | | | | 7,077,474 | |
ICON Financial Fund | | | 1,136,088 | | | | 1,136,088 | |
ICON Healthcare Fund | | | 1,948,725 | | | | 1,948,725 | |
ICON Industrials Fund | | | 1,217,973 | | | | 1,217,973 | |
ICON Information Technology Fund | | | 631,045 | | | | 631,045 | |
ICON Materials Fund | | | 1,039,736 | | | | 1,039,736 | |
ICON Telecommunication & Utilities Fund | | | 595,082 | | | | 595,082 | |
As of September 30, 2011, the components of accumulated earnings/(deficit) on a tax basis were as follows:
| | | | | | | | | | | | | | | | | | | | |
| Fund | | Undistributed
Ordinary
Income | | | Distributions
Payable* | | | Accumulated
Capital and
Other Losses | | | Unrealized
Appreciation/
(Depreciation)** | | | Total
Accumulated
Earnings/
(Deficit) | |
ICON Consumer Discretionary Fund | | $ | - | | | $ | - | | | $ | (19,663,301 | ) | | $ | (1,325,877 | ) | | $ | (20,989,178 | ) |
ICON Consumer Staples Fund | | | 279,768 | | | | - | | | | (3,652,539 | ) | | | 24,723 | | | | (3,348,048 | ) |
ICON Energy Fund | | | 4,365,200 | | | | - | | | | (240,766 | ) | | | (68,694,805 | ) | | | (64,570,371 | ) |
ICON Financial Fund | | | 210,720 | | | | - | | | | (102,411,813 | ) | | | (6,579,165 | ) | | | (108,780,258 | ) |
ICON Healthcare Fund | | | 663,354 | | | | - | | | | (4,557,995 | ) | | | (5,266,551 | ) | | | (9,161,192 | ) |
ICON Industrials Fund | | | 535,609 | | | | - | | | | (39,663,402 | ) | | | (2,036,675 | ) | | | (41,164,468 | ) |
ICON Information Technology Fund | | | - | | | | - | | | | (29,391,111 | ) | | | 1,880,511 | | | | (27,510,600 | ) |
ICON Materials Fund | | | 651,006 | | | | - | | | | (20,132,329 | ) | | | (4,559,976 | ) | | | (24,041,299 | ) |
ICON Telecommunication & Utilities Fund | | | 523,437 | | | | (374,998 | ) | | | (9,872,509 | ) | | | 610,476 | | | | (9,113,594 | ) |
| * | Differences between the financial statement distribution payable and the tax basis distribution payable are a result of accrual based accounting and cash based accounting used for federal tax reporting purposes. |
| ** | Differences between the book-basis and tax-basis unrealized appreciation/(depreciation) are attributable primarily to tax deferral of losses on wash sales. |
| | |
| 102 | | NOTESTO FINANCIAL STATEMENTS |
As of September 30, 2011, cost on investments for federal income tax purposes and the amount of net unrealized appreciation/(depreciation) were as follows:
| | | | | | | | | | | | | | | | |
| Fund | | Cost | | | Unrealized Appreciation | | | Unrealized (Depreciation) | | | Net
Appreciation/ (Depreciation) | |
ICON Consumer Discretionary Fund | | $ | 36,676,102 | | | $ | 1,683,943 | | | $ | (3,009,820 | ) | | $ | (1,325,877 | ) |
ICON Consumer Staples Fund | | | 22,236,625 | | | | 654,172 | | | | (629,449 | ) | | | 24,723 | |
ICON Energy Fund | | | 647,808,975 | | | | 21,841,739 | | | | (90,536,545 | ) | | | (68,694,806 | ) |
ICON Financial Fund | | | 38,789,572 | | | | 466,202 | | | | (7,045,164 | ) | | | (6,578,962 | ) |
ICON Healthcare Fund | | | 81,386,590 | | | | 2,281,923 | | | | (7,548,474 | ) | | | (5,266,551 | ) |
ICON Industrials Fund | | | 54,320,222 | | | | 3,017,401 | | | | (5,053,797 | ) | | | (2,036,396 | ) |
ICON Information Technology Fund | | | 60,344,970 | | | | 9,620,888 | | | | (7,740,377 | ) | | | 1,880,511 | |
ICON Materials Fund | | | 63,593,736 | | | | 3,908,425 | | | | (8,468,401 | ) | | | (4,559,976 | ) |
ICON Telecommunication & Utilities Fund | | | 20,493,493 | | | | 799,171 | | | | (188,695 | ) | | | 610,476 | |
The Regulated Investment Company Modernization Act of 2010 (the “Act”) was signed into law on December 22, 2010. The Act makes changes to a number of tax rules impacting the Funds. Under the Act, future capital losses generated by a fund may be carried over indefinitely, but these losses must be used prior to the utilization of any pre-enactment capital losses. Since pre-enactment capital losses may only be carried forward for eight years, there may be a greater likelihood that all or a portion of each fund’s pre-enactment capital losses will expire unused. In general, the provisions of the Act will be effective for each Fund’s fiscal year ending 2012.
7. Subsequent Events
Effective January 23, 2012, the Telecommunication & Utilities Fund will change its name to the ICON Utilities Fund and invest primarily in utilities.
Subsequent to year end, the ICON Funds suspended participation in the securities lending program.
| | | | |
| NOTESTO FINANCIAL STATEMENTS | | | 103 | |
REPORTOF INDEPENDENT REGISTERED PUBLIC
ACCOUNTING FIRM
To the Board of Trustees and Shareholders of the ICON Funds:
In our opinion, the accompanying statements of assets and liabilities, including the schedules of investments, and the related statements of operations and of changes in net assets and the financial highlights present fairly, in all material respects, the financial position of ICON Consumer Discretionary Fund, ICON Consumer Staples Fund, ICON Energy Fund, ICON Financial Fund, ICON Healthcare Fund, ICON Industrials Fund, ICON Information Technology Fund, ICON Materials Fund, and ICON Telecommunications & Utilities Fund (nine of the portfolios constituting ICON Funds, hereafter referred to as the “Funds”) at September 30, 2011, and the results of each of their operations for the year then ended, the changes in each of their net assets for each of the two years in the period then ended and the financial highlights for each of the periods presented, in conformity with accounting principles generally accepted in the United States of America. These financial statements and financial highlights (hereafter referred to as “financial statements”) are the responsibility of the Funds’ management; our responsibility is to express an opinion on these financial statements based on our audits. We conducted our audits of these financial statements in accordance with the standards of the Public Company Accounting Oversight Board (United States). Those standards require that we plan and perform the audit to obtain reasonable assurance about whether the financial statements are free of material misstatement. An audit includes examining, on a test basis, evidence supporting the amounts and disclosures in the financial statements, assessing the accounting principles used and significant estimates made by management, and evaluating the overall financial statement presentation. We believe that our audits, which included confirmation of securities at September 30, 2011 by correspondence with the custodian and brokers, provide a reasonable basis for our opinion.

Denver, Colorado
November 18, 2011
| | |
| 104 | | REPORTOF ACCOUNTING FIRM |
SIX MONTH HYPOTHETICAL EXPENSE EXAMPLE
SEPTEMBER 30, 2011 (UNAUDITED)
Example
As a shareholder of a Fund you may pay two types of fees: transaction fees and fund-related fees. Certain funds charge transaction fees, including sales charges (loads) on purchase payments, reinvested dividends, or other distributions; redemption fees; and exchange fees. Funds also incur various ongoing expenses, including management fees, distribution and/or service fees, and other fund expenses, which are indirectly paid by shareholders.
This Example is intended to help you understand your ongoing costs (in dollars) of investing in the various ICON Funds and to compare these costs with the ongoing costs of investing in other mutual funds. This Example is based on an investment of $1,000 invested at the beginning of the six-month period and held for the six-month period (4/1/11 – 9/30/11).
Actual Expenses
The first line in the table for each Fund provides information about actual account values and actual expenses. The Example includes, but is not limited to, management fees, 12b-1 fees, fund accounting, custody and transfer agent fees. However, the Example does not include client specific fees, such as the $15 fee charged to IRA accounts, or the $15 fee charged for wire redemptions. You may use this information, together with the amount you invested, to estimate the expenses that you paid over the period. Simply divide your account value by $1,000 (for example, an $8,600 account value divided by $1,000 = 8.6), then multiply the result by the number in the first line for each Fund under the heading entitled “Expenses Paid During Period” to estimate the expenses you paid on your account during this period.
Hypothetical Example for Comparison Purposes
The second line in the table for each Fund provides information about hypothetical account values and hypothetical expenses based on the Fund’s actual expense ratio and an assumed rate of return of 5% per year before expenses, which is not the Fund’s actual return. The hypothetical account values and expenses may not be used to estimate the actual ending account balance or expenses you paid for the period. You may use this information to compare the ongoing costs of investing in the Fund and other funds. To do so, compare this 5% hypothetical example with the 5% hypothetical examples that appear in the shareholder reports of the other funds. Please note that the expenses shown in the table are meant to highlight your ongoing costs only and do not reflect any transactional costs, such as sales charges (loads),
redemption fees, or exchange fees that may be charged by other funds. Therefore, this information is useful in comparing ongoing costs only, and will not help you determine the relative total costs of owning different funds.
| | | | | | | | | | | | | | | | |
| | | Beginning
Account
Value
4/1/11 | | | Ending
Account
Value
9/30/11 | | | Expenses Paid
During Period
4/1/11 - 9/30/11* | | | Annualized
Expense Ratio
4/1/11 - 9/30/11 | |
Actual Expenses | | | | | | | | | | | | | | | | |
ICON Consumer Discretionary Fund | | | | | | | | | | | | | | | | |
Class S | | $ | 1,000.00 | | | $ | 953.40 | | | $ | 6.97 | | | | 1.42% | |
Class C | | | 1,000.00 | | | | 946.80 | | | | 13.75 | | | | 2.75% | |
Class A | | | 1,000.00 | | | | 949.00 | | | | 10.22 | | | | 1.99% | |
ICON Consumer Staples Fund | | | | | | | | | | | | | | | | |
Class S | | | 1,000.00 | | | | 972.90 | | | | 7.47 | | | | 1.51% | |
Class C | | | 1,000.00 | | | | 968.20 | | | | 12.29 | | | | 2.49% | |
Class A | | | 1,000.00 | | | | 981.90 | | | | 8.69 | | | | 1.75% | |
ICON Energy Fund | | | | | | | | | | | | | | | | |
Class S | | | 1,000.00 | | | | 734.70 | | | | 5.25 | | | | 1.21% | |
Class C | | | 1,000.00 | | | | 730.10 | | | | 10.89 | | | | 2.51% | |
Class A | | | 1,000.00 | | | | 732.80 | | | | 7.55 | | | | 1.74% | |
ICON Financial Fund | | | | | | | | | | | | | | | | |
Class S | | | 1,000.00 | | | | 752.80 | | | | 6.27 | | | | 1.43% | |
Class C | | | 1,000.00 | | | | 748.40 | | | | 10.96 | | | | 2.50% | |
Class A | | | 1,000.00 | | | | 752.40 | | | | 7.83 | | | | 1.75% | |
ICON Healthcare Fund | | | | | | | | | | | | | | | | |
Class S | | | 1,000.00 | | | | 935.80 | | | | 6.07 | | | | 1.25% | |
Class C | | | 1,000.00 | | | | 930.70 | | | | 12.11 | | | | 2.50% | |
Class A | | | 1,000.00 | | | | 933.70 | | | | 8.50 | | | | 1.75% | |
ICON Industrials Fund | | | | | | | | | | | | | | | | |
Class S | | | 1,000.00 | | | | 761.50 | | | | 6.05 | | | | 1.37% | |
Class C | | | 1,000.00 | | | | 756.80 | | | | 11.01 | | | | 2.50% | |
Class A | | | 1,000.00 | | | | 758.70 | | | | 7.74 | | | | 1.76% | |
ICON Information Technology Fund | | | | | | | | | | | | | | | | |
Class S | | | 1,000.00 | | | | 878.20 | | | | 6.29 | | | | 1.34% | |
Class C | | | 1,000.00 | | | | 872.30 | | | | 11.73 | | | | 2.50% | |
Class A | | | 1,000.00 | | | | 877.00 | | | | 8.23 | | | | 1.75% | |
ICON Materials Fund | | | | | | | | | | | | | | | | |
Class S | | | 1,000.00 | | | | 738.90 | | | | 5.86 | | | | 1.34% | |
Class C | | | 1,000.00 | | | | 735.40 | | | | 10.95 | | | | 2.51% | |
Class A | | | 1,000.00 | | | | 737.70 | | | | 7.75 | | | | 1.76% | |
| | | | | | | | | | | | | | | | |
| | | Beginning
Account
Value
4/1/11 | | | Ending
Account
Value
9/30/11 | | | Expenses Paid
During Period
4/1/11 - 9/30/11* | | | Annualized
Expense Ratio
4/1/11 - 9/30/11 | |
ICON Telecommunication & Utilities Fund | | | | | | | | | | | | | | | | |
Class S | | $ | 1,000.00 | | | $ | 1,035.40 | | | $ | 7.71 | | | | 1.51% | |
Class C | | | 1,000.00 | | | | 1,024.30 | | | | 12.71 | | | | 2.50% | |
Class A | | | 1,000.00 | | | | 1,028.60 | | | | 8.90 | | | | 1.75% | |
Hypothetical (assuming a 5% return before expenses) | | | | | | | | | | | | | | | | |
ICON Consumer Discretionary Fund | | | | | | | | | | | | | | | | |
Class S | | | 1,000.00 | | | | 1,017.94 | | | | 7.20 | | | | | |
Class C | | | 1,000.00 | | | | 1,010.95 | | | | 14.20 | | | | | |
Class A | | | 1,000.00 | | | | 1,014.58 | | | | 10.57 | | | | | |
ICON Consumer Staples Fund | | | | | | | | | | | | | |
Class S | | | 1,000.00 | | | | 1,017.50 | | | | 7.64 | | | | | |
Class C | | | 1,000.00 | | | | 1,012.58 | | | | 12.57 | | | | | |
Class A | | | 1,000.00 | | | | 1,016.30 | | | | 8.84 | | | | | |
ICON Energy Fund | | | | | | | | | | | | | | | | |
Class S | | | 1,000.00 | | | | 1,019.02 | | | | 6.11 | | | | | |
Class C | | | 1,000.00 | | | | 1,012.48 | | | | 12.67 | | | | | |
Class A | | | 1,000.00 | | | | 1,016.36 | | | | 8.78 | | | | | |
ICON Financial Fund | | | | | | | | | | | | | | | | |
Class S | | | 1,000.00 | | | | 1,017.91 | | | | 7.22 | | | | | |
Class C | | | 1,000.00 | | | | 1,012.53 | | | | 12.62 | | | | | |
Class A | | | 1,000.00 | | | | 1,016.13 | | | | 9.01 | | | | | |
ICON Healthcare Fund | | | | | | | | | | | | | | | | |
Class S | | | 1,000.00 | | | | 1,018.79 | | | | 6.33 | | | | | |
Class C | | | 1,000.00 | | | | 1,012.52 | | | | 12.62 | | | | | |
Class A | | | 1,000.00 | | | | 1,016.28 | | | | 8.86 | | | | | |
ICON Industrials Fund | | | | | | | | | | | | | | | | |
Class S | | | 1,000.00 | | | | 1,018.20 | | | | 6.93 | | | | | |
Class C | | | 1,000.00 | | | | 1,012.53 | | | | 12.62 | | | | | |
Class A | | | 1,000.00 | | | | 1,016.27 | | | | 8.87 | | | | | |
ICON Information Technology Fund | | | | | | | | | | | | | | | | |
Class S | | | 1,000.00 | | | | 1,018.37 | | | | 6.76 | | | | | |
Class C | | | 1,000.00 | | | | 1,012.54 | | | | 12.61 | | | | | |
Class A | | | 1,000.00 | | | | 1,016.29 | | | | 8.85 | | | | | |
| | | | | | | | | | | | | | |
| | | Beginning
Account
Value
4/1/11 | | | Ending
Account
Value
9/30/11 | | | Expenses Paid
During Period
4/1/11 - 9/30/11* | | | Annualized
Expense Ratio
4/1/11 - 9/30/11 |
ICON Materials Fund | | | | | | | | | | | | | | |
Class S | | $ | 1,000.00 | | | $ | 1,018.33 | | | $ | 6.80 | | | |
Class C | | | 1,000.00 | | | | 1,012.44 | | | | 12.70 | | | |
Class A | | | 1,000.00 | | | | 1,016.15 | | | | 8.99 | | | |
ICON Telecommunication & Utilities Fund | | | | | | | | | | | | | | |
Class S | | | 1,000.00 | | | | 1,017.49 | | | | 7.64 | | | |
Class C | | | 1,000.00 | | | | 1,012.51 | | | | 12.64 | | | |
Class A | | | 1,000.00 | | | | 1,016.29 | | | | 8.85 | | | |
| * | Expenses are equal to the Fund’s six month expense ratio annualized, multiplied by the average account value over the period, multiplied by 183/365 to reflect the one-half year period. |
Total returns exclude applicable sales charges. If sales charges were included (maximum 5.75%), returns would be lower.
BOARDOF TRUSTEESAND FUND OFFICERS
(UNAUDITED)
The ICON Funds Board of Trustees (“Board”) consists of four Trustees who oversee the 17 ICON Funds (the “Funds”). The Board is responsible for general oversight of the Funds’ business and for assuring that the Funds are managed in the best interest of the Funds’ shareholders. The Trustees, and their ages, and principal occupations are set forth below. The address of the Trustees is 5299 DTC Blvd., Suite 1200, Greenwood Village, CO 80111. Trustees have no official term of office and generally serve until they resign or are not re-elected.
Interested Trustee
Craig T. Callahan, 60, Chairman of the Board. Dr. Callahan has been a Trustee of the Funds since their inception. Dr. Callahan also serves as President (1998 to present) and Chairman of the Investment Committee (2005 to present) and served as the Chief Investment Officer (1991 to 2004) of ICON Advisers. Dr. Callahan is also Executive Vice President (2005 to present); Director (1991 to present); and was previously President (1998 to 2005) and Chief Compliance Officer (2005) of IDI. Dr. Callahan also serves as the President (1998 to present) and Chairman of the Board of Directors (1994 to present) of ICON Management & Research Corporation (“IM&R”), the parent company of ICON Advisers and IDI.
Independent Trustees
Glen F. Bergert, 61. Mr. Bergert has been a Trustee of the Funds since 1999. Mr. Bergert is President of Venture Capital Management LLC (1997 to present), General Partner of SOGNO Partners LP, a venture capital company (2001 to present), General Partner of Bergert Properties, LLP, a real estate holding company (1997 to present), General Partner of Pyramid Real Estate Partnership, a real estate development company (1998 to present), General Partner of Chamois Partners, LP, a venture capital company (2004 to present) and was previously a General Partner with KPMG Peat Marwick, LLP (1979 to 1997). Mr. Bergert is also a Director of Delta Dental of California, an insurance company (2006 to present), Delta Dental of Pennsylvania, an insurance company (1998 to 2009 and 2010 to present), Dentegra Group, Inc, an insurance holding company (2010 to present) and Delta Reinsurance Corporation (2000 to 2009 and 2011 to present). Mr. Bergert was a Director of Herre Bros, Inc., a contracting company (1998 to 2011).
John C. Pomeroy, Jr., 64. Mr. Pomeroy has been a Trustee of the Funds since November 2002. Mr. Pomeroy is Chief Investment Officer and Director
of Investments, Pennsylvania State University (2001 to present) and was Portfolio Manager and Product Manager, Trinity Investment Management Corporation (1989 to 2001).
R. Michael Sentel, 63. Mr. Sentel has been a Trustee of the Funds since their inception. Mr. Sentel is a Senior Attorney with the U.S. Department of Education (1996 to present). Mr. Sentel also provides legal representation as a sole practitioner with an emphasis on corporate and transactional law. He served as general counsel to numerous public companies and served on the board of directors of one of these clients. Mr. Sentel began his legal career with the U.S. Securities and Exchange Commission’s Division of Enforcement and served as a Branch Chief (1980 to 1981). Later he served as the Section Chief for the Professional Liability Section of the Federal Deposit Insurance Corp. with responsibility for the Rocky Mountain Region (1991 to 1994).
The Officers of the Funds are:
Craig T. Callahan, 60, Chairman of the Board. Dr. Callahan has been a Trustee of the Funds since their inception. Dr. Callahan also serves as President (1998 to present) and Chairman of the Investment Committee (2005 to present) and served as the Chief Investment Officer (1991 to 2004) of ICON Advisers. Dr. Callahan is also Executive Vice President (2005 to present); Director (1991 to present); and was previously President (1998 to 2005) and Chief Compliance Officer (2005) of IDI. Dr. Callahan also serves as the President (1998 to present) and Chairman of the Board of Directors (1994 to present) of IM&R, the parent company of ICON Advisers and IDI.
Erik L. Jonson, 62. Mr. Jonson has been a Vice President and Principal Financial Officer/Treasurer of the Funds since their inception in 1996. Mr. Jonson is also Chief Financial Officer (1996 to present) and Executive Vice President (2004 to present) and was previously Vice President (1998 to 2004) and Secretary (2005 and 1998 to 2002) of ICON Advisers; Chief Financial Officer, Secretary and Director (1998 to present) of IM&R; and Executive Vice President and Treasurer/Financial Principal (1996 to present) of IDI.
Jessica Seidlitz, 33. Ms. Seidlitz serves as the Assistant Treasurer of the Funds (2007 to present). She also serves as the Mutual Fund Controller of ICON Advisers (2005 to present). Previously, she was a Senior Associate/Associate at PricewaterhouseCoopers LLP (2001 to 2004).
Donald Salcito, 58. Mr. Salcito serves as Vice President and Secretary of the Funds (November 15, 2006 to present). Mr. Salcito is also Executive Vice President and General Counsel (September 2005 to present) of ICON Advisers; Director of IM&R (2005 to present); Executive Vice President,
Secretary, General Counsel of IDI (2005 to present). Previously, he was a Partner in various national law firms, practicing in the securities law area. (1980 to 2005).
Brian Harding, 32. Mr. Harding serves as Chief Compliance Officer and Anti-Money Laundering Officer of the Funds (2008 to present). Mr. Harding also serves as Chief Compliance Officer of ICON Advisers (2011 to present). Previously, he was a Manager (2007 to 2008) and a Senior Associate/Associate (2001 to 2007) at PricewaterhouseCoopers LLP.
OTHER INFORMATION (UNAUDITED)
Renewal of Investment Advisory Agreement
On August 15, 2011, the Board of Trustees, including a majority of the Trustees that are not “interested persons” of the Trust (the “Independent Trustees”), approved continuation of the Advisory Agreements with the Adviser for each Fund for an additional one-year term commencing October 1, 2011.
In determining to renew the investment advisory agreements between ICON Funds (the “Trust”) and ICON Advisers, Inc. (“ICON” or the “Adviser”) the Board requested, was provided with and reviewed data with respect to ICON, its personnel, and the services provided and to be provided to each Fund by ICON under the Trust’s Investment Advisory Agreement dated October 9, 1996, as amended (related to the Sector, International and Core Equity Funds) and under the Trust’s Investment Advisory Agreement dated July 9, 2002 and effective October 1, 2002, as amended (related to the U.S. Diversified Funds - Bond, Risk-Managed Equity, Equity Income and Long/Short Funds) (collectively, the “Advisory Agreements”). The data included information concerning advisory, distribution and administrative services provided to the Funds by ICON and its related companies; information concerning other businesses of those companies; comparative data related to exchange traded funds versus the Sector Funds; and comparative data obtained from Lipper Analytical Services related to Fund performance and Fund expenses (the “Lipper report”). The data also included an analysis of the Funds’ ratings on the AthenaInvest system (the “AthenaInvest data”) and a presentation on ICON’s investment model. AthenaInvest is an affiliate of the Adviser. The Board of Trustees met on August 4 and 19, 2011 to discuss the data. Management personnel discussed the data for and with those present. Included in the discussion was a briefing on the sales and marketing initiatives, the different classes of shares being offered by the Trust and efficiencies in connection with administering services to the Funds/various classes of shares.
The Independent Trustees were represented by independent legal counsel throughout the process. Prior to acting on the matter, the Independent Trustees met separately as a group in private sessions with their independent legal counsel to review and discuss the foregoing information. Based on these discussions, independent legal counsel and/or the Lead Independent Trustee also contacted management to request additional information and to discuss responses to questions raised during the process. In addition, the Independent Trustees received materials from their independent legal counsel discussing the legal standards applicable to their consideration of the agreement.
In considering the nature, extent and quality of the services provided by the Adviser, the Board reviewed information relating to ICON’s operations and personnel. Among other things, the Adviser provided biographical information on its professional staff and descriptions of its organizational and management structure. In the course of their deliberations the Board evaluated, among other things, information relating to the investment philosophy, strategies and techniques used in managing each Fund, the qualifications and experience of ICON’s investment personnel, ICON’s compliance programs, ICON’s brokerage practices, including the extent to which the Adviser obtains research through “soft dollar” arrangements with the Funds’ brokerage, compliance reports on the foregoing, and the financial and non-financial resources available to provide services required under the Advisory Agreement.
During the discussion, the Lipper report and the AthenaInvest data were discussed and management personnel showed performance for each fund and discussed the factors affecting performance. Management noted that ICON modified the valuation methodology at the end of 2008 to better account for systemic risk. ICON implemented the modified valuation methodology in February 2009. During the discussion, management personnel noted that the markets continue to experience volatility and that when the markets are volatile, relative strength readings are also more volatile and less reliable It was also noted that volatility has affected ICON’s performance; that this had been the case for much of the last two years for the Funds; that poor quality stocks with low relative strength led the market whereas higher quality stocks with higher relative strength have not performed as well; that the market volatility and the relative strength component to our methodology have produced mixed results; and that many other value managers have had challenges in this market. The Adviser discussed its continuing assessment of its “investment model” – including steps taken to test the relative strength components of the system and methodology. Overall, the Board of Trustees concluded that the Adviser continues to believe the adjustments to the system have been functioning as intended; and that, notwithstanding that belief, the Adviser is constantly evaluating the system and will modify it as needed.
In connection with reviewing data bearing upon the nature, quality, and extent of services furnished by ICON to each Fund, the Board assessed data concerning ICON’s staffing, systems and facilities. The Board also assessed ICON’s non-Trust business to see if there are any initiatives that would dilute service to the Trust. The Board noted:
A. That the breadth and the quality of investment advisory and other services being provided to each Fund is satisfactory, as evidenced in part by efforts to address and improve the performance record of each
Fund when compared with the performance records of a peer group of comparable funds and markets in general;
B. That the breadth and the quality of investment advisory and other services being provided to each Fund is satisfactory, as evidenced in part by the AthenaInvest data (ratings based on an assessment of fund strategy) reflects that all Funds are rated 3 or higher and that, unlike many other fund groups, ICON Funds has no fund rated 1 or 2 (where 1 is the lowest and 5 is the highest).
C. That ICON has made significant expenditures in the past year and in prior years to ensure that it has the sophisticated systems and the highly trained personnel necessary for it to be able to continue to provide quality service to the Funds’ shareholders, including the dedication of substantial resources to ICON’s investment and trading departments;
D. That the Board, after considering compliance reports and compliance initiatives undertaken during the year and conducting individual interviews with selected portfolio managers, is satisfied with the research, portfolio management, and trading services, among others, being provided by ICON to the Funds, and is charging fair, reasonable, and competitive fees; and
E. The risks assumed by ICON in providing investment advisory services to each Fund including the capital commitments which have been made in the past and which continue to be made by ICON to ensure the continuation of the highest quality of service to the Trust is made with the recognition that the Trust’s advisory relationship with ICON be terminated at any time and must be renewed on an annual basis.
In considering the reasonableness of the fee payable to the Adviser for managing each Fund, the Board reviewed, among other things, data concerning other funds from the Lipper report, financial statements of the Adviser and an analysis of the profitability to the Adviser and its affiliates of their relationship with each Fund over various time periods, which analysis identified all revenues and other benefits received by the Adviser and its affiliates from managing each Fund, the costs associated with providing such services and the resulting profitability to the Adviser and its affiliates.
The Board considered the current and anticipated asset levels of each Fund and the willingness of the Adviser to waive fees and pay expenses of the Funds from time to time to limit the total expenses of the Funds. In this regard the Board discussed significantly reduced asset levels in each fund covered by the Advisory Agreements due to the tumultuous markets during the past three and a half years, to relative poor Fund performance, and to industry wide net-redemptions in reaction to the tumultuous markets. ICON’s
ability to provide the services called for under the Advisory Agreements was assessed in light of current and projected asset levels. Fund expenses and expense ratios were also assessed in light of current and projected asset levels. The Board concluded that the Adviser has the resources necessary to provide the services called for under the Advisory Agreements; that profitability to the Adviser and its affiliates from their relationship with the Funds is not excessive; and that the Adviser is not realizing material benefits from economies of scale that would warrant adjustments to the fees for any Fund at this time. The Board of Trustees concluded that, in light of the nature, extent and quality of the services provided by the Adviser and the levels of profitability associated with providing these services, the fees charged by the Adviser under the Advisory Agreements to each Fund are reasonable.
In connection with assessing data bearing the fairness of fee arrangements, the Board used data from Lipper report concerning funds of similar size and funds of larger size, as well as data concerning ICON’s other clients and noted that:
A. the advisory fee structures of the Funds were considered in comparison with advisory fees and expense ratios of other similarly managed funds as set forth in the comparative data;
B. expense ratios for 10 of the 17 Funds are above average, 4 are equal to the median, 2 are below both the average and the median, and 1 is equal to the average.;
C. in 16 of the 17 Funds, the assets under management are significantly below either the average or the median and that when the fund size approaches industry average our expenses also approach or are less than industry average.;
D. ICON has contractually agreed to impose expense limitations on certain Funds at a cost to ICON;
E. the advisory and other fees payable by the Funds to ICON are essentially fees which would be similar to those which would have resulted solely from “arm’s-length” bargaining, and may well be lower than fees arrived at solely from such arm’s-length negotiation;
F. the fees paid to ICON for managing other institutional accounts (such as pension plans) are not lower than the fees paid by similarly-managed funds; indeed, some institutional accounts have been encouraged to, and have in fact used, the Funds Z share class, but to the extent some fees of those accounts are lower, the reasons why such accounts are less costly for ICON to manage; and
G. ICON has contractually committed to break points in its fees so that economies of scale could be realized as a Fund grows in assets, for the benefit of Fund shareholders.
In connection with the direct and indirect benefits to ICON from serving as the Funds’ adviser, the Board discussed and noted that:
A. ICON benefits from serving directly or through affiliates as the principal underwriter and administrative agent for the Funds; that services provided by ICON and its affiliates to the Funds are satisfactory, and that fees derived from providing the services are competitive and reasonable; and
B. ICON receives research assistance (primarily in the form of data) from the use of soft dollars generated from Fund portfolio transactions; that such research assists ICON in providing quality advisory services; that Trust and Adviser compliance personnel continuously evaluate and report on the soft-dollar arrangements and related costs; and that the Board concluded that the arrangements are consistent with Fund brokerage practices and benefit the Funds and their shareholders.
Based on these considerations, among others, the Board, including a majority of the Independent Trustees, concluded that: 1) the continuation of the Advisory Agreement was in the best interests of each Fund and its shareholders, 2) the services to be performed under the Advisory Agreement were required for the operation of the Funds, 3) the advisory services were satisfactory to the Funds in the past, and 4) the fees for the advisory services and other benefits from the relationship with the Trust received by ICON were consistent with fees paid by similar funds, other clients of ICON, reasonable in light of the comparative data, and within the range of what would have been negotiated at arm’s length in light of all the circumstances.
Supplemental Tax Information
For corporate shareholders, the following percentage of the total ordinary income dividends paid during the fiscal year ended September 30, 2011, qualifies for the corporate dividends received deduction for the following Funds:
| | | | |
| Fund | | Dividends
Received
Deduction | |
ICON Consumer Staples Fund | | | 100% | |
ICON Energy Fund | | | 100% | |
ICON Financial Fund | | | 100% | |
ICON Healthcare Fund | | | 100% | |
ICON Industrials Fund | | | 100% | |
ICON Materials Fund | | | 88% | |
ICON Telecommunication & Utilities Fund | | | 100% | |
For the fiscal year ended September 30, 2011, the following funds paid qualified dividend income:
| | | | |
| Fund | | Amount | |
ICON Consumer Staples Fund | | | 100% | |
ICON Energy Fund | | | 100% | |
ICON Financial Fund | | | 100% | |
ICON Healthcare Fund | | | 100% | |
ICON Industrials Fund | | | 100% | |
ICON Materials Fund | | | 89% | |
ICON Telecommunication & Utilities Fund | | | 100% | |
The Funds had no long-term capital gain distributions qualifying for the maximum 15% income tax rate for individuals.
Portfolio Holdings
Information related to the 10 largest portfolio holdings of each Fund is made available at www.iconfunds.com within approximately 10 business days after month-end. Additionally, a complete list of each Fund’s holdings is made available approximately 30 days after month-end. Each ICON Fund also files a complete schedule of portfolio holdings for the first and third quarters of its fiscal year with the Securities and Exchange Commission (the “Commission”) on Form N-Q. The ICON Funds’ Forms N-Q are available at www.sec.gov or may be reviewed and copied at the Commission’s Public Reference Room in Washington, DC. Information about the Public Reference Room may be obtained by calling 1-800-SEC-0330.
Proxy Voting
A summarized description of the policies and procedures the ICON Funds use to vote proxies is available free of charge at www.iconfunds.com or by calling 1-800-764-0442.
Information about how the ICON Funds voted proxies related to each Fund’s portfolio securities during the 12-month period ended June 30 is available free of charge at www.iconfunds.com or on the Commission’s website at www.sec.gov.
Cost Basis Information
Effective January 1, 2012, federal law requires mutual fund companies to maintain and report a shareholder’s cost basis by tax lot, gain/loss information and holding period of covered shares to the Internal Revenue Service on Form 1099. Covered shares are mutual fund shares acquired on or after January 1, 2012. A fund is not required to maintain and report information for shares not deemed as covered.
The new law requires each fund to elect a default tax identification methodology in order to perform the required reporting. As a result, the Trust has chosen Average Cost as its default tax identification methodology. This is the method each Fund will use. However, at the time of purchase or upon the sale of covered shares, shareholders may choose a different tax identification method. Furthermore, if you purchase shares through a financial intermediary, please contact the intermediary to find out what default tax identification method they will use. We recommend that you consult your tax adviser to determine which tax identification methodology best suits your individual tax situation.
For More Information
This report is for the general information of the Funds’ shareholders and is not authorized for distribution to prospective investors unless preceded or accompanied by a current prospectus. You may obtain a copy of the prospectus, which contains information about the investment objectives, risks, charges, expenses, and share classes of each ICON Fund, by visiting www.iconfunds.com or by calling 1-800-764-0442. Please read the prospectus carefully before investing.
ICON Distributors, Inc., Distributor.
IMPORTANT NOTICE TO ALL SHAREHOLDERS OF THE ICON FUNDS:
The Trustees of the ICON Funds (the “Trust”) have amended the ICON Funds Master Trust Agreement dated September 19, 1996 as previously amended (the “MTA”), to expressly state that the Trustees have absolute power to reclassify shares of a Fund, or close a class of shares by merging or consolidating one class with another class of shares within a Fund, without seeking shareholder approval. The amendments state that this Trustee power is subject to the same limitation applicable to any Trustee amendment by providing that “the reclassification, merger or consolidation does not adversely affect the rights of the shareholders.” The amendments are focused on the classes of shares within a Fund, not the Fund itself. A copy of the Amended and Restated Master Trust Agreement (the “Amended and Restated MTA”), marked to show changes can be viewed at: www.iconfunds.com.
As provided in the MTA, the Trustees have authorized the offering of shares of seventeen Funds (sometimes referred to as series or Sub-Trusts). The Trustees have also authorized the offering of classes of shares of the Funds with an expense allocation plan. The expense allocation plan provides that the expenses of the respective share classes are: costs and charges that correspond to the differing distribution and service expenses of the sales and marketing channels used by investors to invest in the Funds; filing and/or registration fees charged by most states for offering or selling each class; and other class specific costs.
During the past year and a half, ICON management and the Trustees have discussed methods to reduce existing share class expenses and to increase Trust assets. ICON management proposed streamlining the existing class structure, which proposal called for a change in the number and type of share classes offered by certain of the ICON Funds. For example, certain ICON Diversified Funds have two similar classes: Class I & A. ICON management proposed merging Class I into Class A. Class A shares are strategically flexible because they can be marketed in both a load structure on a commission platform and a load-waived structure on no-load or NTF platforms. A similar issue exists with Class Z and S shares, where the primary difference between the two classes is Class S shares can be sold on platforms. ICON Management proposed a structure where, in general, each ICON Fund would have three share classes: Class A, C and S. Management proposed merging Class I with Class A, Class S with Class Z and renaming Class Z to Class S with all the attending rights of Class S. For information concerning share class structure, see Explanation of Share Classes at:
| | | | |
| IMPORTANT NOTICETO SHAREHOLDERS | | | 119 | |
www.iconfunds.com. The list of currently authorized classes of shares is also set forth in Section 4.1 of the Amended and Restated MTA.
The Trustees and their representatives questioned and debated whether the Trustees had the power to reclassify shares of a Fund, or close a class of shares by merging or consolidating one class with another class of shares within a Fund, without shareholder approval. The MTA gave shareholders limited voting rights. Shareholders can vote on an amendment to the MTA only if Section 7.3 of the MTA requires it; and, Section 7.3 has not required shareholder approval to reclassify shares of a Fund, or close a class of shares by merging or consolidating one class with another class of shares within a Fund.
On the other hand, the Trustees have the implied power and authority to merge or consolidate classes, but no expressed power. Section 3.2 of the MTA gives the Trustees all the powers necessary to conduct the business of the Trust. The Trustees have had specific authority to establish classes of shares or divide the shares of any Sub-Trust. The Trustees decided to exercise their specific power and amend the MTA to state explicitly that that they can merge or consolidate share classes without shareholder approval. Section 7.3 of the MTA specifically provides the Trustees with the power to amend the MTA, without shareholder approval, whether or not related to the rights of shareholders, as long as the amendment does not adversely affect the rights of any shareholder and is not in contravention of applicable law.
Based on the above, the Trustees believe it was unnecessary to seek shareholder approval to amend the MTA to clarify the Trustees’ powers. Never the less, ICON management requested outside cost estimates for seeking shareholder approval. Costs estimates ranged between $450,000 and $550,000. The Trustees rejected spending shareholder assets to seek approval.
Critically, no shareholder would be adversely affected under the proposed amendment. The dollar value of a shareholder’s interest in the eliminated class will be the same as the dollar value of that shareholder’s interest in the substitute class. It is, for all intents and purposes, only a reclassification of shares. If a shareholder does not like the new share class for any reason, a shareholder can simply redeem his/her shares.
Please read the Amended and Restated MTA carefully. If you have any questions, please call us at 1-800-764-0442, or email the ICON Funds at: info@iconadvisers.com.
| | |
| 120 | | IMPORTANT NOTICETO SHAREHOLDERS |
ICON FUNDS PRIVACY INFORMATION
| | |
| FACTS | | WHAT DOES ICON DO WITH YOUR PERSONAL INFORMATION? |
| | |
| Why? | | Financial companies choose how they share your personal information. Federal law gives consumers the right to limit some but not all sharing. Federal law also requires us to tell you how we collect, share, and protect your personal information. Please read this notice carefully to understand what we do. |
| | |
| What? | | The types of personal information we collect and share depend on the product or service you have with us. This information can include: n Social Security number and account balances n income and transaction history n checking account information and wire transfer instructions When you are no longer our customer, we continue to share your information as described in this notice. |
| | |
| How? | | All financial companies need to share customers’ personal information to run their everyday business. In the section below, we list the reasons financial companies can share their customers’ personal information; the reasons ICON chooses to share; and whether you can limit this sharing. |
| | | | |
| Reasons we can share your personal information | | Does ICON share? | | Can you limit this sharing? |
For our everyday business purposes — such as to process your transactions, maintain your account(s), respond to court orders and legal investigations, or report to credit bureaus | | Yes | | No |
For our marketing purposes — to offer our products and services to you | | No | | We don’t share |
| For joint marketing with other financial companies | | No | | We don’t share |
For our affiliates’ everyday business purposes — information about your transactions and experiences | | No | | We don’t share |
For our affiliates’ everyday business purposes — information about your creditworthiness | | No | | We don’t share |
| For nonaffiliates to market to you | | No | | We don’t share |
| | |
| Questions? | | Call 1-800-764-0442 for the ICON Funds and 1-800-828-4881 for ICON Advisers, Inc. and ICON Distributors, Inc. |
| | | | |
| FUNDS PRIVACY INFORMATION | | | 121 | |
| | |
| Who we are | | |
| Who is providing this notice? | | ICON Funds, ICON Advisers, Inc., and ICON Distributors, Inc. (collectively “ICON”) |
| What we do | | |
| How does ICON protect my personal information? | | To protect your personal information from unauthorized access and use, we use security measures that comply with federal law. These measures include computer safeguards and secured files and buildings. Contracts with our service providers require them to restrict access to your non-public personal information, and to maintain physical, electronic and procedural safeguards against unintended disclosure. |
| How does ICON collect my personal information? | | We collect your personal information, for example, when you n open an account or enter into an investment advisory contract n provide account information or give us your contact information n make a wire transfer We also collect your personal information from others, such as credit bureaus, affiliates, or other companies. |
| Why can’t I limit all sharing? | | Federal law gives you the right to limit only n sharing for affiliates’ everyday business purposes — information about your creditworthiness n affiliates from using your information to market to you n sharing for nonaffiliates to market to you State laws and individual companies may give you additional rights to limit sharing. |
| Definitions | | |
| Affiliates | | Companies related by common ownership or control. They can be financial and nonfinancial companies. n Our affiliates include financial companies such as ICON Funds, ICON Advisers, Inc., and ICON Distributors, Inc. |
| Nonaffiliates | | Companies not related by common ownership or control. They can be financial and nonfinancial companies. n Nonaffiliates we share with can include financial companies such as custodians, transfer agents, registered representatives, financial advisers and nonfinancial companies such as fulfillment, proxy voting, and class action service providers |
| Joint marketing | | A formal agreement between nonaffiliated financial companies that together market financial products or services to you. n ICON doesn’t jointly market |
| | |
| 122 | | FUNDS PRIVACY INFORMATION |
(This page is intentionally left blank)
For more information about the ICON Funds, contact us:
| | |
| |
| By Telephone | | 1-800-764-0442 |
| |
| By Mail | | ICON Funds
P.O. Box 55452
Boston, MA 02205-8165 |
| |
| In Person | | ICON Funds
5299 DTC Boulevard, 12th Floor
Greenwood Village, CO 80111 |
| |
| On the Internet | | www.iconfunds.com |
| |
| By E-Mail | | info@iconadvisers.com |
Item 2. Code of Ethics.
(a) The registrant has adopted a code of ethics that applies to the registrant’s principal executive officer, principal financial officer, principal accounting officer or controller, or persons performing similar functions. This code of ethics is included as an Exhibit.
(b) Not used.
(c) There were no amendments, during the period covered by this report, to a provision of the code of ethics that applies to the Registrant’s principal executive officer, principal financial officer, principal accounting officer or controller, or persons performing similar functions, regardless of whether these individuals are employed by the Registrant or a third party, and that relates to any element of the code of ethics description.
(d) The registrant has not granted any waivers, including an implicit waiver, from a provision of the code of ethics that applies to the Registrant’s principal executive officer, principal financial officer, principal accounting officer or controller, or persons performing similar functions, regardless of whether these individuals are employed by the Registrant or a third party, that relates to one or more of the items set forth in paragraph (b) of this item’s instructions.
(e) Not applicable.
(f) See the attached Exhibit.
Item 3. Audit Committee Financial Expert.
3(a)(1) The Registrant’s Board of Trustees has determined that the registrant has at least one audit committee financial expert serving on its audit committee.
3(a)(2) The audit committee financial experts are Glen F. Bergert and R. Michael Sentel, who are “independent” for purposes of this Item 3 of Form N-CSR.
3(a)(3) Not applicable.
Item 4. Principal Accountant Fees and Services.
(a) Audit Fees
In each of the fiscal years ended September 30, 2011 and September 30, 2010, the aggregate Audit Fees billed (or to be billed) by PricewaterhouseCoopers LLP (“PwC”) for professional services rendered for the audits of the financial statements, or services that are normally provided in connection with statutory and regulatory filings or engagements as well as reimbursable expenses are listed below. All of the below fees were paid by the Registrant.
| | |
| |
| 2011 | | 2010 |
| $352,200 | | $338,650 |
(b) Audit-Related Fees
In each of the fiscal years ended September 30, 2011 and September 30, 2010, the aggregate Audit-Related Fees billed (or to be billed) by PwC for services rendered for assurance and related services to each fund that are reasonably related to the performance of the audit or review of the fund’s financial statements, but not reported as Audit Fees, are shown in the table below.
| | |
| |
| 2011 | | 2010 |
| $8,220* | | $24,100** |
| * | This fee was related to procedures performed during a reprocessing event. |
| ** | This fee was related to procedures performed when the Registrant changed service providers. |
(c) Tax Fees
In each of the fiscal years ended September 30, 2011 and September 30, 2010 the aggregate Tax Fees billed (or to be billed) by PwC for professional services rendered for tax return preparation, tax compliance, tax advice and tax planning are shown in the table below. In the fiscal year ending September 30, 2010, PwC also rendered professional services for service provider conversion procedures. All of the below fees were paid by the Registrant.
| | |
| |
| 2011 | | 2010 |
| $118,425 | | $127,370 |
(d) All Other Fees
In each of the fiscal years ended September 30, 2011 and September 30, 2010 the aggregate Other Fees billed (or to be billed) by PwC for all other non-audit services rendered are shown in the table below. All of the below fees were paid by the Registrant.
(e)(1) The audit committee of the Registrant’s Board of Trustees is required to pre-approve all services to be provided by the independent accountants to the Registrant or the Registrant’s investment adviser and to any entity controlling, controlled by or under common control with the investment adviser that provides on-going services to the Registrant to determine whether the services performed by the independent accountants impair their independence from the Registrant. The audit committee has delegated authority to the Chairman of the audit committee, subject to review and ratification by the full audit committee.
(e)(2) 100% of the fees were approved by the Registrant’s audit committee pursuant to paragraph (c)(7)(i)(C) if Rule 2-01 of Regulation S-X.
(f) For the fiscal year ended September 30, 2011, the percentage of hours spent on the audit of the Registrant’s financial statements that were attributed to work performed by persons who are not full-time, permanent employees of PwC was 0%.
(g) See Item 4(d) above.
(h) There were no non-audit fees provided by PwC in the fiscal year ending September 30, 2011 or September 30, 2010 to the investment adviser or to any entity controlling, controlled by, or under common control with the investment adviser that provides on-going services to the Registrant.
Item 5. Audit Committee of Listed Registrants.
Not applicable.
Item 6. Investments.
| (a) | The schedule of investments in securities of unaffiliated issuers is included in Item 1. |
Item 7. Disclosure of Proxy Voting Policies and Procedures for Closed-End Management Investment Companies.
Not applicable.
Item 8. Portfolio Managers of Closed-End Management Investment Companies.
Not applicable.
Item 9. Purchases of Equity Securities by Closed-End Management Investment Company and Affiliated Purchasers.
Not applicable.
Item10. Submission of Matters to a Vote of Security Holders.
Not applicable.
Item 11. Controls and Procedures.
(a) The registrant’s principal executive officer and principal financial officer have concluded, based on their evaluation of the Registrant’s disclosure controls and procedures as conducted within 90 days of the filing date of this report, that these disclosure controls and procedures are adequately designed and are operating effectively to ensure that information required to be disclosed by the registrant on Form N-CSR is recorded, processed, summarized and reported within the time periods specified in the Securities and Exchange Commission’s rules and forms.
(b) There were no changes in the registrant’s internal control over financial reporting that occurred during the second fiscal quarter of the period covered by this report that have materially affected or are reasonably likely to materially affect, the registrant’s internal control over financial reporting.
Item 12. Exhibits.
(a)(1) The code of ethics is attached.
(a)(2) Certifications pursuant to Rule 30a-2(a) are attached.
(a)(3) Not applicable.
| (b) | Certifications pursuant to Rule 30a-2(b) are furnished herewith. |
SIGNATURES
Pursuant to the requirements of the Securities Exchange Act of 1934 and the Investment Company Act of 1940, the registrant has duly caused this report to be signed on its behalf by the undersigned, thereunto duly authorized.
| | |
| (Registrant) | | ICON Funds |
| |
| By (Signature and Title)* | | /s/ Craig T. Callahan |
| | Craig T. Callahan, President and Chief Executive Officer (Principal Executive Officer) |
| |
| Date | | December 2, 2011 |
Pursuant to the requirements of the Securities Exchange Act of 1934 and the Investment Company Act of 1940, this report has been signed below by the following persons on behalf of the registrant and in the capacities and on the dates indicated.
| | |
| |
| By (Signature and Title)* | | /s/ Craig T. Callahan |
| | Craig T. Callahan, President and Chief Executive Officer (Principal Executive Officer) |
| |
| Date | | December 2, 2011 |
| |
| By (Signature and Title)* | | /s/ Erik L. Jonson |
| | Erik L. Jonson, Vice President, Chief Financial Officer and Treasurer (Principal Financial Officer and Principal Accounting Officer) |
| |
| Date | | December 2, 2011 |
| * | Print the name and title of each signing officer under his or her signature. |