Table of Contents
UNITED STATES
SECURITIES AND EXCHANGE COMMISSION
Washington, D.C. 20549
FORM N-CSR
CERTIFIED SHAREHOLDER REPORT OF REGISTERED
MANAGEMENT INVESTMENT COMPANIES
Investment Company Act file number 811-07883
ICON Funds
(Exact name of registrant as specified in charter)
5299 DTC Blvd.
Suite 1200 Greenwood Village, CO 80111
(Address of principal executive offices) (Zip code)
Carrie M. Schoffman
5299 DTC Blvd.
Suite 1200 Greenwood Village, CO 80111
(Name and address of agent for service)
Registrant’s telephone number, including area code: 303-790-1600
Date of fiscal year end: September 30, 2014
Date of reporting period: September 30, 2014
Table of Contents
| Item 1. | Reports to Stockholders. |
Table of Contents

2014 ANNUAL REPORT
ICON DIVERSIFIED FUNDS
INVESTMENT UPDATE
ICON Bond Fund
ICON Equity Income Fund
ICON Fund
ICON Long/Short Fund
ICON Opportunities Fund
ICON Risk-Managed Balanced Fund

1-800-764-0442 | www.iconfunds.com
Table of Contents

You can now sign up for electronic delivery of ICON Fund shareholder reports, including prospectuses, annual reports, semiannual reports and proxy statements.
When these materials are available, you will receive an email from ICON with instructions on how to view the documents. Statements, transaction confirmations and other documents that are not available online will continue to be sent to you by U.S. mail.
Visit ICON’s website at www.iconfunds.com to learn more and sign up.
You may change or cancel your participation in eDelivery by visiting www.iconfunds.com, or you can request a hard copy of any of the materials free of charge by calling ICON Funds at 1-800-764-0442.
1-800-764-0442 • www.iconfunds.com
Table of Contents

| 2 | ||||
| 6 | ||||
Management Overview (Unaudited) and Schedules of Investments | ||||
| 9 | ||||
| 17 | ||||
| 24 | ||||
| 29 | ||||
| 35 | ||||
| 40 | ||||
| 50 | ||||
| 62 | ||||
| 68 | ||||
| 88 | ||||
| 89 | ||||
| 92 | ||||
| 95 | ||||
| 103 | ||||
Table of Contents
Historical Returns
All total returns mentioned in this Report account for the change in a Fund’s per-share price and the reinvestment of any dividends, capital gain distributions and adjustments for financial statement purposes. If your account is set up to receive Fund distributions in cash rather than to reinvest them, your actual return may differ from these figures. The Funds’ performance results do not reflect the deduction of taxes that a shareholder would pay on Fund distributions or on the redemption of Fund shares. The Adviser may have reimbursed certain fees or expenses of some of the Funds. If not for these reimbursements, performance would have been lower. Fund results shown, unless otherwise indicated, are at net asset value. If a sales charge (maximum 5.75%) had been deducted, results would have been lower.
Past performance does not guarantee future results. Investment return and principal value will fluctuate so that an investor’s shares, when redeemed, may be worth more or less than their original cost. Performance results represent past performance, and current performance may be higher or lower. Please call 1-800-764-0442 or visit www.iconfunds.com for performance results current to the most recent month-end.
Portfolio Data
This Report reflects ICON’s views, opinions and portfolio holdings as of September 30, 2014, the end of the reporting period. The information is not a complete analysis of every aspect of any sector, industry, security or the Funds.
Opinions and forecasts regarding industries, companies and/or themes, and portfolio composition and holdings are subject to change at any time based on market and other conditions, and should not be construed as a recommendation of any specific security, industry or sector. Each Fund’s holdings as of September 30, 2014 are included in each Fund’s Schedule of Investments.
According to ICON, value investing is an analytical approach to investing that employs various factors, including projecting earnings growth estimates, in an effort to determine whether securities are over- or underpriced relative to ICON’s estimates of their intrinsic value. Value investing involves risks and uncertainties and does not guarantee better performance or lower costs than other investment methodologies. ICON’s value-to-price ratio (“V/P”) is a ratio of intrinsic value, as calculated using ICON’s proprietary valuation methodology, of a broad range of domestic and international securities within ICON’s system as compared to the current market price of those securities. The ICON system relies on the integrity of the financial statements released to the market as part of our analysis.
| 2 | ABOUT THIS REPORT |
Table of Contents
This Report contains statements regarding industry or sector themes, new market themes, investment outlook, relative strength, value-to-price ratios, and investment team expectations, beliefs, goals and the like that are based on current expectations, recent individual stock performance relative to current market prices, estimates of company values and other information supplied to the market by the companies we follow. Words such as “expects,” “suggests,” “anticipates,” “targets,” “goals,” “value,” “intrinsic value,” “indicates,” “believes,” “considers,” “estimates,” variations of such words and similar expressions are intended to identify forward looking statements, which are not statements of historical fact. Forward looking statements are not guarantees of future performance and involve certain risks, uncertainties and assumptions that are difficult to assess. These risks and uncertainties are based on a number of important factors, including, among others: stock price fluctuations; the integrity and accuracy of historical and projected financial and other information supplied by companies to the public or assumptions based on such information supplied; interest rates; bond yields; future earnings growth rates; the risks noted in this Report and other factors beyond the control of our investment team but used by the investment team to influence their assumptions. Therefore, actual outcome may differ materially from what is expressed in such forward looking statements.
There are risks associated with mutual fund investing, including the loss of principal. The likelihood of loss may be greater if you invest for a shorter period of time. There is no assurance that the investment process will consistently lead to successful results.
There are risks associated with selling short, including the risk that the ICON Long/Short Fund may have to cover its short position at a higher price than the short price, resulting in a loss. The ICON Long/Short Fund’s loss on a short sale is potentially unlimited as a loss occurs when the value of a security sold short increases. Call options involve certain risks, such as limited gains and lack of liquidity in the underlying securities, and are not suitable for all investors.
Investing in fixed income securities such as bonds involves interest rate risk. When interest rates rise, the value of fixed income securities generally decreases. Effective May 5, 2014 the ICON Bond Fund may invest up to 35% of its assets in high-yield bonds that are below investment grade. Prior to May 5, 2014 the Bond Fund was limited to 25% in below investment grade bonds. The ICON Equity Income Fund may invest up to 25% of its assets in high-yield bonds that are below investment grade. ICON Risk-Managed Balanced Fund may invest up to 10% of its assets in high-yield bonds that are below investment grade. High-yield bonds involve a greater risk of default and price volatility than U.S. Government and other higher-quality bonds.
An investment concentrated in sectors and industries may involve greater risk and volatility than a more diversified investment.
| ABOUT THIS REPORT | 3 |
Table of Contents
Investments in foreign securities may entail unique risks, including political, market, and currency risks. Financial statements of foreign companies are governed by different accounting, auditing, and financial standards than U.S. companies and may be less transparent and uniform than in the United States. Many corporate governance standards, which help ensure the integrity of public information in the United States, do not exist in foreign countries. In general, there may be less governmental supervision of foreign stock exchanges and securities brokers and issuers. The ICON system relies on the integrity of financial statements released to the market as part of our analysis.
Investments in other mutual fund companies may entail certain risks. For example, the Fund’s performance depends on the underlying funds in which it invests, and it is subject to the risks of the underlying funds. Additionally, an investment by the Fund or underlying fund in exchange-traded funds generally presents the same primary risks as an investment in a mutual fund.
The prospectus and statement of additional information contain this and other information about the Funds and are available by visiting www.iconfunds.com or calling 1-800-764-0442. Please read the prospectus and statement of additional information carefully.
Comparative Indexes
The comparative indexes discussed in this Report are meant to provide a basis for judging a Fund’s performance against specific securities indexes. Each index shown accounts for both change in the security price and reinvestment of dividends and distributions (except as noted), but does not reflect the costs of managing a mutual fund. The Funds’ portfolios may significantly differ in holdings and composition from the index. Individuals cannot invest directly in an index.
| • | The unmanaged Standard & Poor’s (“S&P”) Composite 1500 Index (“S&P Composite 1500 Index”) is a broad-based capitalization-weighted index comprising 1,500 stocks of large-cap, mid-cap, and small-cap U.S. companies. |
| • | The unmanaged Barclays Capital U.S. Universal Index (ex-MBS) represents the union of the U.S. Aggregate Index, the U.S. High-Yield Corporate Index, the 144A Index, the Eurodollar Index and the Emerging Markets Index. All securities in this market-value weighted index have at least one year remaining to maturity and meet certain minimum issue size criteria. |
| • | The unmanaged Standard & Poor’s (“S&P”) SmallCap 600 Index (“S&P SmallCap 600 Index”) is a broad-based capitalization-weighted index comprising 600 stocks of small-cap U.S. companies. |
| 4 | ABOUT THIS REPORT |
Table of Contents
Index returns and statistical data included in this Report are provided by FactSet Research Systems.
Financial Intermediary
If you purchase the Fund through a broker-dealer or other financial intermediary (such as a bank), the Fund and its related companies may pay the intermediary for the sale of Fund shares and related services. These payments may influence the broker-dealer or other intermediary and your salesperson to recommend the Fund over another investment. Ask your salesperson or visit your financial intermediary’s website for more information.
| ABOUT THIS REPORT | 5 |
Table of Contents
MESSAGE FROM ICON FUNDS (UNAUDITED)
Dear Shareholder,
The graph below shows the S&P Composite 1500 Index and a subset of it, the S&P SmallCap 600 Index (“S&P SmallCap 600 Index”) from 9/30/13 through 10/6/14 (our fiscal year plus a few days into October). It reveals a fragmented, divergent market in 2014. The two indexes moved similarly in late 2013, then diverged in 2014. The 1500, lifted by a few large-cap stocks, moved 7.5% higher year to date through September 30, 2014, while the small-cap component of it is negative for 2014, as highlighted in the table. In addition to that divergence, there have been a few rapid, short term industry and sector theme reversals during each up and down phase, more easily seen on the Small Cap chart. We believe the divergence and the theme reversals can be explained by investors’ reaction to three situations.

Index | 9/30/13-12/31/13 | 12/31/13-9/30/14 | ||||||
S&P Composite 1500 | 10.3% | 7.5% | ||||||
S&P SmallCap 600 | 9.8% | -3.7% | ||||||
The first situation relates to investors’ reactions to a surprise negative Gross Domestic Product (GDP). Entering the first quarter of 2014, most forecasters were calling for positive real GDP. However, as the quarter unfolded it became apparent that something was wrong. Now, looking back, we know real GDP was at a negative 2.1% pace for the year. Investors flipped from favoring cyclical industries and sectors in late 2013 to favoring defensive, recession proof ones in early 2014. This theme change lasted only three and
| 6 | MESSAGE FROM ICON FUNDS |
Table of Contents
a half months for the 1500 Index and one month longer for the 600 Index, too quick for a value-based system to capture.
The second situation involves investors’ reactions to a rise in the U.S. Dollar. From June 30, 2013 through September 30, 2014, the U.S. Dollar Index (DXY) gained 7.7%, which is still 28.5% below its peak in 2002. It appears many investors and speculators adjusted their equity portfolios, attempting to guess which industries and stocks would either benefit from or be hurt by a stronger US Dollar. We have found economic reactions to currency swings to be less dramatic and slower than theory would suggest so we suspect these investors may be over reacting lately.
The last situation relates to investors’ speculation on rising interest rates. In anticipation of the Federal Reserve ending its quantitative easing program, there appeared to be a popular belief that both short-term and long-term interest rates would increase. Investors who believed this might have adjusted their equity portfolios in anticipation of higher interest rates and their behavior affected stock prices. First, it should be mentioned that ICON believes, and has stated, that interest rates can go low and stay low for many years. We see no support for higher long term interest rates. We sense, however, that we are in the minority with that outlook. We believe the many investors who expect higher interest rates bought stocks they think will benefit from higher rates and sold stocks they think will be hurt by rate increases. For example, it might be that these investors, believing that rising rates will hurt small cap stocks more than large cap stocks, bought large cap issues while avoiding small cap stocks altogether. Similarly, believing that higher rates would have a negative impact on certain industries, they avoided industries in the Consumer Discretionary sector that have an element of consumer borrowing such as the homebuilders, automobile manufacturers and home furnishing industries.
We believe investors’ reactions to a surprise negative GDP quarter, a rise in the US Dollar and an anticipated rise interest rates have contributed to moves in stocks that were not related to value of the stocks themselves. We have seen overpriced stocks (in our opinion) get bid up higher and underpriced stocks taken lower as investors try to get repositioned. This recent trend of positioning equity portfolios for anticipated higher interest rates and a rising US Dollar is stretching the valuation in some industries according to our system. However, according to our methodology, industries favored by these speculators are becoming overpriced while disfavored industries are becoming underpriced. Given this scenario, we expect this behavior to end sometime in the next year.
The first week of October 2014 our ICON market value-to-price (V/P) ratio has been in the 1.06 – 1.10 range, indicating stocks, on average, are priced
| MESSAGE FROM ICON FUNDS | 7 |
Table of Contents
below our estimate of fair value and giving us the expectation that stock prices can move higher over the next year. Over the course of the last year value has grown and prices of some stocks have kept pace, but, as seen in the graph, some have lagged behind. As mentioned above, we believe this disconnect is due to concerns about the strength of the U.S. Dollar and the expectation of rising interest rates. We are finding better value in the cyclical, economically sensitive industries rather than the so-called recession proof industries. With an overall V/P ratio of 1.10 and many industry valuation readings stretched, we will buy the best bargains we can find and have the patience to wait for investors to ultimately recognize value. Our valuation readings, coupled with various supportive conditions such as low inflation, low interest rates, no shortages of capital or commodities and modest economic growth, lead us to believe we are in a favorable setting for owning equities.

Craig Callahan D.B.A.
Chief Executive Officer
ICON Advisers, Inc.
| 8 | MESSAGE FROM ICON FUNDS |
Table of Contents
MANAGEMENT OVERVIEW (UNAUDITED) | Class S Class C Class A | IOBZX IOBCX IOBAX |
| Q. | How did the Fund perform relative to its benchmark? |
| A. | For the Fund’s fiscal year ended September 30, 2014, the ICON Bond Fund (the Fund) Class S shares outperformed its benchmark, the Barclays Capital US Universal Index. The Fund returned 6.01% while the Barclays Capital U.S. Universal Index Excluding Mortgage Backed Securities returned 4.60%. Total returns for other periods and additional Class shares as of September 30, 2014, appear in the subsequent pages of this Fund’s Management Overview. |
| Q. | What primary factors were behind the Fund’s relative performance? |
| A. | Fiscal year 2014 caught many investors off guard as a largely anticipated bond sell-off turned into a strong rally as yields fell across the board. The yield on the U.S. Generic Government 10-year Treasury began the fiscal year at a value of 2.62%, rose above 3.00% by the end of the calendar year 2013, fell below 2.45% at the end of May 2014 in response to some macro-economic uncertainty, and finally finished the fiscal year at a value of 2.49%. In addition to the rally in the U.S. treasury market, corporate bond spreads tightened throughout the majority of the fiscal year in both investment grade and high yield corporate bonds before experiencing some volatility during the third quarter of 2014. While the ICON Bond Fund maintained a lower overall duration over the course of the time period resulting less relative curve effect, the Fund was able to outperform the broad based fixed income benchmark during the fiscal year through a combination of bond selections within the corporate bond segment of the market and active allocation to both preferred shares and closed-end fund positions. In the corporate bond space, we maintained a lower overall duration relative to the benchmark but selections in the Energy, Financials, and Telecommunications sectors of the market outperformed the market as a whole. As spreads continued to tighten we focused on other segments of the market to produce alpha for our investors, including certain preferred issues. All of our positions in this space produced positive returns, but three specific holdings within the real estate segment of the market did particularly well with one position producing a large gain due to a company issued call. Lastly, holdings within the closed-end segment of the market also produced positive returns as either net asset value (NAV) based movement or discount arbitrage opportunities were realized. The end result of these portfolio adjustments was outperformance during the period for the ICON Bond Fund in the face of a large duration based drag. |
| MANAGEMENT OVERVIEW | 9 |
Table of Contents
| Q. | How did the Fund’s composition affect performance? |
| A. | As stated above, the Fund was able to outperform its benchmark during the fiscal year. Further analysis shows the outperformance stemmed from both selection effect and allocation effect while relative curve effect (gains from interest rate movements) was negative over the fiscal year. Positive selection effect came from both the corporate bond segment of the market where selections within the Energy, Financials, and Telecommunications sectors of the market saw larger spread movement than the broad market, as well as closed-end fund positions where either discount tightening was realized or activist actions resulted in fund tender plays. Positive allocation effect came from strong performance in corporate bonds, closed-end funds, and preferred shares. Finally, negative curve effect resulted from the Fund being positioned in shorter duration securities while there was a large rate rally over the course of the fiscal year. Based on our internal assumption of risk and returns we felt as though duration extension was unwarranted and would rather look to focus on bottom up security selection. |
| Q. | What is your investment outlook for the bond market? |
| A. | The end of fiscal year 2014 saw an increase in both spread and interest rate volatility as concerns about domestic and global growth began to emerge. Overall, we generally believe these concerns are unwarranted and the volatility in spread product will create opportunities in the end. While we don’t anticipate a substantial upward movement in interest rates over the course of the next 12 months, the Fund is positioned in the lower portion of its duration range as we move into fiscal year 2015. As in fiscal year 2014, we continue to shy away from interest rate forecasts and remain steadfast in our search for issue specific opportunities. We are looking for opportunities that have the characteristics of credit upgrades, special situations, or anticipated future bond tenders. While future bond market volatility might be substantial, we believe our unique investment methodology will help the Fund navigate the changing market. |
| 10 | MANAGEMENT OVERVIEW |
Table of Contents
ICON Bond Fund
Credit Diversification
September 30, 2014
Aaa | 12.1% | |||
A1 | 4.2% | |||
A2 | 0.4% | |||
A3 | 8.4% | |||
Baa1 | 10.5% | |||
Baa2 | 5.9% | |||
Baa3 | 12.3% | |||
Ba1 | 3.7% | |||
Ba2 | 3.0% | |||
Ba3 | 4.5% | |||
B2 | 3.2% | |||
B3 | 4.2% | |||
Caa1 | 3.4% | |||
|
| |||
| 75.8% | ||||
|
|
Percentages are based upon U.S. Treasury obligations, corporate and foreign corporate bond investments as a percentage of net assets. Ratings based on Moody’s Investors Service, Inc.
| MANAGEMENT OVERVIEW | 11 |
Table of Contents
ICON Bond Fund
Average Annual Total Return
as of September 30, 2014
| Inception Date | 1 Year | 5 Years | 10 Years | Since Inception | Gross Expense Ratio* | Net Expense Ratio* | ||||||||||||||||||||||
ICON Bond Fund - | 5/6/04 | 6.01% | 5.03% | 4.63% | 4.87% | 0.89% | 0.75% | |||||||||||||||||||||
ICON Bond Fund - | 10/21/02 | 5.10% | 4.14% | 3.76% | 4.37% | 2.06% | 1.60% | |||||||||||||||||||||
ICON Bond Fund - | 9/30/10 | 5.77% | N/A | N/A | 3.48% | 1.34% | 1.00% | |||||||||||||||||||||
ICON Bond Fund - | 9/30/10 | 0.77% | N/A | N/A | 2.23% | 1.34% | 1.00% | |||||||||||||||||||||
Barclays Capital U.S. Universal Index | 4.39% | 4.66% | 4.90% | 5.24% | N/A | N/A | ||||||||||||||||||||||
Barclays Capital U.S. Universal Index (ex-MBS) | 4.60% | 5.12% | 4.92% | 5.45% | N/A | N/A | ||||||||||||||||||||||
Past performance is not a guarantee of future results. Information about these performance results and the comparative indexes can be found in the About This Report section. The Adviser has agreed to limit certain Fund expenses; without these limitations, returns would have been lower. The limitation provisions may be terminated in the future.
| * | Please see the most recent prospectus for details. |
Class C total returns exclude applicable sales charges. If sales charges were included returns would be lower.
| 12 | MANAGEMENT OVERVIEW |
Table of Contents
ICON Bond Fund
Value of a $10,000 Investment
through September 30, 2014

Past performance is not a guarantee of future results. The above graph compares a $10,000 investment made in the Bond Fund’s Class S shares on the Class’ inception date of 5/6/04 to a $10,000 investment made in an unmanaged securities index on that date. Performance for the Bond Fund’s other share classes will vary due to differences in charges and expenses. The Bond Fund’s performance in this chart and the performance table assumes the reinvestment of dividends and capital gain distributions but does not reflect the deduction of taxes that a shareholder would pay on Fund distributions or on the redemption of Fund shares.
| MANAGEMENT OVERVIEW | 13 |
Table of Contents
ICON BOND FUND
SCHEDULEOF INVESTMENTS
SEPTEMBER 30, 2014
| Shares or Principal Amount | Interest Rate | Maturity Date | Value | |||||||||||||
| Corporate Bonds (57.2%) | ||||||||||||||||
| $ | 2,000,000 | AIG Life Holdings, Inc. | 6.63 | % | 02/15/29 | $ | 2,456,090 | |||||||||
| 2,798,000 | Altria Group, Inc. | 9.25 | % | 08/06/19 | 3,642,459 | |||||||||||
| 1,000,000 | Brightstar Corp.(a) | 7.25 | % | 08/01/18 | 1,076,250 | |||||||||||
| 3,450,000 | Clearwire Communications LLC / Clearwire Finance, Inc.(a) | 14.75 | % | 12/01/16 | 4,286,625 | |||||||||||
| 1,000,000 | Comcast Cable Holdings LLC | 10.13 | % | 04/15/22 | 1,387,262 | |||||||||||
| 2,500,000 | Cullen/Frost Capital Trust II(b) | 1.78 | % | 03/01/34 | 2,194,746 | |||||||||||
| 1,300,000 | Everest Reinsurance Holdings, Inc.(b) | 6.60 | % | 05/01/67 | 1,358,500 | |||||||||||
| 2,000,000 | Freescale Semiconductor, Inc. | 10.75 | % | 08/01/20 | 2,220,000 | |||||||||||
| 1,000,000 | Fulton Capital Trust I Ltd. | 6.29 | % | 02/01/36 | 965,000 | |||||||||||
| 780,000 | GE Capital Franchise Finance Corp., MTN | 7.10 | % | 11/30/26 | 997,229 | |||||||||||
| 2,500,000 | General Electric Capital Corp., Series A, FRN(b) | 7.13 | % | 06/15/22 | 2,893,750 | |||||||||||
| 1,000,000 | General Electric Capital Corp., Series B(b) | 6.25 | % | 12/15/22 | 1,077,500 | |||||||||||
| 2,750,000 | General Electric Capital Corp. / LJ VP Holdings LLC(a) | 3.80 | % | 06/18/19 | 2,929,074 | |||||||||||
| 1,000,000 | Gibson Brands, Inc.(a) | 8.88 | % | 08/01/18 | 977,500 | |||||||||||
| 1,500,000 | Goodman Networks, Inc.(c) | 12.13 | % | 07/01/18 | 1,575,000 | |||||||||||
| 1,300,000 | GRD Holdings III Corp.(a) | 10.75 | % | 06/01/19 | 1,433,250 | |||||||||||
| 1,000,000 | Ingersoll-Rand Co. | 6.39 | % | 11/15/27 | 1,192,033 | |||||||||||
| 1,549,805 | Kiowa Power Partners LLC(a) | 5.74 | % | 03/30/21 | 1,613,352 | |||||||||||
| 3,500,000 | Lender Processing Services, Inc. / Black Knight Lending Solutions, Inc. | 5.75 | % | 04/15/23 | 3,657,500 | |||||||||||
| 1,000,000 | Liberty Mutual Group, Inc.(a)(b) | 7.00 | % | 03/07/67 | 1,060,000 | |||||||||||
| 1,000,000 | Masco Corp. | 5.95 | % | 03/15/22 | 1,092,500 | |||||||||||
| 2,439,000 | MBIA, Inc. | 6.63 | % | 10/01/28 | 2,487,780 | |||||||||||
| 2,500,000 | Prudential Financial, Inc.(b) | 8.88 | % | 06/15/68 | 3,015,625 | |||||||||||
| 300,000 | Prudential Holdings LLC, Series FSA(a) | 7.25 | % | 12/18/23 | 368,599 | |||||||||||
| 2,000,000 | Prudential Insurance Co. of America(a) | 8.30 | % | 07/01/25 | 2,715,978 | |||||||||||
| 1,000,000 | Regions Financial Corp. | 7.75 | % | 09/15/24 | 1,195,186 | |||||||||||
| 1,500,000 | SESI LLC | 7.13 | % | 12/15/21 | 1,657,500 | |||||||||||
| 1,000,000 | United Refining Co. | 10.50 | % | 02/28/18 | 1,065,000 | |||||||||||
| 1,500,000 | UnitedHealth Group, Inc. | 3.88 | % | 10/15/20 | 1,606,032 | |||||||||||
|
| |||||||||||||||
|
| Total Corporate Bonds (Cost $54,486,273) |
| 54,197,320 | |||||||||||||
| U.S. Treasury Obligations (12.1%) | ||||||||||||||||
| 4,000,000 | U.S. Treasury Note | 1.88 | % | 08/31/17 | 4,092,812 | |||||||||||
| 14 | SCHEDULEOF INVESTMENTS |
Table of Contents
| Shares or Principal Amount | Interest Rate | Maturity Date | Value | |||||||||||||
| $ | 3,500,000 | U.S. Treasury Note | 1.13 | % | 12/31/19 | $ | 3,369,842 | |||||||||
| 2,000,000 | U.S. Treasury Note | 0.25 | % | 02/28/15 | 2,001,718 | |||||||||||
| 2,000,000 | U.S. Treasury Note | 0.13 | % | 12/31/14 | 2,000,312 | |||||||||||
|
| |||||||||||||||
|
| Total U.S. Treasury Obligations (Cost $11,444,296) |
| 11,464,684 | |||||||||||||
| Foreign Corporate Bonds (6.5%) | ||||||||||||||||
| 1,000,000 | CHC Helicopter S.A. | 9.38 | % | 06/01/21 | 1,055,000 | |||||||||||
| 2,000,000 | Drill Rigs Holdings, Inc.(a) | 6.50 | % | 10/01/17 | 1,990,000 | |||||||||||
| 3,000,000 | Shelf Drilling Holdings Ltd.(a)(d) | 8.63 | % | 11/01/18 | 3,150,000 | |||||||||||
|
| |||||||||||||||
|
| Total Foreign Corporate Bonds (Cost $6,448,028) |
| 6,195,000 | |||||||||||||
| Shares or Principal Amount | Value | |||||||||||||||
| Closed-End Mutual Funds (8.9%) | ||||||||||||||||
| 38,036 | Brookfield High Income Fund, Inc.(d) | $ | 356,397 | |||||||||||||
| 256,678 | Diversified Real Asset Income Fund(d) | 4,550,901 | ||||||||||||||
| 30,586 | Firsthand Technology Value Fund, Inc.†(d) | 734,370 | ||||||||||||||
| 81,884 | Nuveen Diversified Currency Opportunities Fund | 872,884 | ||||||||||||||
| 62,575 | Nuveen Dividend Advantage Municipal Fund 3(d) | 855,400 | ||||||||||||||
| 12,864 | Nuveen Dividend Advantage Municipal Income Fund | 181,511 | ||||||||||||||
| 21,513 | Nuveen Municipal Advantage Fund, Inc. | 290,210 | ||||||||||||||
| 44,414 | Nuveen Quality Income Municipal Fund, Inc. | 608,028 | ||||||||||||||
|
| |||||||||||||||
|
| Total Closed-End Mutual Funds (Cost $8,205,003) | 8,449,701 | ||||||||||||||
| Preferred Stocks (7.6%) | ||||||||||||||||
| 95,482 | American Homes 4 Rent REIT, Series B(e) | 2,278,201 | ||||||||||||||
| 18,829 | Digital Realty Trust, Inc., Series E(d) | 484,658 | ||||||||||||||
| 104,543 | Equity Commonwealth, Series E(d) | 2,666,892 | ||||||||||||||
| 56,750 | Gramercy Property Trust, Inc., Series B(d) | 1,427,262 | ||||||||||||||
| 12,532 | Protective Life Corp.(d) | 322,323 | ||||||||||||||
|
| |||||||||||||||
|
| Total Preferred Stocks (Cost $7,221,331) | 7,179,336 | ||||||||||||||
| Collateral for Securities on Loan (5.4%) | ||||||||||||||||
| 5,128,327 | State Street Navigator Prime Portfolio, 0.15% | 5,128,327 | ||||||||||||||
|
| |||||||||||||||
|
| Total Collateral for Securities on Loan (Cost $5,128,327) | 5,128,327 | ||||||||||||||
| Short-Term Investments (4.6%) | ||||||||||||||||
| $ | 4,407,264 | State Street Euro Dollar Time Deposit (USD), 0.01%, 10/01/14 | 4,407,264 | |||||||||||||
|
| |||||||||||||||
|
| Total Short-Term Investments (Cost $4,407,264) | 4,407,264 | ||||||||||||||
| SCHEDULEOF INVESTMENTS | 15 |
Table of Contents
| Shares or Principal Amount | Value | |||||||||
| Total Investments 102.3% (Cost $97,340,522) | $ | 97,021,632 | ||||||||
| Liabilities Less Other Assets (2.3)% | (2,189,725 | ) | ||||||||
|
| |||||||||
| Net Assets 100.0% | $ | 94,831,907 | ||||||||
|
| |||||||||
The accompanying notes are an integral part of the financial statements.
| † | Non-income producing security. |
| (a) | 144A - Exempt from registration under Rule 144A of the Securities Act of 1933. These securities may be resold in transactions exempt from registration, typically only to qualified institutional buyers. Unless otherwise indicated, these securities are not considered to be illiquid. |
| (b) | Floating Rate Security. Rate disclosed is as of September 30, 2014. |
| (c) | Step Bond - the coupon is at a fixed rate and resets at a specific date and rate. The rate disclosed is as of September 30, 2014. |
| (d) | All or a portion of the security was on loan as of September 30, 2014. |
| (e) | Preferred Stock - the coupon is at a fixed rate and resets at a specific date and rate. The rate disclosed is as of September 30, 2014. |
| MTN | Medium Term Note |
| REIT | Real Estate Investment Trust |
| 16 | SCHEDULEOF INVESTMENTS |
Table of Contents
MANAGEMENT OVERVIEW (UNAUDITED) | Class S Class C Class A | IOEZX IOECX IEQAX |
| Q. | How did the Fund perform relative to its benchmarks? |
| A. | The ICON Equity Income Fund (the Fund) Class S shares returned 11.36% for the fiscal year ending September 30, 2014, lagging its benchmark, the S&P Composite 1500 Index, which returned 18.57% during the fiscal year. Total returns for other periods and additional Class shares as of September 30, 2014, appear in the subsequent pages of this Fund’s Management Overview. |
| Q. | What primary factors were behind the Fund’s relative performance? |
| A. | Similar to the other diversified funds at ICON, the poor performance of small cap stocks that our system indicated were trading below our estimate of fair value hindered the Fund’s performance. Over the course of the fiscal year, about 20% of the Fund’s holdings had a market capitalization of less than 3 billion. These holdings only returned, on average, around 7% during the fiscal year, well below the 18.57% return of the S&P Composite 1500 Index. |
Further, at the commencement of the fiscal year the overall average value-to-price (V/P) ratio according to our methodology for the Health Care sector was below 1.00, indicating that, on average, stocks in the Health Care sector were overpriced. As a result, the Fund had little exposure to the Health Care sector, which turned out to be one of the best preforming sectors over the course of the fiscal year.
| Q. | How did the Fund’s composition affect performance? |
| A. | While the availability of dividend paying stocks in the Information Technology sector has improved over the last 5 years, stocks in the sector that were the most attractive according to our methodology did not offer attractive yields. As a result, the Fund only averaged about 6% exposure to this sector during the period. The Fund’s relatively small position in the Information Technology sector had a negative impact on performance as the sector returned around 26% over the fiscal year. |
The Fund also had an average exposure of about 13% to preferred stocks and corporate bonds during the fiscal year. While these securities proved beneficial from an income standpoint, and helped the Fund maintain a strong dividend yield, they proved to be a drag on the Fund’s overall performance compared to the benchmark. Furthermore, during the fiscal year the overall market V/P ratio fell below 1.00 according to our valuation metrics. Based on this reading, the Fund held cash during the
| MANAGEMENT OVERVIEW | 17 |
Table of Contents
fiscal year. On average the cash position was around 6%, which detracted from the Fund’s performance relative to the benchmark given the strong return in the equity market.
A substantial position in the commodity chemical industry, which had an average return of over 55%, proved to be a contributor to the Fund’s performance. However, the performance of the commodity chemical industry was not enough to overcome the negatives stated above.
| Q. | What is the outlook for the ICON Equity Income Fund? |
| A. | The overall average V/P ratio for the stocks we track within our system was 1.10 as of October 1, 2014. The dividend rich Utility sector had an average V/P ratio of 1.12 according to our methodology. Given the relatively high reading in the Utilities sector, the Fund has a large allocation in the sector. We also believe the current downward pressure on the 10-year U.S. Treasury should provide a positive environment for dividend paying stocks. Additionally, certain industries within the Consumer Discretionary sector look attractive according to our system, and as of the end of the fiscal year, the Fund held close to 20% weighting in this sector. We will continue to monitor the equity market to find the best combination of value and dividend for our investors. |
| 18 | MANAGEMENT OVERVIEW |
Table of Contents
ICON Equity Income Fund
Sector Composition
September 30, 2014
Financial | 20.9% | |||
Consumer Discretionary | 17.8% | |||
Consumer Staples | 11.9% | |||
Utilities | 10.4% | |||
Industrials | 9.5% | |||
Materials | 9.4% | |||
Information Technology | 4.6% | |||
Telecommunication | 4.4% | |||
Energy | 3.7% | |||
Health Care | 1.8% | |||
|
| |||
| 94.4% | ||||
|
|
Percentages are based upon common, convertible preferred and preferred stocks as a percentage of net assets.
ICON Equity Income Fund
Industry Composition
September 30, 2014
Electric Utilities | 5.2% | |||
Asset Management & Custody Banks | 4.6% | |||
Integrated Telecommunication Services | 4.4% | |||
Soft Drinks | 4.1% | |||
Agricultural Products | 4.0% | |||
Department Stores | 3.8% | |||
Health Care REITs | 3.8% | |||
Multi-Utilities | 3.6% | |||
Specialized REIT’s | 3.5% | |||
Paper Packaging | 3.3% | |||
Internet Software & Services | 2.3% | |||
Technology Hardware, Storage & Peripherals | 2.3% | |||
Diversified Banks | 2.2% | |||
Diversified Chemicals | 2.2% |
Packaged Foods & Meats | 2.2% | |||
Fertilizers & Agricultural Chemicals | 2.1% | |||
Home Improvement Retail | 2.1% | |||
Oil & Gas Drilling | 2.1% | |||
Diversified Support Services | 2.0% | |||
Computer & Electronics Retail | 1.9% | |||
Industrial Machinery | 1.9% | |||
Auto Parts & Equipment | 1.8% | |||
Commodity Chemicals | 1.8% | |||
Consumer Finance | 1.8% | |||
Household Appliances | 1.8% | |||
Pharmaceuticals | 1.8% | |||
Residential REIT’s | 1.8% | |||
Automobile Manufacturers | 1.7% | |||
Gas Utilities | 1.7% | |||
Restaurants | 1.7% |
| MANAGEMENT OVERVIEW | 19 |
Table of Contents
ICON Equity Income Fund
Industry Composition (continued)
September 30, 2014
Construction & Farm Machinery & Heavy Trucks | 1.6% | |||
Oil & Gas Equipment & Services | 1.6% | |||
Personal Products | 1.6% | |||
Regional Banks | 1.6% | |||
Casinos & Gaming | 1.5% | |||
Housewares & Specialties | 1.5% | |||
Insurance Brokers | 1.5% |
Office Services & Supplies | 1.5% | |||
Aerospace & Defense | 1.4% | |||
Railroads | 1.1% | |||
|
| |||
| 94.4% | ||||
|
|
Percentages are based upon common, convertible preferred and preferred stocks as a percentage of net assets.
ICON Equity Income Fund
Average Annual Total Return
as of September 30, 2014
| Inception Date | 1 Year | 5 Years | 10 Years | Since Inception | Gross Expense Ratio* | Net Expense Ratio* | ||||||||||||||||||||||
ICON Equity Income Fund - Class S | 5/10/04 | 11.36% | 12.08% | 6.20% | 6.75% | 1.53% | 1.21% | |||||||||||||||||||||
ICON Equity Income Fund - Class C | 11/8/02 | 10.26% | 10.97% | 5.14% | 7.18% | 2.42% | 2.21% | |||||||||||||||||||||
ICON Equity Income Fund - Class A | 5/31/06 | 11.07% | 11.81% | N/A | 5.21% | 1.68% | 1.46% | |||||||||||||||||||||
ICON Equity Income Fund - Class A (including maximum sales charge of 5.75%) | 5/31/06 | 4.66% | 10.50% | N/A | 4.47% | 1.68% | 1.46% | |||||||||||||||||||||
S&P Composite 1500 Index | 18.57% | 15.79% | 8.34% | 9.41% | N/A | N/A | ||||||||||||||||||||||
Past performance is not a guarantee of future results. Information about these performance results and the comparative indexes can be found in the About This Report section. The Adviser has agreed to limit certain Fund expenses; without these limitations, returns would have been lower. The limitation provisions may be terminated in the future.
| * | Please see the most recent prospectus for details. |
Class C total returns exclude applicable sales charges. If sales charges were included returns would be lower.
| 20 | MANAGEMENT OVERVIEW |
Table of Contents
ICON Equity Income Fund
Value of a $10,000 Investment
through September 30, 2014
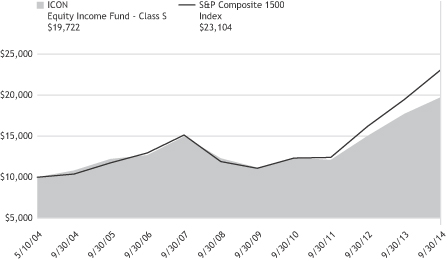
Past performance is not a guarantee of future results. The above graph compares a $10,000 investment made in the Equity Income Fund’s Class S shares on the Class’ inception date of 5/10/04 to a $10,000 investment made in an unmanaged securities index on that date. Performance for the Equity Income Fund’s other share classes will vary due to differences in charges and expenses. The Equity Income Fund’s performance in this chart and the performance table assumes the reinvestment of dividends and capital gain distributions but does not reflect the deduction of taxes that a shareholder would pay on Fund distributions or on the redemption of Fund shares.
| MANAGEMENT OVERVIEW | 21 |
Table of Contents
ICON EQUITY INCOME FUND
SCHEDULEOF INVESTMENTS
SEPTEMBER 30, 2014
| Shares or Principal Amount | Value | |||||||
| Common Stocks (86.6%) | ||||||||
| 8,500 | AbbVie, Inc. | $ | 490,960 | |||||
| 6,400 | Agrium, Inc.(a) | 569,600 | ||||||
| 6,300 | Apple, Inc. | 634,725 | ||||||
| 9,200 | Arthur J Gallagher & Co. | 417,312 | ||||||
| 9,700 | Avery Dennison Corp. | 433,105 | ||||||
| 22,000 | B&G Foods, Inc. | 606,100 | ||||||
| 12,900 | BCE, Inc. | 551,604 | ||||||
| 6,700 | Bristow Group, Inc. | 450,240 | ||||||
| 7,300 | Camden Property Trust, REIT | 500,269 | ||||||
| 18,300 | CMS Energy Corp. | 542,778 | ||||||
| 10,700 | Coca-Cola Enterprises, Inc. | 474,652 | ||||||
| 15,200 | Corrections Corp. of America, REIT | 522,272 | ||||||
| 4,500 | Cracker Barrel Old Country Store, Inc. | 464,355 | ||||||
| 3,300 | Cummins, Inc. | 435,534 | ||||||
| 11,500 | Dow Chemical Co. | 603,060 | ||||||
| 10,200 | Dr. Pepper Snapple Group, Inc. | 655,962 | ||||||
| 6,800 | Duke Energy Corp. | 508,436 | ||||||
| 52,000 | First Commonwealth Financial Corp. | 436,280 | ||||||
| 12,500 | GameStop Corp., Class A(a) | 515,000 | ||||||
| 17,900 | Hawaiian Electric Industries, Inc.(a) | 475,245 | ||||||
| 13,300 | HCP, Inc., REIT | 528,143 | ||||||
| 19,100 | Healthcare Services Group, Inc. | 546,451 | ||||||
| 5,900 | Helmerich & Payne, Inc. | 577,433 | ||||||
| 6,200 | Home Depot, Inc. | 568,788 | ||||||
| 7,500 | Ingredion, Inc. | 568,425 | ||||||
| 14,600 | Invesco, Ltd. | 576,408 | ||||||
| 12,500 | j2 Global, Inc. | 617,000 | ||||||
| 11,000 | Johnson Controls, Inc. | 484,000 | ||||||
| 24,500 | Knoll, Inc. | 424,095 | ||||||
| Shares or Principal Amount | Value | |||||||
| 9,800 | Laclede Group, Inc. | $ | 454,720 | |||||
| 6,500 | Las Vegas Sands Corp. | 404,365 | ||||||
| 4,600 | LyondellBasell Industries, Class A | 499,836 | ||||||
| 9,600 | Macy’s, Inc. | 558,528 | ||||||
| 22,100 | Main Street Capital Corp. | 677,144 | ||||||
| 7,100 | Nordstrom, Inc. | 485,427 | ||||||
| 2,800 | Norfolk Southern Corp. | 312,480 | ||||||
| 9,700 | Nu Skin Enterprises, Inc., Class A(a) | 436,791 | ||||||
| 7,100 | Packaging Corp. of America | 453,122 | ||||||
| 2,700 | Public Storage, REIT | 447,768 | ||||||
| 3,800 | Raytheon Co. | 386,156 | ||||||
| 8,700 | SCANA Corp. | 431,607 | ||||||
| 8,900 | Thor Industries, Inc. | 458,350 | ||||||
| 6,000 | Tupperware Brands Corp. | 414,240 | ||||||
| 8,200 | Ventas, Inc., REIT | 507,990 | ||||||
| 13,300 | Verizon Communications, Inc., Series L | 664,867 | ||||||
| 12,600 | Westar Energy, Inc. | 429,912 | ||||||
| 3,300 | Whirlpool Corp. | 480,645 | ||||||
|
| |||||||
| | Total Common Stocks (Cost $23,199,660) | 23,682,180 | ||||||
| Preferred Stocks (3.7%) | ||||||||
| 19,600 | Discover Financial Services, Series B(a) | 494,116 | ||||||
| 21,000 | Stanley Black & Decker, Inc.(a) | 518,280 | ||||||
|
| |||||||
| | Total Preferred Stocks (Cost $998,730) | 1,012,396 | ||||||
| Convertible Preferred Stocks (4.1%) | ||||||||
| 4,800 | Bunge, Ltd. | 522,000 | ||||||
| 500 | Wells Fargo & Co., Series L | 601,255 | ||||||
|
| |||||||
| | Total Convertible Preferred Stocks (Cost $1,090,147) | 1,123,255 | ||||||
| 22 | SCHEDULEOF INVESTMENTS |
Table of Contents
| Shares or Principal Amount | Value | |||||||
| Collateral for Securities on Loan (10.4%) | ||||||||
| 2,849,625 | State Street Navigator Prime Portfolio, 0.15% | $ | 2,849,625 | |||||
|
| |||||||
| | Total Collateral for Securities on Loan (Cost $2,849,625) | 2,849,625 | ||||||
| Shares or Principal Amount | Value | |||||||
| Short-Term Investments (1.6%) | ||||||||
| $ | 425,747 | State Street Euro Dollar Time Deposit (USD), 0.01%, 10/01/14 | $ | 425,747 | ||||
|
| |||||||
| | Total Short-Term Investments (Cost $425,747) | 425,747 | ||||||
| | Total Investments 106.4% (Cost $28,563,909) | 29,093,203 | ||||||
| | Liabilities Less Other Assets (6.4)% | (1,743,338 | ) | |||||
|
| |||||||
| Net Assets 100.0% | $ | 27,349,865 | ||||||
|
| |||||||
The accompanying notes are an integral part of the financial statements.
| (a) | All or a portion of the security was on loan as of September 30, 2014. |
| REIT | Real Estate Investment Trust |
| SCHEDULEOF INVESTMENTS | 23 |
Table of Contents
MANAGEMENT OVERVIEW (UNAUDITED) | Class S Class C Class A | ICNZX ICNCX ICNAX |
| Q. | How did the Fund perform relative to its benchmarks? |
| A. | The ICON Fund (the Fund) Class S returned 3.71% over the fiscal year ending September 30, 2014, but lagged its benchmark, the S & P Composite 1500 Index, which returned 18.57%. Total returns for other periods and additional Class shares as of September 30, 2014, appear in the subsequent pages of this Fund’s Management Overview. |
| Q. | What primary factors were behind the Fund’s relative performance? |
| A. | A year ago, September 30, 2013, the Fund had a favorable sector weighting with Consumer Discretionary at 31.1%, Energy at 18.5%, Industrials at 16.4%, Information Technology at 11.4% and Materials at 2.6%, but the Fund lagged the rising index during the fourth quarter of 2013, due to the Fund’s 6.2% cash holdings. Over the first quarter of 2014, the cyclical sectors hurt the Fund as investors reacted to a surprise negative GDP unfolding. The Fund’s cash holdings were retained until mid-April, when the Fund’s exposure to the Health Care and Financial sectors were increased. Exposure to the Energy sector was reduced by over half in July, but the remaining positions hurt the portfolio with the drop in the price of oil in September 2014. |
| Q. | How did the Fund’s composition affect performance? |
| A. | The five largest contributions to performance during the fiscal year came from Union Pacific, Walt Disney, Celgene, Questcor Pharmaceuticals and Apple. |
Large declines of a few stocks in the Consumer Discretionary, Energy and Materials sectors were too much for the top performing stocks to overcome relative to the benchmark. The five largest detractors from performance were Lulu Lemon Athletica, Lumber Liquidators, Dril-Quip, Oceaneering International and FMC Corporation. In general, the stocks that had the large, and usually quite sudden, declines had one thing in common, analysts revising earnings estimates downward, often accompanied by a surprise event. The downward revisions in earnings estimates were generally short term oriented, for just one or two quarters. As short term revision do not have much effect on our valuation, we continue to hold four of those stocks. Lulu Lemon was sold, the others remain in the portfolio.
| 24 | MANAGEMENT OVERVIEW |
Table of Contents
In our opinion, three situations influenced investor behavior with regard to equities. Over the first nine months of calendar year 2014, investors repositioned their portfolios for higher long-term interest rates, a rising dollar and a slowing global economy. Stock prices did not respond to value, but instead were driven by these three situations. We expect all three will prove to be passing fads.
| Q. | What is your investment outlook for the overall market? |
| A. | With our overall average market value-to-price (V/P) ratio hitting a sixteen month high of 1.15 in early October 2014, we would expect the broad market to move higher over the next twelve months, posting slightly better than average returns. With investors reacting to the three situations mentioned above, our industry and sector valuation rankings have been altered over the last six months. The current V/P ratios suggest to us that cyclical industries and sectors will lead the market higher, featuring a comeback for the Consumer Discretionary sector. |
ICON Fund
Sector Composition
September 30, 2014
Consumer Discretionary | 34.5% | |||
Health Care | 19.0% | |||
Materials | 13.4% | |||
Industrials | 9.0% | |||
Energy | 8.5% | |||
Financial | 7.7% | |||
Information Technology | 7.3% | |||
|
| |||
| 99.4% | ||||
|
|
Percentages are based upon common stocks as a percentage of net assets.
| MANAGEMENT OVERVIEW | 25 |
Table of Contents
ICON Fund
Industry Composition
September 30, 2014
Biotechnology | 11.7% | |||
Oil & Gas Equipment & Services | 8.5% | |||
Home Improvement Retail | 7.4% | |||
Pharmaceuticals | 7.3% | |||
Broadcasting | 6.7% | |||
Airlines | 4.7% | |||
Railroads | 4.3% | |||
Specialty Chemicals | 3.9% | |||
Paper Products | 3.7% | |||
Electronic Manufacturing Services | 3.6% | |||
Consumer Finance | 3.4% | |||
Home Furnishings | 3.4% | |||
Diversified Chemicals | 3.3% | |||
Movies & Entertainment | 3.0% | |||
Automobile Manufacturers | 2.8% |
Department Stores | 2.8% | |||
Paper Packaging | 2.5% | |||
Internet Software & Services | 2.4% | |||
Hotels, Resorts & Cruise Lines | 2.3% | |||
Regional Banks | 2.3% | |||
Asset Management & Custody Banks | 2.0% | |||
Cable & Satellite | 1.8% | |||
Leisure Products | 1.5% | |||
Specialty Stores | 1.5% | |||
Auto Parts & Equipment | 1.3% | |||
Electronic Components | 1.3% | |||
|
| |||
| 99.4% | ||||
|
|
Percentages are based upon common stocks as a percentage of net assets.
ICON Fund
Average Annual Total Return
as of September 30, 2014
| Inception Date | 1 Year | 5 Years | 10 Years | Since Inception | Gross Expense Ratio* | Net Expense Ratio* | ||||||||||||||||||||||
ICON Fund - Class S | 5/6/04 | 3.71% | 10.33% | 3.51% | 3.95% | 1.23% | 1.23% | |||||||||||||||||||||
ICON Fund - Class C | 11/28/00 | 2.57% | 9.67% | 2.79% | 3.33% | 2.32% | 2.26% | |||||||||||||||||||||
ICON Fund - Class A | 5/31/06 | 3.36% | 9.94% | N/A | 0.52% | 1.58% | 1.51% | |||||||||||||||||||||
ICON Fund - Class A (including maximum sales charge of 5.75%) | 5/31/06 | -2.60% | 8.65% | N/A | -0.19% | 1.58% | 1.51% | |||||||||||||||||||||
S&P Composite 1500 Index | 18.57% | 15.79% | 8.34% | 5.37% | N/A | N/A | ||||||||||||||||||||||
Past performance is not a guarantee of future results. Information about these performance results and the comparative indexes can be found in the About This Report section. The Since Inception performance results for Class C shares include returns for certain time periods that were restarted as of June 8, 2004.
| * | Please see the most recent prospectus for details. |
Class C total returns exclude applicable sales charges. If sales charges were included returns would be lower.
| 26 | MANAGEMENT OVERVIEW |
Table of Contents
ICON Fund
Value of a $10,000 Investment
through September 30, 2014
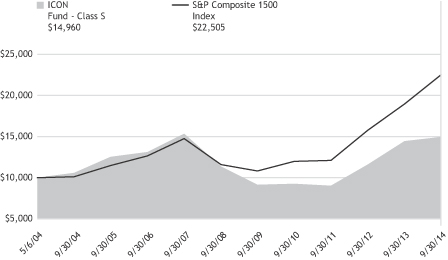
Past performance is not a guarantee of future results. The above graph compares a $10,000 investment made in the ICON Fund’s Class S shares on the Class’ inception date of 5/6/04 to a $10,000 investment made in an unmanaged securities index on that date. Performance for the ICON Fund’s other share classes will vary due to differences in charges and expenses. The ICON Fund’s performance in this chart and the performance table assumes the reinvestment of dividends and capital gain distributions but does not reflect the deduction of taxes that a shareholder would pay on Fund distributions or on the redemption of Fund shares.
| MANAGEMENT OVERVIEW | 27 |
Table of Contents
ICON FUND
SCHEDULEOF INVESTMENTS
SEPTEMBER 30, 2014
| Shares or Principal Amount | Value | |||||||
| Common Stocks (99.4%) | ||||||||
| 42,700 | Alaska Air Group, Inc. | $ | 1,859,158 | |||||
| 24,800 | Ashland, Inc. | 2,581,680 | ||||||
| 7,200 | Biogen Idec, Inc.† | 2,381,832 | ||||||
| 16,900 | BorgWarner, Inc. | 889,109 | ||||||
| 33,300 | CBS Corp., Class B | 1,781,550 | ||||||
| 35,900 | Celgene Corp.† | 3,402,602 | ||||||
| 40,600 | Clearwater Paper Corp.† | 2,440,466 | ||||||
| 42,800 | CSX Corp. | 1,372,168 | ||||||
| 35,700 | Delta Air Lines, Inc. | 1,290,555 | ||||||
| 36,200 | Discovery Communications, Inc., Class A† | 1,368,360 | ||||||
| 36,200 | Discovery Communications, Inc., Class C† | 1,349,536 | ||||||
| 16,600 | Dril-Quip, Inc.† | 1,484,040 | ||||||
| 94,200 | Emergent Biosolutions, Inc.† | 2,007,402 | ||||||
| 50,800 | Encore Capital Group, Inc.†(a) | 2,250,948 | ||||||
| 38,600 | FMC Corp. | 2,207,534 | ||||||
| 28,600 | FMC Technologies, Inc.† | 1,553,266 | ||||||
| 38,200 | Home Depot, Inc. | 3,504,468 | ||||||
| 13,000 | Jazz Pharmaceuticals PLC† | 2,087,280 | ||||||
| 25,600 | Lumber Liquidators Holdings, Inc.†(a) | 1,468,928 | ||||||
| 32,000 | Macy’s, Inc. | 1,861,760 | ||||||
| 64,800 | Methode Electronics, Inc. | 2,389,176 | ||||||
| 16,800 | Mohawk Industries, Inc.† | 2,264,976 | ||||||
| 22,400 | Oceaneering International, Inc. | 1,459,808 | ||||||
| Shares or Principal Amount | Value | |||||||
| 26,400 | Packaging Corp. of America | $ | 1,684,848 | |||||
| 18,700 | Perrigo Co. PLC | 2,808,553 | ||||||
| 6,500 | Polaris Industries, Inc. | 973,635 | ||||||
| 29,300 | RigNet, Inc.† | 1,185,185 | ||||||
| 15,600 | Rogers Corp.† | 854,256 | ||||||
| 13,800 | Signature Bank† | 1,546,428 | ||||||
| 36,000 | Thor Industries, Inc. | 1,854,000 | ||||||
| 8,300 | Time Warner Cable, Inc. | 1,190,967 | ||||||
| 15,900 | Tractor Supply Co. | 978,009 | ||||||
| 13,600 | Union Pacific Corp. | 1,474,512 | ||||||
| 26,100 | Viacom, Inc., Class B | 2,008,134 | ||||||
| 29,200 | VistaPrint NV†(a) | 1,599,868 | ||||||
| 25,900 | Waddell & Reed Financial, Inc., Class A | 1,338,771 | ||||||
| 18,700 | Wyndham Worldwide Corp. | 1,519,562 | ||||||
|
| |||||||
| | Total Common Stocks (Cost $62,958,534) | 66,273,330 | ||||||
| | Collateral for Securities on Loan (3.8%) | |||||||
| 2,566,103 | State Street Navigator Prime Portfolio, 0.15% | 2,566,103 | ||||||
|
| |||||||
| | Total Collateral for Securities on Loan (Cost $2,566,103) | 2,566,103 | ||||||
| | Total Investments 103.2% (Cost $65,524,637) | 68,839,433 | ||||||
| | Liabilities Less Other Assets (3.2)% | (2,136,775 | ) | |||||
|
| |||||||
| Net Assets 100.0% | $ | 66,702,658 | ||||||
|
| |||||||
The accompanying notes are an integral part of the financial statements.
| † | Non-income producing security. |
| (a) | All or a portion of the security was on loan as of September 30, 2014. |
| 28 | SCHEDULEOF INVESTMENTS |
Table of Contents
MANAGEMENT OVERVIEW (UNAUDITED) | Class S Class C Class A | IOLZX IOLCX ISTAX |
| Q. | How did the Fund perform relative to its benchmarks? |
| A. | The ICON Long/Short Fund (the Fund) Class S returned 5.32% over the fiscal year but lagged its benchmark, the S & P Composite 1500 Index, which returned 18.57%. Total returns for other periods and additional Class shares as of September 30, 2014 appear in the subsequent pages of this Fund’s Management Overview. |
| Q. | What primary factors were behind the Fund’s relative performance? |
| A. | A year ago, September 30, 2013, the Fund had a favorable sector weighting with Consumer Discretionary at 31.4%, Information Technology at 17.6%, Industrials at 12.3%, Energy at 11.6%, Healthcare at 6.4%, Financial at 5.8% and Materials at 3.1% but the Fund lagged the rising index that next quarter, ending December 31, 2013, due to the Fund’s 8.8% cash holdings and five short positions accounting for 7.4% of assets. By December 31, 2013, the Fund had 19.9% cash and 9.9% short positions. During the first quarter of 2014, the cyclical sectors hurt the Fund as investors reacted to a surprise negative GDP unfolding. By early April cash had increased to 34% of assets while eight short positioned totaled 16.8% of assets. In mid-April cash was reduced to minimal levels and all but two short positions were covered. The Fund’s holdings in the Healthcare and Materials sectors were increased. |
| Q. | How did the Fund’s composition affect performance? |
| A. | The five largest contributions to performance during the fiscal year came from Celgene Corporation, Jazz Pharmaceuticals, Norfolk Southern, Methode Electronics and Time Warner Cable. |
Large declines of a few stocks in the Consumer Discretionary, Energy, Materials and Healthcare sectors were too much for the top performing stocks to overcome relative to the benchmark. The five largest detractors from performance were Lumber Liquidators, Ligand Pharmaceuticals, FMC, RigNet and Dril-Quip. In general, the stocks that had the large, and usually quite sudden, declines had one thing in common, analysts revising earnings estimates downward, often accompanied by a surprise event. The downward revisions in earnings estimates were generally short term oriented, for just one or two quarters. As short term negative revisions do not have much effect on our valuation, we continue to hold those five stocks.
| MANAGEMENT OVERVIEW | 29 |
Table of Contents
In our opinion, three situations influenced investor behavior with regard to equities. Over the first nine months of calendar year 2014, investors repositioned their portfolios for higher long term interest rates, a rising dollar and a slowing global economy. Stock prices did not respond to value, but instead were driven by these three situations. We expect all three will prove to be passing fads.
| Q. | What is your investment outlook for the overall market? |
| A. | With our overall average market value-to-price (V/P) ratio hitting a sixteen month high of 1.15 in early October 2014, we would expect the broad market to move higher over the next twelve months, posting slightly better than average returns. With investors reacting to the three situations mentioned above, our industry and sector valuation rankings have been altered over the last six months. The current V/P ratios suggest to us that cyclical industries and sectors will lead the market higher, featuring a comeback for the Consumer Discretionary sector. |
ICON Long/Short Fund
Sector Composition
September 30, 2014
Consumer Discretionary | 31.5 % | |||
Health Care | 19.9% | |||
Information Technology | 17.0% | |||
Materials | 10.9% | |||
Energy | 7.9% | |||
Financial | 7.7% | |||
Industrials | 6.9% | |||
|
| |||
| 101.8% | ||||
|
|
Percentages are based upon common stocks as a percentage of net assets.
| 30 | MANAGEMENT OVERVIEW |
Table of Contents
ICON Long/Short Fund
Industry Composition
September 30, 2014
Biotechnology | 12.4% | |||
Home Improvement Retail | 7.9% | |||
Oil & Gas Equipment & Services | 7.9% | |||
Pharmaceuticals | 7.5% | |||
Internet Software & Services | 4.6% | |||
Railroads | 4.5% | |||
Electronic Manufacturing Services | 4.4% | |||
Broadcasting | 3.4% | |||
Electronic Components | 3.4% | |||
Paper Packaging | 3.0% | |||
Hotels, Resorts & Cruise Lines | 2.9% | |||
IT Consulting & Other Services | 2.9% | |||
Home Furnishings | 2.8% | |||
Leisure Products | 2.8% | |||
Asset Management & Custody Banks | 2.7% |
Leisure Facilities | 2.7% | |||
Specialty Stores | 2.7% | |||
Consumer Finance | 2.6% | |||
Cable & Satellite | 2.5% | |||
Housewares & Specialties | 2.5% | |||
Airlines | 2.4% | |||
Regional Banks | 2.4% | |||
Diversified Chemicals | 2.3% | |||
Paper Products | 2.1% | |||
Specialty Chemicals | 2.1% | |||
Data Processing & Outsourced Services | 1.7% | |||
Commodity Chemicals | 1.4% | |||
Automobile Manufacturers | 1.3% | |||
|
| |||
| 101.8% | ||||
|
|
Percentages are based upon common stocks as a percentage of net assets.
ICON Long/Short Fund
Average Annual Total Return
as of September 30, 2014
| Inception Date | 1 Year | 5 Years | 10 Years | Since Inception | Gross Expense Ratio* | Net Expense Ratio* | ||||||||||||||||||||||
ICON Long/Short Fund - Class S | 5/6/04 | 5.32% | 9.69% | 4.35% | 4.14% | 1.53% | 1.32% | |||||||||||||||||||||
ICON Long/Short Fund - Class C | 10/17/02 | 4.30% | 8.55% | 3.32% | 5.11% | 2.62% | 2.37% | |||||||||||||||||||||
ICON Long/Short Fund - Class A | 5/31/06 | 5.02% | 9.36% | N/A | 1.68% | 1.91% | 1.61% | |||||||||||||||||||||
ICON Long/Short Fund - Class A (including maximum sales charge of 5.75%) | 5/31/06 | -1.05% | 8.08% | N/A | 0.96% | 1.91% | 1.61% | |||||||||||||||||||||
S&P Composite 1500 Index | 18.57% | 15.79% | 8.34% | 9.52% | N/A | N/A | ||||||||||||||||||||||
Past performance is not a guarantee of future results. Information about these performance results and the comparative indexes can be found in the About This Report section. The Adviser has agreed to limit certain Fund expenses; without these limitations, returns would have been lower. The limitation provisions may be terminated in the future.
| * | Please see the most recent prospectus for details. |
Class C total returns exclude applicable sales charges. If sales charges were included returns would be lower.
| MANAGEMENT OVERVIEW | 31 |
Table of Contents
ICON Long/Short Fund
Value of a $10,000 Investment
through September 30, 2014
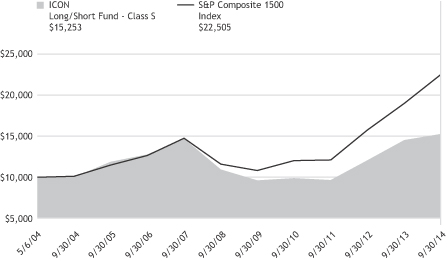
Past performance is not a guarantee of future results. The above graph compares a $10,000 investment made in the Long/Short Fund’s Class S shares on the Class’ inception date of 5/6/04 to a $10,000 investment made in an unmanaged securities index on that date. Performance for the Long/Short Fund’s other share classes will vary due to differences in charges and expenses. The Long/Short Fund’s performance in this chart and the performance table assumes the reinvestment of dividends and capital gain distributions but does not reflect the deduction of taxes that a shareholder would pay on Fund distributions or on the redemption of Fund shares.
| 32 | MANAGEMENT OVERVIEW |
Table of Contents
ICON LONG/SHORT FUND
SCHEDULEOF INVESTMENTS
SEPTEMBER 30, 2014
| Shares or Principal Amount | Value | |||||||
| Common Stocks (101.8%) | ||||||||
| 18,800 | Alaska Air Group, Inc. | $ | 818,552 | |||||
| 7,100 | Ashland, Inc. | 739,110 | ||||||
| 3,000 | Biogen Idec, Inc.† | 992,430 | ||||||
| 9,500 | Cabot Corp. | 482,315 | ||||||
| 19,800 | Cedar Fair L.P. | 935,946 | ||||||
| 14,600 | Celgene Corp.† | 1,383,788 | ||||||
| 12,000 | Clearwater Paper Corp.† | 721,320 | ||||||
| 22,200 | Cognizant Technology Solutions Corp., Class A†(x) | 993,894 | ||||||
| 22,000 | CSX Corp. | 705,320 | ||||||
| 15,600 | Discovery Communications, Inc., Class A† | 589,680 | ||||||
| 15,600 | Discovery Communications, Inc., Class C† | 581,568 | ||||||
| 5,600 | Dril-Quip, Inc.† | 500,640 | ||||||
| 44,400 | Emergent Biosolutions, Inc.† | 946,164 | ||||||
| 19,900 | Encore Capital Group, Inc.†(a) | 881,769 | ||||||
| 14,000 | FMC Corp. | 800,660 | ||||||
| 12,100 | FMC Technologies, Inc.† | 657,151 | ||||||
| 17,300 | Home Depot, Inc. | 1,587,102 | ||||||
| 14,400 | Jarden Corp.† | 865,584 | ||||||
| 6,800 | Jazz Pharmaceuticals PLC† | 1,091,808 | ||||||
| 20,700 | Ligand Pharmaceuticals, Inc., Class B† | 972,693 | ||||||
| 20,000 | Lumber Liquidators Holdings, Inc.†(a) | 1,147,600 | ||||||
| 8,000 | Mastercard, Inc., Class A | 591,360 | ||||||
| 41,700 | Methode Electronics, Inc. | 1,537,479 | ||||||
| 7,300 | Mohawk Industries, Inc.† | 984,186 | ||||||
| Shares or Principal Amount | Value | |||||||
| 7,700 | Norfolk Southern Corp. | $ | 859,320 | |||||
| 9,400 | Oceaneering International, Inc.(x) | 612,598 | ||||||
| 16,000 | Packaging Corp. of America | 1,021,120 | ||||||
| 9,800 | Perrigo Co. PLC | 1,471,862 | ||||||
| 6,500 | Polaris Industries, Inc. | 973,635 | ||||||
| 24,200 | RigNet, Inc.† | 978,890 | ||||||
| 21,200 | Rogers Corp.† | 1,160,912 | ||||||
| 7,300 | Signature Bank† | 818,038 | ||||||
| 8,700 | Thor Industries, Inc.(x) | 448,050 | ||||||
| 6,100 | Time Warner Cable, Inc.(x) | 875,289 | ||||||
| 15,400 | Tractor Supply Co. | 947,254 | ||||||
| 28,800 | VistaPrint NV†(a) | 1,577,952 | ||||||
| 18,300 | Waddell & Reed Financial, Inc., Class A | 945,927 | ||||||
| 12,400 | Wyndham Worldwide Corp. | 1,007,624 | ||||||
|
| |||||||
|
| Total Common Stocks (Cost $33,372,974) | 35,206,590 | ||||||
| | Collateral for Securities on Loan (9.9%) | |||||||
| 3,405,494 | State Street Navigator Prime Portfolio, 0.15% | 3,405,494 | ||||||
|
| |||||||
|
| Total Collateral for Securities on Loan (Cost $3,405,494) | 3,405,494 | ||||||
|
| Total Investments 111.7% (Cost $36,778,468) | 38,612,084 | ||||||
| | Liabilities Less Other Assets (11.7)% | (4,055,305 | ) | |||||
|
| |||||||
| Net Assets 100.0% | $ | 34,556,779 | ||||||
|
| |||||||
The accompanying notes are an integral part of the financial statements.
| † | Non-income producing security. |
| (x) | All or a portion of the security is pledged as collateral for securities sold short. |
| (a) | All or a portion of the security was on loan as of September 30, 2014. |
| SCHEDULEOF INVESTMENTS | 33 |
Table of Contents
ICON LONG/SHORT FUND
SCHEDULEOF SECURITIES SOLD SHORT
SEPTEMBER 30, 2014
| Shares | Short Security | Value | ||||||
| 11,600 | Amedisys, Inc.† | $ | 233,972 | |||||
| 225,000 | Cincinnati Bell, Inc.† | 758,250 | ||||||
|
| |||||||
|
| Total Securities Sold Short (Proceeds $999,482) | $ | 992,222 | |||||
|
| |||||||
The accompanying notes are an integral part of the financial statements.
| † | Non-income producing security. |
| 34 | SCHEDULEOF INVESTMENTS |
Table of Contents
MANAGEMENT OVERVIEW (UNAUDITED) | ICONX |
| Q. | How did the Fund perform relative to its benchmarks? |
| A. | The ICON Opportunities Fund (the Fund) returned 2.19% over the fiscal year but lagged its benchmark, the S&P SmallCap 600 Index, which returned 5.74%. Total returns and other performance statistics as of September 30, 2014 appear in the subsequent pages of this Fund’s Management Overview. |
| Q. | How did the Fund perform relative to its benchmark? |
| A. | A year ago, September 30, 2013, the Fund had a favorable sector weighting with Consumer Discretionary at 18.6%, Materials at 12.4%, Information Technology at 12.1%, Financials at 10.5%, Industrials at 11.1%, Energy at 9.9%, and Healthcare at 7.3%, but the Fund lagged the rising index that next quarter due to the Fund’s 17.9% cash holdings. The cash holdings generally resulted from the Fund selling overpriced positions without buying into other positions. Although exposure to the Consumer Discretionary sector had been reduced to 11.6% by December 31, 2013, remaining positions in the sector hurt the Fund during the first quarter of 2014 as investors reacted to a surprise negative GDP unfolding. The Fund accumulated more cash until mid-April, when the Fund’s exposure to the Information Technology, Financial and Healthcare sector was increased. Unlike the S&P LargeCap 500 Index, the S&P SmallCap 600 index dropped from mid-April to mid-May. Around that dip, a minor rotation was made to increase the Fund’s exposure to the Information Technology, Consumer Discretionary and Healthcare sectors. |
While some large-cap stocks did well, pushing the S&P 500 Index to record highs in 2014, small cap stocks were generally stuck in a sideways range, not moving up as much as their large cap counterparts during advances while dropping more during declines. Amidst these oscillations, there were rapid industry and sector theme reversals.
In our opinion, three situations influenced investor behavior with regard to equities. Over the first nine months of calendar year 2014, investors repositioned their portfolios for higher long term interest rates, a rising dollar and a slowing global economy. Stock prices did not respond to value, but instead were driven by these three situations. We expect all three will prove to be passing fads.
| MANAGEMENT OVERVIEW | 35 |
Table of Contents
| Q. | What were the Fund’s greatest contributors/detractors? |
| A. | The five largest contributions to performance during the fiscal year came from Kapstone Paper & Packaging, Questcor Pharmaceuticals, Akorn, Dresser-Rand Group and Janus Capital, which was purchased based on value but enjoyed a sharp surge when a high profile bond manager joined the firm. It was sold the day of that announcement. |
The five largest detractors from performance were Lumber Liquidators, Ligand Pharmaceuticals, Conn’s, RigNet and World Acceptance. In general, the stocks that had large, and usually quite sudden, declines had one thing in common, analysts revising earnings estimates downward, often accompanied by a surprise event or announcement. The downward revisions in earnings estimates were generally short term oriented, for just one or two quarters. As short term revision do not have much effect on our valuation, we continue to hold all five of those stocks.
| Q. | What is your investment outlook for the overall market? |
| A. | With our overall average market value-to-price (V/P) ratio hitting a sixteen month high of 1.15 in early October 2014, we would expect the broad market to move higher over the next twelve months, posting slightly better than average returns. With investors reacting to the three situations mentioned above, our industry and sector valuation rankings have been altered over the last six months. The current V/P ratios suggest to us that cyclical industries and sectors will lead the market higher and that small-cap stocks will fully participate. |
ICON Opportunities Fund
Country Composition
September 30, 2014
United States | 92.6% | |||
Netherlands | 3.7% | |||
Canada | 2.4% | |||
|
| |||
| 98.7% | ||||
|
|
Percentages are based upon common stocks as a percentage of net assets.
ICON Opportunities Fund
Sector Composition
September 30, 2014
Information Technology | 21.5% | |||
Health Care | 20.6% | |||
Consumer Discretionary | 19.5% | |||
Materials | 18.4% | |||
Financial | 9.6% | |||
Energy | 6.1% | |||
Industrials | 3.0% | |||
|
| |||
| 98.7% | ||||
|
|
Percentages are based upon common stocks as a percentage of net assets.
| 36 | MANAGMENT OVERVIEW |
Table of Contents
ICON Opportunities Fund
Industry Composition
September 30, 2014
Biotechnology | 7.6% | |||
Specialty Chemicals | 7.5% | |||
Electronic Equipment & Instruments | 7.1% | |||
Life Sciences Tools & Services | 7.0% | |||
Consumer Finance | 6.8% | |||
Internet Software & Services | 6.6% | |||
Oil & Gas Equipment & Services | 6.1% | |||
Pharmaceuticals | 6.0% | |||
Automobile Manufacturers | 4.0% | |||
Paper Products | 3.7% | |||
Electronic Manufacturing Services | 3.6% | |||
Restaurants | 3.4% | |||
Home Improvement Retail | 3.1% | |||
Aerospace & Defense | 3.0% | |||
Apparel Retail | 2.7% | |||
Computer & Electronics Retail | 2.7% |
Commodity Chemicals | 2.4% | |||
Diversified Chemicals | 2.4% | |||
Paper Packaging | 2.4% | |||
Home Furnishings | 2.0% | |||
Insurance Brokers | 2.0% | |||
Footwear | 1.6% | |||
Technology Distributors | 1.6% | |||
Electronic Components | 1.5% | |||
Data Processing & Outsourced Services | 1.1% | |||
Asset Management & Custody Banks | 0.8% | |||
|
| |||
| 98.7% | ||||
|
|
Percentages are based upon common stocks as a percentage of net assets.
ICON Opportunities Fund
Average Annual Total Return
as of September 30, 2014
| Inception Date | 1 Year | Since Inception | Gross Expense Ratio* | Net Expense Ratio* | ||||||||||||||||
ICON Opportunities Fund | 9/28/12 | 2.19% | 15.28% | 12.47% | 1.52% | |||||||||||||||
S&P SmallCap 600 Index | 5.74% | 17.94% | N/A | N/A | ||||||||||||||||
Past performance is not a guarantee of future results. Information about these performance results and the comparative indexes can be found in the About This Report section. The Adviser has agreed to limit certain Fund expenses; without these limitations, returns would have been lower. The limitation provisions may be terminated in the future.
| * | Please see the most recent prospectus for details. |
| MANAGEMENT OVERVIEW | 37 |
Table of Contents
ICON Opportunities Fund
Value of a $10,000 Investment
through September 30, 2014
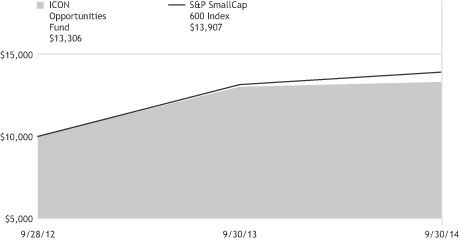
Past performance is not a guarantee of future results. The above graph compares a $10,000 investment made in the Opportunities Fund on the inception date of 10/1/12 to a $10,000 investment made in an unmanaged securities index on that date. The Opportunities Fund’s performance in this chart and the performance table assumes the reinvestment of dividends and capital gain distributions but does not reflect the deduction of taxes that a shareholder would pay on Fund distributions or on the redemption of Fund shares.
| 38 | MANAGEMENT OVERVIEW |
Table of Contents
ICON OPPORTUNITIES FUND
SCHEDULEOF INVESTMENTS
SEPTEMBER 30, 2014
| Shares or Principal Amount | Value | |||||||
| Common Stocks (98.7%) | ||||||||
| 8,637 | Akorn, Inc.† | $ | 313,264 | |||||
| 16,600 | Albany Molecular Research, Inc.† | 366,362 | ||||||
| 12,292 | Ascena Retail Group, Inc.† | 163,484 | ||||||
| 6,600 | Avery Dennison Corp. | 294,690 | ||||||
| 3,400 | Bristow Group, Inc. | 228,480 | ||||||
| 7,700 | Brown & Brown, Inc. | 247,555 | ||||||
| 3,079 | Buffalo Wild Wings, Inc.† | 413,417 | ||||||
| 14,800 | Cambrex Corp.† | 276,464 | ||||||
| 7,566 | Clearwater Paper Corp.† | 454,792 | ||||||
| 4,894 | Coherent, Inc.† | 300,345 | ||||||
| 10,592 | Conn’s, Inc.† | 320,620 | ||||||
| 5,449 | Curtiss-Wright Corp. | 359,198 | ||||||
| 16,500 | Daktronics, Inc. | 202,785 | ||||||
| 1,885 | Dril-Quip, Inc.† | 168,519 | ||||||
| 21,388 | Emergent Biosolutions, Inc.† | 455,778 | ||||||
| 8,873 | Encore Capital Group, Inc.† | 393,163 | ||||||
| 4,665 | FEI Co. | 351,834 | ||||||
| 6,850 | Finish Line, Inc., Class A | 171,456 | ||||||
| 152 | GameStop Corp., Class A | 6,262 | ||||||
| 5,369 | HB Fuller Co. | 213,149 | ||||||
| 3,612 | j2 Global, Inc. | 178,288 | ||||||
| 20,100 | Landec Corp.† | 246,225 | ||||||
| 9,000 | Lannett Co., Inc.† | 411,120 | ||||||
| 7,026 | Leggett & Platt, Inc. | 245,348 | ||||||
| 9,931 | Ligand Pharmaceuticals, Inc., Class B† | 466,658 | ||||||
| Shares or Principal Amount | Value | |||||||
| 8,100 | LSB Industries, Inc.† | $ | 289,251 | |||||
| 6,565 | Lumber Liquidators Holdings, Inc.† | 376,700 | ||||||
| 4,345 | Methanex Corp. | 290,246 | ||||||
| 11,771 | Methode Electronics, Inc. | 433,997 | ||||||
| 7,333 | Minerals Technologies, Inc. | 452,519 | ||||||
| 3,320 | PAREXEL International Corp.† | 209,459 | ||||||
| 11,502 | Perficient, Inc.† | 172,415 | ||||||
| 5,453 | Portfolio Recovery Associates, Inc.† | 284,810 | ||||||
| 8,440 | RigNet, Inc.† | 341,398 | ||||||
| 3,360 | Rogers Corp.† | 183,994 | ||||||
| 5,857 | Steven Madden, Ltd.† | 188,771 | ||||||
| 2,925 | SYNNEX Corp.† | 189,043 | ||||||
| 9,401 | Thor Industries, Inc. | 484,151 | ||||||
| 4,400 | Total System Services, Inc. | 136,224 | ||||||
| 8,205 | VistaPrint NV† | 449,552 | ||||||
| 1,782 | Waddell & Reed Financial, Inc., Class A | 92,112 | ||||||
| 2,304 | World Acceptance Corp.† | 155,520 | ||||||
|
| |||||||
| | Total Common Stocks (Cost $12,641,715) | 11,979,418 | ||||||
| | Total Investments 98.7% (Cost $12,641,715) | 11,979,418 | ||||||
| | Other Assets Less Liabilities 1.3% | 153,277 | ||||||
|
| |||||||
| Net Assets 100.0% | $ | 12,132,695 | ||||||
|
| |||||||
| SCHEDULEOF INVESTMENTS | 39 |
The accompanying notes are an integral part of the financial statements.
| † | Non-income producing security. |
Table of Contents
MANAGEMENT OVERVIEW (UNAUDITED) | Class S Class A | IOCZX IOCAX |
| Q. | How did the Fund perform relative to its benchmarks? |
| A. | The Risk-Managed Balanced Fund (the Fund) Class S shares returned 6.02% for the fiscal year ended September 30, 2014. The S&P Composite 1500 Index rose 18.57% and the Balanced Blended Benchmark was up 12.80%. The Balanced Blended Benchmark is based on a weighting of 60% S&P Composite 1500 Index and 40% Barclays Capital U.S. Universal Index, rebalanced monthly. Total returns for other periods and additional Class shares as of September 30, 2014, appear in the subsequent pages of this Fund’s Management Overview. |
| Q. | What primary factors influenced the Fund’s relative performance during the period? |
| A. | As we entered fiscal year 2014, our equity valuation model saw the domestic market as approximately fair valued, which was significant because we had been bullish on the equity market as a whole since early 2009. With the market close to fair value, the Fund was positioned conservatively with a 55% equity / 45% fixed income allocation. Additionally, the Fund had a relatively tight hedge on its equity holdings using both S&P 500 out-of-the-money puts and S&P 500 out-of-the-money written calls in an attempt to reduce the overall effect of market volatility on the Fund. While the Fund was positioned based on our valuation discipline, the overall allocation and hedging profile proved to be a disadvantage as the equity market produced strong returns over the first few months of the fiscal year. However, the Fund was able to reduce downside participation and overall volatility as a combination of macro-economic concerns and stretched valuations resulted in reduced equity returns and boosted safer fixed income assets from about mid-January to mid-April 2014. This bout of equity volatility reduced some valuation froth within the market and we began to see upside opportunities in certain sectors. Additionally, during this period, the combination of falling bond yields and historically tight credit spreads reduced the overall attractiveness of the bond market. In response to the opportunities we saw on the equity side and relative fixed income attractiveness, we adjusted the allocation of the Fund towards a more normal balanced fund profile of 60% equities / 40% fixed income. Additionally, the hedge on the equity portion of the Fund was loosened in order to have a better opportunity to participate in the anticipated |
| 40 | MANAGEMENT OVERVIEW |
Table of Contents
| upside move. This proved to be beneficial as the equity market proceeded to rally aggressively through the end of fiscal year 2014. |
| Q. | How did the Fund’s composition affect performance? |
| A. | Focusing on the equity portion of the Fund, the largest sector contributor to performance over fiscal year 2014 was the Health Care sector. While the Fund was underweight the sector as a whole due to stretched sector valuations, we saw industry specific opportunities that performed well producing positive benchmark relative selection effect. Other sectors that contributed positively to Fund performance include Materials, Industrials, and Utilities. Overweight positions in all three sectors resulted in positive relative total effect for both the Materials and Industrials sectors but a slight negative total effect for the Utilities sector due to less robust returns on the stock selection side. Inversely, positions in the Energy sector detracted from Fund performance as the combination of an overweight position and underperforming stock selections resulted in a negative relative total effect. Further, both the Information Technology and Financials sectors also produced negative benchmark relative total effect due in large part to underperforming stock selections. Going forward we continue to add to some of the underperforming names within these three sectors as they continue to have attractive valuations according to our system. |
Moving to individual stock performance within the Fund, the largest contributors to performance relative to the benchmark were LyondellBasell Industries, Actavis Plc., Biogen Idec Inc., Walt Disney Company, & Gilead Sciences. The five largest detractors from performance relative to the benchmark were Oceaneering International, Waddell & Reed Financial, Lumber Liquidators Holdings, Bristow Group, & Dril-Quip Inc.
Focusing on the fixed income portion of the Fund, fiscal year 2014 caught many investors off guard when a largely anticipated bond sell-off turned into a strong rally as yields fell across the board. The yield on the U.S. Generic Government 10-year Treasury began the fiscal year at a value of 2.62%, rose above 3.00% by the end of the calendar year 2013, fell below 2.45% at the end of May 2014 in response to some macro-economic uncertainty, and finally finished the fiscal year at a value of 2.49%. In addition to the rally in the U.S. treasury market, corporate bond spreads tightened throughout the majority of the fiscal year in both investment grade and high yield corporate bonds before experiencing some volatility during the third quarter of 2014. While the fixed income portion of the Fund maintained a lower overall duration over the course of the time period, resulting in less relative curve effect, the Fund was able to
| MANAGEMENT OVERVIEW | 41 |
Table of Contents
outperform the broad based fixed income benchmark during the fiscal year through a combination of bond selections within the corporate bond segment of the market and active allocation to both preferred shares and closed-end fund positions. In the corporate bond space, we maintained a lower overall duration relative to the benchmark, but selections in the Energy, Financials, and Telecommunications sectors of the market outperformed the market as a whole. As spreads continued to tighten, we focused on other segments of the market to produce alpha for our investors, including certain preferred issues. All of our positions in this space produced positive returns, but three specific holdings within the real estate segment of the market did particularly well with one position producing a large gain due to a company issued call. Lastly, holdings within the closed-end segment of the market also produced positive returns as either net asset value (NAV) based movement or discount arbitrage opportunities were realized. Overall, during the period, the Fund’s fixed income allocation outperformed the fixed income segment of the benchmark.
| Q. | What is your investment outlook? |
| A. | Our equity valuations concluded fiscal year 2014 with a value-to-price (V/P) ratio of 1.10 as of October 1, 2014, giving us confidence there is room for the market to rise in the coming year. Additionally, our system indicates a notable cyclical tilt in the sector opportunities we are seeing with specific emphasis on Consumer Discretionary, Energy, and Materials. The Fund continues to maintain a more normal balanced allocation stance with approximately 60% in equities and 40% in fixed income (including preferred stocks & closed-end funds) although we are looking for opportunities to increase overall equity exposure. The equity hedge has recently been reduced targeting a beta of approximately 0.90, which is at the upper end of our historical range and will be adjusted based on the amount of upside we see in the equity market over the year. In the fixed income portion of the Fund we continue to be very selective in our individual bond holdings as historically tight spreads force us to focus on downside risks. However, the recent volatility seen in the high yield segment of the market is presenting us with opportunities that have been less apparent over the last few years. Additionally, we continue to see opportunity in unique structured bonds like fixed-to-float securities, preferred securities with attractive upside profiles, and closed-end fund discount arbitrage opportunities. As always, we continue to use our bottom up, issue specific approach to find opportunities in the market. |
| 42 | MANAGEMENT OVERVIEW |
Table of Contents
ICON Risk-Managed Balanced Fund
Sector Composition
September 30, 2014
Financial | 13.2% | |||
Information Technology | 11.2% | |||
Energy | 8.9% | |||
Materials | 8.4% | |||
Consumer Discretionary | 7.5% | |||
Industrials | 5.5% | |||
Health Care | 4.8% | |||
Utilities | 2.3% | |||
Consumer Staples | 1.9% | |||
|
| |||
| 63.7% | ||||
|
|
Percentages are based upon common and preferred stocks as a percentage of net assets.
ICON Risk-Managed Balanced Fund
Industry Composition
September 30, 2014
Data Processing & Outsourced Services | 6.3% | |||
Oil & Gas Equipment & Services | 5.8% | |||
Consumer Finance | 4.4% | |||
Commodity Chemicals | 4.1% | |||
Regional Banks | 4.0% | |||
Home Improvement Retail | 3.6% | |||
Oil & Gas Exploration & Production | 3.1% | |||
Asset Management & Custody Banks | 2.4% | |||
Railroads | 2.4% | |||
Cable & Satellite | 2.1% | |||
IT Consulting & Other Services | 2.1% | |||
Paper Packaging | 2.1% | |||
Pharmaceuticals | 1.8% |
Office REIT’s | 1.7% | |||
Health Care Distributors | 1.6% | |||
Airlines | 1.4% | |||
Biotechnology | 1.4% | |||
Specialty Chemicals | 1.4% | |||
Hypermarkets & Super Centers | 1.3% | |||
Internet Software & Services | 1.3% | |||
Technology Hardware, Storage & Peripherals | 1.1% | |||
Gas Utilities | 1.0% | |||
Other Industries (each less | 7.3% | |||
|
| |||
| 63.7% | ||||
|
|
Percentages are based upon common and preferred stocks as a percentage of net assets.
| MANAGEMENT OVERVIEW | 43 |
Table of Contents
ICON Risk-Managed Balanced Fund
Credit Diversification
September 30, 2014
Aaa | 2.7% | |||
A1 | 1.5% | |||
A3 | 1.9% | |||
Baa1 | 4.1% | |||
Baa2 | 1.7% | |||
Baa3 | 8.6% | |||
Ba1 | 0.7% | |||
Ba2 | 1.0% |
Ba3 | 2.1% | |||
B2 | 1.5% | |||
B3 | 1.7% | |||
|
| |||
| 27.5% | ||||
|
|
Percentages are based upon U.S. Treasury obligations, corporate and foreign corporate bond investments as a percentage of net assets. Ratings based on Moody’s Investors Service, Inc.
ICON Risk-Managed Balanced Fund
Average Annual Total Return
as of September 30, 2013
| Inception Date | 1 Year | 5 Years | 10 Years | Since Inception | Gross Expense Ratio* | Net Expense Ratio* | ||||||||||||||||||||||
ICON Risk-Managed Balanced Fund - Class S | 5/6/04 | 6.02% | 7.01% | 4.00% | 4.16% | 1.43% | 1.21% | |||||||||||||||||||||
ICON Risk-Managed Balanced Fund - Class C | 11/21/02 | 5.06% | 5.94% | 2.94% | 4.47% | 2.72% | 2.22% | |||||||||||||||||||||
ICON Risk-Managed Balanced Fund - Class A | 5/31/06 | 5.88% | 6.78% | N/A | 3.43% | 2.12% | 1.47% | |||||||||||||||||||||
ICON Risk-Managed Balanced Fund - Class A (including maximum sales charge of 5.75%) | 5/31/06 | -0.21% | 5.53% | N/A | 2.69% | 2.12% | 1.47% | |||||||||||||||||||||
S&P Composite 1500 Index | 18.57% | 15.79% | 8.34% | 9.03 | N/A | N/A | ||||||||||||||||||||||
Past performance is not a guarantee of future results. Information about these performance results and the comparative indexes can be found in the About This Report section. The Adviser has agreed to limit certain Fund expenses; without these limitations, returns would have been lower. The limitation provisions may be terminated in the future.
| * | Please see the most recent prospectus for details. |
Class C total returns exclude applicable sales charges. If sales charges were included returns would be lower.
| 44 | MANAGEMENT OVERVIEW |
Table of Contents
ICON Risk-Managed Balanced Fund
Value of a $10,000 Investment
through September 30, 2014
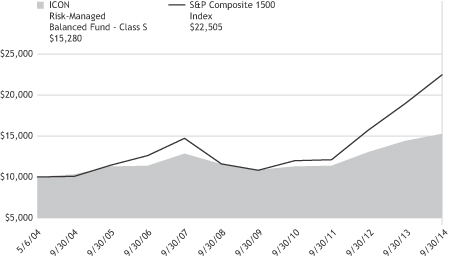
Past performance is not a guarantee of future results. The above graph compares a $10,000 investment made in the Risk-Managed Balanced Fund’s Class S shares on the Class’ inception date of 5/6/04 to a $10,000 investment made in an unmanaged securities index on that date. Performance for the Risk-Managed Balanced Fund’s other share classes will vary due to differences in charges and expenses. The Risk-Managed Balanced Fund’s performance in this chart and the performance table assumes the reinvestment of dividends and capital gain distributions but does not reflect the deduction of taxes that a shareholder would pay on Fund distributions or on the redemption of Fund shares.
| MANAGEMENT OVERVIEW | 45 |
Table of Contents
ICON RISK-MANAGED BALANCED FUND
SCHEDULEOF INVESTMENTS
SEPTEMBER 30, 2014
| Shares or Principal Amount | Value | |||||||
| Common Stocks (61.3%) | ||||||||
| 9,500 | Accenture PLC, Class A | $ | 772,540 | |||||
| 2,800 | Actavis PLC† | 675,584 | ||||||
| 3,600 | Alliance Data Systems Corp.† | 893,772 | ||||||
| 3,900 | Apple, Inc. | 392,925 | ||||||
| 5,000 | Ashland, Inc. | 520,500 | ||||||
| 2,700 | Atmos Energy Corp. | 128,790 | ||||||
| 17,400 | Avery Dennison Corp. | 776,910 | ||||||
| 1,000 | Biogen Idec, Inc.† | 330,810 | ||||||
| 10,900 | Bristow Group, Inc. | 732,480 | ||||||
| 6,200 | CBS Corp., Class B | 331,700 | ||||||
| 10,200 | CMS Energy Corp. | 302,532 | ||||||
| 14,000 | Comcast Corp., Class A | 752,920 | ||||||
| 3,800 | Costco Wholesale Corp. | 476,216 | ||||||
| 14,000 | Delta Air Lines, Inc.(x) | 506,100 | ||||||
| 12,900 | Discover Financial Services(x) | 830,631 | ||||||
| 16,900 | Encore Capital Group, Inc.†(a) | 748,839 | ||||||
| 7,000 | EQT Corp.(x) | 640,780 | ||||||
| 6,000 | Facebook, Inc., Class A†(x) | 474,240 | ||||||
| 4,900 | Genesee & Wyoming, Inc., Class A† | 467,019 | ||||||
| 1,700 | Gilead Sciences, Inc.† | 180,965 | ||||||
| 12,000 | Healthcare Services Group, Inc. | 343,320 | ||||||
| 8,000 | Home Depot, Inc.(x) | 733,920 | ||||||
| 6,000 | International Paper Co.(x) | 286,440 | ||||||
| Shares or Principal Amount | Value | |||||||
| 7,600 | Invesco, Ltd. | $ | 300,048 | |||||
| 5,100 | Laclede Group, Inc. | 236,640 | ||||||
| 10,000 | Lumber Liquidators Holdings, Inc.†(x) | 573,800 | ||||||
| 8,100 | LyondellBasell Industries, Class A(x) | 880,146 | ||||||
| 8,000 | Mastercard, Inc., Class A(x) | 591,360 | ||||||
| 3,000 | McKesson Corp.(x) | 584,010 | ||||||
| 9,300 | Methanex Corp.(x) | 621,240 | ||||||
| 13,300 | Oceaneering International, Inc.(x) | 866,761 | ||||||
| 7,000 | Range Resources Corp.(x) | 474,670 | ||||||
| 3,400 | Reynolds American, Inc.(x) | 200,600 | ||||||
| 5,000 | Schlumberger, Ltd. | 508,450 | ||||||
| 8,300 | Signature Bank†(x) | 930,098 | ||||||
| 5,000 | SVB Financial Group† | 560,450 | ||||||
| 2,500 | SYNNEX Corp.† | 161,575 | ||||||
| 6,400 | Tyco International, Ltd. | 285,248 | ||||||
| 5,300 | UIL Holdings Corp. | 187,620 | ||||||
| 3,800 | Union Pacific Corp.(x) | 411,996 | ||||||
| 4,000 | Visa, Inc., Class A | 853,480 | ||||||
| 11,000 | Waddell & Reed Financial, Inc., Class A | 568,590 | ||||||
| 3,500 | Walt Disney Co. | 311,605 | ||||||
|
| |||||||
|
| Total Common Stocks (Cost $21,969,191) | 22,408,320 | ||||||
| 46 | SCHEDULEOF INVESTMENTS |
Table of Contents
| Shares or Principal Amount | Interest Rate | Maturity Date | Value | |||||||||||||
| Corporate Bonds (23.4%) | ||||||||||||||||
| $ | 500,000 | AIG Life Holdings, Inc. | 6.63 | % | 02/15/29 | $ | 614,023 | |||||||||
| 355,000 | AIG Retirement | 8.13 | % | 04/28/23 | 453,577 | |||||||||||
| 328,000 | Altria Group, Inc. | 9.25 | % | 08/06/19 | 426,993 | |||||||||||
| 250,000 | Brightstar Corp.(b) | 7.25 | % | 08/01/18 | 269,063 | |||||||||||
| 1,156,000 | Clearwire Communications LLC / Clearwire Finance, Inc.(b) | 14.75 | % | 12/01/16 | 1,436,330 | |||||||||||
| 500,000 | Fulton Capital Trust I Ltd. | 6.29 | % | 02/01/36 | 482,500 | |||||||||||
| 500,000 | General Electric Capital Corp. / LJ VP Holdings LLC(b) | 3.80 | % | 06/18/19 | 532,559 | |||||||||||
| 250,000 | Goodman Networks, Inc. | 12.13 | % | 07/01/18 | 262,500 | |||||||||||
| 340,000 | GRD Holdings III Corp.(b) | 10.75 | % | 06/01/19 | 374,850 | |||||||||||
| 442,801 | Kiowa Power Partners LLC(b) | 5.74 | % | 03/30/21 | 460,956 | |||||||||||
| 500,000 | Lender Processing Services, Inc. / Black Knight Lending Solutions, Inc. | 5.75 | % | 04/15/23 | 522,500 | |||||||||||
| 250,000 | Liberty Mutual Group, Inc.(b)(c) | 7.00 | % | 03/15/37 | 265,000 | |||||||||||
| 250,000 | Masco Corp. | 5.95 | % | 03/15/22 | 273,125 | |||||||||||
| 500,000 | Prudential Financial, Inc.(c) | 8.88 | % | 06/15/38 | 603,125 | |||||||||||
| 500,000 | Prudential Insurance Co. of America(b) | 8.30 | % | 07/01/25 | 678,994 | |||||||||||
| 335,000 | SESI LLC | 7.13 | % | 12/15/21 | 370,175 | |||||||||||
| 500,000 | United Refining Co. | 10.50 | % | 02/28/18 | 532,500 | |||||||||||
|
| |||||||||||||||
|
| Total Corporate Bonds (Cost $8,629,799) | 8,558,770 | ||||||||||||||
| Shares or Principal Amount | Value | |||||||||||||||
| Closed-End Mutual Funds (4.8%) | ||||||||||||||||
| 8,993 | BlackRock Enhanced Government Fund, Inc. | $ | 126,262 | |||||||||||||
| 47,618 | Diversified Real Asset Income Fund | 844,267 | ||||||||||||||
| 4,067 | Firsthand Technology Value Fund, Inc.†(a) | 97,649 | ||||||||||||||
| 30,538 | Nuveen Diversified Currency Opportunities Fund | 325,535 | ||||||||||||||
| 16,801 | Nuveen Dividend Advantage Municipal Fund 3 | 229,670 | ||||||||||||||
| 4,374 | Nuveen Dividend Advantage Municipal Income Fund | 61,717 | ||||||||||||||
| 4,197 | Nuveen Municipal Advantage Fund, Inc. | 56,617 | ||||||||||||||
| 1,707 | Nuveen Quality Income Municipal Fund, Inc. | 23,369 | ||||||||||||||
|
| |||||||||||||||
|
| Total Closed-End Mutual Funds (Cost $1,751,706) | 1,765,086 | ||||||||||||||
| Shares or Principal Amount | Interest Rate | Maturity Date | Value | |||||||||||||
| U.S. Treasury Obligations (2.7%) | ||||||||||||||||
| $ | 500,000 | U.S. Treasury Note | 0.63 | % | 08/31/17 | $ | 493,399 | |||||||||
| 500,000 | U.S. Treasury Note | 1.13 | % | 12/31/19 | 481,406 | |||||||||||
|
| |||||||||||||||
|
| Total U.S. Treasury Obligations (Cost $976,934) | 974,805 | ||||||||||||||
| SCHEDULEOF INVESTMENTS | 47 |
Table of Contents
| Shares or Principal Amount | Value | |||||||||||||||
| Preferred Stocks (2.4%) | ||||||||||||||||
| 10,981 | American Homes 4 Rent REIT, Series B(d) | $ | 262,007 | |||||||||||||
| 14,681 | Equity Commonwealth, Series E | 374,512 | ||||||||||||||
| 10,000 | Gramercy Property Trust, Inc., Series B | 251,500 | ||||||||||||||
|
| |||||||||||||||
|
| Total Preferred Stocks (Cost $893,267) | 888,019 | ||||||||||||||
| Shares or Principal Amount | Interest Rate | Maturity Date | Value | |||||||||||||
| Foreign Corporate Bonds (1.4%) | ||||||||||||||||
| $ | 500,000 | Shelf Drilling Holdings Ltd.(a)(b) | 8.63 | % | 11/01/18 | $ | 525,000 | |||||||||
|
| |||||||||||||||
|
| Total Foreign Corporate Bonds (Cost $538,998) | 525,000 | ||||||||||||||
| Underlying Security/Expiration Date/Exercise Price | Contracts* | Value | ||||||||||||||
| Put Options Purchased (0.2%) | ||||||||||||||||
| S+P 500 Index, | 30 | $ | 67,500 | ||||||||||||
|
| |||||||||||||||
|
| Total Put Options Purchased (Cost $55,302) | 67,500 | ||||||||||||||
| Shares or Principal Amount | Value | |||||||||||||||
| Collateral for Securities on Loan (3.9%) | ||||||||||||||||
| 1,422,694 | State Street Navigator Prime Portfolio, 0.15% | $ | 1,422,694 | |||||||||||||
|
| |||||||||||||||
|
| Total Collateral for Securities on Loan (Cost $1,422,694) | 1,422,694 | ||||||||||||||
| Short-Term Investments (2.1%) | ||||||||||||||||
| $ | 754,308 | State Street Euro Dollar Time Deposit (USD), 0.01%, 10/01/14 | 754,308 | |||||||||||||
|
| |||||||||||||||
|
| Total Short-Term Investments (Cost $754,308) | 754,308 | ||||||||||||||
|
| Total Investments 102.2% (Cost $36,992,199) | 37,364,502 | ||||||||||||||
| Liabilities Less Other Assets (2.2)% | (810,265 | ) | ||||||||||||||
|
| |||||||||||||||
| Net Assets 100.0% | $ | 36,554,237 | ||||||||||||||
|
| |||||||||||||||
The accompanying notes are an integral part of the financial statements.
| * | All options have 100 shares per contract. |
| † | Non-income producing security. |
| (x) | All or a portion of the security is pledged as collateral for call options written. |
| (a) | All or a portion of the security was on loan as of September 30, 2014. |
| (b) | 144A - Exempt from registration under Rule 144A of the Securities Act of 1933. These securities may be resold in transactions exempt from registration, typically only to qualified institutional buyers. Unless otherwise indicated, these securities are not considered to be illiquid. |
| (c) | Fixed rate to floating rate security. Rate disclosed as of September 30, 2014 is currently fixed. |
| (d) | Preferred Stock - the coupon is at a fixed rate and resets at a specific date and rate. The rate disclosed is as of September 30, 2014. |
| REIT | Real Estate Investment Trust |
| 48 | SCHEDULEOF INVESTMENTS |
Table of Contents
ICON RISK-MANAGED BALANCED FUND
SCHEDULEOF WRITTEN CALL OPTIONS
SEPTEMBER 30, 2014
Underlying Security/ Expiration Date/ Exercise Price | Contracts* | Value | ||||||
S+P 500 Index November 2014, 2,010 | 20 | $ | 36,000 | |||||
|
| |||||||
Total Options Written (Premiums received $57,732) | $ | 36,000 | ||||||
The accompanying notes are an integral part of the financial statements.
| * | All options have 100 shares per contract. |
| SCHEDULEOF INVESTMENTS | 49 |
Table of Contents
STATEMENTSOF ASSETSAND LIABILITIES
SEPTEMBER 30, 2014
| ICON Bond Fund | ICON Equity Income Fund | ICON Fund | ||||||||||
Assets | ||||||||||||
Investments, at cost | $ | 97,340,522 | $ | 28,563,909 | $ | 65,524,637 | ||||||
|
|
|
|
|
| |||||||
Investments, at value† | 97,021,632 | 29,093,203 | 68,839,433 | |||||||||
Foreign currency, at value(a) | - | 3 | - | |||||||||
Cash | 558,167 | - | - | |||||||||
Receivables: | ||||||||||||
Fund shares sold | 389,744 | 32,999 | 8,251 | |||||||||
Investments sold | 1,047,008 | 1,068,820 | 1,085,161 | |||||||||
Interest | 1,202,941 | - | - | |||||||||
Dividends | 121,635 | 95,828 | 46,758 | |||||||||
Expense reimbursements due from Adviser | 41,692 | 9,180 | 881 | |||||||||
Foreign tax reclaims | - | 1,644 | 476 | |||||||||
Other assets | 28,225 | 20,005 | 22,217 | |||||||||
|
|
|
|
|
| |||||||
Total Assets | 100,411,044 | 30,321,682 | 70,003,177 | |||||||||
|
|
|
|
|
| |||||||
Liabilities | ||||||||||||
Payables: | ||||||||||||
Due to custodian bank | - | - | 585,592 | |||||||||
Expense recoupment due to adviser | - | - | 1,892 | |||||||||
Investments purchased | 275,300 | - | - | |||||||||
Payable for collateral received on securities loaned | 5,128,327 | 2,849,625 | 2,566,103 | |||||||||
Fund shares redeemed | 21,180 | 13,723 | 39,906 | |||||||||
Distributions due to shareholders | 40,808 | 37,045 | - | |||||||||
Advisory fees | 46,623 | 17,055 | 42,745 | |||||||||
Accrued distribution fees | 2,870 | 7,455 | 16,300 | |||||||||
Fund accounting fees | 3,220 | 908 | 2,266 | |||||||||
Transfer agent fees | 11,608 | 7,316 | 8,546 | |||||||||
Administration fees | 3,868 | 1,132 | 2,837 | |||||||||
Trustee fees | 3,042 | 741 | 1,250 | |||||||||
Accrued expenses | 42,291 | 36,817 | 33,082 | |||||||||
|
|
|
|
|
| |||||||
Total Liabilities | 5,579,137 | 2,971,817 | 3,300,519 | |||||||||
|
|
|
|
|
| |||||||
Net Assets - all share classes | $ | 94,831,907 | $ | 27,349,865 | $ | 66,702,658 | ||||||
|
|
|
|
|
| |||||||
Net Assets - Class S | $ | 87,674,934 | $ | 8,022,025 | $ | 41,577,300 | ||||||
|
|
|
|
|
| |||||||
Net Assets - Class C | $ | 2,879,060 | $ | 5,480,817 | $ | 17,049,406 | ||||||
|
|
|
|
|
| |||||||
Net Assets - Class A | $ | 4,277,913 | $ | 13,847,023 | $ | 8,075,952 | ||||||
|
|
|
|
|
| |||||||
| 50 | FINANCIAL STATEMENTS |
Table of Contents
| ICON Bond Fund | ICON Equity Income Fund | ICON Fund | ||||||||||
Net Assets Consist of | ||||||||||||
Paid-in capital | $ | 92,833,948 | $ | 48,957,892 | $ | 84,596,659 | ||||||
Accumulated undistributed net investment income/(loss) | - | 2,556 | (199,698 | ) | ||||||||
Accumulated undistributed net realized gain/(loss) | 2,316,849 | (22,139,775 | ) | (21,009,099 | ) | |||||||
Unrealized appreciation/(depreciation) | (318,890 | ) | 529,192 | 3,314,796 | ||||||||
|
|
|
|
|
| |||||||
Net Assets | $ | 94,831,907 | $ | 27,349,865 | $ | 66,702,658 | ||||||
|
|
|
|
|
| |||||||
Shares outstanding (unlimited shares authorized, no par value) | ||||||||||||
Class S | 8,859,729 | 539,464 | 2,863,365 | |||||||||
Class C | 289,756 | 366,458 | 1,296,453 | |||||||||
Class A | 433,820 | 936,234 | 583,363 | |||||||||
Net asset value (offering and redemption price per share) | ||||||||||||
Class S | $ | 9.90 | $ | 14.87 | $ | 14.52 | ||||||
Class C | $ | 9.94 | $ | 14.96 | $ | 13.15 | ||||||
Class A | $ | 9.86 | $ | 14.79 | $ | 13.84 | ||||||
Class A maximum offering price (100%/(100%-maximum sales charge)) of net asset value adjusted to the nearest cent per share | $ | 10.35 | $ | 15.69 | $ | 14.68 | ||||||
† Includes securities on loan of | $ | 4,940,927 | $ | 2,761,982 | $ | 2,483,757 | ||||||
(a) Foreign currency, at cost | $ | - | $ | 3 | $ | - | ||||||
The accompanying notes are an integral part of the financial statements.
| FINANCIAL STATEMENTS | 51 |
Table of Contents
STATEMENTSOF ASSETSAND LIABILITIES
SEPTEMBER 30, 2014
| ICON Long/Short Fund | ICON Opportunities Fund | ICON Risk-Managed Balanced Fund | ||||||||||
Assets | ||||||||||||
Investments, at cost | $ | 36,778,468 | $ | 12,641,715 | $ | 36,992,199 | ||||||
|
|
|
|
|
| |||||||
Investments, at value† | 38,612,084 | 11,979,418 | 37,364,502 | |||||||||
Deposits for Short Sales | 1,363,960 | – | – | |||||||||
Cash | – | 150 | 166,220 | |||||||||
Cash due from prime broker | 49,523 | – | 104,904 | |||||||||
Receivables: | ||||||||||||
Fund shares sold | 102,671 | 1,626 | 138,386 | |||||||||
Investments sold | – | 302,551 | 151,658 | |||||||||
Interest | – | – | 180,840 | |||||||||
Dividends | 8,500 | 2,178 | 41,928 | |||||||||
Expense reimbursements due from Adviser | 27,342 | 3,464 | 21,379 | |||||||||
Other assets | 19,865 | 10,342 | 24,833 | |||||||||
|
|
|
|
|
| |||||||
Total Assets | 40,183,945 | 12,299,729 | 38,194,650 | |||||||||
|
|
|
|
|
| |||||||
Liabilities | ||||||||||||
Options written, at value (premiums received $57,732) | – | – | 36,000 | |||||||||
Securities sold short, at value (proceeds of $999,482) | 992,222 | – | – | |||||||||
Payables: | ||||||||||||
Due to custodian bank | 903,459 | 16,525 | – | |||||||||
Expense recoupment due to adviser | – | 2,396 | – | |||||||||
Investments purchased | – | 112,414 | – | |||||||||
Payable for collateral received on securities loaned | 3,405,494 | – | 1,422,694 | |||||||||
Fund shares redeemed | 237,995 | 4,504 | 65,257 | |||||||||
Distributions due to shareholders | – | – | 15,237 | |||||||||
Advisory fees | 25,453 | 7,804 | 22,784 | |||||||||
Accrued distribution fees | 8,261 | – | 9,216 | |||||||||
Fund accounting fees | 1,193 | 295 | 1,249 | |||||||||
Transfer agent fees | 14,783 | 104 | 13,078 | |||||||||
Administration fees | 1,490 | 518 | 1,512 | |||||||||
Trustee fees | 977 | 54 | 2,147 | |||||||||
Accrued expenses | 35,839 | 22,420 | 51,239 | |||||||||
|
|
|
|
|
| |||||||
Total Liabilities | 5,627,166 | 167,034 | 1,640,413 | |||||||||
|
|
|
|
|
| |||||||
Net Assets - all share classes | $ | 34,556,779 | $ | 12,132,695 | $ | 36,554,237 | ||||||
|
|
|
|
|
| |||||||
Net Assets - Class S | $ | 16,464,700 | $ | – | $ | 20,071,336 | ||||||
|
|
|
|
|
| |||||||
Net Assets - Class C | $ | 6,931,872 | $ | – | $ | 9,468,578 | ||||||
|
|
|
|
|
| |||||||
Net Assets - Class A | $ | 11,160,207 | $ | – | $ | 7,014,323 | ||||||
|
|
|
|
|
| |||||||
| 52 | FINANCIAL STATEMENTS |
Table of Contents
| ICON Long/Short Fund | ICON Opportunities Fund | ICON Risk-Managed Balanced Fund | ||||||||||
Net Assets Consist of | ||||||||||||
Paid-in capital | $ | 89,723,691 | $ | 12,630,376 | $ | 49,833,986 | ||||||
Accumulated undistributed net investment income/(loss) | (217,386 | ) | – | 8,257 | ||||||||
Accumulated undistributed net realized gain/(loss) | (56,790,402 | ) | 164,616 | (13,682,041 | ) | |||||||
Unrealized appreciation/(depreciation) | 1,840,876 | (662,297 | ) | 394,035 | ||||||||
|
|
|
|
|
| |||||||
Net Assets | $ | 34,556,779 | $ | 12,132,695 | $ | 36,554,237 | ||||||
|
|
|
|
|
| |||||||
Shares outstanding (unlimited shares authorized, no par value) | – | 930,553 | – | |||||||||
Class S | 894,143 | – | 1,435,428 | |||||||||
Class C | 414,204 | – | 734,169 | |||||||||
Class A | 620,510 | – | 512,529 | |||||||||
Net asset value (offering and redemption price per share) | $ | – | $ | 13.04 | $ | – | ||||||
Class S | $ | 18.41 | $ | – | $ | 13.98 | ||||||
Class C | $ | 16.74 | $ | – | $ | 12.90 | ||||||
Class A | $ | 17.99 | $ | – | $ | 13.69 | ||||||
Class A maximum offering price (100%/(100%-maximum sales charge)) of net asset value adjusted to the nearest cent per share | $ | 19.09 | $ | – | $ | 14.53 | ||||||
† Includes securities on loan of | $ | 3,330,635 | $ | – | $ | 1,371,368 | ||||||
The accompanying notes are an integral part of the financial statements.
| FINANCIAL STATEMENTS | 53 |
Table of Contents
STATEMENTSOF OPERATIONS
FORTHEYEARENDED SEPTEMBER 30, 2014
| ICON Bond Fund | ICON Equity Income Fund | ICON Fund | ||||||||||
Investment Income | ||||||||||||
Interest | $ | 3,255,494 | $ | 51,957 | $ | 1,197 | ||||||
Dividends | 1,696,634 | 1,069,829 | 471,515 | |||||||||
Income from securities lending, net | 21,380 | 19,863 | 11,782 | |||||||||
Foreign taxes withheld | - | (12,644 | ) | - | ||||||||
|
|
|
|
|
| |||||||
Total Investment Income | 4,973,508 | 1,129,005 | 484,494 | |||||||||
|
|
|
|
|
| |||||||
Expenses | ||||||||||||
Advisory fees | 586,814 | 180,686 | 314,468 | |||||||||
Distribution fees: | ||||||||||||
Class C | 22,234 | 52,378 | 183,794 | |||||||||
Class A | 11,915 | 32,160 | 23,327 | |||||||||
Fund accounting fees | 19,933 | 4,909 | 8,528 | |||||||||
Transfer agent fees | 78,443 | 45,553 | 69,925 | |||||||||
Administration fees | 48,732 | 12,004 | 20,889 | |||||||||
Custody fees | 10,091 | 3,375 | 2,224 | |||||||||
Registration fees: | - | - | - | |||||||||
Class S | 9,925 | 3,135 | 6,089 | |||||||||
Class C | 10,995 | 11,330 | 13,185 | |||||||||
Class A | 5,320 | 13,783 | 11,710 | |||||||||
Insurance expense | 10,340 | 2,518 | 4,679 | |||||||||
Trustee fees and expenses | 11,585 | 2,777 | 4,296 | |||||||||
Audit and tax service expense | 30,881 | 33,014 | 25,989 | |||||||||
Interest expense | 323 | - | 656 | |||||||||
Recoupment of previously reimbursed expenses | - | - | 2,336 | |||||||||
Dividends on Short positions | - | - | - | |||||||||
Prime broker expense | - | - | - | |||||||||
Other expenses | 47,018 | 18,073 | 24,716 | |||||||||
|
|
|
|
|
| |||||||
Total expenses before expense reimbursement | 904,549 | 415,695 | 716,811 | |||||||||
Expense reimbursement by Adviser due to expense limitation agreement | (136,560 | ) | (42,058 | ) | (6,978 | ) | ||||||
|
|
|
|
|
| |||||||
Net Expenses | 767,989 | 373,637 | 709,833 | |||||||||
|
|
|
|
|
| |||||||
Net Investment Income/(Loss) | 4,205,519 | 755,368 | (225,339 | ) | ||||||||
|
|
|
|
|
| |||||||
Net Realized and Unrealized Gain/(Loss) | ||||||||||||
Net realized gain/(loss) on: | ||||||||||||
Investments | 2,391,782 | 1,899,560 | 9,583,650 | |||||||||
Foreign currency | - | (342 | ) | - | ||||||||
Written options | - | - | - | |||||||||
Securities sold short | - | - | - | |||||||||
Change in unrealized net appreciation/(depreciation) on: | ||||||||||||
Investments | (923,132 | ) | (234,459 | ) | (8,157,199 | ) | ||||||
Written options | - | - | - | |||||||||
Securities sold short | - | - | - | |||||||||
|
|
|
|
|
| |||||||
Net realized and unrealized gain/(loss) | 1,468,650 | 1,664,759 | 1,426,451 | |||||||||
|
|
|
|
|
| |||||||
Net Increase/(Decrease) in Net Assets Resulting From Operations | $ | 5,674,169 | $ | 2,420,127 | $ | 1,201,112 | ||||||
|
|
|
|
|
| |||||||
The accompanying notes are an integral part of the financial statements.
| 54 | FINANCIAL STATEMENTS |
Table of Contents
ICON | ICON Opportunities Fund | ICON Risk-Managed Balanced Fund | ||||||||
| $ | 390 | $ | 28 | $ | 887,610 | |||||
| 300,901 | 15,315 | 1,079,401 | ||||||||
| 12,364 | - | 12,222 | ||||||||
| (1,556 | ) | (177 | ) | (3,906 | ) | |||||
|
|
|
|
|
| |||||
| 312,099 | 15,166 | 1,975,327 | ||||||||
|
|
|
|
|
| |||||
| 269,903 | 17,935 | 504,620 | ||||||||
| 67,902 | - | 78,335 | ||||||||
| 30,670 | - | 18,105 | ||||||||
| 6,445 | 481 | 13,697 | ||||||||
| 72,836 | 2,144 | 81,996 | ||||||||
| 15,818 | 1,190 | 33,525 | ||||||||
| 2,426 | 1,542 | 11,825 | ||||||||
| - | 2,416 | - | ||||||||
| 3,913 | - | 12,653 | ||||||||
| 11,703 | - | 13,134 | ||||||||
| 13,619 | - | 14,131 | ||||||||
| 2,585 | 52 | 2,311 | ||||||||
| 3,268 | 134 | 8,608 | ||||||||
| 30,649 | 23,553 | 36,990 | ||||||||
| 815 | 33 | 1,402 | ||||||||
| | 1,498 | | 2,396 | 56,437 | ||||||
| 7,151 | - | - | ||||||||
| 15,324 | - | - | ||||||||
| 22,394 | 6,608 | 50,597 | ||||||||
|
|
|
|
|
| |||||
| | 578,919 | | 58,484 | 938,366 | ||||||
| (50,612 | ) | (22,580 | ) | (33,132 | ) | ||||
|
|
|
|
|
| |||||
| 528,307 | 35,904 | 905,234 | ||||||||
|
|
|
|
|
| |||||
| (216,208 | ) | (20,738 | ) | 1,070,093 | ||||||
|
|
|
|
|
| |||||
| 2,884,882 | 185,354 | 3,623,064 | ||||||||
| 110 | - | (225 | ) | |||||||
| - | - | (236,539 | ) | |||||||
| (83,967 | ) | - | - | |||||||
| (2,013,226 | ) | (737,258 | ) | (642,983 | ) | |||||
| - | - | (51,140 | ) | |||||||
| 118,101 | - | - | ||||||||
|
|
|
|
|
| |||||
| 905,900 | (551,904 | ) | 2,692,177 | |||||||
|
|
|
|
|
| |||||
$ | 689,692 |
| $ | (572,642 | ) | $ | 3,762,270 | |||
|
|
|
|
|
| |||||
| FINANCIAL STATEMENTS | 55 |
Table of Contents
STATEMENTSOF CHANGESIN NET ASSETS
| ICON Bond Fund | ICON Equity Income Fund | |||||||||||||||
| Year ended September 30, 2014 | Year ended September 30, 2013 | Year ended September 30, 2014 | Year ended September 30, 2013 | |||||||||||||
Operations | ||||||||||||||||
Net investment income/(loss) | $ | 4,205,519 | $ | 2,021,727 | $ | 755,368 | $ | 732,722 | ||||||||
Net realized gain/(loss) | 2,391,782 | 1,808,686 | 1,899,218 | 3,820,735 | ||||||||||||
Change in net unrealized appreciation/(depreciation) | (923,132 | ) | (4,582,127 | ) | (234,459 | ) | (1,112,159 | ) | ||||||||
|
|
|
|
|
|
|
| |||||||||
Net increase/(decrease) in net assets resulting from operations | 5,674,169 | (751,714 | ) | 2,420,127 | 3,441,298 | |||||||||||
|
|
|
|
|
|
|
| |||||||||
Dividends and Distributions to Shareholders | ||||||||||||||||
Net investment income | ||||||||||||||||
Class S | (3,980,600 | ) | (1,805,047 | ) | (212,507 | ) | (178,301 | ) | ||||||||
Class C | (91,693 | ) | (52,646 | ) | (119,845 | ) | (149,518 | ) | ||||||||
Class A | (207,239 | ) | (164,226 | ) | (399,464 | ) | (432,403 | ) | ||||||||
Net realized gains | ||||||||||||||||
Class S | (1,221,845 | ) | (2,116,924 | ) | – | – | ||||||||||
Class C | (33,641 | ) | (105,020 | ) | – | – | ||||||||||
Class A | (84,193 | ) | (208,330 | ) | – | – | ||||||||||
|
|
|
|
|
|
|
| |||||||||
Net decrease from dividends and distributions | (5,619,211 | ) | (4,452,193 | ) | (731,816 | ) | (760,222 | ) | ||||||||
|
|
|
|
|
|
|
| |||||||||
Fund Share Transactions | ||||||||||||||||
Shares sold | ||||||||||||||||
Class S | 25,808,977 | 31,999,432 | 4,320,227 | 3,798,256 | ||||||||||||
Class C | 1,037,215 | 632,592 | 1,565,617 | 927,685 | ||||||||||||
Class A | 2,174,465 | 4,177,547 | 4,270,619 | 2,858,550 | ||||||||||||
Reinvested dividends and distributions | ||||||||||||||||
Class S | 5,037,958 | 3,841,503 | 176,730 | 149,125 | ||||||||||||
Class C | 110,073 | 138,412 | 77,814 | 89,166 | ||||||||||||
Class A | 193,306 | 295,490 | 329,999 | 345,076 | ||||||||||||
Shares repurchased | ||||||||||||||||
Class S | (31,574,518 | ) | (24,400,107 | ) | (1,950,944 | ) | (6,510,218 | ) | ||||||||
Class C | (1,273,625 | ) | (1,313,187 | ) | (1,969,692 | ) | (1,400,893 | ) | ||||||||
Class A | (4,849,752 | ) | (4,723,102 | ) | (4,496,032 | ) | (2,627,276 | ) | ||||||||
|
|
|
|
|
|
|
| |||||||||
Net increase/(decrease) from fund share transactions | (3,335,901 | ) | 10,648,580 | 2,324,338 | (2,370,529 | ) | ||||||||||
|
|
|
|
|
|
|
| |||||||||
Total net increase/(decrease) in net assets | (3,280,943 | ) | 5,444,673 | 4,012,649 | 310,547 | |||||||||||
Net Assets | ||||||||||||||||
Beginning of year | 98,112,850 | 92,668,177 | 23,337,216 | 23,026,669 | ||||||||||||
|
|
|
|
|
|
|
| |||||||||
End of year | $ | 94,831,907 | $ | 98,112,850 | $ | 27,349,865 | $ | 23,337,216 | ||||||||
|
|
|
|
|
|
|
| |||||||||
| 56 | FINANCIAL STATEMENTS |
Table of Contents
| ICON Fund | ICON Long/Short Fund | |||||||||||||
Year ended | Year ended September 30, 2013 | Year ended September 30, 2014 | Year ended September 30, 2013 | |||||||||||
$ | (225,339 | ) | $ | (14,644 | ) | $ | (216,208 | ) | $ | (71,602 | ) | |||
| 9,583,650 | 10,379,428 | 2,801,025 | 3,297,252 | |||||||||||
| (8,157,199 | ) | (2,025,607 | ) | (1,895,125 | ) | 393,306 | |||||||
|
|
|
|
|
|
|
| |||||||
| 1,201,112 |
| 8,339,177 | 689,692 | 3,618,956 | |||||||||
|
|
|
|
|
|
|
| |||||||
|
|
| ||||||||||||
| – | (125,155 | ) | – | – | ||||||||||
| – | – | – | – | |||||||||||
| – | (44,656 | ) | – | – | ||||||||||
| – | – | – | – | |||||||||||
| – | – | – | – | |||||||||||
| – | – | – | – | |||||||||||
|
|
|
|
|
|
|
| |||||||
| – |
| (169,811 | ) | – | – | |||||||||
|
|
|
|
|
|
|
| |||||||
| 39,338,371 | 1,504,207 | 20,303,844 | 2,493,788 | |||||||||||
| 701,776 | 1,236,829 | 1,899,217 | 327,531 | |||||||||||
| 714,468 | 764,166 | 8,514,859 | 2,592,668 | |||||||||||
|
|
| ||||||||||||
| – | 120,377 | – | – | |||||||||||
| – | – | – | – | |||||||||||
| – | 44,027 | – | – | |||||||||||
| (5,050,068 | ) | (19,499,579 | ) | (8,631,931 | ) | (1,876,720 | ) | |||||||
| (3,026,141 | ) | (4,565,141 | ) | (1,322,859 | ) | (1,225,560 | ) | |||||||
| (3,010,830 | ) | (5,671,280 | ) | (6,591,448 | ) | (11,397,248 | ) | |||||||
|
|
|
|
|
|
|
| |||||||
| 29,667,576 |
| (26,066,394 | ) | 14,171,682 | (9,085,541 | ) | |||||||
|
|
|
|
|
|
|
| |||||||
| 30,868,688 |
| (17,897,028 | ) | 14,861,374 | (5,466,585 | ) | |||||||
| 35,833,970 | 53,730,998 | 19,695,405 | 25,161,990 | |||||||||||
|
|
|
|
|
|
|
| |||||||
| $ | 66,702,658 | $ | 35,833,970 | $ | 34,556,779 | $ | 19,695,405 | |||||||
|
|
|
|
|
|
|
| |||||||
| FINANCIAL STATEMENTS | 57 |
Table of Contents
STATEMENTSOF CHANGESIN NET ASSETS (CONTINUED)
| ICON Bond Fund | ICON Equity Income Fund | |||||||||||||||
| Year ended September 30, 2014 | Year ended September 30, 2013 | Year ended September 30, 2014 | Year ended September 30, 2013 | |||||||||||||
Transactions in Fund Shares | ||||||||||||||||
Shares sold | ||||||||||||||||
Class S | 2,592,865 | 3,191,749 | 290,158 | 289,905 | ||||||||||||
Class C | 103,517 | 61,887 | 106,051 | 70,831 | ||||||||||||
Class A | 218,528 | 410,034 | 287,965 | 223,575 | ||||||||||||
Reinvested dividends and distributions | ||||||||||||||||
Class S | 509,394 | 377,817 | 11,918 | 11,531 | ||||||||||||
Class C | 11,098 | 13,538 | 5,226 | 6,865 | ||||||||||||
Class A | 19,561 | 28,997 | 22,426 | 26,724 | ||||||||||||
Shares repurchased | ||||||||||||||||
Class S | (3,173,085 | ) | (2,382,798 | ) | (133,350 | ) | (515,509 | ) | ||||||||
Class C | (127,850 | ) | (129,966 | ) | (135,659 | ) | (107,050 | ) | ||||||||
Class A | (490,776 | ) | (467,338 | ) | (306,449 | ) | (205,513 | ) | ||||||||
|
|
|
|
|
|
|
| |||||||||
Net increase/(decrease) | (336,748 | ) | 1,103,920 | 148,286 | (198,641 | ) | ||||||||||
|
|
|
|
|
|
|
| |||||||||
Shares outstanding, beginning of year | 9,920,053 | 8,816,133 | 1,693,870 | 1,892,511 | ||||||||||||
|
|
|
|
|
|
|
| |||||||||
Shares outstanding, end of year | 9,583,305 | 9,920,053 | 1,842,156 | 1,693,870 | ||||||||||||
|
|
|
|
|
|
|
| |||||||||
Accumulated undistributed net investment income/(loss) | $ | - | $ | - | $ | 2,556 | $ | 2,975 | ||||||||
|
|
|
|
|
|
|
| |||||||||
The accompanying notes are an integral part of the financial statements.
| 58 | FINANCIAL STATEMENTS |
Table of Contents
| ICON Fund | ICON Long/Short Fund | |||||||||||||
Year ended | Year ended September 30, 2013 | Year ended September 30, 2014 | Year ended September 30, 2013 | |||||||||||
| 2,703,725 | 121,654 | 1,088,517 | 155,240 | |||||||||||
| 52,934 | 109,668 | 111,610 | 21,806 | |||||||||||
| 51,369 | 64,470 | 467,016 | 167,924 | |||||||||||
| - | 10,835 | - | - | |||||||||||
| - | - | - | - | |||||||||||
| - | 4,134 | - | - | |||||||||||
| (339,356 | ) | (1,656,644 | ) | (467,545 | ) | (120,447 | ) | |||||||
| (226,841 | ) | (402,626 | ) | (77,860 | ) | (85,591 | ) | |||||||
| (214,698 | ) | (464,696 | ) | (361,119 | ) | (749,427 | ) | |||||||
|
|
|
|
|
|
|
| |||||||
| 2,027,133 | (2,213,205 | ) | 760,619 | (610,495 | ) | |||||||||
|
|
|
|
|
|
|
| |||||||
| 2,716,048 | 4,929,253 | 1,168,238 | 1,778,733 | |||||||||||
|
|
|
|
|
|
|
| |||||||
| 4,743,181 | 2,716,048 | 1,928,857 | 1,168,238 | |||||||||||
|
|
|
|
|
|
|
| |||||||
| $ | (199,698 | ) | $ | (14,662 | ) | $ | (217,386 | ) | $ | (81,756 | ) | |||
|
|
|
|
|
|
|
| |||||||
| FINANCIAL STATEMENTS | 59 |
Table of Contents
STATEMENTSOF CHANGESIN NET ASSETS (CONTINUED)
| ICON Opportunities Fund | ICON Risk-Managed Balanced Fund | |||||||||||||||
| Year ended September 30, 2014 | Year ended September 30, 2013 | Year ended September 30, 2014 | Year ended September 30, 2013 | |||||||||||||
Operations | ||||||||||||||||
Net investment income/(loss) | $ | (20,738 | ) | $ | (234 | ) | $ | 1,070,093 | $ | 295,869 | ||||||
Net realized gain/(loss) | 185,354 | 21,034 | 3,386,300 | 2,597,727 | ||||||||||||
Change in net unrealized appreciation/(depreciation) | (737,258 | ) | 74,961 | (694,123 | ) | (1,535,643 | ) | |||||||||
|
|
|
|
|
|
|
| |||||||||
Net increase/(decrease) in net assets resulting from operations | (572,642 | ) | 95,761 | 3,762,270 | 1,357,953 | |||||||||||
|
|
|
|
|
|
|
| |||||||||
Dividends and Distributions to Shareholders | ||||||||||||||||
Net investment income | - | - | - | - | ||||||||||||
Class S | - | - | (870,218 | ) | (204,302 | ) | ||||||||||
Class C | - | - | (73,148 | ) | (22,634 | ) | ||||||||||
Class A | - | - | (106,307 | ) | (62,534 | ) | ||||||||||
Net realized gains | (20,853 | ) | - | - | - | |||||||||||
|
|
|
|
|
|
|
| |||||||||
Net decrease from dividends and distributions | (20,853 | ) | - | (1,049,673 | ) | (289,470 | ) | |||||||||
|
|
|
|
|
|
|
| |||||||||
Fund Share Transactions | ||||||||||||||||
Shares sold | 13,145,752 | 261,714 | - | - | ||||||||||||
Class S | - | - | 26,547,394 | 39,722,666 | ||||||||||||
Class C | - | - | 4,329,625 | 3,869,861 | ||||||||||||
Class A | - | - | 2,947,462 | 4,944,567 | ||||||||||||
Reinvested dividends and distributions | 20,653 | - | - | - | ||||||||||||
Class S | - | - | 828,672 | 197,831 | ||||||||||||
Class C | - | - | 65,822 | 20,831 | ||||||||||||
Class A | - | - | 84,606 | 50,930 | ||||||||||||
Shares repurchased | (882,170 | ) | (15,520 | ) | - | - | ||||||||||
Class S | - | - | (52,784,217 | ) | (3,787,847 | ) | ||||||||||
Class C | - | - | (874,718 | ) | (660,084 | ) | ||||||||||
Class A | - | - | (4,139,537 | ) | (1,569,911 | ) | ||||||||||
|
|
|
|
|
|
|
| |||||||||
Net increase/(decrease) from fund share transactions | 12,284,235 | 246,194 | (22,994,891 | ) | 42,788,844 | |||||||||||
|
|
|
|
|
|
|
| |||||||||
Total net increase/(decrease) in net assets | 11,690,740 | 341,955 | (20,282,294 | ) | 43,857,327 | |||||||||||
Net Assets | ||||||||||||||||
Beginning of year | 441,955 | 100,000 | 56,836,531 | 12,979,204 | ||||||||||||
|
|
|
|
|
|
|
| |||||||||
End of year | $ | 12,132,695 | $ | 441,955 | $ | 36,554,237 | $ | 56,836,531 | ||||||||
|
|
|
|
|
|
|
| |||||||||
| 60 | FINANCIAL STATEMENTS |
Table of Contents
| ICON Opportunities Fund | ICON Risk-Managed Balanced Fund | |||||||||||||||
| Year ended September 30, 2014 | Year ended September 30, 2013 | Year ended September 30, 2014 | Year ended September 30, 2013 | |||||||||||||
Transactions in Fund Shares | ||||||||||||||||
Shares sold | 960,435 | 25,233 | - | - | ||||||||||||
Class S | - | - | 1,936,186 | 2,970,024 | ||||||||||||
Class C | - | - | 340,349 | 315,370 | ||||||||||||
Class A | - | - | 217,425 | 382,141 | ||||||||||||
Reinvested dividends and distributions | 1,537 | - | - | - | ||||||||||||
Class S | - | - | 59,893 | 15,160 | ||||||||||||
Class C | - | - | 5,143 | 1,753 | ||||||||||||
Class A | - | - | 6,237 | 4,052 | ||||||||||||
Shares repurchased | (65,353 | ) | (1,299 | ) | - | - | ||||||||||
Class S | - | - | (3,796,455 | ) | (292,509 | ) | ||||||||||
Class C | - | - | (68,822 | ) | (56,142 | ) | ||||||||||
Class A | - | - | (307,113 | ) | (125,458 | ) | ||||||||||
|
|
|
|
|
|
|
| |||||||||
Net increase/(decrease) | 896,619 | 23,934 | (1,607,157 | ) | 3,214,391 | |||||||||||
|
|
|
|
|
|
|
| |||||||||
Shares outstanding, beginning of year | 33,934 | 10,000 | 4,289,283 | 1,074,892 | ||||||||||||
|
|
|
|
|
|
|
| |||||||||
Shares outstanding, end of year | 930,553 | 33,934 | 2,682,126 | 4,289,283 | ||||||||||||
|
|
|
|
|
|
|
| |||||||||
Accumulated undistributed net investment income/(loss) | $ | - | $ | - | $ | 8,257 | $ | - | ||||||||
|
|
|
|
|
|
|
| |||||||||
The accompanying notes are an integral part of the financial statements.
| FINANCIAL STATEMENTS | 61 |
Table of Contents
| Income/(loss) from investment operations | Less dividends and | |||||||||||||||||||||||
| Net asset value, beginning of period | Net investment income/ (loss)(x) | Net realized and unrealized gains/(losses) on investments | Total from investment operations | Dividends from net investment income | Distributions from net realized gains | |||||||||||||||||||
ICON Bond Fund | ||||||||||||||||||||||||
Class S** | ||||||||||||||||||||||||
Year ended September 30, 2014 | $ | 9.89 | $ | 0.43 | (f) | $ | 0.15 | $ | 0.58 | $ | (0.44 | ) | $ | (0.13 | ) | |||||||||
Year ended September 30, 2013 | 10.51 | 0.24 | (0.32 | ) | (0.08 | ) | (0.24 | ) | (0.30 | ) | ||||||||||||||
Year ended September 30, 2012 | 10.11 | 0.38 | 0.59 | 0.97 | (0.40 | ) | (0.17 | ) | ||||||||||||||||
Year ended September 30, 2011 | 10.79 | 0.47 | (0.46 | ) | 0.01 | (0.47 | ) | (0.22 | ) | |||||||||||||||
Year ended September 30, 2010 | 10.26 | 0.48 | 0.57 | 1.05 | (0.48 | ) | (0.04 | ) | ||||||||||||||||
Class C | ||||||||||||||||||||||||
Year ended September 30, 2014 | 9.93 | 0.34 | (f) | 0.15 | 0.49 | (0.35 | ) | (0.13 | ) | |||||||||||||||
Year ended September 30, 2013 | 10.55 | 0.15 | (0.32 | ) | (0.17 | ) | (0.15 | ) | (0.30 | ) | ||||||||||||||
Year ended September 30, 2012 | 10.15 | 0.31 | 0.57 | 0.88 | (0.31 | ) | (0.17 | ) | ||||||||||||||||
Year ended September 30, 2011 | 10.83 | 0.39 | (0.46 | ) | (0.07 | ) | (0.39 | ) | (0.22 | ) | ||||||||||||||
Year ended September 30, 2010 | 10.30 | 0.39 | 0.57 | 0.96 | (0.39 | ) | (0.04 | ) | ||||||||||||||||
Class A*** | ||||||||||||||||||||||||
Year ended September 30, 2014 | 9.89 | 0.43 | (f) | 0.12 | 0.55 | (0.45 | ) | (0.13 | ) | |||||||||||||||
Year ended September 30, 2013 | 10.51 | 0.21 | (0.32 | ) | (0.11 | ) | (0.21 | ) | (0.30 | ) | ||||||||||||||
Year ended September 30, 2012 | 10.11 | 0.36 | 0.58 | 0.94 | (0.37 | ) | (0.17 | ) | ||||||||||||||||
Year ended September 30, 2011 | 10.81 | 0.46 | (0.46 | ) | - | (0.48 | ) | (0.22 | ) | |||||||||||||||
ICON Equity Income Fund | ||||||||||||||||||||||||
Class S** | ||||||||||||||||||||||||
Year ended September 30, 2014 | 13.80 | 0.52 | 1.04 | 1.56 | (0.49 | ) | - | |||||||||||||||||
Year ended September 30, 2013 | 12.18 | 0.47 | 1.65 | 2.12 | (0.50 | ) | - | |||||||||||||||||
Year ended September 30, 2012 | 10.21 | 0.43 | 2.03 | 2.46 | (0.49 | ) | - | |||||||||||||||||
Year ended September 30, 2011 | 10.96 | 0.50 | (0.71 | ) | (0.21 | ) | (0.54 | ) | - | |||||||||||||||
Year ended September 30, 2010 | 10.26 | 0.47 | 0.64 | 1.11 | (0.41 | ) | - | |||||||||||||||||
Class C | ||||||||||||||||||||||||
Year ended September 30, 2014 | 13.88 | 0.36 | 1.06 | 1.42 | (0.34 | ) | - | |||||||||||||||||
Year ended September 30, 2013 | 12.25 | 0.35 | 1.65 | 2.00 | (0.37 | ) | - | |||||||||||||||||
Year ended September 30, 2012 | 10.16 | 0.29 | 2.06 | 2.35 | (0.26 | ) | - | |||||||||||||||||
Year ended September 30, 2011 | 10.85 | 0.37 | (0.72 | ) | (0.35 | ) | (0.34 | ) | - | |||||||||||||||
Year ended September 30, 2010 | 10.16 | 0.36 | 0.64 | 1.00 | (0.31 | ) | - | |||||||||||||||||
Class A*** | ||||||||||||||||||||||||
Year ended September 30, 2014 | 13.73 | 0.47 | 1.04 | 1.51 | (0.45 | ) | - | |||||||||||||||||
Year ended September 30, 2013 | 12.12 | 0.45 | 1.63 | 2.08 | (0.47 | ) | - | |||||||||||||||||
Year ended September 30, 2012 | 10.15 | 0.39 | 2.03 | 2.42 | (0.45 | ) | - | |||||||||||||||||
Year ended September 30, 2011 | 10.90 | 0.47 | (0.71 | ) | (0.24 | ) | (0.51 | ) | - | |||||||||||||||
Year ended September 30, 2010 | 10.21 | 0.46 | 0.63 | 1.09 | (0.40 | ) | - | |||||||||||||||||
| 62 | FINANCIAL HIGHLIGHTS |
Table of Contents
| distributions | Ratio of expenses to average net assets | Ratio of net investment income/(loss) to average net assets | ||||||||||||||||||||||||||||||||
| Total dividends and distributions | Net asset value, end of period | Total return* | Net assets, end of period (in thousands) | Before expense limitation/ recoupment and transfer agent earnings credits | After expense limitation/ recoupment and transfer agent earnings credits(b) | Before expense limitation/ recoupment and transfer agent earnings credits | After expense limitation/ recoupment and transfer agent earnings credits | Portfolio turnover rate(a) | ||||||||||||||||||||||||||
| $ | (0.57 | ) | $ | 9.90 | 6.01 | % | $ | 87,675 | 0.86 | % | 0.75 | % | 4.22 | % | 4.33 | %(f) | 175.95 | % | ||||||||||||||||
| (0.54 | ) | 9.89 | (0.84 | )% | 88,313 | 0.89 | % | 0.75 | % | 2.19 | % | 2.33 | % | 96.56 | % | |||||||||||||||||||
| (0.57 | ) | 10.51 | 9.93 | % | 81,381 | 0.88 | % | 0.75 | % | 3.46 | % | 3.59 | % | 51.28 | % | |||||||||||||||||||
| (0.69 | ) | 10.11 | 0.15 | % | 881 | 1.18 | % | 0.75 | % | 4.08 | % | 4.51 | % | 32.13 | % | |||||||||||||||||||
| (0.52 | ) | 10.79 | 10.45 | % | 1,049 | 1.39 | % | 0.75 | % | 3.95 | % | 4.59 | % | 63.47 | % | |||||||||||||||||||
| (0.48 | ) | 9.94 | 5.10 | % | 2,879 | 2.27 | % | 1.60 | % | 2.75 | % | 3.42 | %(f) | 175.95 | % | |||||||||||||||||||
| (0.45 | ) | 9.93 | (1.66 | )% | 3,008 | 2.06 | % | 1.60 | % | 1.02 | % | 1.48 | % | 96.56 | % | |||||||||||||||||||
| (0.48 | ) | 10.55 | 8.98 | % | 3,772 | 2.28 | % | 1.60 | % | 2.35 | % | 3.03 | % | 51.28 | % | |||||||||||||||||||
| (0.61 | ) | 10.15 | (0.68 | )% | 3,879 | 2.16 | % | 1.60 | % | 3.11 | % | 3.67 | % | 32.13 | % | |||||||||||||||||||
| (0.43 | ) | 10.83 | 9.52 | % | 4,544 | 2.46 | % | 1.60 | % | 2.88 | % | 3.74 | % | 63.47 | % | |||||||||||||||||||
| (0.58 | ) | 9.86 | 5.77 | % | 4,278 | 1.44 | % | 1.00 | % | 3.84 | % | 4.28 | %(f) | 175.95 | % | |||||||||||||||||||
| (0.51 | ) | 9.89 | (1.08 | )% | 6,792 | 1.34 | % | 1.00 | % | 1.71 | % | 2.06 | % | 96.56 | % | |||||||||||||||||||
| (0.54 | ) | 10.51 | 9.66 | % | 7,515 | 1.31 | % | 1.00 | % | 3.13 | % | 3.44 | % | 51.28 | % | |||||||||||||||||||
| (0.70 | ) | 10.11 | (0.02 | )% | 249 | 5.83 | % | 1.01 | % | (0.38 | )% | 4.44 | % | 32.13 | % | |||||||||||||||||||
| (0.49 | ) | 14.87 | 11.36 | % | 8,022 | 1.38 | % | 1.20 | % | 3.36 | % | 3.54 | % | 147.56 | % | |||||||||||||||||||
| (0.50 | ) | 13.80 | 17.76 | % | 5,116 | 1.53 | % | 1.21 | % | 3.28 | % | 3.60 | % | 162.82 | % | |||||||||||||||||||
| (0.49 | ) | 12.18 | 24.43 | % | 7,123 | 1.47 | % | 1.21 | % | 3.31 | % | 3.57 | % | 122.39 | % | |||||||||||||||||||
| (0.54 | ) | 10.21 | (2.40 | )% | 142 | 3.99 | % | 1.20 | % | 1.45 | % | 4.24 | % | 142.75 | % | |||||||||||||||||||
| (0.41 | ) | 10.96 | 11.04 | % | 88 | 7.66 | % | 1.20 | % | (2.01 | )% | 4.45 | % | 123.33 | % | |||||||||||||||||||
| (0.34 | ) | 14.96 | 10.26 | % | 5,481 | 2.45 | % | 2.20 | % | 2.21 | %�� | 2.46 | % | 147.56 | % | |||||||||||||||||||
| (0.37 | ) | 13.88 | 16.58 | % | 5,423 | 2.42 | % | 2.21 | % | 2.49 | % | 2.70 | % | 162.82 | % | |||||||||||||||||||
| (0.26 | ) | 12.25 | 23.31 | % | 5,146 | 2.62 | % | 2.20 | % | 2.09 | % | 2.51 | % | 122.39 | % | |||||||||||||||||||
| (0.34 | ) | 10.16 | (3.47 | )% | 3,874 | 2.53 | % | 2.20 | % | 2.85 | % | 3.18 | % | 142.75 | % | |||||||||||||||||||
| (0.31 | ) | 10.85 | 9.99 | % | 3,569 | 2.97 | % | 2.20 | % | 2.68 | % | 3.46 | % | 123.33 | % | |||||||||||||||||||
| (0.45 | ) | 14.79 | 11.07 | % | 13,847 | 1.59 | % | 1.45 | % | 3.08 | % | 3.22 | % | 147.56 | % | |||||||||||||||||||
| (0.47 | ) | 13.73 | 17.49 | % | 12,798 | 1.68 | % | 1.46 | % | 3.24 | % | 3.45 | % | 162.82 | % | |||||||||||||||||||
| (0.45 | ) | 12.12 | 24.10 | % | 10,758 | 1.69 | % | 1.45 | % | 3.11 | % | 3.35 | % | 122.39 | % | |||||||||||||||||||
| (0.51 | ) | 10.15 | (2.66 | )% | 2,871 | 1.91 | % | 1.45 | % | 3.55 | % | 4.01 | % | 142.75 | % | |||||||||||||||||||
| (0.40 | ) | 10.90 | 10.84 | % | 1,521 | 4.59 | % | 1.45 | % | 1.19 | % | 4.32 | % | 123.33 | % | |||||||||||||||||||
| FINANCIAL HIGHLIGHTS | 63 |
Table of Contents
FINANCIAL HIGHLIGHTS (CONTINUED)
| Income/(loss) from investment operations | Less dividends and | |||||||||||||||||||||||
| Net asset value, beginning of period | Net investment income/ (loss)(x) | Net realized and unrealized gains/(losses) on investments | Total from investment operations | Dividends from net investment income | Distributions from net realized gains | |||||||||||||||||||
ICON Fund | ||||||||||||||||||||||||
Class S** | ||||||||||||||||||||||||
Year ended September 30, 2014 | $ | 14.00 | $ | - | (d) | $ | 0.52 | $ | 0.52 | $ | - | $ | - | |||||||||||
Year ended September 30, 2013 | 11.34 | 0.07 | 2.66 | 2.73 | (0.07 | ) | - | |||||||||||||||||
Year ended September 30, 2012 | 8.82 | 0.07 | 2.45 | 2.52 | - | - | ||||||||||||||||||
Year ended September 30, 2011 | 9.04 | (0.07 | ) | (0.15 | ) | (0.22 | ) | - | - | |||||||||||||||
Year ended September 30, 2010 | 9.07 | (0.01 | ) | 0.11 | 0.10 | (0.13 | ) | - | ||||||||||||||||
Class C | ||||||||||||||||||||||||
Year ended September 30, 2014 | 12.82 | (0.14 | ) | 0.47 | 0.33 | - | - | |||||||||||||||||
Year ended September 30, 2013 | 10.42 | (0.07 | ) | 2.47 | 2.40 | - | - | |||||||||||||||||
Year ended September 30, 2012 | 8.17 | (0.04 | ) | 2.29 | 2.25 | - | - | |||||||||||||||||
Year ended September 30, 2011 | 8.36 | (0.05 | ) | (0.14 | ) | (0.19 | ) | - | - | |||||||||||||||
Year ended September 30, 2010 | 8.37 | (0.04 | ) | 0.11 | 0.07 | (0.08 | ) | - | ||||||||||||||||
Class A*** | ||||||||||||||||||||||||
Year ended September 30, 2014 | 13.39 | (0.05 | ) | 0.50 | 0.45 | - | - | |||||||||||||||||
Year ended September 30, 2013 | 10.85 | 0.02 | 2.56 | 2.58 | (0.04 | ) | - | |||||||||||||||||
Year ended September 30, 2012 | 8.46 | 0.03 | 2.36 | 2.39 | - | - | ||||||||||||||||||
Year ended September 30, 2011 | 8.67 | (0.07 | ) | (0.14 | ) | (0.21 | ) | - | - | |||||||||||||||
Year ended September 30, 2010 | 8.73 | (0.08 | ) | 0.10 | 0.02 | (0.08 | ) | - | ||||||||||||||||
ICON Long/Short Fund(c) | ||||||||||||||||||||||||
Class S** | ||||||||||||||||||||||||
Year ended September 30, 2014 | 17.48 | (0.06 | ) | 0.99 | 0.93 | - | - | |||||||||||||||||
Year ended September 30, 2013 | 14.56 | 0.01 | 2.91 | 2.92 | - | - | ||||||||||||||||||
Year ended September 30, 2012 | 11.61 | 0.02 | 2.93 | 2.95 | - | - | ||||||||||||||||||
Year ended September 30, 2011 | 11.90 | 0.02 | (0.31 | ) | (0.29 | ) | - | - | ||||||||||||||||
Year ended September 30, 2010 | 11.80 | 0.03 | 0.29 | 0.32 | (0.22 | ) | - | |||||||||||||||||
Class C | ||||||||||||||||||||||||
Year ended September 30, 2014 | 16.05 | (0.24 | ) | 0.93 | 0.69 | - | - | |||||||||||||||||
Year ended September 30, 2013 | 13.52 | (0.14 | ) | 2.67 | 2.53 | - | - | |||||||||||||||||
Year ended September 30, 2012 | 10.89 | (0.11 | ) | 2.74 | 2.63 | - | - | |||||||||||||||||
Year ended September 30, 2011 | 11.29 | (0.11 | ) | (0.29 | ) | (0.40 | ) | - | - | |||||||||||||||
Year ended September 30, 2010 | 11.19 | (0.08 | ) | 0.27 | 0.19 | (0.09 | ) | - | ||||||||||||||||
Class A*** | ||||||||||||||||||||||||
Year ended September 30, 2014 | 17.13 | (0.12 | ) | 0.98 | 0.86 | - | - | |||||||||||||||||
Year ended September 30, 2013 | 14.31 | (0.02 | ) | 2.84 | 2.82 | - | - | |||||||||||||||||
Year ended September 30, 2012 | 11.44 | (0.02 | ) | 2.89 | 2.87 | - | - | |||||||||||||||||
Year ended September 30, 2011 | 11.77 | (0.02 | ) | (0.31 | ) | (0.33 | ) | - | - | |||||||||||||||
Year ended September 30, 2010 | 11.67 | - | 0.28 | 0.28 | (0.18 | ) | - | |||||||||||||||||
| 64 | FINANCIAL HIGHLIGHTS |
Table of Contents
| distributions | Ratio of expenses to average net assets | Ratio of net investment income/(loss) to average net assets | ||||||||||||||||||||||||||||||||
| Total dividends and distributions | Net asset value, end of period | Total return* | Net assets, end of period (in thousands) | Before expense limitation/ recoupment and transfer agent earnings credits | After expense limitation/ recoupment and transfer agent earnings credits(b) | Before expense limitation/ recoupment and transfer agent earnings credits | After expense limitation/ recoupment and transfer agent earnings credits | Portfolio turnover rate(a) | ||||||||||||||||||||||||||
| $ | - | $ | 14.52 | 3.71 | % | $ | 41,577 | 1.10 | % | 1.10 | % | 0.02 | % | 0.02 | % | 64.51 | % | |||||||||||||||||
| (0.07 | ) | 14.00 | 24.27 | % | 6,986 | 1.23 | % | 1.23 | % | 0.59 | % | 0.59 | % | 32.68 | % | |||||||||||||||||||
| - | 11.34 | 28.57 | % | 22,952 | 1.18 | % | 1.18 | % | 0.61 | % | 0.61 | % | 23.73 | % | ||||||||||||||||||||
| - | 8.82 | (2.43 | )% | 133 | 2.52 | % | 2.52 | % | (0.72 | )% | (0.72 | )% | 57.93 | % | ||||||||||||||||||||
| (0.13 | ) | 9.04 | 1.10 | % | 406 | 1.90 | % | 1.90 | % | (0.06 | )% | (0.06 | )% | 123.12 | % | |||||||||||||||||||
| - | 13.15 | 2.57 | % | 17,050 | 2.26 | % | 2.25 | % | (1.09 | )% | (1.08 | )% | 64.51 | % | ||||||||||||||||||||
| - | 12.82 | 23.03 | % | 18,848 | 2.32 | % | 2.26 | % | (0.64 | )% | (0.58 | )% | 32.68 | % | ||||||||||||||||||||
| - | 10.42 | 27.54 | % | 18,378 | 2.35 | % | 2.28 | % | (0.48 | )% | (0.41 | )% | 23.73 | % | ||||||||||||||||||||
| - | 8.17 | (2.27 | )% | 17,884 | 2.27 | % | 2.27 | % | (0.50 | )% | (0.50 | )% | 57.93 | % | ||||||||||||||||||||
| (0.08 | ) | 8.36 | 0.84 | % | 24,573 | 2.25 | % | 2.25 | % | (0.45 | )% | (0.45 | )% | 123.12 | % | |||||||||||||||||||
| - | 13.84 | 3.36 | % | 8,076 | 1.56 | % | 1.50 | % | (0.38 | )% | (0.32 | )% | 64.51 | % | ||||||||||||||||||||
| (0.04 | ) | 13.39 | 23.90 | % | 10,000 | 1.58 | % | 1.51 | % | 0.12 | % | 0.19 | % | 32.68 | % | |||||||||||||||||||
| - | 10.85 | 28.25 | % | 12,401 | 1.54 | % | 1.54 | % | 0.27 | % | 0.27 | % | 23.73 | % | ||||||||||||||||||||
| - | 8.46 | (2.42 | )% | 1,245 | 2.52 | % | 2.52 | % | (0.75 | )% | (0.75 | )% | 57.93 | % | ||||||||||||||||||||
| (0.08 | ) | 8.67 | 0.22 | % | 1,362 | 2.68 | % | 2.68 | % | (0.88 | )% | (0.88 | )% | 123.12 | % | |||||||||||||||||||
| - | 18.41 | 5.32 | % | 16,465 | 1.45 | % | 1.32 | % | (0.47 | )% | (0.34 | )% | 64.81 | % | ||||||||||||||||||||
| - | 17.48 | 20.05 | % | 4,774 | 1.53 | % | 1.32 | % | (0.14 | )% | 0.07 | % | 32.63 | % | ||||||||||||||||||||
| - | 14.56 | 25.41 | % | 3,471 | 2.18 | % | 1.35 | % | (0.70 | )% | 0.13 | % | 54.26 | % | ||||||||||||||||||||
| - | 11.61 | (2.44 | )% | 42 | 7.76 | % | 1.65 | % | (5.96 | )% | 0.15 | % | 67.28 | % | ||||||||||||||||||||
| (0.22 | ) | 11.90 | 2.63 | % | 132 | 5.80 | % | 2.15 | % | (3.39 | )% | 0.25 | % | 136.50 | % | |||||||||||||||||||
| - | 16.74 | 4.30 | % | 6,932 | 2.57 | % | 2.38 | % | (1.58 | )% | (1.39 | )% | 64.81 | % | ||||||||||||||||||||
| - | 16.05 | 18.71 | % | 6,108 | 2.62 | % | 2.37 | % | (1.21 | )% | (0.96 | )% | 32.63 | % | ||||||||||||||||||||
| - | 13.52 | 24.15 | % | 6,004 | 2.95 | % | 2.41 | % | (1.44 | )% | (0.90 | )% | 54.26 | % | ||||||||||||||||||||
| - | 10.89 | (3.54 | )% | 5,546 | 3.14 | % | 2.70 | % | (1.38 | )% | (0.94 | )% | 67.28 | % | ||||||||||||||||||||
| (0.09 | ) | 11.29 | 1.65 | % | 9,547 | 3.60 | % | 3.19 | % | (1.14 | )% | (0.73 | )% | 136.50 | % | |||||||||||||||||||
| - | 17.99 | 5.02 | % | 11,160 | 1.81 | % | 1.63 | % | (0.82 | )% | (0.64 | )% | 64.81 | % | ||||||||||||||||||||
| - | 17.13 | 19.71 | % | 8,813 | 1.91 | % | 1.61 | % | (0.45 | )% | (0.16 | )% | 32.63 | % | ||||||||||||||||||||
| - | 14.31 | 25.09 | % | 15,687 | 2.09 | % | 1.65 | % | (0.58 | )% | (0.14 | )% | 54.26 | % | ||||||||||||||||||||
| - | 11.44 | (2.80 | )% | 1,213 | 3.23 | % | 1.91 | % | (1.46 | )% | (0.14 | )% | 67.28 | % | ||||||||||||||||||||
| (0.18 | ) | 11.77 | 2.34 | % | 1,855 | 3.65 | % | 2.45 | % | (1.21 | )% | (0.01 | )% | 136.50 | % | |||||||||||||||||||
| FINANCIAL HIGHLIGHTS | 65 |
Table of Contents
FINANCIAL HIGHLIGHTS (CONTINUED)
| Income/(loss) from investment operations | Less dividends and | |||||||||||||||||||||||
| Net asset value, beginning of period | Net investment income/ (loss)(x) | Net realized and unrealized gains/(losses) on investments | Total from investment operations | Dividends from net investment income | Distributions from net realized gains | |||||||||||||||||||
ICON Opportunities Fund | ||||||||||||||||||||||||
Year ended September 30, 2014 | $ | 13.02 | $ | (0.12 | ) | $ | 0.41 | (e) | $ | 0.29 | $ | - | $ | (0.27 | ) | |||||||||
Year ended September 30, 2013 | 10.00 | (0.01 | ) | 3.03 | 3.02 | - | - | |||||||||||||||||
ICON Risk-Managed Balanced Fund | ||||||||||||||||||||||||
Class S** | ||||||||||||||||||||||||
Year ended September 30, 2014 | 13.40 | 0.24 | 0.56 | 0.80 | (0.22 | ) | - | |||||||||||||||||
Year ended September 30, 2013 | 12.32 | 0.24 | 1.04 | 1.28 | (0.20 | ) | - | |||||||||||||||||
Year ended September 30, 2012 | 10.88 | 0.15 | 1.44 | 1.59 | (0.15 | ) | - | |||||||||||||||||
Year ended September 30, 2011 | 10.96 | 0.12 | (0.05 | ) | 0.07 | (0.15 | ) | - | ||||||||||||||||
Year ended September 30, 2010 | 10.61 | 0.08 | 0.33 | 0.41 | (0.06 | ) | - | |||||||||||||||||
Class C | ||||||||||||||||||||||||
Year ended September 30, 2014 | 12.39 | 0.09 | 0.54 | 0.63 | (0.12 | ) | - | |||||||||||||||||
Year ended September 30, 2013 | 11.41 | 0.09 | 0.98 | 1.07 | (0.09 | ) | - | |||||||||||||||||
Year ended September 30, 2012 | 10.09 | 0.02 | 1.34 | 1.36 | (0.04 | ) | - | |||||||||||||||||
Year ended September 30, 2011 | 10.15 | 0.01 | (0.05 | ) | (0.04 | ) | (0.02 | ) | - | |||||||||||||||
Year ended September 30, 2010 | 9.88 | (0.02 | ) | 0.29 | 0.27 | - | - | |||||||||||||||||
Class A*** | ||||||||||||||||||||||||
Year ended September 30, 2014 | 13.12 | 0.20 | 0.57 | 0.77 | (0.20 | ) | - | |||||||||||||||||
Year ended September 30, 2013 | 12.06 | 0.18 | 1.05 | 1.23 | (0.17 | ) | - | |||||||||||||||||
Year ended September 30, 2012 | 10.66 | 0.11 | 1.41 | 1.52 | (0.12 | ) | - | |||||||||||||||||
Year ended September 30, 2011 | 10.72 | 0.09 | (0.05 | ) | 0.04 | (0.10 | ) | - | ||||||||||||||||
Year ended September 30, 2010 | 10.39 | 0.05 | 0.33 | 0.38 | (0.05 | ) | - | |||||||||||||||||
| (x) | Calculated using the average shares method. |
| * | The total return calculation is for the period indicated and excludes any sales charges. |
| ** | Class S shares were formerly named Class Z shares prior to January 23, 2012. |
| *** | Class I shares merged into Class A on January 23, 2012. The results of each class prior to the merger may have been different than what is presented. |
| (a) | Portfolio turnover is calculated at the Fund level and is not annualized for periods less than a year. |
| (b) | The Fund’s operating expenses, not including interest expense, are contractually limited to the amounts discussed in Note 3. The ratios in these financial highlights reflect the limitation, including the interest expense. |
| (c) | The Fund’s operating expenses, not including dividends on short positions, are contractually limited to 1.25% for Class S, 2.30% for Class C and 1.55% for Class A. The ratios in these financial highlights reflect the limitation, including the dividends on short positions. |
| (d) | Amount less than $0.005. |
| (e) | The per share amount does not correspond to activity reflected in the Statement of Operations due to timing of shareholder activity during the period. |
| (f) | Investment income per share of Class S, Class C and Class A reflects a large, non-recurring dividend which amounted to $0.07, $0.06 and $0.08 per share of each class respectively. Excluding this non-recurring dividend, the ratio of net investment income (loss) to average net assets would have been 3.59% for Class S, 2.84% for Class C and 3.55 for Class A. |
The accompanying notes are an integral part of the financial statements.
| 66 | FINANCIAL HIGHLIGHTS |
Table of Contents
| distributions | Ratio of expenses to average net assets | Ratio of net investment income/(loss) to average net assets | ||||||||||||||||||||||||||||||||
| Total dividends and distributions | Net asset value, end of period | Total return* | Net assets, end of period (in thousands) | Before expense limitation/ recoupment and transfer agent earnings credits | After expense limitation/ recoupment and transfer agent earnings credits(b) | Before expense limitation/ recoupment and transfer agent earnings credits | After expense limitation/ recoupment and transfer agent earnings credits | Portfolio turnover rate(a) | ||||||||||||||||||||||||||
| $ | (0.27 | ) | $ | 13.04 | 2.19 | % | $ | 12,133 | 2.44 | % | 1.50 | % | (1.81 | )% | (0.87 | )% | 45.99 | % | ||||||||||||||||
| – | 13.02 | 30.20 | % | 442 | 12.47 | % | 1.52 | % | (11.02 | )% | (0.07 | )% | 52.22 | % | ||||||||||||||||||||
| (0.22 | ) | 13.98 | 6.02 | % | 20,071 | 1.22 | % | 1.20 | % | 1.72 | % | 1.74 | % | 137.48 | % | |||||||||||||||||||
| (0.20 | ) | 13.40 | 10.51 | % | 43,350 | 1.43 | % | 1.21 | % | 1.65 | % | 1.87 | % | 98.30 | % | |||||||||||||||||||
| (0.15 | ) | 12.32 | 14.65 | % | 6,692 | 1.80 | % | 1.24 | % | 0.69 | % | 1.25 | % | 71.06 | % | |||||||||||||||||||
| (0.15 | ) | 10.88 | 0.51 | % | 60 | 7.22 | % | 1.23 | % | (4.94 | )% | 1.05 | % | 67.61 | % | |||||||||||||||||||
| (0.06 | ) | 10.96 | 3.90 | % | 62 | 10.41 | % | 1.31 | % | (8.34 | )% | 0.75 | % | 114.34 | % | |||||||||||||||||||
| (0.12 | ) | 12.90 | 5.06 | % | 9,469 | 2.33 | % | 2.20 | % | 0.61 | % | 0.74 | % | 137.48 | % | |||||||||||||||||||
| (0.09 | ) | 12.39 | 9.45 | % | 5,667 | 2.72 | % | 2.22 | % | 0.22 | % | 0.72 | % | 98.30 | % | |||||||||||||||||||
| (0.04 | ) | 11.41 | 13.47 | % | 2,243 | 3.25 | % | 2.23 | % | (0.79 | )% | 0.23 | % | 71.06 | % | |||||||||||||||||||
| (0.02 | ) | 10.09 | (0.45 | )% | 2,099 | 2.95 | % | 2.23 | % | (0.66 | )% | 0.06 | % | 67.61 | % | |||||||||||||||||||
| – | 10.15 | 2.73 | % | 2,609 | 3.36 | % | 2.30 | % | (1.27 | )% | (0.21 | )% | 114.34 | % | ||||||||||||||||||||
| (0.20 | ) | 13.69 | 5.88 | % | 7,014 | 1.65 | % | 1.45 | % | 1.29 | % | 1.49 | % | 137.48 | % | |||||||||||||||||||
| (0.17 | ) | 13.12 | 10.28 | % | 7,819 | 2.12 | % | 1.47 | % | 0.81 | % | 1.46 | % | 98.30 | % | |||||||||||||||||||
| (0.12 | ) | 12.06 | 14.28 | % | 4,045 | 2.16 | % | 1.48 | % | 0.28 | % | 0.96 | % | 71.06 | % | |||||||||||||||||||
| (0.10 | ) | 10.66 | 0.32 | % | 1,982 | 2.08 | % | 1.48 | % | 0.20 | % | 0.80 | % | 67.61 | % | |||||||||||||||||||
| (0.05 | ) | 10.72 | 3.69 | % | 4,020 | 2.62 | % | 1.59 | % | (0.57 | )% | 0.46 | % | 114.34 | % | |||||||||||||||||||
| FINANCIAL HIGHLIGHTS | 67 |
Table of Contents
SEPTEMBER 30, 2014
1. Organization
The ICON Bond Fund (“Bond Fund”), ICON Equity Income Fund (“Equity Income Fund”), ICON Fund (“ICON Fund”), ICON Long/Short Fund (“Long/Short Fund”), ICON Opportunities Fund (“Opportunities Fund”) and ICON Risk-Managed Balanced Fund (“Risk-Managed Balanced Fund”) are series funds (individually a “Fund” and collectively, the “Funds”). The Funds are part of the ICON Funds (the “Trust”), a Massachusetts business trust registered under the Investment Company Act of 1940, as amended (the “1940 Act”) as an open-end investment management company. Each Fund, with the exception of the Opportunities Fund, offers three classes of shares: Class S, Class C and Class A. The Opportunities Fund is a single-class fund. All classes have equal rights as to earnings, assets and voting privileges except that each Class may bear different distribution fees, registration costs, legal costs, mailing and printing costs and shareholder servicing costs and each Class has exclusive voting rights with respect to its distribution plan. There are currently eleven other active Funds within the Trust. Those Funds are covered by separate prospectuses and shareholder reports.
Each Fund is authorized to issue an unlimited number of no par shares. The investment objective of the Bond Fund is maximum total return. The investment objective of the Equity Income Fund is modest capital appreciation and income. The investment objective of the ICON Fund is long-term capital appreciation with a secondary objective of capital preservation. The investment objective of the Opportunities Fund is to provide capital appreciation. The investment objective of the Long/Short Fund is capital appreciation. The investment objective of the Risk-Managed Balanced Fund is modest capital appreciation and income.
The Funds may have elements of risk, including the risk of loss of principal. There is no assurance that the investment process will consistently lead to successful results. An investment concentrated in sectors and industries may involve greater risk and volatility than a more diversified investment. Securities of small companies generally involve greater risks than investments in larger companies. Small company securities tend to be more volatile and less liquid than equity securities of larger companies. Investing in fixed income securities such as bonds involves interest rate risk. When interest rates rise, the value of fixed income securities generally decreases. Additionally, the Bond Fund, Equity Income Fund and the Risk-Managed Balanced Fund may invest in medium-and lower-quality debt securities. High-yield bonds involve a greater risk of default and price volatility than U.S. government and other high-quality bonds. The Long/Short Fund engages
| 68 | NOTESTO FINANCIAL STATEMENTS |
Table of Contents
in short selling; there are risks associated with selling short, including the risk that the Long/Short Fund may have to cover its short position at a higher price than the short sale, resulting in a loss. The Long/Short Fund’s loss on a short sale is potentially unlimited as a loss occurs when the value of a security sold short increases. The Risk-Managed Balanced Fund invests in call options; selling/writing call options involve certain risks, such as limited gains and lack of liquidity of the underlying securities, and are not suitable for all investors. Investments in foreign securities and currency transactions may involve certain considerations and risks not typically associated with those of U.S. dollar-denominated transactions as a result of, among other factors, the possibility of less government supervision and regulation of foreign securities markets and the possibility of political or economic instability. Financial statements of foreign companies are governed by different accounting, auditing, and financial standards than U.S. companies and may be less transparent and uniform than in the United States. Many corporate governance standards, which help ensure the integrity of public information in the United States, may not exist in some foreign countries. In general, there may be less governmental supervision of foreign stock exchanges and securities brokers and issuers. There are also risks associated with small- and mid-cap investing, including limited product lines, less liquidity and small market share.
The ICON Fund and Long/Short Fund have significant weights in the Consumer Discretionary sector which may cause the Fund’s performance to be susceptible to the economic, business and/or other developments that may affect this sector.
In the normal course of business, the Funds may enter into various agreements that provide for general indemnifications. Each Fund’s maximum exposure under these arrangements is unknown as any potential exposure involving future claims that may be made against each Fund is unknown. However, based on experience, the Funds expect the risk of loss to be remote.
2. Significant Accounting Policies
The following is a summary of significant accounting policies consistently followed by the Funds in the preparation of their financial statements. The preparation of financial statements in conformity with accounting principles generally accepted in the United States of America requires management to make certain estimates and assumptions that affect the reported amounts of
| NOTESTO FINANCIAL STATEMENTS | 69 |
Table of Contents
NOTESTO FINANCIAL STATEMENTS (CONTINUED)
assets and liabilities, disclosure of contingent assets and liabilities at the date of the financial statements, and the reported amounts of income and expenses during the reporting period. Actual results may differ from these estimates.
Investment Valuation
The Funds’ securities and other assets, excluding options on securities indexes, are valued at the closing price as of the close of regular trading on the New York Stock Exchange (the “NYSE”) (normally 4 p.m. Eastern Standard Time) each day the NYSE is open, except that securities traded primarily on the NASDAQ Stock Market (“NASDAQ”) are normally valued by the Funds at the NASDAQ Official Closing Price provided by NASDAQ each business day. Options on securities indexes are valued at the close of the Chicago Board Options Exchange (normally 4:15 p.m. Eastern Standard Time) on each day the New York Stock Exchange is open for trading.
The Funds use pricing services to obtain the market value of securities in their portfolios; if a pricing service is not able to provide a price, or the pricing service’s valuation is considered inaccurate or does not in the Funds’ judgment reflect the market value of the security, prices may be obtained through market quotations from independent broker/dealers. If market quotations from these sources are not readily available, the Funds’ securities or other assets are valued at fair value as determined in good faith by the Funds’ Board of Trustees (“Board”) or pursuant to procedures approved by the Board.
Lacking any sales that day, a security is valued at the current closing bid price (or yield equivalent thereof) or based on quotes obtained from dealers making a market for the security. Options are valued at their closing mid-price on the market with the most volume. Mid-price is the average of the closing bid and closing ask prices. Debt securities with a remaining maturity of greater than 60 days are valued using the evaluated bid price supplied by the pricing service. The evaluated bid price supplied by the pricing service is based upon a matrix valuation system which considers such factors as security prices, yields, maturities and ratings. Short-term debt securities with remaining maturities of 60 days or less are generally valued at amortized cost or original cost plus accrued interest, which approximates market value. Currency rates as of the close of the NYSE are used to convert foreign security values into U.S. dollars.
| 70 | NOTESTO FINANCIAL STATEMENTS |
Table of Contents
Securities of investment companies that trade on an exchange are valued at the last sales price or official closing price as of the close of the customary trading session on the exchange where the security is principally traded. Investments in shares of funds that are not traded on an exchange are valued at the end of day net asset value per share of such fund. Securities in the underlying funds, including restricted securities are valued in accordance with the valuation policy of such fund.
The Funds’ securities traded in countries outside of the Western Hemisphere are fair valued daily by utilizing the quotations of an independent pricing service, unless the Board determines that use of another valuation methodology is appropriate. The purposes of daily fair valuation are to avoid stale prices and to take into account, among other things, any significant events occurring after the close of foreign markets. The pricing service uses statistical analyses and quantitative models to adjust local market prices using factors such as subsequent movements and changes in the prices of indexes, securities and exchange rates in other markets to determine fair value as of the time a Fund calculates its net asset value (“NAV”). The valuation assigned to fair-value securities for purposes of calculating a Fund’s NAV may differ from the security’s most recent closing market price and from the prices used by other mutual funds to calculate their NAVs.
Various inputs are used to determine the value of the Funds’ investments. These inputs are summarized in the three broad levels listed below:
Level 1 — quoted prices in active markets for identical securities.
Level 2 — significant observable inputs other than Level 1quoted prices (including, but not limited to, quoted prices for similar securities, interest rates, prepayment speeds, and credit risk).
Level 3 — significant unobservable inputs.
Observable inputs are those based on market data obtained from sources independent of the Funds, and unobservable inputs reflect the Funds’ own assumptions based on the best information available. The input levels are not necessarily an indication of the risk or liquidity associated with investments at that level. For example, non-U.S. equity securities actively traded in foreign markets may be reflected in Level 2 despite the availability of closing prices, because the Funds evaluate and determine whether those closing prices reflect fair value at the close of the NYSE or require
| NOTESTO FINANCIAL STATEMENTS | 71 |
Table of Contents
NOTESTO FINANCIAL STATEMENTS (CONTINUED)
adjustment, as described above. The following table summarizes the Funds’ investments, based on the inputs used to determine their values on September 30, 2014:
| Level 1 | Level 2 | Level 3 | Total | |||||||||||||
ICON Bond Fund* | ||||||||||||||||
Assets | ||||||||||||||||
Corporate Bonds | $ | - | $ | 54,197,320 | $ | - | $ | 54,197,320 | ||||||||
U.S. Treasury Obligations | - | 11,464,684 | - | 11,464,684 | ||||||||||||
Foreign Corporate Bonds | - | 6,195,000 | - | 6,195,000 | ||||||||||||
Closed-End Mutual Funds | 8,449,701 | - | - | 8,449,701 | ||||||||||||
Preferred Stocks | 4,512,444 | 2,666,892 | - | 7,179,336 | ||||||||||||
Collateral for Securities on Loan | - | 5,128,327 | - | 5,128,327 | ||||||||||||
Short-Term Investments | - | 4,407,264 | - | 4,407,264 | ||||||||||||
|
|
|
|
|
|
|
| |||||||||
Total | $ | 12,962,145 | $ | 84,059,487 | $ | - | $ | 97,021,632 | ||||||||
|
|
|
|
|
|
|
| |||||||||
ICON Equity Income Fund* | ||||||||||||||||
Assets | ||||||||||||||||
Common Stocks | $ | 23,682,180 | $ | - | $ | - | $ | 23,682,180 | ||||||||
Preferred Stocks | 1,012,396 | - | - | 1,012,396 | ||||||||||||
Convertible Preferred Stocks | 1,123,255 | - | - | 1,123,255 | ||||||||||||
Collateral for Securities on Loan | - | 2,849,625 | - | 2,849,625 | ||||||||||||
Short-Term Investments | - | 425,747 | - | 425,747 | ||||||||||||
|
|
|
|
|
|
|
| |||||||||
Total | $ | 25,817,831 | $ | 3,275,372 | $ | - | $ | 29,093,203 | ||||||||
|
|
|
|
|
|
|
| |||||||||
ICON Fund* | ||||||||||||||||
Assets | ||||||||||||||||
Common Stocks | $ | 66,273,330 | $ | - | $ | - | $ | 66,273,330 | ||||||||
Collateral for Securities on Loan | - | 2,566,103 | - | 2,566,103 | ||||||||||||
|
|
|
|
|
|
|
| |||||||||
Total | $ | 66,273,330 | $ | 2,566,103 | $ | - | $ | 68,839,433 | ||||||||
|
|
|
|
|
|
|
| |||||||||
ICON Long/Short Fund* | ||||||||||||||||
Assets | ||||||||||||||||
Common Stocks | $ | 35,206,590 | $ | - | $ | - | $ | 35,206,590 | ||||||||
Collateral for Securities on Loan | - | 3,405,494 | - | 3,405,494 | ||||||||||||
|
|
|
|
|
|
|
| |||||||||
Total | $ | 35,206,590 | $ | 3,405,494 | $ | - | $ | 38,612,084 | ||||||||
|
|
|
|
|
|
|
| |||||||||
Liabilities | ||||||||||||||||
Securities Sold Short | ||||||||||||||||
Common Stock | $ | (992,222 | ) | $ | - | $ | - | $ | (992,222 | ) | ||||||
|
|
|
|
|
|
|
| |||||||||
Total | $ | (992,222 | ) | $ | - | $ | - | $ | (992,222 | ) | ||||||
|
|
|
|
|
|
|
| |||||||||
| 72 | NOTESTO FINANCIAL STATEMENTS |
Table of Contents
| Level 1 | Level 2 | Level 3 | Total | |||||||||||||
ICON Opportunities Fund* | ||||||||||||||||
Assets | ||||||||||||||||
Common Stocks | $ | 11,979,418 | $ | - | $ | - | $ | 11,979,418 | ||||||||
|
|
|
|
|
|
|
| |||||||||
Total | $ | 11,979,418 | $ | - | $ | - | $ | 11,979,418 | ||||||||
|
|
|
|
|
|
|
| |||||||||
ICON Risk-Managed Balanced Fund* | ||||||||||||||||
Assets | ||||||||||||||||
Common Stocks | $ | 22,408,320 | $ | - | $ | - | $ | 22,408,320 | ||||||||
Corporate Bonds | - | 8,558,770 | - | 8,558,770 | ||||||||||||
Closed-End Mutual Funds | 1,765,086 | - | - | 1,765,086 | ||||||||||||
U.S. Treasury Obligations | - | 974,805 | - | 974,805 | ||||||||||||
Preferred Stocks | 513,507 | 374,512 | - | 888,019 | ||||||||||||
Foreign Corporate Bonds | - | 525,000 | - | 525,000 | ||||||||||||
Put Options Purchased | 67,500 | - | - | 67,500 | ||||||||||||
Collateral for Securities on Loan | - | 1,422,694 | - | 1,422,694 | ||||||||||||
Short-Term Investments | - | 754,308 | - | 754,308 | ||||||||||||
|
|
|
|
|
|
|
| |||||||||
Total | $ | 24,754,413 | $ | 12,610,089 | $ | - | $ | 37,364,502 | ||||||||
|
|
|
|
|
|
|
| |||||||||
Liabilities | ||||||||||||||||
Written Call Options | $ | (36,000 | ) | $ | - | $ | - | $ | (36,000 | ) | ||||||
|
|
|
|
|
|
|
| |||||||||
Total | $ | (36,000 | ) | $ | - | $ | - | $ | (36,000 | ) | ||||||
|
|
|
|
|
|
|
| |||||||||
| * | Please refer to the Schedule of Investments and the Sector/Industry Classification and Credit Diversification tables for additional security details. |
No Level 3 securities were held in any of the Funds at September 30, 2014.
For the year ended September 30, 2014, there was no transfer activity between Level 1, Level 2 or Level 3. The end of period timing recognition is used for transfers between levels of the Fund’s assets and liabilities.
Fund Share Valuation
Fund shares are sold and redeemed on a daily basis at net asset value. Net asset value per share is determined daily as of the close of trading on the NYSE on each day the NYSE is open for trading by dividing the total value of the Fund’s investments and other assets, less liabilities, by the number of Fund shares outstanding.
Foreign Currency Translation
The accounting records of the Funds are maintained in U.S. dollars. Investment securities and other assets and liabilities denominated in a
| NOTESTO FINANCIAL STATEMENTS | 73 |
Table of Contents
NOTESTO FINANCIAL STATEMENTS (CONTINUED)
foreign currency are translated daily into U.S. dollars at the prevailing rates of exchange. Income and expenses are translated into U.S. dollars at the prevailing exchange rate on the respective dates of the transactions. Purchases and sales of securities are translated into U.S. dollars at the contractual currency exchange rates established at the time of each trade.
The Funds do not isolate that portion of the results of operations resulting from changes in foreign exchange rates on investments from the fluctuations arising from changes in market prices of securities held. Net unrealized appreciation or depreciation on investments and foreign currency translations arise from changes in the value of assets and liabilities, resulting from changes in the exchange rates and changes in market prices of securities held.
Options Transactions
The Funds’ use of derivatives for the year ended September 30, 2014 was limited to purchased and written options.
The Risk-Managed Balanced Fund’s primary investment strategy involves the use of options. Each of the other Funds may also purchase and/or write (sell) call and put options on any security in which it may invest. The Funds utilize options to hedge against changes in market conditions or to provide market exposure while trying to reduce transaction costs.
Option contracts involve market risk and liquidity risk and can be highly volatile. Should prices of securities or securities indexes move in an unexpected manner, the Funds may not achieve the desired benefits and may realize losses and thus be in a worse position than if such strategies had not been utilized.
When a Fund writes a put or call option, an amount equal to the premium received is included on the Statement of Assets and Liabilities as a liability. The amount of the liability is subsequently marked-to-market to reflect the current market value of the option. If an option expires on its stipulated expiration date or if the Fund enters into a closing purchase transaction, a gain or loss is realized. If a written call option on an individual security is exercised, a gain or loss is realized for the sale of the underlying security, and the proceeds from the sale are increased by the premium originally received. If a written call option on a securities index is exercised, a gain or loss is realized as determined by the premium originally received, the exercise price and the market value of the index. If a written put option on
| 74 | NOTESTO FINANCIAL STATEMENTS |
Table of Contents
an individual security is exercised, the cost of the security acquired is decreased by the premium originally received. As a writer of an option, a Fund bears the market risk of an unfavorable change in the price of the individual security or securities index underlying the written option. Additionally, written call options may involve the risk of limited gains.
Each Fund may also purchase put and call options. When a Fund purchases a put or call option, an amount equal to the premium paid is included on the Fund’s Statement of Assets and Liabilities as an investment, and is subsequently marked-to-market to reflect the current market value of the option. If an option expires on the stipulated expiration date or if the Fund enters into a closing purchase or sale transaction, a gain or loss is realized. If the Fund exercises a call option on an individual security, the cost of the security acquired is increased by the premium paid for the call. If the Fund exercises a put option on an individual security, a gain or loss is realized from the sale of the underlying security, and the proceeds from such a sale are decreased by the premium originally paid. If the Fund exercises a put or a call option on a security index, a gain or loss is realized as determined by the premium originally paid, the exercise price and the market value of the index. Written and purchased options are non-income producing securities.
As of September 30, 2014, the Risk-Managed Balanced Fund engaged in written call and purchased put options transactions. All open option contracts are included on each Fund’s Schedule of Investments.
The Risk-Managed Balanced Fund’s written options are collateralized by cash and/or securities held in a segregated account at the Fund’s custodian. The securities pledged as collateral are included on the Schedule of Investments. Such collateral is restricted from the Fund’s use. The cash collateral held for the prime broker and/or borrowings from the prime broker are included on the Statement of Assets and Liabilities.
The number of options contracts written and the premiums received by the Risk-Managed Balanced Fund during the year ended September 30, 2014, were as follows:
| Risk-Managed Balanced Fund | ||||||||
| Number of Contracts | Premiums Received | |||||||
Options outstanding, beginning of period | 75 | $ | 175,547 | |||||
Options written during period | 1,030 | 1,874,392 | ||||||
Options closed during period | (1,085 | ) | (1,992,207 | ) | ||||
|
|
|
| |||||
Options outstanding, end of period | 20 | $ | 57,732 | |||||
|
|
|
| |||||
| NOTESTO FINANCIAL STATEMENTS | 75 |
Table of Contents
NOTESTO FINANCIAL STATEMENTS (CONTINUED)
The following is a summary of how these derivatives are treated in the financial statements and their impact on the Funds:
Fair Values of Derivative Instruments as of September 30, 2014
Asset Derivatives | Liability Derivatives | |||||||||||
| Derivatives not accounted for as hedging instruments | Statement of Assets and Liabilities Location | Fair Value | Statement of Assets and Liabilities Location | Fair Value | ||||||||
Purchased option contracts | ||||||||||||
Equity risk | ||||||||||||
ICON Risk-Managed Balanced Fund | Investments, at value | $ | 67,500 | |||||||||
Written option contracts | ||||||||||||
Equity risk | ||||||||||||
ICON Risk-Managed Balanced Fund | Options written, at value | $ | 36,000 | |||||||||
Amount of Realized Gain or (Loss) on Derivatives Recognized in Operations
| Derivatives not accounted for as hedging instruments | Location of Gain/(Loss) on Derivatives | Amount | ||||
Purchased option contracts | ||||||
Equity risk | ||||||
ICON Risk-Managed Balanced Fund | Net realized gain/(loss) from Investment transactions | $ | (1,450,983 | ) | ||
Written option contracts | ||||||
Equity risk | ||||||
ICON Risk-Managed Balanced Fund | Net realized gain/(loss) from written option transactions | $ | (236,539 | ) | ||
Change in Unrealized Appreciation/(Depreciation) on Derivatives Recognized in Operations
Derivatives not accounted for as hedging instruments | Location of Gain/(Loss) on Derivatives Recognized in Operations | Amount | ||||
Purchased option contracts | ||||||
Equity risk | ||||||
ICON Risk-Managed Balanced Fund | Change in unrealized net appreciation/(depreciation) on investments | $ | 87,099 | |||
| 76 | NOTESTO FINANCIAL STATEMENTS |
Table of Contents
Derivatives not accounted for as hedging instruments | Location of Gain/(Loss) on Derivatives Recognized in Operations | Amount | ||||
Written option contracts | ||||||
Equity risk | ||||||
ICON Risk-Managed Balanced Fund | Change in unrealized net appreciation/ (depreciation) on written options | $ | (51,140 | ) | ||
For the year ended September 30, 2014, the Fund’s quarterly holdings of options contracts were as follows:
| ICON Risk- Managed Balanced Fund | ICON Risk- Managed Balanced Fund | |||||||
| Quarter Ended | Number of Purchased Options Contracts Outstanding | Number of Written Options Contracts Outstanding | ||||||
December 31, 2013 | 184 | 120 | ||||||
March 31, 2014 | 120 | 140 | ||||||
June 30, 2014 | 250 | 50 | ||||||
September 30, 2014 | 30 | 20 | ||||||
The Funds value derivatives at fair value, as described above, and recognize changes in fair value currently in the results of operations. Accordingly, the Funds do not follow hedge accounting, even for derivatives employed as economic hedges.
Short Sales
The Long/Short Fund may engage in short sales (selling securities it does not own) as part of its normal investment activities. The Long/Short Fund enters into short positions in equity securities identified as being overvalued in management’s opinion.
Short sales involve market risk. If a security sold short increases in price, the Long/Short Fund may have to cover its short position at a higher price than the short sale price, resulting in a loss. These short sales are collateralized by cash and/or securities held with the Fund’s prime broker and in a segregated account at the Fund’s custodian. The collateral required is determined daily by reference to the market value of the short positions. Such collateral for the Fund is restricted from use. The cash collateral that is restricted from use is included on the Statement of Assets and Liabilities as “Deposits for short sales.” The securities pledged as collateral that are restricted from use are included on the Schedule of Investments. Dividends
| NOTESTO FINANCIAL STATEMENTS | 77 |
Table of Contents
NOTESTO FINANCIAL STATEMENTS (CONTINUED)
received on short sales are treated as an expense on the Statement of Operations. Liabilities for securities sold short are closed out by purchasing the applicable securities for delivery to the Fund’s prime broker. As of September 30, 2014, the Long/Short Fund engaged in short selling. The short positions are included in the Schedule of Securities Sold Short on the Schedule of Investments.
Securities Lending
Under procedures adopted by the Board, the Funds may lend securities to certain approved brokers, dealers and other financial institutions to earn additional income. The Funds retain certain benefits of owning the securities, including receipt of dividends or interest generated by the security, but give up other rights including the right to vote proxies. The Funds retain the ability to recall the loans at any time and could do so in order to vote proxies or to sell the loaned securities. Each loan is collateralized by cash that generally exceeds the value of the securities on loan. The market value of the loaned securities is determined daily at the close of business of the Funds and any additional required collateral is delivered to each Fund on the next business day.
Generally, in the event of borrower default, the Funds have the right to use the collateral to offset any losses incurred. In the event the Funds are delayed or prevented from exercising their rights to dispose of the collateral, there may be a potential loss to the Funds. Some of these losses may be indemnified by the lending agent.
The Funds have elected to invest the cash collateral in the State Street Navigator Prime Portfolio which is disclosed on the Schedule of Investments. The Funds bear the risk of loss with respect to the investment of collateral. The net securities lending income earned by the Funds for the year ended September 30, 2014, is included in the Statement of Operations.
For the year ended September 30, 2014, the following Funds had securities with the following values on loan
| Fund | Loaned Securities | Collateral | ||||||
ICON Bond Fund | $ | 4,940,927 | $ | 5,128,327 | ||||
ICON Equity Income Fund | 2,761,982 | 2,849,625 | ||||||
ICON Fund | 2,483,757 | 2,566,103 | ||||||
ICON Long/Short Fund | 3,330,635 | 3,405,494 | ||||||
ICON Risk-Managed Balanced Fund | 1,371,368 | 1,422,694 | ||||||
The value of the collateral above could include collateral held for securities that were sold on or before September 30, 2014. It may also include collateral received from the pre-funding of security loans.
| 78 | NOTESTO FINANCIAL STATEMENTS |
Table of Contents
Income Taxes, Dividends, and Distributions
The Funds intend to continue to qualify as regulated investment companies under Subchapter M of the Internal Revenue Code and, accordingly, the Funds will generally not be subject to federal and state income taxes or federal excise taxes to the extent that they intend to make sufficient distributions of net investment income and net realized capital gains.
Dividends paid by the Funds from net investment income and distributions of net realized short-term gains are, for federal income tax purposes, taxable as ordinary income to shareholders.
Dividends and distributions to shareholders are recorded by the Funds on the ex-dividend/distribution date. The Bond Fund distributes net investment income, if any, to shareholders monthly. The Equity Income Fund and the Risk-Managed Balanced Fund intend to distribute net investment income, if any, to shareholders quarterly. The other Funds distribute income, if any, annually. The Funds distribute net realized capital gains, if any, to shareholders at least annually, if not offset by capital loss carryforwards. The Funds may utilize equalization accounting for tax purposes and designate earnings and profits, including net realized gains distributed to shareholders on redemption of shares, as part of the dividends paid deduction for income tax purposes. Income distributions and capital gain distributions are determined in accordance with income tax regulations, which may differ from accounting principles generally accepted in the United States of America.
Management has analyzed the Funds’ tax positions taken on federal income tax returns for all open tax periods and has concluded that no provision for federal income tax is required in the Funds’ financial statements.
The Funds file U.S. tax returns. While the statute of limitations remains open to examine the Funds’ U.S. tax returns filed for the past three years, no examinations are in progress or anticipated at this time. The Funds are not aware of any tax positions for which it is reasonably possible that the total amounts of unrecognized tax benefits will significantly change in the next twelve months.
Certain foreign countries impose a capital gains tax which is accrued by the Funds based on the unrealized appreciation, if any, on affected securities. Any accrual would reduce a Fund’s NAV. The tax is paid when the gain is realized.
| NOTESTO FINANCIAL STATEMENTS | 79 |
Table of Contents
NOTESTO FINANCIAL STATEMENTS (CONTINUED)
Investment Income
Dividend income is recorded on the ex-dividend date. Non-cash dividends included in dividend income, if any, are recorded at the fair value of the securities received. Interest income is accrued as earned. Certain dividends from foreign securities are recorded as soon as the Funds are informed of the dividend if such information is obtained subsequent to the ex-dividend date. Discounts and premiums on fixed income securities purchased are accreted or amortized to income over the life of the respective securities.
Investment Transactions
Security transactions are accounted for no later than one business day after the trade date. However, for financial reporting purposes, security transactions are accounted for on the trade date. Gains and losses on securities sold are determined on the basis of identified cost.
Allocation of Expenses
Each class of a Fund’s shares bears expenses incurred specifically on its behalf and, in addition, each class bears a portion of general expenses, based upon relative net assets of each class. Expenses which cannot be directly attributed to a specific Fund in the Trust are apportioned between all Funds in the Trust based upon relative net assets. In calculating the net asset value per share of each class, investment income, realized and unrealized gains and losses and expenses other than class-specific expenses are allocated daily to each class of shares based upon the proportion of net assets.
Below are the class level expenses that are included on the Statement of Operations:
| Fund | Legal Expense | Printing and Postage Expense | Transfer Agent Expense | |||||||||
ICON Bond Fund | ||||||||||||
Class S | $ | 12,869 | $ | 10,901 | $ | 59,965 | ||||||
Class C | 394 | 737 | 5,388 | |||||||||
Class A | 639 | 1,831 | 13,091 | |||||||||
ICON Equity Income Fund | ||||||||||||
Class S | 327 | 2,869 | 14,451 | |||||||||
Class C | 295 | 1,316 | 9,002 | |||||||||
Class A | 725 | 3,726 | 22,100 | |||||||||
| 80 | NOTESTO FINANCIAL STATEMENTS |
Table of Contents
| Fund | Legal Expense | Printing and Postage Expense | Transfer Agent Expense | |||||||||
ICON Fund | ||||||||||||
Class S | $ | 638 | $ | 3,010 | $ | 13,900 | ||||||
Class C | 924 | 6,306 | 37,749 | |||||||||
Class A | 472 | 3,105 | 18,275 | |||||||||
ICON Long/Short Fund | ||||||||||||
Class S | 714 | 4,180 | 28,609 | |||||||||
Class C | 380 | 2,286 | 14,158 | |||||||||
Class A | 655 | 5,471 | 30,069 | |||||||||
ICON Risk-Managed Balanced Fund | ||||||||||||
Class S | 3,591 | 25,177 | 53,562 | |||||||||
Class C | 699 | 2,219 | 13,159 | |||||||||
Class A | 603 | 2,923 | 15,275 | |||||||||
3. Fees and Other Transactions with Affiliates
Investment Advisory Fees
ICON Advisers, Inc. (“ICON Advisers”) serves as investment adviser to the Funds and is responsible for managing the Funds’ portfolios of securities. ICON Advisers receives a monthly management fee that is computed daily at an annual rate of 0.60% of average daily net assets of the Bond Fund, 0.75% of average daily net assets of the Equity Income Fund, ICON Fund, Opportunities Fund and Risk-Managed Balanced Fund, and 0.85% of average daily net assets of the Long/Short Fund.
ICON Advisers has contractually agreed to limit the Funds’ expenses (exclusive of brokerage, interest, taxes, dividends on short sales and extraordinary expenses) to the extent necessary to ensure that the Funds’ expenses do not exceed the following amounts:
| Fund | Fund | Class S | Class C | Class A | ||||||||||||
ICON Bond Fund | - | 0.75% | 1.60% | 1.00% | ||||||||||||
ICON Equity Income Fund | - | 1.20% | 2.20% | 1.45% | ||||||||||||
ICON Fund | - | 1.25% | 2.25% | 1.50% | ||||||||||||
ICON Long/Short Fund | - | 1.25% | 2.30% | 1.55% | ||||||||||||
ICON Opportunities Fund | 1.50% | - | - | - | ||||||||||||
ICON Risk-Managed Balanced Fund | - | 1.20% | 2.20% | 1.45% | ||||||||||||
The Funds’ expense limitations, excluding the Bond Fund Class A, all classes of the ICON Fund and the Opportunities Fund, will continue in effect until at least January 31, 2021. Limitations for the Bond Fund Class A, all classes of the ICON Fund and the Opportunities Fund will continue in effect until at
| NOTESTO FINANCIAL STATEMENTS | 81 |
Table of Contents
NOTESTO FINANCIAL STATEMENTS (CONTINUED)
least January 31, 2015. To the extent ICON Advisers reimburses or absorbs fees and expenses, it may seek payment of such amounts for up to three years after the expenses were reimbursed or absorbed. A Fund will make no such payment, however, if the total Fund operating expenses exceed the expense limits in effect at the time the expenses were reimbursed or at the time these payments are proposed.
As of September 30, 2014 the following amounts were available for recoupment by ICON Advisers based upon their potential expiration dates:
| Fund | 2015 | 2016 | 2017 | |||||||||
ICON Bond Fund | $ | 132,550 | $ | 148,484 | $ | 136,560 | ||||||
ICON Equity Income Fund | 58,289 | 52,885 | 42,058 | |||||||||
ICON Fund | 3,772 | 18,393 | 6,978 | |||||||||
ICON Long/Short Fund | 70,576 | 56,161 | 50,612 | |||||||||
ICON Opportunities Fund | - | 33,963 | 22,580 | |||||||||
ICON Risk-Managed Balanced Fund | 49,968 | 40,835 | 33,132 | |||||||||
Accounting, Custody and Transfer Agent Fees
State Street Bank and Trust Company (“State Street”) serves as the fund accounting agent for the Funds. For its services, the Trust pays State Street a fee that is calculated daily and paid monthly at an annual rate based on the aggregate average daily net assets of the Trust.
State Street is the custodian of the Trust’s investments. For its services, the Trust pays State Street asset-based fees that vary according to the number of positions and transactions, plus out-of-pocket expenses.
Boston Financial Data Services, Inc. (“BFDS”) is the Trust’s transfer agent. For these services, the Trust pays a per account fee, plus certain other transaction Cusip charges and out-of-pocket expenses. BFDS may pay each Fund transfer agent earnings credits. Transfer agent earnings credits are credits received for interest which results from overnight balances used by BFDS for clearing shareholder transactions.
Administrative Services
The Trust has entered into an administrative services agreement with ICON Advisers pursuant to which ICON Advisers oversees the administration of the Trust’s business and affairs. This agreement provides for an annual fee of 0.05% on the Trust’s first $1.5 billion of average daily net assets, 0.045% on the next $1.5 billion of average daily net assets, 0.040% on the next $2 billion of average daily net assets and 0.030% on average daily net assets
| 82 | NOTESTO FINANCIAL STATEMENTS |
Table of Contents
over $5 billion. For the year ended September 30, 2014, each Fund’s payment for administrative services to ICON Advisers is included on the Statement of Operations. The administrative services agreement provides that ICON Advisers will not be liable for any error of judgment, mistake of law, or any loss suffered by the Trust in connection with matters to which the administrative services agreement relates, except for a loss resulting from willful misfeasance, bad faith or negligence by ICON Advisers in the performance of its duties.
ICON Advisers has a sub-administration agreement under which State Street assists ICON Advisers with the administration and business affairs of the Trust. For its services, ICON Advisers pays State Street a fee that is calculated daily and paid monthly at an annual rate based on the aggregate average daily net assets of the Trust.
Distribution Fees
The Funds have adopted a Distribution Plan pursuant to Rule 12b-1 under the 1940 Act (“12b-1 Plan”) under which the Funds are authorized to compensate the Funds’ distributor, ICON Distributors, Inc. (“IDI”) (an affiliate of the adviser) for the sale and distribution of shares and for other shareholder services. Under the 12b-1 Plan, Bond Fund Class C shareholders pay an annual distribution and service fee of 0.85% of average daily net assets and Class A shareholders pay an annual distribution and service fee of 0.25% of average daily net assets. The shareholders of the other Funds pay an annual distribution and service fee of 1.00% of average daily net assets for Class C shares and an annual distribution and service fee of 0.25% of average daily net assets for Class A shares. There is no annual distribution and service fee for Class S shares. The total amount paid under the 12b-1 plans by the Funds is shown on the Statement of Operations.
Other Related Parties
Certain Officers and Directors of ICON Advisers are also Officers and Trustees of the Funds; however, such Officers and Trustees (with the exception of the Chief Compliance Officer, “CCO”) receive no compensation from the Funds. The Trust paid $120,000 of the CCO’s salary and the remaining portion is paid by ICON Advisers. For the year ended September 30, 2014, the total related amounts paid by the Funds under this arrangement are included in Other Expenses on the Statement of Operations.
| NOTESTO FINANCIAL STATEMENTS | 83 |
Table of Contents
NOTESTO FINANCIAL STATEMENTS (CONTINUED)
The Funds may reimburse ICON Advisers for legal work performed for the Funds by its attorneys outside of the advisory and administration contracts. The Board of Trustees reviews and approves such reimbursements. For the year ended September 30, 2014, the total related amounts paid by the Funds under this arrangement are included in Other Expenses on the Statement of Operations.
4. Borrowings
The Trust has entered into a Line of Credit agreement/arrangement with State Street to provide temporary funding for redemption requests. The maximum borrowing is limited to $150 million. Interest on domestic borrowings is charged at a rate quoted and determined by State Street. The Risk-Managed Balanced and Long/Short Funds may also have borrowings with the prime broker as a result of brokerage requirements. Interest on domestic borrowing with the prime broker is charged at the Federal Funds rate plus 0.50%.
For the year ended September 30, 2014 the average outstanding loan by Fund was as follows:
| Fund | Average Borrowing (10/1/13-9/30/14) | Average Interest Rates (10/1/13-9/30/14) | ||||||
ICON Bond Fund | $ | 23,658 | 1.31 | % | ||||
ICON Fund* | 47,795 | 1.31 | ||||||
ICON Long/Short Fund* | 34,886 | 1.71 | ||||||
ICON Opportunities Fund | 2,367 | 1.31 | ||||||
ICON Risk-Managed Balanced Fund | 116,267 | 1.83 | ||||||
| * | Fund had outstanding borrowings under these agreements/arrangements as of September 30, 2014. |
5. Purchases and Sales of Investment Securities
For the year ended September 30, 2014, the aggregate cost of purchases and proceeds from sales of investment securities (excluding securities sold short, short-term securities and written options contracts) was as follows:
| Fund | Purchases of Securities | Proceeds from Sales of Securities | Purchases of Long Term U.S. Government Obligations | Proceeds from Sales of | ||||||||||||
ICON Bond Fund | $ | 147,582,711 | $ | 147,419,801 | $ | 15,867,695 | $ | 19,632,578 | ||||||||
ICON Equity Income Fund | 35,160,566 | 33,364,899 | - | - | ||||||||||||
ICON Fund | 58,784,504 | 26,525,517 | - | - | ||||||||||||
| 84 | NOTESTO FINANCIAL STATEMENTS |
Table of Contents
| Fund | Purchases of Securities | Proceeds from Sales of Securities | Purchases of Long Term U.S. Government Obligations | Proceeds from Sales of | ||||||||||||
ICON Long/Short Fund | $ | 34,146,492 | $ | 16,689,675 | $ | - | $ | - | ||||||||
ICON Opportunities Fund | 13,391,710 | 1,222,359 | - | - | ||||||||||||
ICON Risk-Managed Balanced Fund | 82,420,069 | 101,538,038 | 4,969,453 | 7,992,227 | ||||||||||||
6. Federal Income Tax
The following information is presented on an income tax basis. Differences between U.S. GAAP and federal income tax purposes that are permanent in nature are reclassified within the capital accounts. Temporary differences do not require reclassification. Temporary and permanent differences do not impact the NAVs of the Funds. These differences are due to differing treatments for items such as deferrals of wash sale losses, foreign currency transactions, and net investment losses.
For the year ended September 30, 2014 the following Funds had capital loss carryforwards:
| Fund | Amounts | Expires | ||||||
ICON Equity Income Fund | $ | 3,040,715 | 2017 | |||||
| 19,089,764 | 2018 | |||||||
ICON Fund | 1,175,675 | 2017 | ||||||
| 19,833,424 | 2018 | |||||||
ICON Long/Short Fund | 37,506,125 | 2017 | ||||||
| 19,325,857 | 2018 | |||||||
ICON Risk-Managed Balanced Fund | 13,551,114 | 2018 | ||||||
Future capital loss carryforward utilization in any given year may be limited if there are substantial shareholder redemptions or contributions. During the year ended September 30, 2014 the following Funds utilized capital loss carryforwards:
| Fund | Amount | |||
ICON Equity Income Fund | $ | 1,930,719 | ||
ICON Fund | 9,331,874 | |||
ICON Long/Short Fund | 2,797,232 | |||
ICON Risk-Managed Balanced Fund | 3,516,915 | |||
| NOTESTO FINANCIAL STATEMENTS | 85 |
Table of Contents
NOTESTO FINANCIAL STATEMENTS (CONTINUED)
Under the Regulated Investment Company Modernization Act of 2010 (the “Act”) capital losses generated by a fund may be carried over indefinitely, but these losses must be used prior to the utilization of any pre-enactment capital losses. Since pre-enactment capital losses may only be carried forward for eight years there may be a greater likelihood that all or a portion of each fund’s pre-enactment capital losses will expire unused.
The tax characteristics of distributions paid to shareholders during the fiscal year ended September 30, 2014, were as follows:
| Distributions Paid from | Total | |||||||||||
| Fund | Ordinary Income | Net Long- Term Gains | ||||||||||
ICON Bond Fund | $ | 4,279,532 | $ | 1,339,679 | $ | 5,619,211 | ||||||
ICON Equity Income Fund | 731,816 | - | 731,816 | |||||||||
ICON Opportunities Fund | 20,853 | - | 20,853 | |||||||||
ICON Risk-Managed Balanced Fund | 1,049,673 | - | 1,049,673 | |||||||||
The tax characteristics of distributions paid to shareholders during the fiscal year ended September 30, 2013, were as follows:
| Distributions Paid from | ||||||||||||
| Fund | Ordinary Income | Net Long- Term Gains | Total Distributions | |||||||||
ICON Bond Fund | $ | 2,021,727 | $ | 2,430,466 | $ | 4,452,193 | ||||||
ICON Equity Income Fund | 760,222 | - | 760,222 | |||||||||
ICON Fund | 169,811 | - | 169,811 | |||||||||
ICON Risk-Managed Balanced Fund | 289,470 | - | 289,470 | |||||||||
As of September 30, 2014, the components of accumulated earnings/(deficit) on a tax basis were as follows:
| Fund | Undistributed Ordinary Income | Undistributed Capital Gains | Late Year Loss Deferral** | Capital Loss Carryover | Unrealized Appreciation/ (Depreciation)* | Accumulated Earnings/ (Deficit) | ||||||||||||||||||
ICON Bond Fund | $ | 1,362,114 | $ | 972,907 | $ | - | $ | - | $ | (337,062 | ) | $ | 1,997,959 | |||||||||||
ICON Equity Income Fund | - | - | - | (22,130,479 | ) | 522,452 | (21,608,027 | ) | ||||||||||||||||
ICON Fund | - | - | (199,698 | ) | (21,009,099 | ) | 3,314,796 | (17,894,001 | ) | |||||||||||||||
ICON Long/Short Fund | - | - | (217,386 | ) | (56,831,982 | ) | 1,882,456 | (55,166,912 | ) | |||||||||||||||
ICON Opportunities Fund | 104,033 | 60,583 | - | - | (662,297 | ) | (497,681 | ) | ||||||||||||||||
ICON Risk-Managed Balanced Fund | 8,257 | - | - | (13,551,114 | ) | 263,108 | (13,279,749 | ) | ||||||||||||||||
| * | Differences between the book-basis and tax-basis unrealized appreciation/(depreciation) are attributable primarily to tax deferral of losses on wash sales. |
| 86 | NOTESTO FINANCIAL STATEMENTS |
Table of Contents
| ** | The Funds have elected to defer certain qualified late-year losses in accordance with federal income tax rules. These losses are treated as having arisen on the first day of the following fiscal year. |
As of September 30, 2014, cost on investments for federal income tax purposes and the amount of net unrealized appreciation/(depreciation) were as follows:
| Fund | Cost | Unrealized Appreciation | Unrealized (Depreciation) | Net Appreciation/ (Depreciation) | ||||||||||||
ICON Bond Fund | $ | 97,358,694 | $ | 726,175 | $ | (1,063,237 | ) | $ | (337,062 | ) | ||||||
ICON Equity Income Fund | 28,570,649 | 1,222,296 | (699,742 | ) | 522,554 | |||||||||||
ICON Fund | 65,524,637 | 6,107,929 | (2,793,133 | ) | 3,314,796 | |||||||||||
ICON Long/Short Fund | 36,736,888 | 4,162,207 | (2,287,011 | ) | 1,875,196 | |||||||||||
ICON Opportunities Fund | 12,641,715 | 256,938 | (919,235 | ) | (662,297 | ) | ||||||||||
ICON Risk-Managed Balanced Fund | 37,089,195 | 1,658,499 | (1,383,192 | ) | 275,307 | |||||||||||
7. Accounting Pronouncement
In June 2013, FASB issued Accounting Standards Update No. 2013-08, Financial Services – Investment Companies (Topic 946): Amendments to the Scope, Measurement, and Disclosure Requirements (“ASU 2013-08”). This update sets forth a new approach for determining whether a public or private company is an investment company and sets certain measurement and disclosure requirements for an investment company. FASB has determined that a fund registered under the 1940 Act automatically meets the criteria of ASU 2013-08 and is effective for interim and annual reporting periods in fiscal years that begin after December 15, 2013. Management does not expect this guidance to have an impact on the Funds’ financial statements.
8. Subsequent Events
Management has evaluated the possibility of subsequent events and determined that there are no material events that would require adjustment to or disclosure in the Funds’ financial statements.
| NOTESTO FINANCIAL STATEMENTS | 87 |
Table of Contents
REPORTOF INDEPENDENT REGISTERED PUBLIC
ACCOUNTING FIRM
To the Board of Trustees and Shareholders of the ICON Funds:
In our opinion, the accompanying statements of assets and liabilities, including the schedules of investments, and the related statements of operations and of changes in net assets and the financial highlights present fairly, in all material respects, the financial position of ICON Bond Fund, ICON Equity Income Fund, ICON Fund, ICON Long/Short Fund, ICON Opportunities Fund, and ICON Risk-Managed Balanced Fund (six of the portfolios constituting ICON Funds, hereafter referred to as the “Funds”) at September 30, 2014, the results of each of their operations for the year then ended, the changes in each of their net assets for each of the two years in the period then ended and the financial highlights for each of the periods presented, in conformity with accounting principles generally accepted in the United States of America. These financial statements and financial highlights (hereafter referred to as “financial statements”) are the responsibility of the Funds’ management. Our responsibility is to express an opinion on these financial statements based on our audits. We conducted our audits of these financial statements in accordance with the standards of the Public Company Accounting Oversight Board (United States). Those standards require that we plan and perform the audit to obtain reasonable assurance about whether the financial statements are free of material misstatement. An audit includes examining, on a test basis, evidence supporting the amounts and disclosures in the financial statements, assessing the accounting principles used and significant estimates made by management, and evaluating the overall financial statement presentation. We believe that our audits, which included confirmation of securities at September 30, 2014 by correspondence with the custodian and brokers, provide a reasonable basis for our opinion.

Denver, Colorado
November 19, 2014
| 88 | REPORTOF ACCOUNTING FIRM |
Table of Contents
SIX MONTH HYPOTHETICAL EXPENSE EXAMPLE
SEPTEMBER 30, 2014 (UNAUDITED)
Example
As a shareholder of a Fund you may pay two types of fees: transaction fees and fund-related fees. Certain funds charge transaction fees, including sales charges (loads) on purchase payments, reinvested dividends, or other distributions; redemption fees; and exchange fees. Funds also incur various ongoing expenses, including management fees, distribution and/or service fees, and other fund expenses, which are indirectly paid by shareholders.
This Example is intended to help you understand your ongoing costs (in dollars) of investing in the various ICON Funds and to compare these costs with the ongoing costs of investing in other mutual funds. This Example is based on an investment of $1,000 invested at the beginning of the six-month period and held for the six-month period (4/1/14 – 9/30/14).
Actual Expenses
The first line in the table for each Fund provides information about actual account values and actual expenses. The Example includes, but is not limited to, management fees, 12b-1 fees, fund accounting, custody and transfer agent fees. However, the Example does not include client specific fees, such as the $15 fee charged to IRA accounts, or the $15 fee charged for wire redemptions. You may use this information, together with the amount you invested, to estimate the expenses that you paid over the period. Simply divide your account value by $1,000 (for example, an $8,600 account value divided by $1,000 = 8.6), then multiply the result by the number in the first line for each Fund under the heading entitled “Expenses Paid During Period” to estimate the expenses you paid on your account during this period.
Hypothetical Example for Comparison Purposes
The second line in the table for each Fund provides information about hypothetical account values and hypothetical expenses based on the Fund’s actual expense ratio and an assumed rate of return of 5% per year before expenses, which is not the Fund’s actual return. The hypothetical account values and expenses may not be used to estimate the actual ending account balance or expenses you paid for the period. You may use this information to compare the ongoing costs of investing in the Fund and other funds. To do so, compare this 5% hypothetical example with the 5% hypothetical examples that appear in the shareholder reports of the other funds. Please note that the expenses shown in the table are meant to highlight your ongoing costs only and do not reflect any transactional costs, such as sales charges (loads),
| EXPENSE EXAMPLE | 89 |
Table of Contents
redemption fees, or exchange fees that may be charged by other funds. Therefore, this information is useful in comparing ongoing costs only, and will not help you determine the relative total costs of owning different funds.
Beginning Account Value 4/1/14 | Ending Account Value 9/30/14 | Expense Paid During Period 4/1/14 - 9/30/14* | Annualized Expense Ratio 4/1/14 - 9/30/14* | |||||||||||||
Actual Expenses | ||||||||||||||||
ICON Bond Fund | ||||||||||||||||
Class S | $ | 1,000 | $ | 1,023.20 | $ | 3.80 | 0.75% | |||||||||
Class C | 1,000 | 1,018.50 | 8.10 | 1.60% | ||||||||||||
Class A | 1,000 | 1,022.00 | 5.07 | 1.00% | ||||||||||||
ICON Equity Income Fund | ||||||||||||||||
Class S | 1,000 | 1,036.70 | 6.13 | 1.20% | ||||||||||||
Class C | 1,000 | 1,031.40 | 11.20 | 2.20% | ||||||||||||
Class A | 1,000 | 1,035.60 | 7.40 | 1.45% | ||||||||||||
ICON Fund | ||||||||||||||||
Class S | 1,000 | 976.50 | 5.15 | 1.04% | ||||||||||||
Class C | 1,000 | 970.50 | 11.11 | 2.25% | ||||||||||||
Class A | 1,000 | 974.00 | 7.42 | 1.50% | ||||||||||||
ICON Long/Short Fund | ||||||||||||||||
Class S | 1,000 | 977.70 | 6.40 | 1.29% | ||||||||||||
Class C | 1,000 | 972.70 | 11.62 | 2.35% | ||||||||||||
Class A | 1,000 | 976.70 | 7.93 | 1.60% | ||||||||||||
ICON Opportunites Fund | 1,000 | 962.40 | 7.38 | 1.50% | ||||||||||||
ICON Risk-Managed Balanced Fund | ||||||||||||||||
Class S | 1,000 | 1,022.60 | 6.08 | 1.20% | ||||||||||||
Class C | 1,000 | 1,019.00 | 11.13 | 2.20% | ||||||||||||
Class A | 1,000 | 1,022.60 | 7.35 | 1.45% | ||||||||||||
Hypothetical (assuming a 5% return before expenses) | ||||||||||||||||
ICON Bond Fund | ||||||||||||||||
Class S | 1,000 | 1,021.31 | 3.80 | |||||||||||||
Class C | 1,000 | 1,017.05 | 8.09 | |||||||||||||
Class A | 1,000 | 1,020.05 | 5.06 | |||||||||||||
ICON Equity Income Fund | ||||||||||||||||
Class S | 1,000 | 1,019.05 | 6.07 | |||||||||||||
Class C | 1,000 | 1,014.04 | 11.11 | |||||||||||||
Class A | 1,000 | 1,017.80 | 7.33 | |||||||||||||
| 90 | EXPENSE EXAMPLE |
Table of Contents
Beginning Account Value 4/1/14 | Ending Account Value 9/30/14 | Expense Paid During Period 4/1/14 - 9/30/14* | Annualized Expense Ratio 4/1/14 - 9/30/14* | |||||||||||
ICON Fund | ||||||||||||||
Class S | $ | 1,000 | $ | 1,019.85 | $ | 5.27 | ||||||||
Class C | 1,000 | 1,013.79 | 11.36 | |||||||||||
Class A | 1,000 | 1,017.55 | 7.59 | |||||||||||
ICON Long/Short Fund | ||||||||||||||
Class S | 1,000 | 1,018.60 | 6.53 | |||||||||||
Class C | 1,000 | 1,013.29 | 11.86 | |||||||||||
Class A | 1,000 | 1,017.05 | 8.09 | |||||||||||
ICON Opportunities Fund | 1,000 | 1,017.55 | 7.59 | |||||||||||
ICON Risk-Managed Balanced Fund | ||||||||||||||
Class S | 1,000 | 1,019.05 | 6.07 | |||||||||||
Class C | 1,000 | 1,014.04 | 11.11 | |||||||||||
Class A | 1,000 | 1,017.80 | 7.33 | |||||||||||
| * | Expenses are equal to the Fund’s six month expense ratio annualized, multiplied by the average account value over the period, multiplied by 183/365 to reflect the one-half year period. |
Total returns exclude applicable sales charges. If sales charges were included (maximum 5.75%), returns would be lower.
| EXPENSE EXAMPLE | 91 |
Table of Contents
BOARDOF TRUSTEESAND FUND OFFICERS
(UNAUDITED)
The ICON Funds Board of Trustees (“Board”) consists of four Trustees who oversee the 17 ICON Funds (the “Funds”). The Board is responsible for general oversight of the Funds’ business and for assuring that the Funds are managed in the best interest of the Funds’ shareholders. The Trustees, and their ages, and principal occupations are set forth below. The address of the Trustees is 5299 DTC Blvd., Suite 1200, Greenwood Village, CO 80111. Trustees have no official term of office and generally serve until they resign or are not re-elected.
Interested Trustee
Craig T. Callahan, 63, Chairman of the Board. Dr. Callahan has been a Trustee of the Funds since their inception. Dr. Callahan also serves as Chief Executive Officer (2013-present); President (1998 to 2013 and 2014 to present); and Chairman of the Investment Committee (2005 to present) and served as the Chief Investment Officer (1991 to 2004) of ICON Advisers. Dr. Callahan is also Executive Vice President (2005 to present); Director (1991 to present); and was previously President (1998 to 2005) and Chief Compliance Officer (2005) of IDI. Dr. Callahan also serves as the President (1998 to present) and Chairman of the Board of Directors (1994 to present) of IM&R, the parent company of ICON Advisers and IDI.
Independent Trustees
Glen F. Bergert, 64. Mr. Bergert has been a Trustee of the Funds since 1999. Mr. Bergert is President of Venture Capital Management LLC (1997 to present), General Partner of SOGNO Partners LP, a venture capital company (2001 to present), General Partner of Bergert Properties, LLP, a real estate holding company (1997 to present), General Partner of Pyramid Real Estate Partnership, a real estate development company (1998 to present), General Partner of Chamois Partners, LP, a venture capital company (2004 to present) and was previously a General Partner with KPMG Peat Marwick, LLP (1979 to 1997). Mr. Bergert is also a Director of Delta Dental of California, an insurance company (2013 to present and 2006 to 2012), Delta Dental of Pennsylvania, an insurance company (1998 to 2009 and 2010 to present), Dentegra Group, Inc, an insurance holding company (2010 to 2014) and Delta Reinsurance Corporation (2000 to 2009 and 2011 to 2014). Mr. Bergert was a Director of Herre Bros, Inc., a contracting company (1998 to 2011).
| 92 | TRUSTEESAND OFFICERS |
Table of Contents
John C. Pomeroy, Jr., 67. Mr. Pomeroy has been a Trustee of the Funds since November 2002. Mr. Pomeroy is Chief Investment Officer and Director of Investments, Pennsylvania State University (2001 to present) and was Portfolio Manager and Product Manager, Trinity Investment Management Corporation (1989 to 2001).
R. Michael Sentel, 66. Mr. Sentel has been a Trustee of the Funds since their inception. Mr. Sentel is a Senior Attorney with the U.S. Department of Education (1996 to present). Mr. Sentel also provides legal representation as a sole practitioner with an emphasis on corporate and transactional law. He served as general counsel to numerous public companies and served on the board of directors of one of these clients. Mr. Sentel began his legal career with the U.S. Securities and Exchange Commission’s Division of Enforcement and served as a Branch Chief (1980 to 1981). Later he served as the Section Chief for the Professional Liability Section of the Federal Deposit Insurance Corp. with responsibility for the Rocky Mountain Region (1991 to 1994).
The Officers of the Funds are:
Craig T. Callahan, 63, Chairman of the Board. Dr. Callahan has been a Trustee of the Funds since their inception. Dr. Callahan also serves as Chief Executive Officer (2013-present); President (1998 to 2013 and 2014 to present); and Chairman of the Investment Committee (2005 to present) and served as the Chief Investment Officer (1991 to 2004) of ICON Advisers. Dr. Callahan is also Executive Vice President (2005 to present); Director (1991 to present); and was previously President (1998 to 2005) and Chief Compliance Officer (2005) of IDI. Dr. Callahan also serves as the President (1998 to present) and Chairman of the Board of Directors (1994 to present) of IM&R, the parent company of ICON Advisers and IDI.
Donald Salcito, 61. Mr. Salcito serves as Vice President and Secretary of the Funds (November 15, 2006 to present). Mr. Salcito is also Executive Vice President and General Counsel (September 2005 to present) of ICON Advisers; Director of IM&R (2005 to present); Executive Vice President, Secretary, General Counsel of IDI (2005 to present). Previously, he was a Partner in various national law firms, practicing in the securities law area. (1980 to 2005).
Carrie M. Schoffman, 41. Ms. Schoffman has been a Vice President and Principal Financial Officer/Treasurer of the Funds since June 2013. Ms. Schoffman is also Chief Compliance Officer (2013 to present and 2004 to 2008) and Anti-Money Laundering Officer (2013 to present) of the ICON Funds. She is Senior Vice President (2011 to present) and Chief Compliance Officer (2013 to present and 2004 to 2011) of ICON Advisers. Previously, she was a Staff Accountant with the Securities and Exchange Commission (2003 to 2004) and also an Experienced Manager (2001 to 2003) and a Senior Associate/Associate (1996 to 2001) at PricewaterhouseCoopers LLP.
| TRUSTEESAND OFFICERS | 93 |
Table of Contents
Lesley Caviness, 48. Ms. Caviness serves as Assistant Treasurer of the Funds (2014 to present). She has worked at ICON (2007-2008 and 2010 – present) in fund accounting, compliance, business intelligence and performance capacities. Prior to working at ICON, Ms. Caviness was a Real Estate Broker at Seasons Real Estate Group (2008-2012) and Signature Real Estate (2014-present), Finance Manager at Navigant (2000-2007), and Associate/Senior Associate (1996 to 2000) at PricewaterhouseCoopers LLP.
| 94 | TRUSTEESAND OFFICERS |
Table of Contents
Renewal of Investment Advisory Agreement
On September 3, 2014 the Board of Trustees, including all of the Trustees that are not “interested persons” of the Trust (the “Independent Trustees”), approved continuation of the Advisory Agreements with the Adviser for each Fund for an additional one-year term commencing October 1, 2014.
In determining to renew the investment advisory agreements between ICON Funds (the “Trust”) and ICON Advisers, Inc. (“ICON” or the “Adviser”) the Trustees requested, was provided with and reviewed data with respect to the Adviser, its personnel, and the services provided and to be provided to each Fund by the Adviser under the Trust’s Investment Advisory Agreement dated October 9, 1996, as amended (related to the Sector Funds, the International Funds and ICON Funds) and under the Trust’s Investment Advisory Agreement dated July 9, 2002 and effective October 1, 2002, as amended (related to the U.S. Diversified Funds — Bond, Risk-Managed Equity, Equity Income and Long/Short Funds) (collectively, the “Advisory Agreements”), for an additional one-year term commencing October 1, 2014. The Trustees agreed that consideration of the Advisory Agreements should also include consideration of other agreements between the Adviser and the Trust that impact provisions of the Advisory Agreements, including, in particular, expense limitation agreements dated January 22, 2014, as amended May 5, 2014 (for ICON Emerging Markets Fund) and as amended effective September 30, 2014 (for the ICON High Yield Bond Fund).
The Trustees were provided with and reviewed data with respect to the Adviser, its personnel, and the services provided and to be provided to each Fund by the Adviser under the Trust’s Advisory Agreements, Administrative Services Agreement and Expense Limitation Agreement and the Distribution Agreement with ICON Distributors, Inc. (“IDI”). The data included information concerning advisory, distribution and administrative services provided to the Funds by ICON and its related companies; information concerning other businesses of those companies; comparative data related to exchange traded funds versus the Sector Funds; and comparative data obtained from Strategic Insight (“SI”) related to Fund performance and Fund expenses (the “SI Report”). The data also included an analysis of the management style to be applied and the style applied to the Funds’ ratings of the Funds’ performance in their management style on the AthenaInvest system (the “AthenaInvest Data”) and a presentation on the Adviser’s investment model.
The Board convened a meeting with SI to discuss the SI Report and the information contained within the SI Report on August 20, 2014. Management
| OTHER INFORMATION | 95 |
Table of Contents
personnel participated in the SI meeting convened to discuss the data for and with the Board. Included in the 15(c) discussion was a briefing on factors affecting the ICON investment model; expenses and expense ratios of each Fund and other ICON managed products; relative performance of each Fund; status of expense reimbursements to the Funds by the Adviser; sales and marketing initiatives; specific business factors affecting IDI; the work load on ICON as adviser and administrator to the Funds; current profitability of ICON; current quality control procedures in place to show consistency in the management of the investment model, modification to the investment model, and staffing levels and staff morale.
The Independent Trustees were represented by independent legal counsel in this process. Prior to acting on the proposed contract renewals and after participating in the meeting with SI and management, the Independent Trustees met separately as a group in private sessions with their independent legal counsel to review and discuss the foregoing information. Based on these discussions, independent legal counsel and/or the Lead Independent Trustee also contacted management and SI to request additional information and to discuss responses to questions raised during the process and the meeting with SI. In addition, the Board received materials from legal counsel discussing the legal standards applicable to their consideration of the ICON-Trust agreements.
In considering the nature, extent and quality of the services provided by the Adviser, the Board reviewed information relating to ICON’s operations and personnel. Among other things, the Adviser provided biographical information on its professional staff and descriptions of its organizational and management structure. In the course of their deliberations the Board evaluated, among other things, information relating to the investment philosophy, strategies and techniques used in managing each Fund, the qualifications and experience of ICON’s investment personnel, ICON’s compliance programs, ICON’s brokerage practices, including the extent to which the Adviser obtains research through “soft dollar” arrangements with the Funds’ brokerage, compliance reports on the foregoing, and the financial and non-financial resources available to provide services required under the Advisory Agreement.
During the discussion, the SI Report and the AthenaInvest Data were discussed and management personnel showed performance for each fund and discussed the factors affecting performance. The Board inquired from SI whether there was any correlation between fund expenses and performance, and SI saw no correlation with the ICON Funds. During the discussion on performance, management personnel noted that the markets continue to experience volatility and that when the markets are volatile, it affects the performance of the ICON system; during the last three – four years ICON’s
| 96 | OTHER INFORMATION |
Table of Contents
style of management, intrinsic valuation, has not been in favor and performance has been affected by three primary factors: quality, cash and shorter duration theme reversals. The Trustees noted that Advisers’ performance relative to other valuation managers as judged by the AthenaInvest system is in line, but in relation to other strategy managers, valuation is underperforming Future Growth, Social Considerations, Competitive Position, Quantitative and Profitability. The Board believes this information supports the view that an active valuation manager is in a very difficult setting and indicates this setting has been particularly difficult for managers buying what they consider to be value stocks. Management noted that the ICON system is designed to handle one to two year industry themes; and that the Adviser has stuck to its system as specified in Fund disclosure documents, holding the stocks and industries that appear inexpensive in relation to ICON’s calculating of value and ridden through the volatility. SI also noted that from a performance point of view, the Funds in the SI Report are compared using the Morningstar data, and there is no Morningstar category for “all cap” funds. For the period July 1, 2013 and ending June 30, 2014 and for the six month period ending June 30, 2014, five of the 18 ICON Funds out-performed their benchmarks.
The Board addressed style consistency with the Adviser. Management advised that, based on the Adviser’s own analysis, and with the restructuring of the Adviser, the Adviser has continued an additional level of review on the Portfolio Managers (“PMs”) to make sure they are adhering to the ICON System; the Senior Vice President of Fund Management has been systematically tracking the Funds’ performance; he evaluates each of the ICON Funds to help ensure all PMs are investing consistently and in accordance with the ICON System by evaluating the Funds from an attribution perspective in monthly meetings. Management also advised that part of his responsibilities require him to evaluate the ICON system and that this effort has resulted in improvements to the ICON methodology, when necessary.
In connection with reviewing data bearing upon the nature, quality, and extent of services furnished by ICON to each Fund, the Board assessed data concerning ICON’s staffing, systems and facilities. The Board also assessed ICON’s non-Trust business to see if there are any initiatives that would dilute service to the Trust. The Board concluded:
A. That the breadth and the quality of investment advisory and other services being provided to each Fund is satisfactory, as evidenced in part by efforts to address and improve the performance record of each Fund when compared with the performance records of a peer group of comparable funds and markets in general;
| OTHER INFORMATION | 97 |
Table of Contents
B. That the breadth and the quality of investment advisory and other services being provided to each Fund are satisfactory, as evidenced in part by the AthenaInvest Data (ratings based on an assessment of fund strategy), the Adviser’s performance is competitive with other fund managers in the value style group, and the Adviser has applied a disciplined approach in the style specified in the Funds’ offering document;
C. That ICON has made significant expenditures in the past year and in prior years to ensure that it has the sophisticated systems and the highly trained personnel necessary for it to be able to continue to provide quality service to the Funds’ shareholders, including the dedication of substantial resources to ICON’s investment and methodology;
D. That the Board, after considering compliance reports and compliance initiatives undertaken during the year and conducting individual interviews with selected PMs, is satisfied with the research and portfolio management, that research and portfolio management is being constantly evaluated and improved upon; and that the PMs are evaluating trading services constantly, the Board concluded that the Adviser is providing the Funds with professional management of the nature, quality and scope required by the Funds; and
E. The risks assumed by ICON in providing investment advisory services to each Fund, including the capital commitments which have been made in the past and which continue to be made by ICON to ensure the continuation of the highest quality of service to the Trust, is made with the recognition that shareholders may redeem their shares at any time without notice and the Trust’s advisory relationship with ICON may be terminated at any time and must be renewed on an annual basis.
In considering the reasonableness of the fees paid to the Adviser for managing each Fund, the Board reviewed, among other things, data concerning other funds from the SI Report, financial statements of the Adviser and an analysis of the profitability of the Adviser, and its affiliates, and their relationship with each Fund over various time periods. Such analysis identified all revenues and other benefits received by the Adviser and its affiliates from managing each Fund, the costs associated with providing such services and the resulting profitability to the Adviser and its affiliates and a comparison of similar data from reports filed by publicly traded firms.
The Board assessed actual (net) fees for advisory services and Fund expense ratios under the contractual relationship (the Advisory agreements and the Expense Limitation Agreements) with the Adviser as opposed to the fees specified in the applicable Advisory Agreement and expense ratios without
| 98 | OTHER INFORMATION |
Table of Contents
application of the expense limitations and concluded that the focus should be on actual expense ratios after application of the Expense Limitation Agreements.
The Board considered the current and anticipated asset levels of each Fund and the contractual commitments of the Adviser to waive fees and pay expenses of the Funds from time to time to limit the total expenses of the Funds. In this regard the Board discussed asset levels in each Fund covered by the Advisory Agreements due to the relative Fund performance, and the industry wide sales in equity and actively managed funds due to the uncertainty of the markets. ICON’s ability to provide the services called for under the Advisory Agreements was assessed in light of current and projected asset levels. Fund expenses and expense ratios were also assessed in light of current and projected asset levels. The Board concluded that the Adviser has the resources necessary to provide the services called for under the Advisory Agreements; that profitability to the Adviser and its affiliates from their relationship with the Funds, and services provided to the Funds, is not excessive; and that the Adviser is not realizing material benefits from economies of scale that would warrant adjustments to the fees for any Fund at this time. The Board of Trustees concluded that, in light of the nature, extent and quality of the services provided by the Adviser and the levels of profitability associated with providing these services, the fees charged by the Adviser under the Advisory Agreements to each Fund are reasonable.
In connection with assessing data bearing on the fairness of fee arrangements, the Board considered the SI Report. It was noted that SI was selected at the May Board meeting to prepare its report, an extensive analysis of the expense data of other comparable funds; and that Trustee input was solicited and provided in the process. Among other information discussed, it was noted that:
A. the advisory fee structures of the Funds are within the range of funds considered in the comparison with advisory fees and expense ratios of other similarly managed funds as set forth in the comparative data;
B. ICON has contractually agreed to impose expense limitations on each and every Fund at a cost to ICON;
C. ICON has contractually committed to break points in its fees so that economies of scale could be realized as a Fund grows in assets, for the benefit of Fund shareholders.
The Board also considered the fees charged by the Adviser to other advisory clients as outlined in its Registration Application on Form ADV in connection with assessing data bearing on the fairness of fee arrangements. The Trustees noted that certain ICON institutional/sub-advised type accounts
| OTHER INFORMATION | 99 |
Table of Contents
have lower fees than the fees paid by the Funds for a number of reasons, including but not limited to, those clients call for different commitments of time, institutional clients have low and predictable turnover of assets, in competition joint costs are apportioned among paying customers according to elasticity of demand and the Adviser has a limited level of responsibility in sub-managed accounts, or accounts with an investor agent/advisor.
The Board noted that the Funds’ redemptions were similar to industry averages which showed two things: 1) that the Funds’ Performance was not adversely impacting fund redemptions, and 2) that the fees and costs were competitive when compared to size. The Board noted that there are thousands of mutual funds competing; that investors can search and trade funds on the internet or on platforms at very little or no cost; and that if the Adviser were overcharging for its services, with its performance being what it is, the Board would have expected redemptions in excess of industry norms.
The Board concluded that the Adviser is providing the Funds with professional management at a fair, reasonable and competitive price.
In connection with assessing the direct and indirect benefits to ICON from serving as the Funds’ adviser, the Board discussed services provided under the Distribution Agreement and the Administrative Services Agreement which are in addition to services under the Advisory Agreements. It was noted that IDI does not charge a fee to the Funds for its services and that ICON’s fee for administrative services appears to be consistent with such fees in other fund groups. The Board noted that ICON receives research assistance (primarily in the form of data) from the use of soft dollars generated from Fund portfolio transactions; that such research assists ICON in providing quality advisory services; that Trust and Adviser compliance personnel continuously evaluate and report on the soft-dollar arrangements and related costs; and the Board concluded that the arrangements are consistent with Fund brokerage practices and benefit the Funds and their shareholders.
Based on these considerations, the Board, including all of the Independent Trustees, concluded that: 1) the continuation of the Advisory Agreements was in the best interests of each Fund and its shareholders, 2) the services to be performed under the Advisory Agreements were required for the operation of the Funds, 3) the advisory services were satisfactory to the Funds in the past, and 4) the fees for the advisory services and other benefits from the relationship with the Trust received by ICON, and its affiliates, were consistent with fees paid by similar funds and other clients of ICON, and were reasonable in light of the comparative data, and within the range of what would have been negotiated at arm’s length in light of all the circumstances.
| 100 | OTHER INFORMATION |
Table of Contents
Supplemental Tax Information
For corporate shareholders, the following percentage of the total ordinary income dividends paid during the fiscal year ended September 30, 2014, qualifies for the corporate dividends received deduction for the following Funds:
| Fund | Dividends Received Deduction | |||
ICON Equity Income Fund | 78.7 | % | ||
ICON Opportunities Fund | 22.7 | % | ||
ICON Risk-Managed Balanced Fund | 62.9 | % | ||
For the fiscal year ended September 30, 2014, the following funds paid qualified dividend income:
| Fund | Amount | |||
ICON Equity Income Fund | 91.1% | |||
ICON Opportunities Fund | 23.1% | |||
ICON Risk-Managed Balanced Fund | 73.4% | |||
The Funds designate the following amounts, or the maximum amount needed, as long-term capital gain distributions qualifying for the maximum 20% income tax rate for individuals:
| Fund | Amount | |||
ICON Bond Fund | $ | 1,339,679 | ||
Portfolio Holdings
Information related to the 10 largest portfolio holdings of each Fund is made available at www.iconfunds.com within approximately 10 business days after month-end. Additionally, a complete list of each Fund’s holdings is made available approximately 30 days after month-end. Each ICON Fund also files a complete schedule of portfolio holdings for the first and third quarters of its fiscal year with the Securities and Exchange Commission (the “Commission”) on Form N-Q. The ICON Funds’ Forms N-Q are available at www.sec.gov or may be reviewed and copied at the Commission’s Public Reference Room in Washington, DC. Information about the Public Reference Room may be obtained by calling 1-800-SEC-0330.
Proxy Voting
A summarized description of the policies and procedures the ICON Funds use to vote proxies is available free of charge at www.iconfunds.com or by calling 1-800-764-0442.
| OTHER INFORMATION | 101 |
Table of Contents
Information about how the ICON Funds voted proxies related to each Fund’s portfolio securities during the 12-month period ended June 30 is available free of charge at www.iconfunds.com or on the Commission’s website at www.sec.gov.
Cost Basis Information
Effective January 1, 2012, federal law requires mutual fund companies to maintain and report a shareholder’s cost basis by tax lot, gain/loss information and holding period of covered shares to the Internal Revenue Service on Form 1099. Covered shares are mutual fund shares acquired on or after January 1, 2012. A fund is not required to maintain and report information for shares not deemed as covered.
The new law requires each fund to elect a default tax identification methodology in order to perform the required reporting. As a result, the Trust has chosen Average Cost as its default tax identification methodology. This is the method each Fund will use. However, at the time of purchase or upon the sale of covered shares, shareholders may choose a different tax identification method. Furthermore, if you purchase shares through a financial intermediary, please contact the intermediary to find out what default tax identification method they will use. We recommend that you consult your tax adviser to determine which tax identification methodology best suits your individual tax situation.
For More Information
This report is for the general information of the Funds’ shareholders and is not authorized for distribution to prospective investors unless preceded or accompanied by a current prospectus. You may obtain a copy of the prospectus, which contains information about the investment objectives, risks, charges, expenses, and share classes of each ICON Fund, by visiting www.iconfunds.com or by calling 1-800-764-0442. Please read the prospectus carefully before investing.
ICON Distributors, Inc., Distributor.
| 102 | OTHER INFORMATION |
Table of Contents
ICON FUNDS PRIVACY INFORMATION
| FACTS | WHAT DOES ICON DO WITH YOUR PERSONAL INFORMATION? | |
| Why? | Financial companies choose how they share your personal information. Federal law gives consumers the right to limit some but not all sharing. Federal law also requires us to tell you how we collect, share, and protect your personal information. Please read this notice carefully to understand what we do. | |
| What? | The types of personal information we collect and share depend on the product or service you have with us. This information can include:
n Social Security number and account balances
n income and transaction history
n checking account information and wire transfer instructions
When you are no longer our customer, we continue to share your information as described in this notice. | |
| How? | All financial companies need to share customers’ personal information to run their everyday business. In the section below, we list the reasons financial companies can share their customers’ personal information; the reasons ICON chooses to share; and whether you can limit this sharing. |
| Reasons we can share your personal information | Does ICON share? | Can you limit this sharing? | ||
For our everyday business purposes — such as to process your transactions, maintain your account(s), respond to court orders and legal investigations, or report to credit bureaus | Yes | No | ||
For our marketing purposes — to offer our products and services to you | No | We don’t share | ||
| For joint marketing with other financial companies | No | We don’t share | ||
For our affiliates’ everyday business purposes — information about your transactions and experiences | No | We don’t share | ||
For our affiliates’ everyday business purposes — information about your creditworthiness | No | We don’t share | ||
| For nonaffiliates to market to you | No | We don’t share |
| Questions? | Call 1-800-764-0442 for the ICON Funds and 1-800-828-4881 for ICON Advisers, Inc. and ICON Distributors, Inc. |
| FUNDS PRIVACY INFORMATION | 103 |
Table of Contents
| Page 2 |
| Who we are | ||
| Who is providing this notice? | ICON Funds, ICON Advisers, Inc., and ICON Distributors, Inc. (collectively “ICON”) | |
| What we do | ||
| How does ICON protect my personal information? | To protect your personal information from unauthorized access and use, we use security measures that comply with federal law. These measures include computer safeguards and secured files and buildings.
Contracts with our service providers require them to restrict access to your non-public personal information, and to maintain physical, electronic and procedural safeguards against unintended disclosure. | |
| How does ICON collect my personal information? | We collect your personal information, for example, when you
n open an account or enter into an investment advisory contract
n provide account information or give us your contact information
n make a wire transfer
We also collect your personal information from others, such as credit bureaus, affiliates, or other companies. | |
| Why can’t I limit all sharing? | Federal law gives you the right to limit only
n sharing for affiliates’ everyday business purposes — information about your creditworthiness
n affiliates from using your information to market to you
n sharing for nonaffiliates to market to you
State laws and individual companies may give you additional rights to limit sharing. | |
| Definitions | ||
| Affiliates | Companies related by common ownership or control. They can be financial and nonfinancial companies.
n Our affiliates include financial companies such as ICON Funds, ICON Advisers, Inc., and ICON Distributors, Inc. | |
| Nonaffiliates | Companies not related by common ownership or control. They can be financial and nonfinancial companies.
n Nonaffiliates we share with can include financial companies such as custodians, transfer agents, registered representatives, financial advisers and nonfinancial companies such as fulfillment, proxy voting, and class action service providers | |
| Joint marketing | A formal agreement between nonaffiliated financial companies that together market financial products or services to you.
n ICON doesn’t jointly market |
| 104 | FUNDS PRIVACY INFORMATION |
Table of Contents
(This page is intentionally left blank)
Table of Contents
(This page is intentionally left blank)
Table of Contents
(This page is intentionally left blank)
Table of Contents
(This page is intentionally left blank)
Table of Contents
(This page is intentionally left blank)
Table of Contents
For more information about the ICON Funds, contact us:
| By Telephone | 1-800-764-0442 | |
| By Mail | ICON Funds P.O. Box 55452 Boston, MA 02205-8165 | |
| In Person | ICON Funds 5299 DTC Boulevard, 12th Floor Greenwood Village, CO 80111 | |
| On the Internet | www.iconfunds.com | |
| By E-Mail | info@iconadvisers.com | |
Table of Contents

2014 ANNUAL REPORT
ICON INTERNATIONAL FUNDS
INVESTMENT UPDATE
ICON Emerging Markets Fund (formerly known as ICON
Asia-Pacific Region Fund)
ICON International Equity Fund

1-800-764-0442 | www.iconfunds.com
Table of Contents

You can now sign up for electronic delivery of ICON Fund shareholder reports, including prospectuses, annual reports, semiannual reports and proxy statements.
When these materials are available, you will receive an email from ICON with instructions on how to view the documents. Statements, transaction confirmations and other documents that are not available online will continue to be sent to you by U.S. mail.
Visit ICON’s website at www.iconfunds.com to learn more and sign up.
You may change or cancel your participation in eDelivery by visiting www.iconfunds.com, or you can request a hard copy of any of the materials free of charge by calling ICON Funds at 1-800-764-0442.
1-800-764-0442 • www.iconfunds.com
Table of Contents

| 2 | ||||
| 5 | ||||
Management Overview (Unaudited) and Schedules of Investments | ||||
ICON Emerging Markets Fund (formerly known as Asia-Pacific Region Fund) | 8 | |||
| 17 | ||||
| 28 | ||||
| 36 | ||||
| 40 | ||||
| 56 | ||||
| 57 | ||||
| 59 | ||||
| 62 | ||||
| 70 | ||||
Table of Contents
Historical Returns
All total returns mentioned in this Report account for the change in a Fund’s per-share price and the reinvestment of any dividends, capital gain distributions and adjustments for financial statement purposes. If your account is set up to receive Fund distributions in cash rather than to reinvest them, your actual return may differ from these figures. The Funds’ performance results do not reflect the deduction of taxes that a shareholder would pay on Fund distributions or on the redemption of Fund shares. The Adviser may have reimbursed certain fees or expenses of some of the Funds. If not for these reimbursements, performance would have been lower. Fund results shown, unless otherwise indicated, are at net asset value. If a sales charge (maximum 5.75%) had been deducted, results would have been lower.
Past performance does not guarantee future results. Investment return and principal value will fluctuate so that an investor’s shares, when redeemed, may be worth more or less than their original cost. Performance results represent past performance, and current performance may be higher or lower. Please call 1-800-764-0442 or visit www.iconfunds.com for performance results current to the most recent month-end.
Portfolio Data
This Report reflects ICON’s views, opinions and portfolio holdings as of September 30, 2014, the end of the reporting period. The information is not a complete analysis of every aspect of any sector, industry, security or the Funds.
Opinions and forecasts regarding industries, companies and/or themes, and portfolio composition and holdings are subject to change at any time based on market and other conditions, and should not be construed as a recommendation of any specific security, industry or sector. Each Fund’s holdings as of September 30, 2014 are included in each Fund’s Schedule of Investments.
According to ICON, value investing is an analytical approach to investing that employs various factors, including projecting earnings growth estimates, in an effort to determine whether securities are over- or underpriced relative to ICON’s estimates of their intrinsic value. Value investing involves risks and uncertainties and does not guarantee better performance or lower costs than other investment methodologies. ICON’s value-to-price ratio (“V/P”) is a ratio of intrinsic value, as calculated using ICON’s proprietary valuation methodology, of a broad range of domestic and international securities
| 2 | ABOUT THIS REPORT |
Table of Contents
within ICON’s system as compared to the current market price of those securities. The ICON system relies on the integrity of the financial statements released to the market as part of our analysis.
This Report contains statements regarding industry or sector themes, new market themes, investment outlook, relative strength, value-to-price ratios, and investment team expectations, beliefs, goals and the like that are based on current expectations, recent individual stock performance relative to current market prices, estimates of company values and other information supplied to the market by the companies we follow. Words such as “expects,” “suggests,” “anticipates,” “targets,” “goals,” “value,” “intrinsic value,” “indicates,” “believes,” “considers,” “estimates,” variations of such words and similar expressions are intended to identify forward looking statements, which are not statements of historical fact. Forward looking statements are not guarantees of future performance and involve certain risks, uncertainties and assumptions that are difficult to assess. These risks and uncertainties are based on a number of important factors, including, among others: stock price fluctuations; the integrity and accuracy of historical and projected financial and other information supplied by companies to the public or assumptions based on such information supplied; interest rates; bond yields; future earnings growth rates; the risks noted in this report and other factors beyond the control of our investment team but used by the investment team to influence their assumptions. Therefore, actual outcome may differ materially from what is expressed in such forward looking statements.
There are risks associated with mutual fund investing, including the loss of principal. The likelihood of loss may be greater if you invest for a shorter period of time. There is no assurance that the investment process will consistently lead to successful results.
An investment in a region fund may involve greater risk and volatility than a diversified fund. An investment concentrated in sectors and industries may involve greater risk and volatility than a more diversified investment.
Investments in foreign securities may entail unique risks, including political, market, and currency risks. Financial statements of foreign companies are governed by different accounting, auditing, and financial standards than U.S. companies and may be less transparent and uniform than in the United States. Many corporate governance standards, which help ensure the integrity of public information in the United States, do not exist in foreign countries. In general, there may be less governmental supervision of foreign stock exchanges and securities brokers and issuers. The ICON system relies on the integrity of financial statements released to the market as part of our analysis.
| ABOUT THIS REPORT | 3 |
Table of Contents
The prospectus and statement of additional information contain this and other information about the Funds and are available by visiting www.iconfunds.com or calling 1-800-764-0442. Please read the prospectus and statement of additional information carefully.
Comparative Indexes
The comparative indexes discussed in this Report are meant to provide a basis for judging a Fund’s performance against specific securities indexes. Each index shown accounts for both change in the security price and reinvestment of dividends and distributions (except as noted), but does not reflect the costs of managing a mutual fund. The total return figures for the Morgan Stanley Capital International (“MSCI”) indexes assume change in security prices and the deduction of local taxes. The Funds’ portfolios may significantly differ in holdings and composition from the indexes. Individuals cannot invest directly in an index.
| • | The MSCI Emerging Markets Index is a free float-adjusted market capitalization index that is designed to measure equity market performance of emerging markets (Brazil, Chile, China, Columbia, Czech Republic, Egypt, Greece, Hungary, India, Indonesia, Korea, Malaysia, Mexico, Peru, Philippines, Poland, Qatar, Russia, South Africa, Taiwan, Thailand, Turkey and United Arab Emirates). |
| • | The MSCI All Country World Index ex-United States (“ACWI ex-U.S.”) is a leading unmanaged benchmark of international stock performance. The capitalization-weighted index is representative of the performance of securities of companies located in developed and emerging markets outside of the United States. |
Index returns and statistical data included in this Report are provided by FactSet Research Systems.
Financial Intermediary
If you purchase the Fund through a broker-dealer or other financial intermediary (such as a bank), the Fund and its related companies may pay the intermediary for the sale of Fund shares and related services. These payments may influence the broker-dealer or other intermediary and your salesperson to recommend the Fund over another investment. Ask your salesperson or visit your financial intermediary’s website for more information.
| 4 | ABOUT THIS REPORT |
Table of Contents
MESSAGE FROM ICON FUNDS (UNAUDITED)
Dear Shareholder,
The graph below shows the S&P Composite 1500 Index and a subset of it, the S&P SmallCap 600 Index (“S&P SmallCap 600 Index”) from 9/30/13 through 10/6/14 (our fiscal year plus a few days into October). It reveals a fragmented, divergent market in 2014. The two indexes moved similarly in late 2013, then diverged in 2014. The 1500, lifted by a few large-cap stocks, moved 7.5% higher year to date through September 30, 2014, while the small-cap component of it is negative for 2014, as highlighted in the table. In addition to that divergence, there have been a few rapid, short term industry and sector theme reversals during each up and down phase, more easily seen on the Small Cap chart. We believe the divergence and the theme reversals can be explained by investors’ reaction to three situations.
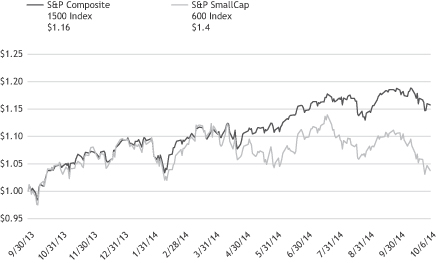
Index | 9/30/2013- 12/31/13 | 12/31/13- 9/30/14 | ||||||
S&P Composite 1500 | 10.3% | 7.5% | ||||||
S&P SmallCap 600 | 9.8% | -3.7% | ||||||
The first situation relates to investors’ reactions to a surprise negative Gross Domestic Product (GDP). Entering the first quarter of 2014, most forecasters were calling for positive real GDP. However, as the quarter unfolded it became apparent that something was wrong. Now, looking back, we know real GDP was at a negative 2.1% pace for the year. Investors flipped from favoring cyclical industries and sectors in late 2013 to favoring defensive, recession proof ones in early 2014. This theme change lasted only three and
| MESSAGEFROM ICON FUNDS | 5 |
Table of Contents
a half months for the 1500 Index and one month longer for the 600 Index, too quick for a value-based system to capture.
The second situation involves investors’ reactions to a rise in the U.S. Dollar. From June 30, 2013 through September 30, 2014, the U.S. Dollar Index (DXY) gained 7.7%, which is still 28.5% below its peak in 2002. It appears many investors and speculators adjusted their equity portfolios, attempting to guess which industries and stocks would either benefit from or be hurt by a stronger US Dollar. We have found economic reactions to currency swings to be less dramatic and slower than theory would suggest so we suspect these investors may be over reacting lately.
The last situation relates to investors’ speculation on rising interest rates. In anticipation of the Federal Reserve ending its quantitative easing program, there appeared to be a popular belief that both short-term and long-term interest rates would increase. Investors who believed this might have adjusted their equity portfolios in anticipation of higher interest rates and their behavior affected stock prices. First, it should be mentioned that ICON believes, and has stated, that interest rates can go low and stay low for many years. We see no support for higher long term interest rates. We sense, however, that we are in the minority with that outlook. We believe the many investors who expect higher interest rates bought stocks they think will benefit from higher rates and sold stocks they think will be hurt by rate increases. For example, it might be that these investors, believing that rising rates will hurt small cap stocks more than large cap stocks, bought large cap issues while avoiding small cap stocks altogether. Similarly, believing that higher rates would have a negative impact on certain industries, they avoided industries in the Consumer Discretionary sector that have an element of consumer borrowing such as the homebuilders, automobile manufacturers and home furnishing industries.
We believe investors’ reactions to a surprise negative GDP quarter, a rise in the US Dollar and an anticipated rise interest rates have contributed to moves in stocks that were not related to value of the stocks themselves. We have seen overpriced stocks (in our opinion) get bid up higher and underpriced stocks taken lower as investors try to get repositioned. This recent trend of positioning equity portfolios for anticipated higher interest rates and a rising US Dollar is stretching the valuation in some industries according to our system. However, according to our methodology, industries favored by these speculators are becoming overpriced while disfavored industries are becoming underpriced. Given this scenario, we expect this behavior to end sometime in the next year.
The first week of October 2014 our ICON market value-to-price (V/P) ratio has been in the 1.06 – 1.10 range, indicating stocks, on average, are priced
| 6 | MESSAGEFROM ICON FUNDS |
Table of Contents
below our estimate of fair value and giving us the expectation that stock prices can move higher over the next year. Over the course of the last year value has grown and prices of some stocks have kept pace, but, as seen in the graph, some have lagged behind. As mentioned above, we believe this disconnect is due to concerns about the strength of the U.S. Dollar and the expectation of rising interest rates. We are finding better value in the cyclical, economically sensitive industries rather than the so-called recession proof industries. With an overall V/P ratio of 1.10 and many industry valuation readings stretched, we will buy the best bargains we can find and have the patience to wait for investors to ultimately recognize value. Our valuation readings, coupled with various supportive conditions such as low inflation, low interest rates, no shortages of capital or commodities and modest economic growth, lead us to believe we are in a favorable setting for owning equities.

Craig Callahan D.B.A.
Chief Executive Officer
ICON Advisers, Inc.
| MESSAGE FROM ICON FUNDS | 7 |
Table of Contents
Class S Class C Class A | ||||
(formerly known as ICON ASIA-PACIFIC FUND) |
| Q. | How did the Fund perform relative to its benchmark? |
| A. | Effective May 5, 2014, the ICON Emerging Markets Fund (Emerging Markets Fund or the Fund) changed its focus from the Asia-Pacific region to a focus on emerging markets. The Emerging Markets Fund Class S returned 1.78% for the fiscal year ended September 30, 2014, while its benchmark, the MSCI Emerging Markets Index, returned 4.66%, and the MSCI All Country Asia-Pacific Index gained 4.03%. |
The ICON Emerging Markets Fund Class S returned -1.18% for the period September 30, 2013, through May 4, 2014, underperforming its benchmark during that period, the MSCI All Country Asia-Pacific Index, which returned 1.02%.
The ICON Emerging Markets Fund Class S returned 3.00% for the period from May 5, 2014 through September 30, 2014, outperforming its benchmark during that period, the MSCI Emerging Markets Index, which returned 1.89%. Total returns for other periods and additional Class shares as of September 30, 2014, appear in the subsequent pages of this Fund’s Management Overview.
| Q. | What primary factors were behind the Fund’s relative performance? |
| A. | While the U.S. economy showed signs of improvement during fiscal year 2014, economic growth outside the U.S. - including Europe, Japan and China - appeared to be concerning to investors. Geopolitical problems also worried investors, as tensions flared between Ukraine and Russia, and martial law was declared in Thailand. Despite these headwinds, global stock markets generally advanced. Globally, central banks maintained loose monetary policy and rates remained low. |
| Asia-Pacific Region Focus Time Period |
During the period when the focus of the Fund was on the Asia-Pacific region, India and Indonesia led all countries due in large part to market expectations of election wins by political parties perceived by investors to be positive for economic growth. On average, the Fund was overweight relative to the benchmark in both countries. India and Indonesia added positively to relative performance. China and Japan were the biggest laggards in the benchmark, as investors worried over slowing economic growth in China and whether or not Japan’s aggressive
| 8 | MANAGEMENT OVERVIEW |
Table of Contents
combination of monetary, fiscal and structural policies would actually prove effective. The Fund, on average, was underweight in both China and Japan relative to the benchmark during the period, however, positioning in both countries detracted from relative performance.
From a sector perspective, the Information Technology sector led all sectors, followed by the Health Care sector. Fund positioning in the Health Care sector contributed to relative performance. Positioning in the Information Technology sector detracted the most of any sector relative to benchmark performance, primarily due to stock selection. The Consumer Discretionary and Materials sectors were the biggest laggards in the benchmark. Positioning in the Materials sector contributed to relative performance while positioning in the Consumer Discretionary sector detracted from relative performance.
| Emerging Markets Focus Time Period |
During the period after the focus of the Fund had shifted to emerging markets, India and Thailand were amongst the top performing countries. India outperformed other countries as it became clear that a political coalition seen by investors as positive for economic growth would win Indian elections. The Fund participated in India’s outperformance, adding the most of any country to performance relative to the benchmark. Following a violent political crisis lasting several months, Thailand came under martial law in May 2014. After a short period of uncertainty, investors generally came to a favorable view of the coup, seeing it as an effective and peaceful way to end Thailand’s political crisis, and Thai stocks responded positively. Given the uncertainty in Thailand, the Fund was underweight during the period resulting in a slight negative total effect relative to the benchmark.
In terms of sectors, Health Care and Telecommunication Services led during the period, and the Fund’s positioning within both sectors added the most to performance relative to the benchmark. Materials and Consumer Discretionary were the two worst performing sectors within the benchmark. The Fund’s holdings in the Consumer Discretionary sector was the largest detractor of any sector from relative performance.
| Q. | How did the Fund’s composition affect performance? |
| A. | Asia-Pacific Region Focus Time Period |
The top country contributors to Fund performance during the period when the focus of the Fund was on the Asia-Pacific region were Australia and India. Japan and Thailand detracted the most from Fund performance. The top sector contributors to performance during the
| MANAGEMENT OVERVIEW | 9 |
Table of Contents
period were Financials, led by the diversified banks industry, and Health Care, led by the biotechnology industry.
From a total effect standpoint, countries that added the most to relative performance included Singapore, India and Australia. Japan and Thailand detracted the most relative to the benchmark. In terms of sectors, the Financials, Energy and Health Care sectors added the most to performance relative to the benchmark. The Information Technology and Industrials sectors detracted the most in terms of performance relative to the benchmark.
With equity valuations appearing stretched during the period, a higher than average allocation to cash was used for defensive purposes, which contributed positively to benchmark relative performance. Currency movements had a positive effect on relative returns. The Fund did not employ currency hedging during the period.
Emerging Markets Region Focus Time Period
The top country contributors to Fund performance during the period when the focus of the Fund was on emerging markets were China and India. Hong Kong and Brazil detracted the most from Fund performance. The top sector contributors to Fund performance during the period were Telecommunications Services, led by the wireless telecommunications services industry, and Health Care, led by the pharmaceuticals industry. The Consumer Discretionary and Energy sectors detracted from Fund performance.
From a total effect standpoint, countries that added the most to relative performance included India, South Korea and China. Hong Kong, Taiwan and Mexico detracted the most relative to the benchmark. In terms of sectors, Health Care, Telecommunication Services and Materials added the most to performance relative to the benchmark. The Consumer Discretionary and Consumer Staples sectors detracted the most in terms of performance relative to the benchmark.
With equity valuations appearing stretched during the period, a higher than average allocation to cash was used for defensive purposes, which detracted from benchmark relative performance. Currency movements had a positive effect on relative returns. The Fund did not employ currency hedging during the period.
| 10 | MANAGEMENT OVERVIEW |
Table of Contents
| Q. | What is your investment outlook for emerging markets? |
| A. | Fiscal year 2014 ended with an emerging markets value-to-price (V/P) ratio of 0.92, indicating that, on average, emerging markets stocks are overpriced according to our system. Having surpassed our estimates of fair value, we have built up a cash position that we intend to put toward better bargains as they present themselves. Economic growth outside of the United States is a key concern for investors, particularly as it relates to China and Europe, and monetary policy remains loose globally. Geopolitical issues, such as the ongoing tensions between Ukraine and Russia, continue to be a concern to investors. |
Although our system indicates emerging markets in general are overvalued, there are still many areas demonstrating good bargains according to our system. Examples of countries where we see opportunities include South Korea and India, and the Fund is overweight in both countries. From a sector perspective, we are seeing the most value in the Information Technology sector, maintaining overweight positions in higher value industries like IT consulting & other services and internet software & services.
At ICON, we continue to look for sectors and industries that our system identifies as trading at a discount to fair value. Guided by our disciplined, systematic and non-emotional approach to investing, we see several opportunities in the current environment and remain watchful for new prospective investments. As always we remain ready to reallocate and adapt as our investment system dictates.
| MANAGEMENT OVERVIEW | 11 |
Table of Contents
ICON Emerging Markets Fund
Country Composition
September 30, 2014
South Korea | 22.3% | |||
India | 15.2% | |||
China | 11.1% | |||
Hong Kong | 7.9% | |||
Brazil | 6.5% | |||
Malaysia | 5.3% | |||
Taiwan | 4.4% | |||
Philippines | 2.3% | |||
Poland | 2.2% | |||
Thailand | 1.1% | |||
Turkey | 0.9% | |||
Hungary | 0.8% | |||
|
| |||
| 80.0% | ||||
|
|
Percentages are based upon common and preferred stocks as a percentage of net assets.
ICON Emerging Markets Fund
Sector Composition
September 30, 2014
Information Technology | 18.8% | |||
Financial | 15.9% | |||
Consumer Discretionary | 11.3% | |||
Consumer Staples | 9.2% | |||
Industrials | 7.7% | |||
Telecommunication | 7.1% | |||
Health Care | 5.3% | |||
Utilities | 2.9% | |||
Energy | 1.8% | |||
|
| |||
| 80.0% | ||||
|
|
Percentages are based upon common and preferred stocks as a percentage of net assets.
ICON Emerging Markets Fund
Industry Composition
September 30, 2014
Wireless Telecommunication Services | 7.1% | |||
Diversified Banks | 6.8% | |||
Internet Software & Services | 5.8% | |||
IT Consulting & Other Services | 5.4% | |||
Semiconductors | 4.4% | |||
Pharmaceuticals | 4.1% | |||
Airport Services | 3.2% | |||
Technology Hardware, Storage & Peripherals | 3.2% | |||
Automobile Manufacturers | 2.9% | |||
Independent Power Producers & Energy Traders | 2.9% | |||
Household Products | 2.8% | |||
Casinos & Gaming | 2.5% | |||
Property & Casualty Insurance | 2.5% | |||
Advertising | 2.4% | |||
Catalog Retail | 2.3% |
Life & Health Insurance | 2.3% | |||
Tobacco | 2.3% | |||
Highways & Railtracks | 2.2% | |||
Reinsurance | 2.2% | |||
Real Estate Development | 2.1% | |||
Brewers | 1.6% | |||
Personal Products | 1.6% | |||
Marine Ports & Services | 1.5% | |||
Biotechnology | 1.2% | |||
Oil & Gas Storage & Transportation | 1.0% | |||
Other Industries (each less than 1%) | 3.7% | |||
|
| |||
| 80.0% | ||||
|
|
Percentages are based upon common and preferred stocks as a percentage of net assets.
| 12 | MANAGEMENT OVERVIEW |
Table of Contents
ICON Emerging Markets Fund^
Average Annual Total Return
as of September 30, 2014
| Inception Date | 1 Year | 5 Years | 10 Years | Since Inception | Gross Expense Ratio* | Net Expense Ratio* | ||||||||||||||||||||||
ICON Emerging Markets Fund - Class S | 2/25/97 | 1.78% | 5.86% | 7.54% | 3.06% | 1.64% | 1.64% | |||||||||||||||||||||
ICON Emerging Markets Fund - Class C | 1/25/08 | 0.92% | 4.88% | N/A | -0.25% | 3.76% | 2.56% | |||||||||||||||||||||
ICON Emerging Markets Fund - Class A | 5/31/06 | 1.68% | 5.67% | N/A | 2.40% | 2.97% | 1.81% | |||||||||||||||||||||
ICON Emerging Markets Fund - Class A (including maximum sales charge of 5.75%) | 5/31/06 | -4.14% | 4.42% | N/A | 1.67% | 2.97% | 1.81% | |||||||||||||||||||||
MSCI Emerging Markets Index | 4.66% | 4.76% | 11.03% | 6.70% | N/A | N/A | ||||||||||||||||||||||
MSCI All Country Asia-Pacific Index | 4.03% | 6.39% | 7.32% | 3.45% | N/A | N/A | ||||||||||||||||||||||
Past performance is not a guarantee of future results. Information about these performance results and the comparative indexes can be found in the About This Report section. The Adviser has agreed to limit certain expenses on Class C and Class A shares; without these limitations, returns would have been lower. The limitation provisions may be terminated in the future.
| ^ | Effective May 5, 2014, the ICON Emerging Markets Fund changed its focus from the Asia-Pacific region to a focus on emerging markets. The benchmark for the Fund is now the MSCI Emerging Markets Index. Prior to May 5, 2014, the benchmark was the MSCI All Country Asia-Pacific Index. |
| * | Please see the most recent prospectus for details. |
Class C total returns exclude applicable sales charges. If sales charges were included returns would be lower.
| MANAGEMENT OVERVIEW | 13 |
Table of Contents
ICON Emerging Markets Fund^
Value of a $10,000 Investment
through September 30, 2014
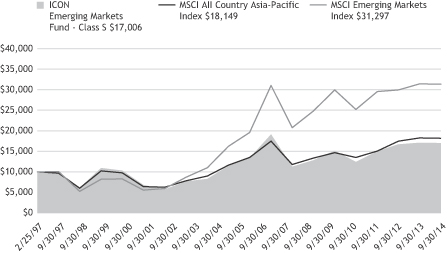
Past performance is not a guarantee of future results. The above graph compares a $10,000 investment made in the Emerging Markets Fund’s Class S shares on the Class’ inception date of 2/25/97 to a $10,000 investment made in an unmanaged securities index on that date. The Emerging Markets Fund’s performance in this chart and the performance table assumes the reinvestment of dividends, capital gain distributions and tax return of capital, but does not reflect the deduction of taxes that a shareholder would pay on Fund distributions or on the redemption of Fund shares.
| ^ | Effective May 5, 2014, the ICON Emerging Markets Fund changed its focus from the Asia-Pacific region to a focus on emerging markets. The benchmark for the Fund is now the MSCI Emerging Markets Index. Prior to May 5, 2014, the benchmark was the MSCI All Country Asia-Pacific Index. |
| 14 | MANAGEMENT OVERVIEW |
Table of Contents
ICON EMERGING MARKETS FUND
SCHEDULEOF INVESTMENTS
SEPTEMBER 30, 2014
| Shares or Principal Amount | Value | |||||||
| Common Stocks (78.3%) | ||||||||
| 3,200 | Aditya Birla Nuvo, Ltd.* | $ | 83,659 | |||||
| 24,500 | AMBEV S.A.** | 160,547 | ||||||
| 1,100 | Bank Zachodni WBK S.A.* | 130,909 | ||||||
| 422,000 | Beijing Capital International Airport Co., Ltd.* | 321,806 | ||||||
| 15,300 | Biocon, Ltd.* | 123,376 | ||||||
| 2,200 | CCC S.A.* | 84,746 | ||||||
| 32,000 | CCR S.A.** | 219,369 | ||||||
| 650,000 | Chaoda Modern Agriculture Holdings, Ltd.***(a) | - | ||||||
| 11,100 | Cheil Worldwide, Inc.†* | 234,927 | ||||||
| 50,000 | China Merchants Holdings International Co., Ltd.* | 154,426 | ||||||
| 80,000 | China Overseas Land & Investment, Ltd.* | 205,102 | ||||||
| 64,000 | China Resources Power Holdings Co., Ltd.* | 172,439 | ||||||
| 50,000 | China Taiping Insurance Holdings Co., Ltd.† * | 108,287 | ||||||
| 750 | CJ O Shopping Co., Ltd.* | 228,579 | ||||||
| 4,400 | Coca-Cola Icecek AS* | 94,676 | ||||||
| 220,000 | Datang International Power Generation Co., Ltd.* | 115,085 | ||||||
| 6,400 | Dr. Reddy’s Laboratories, Ltd.* | 334,727 | ||||||
| 25,000 | Galaxy Entertainment Group, Ltd.* | 145,151 | ||||||
| Shares or Principal Amount | Value | |||||||
| 15,200 | HDFC Bank, Ltd.* | $ | 213,526 | |||||
| 16,000 | Hengan International Group Co., Ltd.* | 157,198 | ||||||
| 9,200 | Hyundai Marine & Fire Insurance Co., Ltd.* | 253,545 | ||||||
| 2,800 | Infosys, Ltd.* | 170,285 | ||||||
| 50,000 | Intouch Holdings PCL* | 111,602 | ||||||
| 38,000 | ITC, Ltd.* | 227,799 | ||||||
| 3,000 | Kangwon Land, Inc.* | 101,641 | ||||||
| 2,400 | Kolao Holdings* | 38,161 | ||||||
| 20,784 | Korean Reinsurance Co.* | 222,379 | ||||||
| 580 | LG Household & Health Care, Ltd.* | 278,334 | ||||||
| 55,000 | Malayan Banking Bhd* | 166,971 | ||||||
| 240 | NAVER Corp.* | 183,330 | ||||||
| 3,400 | Philippine Long Distance Telephone Co.* | 234,607 | ||||||
| 16,000 | Ping An Insurance Group Co., Ltd* | 120,252 | ||||||
| 5,000 | Richter Gedeon Nyrt* | 78,082 | ||||||
| 286 | Samsung Electronics Co., Ltd.* | 320,322 | ||||||
| 63,000 | SapuraKencana Petroleum Bhd* | 79,104 | ||||||
| 1,350 | SK Telecom Co., Ltd.* | 371,375 | ||||||
| 110,000 | Taiwan Semiconductor Manufacturing Co., Ltd.* | 437,924 | ||||||
| 6,300 | Tech Mahindra, Ltd.* | 252,831 | ||||||
| 26,945 | Tencent Holdings, Ltd.* | 400,286 | ||||||
| SCHEDULEOF INVESTMENTS | 15 |
Table of Contents
| Shares or Principal Amount | Value | |||||||
| 4,500 | Ultrapar Participacoes S.A.** | $ | 95,249 | |||||
| 77,000 | UMW Holdings Bhd* | 287,835 | ||||||
| 12,000 | Wipro, Ltd.* | 116,292 | ||||||
|
| |||||||
| | Total Common Stocks (Cost $8,021,120) | 7,836,741 | ||||||
| Preferred Stock (1.7%) | ||||||||
| 12,500 | Itau Unibanco Holding S.A.** | 172,965 | ||||||
|
| |||||||
| | Total Preferred Stocks (Cost $196,055) | 172,965 | ||||||
| Shares or Principal Amount | Value | |||||||
| Short-Term Investments (19.1%) | ||||||||
| $ | 1,912,832 | State Street Euro Dollar Time Deposit (USD), 0.01%, 10/01/14 | $ | 1,912,832 | ||||
|
| |||||||
| | Total Short-Term Investments (Cost $1,912,832) | 1,912,832 | ||||||
| | Total Investments 99.1% (Cost $10,130,007) | 9,922,538 | ||||||
| | Other Assets Less Liabilities 0.9% | 86,261 | ||||||
|
| |||||||
| Net Assets 100.0% | $ | 10,008,799 | ||||||
|
| |||||||
The accompanying notes are an integral part of the financial statements.
| † | Non-income producing security. |
| * | The value of foreign securities fair valued (Note 2) as of September 30, 2014 was 73.6% of net assets. |
| ** | This security is considered a Level 1 security. See Note 2 for further details. |
| *** | This security is considered a Level 3 security. See Note 2 for further details. |
| (a) | This security is considered to be illiquid. The value of this security at September 30, 2014 was $0, which represents 0.0% of the Fund’s Net Assets. |
| 16 | SCHEDULEOF INVESTMENTS |
Table of Contents
MANAGEMENT OVERVIEW (UNAUDITED) | Class S Class C Class A | ICNEX IIQCX IIQAX |
| Q. | How did the Fund perform relative to its benchmark? |
| A. | The ICON International Equity Fund (the International Equity Fund or the Fund) Class S returned -0.51% for the fiscal year ended September 30, 2014, while the MSCI All Country World Index ex-U.S. (ACWI ex-U.S.) returned 5.22%. Total returns for other periods and additional Class shares as of September 30, 2014, appear in the subsequent pages of this Fund’s Management Overview. |
| Q. | What primary factors were behind the Fund’s relative performance? |
| A. | As we have seen in years past, we finished the fiscal year with global stock market gains amidst the backdrop of numerous global and local undercurrents. Europe emerged from recession, albeit at a tepid pace of economic growth due to the backdrop of ongoing tension with Russia and Ukraine. In the Asia-Pacific region, Japan saw mixed results from the prior year’s stimulation measures, bringing into question the viability of its long-term success. Additionally, China continued on its trajectory of slow economic growth. China’s slow growth is in accord with similar lackluster data seen in much of the major economies worldwide. Global central bank accommodation and monetary stimulus persisted, ultimately acting as a backstop to any protracted economic malaise. Despite the macro concerns, relatively low global interest rates and credit spreads have been supportive to company earnings and ultimately helped drive equity prices higher on the whole during the year. As the period closed, we saw modest upside in the global markets overall with a mixture of some regions showing great bargains and others appearing slightly overpriced. |
At the beginning of the fiscal year, our valuation model signaled a slightly overpriced market overall and pointed the Fund towards an overweight position in the defensive themed sectors of Consumer Staples and Health Care. However, gradual lowering of global interest rates had a beneficial effect on our estimate of value, ultimately leading us to increase positions in some of the more economically sensitive areas, most notably the Industrials and Information Technology sectors. From a regional perspective, the most significant allocation change during the years was an increase in European equities and a decrease in Asia-Pacific. Despite the ongoing issues that loom over the world economy and rotations that may seem contrarian, our discipline and focus on value
| MANAGEMENT OVERVIEW | 17 |
Table of Contents
guided our rotations, which we believe will benefit the Fund going forward.
As a multi-cap manager, we are not limited by restrictions on market capitalization. However, following our valuation readings lead to a concentration in small and mid-cap companies during the period, resulting in an underweight position in large-cap stocks relative to the benchmark. Large-cap stocks outperformed their small and mid-cap peers, which detracted from the Fund’s relative performance.
Currency movements worldwide throughout the fiscal year also had a negative impact on the Fund’s returns. The appreciation of the British Pound and the South Korean Won was unable to offset the losses in many other foreign currencies as the U.S. dollar broadly strengthened throughout the year. Currency hedging was not used during the fiscal year.
| Q. | How did the Fund’s composition affect performance? |
| A. | The Fund’s primary contributors to benchmark relative performance came from the Materials, Health Care and Information Technology sectors. Specifically, overweight positions in the health care supplies industry within the Health Care sector and IT consulting & other services industry within the Information Technology Sector benefitted performance relative to the benchmark. Further, an underweight position relative to the benchmark in the poor performing Materials sector, specifically in the diversified metals & mining, gold, and steel industries, was beneficial as we saw commodity-related weakness over the period. |
Conversely, performance of the Consumer Discretionary sector was a detractor, as the specialty stores and auto parts & equipment industries hindered the Fund’s returns. The Industrials sector was another notable source of relative underperformance as the sector underperformed the benchmark, particularly in the Europe region where the electrical components & equipment and building products industries had negative returns. Finally, the oil & gas equipment & services industry within the Energy sector suffered losses as commodity weakness over the period had an adverse effect on companies’ stock prices. With the gradual lowering of interest rates and declines in stock prices, most notably within Europe, our valuation methodology is showing us better bargains than we saw at the beginning of the year. As such, we see modest upside to the market, with the best bargains coming from the Information Technology and Industrials sectors.
| 18 | MANAGEMENT OVERVIEW |
Table of Contents
While return differentials amongst geographic regions were relatively muted, we saw a clear differentiation among certain countries throughout the year. Emerging market countries in the Asia-Pacific region such as India, Indonesia, and China posted strong returns despite our methodology indicating lower value and less upside. Conversely, countries in Europe posted weaker gains despite our methodology indicating better bargains. Most notably, Germany saw weak gains as macro and geopolitical concerns ultimately took hold; this country had a larger allocation in the Fund relative to the benchmark and proved to be unhelpful from a country allocation perspective. As the period ended, the emerging markets, as well as Asia-Pacific region as a whole, appeared overvalued according to our system while Europe and other developed market countries in general showed the most upside globally.
| Q. | What is your investment outlook for the international equity market? |
| A. | After another year of positive equity returns of this bull market, our system estimates that international equities, on average, still remain below our estimate of their intrinsic value. At the end of the period, international markets as a whole had a value-to-price (V/P) reading of 1.08, implying that, on average, our estimate of fair value for stocks is about 8% higher than where they are currently trading. Risk aversion amongst investors remains and corporate earnings have grown despite ongoing economic struggles and geopolitical concerns. While global economic growth has languished outside of the United States, interest rates remain low, thanks in great part to loose monetary policy and extraordinary central bank intervention. |
According to our valuation system, Europe represents the best opportunity from a regional perspective, with Asia-Pacific showing the least upside. Despite some improvements in sentiment and equity prices in the emerging market countries, overall they still remain overvalued according to our metrics and do not warrant an overweight exposure within the Fund. Based on our methodology, developed market countries in Europe show attractive upside in countries such as France, Sweden, Austria, and Germany. As of the end of the fiscal year 2014 we estimate that, on average, fair value for European equities is 24% higher than where prices are currently trading. Within the Western Hemisphere, Canada and Mexico look attractive to our system while Indonesia, Australia, and the Philippines, are currently showing the most value in the Asia-Pacific region.
From a sector perspective, we are still tilted towards the Information Technology and Industrials sectors. Within our system, Materials is now the most over-valued sector, followed by Utilities; Fund holdings in both
| MANAGEMENT OVERVIEW | 19 |
Table of Contents
of these sectors are underweight their respective benchmark weightings as we see little upside within these areas.
At ICON we continue to seek out industries that our system identifies as trading at a discount to fair value. Guided by our disciplined, systematic and non-emotional approach to investing, we see numerous opportunities amidst the recent turbulence and volatility. We believe it is nearly impossible to accurately time market bottoms and we believe rallies do not offer invitations. Therefore, given our current valuations, we remain almost fully invested. As market conditions dictate, we will adjust accordingly.
ICON International Equity Fund Country Composition
September 30, 2014
Germany | 26.7% | |||
France | 14.7% | |||
United Kingdom | 8.9% | |||
Sweden | 5.4% | |||
Australia | 5.2% | |||
Switzerland | 5.0% | |||
South Korea | 4.8% | |||
Hong Kong | 4.4% | |||
Japan | 3.9% | |||
Canada | 3.8% | |||
Netherlands | 2.8% | |||
Singapore | 2.6% | |||
Ireland | 1.5% | |||
Thailand | 1.4% | |||
Denmark | 1.3% | |||
Norway | 1.1% | |||
Italy | 0.9% | |||
Spain | 0.9% | |||
United States | 0.9% | |||
United Arab Emirates | 0.8% | |||
India | 0.8% | |||
Bermuda | 0.7% | |||
China | 0.6% | |||
Turkey | 0.5% | |||
Luxembourg | 0.4% | |||
South Africa | 0.4% | |||
|
| |||
| 100.4% | ||||
|
|
Percentages are based upon common and preferred stocks as a percentage of net assets.
ICON International Equity Fund
Sector Composition
September 30, 2014
Industrials | 27.6% | |||
Information Technology | 19.6% | |||
Health Care | 18.5% | |||
Consumer Discretionary | 13.6% | |||
Energy | 9.4% | |||
Materials | 3.8% | |||
Telecommunication | 2.9% | |||
Financial | 2.5% | |||
Consumer Staples | 1.3% | |||
Utilities | 1.2% | |||
|
| |||
| 100.4% | ||||
|
|
Percentages are based upon common and preferred stocks as a percentage of net assets.
| 20 | MANAGEMENT OVERVIEW |
Table of Contents
ICON International Equity Fund
Industry Composition
September 30, 2014
Pharmaceuticals | 7.9% | |||
Industrial Conglomerates | 6.9% | |||
Industrial Machinery | 4.3% | |||
Auto Parts & Equipment | 4.0% | |||
Internet Software & Services | 4.0% | |||
Oil & Gas Exploration & Production | 4.0% | |||
Semiconductors | 3.8% | |||
IT Consulting & Other Services | 3.6% | |||
Oil & Gas Equipment & Services | 3.5% | |||
Air Freight & Logistics | 3.0% | |||
Wireless Telecommunication Services | 2.9% | |||
Biotechnology | 2.7% | |||
Building Products | 2.7% | |||
Diversified Support Services | 2.7% | |||
Electronic Equipment & Instruments | 2.7% | |||
Health Care Equipment | 2.2% | |||
Aerospace & Defense | 2.1% | |||
Application Software | 2.1% | |||
Automobile Manufacturers | 2.1% | |||
Health Care Services | 2.0% | |||
Trading Companies & Distributors | 1.8% | |||
Apparel, Accessories & Luxury Goods | 1.7% |
Asset Management & Custody Banks | 1.7% | |||
Broadcasting | 1.5% | |||
Data Processing & Outsourced Services | 1.5% | |||
Construction & Engineering | 1.4% | |||
Health Care Supplies | 1.4% | |||
Life Sciences Tools & Services | 1.4% | |||
Commodity Chemicals | 1.3% | |||
Advertising | 1.2% | |||
Gas Utilities | 1.2% | |||
Integrated Oil & Gas | 1.2% | |||
Technology Hardware, Storage & Peripherals | 1.2% | |||
Electrical Components & Equipment | 1.1% | |||
Specialty Chemicals | 1.0% | |||
Other Industries (each less than 1%) | 10.6% | |||
|
| |||
| 100.4% | ||||
|
|
Percentages are based upon common and preferred stocks as a percentage of net assets.
| MANAGEMENT OVERVIEW | 21 |
Table of Contents
ICON International Equity Fund
Average Annual Total Return
as of September 30, 2014
| Inception Date | 1 Year | 5 Years | 10 Years | Since Inception | Gross Expense Ratio* | Net Expense Ratio* | ||||||||||||||||||||||
ICON International Equity Fund - Class S | 2/18/97 | -0.51% | 1.91% | 4.76% | 5.24% | 1.45% | 1.45% | |||||||||||||||||||||
ICON International Equity Fund - Class C | 2/19/04 | -1.56% | 0.79% | 3.34% | 2.49% | 2.77% | 2.56% | |||||||||||||||||||||
ICON International Equity Fund - Class A | 5/31/06 | -0.85% | 1.53% | N/A | -0.72% | 2.19% | 1.81% | |||||||||||||||||||||
ICON International Equity Fund - Class A (including maximum sales charge of 5.75%) | 5/31/06 | -6.58% | 0.32% | N/A | -1.42% | 2.19% | 1.81% | |||||||||||||||||||||
MSCI ACWI ex-U.S. | 5.22% | 6.50% | 7.54% | 5.55% | N/A | N/A | ||||||||||||||||||||||
Past performance is not a guarantee of future results. Information about these performance results and the comparative indexes can be found in the About This Report section. The Fund’s name and investment strategy changed effective January 29, 2004. The Fund’s past performance would have been different if the current strategy had been in effect. The Adviser has agreed to limit certain expenses Fund expenses; without these limitations, returns would have been lower. The limitation provisions may be terminated in the future.
| * | Please see the most recent prospectus for details. |
Class C total returns exclude applicable sales charges. If sales charges were included returns would be lower.
| 22 | MANAGEMENT OVERVIEW |
Table of Contents
ICON International Equity Fund
Value of a $10,000 Investment
through September 30, 2014
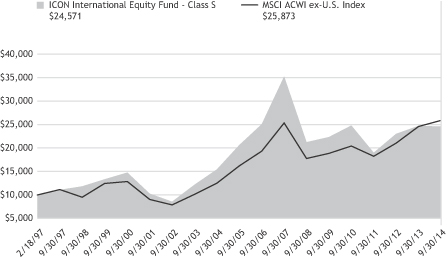
Past performance is not a guarantee of future results. The above graph compares a $10,000 investment made in the International Equity Fund’s Class S shares on the Class’ inception date of 2/18/97 to a $10,000 investment made in an unmanaged securities index on that date. Performance for the International Equity Fund’s other share classes will vary due to differences in charges and expenses. The International Equity Fund’s performance in this chart and the performance table assumes the reinvestment of dividends, capital gain distributions and tax return of capital, but does not reflect the deduction of taxes that a shareholder would pay on Fund distributions or on the redemption of Fund shares.
| MANAGEMENT OVERVIEW | 23 |
Table of Contents
ICON INTERNATIONAL EQUITY FUND
SCHEDULEOF INVESTMENTS
SEPTEMBER 30, 2014
| Shares or Principal Amount | Value | |||||||
| Common Stocks (99.2%) | ||||||||
| 8,000 | AAK AB* | $ | 417,173 | |||||
| 22,000 | Aalberts Industries NV* | 569,588 | ||||||
| 16,000 | Accor S.A.* | 708,611 | ||||||
| 284,000 | Afren PLC†* | 476,706 | ||||||
| 10,250 | Airbus Group NV* | 644,319 | ||||||
| 3,854 | ALK-Abello AS* | 464,808 | ||||||
| 20,700 | Arcadis NV* | 684,675 | ||||||
| 58,400 | Ashtead Group PLC* | 982,455 | ||||||
| 16,129 | AtoS* | 1,167,996 | ||||||
| 28,295 | Aveva Group PLC** | 705,946 | ||||||
| 41,000 | Babcock International Group PLC* | 723,476 | ||||||
| 9,300 | Bayer AG* | 1,293,986 | ||||||
| 112,000 | Beijing Enterprises Holdings, Ltd.* | 962,349 | ||||||
| 62,000 | Berendsen PLC* | 982,445 | ||||||
| 6,510 | Bertrandt AG* | 830,688 | ||||||
| 34,660 | Bonavista Energy Corp.**(b) | 398,608 | ||||||
| 146,000 | BP PLC* | 1,068,039 | ||||||
| 10,000 | CANCOM SE*(b) | 385,262 | ||||||
| 13,300 | Cap Gemini S.A.* | 953,790 | ||||||
| 18,580 | Carl Zeiss Meditec AG*(b) | 539,180 | ||||||
| 7,000 | Cewe Stiftung & Co. KGAA* | 461,473 | ||||||
| 1,702,000 | Chaoda Modern Agriculture Holdings, Ltd.† ***(a) | - | ||||||
| 25,400 | Cie de St-Gobain* | 1,160,564 | ||||||
| 3,100 | Constellation Software, Inc.** | 779,159 | ||||||
| 4,700 | Continental AG* | 890,308 | ||||||
| 12,100 | CSL, Ltd.* | 784,392 | ||||||
| 940,000 | CSPC Pharmaceutical Group, Ltd.* | 781,935 | ||||||
| Shares or Principal Amount | Value | |||||||
| 6,600 | Daetwyler Holding AG* | $ | 868,186 | |||||
| 37,150 | Deutsche Lufthansa AG* | 583,334 | ||||||
| 22,600 | Deutsche Post AG* | 720,376 | ||||||
| 50,000 | Dialog Semiconductor PLC†* | 1,396,045 | ||||||
| 10,700 | DMG Mori Seiki AG* | 300,526 | ||||||
| 147,368 | DNO ASA†* | 461,446 | ||||||
| 8,500 | Dollarama, Inc.** | 721,014 | ||||||
| 75,000 | Dragon Oil PLC* | 725,834 | ||||||
| 70,000 | Duksan Hi-Metal Co., Ltd.†* | 745,320 | ||||||
| 80,000 | Elekta AB, Class B*(b) | 786,344 | ||||||
| 49,650 | Essentra PLC* | 639,863 | ||||||
| 11,500 | Essilor International S.A.* | 1,261,178 | ||||||
| 1,602,000 | Ezion Holdings, Ltd.* | 2,269,340 | ||||||
| 2,779 | Feintool International Holding AG* | 232,290 | ||||||
| 26,000 | Freenet AG* | 674,156 | ||||||
| 23,100 | Fresenius SE & Co. KGaA* | 1,140,423 | ||||||
| 9,050 | Gerresheimer AG* | 585,463 | ||||||
| 24,000 | Getinge AB, Class B* | 602,577 | ||||||
| 10,458 | GFK SE* | 453,444 | ||||||
| 10,200 | Gildan Activewear, Inc.** | 558,020 | ||||||
| 18,889 | Grammer AG* | 726,975 | ||||||
| 132,000 | Gran Tierra Energy, Inc.†** | 729,568 | ||||||
| 18,600 | Grifols S.A.* | 760,105 | ||||||
| 13,500 | Hankook Tire Co., Ltd.* | 657,796 | ||||||
| 12,500 | Hexagon AB, Class B* | 395,255 | ||||||
| 24 | SCHEDULEOF INVESTMENTS |
Table of Contents
| Shares or Principal Amount | Value | |||||||
| 18,000 | Hikma Pharmaceuticals PLC* | $ | 504,275 | |||||
| 50,000 | Horizon North Logistics, Inc.**(b) | 226,796 | ||||||
| 52,000 | Husqvarna AB, Class B* | 366,623 | ||||||
| 79,000 | Hutchison Whampoa, Ltd.* | 954,999 | ||||||
| 123,000 | Infineon Technologies AG* | 1,266,031 | ||||||
| 10,357 | Ingenico* | 1,057,707 | ||||||
| 43,000 | Innox Corp.†* | 610,244 | ||||||
| 67,000 | Insurance Australia Group, Ltd.* | 359,077 | ||||||
| 330,000 | Intouch Holdings PCL* | 736,570 | ||||||
| 54,000 | James Hardie Industries PLC*(b) | 564,962 | ||||||
| 9,200 | Jardine Matheson Holdings, Ltd.* | 548,216 | ||||||
| 83,595 | Jenoptik AG* | 934,802 | ||||||
| 25,000 | Kakaku.com, Inc.*(b) | 355,096 | ||||||
| 40,000 | Keller Group PLC* | 568,649 | ||||||
| 440,000 | Kerry Logistics Network, Ltd.* | 686,509 | ||||||
| 11,000 | Kia Motors Corp.* | 558,679 | ||||||
| 19,500 | Kintetsu World Express, Inc.* | 743,596 | ||||||
| 38,300 | Koninklijke Philips NV* | 1,217,932 | ||||||
| 12,800 | Leoni AG* | 694,746 | ||||||
| 69,000 | Lindab International AB†* | 588,405 | ||||||
| 23,400 | Mazda Motor Corp.* | 588,615 | ||||||
| 900 | NAVER Corp.* | 687,489 | ||||||
| 300,000 | Nippon Steel & Sumitomo Metal Corp.* | 778,840 | ||||||
| 3,700 | Norbert Dentressangle S.A.** | 532,614 | ||||||
| 13,354 | Norma Group SE* | 556,494 | ||||||
| 19,000 | Perpetual, Ltd.* | 733,262 | ||||||
| 18,500 | Petrofac, Ltd.* | 309,987 | ||||||
| 81,000 | Petroleum Geo-Services ASA*(b) | 511,888 | ||||||
| Shares or Principal Amount | Value | |||||||
| 5,900 | Pfeiffer Vacuum Technology AG* | $ | 495,769 | |||||
| 33,228 | Plastic Omnium S.A.* | 793,399 | ||||||
| 141,000 | Platinum Asset Management, Ltd.* | 747,039 | ||||||
| 100,000 | Power Finance Corp., Ltd.* | 377,494 | ||||||
| 160,000 | Primary Health Care, Ltd.* | 611,286 | ||||||
| 17,100 | ProSiebenSat.1 Media AG* | 677,935 | ||||||
| 280,000 | PTT Global Chemical PCL* | 525,911 | ||||||
| 2,370 | Rational AG* | 704,427 | ||||||
| 16,300 | REA Group, Ltd.* | 616,568 | ||||||
| 49,000 | Recordati S.p.A.* | 801,401 | ||||||
| 31,000 | RIB Software AG* | 423,308 | ||||||
| 4,000 | Roche Holding AG* | 1,181,212 | ||||||
| 4,800 | Rockwool International AS, Class B* | 693,684 | ||||||
| 4,500 | RTL Group S.A.* | 385,448 | ||||||
| 17,765 | Rubis SCA* | 1,023,352 | ||||||
| 930 | Samsung Electronics Co., Ltd.* | 1,041,607 | ||||||
| 7,830 | Sanofi* | 885,343 | ||||||
| 66,200 | Santos, Ltd.* | 791,795 | ||||||
| 12,500 | Schneider Electric SE* | 959,030 | ||||||
| 22,000 | Seadrill, Ltd.*(b) | 587,805 | ||||||
| 10,350 | SHW AG* | 436,588 | ||||||
| 13,450 | Siemens AG* | 1,600,443 | ||||||
| 260 | Sika AG* | 898,995 | ||||||
| 16,900 | SKF AB, Class B* | 351,829 | ||||||
| 10,000 | Softbank Corp.* | 698,489 | ||||||
| 7,800 | Sopra Group S.A.* | 707,032 | ||||||
| 9,400 | Stada Arzneimittel AG* | 372,374 | ||||||
| 56,000 | Sun TV Network, Ltd.* | 306,211 | ||||||
| 28,900 | Svenska Cellulosa AB SCA, Class B* | 686,696 | ||||||
| 1,230 | Swatch Group AG* | 582,893 | ||||||
| 6,300 | Tecan Group AG*(b) | 661,272 | ||||||
| SCHEDULEOF INVESTMENTS | 25 |
Table of Contents
| Shares or Principal Amount | Value | |||||||
| 12,066 | Ted Baker PLC* | $ | 363,381 | |||||
| 35,000 | Tencent Holdings, Ltd.* | 519,949 | ||||||
| 23,350 | Travis Perkins PLC* | 627,358 | ||||||
| 33,000 | Trelleborg AB, Class B* | 570,340 | ||||||
| 62,000 | Truworths International, Ltd.* | 372,889 | ||||||
| 90,000 | Turkcell Iletisim Hizmetleri†* | 470,481 | ||||||
| 142,000 | UDG Healthcare PLC** | 761,513 | ||||||
| 31,786 | United Internet AG* | 1,349,580 | ||||||
| 6,000 | Valeant Pharmaceuticals International, Inc.†** | 786,196 | ||||||
| 2,600 | Volkswagen AG* | 537,212 | ||||||
| 37,200 | Wirecard AG* | 1,368,091 | ||||||
| 3,300 | XING AG* | 350,704 | ||||||
| 76,000 | Yahoo! Japan Corp.*(b) | 288,872 | ||||||
| 39,000 | Zodiac Aerospace* | 1,243,656 | ||||||
|
| |||||||
| | Total Common Stocks (Cost $97,436,808) | 88,292,769 | ||||||
| Shares or Principal Amount | Value | |||||||
| Preferred Stocks (1.2%) | ||||||||
| 8,700 | Biotest AG**(b) | $ | 882,819 | |||||
| 2,100 | Porsche Automobil Holding SE* | 167,523 | ||||||
|
| |||||||
| | Total Preferred Stocks (Cost $1,243,116) | 1,050,342 | ||||||
| Collateral for Securities on Loan (5.4%) | ||||||||
| 4,850,216 | State Street Navigator Prime Portfolio, 0.15% | 4,850,216 | ||||||
|
| |||||||
| | Total Collateral for Securities on Loan (Cost $4,850,216) | 4,850,216 | ||||||
| | Total Investments 105.8% (Cost $103,530,140) | 94,193,327 | ||||||
| | Liabilities Less Other Assets (5.8)% | (5,151,762 | ) | |||||
|
| |||||||
| Net Assets 100.0% | $ | 89,041,565 | ||||||
|
| |||||||
The accompanying notes are an integral part of the financial statements.
| † | Non-income producing security. |
| * | The value of foreign securities fair valued (Note 2) as of September 30, 2014 was 92.4% of net assets. |
| ** | This security is considered a Level 1 security. See Note 2 for further details. |
| *** | This security is considered a Level 3 security. See Note 2 for further details. |
| (a) | This security is considered to be illiquid. The value of this security at September 30, 2014 was $0, which represents 0.0% of the Fund’s Net Assets. |
| (b) | All or a portion of the security was on loan September 30, 2014. |
| 26 | SCHEDULEOF INVESTMENTS |
Table of Contents
(This page is intentionally left blank)
Table of Contents
STATEMENTSOF ASSETSAND LIABILITIES
SEPTEMBER 30, 2014
| ICON Emerging Markets Fund | ICON International Equity Fund | |||||||
Assets | ||||||||
Investments, at cost | $ | 10,130,007 | $ | 103,530,140 | ||||
|
|
|
| |||||
Investments, at value† | 9,922,538 | 94,193,327 | ||||||
Foreign currency, at value(a) | 70,978 | 495,465 | ||||||
Receivables: | ||||||||
Fund shares sold | 26 | 96,550 | ||||||
Investments sold | – | 688,195 | ||||||
Dividends | 27,727 | 86,455 | ||||||
Expense reimbursements due from Adviser | 44,369 | 7,125 | ||||||
Foreign tax reclaims | 3,567 | 49,115 | ||||||
Other assets | 12,423 | 21,258 | ||||||
|
|
|
| |||||
Total Assets | 10,081,628 | 95,637,490 | ||||||
|
|
|
| |||||
Liabilities | ||||||||
Payables: | ||||||||
Due to custodian bank | - | 1,577,186 | ||||||
Payable for collateral received on securities loaned | - | 4,850,216 | ||||||
Fund shares redeemed | 7,376 | 5,924 | ||||||
Advisory fees | 8,576 | 76,834 | ||||||
Accrued distribution fees | 685 | 4,926 | ||||||
Fund accounting fees | 366 | 2,507 | ||||||
Transfer agent fees | 5,553 | 10,915 | ||||||
Administration fees | 427 | 3,825 | ||||||
Trustee fees | 649 | 2,030 | ||||||
Capital gains tax | 428 | 4,052 | ||||||
Accrued expenses | 48,769 | 57,510 | ||||||
|
|
|
| |||||
Total Liabilities | 72,829 | 6,595,925 | ||||||
|
|
|
| |||||
Net Assets - all share classes | $ | 10,008,799 | $ | 89,041,565 | ||||
|
|
|
| |||||
Net Assets - Class S | $ | 8,941,257 | $ | 80,356,301 | ||||
|
|
|
| |||||
Net Assets - Class C | $ | 762,179 | $ | 4,596,701 | ||||
|
|
|
| |||||
Net Assets - Class A | $ | 305,363 | $ | 4,088,563 | ||||
|
|
|
| |||||
| 28 | FINANCIAL STATEMENTS |
Table of Contents
| ICON Emerging Markets Fund | ICON International Equity Fund | |||||||
Net Assets Consist of | ||||||||
Paid-in capital | $ | 17,713,202 | $ | 181,987,167 | ||||
Accumulated undistributed net investment income/(loss) | (18,814 | ) | 71,689 | |||||
Accumulated undistributed net realized gain/(loss) | (7,476,535 | ) | (83,669,440 | ) | ||||
Unrealized appreciation/(depreciation) | (209,054 | ) | (9,347,851 | ) | ||||
|
|
|
| |||||
Net Assets | $ | 10,008,799 | $ | 89,041,565 | ||||
|
|
|
| |||||
Shares outstanding (unlimited shares authorized, no par value) | ||||||||
Class S | 651,626 | 6,837,633 | ||||||
Class C | 57,810 | 428,892 | ||||||
Class A | 22,267 | 350,992 | ||||||
Net asset value (offering and redemption price per share) | ||||||||
Class S | $ | 13.72 | $ | 11.75 | ||||
Class C | $ | 13.18 | $ | 10.72 | ||||
Class A | $ | 13.71 | $ | 11.65 | ||||
Class A maximum offering price (100%/(100%-maximum sales charge)) of net asset value adjusted to the nearest cent per share | $ | 14.55 | $ | 12.36 | ||||
† Includes securities on loan of | $ | - | $ | 4,612,892 | ||||
(a) Foreign currency, at cost | $ | 71,707 | $ | 497,175 | ||||
The accompanying notes are an integral part of the financial statements.
| FINANCIAL STATEMENTS | 29 |
Table of Contents
STATEMENTSOF OPERATIONS
FORTHEYEARENDED SEPTEMBER 30, 2014
| ICON Emerging Markets Fund | ICON International Equity Fund | |||||||
Investment Income | ||||||||
Interest | $ | 233 | $ | 689 | ||||
Dividends | 375,431 | 1,315,262 | ||||||
Income from securities lending, net | 3,666 | 53,643 | ||||||
Foreign taxes withheld | (35,051 | ) | (132,868 | ) | ||||
|
|
|
| |||||
Total Investment Income | 344,279 | 1,236,726 | ||||||
|
|
|
| |||||
Expenses | ||||||||
Advisory fees | 202,838 | 670,042 | ||||||
Distribution fees: | ||||||||
Class C | 7,411 | 54,614 | ||||||
Class A | 1,219 | 12,618 | ||||||
Fund accounting fees | 4,172 | 13,608 | ||||||
Transfer agent fees | 38,827 | 72,226 | ||||||
Administration fees | 10,111 | 33,376 | ||||||
Custody fees | 16,687 | 31,968 | ||||||
Registration fees: | ||||||||
Class S | 15,679 | 10,665 | ||||||
Class C | 11,200 | 10,556 | ||||||
Class A | 9,453 | 10,574 | ||||||
Insurance expense | 4,146 | 7,007 | ||||||
Trustee fees and expenses | 2,865 | 6,629 | ||||||
Audit and tax service expense | 42,879 | 36,758 | ||||||
Interest expense | 30,773 | 7,441 | ||||||
Other expenses | 59,430 | 77,392 | ||||||
|
|
|
| |||||
Total expenses before expense reimbursement | 457,690 | 1,055,474 | ||||||
Expense reimbursement by Adviser due to expense limitation agreement | (68,831 | ) | (29,665 | ) | ||||
|
|
|
| |||||
Net Expenses | 388,859 | 1,025,809 | ||||||
|
|
|
| |||||
Net Investment Income/(Loss) | (44,580 | ) | 210,917 | |||||
|
|
|
| |||||
Net Realized and Unrealized Gain/(Loss) | ||||||||
Net realized gain/(loss) on: | ||||||||
Investments | 2,609,559 | 7,551,567 | ||||||
Foreign currency | (37,546 | ) | (271,659 | ) | ||||
Net realized capital gains tax | (52,013 | ) | (35,013 | ) | ||||
Change in unrealized net appreciation/(depreciation) on: | ||||||||
Investments and foreign currency | (2,445,367 | ) | (11,848,195 | ) | ||||
Net unrealized capital gains tax | 53,375 | 32,201 | ||||||
|
|
|
| |||||
Net realized and unrealized gain/(loss) | 128,008 | (4,571,099 | ) | |||||
|
|
|
| |||||
Net Increase/(Decrease) in Net Assets Resulting From Operations | $ | 83,428 | $ | (4,360,182 | ) | |||
|
|
|
| |||||
The accompanying notes are an integral part of the financial statements.
| 30 | FINANCIAL STATEMENTS |
Table of Contents
(This page is intentionally left blank)
Table of Contents
STATEMENTSOF CHANGESIN NET ASSETS
| ICON Emerging Markets Fund | ||||||||
| Year Ended September 30, 2014 | Year Ended September 30, 2013 | |||||||
Operations | ||||||||
Net investment income/(loss) | $ | (44,580 | ) | $ | 166,249 | |||
Net realized gain/(loss) | 2,609,559 | 1,463,941 | ||||||
Net realized gain/(loss) from foreign currency | (37,546 | ) | (71,832 | ) | ||||
Net realized capital gains tax | (52,013 | ) | (7,727 | ) | ||||
Change in net unrealized appreciation/(depreciation) | (2,391,992 | ) | 2,743,851 | |||||
|
|
|
| |||||
Net increase/(decrease) in net assets resulting from operations | 83,428 | 4,294,482 | ||||||
|
|
|
| |||||
Dividends and Distributions to Shareholders | ||||||||
Net investment income | ||||||||
Class S | (59,304 | ) | (268,567 | ) | ||||
Class C | - | (1,055 | ) | |||||
Class A | (1,490 | ) | (1,610 | ) | ||||
Return of Capital | ||||||||
Class S | - | - | ||||||
Class A | - | - | ||||||
|
|
|
| |||||
Net decrease from dividends and distributions | (60,794 | ) | (271,232 | ) | ||||
|
|
|
| |||||
Fund Share Transactions | ||||||||
Shares sold | ||||||||
Class S | 6,840,980 | 7,722,364 | ||||||
Class C | 123,445 | 382,870 | ||||||
Class A | 75,466 | 657,009 | ||||||
Reinvested dividends and distributions | ||||||||
Class S | 56,463 | 261,722 | ||||||
Class C | - | 983 | ||||||
Class A | 1,270 | 1,367 | ||||||
Shares repurchased | ||||||||
Class S | (27,023,177 | ) | (20,783,912 | ) | ||||
Class C | (198,478 | ) | (514,739 | ) | ||||
Class A | (562,635 | ) | (605,518 | ) | ||||
|
|
|
| |||||
Net increase/(decrease) from fund share transactions | (20,686,666 | ) | (12,877,854 | ) | ||||
|
|
|
| |||||
Total net increase/(decrease) in net assets | (20,664,032 | ) | (8,854,604 | ) | ||||
Net Assets | ||||||||
Beginning of year | 30,672,831 | 39,527,435 | ||||||
|
|
|
| |||||
End of year | $ | 10,008,799 | $ | 30,672,831 | ||||
|
|
|
| |||||
| 32 | FINANCIAL STATEMENTS |
Table of Contents
| ICON International Equity Fund | ||||||
Year Ended | Year Ended September 30, 2013 | |||||
| $ | 210,917 | $ | 308,378 | |||
| 7,551,567 | 2,688,672 | |||||
| (271,659 | ) | (330,659 | ) | |||
| (35,013 | ) | (62,403 | ) | |||
| (11,815,994 | ) | 1,946,719 | ||||
|
|
|
| |||
| (4,360,182 | ) | 4,550,707 | ||||
|
|
|
| |||
| - | (9,742 | ) | ||||
| - | - | |||||
| - | (252 | ) | ||||
| - | (223,901 | ) | ||||
| - | (5,798 | ) | ||||
|
|
|
| |||
| - | (239,693 | ) | ||||
|
|
|
| |||
| 54,955,281 | 9,502,457 | |||||
| 194,693 | 98,284 | |||||
| 353,579 | 474,307 | |||||
| - | 228,381 | |||||
| - | - | |||||
| - | 5,066 | |||||
| (12,360,031 | ) | (27,357,099 | ) | |||
| (1,233,291 | ) | (1,585,047 | ) | |||
| (1,312,960 | ) | (2,106,904 | ) | |||
|
|
|
| |||
| 40,597,271 | (20,740,555 | ) | ||||
|
|
|
| |||
| 36,237,089 | (16,429,541 | ) | ||||
| 52,804,476 | 69,234,017 | |||||
|
|
|
| |||
| $ | 89,041,565 | $ | 52,804,476 | |||
|
|
|
| |||
| FINANCIAL STATEMENTS | 33 |
Table of Contents
STATEMENTSOF CHANGESIN NET ASSETS (CONTINUED)
| ICON Emerging Markets Fund | ||||||||
| Year Ended September 30, 2014 | Year Ended September 30, 2013 | |||||||
Transactions in Fund Shares | ||||||||
Shares sold | ||||||||
Class S | 496,107 | 591,915 | ||||||
Class C | 9,218 | 31,082 | ||||||
Class A | 5,468 | �� | 47,998 | |||||
Reinvested dividends and distributions | ||||||||
Class S | 4,198 | 20,871 | ||||||
Class C | - | 81 | ||||||
Class A | 94 | 109 | ||||||
Shares repurchased | ||||||||
Class S | (1,998,939 | ) | (1,573,311 | ) | ||||
Class C | (15,076 | ) | (40,887 | ) | ||||
Class A | (41,663 | ) | (46,439 | ) | ||||
|
|
|
| |||||
Net increase/(decrease) | (1,540,593 | ) | (968,581 | ) | ||||
|
|
|
| |||||
Shares outstanding, beginning of year | 2,272,296 | 3,240,877 | ||||||
|
|
|
| |||||
Shares outstanding, end of year | 731,703 | 2,272,296 | ||||||
|
|
|
| |||||
Accumulated undistributed net investment income/(loss) | $ | (18,814 | ) | $ | 45,365 | |||
|
|
|
| |||||
The accompanying notes are an integral part of the financial statements.
| 34 | FINANCIAL STATEMENTS |
Table of Contents
| ICON International Equity Fund | ||||||
Year Ended | Year Ended September 30, 2013 | |||||
| 4,258,487 | 846,277 | |||||
| 16,869 | 9,335 | |||||
| 28,338 | 41,741 | |||||
| - | 20,247 | |||||
| - | - | |||||
| - | 450 | |||||
| (986,622 | ) | (2,383,691 | ) | |||
| (107,336 | ) | (150,212 | ) | |||
| (106,543 | ) | (186,779 | ) | |||
|
|
|
| |||
| 3,103,193 | (1,802,632 | ) | ||||
|
|
|
| |||
| 4,514,324 | 6,316,956 | |||||
|
|
|
| |||
| 7,617,517 | 4,514,324 | |||||
|
|
|
| |||
| $ | 71,689 | $ | 1,008 | |||
|
|
|
| |||
| FINANCIAL STATEMENTS | 35 |
Table of Contents
| Income/(loss) from investment operations | Less dividends and | |||||||||||||||||||||||
| Net asset value, beginning of period | Net investment income/ (loss)(x) | Net realized and unrealized gains/(losses) on investments | Total from investment operations | Dividends from net investment income | Distributions from net realized gains | |||||||||||||||||||
ICON Emerging Markets Fund | ||||||||||||||||||||||||
Class S | ||||||||||||||||||||||||
Year ended September 30, 2014 | $ | 13.51 | $ | (0.03 | ) | $ | 0.27 | $ | 0.24 | $ | (0.03 | ) | $ | - | ||||||||||
Year ended September 30, 2013 | 12.21 | 0.06 | 1.33 | 1.39 | (0.09 | ) | - | |||||||||||||||||
Year ended September 30, 2012 | 10.12 | 0.11 | 2.02 | 2.13 | (0.04 | ) | - | |||||||||||||||||
Year ended September 30, 2011 | 12.35 | 0.07 | (2.30 | ) | (2.23 | ) | – | - | ||||||||||||||||
Year ended September 30, 2010 | 10.64 | 0.01 | 1.89 | 1.90 | (0.19 | ) | - | |||||||||||||||||
Class C | ||||||||||||||||||||||||
Year ended September 30, 2014 | 13.06 | (0.11 | ) | 0.23 | 0.12 | – | - | |||||||||||||||||
Year ended September 30, 2013 | 11.84 | (0.05 | ) | 1.28 | 1.23 | (0.01 | ) | - | ||||||||||||||||
Year ended September 30, 2012 | 9.88 | 0.01 | 1.95 | 1.96 | – | - | ||||||||||||||||||
Year ended September 30, 2011 | 12.17 | (0.02 | ) | (2.27 | ) | (2.29 | ) | – | - | |||||||||||||||
Year ended September 30, 2010 | 10.54 | (0.05 | ) | 1.82 | 1.77 | (0.14 | ) | - | ||||||||||||||||
Class A | ||||||||||||||||||||||||
Year ended September 30, 2014 | 13.51 | (0.04 | ) | 0.27 | 0.23 | (0.03 | ) | - | ||||||||||||||||
Year ended September 30, 2013 | 12.17 | 0.04 | 1.33 | 1.37 | (0.03 | ) | - | |||||||||||||||||
Year ended September 30, 2012 | 10.10 | 0.09 | 2.00 | 2.09 | (0.02 | ) | - | |||||||||||||||||
Year ended September 30, 2011 | 12.35 | 0.04 | (2.29 | ) | (2.25 | ) | – | - | ||||||||||||||||
Year ended September 30, 2010 | 10.63 | 0.02 | 1.86 | 1.88 | (0.16 | ) | - | |||||||||||||||||
| 36 | FINANCIAL HIGHLIGHTS |
Table of Contents
| distributions | Ratio of expenses to average net assets | Ratio of net investment income/(loss) to average net assets | ||||||||||||||||||||||||||||||||
| Total dividends and distributions | Net asset value, end of period | Total return* | Net assets, end of period (in thousands) | Before expense limitation/ recoupment and transfer agent earnings credits | After expense limitation/ recoupment and transfer agent earnings credits | Before expense limitation/ recoupment and transfer agent earnings credits | After expense limitation/ recoupment and transfer agent earnings credits | Portfolio turnover rate(a) | ||||||||||||||||||||||||||
| $ | (0.03 | ) | $ | 13.72 | 1.78 | % | $ | 8,942 | 2.11 | % | 1.88 | %(d) | (0.42 | )% | (0.19 | )% | 92.17 | % | ||||||||||||||||
| (0.09 | ) | 13.51 | 11.44 | % | 29,053 | 1.64 | % | 1.64 | % | 0.46 | % | 0.46 | % | 59.98 | % | |||||||||||||||||||
| (0.04 | ) | 12.21 | 21.16 | % | 37,969 | 1.50 | % | 1.50 | % | 0.96 | % | 0.96 | % | 71.84 | % | |||||||||||||||||||
| - | 10.12 | (18.06 | )% | 55,637 | 1.59 | % | 1.59 | % | 0.55 | % | 0.55 | % | 71.03 | % | ||||||||||||||||||||
| (0.19 | ) | 12.35 | 18.02 | % | 70,854 | 1.63 | % | 1.63 | % | 0.13 | % | 0.13 | % | 100.41 | % | |||||||||||||||||||
| - | 13.18 | 0.92 | % | 762 | 4.65 | % | 2.78 | %(b) | (2.70 | )% | (0.83 | )% | 92.17 | % | ||||||||||||||||||||
| (0.01 | ) | 13.06 | 10.44 | % | 832 | 3.76 | % | 2.56 | %(b) | (1.63 | )% | (0.43 | )% | 59.98 | % | |||||||||||||||||||
| - | 11.84 | 19.84 | % | 869 | 3.91 | % | 2.55 | %(b) | (1.28 | )% | 0.08 | % | 71.84 | % | ||||||||||||||||||||
| - | 9.88 | (18.82 | )% | 792 | 4.40 | % | 2.55 | %(b) | (2.02 | )% | (0.17 | )% | 71.03 | % | ||||||||||||||||||||
| (0.14 | ) | 12.17 | 17.02 | % | 441 | 9.04 | % | 2.57 | %(b) | (6.91 | )% | (0.44 | )% | 100.41 | % | |||||||||||||||||||
| (0.03 | ) | 13.71 | 1.68 | % | 305 | 4.32 | % | 1.95 | %(b) | (2.65 | )% | (0.28 | )% | 92.17 | % | |||||||||||||||||||
| (0.03 | ) | 13.51 | 11.29 | % | 789 | 2.97 | % | 1.81 | %(b) | (0.82 | )% | 0.34 | % | 59.98 | % | |||||||||||||||||||
| (0.02 | ) | 12.17 | 20.73 | % | 690 | 2.88 | % | 1.80 | %(b) | (0.31 | )% | 0.77 | % | 71.84 | % | |||||||||||||||||||
| - | 10.10 | (18.22 | )% | 768 | 3.05 | % | 1.81 | %(b) | (0.97 | )% | 0.27 | % | 71.03 | % | ||||||||||||||||||||
| (0.16 | ) | 12.35 | 17.91 | % | 1,149 | 5.17 | % | 1.82 | %(b) | (3.13 | )% | 0.22 | % | 100.41 | % | |||||||||||||||||||
| FINANCIAL HIGHLIGHTS | 37 |
Table of Contents
FINANCIAL HIGHLIGHTS (CONTINUED)
| Income/(loss) from investment operations | Less dividends and | |||||||||||||||||||||||
| Net asset value, beginning of period | Net investment income/ (loss)(x) | Net realized and unrealized gains/(losses) on investments | Total from investment operations | Dividends from net investment income | Distributions from Return of Capital | |||||||||||||||||||
ICON International Equity Fund | ||||||||||||||||||||||||
Class S** | ||||||||||||||||||||||||
Year ended September 30, 2014 | $ | 11.81 | $ | 0.06 | $ | (0.12 | ) | $ | (0.06 | ) | $ | - | $ | - | ||||||||||
Year ended September 30, 2013 | 11.05 | 0.07 | 0.74 | 0.81 | - | (c) | (0.05 | ) | ||||||||||||||||
Year ended September 30, 2012 | 9.22 | 0.16 | 1.78 | 1.94 | (0.11 | ) | - | |||||||||||||||||
Year ended September 30, 2011 | 12.11 | 0.14 | (2.95 | ) | (2.81 | ) | (0.08 | ) | - | |||||||||||||||
Year ended September 30, 2010 | 11.13 | 0.13 | 1.06 | 1.19 | (0.21 | ) | - | |||||||||||||||||
Class C | ||||||||||||||||||||||||
Year ended September 30, 2014 | 10.89 | (0.08 | ) | (0.09 | ) | (0.17 | ) | - | - | |||||||||||||||
Year ended September 30, 2013 | 10.26 | (0.04 | ) | 0.67 | 0.63 | - | - | |||||||||||||||||
Year ended September 30, 2012 | 8.56 | (0.02 | ) | 1.72 | 1.70 | - | - | |||||||||||||||||
Year ended September 30, 2011 | 11.30 | - | (c) | (2.74 | ) | (2.74 | ) | - | - | |||||||||||||||
Year ended September 30, 2010 | 10.40 | (0.01 | ) | 1.01 | 1.00 | (0.10 | ) | - | ||||||||||||||||
Class A*** | ||||||||||||||||||||||||
Year ended September 30, 2014 | 11.75 | - | (c) | (0.10 | ) | (0.10 | ) | - | - | |||||||||||||||
Year ended September 30, 2013 | 10.99 | 0.04 | 0.73 | 0.77 | - | (c) | (0.01 | ) | ||||||||||||||||
Year ended September 30, 2012 | 9.16 | 0.11 | 1.77 | 1.88 | (0.05 | ) | - | |||||||||||||||||
Year ended September 30, 2011 | 12.04 | 0.10 | (2.94 | ) | (2.84 | ) | (0.04 | ) | - | |||||||||||||||
Year ended September 30, 2010 | 11.07 | 0.08 | 1.06 | 1.14 | (0.17 | ) | - | |||||||||||||||||
| (x) | Calculated using the average shares method. |
| * | The total return calculation is for the period indicated and excludes any sales charges. |
| ** | Class S shares were formerly named Class Z shares prior to January 23, 2012. |
| *** | Class I shares merged into Class A on January 23, 2012. The results of each class prior to the merger may have been different than what is presented. |
| (a) | Portfolio turnover is calculated at the Fund level and is not annualized for periods less than a year. |
| (b) | The Fund’s operating expenses, not including interest expense, are contractually limited to the amounts discussed in Note 3. The ratios in these financial highlights reflect the limitation, including the interest expense. |
| (c) | Amount less than $0.005. |
| (d) | Effective May, 5, 2014, Class S’s operating expenses, not including interest expense, were contractually limited to the amounts discussed in Note 3. The ratios in these financial highlights reflect the limitation, including the interest expense. |
The accompanying notes are an integral part of the financial statements.
| 38 | FINANCIAL HIGHLIGHTS |
Table of Contents
| distributions | Ratio of expenses to average net assets | Ratio of net investment income/(loss) to average net assets | ||||||||||||||||||||||||||||||||
| Total dividends and distributions | Net asset value, end of period | Total return* | Net assets, end of period (in thousands) | Before expense limitation/ recoupment and transfer agent earnings credits | After expense limitation/ recoupment and transfer agent earnings credits(b) | Before expense limitation/ recoupment and transfer agent earnings credits | After expense limitation/ recoupment and transfer agent earnings credits | Portfolio turnover rate(a) | ||||||||||||||||||||||||||
| $ | - | $ | 11.75 | (0.51 | )% | $ | 80,356 | 1.41 | % | 1.41 | % | 0.44 | % | 0.44 | % | 192.93 | % | |||||||||||||||||
| (0.05 | ) | 11.81 | 7.33 | % | 42,105 | 1.45 | % | 1.45 | % | 0.65 | % | 0.65 | % | 137.83 | % | |||||||||||||||||||
| (0.11 | ) | 11.05 | 21.19 | % | 56,152 | 1.39 | % | 1.39 | % | 1.47 | % | 1.47 | % | 121.82 | % | |||||||||||||||||||
| (0.08 | ) | 9.22 | (23.38 | )% | 6,826 | 1.45 | % | 1.45 | % | 1.12 | % | 1.12 | % | 91.46 | % | |||||||||||||||||||
| (0.21 | ) | 12.11 | 10.87 | % | 12,806 | 1.43 | % | 1.36 | % | 1.06 | % | 1.12 | % | 111.29 | % | |||||||||||||||||||
| - | 10.72 | (1.56 | )% | 4,597 | 2.82 | % | 2.56 | % | (0.99 | )% | (0.73 | )% | 192.93 | % | ||||||||||||||||||||
| - | 10.89 | 6.14 | % | 5,657 | 2.77 | % | 2.56 | % | (0.63 | )% | (0.42 | )% | 137.83 | % | ||||||||||||||||||||
| - | 10.26 | 19.86 | % | 6,773 | 2.72 | % | 2.55 | % | (0.41 | )% | (0.24 | )% | 121.82 | % | ||||||||||||||||||||
| - | 8.56 | (24.25 | )% | 8,050 | 2.64 | % | 2.55 | % | (0.11 | )% | (0.02 | )% | 91.46 | % | ||||||||||||||||||||
| (0.10 | ) | 11.30 | 9.65 | % | 13,990 | 2.69 | % | 2.55 | % | (0.21 | )% | (0.07 | )% | 111.29 | % | |||||||||||||||||||
| - | 11.65 | (0.85 | )% | 4,089 | 2.12 | % | 1.81 | % | (0.27 | )% | 0.04 | % | 192.93 | % | ||||||||||||||||||||
| (0.01 | ) | 11.75 | 7.03 | % | 5,043 | 2.19 | % | 1.81 | % | (0.06 | )% | 0.32 | % | 137.83 | % | |||||||||||||||||||
| (0.05 | ) | 10.99 | 20.61 | % | 6,309 | 2.01 | % | 1.80 | % | 0.85 | % | 1.06 | % | 121.82 | % | |||||||||||||||||||
| (0.04 | ) | 9.16 | (23.65 | )% | 2,640 | 2.03 | % | 1.80 | % | 0.56 | % | 0.79 | % | 91.46 | % | |||||||||||||||||||
| (0.17 | ) | 12.04 | 10.38 | % | 5,358 | 2.16 | % | 1.80 | % | 0.33 | % | 0.68 | % | 111.29 | % | |||||||||||||||||||
| FINANCIAL HIGHLIGHTS | 39 |
Table of Contents
SEPTEMBER 30, 2014
1. Organization
The ICON Emerging Markets Fund (“Emerging Markets Fund”) and ICON International Equity Fund (“International Equity Fund”) are series funds (individually a “Fund” and collectively, the “Funds”). The Funds are part of the ICON Funds (the “Trust”), a Massachusetts business trust registered under the Investment Company Act of 1940, as amended (the “1940 Act”) as an open-end investment management company. Each Fund offers three classes of shares: Class S, Class C and Class A. All classes have equal rights as to earnings, assets and voting privileges except that each Class may bear different distribution fees, registration costs, legal costs, mailing and printing costs and shareholder servicing costs and each Class has exclusive voting rights with respect to its distribution plan. There are currently fifteen other active Funds within the Trust. Those Funds are covered by separate prospectuses and shareholder reports.
Each Fund is authorized to issue an unlimited number of no par shares. The Funds primarily invest in foreign securities; the Emerging Markets Fund primarily invests in securities of issuers whose principal activities are in emerging market, or are economically tied to an emerging market country. The investment objective of each Fund is to provide long-term capital appreciation.
The Funds may have elements of risk, including the risk of loss of principal. There is no assurance that the investment process will consistently lead to successful results. An investment concentrated in sectors and industries may involve greater risk and volatility than a more diversified investment. Investments in foreign securities and currency transactions may involve certain considerations and risks not typically associated with those of U.S. dollar-denominated transactions as a result of, among other factors, the possibility of less government supervision and regulation of foreign securities markets and the possibility of political or economic instability. Financial statements of foreign companies are governed by different accounting, auditing, and financial standards than U.S. companies and may be less transparent and uniform than in the United States. Many corporate governance standards, which help ensure the integrity of public information in the United States, may not exist in some foreign countries. In general, there may be less governmental supervision of foreign stock exchanges and securities brokers and issuers. There are also risks associated with small-and mid-cap investing, including limited product lines, less liquidity, and small market share. Securities of emerging or developing market companies may
| 40 | NOTESTO FINANCIAL STATEMENTS |
Table of Contents
be less liquid and more volatile than securities in countries with more mature markets.
The International Equity Fund has a significant weighting in Germany which may cause the Fund’s performance to be susceptible to the economic, business and/or other developments that may affect that country.
In the normal course of business, the Funds may enter into various agreements that provide for general indemnifications. Each Fund’s maximum exposure under these arrangements is unknown as any potential exposure involving future claims that may be made against each Fund is unknown. However, based on experience, the Funds expect the risk of loss to be remote.
2. Significant Accounting Policies
The following is a summary of significant accounting policies consistently followed by the Funds in the preparation of their financial statements. The preparation of financial statements in conformity with accounting principles generally accepted in the United States of America requires management to make certain estimates and assumptions that affect the reported amounts of assets and liabilities, disclosure of contingent assets and liabilities at the date of the financial statements, and the reported amounts of income and expenses during the reporting period. Actual results may differ from these estimates.
Investment Valuation
The Funds’ securities and other assets, excluding options on securities indexes, are valued at the closing price as of the close of regular trading on the New York Stock Exchange (the “NYSE”) (normally 4 p.m. Eastern Standard Time) each day the NYSE is open, except that securities traded primarily on the NASDAQ Stock Market (“NASDAQ”) are normally valued by the Funds at the NASDAQ Official Closing Price provided by NASDAQ each business day. Options on securities indexes are valued at the close of the Chicago Board Options Exchange (normally 4:15 p.m. Eastern Standard Time) on each day the New York Stock Exchange is open for trading.
The Funds use pricing services to obtain the market value of securities in their portfolios; if a pricing service is not able to provide a price, or the pricing service’s valuation is considered inaccurate or does not in the Funds’ judgment reflect the market value of the security, prices may be obtained
| NOTESTO FINANCIAL STATEMENTS | 41 |
Table of Contents
NOTESTO FINANCIAL STATEMENTS (CONTINUED)
through market quotations from independent broker/dealers. If market quotations from these sources are not readily available, the Funds’ securities or other assets are valued at fair value as determined in good faith by the Funds’ Board of Trustees (“Board”) or pursuant to procedures approved by the Board.
Lacking any sales that day, a security is valued at the current closing bid price (or yield equivalent thereof) or based on quotes obtained from dealers making a market for the security. Options are valued at their closing mid-price on the market with the most volume. Mid-price is the average of the closing bid and closing ask prices. Debt securities with a remaining maturity of greater than 60 days are valued using the evaluated bid price supplied by the pricing service. The evaluated bid price supplied by the pricing service is based upon a matrix valuation system which considers such factors as security prices, yields, maturities and ratings. Short-term debt securities with remaining maturities of 60 days or less are generally valued at amortized cost or original cost plus accrued interest, which approximates market value. Currency rates as of the close of the NYSE are used to convert foreign security values into U.S. dollars.
Securities of investment companies that trade on an exchange are valued at the last sales price or official closing price as of the close of the customary trading session on the exchange where the security is principally traded. Investments in shares of funds that are not traded on an exchange are valued at the end of day net asset value per share of such fund. Securities in the underlying funds, including restricted securities are valued in accordance with the valuation policy of such fund.
The Funds’ securities traded in countries outside of the Western Hemisphere are fair valued daily by utilizing the quotations of an independent pricing service, unless the Board determines that use of another valuation methodology is appropriate. The purposes of daily fair valuation are to avoid stale prices and to take into account, among other things, any significant events occurring after the close of foreign markets. The pricing service uses statistical analyses and quantitative models to adjust local market prices using factors such as subsequent movements and changes in the prices of indexes, securities and exchange rates in other markets to determine fair value as of the time a Fund calculates its net asset value (“NAV”). The valuation assigned to fair-value securities for purposes of calculating a Fund’s NAV may differ from the security’s most recent closing market price and from the prices used by other mutual funds to calculate their NAVs.
| 42 | NOTESTO FINANCIAL STATEMENTS |
Table of Contents
Various inputs are used to determine the value of the Funds’ investments. These inputs are summarized in the three broad levels listed below:
Level 1 — quoted prices in active markets for identical securities.
Level 2 — significant observable inputs other than Level 1quoted prices (including, but not limited to, quoted prices for similar securities, interest rates, prepayment speeds, and credit risk).
Level 3 — significant unobservable inputs.
Observable inputs are those based on market data obtained from sources independent of the Funds, and unobservable inputs reflect the Funds’ own assumptions based on the best information available. The input levels are not necessarily an indication of the risk or liquidity associated with investments at that level. For example, non-U.S. equity securities actively traded in foreign markets may be reflected in Level 2 despite the availability of closing prices, because the Funds evaluate and determine whether those closing prices reflect fair value at the close of the NYSE or require adjustment, as described above. The following table summarizes the Funds’ investments, based on the inputs used to determine their values on September 30, 2014:
| Level 1 | Level 2 | Level 3 | Total | |||||||||||||
ICON Emerging Markets Fund* | ||||||||||||||||
Assets | ||||||||||||||||
Common Stocks | ||||||||||||||||
South Korea | $ | - | $ | 2,232,593 | $ | - | $ | 2,232,593 | ||||||||
India | - | 1,522,495 | - | 1,522,495 | ||||||||||||
China | - | 1,114,627 | - | 1,114,627 | ||||||||||||
Hong Kong | - | 785,405 | 0 | ** | 785,405 | |||||||||||
Malaysia | - | 533,910 | - | 533,910 | ||||||||||||
Other Countries | 475,165 | 1,172,546 | - | 1,647,711 | ||||||||||||
Preferred Stock | ||||||||||||||||
Brazil | 172,965 | - | - | 172,965 | ||||||||||||
Short-Term Investments | - | 1,912,832 | - | 1,912,832 | ||||||||||||
|
|
|
|
|
|
|
| |||||||||
Total | $ | 648,130 | $ | 9,274,408 | $ | 0 | $ | 9,922,538 | ||||||||
|
|
|
|
|
|
|
| |||||||||
| NOTESTO FINANCIAL STATEMENTS | 43 |
Table of Contents
NOTESTO FINANCIAL STATEMENTS (CONTINUED)
| Level 1 | Level 2 | Level 3 | Total | |||||||||||||
ICON International Equity Fund* | ||||||||||||||||
Assets | ||||||||||||||||
Common Stocks | ||||||||||||||||
Germany | $ | - | $ | 22,750,143 | $ | - | $ | 22,750,143 | ||||||||
France | 532,614 | 12,565,977 | - | 13,098,591 | ||||||||||||
United Kingdom | 705,946 | 7,246,634 | - | 7,952,580 | ||||||||||||
Sweden | - | 4,765,242 | - | 4,765,242 | ||||||||||||
Australia | - | 4,643,419 | - | 4,643,419 | ||||||||||||
Other Countries | 4,960,874 | 30,121,920 | 0 | ** | 35,082,794 | |||||||||||
Preferred Stocks | ||||||||||||||||
Germany | 882,819 | 167,523 | - | 1,050,342 | ||||||||||||
Collateral for Securities on Loan | - | 4,850,216 | - | 4,850,216 | ||||||||||||
|
|
|
|
|
|
|
| |||||||||
Total | $ | 7,082,253 | $ | 87,111,074 | $ | 0 | $ | 94,193,327 | ||||||||
|
|
|
|
|
|
|
| |||||||||
| * | Please refer to the Schedule of Investments and the Sector/Industry Classification and Country Composition tables for additional security details. |
| ** | Chaoda Modern Agriculture Holdings, Ltd. is illiquid and valued with a zero market value for the year ended September 30, 2014. |
There were no significant Level 3 securities held in any of the Funds at September 30, 2014.
For the ICON Emerging Markets Fund, there was no significant transfer activity between Level 1 and Level 2.
For the ICON International Equity Fund, common stocks valued at $705,946 were transferred from Level 2 to Level 1 during the year ended September 30, 2014. At September 30, 2013, these securities were valued using quoted market prices in active markets with fair value adjustment factors; at September 30, 2014, these securities were valued using quoted market prices in active markets without using fair value adjustment factors.
The end of year timing recognition is used for the transfers between levels of the Fund’s assets and liabilities.
| 44 | NOTESTO FINANCIAL STATEMENTS |
Table of Contents
A roll forward of fair value measurements using significant unobservable inputs (Level 3) for the Year ended September 30, 2014 for the Emerging Markets Fund and the International Equity Fund, is as follows:
| Common Stocks Hong Kong | ||||
ICON Emerging Markets Fund | ||||
Beginning balance 9/30/13 | $ | 0 | * | |
Purchases | - | |||
Sales | - | |||
Accrued discounts/(premiums) | - | |||
Total realized gains/(losses) | - | |||
Total change in unrealized appreciation/(depreciation) | - | |||
Transfers in to Level 3 | - | |||
Transfers out of Level 3 | - | |||
|
| |||
Ending balance 9/30/14 | $ | 0 | * | |
|
| |||
Net change in unrealized appreciation/(depreciation) on investments held at 9/30/14 | $ | - | ||
|
| |||
ICON International Equity Fund | ||||
Beginning balance 9/30/13 | $ | 0 | * | |
Purchases | - | |||
Sales | - | |||
Accrued discounts/(premiums) | - | |||
Total realized gains/(losses) | - | |||
Total change in unrealized appreciation/(depreciation) | - | |||
Transfers in to Level 3 | - | |||
Transfers out of Level 3 | - | |||
|
| |||
Ending balance 9/30/14 | $ | 0 | * | |
|
| |||
Net change in unrealized appreciation/(depreciation) on investments held at 9/30/14 | $ | - | ||
|
| |||
| * | Chaoda Modern Agriculture Holdings, Ltd. is illiquid and valued with a zero market value for the year ended September 30, 2014. |
Fund Share Valuation
Fund shares are sold and redeemed on a daily basis at net asset value. Net asset value per share is determined daily as of the close of trading on the NYSE on each day the NYSE is open for trading by dividing the total value of the Fund’s investments and other assets, less liabilities, by the number of Fund shares outstanding.
| NOTESTO FINANCIAL STATEMENTS | 45 |
Table of Contents
NOTESTO FINANCIAL STATEMENTS (CONTINUED)
Foreign Currency Translation
The accounting records of the Funds are maintained in U.S. dollars. Investment securities and other assets and liabilities denominated in a foreign currency are translated daily into U.S. dollars at the prevailing rates of exchange. Income and expenses are translated into U.S. dollars at the prevailing exchange rate on the respective dates of the transactions. Purchases and sales of securities are translated into U.S. dollars at the contractual currency exchange rates established at the time of each trade.
The Funds do not isolate that portion of the results of operations resulting from changes in foreign exchange rates on investments from the fluctuations arising from changes in market prices of securities held. Net unrealized appreciation or depreciation on investments and foreign currency translations arise from changes in the value of assets and liabilities, resulting from changes in the exchange rates and changes in market prices of securities held.
Forward Foreign Currency Contracts
The Funds may enter into short-term forward foreign currency contracts. A forward foreign currency contract is an agreement between contracting parties to exchange an amount of currency at some future time at an agreed upon rate. The Funds use forward foreign currency contracts to manage foreign currency exposure with respect to transactional hedging, positional hedging, cross hedging and proxy hedging.
These contracts involve market risk and do not eliminate fluctuations in the prices of portfolio securities or prevent losses if the prices of those securities decline. The Funds could be exposed to risk if the value of the currency changes unfavorably. Additionally, the Funds could be exposed to counterparty risk if the counterparties are unable to meet the terms of the contracts.
These contracts are marked-to-market daily. Net realized gains and losses on foreign currency transactions represent disposition of foreign currencies, and the difference between the amount recorded at the time of the transaction and the U.S. dollar amount actually received. Any realized gain or loss incurred by the Funds due to foreign currency translation is included on the Statement of Operations. At September 30, 2014, the Emerging Markets Fund and International Equity Fund had no outstanding forward foreign currency contracts.
| 46 | NOTESTO FINANCIAL STATEMENTS |
Table of Contents
Securities Lending
Under procedures adopted by the Board, the Funds may lend securities to certain approved brokers, dealers and other financial institutions to earn additional income. The Funds retain certain benefits of owning the securities, including receipt of dividends or interest generated by the security, but give up other rights including the right to vote proxies. The Funds retain the ability to recall the loans at any time and could do so in order to vote proxies or to sell the loaned securities. Each loan is collateralized by cash that generally exceeds the value of the securities on loan. The market value of the loaned securities is determined daily at the close of business of the Funds and any additional required collateral is delivered to each Fund on the next business day.
Generally, in the event of borrower default, the Funds have the right to use the collateral to offset any losses incurred. In the event the Funds are delayed or prevented from exercising their rights to dispose of the collateral, there may be a potential loss to the Funds. Some of these losses may be indemnified by the lending agent.
The Funds have elected to invest the cash collateral in the State Street Navigator Prime Portfolio which is disclosed on the Schedule of Investments. The Funds bear the risk of loss with respect to the investment of collateral. The net securities lending income earned by the Funds for the year ended September 30, 2014, is included in the Statement of Operations.
For the year ended September 30, 2014, the following Funds had securities with the following values on loan:
| Fund | Loaned Securities | Collateral | ||||||
ICON International Equity Fund | $ | 4,612,892 | $ | 4,850,216 | ||||
The value of the collateral above could include collateral held for securities that were sold on or before September 30, 2014. It may also include collateral received from the pre-funding of security loans.
Income Taxes, Dividends, and Distributions
The Funds intend to continue to qualify as regulated investment companies under Subchapter M of the Internal Revenue Code and, accordingly, the Funds will generally not be subject to federal and state income taxes or federal excise taxes to the extent that they intend to make sufficient distributions of net investment income and net realized capital gains.
| NOTESTO FINANCIAL STATEMENTS | 47 |
Table of Contents
NOTESTO FINANCIAL STATEMENTS (CONTINUED)
Dividends paid by the Funds from net investment income and distributions of net realized short-term gains are, for federal income tax purposes, taxable as ordinary income to shareholders.
Dividends and distributions to shareholders are recorded by the Funds on the ex-dividend/distribution date. The Funds distribute income and net realized capital gains, if any, to shareholders at least annually, if not offset by capital loss carryforward. The Funds may utilize equalization accounting for tax purposes and designate earnings and profits, including net realized gains distributed to shareholders on redemption of shares, as part of the dividends paid deduction for income tax purposes. Income distributions and capital gain distributions are determined in accordance with income tax regulations, which may differ from accounting principles generally accepted in the United States of America.
Management has analyzed the Funds’ tax positions taken on federal income tax returns for all open tax years and has concluded that no provision for federal income tax is required in the Funds’ financial statements.
The Funds file U.S. tax returns. While the statute of limitations remains open to examine the Funds’ U.S. tax returns filed for the past three years, no examinations are in progress or anticipated at this time. The Funds are not aware of any tax positions for which it is reasonably possible that the total amounts of unrecognized tax benefits will significantly change in the next twelve months.
Certain foreign countries impose a capital gains tax which is accrued by the Funds based on the unrealized appreciation, if any, on affected securities. Any accrual would reduce a Fund’s NAV. The tax is paid when the gain is realized.
Investment Income
Dividend income is recorded on the ex-dividend date. Non-cash dividends included in dividend income, if any, are recorded at the fair value of the securities received. Interest income is accrued as earned. Certain dividends from foreign securities are recorded as soon as the Funds are informed of the dividend if such information is obtained subsequent to the ex-dividend date. Discounts and premiums on fixed income securities purchased are accreted or amortized to income over the life of the respective securities.
| 48 | NOTESTO FINANCIAL STATEMENTS |
Table of Contents
Investment Transactions
Security transactions are accounted for no later than one business day after the trade date. However, for financial reporting purposes, security transactions are accounted for on the trade date. Gains and losses on securities sold are determined on the basis of identified cost.
Allocation of Expenses
Each class of a Fund’s shares bears expenses incurred specifically on its behalf and, in addition, each class bears a portion of general expenses, based upon relative net assets of each class. Expenses which cannot be directly attributed to a specific Fund in the Trust are apportioned between all Funds in the Trust based upon relative net assets. In calculating the net asset value per share of each class, investment income, realized and unrealized gains and losses and expenses other than class-specific expenses are allocated daily to each class of shares based upon the proportion of net assets.
Below are the class level expenses that are included on the Statement of Operations:
| Fund | Legal Expense | Printing and Postage Expense | Transfer Agent Expense | |||||||||
ICON Emerging Markets Fund | ||||||||||||
Class S | $ | 3,044 | $ | 17,611 | $ | 36,159 | ||||||
Class C | 179 | 268 | 1,423 | |||||||||
Class A | 89 | 563 | 1,246 | |||||||||
ICON International Equity Fund | ||||||||||||
Class S | 6,700 | 13,789 | 42,158 | |||||||||
Class C | 521 | 2,897 | 15,358 | |||||||||
Class A | 482 | 3,843 | 14,710 | |||||||||
3. Fees and Other Transactions with Affiliates
Investment Advisory Fees
ICON Advisers, Inc. (“ICON Advisers”) serves as investment adviser to the Funds and is responsible for managing the Funds’ portfolios of securities. ICON Advisers receives a monthly management fee that is computed daily at an annual rate of 1.00% of each Fund’s average daily net assets.
| NOTESTO FINANCIAL STATEMENTS | 49 |
Table of Contents
NOTESTO FINANCIAL STATEMENTS (CONTINUED)
ICON Advisers has contractually agreed to limit the Funds’ operating expenses (exclusive of brokerage, interest, taxes, and extraordinary expenses) to the extent necessary to ensure that the Funds’ expenses do not exceed the following amounts:
| Fund | Class S | Class C | Class A | |||||||||
ICON Emerging Markets Fund | 1.55% | 2.55% | 1.80% | |||||||||
ICON International Equity Fund | 1.55% | 2.55% | 1.80% | |||||||||
The Funds’ expense limitations will continue in effect until at least January 31, 2021 for Class C, Class A and International Equity Fund Class S. Effective May 5, 2014, ICON Advisors has contractually agreed to limit the total expenses of the Emerging Markets Fund Class S shares to an annual rate of 1.55% in effect until at least January 31, 2016. To the extent ICON Advisers reimburses or absorbs fees and expenses, it may seek payment of such amounts for up to three years after the expenses were reimbursed or absorbed. A Fund will make no such payment, however, if the total Fund operating expenses exceed the expense limits in effect at the time the expenses were reimbursed or at the time these payments are proposed.
As of September 30, 2014 the following amounts were available for recoupment by ICON Advisers based upon their potential expiration dates:
| Fund | 2015 | 2016 | 2017 | |||||||||
ICON Emerging Markets Fund | $ | 22,319 | $ | 18,421 | $ | 62,550 | ||||||
ICON International Equity Fund | 25,950 | 33,867 | 29,665 | |||||||||
Accounting, Custody and Transfer Agent Fees
State Street Bank and Trust Company (“State Street”) serves as the fund accounting agent for the Funds. For its services, the Trust pays State Street a fee that is calculated daily and paid monthly at an annual rate based on the aggregate average daily net assets of the Trust.
State Street is the custodian of the Trust’s investments. For its services, the Trust pays State Street asset-based fees that vary according to the number of positions and transactions, plus out-of-pocket expenses.
Boston Financial Data Services, Inc. (“BFDS”) is the Trust’s transfer agent. For these services, the Trust pays a per account fee, plus certain other transaction Cusip charges and out-of-pocket expenses. BFDS may pay each Fund transfer agent earnings credits. Transfer agent earnings credits are credits received for interest which results from overnight balances used by BFDS for clearing shareholder transactions.
| 50 | NOTESTO FINANCIAL STATEMENTS |
Table of Contents
Administrative Services
The Trust has entered into an administrative services agreement with ICON Advisers pursuant to which ICON Advisers oversees the administration of the Trust’s business and affairs. This agreement provides for an annual fee of 0.05% on the Trust’s first $1.5 billion of average daily net assets, 0.045% on the next $1.5 billion of average daily net assets, 0.040% on the next $2 billion of average daily net assets and 0.030% on average daily net assets over $5 billion. For the year ended September 30, 2014, each Fund’s payment for administrative services to ICON Advisers is included on the Statement of Operations. The administrative services agreement provides that ICON Advisers will not be liable for any error of judgment, mistake of law, or any loss suffered by the Trust in connection with matters to which the administrative services agreement relates, except for a loss resulting from willful misfeasance, bad faith or negligence by ICON Advisers in the performance of its duties.
ICON Advisers has a sub-administration agreement with State Street under which State Street assists ICON Advisers with the administration and business affairs of the Trust. For its services, ICON Advisers pays State Street a fee that is calculated daily and paid monthly at an annual rate based on the aggregate average daily net assets of the Trust.
Distribution Fees
The Funds have adopted a Distribution Plan pursuant to Rule 12b-1 under the 1940 Act (“12b-1 Plan”) under which the Funds are authorized to compensate the Funds’ distributor, ICON Distributors, Inc. (“IDI”) (an affiliate of the adviser) for the sale and distribution of shares and for other shareholder services. Under the 12b-1 Plan, Class A shareholders pay an annual distribution and service fee of 0.25% of average daily net assets. The Class C shareholders pay an annual distribution and service fee of 1.00% of average daily net assets. There is no annual distribution and service fee for Class S shares. The total amount paid under the 12b-1 plans by the Funds, if any, is shown on the Statement of Operations.
Other Related Parties
Certain Officers and Directors of ICON Advisers are also Officers and Trustees of the Funds; however, such Officers and Trustees (with the exception of the Chief Compliance Officer, “CCO”) receive no compensation from the Funds. The Trust paid $120,000 of the CCO’s salary and the remaining portion is
| NOTESTO FINANCIAL STATEMENTS | 51 |
Table of Contents
NOTESTO FINANCIAL STATEMENTS (CONTINUED)
paid by ICON Advisers. For the year ended September 30, 2014, the total related amounts paid by the Funds under this arrangement are included in Other Expenses on the Statement of Operations.
The Fund may reimburse ICON Advisers for legal work performed for the Fund by its attorneys outside of the advisory and administration contracts. The Board of Trustees reviews and approves such reimbursements. For the year ended September 30, 2014, the total related amounts paid by the Funds under this arrangement are included in Other Expenses on the Statement of Operations.
4. Borrowings
The Trust has entered into a Line of Credit agreement/arrangement with State Street to provide temporary funding for redemption requests. The maximum borrowing is limited to $150 million. Interest on domestic borrowings is charged at a rate quoted and determined by State Street. The average interest rate charged for the year ended September 30, 2014 was 1.31%.
For the year ended September 30, 2014 the average outstanding loan by Fund was as follows:
| Fund | Average Borrowing (10/1/13-9/30/14) | |||
ICON Emerging Markets Fund | $ | 12,793 | ||
ICON International Equity Fund* | 50,693 | |||
| * | Fund had outstanding borrowings under these agreements/arrangements as of September 30,2014. |
5. Purchases and Sales of Investment Securities
For the year ended September 30, 2014, the aggregate cost of purchases and proceeds from sales of securities (excluding short-term securities) was as follows:
| Fund | Purchases of Securities | Proceeds from Sales of Securities | ||||||
ICON Emerging Markets Fund | $ | 16,393,890 | $ | 36,994,152 | ||||
ICON International Equity Fund | 164,082,794 | 119,058,795 | ||||||
| 52 | NOTESTO FINANCIAL STATEMENTS |
Table of Contents
6. Federal Income Tax
The following information is presented on an income tax basis. Differences between U.S. GAAP and federal income tax purposes that are permanent in nature are reclassified within the capital accounts. Temporary differences do not require reclassification. Temporary and permanent differences do not impact the NAVs of the Funds. These differences are due to differing treatments for items such as deferrals of wash sale losses, foreign currency transactions, and net investment losses.
For the year ended September 30, 2014 the following Funds had capital loss carryforwards:
| Fund | Amounts | Expires | ||||||
ICON Emerging Markets Fund | $ | 7,143,674 | 2017 | |||||
ICON International Equity Fund | 53,195,839 | 2017 | ||||||
| 27,012,993 | 2018 | |||||||
| 3,460,576 | Unlimited | |||||||
Future capital loss carryforward utilization in any given year may be limited if there are substantial shareholder redemptions or contributions. During the year ended September 30, 2014 the following Funds utilized capital loss carryforwards:
| Fund | Amount | |||
ICON Emerging Markets Fund | $ | 2,958,821 | ||
ICON International Equity Fund | 7,395,495 | |||
Under the Regulated Investment Company Modernization Act of 2010 (the “Act”) capital losses generated by a fund may be carried over indefinitely, but these losses must be used prior to the utilization of any pre-enactment capital losses. Since pre-enactment capital losses may only be carried forward for eight years there may be a greater likelihood that all or a portion of each fund’s pre-enactment capital losses will expire unused.
The tax characteristics of distributions paid to shareholders during the fiscal year ended September 30, 2014, were as follows:
| Fund | Distributions Paid from Ordinary Income | Distributions Paid from Return of Capital | Total Distributions Paid | |||||||||
ICON Emerging Markets Fund | $ | 60,794 | $ | - | $ | 60,794 | ||||||
| NOTESTO FINANCIAL STATEMENTS | 53 |
Table of Contents
NOTESTO FINANCIAL STATEMENTS (CONTINUED)
The tax characteristics of distributions paid to shareholders during the fiscal year ended September 30, 2013, were as follows:
| Fund | Distributions Paid from Ordinary Income | Distributions Paid from Return of Capital | Total Distributions Paid | |||||||||
ICON Emerging Markets Fund | $ | 271,232 | $ | - | $ | 271,232 | ||||||
ICON International Equity Fund | 9,994 | 229,699 | 239,693 | |||||||||
As of September 30, 2014, the components of accumulated earnings/(deficit) on a tax basis were as follows:
| Fund | Undistributed Ordinary Income | Late Year Loss Deferral** | Capital Loss Carryover | Unrealized Appreciation/ (Depreciation)* | Total Accumulated Earnings/ (Deficit) | |||||||||||||||
ICON Emerging Markets Fund | $ | - | $ | (351,675 | ) | $ | (7,143,674 | ) | $ | (209,054 | ) | $ | (7,704,403 | ) | ||||||
ICON International Equity Fund | 71,689 | - | (83,669,408 | ) | (9,347,883 | ) | (92,945,602 | ) | ||||||||||||
| * | Differences between the book-basis and tax-basis unrealized appreciation/(depreciation) are attributable primarily to tax deferral of losses on wash sales. |
| ** | The Funds have elected to defer certain qualified late-year losses in accordance with federal income tax rules. These losses are treated as having arisen on the first day of the following fiscal year. |
As of September 30, 2014, cost on investments for federal income tax purposes and the amount of net unrealized appreciation/(depreciation) were as follows:
| Fund | Cost | Unrealized Appreciation | Unrealized (Depreciation) | Net Appreciation/ (Depreciation) | ||||||||||||
ICON Emerging Markets Fund | $ | 10,130,007 | $ | 750,998 | $ | (958,467 | ) | $ | (207,469 | ) | ||||||
ICON International Equity Fund | 103,530,172 | 2,291,463 | (11,628,308 | ) | (9,336,845 | ) | ||||||||||
7. Accounting Pronouncement
In June 2013, FASB issued Accounting Standards Update No. 2013-08, Financial Services – Investment Companies (Topic 946): Amendments to the Scope, Measurement, and Disclosure Requirements (“ASU 2013-08”). This update sets forth a new approach for determining whether a public or private company is an investment company and sets certain measurement
| 54 | NOTESTO FINANCIAL STATEMENTS |
Table of Contents
and disclosure requirements for an investment company. FASB has determined that a fund registered under the 1940 Act automatically meets the criteria of ASU 2013-08 and is effective for interim and annual reporting periods in fiscal years that begin after December 15, 2013. Management does not expect this guidance to have an impact on the Funds’ financial statements.
8. Subsequent Events
Management has evaluated the possibility of subsequent events and determined that there are no material events that would require adjustment to or disclosure in the Funds’ financial statements.
| NOTESTO FINANCIAL STATEMENTS | 55 |
Table of Contents
REPORTOF INDEPENDENT REGISTERED PUBLIC
ACCOUNTING FIRM
To the Board of Trustees and Shareholders of the ICON Funds:
In our opinion, the accompanying statements of assets and liabilities, including the schedules of investments, and the related statements of operations and of changes in net assets and the financial highlights present fairly, in all material respects, the financial position of ICON Emerging Markets Fund (formerly the ICON Asia-Pacific Region Fund) and ICON International Equity Fund (two of the portfolios constituting ICON Funds, hereafter referred to as the “Funds”) at September 30, 2014, the results of each of their operations for the year then ended, the changes in each of their net assets for each of the two years in the period then ended and the financial highlights for each of the five years in the period then ended, in conformity with accounting principles generally accepted in the United States of America. These financial statements and financial highlights (hereafter referred to as “financial statements”) are the responsibility of the Funds’ management. Our responsibility is to express an opinion on these financial statements based on our audits. We conducted our audits of these financial statements in accordance with the standards of the Public Company Accounting Oversight Board (United States). Those standards require that we plan and perform the audit to obtain reasonable assurance about whether the financial statements are free of material misstatement. An audit includes examining, on a test basis, evidence supporting the amounts and disclosures in the financial statements, assessing the accounting principles used and significant estimates made by management, and evaluating the overall financial statement presentation. We believe that our audits, which included confirmation of securities at September 30, 2014 by correspondence with the custodian and brokers, provide a reasonable basis for our opinion.

Denver, Colorado
November 19, 2014
| 56 | REPORT OF ACCOUNTING FIRM |
Table of Contents
SIX MONTH HYPOTHETICAL EXPENSE EXAMPLE
SEPTEMBER 30, 2014 (UNAUDITED)
Example
As a shareholder of a Fund you may pay two types of fees: transaction fees and fund-related fees. Certain funds charge transaction fees, including sales charges (loads) on purchase payments, reinvested dividends, or other distributions; redemption fees; and exchange fees. Funds also incur various ongoing expenses, including management fees, distribution and/or service fees, and other fund expenses, which are indirectly paid by shareholders.
This Example is intended to help you understand your ongoing costs (in dollars) of investing in the various ICON Funds and to compare these costs with the ongoing costs of investing in other mutual funds. This Example is based on an investment of $1,000 invested at the beginning of the six-month period and held for the six-month period (4/1/14 – 9/30/14).
Actual Expenses
The first line in the table for each Fund provides information about actual account values and actual expenses. The Example includes, but is not limited to, management fees, 12b-1 fees, fund accounting, custody and transfer agent fees. However, the Example does not include client specific fees, such as the $15 fee charged to IRA accounts, or the $15 fee charged for wire redemptions. You may use this information, together with the amount you invested, to estimate the expenses that you paid over the period. Simply divide your account value by $1,000 (for example, an $8,600 account value divided by $1,000 = 8.6), then multiply the result by the number in the first line for each Fund under the heading entitled “Expenses Paid During Period” to estimate the expenses you paid on your account during this period.
Hypothetical Example for Comparison Purposes
The second line in the table for each Fund provides information about hypothetical account values and hypothetical expenses based on the Fund’s actual expense ratio and an assumed rate of return of 5% per year before expenses, which is not the Fund’s actual return. The hypothetical account values and expenses may not be used to estimate the actual ending account balance or expenses you paid for the period. You may use this information to compare the ongoing costs of investing in the Fund and other funds. To do so, compare this 5% hypothetical example with the 5% hypothetical examples that appear in the shareholder reports of the other funds. Please note that the expenses shown in the table are meant to highlight your ongoing costs only and do not reflect any transactional costs, such as sales charges (loads),
| EXPENSE EXAMPLE | 57 |
Table of Contents
redemption fees, or exchange fees that may be charged by other funds. Therefore, this information is useful in comparing ongoing costs only, and will not help you determine the relative total costs of owning different funds.
| Beginning Account Value 4/1/14 | Ending Account Value 9/30/14 | Expense Paid During Period 4/1/14 - 9/30/14* | Annualized Expense Ratio 4/1/14 - 9/30/14* | |||||||||||||
Actual Expenses |
| |||||||||||||||
ICON Emerging Markets Fund |
| |||||||||||||||
Class S | $ | 1,000 | $ | 1,017.00 | $ | 10.82 | 2.14% | |||||||||
Class C | 1,000 | 1,012.30 | 15.23 | 3.02% | ||||||||||||
Class A | 1,000 | 1,016.30 | 11.32 | 2.24% | ||||||||||||
ICON International Equity Fund | ||||||||||||||||
Class S | 1,000 | 931.10 | 6.68 | 1.38% | ||||||||||||
Class C | 1,000 | 925.70 | 12.41 | 2.57% | ||||||||||||
Class A | 1,000 | 929.00 | 8.80 | 1.82% | ||||||||||||
Hypothetical (assuming a 5% return before expenses) | ||||||||||||||||
ICON Emerging Markets Fund |
| |||||||||||||||
Class S | 1,000 | 1,014.34 | 10.81 | |||||||||||||
Class C | 1,000 | 1,009.93 | 15.22 | |||||||||||||
Class A | 1,000 | 1,013.84 | 11.31 | |||||||||||||
ICON International Equity Fund |
| |||||||||||||||
Class S | 1,000 | 1,018.15 | 6.98 | |||||||||||||
Class C | 1,000 | 1,012.18 | 12.96 | |||||||||||||
Class A | 1,000 | 1,015.94 | 9.20 | |||||||||||||
| * | Expenses are equal to the Fund’s six month expense ratio annualized and multiplied by the average account value over the period, multiplied by 183/365 to reflect the one-half year period. |
Total returns exclude applicable sales charges. If sales charges were included (maximum 5.75%), returns would be lower.
| 58 | EXPENSE EXAMPLE |
Table of Contents
BOARDOF TRUSTEESAND FUND OFFICERS (UNAUDITED)
The ICON Funds Board of Trustees (“Board”) consists of four Trustees who oversee the 17 ICON Funds (the “Funds”). The Board is responsible for general oversight of the Funds’ business and for assuring that the Funds are managed in the best interest of the Funds’ shareholders. The Trustees, and their ages, and principal occupations are set forth below. The address of the Trustees is 5299 DTC Blvd., Suite 1200, Greenwood Village, CO 80111. Trustees have no official term of office and generally serve until they resign or are not re-elected.
Interested Trustee
Craig T. Callahan, 63, Chairman of the Board. Dr. Callahan has been a Trustee of the Funds since their inception. Dr. Callahan also serves as Chief Executive Officer (2013-present); President (1998 to 2013 and 2014 to present); and Chairman of the Investment Committee (2005 to present) and served as the Chief Investment Officer (1991 to 2004) of ICON Advisers. Dr. Callahan is also Executive Vice President (2005 to present); Director (1991 to present); and was previously President (1998 to 2005) and Chief Compliance Officer (2005) of IDI. Dr. Callahan also serves as the President (1998 to present) and Chairman of the Board of Directors (1994 to present) of IM&R, the parent company of ICON Advisers and IDI.
Independent Trustees
Glen F. Bergert, 64. Mr. Bergert has been a Trustee of the Funds since 1999. Mr. Bergert is President of Venture Capital Management LLC (1997 to present), General Partner of SOGNO Partners LP, a venture capital company (2001 to present), General Partner of Bergert Properties, LLP, a real estate holding company (1997 to present), General Partner of Pyramid Real Estate Partnership, a real estate development company (1998 to present), General Partner of Chamois Partners, LP, a venture capital company (2004 to present) and was previously a General Partner with KPMG Peat Marwick, LLP (1979 to 1997). Mr. Bergert is also a Director of Delta Dental of California, an insurance company (2013 to present and 2006 to 2012), Delta Dental of Pennsylvania, an insurance company (1998 to 2009 and 2010 to present), Dentegra Group, Inc, an insurance holding company (2010 to 2014) and Delta Reinsurance Corporation (2000 to 2009 and 2011 to 2014). Mr. Bergert was a Director of Herre Bros, Inc., a contracting company (1998 to 2011).
John C. Pomeroy, Jr., 67. Mr. Pomeroy has been a Trustee of the Funds since November 2002. Mr. Pomeroy is Chief Investment Officer and Director
| TRUSTEESAND OFFICERS | 59 |
Table of Contents
of Investments, Pennsylvania State University (2001 to present) and was Portfolio Manager and Product Manager, Trinity Investment Management Corporation (1989 to 2001).
R. Michael Sentel, 66. Mr. Sentel has been a Trustee of the Funds since their inception. Mr. Sentel is a Senior Attorney with the U.S. Department of Education (1996 to present). Mr. Sentel also provides legal representation as a sole practitioner with an emphasis on corporate and transactional law. He served as general counsel to numerous public companies and served on the board of directors of one of these clients. Mr. Sentel began his legal career with the U.S. Securities and Exchange Commission’s Division of Enforcement and served as a Branch Chief (1980 to 1981). Later he served as the Section Chief for the Professional Liability Section of the Federal Deposit Insurance Corp. with responsibility for the Rocky Mountain Region (1991 to 1994).
The Officers of the Funds are:
Craig T. Callahan, 63, Chairman of the Board. Dr. Callahan has been a Trustee of the Funds since their inception. Dr. Callahan also serves as Chief Executive Officer (2013-present); President (1998 to 2013 and 2014 to present); and Chairman of the Investment Committee (2005 to present) and served as the Chief Investment Officer (1991 to 2004) of ICON Advisers. Dr. Callahan is also Executive Vice President (2005 to present); Director (1991 to present); and was previously President (1998 to 2005) and Chief Compliance Officer (2005) of IDI. Dr. Callahan also serves as the President (1998 to present) and Chairman of the Board of Directors (1994 to present) of IM&R, the parent company of ICON Advisers and IDI.
Donald Salcito, 61. Mr. Salcito serves as Vice President and Secretary of the Funds (November 15, 2006 to present). Mr. Salcito is also Executive Vice President and General Counsel (September 2005 to present) of ICON Advisers; Director of IM&R (2005 to present); Executive Vice President, Secretary, General Counsel of IDI (2005 to present). Previously, he was a Partner in various national law firms, practicing in the securities law area. (1980 to 2005).
Carrie M. Schoffman, 41. Ms. Schoffman has been a Vice President and Principal Financial Officer/Treasurer of the Funds since June 2013. Ms. Schoffman is also Chief Compliance Officer (2013 to present and 2004 to 2008) and Anti-Money Laundering Officer (2013 to present) of the ICON Funds. She is Senior Vice President (2011 to present) and Chief Compliance Officer (2013 to present and 2004 to 2011) of ICON Advisers. Previously, she was a Staff Accountant with the Securities and Exchange Commission (2003 to 2004) and also an Experienced Manager (2001 to 2003) and a Senior Associate/Associate (1996 to 2001) at PricewaterhouseCoopers LLP.
| 60 | TRUSTEESAND OFFICERS |
Table of Contents
Lesley Caviness, 48. Ms. Caviness serves as Assistant Treasurer of the Funds (2014 to present). She has worked at ICON (2007-2008 and 2010 – present) in fund accounting, compliance, business intelligence and performance capacities. Prior to working at ICON, Ms. Caviness was a Real Estate Broker at Seasons Real Estate Group (2008-2012) and Signature Real Estate (2014 - present), Finance Manager at Navigant (2000-2007), and Associate/Senior Associate (1996 to 2000) at PricewaterhouseCoopers LLP.
| TRUSTEESAND OFFICERS | 61 |
Table of Contents
Renewal of Investment Advisory Agreement
On September 3, 2014 the Board of Trustees, including all of the Trustees that are not “interested persons” of the Trust (the “Independent Trustees”), approved continuation of the Advisory Agreements with the Adviser for each Fund for an additional one-year term commencing October 1, 2014.
In determining to renew the investment advisory agreements between ICON Funds (the “Trust”) and ICON Advisers, Inc. (“ICON” or the “Adviser”) the Trustees requested, was provided with and reviewed data with respect to the Adviser, its personnel, and the services provided and to be provided to each Fund by the Adviser under the Trust’s Investment Advisory Agreement dated October 9, 1996, as amended (related to the Sector Funds, the International Funds and ICON Funds) and under the Trust’s Investment Advisory Agreement dated July 9, 2002 and effective October 1, 2002, as amended (related to the U.S. Diversified Funds — Bond, Risk-Managed Equity, Equity Income and Long/Short Funds) (collectively, the “Advisory Agreements”), for an additional one-year term commencing October 1, 2014. The Trustees agreed that consideration of the Advisory Agreements should also include consideration of other agreements between the Adviser and the Trust that impact provisions of the Advisory Agreements, including, in particular, expense limitation agreements dated January 22, 2014, as amended May 5, 2014 (for ICON Emerging Markets Fund) and as amended effective September 30, 2014 (for the ICON High Yield Bond Fund).
The Trustees were provided with and reviewed data with respect to the Adviser, its personnel, and the services provided and to be provided to each Fund by the Adviser under the Trust’s Advisory Agreements, Administrative Services Agreement and Expense Limitation Agreement and the Distribution Agreement with ICON Distributors, Inc. (“IDI”). The data included information concerning advisory, distribution and administrative services provided to the Funds by ICON and its related companies; information concerning other businesses of those companies; comparative data related to exchange traded funds versus the Sector Funds; and comparative data obtained from Strategic Insight (“SI”) related to Fund performance and Fund expenses (the “SI Report”). The data also included an analysis of the management style to be applied and the style applied to the Funds’ ratings of the Funds’ performance in their management style on the AthenaInvest system (the “AthenaInvest Data”) and a presentation on the Adviser’s investment model.
The Board convened a meeting with SI to discuss the SI Report and the information contained within the SI Report on August 20, 2014. Management
| 62 | OTHER INFORMATION |
Table of Contents
personnel participated in the SI meeting convened to discuss the data for and with the Board. Included in the 15(c) discussion was a briefing on factors affecting the ICON investment model; expenses and expense ratios of each Fund and other ICON managed products; relative performance of each Fund; status of expense reimbursements to the Funds by the Adviser; sales and marketing initiatives; specific business factors affecting IDI; the work load on ICON as adviser and administrator to the Funds; current profitability of ICON; current quality control procedures in place to show consistency in the management of the investment model, modification to the investment model, and staffing levels and staff morale.
The Independent Trustees were represented by independent legal counsel in this process. Prior to acting on the proposed contract renewals and after participating in the meeting with SI and management, the Independent Trustees met separately as a group in private sessions with their independent legal counsel to review and discuss the foregoing information. Based on these discussions, independent legal counsel and/or the Lead Independent Trustee also contacted management and SI to request additional information and to discuss responses to questions raised during the process and the meeting with SI. In addition, the Board received materials from legal counsel discussing the legal standards applicable to their consideration of the ICON-Trust agreements.
In considering the nature, extent and quality of the services provided by the Adviser, the Board reviewed information relating to ICON’s operations and personnel. Among other things, the Adviser provided biographical information on its professional staff and descriptions of its organizational and management structure. In the course of their deliberations the Board evaluated, among other things, information relating to the investment philosophy, strategies and techniques used in managing each Fund, the qualifications and experience of ICON’s investment personnel, ICON’s compliance programs, ICON’s brokerage practices, including the extent to which the Adviser obtains research through “soft dollar” arrangements with the Funds’ brokerage, compliance reports on the foregoing, and the financial and non-financial resources available to provide services required under the Advisory Agreement.
During the discussion, the SI Report and the AthenaInvest Data were discussed and management personnel showed performance for each fund and discussed the factors affecting performance. The Board inquired from SI whether there was any correlation between fund expenses and performance, and SI saw no correlation with the ICON Funds. During the discussion on performance, management personnel noted that the markets continue to experience volatility and that when the markets are volatile, it affects the performance of the ICON system; during the last three – four years ICON’s
| OTHER INFORMATION | 63 |
Table of Contents
style of management, intrinsic valuation, has not been in favor and performance has been affected by three primary factors: quality, cash and shorter duration theme reversals. The Trustees noted that Advisers’ performance relative to other valuation managers as judged by the AthenaInvest system is in line, but in relation to other strategy managers, valuation is underperforming Future Growth, Social Considerations, Competitive Position, Quantitative and Profitability. The Board believes this information supports the view that an active valuation manager is in a very difficult setting and indicates this setting has been particularly difficult for managers buying what they consider to be value stocks. Management noted that the ICON system is designed to handle one to two year industry themes; and that the Adviser has stuck to its system as specified in Fund disclosure documents, holding the stocks and industries that appear inexpensive in relation to ICON’s calculating of value and ridden through the volatility. SI also noted that from a performance point of view, the Funds in the SI Report are compared using the Morningstar data, and there is no Morningstar category for “all cap” funds. For the period July 1, 2013 and ending June 30, 2014 and for the six month period ending June 30, 2014, five of the 18 ICON Funds out-performed their benchmarks.
The Board addressed style consistency with the Adviser. Management advised that, based on the Adviser’s own analysis, and with the restructuring of the Adviser, the Adviser has continued an additional level of review on the Portfolio Managers (“PMs”) to make sure they are adhering to the ICON System; the Senior Vice President of Fund Management has been systematically tracking the Funds’ performance; he evaluates each of the ICON Funds to help ensure all PMs are investing consistently and in accordance with the ICON System by evaluating the Funds from an attribution perspective in monthly meetings. Management also advised that part of his responsibilities require him to evaluate the ICON system and that this effort has resulted in improvements to the ICON methodology, when necessary.
In connection with reviewing data bearing upon the nature, quality, and extent of services furnished by ICON to each Fund, the Board assessed data concerning ICON’s staffing, systems and facilities. The Board also assessed ICON’s non-Trust business to see if there are any initiatives that would dilute service to the Trust. The Board concluded:
A. That the breadth and the quality of investment advisory and other services being provided to each Fund is satisfactory, as evidenced in part by efforts to address and improve the performance record of each Fund when compared with the performance records of a peer group of comparable funds and markets in general;
| 64 | OTHER INFORMATION |
Table of Contents
B. That the breadth and the quality of investment advisory and other services being provided to each Fund are satisfactory, as evidenced in part by the AthenaInvest Data (ratings based on an assessment of fund strategy), the Adviser’s performance is competitive with other fund managers in the value style group, and the Adviser has applied a disciplined approach in the style specified in the Funds’ offering document;
C. That ICON has made significant expenditures in the past year and in prior years to ensure that it has the sophisticated systems and the highly trained personnel necessary for it to be able to continue to provide quality service to the Funds’ shareholders, including the dedication of substantial resources to ICON’s investment and methodology;
D. That the Board, after considering compliance reports and compliance initiatives undertaken during the year and conducting individual interviews with selected PMs, is satisfied with the research and portfolio management, that research and portfolio management is being constantly evaluated and improved upon; and that the PMs are evaluating trading services constantly, the Board concluded that the Adviser is providing the Funds with professional management of the nature, quality and scope required by the Funds; and
E. The risks assumed by ICON in providing investment advisory services to each Fund, including the capital commitments which have been made in the past and which continue to be made by ICON to ensure the continuation of the highest quality of service to the Trust, is made with the recognition that shareholders may redeem their shares at any time without notice and the Trust’s advisory relationship with ICON may be terminated at any time and must be renewed on an annual basis.
In considering the reasonableness of the fees paid to the Adviser for managing each Fund, the Board reviewed, among other things, data concerning other funds from the SI Report, financial statements of the Adviser and an analysis of the profitability of the Adviser, and its affiliates, and their relationship with each Fund over various time periods. Such analysis identified all revenues and other benefits received by the Adviser and its affiliates from managing each Fund, the costs associated with providing such services and the resulting profitability to the Adviser and its affiliates and a comparison of similar data from reports filed by publicly traded firms.
The Board assessed actual (net) fees for advisory services and Fund expense ratios under the contractual relationship (the Advisory agreements and the Expense Limitation Agreements) with the Adviser as opposed to the fees specified in the applicable Advisory Agreement and expense ratios without
| OTHER INFORMATION | 65 |
Table of Contents
application of the expense limitations and concluded that the focus should be on actual expense ratios after application of the Expense Limitation Agreements.
The Board considered the current and anticipated asset levels of each Fund and the contractual commitments of the Adviser to waive fees and pay expenses of the Funds from time to time to limit the total expenses of the Funds. In this regard the Board discussed asset levels in each Fund covered by the Advisory Agreements due to the relative Fund performance, and the industry wide sales in equity and actively managed funds due to the uncertainty of the markets. ICON’s ability to provide the services called for under the Advisory Agreements was assessed in light of current and projected asset levels. Fund expenses and expense ratios were also assessed in light of current and projected asset levels. The Board concluded that the Adviser has the resources necessary to provide the services called for under the Advisory Agreements; that profitability to the Adviser and its affiliates from their relationship with the Funds, and services provided to the Funds, is not excessive; and that the Adviser is not realizing material benefits from economies of scale that would warrant adjustments to the fees for any Fund at this time. The Board of Trustees concluded that, in light of the nature, extent and quality of the services provided by the Adviser and the levels of profitability associated with providing these services, the fees charged by the Adviser under the Advisory Agreements to each Fund are reasonable.
In connection with assessing data bearing on the fairness of fee arrangements, the Board considered the SI Report. It was noted that SI was selected at the May Board meeting to prepare its report, an extensive analysis of the expense data of other comparable funds; and that Trustee input was solicited and provided in the process. Among other information discussed, it was noted that:
A. the advisory fee structures of the Funds are within the range of funds considered in the comparison with advisory fees and expense ratios of other similarly managed funds as set forth in the comparative data;
B. ICON has contractually agreed to impose expense limitations on each and every Fund at a cost to ICON;
C. ICON has contractually committed to break points in its fees so that economies of scale could be realized as a Fund grows in assets, for the benefit of Fund shareholders.
The Board also considered the fees charged by the Adviser to other advisory clients as outlined in its Registration Application on Form ADV in connection with assessing data bearing on the fairness of fee arrangements. The Trustees noted that certain ICON institutional/sub-advised type accounts
| 66 | OTHER INFORMATION |
Table of Contents
have lower fees than the fees paid by the Funds for a number of reasons, including but not limited to, those clients call for different commitments of time, institutional clients have low and predictable turnover of assets, in competition joint costs are apportioned among paying customers according to elasticity of demand and the Adviser has a limited level of responsibility in sub-managed accounts, or accounts with an investor agent/advisor.
The Board noted that the Funds’ redemptions were similar to industry averages which showed two things: 1) that the Funds’ Performance was not adversely impacting fund redemptions, and 2) that the fees and costs were competitive when compared to size. The Board noted that there are thousands of mutual funds competing; that investors can search and trade funds on the internet or on platforms at very little or no cost; and that if the Adviser were overcharging for its services, with its performance being what it is, the Board would have expected redemptions in excess of industry norms.
The Board concluded that the Adviser is providing the Funds with professional management at a fair, reasonable and competitive price.
In connection with assessing the direct and indirect benefits to ICON from serving as the Funds’ adviser, the Board discussed services provided under the Distribution Agreement and the Administrative Services Agreement which are in addition to services under the Advisory Agreements. It was noted that IDI does not charge a fee to the Funds for its services and that ICON’s fee for administrative services appears to be consistent with such fees in other fund groups. The Board noted that ICON receives research assistance (primarily in the form of data) from the use of soft dollars generated from Fund portfolio transactions; that such research assists ICON in providing quality advisory services; that Trust and Adviser compliance personnel continuously evaluate and report on the soft-dollar arrangements and related costs; and the Board concluded that the arrangements are consistent with Fund brokerage practices and benefit the Funds and their shareholders.
Based on these considerations, the Board, including all of the Independent Trustees, concluded that: 1) the continuation of the Advisory Agreements was in the best interests of each Fund and its shareholders, 2) the services to be performed under the Advisory Agreements were required for the operation of the Funds, 3) the advisory services were satisfactory to the Funds in the past, and 4) the fees for the advisory services and other benefits from the relationship with the Trust received by ICON, and its affiliates, were consistent with fees paid by similar funds and other clients of ICON, and were reasonable in light of the comparative data, and within the range of what would have been negotiated at arm’s length in light of all the circumstances.
| OTHER INFORMATION | 67 |
Table of Contents
Supplemental Tax Information
For the fiscal year ended September 30, 2014, the following funds paid qualified dividend income:
| Fund | Amount | |||
ICON Emerging Markets Fund | 100 | % | ||
The Funds had no long-term capital gain distributions qualifying for the maximum 20% income tax rate for individuals.
Portfolio Holdings
Information related to the 10 largest portfolio holdings of each Fund is made available at www.iconfunds.com within approximately 10 business days after month-end. Additionally, a complete list of each Fund’s holdings is made available approximately 30 days after month-end. Each ICON Fund also files a complete schedule of portfolio holdings for the first and third quarters of its fiscal year with the Securities and Exchange Commission (the “Commission”) on Form N-Q. The ICON Funds’ Forms N-Q are available at www.sec.gov or may be reviewed and copied at the Commission’s Public Reference Room in Washington, DC. Information about the Public Reference Room may be obtained by calling 1-800-SEC-0330.
Proxy Voting
A summarized description of the policies and procedures the ICON Funds use to vote proxies is available free of charge at www.iconfunds.com or by calling 1-800-764-0442.
Information about how the ICON Funds voted proxies related to each Fund’s portfolio securities during the 12-month period ended June 30 is available free of charge at www.iconfunds.com or on the Commission’s website at www.sec.gov.
Cost Basis Information
Effective January 1, 2012, federal law requires mutual fund companies to maintain and report a shareholder’s cost basis by tax lot, gain/loss information and holding period of covered shares to the Internal Revenue Service on Form 1099. Covered shares are mutual fund shares acquired on or after January 1, 2012. A fund is not required to maintain and report information for shares not deemed as covered.
The new law requires each fund to elect a default tax identification methodology in order to perform the required reporting. As a result, the Trust has chosen Average Cost as its default tax identification methodology.
| 68 | OTHER INFORMATION |
Table of Contents
This is the method each Fund will use. However, at the time of purchase or upon the sale of covered shares, shareholders may choose a different tax identification method. Furthermore, if you purchase shares through a financial intermediary, please contact the intermediary to find out what default tax identification method they will use. We recommend that you consult your tax adviser to determine which tax identification methodology best suits your individual tax situation.
For More Information
This report is for the general information of the Funds’ shareholders and is not authorized for distribution to prospective investors unless preceded or accompanied by a current prospectus. You may obtain a copy of the prospectus, which contains information about the investment objectives, risks, charges, expenses, and share classes of each ICON Fund, by visiting www.iconfunds.com or by calling 1-800-764-0442. Please read the prospectus carefully before investing.
ICON Distributors, Inc., Distributor.
| OTHER INFORMATION | 69 |
Table of Contents
ICON FUNDS PRIVACY INFORMATION
| FACTS | WHAT DOES ICON DO WITH YOUR PERSONAL INFORMATION? | |
| Why? | Financial companies choose how they share your personal information. Federal law gives consumers the right to limit some but not all sharing. Federal law also requires us to tell you how we collect, share, and protect your personal information. Please read this notice carefully to understand what we do. | |
| What? | The types of personal information we collect and share depend on the product or service you have with us. This information can include:
n Social Security number and account balances
n income and transaction history
n checking account information and wire transfer instructions
When you are no longer our customer, we continue to share your information as described in this notice. | |
| How? | All financial companies need to share customers’ personal information to run their everyday business. In the section below, we list the reasons financial companies can share their customers’ personal information; the reasons ICON chooses to share; and whether you can limit this sharing. |
| Reasons we can share your personal information | Does ICON share? | Can you limit this sharing? | ||
For our everyday business purposes — such as to process your transactions, maintain your account(s), respond to court orders and legal investigations, or report to credit bureaus | Yes | No | ||
For our marketing purposes — to offer our products and services to you | No | We don’t share | ||
| For joint marketing with other financial companies | No | We don’t share | ||
For our affiliates’ everyday business purposes — information about your transactions and experiences | No | We don’t share | ||
For our affiliates’ everyday business purposes — information about your creditworthiness | No | We don’t share | ||
| For nonaffiliates to market to you | No | We don’t share |
| Questions? | Call 1-800-764-0442 for the ICON Funds and 1-800-828-4881 for ICON Advisers, Inc. and ICON Distributors, Inc. |
| 70 | FUNDS PRIVACY INFORMATION |
Table of Contents
| Page 2 |
| Who we are | ||
| Who is providing this notice? | ICON Funds, ICON Advisers, Inc., and ICON Distributors, Inc. (collectively “ICON”) | |
| What we do | ||
| How does ICON protect my personal information? | To protect your personal information from unauthorized access and use, we use security measures that comply with federal law. These measures include computer safeguards and secured files and buildings.
Contracts with our service providers require them to restrict access to your non-public personal information, and to maintain physical, electronic and procedural safeguards against unintended disclosure. | |
| How does ICON collect my personal information? | We collect your personal information, for example, when you
n open an account or enter into an investment advisory contract
n provide account information or give us your contact information
n make a wire transfer
We also collect your personal information from others, such as credit bureaus, affiliates, or other companies. | |
| Why can’t I limit all sharing? | Federal law gives you the right to limit only
n sharing for affiliates’ everyday business purposes — information about your creditworthiness
n affiliates from using your information to market to you
n sharing for nonaffiliates to market to you
State laws and individual companies may give you additional rights to limit sharing. | |
| Definitions | ||
| Affiliates | Companies related by common ownership or control. They can be financial and nonfinancial companies.
n Our affiliates include financial companies such as ICON Funds, ICON Advisers, Inc., and ICON Distributors, Inc. | |
| Nonaffiliates | Companies not related by common ownership or control. They can be financial and nonfinancial companies.
n Nonaffiliates we share with can include financial companies such as custodians, transfer agents, registered representatives, financial advisers and nonfinancial companies such as fulfillment, proxy voting, and class action service providers | |
| Joint marketing | A formal agreement between nonaffiliated financial companies that together market financial products or services to you.
n ICON doesn’t jointly market |
| FUNDS PRIVACY INFORMATION | 71 |
Table of Contents
(This page is intentionally left blank)
Table of Contents
(This page is intentionally left blank)
Table of Contents
(This page is intentionally left blank)
Table of Contents
(This page is intentionally left blank)
Table of Contents
(This page is intentionally left blank)
Table of Contents
(This page is intentionally left blank)
Table of Contents
For more information about the ICON Funds, contact us:
| By Telephone | 1-800-764-0442 | |
| By Mail | ICON Funds P.O. Box 55452 Boston, MA 02205-8165 | |
| In Person | ICON Funds 5299 DTC Boulevard, 12th Floor Greenwood Village, CO 80111 | |
| On the Internet | www.iconfunds.com | |
| By E-Mail | info@iconadvisers.com | |
Table of Contents

2014 ANNUAL REPORT
ICON SECTOR FUNDS
INVESTMENT UPDATE
ICON Consumer Discretionary Fund
ICON Consumer Staples Fund
ICON Energy Fund
ICON Financial Fund
ICON Healthcare Fund
ICON Industrials Fund
ICON Information Technology Fund
ICON Materials Fund
ICON Utilities Fund

1-800-764-0442 | www.iconfunds.com
Table of Contents

You can now sign up for electronic delivery of ICON Fund shareholder reports, including prospectuses, annual reports, semiannual reports and proxy statements.
When these materials are available, you will receive an email from ICON with instructions on how to view the documents. Statements, transaction confirmations and other documents that are not available online will continue to be sent to you by U.S. mail.
Visit ICON’s website at www.iconfunds.com to learn more and sign up.
You may change or cancel your participation in eDelivery by visiting www.iconfunds.com, or you can request a hard copy of any of the materials free of charge by calling ICON Funds at 1-800-764-0442.
1-800-764-0442 • www.iconfunds.com
Table of Contents

| 2 | ||||
| 5 | ||||
Management Overview (Unaudited) and Schedules of Investments | ||||
| 8 | ||||
| 14 | ||||
| 19 | ||||
| 25 | ||||
| 31 | ||||
| 36 | ||||
| 42 | ||||
| 48 | ||||
| 54 | ||||
| 60 | ||||
| 76 | ||||
| 86 | ||||
| 104 | ||||
| 105 | ||||
| 108 | ||||
| 111 | ||||
| 119 | ||||
Table of Contents
Historical Returns
All total returns mentioned in this Report account for the change in a Fund’s per-share price and the reinvestment of any dividends, capital gain distributions and adjustments for financial statement purposes. If your account is set up to receive Fund distributions in cash rather than to reinvest them, your actual return may differ from these figures. The Funds’ performance results do not reflect the deduction of taxes that a shareholder would pay on Fund distributions or on the redemption of Fund shares. The Adviser may have reimbursed certain fees or expenses of some of the Funds. If not for these reimbursements, performance would have been lower. Fund results shown, unless otherwise indicated, are at net asset value. If a sales charge (maximum 5.75%) had been deducted, results would have been lower.
Past performance does not guarantee future results. Investment return and principal value will fluctuate so that an investor’s shares, when redeemed, may be worth more or less than their original cost. Performance results represent past performance, and current performance may be higher or lower. Please call 1-800-764-0442 or visit www.iconfunds.com for performance results current to the most recent month-end.
Portfolio Data
This Report reflects ICON’s portfolio holdings as of September 30, 2014, the end of the reporting period. The information is not a complete analysis of every aspect of any sector, industry, security or the Funds.
Opinions and forecasts regarding industries, companies and/or themes, and portfolio composition and holdings are subject to change at any time based on market and other conditions, and should not be construed as a recommendation of any specific security, industry or sector. Each Fund’s holdings as of September 30, 2014 are included in each Fund’s Schedule of Investments.
According to ICON, value investing is an analytical approach to investing that employs various factors, including projecting earnings growth estimates, in an effort to determine whether securities are over- or underpriced relative to ICON’s estimates of their intrinsic value. Value investing involves risks and uncertainties and does not guarantee better performance or lower costs than other investment methodologies. ICON’s value-to-price ratio (“V/P”) is a ratio of intrinsic value, as calculated using ICON’s proprietary valuation methodology, of a broad range of domestic and international securities
| 2 | ABOUT THIS REPORT |
Table of Contents
within ICON’s system as compared to the current market price of those securities. The ICON system relies on the integrity of the financial statements released to the market as part of our analysis.
This Report contains statements regarding industry or sector themes, new market themes, investment outlook, relative strength, value-to-price ratios, and investment team expectations, beliefs, goals and the like that are based on current expectations, recent individual stock performance relative to current market prices, estimates of company values and other information supplied to the market by the companies we follow. Words such as “expects,” “suggests,” “anticipates,” “targets,” “goals,” “value,” “intrinsic value,” “indicates,” “believes,” “considers,” “estimates,” variations of such words and similar expressions are intended to identify forward looking statements, which are not statements of historical fact. Forward looking statements are not guarantees of future performance and involve certain risks, uncertainties and assumptions that are difficult to assess. These risks and uncertainties are based on a number of important factors, including, among others: stock price fluctuations; the integrity and accuracy of historical and projected financial and other information supplied by companies to the public or assumptions based on such information supplied; interest rates; bond yields; future earnings growth rates; the risks noted in this Report and other factors beyond the control of our investment team but used by the investment team to influence their assumptions. Therefore, actual outcome may differ materially from what is expressed in such forward looking statements.
There are risks associated with mutual fund investing, including the loss of principal. The likelihood of loss may be greater if you invest for a shorter period of time. There is no assurance that the investment process will consistently lead to successful results.
An investment concentrated in sectors and industries may involve greater risk and volatility than a more diversified investment. Investments in foreign securities may entail unique risks, including political, market, and currency risks. Financial statements of foreign companies are governed by different accounting, auditing, and financial standards than U.S. companies and may be less transparent and uniform than in the United States. Many corporate governance standards, which help ensure the integrity of public information in the United States, do not exist in foreign countries. In general, there may be less governmental supervision of foreign stock exchanges and securities brokers and issuers. The ICON system relies on the integrity of financial statements released to the market as part of our analysis.
The prospectus and statement of additional information contain this and other information about the Funds and are available by visiting
| ABOUT THIS REPORT | 3 |
Table of Contents
www.iconfunds.com or calling 1-800-764-0442. Please read the prospectus and statement of additional information carefully.
Comparative Indexes
The comparative indexes discussed in this Report are meant to provide a basis for judging the Funds’ performance against specific securities indexes. Each index shown accounts for both change in security price and reinvestment of dividends and distributions (except as noted), but does not reflect the costs of managing a mutual fund. The Funds’ portfolios may significantly differ in holdings and composition from the indexes. Individuals cannot invest directly in an index.
| • | The unmanaged Standard & Poor’s (“S&P”) Composite 1500 Index (“S&P Composite 1500 Index”) is a broad-based capitalization-weighted index comprising 1,500 stocks of large-cap, mid-cap, and small-cap U.S. companies. |
| • | The capitalization-weighted S&P 1500 Sector and Industry Indexes are based on specific classifications determined by S&P. |
| • | The unmanaged NASDAQ Composite (“NASDAQ”) Index is a broad-based capitalization-weighted index of all NASDAQ National Market and Small-Cap stocks. |
| • | Total returns for the S&P 1500 Consumer Discretionary Index and the S&P 1500 Industrials Index include the reinvestment of dividends and capital gain distributions beginning January 1, 2002. Index returns with reinvested dividends and distributions are unavailable prior to that date. |
Index returns and statistical data included in this Report are provided by FactSet Research Systems.
Financial Intermediary
If you purchase the Fund through a broker-dealer or other financial intermediary (such as a bank), the Fund and its related companies may pay the intermediary for the sale of Fund shares and related services. These payments may influence the broker-dealer or other intermediary and your salesperson to recommend the Fund over another investment. Ask your salesperson or visit your financial intermediary’s website for more information.
| 4 | ABOUT THIS REPORT |
Table of Contents
MESSAGE FROM ICON FUNDS (UNAUDITED)
Dear Shareholder,
The graph below shows the S&P Composite 1500 Index and a subset of it, the S&P SmallCap 600 Index (“S&P SmallCap 600 Index”) from 9/30/13 through 10/6/14 (our fiscal year plus a few days into October). It reveals a fragmented, divergent market in 2014. The two indexes moved similarly in late 2013, then diverged in 2014. The 1500, lifted by a few large-cap stocks, moved 7.5% higher year to date through September 30, 2014, while the small-cap component of it is negative for 2014, as highlighted in the table. In addition to that divergence, there have been a few rapid, short term industry and sector theme reversals during each up and down phase, more easily seen on the Small Cap chart. We believe the divergence and the theme reversals can be explained by investors’ reaction to three situations.
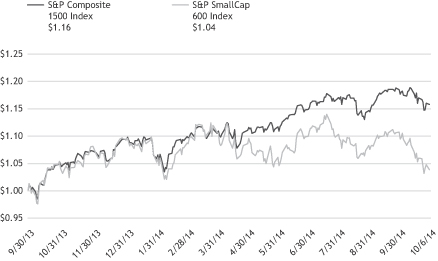
Index | 9/30/13-12/31/13 | 12/31/13-9/30/14 | ||||||
S&P Composite 1500 | 10.3% | 7.5% | ||||||
S&P SmallCap 600 | 9.8% | -3.7% | ||||||
The first situation relates to investors’ reactions to a surprise negative Gross Domestic Product (GDP). Entering the first quarter of 2014, most forecasters were calling for positive real GDP. However, as the quarter unfolded it became apparent that something was wrong. Now, looking back, we know real GDP was at a negative 2.1% pace for the year. Investors flipped from favoring cyclical industries and sectors in late 2013 to favoring defensive, recession proof ones in early 2014. This theme change lasted only three and
| MESSAGE FROM ICON FUNDS | 5 |
Table of Contents
a half months for the 1500 Index and one month longer for the 600 Index, too quick for a value-based system to capture.
The second situation involves investors’ reactions to a rise in the U.S. Dollar. From June 30, 2013 through September 30, 2014, the U.S. Dollar Index (DXY) gained 7.7%, which is still 28.5% below its peak in 2002. It appears many investors and speculators adjusted their equity portfolios, attempting to guess which industries and stocks would either benefit from or be hurt by a stronger US Dollar. We have found economic reactions to currency swings to be less dramatic and slower than theory would suggest so we suspect these investors may be over reacting lately.
The last situation relates to investors’ speculation on rising interest rates. In anticipation of the Federal Reserve ending its quantitative easing program, there appeared to be a popular belief that both short-term and long-term interest rates would increase. Investors who believed this might have adjusted their equity portfolios in anticipation of higher interest rates and their behavior affected stock prices. First, it should be mentioned that ICON believes, and has stated, that interest rates can go low and stay low for many years. We see no support for higher long term interest rates. We sense, however, that we are in the minority with that outlook. We believe the many investors who expect higher interest rates bought stocks they think will benefit from higher rates and sold stocks they think will be hurt by rate increases. For example, it might be that these investors, believing that rising rates will hurt small cap stocks more than large cap stocks, bought large cap issues while avoiding small cap stocks altogether. Similarly, believing that higher rates would have a negative impact on certain industries, they avoided industries in the Consumer Discretionary sector that have an element of consumer borrowing such as the homebuilders, automobile manufacturers and home furnishing industries.
We believe investors’ reactions to a surprise negative GDP quarter, a rise in the US Dollar and an anticipated rise interest rates have contributed to moves in stocks that were not related to value of the stocks themselves. We have seen overpriced stocks (in our opinion) get bid up higher and underpriced stocks taken lower as investors try to get repositioned. This recent trend of positioning equity portfolios for anticipated higher interest rates and a rising US Dollar is stretching the valuation in some industries according to our system. However, according to our methodology, industries favored by these speculators are becoming overpriced while disfavored industries are becoming underpriced. Given this scenario, we expect this behavior to end sometime in the next year.
The first week of October 2014 our ICON market value-to-price (V/P) ratio has been in the 1.06 – 1.10 range, indicating stocks, on average, are priced
| 6 | MESSAGE FROM ICON FUNDS |
Table of Contents
below our estimate of fair value and giving us the expectation that stock prices can move higher over the next year. Over the course of the last year value has grown and prices of some stocks have kept pace, but, as seen in the graph, some have lagged behind. As mentioned above, we believe this disconnect is due to concerns about the strength of the U.S. Dollar and the expectation of rising interest rates. We are finding better value in the cyclical, economically sensitive industries rather than the so-called recession proof industries. With an overall V/P ratio of 1.10 and many industry valuation readings stretched, we will buy the best bargains we can find and have the patience to wait for investors to ultimately recognize value. Our valuation readings, coupled with various supportive conditions such as low inflation, low interest rates, no shortages of capital or commodities and modest economic growth, lead us to believe we are in a favorable setting for owning equities.

Craig Callahan D.B.A.
Chief Executive Officer
ICON Advisers, Inc.
| MESSAGE FROM ICON FUNDS | 7 |
Table of Contents
Class S Class C Class A | ICCCX ICCEX ICCAX |
| Q. | How did the Fund Perform relative to its benchmark? |
| A. | The ICON Consumer Discretionary Fund (the Fund) Class S returned 7.24% for the fiscal year ended September 30, 2014, while the benchmark S&P Composite 1500 Consumer Discretionary Index rose 11.32%. The broad market S&P Composite 1500 Index gained 18.57%. Total returns for other periods and additional Class shares as of September 30, 2014, appear in the subsequent pages of this Fund’s Management Overview. |
| Q. | What primary factors influenced the Fund’s relative performance during the period? |
| A. | The broad market performed well over the past year but the Consumer Discretionary sector lagged the U.S. equity market. Despite the gradual pace of economic growth, the U.S. economy suffered a setback in the first quarter of 2014, which provided a headwind for stocks in the Consumer Discretionary sector. However, as the U.S. Federal Reserve winds down its quantitative easing program, interest rates remain low and monetary policy remains loose. Over the fiscal year 2014, consumer confidence rose, unemployment fell, and inflation remained subdued by historical standards. All these factors could remain as tailwinds for the U.S. consumer and should be supportive for companies and industries in this sector of the economy. |
At the start of this fiscal year, our valuation model indicated the Consumer Discretionary sector, as well as the U.S. equity market as a whole, were slightly over valued. Our model provides us with an estimate of the intrinsic value of a stock, which can then be compared to where it is trading in the market. As value acting as our primary tenet, we held cash in the first quarter of the period. This year’s harsh winter contributed to an unexpected slowdown in U.S. economic growth as well as declines in the sector. As our system dictated, cash was invested as better bargains emerged throughout the year.
| Q. | How did the Fund’s Composition affect performance? |
| A. | The restaurants industry was the greatest contributor to the Fund’s performance over the period on an industry level. Despite the Fund’s holdings in the restaurants industry being underweight relative to the benchmark, the Fund was able to outperform the benchmark in this industry based on strong stock selection over the period. Holdings in |
| 8 | MANAGEMENT OVERVIEW |
Table of Contents
| companies like Yum! Brands and Red Robin Gourmet Burgers were strong contributors to relative performance, and avoiding large benchmark laggards such as McDonald’s also proved beneficial. The movies & entertainment industry was another positive contributor, as holdings in Walt Disney and Twenty-First Century Fox contributed positively to the Fund’s performance. |
The specialty stores industry was the Fund’s largest detractor to relative performance on the industry level. Overweight positions in Outerwall, GNC Holdings, and PetSmart detracted from performance of the Fund relative to the benchmark. Auto parts & equipment was another industry detractor to relative performance with Fund holdings in Dorman Products and BorgWarner hurting from the Fund’s performance.
| Q. | What is your investment outlook for the Consumer Discretionary sector? |
| A. | At the close of the fiscal year, our model indicates the Consumer Discretionary sector has a an overall average value-to-price (V/P) ratio of 1.10; or in other words, we believe the average fair value for the stocks in the Consumer Discretionary sector as a whole is approximately 10% higher than where the stocks are currently trading. Given this V/P reading, the Fund remains nearly fully invested as there are many industry opportunities that look attractive from a value perspective. For example, the motorcycle manufacturers and auto parts & equipment industries are among the best bargains within the sector according to our system, and the Fund maintains an overweight position relative to the benchmark in both. As always, we look to value as our primary guide and will adjust our positioning as market conditions dictate. |
| MANAGEMENT OVERVIEW | 9 |
Table of Contents
ICON Consumer Discretionary Fund
Sector Composition
September 30, 2014
Consumer Discretionary | 97.6% | |||
|
| |||
| 97.6% | ||||
|
|
Percentages are based upon common stocks as a percentage of net assets.
ICON Consumer Discretionary Fund
Industry Composition
September 30, 2014
Movies & Entertainment | 12.4% | |||
Restaurants | 9.9% | |||
Auto Parts & Equipment | 9.6% | |||
Automotive Retail | 8.8% | |||
Home Improvement Retail | 8.1% | |||
Cable & Satellite | 7.5% | |||
Apparel, Accessories & | 7.4% | |||
Motorcycle Manufacturers | 5.5% | |||
Broadcasting | 4.9% | |||
General Merchandise Stores | 4.2% | |||
Footwear | 3.8% | |||
Distributors | 3.7% | |||
Housewares & Specialties | 2.7% | |||
Specialty Stores | 2.3% | |||
Homefurnishing Retail | 2.0% | |||
Homebuilding | 1.6% | |||
Hotels, Resorts & Cruise Lines | 1.6% | |||
Apparel Retail | 1.0% | |||
Household Appliances | 0.6% | |||
|
| |||
| 97.6% | ||||
|
|
Percentages are based upon common stocks as a percentage of net assets.
| 10 | MANAGEMENT OVERVIEW |
Table of Contents
ICON Consumer Discretionary Fund Average Annual Total Return
as of September 30, 2014
| Inception Date | 1 Year | 5 Years | 10 Years | Since Inception | Gross Expense Ratio* | Net Expense Ratio* | ||||||||||||||||||||||
ICON Consumer Discretionary | 7/9/97 | 7.24% | 18.86% | 7.46% | 5.86% | 1.38% | 1.38% | |||||||||||||||||||||
ICON Consumer Discretionary | 9/30/10 | 5.91% | N/A | N/A | 17.06% | 3.68% | 2.75% | |||||||||||||||||||||
ICON Consumer Discretionary | 9/30/10 | 6.95% | N/A | N/A | 17.77% | 1.78% | 1.78% | |||||||||||||||||||||
ICON Consumer Discretionary | 9/30/10 | 0.79% | N/A | N/A | 16.05% | 1.78% | 1.78% | |||||||||||||||||||||
S&P 1500 Consumer Discretionary Index | 11.32% | 21.12% | 9.40% | 8.42% | N/A | N/A | ||||||||||||||||||||||
S&P Composite 1500 Index | 18.57% | 15.79% | 8.34% | 6.94% | N/A | N/A | ||||||||||||||||||||||
Past performance is not a guarantee of future results. The performance of the S&P 1500 Consumer Discretionary Index includes the reinvestment of the dividends and capital gain distributions beginning on January 1, 2002. Additional information about these performance results and the comparative indexes can be found in the About This Report section. The Adviser has agreed to limit certain Fund expenses; without these limitations, returns would have been lower. The limitation provisions may be terminated in the future.
| * | Please see the most recent prospectus for details. |
Class C total returns exclude applicable sales charges. If sales charges were included returns would be lower.
| MANAGEMENT OVERVIEW | 11 |
Table of Contents
ICON Consumer Discretionary Fund
Value of a $10,000 Investment
through September 30, 2014

Past performance is not a guarantee of future results. The above graph compares a $10,000 investment made in the Fund’s Class S shares on the Class’ inception date of 7/9/97 to a $10,000 investment made in unmanaged securities indexes on that date. The Fund’s performance in this chart and the performance table assumes the reinvestment of dividends and capital gain distributions but does not reflect the deduction of taxes that a shareholder would pay on Fund distributions or on the redemption of Fund shares.
| 12 | MANAGEMENT OVERVIEW |
Table of Contents
ICON CONSUMER DISCRETIONARY FUND
SCHEDULEOF INVESTMENTS
SEPTEMBER 30, 2014
| Shares or Principal Amount | Value | |||||||
| Common Stocks (97.6%) | ||||||||
| 13,000 | Advance Auto Parts, Inc. | $ | 1,693,900 | |||||
| 4,300 | AutoZone, Inc.† | 2,191,538 | ||||||
| 37,800 | BorgWarner, Inc. | 1,988,658 | ||||||
| 22,100 | Buffalo Wild Wings, Inc.† | 2,967,367 | ||||||
| 33,600 | CBS Corp., Class B | 1,797,600 | ||||||
| 81,200 | Comcast Corp., Class A | 4,366,936 | ||||||
| 14,600 | Discovery Communications, Inc., Class A† | 551,880 | ||||||
| 14,600 | Discovery Communications, Inc.† | 544,288 | ||||||
| 20,400 | Dollar Tree, Inc.† | 1,143,828 | ||||||
| 36,700 | Dorman Products, Inc.†(a) | 1,470,202 | ||||||
| 24,000 | Finish Line, Inc., Class A | 600,720 | ||||||
| 28,300 | Fox Factory Holding Corp.† | 438,650 | ||||||
| 20,200 | Gildan Activewear, Inc.(a) | 1,105,344 | ||||||
| 55,300 | Harley-Davidson, Inc. | 3,218,460 | ||||||
| 31,000 | Hibbett Sports, Inc.† | 1,321,530 | ||||||
| 33,500 | Home Depot, Inc. | 3,073,290 | ||||||
| 26,600 | Jarden Corp.† | 1,598,926 | ||||||
| 28,400 | Johnson Controls, Inc. | 1,249,600 | ||||||
| 25,600 | LGI Homes, Inc.† | 470,016 | ||||||
| 80,900 | LKQ Corp.† | 2,151,131 | ||||||
| 21,700 | Lululemon Athletica, Inc.†(a) | 911,617 | ||||||
| Shares or Principal Amount | Value | |||||||
| 28,400 | Lumber Liquidators Holdings, Inc.†(a) | $ | 1,629,592 | |||||
| 5,700 | Magna International, Inc. | 540,987 | ||||||
| 11,000 | Michael Kors Holdings Ltd.† | 785,290 | ||||||
| 45,600 | Movado Group, Inc. | 1,507,536 | ||||||
| 24,600 | Nike, Inc., Class B | 2,194,320 | ||||||
| 8,400 | O’Reilly Automotive, Inc.† | 1,263,024 | ||||||
| 96,000 | Pier 1 Imports, Inc. | 1,141,440 | ||||||
| 7,100 | Royal Caribbean Cruises Ltd. | 477,759 | ||||||
| 37,500 | Starbucks Corp. | 2,829,750 | ||||||
| 21,000 | Target Corp. | 1,316,280 | ||||||
| 21,100 | Time Warner, Inc. | 1,586,931 | ||||||
| 15,800 | Toll Brothers, Inc.† | 492,328 | ||||||
| 35,200 | Viacom, Inc., Class B | 2,708,288 | ||||||
| 33,600 | Walt Disney Co. | 2,991,408 | ||||||
| 2,500 | Whirlpool Corp. | 364,125 | ||||||
| 5,500 | Wyndham Worldwide Corp. | 446,930 | ||||||
|
| |||||||
| | Total Common Stocks (Cost $57,910,571) | 57,131,469 | ||||||
| Collateral for Securities on Loan (9.4%) | ||||||||
| 5,485,890 | State Street Navigator Prime Portfolio, 0.15% | 5,485,890 | ||||||
|
| |||||||
| | Total Collateral for Securities on Loan (Cost $5,485,890) | 5,485,890 | ||||||
| | Total Investments 107.0% (Cost $63,396,461) | 62,617,359 | ||||||
| | Liabilities Less Other Assets (7.0)% | (4,110,697 | ) | |||||
|
| |||||||
| Net Assets 100.0% | $ | 58,506,662 | ||||||
|
| |||||||
The accompanying notes are an integral part of the financial statements.
| † | Non-income producing security. |
| (a) | All or a portion of the security was on loan as of September 30, 2014. |
| SCHEDULEOF INVESTMENTS | 13 |
Table of Contents
MANAGEMENT OVERVIEW (UNAUDITED) | Class S Class C Class A | ICLEX ICLCX ICRAX |
| Q. | How did the Fund perform relative to its benchmarks? |
| A. | The ICON Consumer Staples Fund (the Fund) Class S returned 13.32% for the fiscal year ended September 30, 2014, while its sector-specific benchmark, the S&P Composite 1500 Consumer Staples Index, returned 16.90%, and the S&P Composite 1500 Index gained 18.57%. Total returns for other periods and additional Class shares as of September 30, 2014, appear in the subsequent pages of this Fund’s Management Overview. |
| Q. | What primary factors were behind the Fund’s relative performance? |
| A. | The broad U.S. market performed well over the course of fiscal year 2014. Performance, during the continuation of a multi-year rally, was notably impressive considering the headwinds investors faced, such as economic growth concerns internationally, especially in relation to China and Europe, and the winding down of the U.S. Federal Reserve’s quantitative easing program. Despite tapering, interest rates remained low and monetary policy continued to be accommodative. Further, the U.S. economy continued to show signs of improvement, providing a boost to domestic equity markets. |
The Consumer Staples sector, however, lagged the broad U.S. market during the period. Much of the sector’s underperformance occurred early in the period as investors were cautious towards the sector for a variety of reasons including market saturation and sluggish wage growth in developed markets as well as growth concerns and currency headwinds in emerging markets. Harsh weather in the U.S. at the start of 2014 was also a factor in the sector’s returns. Investors returned to Consumer Staples in the second half of the fiscal year, however, causing the sector to outperform the broad U.S. market during this time frame.
From a valuation standpoint, we began the period with an average value-to-price (V/P) ratio for the sector of 1.05. Leadership in fiscal year 2014 was dominated by alcoholic beverage companies. The distillers & vintners and brewer industries each returned in excess of 38%. The Fund participated in the upside move in the distillers & vintners industry, but the Fund’s positioning in the brewers industry detracted from Fund performance on a relative basis. The drug retail industry also experienced solid returns during the period, however, the Fund was underweight this space for much of the year. As a result, the drug retail industry detracted the most from relative performance in fiscal year 2014.
| 14 | MANAGEMENT OVERVIEW |
Table of Contents
| Q. | How did the Fund’s composition affect performance? |
A. Industry returns within the sector varied significantly, from 40% for the top-performing industry to -7% for the worst performing industry. This highlights the significant role that industry rotation can play in sector investing.
The top industry contributors to Fund performance during fiscal year 2014 were the soft drinks, tobacco, household products and packaged foods & meats industries. The food retail industry detracted from Fund performance.
From a total effect standpoint, industries that contributed to performance relative to the benchmark included personal products, distillers & vintners, household products and food distributors. Although packaged foods & meats was a key contributor to absolute performance of the Fund, stock selection caused it to detract from benchmark relative performance. Other industries that detracted from performance relative to the benchmark included drug retail and brewers.
| Q. | What is your investment outlook for the Consumer Staples sector? |
| A. | At the end of fiscal year 2014, the Consumer Staples sector had a V/P ratio of 1.05, similar to where we started the year and indicating that our system still sees upside potential for the sector. Industries within the sector that are showing value according to our system include agricultural products and food distributors. We anticipate that the Consumer Staples sector will continue to serve as a safe haven relative to economically sensitive sectors. As always, we remain ready to reallocate and adapt as our investment system dictates. |
ICON Consumer Staples Fund
Sector Composition
September 30, 2014
Consumer Staples | 94.9% | |||
|
| |||
| 94.9% | ||||
|
|
Percentages are based upon common stocks as a percentage of net assets.
ICON Consumer Staples Fund
Industry Composition
September 30, 2014
Packaged Foods & Meats | 21.8% | |||
Soft Drinks | 15.8% | |||
Household Products | 13.2% | |||
Food Distributors | 9.6% | |||
Agricultural Products | 9.2% | |||
Drug Retail | 9.2% | |||
Tobacco | 8.5% | |||
Brewers | 4.2% | |||
Hypermarkets & Super Centers | 3.4% | |||
|
| |||
| 94.9% | ||||
|
|
Percentages are based upon common stocks as a percentage of net assets.
| MANAGEMENT OVERVIEW | 15 |
Table of Contents
ICON Consumer Staples Fund Average Annual Total Return
as of September 30, 2014
| Inception Date | 1 Year | 5 Years | 10 Years | Since Inception | Gross Expense Ratio* | Net Expense Ratio* | ||||||||||||||||||||||
ICON Consumer Staples Fund - Class S | 5/9/97 | 13.32% | 13.07% | 6.31% | 8.52% | 1.51% | 1.51% | |||||||||||||||||||||
ICON Consumer Staples Fund - Class C | 9/30/10 | 12.17% | N/A | N/A | 12.33% | 2.61% | 2.50% | |||||||||||||||||||||
ICON Consumer Staples Fund - Class A | 9/30/10 | 12.99% | N/A | N/A | 13.39% | 1.84% | 1.75% | |||||||||||||||||||||
ICON Consumer Staples Fund - Class A (including maximum sales charge of 5.75%) | 9/30/10 | 6.45% | N/A | N/A | 11.74% | 1.84% | 1.75% | |||||||||||||||||||||
S&P 1500 Consumer Staples Index | 16.90% | 15.77% | 10.97% | 8.04% | N/A | N/A | ||||||||||||||||||||||
S&P Composite 1500 Index | 18.57% | 15.79% | 8.34% | 7.48% | N/A | N/A | ||||||||||||||||||||||
Past performance is not a guarantee of future results. The performance of the S&P 1500 Consumer Staples Index includes the reinvestment of the dividends and capital gain distributions beginning on January 1, 2002. Additional information about these performance results and the comparative indexes can be found in the About This Report section. The Adviser has agreed to limit certain Fund expenses; without these limitations, returns would have been lower. The limitation provisions may be terminated in the future.
| * | Please see the most recent prospectus for details. |
Class C total returns exclude applicable sales charges. If sales charges were included returns would be lower.
| 16 | MANAGEMENT OVERVIEW |
Table of Contents
ICON Consumer Staples Fund
Value of a $10,000 Investment
through September 30, 2014
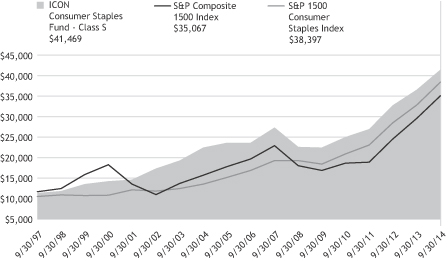
Past performance is not a guarantee of future results. The above graph compares a $10,000 investment made in the Fund’s Class S shares on the Class’ inception date of 5/9/97 to a $10,000 investment made in unmanaged securities indexes on that date. The Fund’s performance in this chart and the performance table assumes the reinvestment of dividends and capital gain distributions but does not reflect the deduction of taxes that a shareholder would pay on Fund distributions or on the redemption of Fund shares.
| MANAGEMENT OVERVIEW | 17 |
Table of Contents
ICON CONSUMER STAPLES FUND
SCHEDULEOF INVESTMENTS
SEPTEMBER 30, 2014
| Shares or Principal Amount | Value | |||||||
| Common Stocks (94.9%) | ||||||||
| 26,100 | Andersons, Inc. | $ | 1,641,168 | |||||
| 5,700 | Boston Beer Co., Inc., Class A†(a) | 1,264,032 | ||||||
| 15,800 | Bunge, Ltd. | 1,330,834 | ||||||
| 20,600 | Church & Dwight Co., Inc. | 1,445,296 | ||||||
| �� | 28,000 | Coca-Cola Co. | 1,194,480 | |||||
| 29,100 | Coca-Cola Enterprises, Inc. | 1,290,876 | ||||||
| 14,000 | Colgate-Palmolive Co. | 913,080 | ||||||
| 23,000 | ConAgra Foods, Inc. | 759,920 | ||||||
| 8,100 | Costco Wholesale Corp. | 1,015,092 | ||||||
| 22,500 | CVS Caremark Corp. | 1,790,775 | ||||||
| 16,900 | Dr. Pepper Snapple Group, Inc. | 1,086,839 | ||||||
| 19,200 | Flowers Foods, Inc. | 352,512 | ||||||
| 14,200 | Hershey Co. | 1,355,106 | ||||||
| 18,700 | Ingredion, Inc. | 1,417,273 | ||||||
| 14,400 | J.M. Smucker Co. | 1,425,456 | ||||||
| 12,700 | McCormick & Co., Inc. | 849,630 | ||||||
| 12,500 | PepsiCo, Inc. | 1,163,625 | ||||||
| 13,500 | Philip Morris International, Inc. | 1,125,900 | ||||||
| Shares or Principal Amount | Value | |||||||
| 19,200 | Procter & Gamble Co. | $ | 1,607,808 | |||||
| 24,200 | Reynolds American, Inc. | 1,427,800 | ||||||
| 45,500 | Tyson Foods, Inc., Class A | 1,791,335 | ||||||
| 19,800 | United Natural Foods, Inc.† | 1,216,908 | ||||||
| 16,100 | Walgreen Co. | 954,247 | ||||||
|
| |||||||
| | Total Common Stocks (Cost $26,578,237) | 28,419,992 | ||||||
| Collateral for Securities on Loan (3.3%) | ||||||||
| 1,001,000 | State Street Navigator Prime Portfolio, 0.15% | 1,001,000 | ||||||
|
| |||||||
|
| Total Collateral for Securities on Loan (Cost $1,001,000) | 1,001,000 | ||||||
| Short-Term Investments (19.8%) | ||||||||
| $ | 5,918,949 | State Street Euro Dollar Time Deposit (USD), 0.01%, 10/01/14 | 5,918,949 | |||||
|
| |||||||
| | Total Short-Term Investments (Cost $5,918,949) | 5,918,949 | ||||||
| | Total Investments 118.0% (Cost $33,498,186) | 35,339,941 | ||||||
| | Liabilities Less Other Assets (18.0)% | (5,401,999 | ) | |||||
|
| |||||||
| Net Assets 100.0% | $ | 29,937,942 | ||||||
|
| |||||||
The accompanying notes are an integral part of the financial statements.
| † | Non-income producing security. |
| (a) | All or a portion of the security was on loan as of September 30, 2014. |
| 18 | SCHEDULEOF INVESTMENTS |
Table of Contents
MANAGEMENT OVERVIEW (UNAUDITED) | Class S Class C Class A | ICENX ICEEX ICEAX |
| Q. | How did the Fund perform relative to its benchmarks? |
| A. | For the fiscal year ending September 30, 2014, the ICON Energy Fund Class S returned 1.92%, underperforming its sector-specific benchmark, the S&P Composite 1500 Energy Index, which returned 11.11%. The ICON Energy Fund also lagged the broad benchmark, the S&P Composite 1500 Index, which returned 18.57%. Total returns for other periods and additional Class shares as of September 30, 2014, appear in the subsequent pages of this Fund’s Management Overview. |
| Q. | What primary factors were behind the Fund’s relative performance? |
| A. | The Energy sector’s underperformance relative to the broader market was particularly disappointing given ICON’s valuation readings for the sector overall. On October 1, 2013, ICON calculated a value-to-price (V/P) ratio for the Energy sector at 1.11, and ICON’s average V/P ratio for the overall market was .99 at the time. While the 11.11% rise in the Energy sector was in line with our estimation of the sector’s value, the 18.57% raise in the broader market was somewhat surprising. Both domestic oil and natural gas production continued to increase over the course of the fiscal year through the development of unconventional reserves. While this should have resulted in upward pricing pressure in the energy sector, these positive conditions appeared to be tempered by an oil price decline late in the fiscal year. |
At the start of the fiscal year, Brent oil was priced at around $108 a barrel. Through most of the year oil pricing was fairly stable reaching a low of $103 in early November 2013 and a high of $115 in mid-June. Since the high, the oil price faced significant downward pressure as global economies showed signs of slowing. Additional price pressure on oil came from a strengthening U.S. dollar, which, since the end of June, has appreciated about 7.7% against a basket of major world currencies. By the end of the fiscal year, Brent fell below $95 a barrel. Prior to the end of June, the Energy sector was outpreforming the broader market. From the end of June to the end of the fiscal year the S&P Composite 1500 Energy Index fell over 9.0%, resulting in the sector lagging the broader market for the fiscal year.
| Q. | How did the Fund’s composition affect performance? |
| A. | The Fund’s composition had a large impact on its relative underperformance compared to the S&P 1500 Energy Index. Over the |
| MANAGEMENT OVERVIEW | 19 |
Table of Contents
| course of the fiscal year, the oil & gas equipment and services industry was the largest over weight industry in the Fund compared to the benchmark. The overweight position was based in large part on its attractive V/P readings. While the oil & gas equipment and services industry did outpace the broader S&P Composite 1500 Energy Index, up over 15% during the fiscal year, the Fund’s stock selection for the industry was a significant detractor from the Fund’s returns. Individual stocks from the industry that had attractive valuation, based on our methodology, underperformed, especially in the first half of 2014. As the price per barrel of oil reached a high of $115 in mid-June, it appeared the stocks that lead the Energy sector were trading based on momentum while the stocks with attractive valuations based on our methodology lagged notably. The net result was that the stocks selected to represent the oil & gas equipment industry in the Fund had negative returns, which was the single biggest factor in the Fund’s underperformance. |
The oil & gas refining and marketing industry was the second largest overweight industry in the Fund compared to the benchmark during the fiscal year. On average, the stocks held in the Fund from this industry, were up over 35% and had a positive impact on the Fund’s performance compared to its benchmark. Additionally, the Fund held stocks from the gas utilities industry, which also had a positive effect on the Fund’s relative performance to the benchmark. However, the positive impact of holdings in these two industries was not sufficient to overcome the negative impact from the oil & gas equipment and services industry discussed earlier.
| Q. | What is your investment outlook for the Energy sector? |
| A. | At the end of the fiscal year the average V/P ratio for the Energy sector was 1.11 while the average V/P ratio for the overall market was 1.06. As discussed earlier, the last quarter of the fiscal year saw a large drop in the price of crude oil, which, in turn, lead to downward pressure on forward looking earnings per share for companies with the most exposure to oil pricing. As a result of this negative pressure on a key component of our valuation equation in the Energy sector, the Fund has taken advantage of its ability to hold securities outside of the energy sector. The Fund, as of the end of the fiscal year, has holdings in both the gas utilities and multi-utilities industries in the Utilities sector as well as the railroads industry in the Utilities sector. Over the course of the upcoming fiscal year we are looking for sign of stabilization in forward looking earnings within the Energy sector and will reposition the Fund as our valuation methodology dictates. |
| 20 | MANAGEMENT OVERVIEW |
Table of Contents
ICON Energy Fund
Sector Composition
September 30, 2014
Energy | 84.8% | |||
Utilities | 8.1% | |||
Industrials | 1.8% | |||
|
| |||
| 94.7% | ||||
|
|
Percentages are based upon common stocks as a percentage of net assets.
ICON Energy Fund
Industry Composition
September 30, 2014
Oil & Gas Equipment & Services | 36.7% | |||
Oil & Gas Exploration & Production | 29.1% | |||
Oil & Gas Refining & Marketing | 8.1% | |||
Integrated Oil & Gas | 7.2% | |||
Gas Utilities | 4.8% | |||
Oil & Gas Drilling | 3.7% | |||
Multi-Utilities | 3.3% | |||
Railroads | 1.8% | |||
|
| |||
| 94.7% | ||||
|
|
Percentages are based upon common stocks as a percentage of net assets.
| MANAGEMENT OVERVIEW | 21 |
Table of Contents
ICON Energy Fund
Average Annual Total Return
as of September 30, 2014
| Inception Date | 1 Year | 5 Years | 10 Years | Since Inception | Gross Expense Ratio* | Net Expense Ratio* | ||||||||||||||||||||||
ICON Energy Fund - Class S | 11/5/97 | 1.92% | 7.83% | 10.20% | 11.59% | 1.29% | 1.29% | |||||||||||||||||||||
ICON Energy Fund - Class C | 9/30/10 | 0.83% | N/A | N/A | 8.74% | 2.35% | 2.35% | |||||||||||||||||||||
ICON Energy Fund - Class A | 9/30/10 | 1.67% | N/A | N/A | 9.59% | 1.61% | 1.61% | |||||||||||||||||||||
ICON Energy Fund - Class A (including maximum sales charge of 5.75%) | 9/30/10 | -4.16% | N/A | N/A | 7.98% | 1.61% | 1.61% | |||||||||||||||||||||
S&P 1500 Energy Index | 11.11% | 12.38% | 11.28% | 9.71% | N/A | N/A | ||||||||||||||||||||||
S&P Composite 1500 Index | 18.57% | 15.79% | 8.34% | 6.74% | N/A | N/A | ||||||||||||||||||||||
Past performance is not a guarantee of future results. Information about these performance results and the comparative indexes can be found in the About This Report section. The Adviser has agreed to limit certain Fund expenses; without these limitations, returns would have been lower. The limitation provisions may be terminated in the future.
| * | Please see the most recent prospectus for details. |
Class C total returns exclude applicable sales charges. If sales charges were included returns would be lower.
| 22 | MANAGEMENT OVERVIEW |
Table of Contents
ICON Energy Fund
Value of a $10,000 Investment
through September 30, 2014
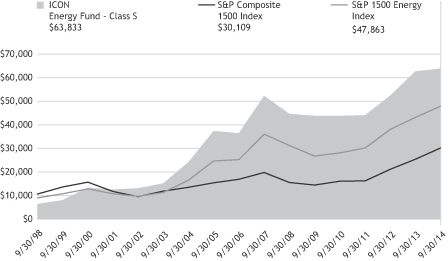
Past performance is not a guarantee of future results. The above graph compares a $10,000 investment made in the Fund’s Class S shares on the Class’ inception date of 11/5/97 to a $10,000 investment made in unmanaged securities indexes on that date. The Fund’s performance in this chart and the performance table assumes the reinvestment of dividends and capital gain distributions but does not reflect the deduction of taxes that a shareholder would pay on Fund distributions or on the redemption of Fund shares.
| MANAGEMENT OVERVIEW | 23 |
Table of Contents
ICON ENERGY FUND
SCHEDULEOF INVESTMENTS
SEPTEMBER 30, 2014
| Shares or Principal Amount | Value | |||||||
| Common Stocks (94.7%) | ||||||||
| 93,600 | Anadarko Petroleum Corp. | $ | 9,494,784 | |||||
| 346,600 | Atmos Energy Corp. | 16,532,820 | ||||||
| 305,700 | Baker Hughes, Inc. | 19,888,842 | ||||||
| 297,200 | Bristow Group, Inc. | 19,971,840 | ||||||
| 244,600 | Cameron International Corp.† | 16,236,548 | ||||||
| 123,800 | Chevron Corp. | 14,771,816 | ||||||
| 740,200 | CMS Energy Corp. | 21,954,332 | ||||||
| 312,700 | ConocoPhillips | 23,927,804 | ||||||
| 207,400 | Continental Resources, Inc.†(a) | 13,787,952 | ||||||
| 218,800 | Dril-Quip, Inc.† | 19,560,720 | ||||||
| 275,600 | EOG Resources, Inc. | 27,289,912 | ||||||
| 441,200 | EQT Corp. | 40,387,448 | ||||||
| 345,300 | Exxon Mobil Corp. | 32,475,465 | ||||||
| 392,200 | FMC Technologies, Inc.† | 21,300,382 | ||||||
| 410,300 | Halliburton Co. | 26,468,453 | ||||||
| 249,400 | Helmerich & Payne, Inc. | 24,408,778 | ||||||
| 322,000 | Laclede Group, Inc. | 14,940,800 | ||||||
| 103,100 | Marathon Petroleum Corp. | 8,729,477 | ||||||
| 305,500 | National Oilwell Varco, Inc. | 23,248,550 | ||||||
| 198,800 | Noble Energy, Inc. | 13,589,968 | ||||||
| Shares or Principal Amount | Value | |||||||
| 105,800 | Norfolk Southern Corp. | $ | 11,807,280 | |||||
| 518,800 | Oceaneering International, Inc. | 33,810,196 | ||||||
| 187,850 | Phillips 66 | 15,274,083 | ||||||
| 321,300 | RigNet, Inc.† | 12,996,585 | ||||||
| 478,700 | Schlumberger, Ltd. | 48,679,003 | ||||||
| 370,800 | SM Energy Co. | 28,922,400 | ||||||
| 338,200 | Southwestern Energy Co.† | 11,820,090 | ||||||
| 210,600 | Tesoro Corp. | 12,842,388 | ||||||
| 360,300 | Valero Energy Corp. | 16,671,081 | ||||||
| 294,800 | Whiting Petroleum Corp.† | 22,861,740 | ||||||
|
| |||||||
| | Total Common Stocks (Cost $597,025,133) | 624,651,537 | ||||||
| Collateral for Securities on Loan (1.8%) | ||||||||
| 11,860,729 | State Street Navigator Prime Portfolio, 0.15% | 11,860,729 | ||||||
|
| |||||||
|
| Total Collateral for Securities on Loan (Cost $11,860,729) | 11,860,729 | ||||||
| Short-Term Investments (5.7%) | ||||||||
| $ | 37,692,998 | State Street Euro Dollar Time Deposit (USD), 0.01%, 10/01/14 | 37,692,998 | |||||
|
| |||||||
| | Total Short-Term Investments (Cost $37,692,998) | 37,692,998 | ||||||
| | Total Investments 102.2% (Cost $646,578,860) | 674,205,264 | ||||||
| | Liabilities Less Other Assets (2.2)% | (14,798,990 | ) | |||||
|
| |||||||
| Net Assets 100.0% | $ | 659,406,274 | ||||||
|
| |||||||
The accompanying notes are an integral part of the financial statements.
| † | Non-income producing security. |
(a) All or a portion of the security was on loan as of September 30, 2014.
| 24 | SCHEDULEOF INVESTMENTS |
Table of Contents
MANAGEMENT OVERVIEW (UNAUDITED) | Class S Class C Class A | ICFSX ICOCX ICFAX |
| Q. | How did the Fund perform relative to its benchmarks? |
| A. | The ICON Financial Fund (the Fund) Class S returned 7.27% for the fiscal year ending September 30, 2014, lagging both its sector-specific benchmark, the S&P Composite 1500 Financial Index, which returned 17.04%, and its broad benchmark, the S&P Composite 1500 Index, which returned 18.57%. Total returns for other periods and additional Class shares as of September 30, 2014 appear in the subsequent pages of this Fund’s Management Overview. |
| Q. | What primary factors were behind the Fund’s relative performance? |
| A. | For most of the fiscal year the government yield curve remained relatively steep. This is generally a positive environment for the banking stocks within the Financial sector. However, most of the benefit of the steep yield curve was offset by narrow credit spreads, reducing the profitability of banking stocks that rely primarily on lending revenue. Companies in the regional banks industry were up about 12% for the fiscal year and companies in the thrifts & mortgage industry were up only about 6%. Both of these industries lagged behind the 18.57% return for the broader market. |
Lending standards remained bifurcated over the fiscal year as consumer lending policies eased while mortgage lending practices remained tight. When analyzing the amount of dollars lent by segmented and credit score, low credit score mortgage loans still have not returned to pre-2008 levels. That is in stark contrast to auto lending, which has experienced a notable recovery. These tight lending practices in mortgage lending led to lower growth in the mortgage finance markets, a negative environment for the Financial sector.
| Q. | How did the Fund’s composition affect performance? |
| A. | At the start of the fiscal year the value-to-price (V/P) ratio for the Financial sector was .93 according to our methodology, the lowest value of any sector in the market. Based on this weak valuation reading, the Fund held cash during the course of the fiscal year. Given the strong returns in the Financial sector over the fiscal year, the Fund’s cash position was the largest detractor from overall performance. While the consumer finance industry had positive returns, up over 17% during the fiscal year, the stocks from the industry selected to be held in the Fund |
| MANAGEMENT OVERVIEW | 25 |
Table of Contents
| underperformed, causing the next largest detraction from the Fund’s performance relative to the benchmark. World Acceptance Corp., a consumer finance company, detracted from the Fund’s performance as it fell nearly 20% by the end of March 2014 as the Consumer Financial Protection Bureau began an inquiry into the company’s lending practices. |
The Fund was overweight in the real estate services industry during the course of the fiscal year and the Fund’s holdings in that industry contributed to the Fund’s returns. The Fund’s holdings in the property & casualty insurance industry also had a positive impact on the Fund’s performance. However, the positive impact of holdings in these two industries was not enough to overcome the underperformance discussed earlier.
| Q. | What is your investment outlook for the Financials sector? |
| A. | As of September 30, 2014, the average V/P ratio for the Financial sector was 1.11 while the average V/P ratio for the overall market was 1.06. Based on our valuation methodology, several industries in the Financial sector are attractive to our system looking forward. The real estate services, asset management & custody banks, and consumer finance industries all have V/P ratios greater than 1.20. As such, the Fund is heavily weighted in these industries. We will continue to look for opportunities in the Financial sector over the year as guided by value. |
ICON Financial Fund
Sector Composition
September 30, 2014
Financial | 92.8% | |||
Information Technology | 2.2% | |||
|
| |||
| 95.0% | ||||
|
|
Percentages are based upon common stocks as a percentage of net assets.
ICON Financial Fund
Industry Composition
September 30, 2014
Asset Management & | 21.5% | |||
Diversified Banks | 17.5% | |||
Consumer Finance | 16.8% | |||
Regional Banks | 9.9% | |||
Real Estate Services | 7.8% | |||
Health Care REITs | 5.4% | |||
Property & Casualty Insurance | 4.8% | |||
Multi-line Insurance | 4.1% | |||
Insurance Brokers | 3.0% | |||
Data Processing & | 2.2% | |||
Specialized Finance | 2.0% | |||
|
| |||
| 95.0% | ||||
|
|
Percentages are based upon common stocks as a percentage of net assets.
| 26 | MANAGEMENT OVERVIEW |
Table of Contents
ICON Financial Fund
Average Annual Total Return
as of September 30, 2014
| Inception Date | 1 Year | 5 Years | 10 Years | Since Inception | Gross Expense Ratio* | Net Expense Ratio* | ||||||||||||||||||||||
ICON Financial Fund - Class S | 7/1/97 | 7.27% | 6.88% | -1.02% | 3.79% | 1.47% | 1.47% | |||||||||||||||||||||
ICON Financial Fund - | 9/30/10 | 7.93% | N/A | N/A | 9.23% | 3.19% | 2.51% | |||||||||||||||||||||
ICON Financial Fund - | 9/30/10 | 7.20% | N/A | N/A | 9.72% | 1.88% | 1.76% | |||||||||||||||||||||
ICON Financial Fund - Class A (including maximum sales charge of 5.75%) | 9/30/10 | 1.02% | N/A | N/A | 8.11% | 1.88% | 1.76% | |||||||||||||||||||||
S&P 1500 Financials Index | 17.04% | 11.34% | 0.77% | 4.14% | N/A | N/A | ||||||||||||||||||||||
S&P Composite 1500 Index | 18.57% | 15.79% | 8.34% | 7.04% | N/A | N/A | ||||||||||||||||||||||
Past performance is not a guarantee of future results. Information about these performance results and the comparative indexes can be found in the About This Report section. The Adviser has agreed to limit certain Fund expenses; without these limitations, returns would have been lower. The limitation provisions may be terminated in the future.
| * | Please see the most recent prospectus for details. |
Class C total returns exclude applicable sales charges. If sales charges were included returns would be lower.
| MANAGEMENT OVERVIEW | 27 |
Table of Contents
ICON Financial Fund
Value of a $10,000 Investment
through September 30, 2014
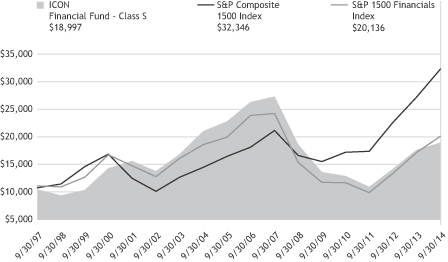
Past performance is not a guarantee of future results. The above graph compares a $10,000 investment made in the Fund’s Class S shares on the Class’ inception date of 7/1/97 to a $10,000 investment made in unmanaged securities indexes on that date. The Fund’s performance in this chart and the performance table assumes the reinvestment of dividends and capital gain distributions but does not reflect the deduction of taxes that a shareholder would pay on Fund distributions or on the redemption of Fund shares.
| 28 | MANAGEMENT OVERVIEW |
Table of Contents
ICON FINANCIAL FUND
SCHEDULEOF INVESTMENTS
SEPTEMBER 30, 2014
| Shares or Principal Amount | Value | |||||||
| Common Stocks (95.0%) | ||||||||
| 4,900 | Affiliated Managers Group, Inc.† | $ | 981,764 | |||||
| 2,900 | Alliance Data Systems Corp.† | 719,983 | ||||||
| 16,100 | American Express Co. | 1,409,394 | ||||||
| 8,400 | American Financial Group, Inc. | 486,276 | ||||||
| 15,900 | American International Group, Inc. | 858,918 | ||||||
| 4,900 | Aon PLC | 429,583 | ||||||
| 24,400 | BancorpSouth, Inc. | 491,416 | ||||||
| 14,500 | BB&T Corp. | 539,545 | ||||||
| 17,700 | Brown & Brown, Inc. | 569,055 | ||||||
| 10,100 | Credicorp, Ltd. | 1,549,239 | ||||||
| 15,900 | Discover Financial Services | 1,023,801 | ||||||
| 13,400 | Eaton Vance Corp. | 505,582 | ||||||
| 34,500 | Encore Capital Group, Inc.†(a) | 1,528,695 | ||||||
| 22,000 | FirstService Corp. | 1,148,840 | ||||||
| 11,700 | GAMCO Investors, Inc. | 827,658 | ||||||
| 32,000 | Glacier Bancorp, Inc. | 827,520 | ||||||
| 16,700 | HCP, Inc., REIT | 663,157 | ||||||
| 14,700 | Invesco, Ltd. | 580,356 | ||||||
| 20,000 | Janus Capital Group, Inc.(a) | 290,800 | ||||||
| 11,100 | Jones Lang LaSalle, Inc. | 1,402,374 | ||||||
| 28,900 | JPMorgan Chase & Co. | 1,740,936 | ||||||
| 13,700 | Main Street Capital Corp. | 419,768 | ||||||
| 7,000 | Moody’s Corp. | 661,500 | ||||||
| 5,500 | Northern Trust Corp. | 374,165 | ||||||
| Shares or Principal Amount | Value | |||||||
| 13,400 | Omega Healthcare Investors, Inc., REIT | $ | 458,146 | |||||
| 16,600 | Portfolio Recovery Associates, Inc.† | 867,018 | ||||||
| 34,400 | SEI Investments Co. | 1,243,904 | ||||||
| 8,000 | Signature Bank† | 896,480 | ||||||
| 4,600 | SVB Financial Group† | 515,614 | ||||||
| 9,400 | T Rowe Price Group, Inc. | 736,960 | ||||||
| 18,400 | U.S. Bancorp | 769,672 | ||||||
| 10,600 | Ventas, Inc., REIT | 656,670 | ||||||
| 21,700 | Waddell & Reed Financial, Inc., Class A | 1,121,673 | ||||||
| 32,800 | Wells Fargo & Co. | 1,701,336 | ||||||
| 10,600 | World Acceptance Corp.† | 715,500 | ||||||
| 21,200 | WR Berkley Corp. | 1,013,360 | ||||||
| 16,500 | XL Group PLC | 547,305 | ||||||
|
| |||||||
| | Total Common Stocks (Cost $30,739,675) | 31,273,963 | ||||||
| Collateral for Securities on Loan (5.7%) | ||||||||
| 1,860,075 | State Street Navigator Prime Portfolio, 0.15% | 1,860,075 | ||||||
|
| |||||||
|
| Total Collateral for Securities on Loan (Cost $1,860,075) | 1,860,075 | ||||||
| Short-Term Investments (3.6%) | ||||||||
| $ | 1,173,764 | State Street Euro Dollar Time Deposit (USD), 0.01%, 10/01/14 | 1,173,764 | |||||
|
| |||||||
| | Total Short-Term Investments (Cost $1,173,764) | 1,173,764 | ||||||
| | Total Investments 104.3% (Cost $33,773,514) | 34,307,802 | ||||||
| | Liabilities Less Other Assets (4.3)% | (1,410,073 | ) | |||||
|
| |||||||
| Net Assets 100.0% | $ | 32,897,729 | ||||||
|
| |||||||
| SCHEDULEOF INVESTMENTS | 29 |
Table of Contents
The accompanying notes are an integral part of the financial statements.
| † | Non-income producing security. |
| (a) | All or a portion of the security was on loan as of September 30, 2014. |
REIT Real Estate Investment Trust
| 30 | SCHEDULEOF INVESTMENTS |
Table of Contents
MANAGEMENT OVERVIEW (UNAUDITED) | Class S Class C Class A | ICHCX ICHEX ICHAX |
| Q. | How did the Fund perform relative to its benchmarks? |
| A. | The ICON Healthcare Fund (the Fund) Class S returned 32.27% for the fiscal year ended September 30, 2014, outperforming both its sector-specific benchmark, the S&P Composite1500 Health Care Index, which returned 27.47%, and its broad benchmark, the S&P Composite 1500 Index, which returned 18.57%. Total returns for other periods and additional Class shares as of September 30, 2014, appear in the subsequent pages of this Fund’s Management Overview. |
| Q. | What primary factors were behind the Fund’s relative performance? |
| A. | The broad market performed well over the past year, and the Health Care sector outperformed all other sectors in the U.S. equity market. Despite many of the ongoing geopolitical concerns and worries about the pace of economic growth, the U.S. economy has remained stronger than much of the world, which has provided a boost to the local equity markets. As the U.S. Federal Reserve winds down its quantitative easing program, interest rates remain low and monetary policy remains loose. Mergers & acquisitions in the sector, as well as ongoing advancements in biotechnology and pharmaceutical companies and industries, factored in to the sector’s gains. The Health Care sector enjoyed a relatively steady climb higher over the year with very few periods of drops in prices as a whole. The latter half of the fiscal year brought gains, but not without periods of volatility. Despite the positive gains, the sector remained overvalued according to our methodology for much of the fiscal year, which in turn resulted in cash positions being held in the Fund. Despite cash positions, our system found opportunities in a number of industries, and ultimately the Fund was able to capitalize on these opportunities and outperform the benchmark for the fiscal year. |
| Q. | What were the Fund’s greatest contributors/detractors? |
| A. | Pharmaceuticals was the greatest industry contributor to the Fund’s outperformance relative to the benchmark during the fiscal year. Despite being underweight in the pharmaceuticals industry relative to the benchmark, the Fund was able to outperform based on individual stock selection within the industry over the period. Companies like Actavis Inc. and Perrigo Co. Plc were strong contributors to relative performance. Additionally, the biotechnology industry contributed to the Fund’s relative performance, as the industry showed the best value according to |
| MANAGEMENT OVERVIEW | 31 |
Table of Contents
| our methodology coming into the year and was ultimately the top performer of the ten industries within the Health Care sector. The Fund’s overweight position in the biotechnology industry relative to the benchmark and stock selection within the industry, including companies such as Biogen Idec and Gilead Sciences, contributed to the Fund’s performance. |
The life sciences tools & services industry was the Fund’s largest detractor to relative performance on an industry level, as overweight positions in Covance and PerkinElmer underperformed relative to the benchmark. The health care equipment industry was also a slight detractor to relative performance from holdings in St. Jude Medical and Thoratec. Additionally, as our value metrics indicated over-priced conditions for the Health Care stocks as whole, cash was held for temporary defensive reasons. The cash position was a detractor to performance during the period.
| Q. | What is your investment outlook for the Health Care sector? |
| A. | According to our methodology, Health Care has one of the lowest valuation readings of all the sectors in the market with a value-to-price (V/P) ratio of 1.00; in other words, we see Health Care stocks currently trading at our estimate of fair value. This relatively low value reading has been the case for most of the last year and the Fund’s cash position has been increased with the expectation that if value increases there will be better opportunities in the future. However, not all industries within the sector are over-priced. We continue to see the best upside in industries such as biotechnology, health care distributors, and life sciences tools & services. As always, we look to value as our primary guide and will adjust our positioning as market conditions dictate. |
ICON Healthcare Fund
Sector Composition
September 30, 2014
Health Care | 78.9% | |||
|
| |||
| 78.9% | ||||
|
|
Percentages are based upon common stocks as a percentage of net assets.
ICON Healthcare Fund
Industry Composition
September 30, 2014
Pharmaceuticals | 26.2% | |||
Health Care Equipment | 20.2% | |||
Biotechnology | 15.9% | |||
Health Care Distributors | 8.0% | |||
Life Sciences Tools & Services | 7.0% | |||
Health Care Services | 1.0% | |||
Health Care Supplies | 0.6% | |||
|
| |||
| 78.9% | ||||
|
|
Percentages are based upon common stocks as a percentage of net assets.
| 32 | MANAGEMENT OVERVIEW |
Table of Contents
ICON Healthcare Fund Average Annual Total Return
as of September 30, 2014
| Inception Date | 1 Year | 5 Years | 10 Years | Since Inception | Gross Expense Ratio* | Net Expense Ratio* | ||||||||||||||||||||||
ICON Healthcare Fund - Class S | 2/24/97 | 32.27% | 19.90% | 10.44% | 10.98% | 1.39% | 1.39% | |||||||||||||||||||||
ICON Healthcare Fund - Class C | 9/30/10 | 30.73% | N/A | N/A | 22.47% | 4.42% | 2.50% | |||||||||||||||||||||
ICON Healthcare Fund - Class A | 9/30/10 | 31.72% | N/A | N/A | 23.36% | 1.69% | 1.69% | |||||||||||||||||||||
ICON Healthcare Fund - Class A (including maximum sales charge of 5.75%) | 9/30/10 | 24.13% | N/A | N/A | 21.54% | 1.69% | 1.69% | |||||||||||||||||||||
S&P 1500 Health Care Index | 27.47% | 20.06% | 10.75% | 9.47% | N/A | N/A | ||||||||||||||||||||||
S&P Composite 1500 Index | 18.57% | 15.79% | 8.34% | 7.51% | N/A | N/A | ||||||||||||||||||||||
Past performance is not a guarantee of future results. Information about these performance results and the comparative indexes can be found in the About This Report section. The Adviser has agreed to limit certain Fund expenses; without these limitations, returns would have been lower. The limitation provisions may be terminated in the future.
| * | Please see the most recent prospectus for details. |
Class C total returns exclude applicable sales charges. If sales charges were included returns would be lower.
| MANAGEMENT OVERVIEW | 33 |
Table of Contents
ICON Healthcare Fund
Value of a $10,000 Investment
through September 30, 2014
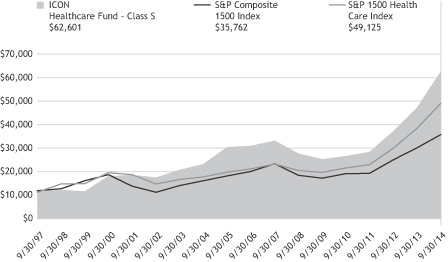
Past performance is not a guarantee of future results. The above graph compares a $10,000 investment made in the Fund’s Class S shares on the Class’ inception date of 2/24/97 to a $10,000 investment made in unmanaged securities indexes on that date. The Fund’s performance in this chart and the performance table assumes the reinvestment of dividends and capital gain distributions but does not reflect the deduction of taxes that a shareholder would pay on Fund distributions or on the redemption of Fund shares.
| 34 | MANAGEMENT OVERVIEW |
Table of Contents
ICON HEALTHCARE FUND
SCHEDULEOF INVESTMENTS
SEPTEMBER 30, 2014
| Shares or Principal Amount | Value | |||||||
| Common Stocks (78.9%) | ||||||||
| 155,000 | AbbVie, Inc. | $ | 8,952,800 | |||||
| 28,775 | Actavis PLC† | 6,942,832 | ||||||
| 24,400 | Alexion Pharmaceuticals, Inc.† | 4,046,008 | ||||||
| 34,000 | Allergan, Inc. | 6,058,460 | ||||||
| 89,500 | Baxter International, Inc. | 6,423,415 | ||||||
| 21,300 | Biogen Idec, Inc.† | 7,046,253 | ||||||
| 15,000 | Cambrex Corp.† | 280,200 | ||||||
| 63,800 | Cardinal Health, Inc. | 4,779,896 | ||||||
| 59,800 | Celgene Corp.† | 5,667,844 | ||||||
| 46,000 | Covance, Inc.† | 3,620,200 | ||||||
| 18,000 | CR Bard, Inc. | 2,568,780 | ||||||
| 26,500 | Cyberonics, Inc.† | 1,355,740 | ||||||
| 27,000 | Emergent Biosolutions, Inc.† | 575,370 | ||||||
| 35,282 | Gilead Sciences, Inc.† | 3,755,769 | ||||||
| 52,000 | Globus Medical, Inc.† | 1,022,840 | ||||||
| 14,400 | Jazz Pharmaceuticals PLC† | 2,312,064 | ||||||
| 78,700 | Johnson & Johnson | 8,388,633 | ||||||
| 118,000 | Lannett Co., Inc.† | 5,390,240 | ||||||
| 41,000 | McKesson Corp. | 7,981,470 | ||||||
| 29,000 | MEDNAX, Inc.† | 1,589,780 | ||||||
| 101,700 | Medtronic, Inc. | 6,300,315 | ||||||
| 52,000 | PerkinElmer, Inc. | 2,267,200 | ||||||
| Shares or Principal Amount | Value | |||||||
| 14,100 | Perrigo Co. PLC | $ | 2,117,679 | |||||
| 11,900 | Regeneron Pharmaceuticals, Inc.† | 4,290,188 | ||||||
| 107,500 | St Jude Medical, Inc. | 6,463,975 | ||||||
| 72,000 | Stryker Corp. | 5,814,000 | ||||||
| 41,000 | Thermo Fisher Scientific, Inc. | 4,989,700 | ||||||
| 41,000 | Thoratec Corp.† | 1,095,930 | ||||||
| 12,300 | Valeant Pharmaceuticals International, Inc.† | 1,613,760 | ||||||
| 18,000 | Varian Medical Systems, Inc.† | 1,442,160 | ||||||
| 22,800 | West Pharmaceutical Services, Inc. | 1,020,528 | ||||||
|
| |||||||
|
| Total Common Stocks (Cost $117,273,334) | 126,174,029 | ||||||
| Short-Term Investments (25.7%) | ||||||||
| $ | 41,082,556 | State Street Euro Dollar Time Deposit (USD), 0.01%, 10/01/14 | 41,082,556 | |||||
|
| |||||||
| | Total Short-Term Investments (Cost $41,082,556) | 41,082,556 | ||||||
| | Total Investments 104.6% (Cost $158,355,890) | 167,256,585 | ||||||
| | Liabilities Less Other Assets (4.6)% | (7,402,058 | ) | |||||
|
| |||||||
| Net Assets 100.0% | $ | 159,854,527 | ||||||
|
| |||||||
The accompanying notes are an integral part of the financial statements.
| † | Non-income producing security. |
| SCHEDULEOF INVESTMENTS | 35 |
Table of Contents
MANAGEMENT OVERVIEW (UNAUDITED) | Class S Class C | ICTRX ICICX ICIAX |
| Q. | How did the Fund perform relative to its benchmarks? |
| A. | The ICON Industrials Fund (the Fund) Class S shares returned 11.14% for the fiscal year ended September 30, 2014, while its sector-specific benchmark, the S&P 1500 Industrials Index, returned 15.27%, and the S&P Composite 1500 Index returned 18.57%. Total returns for other periods and additional Class shares as of September 30, 2014, appear in the subsequent pages of this Fund’s Management Overview. |
| Q. | What primary factors were behind the Fund’s relative performance? |
| A. | The broad U.S. market performed well over the course of fiscal year 2014. Performance this year, during the continuation of a multi-year rally, was notably impressive considering the headwinds investors faced such as economic growth concerns internationally, especially in relation to China and Europe, and the winding down of the U.S. Federal Reserve’s quantitative easing program. Despite tapering, interest rates remained low and monetary policy continued to be accommodative. Further, the U.S. economy continued to show signs of improvement, providing a boost to domestic equity markets. The Industrials sector, however, lagged the broad U.S. market during the period. |
From a valuation standpoint, according to our system, we began the period with a value-to-price (V/P) ratio of 1.04 for the Industrials sector. Fiscal year 2014 saw a continuation of leadership in industries in the Industrials sector that are more closely tied to domestic economic growth, a trend that began in fiscal year 2013. Transportation-related stocks in particular were among the strongest performers in the sector and U.S. markets as a whole, during fiscal year 2014. Seeing good value in several transportation-related industries, the Fund participated in this trend thanks to overweight positions in the airlines, railroads and trucking industries. The airlines industry led the sector, as carriers have maintained capacity discipline since slashing available seats during the previous recession, resulting in better pricing power and improved growth expectations. The benchmark’s heaviest weighted industry, aerospace & defense, posted solid returns during the period. However, because we saw better values in other areas of the sector, the Fund was underweight this industry during the period. Selection effect, primarily related to aerospace & defense, was a key driver of Fund underperformance relative to the benchmark during fiscal year 2014.
| 36 | MANAGEMENT OVERVIEW |
Table of Contents
| Q. | How did the Fund’s composition affect performance? |
| A. | Investors clearly favored transportation-related industries during fiscal year 2014, as these industries outperformed all other industries in the sector. Indeed, airlines, railroads, and trucking each returned in excess of 28% during the period while the next closest industry returned 18%, highlighting the importance of industry allocation. |
The top industry contributors to Fund performance during fiscal year 2014 included railroads, aerospace & defense, airlines, and industrial machinery. The research & consulting services and construction & engineering industries detracted from performance.
From a total effect standpoint, industries that helped the Fund relative to the benchmark included electrical components & equipment, industrial machinery, security & alarm services, railroads and trucking. Although the aerospace & defense industry was a key contributor to absolute performance of the Fund, stock selection caused it to detract from benchmark relative performance. Other industries that detracted from performance relative to the benchmark included construction & engineering and trading companies & distributors. With equity valuations appearing stretched at times during the period, a higher than average allocation to cash was used for defensive purposes, which detracted from benchmark relative performance.
| Q. | What is your investment outlook for the Industrials sector? |
| A. | At the end of fiscal year 2014, the Industrials sector had a V/P ratio of 1.07, indicating that our system still sees upside potential for the sector. Specific industries that are showing value according to our system are airlines and railroads. We continue to look for industries that our system identifies as trading at a discount to fair value. Guided by our disciplined, systematic and non-emotional approach to investing, we see several opportunities in the current environment and remain watchful for new prospective investments. As always we remain ready to reallocate and adapt as our investment system dictates. |
| MANAGEMENT OVERVIEW | 37 |
Table of Contents
ICON Industrials Fund
Sector Composition
September 30, 2014
Industrials | 98.4% | |||
|
| |||
| 98.4% | ||||
|
|
Percentages are based upon common stocks as a percentage of net assets.
ICON Industrials Fund
Industry Composition
September 30, 2014
Aerospace & Defense | 22.2% | |||
Railroads | 16.0% | |||
Industrial Machinery | 10.8% | |||
Airlines | 9.9% | |||
Industrial Conglomerates | 8.9% | |||
Trading Companies & Distributors | 7.0% | |||
Construction & Engineering | 5.9% | |||
Security & Alarm Services | 4.3% | |||
Construction & Farm Machinery & Heavy Trucks | 3.9% | |||
Trucking | 3.8% | |||
Diversified Support Services | 3.1% | |||
Electrical Components & Equipment | 1.7% | |||
Research & Consulting Services | 0.9% | |||
|
| |||
| 98.4% | ||||
|
|
Percentages are based upon common stocks as a percentage of net assets.
| 38 | MANAGEMENT OVERVIEW |
Table of Contents
ICON Industrials Fund
Average Annual Total Return
as of September 30, 2014
| Inception Date | 1 Year | 5 Years | 10 Years | Since Inception | Gross Expense Ratio* | Net Expense Ratio* | ||||||||||||||||||||||
ICON Industrials Fund - Class S | 5/9/97 | 11.14% | 14.17% | 7.17% | 5.43% | 1.46% | 1.46% | |||||||||||||||||||||
ICON Industrials Fund - Class C | 9/30/10 | 9.95% | N/A | N/A | 11.65% | 9.86% | 2.50% | |||||||||||||||||||||
ICON Industrials Fund - Class A | 9/30/10 | 10.81% | N/A | N/A | 12.17% | 2.09% | 1.75% | |||||||||||||||||||||
ICON Industrials Fund - Class A (including maximum sales charge of 5.75%) | 9/30/10 | 4.42% | N/A | N/A | 10.51% | 2.09% | 1.75% | |||||||||||||||||||||
S&P 1500 Industrials Index | 15.27% | 17.38% | 8.73% | 7.89% | N/A | N/A | ||||||||||||||||||||||
S&P Composite 1500 Index | 18.57% | 15.79% | 8.34% | 7.48% | N/A | N/A | ||||||||||||||||||||||
Past performance is not a guarantee of future results. Information about these performance results and the comparative indexes can be found in the About This Report section. The Adviser has agreed to limit certain Fund expenses; without these limitations, returns would have been lower. The limitation provisions may be terminated in the future.
| * | Please see the most recent prospectus for details. |
Class C total returns exclude applicable sales charges. If sales charges were included returns would be lower.
| MANAGEMENT OVERVIEW | 39 |
Table of Contents
ICON Industrials Fund
Value of a $10,000 Investment
through September 30, 2014
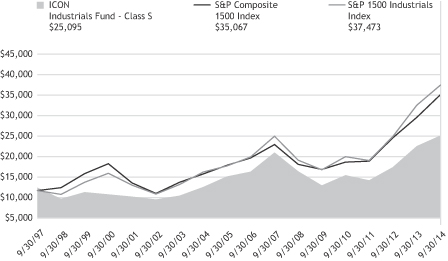
Past performance is not a guarantee of future results. The above graph compares a $10,000 investment made in the Fund’s Class S shares on the Class’ inception date of 5/9/97 to a $10,000 investment made in unmanaged securities indexes on that date. The Fund’s performance in this chart and the performance table assumes the reinvestment of dividends and capital gain distributions but does not reflect the deduction of taxes that a shareholder would pay on Fund distributions or on the redemption of Fund shares.
| 40 | MANAGEMENT OVERVIEW |
Table of Contents
ICON INDUSTRIALS FUND
SCHEDULEOF INVESTMENTS
SEPTEMBER 30, 2014
| Shares or Principal Amount | Value | |||||||
| Common Stocks (98.4%) | ||||||||
| 30,000 | Alaska Air Group, Inc. | $ | 1,306,200 | |||||
| 5,700 | Alliant Techsystems, Inc. | 727,548 | ||||||
| 5,000 | Boeing Co. | 636,900 | ||||||
| 10,000 | Caterpillar, Inc. | 990,300 | ||||||
| 5,600 | Corporate Executive Board Co. | 336,392 | ||||||
| 21,700 | Crane Co. | 1,371,657 | ||||||
| 16,700 | Curtiss-Wright Corp. | 1,100,864 | ||||||
| 11,000 | Danaher Corp. | 835,780 | ||||||
| 50,500 | Delta Air Lines, Inc. | 1,825,575 | ||||||
| 10,000 | Eaton Corp. PLC | 633,700 | ||||||
| 15,000 | Flowserve Corp. | 1,057,800 | ||||||
| 15,000 | Fluor Corp. | 1,001,850 | ||||||
| 94,500 | General Electric Co. | 2,421,090 | ||||||
| 15,000 | Genesee & Wyoming, Inc., Class A† | 1,429,650 | ||||||
| 40,000 | Healthcare Services Group, Inc. | 1,144,400 | ||||||
| 5,000 | Honeywell International, Inc. | 465,600 | ||||||
| 12,500 | Jacobs Engineering Group, Inc.† | 610,250 | ||||||
| 5,500 | JB Hunt Transport Services, Inc. | 407,275 | ||||||
| 45,400 | JetBlue Airways Corp.† | 482,148 | ||||||
| 5,000 | Landstar System, Inc. | 360,950 | ||||||
| 4,500 | Middleby Corp.† | 396,585 | ||||||
| 11,300 | MSC Industrial Direct Co., Inc., Class A | 965,698 | ||||||
| Shares or Principal Amount | Value | |||||||
| 14,400 | Norfolk Southern Corp. | $ | 1,607,040 | |||||
| 5,000 | Pall Corp. | 418,500 | ||||||
| 5,000 | Precision Castparts Corp. | 1,184,400 | ||||||
| 18,400 | Primoris Services Corp. | 493,856 | ||||||
| 11,900 | Raytheon Co. | 1,209,278 | ||||||
| 7,000 | Ryder System, Inc. | 629,790 | ||||||
| 5,800 | Snap-on, Inc. | 702,264 | ||||||
| 35,000 | Tyco International, Ltd. | 1,559,950 | ||||||
| 26,000 | Union Pacific Corp. | 2,818,920 | ||||||
| 26,100 | United Technologies Corp. | 2,756,160 | ||||||
| 5,300 | Wabtec Corp. | 429,512 | ||||||
| 5,000 | WESCO International, Inc.† | 391,300 | ||||||
| 4,700 | WW Grainger, Inc. | 1,182,755 | ||||||
|
| |||||||
| | Total Common Stocks (Cost $27,634,105) | 35,891,937 | ||||||
| Short-Term Investments (1.9%) | ||||||||
| $ | 680,799 | State Street Euro Dollar Time Deposit (USD), 0.01%, 10/01/14 | 680,799 | |||||
|
| |||||||
| | Total Short-Term Investments (Cost $680,799) | 680,799 | ||||||
| | Total Investments 100.3% (Cost $28,314,904) | 36,572,736 | ||||||
| | Liabilities Less Other Assets (0.3)% | (117,091 | ) | |||||
|
| |||||||
| Net Assets 100.0% | $ | 36,455,645 | ||||||
|
| |||||||
| SCHEDULEOF INVESTMENTS | 41 |
The accompanying notes are an integral part of the financial statements.
| † | Non-income producing security. |
Table of Contents
MANAGEMENT OVERVIEW (UNAUDITED) | Class S Class C Class A | ICTEX ICTFX ICTTX |
| Q. | How did the Fund perform relative to its benchmarks? |
| A. | The ICON Information Technology Fund (the Fund) Class S shares returned 18.44% for the fiscal year ended September 30, 2014, while its sector-specific benchmark, the S&P Composite 1500 Information Technology Index, returned 27.00%, and the S&P Composite 1500 Index gained 18.57%. Total returns for other periods and additional Class shares as of September 30, 2014, appear in the subsequent pages of this Fund’s Management Overview. |
| Q. | What primary factors were behind the Fund’s relative performance? |
| A. | The broad U.S. market performed well over the course of fiscal year 2014. Performance this year, during the continuation of a multi-year rally, was notably impressive considering the headwinds investors faced such as economic growth concerns internationally, especially in relation to China and Europe, and the winding down of the U.S. Federal Reserve’s quantitative easing program. Despite tapering, interest rates remained low and monetary policy continued to be accommodative. Further, the U.S. economy continued to show signs of improvement, providing a boost to domestic equity markets. The Information Technology sector outperformed the broad U.S. market during the period. |
From a valuation standpoint, according to our system, we began the period with a value-to-price (V/P) ratio of 1.04 for the Information Technology sector. The Information Technology sector was led by the technology hardware storage & peripherals industry, as Apple, the sector’s largest benchmark weight, rallied during the second half of the fiscal year on well received earnings reports and market expectations for changes to its product mix. The semiconductor industry was also amongst the sector’s leadership, driven by expectations for increases in chip demand thanks to several reasons, including advances in cloud services, mobile technology and an increasing number of everyday devices, like cars and refrigerators, becoming connected (the so-called “internet of things”). The Fund participated in the gains of the semiconductor industry; however, seeing better opportunities elsewhere in the sector, the Fund’s underweight position in Apple relative to the benchmark detracted from relative performance. The internet software & services industry was the biggest detractor to relative performance, primarily due to stock selection.
| 42 | MANAGEMENT OVERVIEW |
Table of Contents
| Q. | How did the Fund’s composition affect performance? |
| A. | Industry returns within the sector varied significantly, from 47% for the top-performing industry to 5% for the worst performing industry. This highlights the significant role that industry rotation can play in sector investing. |
The top industry contributors to performance during fiscal year 2014 were the semiconductors, technology hardware storage & peripherals, data processing & outsourced services and electronic manufacturing services industries. The electronic equipment & instruments, application software and electronic components industries detracted from performance.
From a total effect standpoint industries that helped the Fund relative to the benchmark included the semiconductors, communications equipment, electronic manufacturing services, and IT consulting & other services industries. Industries that hurt the Fund relative to the benchmark included internet software & services, application software and electronic equipment & instruments. With equity valuations appearing stretched at times during the period, a higher than average allocation to cash was used for defensive purposes, which detracted from benchmark relative performance.
| Q. | What is your investment outlook for the Information Technology sector? |
| A. | At the end of fiscal year 2014, the Information Technology sector had a V/P ratio of 1.08, an indication that our system still sees upside potential for the sector. According to our system, several industries are showing good value, including the technology distributors and data processing & outsourced services industries. As always, we remain ready to reallocate and adapt as our investment system dictates. |
| MANAGEMENT OVERVIEW | 43 |
Table of Contents
ICON Information Technology Fund
Sector Composition
September 30, 2014
Information Technology | 98.5% | |||
|
| |||
| 98.5% | ||||
|
|
Percentages are based upon common stocks as a percentage of net assets.
ICON Information Technology Fund
Industry Composition
September 30, 2014
Internet Software & Services | 25.3% | |||
Data Processing & Outsourced Services | 18.5% | |||
Semiconductors | 10.8% | |||
Technology Hardware, Storage & Peripherals | 8.3% | |||
Application Software | 7.7% | |||
Technology Distributors | 6.5% | |||
Systems Software | 6.4% | |||
Electronic Equipment & Instruments | 4.8% | |||
Electronic Manufacturing Services | 4.0% | |||
IT Consulting & Other Services | 3.4% | |||
Semiconductor Equipment | 2.2% | |||
Electronic Components | 0.6% | |||
|
| |||
| 98.5% | ||||
|
|
Percentages are based upon common stocks as a percentage of net assets.
| 44 | MANAGEMENT OVERVIEW |
Table of Contents
ICON Information Technology Fund
Average Annual Total Return
as of September 30, 2014
| Inception Date | 1 Year | 5 Years | 10 Years | Since Inception | Gross Expense Ratio* | Net Expense Ratio* | ||||||||||||||||||||||
ICON Information Technology Fund - Class S | 2/19/97 | 18.44% | 11.83% | 5.60% | 8.07% | 1.38% | 1.38% | |||||||||||||||||||||
ICON Information Technology Fund - Class C | 9/30/10 | 17.07% | N/A | N/A | 12.63% | 3.31% | 2.50% | |||||||||||||||||||||
ICON Information Technology Fund - Class A | 9/30/10 | 17.88% | N/A | N/A | 13.41% | 2.23% | 1.75% | |||||||||||||||||||||
ICON Information Technology Fund - Class A (including maximum sales charge of 5.75%) | 9/30/10 | 11.09% | N/A | N/A | 11.75% | 2.23% | 1.75% | |||||||||||||||||||||
S&P 1500 Information Technology Index | 27.00% | 15.79% | 9.71% | 7.40% | N/A | N/A | ||||||||||||||||||||||
NASDAQ Composite Index | 19.14% | 16.19% | 9.01% | 7.00% | N/A | N/A | ||||||||||||||||||||||
S&P Composite 1500 Index | 18.57% | 15.79% | 8.34% | 7.48% | N/A | N/A | ||||||||||||||||||||||
Past performance is not a guarantee of future results. Information about these performance results and the comparative indexes can be found in the About This Report section. The Adviser has agreed to limit certain Fund expenses; without these
limitations, returns would have been lower. The limitation provisions may be terminated in the future.
| * | Please see the most recent prospectus for details. |
Class C total returns exclude applicable sales charges. If sales charges were included returns would be lower.
| MANAGEMENT OVERVIEW | 45 |
Table of Contents
ICON Information Technology Fund
Value of a $10,000 Investment
through September 30, 2014
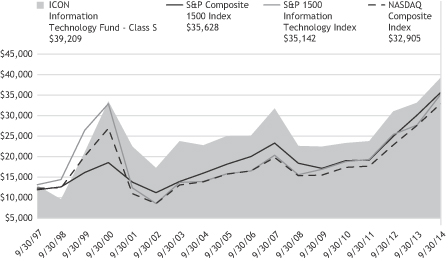
Past performance is not a guarantee of future results. The above graph compares a $10,000 investment made in the Fund’s Class S shares on the Class’ inception date of 2/19/97 to a $10,000 investment made in unmanaged securities indexes on that date. The Fund’s performance in this chart and the performance table assumes the reinvestment of dividends and capital gain distributions but does not reflect the deduction of taxes that a shareholder would pay on Fund distributions or on the redemption of Fund shares.
| 46 | MANAGEMENT OVERVIEW |
Table of Contents
ICON INFORMATION TECHNOLOGY FUND
SCHEDULEOF INVESTMENTS
SEPTEMBER 30, 2014
| Shares or Principal Amount | Value | |||||||
| Common Stocks (98.5%) | ||||||||
| 21,500 | Accenture PLC, Class A | $ | 1,748,380 | |||||
| 6,800 | Alliance Data Systems Corp.† | 1,688,236 | ||||||
| 31,000 | Apple, Inc. | 3,123,250 | ||||||
| 42,500 | eBay, Inc.† | 2,406,775 | ||||||
| 38,800 | Facebook, Inc., Class A† | 3,066,752 | ||||||
| 3,400 | FEI Co. | 256,428 | ||||||
| 4,325 | Google, Inc., Class A† | 2,544,873 | ||||||
| 4,325 | Google, Inc., Class C† | 2,497,082 | ||||||
| 12,100 | Intuit, Inc. | 1,060,565 | ||||||
| 25,200 | j2 Global, Inc.(a) | 1,243,872 | ||||||
| 23,800 | Mastercard, Inc., Class A | 1,759,296 | ||||||
| 18,000 | MAXIMUS, Inc. | 722,340 | ||||||
| 76,400 | Mentor Graphics Corp. | 1,565,818 | ||||||
| 54,900 | Methode Electronics, Inc. | 2,024,163 | ||||||
| 60,100 | Micron Technology, Inc.† | 2,059,026 | ||||||
| 29,500 | Microsoft Corp. | 1,367,620 | ||||||
| 11,900 | MTS Systems Corp. | 812,294 | ||||||
| 49,900 | Oracle Corp. | 1,910,172 | ||||||
| 21,600 | OSI Systems, Inc.† | 1,371,168 | ||||||
| 5,300 | Rogers Corp.† | 290,228 | ||||||
| 22,600 | salesforce.com, Inc.† | 1,300,178 | ||||||
| Shares or Principal Amount | Value | |||||||
| 35,277 | ScanSource, Inc.† | $ | 1,220,231 | |||||
| 60,400 | Skyworks Solutions, Inc. | 3,506,220 | ||||||
| 9,400 | Stratasys Ltd.† (a) | 1,135,332 | ||||||
| 32,900 | SYNNEX Corp.† | 2,126,327 | ||||||
| 57,400 | Teradyne, Inc. | 1,112,986 | ||||||
| 57,000 | Total System Services, Inc. | 1,764,720 | ||||||
| 16,845 | Visa, Inc., Class A | 3,594,218 | ||||||
| 21,300 | VistaPrint NV† (a) | 1,167,027 | ||||||
|
| |||||||
|
| Total Common Stocks (Cost $38,076,485) | 50,445,577 | ||||||
| Collateral for Securities on Loan (3.4%) | ||||||||
| 1,717,622 | State Street Navigator Prime Portfolio, 0.15% | 1,717,622 | ||||||
|
| |||||||
|
| Total Collateral for Securities on Loan (Cost $1,717,622) | 1,717,622 | ||||||
| Short-Term Investments (1.6%) | ||||||||
| $ | 860,383 | State Street Euro Dollar Time Deposit (USD), 0.01%, 10/01/14 | 860,383 | |||||
|
| |||||||
| | Total Short-Term Investments (Cost $860,383) | 860,383 | ||||||
| | Total Investments 103.5% (Cost $40,654,490) | 53,023,582 | ||||||
| | Liabilities Less Other Assets (3.5)% | (1,804,435 | ) | |||||
|
| |||||||
| Net Assets 100.0% | $ | 51,219,147 | ||||||
|
| |||||||
The accompanying notes are an integral part of the financial statements.
| † | Non-income producing security. |
| (a) | All or a portion of the security was on loan as of September 30, 2014. |
| SCHEDULEOF INVESTMENTS | 47 |
Table of Contents
MANAGEMENT OVERVIEW (UNAUDITED) | Class S Class C Class A | ICBMX ICBCX ICBAX |
| Q. | How did the Fund perform relative to its benchmarks? |
| A. | The ICON Materials Fund returned 12.85% for the fiscal year ended September 30, 2014, while its sector-specific benchmark, the S&P Composite 1500 Materials Index, returned 18.72%, and the S&P Composite 1500 Index gained 18.57%. Total returns for other periods and additional Class shares as of September 30, 2014 appear in the subsequent pages of this Fund’s Management Overview. |
| Q. | What primary factors were behind the Fund’s relative performance? |
| A. | Fiscal year 2014 was a strong year for the U.S. equity market across the board as the market generally continued the bull market rally that began over 5 years ago. The market advance was rather impressive as it continued to move higher despite numerous headwinds; a continued economic slowdown in both emerging market economies and Europe, a reduction in the amount of monetary stimulus provided by the Federal Reserve, and less attractive equity valuations to name a few. The Materials sector was no exception as investors bid up prices in this highly cyclical segment of the market to produce returns in excess of 18% for the sector as a whole. |
According to our valuation methodology, we began fiscal year 2014 with an average value-to-price (V/P) ratio for the Materials Sector of 1.10, indicating we anticipated approximately 10% of upside in the sector over the next 9 to 12 months. However, due to the combination of rising forward looking growth rates and declining interest rates (making equities relatively more attractive according to our system) we generally saw prices remain below our estimate of fair value even as the sector continued to rise. After the market jumped out of the gate during the first few months of the fiscal year, we began to see equity valuations as closer to fair valued. While the sector as a whole seemed to be priced for perfection, our system continued to see certain industries that stood out as attractive opportunities. These opportunities were consistent with a recent theme that has emerged in the Materials sector over the last couple years, with revenues more directly tied to domestic economic growth rather than emerging market economies. Examples of this theme were seen in industries such as niche based commodity chemicals, construction materials, and diversified chemicals.
| 48 | MANAGEMENT OVERVIEW |
Table of Contents
Finally, while many investors continue to believe the gold mining segment of the economy will produce a hedge against inflationary pressures and global expansionary monetary policy, the gold mining industry continued to disappoint, producing a second straight year of negative overall returns. We were able to avoid the negative overall returns from this industry as our valuations continued to steer us away from this segment of the market throughout the fiscal year.
| Q. | How did the Fund’s composition affect performance? |
| A. | Individual industry returns for the industries in the Materials sector varied wildly over the course of fiscal year 2014. The best performing industry was up over 45% while the worst was down almost 7%. This divergence highlights why we believe industry rotation is so important within a volatile sector such as Materials. Additionally, variation in industry returns shows how industry allocation can drive the majority of returns over the course of the year. |
The top industry contributors to the Fund’s performance during fiscal year 2014 were commodity chemicals, diversified chemicals, specialty chemicals, paper products, and fertilizers & agricultural chemicals.
There was only one absolute industry detractor from the Fund’s performance during fiscal year 2014 – paper packaging. However, the Fund’s relative positioning in diversified chemicals, cash allocations, and specialty chemicals resulted in the Fund underperforming the benchmark. The diversified chemicals and specialty chemicals industries were both contributors to overall performance and detractors from performance relative to the benchmark. This situation stems from incorrect stock selection effect, as holdings within the Fund underperformed the benchmark. Additionally, a larger than average cash allocation, stemming from some defensive posturing during the first half of calendar quarter 2014 as equity valuations seemed stretched based on our methodology, detracted from performance.
| Q. | What is your investment outlook for the Materials sector? |
| A. | At the close of the fiscal year, the Materials sector had an overall average V/P ratio of 1.13, indicating that we see upside opportunity within the sector as a whole. Towards the end of the year the overall market saw an increase in volatility, which was exaggerated in this heavily cyclical segment of the market. Based on our valuations this volatility is presenting us with opportunity rather than something to be concerned about over the long term. At the industry level, both current valuations and forward-looking growth estimates remain attractive |
| MANAGEMENT OVERVIEW | 49 |
Table of Contents
| according to our system in select chemical based companies. Continued weakness in industrial commodity industries over the course of fiscal year 2014 could mean future return possibility, however we remain cautious on this segment of the market as forward looking earnings estimates remain depressed. |
ICON Materials Fund
Sector Composition
September 30, 2014
Materials | 94.4% | |||
Industrials | 1.1% | |||
|
| |||
| 95.5% | ||||
|
|
Percentages are based upon common stocks as a percentage of net assets.
ICON Materials Fund
Industry Composition
September 30, 2014
Specialty Chemicals | 20.6% | |||
Commodity Chemicals | 15.9% | |||
Diversified Chemicals | 15.8% | |||
Paper Packaging | 11.8% | |||
Fertilizers & Agricultural Chemicals | 8.8% | |||
Paper Products | 8.1% | |||
Diversified Metals & Mining | 4.8% | |||
Construction Materials | 4.5% | |||
Steel | 2.8% | |||
Industrial Gases | 1.3% | |||
Railroads | 1.1% | |||
|
| |||
| 95.5% | ||||
|
|
Percentages are based upon common stocks as a percentage of net assets.
| 50 | MANAGEMENT OVERVIEW |
Table of Contents
ICON Materials Fund
Average Annual Total Return
as of September 30, 2014
| Inception Date | 1 Year | 5 Years | 10 Years | Since Inception | Gross Expense Ratio* | Net Expense Ratio* | ||||||||||||||||||||||
ICON Materials Fund - Class S | 5/5/97 | 12.85% | 12.12% | 9.90% | 5.35% | 1.45% | 1.45% | |||||||||||||||||||||
ICON Materials Fund - Class C | 9/30/10 | 11.56% | N/A | N/A | 10.46% | 4.12% | 2.50% | |||||||||||||||||||||
ICON Materials Fund - Class A | 9/30/10 | 12.47% | N/A | N/A | 11.27% | 2.02% | 1.75% | |||||||||||||||||||||
ICON Materials Fund - Class A (including maximum sales charge of 5.75%) | 9/30/10 | 5.97% | N/A | N/A | 9.65% | 2.02% | 1.75% | |||||||||||||||||||||
S&P 1500 Materials Index | 18.72% | 13.84% | 9.28% | 7.38% | N/A | N/A | ||||||||||||||||||||||
S&P Composite 1500 Index | 18.57% | 15.79% | 8.34% | 7.44% | N/A | N/A | ||||||||||||||||||||||
Past performance is not a guarantee of future results. Information about these performance results and the comparative indexes can be found in the About This Report section. The Adviser has agreed to limit certain Fund expenses; without these limitations, returns would have been lower. The limitation provisions may be terminated in the future.
| * | Please see the most recent prospectus for details. |
Class C total returns exclude applicable sales charges. If sales charges were included returns would be lower.
| MANAGEMENT OVERVIEW | 51 |
Table of Contents
ICON Materials Fund
Value of a $10,000 Investment
through September 30, 2014
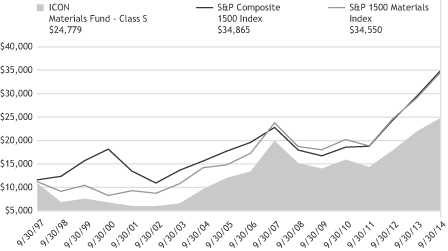
Past performance is not a guarantee of future results. The above graph compares a $10,000 investment made in the Fund’s Class S shares on the Class’ inception date of 5/5/97 to a $10,000 investment made in unmanaged securities indexes on that date. The Fund’s performance in this chart and the performance table assumes the reinvestment of dividends and capital gain distributions but does not reflect the deduction of taxes that a shareholder would pay on Fund distributions or on the redemption of Fund shares.
| 52 | MANAGEMENT OVERVIEW |
Table of Contents
ICON MATERIALS FUND
SCHEDULEOF INVESTMENTS
SEPTEMBER 30, 2014
| Shares or Principal Amount | Value | |||||||
| Common Stocks (95.5%) | ||||||||
| 23,000 | Ashland, Inc. | $ | 2,394,300 | |||||
| 95,000 | Avery Dennison Corp. | 4,241,750 | ||||||
| 15,000 | Bemis Co., Inc. | 570,300 | ||||||
| 50,000 | Cabot Corp. | 2,538,500 | ||||||
| 50,000 | Calgon Carbon Corp.† | 969,000 | ||||||
| 35,000 | Celanese Corp. | 2,048,200 | ||||||
| 40,000 | Clearwater Paper Corp.† | 2,404,400 | ||||||
| 90,000 | Dow Chemical Co. | 4,719,600 | ||||||
| 45,000 | E.I. du Pont de Nemours & Co. | 3,229,200 | ||||||
| 45,000 | Eagle Materials, Inc. | 4,582,350 | ||||||
| 25,000 | Eastman Chemical Co. | 2,022,250 | ||||||
| 40,000 | Ecolab, Inc. | 4,593,200 | ||||||
| 60,000 | FMC Corp. | 3,431,400 | ||||||
| 150,000 | Freeport-McMoRan, Inc. | 4,897,500 | ||||||
| 240,000 | Graphic Packaging Holding Co.† | 2,983,200 | ||||||
| 40,000 | HB Fuller Co. | 1,588,000 | ||||||
| 45,000 | Innospec, Inc. | 1,615,500 | ||||||
| 85,000 | International Paper Co. | 4,057,900 | ||||||
| 302,800 | Landec Corp.† | 3,709,300 | ||||||
| 80,000 | LSB Industries, Inc.† | 2,856,800 | ||||||
| 75,000 | LyondellBasell Industries, Class A | 8,149,500 | ||||||
| Shares or Principal Amount | Value | |||||||
| 65,000 | Methanex Corp. | $ | 4,342,000 | |||||
| 80,000 | Monsanto Co. | 9,000,800 | ||||||
| 20,000 | Nucor Corp. | 1,085,600 | ||||||
| 37,000 | Packaging Corp. of America | 2,361,340 | ||||||
| 85,000 | PH Glatfelter Co. | 1,865,750 | ||||||
| 10,000 | Praxair, Inc. | 1,290,000 | ||||||
| 25,000 | Reliance Steel & Aluminum Co. | 1,710,000 | ||||||
| 40,000 | Rock-Tenn Co., Class A | 1,903,200 | ||||||
| 20,000 | Sherwin-Williams Co. | 4,379,800 | ||||||
| 10,000 | Union Pacific Corp. | 1,084,200 | ||||||
| 10,000 | Valspar Corp. | 789,900 | ||||||
| 5,000 | Westlake Chemical Corp. | 432,950 | ||||||
|
| |||||||
|
| Total Common Stocks (Cost $80,560,716) | 97,847,690 | ||||||
| Short-Term Investments (4.5%) | ||||||||
| $ | 4,641,240 | State Street Euro Dollar Time Deposit (USD), 0.01%, 10/01/14 | 4,641,240 | |||||
|
| |||||||
|
| Total Short-Term Investments (Cost $4,641,240) | 4,641,240 | ||||||
| | Total Investments 100.0% (Cost $85,201,956) | 102,488,930 | ||||||
| | Other Assets Less Liabilities 0.0% | 25,186 | ||||||
|
| |||||||
| Net Assets 100.0% | $ | 102,514,116 | ||||||
|
| |||||||
The accompanying notes are an integral part of the financial statements.
| † | Non-income producing security. |
| SCHEDULEOF INVESTMENTS | 53 |
Table of Contents
MANAGEMENT OVERVIEW (UNAUDITED) | Class S Class C Class A | ICTUX ICTZX ICTVX |
| Q. | How did the Fund perform relative to its benchmarks? |
| A. | The ICON Utilities Fund (the Fund) Class S returned 12.69% for the fiscal year ending September 30, 2014, lagging both its sector-specific benchmark, the S&P Composite 1500 Utilities Index, which returned 15.91%, and its broad benchmark, the S&P Composite 1500 Index, which returned 18.57%. Total returns for other periods and additional Class shares as of September 30, 2014, appear in the subsequent pages of this Fund’s Management Overview. |
| Q. | What primary factors were behind the Fund’s relative performance? |
| A. | Given the non-cyclical nature of the Utilities sector, it is not surprising that it lagged the broader market in such a strong up-market. When comparing the sector’s monthly five-year beta to the S&P Composite 1500’s, the resulting beta was less than .5. The Utilities sector was able to generate stronger than expected returns in part because of falling interest rates over the course of the first three quarters of calendar year 2014. As of December 31, 2013, the 10-year U.S. Treasury yield was about 3%. By September 31, 2014, this yield had fallen to 2.49%. On average, as of the end of the fiscal year 2014, the dividend yield for stocks we track in the Utilities sector was 3.7%, making them an attractive alternative to treasuries from a yield stand-point. |
| Q. | How did the Fund’s composition affect performance? |
| A. | The Fund’s underweight in the electric utilities industry was the largest detractor to the Fund’s performance relative to the benchmark. Out of all the industries in the Utilities sector, this industry had the strongest performance, returning over 16% during the fiscal year. Additionally, the Fund’s stock selection detracted from the Fund’s performance relative to the benchmark. UIL Holdings Company (UIL) was the largest detractor from performance. As February 2014 came to a close, UIL was the winning bidder for the buyout of Philadelphia Gas as it looked to expand into gas distribution. This move was not well received by investors as the stock fell more than 12% over 5 trading days after the announcement. Performance of this stock alone explains the majority of the Fund’s underperformance in the electrical utilities industry relative to the benchmark. |
| 54 | MANAGEMENT OVERVIEW |
Table of Contents
| Q. | What is your investment outlook for the Utilities sector? |
| A. | As of September 30, 2014, according to our valuation methodology the Utilities sector had the highest value-to-price (V/P) ratio of all the sectors we track. We believe this V/P ratio, coupled with downward pressure on the 10-year U.S. Treasury, should provide a positive environment for the sector. The electrical utilities industry continues to look attractive to our system with a V/P ratio of 1.16. Given this valuation, the Fund is overweight in the electrical utilities industry. As always, we look to value as our primary guide and will adjust our positioning as market conditions dictate. |
ICON Utilities Fund
Sector Composition
September 30, 2014
Utilities | 89.8% | |||
Telecommunication | 7.8% | |||
|
| |||
| 97.6% | ||||
|
|
Percentages are based upon common stocks as a percentage of net assets.
ICON Utilities Fund
Industry Composition
September 30, 2014
Electric Utilities | 64.2% | |||
Multi-Utilities | 19.6% | |||
Integrated Telecommunication Services | 7.8% | |||
Gas Utilities | 6.0% | |||
|
| |||
| 97.6% | ||||
|
|
Percentages are based upon common stocks as a percentage of net assets.
| MANAGEMENT OVERVIEW | 55 |
Table of Contents
ICON Utilities Fund
Average Annual Total Return
as of September 30, 2014
| Inception Date | 1 Year | 5 Years | 10 Years | Since Inception | Gross Expense Ratio* | Net Expense Ratio* | ||||||||||||||||||||||
ICON Utilities Fund - Class S | 7/9/97 | 12.69% | 10.85% | 8.25% | 7.95% | 1.62% | 1.51% | |||||||||||||||||||||
ICON Utilities Fund - Class C | 9/30/10 | 11.59% | N/A | N/A | 9.74% | 2.47% | 2.47% | |||||||||||||||||||||
ICON Utilities Fund - Class A | 9/30/10 | 12.44% | N/A | N/A | 10.42% | 1.74% | 1.74% | |||||||||||||||||||||
ICON Utilities Fund - Class A (including maximum sales charge of 5.75%) | 9/30/10 | 5.91% | N/A | N/A | 8.78% | 1.74% | 1.74% | |||||||||||||||||||||
S&P 1500 Utilities Index | 15.91% | 12.64% | 9.74% | 7.90% | N/A | N/A | ||||||||||||||||||||||
S&P Composite 1500 Index | 18.57% | 15.79% | 8.34% | 6.94% | N/A | N/A | ||||||||||||||||||||||
Past performance is not a guarantee of future results. Information about these performance results and the comparative indexes can be found in the About This Report section. The Adviser has agreed to limit certain Fund expenses; without these limitations, returns would have been lower. The limitation provisions may be terminated in the future.
| * | Please see the most recent prospectus for details. |
Class C total returns exclude applicable sales charges. If sales charges were included returns would be lower.
| 56 | MANAGEMENT OVERVIEW |
Table of Contents
ICON Utilities Fund
Value of a $10,000 Investment
through September 30, 2014
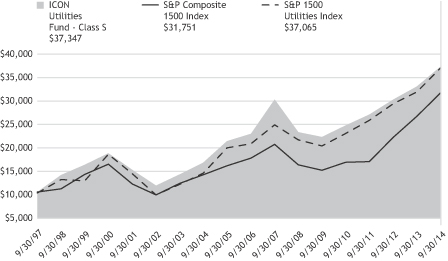
Past performance is not a guarantee of future results. The above graph compares a $10,000 investment made in the Fund’s Class S shares on the Class’ inception date of 7/9/97 to a $10,000 investment made in unmanaged securities indexes on that date. The Fund’s performance in this chart and the performance table assumes the reinvestment of dividends and capital gain distributions but does not reflect the deduction of taxes that a shareholder would pay on Fund distributions or on the redemption of Fund shares.
| MANAGEMENT OVERVIEW | 57 |
Table of Contents
ICON UTILITIES FUND
SCHEDULE OF INVESTMENTS
SEPTEMBER 30, 2014
| Shares or Principal Amount | Value | |||||||
| Common Stocks (97.6%) | ||||||||
| 34,600 | ALLETE, Inc. | $ | 1,535,894 | |||||
| 11,700 | Ameren Corp. | 448,461 | ||||||
| 18,000 | American Electric Power Co., Inc. | 939,780 | ||||||
| 11,600 | Atmos Energy Corp. | 553,320 | ||||||
| 19,800 | BCE, Inc. | 846,648 | ||||||
| 16,100 | Cleco Corp. | 775,215 | ||||||
| 69,800 | CMS Energy Corp. | 2,070,268 | ||||||
| 12,000 | DTE Energy Co. | 912,960 | ||||||
| 28,600 | Duke Energy Corp. | 2,138,422 | ||||||
| 44,400 | Great Plains Energy, Inc. | 1,073,148 | ||||||
| 51,300 | Hawaiian Electric Industries, Inc.(a) | 1,362,015 | ||||||
| 21,800 | ITC Holdings Corp. | 776,734 | ||||||
| 17,400 | Laclede Group, Inc. | 807,360 | ||||||
| 7,700 | NextEra Energy, Inc. | 722,876 | ||||||
| 32,800 | Northeast Utilities | 1,453,040 | ||||||
| 31,800 | Portland General Electric Co. | 1,021,416 | ||||||
| 20,400 | SCANA Corp. | 1,012,044 | ||||||
| 31,500 | UIL Holdings Corp. | 1,115,100 | ||||||
| Shares or Principal Amount | Value | |||||||
| 18,600 | Verizon Communications, Inc. | $ | 929,814 | |||||
| 28,500 | Westar Energy, Inc. | 972,420 | ||||||
| 22,100 | Xcel Energy, Inc. | 671,840 | ||||||
|
| |||||||
|
| Total Common Stocks (Cost $22,215,696) | 22,138,775 | ||||||
| Collateral for Securities on Loan (4.3%) | ||||||||
| 973,779 | State Street Navigator Prime Portfolio, 0.15% | 973,779 | ||||||
|
| |||||||
|
| Total Collateral for Securities on Loan (Cost $973,779) | 973,779 | ||||||
| Short-Term Investments (3.4%) | ||||||||
| $ | 780,465 | State Street Euro Dollar Time Deposit (USD), 0.01%, 10/01/14 | 780,465 | |||||
|
| |||||||
|
| Total Short-Term Investments (Cost $780,465) | 780,465 | ||||||
| | Total Investments 105.3% (Cost $23,969,940) | 23,893,019 | ||||||
| | Liabilities Less Other Assets (5.3)% | (1,209,730 | ) | |||||
|
| |||||||
| Net Assets 100.0% | $ | 22,683,289 | ||||||
|
| |||||||
The accompanying notes are an integral part of the financial statements.
| (a) | All or a portion of the security was on loan as of September 30, 2014. |
| 58 | SCHEDULE OF INVESTMENTS |
Table of Contents
(This page is intentionally left blank)
Table of Contents
STATEMENTSOF ASSETSAND LIABILITIES
SEPTEMBER 30, 2014
| ICON Consumer Discretionary Fund | ICON Consumer Staples Fund | ICON Energy Fund | ||||||||||
Assets | ||||||||||||
Investments, at cost | $ | 63,396,461 | $ | 33,498,186 | $ | 646,578,860 | ||||||
|
|
|
|
|
| |||||||
Investments, at value† | 62,617,359 | 35,339,941 | 674,205,264 | |||||||||
Receivables: | ||||||||||||
Fund shares sold | 102,901 | 4,045 | 680,334 | |||||||||
Investments sold | 4,388,112 | - | 5,076,871 | |||||||||
Dividends | 39,017 | 53,185 | 298,895 | |||||||||
Expense reimbursements due from Adviser | 1,522 | 1,506 | - | |||||||||
Foreign tax reclaims | - | - | 14,318 | |||||||||
Other assets | 15,286 | 10,179 | 98,480 | |||||||||
|
|
|
|
|
| |||||||
Total Assets | 67,164,197 | 35,408,856 | 680,374,162 | |||||||||
|
|
|
|
|
| |||||||
Liabilities | ||||||||||||
Payables: | ||||||||||||
Due to custodian bank | 2,381,726 | - | - | |||||||||
Expense recoupment due to adviser | - | 828 | - | |||||||||
Investments purchased | 614,563 | 4,396,720 | 7,210,847 | |||||||||
Payable for collateral received on securities loaned | 5,485,890 | 1,001,000 | 11,860,729 | |||||||||
Fund shares redeemed | 66,164 | 4,707 | 901,554 | |||||||||
Advisory fees | 53,021 | 20,532 | 565,820 | |||||||||
Accrued distribution fees | 985 | 1,762 | 20,823 | |||||||||
Fund accounting fees | 2,000 | 825 | 23,266 | |||||||||
Transfer agent fees | 16,479 | 10,731 | 224,086 | |||||||||
Administration fees | 2,639 | 1,023 | 28,569 | |||||||||
Trustee fees | 1,293 | 1,175 | 22,948 | |||||||||
Accrued expenses | 32,775 | 31,611 | 109,246 | |||||||||
|
|
|
|
|
| |||||||
Total Liabilities | 8,657,535 | 5,470,914 | 20,967,888 | |||||||||
|
|
|
|
|
| |||||||
Net Assets - all share classes | $ | 58,506,662 | $ | 29,937,942 | $ | 659,406,274 | ||||||
|
|
|
|
|
| |||||||
Net Assets - Class S | $ | 55,476,066 | $ | 25,730,527 | $ | 615,541,401 | ||||||
|
|
|
|
|
| |||||||
Net Assets - Class C | $ | 539,069 | $ | 1,467,393 | $ | 17,169,864 | ||||||
|
|
|
|
|
| |||||||
Net Assets - Class A | $ | 2,491,527 | $ | 2,740,022 | $ | 26,695,009 | ||||||
|
|
|
|
|
| |||||||
| 60 | FINANCIAL STATEMENTS |
Table of Contents
| ICON Consumer Discretionary Fund | ICON Consumer Staples Fund | ICON Energy Fund | ||||||||||
Net Assets Consist of | ||||||||||||
Paid-in capital | $ | 51,825,984 | $ | 24,033,956 | $ | 546,809,684 | ||||||
Accumulated undistributed net investment income/(loss) | - | 228,467 | 2,197,918 | |||||||||
Accumulated undistributed net realized gain/(loss) | 7,459,780 | 3,833,764 | 82,772,268 | |||||||||
Unrealized appreciation/(depreciation) | (779,102 | ) | 1,841,755 | 27,626,404 | ||||||||
|
|
|
|
|
| |||||||
Net Assets | $ | 58,506,662 | $ | 29,937,942 | $ | 659,406,274 | ||||||
|
|
|
|
|
| |||||||
Shares outstanding (unlimited shares authorized, no par value) | ||||||||||||
Class S | 3,567,138 | 2,227,195 | 27,598,252 | |||||||||
Class C | 36,225 | 130,062 | 789,680 | |||||||||
Class A | 163,443 | 236,642 | 1,202,744 | |||||||||
Net asset value (offering and redemption price per share) | ||||||||||||
Class S | $ | 15.55 | $ | 11.55 | $ | 22.30 | ||||||
Class C | $ | 14.88 | $ | 11.28 | $ | 21.74 | ||||||
Class A | $ | 15.24 | $ | 11.58 | $ | 22.20 | ||||||
Class A maximum offering price (100%/(100%-maximum sales charge)) of net asset value adjusted to the nearest cent per share | $ | 16.17 | $ | 12.29 | $ | 23.55 | ||||||
† Includes securities on loan of | $ | 5,283,138 | $ | 975,744 | $ | 11,224,217 | ||||||
The accompanying notes are an integral part of the financial statements.
| FINANCIAL STATEMENTS | 61 |
Table of Contents
STATEMENTSOF ASSETSAND LIABILITIES
SEPTEMBER 30, 2014
| ICON Financial Fund | ICON Healthcare Fund | ICON Industrials Fund | ||||||||||
Assets | ||||||||||||
Investments, at cost | $ | 33,773,514 | $ | 158,355,890 | $ | 28,314,904 | ||||||
|
|
|
|
|
| |||||||
Investments, at value† | 34,307,802 | 167,256,585 | 36,572,736 | |||||||||
Cash | - | 2,673,608 | - | |||||||||
Receivables: | ||||||||||||
Fund shares sold | 49,267 | 400,599 | 3,919 | |||||||||
Investments sold | 551,403 | - | - | |||||||||
Dividends | 14,684 | 114,186 | 48,376 | |||||||||
Expense reimbursements due from Adviser | 1,109 | 1,681 | 1,574 | |||||||||
Foreign tax reclaims | 335 | 4,433 | - | |||||||||
Other assets | 9,165 | 22,571 | 10,293 | |||||||||
|
|
|
|
|
| |||||||
Total Assets | 34,933,765 | 170,473,663 | 36,636,898 | |||||||||
|
|
|
|
|
| |||||||
Liabilities | ||||||||||||
Payables: | ||||||||||||
Expense recoupment due to adviser | 15,619 | - | 26 | |||||||||
Investments purchased | - | 10,386,109 | - | |||||||||
Payable for collateral received on securities loaned | 1,860,075 | - | - | |||||||||
Fund shares redeemed | 94,181 | 23,204 | 106,087 | |||||||||
Advisory fees | 28,012 | 121,959 | 31,237 | |||||||||
Accrued distribution fees | 232 | 1,414 | 284 | |||||||||
Fund accounting fees | 1,142 | 4,498 | 1,248 | |||||||||
Transfer agent fees | 7,044 | 33,748 | 8,763 | |||||||||
Administration fees | 1,394 | 6,071 | 1,555 | |||||||||
Trustee fees | 513 | 3,522 | 1,147 | |||||||||
Accrued expenses | 27,824 | 38,611 | 30,906 | |||||||||
|
|
|
|
|
| |||||||
Total Liabilities | 2,036,036 | 10,619,136 | 181,253 | |||||||||
|
|
|
|
|
| |||||||
Net Assets - all share classes | $ | 32,897,729 | $ | 159,854,527 | $ | 36,455,645 | ||||||
|
|
|
|
|
| |||||||
Net Assets - Class S | $ | 32,285,671 | $ | 148,260,258 | $ | 35,883,063 | ||||||
|
|
|
|
|
| |||||||
Net Assets - Class C | $ | 70,655 | $ | 716,063 | $ | 274,576 | ||||||
|
|
|
|
|
| |||||||
Net Assets - Class A | $ | 541,403 | $ | 10,878,206 | $ | 298,006 | ||||||
|
|
|
|
|
| |||||||
| 62 | FINANCIAL STATEMENTS |
Table of Contents
| ICON Financial Fund | ICON Healthcare Fund | ICON Industrials Fund | ||||||||||
Net Assets Consist of | ||||||||||||
Paid-in capital | $ | 121,097,153 | $ | 120,688,639 | $ | 54,514,640 | ||||||
Accumulated undistributed net investment income/(loss) | (14,823 | ) | - | 16,629 | ||||||||
Accumulated undistributed net realized gain/(loss) | (88,718,889 | ) | 30,265,193 | (26,333,456 | ) | |||||||
Unrealized appreciation/(depreciation) | 534,288 | 8,900,695 | 8,257,832 | |||||||||
|
|
|
|
|
| |||||||
Net Assets | $ | 32,897,729 | $ | 159,854,527 | $ | 36,455,645 | ||||||
|
|
|
|
|
| |||||||
Shares outstanding (unlimited shares authorized, no par value) | ||||||||||||
Class S | 4,122,090 | 6,614,197 | 3,075,594 | |||||||||
Class C | 9,105 | 33,525 | 24,137 | |||||||||
Class A | 68,608 | 494,296 | 25,731 | |||||||||
Net asset value (offering and redemption price per share) | ||||||||||||
Class S | $ | 7.83 | $ | 22.42 | $ | 11.67 | ||||||
Class C | $ | 7.76 | $ | 21.36 | $ | 11.38 | ||||||
Class A | $ | 7.89 | $ | 22.01 | $ | 11.58 | ||||||
Class A maximum offering price (100%/(100%-maximum sales charge)) of net asset value adjusted to the nearest cent per share | $ | 8.37 | $ | 23.35 | $ | 12.29 | ||||||
† Includes securities on loan of | $ | 1,801,771 | $ | - | $ | - | ||||||
The accompanying notes are an integral part of the financial statements.
| FINANCIAL STATEMENTS | 63 |
Table of Contents
STATEMENTSOF ASSETSAND LIABILITIES
SEPTEMBER 30, 2014
| ICON Information Technology Fund | ICON Materials Fund | ICON Utilities Fund | ||||||||||
Assets | ||||||||||||
Investments, at cost | $ | 40,654,490 | $ | 85,201,956 | $ | 23,969,940 | ||||||
|
|
|
|
|
| |||||||
Investments, at value† | 53,023,582 | 102,488,930 | 23,893,019 | |||||||||
Cash | - | 89 | - | |||||||||
Receivables: | ||||||||||||
Fund shares sold | 2,961 | 126,556 | 15,677 | |||||||||
Investments sold | - | - | 520,731 | |||||||||
Dividends | 5,700 | 89,251 | 104,463 | |||||||||
Expense reimbursements due from Adviser | 1,767 | 1,906 | 6,417 | |||||||||
Foreign tax reclaims | - | - | 4,916 | |||||||||
Other assets | 13,657 | 19,357 | 15,542 | |||||||||
|
|
|
|
|
| |||||||
Total Assets | 53,047,667 | 102,726,089 | 24,560,765 | |||||||||
|
|
|
|
|
| |||||||
Liabilities | ||||||||||||
Payables: | ||||||||||||
Expense recoupment due to adviser | 77 | - | 29 | |||||||||
Investments purchased | - | - | 785,732 | |||||||||
Payable for collateral received on securities loaned | 1,717,622 | - | 973,779 | |||||||||
Fund shares redeemed | 8,368 | 48,788 | 25,953 | |||||||||
Distributions due to shareholders | - | - | 25,152 | |||||||||
Advisory fees | 42,498 | 86,180 | 18,995 | |||||||||
Accrued distribution fees | 414 | 2,268 | 2,412 | |||||||||
Fund accounting fees | 1,742 | 3,366 | 888 | |||||||||
Transfer agent fees | 18,793 | 26,909 | 10,954 | |||||||||
Administration fees | 2,115 | 4,290 | 945 | |||||||||
Trustee fees | 2,074 | 2,701 | 1,063 | |||||||||
Accrued expenses | 34,817 | 37,471 | 31,574 | |||||||||
| �� |
|
|
|
| |||||||
Total Liabilities | 1,828,520 | 211,973 | 1,877,476 | |||||||||
|
|
|
|
|
| |||||||
Net Assets - all share classes | $ | 51,219,147 | $ | 102,514,116 | $ | 22,683,289 | ||||||
|
|
|
|
|
| |||||||
Net Assets - Class S | $ | 50,363,013 | $ | 93,609,807 | $ | 17,920,396 | ||||||
|
|
|
|
|
| |||||||
Net Assets - Class C | $ | 401,485 | $ | 674,573 | $ | 2,246,296 | ||||||
|
|
|
|
|
| |||||||
Net Assets - Class A | $ | 454,649 | $ | 8,229,736 | $ | 2,516,597 | ||||||
|
|
|
|
|
| |||||||
| 64 | FINANCIAL STATEMENTS |
Table of Contents
| ICON Information Technology Fund | ICON Materials Fund | ICON Utilities Fund | ||||||||||
Net Assets Consist of | ||||||||||||
Paid-in capital | $ | 46,102,319 | $ | 94,613,540 | $ | 23,863,332 | ||||||
Accumulated undistributed net investment income/(loss) | (288,745 | ) | 208,261 | 36,466 | ||||||||
Accumulated undistributed net realized gain/(loss) | (6,963,519 | ) | (9,594,659 | ) | (1,139,450 | ) | ||||||
Unrealized appreciation/(depreciation) | 12,369,092 | 17,286,974 | (77,059 | ) | ||||||||
|
|
|
|
|
| |||||||
Net Assets | $ | 51,219,147 | $ | 102,514,116 | $ | 22,683,289 | ||||||
|
|
|
|
|
| |||||||
Shares outstanding (unlimited shares authorized, no par value) | ||||||||||||
Class S | 3,717,030 | 6,203,981 | 2,267,100 | |||||||||
Class C | 30,969 | 45,661 | 288,298 | |||||||||
Class A | 34,124 | 550,161 | 322,282 | |||||||||
Net asset value (offering and redemption price per share) | ||||||||||||
Class S | $ | 13.55 | $ | 15.09 | $ | 7.90 | ||||||
Class C | $ | 12.96 | $ | 14.77 | $ | 7.79 | ||||||
Class A | $ | 13.32 | $ | 14.96 | $ | 7.81 | ||||||
Class A maximum offering price (100%/(100%-maximum sales charge)) of net asset value adjusted to the nearest cent per share | $ | 14.13 | $ | 15.87 | $ | 8.29 | ||||||
† Includes securities on loan of | $ | 1,700,882 | $ | - | $ | 948,764 | ||||||
The accompanying notes are an integral part of the financial statements.
| FINANCIAL STATEMENTS | 65 |
Table of Contents
STATEMENTSOF OPERATIONS
FORTHEYEARENDED SEPTEMBER 30, 2014
| ICON Consumer Discretionary Fund | ICON Consumer Staples Fund | ICON Energy Fund | ||||||||||
Investment Income | ||||||||||||
Interest | $ | 523 | $ | 65 | $ | 2,673 | ||||||
Dividends | 407,875 | 886,494 | 12,789,785 | |||||||||
Income from securities lending, net | 15,266 | 81 | 71,367 | |||||||||
Foreign taxes withheld | (571 | ) | - | (71,026 | ) | |||||||
|
|
|
|
|
| |||||||
Total Investment Income | 423,093 | 886,640 | 12,792,799 | |||||||||
|
|
|
|
|
| |||||||
Expenses | ||||||||||||
Advisory fees | 429,672 | 371,349 | 7,243,379 | |||||||||
Distribution fees: | ||||||||||||
Class C | 5,430 | 16,389 | 173,021 | |||||||||
Class A | 6,623 | 6,629 | 72,811 | |||||||||
Fund accounting fees | 8,761 | 7,579 | 150,028 | |||||||||
Transfer agent fees | 83,439 | 65,873 | 1,176,371 | |||||||||
Administration fees | 21,406 | 18,503 | 366,841 | |||||||||
Custody fees | 3,847 | 2,230 | 22,223 | |||||||||
Registration fees: | ||||||||||||
Class S | 14,337 | 13,011 | 41,712 | |||||||||
Class C | 7,111 | 5,672 | 19,970 | |||||||||
Class A | 2,866 | 2,960 | 5,199 | |||||||||
Insurance expense | 7,056 | 4,786 | 73,100 | |||||||||
Trustee fees and expenses | 4,383 | 4,532 | 86,822 | |||||||||
Audit and tax service expense | 25,995 | 28,624 | 29,861 | |||||||||
Interest expense | 1,098 | 16 | 88 | |||||||||
Recoupment of previously reimbursed expenses | - | 828 | - | |||||||||
Other expenses | 25,779 | 26,405 | 245,830 | |||||||||
|
|
|
|
|
| |||||||
Total expenses before expense reimbursement | 647,803 | 575,386 | 9,707,256 | |||||||||
Expense reimbursement by Adviser due to expense limitation agreement | (5,663 | ) | (11,844 | ) | - | |||||||
|
|
|
|
|
| |||||||
Net Expenses | 642,140 | 563,542 | 9,707,256 | |||||||||
|
|
|
|
|
| |||||||
Net Investment Income/(Loss) | (219,047 | ) | 323,098 | 3,085,543 | ||||||||
|
|
|
|
|
| |||||||
Net Realized and Unrealized Gain/(Loss) | ||||||||||||
Net realized gain/(loss) on: | ||||||||||||
Investments | 8,557,188 | 4,345,596 | 92,781,397 | |||||||||
Foreign currency | - | - | (10,055 | ) | ||||||||
Change in unrealized net appreciation/(depreciation) on: | ||||||||||||
Investments and foreign currency | (6,120,506 | ) | (319,405 | ) | (79,071,399 | ) | ||||||
|
|
|
|
|
| |||||||
Net realized and unrealized gain/(loss) | 2,436,682 | 4,026,191 | 13,699,943 | |||||||||
|
|
|
|
|
| |||||||
Net Increase/(Decrease) in Net Assets Resulting From Operations | $ | 2,217,635 | $ | 4,349,289 | $ | 16,785,486 | ||||||
|
|
|
|
|
| |||||||
The accompanying notes are an integral part of the financial statements.
| 66 | FINANCIAL STATEMENTS |
Table of Contents
| ICON Financial Fund | ICON Healthcare Fund | ICON Industrials Fund | ICON Information Technology Fund | ICON Materials Fund | ICON Utilities Fund | |||||||||||||||||
| $ | 324 | $ | 2,580 | $ | 294 | $ | 542 | $ | 2,646 | $ | 41 | |||||||||||
| 243,196 | 940,023 | 548,646 | 550,013 | 1,430,500 | 1,468,937 | |||||||||||||||||
| 10,663 | 23,893 | 351 | 4,097 | 2,262 | 20,795 | |||||||||||||||||
| (543 | ) | (3,676 | ) | - | (2,678 | ) | (3,713 | ) | (20,037 | ) | ||||||||||||
|
|
|
|
|
|
|
|
|
|
|
| |||||||||||
| 253,640 | 962,820 | 549,291 | 551,974 | 1,431,695 | 1,469,736 | |||||||||||||||||
|
|
|
|
|
|
|
|
|
|
|
| |||||||||||
| 175,399 | 1,156,155 | 370,170 | 659,210 | 880,576 | 335,794 | |||||||||||||||||
| 741 | 4,088 | 2,111 | 3,635 | 4,809 | 26,326 | |||||||||||||||||
| 2,482 | 8,159 | 1,654 | 2,312 | 14,343 | 5,781 | |||||||||||||||||
| 3,573 | 23,540 | 7,552 | 13,471 | 17,901 | 6,850 | |||||||||||||||||
| 39,600 | 209,036 | 52,731 | 115,945 | 149,046 | 63,672 | |||||||||||||||||
| 8,736 | 57,605 | 18,445 | 32,851 | 43,870 | 16,732 | |||||||||||||||||
| 3,619 | 5,736 | 2,059 | 3,340 | 3,568 | 2,192 | |||||||||||||||||
| 14,704 | 19,789 | 13,166 | 15,235 | 14,535 | 12,546 | |||||||||||||||||
| 3,407 | 7,947 | 5,399 | 6,616 | 8,109 | 6,078 | |||||||||||||||||
| 2,883 | 3,853 | 1,359 | 2,010 | 2,833 | 3,675 | |||||||||||||||||
| 4,624 | 12,604 | 3,970 | 8,631 | 5,754 | 3,750 | |||||||||||||||||
| 1,251 | 12,996 | 4,374 | 8,324 | 9,800 | 4,059 | |||||||||||||||||
| 25,856 | 26,415 | 25,992 | 26,180 | 27,553 | 29,907 | |||||||||||||||||
| - | - | - | 1,208 | 142 | 1,296 | |||||||||||||||||
| 1,287 |
| - | 1,152 | 1,095 | 6,048 | 2,254 | |||||||||||||||
| 11,450 | 42,347 | 23,351 | 35,068 | 42,595 | 25,353 | |||||||||||||||||
|
|
|
|
|
|
|
|
|
|
|
| |||||||||||
| 299,612 |
| 1,590,270 | 533,485 | 935,131 | 1,231,482 | 546,265 | |||||||||||||||
| (33,291 | ) | (7,400 | ) | (7,089 | ) | (7,936 | ) | (8,051 | ) | (9,172 | ) | ||||||||||
|
|
|
|
|
|
|
|
|
|
|
| |||||||||||
| 266,321 | 1,582,870 | 526,396 | 927,195 | 1,223,431 | 537,093 | |||||||||||||||||
|
|
|
|
|
|
|
|
|
|
|
| |||||||||||
| (12,681 | ) | (620,050 | ) | 22,895 | (375,221 | ) | 208,264 | 932,643 | ||||||||||||||
|
|
|
|
|
|
|
|
|
|
|
| |||||||||||
| 1,405,808 | 35,568,937 | 4,402,317 | 17,646,371 | 5,734,068 | 3,461,225 | |||||||||||||||||
| - | - | (2 | ) | - | - | (355 | ) | |||||||||||||||
| (493,598 | ) | (5,261,635 | ) | (368,853 | ) | (6,490,713 | ) | 3,387,627 | (41,712 | ) | ||||||||||||
|
|
|
|
|
|
|
|
|
|
|
| |||||||||||
| 912,210 | 30,307,302 | 4,033,462 | 11,155,658 | 9,121,695 | 3,419,158 | |||||||||||||||||
|
|
|
|
|
|
|
|
|
|
|
| |||||||||||
$ | 899,529 |
| $ | 29,687,252 | $ | 4,056,357 | $ | 10,780,437 | $ | 9,329,959 | $ | 4,351,801 | ||||||||||
|
|
|
|
|
|
|
|
|
|
|
| |||||||||||
| FINANCIAL STATEMENTS | 67 |
Table of Contents
STATEMENTSOF CHANGESIN NET ASSETS
| ICON Consumer Discretionary Fund | ICON Consumer Staples Fund | |||||||||||||||
| Year Ended September 30, 2014 | Year Ended September 30, 2013 | Year Ended September 30, 2014 | Year Ended September 30, 2013 | |||||||||||||
Operations | ||||||||||||||||
Net investment income/(loss) | $ | (219,047 | ) | $ | (144,778 | ) | $ | 323,098 | $ | 747,097 | ||||||
Net realized gain/(loss) | 8,557,188 | 17,367,080 | 4,345,596 | 5,151,989 | ||||||||||||
Change in net unrealized appreciation/(depreciation) | (6,120,506 | ) | (5,298,877 | ) | (319,405 | ) | (1,187,254 | ) | ||||||||
|
|
|
|
|
|
|
| |||||||||
Net increase/(decrease) in net assets resulting from operations | 2,217,635 | 11,923,425 | 4,349,289 | 4,711,832 | ||||||||||||
|
|
|
|
|
|
|
| |||||||||
Dividends and Distributions to Shareholders | ||||||||||||||||
Net investment income | ||||||||||||||||
Class S | - | (107,081 | ) | (90,346 | ) | (705,385 | ) | |||||||||
Class C | - | - | - | (14,925 | ) | |||||||||||
Class A | - | - | (4,612 | ) | (34,332 | ) | ||||||||||
Net realized gains | ||||||||||||||||
Class S | - | - | (3,012,548 | ) | - | |||||||||||
Class C | - | - | (170,527 | ) | - | |||||||||||
Class A | - | - | (227,301 | ) | - | |||||||||||
|
|
|
|
|
|
|
| |||||||||
Net decrease from dividends and distributions | - | (107,081 | ) | (3,505,334 | ) | (754,642 | ) | |||||||||
|
|
|
|
|
|
|
| |||||||||
Fund Share Transactions | ||||||||||||||||
Shares sold | ||||||||||||||||
Class S | 41,907,118 | 43,652,744 | 10,374,445 | 21,836,090 | ||||||||||||
Class C | 145,190 | 401,289 | 509,133 | 813,655 | ||||||||||||
Class A | 940,301 | 4,395,182 | 453,023 | 3,932,331 | ||||||||||||
Reinvested dividends and distributions | ||||||||||||||||
Class S | - | 105,010 | 3,053,902 | 692,727 | ||||||||||||
Class C | - | - | 44,192 | 4,317 | ||||||||||||
Class A | - | - | 194,753 | 29,553 | ||||||||||||
Shares repurchased | ||||||||||||||||
Class S | (28,297,795 | ) | (73,391,087 | ) | (22,245,087 | ) | (30,093,447 | ) | ||||||||
Class C | (106,466 | ) | (36,831 | ) | (839,836 | ) | (124,117 | ) | ||||||||
Class A | (3,354,387 | ) | (1,812,004 | ) | (745,674 | ) | (2,752,989 | ) | ||||||||
|
|
|
|
|
|
|
| |||||||||
Net increase/(decrease) from fund share transactions | 11,233,961 | (26,685,697 | ) | (9,201,149 | ) | (5,661,880 | ) | |||||||||
|
|
|
|
|
|
|
| |||||||||
Total net increase/(decrease) in net assets | 13,451,596 | (14,869,353 | ) | (8,357,194 | ) | (1,704,690 | ) | |||||||||
Net Assets | ||||||||||||||||
Beginning of year | 45,055,066 | 59,924,419 | 38,295,136 | 39,999,826 | ||||||||||||
|
|
|
|
|
|
|
| |||||||||
End of year | $ | 58,506,662 | $ | 45,055,066 | $ | 29,937,942 | $ | 38,295,136 | ||||||||
|
|
|
|
|
|
|
| |||||||||
| 68 | FINANCIAL STATEMENTS |
Table of Contents
| ICON Energy Fund | ICON Financial Fund | ICON Healthcare Fund | ||||||||||||||||||||
Year Ended | Year Ended September 30, 2013 | Year Ended September 30, 2014 | Year Ended September 30, 2013 | Year Ended September 30, 2014 | Year Ended September 30, 2013 | |||||||||||||||||
| $ | 3,085,543 | $ | 5,159,129 | $ | (12,681 | ) | $ | 281,353 | $ | (620,050 | ) | $ | 130,524 | |||||||||
| 92,771,342 | 51,204,122 | 1,405,808 | 12,374,185 | 35,568,937 | 26,892,462 | |||||||||||||||||
| (79,071,399 | ) | 51,972,292 | (493,598 | ) | (2,638,068 | ) | (5,261,635 | ) | 68,512 | |||||||||||||
|
|
|
|
|
|
|
|
|
|
|
| |||||||||||
| 16,785,486 | 108,335,543 | 899,529 | 10,017,470 | 29,687,252 | 27,091,498 | |||||||||||||||||
|
|
|
|
|
|
|
|
|
|
|
| |||||||||||
| (1,893,617 | ) | (7,939,013 | ) | (278,278 | ) | (212,181 | ) | (127,305 | ) | (960,315 | ) | |||||||||||
| - | (40,680 | ) | - | (2,641 | ) | - | (830 | ) | ||||||||||||||
| (21,999 | ) | (198,437 | ) | - | (87,060 | ) | (3,215 | ) | (4,814 | ) | ||||||||||||
| (19,835,437 | ) | - | - | - | (28,562,135 | ) | - | |||||||||||||||
| (474,214 | ) | - | - | - | (77,969 | ) | - | |||||||||||||||
| (826,812 | ) | - | - | - | (1,764,297 | ) | - | |||||||||||||||
|
|
|
|
|
|
|
|
|
|
|
| |||||||||||
| (23,052,079 | ) | (8,178,130 | ) | (278,278 | ) | (301,882 | ) | (30,534,921 | ) | (965,959 | ) | |||||||||||
|
|
|
|
|
|
|
|
|
|
|
| |||||||||||
| 167,382,750 | 198,302,565 | 25,626,071 | 29,654,752 | 103,467,905 | 43,127,373 | |||||||||||||||||
| 5,878,324 | 6,783,056 | 76,434 | 243,546 | 472,054 | 146,690 | |||||||||||||||||
| 10,311,595 | 17,708,600 | 232,046 | 819,285 | 17,798,680 | 11,232,441 | |||||||||||||||||
| 20,337,410 | 7,493,213 | 264,618 | 206,388 | 26,680,676 | 908,195 | |||||||||||||||||
| 353,636 | 32,808 | - | 2,641 | 56,771 | 494 | |||||||||||||||||
| 691,659 | 156,316 | - | 71,977 | 1,607,097 | 3,781 | |||||||||||||||||
| (226,299,050 | ) | (208,619,981 | ) | (5,998,164 | ) | (54,045,138 | ) | (74,118,289 | ) | (77,710,064 | ) | |||||||||||
| (3,329,355 | ) | (1,988,902 | ) | (314,733 | ) | (4,217 | ) | (88,793 | ) | (28,984 | ) | |||||||||||
| (10,095,019 | ) | (10,731,767 | ) | (695,372 | ) | (10,555,135 | ) | (11,351,623 | ) | (9,058,937 | ) | |||||||||||
|
|
|
|
|
|
|
|
|
|
|
| |||||||||||
| (34,768,050 | ) | 9,135,908 | 19,190,900 | (33,605,901 | ) | 64,524,478 | (31,379,011 | ) | ||||||||||||||
|
|
|
|
|
|
|
|
|
|
|
| |||||||||||
| (41,034,643 | ) | 109,293,321 | 19,812,151 | (23,890,313 | ) | 63,676,809 | (5,253,472 | ) | ||||||||||||||
| 700,440,917 | 591,147,596 | 13,085,578 | 36,975,891 | 96,177,718 | 101,431,190 | |||||||||||||||||
|
|
|
|
|
|
|
|
|
|
|
| |||||||||||
| $ | 659,406,274 | $ | 700,440,917 | $ | 32,897,729 | $ | 13,085,578 | $ | 159,854,527 | $ | 96,177,718 | |||||||||||
|
|
|
|
|
|
|
|
|
|
|
| |||||||||||
| FINANCIAL STATEMENTS | 69 |
Table of Contents
STATEMENTSOF CHANGESIN NET ASSETS (CONTINUED)
| ICON Consumer Discretionary Fund | ICON Consumer Staples Fund | |||||||||||||||
| Year Ended September 30, 2014 | Year Ended September 30, 2013 | Year Ended September 30, 2014 | Year Ended September 30, 2013 | |||||||||||||
Transactions in Fund Shares | ||||||||||||||||
Shares sold | ||||||||||||||||
Class S | 2,651,639 | 3,395,262 | 915,468 | 2,043,041 | ||||||||||||
Class C | 9,556 | 30,502 | 45,827 | 76,170 | ||||||||||||
Class A | 61,458 | 332,826 | 39,755 | 342,500 | ||||||||||||
Reinvested dividends and distributions | ||||||||||||||||
Class S | - | 9,147 | 282,148 | 64,320 | ||||||||||||
Class C | - | - | 4,161 | 403 | ||||||||||||
Class A | - | - | 17,945 | 2,678 | ||||||||||||
Shares repurchased | ||||||||||||||||
Class S | (1,835,870 | ) | (5,587,832 | ) | (1,993,855 | ) | (2,766,875 | ) | ||||||||
Class C | (7,003 | ) | (2,785 | ) | (77,614 | ) | (11,686 | ) | ||||||||
Class A | (227,736 | ) | (135,510 | ) | (65,428 | ) | (247,161 | ) | ||||||||
|
|
|
|
|
|
|
| |||||||||
Net increase/(decrease) | 652,044 | (1,958,390 | ) | (831,593 | ) | (496,610 | ) | |||||||||
|
|
|
|
|
|
|
| |||||||||
Shares outstanding, beginning of year | 3,114,762 | 5,073,152 | 3,425,492 | 3,922,102 | ||||||||||||
|
|
|
|
|
|
|
| |||||||||
Shares outstanding, end of year | 3,766,806 | 3,114,762 | 2,593,899 | 3,425,492 | ||||||||||||
|
|
|
|
|
|
|
| |||||||||
Accumulated undistributed net investment income/(loss) | $ | - | $ | (144,779 | ) | $ | 228,467 | $ | 327 | |||||||
|
|
|
|
|
|
|
| |||||||||
The accompanying notes are an integral part of the financial statements.
| 70 | FINANCIAL STATEMENTS |
Table of Contents
| ICON Energy Fund | ICON Financial Fund | ICON Healthcare Fund | ||||||||||||||||||||
Year Ended | Year Ended September 30, 2013 | Year Ended September 30, 2014 | Year Ended September 30, 2013 | Year Ended September 30, 2014 | Year Ended September 30, 2013 | |||||||||||||||||
| 7,232,880 | 9,319,960 | 3,271,278 | 4,375,423 | 4,720,711 | 2,183,690 | |||||||||||||||||
| 259,250 | 319,293 | 9,829 | 40,854 | 22,892 | 7,542 | |||||||||||||||||
| 444,640 | 838,402 | 29,716 | 124,095 | 782,634 | 584,040 | |||||||||||||||||
| 893,167 | 401,996 | 34,681 | 34,227 | 1,412,423 | 51,749 | |||||||||||||||||
| 15,794 | 1,776 | - | 450 | 3,126 | 29 | |||||||||||||||||
| 30,456 | 8,404 | - | 12,036 | 86,357 | 217 | |||||||||||||||||
| (9,726,177 | ) | (10,092,638 | ) | (771,690 | ) | (7,408,147 | ) | (3,675,631 | ) | (3,826,521 | ) | |||||||||||
| (146,695 | ) | (97,341 | ) | (41,878 | ) | (582 | ) | (4,505 | ) | (1,548 | ) | |||||||||||
| (435,607 | ) | (511,867 | ) | (88,044 | ) | (1,557,301 | ) | (545,685 | ) | (435,642 | ) | |||||||||||
|
|
|
|
|
|
|
|
|
|
|
| |||||||||||
| (1,432,292 | ) | 187,985 | 2,443,892 | (4,378,945 | ) | 2,802,322 | (1,436,444 | ) | ||||||||||||||
|
|
|
|
|
|
|
|
|
|
|
| |||||||||||
| 31,022,968 | 30,834,983 | 1,755,911 | 6,134,856 | 4,339,696 | 5,776,140 | |||||||||||||||||
|
|
|
|
|
|
|
|
|
|
|
| |||||||||||
| 29,590,676 | 31,022,968 | 4,199,803 | 1,755,911 | 7,142,018 | 4,339,696 | |||||||||||||||||
|
|
|
|
|
|
|
|
|
|
|
| |||||||||||
| $ | 2,197,918 | $ | 1,301,971 | $ | (14,823 | ) | $ | 278,277 | $ | - | $ | 130,520 | ||||||||||
|
|
|
|
|
|
|
|
|
|
|
| |||||||||||
| FINANCIAL STATEMENTS | 71 |
Table of Contents
STATEMENTSOF CHANGESIN NET ASSETS (CONTINUED)
| ICON Industrials Fund | ICON Information Technology Fund | |||||||||||||||
| Year Ended September 30, 2014 | Year Ended September 30, 2013 | Year Ended September 30, 2014 | Year Ended September 30, 2013 | |||||||||||||
Operations | ||||||||||||||||
Net investment income/(loss) | $ | 22,895 | $ | 205,307 | $ | (375,221 | ) | $ | (170,402 | ) | ||||||
Net realized gain/(loss) | 4,402,315 | 5,370,830 | 17,646,371 | 5,389,992 | ||||||||||||
Change in net unrealized appreciation/(depreciation) | (368,853 | ) | 3,471,242 | (6,490,713 | ) | (1,444,372 | ) | |||||||||
|
|
|
|
|
|
|
| |||||||||
Net increase/(decrease) in net assets resulting from operations | 4,056,357 | 9,047,379 | 10,780,437 | 3,775,218 | ||||||||||||
|
|
|
|
|
|
|
| |||||||||
Dividends and Distributions to Shareholders | ||||||||||||||||
Net investment income | ||||||||||||||||
Class S | (197,919 | ) | (420,405 | ) | - | - | ||||||||||
Class C | (974 | ) | - | - | - | |||||||||||
Class A | - | (217 | ) | - | - | |||||||||||
|
|
|
|
|
|
|
| |||||||||
Net decrease from dividends and distributions | (198,893 | ) | (420,622 | ) | - | - | ||||||||||
|
|
|
|
|
|
|
| |||||||||
Fund Share Transactions | ||||||||||||||||
Shares sold | ||||||||||||||||
Class S | 11,135,221 | 7,173,504 | 8,709,140 | 17,162,900 | ||||||||||||
Class C | 221,178 | 74,596 | 92,744 | 181,126 | ||||||||||||
Class A | 212,076 | 4,283,513 | 248,732 | 2,303,876 | ||||||||||||
Reinvested dividends and distributions | ||||||||||||||||
Class S | 194,267 | 414,890 | - | - | ||||||||||||
Class C | 803 | - | - | - | ||||||||||||
Class A | - | 175 | - | - | ||||||||||||
Shares repurchased | ||||||||||||||||
Class S | (13,559,727 | ) | (21,215,368 | ) | (42,697,099 | ) | (30,428,290 | ) | ||||||||
Class C | (43,871 | ) | (6,000 | ) | (63,858 | ) | (177,556 | ) | ||||||||
Class A | (4,380,352 | ) | (328,907 | ) | (2,347,174 | ) | (1,345,123 | ) | ||||||||
|
|
|
|
|
|
|
| |||||||||
Net increase/(decrease) from fund share transactions | (6,220,405 | ) | (9,603,597 | ) | (36,057,515 | ) | (12,303,067 | ) | ||||||||
|
|
|
|
|
|
|
| |||||||||
Total net increase/(decrease) in net assets | (2,362,941 | ) | (976,840 | ) | (25,277,078 | ) | (8,527,849 | ) | ||||||||
Net Assets | ||||||||||||||||
Beginning of year | 38,818,586 | 39,795,426 | 76,496,225 | 85,024,074 | ||||||||||||
|
|
|
|
|
|
|
| |||||||||
End of year | $ | 36,455,645 | $ | 38,818,586 | $ | 51,219,147 | $ | 76,496,225 | ||||||||
|
|
|
|
|
|
|
| |||||||||
| 72 | FINANCIAL STATEMENTS |
Table of Contents
| ICON Materials Fund | ICON Utilities Fund | |||||||||||||
Year Ended | Year Ended September 30, 2013 | Year Ended September 30, 2014 | Year Ended September 30, 2013 | |||||||||||
| $ | 208,264 | $ | 347,887 | $ | 932,643 | $ | 868,173 | |||||||
| 5,734,068 | 3,216,292 | 3,460,870 | 4,937,104 | |||||||||||
| 3,387,627 | 7,021,570 | (41,712 | ) | (2,498,233 | ) | |||||||||
|
|
|
|
|
|
|
| |||||||
| 9,329,959 | 10,585,749 | 4,351,801 | 3,307,044 | |||||||||||
|
|
|
|
|
|
|
| |||||||
| (335,560 | ) | (562,814 | ) | (783,820 | ) | (720,511 | ) | |||||||
| - | (522 | ) | (49,984 | ) | (63,357 | ) | ||||||||
| (12,325 | ) | (6,559 | ) | (65,419 | ) | (86,104 | ) | |||||||
|
|
|
|
|
|
|
| |||||||
| (347,885 | ) | (569,895 | ) | (899,223 | ) | (869,972 | ) | |||||||
|
|
|
|
|
|
|
| |||||||
| 43,480,999 | 38,528,676 | 3,908,224 | 34,316,231 | |||||||||||
| 465,892 | 39,207 | 105,014 | 94,411 | |||||||||||
| 6,611,987 | 3,429,905 | 1,191,616 | 817,380 | |||||||||||
| 301,996 | 518,793 | 748,212 | 654,271 | |||||||||||
| - | 473 | 11,949 | 19,963 | |||||||||||
| 11,008 | 5,232 | 52,883 | 46,543 | |||||||||||
| (24,468,828 | ) | (24,745,973 | ) | (18,863,423 | ) | (31,490,277 | ) | |||||||
| (48,417 | ) | (51,875 | ) | (957,637 | ) | (715,484 | ) | |||||||
| (705,580 | ) | (2,218,510 | ) | (1,319,199 | ) | (5,719,639 | ) | |||||||
|
|
|
|
|
|
|
| |||||||
| 25,649,057 | 15,505,928 | (15,122,361 | ) | (1,976,601 | ) | |||||||||
|
|
|
|
|
|
|
| |||||||
| 34,631,131 | 25,521,782 | (11,669,783 | ) | 460,471 | ||||||||||
| 67,882,985 | 42,361,203 | 34,353,072 | 33,892,601 | |||||||||||
|
|
|
|
|
|
|
| |||||||
| $ | 102,514,116 | $ | 67,882,985 | $ | 22,683,289 | $ | 34,353,072 | |||||||
|
|
|
|
|
|
|
| |||||||
| FINANCIAL STATEMENTS | 73 |
Table of Contents
STATEMENTSOF CHANGESIN NET ASSETS (CONTINUED)
| ICON Industrials Fund | ICON Information Technology Fund | |||||||||||||||
| Year Ended September 30, 2014 | Year Ended September 30, 2013 | Year Ended September 30, 2014 | Year Ended September 30, 2013 | |||||||||||||
Transactions in Fund Shares | ||||||||||||||||
Shares sold | ||||||||||||||||
Class S | 968,544 | 770,135 | 675,116 | 1,627,939 | ||||||||||||
Class C | 19,526 | 7,472 | 7,757 | 17,981 | ||||||||||||
Class A | 17,942 | 426,449 | 19,562 | 204,149 | ||||||||||||
Reinvested dividends and distributions | ||||||||||||||||
Class S | 17,330 | 49,628 | - | - | ||||||||||||
Class C | 73 | - | - | - | ||||||||||||
Class A | - | 21 | - | - | ||||||||||||
Shares repurchased | ||||||||||||||||
Class S | (1,168,317 | ) | (2,361,282 | ) | (3,413,938 | ) | (2,944,037 | ) | ||||||||
Class C | (3,813 | ) | (570 | ) | (5,246 | ) | (17,570 | ) | ||||||||
Class A | (405,848 | ) | (32,904 | ) | (191,533 | ) | (129,555 | ) | ||||||||
|
|
|
|
|
|
|
| |||||||||
Net increase/(decrease) | (554,563 | ) | (1,141,051 | ) | (2,908,282 | ) | (1,241,093 | ) | ||||||||
|
|
|
|
|
|
|
| |||||||||
Shares outstanding, beginning of year | 3,680,025 | 4,821,076 | 6,690,405 | 7,931,498 | ||||||||||||
|
|
|
|
|
|
|
| |||||||||
Shares outstanding, end of year | 3,125,462 | 3,680,025 | 3,782,123 | 6,690,405 | ||||||||||||
|
|
|
|
|
|
|
| |||||||||
Accumulated undistributed net investment income/(loss) | $ | 16,629 | $ | 198,892 | $ | (288,745 | ) | $ | (290,634 | ) | ||||||
|
|
|
|
|
|
|
| |||||||||
The accompanying notes are an integral part of the financial statements.
| 74 | FINANCIAL STATEMENTS |
Table of Contents
| ICON Materials Fund | ICON Utilities Fund | |||||||||||||
Year Ended | Year Ended September 30, 2013 | Year Ended September 30, 2014 | Year Ended September 30, 2013 | |||||||||||
| 2,950,323 | 3,213,924 | 507,380 | 4,739,990 | |||||||||||
| 32,505 | 3,256 | 13,552 | 13,503 | |||||||||||
| 455,567 | 268,253 | 152,325 | 111,218 | |||||||||||
| 21,282 | 47,903 | 94,392 | 91,047 | |||||||||||
| - | 44 | 1,526 | 2,846 | |||||||||||
| 780 | 484 | 6,726 | 6,655 | |||||||||||
| (1,667,011 | ) | (2,106,268 | ) | (2,368,098 | ) | (4,252,491 | ) | |||||||
| (3,294 | ) | (4,677 | ) | (124,852 | ) | (103,007 | ) | |||||||
| (47,170 | ) | (176,505 | ) | (173,414 | ) | (838,700 | ) | |||||||
|
|
|
|
|
|
|
| |||||||
| 1,742,982 | 1,246,414 | (1,890,463 | ) | (228,939 | ) | |||||||||
|
|
|
|
|
|
|
| |||||||
| 5,056,821 | 3,810,407 | 4,768,143 | 4,997,082 | |||||||||||
|
|
|
|
|
|
|
| |||||||
| 6,799,803 | 5,056,821 | 2,877,680 | 4,768,143 | |||||||||||
|
|
|
|
|
|
|
| |||||||
| $ | 208,261 | $ | 347,882 | $ | 36,466 | $ | 3,401 | |||||||
|
|
|
|
|
|
|
| |||||||
| FINANCIAL STATEMENTS | 75 |
Table of Contents
| Income/(loss) from investment operations | Less dividends and | |||||||||||||||||||||||
| Net asset value, beginning of period | Net investment income/ (loss)(x) | Net realized and unrealized gains/(losses) on investments | Total from investment operations | Dividends from net investment income | Distributions from net realized gains | |||||||||||||||||||
ICON Consumer Discretionary Fund | ||||||||||||||||||||||||
Class S | ||||||||||||||||||||||||
Year ended September 30, 2014 | $ | 14.50 | $ | (0.07 | ) | $ | 1.12 | $ | 1.05 | $ | - | $ | - | |||||||||||
Year ended September 30, 2013 | 11.82 | (0.03 | ) | 2.73 | 2.70 | (0.02 | ) | - | ||||||||||||||||
Year ended September 30, 2012 | 8.79 | 0.03 | 3.00 | 3.03 | - | - | ||||||||||||||||||
Year ended September 30, 2011 | 7.92 | (0.02 | ) | 0.89 | 0.87 | - | - | |||||||||||||||||
Year ended September 30, 2010 | 6.83 | (0.05 | ) | 1.42 | 1.37 | (0.28 | ) | - | ||||||||||||||||
Class C | ||||||||||||||||||||||||
Year ended September 30, 2014 | 14.05 | (0.26 | ) | 1.09 | 0.83 | - | - | |||||||||||||||||
Year ended September 30, 2013 | 11.57 | (0.24 | ) | 2.72 | 2.48 | - | - | |||||||||||||||||
Year ended September 30, 2012 | 8.72 | (0.12 | ) | 2.97 | 2.85 | - | - | |||||||||||||||||
Year ended September 30, 2011 | 7.92 | (0.12 | ) | 0.92 | 0.80 | - | - | |||||||||||||||||
Class A | ||||||||||||||||||||||||
Year ended September 30, 2014 | 14.25 | (0.12 | ) | 1.11 | 0.99 | - | - | |||||||||||||||||
Year ended September 30, 2013 | 11.65 | (0.09 | ) | 2.69 | 2.60 | - | - | |||||||||||||||||
Year ended September 30, 2012 | 8.75 | (0.02 | ) | 2.92 | 2.90 | - | - | |||||||||||||||||
Year ended September 30, 2011 | 7.92 | (0.06 | ) | 0.89 | 0.83 | - | - | |||||||||||||||||
ICON Consumer Staples Fund | ||||||||||||||||||||||||
Class S | ||||||||||||||||||||||||
Year ended September 30, 2014 | 11.18 | 0.11 | 1.31 | 1.42 | (0.03 | ) | (1.02 | ) | ||||||||||||||||
Year ended September 30, 2013 | 10.20 | 0.21 | 0.98 | 1.19 | (0.21 | ) | - | |||||||||||||||||
Year ended September 30, 2012 | 8.61 | 0.14 | 1.69 | 1.83 | (0.24 | ) | - | |||||||||||||||||
Year ended September 30, 2011 | 8.08 | 0.10 | 0.52 | 0.62 | (0.09 | ) | - | |||||||||||||||||
Year ended September 30, 2010 | 7.32 | 0.08 | 0.76 | 0.84 | (0.08 | ) | - | |||||||||||||||||
Class C | ||||||||||||||||||||||||
Year ended September 30, 2014 | 11.02 | (0.01 | ) | 1.29 | 1.28 | - | (1.02 | ) | ||||||||||||||||
Year ended September 30, 2013 | 10.06 | 0.08 | 0.99 | 1.07 | (0.11 | ) | - | |||||||||||||||||
Year ended September 30, 2012 | 8.53 | 0.05 | 1.66 | 1.71 | (0.18 | ) | - | |||||||||||||||||
Year ended September 30, 2011 | 8.08 | 0.04 | 0.50 | 0.54 | (0.09 | ) | - | |||||||||||||||||
Class A | ||||||||||||||||||||||||
Year ended September 30, 2014 | 11.23 | 0.07 | 1.32 | 1.39 | (0.02 | ) | (1.02 | ) | ||||||||||||||||
Year ended September 30, 2013 | 10.24 | 0.14 | 1.03 | 1.17 | (0.18 | ) | - | |||||||||||||||||
Year ended September 30, 2012 | 8.68 | 0.11 | 1.68 | 1.79 | (0.23 | ) | - | |||||||||||||||||
Year ended September 30, 2011 | 8.08 | 0.11 | 0.58 | 0.69 | (0.09 | ) | - | |||||||||||||||||
| 76 | FINANCIAL HIGHLIGHTS |
Table of Contents
| distributions | Ratio of expenses to average net assets | Ratio of net investment income/(loss) to average net assets | ||||||||||||||||||||||||||||||||
| Total dividends and distributions | Net asset value, end of period | Total return* | Net assets, end of period (in thousands) | Before expense limitation/ recoupment and transfer agent earnings credits | After expense limitation/ recoupment and transfer agent earnings credits | Before expense limitation/ recoupment and transfer agent earnings credits | After expense limitation/ recoupment and transfer agent earnings credits | Portfolio turnover rate(a) | ||||||||||||||||||||||||||
| $ | - | $ | 15.55 | 7.24 | % | $ | 55,476 | 1.46 | % | 1.46 | %(b) | (0.47 | )% | (0.47 | )% | 202.10 | % | |||||||||||||||||
| (0.02 | ) | 14.50 | 22.91 | % | 39,883 | 1.38 | % | 1.38 | %(b) | (0.21 | )% | (0.21 | )% | 87.00 | % | |||||||||||||||||||
| - | 11.82 | 34.47 | % | 58,314 | 1.40 | % | 1.40 | %(b) | 0.26 | % | 0.26 | % | 91.24 | % | ||||||||||||||||||||
| - | 8.79 | 10.98 | % | 34,123 | 1.54 | % | 1.54 | %(b) | (0.23 | )% | (0.23 | )% | 107.57 | % | ||||||||||||||||||||
| (0.28 | ) | 7.92 | 20.61 | % | 17,750 | 2.02 | % | 2.02 | % | (0.62 | )% | (0.62 | )% | 194.84 | % | |||||||||||||||||||
| - | 14.88 | 5.91 | % | 539 | 3.78 | % | 2.74 | %(b) | (2.80 | )% | (1.76 | )% | 202.10 | % | ||||||||||||||||||||
| - | 14.05 | 21.43 | % | 473 | 3.68 | % | 2.75 | %(b) | (2.74 | )% | (1.81 | )% | 87.00 | % | ||||||||||||||||||||
| - | 11.57 | 32.68 | % | 69 | 6.01 | % | 2.75 | %(b) | (4.42 | )% | (1.16 | )% | 91.24 | % | ||||||||||||||||||||
| - | 8.72 | 10.10 | % | 32 | 13.14 | % | 2.75 | %(b) | (11.73 | )% | (1.34 | )% | 107.57 | % | ||||||||||||||||||||
| - | 15.24 | 6.95 | % | 2,492 | 1.76 | % | 1.76 | %(b) | (0.80 | )% | (0.80 | )% | 202.10 | % | ||||||||||||||||||||
| - | 14.25 | 22.42 | % | 4,699 | 1.78 | % | 1.78 | %(b) | (0.66 | )% | (0.66 | )% | 87.00 | % | ||||||||||||||||||||
| - | 11.65 | 33.03 | % | 1,542 | 1.78 | % | 1.78 | %(b) | (0.20 | )% | (0.20 | )% | 91.24 | % | ||||||||||||||||||||
| - | 8.75 | 10.48 | % | 11 | 18.49 | % | 1.98 | %(b) | (17.17 | )% | (0.66 | )% | 107.57 | % | ||||||||||||||||||||
| (1.05 | ) | 11.55 | 13.32 | % | 25,731 | 1.45 | % | 1.45 | %(b) | 0.94 | % | 0.94 | % | 52.38 | % | |||||||||||||||||||
| (0.21 | ) | 11.18 | 11.75 | % | 33,813 | 1.51 | % | 1.51 | %(b) | 1.92 | % | 1.92 | % | 90.51 | % | |||||||||||||||||||
| (0.24 | ) | 10.20 | 21.50 | % | 37,567 | 1.55 | % | 1.51 | %(b) | 1.40 | % | 1.44 | % | 81.81 | % | |||||||||||||||||||
| (0.09 | ) | 8.61 | 7.64 | % | 20,614 | 1.57 | % | 1.50 | %(b) | 1.03 | % | 1.10 | % | 109.56 | % | |||||||||||||||||||
| (0.08 | ) | 8.08 | 11.56 | % | 30,640 | 1.54 | % | 1.54 | % | 0.98 | % | 0.98 | % | 86.31 | % | |||||||||||||||||||
| (1.02 | ) | 11.28 | 12.17 | % | 1,467 | 2.76 | % | 2.50 | %(b) | (0.38 | )% | (0.12 | )% | 52.38 | % | |||||||||||||||||||
| (0.11 | ) | 11.02 | 10.69 | % | 1,738 | 2.61 | % | 2.50 | %(b) | 0.61 | % | 0.72 | % | 90.51 | % | |||||||||||||||||||
| (0.18 | ) | 10.06 | 20.26 | % | 934 | 3.33 | % | 2.51 | %(b) | (0.35 | )% | 0.47 | % | 81.81 | % | |||||||||||||||||||
| (0.09 | ) | 8.53 | 6.65 | % | 55 | 7.00 | % | 2.50 | %(b) | (4.09 | )% | 0.41 | % | 109.56 | % | |||||||||||||||||||
| (1.04 | ) | 11.58 | 12.99 | % | 2,740 | 2.04 | % | 1.75 | %(b) | 0.35 | % | 0.64 | % | 52.38 | % | |||||||||||||||||||
| (0.18 | ) | 11.23 | 11.52 | % | 2,744 | 1.84 | % | 1.75 | %(b) | 1.20 | % | 1.29 | % | 90.51 | % | |||||||||||||||||||
| (0.23 | ) | 10.24 | 20.94 | % | 1,499 | 2.05 | % | 1.77 | %(b) | 0.82 | % | 1.10 | % | 81.81 | % | |||||||||||||||||||
| (0.09 | ) | 8.68 | 8.52 | % | 24 | 7.60 | % | 1.75 | %(b) | (4.60 | )% | 1.25 | % | 109.56 | % | |||||||||||||||||||
| FINANCIAL HIGHLIGHTS | 77 |
Table of Contents
FINANCIAL HIGHLIGHTS (CONTINUED)
| Income/(loss) from investment operations | Less dividends and | |||||||||||||||||||||||
| Net asset value, beginning of period | Net investment income/ (loss)(x) | Net realized and unrealized gains/(losses) on investments | Total from investment operations | Dividends from net investment income | Distributions from net realized gains | |||||||||||||||||||
ICON Energy Fund | ||||||||||||||||||||||||
Class S | ||||||||||||||||||||||||
Year ended September 30, 2014 | $ | 22.59 | $ | 0.11 | $ | 0.33 | $ | 0.44 | $ | (0.06 | ) | $ | (0.67 | ) | ||||||||||
Year ended September 30, 2013 | 19.18 | 0.18 | 3.51 | 3.69 | (0.28 | ) | - | |||||||||||||||||
Year ended September 30, 2012 | 16.64 | 0.16 | 2.93 | 3.09 | (0.15 | ) | (0.40 | ) | ||||||||||||||||
Year ended September 30, 2011 | 16.69 | 0.16 | - | 0.16 | (0.21 | ) | - | |||||||||||||||||
Year ended September 30, 2010 | 16.92 | 0.21 | (0.23 | ) | (0.02 | ) | (0.21 | ) | - | |||||||||||||||
Class C | ||||||||||||||||||||||||
Year ended September 30, 2014 | 22.21 | (0.15 | ) | 0.35 | 0.20 | - | (0.67 | ) | ||||||||||||||||
Year ended September 30, 2013 | 18.87 | (0.05 | ) | 3.48 | 3.43 | (0.09 | ) | - | ||||||||||||||||
Year ended September 30, 2012 | 16.47 | (0.04 | ) | 2.88 | 2.84 | (0.04 | ) | (0.40 | ) | |||||||||||||||
Year ended September 30, 2011 | 16.69 | (0.10 | ) | 0.09 | (0.01 | ) | (0.21 | ) | - | |||||||||||||||
Class A | ||||||||||||||||||||||||
Year ended September 30, 2014 | 22.50 | 0.04 | 0.35 | 0.39 | (0.02 | ) | (0.67 | ) | ||||||||||||||||
Year ended September 30, 2013 | 19.12 | 0.11 | 3.51 | 3.62 | (0.24 | ) | - | |||||||||||||||||
Year ended September 30, 2012 | 16.59 | 0.11 | 2.91 | 3.02 | (0.09 | ) | (0.40 | ) | ||||||||||||||||
Year ended September 30, 2011 | 16.69 | 0.08 | 0.03 | 0.11 | (0.21 | ) | - | |||||||||||||||||
ICON Financial Fund | ||||||||||||||||||||||||
Class S | ||||||||||||||||||||||||
Year ended September 30, 2014 | 7.47 | - | (c) | 0.54 | 0.54 | (0.18 | ) | - | ||||||||||||||||
Year ended September 30, 2013 | 6.04 | 0.04 | 1.44 | 1.48 | (0.05 | ) | - | |||||||||||||||||
Year ended September 30, 2012 | 4.69 | 0.04 | 1.34 | 1.38 | (0.03 | ) | - | |||||||||||||||||
Year ended September 30, 2011 | 5.55 | 0.03 | (0.87 | ) | (0.84 | ) | (0.02 | ) | - | |||||||||||||||
Year ended September 30, 2010 | 5.97 | 0.02 | (0.32 | ) | (0.30 | ) | (0.12 | ) | - | |||||||||||||||
Class C | ||||||||||||||||||||||||
Year ended September 30, 2014 | 7.20 | (0.07 | ) | 0.63 | 0.56 | - | - | |||||||||||||||||
Year ended September 30, 2013 | 5.91 | (0.03 | ) | 1.39 | 1.36 | (0.07 | ) | - | ||||||||||||||||
Year ended September 30, 2012 | 4.64 | (0.02 | ) | 1.31 | 1.29 | (0.02 | ) | - | ||||||||||||||||
Year ended September 30, 2011 | 5.55 | (0.02 | ) | (0.87 | ) | (0.89 | ) | (0.02 | ) | - | ||||||||||||||
Class A | ||||||||||||||||||||||||
Year ended September 30, 2014 | 7.37 | (0.02 | ) | 0.54 | 0.52 | - | - | |||||||||||||||||
Year ended September 30, 2013 | 5.99 | 0.06 | 1.38 | 1.44 | (0.06 | ) | - | |||||||||||||||||
Year ended September 30, 2012 | 4.68 | 0.01 | 1.33 | 1.34 | (0.03 | ) | - | |||||||||||||||||
Year ended September 30, 2011 | 5.55 | 0.01 | (0.86 | ) | (0.85 | ) | (0.02 | ) | - | |||||||||||||||
| 78 | FINANCIAL HIGHLIGHTS |
Table of Contents
| distributions | Ratio of expenses to average net assets | Ratio of net investment income/(loss) to average net assets | ||||||||||||||||||||||||||||||||
| Total dividends and distributions | Net asset value, end of period | Total return* | Net assets, end of period (in thousands) | Before expense limitation/ recoupment and transfer agent earnings credits | After expense limitation/ recoupment and transfer agent earnings credits | Before expense limitation/ recoupment and transfer agent earnings credits | After expense limitation/ recoupment and transfer agent earnings credits | Portfolio turnover rate(a) | ||||||||||||||||||||||||||
| $ | (0.73 | ) | $ | 22.30 | 1.92 | % | $ | 615,541 | 1.28 | % | 1.28 | %(b) | 0.46 | % | 0.46 | % | 96.79 | % | ||||||||||||||||
| (0.28 | ) | 22.59 | 19.55 | % | 659,581 | 1.29 | % | 1.29 | %(b) | 0.85 | % | 0.85 | % | 88.16 | % | |||||||||||||||||||
| (0.55 | ) | 19.18 | 18.87 | % | 567,054 | 1.23 | % | 1.23 | %(b) | 0.87 | % | 0.87 | % | 74.41 | % | |||||||||||||||||||
| (0.21 | ) | 16.64 | 0.80 | % | 556,393 | 1.20 | % | 1.20 | %(b) | 0.77 | % | 0.77 | % | 88.31 | % | |||||||||||||||||||
| (0.21 | ) | 16.69 | (0.17 | )% | 510,181 | 1.24 | % | 1.24 | % | 1.26 | % | 1.26 | % | 169.86 | % | |||||||||||||||||||
| (0.67 | ) | 21.74 | 0.83 | % | 17,170 | 2.38 | % | 2.38 | %(b) | (0.65 | )% | (0.65 | )% | 96.79 | % | |||||||||||||||||||
| (0.09 | ) | 22.21 | 18.30 | % | 14,691 | 2.35 | % | 2.35 | %(b) | (0.25 | )% | (0.25 | )% | 88.16 | % | |||||||||||||||||||
| (0.44 | ) | 18.87 | 17.50 | % | 8,257 | 2.36 | % | 2.36 | %(b) | (0.20 | )% | (0.20 | )% | 74.41 | % | |||||||||||||||||||
| (0.21 | ) | 16.47 | (0.23 | )% | 4,718 | 2.47 | % | 2.47 | %(b) | (0.47 | )% | (0.47 | )% | 88.31 | % | |||||||||||||||||||
| (0.69 | ) | 22.20 | 1.67 | % | 26,695 | 1.55 | % | 1.55 | %(b) | 0.19 | % | 0.19 | % | 96.79 | % | |||||||||||||||||||
| (0.24 | ) | 22.50 | 19.21 | % | 26,170 | 1.61 | % | 1.61 | %(b) | 0.51 | % | 0.51 | % | 88.16 | % | |||||||||||||||||||
| (0.49 | ) | 19.12 | 18.47 | % | 15,836 | 1.55 | % | 1.55 | %(b) | 0.61 | % | 0.61 | % | 74.41 | % | |||||||||||||||||||
| (0.21 | ) | 16.59 | 0.49 | % | 6,005 | 1.70 | % | 1.70 | %(b) | 0.38 | % | 0.38 | % | 88.31 | % | |||||||||||||||||||
| (0.18 | ) | 7.83 | 7.27 | % | 32,286 | 1.64 | % | 1.50 | %(b) | (0.20 | )% | (0.06 | )% | 78.93 | % | |||||||||||||||||||
| (0.05 | ) | 7.47 | 24.68 | % | 11,853 | 1.47 | % | 1.47 | %(b) | 0.65 | % | 0.65 | % | 95.21 | % | |||||||||||||||||||
| (0.03 | ) | 6.04 | 29.54 | % | 27,696 | 1.39 | % | 1.39 | %(b) | 0.70 | % | 0.70 | % | 95.47 | % | |||||||||||||||||||
| (0.02 | ) | 4.69 | (15.18 | )% | 32,432 | 1.40 | % | 1.40 | %(b) | 0.44 | % | 0.44 | % | 100.23 | % | |||||||||||||||||||
| (0.12 | ) | 5.55 | (5.11 | )% | 58,750 | 1.43 | % | 1.43 | % | 0.36 | % | 0.36 | % | 143.36 | % | |||||||||||||||||||
| - | 7.76 | 7.93 | % | 71 | 7.35 | % | 2.50 | %(b) | (5.74 | )% | (0.89 | )% | 78.93 | % | ||||||||||||||||||||
| (0.07 | ) | 7.20 | 23.18 | % | 296 | 3.19 | % | 2.51 | %(b) | (1.07 | )% | (0.40 | )% | 95.21 | % | |||||||||||||||||||
| (0.02 | ) | 5.91 | 27.79 | % | 3 | 23.96 | % | 2.51 | %(b) | (21.84 | )% | (0.39 | )% | 95.47 | % | |||||||||||||||||||
| (0.02 | ) | 4.64 | (16.08 | )% | 9 | 35.28 | % | 2.50 | %(b) | (33.22 | )% | (0.44 | )% | 100.23 | % | |||||||||||||||||||
| - | 7.89 | 7.20 | % | 541 | 2.35 | % | 1.75 | %(b) | (0.86 | )% | (0.26 | )% | 78.93 | % | ||||||||||||||||||||
| (0.06 | ) | 7.37 | 24.20 | % | 936 | 1.88 | % | 1.76 | %(b) | 0.82 | % | 0.94 | % | 95.21 | % | |||||||||||||||||||
| (0.03 | ) | 5.99 | 28.83 | % | 9,278 | 1.80 | % | 1.77 | %(b) | 0.09 | % | 0.12 | % | 95.47 | % | |||||||||||||||||||
| (0.02 | ) | 4.68 | (15.36 | )% | 24 | 7.37 | % | 1.75 | %(b) | (5.50 | )% | 0.12 | % | 100.23 | % | |||||||||||||||||||
| FINANCIAL HIGHLIGHTS | 79 |
Table of Contents
FINANCIAL HIGHLIGHTS (CONTINUED)
| Income/(loss) from investment operations | Less dividends and | |||||||||||||||||||||||
| Net asset value, beginning of period | Net investment income/ (loss)(x) | Net realized and unrealized gains/(losses) on investments | Total from investment operations | Dividends from net investment income | Distributions from net realized gains | |||||||||||||||||||
ICON Healthcare Fund | ||||||||||||||||||||||||
Class S | ||||||||||||||||||||||||
Year ended September 30, 2014 | $ | 22.17 | $ | (0.11 | ) | $ | 6.18 | $ | 6.07 | $ | (0.03 | ) | $ | (5.79 | ) | |||||||||
Year ended September 30, 2013 | 17.56 | 0.03 | 4.75 | 4.78 | (0.17 | ) | - | |||||||||||||||||
Year ended September 30, 2012 | 13.56 | 0.17 | 3.97 | 4.14 | (0.14 | ) | - | |||||||||||||||||
Year ended September 30, 2011 | 12.78 | 0.12 | 0.73 | 0.85 | (0.07 | ) | - | |||||||||||||||||
Year ended September 30, 2010 | 12.29 | 0.04 | 0.63 | 0.67 | (0.18 | ) | - | |||||||||||||||||
Class C | ||||||||||||||||||||||||
Year ended September 30, 2014 | 21.55 | (0.34 | ) | 5.94 | 5.60 | - | (5.79 | ) | ||||||||||||||||
Year ended September 30, 2013 | 17.21 | (0.21 | ) | 4.67 | 4.46 | (0.12 | ) | - | ||||||||||||||||
Year ended September 30, 2012 | 13.43 | (0.01 | ) | 3.91 | 3.90 | (0.12 | ) | - | ||||||||||||||||
Year ended September 30, 2011 | 12.78 | (0.01 | ) | 0.73 | 0.72 | (0.07 | ) | - | ||||||||||||||||
Class A | ||||||||||||||||||||||||
Year ended September 30, 2014 | 21.92 | (0.14 | ) | 6.03 | 5.89 | (0.01 | ) | (5.79 | ) | |||||||||||||||
Year ended September 30, 2013 | 17.42 | (0.03 | ) | 4.69 | 4.66 | (0.16 | ) | - | ||||||||||||||||
Year ended September 30, 2012 | 13.53 | 0.11 | 3.94 | 4.05 | (0.16 | ) | - | |||||||||||||||||
Year ended September 30, 2011 | 12.78 | 0.12 | 0.70 | 0.82 | (0.07 | ) | - | |||||||||||||||||
ICON Industrials Fund | ||||||||||||||||||||||||
Class S | ||||||||||||||||||||||||
Year ended September 30, 2014 | 10.56 | 0.01 | 1.16 | 1.17 | (0.06 | ) | - | |||||||||||||||||
Year ended September 30, 2013 | 8.26 | 0.06 | 2.35 | 2.41 | (0.11 | ) | - | |||||||||||||||||
Year ended September 30, 2012 | 6.80 | 0.07 | 1.48 | 1.55 | (0.09 | ) | - | |||||||||||||||||
Year ended September 30, 2011 | 7.47 | 0.07 | (0.67 | ) | (0.60 | ) | (0.07 | ) | - | |||||||||||||||
Year ended September 30, 2010 | 6.38 | 0.05 | 1.17 | 1.22 | (0.13 | ) | - | |||||||||||||||||
Class C | ||||||||||||||||||||||||
Year ended September 30, 2014 | 10.41 | (0.12 | ) | 1.15 | 1.03 | (0.06 | ) | - | ||||||||||||||||
Year ended September 30, 2013 | 8.12 | (0.06 | ) | 2.35 | 2.29 | - | - | |||||||||||||||||
Year ended September 30, 2012 | 6.72 | (0.01 | ) | 1.46 | 1.45 | (0.05 | ) | - | ||||||||||||||||
Year ended September 30, 2011 | 7.47 | (0.02 | ) | (0.66 | ) | (0.68 | ) | (0.07 | ) | - | ||||||||||||||
Class A | ||||||||||||||||||||||||
Year ended September 30, 2014 | 10.45 | (0.03 | ) | 1.16 | 1.13 | - | - | |||||||||||||||||
Year ended September 30, 2013 | 8.10 | - | (c) | 2.36 | 2.36 | (0.01 | ) | - | ||||||||||||||||
Year ended September 30, 2012 | 6.76 | 0.08 | 1.35 | 1.43 | (0.09 | ) | - | |||||||||||||||||
Year ended September 30, 2011 | 7.47 | 0.05 | (0.69 | ) | (0.64 | ) | (0.07 | ) | - | |||||||||||||||
| 80 | FINANCIAL HIGHLIGHTS |
Table of Contents
| distributions | Ratio of expenses to average net assets | Ratio of net investment income/(loss) to average net assets | ||||||||||||||||||||||||||||||||
| Total dividends and distributions | Net asset value, end of period | Total return* | Net assets, end of period (in thousands) | Before expense limitation/ recoupment and transfer agent earnings credits | After expense limitation/ recoupment and transfer agent earnings credits | Before expense limitation/ recoupment and transfer agent earnings credits | After expense limitation/ recoupment and transfer agent earnings credits | Portfolio turnover rate(a) | ||||||||||||||||||||||||||
| $ | (5.82 | ) | $ | 22.42 | 32.27 | % | $ | 148,261 | 1.36 | % | 1.36 | %(b) | (0.53 | )% | (0.53 | )% | 187.85 | % | ||||||||||||||||
| (0.17 | ) | 22.17 | 27.48 | % | 92,171 | 1.39 | % | 1.39 | %(b) | 0.13 | % | 0.13 | % | 111.86 | % | |||||||||||||||||||
| (0.14 | ) | 17.56 | 30.76 | % | 100,938 | 1.34 | % | 1.34 | %(b) | 1.08 | % | 1.08 | % | 47.59 | % | |||||||||||||||||||
| (0.07 | ) | 13.56 | 6.66 | % | 75,116 | 1.36 | % | 1.36 | %(b) | 0.85 | % | 0.85 | % | 83.63 | % | |||||||||||||||||||
| (0.18 | ) | 12.78 | 5.39 | % | 72,554 | 1.36 | % | 1.36 | % | 0.31 | % | 0.31 | % | 102.42 | % | |||||||||||||||||||
| (5.79 | ) | 21.36 | 30.73 | % | 716 | 4.31 | % | 2.50 | %(b) | (3.49 | )% | (1.68 | )% | 187.85 | % | |||||||||||||||||||
| (0.12 | ) | 21.55 | 26.11 | % | 259 | 4.42 | % | 2.50 | %(b) | (2.98 | )% | (1.06 | )% | 111.86 | % | |||||||||||||||||||
| (0.12 | ) | 17.21 | 29.24 | % | 103 | 11.81 | % | 2.51 | %(b) | (9.38 | )% | (0.08 | )% | 47.59 | % | |||||||||||||||||||
| (0.07 | ) | 13.43 | 5.64 | % | 22 | 31.38 | % | 2.50 | %(b) | (28.98 | )% | (0.10 | )% | 83.63 | % | |||||||||||||||||||
| (5.80 | ) | 22.01 | 31.72 | % | 10,878 | 1.62 | % | 1.62 | %(b) | (0.66 | )% | (0.66 | )% | 187.85 | % | |||||||||||||||||||
| (0.16 | ) | 21.92 | 26.95 | % | 3,748 | 1.69 | % | 1.69 | %(b) | (0.15 | )% | (0.15 | )% | 111.86 | % | |||||||||||||||||||
| (0.16 | ) | 17.42 | 30.19 | % | 390 | 2.89 | % | 1.76 | %(b) | (0.46 | )% | 0.67 | % | 47.59 | % | |||||||||||||||||||
| (0.07 | ) | 13.53 | 6.42 | % | 126 | 7.15 | % | 1.75 | %(b) | (4.58 | )% | 0.82 | % | 83.63 | % | |||||||||||||||||||
| (0.06 | ) | 11.67 | 11.14 | % | 35,883 | 1.41 | % | 1.41 | %(b) | 0.07 | % | 0.07 | % | 30.09 | % | |||||||||||||||||||
| (0.11 | ) | 10.56 | 29.52 | % | 34,409 | 1.46 | % | 1.46 | %(b) | 0.60 | % | 0.60 | % | 45.66 | % | |||||||||||||||||||
| (0.09 | ) | 8.26 | 22.99 | % | 39,621 | 1.40 | % | 1.40 | %(b) | 0.91 | % | 0.91 | % | 33.73 | % | |||||||||||||||||||
| (0.07 | ) | 6.80 | (8.21 | )% | 50,653 | 1.36 | % | 1.36 | %(b) | 0.80 | % | 0.80 | % | 55.87 | % | |||||||||||||||||||
| (0.13 | ) | 7.47 | 19.40 | % | 71,607 | 1.40 | % | 1.40 | % | 0.73 | % | 0.73 | % | 54.34 | % | |||||||||||||||||||
| (0.06 | ) | 11.38 | 9.95 | % | 275 | 5.01 | % | 2.50 | %(b) | (3.53 | )% | (1.03 | )% | 30.09 | % | |||||||||||||||||||
| - | 10.41 | 28.20 | % | 87 | 9.86 | % | 2.50 | %(b) | (8.02 | )% | (0.66 | )% | 45.66 | % | ||||||||||||||||||||
| (0.05 | ) | 8.12 | 21.58 | % | 12 | 13.40 | % | 2.51 | %(b) | (11.07 | )% | (0.18 | )% | 33.73 | % | |||||||||||||||||||
| (0.07 | ) | 6.72 | (9.29 | )% | 15 | 13.56 | % | 2.50 | %(b) | (11.29 | )% | (0.23 | )% | 55.87 | % | |||||||||||||||||||
| - | 11.58 | 10.81 | % | 298 | 2.02 | % | 1.75 | %(b) | (0.56 | )% | (0.29 | )% | 30.09 | % | ||||||||||||||||||||
| (0.01 | ) | 10.45 | 29.20 | % | 4,322 | 2.09 | % | 1.75 | %(b) | (0.32 | )% | 0.02 | % | 45.66 | % | |||||||||||||||||||
| (0.09 | ) | 8.10 | 21.21 | % | 163 | 2.50 | % | 1.75 | %(b) | 0.18 | % | 0.93 | % | 33.73 | % | |||||||||||||||||||
| (0.07 | ) | 6.76 | (8.75 | )% | 122 | 3.46 | % | 1.75 | %(b) | (1.12 | )% | 0.59 | % | 55.87 | % | |||||||||||||||||||
| FINANCIAL HIGHLIGHTS | 81 |
Table of Contents
FINANCIAL HIGHLIGHTS (CONTINUED)
| Income/(loss) from investment operations | Less dividends and | |||||||||||||||||||||||
| Net asset value, beginning of period | Net investment income/ (loss)(x) | Net realized and unrealized gains/(losses) on investments | Total from investment operations | Dividends from net investment income | Distributions from net realized gains | |||||||||||||||||||
ICON Information Technology Fund | ||||||||||||||||||||||||
Class S | ||||||||||||||||||||||||
Year ended September 30, 2014 | $ | 11.44 | $ | (0.07 | ) | $ | 2.18 | $ | 2.11 | $ | - | $ | - | |||||||||||
Year ended September 30, 2013 | 10.72 | (0.02 | ) | 0.74 | 0.72 | - | - | |||||||||||||||||
Year ended September 30, 2012 | 8.22 | (0.02 | ) | 2.52 | 2.50 | - | - | |||||||||||||||||
Year ended September 30, 2011 | 8.05 | (0.04 | ) | 0.21 | 0.17 | - | - | |||||||||||||||||
Year ended September 30, 2010 | 7.79 | (0.05 | ) | 0.35 | 0.30 | (0.04 | ) | - | ||||||||||||||||
Class C | ||||||||||||||||||||||||
Year ended September 30, 2014 | 11.07 | (0.21 | ) | 2.10 | 1.89 | - | - | |||||||||||||||||
Year ended September 30, 2013 | 10.49 | (0.14 | ) | 0.72 | 0.58 | - | - | |||||||||||||||||
Year ended September 30, 2012 | 8.13 | (0.13 | ) | 2.49 | 2.36 | - | - | |||||||||||||||||
Year ended September 30, 2011 | 8.05 | (0.13 | ) | 0.21 | 0.08 | - | - | |||||||||||||||||
Class A | ||||||||||||||||||||||||
Year ended September 30, 2014 | 11.30 | (0.11 | ) | 2.13 | 2.02 | - | - | |||||||||||||||||
Year ended September 30, 2013 | 10.65 | (0.05 | ) | 0.70 | 0.65 | - | - | |||||||||||||||||
Year ended September 30, 2012 | 8.20 | (0.06 | ) | 2.51 | 2.45 | - | - | |||||||||||||||||
Year ended September 30, 2011 | 8.05 | (0.05 | ) | 0.20 | 0.15 | - | - | |||||||||||||||||
ICON Materials Fund | ||||||||||||||||||||||||
Class S | ||||||||||||||||||||||||
Year ended September 30, 2014 | 13.43 | 0.04 | 1.68 | 1.72 | (0.06 | ) | - | |||||||||||||||||
Year ended September 30, 2013 | 11.12 | 0.09 | 2.40 | 2.49 | (0.18 | ) | - | |||||||||||||||||
Year ended September 30, 2012 | 9.00 | 0.11 | 2.11 | 2.22 | (0.10 | ) | - | |||||||||||||||||
Year ended September 30, 2011 | 10.06 | 0.08 | (1.08 | ) | (1.00 | ) | (0.06 | ) | - | |||||||||||||||
Year ended September 30, 2010 | 8.93 | 0.05 | 1.18 | 1.23 | (0.10 | ) | - | |||||||||||||||||
Class C | ||||||||||||||||||||||||
Year ended September 30, 2014 | 13.24 | (0.12 | ) | 1.65 | 1.53 | - | - | |||||||||||||||||
Year ended September 30, 2013 | 10.94 | (0.04 | ) | 2.38 | 2.34 | (0.04 | ) | - | ||||||||||||||||
Year ended September 30, 2012 | 8.92 | - | (c) | 2.08 | 2.08 | (0.06 | ) | - | ||||||||||||||||
Year ended September 30, 2011 | 10.06 | (0.03 | ) | (1.05 | ) | (1.08 | ) | (0.06 | ) | - | ||||||||||||||
Class A | ||||||||||||||||||||||||
Year ended September 30, 2014 | 13.36 | (0.01 | ) | 1.67 | 1.66 | (0.06 | ) | - | ||||||||||||||||
Year ended September 30, 2013 | 11.07 | 0.05 | 2.38 | 2.43 | (0.14 | ) | - | |||||||||||||||||
Year ended September 30, 2012 | 8.97 | 0.08 | 2.10 | 2.18 | (0.08 | ) | - | |||||||||||||||||
Year ended September 30, 2011 | 10.06 | 0.05 | (1.08 | ) | (1.03 | ) | (0.06 | ) | - | |||||||||||||||
| 82 | FINANCIAL HIGHLIGHTS |
Table of Contents
| distributions | Ratio of expenses to average net assets | Ratio of net investment income/(loss) to average net assets | ||||||||||||||||||||||||||||||||
| Total dividends and distributions | Net asset value, end of period | Total return* | Net assets, end of period (in thousands) | Before expense limitation/ recoupment and transfer agent earnings credits | After expense limitation/ recoupment and transfer agent earnings credits | Before expense limitation/ recoupment and transfer agent earnings credits | After expense limitation/ recoupment and transfer agent earnings credits | Portfolio turnover rate(a) | ||||||||||||||||||||||||||
| $ | - | $ | 13.55 | 18.44 | % | $ | 50,363 | 1.40 | % | 1.40 | %(b) | (0.56 | )% | (0.56 | )% | 47.88 | % | |||||||||||||||||
| - | 11.44 | 6.72 | % | 73,851 | 1.38 | % | 1.38 | %(b) | (0.22 | )% | (0.22 | )% | 51.71 | % | ||||||||||||||||||||
| - | 10.72 | 30.41 | % | 83,330 | 1.34 | % | 1.34 | %(b) | (0.20 | )% | (0.20 | )% | 35.22 | % | ||||||||||||||||||||
| - | 8.22 | 2.11 | % | 61,081 | 1.34 | % | 1.34 | %(b) | (0.40 | )% | (0.40 | )% | 44.84 | % | ||||||||||||||||||||
| (0.04 | ) | 8.05 | 3.91 | % | 77,269 | 1.37 | % | 1.37 | % | (0.58 | )% | (0.58 | )% | 68.32 | % | |||||||||||||||||||
| - | 12.96 | 17.07 | % | 401 | 4.20 | % | 2.50 | %(b) | (3.40 | )% | (1.70 | )% | 47.88 | % | ||||||||||||||||||||
| - | 11.07 | 5.53 | % | 315 | 3.31 | % | 2.50 | %(b) | (2.16 | )% | (1.36 | )% | 51.71 | % | ||||||||||||||||||||
| - | 10.49 | 29.03 | % | 294 | 4.46 | % | 2.50 | %(b) | (3.22 | )% | (1.26 | )% | 35.22 | % | ||||||||||||||||||||
| - | 8.13 | 0.99 | % | 1 | 115.00 | % | 2.51 | %(b) | (113.96 | )% | (1.47 | )% | 44.84 | % | ||||||||||||||||||||
| - | 13.32 | 17.88 | % | 455 | 1.94 | % | 1.75 | %(b) | (1.10 | )% | (0.91 | )% | 47.88 | % | ||||||||||||||||||||
| - | 11.30 | 6.10 | % | 2,330 | 2.23 | % | 1.75 | %(b) | (0.94 | )% | (0.45 | )% | 51.71 | % | ||||||||||||||||||||
| - | 10.65 | 29.88 | % | 1,400 | 2.87 | % | 1.75 | %(b) | (1.71 | )% | (0.59 | )% | 35.22 | % | ||||||||||||||||||||
| - | 8.20 | 1.86 | % | 1 | 215.56 | % | 1.75 | %(b) | (214.36 | )% | (0.55 | )% | 44.84 | % | ||||||||||||||||||||
| (0.06 | ) | 15.09 | 12.85 | % | 93,610 | 1.36 | % | 1.36 | %(b) | 0.26 | % | 0.26 | % | 33.16 | % | |||||||||||||||||||
| (0.18 | ) | 13.43 | 22.73 | % | 65,782 | 1.45 | % | 1.45 | %(b) | 0.72 | % | 0.72 | % | 55.66 | % | |||||||||||||||||||
| (0.10 | ) | 11.12 | 24.85 | % | 41,627 | 1.39 | % | 1.39 | %(b) | 1.00 | % | 1.00 | % | 40.89 | % | |||||||||||||||||||
| (0.06 | ) | 9.00 | (10.07 | )% | 59,068 | 1.33 | % | 1.33 | %(b) | 0.73 | % | 0.73 | % | 62.97 | % | |||||||||||||||||||
| (0.10 | ) | 10.06 | 13.92 | % | 87,856 | 1.38 | % | 1.38 | % | 0.54 | % | 0.54 | % | 70.80 | % | |||||||||||||||||||
| - | 14.77 | 11.56 | % | 675 | 4.17 | % | 2.50 | %(b) | (2.51 | )% | (0.84 | )% | 33.16 | % | ||||||||||||||||||||
| (0.04 | ) | 13.24 | 21.43 | % | 218 | 4.12 | % | 2.50 | %(b) | (1.95 | )% | (0.33 | )% | 55.66 | % | |||||||||||||||||||
| (0.06 | ) | 10.94 | 23.36 | % | 195 | 4.29 | % | 2.51 | %(b) | (1.82 | )% | (0.04 | )% | 40.89 | % | |||||||||||||||||||
| (0.06 | ) | 8.92 | (10.87 | )% | 120 | 4.11 | % | 2.50 | %(b) | (1.91 | )% | (0.30 | )% | 62.97 | % | |||||||||||||||||||
| (0.06 | ) | 14.96 | 12.47 | % | 8,229 | 1.72 | % | 1.72 | %(b) | (0.07 | )% | (0.07 | )% | 33.16 | % | |||||||||||||||||||
| (0.14 | ) | 13.36 | 22.24 | % | 1,883 | 2.02 | % | 1.75 | %(b) | 0.17 | % | 0.44 | % | 55.66 | % | |||||||||||||||||||
| (0.08 | ) | 11.07 | 24.44 | % | 539 | 2.12 | % | 1.76 | %(b) | 0.34 | % | 0.70 | % | 40.89 | % | |||||||||||||||||||
| (0.06 | ) | 8.97 | (10.37 | )% | 487 | 2.26 | % | 1.74 | %(b) | (0.07 | )% | 0.45 | % | 62.97 | % | |||||||||||||||||||
| FINANCIAL HIGHLIGHTS | 83 |
Table of Contents
FINANCIAL HIGHLIGHTS (CONTINUED)
| Income/(loss) from investment operations | Less dividends and | |||||||||||||||||||||||
| Net asset value, beginning of period | Net investment income/ (loss)(x) | Net realized and unrealized gains/(losses) on investments | Total from investment operations | Dividends from net investment income | Distributions from net realized gains | |||||||||||||||||||
ICON Utilities Fund | ||||||||||||||||||||||||
Class S | ||||||||||||||||||||||||
Year ended September 30, 2014 | $ | 7.22 | $ | 0.22 | $ | 0.69 | $ | 0.91 | $ | (0.23 | ) | $ | - | |||||||||||
Year ended September 30, 2013 | 6.81 | 0.20 | 0.43 | 0.63 | (0.22 | ) | - | |||||||||||||||||
Year ended September 30, 2012 | 6.29 | 0.20 | 0.55 | 0.75 | (0.23 | ) | - | |||||||||||||||||
Year ended September 30, 2011 | 6.15 | 0.24 | 0.31 | 0.55 | (0.41 | ) | - | |||||||||||||||||
Year ended September 30, 2010 | 5.66 | 0.19 | 0.44 | 0.63 | (0.14 | ) | - | |||||||||||||||||
Class C | ||||||||||||||||||||||||
Year ended September 30, 2014 | 7.12 | 0.15 | 0.68 | 0.83 | (0.16 | ) | - | |||||||||||||||||
Year ended September 30, 2013 | 6.72 | 0.13 | 0.42 | 0.55 | (0.15 | ) | - | |||||||||||||||||
Year ended September 30, 2012 | 6.21 | 0.14 | 0.57 | 0.71 | (0.20 | ) | - | |||||||||||||||||
Year ended September 30, 2011 | 6.15 | 0.25 | 0.22 | 0.47 | (0.41 | ) | - | |||||||||||||||||
Class A | ||||||||||||||||||||||||
Year ended September 30, 2014 | 7.14 | 0.21 | 0.68 | 0.89 | (0.22 | ) | - | |||||||||||||||||
Year ended September 30, 2013 | 6.73 | 0.18 | 0.42 | 0.60 | (0.19 | ) | - | |||||||||||||||||
Year ended September 30, 2012 | 6.24 | 0.20 | 0.53 | 0.73 | (0.24 | ) | - | |||||||||||||||||
Year ended September 30, 2011 | 6.15 | 0.34 | 0.17 | 0.51 | (0.42 | ) | - | |||||||||||||||||
| (x) | Calculated using the average shares method. |
| * | The total return calculation is for the period indicated and excludes any sales charges. |
| (a) | Portfolio turnover is calculated at the Fund level and is not annualized for periods less than a year. |
| (b) | The Fund’s operating expenses, not including interest expense, are contractually limited to the amounts discussed in Note 3. The ratios in these financial highlights reflect the limitation, including the interest expense. |
| (c) | Amount less than $0.005. |
The accompanying notes are an integral part of the financial statements.
| 84 | FINANCIAL HIGHLIGHTS |
Table of Contents
| distributions | Ratio of expenses to average net assets | Ratio of net investment income/(loss) to average net assets | ||||||||||||||||||||||||||||||||
| Total dividends and distributions | Net asset value, end of period | Total return* | Net assets, end of period (in thousands) | Before expense limitation/ recoupment and transfer agent earnings credits | After expense limitation/ recoupment and transfer agent earnings credits | Before expense limitation/ recoupment and transfer agent earnings credits | After expense limitation/ recoupment and transfer agent earnings credits | Portfolio turnover rate(a) | ||||||||||||||||||||||||||
| $ | (0.23 | ) | $ | 7.90 | 12.69 | % | $ | 17,920 | 1.52 | % | 1.50 | %(b) | 2.84 | % | 2.86 | % | 106.99 | % | ||||||||||||||||
| (0.22 | ) | 7.22 | 9.25 | % | 29,117 | 1.62 | % | 1.51 | %(b) | 2.71 | % | 2.81 | % | 121.14 | % | |||||||||||||||||||
| (0.23 | ) | 6.81 | 12.01 | % | 23,524 | 1.53 | % | 1.51 | %(b) | 3.00 | % | 3.02 | % | 50.92 | % | |||||||||||||||||||
| (0.41 | ) | 6.29 | 9.16 | % | 21,313 | 1.61 | % | 1.51 | %(b) | 3.75 | % | 3.85 | % | 114.73 | % | |||||||||||||||||||
| (0.14 | ) | 6.15 | 11.16 | % | 32,036 | 1.67 | % | 1.67 | % | 3.28 | % | 3.28 | % | 84.45 | % | |||||||||||||||||||
| (0.16 | ) | 7.79 | 11.59 | % | 2,246 | 2.55 | % | 2.50 | %(b) | 1.87 | % | 1.92 | % | 106.99 | % | |||||||||||||||||||
| (0.15 | ) | 7.12 | 8.16 | % | 2,834 | 2.47 | % | 2.47 | %(b) | 1.89 | % | 1.89 | % | 121.14 | % | |||||||||||||||||||
| (0.20 | ) | 6.72 | 11.53 | % | 3,256 | 2.47 | % | 2.47 | %(b) | 2.17 | % | 2.17 | % | 50.92 | % | |||||||||||||||||||
| (0.41 | ) | 6.21 | 7.77 | % | 24 | 122.08 | % | 2.50 | %(b) | (115.58 | )% | 4.00 | % | 114.73 | % | |||||||||||||||||||
| (0.22 | ) | 7.81 | 12.44 | % | 2,517 | 1.81 | % | 1.75 | %(b) | 2.69 | % | 2.75 | % | 106.99 | % | |||||||||||||||||||
| (0.19 | ) | 7.14 | 8.96 | % | 2,402 | 1.74 | % | 1.74 | %(b) | 2.55 | % | 2.55 | % | 121.14 | % | |||||||||||||||||||
| (0.24 | ) | 6.73 | 11.81 | % | 7,113 | 1.70 | % | 1.70 | %(b) | 3.03 | % | 3.03 | % | 50.92 | % | |||||||||||||||||||
| (0.42 | ) | 6.24 | 8.56 | % | 449 | 185.34 | % | 1.75 | %(b) | (178.27 | )% | 5.32 | % | 114.73 | % | |||||||||||||||||||
| FINANCIAL HIGHLIGHTS | 85 |
Table of Contents
SEPTEMBER 30, 2014
1. Organization
The ICON Consumer Discretionary Fund, ICON Consumer Staples Fund, ICON Energy Fund, ICON Financial Fund, ICON Healthcare Fund, ICON Industrials Fund, ICON Information Technology Fund, ICON Materials Fund, and ICON Utilities Fund are series funds (individually a “Fund” and collectively, the “Funds”). The Funds are part of the ICON Funds (the “Trust”), a Massachusetts business trust registered under the Investment Company Act of 1940, as amended (the “1940 Act”) as an open-end non-diversified investment management company. Each Fund offers three classes of shares: Class S, Class C and Class A. All classes have equal rights as to earnings, assets, and voting privileges except that each Class may bear different distribution fees, registration costs, legal costs, mailing and printing costs and shareholder servicing costs and each Class has exclusive voting rights with respect to its distribution plan. There are currently eight other active Funds within the Trust. Those Funds are covered by separate prospectuses and shareholder reports.
Each Fund is authorized to issue an unlimited number of no par shares. The Funds invest primarily in securities of companies whose principal business activities fall within specific sectors and industries. The investment objective of each Fund is to provide long-term capital appreciation.
The Funds may have elements of risk, including the risk of loss of principal. There is no assurance that the investment process will consistently lead to successful results. An investment in a non-diversified sector fund may involve greater risk and volatility than a more diversified fund. Investments in foreign securities and currency transactions may involve certain considerations and risks not typically associated with those of U.S. dollar-denominated transactions as a result of, among other factors, the possibility of lower government supervision and regulation of foreign securities markets and the possibility of political or economic instability. Financial statements of foreign companies are governed by different accounting, auditing, and financial standards than U.S. companies and may be less transparent and uniform than in the United States. Many corporate governance standards, which help ensure the integrity of public information in the United States, may not exist in some foreign countries. In general, there may be less governmental supervision of foreign stock exchanges and securities brokers and issuers. There are also risks associated with small-and mid-cap investing, including limited product lines, less liquidity and small market share.
| 86 | NOTESTO FINANCIAL STATEMENTS |
Table of Contents
The ICON Energy Fund has a significant weighting in the Oil & Gas Equipment & Services industry and the Oil & Gas Exploration & Production industry, the ICON Healthcare Fund has a significant weighting in the Pharmaceuticals industry, the ICON Information Technology Fund has a significant weighting in the Internet Software & Services industry, and the ICON Utilities Fund has a significant weighting in the Electric Utilities industry which may cause the Funds’ performance to be susceptible to the economic, business and/or other developments that may affect those industries.
In the normal course of business, the Funds may enter into various agreements that provide for general indemnifications. Each Fund’s maximum exposure under these arrangements is unknown as any potential exposure involving future claims that may be made against each Fund is unknown. However, based on experience, the Funds expect the risk of loss to be remote.
2. Significant Accounting Policies
The following is a summary of significant accounting policies consistently followed by the Funds in the preparation of their financial statements. The preparation of financial statements in conformity with accounting principles generally accepted in the United States of America requires management to make certain estimates and assumptions that affect the reported amounts of assets and liabilities, disclosure of contingent assets and liabilities at the date of the financial statements, and the reported amounts of income and expenses during the reporting period. Actual results may differ from these estimates.
Investment Valuation
The Funds’ securities and other assets, excluding options on securities indexes, are valued at the closing price as of the close of regular trading on the New York Stock Exchange (the “NYSE”) (normally 4 p.m. Eastern Standard Time) each day the NYSE is open, except that securities traded primarily on the NASDAQ Stock Market (“NASDAQ”) are normally valued by the Funds at the NASDAQ Official Closing Price provided by NASDAQ each business day. Options on securities indexes are valued at the close of the Chicago Board Options Exchange (normally 4:15 p.m. Eastern Standard Time) on each day the New York Stock Exchange is open for trading.
| NOTESTO FINANCIAL STATEMENTS | 87 |
Table of Contents
NOTESTO FINANCIAL STATEMENTS (CONTINUED)
The Funds use pricing services to obtain the market value of securities in their portfolios; if a pricing service is not able to provide a price, or the pricing service’s valuation is considered inaccurate or does not in the Funds’ judgment reflect the market value of the security, prices may be obtained through market quotations from independent broker/dealers. If market quotations from these sources are not readily available, the Funds’ securities or other assets are valued at fair value as determined in good faith by the Funds’ Board of Trustees (“Board”) or pursuant to procedures approved by the Board.
Lacking any sales that day, a security is valued at the current closing bid price (or yield equivalent thereof) or based on quotes obtained from dealers making a market for the security. Options are valued at their closing mid-price on the market with the most volume. Mid-price is the average of the closing bid and closing ask prices. Debt securities with a remaining maturity of greater than 60 days are valued using the evaluated bid price supplied by the pricing service. The evaluated bid price supplied by the pricing service is based upon a matrix valuation system which considers such factors as security prices, yields, maturities and ratings. Short-term debt securities with remaining maturities of 60 days or less are generally valued at amortized cost or original cost plus accrued interest, which approximates market value. Currency rates as of the close of the NYSE are used to convert foreign security values into U.S. dollars.
Securities of investment companies that trade on an exchange are valued at the last sales price or official closing price as of the close of the customary trading session on the exchange where the security is principally traded. Investments in shares of funds that are not traded on an exchange are valued at the end of day net asset value per share of such fund. Securities in the underlying funds, including restricted securities are valued in accordance with the valuation policy of such fund.
The Funds’ securities traded in countries outside of the Western Hemisphere are fair valued daily by utilizing the quotations of an independent pricing service, unless the Board determines that use of another valuation methodology is appropriate. The purposes of daily fair valuation are to avoid stale prices and to take into account, among other things, any significant events occurring after the close of foreign markets. The pricing service uses statistical analyses and quantitative models to adjust local market prices using factors such as subsequent movements and changes in the prices of indexes, securities and exchange rates in other markets to determine fair
| 88 | NOTESTO FINANCIAL STATEMENTS |
Table of Contents
value as of the time a Fund calculates its net asset value (“NAV”). The valuation assigned to fair-value securities for purposes of calculating a Fund’s NAV may differ from the security’s most recent closing market price and from the prices used by other mutual funds to calculate their NAVs.
Various inputs are used to determine the value of the Funds’ investments. These inputs are summarized in the three broad levels listed below:
Level 1 — quoted prices in active markets for identical securities.
Level 2 — significant observable inputs other than Level 1quoted prices (including, but not limited to, quoted prices for similar securities, interest rates, prepayment speeds, and credit risk).
Level 3 — significant unobservable inputs.
Observable inputs are those based on market data obtained from sources independent of the Funds, and unobservable inputs reflect the Funds’ own assumptions based on the best information available. The input levels are not necessarily an indication of the risk or liquidity associated with investments at that level. For example, non-U.S. equity securities actively traded in foreign markets may be reflected in Level 2 despite the availability of closing prices, because the Funds evaluate and determine whether those closing prices reflect fair value at the close of the NYSE or require adjustment, as described above. The following table summarizes the Funds’ investments, based on the inputs used to determine their values on September 30, 2014:
| Level 1 | Level 2 | Level 3 | Total | |||||||||||||
ICON Consumer Discretionary Fund* |
| |||||||||||||||
Assets | ||||||||||||||||
Common Stocks | $ | 57,131,469 | $ | - | $ | - | $ | 57,131,469 | ||||||||
Collateral for Securities on Loan | - | 5,485,890 | - | 5,485,890 | ||||||||||||
|
|
|
|
|
|
|
| |||||||||
Total | $ | 57,131,469 | $ | 5,485,890 | $ | - | $ | 62,617,359 | ||||||||
|
|
|
|
|
|
|
| |||||||||
ICON Consumer Staples Fund* |
| |||||||||||||||
Assets | ||||||||||||||||
Common Stocks | $ | 28,419,992 | $ | - | $ | - | $ | 28,419,992 | ||||||||
Collateral for Securities on Loan | - | 1,001,000 | - | 1,001,000 | ||||||||||||
Short-Term Investments | - | 5,918,949 | - | 5,918,949 | ||||||||||||
|
|
|
|
|
|
|
| |||||||||
Total | $ | 28,419,992 | $ | 6,919,949 | $ | - | $ | 35,339,941 | ||||||||
|
|
|
|
|
|
|
| |||||||||
| NOTESTO FINANCIAL STATEMENTS | 89 |
Table of Contents
NOTESTO FINANCIAL STATEMENTS (CONTINUED)
| Level 1 | Level 2 | Level 3 | Total | |||||||||||||
ICON Energy Fund* | ||||||||||||||||
Assets | ||||||||||||||||
Common Stocks | $ | 624,651,537 | $ | - | $ | - | $ | 624,651,537 | ||||||||
Collateral for Securities on Loan | - | 11,860,729 | - | 11,860,729 | ||||||||||||
Short-Term Investments | - | 37,692,998 | - | 37,692,998 | ||||||||||||
|
|
|
|
|
|
|
| |||||||||
Total | $ | 624,651,537 | $ | 49,553,727 | $ | - | $ | 674,205,264 | ||||||||
|
|
|
|
|
|
|
| |||||||||
ICON Financial Fund* | ||||||||||||||||
Assets | ||||||||||||||||
Common Stocks | $ | 31,273,963 | $ | - | $ | - | $ | 31,273,963 | ||||||||
Collateral for Securities on Loan | - | 1,860,075 | - | 1,860,075 | ||||||||||||
Short-Term Investments | - | 1,173,764 | - | 1,173,764 | ||||||||||||
|
|
|
|
|
|
|
| |||||||||
Total | $ | 31,273,963 | $ | 3,033,839 | $ | - | $ | 34,307,802 | ||||||||
|
|
|
|
|
|
|
| |||||||||
ICON Healthcare Fund* | ||||||||||||||||
Assets | ||||||||||||||||
Common Stocks | $ | 126,174,029 | $ | - | $ | - | $ | 126,174,029 | ||||||||
Short-Term Investments | - | 41,082,556 | - | 41,082,556 | ||||||||||||
|
|
|
|
|
|
|
| |||||||||
Total | $ | 126,174,029 | $ | 41,082,556 | $ | - | $ | 167,256,585 | ||||||||
|
|
|
|
|
|
|
| |||||||||
ICON Industrials Fund* | ||||||||||||||||
Assets | ||||||||||||||||
Common Stocks | $ | 35,891,937 | $ | - | $ | - | $ | 35,891,937 | ||||||||
Short-Term Investments | - | 680,799 | - | 680,799 | ||||||||||||
|
|
|
|
|
|
|
| |||||||||
Total | $ | 35,891,937 | $ | 680,799 | $ | - | $ | 36,572,736 | ||||||||
|
|
|
|
|
|
|
| |||||||||
ICON Information Technology Fund* |
| |||||||||||||||
Assets | ||||||||||||||||
Common Stocks | $ | 50,445,577 | $ | - | $ | - | $ | 50,445,577 | ||||||||
Collateral for Securities on Loan | - | 1,717,622 | - | 1,717,622 | ||||||||||||
Short-Term Investments | - | 860,383 | - | 860,383 | ||||||||||||
|
|
|
|
|
|
|
| |||||||||
Total | $ | 50,445,577 | $ | 2,578,005 | $ | - | $ | 53,023,582 | ||||||||
|
|
|
|
|
|
|
| |||||||||
ICON Materials Fund* | ||||||||||||||||
Assets | ||||||||||||||||
Common Stocks | $ | 97,847,690 | $ | - | $ | - | $ | 97,847,690 | ||||||||
Short-Term Investments | - | 4,641,240 | - | 4,641,240 | ||||||||||||
|
|
|
|
|
|
|
| |||||||||
Total | $ | 97,847,690 | $ | 4,641,240 | $ | - | $ | 102,488,930 | ||||||||
|
|
|
|
|
|
|
| |||||||||
| 90 | NOTESTO FINANCIAL STATEMENTS |
Table of Contents
| Level 1 | Level 2 | Level 3 | Total | |||||||||||||
ICON Utilities Fund* | ||||||||||||||||
Assets | ||||||||||||||||
Common Stocks | $ | 22,138,775 | $ | - | $ | - | $ | 22,138,775 | ||||||||
Collateral for Securities on Loan | - | 973,779 | - | 973,779 | ||||||||||||
Short-Term Investments | - | 780,465 | - | 780,465 | ||||||||||||
|
|
|
|
|
|
|
| |||||||||
Total | $ | 22,138,775 | $ | 1,754,244 | $ | - | $ | 23,893,019 | ||||||||
|
|
|
|
|
|
|
| |||||||||
| * | Please refer to the Schedule of Investments and the Sector/Industry Classification and Credit Diversification tables for additional security details. |
No Level 3 securities were held in any of the Funds at September 30, 2014.
For the year ended September 30, 2014, there was no transfer activity between Level 1, Level 2 or Level 3. The end of period timing recognition is used for transfers between levels of the Fund’s assets and liabilities.
Fund Share Valuation
Fund shares are sold and redeemed on a daily basis at net asset value. Net asset value per share is determined daily as of the close of trading on the NYSE on each day the NYSE is open for trading by dividing the total value of the Fund’s investments and other assets, less liabilities, by the number of Fund shares outstanding.
Foreign Currency Translation
The accounting records of the Funds are maintained in U.S. dollars. Investment securities and other assets and liabilities denominated in a foreign currency are translated daily into U.S. dollars at the prevailing rates of exchange. Income and expenses are translated into U.S. dollars at the prevailing exchange rate on the respective dates of the transactions. Purchases and sales of securities are translated into U.S. dollars at the contractual currency exchange rates established at the time of each trade.
The Funds do not isolate that portion of the results of operations resulting from changes in foreign exchange rates on investments from the fluctuations arising from changes in market prices of securities held. Net unrealized appreciation or depreciation on investments and foreign currency translations arise from changes in the value of assets and liabilities, resulting from changes in the exchange rates and changes in market prices of securities held.
| NOTESTO FINANCIAL STATEMENTS | 91 |
Table of Contents
NOTESTO FINANCIAL STATEMENTS (CONTINUED)
Securities Lending
Under procedures adopted by the Board, the Funds may lend securities to certain approved brokers, dealers and other financial institutions to earn additional income. The Funds retain certain benefits of owning the securities, including receipt of dividends or interest generated by the security, but give up other rights including the right to vote proxies. The Funds retain the ability to recall the loans at any time and could do so in order to vote proxies or to sell the loaned securities. Each loan is collateralized by cash that generally exceeds the value of the securities on loan. The market value of the loaned securities is determined daily at the close of business of the Funds and any additional required collateral is delivered to each Fund on the next business day.
Generally, in the event of borrower default, the Funds have the right to use the collateral to offset any losses incurred. In the event the Funds are delayed or prevented from exercising their rights to dispose of the collateral, there may be a potential loss to the Funds. Some of these losses may be indemnified by the lending agent.
The Funds have elected to invest the cash collateral in the State Street Navigator Prime Portfolio which is disclosed on the Schedule of Investments. The Funds bear the risk of loss with respect to the investment of collateral. The net securities lending income earned by the Funds for the year ended September 30, 2014, is included in the Statement of Operations.
For the year ended September 30, 2014, the following Funds had securities with the following values on loan:
| Fund | Loaned Securities | Collateral | ||||||
ICON Consumer Discretionary Fund | $ | 5,283,138 | $ | 5,485,890 | ||||
ICON Consumer Staples Fund | 975,744 | 1,001,000 | ||||||
ICON Energy Fund | 11,224,217 | 11,860,729 | ||||||
ICON Financial Fund | 1,801,771 | 1,860,075 | ||||||
ICON Information Technology Fund | 1,700,882 | 1,717,622 | ||||||
ICON Utilities Fund | 948,764 | 973,779 | ||||||
The value of the collateral above could include collateral held for securities that were sold on or before September 30, 2014. It may also include collateral received from the pre-funding of security loans.
| 92 | NOTESTO FINANCIAL STATEMENTS |
Table of Contents
Income Taxes, Dividends, and Distributions
The Funds intend to continue to qualify as regulated investment companies under Subchapter M of the Internal Revenue Code and, accordingly, the Funds will generally not be subject to federal and state income taxes or federal excise taxes to the extent that they intend to make sufficient distributions of net investment income and net realized capital gains.
Dividends paid by the Funds from net investment income and distributions of net realized short-term gains are, for federal income tax purposes, taxable as ordinary income to shareholders.
Dividends and distributions to shareholders are recorded by the Funds on the ex-dividend/distribution date. The Funds distribute income and net realized capital gains, if any, to shareholders at least annually, if not offset by capital loss carryforward. The Funds may utilize equalization accounting for tax purposes and designate earnings and profits, including net realized gains distributed to shareholders on redemption of shares, as part of the dividends paid deduction for income tax purposes. Income distributions and capital gain distributions are determined in accordance with income tax regulations, which may differ from accounting principles generally accepted in the United States of America.
Management has analyzed the Funds’ tax positions taken on federal income tax returns for all open tax periods and has concluded that no provision for federal income tax is required in the Funds’ financial statements.
The Funds file U.S. tax returns. While the statute of limitations remains open to examine the Funds’ U.S. tax returns filed for the past three years, no examinations are in progress or anticipated at this time. The Funds are not aware of any tax positions for which it is reasonably possible that the total amounts of unrecognized tax benefits will significantly change in the next twelve months.
Certain foreign countries impose a capital gains tax which is accrued by the Funds based on the unrealized appreciation, if any, on affected securities. Any accrual would reduce a Fund’s NAV. The tax is paid when the gain is realized.
| NOTESTO FINANCIAL STATEMENTS | 93 |
Table of Contents
NOTESTO FINANCIAL STATEMENTS (CONTINUED)
Investment Income
Dividend income is recorded on the ex-dividend date. Non-cash dividends included in dividend income, if any, are recorded at the fair value of the securities received. Interest income is accrued as earned. Certain dividends from foreign securities are recorded as soon as the Funds are informed of the dividend if such information is obtained subsequent to the ex-dividend date. Discounts and premiums on fixed income securities purchased are accreted or amortized to income over the life of the respective securities.
Investment Transactions
Security transactions are accounted for no later than one business day after the trade date. However, for financial reporting purposes, security transactions are accounted for on the trade date. Gains and losses on securities sold are determined on the basis of identified cost.
Allocation of Expenses
Each class of a Fund’s shares bears expenses incurred specifically on its behalf and, in addition, each class bears a portion of general expenses, based upon relative net assets of each class. Expenses which cannot be directly attributed to a specific Fund in the Trust are apportioned between all Funds in the Trust based upon relative net assets. In calculating the net asset value per share of each class, investment income, realized and unrealized gains and losses and expenses other than class-specific expenses are allocated daily to each class of shares based upon the proportion of net assets.
| 94 | NOTESTO FINANCIAL STATEMENTS |
Table of Contents
Below are the class level expenses that are included on the Statement of Operations:
| Fund | Legal Expense | Printing And Postage Expense | Transfer Agent Expense | |||||||||
ICON Consumer Discretionary Fund | ||||||||||||
Class S | $ | 1,649 | $ | 12,090 | $ | 77,427 | ||||||
Class C | 23 | 140 | 1,347 | |||||||||
Class A | 120 | 647 | 4,665 | |||||||||
ICON Consumer Staples Fund | ||||||||||||
Class S | 1,861 | 12,737 | 53,011 | |||||||||
Class C | 93 | 413 | 2,778 | |||||||||
Class A | 150 | 1,222 | 10,084 | |||||||||
ICON Energy Fund | ||||||||||||
Class S | 40,371 | 96,814 | 1,102,606 | |||||||||
Class C | 1,006 | 2,303 | 25,867 | |||||||||
Class A | 1,695 | 4,628 | 47,898 | |||||||||
ICON Financial Fund | ||||||||||||
Class S | 208 | 3,251 | 36,156 | |||||||||
Class C | 3 | 14 | 273 | |||||||||
Class A | 39 | 20 | 3,171 | |||||||||
ICON Healthcare Fund | ||||||||||||
Class S | 6,016 | 16,170 | 204,891 | |||||||||
Class C | 22 | 68 | 837 | |||||||||
Class A | 238 | 357 | 3,308 | |||||||||
ICON Industrials Fund | ||||||||||||
Class S | 2,047 | 11,269 | 51,186 | |||||||||
Class C | 12 | 35 | 486 | |||||||||
Class A | 44 | 209 | 1,059 | |||||||||
ICON Information Technology Fund | ||||||||||||
Class S | 3,698 | 16,445 | 113,655 | |||||||||
Class C | 20 | 67 | 690 | |||||||||
Class A | 61 | 200 | 1,600 | |||||||||
ICON Materials Fund | ||||||||||||
Class S | 4,946 | 22,016 | 138,900 | |||||||||
Class C | 29 | 133 | 1,506 | |||||||||
Class A | 338 | 954 | 8,640 | |||||||||
ICON Utilities Fund | ||||||||||||
Class S | 1,657 | 13,650 | 58,014 | |||||||||
Class C | 161 | 340 | 2,102 | |||||||||
Class A | 144 | 385 | 3,556 | |||||||||
| NOTESTO FINANCIAL STATEMENTS | 95 |
Table of Contents
NOTESTO FINANCIAL STATEMENTS (CONTINUED)
3. Fees and Other Transactions with Affiliates
Investment Advisory Fees
ICON Advisers, Inc. (“ICON Advisers”) serves as investment adviser to the Funds and is responsible for managing the Funds’ portfolios of securities. ICON Advisers receives a monthly management fee that is computed daily at an annual rate of 1.00% on the first $500 million of average daily net assets, 0.95% on the next $250 million, 0.925% on the next $750 million, 0.90% on the next $3.5 billion, and 0.875% on average daily net assets over $5 billion.
ICON Advisers has contractually agreed to limit its Funds’ expenses (exclusive of brokerage, interest, taxes, dividends on short sales and extraordinary expenses) to the extent necessary to ensure that the Funds’ operating expenses do not exceed the following amounts:
| Fund | Class S | Class C | Class A | |||||||||
ICON Consumer Discretionary Fund | 1.74% | 2.74% | 1.99% | |||||||||
ICON Consumer Staples Fund | 1.50% | 2.50% | 1.75% | |||||||||
ICON Energy Fund | 1.50% | 2.50% | 1.75% | |||||||||
ICON Financial Fund | 1.50% | 2.50% | 1.75% | |||||||||
ICON Healthcare Fund | 1.50% | 2.50% | 1.75% | |||||||||
ICON Industrials Fund | 1.50% | 2.50% | 1.75% | |||||||||
ICON Information Technology Fund | 1.50% | 2.50% | 1.75% | |||||||||
ICON Materials Fund | 1.50% | 2.50% | 1.75% | |||||||||
ICON Utilities Fund | 1.50% | 2.50% | 1.75% | |||||||||
The Funds’ expense limitations will continue in effect until at least January 31, 2015. To the extent ICON Advisers reimburses or absorbs fees and expenses, it may seek payment of such amounts for up to three years after the expenses were reimbursed or absorbed. A Fund will make no such payment, however, if the total Fund operating expenses exceed the expense limits in effect at the time the expenses were reimbursed or at the time these payments are proposed.
| 96 | NOTESTO FINANCIAL STATEMENTS |
Table of Contents
As of September 30, 2014 the following amounts were available for recoupment by ICON Advisers based upon their potential expiration dates:
| Fund | 2015 | 2016 | 2017 | |||||||||
ICON Consumer Discretionary Fund | $ | 1,981 | $ | 1,881 | $ | 5,663 | ||||||
ICON Consumer Staples Fund | 5,954 | 3,344 | 11,844 | |||||||||
ICON Financial Fund | 2,094 | 7,072 | 33,291 | |||||||||
ICON Healthcare Fund | 3,689 | 3,191 | 7,400 | |||||||||
ICON Industrials Fund | 2,939 | 4,711 | 7,089 | |||||||||
ICON Information Technology Fund | 3,947 | 5,822 | 7,936 | |||||||||
ICON Materials Fund | 3,469 | 3,018 | 8,051 | |||||||||
ICON Utilities Fund | 5,758 | 25,930 | 9,172 | |||||||||
Accounting, Custody and Transfer Agent Fees
State Street Bank and Trust Company (“State Street”) serves as the fund accounting agent for the Funds. For its services, the Trust pays State Street a fee that is calculated daily and paid monthly at an annual rate based on the aggregate average daily net assets of the Trust.
State Street is the custodian of the Trust’s investments. For its services, the Trust pays State Street asset-based fees that vary according to the number of positions and transactions, plus out-of-pocket expenses.
Boston Financial Data Services, Inc. (“BFDS”) is the Trust’s transfer agent. For these services, the Trust pays a per account fee, plus certain other transaction Cusip charges and out-of-pocket expenses. BFDS may pay each Fund transfer agent earnings credits. Transfer agent earnings credits are credits received for interest which results from overnight balances used by BFDS for clearing shareholder transactions.
Administrative Services
The Trust has entered into an administrative services agreement with ICON Advisers pursuant to which ICON Advisers oversees the administration of the Trust’s business and affairs. This agreement provides for an annual fee of 0.05% on the Trust’s first $1.5 billion of average daily net assets, 0.045% on the next $1.5 billion of average daily net assets, 0.040% on the next $2 billion of average daily net assets and 0.030% on average daily net assets over $5 billion. For the year ended September 30, 2014, each Fund’s payment for administrative services to ICON Advisers is included on the Statement of Operations. The administrative services agreement provides that ICON Advisers will not be liable for any error of judgment, mistake of
| NOTESTO FINANCIAL STATEMENTS | 97 |
Table of Contents
NOTESTO FINANCIAL STATEMENTS (CONTINUED)
law, or any loss suffered by the Trust in connection with matters to which the administrative services agreement relates, except for a loss resulting from willful misfeasance, bad faith or negligence by ICON Advisers in the performance of its duties.
ICON Advisers has a sub-administration agreement under which State Street assists ICON Advisers with the administration and business affairs of the Trust. For its services, ICON Advisers pays State Street a fee that is calculated daily and paid monthly at an annual rate based on the aggregate average daily net assets of the Trust.
Distribution Fees
The Funds have adopted a Distribution Plan pursuant to Rule 12b-1 under the 1940 Act (“12b-1 Plan”) under which the Funds are authorized to compensate the Funds’ distributor, ICON Distributors, Inc. (“IDI”) (an affiliate of the adviser) for the sale and distribution of shares. Under the 12b-1 Plan, Class A shareholders pay an annual distribution and service fee of 0.25% of average daily net assets. The Class C shareholders pay an annual distribution and service fee of 1.00% of average daily net assets. There is no annual distribution and service fee for Class S shares. The total amount paid under the 12b-1 plans, if any, by the Funds is shown on the Statement of Operations.
Other Related Parties
Certain Officers and Directors of ICON Advisers are also Officers and Trustees of the Funds; however, such Officers and Trustees (with the exception of the Chief Compliance Officer, “CCO”) receive no compensation from the Funds. The Trust paid $120,000 of the CCO’s salary and the remaining portion is paid by ICON Advisers. For the year ended September 30, 2014, the total related amounts paid by the Funds under this arrangement are included in Other Expenses on the Statement of Operations.
The Fund may reimburse ICON Advisers for legal work performed for the Fund by its attorneys outside of the advisory and administration contracts. The Board of Trustees reviews and approves such reimbursements. For the year ended September 30, 2014, the total related amounts paid by the Funds under this arrangement are included in Other Expenses on the Statement of Operations.
| 98 | NOTESTO FINANCIAL STATEMENTS |
Table of Contents
4. Borrowings
The Trust has entered into a Line of Credit agreement/arrangement with State Street to provide temporary funding for redemption requests. The maximum borrowing is limited to $150 million. Interest on domestic borrowings is charged at a rate quoted and determined by State Street. The average interest rate charged for the year ended September 30, 2014 was 1.31%.
For the year ended September 30, 2014 the average outstanding loan by Fund was as follows:
| Fund | Average Borrowing (10/1/13-9/30/14) | |||
ICON Consumer Discretionary Fund* | $ | 79,999 | ||
ICON Consumer Staples Fund | 1,149 | |||
ICON Energy Fund | 6,408 | |||
ICON Information Technology Fund | 88,402 | |||
ICON Materials Fund | 10,323 | |||
ICON Utilities Fund | 94,466 | |||
| * | Fund had outstanding borrowings under these agreements/arrangements as of September 30, 2014. |
5. Purchases and Sales of Investment Securities
For the year ended September 30, 2014, the aggregate cost of purchases and proceeds from sales of investment securities (excluding short-term securities) was as follows:
| Fund | Purchases of Securities | Proceeds From Sales of Securities | ||||||
ICON Consumer Discretionary Fund | $ | 94,566,019 | $ | 76,821,525 | ||||
ICON Consumer Staples Fund | 18,728,518 | 32,212,596 | ||||||
ICON Energy Fund | 680,951,881 | 738,831,262 | ||||||
ICON Financial Fund | 31,786,538 | 11,587,052 | ||||||
ICON Healthcare Fund | 174,730,637 | 170,561,919 | ||||||
ICON Industrials Fund | 10,284,045 | 13,858,376 | ||||||
ICON Information Technology Fund | 28,716,081 | 57,919,283 | ||||||
ICON Materials Fund | 55,330,381 | 26,612,120 | ||||||
ICON Utilities Fund | 34,992,948 | 50,351,200 | ||||||
| NOTESTO FINANCIAL STATEMENTS | 99 |
Table of Contents
NOTESTO FINANCIAL STATEMENTS (CONTINUED)
6. Federal Income Tax
The following information is presented on an income tax basis. Differences between U.S. GAAP and federal income tax purposes that are permanent in nature are reclassified within the capital accounts. Temporary differences do not require reclassification. Temporary and permanent differences do not impact the NAVs of the Funds. These differences are due to differing treatments for items such as deferrals of wash sale losses, foreign currency transactions, and net investment losses.
For the year ended September 30, 2014 the following Funds had capital loss carryforwards:
| Fund | Amounts | Expires | ||||||
ICON Financial Fund | $ | 45,004,011 | 2017 | |||||
| 43,715,782 | 2018 | |||||||
ICON Industrials Fund | 26,339,719 | 2018 | ||||||
ICON Information Technology Fund | 390,260 | 2017 | ||||||
| 6,573,259 | 2018 | |||||||
ICON Materials Fund | 2,148,321 | 2017 | ||||||
| 7,349,690 | 2018 | |||||||
ICON Utilities Fund | 1,129,706 | 2018 | ||||||
Future capital loss carryforward utilization in any given year may be limited if there are substantial shareholder redemptions or contributions. During the year ended September 30, 2014 the following Funds utilized capital loss carryforwards:
| Fund | Amount | |||
ICON Consumer Discretionary Fund | $ | 724,922 | ||
ICON Financial Fund | 1,407,388 | |||
ICON Industrials Fund | 4,402,317 | |||
ICON Information Technology Fund | 17,531,866 | |||
ICON Materials Fund | 5,734,068 | |||
ICON Utilities Fund | 3,470,969 | |||
Under the Regulated Investment Company Modernization Act of 2010 (the “Act”) capital losses generated by a fund may be carried over indefinitely, but these losses must be used prior to the utilization of any pre-enactment capital losses. Since pre-enactment capital losses may only be carried forward for eight years there may be a greater likelihood that all or a portion of each fund’s pre-enactment capital losses will expire unused
| 100 | NOTESTO FINANCIAL STATEMENTS |
Table of Contents
The tax characteristics of distributions paid to shareholders during the fiscal year ended September 30, 2014, were as follows:
| Distributions Paid from | ||||||||||||
| Fund | Ordinary Income | Net Long- Term Gains | Total Distributions | |||||||||
ICON Consumer Staples Fund | $ | 188,400 | $ | 3,316,934 | $ | 3,505,334 | ||||||
ICON Energy Fund | 7,889,789 | 15,162,290 | 23,052,079 | |||||||||
ICON Financial Fund | 278,278 | - | 278,278 | |||||||||
ICON Healthcare Fund | 9,719,828 | 20,815,093 | 30,534,921 | |||||||||
ICON Industrials Fund | 198,893 | - | 198,893 | |||||||||
ICON Materials Fund | 347,885 | - | 347,885 | |||||||||
ICON Utilities Fund | 899,223 | - | 899,223 | |||||||||
The tax characteristics of distributions paid to shareholders during the fiscal year ended September 30, 2013, were as follows:
| Distributions Paid from | ||||||||||||
| Fund | Ordinary Income | Net Long- Term Gains | Total Distributions | |||||||||
ICON Consumer Discretionary Fund | $ | 107,081 | $ | - | $ | 107,081 | ||||||
ICON Consumer Staples Fund | 754,642 | - | 754,642 | |||||||||
ICON Energy Fund | 8,178,130 | - | 8,178,130 | |||||||||
ICON Financial Fund | 301,882 | - | 301,882 | |||||||||
ICON Healthcare Fund | 965,959 | - | 965,959 | |||||||||
ICON Industrials Fund | 420,622 | - | 420,622 | |||||||||
ICON Materials Fund | 569,895 | - | 569,895 | |||||||||
ICON Utilities Fund | 869,972 | - | 869,972 | |||||||||
| NOTESTO FINANCIAL STATEMENTS | 101 |
Table of Contents
NOTESTO FINANCIAL STATEMENTS (CONTINUED)
As of September 30, 2014, the components of accumulated earnings/(deficit) on a tax basis were as follows:
| Fund | Undistributed Ordinary Income | Undistributed Capital Gains | Late Year Loss Deferral** | Capital Loss Carryover | Unrealized Appreciation/ (Depreciation)* | Accumulated Earnings/ (Deficit) | ||||||||||||||||||
ICON Consumer Discretionary Fund | $ | 2,900,385 | $ | 4,565,209 | $ | - | $ | - | $ | (784,916 | ) | $ | 6,680,678 | |||||||||||
ICON Consumer Staples Fund | 1,018,444 | 3,043,787 | - | - | 1,841,755 | 5,903,986 | ||||||||||||||||||
ICON Energy Fund | 5,849,832 | 79,120,354 | - | - | 27,626,404 | 112,596,590 | ||||||||||||||||||
ICON Financial Fund | - | - | (14,823 | ) | (88,719,793 | ) | 535,192 | (88,199,424 | ) | |||||||||||||||
ICON Healthcare Fund | 16,828,952 | 13,436,241 | - | - | 8,900,695 | 39,165,888 | ||||||||||||||||||
ICON Industrials Fund | 16,629 | - | - | (26,339,719 | ) | 8,264,095 | (18,058,995 | ) | ||||||||||||||||
ICON Information Technology Fund | - | - | (288,745 | ) | (6,963,519 | ) | 12,369,092 | 5,116,828 | ||||||||||||||||
ICON Materials Fund | 208,261 | - | - | (9,498,011 | ) | 17,190,326 | 7,900,576 | |||||||||||||||||
ICON Utilities Fund | 36,466 | - | - | (1,129,706 | ) | (86,803 | ) | (1,180,043 | ) | |||||||||||||||
| * | Differences between the book-basis and tax-basis unrealized appreciation/(depreciation) are attributable primarily to tax deferral of losses on wash sales. |
| ** | The Funds have elected to defer certain qualified late-year losses in accordance with federal income tax rules. These losses are treated as having arisen on the first day of the following fiscal year. |
As of September 30, 2014, cost on investments for federal income tax purposes and the amount of net unrealized appreciation/(depreciation) were as follows:
| Fund | Cost | Unrealized Appreciation | Unrealized (Depreciation) | Net Appreciation/ (Depreciation) | ||||||||||||
ICON Consumer Discretionary Fund | $ | 63,402,275 | $ | 3,058,813 | $ | (3,843,729 | ) | $ | (784,916 | ) | ||||||
ICON Consumer Staples Fund | 33,498,186 | 2,295,089 | (453,334 | ) | 1,841,755 | |||||||||||
ICON Energy Fund | 646,578,860 | 48,027,437 | (20,401,033 | ) | 27,626,404 | |||||||||||
ICON Financial Fund | 33,772,610 | 1,290,722 | (755,530 | ) | 535,192 | |||||||||||
ICON Healthcare Fund | 158,355,890 | 10,926,181 | (2,025,486 | ) | 8,900,695 | |||||||||||
ICON Industrials Fund | 28,308,641 | 8,627,081 | (362,986 | ) | 8,264,095 | |||||||||||
ICON Information Technology Fund | 40,654,490 | 12,694,263 | (325,171 | ) | 12,369,092 | |||||||||||
ICON Materials Fund | 85,298,604 | 19,571,708 | (2,381,382 | ) | 17,190,326 | |||||||||||
ICON Utilities Fund | 23,979,684 | 449,805 | (536,470 | ) | (86,665 | ) | ||||||||||
| 102 | NOTESTO FINANCIAL STATEMENTS |
Table of Contents
7. Accounting Pronouncement
In June 2013, FASB issued Accounting Standards Update No. 2013-08, Financial Services – Investment Companies (Topic 946): Amendments to the Scope, Measurement, and Disclosure Requirements (“ASU 2013-08”). This update sets forth a new approach for determining whether a public or private company is an investment company and sets certain measurement and disclosure requirements for an investment company. FASB has determined that a fund registered under the 1940 Act automatically meets the criteria of ASU 2013-08 and is effective for interim and annual reporting periods in fiscal years that begin after December 15, 2013. Management does not expect this guidance to have an impact on the Funds’ financial statements.
8. Subsequent Events
Management has evaluated the possibility of subsequent events and determined that there are no material events that would require adjustment to or disclosure in the Funds’ financial statements.
| NOTESTO FINANCIAL STATEMENTS | 103 |
Table of Contents
REPORTOF INDEPENDENT REGISTERED PUBLIC
ACCOUNTING FIRM
To the Board of Trustees and Shareholders of the ICON Funds:
In our opinion, the accompanying statements of assets and liabilities, including the schedules of investments, and the related statements of operations and of changes in net assets and the financial highlights present fairly, in all material respects, the financial position of ICON Consumer Discretionary Fund, ICON Consumer Staples Fund, ICON Energy Fund, ICON Financial Fund, ICON Healthcare Fund, ICON Industrials Fund, ICON Information Technology Fund, ICON Materials Fund, and ICON Utilities Fund (nine of the portfolios constituting ICON Funds, hereafter referred to as the “Funds”) at September 30, 2014, the results of each of their operations for the year then ended, the changes in each of their net assets for each of the two years in the period then ended and the financial highlights for each of the periods presented, in conformity with accounting principles generally accepted in the United States of America. These financial statements and financial highlights (hereafter referred to as “financial statements”) are the responsibility of the Funds’ management. Our responsibility is to express an opinion on these financial statements based on our audits. We conducted our audits of these financial statements in accordance with the standards of the Public Company Accounting Oversight Board (United States). Those standards require that we plan and perform the audit to obtain reasonable assurance about whether the financial statements are free of material misstatement. An audit includes examining, on a test basis, evidence supporting the amounts and disclosures in the financial statements, assessing the accounting principles used and significant estimates made by management, and evaluating the overall financial statement presentation. We believe that our audits, which included confirmation of securities at September 30, 2014 by correspondence with the custodian and brokers, provide a reasonable basis for our opinion.

Denver, Colorado
November 19, 2014
| 104 | REPORTOF ACCOUNTING FIRM |
Table of Contents
SIX MONTH HYPOTHETICAL EXPENSE EXAMPLE
SEPTEMBER 30, 2014 (UNAUDITED)
Example
As a shareholder of a Fund you may pay two types of fees: transaction fees and fund-related fees. Certain funds charge transaction fees, including sales charges (loads) on purchase payments, reinvested dividends, or other distributions; redemption fees; and exchange fees. Funds also incur various ongoing expenses, including management fees, distribution and/or service fees, and other fund expenses, which are indirectly paid by shareholders.
This Example is intended to help you understand your ongoing costs (in dollars) of investing in the various ICON Funds and to compare these costs with the ongoing costs of investing in other mutual funds. This Example is based on an investment of $1,000 invested at the beginning of the six-month period and held for the six-month period (4/1/14 – 9/30/14).
Actual Expenses
The first line in the table for each Fund provides information about actual account values and actual expenses. The Example includes, but is not limited to, management fees, 12b-1 fees, fund accounting, custody and transfer agent fees. However, the Example does not include client specific fees, such as the $15 fee charged to IRA accounts, or the $15 fee charged for wire redemptions. You may use this information, together with the amount you invested, to estimate the expenses that you paid over the period. Simply divide your account value by $1,000 (for example, an $8,600 account value divided by $1,000 = 8.6), then multiply the result by the number in the first line for each Fund under the heading entitled “Expenses Paid During Period” to estimate the expenses you paid on your account during this period.
Hypothetical Example for Comparison Purposes
The second line in the table for each Fund provides information about hypothetical account values and hypothetical expenses based on the Fund’s actual expense ratio and an assumed rate of return of 5% per year before expenses, which is not the Fund’s actual return. The hypothetical account values and expenses may not be used to estimate the actual ending account balance or expenses you paid for the period. You may use this information to compare the ongoing costs of investing in the Fund and other funds. To do so, compare this 5% hypothetical example with the 5% hypothetical examples that appear in the shareholder reports of the other funds. Please note that the expenses shown in the table are meant to highlight your ongoing costs only and do not reflect any transactional costs, such as sales charges (loads),
| EXPENSE EXAMPLE | 105 |
Table of Contents
redemption fees, or exchange fees that may be charged by other funds. Therefore, this information is useful in comparing ongoing costs only, and will not help you determine the relative total costs of owning different funds.
| Beginning Account Value 4/1/14 | Ending Account Value 9/30/14 | Expense Paid During Period 4/1/14 - 9/30/14* | Annualized Expense Ratio 4/1/14 - 9/30/14* | |||||||||||||
Actual Expenses | ||||||||||||||||
ICON Consumer Discretionary Fund | ||||||||||||||||
Class S | $ | 1,000 | $ | 982.90 | $ | 7.01 | 1.41% | |||||||||
Class C | 1,000 | 977.00 | 13.58 | 2.74% | ||||||||||||
Class A | 1,000 | 982.00 | 8.45 | 1.70% | ||||||||||||
ICON Consumer Staples Fund | ||||||||||||||||
Class S | 1,000 | 1,050.00 | 7.50 | 1.46% | ||||||||||||
Class C | 1,000 | 1,045.40 | 12.82 | 2.50% | ||||||||||||
Class A | 1,000 | 1,049.90 | 8.99 | 1.75% | ||||||||||||
ICON Energy Fund | ||||||||||||||||
Class S | 1,000 | 974.20 | 6.33 | 1.28% | ||||||||||||
Class C | 1,000 | 968.80 | 11.80 | 2.39% | ||||||||||||
Class A | 1,000 | 973.30 | 7.77 | 1.57% | ||||||||||||
ICON Financial Fund | ||||||||||||||||
Class S | 1,000 | 1,005.10 | 7.54 | 1.50% | ||||||||||||
Class C | 1,000 | 1,000.00 | 12.53 | 2.50% | ||||||||||||
Class A | 1,000 | 1,003.80 | 8.79 | 1.75% | ||||||||||||
ICON Healthcare Fund | ||||||||||||||||
Class S | 1,000 | 1,121.60 | 7.23 | 1.36% | ||||||||||||
Class C | 1,000 | 1,115.40 | 13.26 | 2.50% | ||||||||||||
Class A | 1,000 | 1,119.50 | 9.25 | 1.74% | ||||||||||||
ICON Industrials Fund | ||||||||||||||||
Class S | 1,000 | 986.50 | 7.07 | 1.42% | ||||||||||||
Class C | 1,000 | 981.00 | 12.42 | 2.50% | ||||||||||||
Class A | 1,000 | 984.70 | 8.71 | 1.75% | ||||||||||||
ICON Information Technology Fund | ||||||||||||||||
Class S | 1,000 | 1,079.70 | 7.35 | 1.41% | ||||||||||||
Class C | 1,000 | 1,073.70 | 13.00 | 2.50% | ||||||||||||
Class A | 1,000 | 1,077.70 | 9.11 | 1.75% | ||||||||||||
ICON Materials Fund | ||||||||||||||||
Class S | 1,000 | 1,018.20 | 6.98 | 1.38% | ||||||||||||
Class C | 1,000 | 1,012.30 | 12.61 | 2.50% | ||||||||||||
Class A | 1,000 | 1,017.00 | 8.65 | 1.71% | ||||||||||||
ICON Utilities Fund | ||||||||||||||||
Class S | 1,000 | 1,020.10 | 7.65 | 1.51% | ||||||||||||
Class C | 1,000 | 1,015.40 | 12.68 | 2.51% | ||||||||||||
Class A | 1,000 | 1,019.50 | 8.91 | 1.76% | ||||||||||||
| 106 | EXPENSE EXAMPLE |
Table of Contents
| Beginning Account Value 4/1/14 | Ending Account Value 9/30/14 | Expense Paid During Period 4/1/14 - 9/30/14* | Annualized Expense Ratio 4/1/14 - 9/30/14* | |||||||||||
Hypothetical (assuming a 5% return before expenses) | ||||||||||||||
ICON Consumer Discretionary Fund | ||||||||||||||
Class S | $ | 1,000 | $ | 1,018.00 | $ | 7.13 | ||||||||
Class C | 1,000 | 1,011.33 | 13.82 | |||||||||||
Class A | 1,000 | 1,016.55 | 8.59 | |||||||||||
ICON Consumer Staples Fund | ||||||||||||||
Class S | 1,000 | 1,017.75 | 7.38 | |||||||||||
Class C | 1,000 | 1,012.53 | 12.61 | |||||||||||
Class A | 1,000 | 1,016.29 | 8.85 | |||||||||||
ICON Energy Fund | ||||||||||||||
Class S | 1,000 | 1,018.65 | 6.48 | |||||||||||
Class C | 1,000 | 1,013.09 | 12.06 | |||||||||||
Class A | 1,000 | 1,017.20 | 7.94 | |||||||||||
ICON Financial Fund | ||||||||||||||
Class S | 1,000 | 1,017.55 | 7.59 | |||||||||||
Class C | 1,000 | 1,012.53 | 12.61 | |||||||||||
Class A | 1,000 | 1,016.29 | 8.85 | |||||||||||
ICON Healthcare Fund | ||||||||||||||
Class S | 1,000 | 1,018.25 | 6.88 | |||||||||||
Class C | 1,000 | 1,012.53 | 12.61 | |||||||||||
Class A | 1,000 | 1,016.34 | 8.80 | |||||||||||
ICON Industrials Fund | ||||||||||||||
Class S | 1,000 | 1,017.95 | 7.18 | |||||||||||
Class C | 1,000 | 1,012.53 | 12.61 | |||||||||||
Class A | 1,000 | 1,016.29 | 8.85 | |||||||||||
ICON Information Technology Fund | ||||||||||||||
Class S | 1,000 | 1,018.00 | 7.13 | |||||||||||
Class C | 1,000 | 1,012.53 | 12.61 | |||||||||||
Class A | 1,000 | 1,016.29 | 8.85 | |||||||||||
ICON Materials Fund | ||||||||||||||
Class S | 1,000 | 1,018.15 | 6.98 | |||||||||||
Class C | 1,000 | 1,012.53 | 12.61 | |||||||||||
Class A | 1,000 | 1,016.50 | 8.64 | |||||||||||
ICON Utilities Fund | ||||||||||||||
Class S | 1,000 | 1,017.50 | 7.64 | |||||||||||
Class C | 1,000 | 1,012.48 | 12.66 | |||||||||||
Class A | 1,000 | 1,016.24 | 8.90 | |||||||||||
| * | Expenses are equal to the Fund’s six month expense ratio annualized, multiplied by the average account value over the period, multiplied by 183/365 to reflect the one-half year period. |
Total returns exclude applicable sales charges. If sales charges were included (maximum 5.75%), returns would be lower.
| EXPENSE EXAMPLE | 107 |
Table of Contents
BOARDOF TRUSTEESAND FUND OFFICERS (UNAUDITED)
The ICON Funds Board of Trustees (“Board”) consists of four Trustees who oversee the 17 ICON Funds (the “Funds”). The Board is responsible for general oversight of the Funds’ business and for assuring that the Funds are managed in the best interest of the Funds’ shareholders. The Trustees, and their ages, and principal occupations are set forth below. The address of the Trustees is 5299 DTC Blvd., Suite 1200, Greenwood Village, CO 80111. Trustees have no official term of office and generally serve until they resign or are not re-elected.
Interested Trustee
Craig T. Callahan, 63, Chairman of the Board. Dr. Callahan has been a Trustee of the Funds since their inception. Dr. Callahan also serves as Chief Executive Officer (2013-present); President (1998 to 2013 and 2014 to present); and Chairman of the Investment Committee (2005 to present) and served as the Chief Investment Officer (1991 to 2004) of ICON Advisers. Dr. Callahan is also Executive Vice President (2005 to present); Director (1991 to present); and was previously President (1998 to 2005) and Chief Compliance Officer (2005) of IDI. Dr. Callahan also serves as the President (1998 to present) and Chairman of the Board of Directors (1994 to present) of IM&R, the parent company of ICON Advisers and IDI.
Independent Trustees
Glen F. Bergert, 64. Mr. Bergert has been a Trustee of the Funds since 1999. Mr. Bergert is President of Venture Capital Management LLC (1997 to present), General Partner of SOGNO Partners LP, a venture capital company (2001 to present), General Partner of Bergert Properties, LLP, a real estate holding company (1997 to present), General Partner of Pyramid Real Estate Partnership, a real estate development company (1998 to present), General Partner of Chamois Partners, LP, a venture capital company (2004 to present) and was previously a General Partner with KPMG Peat Marwick, LLP (1979 to 1997). Mr. Bergert is also a Director of Delta Dental of California, an insurance company (2013 to present and 2006 to 2012), Delta Dental of Pennsylvania, an insurance company (1998 to 2009 and 2010 to present), Dentegra Group, Inc, an insurance holding company (2010 to 2014) and Delta Reinsurance Corporation (2000 to 2009 and 2011 to 2014). Mr. Bergert was a Director of Herre Bros, Inc., a contracting company (1998 to 2011).
John C. Pomeroy, Jr., 67. Mr. Pomeroy has been a Trustee of the Funds since November 2002. Mr. Pomeroy is Chief Investment Officer and Director
| 108 | TRUSTEESAND OFFICERS |
Table of Contents
of Investments, Pennsylvania State University (2001 to present) and was Portfolio Manager and Product Manager, Trinity Investment Management Corporation (1989 to 2001).
R. Michael Sentel, 66. Mr. Sentel has been a Trustee of the Funds since their inception. Mr. Sentel is a Senior Attorney with the U.S. Department of Education (1996 to present). Mr. Sentel also provides legal representation as a sole practitioner with an emphasis on corporate and transactional law. He served as general counsel to numerous public companies and served on the board of directors of one of these clients. Mr. Sentel began his legal career with the U.S. Securities and Exchange Commission’s Division of Enforcement and served as a Branch Chief (1980 to 1981). Later he served as the Section Chief for the Professional Liability Section of the Federal Deposit Insurance Corp. with responsibility for the Rocky Mountain Region (1991 to 1994).
The Officers of the Funds are:
Craig T. Callahan, 63, Chairman of the Board. Dr. Callahan has been a Trustee of the Funds since their inception. Dr. Callahan also serves as Chief Executive Officer (2013-present); President (1998 to 2013 and 2014 to present); and Chairman of the Investment Committee (2005 to present) and served as the Chief Investment Officer (1991 to 2004) of ICON Advisers. Dr. Callahan is also Executive Vice President (2005 to present); Director (1991 to present); and was previously President (1998 to 2005) and Chief Compliance Officer (2005) of IDI. Dr. Callahan also serves as the President (1998 to present) and Chairman of the Board of Directors (1994 to present) of IM&R, the parent company of ICON Advisers and IDI.
Donald Salcito, 61. Mr. Salcito serves as Vice President and Secretary of the Funds (November 15, 2006 to present). Mr. Salcito is also Executive Vice President and General Counsel (September 2005 to present) of ICON Advisers; Director of IM&R (2005 to present); Executive Vice President, Secretary, General Counsel of IDI (2005 to present). Previously, he was a Partner in various national law firms, practicing in the securities law area. (1980 to 2005).
Carrie M. Schoffman, 41. Ms. Schoffman has been a Vice President and Principal Financial Officer/Treasurer of the Funds since June 2013. Ms. Schoffman is also Chief Compliance Officer (2013 to present and 2004 to 2008) and Anti-Money Laundering Officer (2013 to present) of the ICON Funds. She is Senior Vice President (2011 to present) and Chief Compliance Officer (2013 to present and 2004 to 2011) of ICON Advisers. Previously, she was a Staff Accountant with the Securities and Exchange Commission (2003 to 2004) and also an Experienced Manager (2001 to 2003) and a Senior Associate/Associate (1996 to 2001) at PricewaterhouseCoopers LLP.
| TRUSTEESAND OFFICERS | 109 |
Table of Contents
Lesley Caviness, 48. Ms. Caviness serves as Assistant Treasurer of the Funds (2014 to present). She has worked at ICON (2007-2008 and 2010 – present) in fund accounting, compliance, business intelligence and performance capacities. Prior to working at ICON, Ms. Caviness was a Real Estate Broker at Seasons Real Estate Group (2008-2012) and Signature Real Estate (2014-present), Finance Manager at Navigant (2000-2007), and Associate/Senior Associate (1996 to 2000) at PricewaterhouseCoopers LLP.
| 110 | TRUSTEESAND OFFICERS |
Table of Contents
Renewal of Investment Advisory Agreement
On September 3, 2014 the Board of Trustees, including all of the Trustees that are not “interested persons” of the Trust (the “Independent Trustees”), approved continuation of the Advisory Agreements with the Adviser for each Fund for an additional one-year term commencing October 1, 2014.
In determining to renew the investment advisory agreements between ICON Funds (the “Trust”) and ICON Advisers, Inc. (“ICON” or the “Adviser”) the Trustees requested, was provided with and reviewed data with respect to the Adviser, its personnel, and the services provided and to be provided to each Fund by the Adviser under the Trust’s Investment Advisory Agreement dated October 9, 1996, as amended (related to the Sector Funds, the International Funds and ICON Funds) and under the Trust’s Investment Advisory Agreement dated July 9, 2002 and effective October 1, 2002, as amended (related to the U.S. Diversified Funds — Bond, Risk-Managed Equity, Equity Income and Long/Short Funds) (collectively, the “Advisory Agreements”), for an additional one-year term commencing October 1, 2014. The Trustees agreed that consideration of the Advisory Agreements should also include consideration of other agreements between the Adviser and the Trust that impact provisions of the Advisory Agreements, including, in particular, expense limitation agreements dated January 22, 2014, as amended May 5, 2014 (for ICON Emerging Markets Fund) and as amended effective September 30, 2014 (for the ICON High Yield Bond Fund).
The Trustees were provided with and reviewed data with respect to the Adviser, its personnel, and the services provided and to be provided to each Fund by the Adviser under the Trust’s Advisory Agreements, Administrative Services Agreement and Expense Limitation Agreement and the Distribution Agreement with ICON Distributors, Inc. (“IDI”). The data included information concerning advisory, distribution and administrative services provided to the Funds by ICON and its related companies; information concerning other businesses of those companies; comparative data related to exchange traded funds versus the Sector Funds; and comparative data obtained from Strategic Insight (“SI”) related to Fund performance and Fund expenses (the “SI Report”). The data also included an analysis of the management style to be applied and the style applied to the Funds’ ratings of the Funds’ performance in their management style on the AthenaInvest system (the “AthenaInvest Data”) and a presentation on the Adviser’s investment model.
The Board convened a meeting with SI to discuss the SI Report and the information contained within the SI Report on August 20, 2014. Management
| OTHER INFORMATION | 111 |
Table of Contents
personnel participated in the SI meeting convened to discuss the data for and with the Board. Included in the 15(c) discussion was a briefing on factors affecting the ICON investment model; expenses and expense ratios of each Fund and other ICON managed products; relative performance of each Fund; status of expense reimbursements to the Funds by the Adviser; sales and marketing initiatives; specific business factors affecting IDI; the work load on ICON as adviser and administrator to the Funds; current profitability of ICON; current quality control procedures in place to show consistency in the management of the investment model, modification to the investment model, and staffing levels and staff morale.
The Independent Trustees were represented by independent legal counsel in this process. Prior to acting on the proposed contract renewals and after participating in the meeting with SI and management, the Independent Trustees met separately as a group in private sessions with their independent legal counsel to review and discuss the foregoing information. Based on these discussions, independent legal counsel and/or the Lead Independent Trustee also contacted management and SI to request additional information and to discuss responses to questions raised during the process and the meeting with SI. In addition, the Board received materials from legal counsel discussing the legal standards applicable to their consideration of the ICON-Trust agreements.
In considering the nature, extent and quality of the services provided by the Adviser, the Board reviewed information relating to ICON’s operations and personnel. Among other things, the Adviser provided biographical information on its professional staff and descriptions of its organizational and management structure. In the course of their deliberations the Board evaluated, among other things, information relating to the investment philosophy, strategies and techniques used in managing each Fund, the qualifications and experience of ICON’s investment personnel, ICON’s compliance programs, ICON’s brokerage practices, including the extent to which the Adviser obtains research through “soft dollar” arrangements with the Funds’ brokerage, compliance reports on the foregoing, and the financial and non-financial resources available to provide services required under the Advisory Agreement.
During the discussion, the SI Report and the AthenaInvest Data were discussed and management personnel showed performance for each fund and discussed the factors affecting performance. The Board inquired from SI whether there was any correlation between fund expenses and performance, and SI saw no correlation with the ICON Funds. During the discussion on performance, management personnel noted that the markets continue to experience volatility and that when the markets are volatile, it affects the performance of the ICON system; during the last three – four years ICON’s
| 112 | OTHER INFORMATION |
Table of Contents
style of management, intrinsic valuation, has not been in favor and performance has been affected by three primary factors: quality, cash and shorter duration theme reversals. The Trustees noted that Advisers’ performance relative to other valuation managers as judged by the AthenaInvest system is in line, but in relation to other strategy managers, valuation is underperforming Future Growth, Social Considerations, Competitive Position, Quantitative and Profitability. The Board believes this information supports the view that an active valuation manager is in a very difficult setting and indicates this setting has been particularly difficult for managers buying what they consider to be value stocks. Management noted that the ICON system is designed to handle one to two year industry themes; and that the Adviser has stuck to its system as specified in Fund disclosure documents, holding the stocks and industries that appear inexpensive in relation to ICON’s calculating of value and ridden through the volatility. SI also noted that from a performance point of view, the Funds in the SI Report are compared using the Morningstar data, and there is no Morningstar category for “all cap” funds. For the period July 1, 2013 and ending June 30, 2014 and for the six month period ending June 30, 2014, five of the 18 ICON Funds out-performed their benchmarks.
The Board addressed style consistency with the Adviser. Management advised that, based on the Adviser’s own analysis, and with the restructuring of the Adviser, the Adviser has continued an additional level of review on the Portfolio Managers (“PMs”) to make sure they are adhering to the ICON System; the Senior Vice President of Fund Management has been systematically tracking the Funds’ performance; he evaluates each of the ICON Funds to help ensure all PMs are investing consistently and in accordance with the ICON System by evaluating the Funds from an attribution perspective in monthly meetings. Management also advised that part of his responsibilities require him to evaluate the ICON system and that this effort has resulted in improvements to the ICON methodology, when necessary.
In connection with reviewing data bearing upon the nature, quality, and extent of services furnished by ICON to each Fund, the Board assessed data concerning ICON’s staffing, systems and facilities. The Board also assessed ICON’s non-Trust business to see if there are any initiatives that would dilute service to the Trust. The Board concluded:
A. That the breadth and the quality of investment advisory and other services being provided to each Fund is satisfactory, as evidenced in part by efforts to address and improve the performance record of each Fund when compared with the performance records of a peer group of comparable funds and markets in general;
| OTHER INFORMATION | 113 |
Table of Contents
B. That the breadth and the quality of investment advisory and other services being provided to each Fund are satisfactory, as evidenced in part by the AthenaInvest Data (ratings based on an assessment of fund strategy), the Adviser’s performance is competitive with other fund managers in the value style group, and the Adviser has applied a disciplined approach in the style specified in the Funds’ offering document;
C. That ICON has made significant expenditures in the past year and in prior years to ensure that it has the sophisticated systems and the highly trained personnel necessary for it to be able to continue to provide quality service to the Funds’ shareholders, including the dedication of substantial resources to ICON’s investment and methodology;
D. That the Board, after considering compliance reports and compliance initiatives undertaken during the year and conducting individual interviews with selected PMs, is satisfied with the research and portfolio management, that research and portfolio management is being constantly evaluated and improved upon; and that the PMs are evaluating trading services constantly, the Board concluded that the Adviser is providing the Funds with professional management of the nature, quality and scope required by the Funds; and
E. The risks assumed by ICON in providing investment advisory services to each Fund, including the capital commitments which have been made in the past and which continue to be made by ICON to ensure the continuation of the highest quality of service to the Trust, is made with the recognition that shareholders may redeem their shares at any time without notice and the Trust’s advisory relationship with ICON may be terminated at any time and must be renewed on an annual basis.
In considering the reasonableness of the fees paid to the Adviser for managing each Fund, the Board reviewed, among other things, data concerning other funds from the SI Report, financial statements of the Adviser and an analysis of the profitability of the Adviser, and its affiliates, and their relationship with each Fund over various time periods. Such analysis identified all revenues and other benefits received by the Adviser and its affiliates from managing each Fund, the costs associated with providing such services and the resulting profitability to the Adviser and its affiliates and a comparison of similar data from reports filed by publicly traded firms.
The Board assessed actual (net) fees for advisory services and Fund expense ratios under the contractual relationship (the Advisory agreements and the Expense Limitation Agreements) with the Adviser as opposed to the fees specified in the applicable Advisory Agreement and expense ratios without
| 114 | OTHER INFORMATION |
Table of Contents
application of the expense limitations and concluded that the focus should be on actual expense ratios after application of the Expense Limitation Agreements.
The Board considered the current and anticipated asset levels of each Fund and the contractual commitments of the Adviser to waive fees and pay expenses of the Funds from time to time to limit the total expenses of the Funds. In this regard the Board discussed asset levels in each Fund covered by the Advisory Agreements due to the relative Fund performance, and the industry wide sales in equity and actively managed funds due to the uncertainty of the markets. ICON’s ability to provide the services called for under the Advisory Agreements was assessed in light of current and projected asset levels. Fund expenses and expense ratios were also assessed in light of current and projected asset levels. The Board concluded that the Adviser has the resources necessary to provide the services called for under the Advisory Agreements; that profitability to the Adviser and its affiliates from their relationship with the Funds, and services provided to the Funds, is not excessive; and that the Adviser is not realizing material benefits from economies of scale that would warrant adjustments to the fees for any Fund at this time. The Board of Trustees concluded that, in light of the nature, extent and quality of the services provided by the Adviser and the levels of profitability associated with providing these services, the fees charged by the Adviser under the Advisory Agreements to each Fund are reasonable.
In connection with assessing data bearing on the fairness of fee arrangements, the Board considered the SI Report. It was noted that SI was selected at the May Board meeting to prepare its report, an extensive analysis of the expense data of other comparable funds; and that Trustee input was solicited and provided in the process. Among other information discussed, it was noted that:
A. the advisory fee structures of the Funds are within the range of funds considered in the comparison with advisory fees and expense ratios of other similarly managed funds as set forth in the comparative data;
B. ICON has contractually agreed to impose expense limitations on each and every Fund at a cost to ICON;
C. ICON has contractually committed to break points in its fees so that economies of scale could be realized as a Fund grows in assets, for the benefit of Fund shareholders.
The Board also considered the fees charged by the Adviser to other advisory clients as outlined in its Registration Application on Form ADV in connection with assessing data bearing on the fairness of fee arrangements. The Trustees noted that certain ICON institutional/sub-advised type accounts
| OTHER INFORMATION | 115 |
Table of Contents
have lower fees than the fees paid by the Funds for a number of reasons, including but not limited to, those clients call for different commitments of time, institutional clients have low and predictable turnover of assets, in competition joint costs are apportioned among paying customers according to elasticity of demand and the Adviser has a limited level of responsibility in sub-managed accounts, or accounts with an investor agent/advisor.
The Board noted that the Funds’ redemptions were similar to industry averages which showed two things: 1) that the Funds’ Performance was not adversely impacting fund redemptions, and 2) that the fees and costs were competitive when compared to size. The Board noted that there are thousands of mutual funds competing; that investors can search and trade funds on the internet or on platforms at very little or no cost; and that if the Adviser were overcharging for its services, with its performance being what it is, the Board would have expected redemptions in excess of industry norms.
The Board concluded that the Adviser is providing the Funds with professional management at a fair, reasonable and competitive price.
In connection with assessing the direct and indirect benefits to ICON from serving as the Funds’ adviser, the Board discussed services provided under the Distribution Agreement and the Administrative Services Agreement which are in addition to services under the Advisory Agreements. It was noted that IDI does not charge a fee to the Funds for its services and that ICON’s fee for administrative services appears to be consistent with such fees in other fund groups. The Board noted that ICON receives research assistance (primarily in the form of data) from the use of soft dollars generated from Fund portfolio transactions; that such research assists ICON in providing quality advisory services; that Trust and Adviser compliance personnel continuously evaluate and report on the soft-dollar arrangements and related costs; and the Board concluded that the arrangements are consistent with Fund brokerage practices and benefit the Funds and their shareholders.
Based on these considerations, the Board, including all of the Independent Trustees, concluded that: 1) the continuation of the Advisory Agreements was in the best interests of each Fund and its shareholders, 2) the services to be performed under the Advisory Agreements were required for the operation of the Funds, 3) the advisory services were satisfactory to the Funds in the past, and 4) the fees for the advisory services and other benefits from the relationship with the Trust received by ICON, and its affiliates, were consistent with fees paid by similar funds and other clients of ICON, and were reasonable in light of the comparative data, and within the range of what would have been negotiated at arm’s length in light of all the circumstances.
| 116 | OTHER INFORMATION |
Table of Contents
Supplemental Tax Information
For corporate shareholders, the following percentage of the total ordinary income dividends paid during the fiscal year ended September 30, 2014, qualifies for the corporate dividends received deduction for the following Funds:
| Fund | Dividends Received Deduction | |||
ICON Consumer Staples Fund | 89.1 | % | ||
ICON Energy Fund | 91 | % | ||
ICON Financial Fund | 100 | % | ||
ICON Healthcare Fund | 12.3 | % | ||
ICON Industrials Fund | 100 | % | ||
ICON Materials Fund | 100 | % | ||
ICON Utilities Fund | 100 | % | ||
For the fiscal year ended September 30, 2014, the following funds paid qualified dividend income:
| Fund | Amount | |||
ICON Consumer Staples Fund | 89.8 | % | ||
ICON Energy Fund | 98 | % | ||
ICON Financial Fund | 100 | % | ||
ICON Healthcare Fund | 15 | % | ||
ICON Industrials Fund | 100 | % | ||
ICON Materials Fund | 100 | % | ||
ICON Utilities Fund | 100 | % | ||
The Funds designate the following amounts, or the maximum amount needed, as long-term capital gain distributions qualifying for the maximum 20% income tax rate for individuals:
| Fund | Amount | |||
ICON Consumer Staples Fund | $ | 3,316,934 | ||
ICON Energy Fund | 15,162,290 | |||
ICON Healthcare Fund | 20,815,093 | |||
Portfolio Holdings
Information related to the 10 largest portfolio holdings of each Fund is made available at www.iconfunds.com within approximately 10 business days after month-end. Additionally, a complete list of each Fund’s holdings is made available approximately 30 days after month-end. Each ICON Fund also files a complete schedule of portfolio holdings for the first and third quarters of its fiscal year with the Securities and Exchange Commission (the “Commission”) on Form N-Q. The ICON Funds’ Forms N-Q are available at www.sec.gov or may be reviewed and copied at the Commission’s Public Reference Room in Washington, DC. Information about the Public Reference Room may be obtained by calling 1-800-SEC-0330.
| OTHER INFORMATION | 117 |
Table of Contents
Proxy Voting
A summarized description of the policies and procedures the ICON Funds use to vote proxies is available free of charge at www.iconfunds.com or by calling 1-800-764-0442.
Information about how the ICON Funds voted proxies related to each Fund’s portfolio securities during the 12-month period ended June 30 is available free of charge at www.iconfunds.com or on the Commission’s website at www.sec.gov.
Cost Basis Information
Effective January 1, 2012, federal law requires mutual fund companies to maintain and report a shareholder’s cost basis by tax lot, gain/loss information and holding period of covered shares to the Internal Revenue Service on Form 1099. Covered shares are mutual fund shares acquired on or after January 1, 2012. A fund is not required to maintain and report information for shares not deemed as covered.
The new law requires each fund to elect a default tax identification methodology in order to perform the required reporting. As a result, the Trust has chosen Average Cost as its default tax identification methodology. This is the method each Fund will use. However, at the time of purchase or upon the sale of covered shares, shareholders may choose a different tax identification method. Furthermore, if you purchase shares through a financial intermediary, please contact the intermediary to find out what default tax identification method they will use. We recommend that you consult your tax adviser to determine which tax identification methodology best suits your individual tax situation.
For More Information
This report is for the general information of the Funds’ shareholders and is not authorized for distribution to prospective investors unless preceded or accompanied by a current prospectus. You may obtain a copy of the prospectus, which contains information about the investment objectives, risks, charges, expenses, and share classes of each ICON Fund, by visiting www.iconfunds.com or by calling 1-800-764-0442. Please read the prospectus carefully before investing.
ICON Distributors, Inc., Distributor.
| 118 | OTHER INFORMATION |
Table of Contents
ICON FUNDS PRIVACY INFORMATION
| FACTS | WHAT DOES ICON DO WITH YOUR PERSONAL INFORMATION? | |
| Why? | Financial companies choose how they share your personal information. Federal law gives consumers the right to limit some but not all sharing. Federal law also requires us to tell you how we collect, share, and protect your personal information. Please read this notice carefully to understand what we do. | |
| What? | The types of personal information we collect and share depend on the product or service you have with us. This information can include:
n Social Security number and account balances
n income and transaction history
n checking account information and wire transfer instructions
When you are no longer our customer, we continue to share your information as described in this notice. | |
| How? | All financial companies need to share customers’ personal information to run their everyday business. In the section below, we list the reasons financial companies can share their customers’ personal information; the reasons ICON chooses to share; and whether you can limit this sharing. |
| Reasons we can share your personal information | Does ICON share? | Can you limit this sharing? | ||
For our everyday business purposes — such as to process your transactions, maintain your account(s), respond to court orders and legal investigations, or report to credit bureaus | Yes | No | ||
For our marketing purposes — to offer our products and services to you | No | We don’t share | ||
| For joint marketing with other financial companies | No | We don’t share | ||
For our affiliates’ everyday business purposes — information about your transactions and experiences | No | We don’t share | ||
For our affiliates’ everyday business purposes — information about your creditworthiness | No | We don’t share | ||
| For nonaffiliates to market to you | No | We don’t share |
| Questions? | Call 1-800-764-0442 for the ICON Funds and 1-800-828-4881 for ICON Advisers, Inc. and ICON Distributors, Inc. |
| FUNDS PRIVACY INFORMATION | 119 |
Table of Contents
| Page 2 |
| Who we are | ||
| Who is providing this notice? | ICON Funds, ICON Advisers, Inc., and ICON Distributors, Inc. (collectively “ICON”) | |
| What we do | ||
| How does ICON protect my personal information? | To protect your personal information from unauthorized access and use, we use security measures that comply with federal law. These measures include computer safeguards and secured files and buildings.
Contracts with our service providers require them to restrict access to your non-public personal information, and to maintain physical, electronic and procedural safeguards against unintended disclosure. | |
| How does ICON collect my personal information? | We collect your personal information, for example, when you
n open an account or enter into an investment advisory contract
n provide account information or give us your contact information
n make a wire transfer
We also collect your personal information from others, such as credit bureaus, affiliates, or other companies. | |
| Why can’t I limit all sharing? | Federal law gives you the right to limit only
n sharing for affiliates’ everyday business purposes — information about your creditworthiness
n affiliates from using your information to market to you
n sharing for nonaffiliates to market to you
State laws and individual companies may give you additional rights to limit sharing. | |
| Definitions | ||
| Affiliates | Companies related by common ownership or control. They can be financial and nonfinancial companies.
n Our affiliates include financial companies such as ICON Funds, ICON Advisers, Inc., and ICON Distributors, Inc. | |
| Nonaffiliates | Companies not related by common ownership or control. They can be financial and nonfinancial companies.
n Nonaffiliates we share with can include financial companies such as custodians, transfer agents, registered representatives, financial advisers and nonfinancial companies such as fulfillment, proxy voting, and class action service providers | |
| Joint marketing | A formal agreement between nonaffiliated financial companies that together market financial products or services to you.
n ICON doesn’t jointly market |
| 120 | FUNDS PRIVACY INFORMATION |
Table of Contents
(This page is intentionally left blank)
Table of Contents
(This page is intentionally left blank)
Table of Contents
(This page is intentionally left blank)
Table of Contents
(This page is intentionally left blank)
Table of Contents
(This page is intentionally left blank)
Table of Contents
For more information about the ICON Funds, contact us:
| By Telephone | 1-800-764-0442 | |
| By Mail | ICON Funds P.O. Box 55452 Boston, MA 02205-8165 | |
| In Person | ICON Funds 5299 DTC Boulevard, 12th Floor Greenwood Village, CO 80111 | |
| On the Internet | www.iconfunds.com | |
| By E-Mail | info@iconadvisers.com | |
Table of Contents
| Item 2. | Code of Ethics. |
(a) The registrant has adopted a code of ethics that applies to the registrant’s principal executive officer, principal financial officer, principal accounting officer or controller, or persons performing similar functions. This code of ethics is included as an Exhibit.
(b) Not used.
(c) There were no amendments, during the period covered by this report, to a provision of the code of ethics that applies to the Registrant’s principal executive officer, principal financial officer, principal accounting officer or controller, or persons performing similar functions, regardless of whether these individuals are employed by the Registrant or a third party, and that relates to any element of the code of ethics description.
(d) The registrant has not granted any waivers, including an implicit waiver, from a provision of the code of ethics that applies to the Registrant’s principal executive officer, principal financial officer, principal accounting officer or controller, or persons performing similar functions, regardless of whether these individuals are employed by the Registrant or a third party, that relates to one or more of the items set forth in paragraph (b) of this item’s instructions.
(e) Not applicable.
(f) See the attached Exhibit.
| Item 3. | Audit Committee Financial Expert. |
3(a)(1) The Registrant’s Board of Trustees has determined that the registrant has at least one audit committee financial expert serving on its audit committee.
3(a)(2) The audit committee financial experts are Glen F. Bergert and R. Michael Sentel, who are “independent” for purposes of this Item 3 of Form N-CSR.
3(a)(3) Not applicable.
Table of Contents
| Item 4. | Principal Accountant Fees and Services. |
| (a) | Audit Fees |
In each of the fiscal years ended September 30, 2014 and September 30, 2013, the aggregate Audit Fees billed (or to be billed) by PricewaterhouseCoopers LLP (“PwC”) for professional services rendered for the audits of the financial statements, or services that are normally provided in connection with statutory and regulatory filings or engagements as well as reimbursable expenses are listed below. All of the below fees were paid by the Registrant.
| 2014 | 2013 | |||
$375,563 | $ | 362,100 | ||
| (b) | Audit-Related Fees |
In each of the fiscal years ended September 30, 2014 and September 30, 2013, the aggregate Audit-Related Fees billed (or to be billed) by PwC for services rendered for assurance and related services to each fund that are reasonably related to the performance of the audit or review of the fund’s financial statements, but not reported as Audit Fees, are shown in the table below.
| 2014 | 2013 | |||
$0 | $ | 0 | ||
| (c) | Tax Fees |
In each of the fiscal years ended September 30, 2014 and September 30, 2013 the aggregate Tax Fees billed (or to be billed) by PwC for professional services rendered for tax return preparation, tax compliance, tax advice and tax planning are shown in the table below. All of the below fees were paid by the Registrant.
| 2014 | 2013 | |||
$136,500 | $ | 136,850 | ||
| (d) | All Other Fees |
In each of the fiscal years ended September 30, 2014 and September 30, 2013 the aggregate Other Fees billed (or to be billed) by PwC for all other non-audit services rendered are shown in the table below. All of the below fees were paid by the Registrant.
| 2014 | 2013 | |||
$0 | $ | 0 | ||
.
(e)(1) The audit committee of the Registrant’s Board of Trustees is required to pre-approve all services to be provided by the independent accountants to the Registrant or the Registrant’s investment adviser and to any entity controlling, controlled by or under common control with the investment adviser that provides on-going services to the Registrant to determine whether the services performed by the independent accountants impair their independence from the Registrant. The audit committee has delegated authority to the Chairman of the audit committee, subject to review and ratification by the full audit committee.
(e)(2) 100% of the fees were approved by the Registrant’s audit committee pursuant to paragraph (c)(7)(i)(C) if Rule 2-01 of Regulation S-X.
(f) For the fiscal year ended September 30, 2014, the percentage of hours spent on the audit of the Registrant’s financial statements that were attributed to work performed by persons who are not full-time, permanent employees of PwC was 0%.
(g) See Item 4(d) above.
Table of Contents
(h) There were no non-audit fees provided by PwC in the fiscal year ending September 30, 2014 or September 30, 2013 to the investment adviser or to any entity controlling, controlled by, or under common control with the investment adviser that provides on-going services to the Registrant.
| Item 5. | Audit Committee of Listed Registrants. |
Not applicable.
| Item 6. | Investments. |
(a) The schedule of investments in securities of unaffiliated issuers is included in Item 1.
(b) Not applicable.
| Item 7. | Disclosure of Proxy Voting Policies and Procedures for Closed-End Management Investment Companies. |
Not applicable.
| Item 8. | Portfolio Managers of Closed-End Management Investment Companies. |
Not applicable.
| Item 9. | Purchases of Equity Securities by Closed-End Management Investment Company and Affiliated Purchasers. |
Not applicable.
| Item 10. | Submission of Matters to a Vote of Security Holders. |
Not applicable.
| Item 11. | Controls and Procedures. |
(a) The registrant’s principal executive officer and principal financial officer have concluded, based on their evaluation of the Registrant’s disclosure controls and procedures as conducted within 90 days of the filing date of this report, that these disclosure controls and procedures are adequately designed and are operating effectively to ensure that information required to be disclosed by the registrant on Form N-CSR is recorded, processed, summarized and reported within the time periods specified in the Securities and Exchange Commission’s rules and forms.
(b)There were no changes in the registrant’s internal control over financial reporting that occurred during the second fiscal quarter of the period covered by this report that have materially affected or are reasonably likely to materially affect, the registrant’s internal control over financial reporting.
| Item 12. | Exhibits. |
(a)(1) The code of ethics is attached.
(a)(2) Certifications pursuant to Rule 30a-2(a) are attached.
(a)(3) Not applicable.
(b) Certifications pursuant to Rule 30a-2(b) are furnished herewith.
Table of Contents
SIGNATURES
Pursuant to the requirements of the Securities Exchange Act of 1934 and the Investment Company Act of 1940, the registrant has duly caused this report to be signed on its behalf by the undersigned, thereunto duly authorized.
(Registrant) | ICON Funds |
By (Signature and Title)* | /s/ Craig T. Callahan | |
| Craig T. Callahan, President and Chief Executive Officer (Principal Executive Officer) | ||
Date | December 5, 2014 |
Pursuant to the requirements of the Securities Exchange Act of 1934 and the Investment Company Act of 1940, this report has been signed below by the following persons on behalf of the registrant and in the capacities and on the dates indicated.
By (Signature and Title)* | /s/ Craig T. Callahan | |
Craig T. Callahan, President and Chief Executive Officer (Principal Executive Officer) |
Date | December 5, 2014 |
By (Signature and Title)* | /s/ Carrie M. Schoffman | |
Carrie M. Schoffman, Vice President, Chief Compliance Officer and Treasurer (Principal Financial Officer and Principal Accounting Officer) |
Date | December 5, 2014 |
* Print the name and title of each signing officer under his or her signature.