UNITED STATES
SECURITIES AND EXCHANGE COMMISSION
Washington, D.C. 20549
FORM N-CSR
CERTIFIED SHAREHOLDER REPORT OF REGISTERED
MANAGEMENT INVESTMENT COMPANIES
Investment Company Act file number 811-07883
ICON Funds
(Exact name of registrant as specified in charter)
5299 DTC Blvd. Suite 1200 Greenwood Village, CO 80111
(Address of principal executive offices) (Zip code)
Carrie Schoffman
5299 DTC Blvd. Suite 1200 Greenwood Village, CO 80111
(Name and address of agent for service)
Registrant’s telephone number, including area code: 303-790-1600
Date of fiscal year end: September 30, 2015
Date of reporting period: September 30, 2015
Item 1. Reports to Stockholders.

2015 ANNUAL REPORT
ICON DIVERSIFIED FUNDS
INVESTMENT UPDATE
ICON Bond Fund
ICON Equity Income Fund
ICON Fund
ICON Long/Short Fund
ICON Opportunities Fund
ICON Risk-Managed Balanced Fund

1-800-764-0442 | www.iconfunds.com

You can now sign up for electronic delivery of ICON Fund shareholder reports, including prospectuses, annual reports, semiannual reports and proxy statements.
When these materials are available, you will receive an email from ICON with instructions on how to view the documents. Statements, transaction confirmations and other documents that are not available online will continue to be sent to you by U.S. mail.
Visit ICON’s website at www.iconfunds.com to learn more and sign up.
You may change or cancel your participation in eDelivery by visiting www.iconfunds.com, or you can request a hard copy of any of the materials free of charge by calling ICON Funds at 1-800-764-0442.
1-800-764-0442 • www.iconfunds.com

TABLEOF CONTENTS
ABOUT THIS REPORT (UNAUDITED)
Historical Returns
All total returns mentioned in this Report account for the change in a Fund’s per-share price and the reinvestment of any dividends, capital gain distributions and adjustments for financial statement purposes. If your account is set up to receive Fund distributions in cash rather than to reinvest them, your actual return may differ from these figures. The Funds’ performance results do not reflect the deduction of taxes that a shareholder would pay on Fund distributions or on the redemption of Fund shares. The Adviser may have reimbursed certain fees or expenses of some of the Funds. If not for these reimbursements, performance would have been lower. Fund results shown, unless otherwise indicated, are at net asset value. If a sales charge (maximum 5.75%) had been deducted, results would have been lower.
Past performance does not guarantee future results. Investment return and principal value will fluctuate so that an investor’s shares, when redeemed, may be worth more or less than their original cost. Performance results represent past performance, and current performance may be higher or lower. Please call 1-800-764-0442 or visit www.iconfunds.com for performance results current to the most recent month-end.
Portfolio Data
This Report reflects ICON’s portfolio holdings as of September 30, 2015, the end of the reporting period. The information is not a complete analysis of every aspect of any sector, industry, security or the Funds.
There are risks associated with mutual fund investing, including the loss of principal. The likelihood of loss may be greater if you invest for a shorter period of time. There is no assurance that the investment process will consistently lead to successful results.
There are risks associated with selling short, including the risk that the ICON Long/Short Fund may have to cover its short position at a higher price than the short price, resulting in a loss. The ICON Long/Short Fund’s loss on a short sale is potentially unlimited as a loss occurs when the value of a security sold short increases. Call options involve certain risks, such as limited gains and lack of liquidity in the underlying securities, and are not suitable for all investors.
Investing in fixed income securities such as bonds involves interest rate risk. When interest rates rise, the value of fixed income securities generally decreases. The ICON Bond Fund and ICON Equity Income Fund may invest up to 35% and 25% of its assets in high-yield bonds that are below investment
grade, respectively. ICON Risk-Managed Balanced Fund may invest up to 10% of its assets in high-yield bonds that are below investment grade. High-yield bonds involve a greater risk of default and price volatility than U.S. Government and other higher-quality bonds.
An investment concentrated in sectors and industries may involve greater risk and volatility than a more diversified investment.
Investments in foreign securities may entail unique risks, including political, market, and currency risks. Financial statements of foreign companies are governed by different accounting, auditing, and financial standards than U.S. companies and may be less transparent and uniform than in the United States. Many corporate governance standards, which help ensure the integrity of public information in the United States, do not exist in foreign countries. In general, there may be less governmental supervision of foreign stock exchanges and securities brokers and issuers. The ICON system relies on the integrity of the financial statements released to the market as part of our analysis.
Investments in other mutual fund companies may entail certain risks. For example, the Fund’s performance depends on the underlying funds in which it invests, and it is subject to the risks of the underlying funds. Additionally, an investment by the Fund or underlying fund in exchange-traded funds generally presents the same primary risks as an investment in a mutual fund.
The prospectus and statement of additional information contain this and other information about the Funds and are available by visiting www.iconfunds.com or calling 1-800-764-0442. Please read the prospectus and statement of additional information carefully.
Financial Intermediary
If you purchase the Fund through a broker-dealer or other financial intermediary (such as a bank), the Fund and its related companies may pay the intermediary for the sale of Fund shares and related services. These payments may influence the broker-dealer or other intermediary and your salesperson to recommend the Fund over another investment. Ask your salesperson or visit your financial intermediary’s website for more information.
| | |
MANAGEMENT OVERVIEW (UNAUDITED) ICON BOND FUND | | |
| Q. | How did the Fund perform relative to its benchmark? |
| A. | For the Fund’s fiscal year ended September 30, 2015, the ICON Bond Fund (the Fund) Class S shares underperformed its benchmark, the Barclays Capital U.S. Universal Index (ex-MBS). The Fund returned -0.28% while the Barclays Capital U.S. Universal Index (ex-MBS) returned 2.00%. Total returns for other periods and additional Class shares as of September 30, 2015, appear in the subsequent pages of this Fund’s Management Overview. |
| Q. | What primary factors were behind the Fund’s relative performance? |
| A. | Investors began fiscal year 2015 anticipating a rising rate environment. As the year unfolded, a general economic malaise and declining inflation expectations produced the exact opposite, a rate rally. The U.S. Treasury market experienced volatility through the fiscal year as the yield on the 10-Year U.S. Treasury began the fiscal year at 2.49%, fell to 1.64% by the end of January 2015, due in large part to macro-economic uncertainty, rose to 2.48% at the end of May 2015, and finally finished the fiscal year at 2.04%. Corporate bond spreads experienced volatility of their own as default concerns that started primarily in the Energy sector eventually spread to other sectors of the economy. Over the course of the fiscal year, the Fund maintained a lower overall duration relative to the benchmark, causing the majority of the Fund’s underperformance as both curve return and curve carry worked against the Fund’s holdings. In the corporate bond segment of the market, the Fund maintained a relatively defensive posture as we felt spreads, specifically in the high yield segment of the market, had reached unsustainable levels. This defensive posture proved to be advantageous for the Fund as spreads began to aggressively widen, especially in the Energy sector. However, the Fund was not completely immune from the sell-off due to a small allocation to high yield bonds in the Energy sector and a specific security within the Telecommunication space. Other positions that provided positive returns for the Fund over the course of the fiscal year included preferred shares and investments in closed-end funds. Both areas provided positive returns and diversification benefits relative to the volatility in the fixed income market. In the end, the negative effects of yield curve movements proved too large to offset and the ICON Bond Fund underperformed the benchmark over the course of the fiscal year. |
| Q. | How did the Fund’s composition affect performance? |
| A. | As stated above, the Fund underperformed its benchmark during the fiscal year. Further analysis shows the underperformance stemmed from both negative curve return and negative curve carry as the Fund had a lower overall duration and virtually no exposure to long-dated U.S. Treasuries over the course of the fiscal year. The Fund had positive selection effect in the corporate bond segment of the market where holdings within the Information Technology, Financials, and Materials sectors of the market experienced larger spread movement than the broad market. Additionally, the Fund had positive selection effect from closed-end fund positions where either discount tightening was realized or activist actions resulted in bond tenders. Negative allocation effect came from the Fund’s lack of holdings in both long-dated high quality corporate bonds and long-dated U.S. Treasuries as the long end of the curve experienced strong returns. Based on our internal assumption of risk and returns, we felt as though duration extension was unwarranted and would rather look to focus on bottom up security selection. |
| Q. | What is your investment outlook for the bond market? |
| A. | The end of fiscal year 2015 saw an increase in both spread and interest rate volatility as concerns about domestic and global growth persisted. Overall, we generally believe these concerns will eventually subside and the volatility in spread product will create opportunities. Specifically, we are beginning to look for higher quality, high yield bonds in the Energy sector as risk return profiles are beginning to look attractive. While we don’t anticipate a substantial upward movement in interest rates over the course of the next 12 months, the Fund is positioned in the lower portion of its duration range as we move into fiscal year 2016. We continue to shy away from interest rate forecasts and remain steadfast in our search for issue specific opportunities. We are looking for opportunities that have the characteristics of credit upgrades, special situations, or anticipated future bond tenders. While future bond market volatility might be substantial, we believe our unique investment methodology will help the Fund navigate the changing market. |
ICON Bond Fund
Credit Diversification
September 30, 2015
| | | | |
Aaa | | | 6.8% | |
A2 | | | 1.2% | |
A3 | | | 6.5% | |
A- | | | 1.8% | * |
Baa1 | | | 9.2% | |
Baa2 | | | 9.2% | |
Baa3 | | | 5.6% | |
Ba1 | | | 10.9% | |
Ba2 | | | 8.9% | |
Ba3 | | | 0.8% | |
B1 | | | 4.1% | |
B2 | | | 5.1% | |
B3 | | | 1.5% | |
Caa1 | | | 3.5% | |
NR | | | 7.0% | |
| | | | |
| | | 82.1% | |
| | | | |
| | * | Reflects S&P Rating of A- since a Moody’s rating is unavailable for MASTR Seasoned Security Trust 2005-1, CMO as of September 30, 2015. |
Percentages are based upon U.S. Treasury obligations, collateralized mortgage obligations, corporate and foreign corporate bond investments as a percentage of net assets. Ratings based on Moody’s Investors Service, Inc.
ICON Bond Fund
Average Annual Total Return
as of September 30, 2015
| | | | | | | | | | | | | | | | | | | | | | | | | | | | |
| | | Inception
Date | | | 1 Year | | | 5 Years | | | 10 Years | | | Since
Inception | | | Gross
Expense
Ratio* | | | Net
Expense
Ratio* | |
ICON Bond Fund - Class S | | | 5/6/04 | | | | -0.28% | | | | 2.91% | | | | 4.46% | | | | 4.41% | | | | 0.86% | | | | 0.75% | |
ICON Bond Fund - Class C | | | 10/21/02 | | | | -1.10% | | | | 2.04% | | | | 3.59% | | | | 3.94% | | | | 2.27% | | | | 1.60% | |
ICON Bond Fund - Class A | | | 9/30/10 | | | | -0.44% | | | | 2.69% | | | | N/A | | | | 2.69% | | | | 1.44% | | | | 1.00% | |
ICON Bond Fund - Class A (including maximum sales charge of 4.75%) | | | 9/30/10 | | | | -5.16% | | | | N/A | | | | N/A | | | | 1.69% | | | | 1.44% | | | | 1.00% | |
Barclays Capital U.S. Universal Index | | | | | | | 2.33% | | | | 3.36% | | | | 4.80% | | | | 5.01% | | | | N/A | | | | N/A | |
Barclays Capital U.S. Universal Index (ex-MBS) | | | | | | | 2.00% | | | | 3.49% | | | | 4.78% | | | | 5.18% | | | | N/A | | | | N/A | |
Past performance is not a guarantee of future results. Information about these performance results and the comparative indexes can be found in the About This Report section. The Adviser has agreed to limit certain Fund expenses; without these limitations, returns would have been lower. The limitation provisions may be terminated in the future.
| * | Please see the most recent prospectus for details. |
Class C total returns exclude applicable sales charges. If sales charges were included returns would be lower.
ICON Bond Fund
Value of a $10,000 Investment
through September 30, 2015
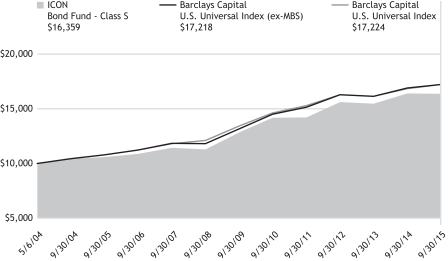
Past performance is not a guarantee of future results. The above graph compares a $10,000 investment made in the Bond Fund’s Class S shares on the Class’ inception date of 5/6/04 to a $10,000 investment made in an unmanaged securities index on that date. Performance for the Bond Fund’s other share classes will vary due to differences in charges and expenses. The Bond Fund’s performance in this chart and the performance table assumes the reinvestment of dividends and capital gain distributions but does not reflect the deduction of taxes that a shareholder would pay on Fund distributions or on the redemption of Fund shares.
ICON BOND FUND
SCHEDULEOF INVESTMENTS
SEPTEMBER 30, 2015
| | | | | | | | | | | | | | | | |
| Shares or Principal Amount | | Interest
Rate | | | Maturity
Date | | | Value | |
| | | | | | | | | | | | | | | | |
| | Corporate Bonds (63.3%) | |
| | Communications (2.1%) | |
| $ | 500,000 | | | Cincinnati Bell Telephone Co. LLC | | | 6.30 | % | | | 12/01/28 | | | $ | 467,500 | |
| | 1,290,000 | | | Cincinnati Bell, Inc. | | | 8.38 | % | | | 10/15/20 | | | | 1,298,869 | |
| | | | | | | | | | | | | | | | |
| | | | | | | | | | | | | | | 1,766,369 | |
| | Consumer, Cyclical (5.7%) | |
| | 800,000 | | | Darden Restaurants, Inc. | | | 6.45 | % | | | 10/15/17 | | | | 870,900 | |
| | 1,300,000 | | | Darden Restaurants, Inc. | | | 7.05 | % | | | 10/15/37 | | | | 1,553,526 | |
| | 1,000,000 | | | International Game Technology(a) | | | 5.35 | % | | | 10/15/23 | | | | 915,000 | |
| | 1,000,000 | | | Pinnacle Entertainment, Inc. | | | 7.50 | % | | | 04/15/21 | | | | 1,042,500 | |
| | 500,000 | | | Pinnacle Entertainment, Inc. | | | 6.38 | % | | | 08/01/21 | | | | 529,165 | |
| | | | | | | | | | | | | | | | |
| | | | | | | | | | | | | | | 4,911,091 | |
| | Consumer, Non-cyclical (23.0%) | |
| | 2,798,000 | | | Altria Group, Inc. | | | 9.25 | % | | | 08/06/19 | | | | 3,487,167 | |
| | 1,000,000 | | | HCA, Inc. | | | 5.25 | % | | | 04/15/25 | | | | 1,021,250 | |
| | 2,336,000 | | | Kraft Heinz Foods Co.(b) | | | 4.88 | % | | | 02/15/25 | | | | 2,492,979 | |
| | 3,000,000 | | | Hospira, Inc. | | | 5.80 | % | | | 08/12/23 | | | | 3,474,468 | |
| | 1,000,000 | | | inVentiv Health, Inc.(b) | | | 9.00 | % | | | 01/15/18 | | | | 1,032,500 | |
| | 2,565,000 | | | Lender Processing Services, Inc. / Black Knight Lending Solutions, Inc. | | | 5.75 | % | | | 04/15/23 | | | | 2,715,694 | |
| | 3,250,000 | | | Omnicare, Inc. | | | 4.75 | % | | | 12/01/22 | | | | 3,510,000 | |
| | 1,797,000 | | | Prospect Medical Holdings, Inc.(b) | | | 8.38 | % | | | 05/01/19 | | | | 1,877,865 | |
| | | | | | | | | | | | | | | | |
| | | | | | | | | | | | | | | 19,611,923 | |
| | Energy (2.9%) | |
| | 500,000 | | | Bill Barrett Corp.(a) | | | 7.00 | % | | | 10/15/22 | | | | 325,000 | |
| | 750,000 | | | Noble Energy, Inc. | | | 5.88 | % | | | 06/01/22 | | | | 748,585 | |
| | 500,000 | | | Noble Energy, Inc. | | | 5.88 | % | | | 06/01/24 | | | | 497,500 | |
| | 1,000,000 | | | Range Resources Corp.(a) | | | 5.00 | % | | | 08/15/22 | | | | 885,000 | |
| | | | | | | | | | | | | | | | |
| | | | | | | | | | | | | | | 2,456,085 | |
| | Financial (23.5%) | |
| | 1,366,000 | | | Ally Financial, Inc. | | | 8.00 | % | | | 03/15/20 | | | | 1,570,900 | |
| | 1,010,000 | | | E*TRADE Financial Corp. | | | 5.38 | % | | | 11/15/22 | | | | 1,070,600 | |
| | 2,500,000 | | | General Electric Capital Corp., Series A(c) | | | 7.13 | % | | | 06/15/22 | | | | 2,887,500 | |
| | 1,300,000 | | | General Electric Capital Corp., Series B(c) | | | 6.25 | % | | | 12/15/22 | | | | 1,410,500 | |
| | 600,000 | | | GFI Group, Inc. | | | 8.63 | % | | | 07/19/18 | | | | 648,000 | |
| | | | | | | | | | | | | | | | |
| Shares or Principal Amount | | Interest
Rate | | | Maturity
Date | | | Value | |
| | | | | | | | | | | | | | | | |
| $ | 1,015,000 | | | Highmark, Inc.(b) | | | 4.75 | % | | | 05/15/21 | | | $ | 1,053,074 | |
| | 1,000,000 | | | Highmark, Inc.(b) | | | 6.13 | % | | | 05/15/41 | | | | 1,011,381 | |
| | 1,094,000 | | | KeyCorp Capital II | | | 6.88 | % | | | 03/17/29 | | | | 1,215,504 | |
| | 2,439,000 | | | MBIA, Inc. | | | 6.63 | % | | | 10/01/28 | | | | 2,384,122 | |
| | 1,500,000 | | | NTC Capital I, Series A, FRN(c) | | | 0.81 | % | | | 01/15/27 | | | | 1,305,000 | |
| | 1,000,000 | | | Prudential Financial, Inc.(c) | | | 8.88 | % | | | 06/15/68 | | | | 1,147,750 | |
| | 2,000,000 | | | State Street Capital Trust I, FRN(c) | | | 0.88 | % | | | 05/15/28 | | | | 1,740,000 | |
| | 2,800,000 | | | USB Realty Corp., FRN(b)(c) | | | 1.44 | % | | | 01/15/17 | | | | 2,541,000 | |
| | | | | | | | | | | | | | | | |
| | | | | | | | | | | | | | | 19,985,331 | |
| | Industrials (2.6%) | |
| | 1,260,000 | | | Ingersoll-Rand Co. | | | 6.39 | % | | | 11/15/27 | | | | 1,525,403 | |
| | 700,000 | | | Vulcan Materials Co. | | | 4.50 | % | | | 04/01/25 | | | | 686,000 | |
| | | | | | | | | | | | | | | | |
| | | | | | | | | | | | | | | 2,211,403 | |
| | Technology (3.5%) | |
| | 1,000,000 | | | First Data Corp. | | | 11.25 | % | | | 01/15/21 | | | | 1,092,500 | |
| | 1,671,000 | | | First Data Corp. | | | 12.63 | % | | | 01/15/21 | | | | 1,898,674 | |
| | | | | | | | | | | | | | | | |
| | | | | | | | | | | | | | | 2,991,174 | |
| | | | | | | | | | | | | | | | |
| Total Corporate Bonds
(Cost $55,099,454) | | | | | | | | | | | 53,933,376 | |
| | U.S. Treasury Obligations (6.8%) | |
| | 5,030,420 | | | Treasury Inflation Protected Security | | | 0.13 | % | | | 07/15/24 | | | | 4,799,599 | |
| | 1,000,000 | | | U.S. Treasury Note | | | 2.00 | % | | | 08/15/25 | | | | 994,714 | |
| | | | | | | | | | | | | | | | |
| Total U.S. Treasury Obligations
(Cost $5,805,361) | | | | | | | | | | | 5,794,313 | |
| | Collateralized Mortgage Obligations (7.6%) | | | | | | | | | | | | |
| | 496,411 | | | Citigroup Mortgage Loan Trust, Inc.,
Series 2013-J1, Class B3, CMO, VRN(b)(c)(d) | | | 3.56 | % | | | 10/25/43 | | | | 486,496 | |
| | 1,444,702 | | | MASTR Seasoned Securitization Trust, Inc., Series 2005-1, Class 1A1, CMO(c) | | | 6.54 | % | | | 09/25/32 | | | | 1,574,068 | |
| | 1,191,970 | | | Sequoia Mortgage Trust, Inc., Series 2013-1, Class B2, CMO, FRN(c)(d) | | | 3.64 | % | | | 02/25/43 | | | | 1,147,233 | |
| | 1,904,186 | | | Sequoia Mortgage Trust, Inc., Series 2013-10, Class B2, CMO, VRN(b)(c)(d) | | | 3.59 | % | | | 08/25/43 | | | | 1,791,775 | |
| | 1,474,117 | | | Sequoia Mortgage Trust, Inc., Series 2014-4, Class B2, CMO, VRN(b)(c)(d) | | | 3.90 | % | | | 11/25/44 | | | | 1,463,281 | |
| | | | | | | | | | | | | | | | |
| Total Collateralized Mortgage Obligations
(Cost $6,595,754) | | | | | | | | | | | 6,462,853 | |
| | Municipal Bond (1.3%) | |
| | 1,000,000 | | | Texas State Public Finance Authority, Charter School Finance Corp. | | | 7.50 | % | | | 08/15/30 | | | | 1,073,690 | |
| | | | | | | | | | | | | | | | |
| Total Municipal Bonds
(Cost $1,079,062) | | | | | | | | | | | 1,073,690 | |
| | |
| 10 | | SCHEDULEOF INVESTMENTS |
| | | | | | | | | | | | | | | | |
| Shares or Principal Amount | | Interest
Rate | | | Maturity
Date | | | Value | |
| | | | | | | | | | | | | | | | |
| | Foreign Corporate Bonds (3.1%) | |
| | Consumer, Cyclical (1.7%) | |
| $ | 1,300,000 | | | Air Canada(b) | | | 8.75 | % | | | 04/01/20 | | | $ | 1,418,625 | |
| | | | | | | | | | | | | | | | |
| | Energy (1.4%) | |
| | 200,000 | | | Encana Corp. | | | 6.50 | % | | | 02/01/38 | | | | 176,460 | |
| | 1,000,000 | | | BG Energy Capital PLC(b) | | | 4.00 | % | | | 10/15/21 | | | | 1,062,042 | |
| | | | | | | | | | | | | | | | |
| | | | | | | | | | | | | | | 1,238,502 | |
| | | | | | | | | | | | | | | | |
| Total Foreign Corporate Bonds
(Cost $2,690,541) | | | | | | | | | | | 2,657,127 | |
| | | |
| Shares or Principal Amount | | | | | | | | Value | |
| | Preferred Stocks (6.7%) | |
| | Diversified Banks (1.3%) | |
| | 10,000 | | | GMAC Capital Trust I, Series 2 | | | | | | | | | | | 255,300 | |
| | 35,686 | | | RBS Capital Funding Trust V, Series E | | | | | | | | | | | 869,668 | |
| | | | | | | | | | | | | | | | |
| | | | | | | | | | | | | | | 1,124,968 | |
| | Diversified REIT’s (0.4%) | |
| | 20,872 | | | Winthrop Realty Trust, REIT | | | | | | | | | | | 299,722 | |
| | | | | | | | | | | | | | | | |
| | Office REIT’s (4.2%) | |
| | 70,039 | | | Equity Commonwealth, Series E | | | | | | | | | | | 1,784,593 | |
| | 69,852 | | | Gramercy Property Trust, Inc., Series B(d) | | | | | | | | | | | 1,781,226 | |
| | | | | | | | | | | | | | | | |
| | | | | | | | | | | | | | | 3,565,819 | |
| | Specialized REIT’s (0.8%) | |
| | 28,300 | | | Digital Realty Trust, Inc., Series E(a) | | | | | | | | | | | 721,933 | |
| | | | | | | | | | | | | | | | |
| Total Preferred Stocks
(Cost $5,705,428) | | | | | | | | | | | 5,712,442 | |
| | Closed-End Mutual Funds (9.4%) | |
| | 37,949 | | | AllianceBernstein Income Fund, Inc. | | | | | | | | | | | 298,279 | |
| | 5,800 | | | BlackRock Enhanced Government Fund, Inc. | | | | | | | | | | | 79,924 | |
| | 29,661 | | | Deutsche Global High Income Fund, Inc. | | | | | | | | | | | 224,207 | |
| | 213,226 | | | Federated Enhanced Treasury Income Fund | | | | | | | | | | | 2,882,816 | |
| | 29,930 | | | First Trust Mortgage Income Fund | | | | | | | | | | | 430,693 | |
| | 13,170 | | | Firsthand Technology Value Fund, Inc.(a) | | | | | | | | | | | 112,077 | |
| | 36,360 | | | Fort Dearborn Income Securities, Inc. | | | | | | | | | | | 512,676 | |
| | 5,936 | | | LMP Real Estate Income Fund, Inc. | | | | | | | | | | | 72,894 | |
| | 29,584 | | | Montgomery Street Income Securities, Inc. | | | | | | | | | | | 514,466 | |
| | 5,201 | | | Nuveen Mortgage Opportunity Term Fund | | | | | | | | | | | 116,502 | |
| | 96,140 | | | Transamerica Income Shares, Inc. | | | | | | | | | | | 2,082,392 | |
| | 60,936 | | | Western Asset/Claymore Inflation-Linked Securities & Income Fund | | | | | | | | | | | 642,875 | |
| | | | | | | | | | | | | | | | |
| Total Closed-End Mutual Funds
(Cost $8,269,885) | | | | | | | | | | | 7,969,801 | |
| | | | |
| SCHEDULEOF INVESTMENTS | | | 11 | |
| | | | | | | | | | | | |
| | | |
| Shares or Principal Amount | | | | | | Value | |
| | | | | | | | | | | | |
| | Collateral for Securities on Loan (1.1%) | |
| $ | 974,488 | | | State Street Navigator Prime Portfolio, 0.20% | | | | | | $ | 974,488 | |
| | | | | | | | | | | | |
| Total Collateral for Securities on Loan
(Cost $974,488) | | | | | | | 974,488 | |
| | Short-Term Investments (1.1%) | |
| | 923,476 | | | State Street Euro Dollar Time Deposit (USD), 0.01%, 10/01/15 | | | | | | | 923,476 | |
| | | | | | | | | | | | |
| Total Short-Term Investments
(Cost $923,476) | | | | | | | 923,476 | |
| Total Investments 100.4%
(Cost $87,143,449) | | | 85,501,566 | |
| | Liabilities Less Other Assets (0.4)% | | | (369,595 | ) |
| | | | | | | | | | | | |
| | Net Assets 100.0% | | | | | | $ | 85,131,971 | |
| | | | | | | | | | | | |
The accompanying notes are an integral part of the financial statements.
| (a) | All or a portion of the security was on loan as of September 30, 2015. |
| (b) | 144A—Exempt from registration under Rule 144A of the Securities Act of 1933. These securities may be resold in transactions exempt from registration, typically only to qualified institutional buyers. Unless otherwise indicated, these securities are not considered to be illiquid. |
| (c) | Floating Rate Security. Rate disclosed is as of September 30, 2015. |
| (d) | These securities are considered to be illiquid. The aggregate value of these securities at September 30, 2015 was $6,670,011, which represent 7.8% of the Fund’s Net Assets. |
| REIT | Real Estate Investment Trust |
| | |
| 12 | | SCHEDULEOF INVESTMENTS |
| | |
MANAGEMENT OVERVIEW (UNAUDITED) ICON EQUITY INCOME FUND | | |
| Q. | How did the Fund perform relative to its benchmarks? |
| A. | The ICON Equity Income Fund (the Fund) Class S shares returned -.17% for the fiscal year ending September 30, 2015, out pacing its benchmark, the S&P Composite 1500 Index, which returned -.30% during the fiscal year. Total returns for other periods and additional Class shares as of September 30, 2015, appear in the subsequent pages of this Fund’s Management Overview. |
Q. What primary factors were behind the Fund’s relative performance?
| A. | While stock returns for the fiscal year 2015 were relatively muted, the period saw notable volatility. From mid-October 2014 to mid-May 2015, the S&P Composite 1500 Index value gained over 14%. However, in just six trading days starting August 16, 2015, the same Index value fell about 10%. |
The low interest environment that has persisted over the past few years continued through fiscal year 2015. As the yield on the 10-year U.S. Treasury fell from 2.49% on September 30, 2014 to 2.04% on September 30, 2015, many investors sought higher yields in stocks, which, in turn, helped drive the demand for dividend paying stocks. This demand helped the performance of the Fund. The Utilities sector in particular, which traditionally has stocks with high dividend yields, benefited from the interest rate pressure. In September 2015, many speculated that the Federal Reserve (the FED) would raise rates for the first time since 2006. Ultimately, the FED decided not to raise rates at that time and, as previously stated, the yield on the 10-Year U.S. Treasury note fell to 2.04% by the end of September 2015.
| Q. | How did the Fund’s composition affect performance? |
| A. | At the sector level, the Consumer Staples sector had the largest positive effect on Fund’s relative performance from a total effect standpoint. Drilling down to the stock level to assess the source of this sector’s out performance, the Fund’s position in B&G Foods, Inc. was single largest positive contributor to the Fund’s performance. |
During specific periods over the course year, the overall average market value-to-price (V/P) ratio fell below 1. Because of these valuations, the Fund held increased levels of both cash and fixed income. The cash position was a positive for the Fund. However, the Fund’s fixed income
holdings created a headwind for the Fund. The Fund’s fixed income exposure primarily came from corporate bonds. While the interest rate environment was positive for government bonds, the spread between corporate bonds and government bond increased. This spread increase outpaced the improving interest rate environment leading to downward pressure on corporate bond pricing.
In addition, a sharp decline in energy commodity prices led to a steep drop in the Energy sector. While the Fund was underweight in the Energy sector relative to the benchmark, the stock selection within the Fund under performed the Energy sector holdings within the benchmark. Ultimately, the Fund’s energy exposure was the largest detractor from Fund performance. In the end, the detractors and the contributors nearly canceled each other out, leaving the Fund with only minor outperformance of the benchmark.
| Q. | What is the outlook for the ICON Equity Income Fund? |
| A. | The overall average V/P ratio for the stocks we track within our system was 1.09 as of September 30, 2015. The highest V/P at a sector level was the Financial sector with a V/P of 1.28 as of September 30, 2015. The Financial sector’s relatively high V/P ratio coupled with attractive yields on a large percentage of stocks within the sector, led to a large allocation within the Fund to the Financial sector. In addition, the Fund has an overweight position relative to the benchmark in the Utilities sector due in large part to the sector’s overall average V/P ratio of 1.11 and the large number of dividend paying stocks within the sector. We will continue to monitor the equity market to find the best combination of value and dividend for our investors. |
ICON Equity Income Fund
Sector Composition
September 30, 2015
| | | | |
Financial | | | 32.0% | |
Utilities | | | 11.1% | |
Consumer Discretionary | | | 10.6% | |
Information Technology | | | 8.6% | |
Leisure and Consumer Staples | | | 7.6% | |
Materials | | | 6.4% | |
Telecommunication & Utilities | | | 3.9% | |
Energy | | | 3.8% | |
Telecommunication Services | | | 2.0% | |
Health Care | | | 1.9% | |
Industrials | | | 1.9% | |
| | | | |
| | | 89.8% | |
| | | | |
Percentages are based upon common, convertible preferred and preferred stocks as a percentage of net assets.
ICON Equity Income Fund
Industry Composition
September 30, 2015
| | | | |
Asset Management & Custody Banks | | | 6.8% | |
Integrated Telecommunication Services | | | 5.9% | |
Multi-Utilities | | | 5.8% | |
Diversified Banks | | | 5.0% | |
Multi-line Insurance | | | 4.3% | |
Movies & Entertainment | | | 3.8% | |
Regional Banks | | | 3.8% | |
Electric Utilities | | | 3.7% | |
Tobacco | | | 3.6% | |
Automobile Manufacturers | | | 3.3% | |
Technology Hardware, Storage & Peripherals | | | 3.2% | |
Diversified Chemicals | | | 3.0% | |
Oil & Gas Refining & Marketing | | | 2.8% | |
Life & Health Insurance | | | 2.2% | |
Packaged Foods & Meats | | | 2.1% | |
Semiconductors | | | 2.1% | |
Computer & Electronics Retail | | | 2.0% | |
Biotechnology | | | 1.9% | |
Construction & Farm Machinery & Heavy Trucks | | | 1.9% | |
| | | | |
Insurance Brokers | | | 1.9% | |
Soft Drinks | | | 1.9% | |
Health Care REITs | | | 1.8% | |
Thrifts & Mortgage Finance | | | 1.8% | |
Electronic Equipment & Instruments | | | 1.7% | |
Fertilizers & Agricultural Chemicals | | | 1.7% | |
Paper Products | | | 1.7% | |
Gas Utilities | | | 1.6% | |
Semiconductor Equipment | | | 1.6% | |
Housewares & Specialties | | | 1.5% | |
Mortgage REIT’s | | | 1.4% | |
Residential REIT’s | | | 1.3% | |
Consumer Finance | | | 1.2% | |
Oil & Gas Storage & Transportation | | | 1.0% | |
Office REIT’s | | | 0.5% | |
| | | | |
| | | 89.8% | |
| | | | |
Percentages are based upon common, convertible preferred and preferred stocks as a percentage of net assets.
ICON Equity Income Fund
Average Annual Total Return
as of September 30, 2015
| | | | | | | | | | | | | | | | | | | | | | | | | | | | |
| | | Inception
Date | | | 1 Year | | | 5 Years | | | 10 Years | | | Since
Inception | | | Gross
Expense
Ratio* | | | Net
Expense
Ratio* | |
ICON Equity Income Fund - Class S | | | 5/10/04 | | | | -0.17% | | | | 9.72% | | | | 4.90% | | | | 6.13% | | | | 1.38% | | | | 1.20% | |
ICON Equity Income Fund - Class C | | | 11/8/02 | | | | -1.16% | | | | 8.62% | | | | 3.86% | | | | 6.51% | | | | 2.45% | | | | 2.20% | |
ICON Equity Income Fund - Class A | | | 5/31/06 | | | | -0.38% | | | | 9.45% | | | | N/A | | | | 4.60% | | | | 1.59% | | | | 1.45% | |
ICON Equity Income Fund - Class A (including maximum sales charge of 5.75%) | | | 5/31/06 | | | | -6.09% | | | | 8.17% | | | | N/A | | | | 3.94% | | | | 1.59% | | | | 1.45% | |
S&P Composite 1500 Index | | | | | | | -0.30% | | | | 13.34% | | | | 6.95% | | | | 8.62% | | | | N/A | | | | N/A | |
Past performance is not a guarantee of future results. Information about these performance results and the comparative indexes can be found in the About This Report section. The Adviser has agreed to limit certain Fund expenses; without these limitations, returns would have been lower. The limitation provisions may be terminated in the future.
| * | Please see the most recent prospectus for details. |
Class C total returns exclude applicable sales charges. If sales charges were included returns would be lower.
ICON Equity Income Fund
Value of a $10,000 Investment
through September 30, 2015
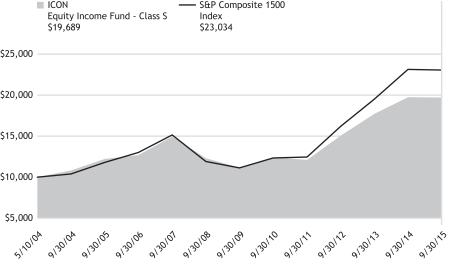
Past performance is not a guarantee of future results. The above graph compares a $10,000 investment made in the Equity Income Fund’s Class S shares on the Class’ inception date of 5/10/04 to a $10,000 investment made in an unmanaged securities index on that date. Performance for the Equity Income Fund’s other share classes will vary due to differences in charges and expenses. The Equity Income Fund’s performance in this chart and the performance table assumes the reinvestment of dividends and capital gain distributions but does not reflect the deduction of taxes that a shareholder would pay on Fund distributions or on the redemption of Fund shares.
ICON EQUITY INCOME FUND
SCHEDULEOF INVESTMENTS
SEPTEMBER 30, 2015
| | | | | | | | |
| Shares or Principal Amount | | Value | |
| | | | | | | | |
| | Common Stocks (85.2%) | |
| | Asset Management & Custody Banks (6.8%) | |
| | 49,100 | | | Ares Capital Corp. | | $ | 710,968 | |
| | 32,600 | | | Arlington Asset Investment Corp., Class A(a) | | | 458,030 | |
| | 18,700 | | | Invesco, Ltd. | | | 584,001 | |
| | 26,000 | | | Main Street Capital Corp.(a) | | | 693,160 | |
| | 28,700 | | | Triangle Capital Corp.(a) | | | 472,976 | |
| | | | | | | | |
| | | | | | | 2,919,135 | |
| | Automobile Manufacturers (3.3%) | |
| | 56,400 | | | Ford Motor Co. | | | 765,348 | |
| | 21,400 | | | General Motors Co. | | | 642,428 | |
| | | | | | | | |
| | | | | | | 1,407,776 | |
| | Biotechnology (1.9%) | |
| | 15,100 | | | AbbVie, Inc. | | | 821,591 | |
| | | | | | | | |
| | Computer & Electronics Retail (2.0%) | |
| | 20,900 | | | GameStop Corp., Class A(a) | | | 861,289 | |
| | | | | | | | |
| Construction & Farm Machinery & Heavy
Trucks (1.9%) |
|
| | 7,300 | | | Cummins, Inc. | | | 792,634 | |
| | | | | | | | |
| | Diversified Banks (2.1%) | |
| | 14,500 | | | JPMorgan Chase & Co. | | | 884,065 | |
| | | | | | | | |
| | Diversified Chemicals (3.0%) | |
| | 19,300 | | | Dow Chemical Co. | | | 818,320 | |
| | 49,500 | | | Huntsman Corp. | | | 479,655 | |
| | | | | | | | |
| | | | | | | 1,297,975 | |
| | Electric Utilities (3.7%) | |
| | 16,800 | | | ALLETE, Inc. | | | 848,232 | |
| | 26,800 | | | OGE Energy Corp. | | | 733,248 | |
| | | | | | | | |
| | | | | | | 1,581,480 | |
| | Electronic Equipment & Instruments (1.7%) | |
| | 84,800 | | | Daktronics, Inc. | | | 735,216 | |
| | | | | | | | |
| Shares or Principal Amount | | Value | |
| | | | | | | | |
| | Fertilizers & Agricultural Chemicals (1.7%) | |
| | 8,300 | | | Agrium, Inc.(a) | | $ | 742,850 | |
| | | | | | | | |
| | Gas Utilities (1.6%) | |
| | 14,000 | | | National Fuel Gas Co. | | | 699,720 | |
| | | | | | | | |
| | Health Care REITs (1.8%) | |
| | 20,800 | | | HCP, Inc., REIT | | | 774,800 | |
| | | | | | | | |
| | Housewares & Specialties (1.5%) | |
| | 13,200 | | | Tupperware Brands Corp.(a) | | | 653,268 | |
| | | | | | | | |
| | Insurance Brokers (1.9%) | |
| | 19,800 | | | Arthur J Gallagher & Co. | | | 817,344 | |
| | | | | | | | |
| Integrated Telecommunication
Services (5.9%) |
|
| | 23,300 | | | BCE, Inc. | | | 954,368 | |
| | 87,900 | | | Spark New Zealand, Ltd., ADR | | | 836,808 | |
| | 16,700 | | | Verizon Communications, Inc. | | | 726,617 | |
| | | | | | | | |
| | | | | | | 2,517,793 | |
| | Life & Health Insurance (2.2%) | |
| | 28,500 | | | Sun Life Financial, Inc. | | | 919,410 | |
| | | | | | | | |
| | Mortgage REIT’s (1.4%) | |
| | 61,000 | | | Annaly Capital Management, Inc., REIT | | | 602,070 | |
| | | | | | | | |
| | Movies & Entertainment (3.8%) | |
| | 10,100 | | | Time Warner, Inc. | | | 694,375 | |
| | 21,100 | | | Viacom, Inc., Class B | | | 910,465 | |
| | | | | | | | |
| | | | | | | 1,604,840 | |
| | Multi-line Insurance (4.3%) | |
| | 29,600 | | | Horace Mann Educators Corp. | | | 983,312 | |
| | 24,200 | | | Kemper Corp. | | | 855,954 | |
| | | | | | | | |
| | | | | | | 1,839,266 | |
| | |
| 18 | | SCHEDULEOF INVESTMENTS |
| | | | | | | | |
| Shares or Principal Amount | | Value | |
| | | | | | | | |
| | Multi-Utilities (5.8%) | |
| | 17,900 | | | Black Hills Corp. | | $ | 739,986 | |
| | 24,800 | | | CMS Energy Corp. | | | 875,936 | |
| | 10,700 | | | DTE Energy Co. | | | 859,959 | |
| | | | | | | | |
| | | | | | | 2,475,881 | |
| | Oil & Gas Refining & Marketing (2.8%) | |
| | 18,400 | | | PBF Energy, Inc., Class A | | | 519,432 | |
| | 8,500 | | | Phillips 66 | | | 653,140 | |
| | | | | | | | |
| | | | | | | 1,172,572 | |
| | Oil & Gas Storage & Transportation (1.0%) | |
| | 13,900 | | | TransCanada Corp.(a) | | | 438,962 | |
| | | | | | | | |
| | Packaged Foods & Meats (2.1%) | |
| | 24,200 | | | B&G Foods, Inc. | | | 882,090 | |
| | | | | | | | |
| | Paper Products (1.7%) | |
| | 19,200 | | | International Paper Co. | | | 725,568 | |
| | | | | | | | |
| | Regional Banks (3.8%) | |
| | 50,100 | | | Fifth Third Bancorp | | | 947,391 | |
| | 72,100 | | | First Commonwealth Financial Corp. | | | 655,389 | |
| | | | | | | | |
| | | | | | | 1,602,780 | |
| | Residential REIT’s (1.3%) | |
| | 7,300 | | | Camden Property Trust, REIT | | | 539,470 | |
| | | | | | | | |
| | | | | | | | |
| Shares or Principal Amount | | Value | |
| | Semiconductor Equipment (1.6%) | |
| | 45,800 | | | Applied Materials, Inc. | | $ | 672,802 | |
| | | | | | | | |
| | Semiconductors (2.1%) | |
| | 18,000 | | | Texas Instruments, Inc. | | | 891,360 | |
| | | | | | | | |
| | Soft Drinks (1.9%) | |
| | 10,200 | | | Dr. Pepper Snapple Group, Inc. | | | 806,310 | |
| | | | | | | | |
| Technology Hardware, Storage &
Peripherals (3.2%) |
|
| | 22,700 | | | Lexmark International, Inc. | | | 657,846 | |
| | 9,000 | | | Western Digital Corp. | | | 714,960 | |
| | | | | | | | |
| | | | | | | 1,372,806 | |
| | Thrifts & Mortgage Finance (1.8%) | |
| | 44,600 | | | Dime Community Bancshares, Inc. | | | 753,740 | |
| | | | | | | | |
| | Tobacco (3.6%) | |
| | 13,700 | | | Altria Group, Inc. | | | 745,280 | |
| | 17,400 | | | Reynolds American, Inc. | | | 770,298 | |
| | | | | | | | |
| | | | | | | 1,515,578 | |
| | | | | | | | |
| Total Common Stocks
(Cost $39,183,133) | | | 36,322,441 | |
| | | | | | | | | | | | | | | | |
| Shares or Principal Amount | | Interest
Rate | | | Maturity
Date | | | Value | |
| | Corporate Bonds (6.5%) | |
| | Basic Materials (0.9%) | | | | | |
| $ | 400,000 | | | Alcoa, Inc. | | | 5.13 | % | | | 10/01/24 | | | $ | 381,000 | |
| | | | | | | | | | | | | | | | |
| | Consumer, Cyclical (2.1%) | | | | | |
| | 750,000 | | | Darden Restaurants, Inc. | | | 7.05 | % | | | 10/15/37 | | | | 896,265 | |
| | | | | | | | | | | | | | | | |
| | Energy (2.1%) | | | | | |
| | 500,000 | | | California Resources Corp.(a) | | | 6.00 | % | | | 11/15/24 | | | | 297,813 | |
| | 500,000 | | | Chesapeake Energy Corp.(a) | | | 5.75 | % | | | 03/15/23 | | | | 326,093 | |
| | 500,000 | | | Denbury Resources, Inc. | | | 4.63 | % | | | 07/15/23 | | | | 270,000 | |
| | | | | | | | | | | | | | | | |
| | | | | | | | | | | | | | | 893,906 | |
| | Financial (1.4%) | | | | | |
| | 500,000 | | | Ironshore Holdings US, Inc.(b) | | | 8.50 | % | | | 05/15/20 | | | | 587,164 | |
| | | | | | | | | | | | | | | | |
| Total Corporate Bonds
(Cost $3,263,123) |
| | | 2,758,335 | |
| | | | |
| SCHEDULEOF INVESTMENTS | | | 19 | |
| | | | | | | | | | | | |
| | | |
| Shares or Principal Amount | | | | | | Value | |
| | | | | | | | | | | | |
| | Preferred Stocks (2.7%) | | | | |
| | Consumer Finance (1.2%) | |
| | 19,600 | | | Discover Financial Services, Series B(a) | | | | | | $ | 505,876 | |
| | | | | | | | | | | | |
| | Diversified Banks (1.0%) | |
| | 17,314 | | | RBS Capital Funding Trust V, Series E | | | | | | | 421,942 | |
| | | | | | | | | | | | |
| | Office REIT’s (0.5%) | |
| | 8,329 | | | Gramercy Property Trust, Inc., Series B | | | | | | | 212,390 | |
| | | | | | | | | | | | |
| Total Preferred Stocks
(Cost $1,146,211) | | | 1,140,208 | |
| | Convertible Preferred Stock (1.9%) | |
| | Diversified Banks (1.9%) | |
| | 700 | | | Wells Fargo & Co., Series L | | | | | | | 817,600 | |
| | | | | | | | | | | | |
| Total Convertible Preferred Stocks
(Cost $828,278) | | | 817,600 | |
| | Collateral for Securities on Loan (11.2%) | |
| | 4,775,526 | | | State Street Navigator Prime Portfolio, 0.20% | | | | | | | 4,775,526 | |
| | | | | | | | | | | | |
| Total Collateral for Securities on Loan
(Cost $4,775,526) | | | 4,775,526 | |
| | Short-Term Investments (2.3%) | |
| $ | 986,907 | | | State Street Euro Dollar Time Deposit (USD), 0.01%, 10/01/15 | | | | | | | 986,907 | |
| | | | | | | | | | | | |
| Total Short-Term Investments
(Cost $986,907) | | | 986,907 | |
| Total Investments 109.8%
(Cost $50,183,178) | | | 46,801,017 | |
| | Liabilities Less Other Assets (9.8)% | | | (4,158,039 | ) |
| | | | | | | | | | | | |
| | Net Assets 100.0% | | $ | 42,642,978 | |
| | | | | | | | | | | | |
The accompanying notes are an integral part of the financial statements.
| (a) | All or a portion of the security was on loan as of September 30, 2015. |
| (b) | 144A - Exempt from registration under Rule 144A of the Securities Act of 1933. These securities may be resold in transactions exempt from registration, typically only to qualified institutional buyers. Unless otherwise indicated, these securities are not considered to be illiquid. |
| ADR | American Depositary Receipt |
| REIT | Real Estate Investment Trust |
| | |
| 20 | | SCHEDULEOF INVESTMENTS |
| | |
MANAGEMENT OVERVIEW (UNAUDITED) ICON FUND | | |
| Q. | How did the Fund perform relative to its benchmarks? |
| A. | The ICON Fund (the Fund) Class S returned -4.75% for the fiscal year ending September 30, 2015, while its benchmark, the S&P 1500 Index, returned -.30%. Total returns for other periods and additional Class shares as of September 30, 2015, appear in the subsequent pages of this Fund’s Management Overview. |
| Q. | What primary factors were behind the Fund’s relative performance? |
| A. | The Fund outperformed its benchmark over the first six months of the fiscal year due in large part to overweight positions in the Consumer Discretionary and Health Care sectors. Further, an underweight position in the Energy sector, before selling it entirely in late January, as well as having no position in the Utilities sector contributed to Fund outperformance during the first six months. From late June 2015 through August 14, 2015, the day before the steep, sudden 10% drop over six trading days began, the Fund sold positions that had reached ICON’s valuation sell threshold. By August 14, the Fund had accumulated 7.4% cash. In addition, from March 31, 2015 to August 14, 2015, the Fund had gone from a 0% to a 6.2% position in the Utilities sector and from a 13.5% to a 30.7% position in the Financial sector. Despite these two sectors being known for low volatility, as measured by their below average betas, and being the most underpriced sectors according to ICON’s valuation model, Utilities and Financials dropped along with the broad market and did not provide the protection we expected. The Fund dropped more than the overall market and gave back the lead it had accumulated the first six months of the fiscal year. |
| Q. | How did the Fund’s composition affect performance? |
| A. | The five biggest contributors to Fund performance were Skyworks Solutions, Home Depot, Mohawk Industries, Perrigo and Emergent Bio-Solutions. The leader is in the Information Technology sector, the next two are in the Consumer Discretionary sector and the last two are part of the Health Care sector. |
The five largest detractors from Fund performance were Viacom, Jazz Pharmaceuticals, Applied Materials, Lumber Liquidators and Methode Electronics. All were sold except Jazz Pharmaceuticals which remains in the portfolio. Lumber Liquidators stands out as the most notorious as the company was accused on national television of selling flooring products made from illegal chemicals.
| Q. | What is your investment outlook for the overall market? |
| A. | Over the last year, investor sentiment has been influenced by various situations including an expected rise in interest rates, a changing of the shape of the yield curve, lower oil and commodity prices, and the Energy sector’s performance dragging down earnings across all companies. Many moves in stock prices were not based on value but rather were the result of investor reaction to, and expectations for, the situations mentioned above. Some stocks we viewed as cheap didn’t rise while some we saw as over-priced moved higher. Over the long run we expect stocks to respond to value and therefore believe the market will move higher over the next year about in line with its historic average. We do not see any of the behaviors and signs we believe are typical of market peaks and expect the six-year-old bull market to resume. |
ICON Fund
Sector Composition
September 30, 2015
| | | | |
Financial | | | 37.1% | |
Consumer Discretionary | | | 23.3% | |
Health Care | | | 14.7% | |
Materials | | | 7.7% | |
Information Technology | | | 7.3% | |
Utilities | | | 6.5% | |
Industrials | | | 2.1% | |
| | | | |
| | | 98.7% | |
| | | | |
Percentages are based upon common stocks as a percentage of net assets.
ICON Fund
Industry Composition
September 30, 2015
| | | | |
Regional Banks | | | 13.2% | |
Biotechnology | | | 7.8% | |
Multi-line Insurance | | | 5.6% | |
Diversified Banks | | | 5.5% | |
Home Improvement Retail | | | 5.3% | |
Semiconductors | | | 4.6% | |
Specialty Chemicals | | | 4.6% | |
Multi-Utilities | | | 4.5% | |
Pharmaceuticals | | | 3.7% | |
Automobile Manufacturers | | | 3.4% | |
Consumer Finance | | | 3.4% | |
Home Furnishings | | | 3.3% | |
Health Care Distributors | | | 3.2% | |
Leisure Products | | | 3.2% | |
| | | | |
Life & Health Insurance | | | 3.2% | |
Construction Materials | | | 3.1% | |
Electronic Components | | | 2.7% | |
Real Estate Services | | | 2.7% | |
Hotels, Resorts & Cruise Lines | | | 2.5% | |
Asset Management & Custody Banks | | | 2.4% | |
Household Appliances | | | 2.3% | |
Railroads | | | 2.1% | |
Electric Utilities | | | 2.0% | |
Tires & Rubber | | | 2.0% | |
Auto Parts & Equipment | | | 1.3% | |
Investment Banking & Brokerage | | | 1.1% | |
| | | | |
| | | 98.7% | |
| | | | |
Percentages are based upon common stocks as a percentage of net assets.
ICON Fund
Average Annual Total Return
as of September 30, 2015
| | | | | | | | | | | | | | | | | | | | | | | | | | | | |
| | | Inception
Date | | | 1 Year | | | 5 Years | | | 10 Years | | | Since
Inception | | | Gross
Expense
Ratio* | | | Net
Expense
Ratio* | |
ICON Fund - Class S | | | 5/6/04 | | | | -4.75% | | | | 9.02% | | | | 1.30% | | | | 3.15% | | | | 1.10% | | | | 1.10% | |
ICON Fund - Class C | | | 11/28/00 | | | | -5.86% | | | | 8.17% | | | | 0.54% | | | | 2.69% | | | | 2.26% | | | | 2.25% | |
ICON Fund - Class A | | | 5/31/06 | | | | -5.13% | | | | 8.74% | | | | N/A | | | | -0.10% | | | | 1.56% | | | | 1.50% | |
ICON Fund - Class A (including maximum sales charge of 5.75%) | | | 5/31/06 | | | | -10.56% | | | | 7.46% | | | | N/A | | | | -0.73% | | | | 1.56% | | | | 1.50% | |
S&P Composite 1500 Index | | | | | | | -0.30% | | | | 13.34% | | | | 6.95% | | | | 4.98% | | | | N/A | | | | N/A | |
Past performance is not a guarantee of future results. Information about these performance results and the comparative indexes can be found in the About This Report section. The Since Inception performance results for Class C shares include returns for certain time periods that were restarted as of June 8, 2004.
| * | Please see the most recent prospectus for details. |
Class C total returns exclude applicable sales charges. If sales charges were included returns would be lower.
ICON Fund
Value of a $10,000 Investment
through September 30, 2015
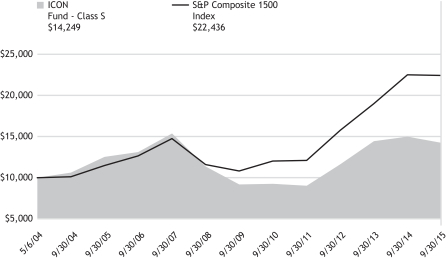
Past performance is not a guarantee of future results. The above graph compares a $10,000 investment made in the ICON Fund’s Class S shares on the Class’ inception date of 5/6/04 to a $10,000 investment made in an unmanaged securities index on that date. Performance for the ICON Fund’s other share classes will vary due to differences in charges and expenses. The ICON Fund’s performance in this chart and the performance table assumes the reinvestment of dividends and capital gain distributions but does not reflect the deduction of taxes that a shareholder would pay on Fund distributions or on the redemption of Fund shares.
ICON FUND
SCHEDULEOF INVESTMENTS
SEPTEMBER 30, 2015
| | | | | | | | |
| Shares or Principal Amount | | Value | |
| | | | | | | | |
| | Common Stocks (98.7%) | | | | |
| | Asset Management & Custody Banks (2.4%) | |
| | 94,900 | | | Janus Capital Group, Inc. | | $ | 1,290,640 | |
| | | | | | | | |
| | Auto Parts & Equipment (1.3%) | |
| | 16,900 | | | BorgWarner, Inc. | | | 702,871 | |
| | | | | | | | |
| | Automobile Manufacturers (3.4%) | |
| | 36,000 | | | Thor Industries, Inc. | | | 1,864,800 | |
| | | | | | | | |
| | Biotechnology (7.8%) | | | | |
| | 3,900 | | | Biogen, Inc.† | | | 1,138,059 | |
| | 28,900 | | | Celgene Corp.† | | | 3,126,113 | |
| | | | | | | | |
| | | | | | | 4,264,172 | |
| | Construction Materials (3.1%) | | | | |
| | 11,100 | | | Martin Marietta Materials, Inc. | | | 1,686,645 | |
| | | | | | | | |
| | Consumer Finance (3.4%) | | | | |
| | 50,800 | | | Encore Capital Group, Inc.†(a) | | | 1,879,600 | |
| | | | | | | | |
| | Diversified Banks (5.5%) | | | | |
| | 190,600 | | | Bank of America Corp. | | | 2,969,548 | |
| | | | | | | | |
| | Electric Utilities (2.0%) | | | | |
| | 39,500 | | | OGE Energy Corp. | | | 1,080,720 | |
| | | | | | | | |
| | Electronic Components (2.7%) | | | | |
| | 27,300 | | | Rogers Corp.† | | | 1,451,814 | |
| | | | | | | | |
| | Health Care Distributors (3.2%) | |
| | 9,300 | | | McKesson Corp. | | | 1,720,779 | |
| | | | | | | | |
| | Home Furnishings (3.3%) | | | | |
| | 9,800 | | | Mohawk Industries, Inc.† | | | 1,781,542 | |
| | | | | | | | |
| | Home Improvement Retail (5.3%) | |
| | 25,200 | | | Home Depot, Inc. | | | 2,910,348 | |
| | | | | | | | |
| | Hotels, Resorts & Cruise Lines (2.5%) | |
| | 18,700 | | | Wyndham Worldwide Corp. | | | 1,344,530 | |
| | | | | | | | |
| | | | | | | | |
| Shares or Principal Amount | | Value | |
| | | | | | | | |
| | Household Appliances (2.3%) | | | | |
| | 8,600 | | | Whirlpool Corp. | | $ | 1,266,436 | |
| | | | | | | | |
| | Investment Banking & Brokerage (1.1%) | |
| | 22,500 | | | E*TRADE Financial Corp.† | | | 592,425 | |
| | | | | | | | |
| | Leisure Products (3.2%) | | | | |
| | 14,400 | | | Polaris Industries, Inc. | | | 1,726,128 | |
| | | | | | | | |
| | Life & Health Insurance (3.2%) | |
| | 91,700 | | | CNO Financial Group, Inc. | | | 1,724,877 | |
| | | | | | | | |
| | Multi-line Insurance (5.6%) | | | | |
| | 19,000 | | | American International Group, Inc. | | | 1,079,580 | |
| | 55,800 | | | Kemper Corp. | | | 1,973,646 | |
| | | | | | | | |
| | | | | | | 3,053,226 | |
| | Multi-Utilities (4.5%) | | | | |
| | 63,800 | | | CenterPoint Energy, Inc. | | | 1,150,952 | |
| | 36,800 | | | CMS Energy Corp. | | | 1,299,776 | |
| | | | | | | | |
| | | | | | | 2,450,728 | |
| | Pharmaceuticals (3.7%) | | | | |
| | 15,300 | | | Jazz Pharmaceuticals PLC† | | | 2,031,993 | |
| | | | | | | | |
| | Railroads (2.1%) | | | | |
| | 42,800 | | | CSX Corp. | | | 1,151,320 | |
| | | | | | | | |
| | Real Estate Services (2.7%) | | | | |
| | 46,500 | | | CBRE Group, Inc., Class A† | | | 1,488,000 | |
| | | | | | | | |
| | Regional Banks (13.2%) | | | | |
| | 92,300 | | | Fifth Third Bancorp | | | 1,745,393 | |
| | 183,700 | | | First Commonwealth Financial Corp. | | | 1,669,833 | |
| | 18,300 | | | Signature Bank† | | | 2,517,348 | |
| | 11,000 | | | SVB Financial Group† | | | 1,270,940 | |
| | | | | | | | |
| | | | | | | 7,203,514 | |
| | | | |
| SCHEDULEOF INVESTMENTS | | | 25 | |
| | | | | | | | |
| Shares or Principal Amount | | Value | |
| | | | | | | | |
| | Semiconductors (4.6%) | | | | |
| | 29,500 | | | Skyworks Solutions, Inc. | | $ | 2,484,195 | |
| | | | | | | | |
| | Specialty Chemicals (4.6%) | | | | |
| | 24,800 | | | Ashland, Inc. | | | 2,495,376 | |
| | | | | | | | |
| | Tires & Rubber (2.0%) | | | | |
| | 37,800 | | | Goodyear Tire & Rubber Co. | | | 1,108,674 | |
| | | | | | | | |
| Total Common Stocks
(Cost $53,901,021) | | | 53,724,901 | |
| | Collateral for Securities on Loan (3.5%) | |
| | 1,930,400 | | | State Street Navigator Prime Portfolio, 0.20% | | | 1,930,400 | |
| | | | | | | | |
| Total Collateral for Securities
on Loan
(Cost $1,930,400) | | | 1,930,400 | |
| | | | | | | | |
| Shares or Principal Amount | | Value | |
| | | | | | | | |
| | Short-Term Investments (1.4%) | |
| $ | 756,401 | | | State Street Euro Dollar Time Deposit (USD), 0.01%, 10/01/15 | | $ | 756,401 | |
| | | | | | | | |
| Total Short-Term Investments
(Cost $756,401) | | | 756,401 | |
| Total Investments 103.6%
(Cost $56,587,822) | | | 56,411,702 | |
| Liabilities Less Other Assets
(3.6)% | | | (1,977,321 | ) |
| | | | | | | | |
| | Net Assets 100.0% | | $ | 54,434,381 | |
| | | | | | | | |
The accompanying notes are an integral part of the financial statements.
| † | Non-income producing security. |
| (a) | All or a portion of the security was on loan as of September 30, 2015. |
| | |
| 26 | | SCHEDULEOF INVESTMENTS |
| | |
MANAGEMENT OVERVIEW (UNAUDITED) ICON LONG/SHORT FUND | | |
| Q. | How did the Fund perform relative to its benchmarks? |
| A. | The ICON Long/Short Fund (the Fund) Class S returned -.11% for the fiscal year ending September 30, 2015, while its benchmark, the S&P 1500 Index, returned -.30%. Total returns for other periods and additional Class shares as of September 30, 2015, appear in the subsequent pages of this Fund’s Management Overview. |
| Q. | What primary factors were behind the Fund’s relative performance? |
| A. | The Fund outperformed its benchmark over the first ten months of the fiscal year due in large part to overweight positions in the Consumer Discretionary and Health Care sectors. Further, an underweight position in the Energy sector, before selling it entirely in late January, as well as having no position in the Utilities sector contributed to Fund outperformance during the first nine months. From late June 2015 through August 14, 2015, the day before the steep, sudden 10% drop over six trading days began, the Fund sold positions that had reached ICON’s valuation sell threshold. By August 14, the Fund had accumulated 6.8% cash and had a 2.37% short position. In addition, from March 31, 2015 to August 14, 2015, the Fund had gone from a 0% to a 4.0% position in the Utilities sector and from a 13.9% to a 32.7% position in the Financial sector. Despite these two sectors being known for low volatility, as measured by their below average betas, and being the most underpriced sectors according to ICON’s valuation model, Utilities and Financials dropped along with the broad market and did not provide the protection we expected. The Fund dropped more than the overall market and gave back most of the lead it had accumulated the first ten months of the fiscal year. |
| Q. | How did the Fund’s composition affect performance? |
| A. | The five biggest contributors to Fund performance were Ligand Pharmaceuticals, Skyworks Solutions, Tractor Supply Company, Perrigo and Home Depot. Tractor Supply Company and Perrigo were sold for meeting our value-based sell threshold. The other three remain in the portfolio. |
The five largest detractors from Fund performance were Lumber Liquidators, Methode Electronics, Applied Materials, Jazz Pharmaceuticals, and McKesson. The first three were sold while Jazz
Pharmaceuticals and McKesson, both from the Health Care sector, remain in the portfolio. Lumber Liquidators stands out as the most notorious as the company was accused on national television of selling flooring products made from illegal chemicals.
| Q. | What is your investment outlook for the overall market? |
| A. | Over the last year, investor sentiment has been influenced by various situations including an expected rise in interest rates, a changing of the shape of the yield curve, lower oil and commodity prices, and the Energy sector’s performance dragging down earnings across all companies. Many moves in stock prices were not based on value but rather were the result of investor reaction to, and expectations for, the situations mentioned above. Some stocks we viewed as cheap didn’t rise while some we saw as over-priced moved higher. Over the long run we expect stocks to respond to value and therefore believe the market will move higher over the next year about in line with its historic average. We do not see any of the behaviors and signs we believe are typical of market peaks and expect the six-year-old bull market to resume. |
ICON Long/Short Fund
Sector Composition
September 30, 2015
| | | | |
Financial | | | 37.1% | |
Consumer Discretionary | | | 19.8% | |
Health Care | | | 17.0% | |
Information Technology | | | 10.7% | |
Materials | | | 6.3% | |
Utilities | | | 6.3% | |
Industrials | | | 1.7% | |
| | | | |
| | | 98.9% | |
| | | | |
Percentages are based upon common stocks as a percentage of net assets.
ICON Long/Short Fund
Industry Composition
September 30, 2015
| | | | |
Regional Banks | | | 12.3% | |
Biotechnology | | | 10.2% | |
Multi-line Insurance | | | 5.4% | |
Diversified Banks | | | 5.1% | |
Home Improvement Retail | | | 4.5% | |
Multi-Utilities | | | 4.3% | |
Semiconductors | | | 4.1% | |
Specialty Chemicals | | | 3.9% | |
Data Processing & Outsourced Services | | | 3.4% | |
Health Care Distributors | | | 3.4% | |
Pharmaceuticals | | | 3.4% | |
Consumer Finance | | | 3.3% | |
Electronic Components | | | 3.2% | |
Home Furnishings | | | 3.2% | |
Life & Health Insurance | | | 3.2% | |
| | | | |
Automobile Manufacturers | | | 2.7% | |
Asset Management & Custody Banks | | | 2.6% | |
Leisure Products | | | 2.6% | |
Hotels, Resorts & Cruise Lines | | | 2.5% | |
Construction Materials | | | 2.4% | |
Household Appliances | | | 2.3% | |
Real Estate Services | | | 2.1% | |
Electric Utilities | | | 2.0% | |
Insurance Brokers | | | 2.0% | |
Tires & Rubber | | | 2.0% | |
Railroads | | | 1.7% | |
Investment Banking & Brokerage | | | 1.1% | |
| | | | |
| | | 98.9% | |
| | | | |
Percentages are based upon common stocks as a percentage of net assets.
ICON Long/Short Fund
Average Annual Total Return
as of September 30, 2015
| | | | | | | | | | | | | | | | | | | | | | | | | | | | |
| | | Inception
Date | | | 1 Year | | | 5 Years | | | 10 Years | | | Since
Inception | | | Gross
Expense
Ratio* | | | Net
Expense
Ratio* | |
ICON Long/Short Fund - Class S | | | 5/6/04 | | | | -0.11% | | | | 9.10% | | | | 2.54% | | | | 3.76% | | | | 1.45% | | | | 1.32% | |
ICON Long/Short Fund - Class C | | | 10/17/02 | | | | -1.19% | | | | 7.94% | | | | 1.53% | | | | 4.61% | | | | 2.57% | | | | 2.38% | |
ICON Long/Short Fund - Class A | | | 5/31/06 | | | | -0.44% | | | | 8.76% | | | | N/A | | | | 1.45% | | | | 1.81% | | | | 1.63% | |
ICON Long/Short Fund - Class A (including maximum sales charge of 5.75%) | | | 5/31/06 | | | | -6.18% | | | | 7.47% | | | | N/A | | | | 0.81% | | | | 1.81% | | | | 1.63% | |
S&P Composite 1500 Index | | | | | | | -0.30% | | | | 13.34% | | | | 6.95% | | | | 8.72% | | | | N/A | | | | N/A | |
Past performance is not a guarantee of future results. Information about these performance results and the comparative indexes can be found in the About This Report section. The Adviser has agreed to limit certain Fund expenses; without these limitations, returns would have been lower. The limitation provisions may be terminated in the future.
| * | Please see the most recent prospectus for details. |
Class C total returns exclude applicable sales charges. If sales charges were included returns would be lower.
ICON Long/Short Fund
Value of a $10,000 Investment
through September 30, 2015
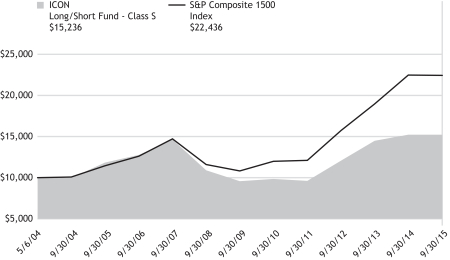
Past performance is not a guarantee of future results. The above graph compares a $10,000 investment made in the Long/Short Fund’s Class S shares on the Class’ inception date of 5/6/04 to a $10,000 investment made in an unmanaged securities index on that date. Performance for the Long/Short Fund’s other share classes will vary due to differences in charges and expenses. The Long/Short Fund’s performance in this chart and the performance table assumes the reinvestment of dividends and capital gain distributions but does not reflect the deduction of taxes that a shareholder would pay on Fund distributions or on the redemption of Fund shares.
ICON LONG/SHORT FUND
SCHEDULEOF INVESTMENTS
SEPTEMBER 30, 2015
| | | | | | | | |
| Shares or Principal Amount | | Value | |
| | | | | | | | |
| | Common Stocks (98.9%) | | | | |
| | Asset Management & Custody Banks (2.6%) | |
| | 61,800 | | | Janus Capital Group, Inc. | | $ | 840,480 | |
| | | | | | | | |
| | Automobile Manufacturers (2.7%) | |
| | 17,000 | | | Thor Industries, Inc. | | | 880,600 | |
| | | | | | | | |
| | Biotechnology (10.2%) | | | | |
| | 2,300 | | | Biogen, Inc.† | | | 671,163 | |
| | 13,500 | | | Celgene Corp.† | | | 1,460,295 | |
| | 13,900 | | | Ligand Pharmaceuticals, Inc.†(a) | | | 1,190,535 | |
| | | | | | | | |
| | | | | | | 3,321,993 | |
| | Construction Materials (2.4%) | | | | |
| | 5,200 | | | Martin Marietta Materials, Inc. | | | 790,140 | |
| | | | | | | | |
| | Consumer Finance (3.3%) | | | | |
| | 29,400 | | | Encore Capital Group, Inc.†(a) | | | 1,087,800 | |
| | | | | | | | |
| Data Processing & Outsourced
Services (3.4%) |
|
| | 12,300 | | | Mastercard, Inc., Class A | | | 1,108,476 | |
| | | | | | | | |
| | Diversified Banks (5.1%) | | | | |
| | 107,100 | | | Bank of America Corp. | | | 1,668,618 | |
| | | | | | | | |
| | Electric Utilities (2.0%) | | | | |
| | 23,700 | | | OGE Energy Corp. | | | 648,432 | |
| | | | | | | | |
| | Electronic Components (3.2%) | | | | |
| | 19,700 | | | Rogers Corp.† | | | 1,047,646 | |
| | | | | | | | |
| | Health Care Distributors (3.4%) | |
| | 6,000 | | | McKesson Corp. | | | 1,110,180 | |
| | | | | | | | |
| | Home Furnishings (3.2%) | | | | |
| | 5,800 | | | Mohawk Industries, Inc.† | | | 1,054,382 | |
| | | | | | | | |
| | Home Improvement Retail (4.5%) | |
| | 12,800 | | | Home Depot, Inc. | | | 1,478,272 | |
| | | | | | | | |
| | | | | | | | |
| Shares or Principal Amount | | Value | |
| | | | | | | | |
| | Hotels, Resorts & Cruise Lines (2.5%) | |
| | 11,500 | | | Wyndham Worldwide Corp. | | $ | 826,850 | |
| | | | | | | | |
| | Household Appliances (2.3%) | | | | |
| | 5,100 | | | Whirlpool Corp. | | | 751,026 | |
| | | | | | | | |
| | Insurance Brokers (2.0%) | | | | |
| | 15,500 | | | Arthur J Gallagher & Co. | | | 639,840 | |
| | | | | | | | |
| | Investment Banking & Brokerage (1.1%) | |
| | 13,500 | | | E*TRADE Financial Corp.† | | | 355,455 | |
| | | | | | | | |
| | Leisure Products (2.6%) | | | | |
| | 7,200 | | | Polaris Industries, Inc. | | | 863,064 | |
| | | | | | | | |
| | Life & Health Insurance (3.2%) | |
| | 56,300 | | | CNO Financial Group, Inc. | | | 1,059,003 | |
| | | | | | | | |
| | Multi-line Insurance (5.4%) | | | | |
| | 11,600 | | | American International Group, Inc. | | | 659,112 | |
| | 31,200 | | | Kemper Corp. | | | 1,103,544 | |
| | | | | | | | |
| | | | | | | 1,762,656 | |
| | Multi-Utilities (4.3%) | |
| | 34,600 | | | CenterPoint Energy, Inc. | | | 624,184 | |
| | 22,100 | | | CMS Energy Corp. | | | 780,572 | |
| | | | | | | | |
| | | | | | | 1,404,756 | |
| | Pharmaceuticals (3.4%) | | | | |
| | 8,400 | | | Jazz Pharmaceuticals PLC† | | | 1,115,604 | |
| | | | | | | | |
| | Railroads (1.7%) | | | | |
| | 20,400 | | | CSX Corp. | | | 548,760 | |
| | | | | | | | |
| | Real Estate Services (2.1%) | | | | |
| | 21,800 | | | CBRE Group, Inc., Class A† | | | 697,600 | |
| | | | | | | | |
| | |
| 32 | | SCHEDULEOF INVESTMENTS |
| | | | | | | | |
| Shares or Principal Amount | | Value | |
| | | | | | | | |
| | Regional Banks (12.3%) | | | | |
| | 40,300 | | | Fifth Third Bancorp | | $ | 762,073 | |
| | 112,800 | | | First Commonwealth Financial Corp. | | | 1,025,352 | |
| | 10,600 | | | Signature Bank† | | | 1,458,136 | |
| | 6,600 | | | SVB Financial Group† | | | 762,564 | |
| | | | | | | | |
| | | | | | | 4,008,125 | |
| | Semiconductors (4.1%) | | | | |
| | 15,700 | | | Skyworks Solutions, Inc. | | | 1,322,097 | |
| | | | | | | | |
| | Specialty Chemicals (3.9%) | | | | |
| | 12,600 | | | Ashland, Inc. | | | 1,267,812 | |
| | | | | | | | |
| | | | | | | | |
| Shares or Principal Amount | | Value | |
| | | | | | | | |
| | Tires & Rubber (2.0%) | | | | |
| | 22,700 | | | Goodyear Tire & Rubber Co. | | $ | 665,791 | |
| | | | | | | | |
| Total Common Stocks
(Cost $31,819,065) | | | 32,325,458 | |
| | Collateral for Securities on Loan (7.0%) | |
| | 2,281,325 | | | State Street Navigator Prime Portfolio, 0.20% | | | 2,281,325 | |
| | | | | | | | |
| Total Collateral for
Securities on Loan
(Cost $2,281,325) | | | 2,281,325 | |
| Total Investments 105.9%
(Cost $34,100,390) | | | 34,606,783 | |
| Liabilities Less Other
Assets (5.9)% | | | (1,924,346 | ) |
| | | | | | | | |
| | Net Assets 100.0% | | $ | 32,682,437 | |
| | | | | | | | |
The accompanying notes are an integral part of the financial statements.
| † | Non-income producing security. |
| (a) | All or a portion of the security was on loan as of September 30, 2015. |
| | | | |
| SCHEDULEOF INVESTMENTS | | | 33 | |
| | |
MANAGEMENT OVERVIEW (UNAUDITED) ICON OPPORTUNITIES FUND | | |
| Q. | How did the Fund perform relative to its benchmarks? |
| A. | The ICON Opportunities Fund (the Fund) returned 3.75% for the fiscal year ending September 30, 2015, while its benchmark, the S&P Small-Cap 600 Index, returned 3.81%. Total returns for other periods as of September 30, 2015, appear in the subsequent pages of this Fund’s Management Overview. |
| Q. | What primary factors were behind the Fund’s relative performance? |
| A. | The Fund outperformed its benchmark over the first ten months of the fiscal year due in large part to overweight positions in the Consumer Discretionary and Health Care sectors. Further, an underweight position in the Energy sector, before selling it entirely in late January, as well as having no position in the Utilities sector contributed to Fund outperformance during the first nine months. From late June 2015 through August 14, 2015, the day before the steep, sudden 10% drop over six trading days began, the Fund sold positions that had reached ICON’s valuation sell threshold. By August 14, the Fund had accumulated 8.5% cash. In addition, from March 31, 2015 to August 14, 2015, the Fund had gone from a 0% to a 6.3% position in the Utilities sector and from a 14.7% to a 23.7% position in the Financial sector. Despite these two sectors being known for low volatility, as measured by their below average betas, and being the most underpriced sectors according to ICON’s valuation model, Utilities and Financials dropped along with the broad market and did not provide the protection we expected. The Fund dropped more than the overall market and gave back the lead it had accumulated the first ten months of the fiscal year. |
| Q. | How did the Fund’s composition affect performance? |
| A. | The five biggest contributors to Fund performance were Ligand Pharmaceuticals, Cambrex, Emergent BioSolutions, Nutrisystem, and Buffalo Wild Wings. The first three are in the Health Care sector while the next two are in the Consumer Discretionary sector. |
The five largest detractors from Fund performance were Lumber Liquidators, Conn’s, Methode Electronics, Janus Capital Group, and Methanex. Lumber Liquidators stands out as the most notorious as the company was accused on national television of selling flooring products made from illegal chemicals. Conn’s stock price dropped almost 60% in
six trading days when analysts suspected the credit the company was granting customers buying appliances was resulting in growing delinquencies.
| Q. | What is your investment outlook for the overall market? |
| A. | Over the last year, investor sentiment has been influenced by various situations including an expected rise in interest rates, a changing of the shape of the yield curve, lower oil and commodity prices, and the Energy sector’s performance dragging down earnings across all companies. Many moves in stock prices were not based on value but rather were the result of investor reaction to, and expectations for, the situations mentioned above. Some stocks we viewed as cheap didn’t rise while some we saw as over-priced moved higher. Over the long run we expect stocks to respond to value and therefore believe the market will move higher over the next year about in line with its historic average. We do not see any of the behaviors and signs believe are as typical of market peaks and expect the six-year-old bull market to resume. |
ICON Opportunities Fund
Sector Composition
September 30, 2015
| | | | |
Financial | | | 29.1% | |
Consumer Discretionary | | | 15.2% | |
Health Care | | | 14.6% | |
Information Technology | | | 14.4% | |
Utilities | | | 10.3% | |
Industrials | | | 8.7% | |
Materials | | | 3.4% | |
Leisure and Consumer Staples | | | 2.1% | |
| | | | |
| | | 97.8% | |
| | | | |
Percentages are based upon common stocks as a percentage of net assets.
ICON Opportunities Fund
Industry Composition
September 30, 2015
| | | | |
Electric Utilities | | | 6.9% | |
Multi-line Insurance | | | 6.4% | |
Regional Banks | | | 6.4% | |
Consumer Finance | | | 6.2% | |
Electronic Equipment & Instruments | | | 6.2% | |
Pharmaceuticals | | | 5.5% | |
Asset Management & Custody Banks | | | 4.7% | |
Internet Retail | | | 4.6% | |
Automobile Manufacturers | | | 4.4% | |
Internet Software & Services | | | 3.7% | |
Biotechnology | | | 3.6% | |
Life Sciences Tools & Services | | | 3.6% | |
Construction & Farm Machinery & Heavy Trucks | | | 3.5% | |
Paper Packaging | | | 3.4% | |
| | | | |
Life & Health Insurance | | | 3.2% | |
Aerospace & Defense | | | 3.1% | |
Semiconductors | | | 2.5% | |
Gas Utilities | | | 2.3% | |
Auto Parts & Equipment | | | 2.2% | |
Insurance Brokers | | | 2.2% | |
Building Products | | | 2.1% | |
Packaged Foods & Meats | | | 2.1% | |
Electronic Components | | | 2.0% | |
Housewares & Specialties | | | 2.0% | |
Leisure Products | | | 2.0% | |
Health Care Facilities | | | 1.9% | |
Water Utilities | | | 1.1% | |
| | | | |
| | | 97.8% | |
| | | | |
Percentages are based upon common stocks as a percentage of net assets.
ICON Opportunities Fund
Average Annual Total Return
as of September 30, 2015
| | | | | | | | | | | | | | | | | | | | |
| | | Inception
Date | | | 1 Year | | | Since
Inception | | | Gross
Expense
Ratio* | | | Net
Expense
Ratio* | |
ICON Opportunities Fund | | | 9/28/12 | | | | 3.75% | | | | 11.31% | | | | 2.44% | | | | 1.50% | |
S&P Small Cap Total Return | | | | | | | 3.81% | | | | 13.03% | | | | N/A | | | | N/A | |
Past performance is not a guarantee of future results. Information about these performance results and the comparative indexes can be found in the About This Report section. The Adviser has agreed to limit certain Fund expenses; without these limitations, returns would have been lower. The limitation provisions may be terminated in the future.
| * | Please see the most recent prospectus for details. |
ICON Opportunities Fund
Value of a $10,000 Investment
through September 30, 2015
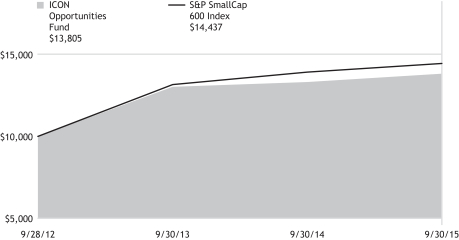
Past performance is not a guarantee of future results. The above graph compares a $10,000 investment made in the Opportunities Fund on the inception date of 9/28/12 to a $10,000 investment made in an unmanaged securities index on that date. The Opportunities Fund’s performance in this chart and the performance table assumes the reinvestment of dividends and capital gain distributions but does not reflect the deduction of taxes that a shareholder would pay on Fund distributions or on the redemption of Fund shares.
ICON OPPORTUNITIES FUND
SCHEDULEOF INVESTMENTS
SEPTEMBER 30, 2015
| | | | | | | | |
| Shares or Principal Amount | | Value | |
| | | | | | | | |
| | Common Stocks (97.8%) | |
| | Aerospace & Defense (3.1%) | |
| | 5,449 | | | Curtiss-Wright Corp. | | $ | 340,126 | |
| | | | | | | | |
| | Asset Management & Custody Banks (4.7%) | |
| | 23,000 | | | Janus Capital Group, Inc. | | | 312,800 | |
| | 12,600 | | | WisdomTree Investments, Inc. | | | 203,238 | |
| | | | | | | | |
| | | | 516,038 | |
| | Auto Parts & Equipment (2.2%) | |
| | 4,800 | | | Dorman Products, Inc.† | | | 244,272 | |
| | | | | | | | |
| | Automobile Manufacturers (4.4%) | |
| | 9,401 | | | Thor Industries, Inc. | | | 486,972 | |
| | | | | | | | |
| | Biotechnology (3.6%) | |
| | 4,675 | | | Ligand Pharmaceuticals, Inc.† | | | 400,414 | |
| | | | | | | | |
| | Building Products (2.1%) | |
| | 12,500 | | | Quanex Building Products Corp. | | | 227,125 | |
| | | | | | | | |
| Construction & Farm Machinery & Heavy
Trucks (3.5%) |
|
| | 36,600 | | | Meritor, Inc.† | | | 389,058 | |
| | | | | | | | |
| | Consumer Finance (6.2%) | |
| | 10,773 | | | Encore Capital Group, Inc.† | | | 398,601 | |
| | 5,453 | | | PRA Group, Inc.† | | | 288,573 | |
| | | | | | | | |
| | | | 687,174 | |
| | Electric Utilities (6.9%) | |
| | 5,257 | | | ALLETE, Inc. | | | 265,426 | |
| | 8,900 | | | Otter Tail Corp. | | | 231,934 | |
| | 5,300 | | | UIL Holdings Corp. | | | 266,431 | |
| | | | | | | | |
| | | | 763,791 | |
| | Electronic Components (2.0%) | |
| | 4,160 | | | Rogers Corp.† | | | 221,229 | |
| | | | | | | | |
| | | | | | | | |
| Shares or Principal Amount | | Value | |
| | | | | | | | |
| | Electronic Equipment & Instruments (6.2%) | |
| | 6,294 | | | Coherent, Inc.† | | $ | 344,282 | |
| | 4,665 | | | FEI Co. | | | 340,731 | |
| | | | | | | | |
| | | | 685,013 | |
| | Gas Utilities (2.3%) | |
| | 4,400 | | | Southwest Gas Corp. | | | 256,608 | |
| | | | | | | | |
| | Health Care Facilities (1.9%) | |
| | 3,100 | | | Acadia Healthcare Co., Inc.† | | | 205,437 | |
| | | | | | | | |
| | Housewares & Specialties (2.0%) | |
| | 6,900 | | | Libbey, Inc. | | | 225,009 | |
| | | | | | | | |
| | Insurance Brokers (2.2%) | |
| | 7,700 | | | Brown & Brown, Inc. | | | 238,469 | |
| | | | | | | | |
| | Internet Retail (4.6%) | |
| | 19,100 | | | Nutrisystem, Inc. | | | 506,532 | |
| | | | | | | | |
| | Internet Software & Services (3.7%) | |
| | 5,714 | | | j2 Global, Inc. | | | 404,837 | |
| | | | | | | | |
| | Leisure Products (2.0%) | |
| | 4,600 | | | Brunswick Corp. | | | 220,294 | |
| | | | | | | | |
| | Life & Health Insurance (3.2%) | |
| | 18,600 | | | CNO Financial Group, Inc. | | | 349,866 | |
| | | | | | | | |
| | Life Sciences Tools & Services (3.6%) | |
| | 10,100 | | | Cambrex Corp.† | | | 400,768 | |
| | | | | | | | |
| | Multi-line Insurance (6.4%) | |
| | 8,100 | | | Horace Mann Educators Corp. | | | 269,082 | |
| | 12,300 | | | Kemper Corp. | | | 435,051 | |
| | | | | | | | |
| | | | 704,133 | |
| | Packaged Foods & Meats (2.1%) | |
| | 20,100 | | | Landec Corp.† | | | 234,567 | |
| | | | | | | | |
| | Paper Packaging (3.4%) | |
| | 6,600 | | | Avery Dennison Corp. | | | 373,362 | |
| | | | | | | | |
| | |
| 38 | | SCHEDULEOF INVESTMENTS |
| | | | | | | | |
| Shares or Principal Amount | | Value | |
| | | | | | | | |
| | Pharmaceuticals (5.5%) | |
| | 5,425 | | | Lannett Co., Inc.† | | $ | 225,246 | |
| | 19,500 | | | Sucampo Pharmaceuticals, Inc., Class A† | | | 387,465 | |
| | | | | | | | |
| | | | 612,711 | |
| | Regional Banks (6.4%) | |
| | 40,000 | | | First Commonwealth Financial Corp. | | | 363,600 | |
| | 9,700 | | | Webster Financial Corp. | | | 345,611 | |
| | | | | | | | |
| | | | | | | 709,211 | |
| | Semiconductors (2.5%) | |
| | 8,500 | | | Microsemi Corp.† | | | 278,970 | |
| | | | | | | | |
| | | | | | | | |
| Shares or Principal Amount | | Value | |
| | | | | | | | |
| | Water Utilities (1.1%) | |
| | 4,500 | | | Aqua America, Inc. | | $ | 119,115 | |
| | | | | | | | |
| Total Common Stocks
(Cost $10,875,708) | | | 10,801,101 | |
| | Short-Term Investments (2.3%) | |
| $ | 252,380 | | | State Street Euro Dollar Time Deposit (USD), 0.01%, 10/01/15 | | | 252,380 | |
| | | | | | | | |
| Total Short-Term Investments
(Cost $252,380) | | | 252,380 | |
| Total Investments 100.1%
(Cost $11,128,088) | | | 11,053,481 | |
| Liabilities Less Other Assets
(0.1)% | | | (6,514 | ) |
| | | | | | | | |
| | Net Assets 100.0% | | $ | 11,046,967 | |
| | | | | | | | |
The accompanying notes are an integral part of the financial statements.
| † | Non-income producing security. |
| | | | |
| SCHEDULEOF INVESTMENTS | | | 39 | |
| | |
MANAGEMENT OVERVIEW (UNAUDITED) ICON RISK-MANAGED BALANCED FUND | | |
| Q. | How did the Fund perform relative to its benchmarks? |
| A. | The ICON Risk-Managed Balanced Fund (the Fund) Class S shares returned 1.35% for the fiscal year ended September 30, 2015. The S&P Composite 1500 Index returned -0.30% and the Balanced Blended Benchmark returned 0.89%. The Balanced Blended Benchmark is based on a weighting of 60% S&P Composite 1500 Index and 40% Barclays Capital U.S. Universal Index, rebalanced monthly. Total returns for other periods and additional Class shares as of September 30, 2015, appear in the subsequent pages of this Fund’s Management Overview. |
| Q. | What primary factors influenced the Fund’s relative performance during the period? |
| A. | Fiscal year 2015 was an interesting year as both equity and fixed income returns were relatively muted. However, that is not to say there was a lack of market action during the fiscal year. In fact, fiscal year 2015 saw several significant events that included a virtual repricing of nearly all types of commodity assets and times of significant market volatility in both equity and fixed income securities. |
According to our valuation methodology, we began fiscal year 2015 with an overall average value-to-price (V/P) ratio for the domestic market of 1.10, indicating the domestic market was priced approximately 10% below our estimate of fair value. Based on this outlook we positioned the Fund in a relatively neutral stance with an approximate 60% equities / 40% fixed income allocation. Additionally, we implemented a hedge strategy by both buying out-of-the-money S&P 500 put options and writing out-of-the-money S&P 500 call options in an attempt to reduce the effects of market volatility on the Fund. From the beginning of the fiscal year through the middle of October 2014, the market fell by approximately 5% as investors continued to remain skeptical about economic growth both domestic and abroad. The Fund was able to reduce downside participation during this initial downturn, only capturing approximately 60% of the equity move. As our system saw improving equity valuations, we began to increase our equity exposure to an approximate 65% equity / 35% fixed income allocation by the beginning of November 2014, and generally maintained that allocation through the end of calendar year 2014 as the equity market finished the year with a strong rally.
Entering calendar year 2015, our equity valuation model viewed the overall broad domestic market as approximately 5% below our estimate of fair value. While our return expectations were relatively muted for the overall market, our system identified opportunities in specific sectors and industries. In an attempt to take advantage of those opportunities, the Fund was slightly overweight in equities relative to the blended benchmark, with a specific focus on the Consumer Discretionary, Financials and Information Technology sectors. Relative to the fixed income portion of the benchmark, the fixed income portion of the Fund began the year with an overweight position in the corporate debt segment of the market. As value was tough to find due to tight corporate bond spreads, the Fund had a specific focus on rating crossover bonds and high yield yield-to-call paper. Overall, this strategy proved advantageous during the first month of the year as the equity market fell by about 2.87% due in large part to a combination of macro-economic concerns and a U.S. gross domestic product (GDP) slowdown. The decline in equities had many investors fleeing to the safety of U.S. Treasuries as yields on the 10-year U.S. Treasury fell from 2.17% on January 1, 2015, to 1.64% by January 31, 2015. While the underlying holdings in the Fund were generally in line with the benchmark during this sell-off, our hedging profile helped the Fund outperform the blended benchmark during this move. This bout of equity volatility provided some attractive entry points within certain sectors according to our system, and we began to increase the Fund’s equity exposure throughout the remainder of the first quarter. In addition, we loosened the hedge on the equity portion of the Fund to put it in the position to participate in the anticipated upside move. Increasing the equity exposure and loosening the hedge turned out to be a positive contribution to returns as the equity market reversed course and rallied through the end of the first quarter. Further, positive selection effect in both the equity and fixed income portion of the Fund contributed to returns during this move.
The second quarter of 2015 was relatively uneventful from a price movement standpoint although volatility returned to the market near the end of June as concerns over Greece reemerged. Over the course of the second quarter, our methodology indicated decreasing value and fewer attractive opportunities in the equity market, leading us to reduce our equity exposure and increase our fixed income exposure in both corporate bonds and U.S. Treasuries. Additionally, the hedge was slowly increased throughout the second quarter as stretched valuations made us wary of increased market volatility ahead. Again, positive selection effect in both the equity and fixed income portions of the Fund outperformed the benchmark for the second quarter of 2015.
Finally, the last quarter of fiscal year 2015 reintroduced volatility into the market place as concerns regarding emerging market growth and continued declines in commodity prices resulted in a rather aggressive sell-off during the last half of the quarter. Fortunately, due to low equity valuations based on our methodology, we began the quarter with a more defensive allocation at approximately 56% equities / 44% fixed income. Additionally, the Fund’s hedge profile was increased in an attempt to mitigate the effects of market volatility on the Fund. Both moves were advantageous as the Fund only captured 52% of the downside move in August 2015.
Ultimately, over fiscal year 2015, the Fund had both higher returns and reduced volatility relative to both the broad equity index and blended benchmark.
| Q. | How did the Fund’s composition affect performance? |
| A. | Focusing on the equity portion of the Fund, the largest sector contributor to performance over fiscal year 2015 was the Consumer Discretionary sector. The Fund was overweight in the sector as a whole and held equities that produced positive benchmark relative selection effect. Other sectors that contributed positively to Fund performance include Information Technology and Utilities. The Energy sector produced the largest total effect relative to the benchmark as the combination of an underweight position and outperforming equities helped relative outperformance. |
Moving to individual stock performance within the Fund, the largest contributors to performance relative to the benchmark were Delta Air Lines, Advanced Auto Parts, Signature Bank, MasterCard, and Allergan. The five largest detractors from performance relative to the benchmark were Methanex Corp, LyondellBasell Industries, Applied Materials, Discover Financial Services, and Micron Technology.
Focusing on the fixed income portion of the Fund, we remained relatively defensive over the course of the fiscal year as corporate bond spreads in both investment grade and high yield bonds were at levels that we felt were unsustainable over the long term. This led us to focus on more defensive positions such as yield-to-call paper and specific merger arbitrage spread compression opportunities. Despite some positive gains on these more defensive positions, the Fund underperformed in the corporate bond segment of the portfolio due to investments in certain high yield energy bonds that sold off as oil prices collapsed as well as a large loss in Goodman Networks which got caught up in some telecommunication weakness. The Fund performed well in the preferred share space as selections such as RBS Capital, Gramercy Property Trust, and Equity Commonwealth produced market beating returns. Lastly, the
Fund’s closed-end fund discount arbitrage investments contributed to Fund performance. Overall, during the period, the Fund’s fixed income allocation slightly underperformed the benchmark as gains in preferred shares and closed-end funds were offset by selections in corporate bonds and a lower overall duration relative to the benchmark in a declining rate environment.
| Q. | What is your investment outlook? |
| A. | Our equity valuations concluded fiscal year 2015 with an overall average V/P ratio of 1.09, giving us confidence there is room for the market to rise in the coming year. Currently, our system indicates noticeable sector discrepancy in sector opportunities with specific emphasis on the Financials, Utilities and Materials sectors. The Fund continues to maintain a more normal balanced allocation. The equity hedge has recently been reduced, targeting a beta at the upper end of our historical range and we will continue to adjust the positioning based on our value readings. In the fixed income portion of the Fund we continue to be very selective in our individual bond holdings as recent spread widening has reintroduced risk into a bond market that had been relatively quiet over the last few year. However, the recent volatility seen in the high yield segment of the market is presenting us with opportunities specifically in the Energy segment of the market although we continue to remain cautious with our individual bond selections. Additionally, we continue to see opportunity in unique structured bonds like yield-to-call extension plays, preferred securities with attractive upside profiles, and closed-end fund opportunities. As always, we look to value as our primary guide and will adjust our positioning as market conditions dictate. |
ICON Risk-Managed Balanced Fund
Sector Composition
September 30, 2015
| | | | |
Financial | | | 18.0% | |
Information Technology | | | 9.5% | |
Health Care | | | 6.9% | |
Consumer Discretionary | | | 5.9% | |
Industrials | | | 5.8% | |
Utilities | | | 4.4% | |
Leisure and Consumer Staples | | | 2.8% | |
Materials | | | 2.7% | |
Energy | | | 2.6% | |
| | | | |
| | | 58.6% | |
| | | | |
Percentages are based upon common and preferred stocks as a percentage of net assets.
ICON Risk-Managed Balanced Fund
Industry Composition
September 30, 2015
| | | | |
Diversified Banks | | | 3.9% | |
Consumer Finance | | | 3.0% | |
Data Processing & Outsourced Services | | | 2.9% | |
Internet Software & Services | | | 2.4% | |
Pharmaceuticals | | | 2.4% | |
Airlines | | | 2.0% | |
Regional Banks | | | 2.0% | |
Biotechnology | | | 1.8% | |
Multi-Utilities | | | 1.8% | |
Real Estate Services | | | 1.8% | |
Drug Retail | | | 1.7% | |
Health Care Distributors | | | 1.7% | |
Office REIT’s | | | 1.7% | |
Electric Utilities | | | 1.5% | |
Aerospace & Defense | | | 1.3% | |
Asset Management & Custody Banks | | | 1.3% | |
Gas Utilities | | | 1.2% | |
Specialty Chemicals | | | 1.2% | |
| | | | |
Electronic Manufacturing Services | | | 1.1% | |
Life & Health Insurance | | | 1.1% | |
Multi-line Insurance | | | 1.1% | |
Packaged Foods & Meats | | | 1.1% | |
Trucking | | | 1.1% | |
Auto Parts & Equipment | | | 1.0% | |
Automotive Retail | | | 1.0% | |
Health Care Facilities | | | 1.0% | |
Home Improvement Retail | | | 1.0% | |
Oil & Gas Refining & Marketing | | | 1.0% | |
Oil & Gas Storage & Transportation | | | 1.0% | |
Other Industries (each less than 1%) | | | 11.5% | |
| | | | |
| | | 58.6% | |
| | | | |
Percentages are based upon common and preferred stocks as a percentage of net assets.
ICON Risk-Managed Balanced Fund
Credit Diversification
September 30, 2015
| | | | |
Aaa | | | 6.2% | |
A2 | | | 0.5% | |
A3 | | | 2.1% | |
A- | | | 1.0% | * |
Baa1 | | | 2.5% | |
Baa2 | | | 2.8% | |
Baa3 | | | 2.3% | |
Ba1 | | | 2.0% | |
Ba2 | | | 2.1% | |
Ba3 | | | 0.6% | |
B1 | | | 1.7% | |
| | | | |
B2 | | | 0.8% | |
B3 | | | 0.6% | |
Caa1 | | | 1.0% | |
NR | | | 1.1% | |
| | | | |
| | | 27.3% | |
| | | | |
* Reflects S&P Rating of A- since a Moody’s rating is unavailable for MASTR Seasoned Security Trust 2005-1, CMO as of September 30, 2015.
Percentages are based upon U.S. Treasury obligations, collateralized mortgage obligations, corporate and foreign corporate bond investments as a percentage of net assets. Ratings based on Moody’s Investors Service, Inc.
ICON Risk-Managed Balanced Fund
Average Annual Total Return
as of September 30, 2015
| | | | | | | | | | | | | | | | | | | | | | | | | | | | |
| | | Inception
Date | | | 1 Year | | | 5 Years | | | 10 Years | | | Since
Inception | | | Gross
Expense
Ratio* | | | Net
Expense
Ratio* | |
ICON Risk-Managed Equity Fund - Class S | | | 5/6/04 | | | | 1.35% | | | | 6.48% | | | | 3.21% | | | | 3.91% | | | | 1.22% | | | | 1.20% | |
ICON Risk-Managed Equity Fund - Class C | | | 11/21/02 | | | | 0.31% | | | | 5.43% | | | | 2.15% | | | | 4.14% | | | | 2.33% | | | | 2.20% | |
ICON Risk-Managed Equity Fund - Class A | | | 5/31/06 | | | | 1.00% | | | | 6.22% | | | | N/A | | | | 3.16% | | | | 1.65% | | | | 1.45% | |
ICON Risk-Managed Equity Fund - Class A (including maximum sales charge of 5.75%) | | | 5/31/06 | | | | -4.84% | | | | 4.97% | | | | N/A | | | | 2.51% | | | | 1.65% | | | | 1.45% | |
S&P Composite 1500 Index | | | | | | | -0.30% | | | | 13.34% | | | | 6.95% | | | | 8.27% | | | | N/A | | | | N/A | |
Past performance is not a guarantee of future results. Information about these performance results and the comparative indexes can be found in the About This Report section. The Adviser has agreed to limit certain Fund expenses; without these limitations, returns would have been lower. The limitation provisions may be terminated in the future.
| * | Please see the most recent prospectus for details. |
Class C total returns exclude applicable sales charges. If sales charges were included returns would be lower.
ICON Risk-Managed Balanced Fund
Value of a $10,000 Investment
through September 30, 2015
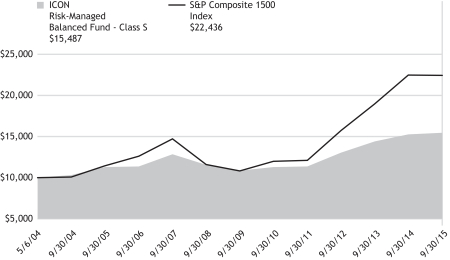
Past performance is not a guarantee of future results. The above graph compares a $10,000 investment made in the Risk-Managed Balanced Fund’s Class S shares on the Class’ inception date of 5/6/04 to a $10,000 investment made in an unmanaged securities index on that date. Performance for the Risk-Managed Balanced Fund’s other share classes will vary due to differences in charges and expenses. The Risk-Managed Balanced Fund’s performance in this chart and the performance table assumes the reinvestment of dividends and capital gain distributions but does not reflect the deduction of taxes that a shareholder would pay on Fund distributions or on the redemption of Fund shares.
ICON RISK-MANAGED BALANCED FUND
SCHEDULEOF INVESTMENTS
SEPTEMBER 30, 2015
| | | | | | | | |
| Shares or Principal Amount | | Value | |
| | | | | | | | |
| | Common Stocks (54.1%) | | | | |
| | Aerospace & Defense (1.3%) | | | | |
| | 2,973 | | | Curtiss-Wright Corp. | | $ | 185,575 | |
| | 2,000 | | | General Dynamics Corp. | | | 275,900 | |
| | 2,000 | | | Honeywell International, Inc. | | | 189,380 | |
| | | | | | | | |
| | | | 650,855 | |
| | Air Freight & Logistics (0.6%) | | | | |
| | 2,000 | | | FedEx Corp. | | | 287,960 | |
| | | | | | | | |
| | Airlines (2.0%) | | | | |
| | 19,000 | | | Delta Air Lines, Inc. | | | 852,530 | |
| | 2,000 | | | United Continental Holdings† | | | 106,100 | |
| | | | | | | | |
| | | | 958,630 | |
| | Asset Management & Custody Banks (1.3%) | |
| | 7,600 | | | Invesco, Ltd. | | | 237,348 | |
| | 19,000 | | | Janus Capital Group, Inc. | | | 258,400 | |
| | 3,500 | | | Waddell & Reed Financial, Inc., Class A | | | 121,695 | |
| | | | | | | | |
| | | | 617,443 | |
| | Auto Parts & Equipment (1.0%) | |
| | 4,600 | | | BorgWarner, Inc. | | | 191,314 | |
| | 2,200 | | | Delphi Automotive PLC | | | 167,288 | |
| | 2,500 | | | Gentherm, Inc.† | | | 112,300 | |
| | | | | | | | |
| | | | 470,902 | |
| | Automotive Retail (1.0%) | | | | |
| | 2,500 | | | Advance Auto Parts, Inc. | | | 473,825 | |
| | | | | | | | |
| | Biotechnology (1.8%) | | | | |
| | 5,000 | | | AbbVie, Inc. | | | 272,050 | |
| | 1,000 | | | Biogen, Inc.† | | | 291,810 | |
| | 3,200 | | | Gilead Sciences, Inc. | | | 314,208 | |
| | | | | | | | |
| | | | 878,068 | |
| | | | | | | | |
| Shares or Principal Amount | | Value | |
| | | | | | | | |
| | Broadcasting (0.5%) | | | | |
| | 6,200 | | | CBS Corp., Class B | | $ | 247,380 | |
| | | | | | | | |
| | Cable & Satellite (0.5%) | | | | |
| | 4,300 | | | Comcast Corp., Class A | | | 244,584 | |
| | | | | | | | |
| | Commodity Chemicals (0.2%) | | | | |
| | 2,428 | | | Methanex Corp.(a) | | | 80,512 | |
| | | | | | | | |
| | Construction Materials (0.9%) | | | | |
| | 4,500 | | | Eagle Materials, Inc. | | | 307,890 | |
| | 800 | | | Martin Marietta Materials, Inc. | | | 121,560 | |
| | | | | | | | |
| | | | 429,450 | |
| | Consumer Finance (3.0%) | | | | |
| | 15,000 | | | Ally Financial, Inc.† | | | 305,700 | |
| | 3,000 | | | American Express Co. | | | 222,390 | |
| | 10,900 | | | Discover Financial Services | | | 566,691 | |
| | 8,900 | | | Encore Capital Group, Inc.†(a) | | | 329,300 | |
| | | | | | | | |
| | | | 1,424,081 | |
| Data Processing & Outsourced
Services (2.9%) |
|
| | 1,000 | | | Alliance Data Systems Corp.† | | | 258,980 | |
| | 1,500 | | | DST Systems, Inc. | | | 157,710 | |
| | 5,000 | | | Mastercard, Inc., Class A | | | 450,600 | |
| | 7,400 | | | Visa, Inc., Class A | | | 515,484 | |
| | | | | | | | |
| | | | 1,382,774 | |
| | Diversified Banks (2.0%) | | | | |
| | 30,000 | | | Bank of America Corp. | | | 467,400 | |
| | 6,000 | | | JPMorgan Chase & Co. | | | 365,820 | |
| | 3,000 | | | Wells Fargo & Co. | | | 154,050 | |
| | | | | | | | |
| | | | 987,270 | |
| | | | |
| SCHEDULEOF INVESTMENTS | | | 47 | |
| | | | | | | | |
| Shares or Principal Amount | | Value | |
| | | | | | | | |
| | Drug Retail (1.7%) | | | | |
| | 4,200 | | | CVS Health Corp. | | $ | 405,216 | |
| | 5,000 | | | Walgreens Boots Alliance, Inc. | | | 415,500 | |
| | | | | | | | |
| | | | 820,716 | |
| | Electric Utilities (1.5%) | | | | |
| | 3,000 | | | ALLETE, Inc. | | | 151,470 | |
| | 13,000 | | | ITC Holdings Corp. | | | 433,420 | |
| | 5,000 | | | OGE Energy Corp. | | | 136,800 | |
| | | | | | | | |
| | | | 721,690 | |
| | Electronic Manufacturing Services (1.1%) | |
| | 3,793 | | | IPG Photonics Corp.† | | | 288,154 | |
| | 4,000 | | | TE Connectivity, Ltd. | | | 239,560 | |
| | | | | | | | |
| | | | 527,714 | |
| Fertilizers & Agricultural
Chemicals (0.3%) | | | | |
| | 2,000 | | | Monsanto Co. | | | 170,680 | |
| | | | | | | | |
| | Gas Utilities (1.2%) | | | | |
| | 7,271 | | | Atmos Energy Corp. | | | 423,027 | |
| | 2,600 | | | Laclede Group, Inc. | | | 141,778 | |
| | | | | | | | |
| | | | 564,805 | |
| | Health Care Distributors (1.7%) | |
| | 1,500 | | | AmerisourceBergen Corp. | | | 142,485 | |
| | 1,500 | | | Cardinal Health, Inc. | | | 115,230 | |
| | 3,000 | | | McKesson Corp. | | | 555,090 | |
| | | | | | | | |
| | | | 812,805 | |
| | Health Care Facilities (1.0%) | | | | |
| | 4,000 | | | Community Health Systems, Inc.† | | | 171,080 | |
| | 4,000 | | | HCA Holdings, Inc.† | | | 309,440 | |
| | | | | | | | |
| | | | 480,520 | |
| | Home Improvement Retail (1.0%) | |
| | 1,500 | | | Home Depot, Inc. | | | 173,235 | |
| | 4,500 | | | Lowe’s Cos., Inc. | | | 310,140 | |
| | | | | | | | |
| | | | 483,375 | |
| | Hotels, Resorts & Cruise Lines (0.9%) | |
| | 2,500 | | | Royal Caribbean Cruises, Ltd. | | | 222,725 | |
| | 3,000 | | | Wyndham Worldwide Corp. | | | 215,700 | |
| | | | | | | | |
| | | | 438,425 | |
| | | | | | | | |
| Shares or Principal Amount | | Value | |
| | | | | | | | |
| | Household Appliances (0.5%) | | | | |
| | 1,500 | | | Whirlpool Corp. | | $ | 220,890 | |
| | | | | | | | |
| | Housewares & Specialties (0.3%) | |
| | 3,000 | | | Jarden Corp.† | | | 146,640 | |
| | | | | | | | |
| | Insurance Brokers (0.3%) | | | | |
| | 3,500 | | | Arthur J Gallagher & Co. | | | 144,480 | |
| | | | | | | | |
| | Internet Software & Services (2.4%) | |
| | 7,500 | | | Facebook, Inc., Class A† | | | 674,250 | |
| | 500 | | | Google, Inc., Class A† | | | 319,185 | |
| | 301 | | | Google, Inc., Class C† | | | 183,134 | |
| | | | | | | | |
| | | | 1,176,569 | |
| | IT Consulting & Other Services (0.8%) | |
| | 3,700 | | | Accenture PLC, Class A | | | 363,562 | |
| | | | | | | | |
| | Life & Health Insurance (1.1%) | |
| | 8,000 | | | Lincoln National Corp. | | | 379,680 | |
| | 4,975 | | | Sun Life Financial, Inc. | | | 160,494 | |
| | | | | | | | |
| | | | 540,174 | |
| | Movies & Entertainment (0.2%) | |
| | 1,000 | | | Walt Disney Co. | | | 102,200 | |
| | | | | | | | |
| | Multi-line Insurance (1.1%) | | | | |
| | 5,000 | | | American International Group, Inc. | �� | | 284,100 | |
| | 7,000 | | | Kemper Corp. | | | 247,590 | |
| | | | | | | | |
| | | | 531,690 | |
| | Multi-Utilities (1.8%) | | | | |
| | 4,000 | | | Ameren Corp. | | | 169,080 | |
| | 11,200 | | | CMS Energy Corp. | | | 395,584 | |
| | 3,000 | | | Sempra Energy | | | 290,160 | |
| | | | | | | | |
| | | | 854,824 | |
| | Oil & Gas Equipment & Services (0.5%) | |
| | 3,300 | | | Schlumberger, Ltd. | | | 227,601 | |
| | | | | | | | |
| | Oil & Gas Exploration & Production (0.2%) | |
| | 1,500 | | | EQT Corp. | | | 97,155 | |
| | | | | | | | |
| | |
| 48 | | SCHEDULEOF INVESTMENTS |
| | | | | | | | |
| Shares or Principal Amount | | Value | |
| | | | | | | | |
| | Oil & Gas Refining & Marketing (1.0%) | |
| | 5,000 | | | Marathon Petroleum Corp. | | $ | 231,650 | |
| | 3,800 | | | Valero Energy Corp. | | | 228,380 | |
| | | | | | | | |
| | | | 460,030 | |
| | Oil & Gas Storage & Transportation (1.0%) | |
| | 8,000 | | | Plains All American Pipeline L.P. | | | 243,040 | |
| | 9,000 | | | Spectra Energy Corp. | | | 236,430 | |
| | | | | | | | |
| | | | 479,470 | |
| | Packaged Foods & Meats (1.1%) | |
| | 12,000 | | | Tyson Foods, Inc., Class A | | | 517,200 | |
| | | | | | | | |
| | Pharmaceuticals (2.4%) | |
| | 2,100 | | | Allergan PLC† | | | 570,801 | |
| | 2,000 | | | Jazz Pharmaceuticals PLC† | | | 265,620 | |
| | 3,500 | | | Johnson & Johnson | | | 326,725 | |
| | | | | | | | |
| | | | 1,163,146 | |
| | Property & Casualty Insurance (0.9%) | |
| | 12,500 | | | XL Group PLC | | | 454,000 | |
| | | | | | | | |
| | Railroads (0.7%) | |
| | 3,800 | | | Union Pacific Corp. | | | 335,958 | |
| | | | | | | | |
| | Real Estate Services (1.8%) | |
| | 14,000 | | | CBRE Group, Inc., Class A† | | | 448,000 | |
| | 3,000 | | | Jones Lang LaSalle, Inc. | | | 431,310 | |
| | | | | | | | |
| | | | 879,310 | |
| | | | | | | | |
| Shares or Principal Amount | | Value | |
| | | | | | | | |
| | Regional Banks (2.0%) | |
| | 13,000 | | | Fifth Third Bancorp | | $ | 245,830 | |
| | 2,800 | | | Signature Bank† | | | 385,168 | |
| | 2,800 | | | SVB Financial Group† | | | 323,512 | |
| | | | | | | | |
| | | | 954,510 | |
| | Semiconductor Equipment (0.7%) | |
| | 23,000 | | | Applied Materials, Inc. | | | 337,870 | |
| | | | | | | | |
| | Semiconductors (0.7%) | |
| | 2,000 | | | Avago Technologies, Ltd. | | | 250,020 | |
| | 1,100 | | | Synaptics, Inc.† | | | 90,706 | |
| | | | | | | | |
| | | | 340,726 | |
| | Specialty Chemicals (1.2%) | |
| | 6,000 | | | Ashland, Inc. | | | 603,720 | |
| | | | | | | | |
| Technology Hardware, Storage &
Peripherals (0.9%) |
|
| | 3,900 | | | Apple, Inc. | | | 430,170 | |
| | | | | | | | |
| | Trucking (1.1%) | |
| | 3,000 | | | Old Dominion Freight Line, Inc.† | | | 183,000 | |
| | 5,000 | | | Ryder System, Inc. | | | 370,200 | |
| | | | | | | | |
| | | | 553,200 | |
| | | | | | | | |
| Total Common Stocks
(Cost $26,402,636) | | | 26,069,559 | |
| | | | |
| SCHEDULEOF INVESTMENTS | | | 49 | |
| | | | | | | | | | | | | | | | |
| Shares or Principal Amount | | Interest
Rate | | | Maturity
Date | | | Value | |
| | | | | | | | | | | | | | | | |
| | Corporate Bonds (17.9%) | |
| | Communications (0.9%) | | | | | | | | | |
| $ | 260,000 | | | Cincinnati Bell, Inc. | | | 8.38 | % | | | 10/15/20 | | | $ | 261,788 | |
| | 100,000 | | | EarthLink Holdings Corp. | | | 7.38 | % | | | 06/01/20 | | | | 102,750 | |
| | 45,000 | | | Level 3 Financing, Inc. | | | 8.63 | % | | | 07/15/20 | | | | 47,025 | |
| | | | | | | | | | | | | | | | |
| | | | | | | | | | | | | | | 411,563 | |
| | Consumer, Cyclical (1.4%) | | | | | | | | | |
| | 200,000 | | | Darden Restaurants, Inc. | | | 6.45 | % | | | 10/15/17 | | | | 217,725 | |
| | 200,000 | | | Darden Restaurants, Inc. | | | 7.05 | % | | | 10/15/37 | | | | 239,004 | |
| | 100,000 | | | International Game Technology | | | 5.35 | % | | | 10/15/23 | | | | 91,500 | |
| | 140,000 | | | Pinnacle Entertainment, Inc. | | | 7.50 | % | | | 04/15/21 | | | | 145,950 | |
| | | | | | | | | | | | | | | | |
| | | | | | | | | | | | | | | 694,179 | |
| | Consumer, Non-cyclical (5.4%) | | | | | | | | | |
| | 328,000 | | | Altria Group, Inc. | | | 9.25 | % | | | 08/06/19 | | | | 408,788 | |
| | 200,000 | | | HCA, Inc. | | | 5.25 | % | | | 04/15/25 | | | | 204,250 | |
| | 220,000 | | | Kraft Heinz Foods Co.(b) | | | 4.88 | % | | | 02/15/25 | | | | 234,784 | |
| | 300,000 | | | Hospira, Inc. | | | 5.80 | % | | | 08/12/23 | | | | 347,447 | |
| | 18,000 | | | inVentiv Health, Inc.(b) | | | 9.00 | % | | | 01/15/18 | | | | 18,585 | |
| | 444,000 | | | Lender Processing Services, Inc. / Black Knight Lending Solutions, Inc. | | | 5.75 | % | | | 04/15/23 | | | | 470,085 | |
| | 500,000 | | | Omnicare, Inc. | | | 4.75 | % | | | 12/01/22 | | | | 540,000 | |
| | 300,000 | | | Prospect Medical Holdings, Inc.(b) | | | 8.38 | % | | | 05/01/19 | | | | 313,500 | |
| | 42,000 | | | United Rentals North America, Inc. | | | 8.25 | % | | | 02/01/21 | | | | 44,205 | |
| | | | | | | | | | | | | | | | |
| | | | | | | | | | | | | | | 2,581,644 | |
| | Energy (1.3%) | | | | | | | | | |
| | 100,000 | | | Bill Barrett Corp.(a) | | | 7.00 | % | | | 10/15/22 | | | | 65,000 | |
| | 250,000 | | | Noble Energy, Inc. | | | 5.88 | % | | | 06/01/22 | | | | 249,529 | |
| | 150,000 | | | Noble Energy, Inc. | | | 5.88 | % | | | 06/01/24 | | | | 149,250 | |
| | 200,000 | | | Range Resources Corp.(a) | | | 5.00 | % | | | 08/15/22 | | | | 177,000 | |
| | | | | | | | | | | | | | | | |
| | | | | | | | | | | | | | | 640,779 | |
| | Financial (7.3%) | | | | | | | | | |
| | 240,000 | | | Ally Financial, Inc. | | | 8.00 | % | | | 03/15/20 | | | | 276,000 | |
| | 378,000 | | | City National Corp. | | | 5.25 | % | | | 09/15/20 | | | | 430,405 | |
| | 135,000 | | | E*TRADE Financial Corp. | | | 5.38 | % | | | 11/15/22 | | | | 143,100 | |
| | 500,000 | | | General Electric Capital Corp., Series A(c) | | | 7.13 | % | | | 06/15/22 | | | | 577,500 | |
| | 200,000 | | | General Electric Capital Corp., Series B(c) | | | 6.25 | % | | | 12/15/22 | | | | 217,000 | |
| | 200,000 | | | GFI Group, Inc. | | | 8.63 | % | | | 07/19/18 | | | | 216,000 | |
| | 170,000 | | | Highmark, Inc.(b) | | | 4.75 | % | | | 05/15/21 | | | | 176,377 | |
| | 225,000 | | | Highmark, Inc.(b) | | | 6.13 | % | | | 05/15/41 | | | | 227,561 | |
| | 100,000 | | | ILFC E-Capital Trust II, FRN(b)(c) | | | 6.25 | % | | | 12/21/65 | | | | 92,500 | |
| | |
| 50 | | SCHEDULEOF INVESTMENTS |
| | | | | | | | | | | | | | | | |
| Shares or Principal Amount | | Interest
Rate | | | Maturity
Date | | | Value | |
| | | | | | | | | | | | | | | | |
| $ | 200,000 | | | Neuberger Berman Group LLC / Neuberger Berman Finance Corp.(b) | | | 5.88 | % | | | 03/15/22 | | | $ | 211,750 | |
| | 200,000 | | | NTC Capital I, Series A, FRN(c) | | | 0.81 | % | | | 01/15/27 | | | | 174,000 | |
| | 151,000 | | | PNC Preferred Funding Trust II, FRN(b)(c) | | | 1.56 | % | | | 03/15/17 | | | | 139,486 | |
| | 200,000 | | | Prudential Financial, Inc.(c) | | | 8.88 | % | | | 06/15/68 | | | | 229,550 | |
| | 250,000 | | | State Street Capital Trust I, FRN(c) | | | 0.88 | % | | | 05/15/28 | | | | 217,500 | |
| | 200,000 | | | USB Realty Corp., FRN(b)(c) | | | 1.44 | % | | | 01/15/17 | | | | 181,500 | |
| | | | | | | | | | | | | | | | |
| | | | | | | | | | | | | | | 3,510,229 | |
| | Industrials (0.6%) | | | | | | | | | |
| | 150,000 | | | Ingersoll-Rand Co. | | | 6.39 | % | | | 11/15/27 | | | | 181,595 | |
| | 51,000 | | | Ingersoll-Rand Co. | | | 6.44 | % | | | 11/15/27 | | | | 61,452 | |
| | 50,000 | | | Vulcan Materials Co. | | | 4.50 | % | | | 04/01/25 | | | | 49,000 | |
| | | | | | | | | | | | | | | | |
| | | | | | | | | | | | | | | 292,047 | |
| | Technology (1.0%) | | | | | | | | | |
| | 250,000 | | | First Data Corp. | | | 11.25 | % | | | 01/15/21 | | | | 273,125 | |
| | 195,000 | | | First Data Corp. | | | 12.63 | % | | | 01/15/21 | | | | 221,569 | |
| | | | | | | | | | | | | | | | |
| | | | | | | | | | | | | | | 494,694 | |
| | | | | | | | | | | | | | | | |
| Total Corporate Bonds
(Cost $8,813,682) |
| | | 8,625,135 | |
| | U.S. Treasury Obligations (6.2%) | | | | | | | | | |
| | 458,325 | | | Treasury Inflation Protected Security | | | 0.13 | % | | | 04/15/19 | | | | 456,762 | |
| | 750,000 | | | U.S. Treasury Note | | | 1.88 | % | | | 05/31/22 | | | | 756,934 | |
| | 750,000 | | | U.S. Treasury Note | | | 2.00 | % | | | 08/15/25 | | | | 746,035 | |
| | 500,000 | | | U.S. Treasury Note | | | 2.13 | % | | | 09/30/21 | | | | 514,453 | |
| | 500,000 | | | U.S. Treasury Note | | | 1.00 | % | | | 09/15/17 | | | | 503,522 | |
| | | | | | | | | | | | | | | | |
| Total U.S. Treasury Obligations
(Cost $2,938,013) |
| | | 2,977,706 | |
| | Collateralized Mortgage Obligations (2.1%) | | | | | | | | | |
| | 198,564 | | | Citigroup Mortgage Loan Trust, Inc.,
Series 2013-J1, Class B3, CMO, VRN(b)(c)(d) | | | 3.56 | % | | | 10/25/43 | | | | 194,599 | |
| | 437,788 | | | MASTR Seasoned Securitization Trust, Inc.,
Series 2005-1, Class 1A1, CMO(c) | | | 6.54 | % | | | 09/25/32 | | | | 476,990 | |
| | 183,380 | | | Sequoia Mortgage Trust, Inc., Series 2013-1, Class B2, CMO, FRN(c)(d) | | | 3.64 | % | | | 02/25/43 | | | | 176,497 | |
| | 190,419 | | | Sequoia Mortgage Trust, Inc., Series 2013-10, Class B2, CMO, VRN(b)(c)(d) | | | 3.59 | % | | | 08/25/43 | | | | 179,178 | |
| | | | | | | | | | | | | | | | |
| Total Collateralized Mortgage Obligations
(Cost $1,044,749) |
| | | 1,027,264 | |
| | Foreign Corporate Bonds (1.1%) | | | | | | | | | |
| | Consumer, Cyclical (0.4%) | | | | | | | | | |
| | 190,000 | | | Air Canada(b) | | | 8.75 | % | | | 04/01/20 | | | | 207,337 | |
| | | | | | | | | | | | | | | | |
| | | | |
| SCHEDULEOF INVESTMENTS | | | 51 | |
| | | | | | | | | | | | | | | | |
| Shares or Principal Amount | | Interest
Rate | | | Maturity
Date | | | Value | |
| | | | | | | | | | | | | | | | |
| | Energy (0.7%) | | | | | | | | | |
| $ | 125,000 | | | Encana Corp. | | | 6.50 | % | | | 02/01/38 | | | $ | 110,288 | |
| | 200,000 | | | BG Energy Capital PLC(b) | | | 4.00 | % | | | 10/15/21 | | | | 212,408 | |
| | | | | | | | | | | | | | | | |
| | | | | | | | | | | | | | | 322,696 | |
| | | | | | | | | | | | | | | | |
| Total Foreign Corporate Bonds
(Cost $541,385) |
| | | 530,033 | |
| | | |
| Shares or Principal Amount | | | | | | | | Value | |
| | Preferred Stocks (4.5%) | | | | | | | | | |
| | Diversified Banks (1.9%) | | | | | | | | | |
| | 21,358 | | | GMAC Capital Trust I, Series 2 | | | | | | | | | | $ | 545,270 | |
| | 14,324 | | | RBS Capital Funding Trust V, Series E | | | | | | | | | | | 349,076 | |
| | | | | | | | | | | | | | | | |
| | | | | | | | | | | | 894,346 | |
| | Diversified REIT’s (0.3%) | | | | | | | | | |
| | 10,912 | | | Winthrop Realty Trust, REIT | | | | | | | | | | | 156,696 | |
| | | | | | | | | | | | | | | | |
| | Office REIT’s (1.7%) | | | | | | | | | |
| | 18,812 | | | Equity Commonwealth, Series E | | | | | | | | | | | 479,330 | |
| | 12,696 | | | Gramercy Property Trust, Inc., Series B(d) | | | | | | | | | | | 323,748 | |
| | | | | | | | | | | | | | | | |
| | | | | | | | | | | | 803,078 | |
| | Specialized REIT’s (0.6%) | | | | | | | | | |
| | 11,653 | | | Digital Realty Trust, Inc., Series E | | | | | | | | | | | 297,268 | |
| | | | | | | | | | | | | | | | |
| Total Preferred Stocks
(Cost $2,169,293) | | | | | | | | | | | 2,151,388 | |
| | Closed-End Mutual Funds (5.5%) | | | | | | | | | |
| | 7,058 | | | Advent/Claymore Enhanced Growth & Income Fund | | | | | | | | | | | 57,876 | |
| | 33,625 | | | AllianceBernstein Income Fund, Inc. | | | | | | | | | | | 264,292 | |
| | 12,500 | | | BlackRock Enhanced Government Fund, Inc. | | | | | | | | | | | 172,250 | |
| | 29,309 | | | Deutsche Global High Income Fund, Inc. | | | | | | | | | | | 221,547 | |
| | 40,423 | | | Federated Enhanced Treasury Income Fund | | | | | | | | | | | 546,519 | |
| | 9,547 | | | First Trust Mortgage Income Fund | | | | | | | | | | | 137,381 | |
| | 2,813 | | | Firsthand Technology Value Fund, Inc. | | | | | | | | | | | 23,939 | |
| | 16,880 | | | Fort Dearborn Income Securities, Inc. | | | | | | | | | | | 238,008 | |
| | 15,427 | | | Montgomery Street Income Securities, Inc. | | | | | | | | | | | 268,276 | |
| | 5,803 | | | Nuveen Mortgage Opportunity Term Fund | | | | | | | | | | | 129,987 | |
| | 20,514 | | | Transamerica Income Shares, Inc. | | | | | | | | | | | 444,333 | |
| | 12,351 | | | Western Asset/Claymore Inflation-Linked Securities & Income Fund | | | | | | | | | | | 130,303 | |
| | | | | | | | | | | | | | | | |
| Total Closed-End Mutual Funds
(Cost $2,713,145) |
| | | 2,634,711 | |
| | |
| 52 | | SCHEDULEOF INVESTMENTS |
| | | | | | | | | | | | | | |
| | | |
| Shares or Principal Amount | | | | | | | Value | |
| | | | | | | | | | | | | | |
| | Exchange Traded Funds (4.2%) | | | | | | | | |
| | 3,300 | | | iShares Core S&P Small-Cap ETF(a) | | | | | | | | $ | 351,681 | |
| | 16,100 | | | iShares Europe ETF(a) | | | | | | | | | 640,780 | |
| | 2,100 | | | SPDR S&P 500 ETF Trust(a) | | | | | | | | | 402,423 | |
| | 11,500 | | | WisdomTree Europe Hedged Equity Fund(a) | | | | | | | | | 628,475 | |
| | | | | | | | | | | | | | |
| Total Exchange Traded Funds
(Cost $2,171,655) |
| | | 2,023,359 | |
| | | |
| Underlying Security/Expiration Date/Exercise Price | | | | Contracts* | | | Value | |
| | Put Options Purchased (0.2%) | | | | | | | | |
| S+P 500 Index,
November 2015, 1,800.00 | | | | | 30 | | | $ | 82,200 | |
| S+P 500 Index,
October 2015, 1,850.00 | | | | | 25 | | | | 40,375 | |
| | | | | | | | | | | | | | |
| Total Put Options Purchased
(Cost $158,032) |
| | | 122,575 | |
| | | |
| Shares or Principal Amount | | | | | | | Value | |
| | Collateral for Securities on Loan (3.2%) | | | | | | | | |
| | 1,520,474 | | | State Street Navigator Prime Portfolio, 0.20% | | | | | | | | $ | 1,520,474 | |
| | | | | | | | | | | | | | |
| Total Collateral for Securities on Loan
(Cost $1,520,474) |
| | | 1,520,474 | |
| | Short-Term Investments (5.3%) | |
| $ | 2,580,085 | | | State Street Euro Dollar Time Deposit (USD),
0.01%, 10/01/15 | | | | | | | | | 2,580,085 | |
| | | | | | | | | | | | | | |
| Total Short-Term Investments
(Cost $2,580,085) |
| | | 2,580,085 | |
| Total Investments 104.3%
(Cost $51,053,149) |
| | | 50,262,289 | |
| | Liabilities Less Other Assets (4.3)% | | | | (2,078,781 | ) |
| | | | | | | | | | | | | | |
| | Net Assets 100.0% | | | $ | 48,183,508 | |
| | | | | | | | | | | | | | |
The accompanying notes are an integral part of the financial statements.
| * | All options have 100 shares per contract. |
| † | Non-income producing security. |
| (a) | All or a portion of the security was on loan as of September 30, 2015. |
| (b) | 144A - Exempt from registration under Rule 144A of the Securities Act of 1933. These securities may be resold in transactions exempt from registration, typically only to qualified institutional buyers. Unless otherwise indicated, these securities are not considered to be illiquid. |
| (c) | Floating Rate Security. Rate disclosed is as of September 30, 2015. |
| (d) | These securities are considered to be illiquid. The aggregate value of these securities at September 30, 2015 was $874,022, which represent 1.8% of the Fund’s Net Assets. |
| REIT | Real Estate Investment Trust |
| | | | |
| SCHEDULEOF INVESTMENTS | | | 53 | |
STATEMENTSOF ASSETSAND LIABILITIES
SEPTEMBER 30, 2015
| | | | | | | | | | | | |
| | | ICON
Bond Fund | | | ICON
Equity Income
Fund | | | ICON
Fund | |
Assets | | | | | | | | | | | | |
Investments, at cost | | $ | 87,143,449 | | | $ | 50,183,178 | | | $ | 56,587,822 | |
| | | | | | | | | | | | |
Investments, at value† | | | 85,501,566 | | | | 46,801,017 | | | | 56,411,702 | |
Foreign currency, at value(a) | | | - | | | | 2 | | | | - | |
Receivables: | | | | | | | | | | | | |
Interest | | | 1,088,129 | | | | 68,180 | | | | - | |
Investments sold | | | 158,289 | | | | 403,745 | | | | - | |
Fund shares sold | | | 134,776 | | | | 82,965 | | | | 48,544 | |
Expense reimbursements due from Adviser | | | 61,715 | | | | 21,826 | | | | 4,122 | |
Dividends | | | 7,076 | | | | 194,078 | | | | 14,603 | |
Foreign tax reclaims | | | - | | | | 1,383 | | | | 269 | |
Other assets | | | 26,089 | | | | 27,226 | | | | 22,896 | |
| | | | | | | | | | | | |
Total Assets | | | 86,977,640 | | | | 47,600,422 | | | | 56,502,136 | |
| | | | | | | | | | | | |
Liabilities | | | | | | | | | | | | |
Payables: | | | | | | | | | | | | |
Payable for collateral received on securities loaned | | | 974,488 | | | | 4,775,526 | | | | 1,930,400 | |
Investments purchased | | | 635,154 | | | | - | | | | - | |
Fund shares redeemed | | | 75,675 | | | | 58,459 | | | | 33,863 | |
Distributions due to shareholders | | | 49,006 | | | | 37,835 | | | | - | |
Advisory fees | | | 42,064 | | | | 26,756 | | | | 35,093 | |
Transfer agent fees | | | 12,979 | | | | 11,778 | | | | 11,726 | |
Fund accounting fees | | | 4,572 | | | | 2,309 | | | | 3,106 | |
Accrued distribution fees | | | 4,461 | | | | 8,433 | | | | 13,392 | |
Trustee fees and expenses | | | 3,587 | | | | 1,693 | | | | 2,630 | |
Administration fees | | | 3,505 | | | | 1,784 | | | | 2,339 | |
Accrued expenses | | | 40,178 | | | | 32,871 | | | | 35,206 | |
| | | | | | | | | | | | |
Total Liabilities | | | 1,845,669 | | | | 4,957,444 | | | | 2,067,755 | |
| | | | | | | | | | | | |
Net Assets - all share classes | | $ | 85,131,971 | | | $ | 42,642,978 | | | $ | 54,434,381 | |
| | | | | | | | | | | | |
Net Assets - Class S | | $ | 73,151,267 | | | $ | 22,779,015 | | | $ | 33,695,459 | |
| | | | | | | | | | | | |
Net Assets - Class C | | $ | 4,142,356 | | | $ | 6,825,307 | | | $ | 13,744,542 | |
| | | | | | | | | | | | |
Net Assets - Class A | | $ | 7,838,348 | | | $ | 13,038,656 | | | $ | 6,994,380 | |
| | | | | | | | | | | | |
| | | | | | | | | | | | |
| | | ICON
Bond Fund | | | ICON
Equity Income
Fund | | | ICON
Fund | |
Net Assets Consist of | | | | | | | | | | | | |
Paid-in capital | | $ | 89,515,001 | | | $ | 65,675,977 | | | $ | 74,114,032 | |
Accumulated undistributed net investment income/(loss) | | | (2,398 | ) | | | 73,948 | | | | (171,984 | ) |
Accumulated undistributed net realized gain/(loss) | | | (2,738,749 | ) | | | (19,724,684 | ) | | | (19,331,547 | ) |
Unrealized appreciation/(depreciation) | | | (1,641,883 | ) | | | (3,382,263 | ) | | | (176,120 | ) |
| | | | | | | | | | | | |
Net Assets | | $ | 85,131,971 | | | $ | 42,642,978 | | | $ | 54,434,381 | |
| | | | | | | | | | | | |
Shares outstanding (unlimited shares authorized, no par value) | | | | | | | | | | | | |
Class S | | | 7,947,911 | | | | 1,586,127 | | | | 2,436,635 | |
Class C | | | 448,204 | | | | 472,394 | | | | 1,110,220 | |
Class A | | | 854,646 | | | | 912,687 | | | | 532,669 | |
Net asset value (offering and redemption price per share) | | | | | | | | | | | | |
Class S | | $ | 9.20 | | | $ | 14.36 | | | $ | 13.83 | |
Class C | | $ | 9.24 | | | $ | 14.45 | | | $ | 12.38 | |
Class A | | $ | 9.17 | | | $ | 14.29 | | | $ | 13.13 | |
Class A maximum offering price (100%/(100%-maximum sales charge)) of net asset value adjusted to the nearest cent per share | | $ | 9.62 | | | $ | 15.16 | | | $ | 13.93 | |
| | | |
† Includes securities on loan of | | $ | 926,428 | | | $ | 4,718,991 | | | $ | 1,879,600 | |
| | | |
(a) Foreign currency, at cost | | $ | - | | | $ | 2 | | | $ | - | |
The accompanying notes are an integral part of the financial statements.
STATEMENTSOF ASSETSAND LIABILITIES
SEPTEMBER 30, 2015
| | | | | | | | | | | | |
| | | ICON
Long/Short
Fund | | | ICON
Opportunities
Fund | | | ICON
Risk-Managed
Balanced
Fund | |
Assets | | | | | | | | | | | | |
Investments, at cost | | $ | 34,100,390 | | | $ | 11,128,088 | | | $ | 51,053,149 | |
| | | | | | | | | | | | |
Investments, at value† | | | 34,606,783 | | | | 11,053,481 | | | | 50,262,289 | |
Cash | | | 10,955 | | | | - | | | | 2,187 | |
Cash due from prime broker | | | 528 | | | | - | | | | - | |
Deposits for Short Sales | | | 341,300 | | | | - | | | | - | |
Receivables: | | | | | | | | | | | | |
Fund shares sold | | | 222,493 | | | | 14,375 | | | | 172,255 | |
Investments sold | | | - | | | | - | | | | 188,241 | |
Interest | | | - | | | | - | | | | 175,733 | |
Expense reimbursements due from Adviser | | | 22,258 | | | | 5,606 | | | | 14,806 | |
Dividends | | | 6,919 | | | | 2,998 | | | | 15,107 | |
Other assets | | | 20,914 | | | | 4,463 | | | | 19,624 | |
| | | | | | | | | | | | |
Total Assets | | | 35,232,150 | | | | 11,080,923 | | | | 50,850,242 | |
| | | | | | | | | | | | |
Liabilities | | | | | | | | | | | | |
Payables: | | | | | | | | | | | | |
Expense recoupment due to adviser | | | - | | | | - | | | | 2,469 | |
Investments purchased | | | - | | | | - | | | | 995,944 | |
Payable for collateral received on securities loaned | | | 2,281,325 | | | | - | | | | 1,520,474 | |
Fund shares redeemed | | | 185,709 | | | | 483 | | | | 18,708 | |
Distributions due to shareholders | | | - | | | | - | | | | 33,676 | |
Advisory fees | | | 24,122 | | | | 7,109 | | | | 28,327 | |
Accrued distribution fees | | | 7,441 | | | | - | | | | 12,159 | |
Fund accounting fees | | | 1,880 | | | | 621 | | | | 2,170 | |
Transfer agent fees | | | 13,900 | | | | 1,748 | | | | 11,923 | |
Administration fees | | | 1,419 | | | | 474 | | | | 1,889 | |
Trustee fees and expenses | | | 1,492 | | | | 484 | | | | 1,301 | |
Accrued expenses | | | 32,425 | | | | 23,037 | | | | 37,694 | |
| | | | | | | | | | | | |
Total Liabilities | | | 2,549,713 | | | | 33,956 | | | | 2,666,734 | |
| | | | | | | | | | | | |
Net Assets - all share classes | | $ | 32,682,437 | | | $ | 11,046,967 | | | $ | 48,183,508 | |
| | | | | | | | | | | | |
Net Assets - Class S | | $ | 17,196,586 | | | $ | - | | | $ | 26,676,128 | |
| | | | | | | | | | | | |
Net Assets - Class C | | $ | 6,299,903 | | | $ | - | | | $ | 13,060,920 | |
| | | | | | | | | | | | |
Net Assets - Class A | | $ | 9,185,948 | | | $ | - | | | $ | 8,446,460 | |
| | | | | | | | | | | | |
| | | | | | | | | | | | |
| | | ICON
Long/Short
Fund | | | ICON
Opportunities
Fund | | | ICON
Risk-Managed
Balanced
Fund | |
Net Assets Consist of | | | | | | | | | | | | |
Paid-in capital | | $ | 87,546,496 | | | $ | 11,192,538 | | | $ | 62,165,138 | |
Accumulated undistributed net investment income/(loss) | | | (195,326 | ) | | | (57,770 | ) | | | (3,654 | ) |
Accumulated undistributed net realized gain/(loss) | | | (55,175,126 | ) | | | (13,194 | ) | | | (13,187,102 | ) |
Unrealized appreciation/(depreciation) | | | 506,393 | | | | (74,607 | ) | | | (790,874 | ) |
| | | | | | | | | | | | |
Net Assets | | $ | 32,682,437 | | | $ | 11,046,967 | | | $ | 48,183,508 | |
| | | | | | | | | | | | |
Shares outstanding (unlimited shares authorized, no par value) | | | - | | | | 829,305 | | | | - | |
Class S | | | 935,175 | | | | - | | | | 1,902,918 | |
Class C | | | 380,918 | | | | - | | | | 1,013,584 | |
Class A | | | 512,976 | | | | - | | | | 617,260 | |
Net asset value (offering and redemption price per share) | | $ | - | | | $ | 13.32 | | | $ | - | |
Class S | | $ | 18.39 | | | $ | - | | | $ | 14.02 | |
Class C | | $ | 16.54 | | | $ | - | | | $ | 12.89 | |
Class A | | $ | 17.91 | | | $ | - | | | $ | 13.68 | |
Class A maximum offering price (100%/(100%-maximum sales charge)) of net asset value adjusted to the nearest cent per share | | $ | 19.00 | | | $ | - | | | $ | 14.51 | |
| | | |
† Includes securities on loan of | | $ | 2,278,335 | | | $ | - | | | $ | 1,502,085 | |
The accompanying notes are an integral part of the financial statements.
STATEMENTSOF OPERATIONS
FORTHEYEARENDED SEPTEMBER 30, 2015
| | | | | | | | | | | | |
| | | ICON
Bond Fund | | | ICON
Equity Income
Fund | | | ICON
Fund | |
Investment Income | | | | | | | | | | | | |
Interest | | $ | 3,545,355 | | | $ | 130,076 | | | $ | 4,628 | |
Dividends | | | 1,023,326 | | | | 1,870,260 | | | | 641,679 | |
Income from securities lending, net | | | 25,347 | | | | 86,140 | | | | 9,657 | |
Foreign taxes withheld | | | - | | | | (25,021 | ) | | | - | |
| | | | | | | | | | | | |
Total Investment Income | | | 4,594,028 | | | | 2,061,455 | | | | 655,964 | |
| | | | | | | | | | | | |
Expenses | | | | | | | | | | | | |
Advisory fees | | | 551,025 | | | | 326,856 | | | | 501,705 | |
Transfer agent fees | | | 85,808 | | | | 67,409 | | | | 92,015 | |
Distribution fees: | | | | | | | | | | | | |
Class C | | | 31,322 | | | | 66,472 | | | | 168,831 | |
Class A | | | 17,453 | | | | 35,569 | | | | 20,666 | |
Administration fees | | | 45,918 | | | | 21,790 | | | | 33,447 | |
Registration fees: | | | - | | | | - | | | | - | |
Class S | | | 13,404 | | | | 6,254 | | | | 10,198 | |
Class C | | | 11,479 | | | | 11,085 | | | | 13,262 | |
Class A | | | 10,786 | | | | 13,960 | | | | 11,326 | |
Audit and tax service expense | | | 34,051 | | | | 34,132 | | | | 28,880 | |
Fund accounting fees | | | 21,466 | | | | 10,064 | | | | 15,461 | |
Trustee fees and expenses | | | 12,388 | | | | 5,642 | | | | 9,135 | |
Insurance expense | | | 10,852 | | | | 2,826 | | | | 4,682 | |
Custody fees | | | 9,142 | | | | 5,006 | | | | 3,791 | |
Interest expense | | | 245 | | | | 145 | | | | 3,483 | |
Prime broker expense | | | - | | | | - | | | | - | |
Recoupment of previously reimbursed expenses | | | - | | | | 12,848 | | | | 2,491 | |
Other expenses | | | 62,530 | | | | 36,285 | | | | 49,153 | |
| | | | | | | | | | | | |
Total expenses before expense reimbursement | | | 917,869 | | | | 656,343 | | | | 968,526 | |
Expense reimbursement by Adviser due to expense limitation agreement | | | (180,067 | ) | | | (31,087 | ) | | | (6,855 | ) |
| | | | | | | | | | | | |
Net Expenses | | | 737,802 | | | | 625,256 | | | | 961,671 | |
| | | | | | | | | | | | |
Net Investment Income/(Loss) | | | 3,856,226 | | | | 1,436,199 | | | | (305,707 | ) |
| | | | | | | | | | | | |
Net Realized and Unrealized Gain/(Loss) | | | | | | | | | | | | |
Net realized gain/(loss) on: | | | | | | | | | | | | |
Investments | | | (2,721,154 | ) | | | 2,379,702 | | | | 1,666,949 | |
Foreign currency | | | - | | | | (1,669 | ) | | | - | |
Written options | | | - | | | | - | | | | - | |
Securities sold short | | | - | | | | - | | | | - | |
Change in unrealized net appreciation/(depreciation) on: | | | | | | | | | | | | |
Investments and foreign currency | | | (1,322,993 | ) | | | (3,911,455 | ) | | | (3,490,916 | ) |
Written options | | | - | | | | - | | | | - | |
Securities sold short | | | - | | | | - | | | | - | |
| | | | | | | | | | | | |
Net realized and unrealized gain/(loss) | | | (4,044,147 | ) | | | (1,533,422 | ) | | | (1,823,967 | ) |
| | | | | | | | | | | | |
Net Increase/(Decrease) in Net Assets Resulting From Operations | | $ | (187,921 | ) | | $ | (97,223 | ) | | $ | (2,129,674 | ) |
| | | | | | | | | | | | |
The accompanying notes are an integral part of the financial statements.
| | | | | | | | | | |
ICON
Long/Short
Fund | | | ICON
Opportunities
Fund | | | ICON
Risk-Managed
Balanced
Fund | |
| | | | | | | | | | |
| $ | 2,543 | | | $ | 16 | | | $ | 442,572 | |
| | 311,326 | | | | 106,100 | | | | 391,216 | |
| | 8,892 | | | | - | | | | 3,976 | |
| | - | | | | (250 | ) | | | (770 | ) |
| | | | | | | | | | |
| | 322,761 | | | | 105,866 | | | | 836,994 | |
| | | | | | | | | | |
| | | | | | | | | | |
| | 324,094 | | | | 92,935 | | | | 258,570 | |
| | 74,808 | | | | 14,144 | | | | 60,531 | |
| | | | | | | | | | |
| | 72,556 | | | | - | | | | 108,912 | |
| | 26,687 | | | | - | | | | 20,444 | |
| | 19,064 | | | | 6,195 | | | | 17,238 | |
| | - | | | | 15,960 | | | | - | |
| | 5,031 | | | | - | | | | 10,121 | |
| | 11,815 | | | | - | | | | 13,125 | |
| | 14,975 | | | | - | | | | 12,717 | |
| | 32,641 | | | | 24,271 | | | | 38,920 | |
| | 8,897 | | | | 2,833 | | | | 8,302 | |
| | 5,030 | | | | 1,669 | | | | 4,061 | |
| | 3,553 | | | | 274 | | | | 7,405 | |
| | 3,720 | | | | 2,429 | | | | 8,886 | |
| | 3,131 | | | | 512 | | | | 84 | |
| | 7,639 | | | | - | | | | 40 | |
| 418 | | | | 12,599 | | | | 3,689 | |
| | 32,515 | | | | 21,384 | | | | 32,121 | |
| | | | | | | | | | |
| 646,574 | | | | 195,205 | | | | 605,166 | |
| (50,987 | ) | | | (8,824 | ) | | | (61,973 | ) |
| | | | | | | | | | |
| | 595,587 | | | | 186,381 | | | | 543,193 | |
| | | | | | | | | | |
| | (272,826 | ) | | | (80,515 | ) | | | 293,801 | |
| | | | | | | | | | |
| | | | | | | | | | |
| | | | | | | | | | |
| | 1,661,931 | | | | 29,960 | | | | 293,689 | |
| | - | | | | - | | | | - | |
| | - | | | | - | | | | 152,398 | |
| | (64,991 | ) | | | - | | | | - | |
| | | | | | | | | | |
| | (1,327,223 | ) | | | 587,690 | | | | (1,163,177 | ) |
| | - | | | | - | | | | (21,732 | ) |
| | (7,260 | ) | | | - | | | | - | |
| | | | | | | | | | |
| | 262,457 | | | | 617,650 | | | | (738,822 | ) |
| | | | | | | | | | |
| $ | (10,369 | ) | | $ | 537,135 | | | $ | (445,021 | ) |
| | | | | | | | | | |
STATEMENTSOF CHANGESIN NET ASSETS
| | | | | | | | | | | | | | | | |
| | | ICON Bond Fund | | | ICON Equity Income Fund | |
| | | Year ended
September 30,
2015 | | | Year ended
September 30,
2014 | | | Year ended
September 30,
2015 | | | Year ended
September 30,
2014 | |
Operations | | | | | | | | | | | | | | | | |
Net investment income/(loss) | | $ | 3,856,226 | | | $ | 4,205,519 | | | $ | 1,436,199 | | | $ | 755,368 | |
Net realized gain/(loss) | | | (2,721,154 | ) | | | 2,391,782 | | | | 2,378,033 | | | | 1,899,218 | |
Change in net unrealized appreciation/(depreciation) | | | (1,322,993 | ) | | | (923,132 | ) | | | (3,911,455 | ) | | | (234,459 | ) |
| | | | | | | | | | | | | | | | |
Net increase/(decrease) in net assets resulting from operations | | | (187,921 | ) | | | 5,674,169 | | | | (97,223 | ) | | | 2,420,127 | |
| | | | | | | | | | | | | | | | |
Dividends and Distributions to Shareholders | | | | | | | | | | | | | | | | |
Net investment income | | | | | | | | | | | | | | | | |
Class S | | | (4,367,039 | )* | | | (3,980,600 | ) | | | (760,578 | ) | | | (212,507 | ) |
Class C | | | (198,438 | )* | | | (91,693 | ) | | | (154,918 | ) | | | (119,845 | ) |
Class A | | | (381,214 | )* | | | (207,239 | ) | | | (425,141 | ) | | | (399,464 | ) |
Net realized gains | | | | | | | | | | | | | | | | |
Class S | | | (1,100,327 | ) | | | (1,221,845 | ) | | | - | | | | - | |
Class C | | | (49,999 | ) | | | (33,641 | ) | | | - | | | | - | |
Class A | | | (96,051 | ) | | | (84,193 | ) | | | - | | | | - | |
Return of capital | | | | | | | | | | | | | | | | |
Class S | | | (281,945 | ) | | | - | | | | - | | | | - | |
Class C | | | (12,812 | ) | | | - | | | | - | | | | - | |
Class A | | | (24,612 | ) | | | - | | | | - | | | | - | |
| | | | | | | | | | | | | | | | |
Net decrease from dividends and distributions | | | (6,512,437 | ) | | | (5,619,211 | ) | | | (1,340,637 | ) | | | (731,816 | ) |
| | | | | | | | | | | | | | | | |
Fund Share Transactions | | | | | | | | | | | | | | | | |
Shares sold | | | | | | | | | | | | | | | | |
Class S | | | 19,939,410 | | | | 25,808,977 | | | | 22,636,893 | | | | 4,320,227 | |
Class C | | | 2,204,299 | | | | 1,037,215 | | | | 2,336,246 | | | | 1,565,617 | |
Class A | | | 5,041,777 | | | | 2,174,465 | | | | 2,127,508 | | | | 4,270,619 | |
Reinvested dividends and distributions | | | | | | | | | | | | | | | | |
Class S | | | 5,264,217 | | | | 5,037,958 | | | | 715,630 | | | | 176,730 | |
Class C | | | 160,822 | | | | 110,073 | | | | 105,154 | | | | 77,814 | |
Class A | | | 245,318 | | | | 193,306 | | | | 385,989 | | | | 329,999 | |
Shares repurchased | | | | | | | | | | | | | | | | |
Class S | | | (33,725,086 | ) | | | (31,574,518 | ) | | | (7,873,137 | ) | | | (1,950,944 | ) |
Class C | | | (843,849 | ) | | | (1,273,625 | ) | | | (796,100 | ) | | | (1,969,692 | ) |
Class A | | | (1,286,486 | ) | | | (4,849,752 | ) | | | (2,907,210 | ) | | | (4,496,032 | ) |
| | | | | | | | | | | | | | | | |
Net increase/(decrease) from fund share transactions | | | (2,999,578 | ) | | | (3,335,901 | ) | | | 16,730,973 | | | | 2,324,338 | |
| | | | | | | | | | | | | | | | |
Total net increase/(decrease) in net assets | | | (9,699,936 | ) | | | (3,280,943 | ) | | | 15,293,113 | | | | 4,012,649 | |
Net Assets | | | | | | | | | | | | | | | | |
Beginning of year | | | 94,831,907 | | | | 98,112,850 | | | | 27,349,865 | | | | 23,337,216 | |
| | | | | | | | | | | | | | | | |
End of year | | $ | 85,131,971 | | | $ | 94,831,907 | | | $ | 42,642,978 | | | $ | 27,349,865 | |
| | | | | | | | | | | | | | | | |
| * | The ICON Bond Fund had a distribution in excess of net investment income during the fiscal year ending September 30, 2015. |
| | | | | | | | | | | | | | |
| ICON Fund | | | ICON Long/Short Fund | |
Year ended September 30, 2015 | | | Year ended
September 30,
2014 | | | Year ended
September 30,
2015 | | | Year ended
September 30,
2014 | |
| | | | | | | | | | | | | | |
$ |
(305,707 |
) | | $ | (225,339 | ) | | $ | (272,826 | ) | | $ | (216,208 | ) |
| | 1,666,949 | | | | 9,583,650 | | | | 1,596,940 | | | | 2,801,025 | |
| (3,490,916 | ) | | | (8,157,199 | ) | | | (1,334,483 | ) | | | (1,895,125 | ) |
| | | | | | | | | | | | | | |
| (2,129,674 | ) | | | 1,201,112 | | | | (10,369 | ) | | | 689,692 | |
| | | | | | | | | | | | | | |
| | | | | | | | | | | | | | |
| | | | | | | | | | | | | | |
| | - | | | | - | | | | - | | | | - | |
| | - | | | | - | | | | - | | | | - | |
| | - | | | | - | | | | - | | | | - | |
| | | | | | | | | | | | | | |
| | - | | | | - | | | | - | | | | - | |
| | - | | | | - | | | | - | | | | - | |
| | - | | | | - | | | | - | | | | - | |
| | | | | | | | | | | | | | |
| | - | | | | - | | | | - | | | | - | |
| | - | | | | - | | | | - | | | | - | |
| | - | | | | - | | | | - | | | | - | |
| | | | | | | | | | | | | | |
| - | | | | - | | | | - | | | | - | |
| | | | | | | | | | | | | | |
| | | | | | | | | | | | | | |
| | | | | | | | | | | | | | |
| | 2,650,530 | | | | 39,338,371 | | | | 13,446,762 | | | | 20,303,844 | |
| | 570,850 | | | | 701,776 | | | | 1,135,887 | | | | 1,899,217 | |
| | 673,069 | | | | 714,468 | | | | 2,023,326 | | | | 8,514,859 | |
| | | | | | | | | | | | | | |
| | - | | | | - | | | | - | | | | - | |
| | - | | | | - | | | | - | | | | - | |
| | - | | | | - | | | | - | | | | - | |
| | | | | | | | | | | | | | |
| | (9,474,040 | ) | | | (5,050,068 | ) | | | (12,681,757 | ) | | | (8,631,931 | ) |
| | (3,146,732 | ) | | | (3,026,141 | ) | | | (1,710,185 | ) | | | (1,322,859 | ) |
| | (1,412,280 | ) | | | (3,010,830 | ) | | | (4,078,006 | ) | | | (6,591,448 | ) |
| | | | | | | | | | | | | | |
| (10,138,603 | ) | | | 29,667,576 | | | | (1,863,973 | ) | | | 14,171,682 | |
| | | | | | | | | | | | | | |
| (12,268,277 | ) | | | 30,868,688 | | | | (1,874,342 | ) | | | 14,861,374 | |
| | | | | | | | | | | | | | |
| | 66,702,658 | | | | 35,833,970 | | | | 34,556,779 | | | | 19,695,405 | |
| | | | | | | | | | | | | | |
| $ | 54,434,381 | | | $ | 66,702,658 | | | $ | 32,682,437 | | | $ | 34,556,779 | |
| | | | | | | | | | | | | | |
STATEMENTSOF CHANGESIN NET ASSETS (CONTINUED)
| | | | | | | | | | | | | | | | |
| | | ICON Bond Fund | | | ICON Equity Income Fund | |
| | | Year ended
September 30,
2015 | | | Year ended
September 30,
2014 | | | Year ended
September 30,
2015 | | | Year ended
September 30,
2014 | |
Transactions in Fund Shares | | | | | | | | | | | | | | | | |
Shares sold | | | | | | | | | | | | | | | | |
Class S | | | 2,079,890 | | | | 2,592,865 | | | | 1,503,214 | | | | 290,158 | |
Class C | | | 230,646 | | | | 103,517 | | | | 150,250 | | | | 106,051 | |
Class A | | | 531,071 | | | | 218,528 | | | | 137,103 | | | | 287,965 | |
Reinvested dividends and distributions | | | | | | | | | | | | | | | | |
Class S | | | 556,451 | | | | 509,394 | | | | 46,951 | | | | 11,918 | |
Class C | | | 16,961 | | | | 11,098 | | | | 6,871 | | | | 5,226 | |
Class A | | | 26,037 | | | | 19,561 | | | | 25,418 | | | | 22,426 | |
Shares repurchased | | | | | | | | | | | | | | | | |
Class S | | | (3,548,159 | ) | | | (3,173,085 | ) | | | (503,502 | ) | | | (133,350 | ) |
Class C | | | (89,159 | ) | | | (127,850 | ) | | | (51,185 | ) | | | (135,659 | ) |
Class A | | | (136,282 | ) | | | (490,776 | ) | | | (186,068 | ) | | | (306,449 | ) |
| | | | | | | | | | | | | | | | |
Net increase/(decrease) | | | (332,544 | ) | | | (336,748 | ) | | | 1,129,052 | | | | 148,286 | |
| | | | | | | | | | | | | | | | |
Shares outstanding, beginning of year | | | 9,583,305 | | | | 9,920,053 | | | | 1,842,156 | | | | 1,693,870 | |
| | | | | | | | | | | | | | | | |
Shares outstanding, end of year | | | 9,250,761 | | | | 9,583,305 | | | | 2,971,208 | | | | 1,842,156 | |
| | | | | | | | | | | | | | | | |
Accumulated undistributed net investment income/(loss) | | $ | (2,398 | ) | | $ | - | | | $ | 73,948 | | | $ | 2,556 | |
| | | | | | | | | | | | | | | | |
The accompanying notes are an integral part of the financial statements.
| | | | | | | | | | | | | | |
| ICON Fund | | | ICON Long/Short Fund | |
Year ended September 30, 2015 | | | Year ended
September 30,
2014 | | | Year ended
September 30,
2015 | | | Year ended
September 30,
2014 | |
| | | | | | | | | | | | | | |
| | | | | | | | | | | | | | |
| | 174,791 | | | | 2,703,725 | | | | 668,902 | | | | 1,088,517 | |
| | 40,080 | | | | 52,934 | | | | 60,489 | | | | 111,610 | |
| | 44,868 | | | | 51,369 | | | | 100,326 | | | | 467,016 | |
| | | | | | | | | | | | | | |
| | - | | | | - | | | | - | | | | - | |
| | - | | | | - | | | | - | | | | - | |
| | - | | | | - | | | | - | | | | - | |
| | | | | | | | | | | | | | |
| | (601,521 | ) | | | (339,356 | ) | | | (627,870 | ) | | | (467,545 | ) |
| | (226,313 | ) | | | (226,841 | ) | | | (93,775 | ) | | | (77,860 | ) |
| | (95,562 | ) | | | (214,698 | ) | | | (207,860 | ) | | | (361,119 | ) |
| | | | | | | | | | | | | | |
| (663,657 | ) | | | 2,027,133 | | | | (99,788 | ) | | | 760,619 | |
| | | | | | | | | | | | | | |
| 4,743,181 | | | | 2,716,048 | | | | 1,928,857 | | | | 1,168,238 | |
| | | | | | | | | | | | | | |
| 4,079,524 | | | | 4,743,181 | | | | 1,829,069 | | | | 1,928,857 | |
| | | | | | | | | | | | | | |
$ | (171,984 | ) | | $ | (199,698 | ) | | $ | (195,326 | ) | | $ | (217,386 | ) |
| | | | | | | | | | | | | | |
STATEMENTSOF CHANGESIN NET ASSETS (CONTINUED)
| | | | | | | | | | | | | | | | |
| | | ICON Opportunities Fund | | | ICON Risk-Managed Balanced Fund | |
| | | Year ended
September 30,
2015 | | | Year ended
September 30,
2014 | | | Year ended
September 30,
2015 | | | Year ended
September 30,
2014 | |
Operations | | | | | | | | | | | | | | | | |
Net investment income/(loss) | | $ | (80,515 | ) | | $ | (20,738 | ) | | $ | 293,801 | | | $ | 1,070,093 | |
Net realized gain/(loss) | | | 29,960 | | | | 185,354 | | | | 446,087 | | | | 3,386,300 | |
Change in net unrealized appreciation/(depreciation) | | | 587,690 | | | | (737,258 | ) | | | (1,184,909 | ) | | | (694,123 | ) |
| | | | | | | | | | | | | | | | |
Net increase/(decrease) in net assets resulting from operations | | | 537,135 | | | | (572,642 | ) | | | (445,021 | ) | | | 3,762,270 | |
| | | | | | | | | | | | | | | | |
Dividends and Distributions to Shareholders | | | | | | | | | | | | | | | | |
Net investment income | | | (126,909 | ) | | | - | | | | - | | | | - | |
Class S | | | - | | | | - | | | | (195,258 | )** | | | (870,218 | ) |
Class C | | | - | | | | - | | | | (45,453 | )** | | | (73,148 | ) |
Class A | | | - | | | | - | | | | (80,740 | )** | | | (106,307 | ) |
Net realized gains | | | (60,583 | )+ | | | (20,853 | ) | | | - | | | | - | |
| | | | | | | | | | | | | | | | |
Net decrease from dividends and distributions | | | (187,492 | ) | | | (20,853 | ) | | | (321,451 | ) | | | (1,049,673 | ) |
| | | | | | | | | | | | | | | | |
Fund Share Transactions | | | | | | | | | | | | | | | | |
Shares sold | | | 1,123,562 | | | | 13,145,752 | | | | - | | | | - | |
Class S | | | - | | | | - | | | | 20,735,760 | | | | 26,547,394 | |
Class C | | | - | | | | - | | | | 5,157,125 | | | | 4,329,625 | |
Class A | | | - | | | | - | | | | 7,372,991 | | | | 2,947,462 | |
Reinvested dividends and distributions | | | 182,711 | | | | 20,653 | | | | - | | | | - | |
Class S | | | - | | | | - | | | | 158,420 | | | | 828,672 | |
Class C | | | - | | | | - | | | | 36,577 | | | | 65,822 | |
Class A | | | - | | | | - | | | | 63,152 | | | | 84,606 | |
Shares repurchased | | | (2,741,644 | ) | | | (882,170 | ) | | | - | | | | - | |
Class S | | | - | | | | - | | | | (13,651,238 | ) | | | (52,784,217 | ) |
Class C | | | - | | | | - | | | | (1,464,014 | ) | | | (874,718 | ) |
Class A | | | - | | | | - | | | | (6,013,030 | ) | | | (4,139,537 | ) |
| | | | | | | | | | | | | | | | |
Net increase/(decrease) from fund share transactions | | | (1,435,371 | ) | | | 12,284,235 | | | | 12,395,743 | | | | (22,994,891 | ) |
| | | | | | | | | | | | | | | | |
Total net increase/(decrease) in net assets | | | (1,085,728 | ) | | | 11,690,740 | | | | 11,629,271 | | | | (20,282,294 | ) |
Net Assets | | | | | | | | | | | | | | | | |
Beginning of year | | | 12,132,695 | | | | 441,955 | | | | 36,554,237 | | | | 56,836,531 | |
| | | | | | | | | | | | | | | | |
End of year | | $ | 11,046,967 | | | $ | 12,132,695 | | | $ | 48,183,508 | | | $ | 36,554,237 | |
| | | | | | | | | | | | | | | | |
| + | The ICON Opportunities Fund had a distribution in excess of net realized gain during the fiscal year ending September 30, 2015. |
| ** | The ICON Risk-Managed Balanced Fund had a distribution in excess of net investment income during the fiscal year ending September 30, 2015. |
| | | | | | | | | | | | | | | | |
| | | ICON Opportunities Fund | | | ICON Risk-Managed Balanced Fund | |
| | | Year ended
September 30,
2015 | | | Year ended
September 30,
2014 | | | Year ended
September 30,
2015 | | | Year ended
September 30,
2014 | |
Transactions in Fund Shares | | | | | | | | | | | | | | | | |
Shares sold | | | 79,579 | | | | 960,435 | | | | - | | | | - | |
Class S | | | - | | | | - | | | | 1,429,825 | | | | 1,936,186 | |
Class C | | | - | | | | - | | | | 385,869 | | | | 340,349 | |
Class A | | | - | | | | - | | | | 521,467 | | | | 217,425 | |
Reinvested dividends and distributions | | | 13,494 | | | | 1,537 | | | | - | | | | - | |
Class S | | | - | | | | - | | | | 11,119 | | | | 59,893 | |
Class C | | | - | | | | - | | | | 2,801 | | | | 5,143 | |
Class A | | | - | | | | - | | | | 4,524 | | | | 6,237 | |
Shares repurchased | | | (194,321 | ) | | | (65,353 | ) | | | - | | | | - | |
Class S | | | - | | | | - | | | | (973,454 | ) | | | (3,796,455 | ) |
Class C | | | - | | | | - | | | | (109,255 | ) | | | (68,822 | ) |
Class A | | | - | | | | - | | | | (421,260 | ) | | | (307,113 | ) |
| | | | | | | | | | | | | | | | |
Net increase/(decrease) | | | (101,248 | ) | | | 896,619 | | | | 851,636 | | | | (1,607,157 | ) |
| | | | | | | | | | | | | | | | |
Shares outstanding, beginning of year | | | 930,553 | | | | 33,934 | | | | 2,682,126 | | | | 4,289,283 | |
| | | | | | | | | | | | | | | | |
Shares outstanding, end of year | | | 829,305 | | | | 930,553 | | | | 3,533,762 | | | | 2,682,126 | |
| | | | | | | | | | | | | | | | |
Accumulated undistributed net investment income/(loss) | | $ | (57,770 | ) | | $ | - | | | $ | (3,654 | ) | | $ | 8,257 | |
| | | | | | | | | | | | | | | | |
The accompanying notes are an integral part of the financial statements.
FINANCIAL HIGHLIGHTS
| | | | | | | | | | | | | | | | | | | | | | | | | | | | |
| | | | | | Income/(loss) from investment operations | | | Less dividends and | |
| | | Net asset
value,
beginning
of period | | | Net
investment
income/
(loss)(x) | | | Net realized
and unrealized
gains/(losses)
on investments | | | Total from
investment
operations | | | Dividends
from net
investment
income | | | Distributions
from net
realized
gains | | | Return
of
Capital | |
ICON Bond Fund | | | | | | | | | | | | | | | | | | | | | | | | |
Class S** | | | | | | | | | | | | | | | | | | | | | | | | |
Year ended September 30, 2015 | | $ | 9.90 | | | $ | 0.41 | | | $ | (0.44 | ) | | $ | (0.03 | ) | | $ | (0.51 | ) | | $ | (0.13 | ) | | $ | (0.03 | ) |
Year ended September 30, 2014 | | | 9.89 | | | | 0.43 | (f) | | | 0.15 | | | | 0.58 | | | | (0.44 | ) | | | (0.13 | ) | | | - | |
Year ended September 30, 2013 | | | 10.51 | | | | 0.24 | | | | (0.32 | ) | | | (0.08 | ) | | | (0.24 | ) | | | (0.30 | ) | | | - | |
Year ended September 30, 2012 | | | 10.11 | | | | 0.38 | | | | 0.59 | | | | 0.97 | | | | (0.40 | ) | | | (0.17 | ) | | | - | |
Year ended September 30, 2011 | | | 10.79 | | | | 0.47 | | | | (0.46 | ) | | | 0.01 | | | | (0.47 | ) | | | (0.22 | ) | | | - | |
Class C | | | | | | | | | | | | | | | | | | | | | | | | |
Year ended September 30, 2015 | | | 9.94 | | | | 0.32 | | | | (0.43 | ) | | | (0.11 | ) | | | (0.43 | ) | | | (0.13 | ) | | | (0.03 | ) |
Year ended September 30, 2014 | | | 9.93 | | | | 0.34 | (f) | | | 0.15 | | | | 0.49 | | | | (0.35 | ) | | | (0.13 | ) | | | - | |
Year ended September 30, 2013 | | | 10.55 | | | | 0.15 | | | | (0.32 | ) | | | (0.17 | ) | | | (0.15 | ) | | | (0.30 | ) | | | - | |
Year ended September 30, 2012 | | | 10.15 | | | | 0.31 | | | | 0.57 | | | | 0.88 | | | | (0.31 | ) | | | (0.17 | ) | | | - | |
Year ended September 30, 2011 | | | 10.83 | | | | 0.39 | | | | (0.46 | ) | | | (0.07 | ) | | | (0.39 | ) | | | (0.22 | ) | | | - | |
Class A*** | | | | | | | | | | | | | | | | | | | | | | | | |
Year ended September 30, 2015 | | | 9.86 | | | | 0.36 | | | | (0.41 | ) | | | (0.05 | ) | | | (0.48 | ) | | | (0.13 | ) | | | (0.03 | ) |
Year ended September 30, 2014 | | | 9.89 | | | | 0.43 | (f) | | | 0.12 | | | | 0.55 | | | | (0.45 | ) | | | (0.13 | ) | | | - | |
Year ended September 30, 2013 | | | 10.51 | | | | 0.21 | | | | (0.32 | ) | | | (0.11 | ) | | | (0.21 | ) | | | (0.30 | ) | | | - | |
Year ended September 30, 2012 | | | 10.11 | | | | 0.36 | | | | 0.58 | | | | 0.94 | | | | (0.37 | ) | | | (0.17 | ) | | | - | |
Year ended September 30, 2011 | | | 10.81 | | | | 0.46 | | | | (0.46 | ) | | | - | | | | (0.48 | ) | | | (0.22 | ) | | | - | |
ICON Equity Income Fund | | | | | | | | | | | | | | | | | | | | | | | | |
Class S** | | | | | | | | | | | | | | | | | | | | | | | | |
Year ended September 30, 2015 | | | 14.87 | | | | 0.56 | | | | (0.56 | ) | | | (- | )(c) | | | (0.51 | ) | | | - | | | | - | |
Year ended September 30, 2014 | | | 13.80 | | | | 0.52 | | | | 1.04 | | | | 1.56 | | | | (0.49 | ) | | | - | | | | - | |
Year ended September 30, 2013 | | | 12.18 | | | | 0.47 | | | | 1.65 | | | | 2.12 | | | | (0.50 | ) | | | - | | | | - | |
Year ended September 30, 2012 | | | 10.21 | | | | 0.43 | | | | 2.03 | | | | 2.46 | | | | (0.49 | ) | | | - | | | | - | |
Year ended September 30, 2011 | | | 10.96 | | | | 0.50 | | | | (0.71 | ) | | | (0.21 | ) | | | (0.54 | ) | | | - | | | | - | |
Class C | | | | | | | | | | | | | | | | | | | | | | | | |
Year ended September 30, 2015 | | | 14.96 | | | | 0.40 | | | | (0.56 | ) | | | (0.16 | ) | | | (0.35 | ) | | | - | | | | - | |
Year ended September 30, 2014 | | | 13.88 | | | | 0.36 | | | | 1.06 | | | | 1.42 | | | | (0.34 | ) | | | - | | | | - | |
Year ended September 30, 2013 | | | 12.25 | | | | 0.35 | | | | 1.65 | | | | 2.00 | | | | (0.37 | ) | | | - | | | | - | |
Year ended September 30, 2012 | | | 10.16 | | | | 0.29 | | | | 2.06 | | | | 2.35 | | | | (0.26 | ) | | | - | | | | - | |
Year ended September 30, 2011 | | | 10.85 | | | | 0.37 | | | | (0.72 | ) | | | (0.35 | ) | | | (0.34 | ) | | | - | | | | - | |
Class A*** | | | | | | | | | | | | | | | | | | | | | | | | |
Year ended September 30, 2015 | | | 14.79 | | | | 0.50 | | | | (0.53 | ) | | | (0.03 | ) | | | (0.47 | ) | | | - | | | | - | |
Year ended September 30, 2014 | | | 13.73 | | | | 0.47 | | | | 1.04 | | | | 1.51 | | | | (0.45 | ) | | | - | | | | - | |
Year ended September 30, 2013 | | | 12.12 | | | | 0.45 | | | | 1.63 | | | | 2.08 | | | | (0.47 | ) | | | - | | | | - | |
Year ended September 30, 2012 | | | 10.15 | | | | 0.39 | | | | 2.03 | | | | 2.42 | | | | (0.45 | ) | | | - | | | | - | |
Year ended September 30, 2011 | | | 10.90 | | | | 0.47 | | | | (0.71 | ) | | | (0.24 | ) | | | (0.51 | ) | | | - | | | | - | |
| | | | | | | | | | | | | | | | | | | | | | | | | | | | | | | | | | |
| distributions | | | | | | | | | | | | Ratio of expenses
to average net assets | | | Ratio of net investment
income/(loss)
to average net assets | | | | |
Total
dividends
and
distributions | | | Net asset
value, end
of period | | | Total
return* | | | Net assets,
end of
period (in
thousands) | | |
Before
expense
limitation/
recoupment
and transfer
agent
earnings
credits | | | After
expense
limitation/
recoupment
and transfer
agent
earnings
credits(b) | | | Before
expense
limitation/
recoupment
and transfer
agent
earnings
credits | | | After
expense
limitation/
recoupment
and transfer
agent
earnings
credits | | | Portfolio
turnover
rate(a) | |
| | | | | | | | | | | | | | | | | | | | | | | | | | | | | | | | | | |
| | | | | | | | | | | | | | | | | | | | | | | | | | | | | | | | | | |
| $ | (0.67 | ) | | $ | 9.20 | | | | (0.28 | )% | | $ | 73,152 | | | | 0.91 | % | | | 0.75 | % | | | 4.10 | % | | | 4.26 | % | | | 153.17 | % |
| | (0.57 | ) | | | 9.90 | | | | 6.01 | % | | | 87,675 | | | | 0.86 | % | | | 0.75 | % | | | 4.22 | % | | | 4.33 | %(f) | | | 175.95 | % |
| | (0.54 | ) | | | 9.89 | | | | (0.84 | )% | | | 88,313 | | | | 0.89 | % | | | 0.75 | % | | | 2.19 | % | | | 2.33 | % | | | 96.56 | % |
| | (0.57 | ) | | | 10.51 | | | | 9.93 | % | | | 81,381 | | | | 0.88 | % | | | 0.75 | % | | | 3.46 | % | | | 3.59 | % | | | 51.28 | % |
| | (0.69 | ) | | | 10.11 | | | | 0.15 | % | | | 881 | | | | 1.18 | % | | | 0.75 | % | | | 4.08 | % | | | 4.51 | % | | | 32.13 | % |
| | | | | | | | | | | | | | | | | | | | | | | | | | | | | | | | | | |
| | (0.59 | ) | | | 9.24 | | | | (1.10 | )% | | | 4,142 | | | | 2.19 | % | | | 1.60 | % | | | 2.76 | % | | | 3.35 | % | | | 153.17 | % |
| | (0.48 | ) | | | 9.94 | | | | 5.10 | % | | | 2,879 | | | | 2.27 | % | | | 1.60 | % | | | 2.75 | % | | | 3.42 | %(f) | | | 175.95 | % |
| | (0.45 | ) | | | 9.93 | | | | (1.66 | )% | | | 3,008 | | | | 2.06 | % | | | 1.60 | % | | | 1.02 | % | | | 1.48 | % | | | 96.56 | % |
| | (0.48 | ) | | | 10.55 | | | | 8.98 | % | | | 3,772 | | | | 2.28 | % | | | 1.60 | % | | | 2.35 | % | | | 3.03 | % | | | 51.28 | % |
| | (0.61 | ) | | | 10.15 | | | | (0.68 | )% | | | 3,879 | | | | 2.16 | % | | | 1.60 | % | | | 3.11 | % | | | 3.67 | % | | | 32.13 | % |
| | | | | | | | | | | | | | | | | | | | | | | | | | | | | | | | | | |
| | (0.64 | ) | | | 9.17 | | | | (0.44 | )% | | | 7,838 | | | | 1.36 | % | | | 1.00 | % | | | 3.50 | % | | | 3.86 | % | | | 153.17 | % |
| | (0.58 | ) | | | 9.86 | | | | 5.77 | % | | | 4,278 | | | | 1.44 | % | | | 1.00 | % | | | 3.84 | % | | | 4.28 | %(f) | | | 175.95 | % |
| | (0.51 | ) | | | 9.89 | | | | (1.08 | )% | | | 6,792 | | | | 1.34 | % | | | 1.00 | % | | | 1.71 | % | | | 2.06 | % | | | 96.56 | % |
| | (0.54 | ) | | | 10.51 | | | | 9.66 | % | | | 7,515 | | | | 1.31 | % | | | 1.00 | % | | | 3.13 | % | | | 3.44 | % | | | 51.28 | % |
| | (0.70 | ) | | | 10.11 | | | | (0.02 | )% | | | 249 | | | | 5.83 | % | | | 1.01 | % | | | (0.38 | )% | | | 4.44 | % | | | 32.13 | % |
| | | | | | | | | | | | | | | | | | | | | | | | | | | | | | | | | | |
| | | | | | | | | | | | | | | | | | | | | | | | | | | | | | | | | | |
| | (0.51 | ) | | | 14.36 | | | | (0.17 | )% | | | 22,779 | | | | 1.25 | % | | | 1.20 | % | | | 3.52 | % | | | 3.57 | % | | | 173.95 | % |
| | (0.49 | ) | | | 14.87 | | | | 11.36 | % | | | 8,022 | | | | 1.38 | % | | | 1.20 | % | | | 3.36 | % | | | 3.54 | % | | | 147.56 | % |
| | (0.50 | ) | | | 13.80 | | | | 17.76 | % | | | 5,116 | | | | 1.53 | % | | | 1.21 | % | | | 3.28 | % | | | 3.60 | % | | | 162.82 | % |
| | (0.49 | ) | | | 12.18 | | | | 24.43 | % | | | 7,123 | | | | 1.47 | % | | | 1.21 | % | | | 3.31 | % | | | 3.57 | % | | | 122.39 | % |
| | (0.54 | ) | | | 10.21 | | | | (2.40 | )% | | | 142 | | | | 3.99 | % | | | 1.20 | % | | | 1.45 | % | | | 4.24 | % | | | 142.75 | % |
| | | | | | | | | | | | | | | | | | | | | | | | | | | | | | | | | | |
| | (0.35 | ) | | | 14.45 | | | | (1.16 | )% | | | 6,825 | | | | 2.34 | % | | | 2.20 | % | | | 2.40 | % | | | 2.54 | % | | | 173.95 | % |
| | (0.34 | ) | | | 14.96 | | | | 10.26 | % | | | 5,481 | | | | 2.45 | % | | | 2.20 | % | | | 2.21 | % | | | 2.46 | % | | | 147.56 | % |
| | (0.37 | ) | | | 13.88 | | | | 16.58 | % | | | 5,423 | | | | 2.42 | % | | | 2.21 | % | | | 2.49 | % | | | 2.70 | % | | | 162.82 | % |
| | (0.26 | ) | | | 12.25 | | | | 23.31 | % | | | 5,146 | | | | 2.62 | % | | | 2.20 | % | | | 2.09 | % | | | 2.51 | % | | | 122.39 | % |
| | (0.34 | ) | | | 10.16 | | | | (3.47 | )% | | | 3,874 | | | | 2.53 | % | | | 2.20 | % | | | 2.85 | % | | | 3.18 | % | | | 142.75 | % |
| | | | | | | | | | | | | | | | | | | | | | | | | | | | | | | | | | |
| | (0.47 | ) | | | 14.29 | | | | (0.38 | )% | | | 13,039 | | | | 1.52 | % | | | 1.45 | % | | | 3.14 | % | | | 3.21 | % | | | 173.95 | % |
| | (0.45 | ) | | | 14.79 | | | | 11.07 | % | | | 13,847 | | | | 1.59 | % | | | 1.45 | % | | | 3.08 | % | | | 3.22 | % | | | 147.56 | % |
| | (0.47 | ) | | | 13.73 | | | | 17.49 | % | | | 12,798 | | | | 1.68 | % | | | 1.46 | % | | | 3.24 | % | | | 3.45 | % | | | 162.82 | % |
| | (0.45 | ) | | | 12.12 | | | | 24.10 | % | | | 10,758 | | | | 1.69 | % | | | 1.45 | % | | | 3.11 | % | | | 3.35 | % | | | 122.39 | % |
| | (0.51 | ) | | | 10.15 | | | | (2.66 | )% | | | 2,871 | | | | 1.91 | % | | | 1.45 | % | | | 3.55 | % | | | 4.01 | % | | | 142.75 | % |
FINANCIAL HIGHLIGHTS (CONTINUED)
| | | | | | | | | | | | | | | | | | | | | | | | |
| | | | | | Income/(loss) from investment operations | | | Less dividends and | |
| | | Net asset
value,
beginning
of period | | | Net
investment
income/
(loss)(x) | | | Net realized
and unrealized
gains/(losses)
on investments | | | Total from
investment
operations | | | Dividends
from net
investment
income | | | Distributions
from net
realized
gains | |
ICON Fund | | | | | | | | | | | | | | | | | | | | | | | | |
Class S** | | | | | | | | | | | | | | | | | | | | | | | | |
Year ended September 30, 2015 | | $ | 14.52 | | | $ | (0.02 | ) | | $ | (0.67 | ) | | $ | (0.69 | ) | | $ | - | | | $ | - | |
Year ended September 30, 2014 | | | 14.00 | | | | - | (c) | | | 0.52 | | | | 0.52 | | | | - | | | | - | |
Year ended September 30, 2013 | | | 11.34 | | | | 0.07 | | | | 2.66 | | | | 2.73 | | | | (0.07 | ) | | | - | |
Year ended September 30, 2012 | | | 8.82 | | | | 0.07 | | | | 2.45 | | | | 2.52 | | | | - | | | | - | |
Year ended September 30, 2011 | | | 9.04 | | | | (0.07 | ) | | | (0.15 | ) | | | (0.22 | ) | | | - | | | | - | |
Class C | | | | | | | | | | | | | | | | | | | | | | | | |
Year ended September 30, 2015 | | | 13.15 | | | | (0.18 | ) | | | (0.59 | ) | | | (0.77 | ) | | | - | | | | - | |
Year ended September 30, 2014 | | | 12.82 | | | | (0.14 | ) | | | 0.47 | | | | 0.33 | | | | - | | | | - | |
Year ended September 30, 2013 | | | 10.42 | | | | (0.07 | ) | | | 2.47 | | | | 2.40 | | | | - | | | | - | |
Year ended September 30, 2012 | | | 8.17 | | | | (0.04 | ) | | | 2.29 | | | | 2.25 | | | | - | | | | - | |
Year ended September 30, 2011 | | | 8.36 | | | | (0.05 | ) | | | (0.14 | ) | | | (0.19 | ) | | | - | | | | - | |
Class A*** | | | | | | | | | | | | | | | | | | | | | | | | |
Year ended September 30, 2015 | | | 13.84 | | | | (0.08 | ) | | | (0.63 | ) | | | (0.71 | ) | | | - | | | | - | |
Year ended September 30, 2014 | | | 13.39 | | | | (0.05 | ) | | | 0.50 | | | | 0.45 | | | | - | | | | - | |
Year ended September 30, 2013 | | | 10.85 | | | | 0.02 | | | | 2.56 | | | | 2.58 | | | | (0.04 | ) | | | - | |
Year ended September 30, 2012 | | | 8.46 | | | | 0.03 | | | | 2.36 | | | | 2.39 | | | | - | | | | - | |
Year ended September 30, 2011 | | | 8.67 | | | | (0.07 | ) | | | (0.14 | ) | | | (0.21 | ) | | | - | | | | - | |
ICON Long/Short Fund(d) | | | | | | | | | | | | | | | | | | | | | | | | |
Class S** | | | | | | | | | | | | | | | | | | | | | | | | |
Year ended September 30, 2015 | | | 18.41 | | | | (0.09 | ) | | | 0.07 | | | | (0.02 | ) | | | - | | | | - | |
Year ended September 30, 2014 | | | 17.48 | | | | (0.06 | ) | | | 0.99 | | | | 0.93 | | | | - | | | | - | |
Year ended September 30, 2013 | | | 14.56 | | | | 0.01 | | | | 2.91 | | | | 2.92 | | | | - | | | | - | |
Year ended September 30, 2012 | | | 11.61 | | | | 0.02 | | | | 2.93 | | | | 2.95 | | | | - | | | | - | |
Year ended September 30, 2011 | | | 11.90 | | | | 0.02 | | | | (0.31 | ) | | | (0.29 | ) | | | - | | | | - | |
Class C | | | | | | | | | | | | | | | | | | | | | | | | |
Year ended September 30, 2015 | | | 16.74 | | | | (0.27 | ) | | | 0.07 | | | | (0.20 | ) | | | - | | | | - | |
Year ended September 30, 2014 | | | 16.05 | | | | (0.24 | ) | | | 0.93 | | | | 0.69 | | | | - | | | | - | |
Year ended September 30, 2013 | | | 13.52 | | | | (0.14 | ) | | | 2.67 | | | | 2.53 | | | | - | | | | - | |
Year ended September 30, 2012 | | | 10.89 | | | | (0.11 | ) | | | 2.74 | | | | 2.63 | | | | - | | | | - | |
Year ended September 30, 2011 | | | 11.29 | | | | (0.11 | ) | | | (0.29 | ) | | | (0.40 | ) | | | - | | | | - | |
Class A*** | | | | | | | | | | | | | | | | | | | | | | | | |
Year ended September 30, 2015 | | | 17.99 | | | | (0.15 | ) | | | 0.07 | | | | (0.08 | ) | | | - | | | | - | |
Year ended September 30, 2014 | | | 17.13 | | | | (0.12 | ) | | | 0.98 | | | | 0.86 | | | | - | | | | - | |
Year ended September 30, 2013 | | | 14.31 | | | | (0.02 | ) | | | 2.84 | | | | 2.82 | | | | - | | | | - | |
Year ended September 30, 2012 | | | 11.44 | | | | (0.02 | ) | | | 2.89 | | | | 2.87 | | | | - | | | | - | |
Year ended September 30, 2011 | | | 11.77 | | | | (0.02 | ) | | | (0.31 | ) | | | (0.33 | ) | | | - | | | | - | |
| | | | | | | | | | | | | | | | | | | | | | | | | | | | | | | | | | |
| distributions | | | | | | | | | | | | Ratio of expenses
to average net assets | | | Ratio of net investment
income/(loss)
to average net assets | |
Total
dividends
and
distributions | | | Net asset
value, end
of period | | | Total
return* | | | Net assets,
end of
period (in
thousands) | | |
Before
expense
limitation/
recoupment
and transfer
agent
earnings
credits | | | After
expense
limitation/
recoupment
and transfer
agent
earnings
credits(b) | | | Before
expense
limitation/
recoupment
and transfer
agent
earnings
credits | | | After
expense
limitation/
recoupment
and transfer
agent
earnings
credits | | | Portfolio
turnover
rate(a) | |
| | | | | | | | | | | | | | | | | | | | | | | | | | | | | | | | | | |
| | | | | | | | | | | | | | | | | | | | | | | | | | | | | | | | | | |
| $ | - | | | $ | 13.83 | | | | (4.75 | )% | | $ | 33,695 | | | | 1.09 | % | | | 1.09 | % | | | (0.11 | )% | | | (0.11 | )% | | | 54.33 | % |
| | - | | | | 14.52 | | | | 3.71 | % | | | 41,577 | | | | 1.10 | % | | | 1.10 | % | | | 0.02 | % | | | 0.02 | % | | | 64.51 | % |
| | (0.07 | ) | | | 14.00 | | | | 24.27 | % | | | 6,986 | | | | 1.23 | % | | | 1.23 | % | | | 0.59 | % | | | 0.59 | % | | | 32.68 | % |
| | - | | | | 11.34 | | | | 28.57 | % | | | 22,952 | | | | 1.18 | % | | | 1.18 | % | | | 0.61 | % | | | 0.61 | % | | | 23.73 | % |
| | - | | | | 8.82 | | | | (2.43 | )% | | | 133 | | | | 2.52 | % | | | 2.52 | % | | | (0.72 | )% | | | (0.72 | )% | | | 57.93 | % |
| | | | | | | | | | | | | | | | | | | | | | | | | | | | | | | | | | |
| | - | | | | 12.38 | | | | (5.86 | )% | | | 13,745 | | | | 2.27 | % | | | 2.25 | % | | | (1.29 | )% | | | (1.27 | )% | | | 54.33 | % |
| | - | | | | 13.15 | | | | 2.57 | % | | | 17,050 | | | | 2.26 | % | | | 2.25 | % | | | (1.09 | )% | | | (1.08 | )% | | | 64.51 | % |
| | - | | | | 12.82 | | | | 23.03 | % | | | 18,848 | | | | 2.32 | % | | | 2.26 | % | | | (0.64 | )% | | | (0.58 | )% | | | 32.68 | % |
| | - | | | | 10.42 | | | | 27.54 | % | | | 18,378 | | | | 2.35 | % | | | 2.28 | % | | | (0.48 | )% | | | (0.41 | )% | | | 23.73 | % |
| | - | | | | 8.17 | | | | (2.27 | )% | | | 17,884 | | | | 2.27 | % | | | 2.27 | % | | | (0.50 | )% | | | (0.50 | )% | | | 57.93 | % |
| | | | | | | | | | | | | | | | | | | | | | | | | | | | | | | | | | |
| | - | | | | 13.13 | | | | (5.13 | )% | | | 6,994 | | | | 1.55 | % | | | 1.50 | % | | | (0.57 | )% | | | (0.52 | )% | | | 54.33 | % |
| | - | | | | 13.84 | | | | 3.36 | % | | | 8,076 | | | | 1.56 | % | | | 1.50 | % | | | (0.38 | )% | | | (0.32 | )% | | | 64.51 | % |
| | (0.04 | ) | | | 13.39 | | | | 23.90 | % | | | 10,000 | | | | 1.58 | % | | | 1.51 | % | | | 0.12 | % | | | 0.19 | % | | | 32.68 | % |
| | - | | | | 10.85 | | | | 28.25 | % | | | 12,401 | | | | 1.54 | % | | | 1.54 | % | | | 0.27 | % | | | 0.27 | % | | | 23.73 | % |
| | - | | | | 8.46 | | | | (2.42 | )% | | | 1,245 | | | | 2.52 | % | | | 2.52 | % | | | (0.75 | )% | | | (0.75 | )% | | | 57.93 | % |
| | | | | | | | | | | | | | | | | | | | | | | | | | | | | | | | | | |
| | | | | | | | | | | | | | | | | | | | | | | | | | | | | | | | | | |
| | - | | | | 18.39 | | | | (0.11 | )% | | | 17,196 | | | | 1.37 | % | | | 1.28 | % | | | (0.52 | )% | | | (0.43 | )% | | | 74.34 | % |
| | - | | | | 18.41 | | | | 5.32 | % | | | 16,465 | | | | 1.45 | % | | | 1.32 | % | | | (0.47 | )% | | | (0.34 | )% | | | 64.81 | % |
| | - | | | | 17.48 | | | | 20.05 | % | | | 4,774 | | | | 1.53 | % | | | 1.32 | % | | | (0.14 | )% | | | 0.07 | % | | | 32.63 | % |
| | - | | | | 14.56 | | | | 25.41 | % | | | 3,471 | | | | 2.18 | % | | | 1.35 | % | | | (0.70 | )% | | | 0.13 | % | | | 54.26 | % |
| | - | | | | 11.61 | | | | (2.44 | )% | | | 42 | | | | 7.76 | % | | | 1.65 | % | | | (5.96 | )% | | | 0.15 | % | | | 67.28 | % |
| | | | | | | | | | | | | | | | | | | | | | | | | | | | | | | | | | |
| | - | | | | 16.54 | | | | (1.19 | )% | | | 6,300 | | | | 2.53 | % | | | 2.33 | % | | | (1.68 | )% | | | (1.48 | )% | | | 74.34 | % |
| | - | | | | 16.74 | | | | 4.30 | % | | | 6,932 | | | | 2.57 | % | | | 2.38 | % | | | (1.58 | )% | | | (1.39 | )% | | | 64.81 | % |
| | - | | | | 16.05 | | | | 18.71 | % | | | 6,108 | | | | 2.62 | % | | | 2.37 | % | | | (1.21 | )% | | | (0.96 | )% | | | 32.63 | % |
| | - | | | | 13.52 | | | | 24.15 | % | | | 6,004 | | | | 2.95 | % | | | 2.41 | % | | | (1.44 | )% | | | (0.90 | )% | | | 54.26 | % |
| | - | | | | 10.89 | | | | (3.54 | )% | | | 5,546 | | | | 3.14 | % | | | 2.70 | % | | | (1.38 | )% | | | (0.94 | )% | | | 67.28 | % |
| | | | | | | | | | | | | | | | | | | | | | | | | | | | | | | | | | |
| | - | | | | 17.91 | | | | (0.44 | )% | | | 9,186 | | | | 1.73 | % | | | 1.58 | % | | | (0.89 | )% | | | (0.74 | )% | | | 74.34 | % |
| | - | | | | 17.99 | | | | 5.02 | % | | | 11,160 | | | | 1.81 | % | | | 1.63 | % | | | (0.82 | )% | | | (0.64 | )% | | | 64.81 | % |
| | - | | | | 17.13 | | | | 19.71 | % | | | 8,813 | | | | 1.91 | % | | | 1.61 | % | | | (0.45 | )% | | | (0.16 | )% | | | 32.63 | % |
| | - | | | | 14.31 | | | | 25.09 | % | | | 15,687 | | | | 2.09 | % | | | 1.65 | % | | | (0.58 | )% | | | (0.14 | )% | | | 54.26 | % |
| | - | | | | 11.44 | | | | (2.80 | )% | | | 1,213 | | | | 3.23 | % | | | 1.91 | % | | | (1.46 | )% | | | (0.14 | )% | | | 67.28 | % |
FINANCIAL HIGHLIGHTS (CONTINUED)
| | | | | | | | | | | | | | | | | | | | | | | | |
| | | | | | Income/(loss) from investment operations | | | Less dividends and | |
| | | Net asset
value,
beginning
of period | | | Net
investment
income/
(loss)(x) | | | Net realized
and unrealized
gains/(losses)
on investments | | | Total from
investment
operations | | | Dividends
from net
investment
income | | | Distributions
from net
realized
gains | |
ICON Opportunities Fund | | | | | | | | | | | | | | | | | | | | | | | | |
Year ended September 30, 2015 | | $ | 13.04 | | | $ | (0.09 | ) | | $ | 0.58 | | | $ | 0.49 | | | $ | - | | | $ | (0.21 | ) |
Year ended September 30, 2014 | | | 13.02 | | | | (0.12 | ) | | | 0.41 | (e) | | | 0.29 | | | | - | | | | (0.27 | ) |
Year ended September 30, 2013 | | | 10.00 | | | | (0.01 | ) | | | 3.03 | | | | 3.02 | | | | - | | | | - | |
ICON Risk-Managed Balanced Fund | | | | | | | | | | | | | | | | | | | | | | | | |
Class S** | | | | | | | | | | | | | | | | | | | | | | | | |
Year ended September 30, 2015 | | | 13.98 | | | | 0.18 | | | | 0.01 | | | | 0.19 | | | | (0.15 | ) | | | - | |
Year ended September 30, 2014 | | | 13.40 | | | | 0.24 | | | | 0.56 | | | | 0.80 | | | | (0.22 | ) | | | - | |
Year ended September 30, 2013 | | | 12.32 | | | | 0.24 | | | | 1.04 | | | | 1.28 | | | | (0.20 | ) | | | - | |
Year ended September 30, 2012 | | | 10.88 | | | | 0.15 | | | | 1.44 | | | | 1.59 | | | | (0.15 | ) | | | - | |
Year ended September 30, 2011 | | | 10.96 | | | | 0.12 | | | | (0.05 | ) | | | 0.07 | | | | (0.15 | ) | | | - | |
Class C | | | | | | | | | | | | | | | | | | | | | | | | |
Year ended September 30, 2015 | | | 12.90 | | | | 0.03 | | | | 0.01 | | | | 0.04 | | | | (0.05 | ) | | | - | |
Year ended September 30, 2014 | | | 12.39 | | | | 0.09 | | | | 0.54 | | | | 0.63 | | | | (0.12 | ) | | | - | |
Year ended September 30, 2013 | | | 11.41 | | | | 0.09 | | | | 0.98 | | | | 1.07 | | | | (0.09 | ) | | | - | |
Year ended September 30, 2012 | | | 10.09 | | | | 0.02 | | | | 1.34 | | | | 1.36 | | | | (0.04 | ) | | | - | |
Year ended September 30, 2011 | | | 10.15 | | | | 0.01 | | | | (0.05 | ) | | | (0.04 | ) | | | (0.02 | ) | | | - | |
Class A*** | | | | | | | | | | | | | | | | | | | | | | | | |
Year ended September 30, 2015 | | | 13.69 | | | | 0.14 | | | | - | (c) | | | 0.14 | | | | (0.15 | ) | | | - | |
Year ended September 30, 2014 | | | 13.12 | | | | 0.20 | | | | 0.57 | | | | 0.77 | | | | (0.20 | ) | | | - | |
Year ended September 30, 2013 | | | 12.06 | | | | 0.18 | | | | 1.05 | | | | 1.23 | | | | (0.17 | ) | | | - | |
Year ended September 30, 2012 | | | 10.66 | | | | 0.11 | | | | 1.41 | | | | 1.52 | | | | (0.12 | ) | | | - | |
Year ended September 30, 2011 | | | 10.72 | | | | 0.09 | | | | (0.05 | ) | | | 0.04 | | | | (0.10 | ) | | | - | |
| (x) | Calculated using the average shares method. | |
| * | The total return calculation is for the period indicated and excludes any sales charges. | |
| ** | Class S shares were formerly named Class Z shares prior to January 23, 2012. | |
| *** | Class I shares merged into Class A on January 23, 2012. The results of each class prior to the merger may have been different than what is presented. | |
| (a) | Portfolio turnover is calculated at the Fund level and is not annualized for periods less than a year. | |
| (b) | The Fund’s operating expenses, not including interest expense, are contractually limited to the amounts discussed in Note 3. The ratios in these financial highlights reflect the limitation, including the interest expense. | |
| (c) | Amount less than $0.005. | |
| (d) | The Fund’s operating expenses, not including dividends on short positions, are contractually limited to 1.25% for Class S, 2.30% for Class C and 1.55% for Class A. The ratios in these financial highlights reflect the limitation, including the dividends on short positions. | |
| (e) | The per share amount does not correspond to activity reflected in the Statement of Operations due to timing of shareholder activity during the period. | |
| (f) | Investment income per share of Class S, Class C and Class A reflects a large, non-recurring dividend which amounted to $0.07, $0.06 and $0.08 per share of each class respectively. Excluding this non-recurring dividend, the ratio of net investment income (loss) to average net assets would have been 3.59% for Class S, 2.84% for Class C and 3.55 for Class A. | |
The accompanying notes are an integral part of the financial statements.
| | | | | | | | | | | | | | | | | | | | | | | | | | | | | | | | | | |
| distributions | | | | | | | | | | | | Ratio of expenses
to average net assets | | | Ratio of net investment
income/(loss)
to average net assets | | | | |
Total
dividends
and
distributions | | | Net asset
value, end
of period | | | Total
return* | | | Net assets,
end of
period (in
thousands) | | | Before
expense
limitation/
recoupment
and transfer
agent
earnings
credits | | | After
expense
limitation/
recoupment
and transfer
agent
earnings
credits(b) | | | Before
expense
limitation/
recoupment
and transfer
agent
earnings
credits | | | After
expense
limitation/
recoupment
and transfer
agent
earnings
credits | | | Portfolio
turnover
rate(a) | |
| | | | | | | | | | | | | | | | | | | | | | | | | | | | | | | | | | |
| $ | (0.21 | ) | | $ | 13.32 | | | | 3.75 | % | | $ | 11,047 | | | | 1.58 | % | | | 1.50 | % | | | (0.72 | )% | | | (0.65 | )% | | | 76.17 | % |
| | (0.27 | ) | | | 13.04 | | | | 2.19 | % | | | 12,133 | | | | 2.44 | % | | | 1.50 | % | | | (1.81 | )% | | | (0.87 | )% | | | 45.99 | % |
| | - | | | | 13.02 | | | | 30.20 | % | | | 442 | | | | 12.47 | % | | | 1.52 | % | | | (11.02 | )% | | | (0.07 | )% | | | 52.22 | % |
| | | | | | | | | | | | | | | | | | | | | | | | | | | | | | | | | | |
| | | | | | | | | | | | | | | | | | | | | | | | | | | | | | | | | | |
| | (0.15 | ) | | | 14.02 | | | | 1.35 | % | | | 26,677 | | | | 1.34 | % | | | 1.20 | % | | | 1.09 | % | | | 1.23 | % | | | 118.55 | % |
| | (0.22 | ) | | | 13.98 | | | | 6.02 | % | | | 20,071 | | | | 1.22 | % | | | 1.20 | % | | | 1.72 | % | | | 1.74 | % | | | 137.48 | % |
| | (0.20 | ) | | | 13.40 | | | | 10.51 | % | | | 43,350 | | | | 1.43 | % | | | 1.21 | % | | | 1.65 | % | | | 1.87 | % | | | 98.30 | % |
| | (0.15 | ) | | | 12.32 | | | | 14.65 | % | | | 6,692 | | | | 1.80 | % | | | 1.24 | % | | | 0.69 | % | | | 1.25 | % | | | 71.06 | % |
| | (0.15 | ) | | | 10.88 | | | | 0.51 | % | | | 60 | | | | 7.22 | % | | | 1.23 | % | | | (4.94 | )% | | | 1.05 | % | | | 67.61 | % |
| | | | | | | | | | | | | | | | | | | | | | | | | | | | | | | | | | |
| | (0.05 | ) | | | 12.89 | | | | 0.31 | % | | | 13,061 | | | | 2.38 | % | | | 2.20 | % | | | 0.06 | % | | | 0.24 | % | | | 118.55 | % |
| | (0.12 | ) | | | 12.90 | | | | 5.06 | % | | | 9,469 | | | | 2.33 | % | | | 2.20 | % | | | 0.61 | % | | | 0.74 | % | | | 137.48 | % |
| | (0.09 | ) | | | 12.39 | | | | 9.45 | % | | | 5,667 | | | | 2.72 | % | | | 2.22 | % | | | 0.22 | % | | | 0.72 | % | | | 98.30 | % |
| | (0.04 | ) | | | 11.41 | | | | 13.47 | % | | | 2,243 | | | | 3.25 | % | | | 2.23 | % | | | (0.79 | )% | | | 0.23 | % | | | 71.06 | % |
| | (0.02 | ) | | | 10.09 | | | | (0.45 | )% | | | 2,099 | | | | 2.95 | % | | | 2.23 | % | | | (0.66 | )% | | | 0.06 | % | | | 67.61 | % |
| | | | | | | | | | | | | | | | | | | | | | | | | | | | | | | | | | |
| | (0.15 | ) | | | 13.68 | | | | 1.00 | % | | | 8,446 | | | | 1.70 | % | | | 1.45 | % | | | 0.71 | % | | | 0.96 | % | | | 118.55 | % |
| | (0.20 | ) | | | 13.69 | | | | 5.88 | % | | | 7,014 | | | | 1.65 | % | | | 1.45 | % | | | 1.29 | % | | | 1.49 | % | | | 137.48 | % |
| | (0.17 | ) | | | 13.12 | | | | 10.28 | % | | | 7,819 | | | | 2.12 | % | | | 1.47 | % | | | 0.81 | % | | | 1.46 | % | | | 98.30 | % |
| | (0.12 | ) | | | 12.06 | | | | 14.28 | % | | | 4,045 | | | | 2.16 | % | | | 1.48 | % | | | 0.28 | % | | | 0.96 | % | | | 71.06 | % |
| | (0.10 | ) | | | 10.66 | | | | 0.32 | % | | | 1,982 | | | | 2.08 | % | | | 1.48 | % | | | 0.20 | % | | | 0.80 | % | | | 67.61 | % |
NOTESTO FINANCIAL STATEMENTS
SEPTEMBER 30, 2015
1. Organization
The ICON Bond Fund (“Bond Fund”), ICON Equity Income Fund (“Equity Income Fund”), ICON Fund (“ICON Fund”), ICON Long/Short Fund (“Long/Short Fund”), ICON Opportunities Fund (“Opportunities Fund”) and ICON Risk-Managed Balanced Fund (“Risk-Managed Balanced Fund”) are a series of funds (individually a “Fund” and collectively, the “Funds”). The Funds are part of the ICON Funds (the “Trust”), a Massachusetts business trust registered under the Investment Company Act of 1940, as amended (the “1940 Act”) as an open-end investment management company. Each Fund, with the exception of the Opportunities Fund, offers three classes of shares: Class S, Class C and Class A. The Opportunities Fund is a single-class fund. All classes have equal rights as to earnings, assets and voting privileges except that each Class may bear different distribution fees, registration costs, legal costs, mailing and printing costs and shareholder servicing costs and each Class has exclusive voting rights with respect to its distribution plan. There are currently eleven other active Funds within the Trust. Those Funds are covered by separate prospectuses and shareholder reports.
Each Fund is authorized to issue an unlimited number of no par shares. The investment objective of the Bond Fund is to maximize total return. The investment objective of the Equity Income Fund is modest capital appreciation and income. The investment objective of the ICON Fund is long-term capital appreciation with a secondary objective of capital preservation. The investment objective of the Opportunities Fund is to provide capital appreciation. The investment objective of the Long/Short Fund is capital appreciation. The investment objective of the Risk-Managed Balanced Fund is modest capital appreciation and income.
The Funds, like all investments in securities, have elements of risk, including risk of loss of principal. There is no assurance that the Funds will achieve their investment objectives and may underperform funds with similar investment objectives. An investment concentrated in sectors and industries involves greater risk and volatility than a more diversified investment. Securities of small companies generally involve greater risks than investments in larger companies. Small company securities tend to be more volatile and less liquid than equity securities of larger companies. Investing in fixed income securities such as bonds involves interest rate risk. When interest rates rise, the value of fixed income securities generally decreases. Additionally, the Bond Fund, Equity Income Fund and the Risk-Managed Balanced Fund may invest in medium-and lower-quality debt securities. High-yield bonds, also known as “junk bonds” are speculative investments
| | |
| 72 | | NOTESTO FINANCIAL STATEMENTS |
and involve a greater risk of default and price volatility than U.S. government and other high-quality bonds. Junk bonds are also less liquid (more difficult to sell) than equities and higher credit bonds. These illiquid securities are harder to sell; or value, especially in changing markets, such as periods with rising interest rates.
The ICON Bond Fund may invest in mortgage-related securities, which are interests in pools of mortgage loans made to residential home buyers, including mortgage loans made by savings and loan institutions, mortgage bankers, commercial banks and others. Pools of mortgage loans are assembled as securities for sale to investors by various governmental and government-related organizations. The ICON Bond Fund also may invest in debt securities that are secured with collateral consisting of mortgage related securities (a Collateralized Mortgage Obligations or “CMO”), and in other types of mortgage-related securities. The ICON Equity Income Fund, ICON Fund, ICON Long/Short Fund and ICON Risk-Managed Balanced Fund also may invest in such securities for temporary defensive purposes. CMOs are debt obligations of a legal entity that are collateralized by whole mortgage loans or private mortgage bonds and divided into classes. CMOs are typically structured into multiple classes, often referred to as “tranches,” with each class bearing a different stated maturity and entitled to a different schedule for payments of principal and interest, including prepayments. CMOs may be less liquid and may exhibit greater price volatility than other types of mortgage-related or asset-backed securities. Many of the risks of investing in mortgage-related securities secured by commercial mortgage loans reflect the effects of local and other economic conditions on real estate markets, the ability of tenants to make lease payments, and the ability of a property to attract and retain tenants. These securities may be less liquid and may exhibit greater price volatility than other types of mortgage-related or other asset-backed securities. Other asset-backed securities are created from many types of assets, including auto loans, credit card receivables, home equity loans, and student loans.
The Long/Short Fund engages in short selling; there are risks associated with selling short, including the risk that the Long/Short Fund may have to cover its short position at a higher price than the short sale, resulting in a loss. The Long/Short Fund’s loss on a short sale is potentially unlimited as a loss occurs when the value of a security sold short increases.
The Risk-Managed Balanced Fund invests in call options; selling/writing call options involve certain risks, such as limited gains and lack of liquidity of the underlying securities, and are not suitable for all investors.
| | | | |
| NOTESTO FINANCIAL STATEMENTS | | | 73 | |
NOTESTO FINANCIAL STATEMENTS (CONTINUED)
Investments in foreign securities and currency transactions may involve certain considerations and risks not typically associated with those of U.S. dollar-denominated transactions as a result of, among other factors, the possibility of less government supervision and regulation of foreign securities markets and the possibility of political or economic instability. Financial statements of foreign companies are governed by different accounting, auditing, and financial standards than U.S. companies and may be less transparent and uniform than in the United States. Many corporate governance standards, which help ensure the integrity of public information in the United States, may not exist in some foreign countries. In general, there may be less governmental supervision of foreign stock exchanges and securities brokers and issuers. There are also risks associated with small- and mid-cap investing, including limited product lines, less liquidity and small market share.
The Equity Income Fund, ICON Fund, Long/Short Fund and Opportunities Fund have significant weights in the Financial Sector which may cause the Fund’s performance to be susceptible to the economic, business and/or other developments that may affect this sector.
In the normal course of business, the Funds may enter into various agreements that provide for general indemnifications. Each Fund’s maximum exposure under these arrangements is unknown as any potential exposure involving future claims that may be made against each Fund is unknown. However, based on experience, the Funds expect the risk of loss to be remote.
2. Significant Accounting Policies
The following is a summary of significant accounting policies consistently followed by the Funds in the preparation of their financial statements. The preparation of financial statements in conformity with accounting principles generally accepted in the United States of America requires management to make certain estimates and assumptions that affect the reported amounts of assets and liabilities, disclosure of contingent assets and liabilities at the date of the financial statements, and the reported amounts of income and expenses during the reporting period. Actual results may differ from these estimates.
Investment Valuation
The Funds’ securities and other assets, excluding options on securities indexes, are valued at the closing price as of the close of regular trading on the New York Stock Exchange (the “NYSE”) (normally 4 p.m. Eastern
| | |
| 74 | | NOTESTO FINANCIAL STATEMENTS |
Standard Time) each day the NYSE is open, except that securities traded primarily on the NASDAQ Stock Market (“NASDAQ”) are normally valued by the Funds at the NASDAQ Official Closing Price provided by NASDAQ each business day. Options on securities indexes are valued at the close of the Chicago Board Options Exchange (normally 4:15 p.m. Eastern Standard Time) on each day the New York Stock Exchange is open for trading.
The Funds use pricing services to obtain the market value of securities in their portfolios; if a pricing service is not able to provide a price, or the pricing service’s valuation is considered inaccurate or does not in the Funds’ judgment reflect the market value of the security, prices may be obtained through market quotations from independent broker/dealers. If market quotations from these sources are not readily available, the Funds’ securities or other assets are valued at fair value as determined in good faith by the Funds’ Board of Trustees (“Board”) or pursuant to procedures approved by the Board.
Lacking any sales that day, a security is valued at the current closing bid price (or yield equivalent thereof) or based on quotes obtained from dealers making a market for the security. Options are valued at their closing mid-price on the market with the most volume. Mid-price is the average of the closing bid and closing ask prices. Debt securities with a remaining maturity of greater than 60 days are valued using the evaluated bid price supplied by the pricing service. The evaluated bid price supplied by the pricing service is based upon a matrix valuation system which considers such factors as security prices, yields, maturities and ratings. Short-term debt securities with remaining maturities of 60 days or less are generally valued at amortized cost or original cost plus accrued interest, which approximates market value. Currency rates as of the close of the NYSE are used to convert foreign security values into U.S. dollars.
Mortgage-related and asset-backed securities are typically issued as separate tranches, or classes, of securities within each deal. These securities are also normally valued by pricing service providers that use broker-dealer quotations, reported trades or valuation estimates from their internal pricing models. The pricing models for these securities usually consider tranche level attributes, current market data, estimated cash flows and market based yield spreads for each tranche, and incorporate deal collateral performance, as available. Mortgage-related and asset-backed securities that use similar valuation techniques and inputs as described above are categorized as Level 2 of the fair value hierarchy.
| | | | |
| NOTESTO FINANCIAL STATEMENTS | | | 75 | |
NOTESTO FINANCIAL STATEMENTS (CONTINUED)
Securities of investment companies that trade on an exchange are valued at the last sales price or official closing price as of the close of the customary trading session on the exchange where the security is principally traded. Investments in shares of funds that are not traded on an exchange are valued at the end of day net asset value per share of such fund. Securities in the underlying funds, including restricted securities are valued in accordance with the valuation policy of such fund.
The Funds’ securities traded in countries outside of the Western Hemisphere are fair valued daily by utilizing the quotations of an independent pricing service, unless the Board determines that use of another valuation methodology is appropriate. The purposes of daily fair valuation are to avoid stale prices and to take into account, among other things, any significant events occurring after the close of foreign markets. The pricing service uses statistical analyses and quantitative models to adjust local market prices using factors such as subsequent movements and changes in the prices of indexes, securities and exchange rates in other markets to determine fair value as of the time a Fund calculates its net asset value (“NAV”). The valuation assigned to fair-value securities for purposes of calculating a Fund’s NAV may differ from the security’s most recent closing market price and from the prices used by other mutual funds to calculate their NAVs.
Various inputs are used to determine the value of the Funds’ investments. These inputs are summarized in the three broad levels listed below:
Level 1 — quoted prices in active markets for identical securities.
Level 2 — significant observable inputs other than Level 1 quoted prices (including, but not limited to, quoted prices for similar securities, interest rates, prepayment speeds, and credit risk).
Level 3 — significant unobservable inputs.
Observable inputs are those based on market data obtained from sources independent of the Funds, and unobservable inputs reflect the Funds’ own assumptions based on the best information available. The input levels are not necessarily an indication of the risk or liquidity associated with investments at that level. For example, non-U.S. equity securities actively traded in foreign markets may be reflected in Level 2 despite the availability of closing prices, because the Funds evaluate and determine whether those closing prices reflect fair value at the close of the NYSE or require
| | |
| 76 | | NOTESTO FINANCIAL STATEMENTS |
adjustment, as described above. The following table summarizes the Funds’ investments, based on the inputs used to determine their values on September 30, 2015:
| | | | | | | | | | | | | | | | |
| | | Level 1 | | | Level 2 | | | Level 3 | | | Total | |
| | | | | | | | | | | | | | | | |
ICON Bond Fund* | | | | | | | | | | | | | | | | |
Assets | | | | | | | | | | | | | | | | |
Corporate Bonds | | $ | - | | | $ | 53,933,376 | | | $ | - | | | $ | 53,933,376 | |
U.S. Treasury Obligations | | | - | | | | 5,794,313 | | | | - | | | | 5,794,313 | |
Collateralized Mortgage Obligations | | | - | | | | 6,462,853 | | | | - | | | | 6,462,853 | |
Municipal Bond | | | - | | | | 1,073,690 | | | | - | | | | 1,073,690 | |
Foreign Corporate Bonds | | | - | | | | 2,657,127 | | | | - | | | | 2,657,127 | |
Preferred Stocks | | | 5,712,442 | | | | - | | | | - | | | | 5,712,442 | |
Closed-End Mutual Funds | | | 7,969,801 | | | | - | | | | - | | | | 7,969,801 | |
Collateral for Securities on Loan | | | - | | | | 974,488 | | | | - | | | | 974,488 | |
Short-Term Investments | | | - | | | | 923,476 | | | | - | | | | 923,476 | |
| | | | | | | | | | | | | | | | |
Total | | $ | 13,682,243 | | | $ | 71,819,323 | | | $ | - | | | $ | 85,501,566 | |
| | | | | | | | | | | | | | | | |
ICON Equity Income Fund* | | | | | | | | | | | | | | | | |
Assets | | | | | | | | | | | | | | | | |
Common Stocks | | $ | 36,322,441 | | | $ | - | | | $ | - | | | $ | 36,322,441 | |
Corporate Bonds | | | - | | | | 2,758,335 | | | | - | | | | 2,758,335 | |
Preferred Stocks | | | 1,140,208 | | | | - | | | | - | | | | 1,140,208 | |
Convertible Preferred Stock | | | 817,600 | | | | - | | | | - | | | | 817,600 | |
Collateral for Securities on Loan | | | - | | | | 4,775,526 | | | | - | | | | 4,775,526 | |
Short-Term Investments | | | - | | | | 986,907 | | | | - | | | | 986,907 | |
| | | | | | | | | | | | | | | | |
Total | | $ | 38,280,249 | | | $ | 8,520,768 | | | $ | - | | | $ | 46,801,017 | |
| | | | | | | | | | | | | | | | |
ICON Fund* | | | | | | | | | | | | | | | | |
Assets | | | | | | | | | | | | | | | | |
Common Stocks | | $ | 53,724,901 | | | $ | - | | | $ | - | | | $ | 53,724,901 | |
Collateral for Securities on Loan | | | - | | | | 1,930,400 | | | | - | | | | 1,930,400 | |
Short-Term Investments | | | - | | | | 756,401 | | | | - | | | | 756,401 | |
| | | | | | | | | | | | | | | | |
Total | | $ | 53,724,901 | | | $ | 2,686,801 | | | $ | - | | | $ | 56,411,702 | |
| | | | | | | | | | | | | | | | |
ICON Long/Short Fund* | | | | | | | | | | | | | | | | |
Assets | | | | | | | | | | | | | | | | |
Common Stocks | | $ | 32,325,458 | | | $ | - | | | $ | - | | | $ | 32,325,458 | |
Collateral for Securities on Loan | | | - | | | | 2,281,325 | | | | - | | | | 2,281,325 | |
| | | | | | | | | | | | | | | | |
Total | | $ | 32,325,458 | | | $ | 2,281,325 | | | $ | - | | | $ | 34,606,783 | |
| | | | | | | | | | | | | | | | |
| | | | |
| NOTESTO FINANCIAL STATEMENTS | | | 77 | |
NOTESTO FINANCIAL STATEMENTS (CONTINUED)
| | | | | | | | | | | | | | | | |
| | | Level 1 | | | Level 2 | | | Level 3 | | | Total | |
| | | | | | | | | | | | | | | | |
ICON Opportunities Fund* | | | | | | | | | | | | | | | | |
Assets | | | | | | | | | | | | | | | | |
Common Stocks | | $ | 10,801,101 | | | $ | - | | | $ | - | | | $ | 10,801,101 | |
Short-Term Investments | | | - | | | | 252,380 | | | | - | | | | 252,380 | |
| | | | | | | | | | | | | | | | |
Total | | $ | 10,801,101 | | | $ | 252,380 | | | $ | - | | | $ | 11,053,481 | |
| | | | | | | | | | | | | | | | |
ICON Risk-Managed Balanced Fund* | | | | | | | | | | | | | | | | |
Assets | | | | | | | | | | | | | | | | |
Common Stocks | | $ | 26,069,559 | | | $ | - | | | $ | - | | | $ | 26,069,559 | |
Corporate Bonds | | | - | | | | 8,625,135 | | | | - | | | | 8,625,135 | |
U.S. Treasury Obligations | | | - | | | | 2,977,706 | | | | - | | | | 2,977,706 | |
Collateralized Mortgage Obligations | | | - | | | | 1,027,264 | | | | - | | | | 1,027,264 | |
Foreign Corporate Bonds | | | - | | | | 530,033 | | | | - | | | | 530,033 | |
Preferred Stocks | | | 2,151,388 | | | | - | | | | - | | | | 2,151,388 | |
Closed-End Mutual Funds | | | 2,634,711 | | | | - | | | | - | | | | 2,634,711 | |
Exchange Traded Funds | | | 2,023,359 | | | | - | | | | - | | | | 2,023,359 | |
Put Options Purchased | | | 122,575 | | | | - | | | | - | | | | 122,575 | |
Collateral for Securities on Loan | | | - | | | | 1,520,474 | | | | - | | | | 1,520,474 | |
Short-Term Investments | | | - | | | | 2,580,085 | | | | - | | | | 2,580,085 | |
| | | | | | | | | | | | | | | | |
Total | | $ | 33,001,592 | | | $ | 17,260,697 | | | $ | - | | | $ | 50,262,289 | |
| | | | | | | | | | | | | | | | |
| * | Please refer to the Schedule of Investments and the Sector/Industry Classification and Credit Diversification tables for additional security details. |
No Level 3 securities were held in any of the Funds at September 30, 2015.
For the year ended September 30, 2015, there was no transfer activity between Level 1, Level 2 or Level 3. The end of period timing recognition is used for transfers between levels of the Fund’s assets and liabilities.
Fund Share Valuation
Fund shares are sold and redeemed on a daily basis at net asset value. Net asset value per share is determined daily as of the close of trading on the NYSE on each day the NYSE is open for trading by dividing the total value of the Fund’s investments and other assets, less liabilities, by the number of Fund shares outstanding.
| | |
| 78 | | NOTESTO FINANCIAL STATEMENTS |
Foreign Currency Translation
The accounting records of the Funds are maintained in U.S. dollars. Investment securities and other assets and liabilities denominated in a foreign currency are translated daily into U.S. dollars at the prevailing rates of exchange. Income and expenses are translated into U.S. dollars at the prevailing exchange rate on the respective dates of the transactions. Purchases and sales of securities are translated into U.S. dollars at the contractual currency exchange rates established at the time of each trade.
The Funds do not isolate that portion of the results of operations resulting from changes in foreign exchange rates on investments from the fluctuations arising from changes in market prices of securities held. Net unrealized appreciation or depreciation on investments and foreign currency translations arise from changes in the value of assets and liabilities, resulting from changes in the exchange rates and changes in market prices of securities held.
Options Transactions
The Funds’ use of derivatives for the year ended September 30, 2015 was limited to purchased and written options.
The Risk-Managed Balanced Fund’s primary investment strategy involves the use of options. Each of the other Funds may also purchase and/or write (sell) call and put options on any security in which it may invest. The Funds utilize options to hedge against changes in market conditions or to provide market exposure while trying to reduce transaction costs.
Option contracts involve market risk and liquidity risk and can be highly volatile. Should prices of securities or securities indexes move in an unexpected manner, the Funds may not achieve the desired benefits and may realize losses and thus be in a worse position than if such strategies had not been utilized.
When a Fund writes a put or call option, an amount equal to the premium received is included on the Statement of Assets and Liabilities as a liability. The amount of the liability is subsequently marked-to-market to reflect the current market value of the option. If an option expires on its stipulated expiration date or if the Fund enters into a closing purchase transaction, a gain or loss is realized. If a written call option on an individual security is exercised, a gain or loss is realized for the sale of the underlying security, and the proceeds from the sale are increased by the premium originally received. If a written call option on a securities index is exercised, a gain or
| | | | |
| NOTESTO FINANCIAL STATEMENTS | | | 79 | |
NOTESTO FINANCIAL STATEMENTS (CONTINUED)
loss is realized as determined by the premium originally received, the exercise price and the market value of the index. If a written put option on an individual security is exercised, the cost of the security acquired is decreased by the premium originally received. As a writer of an option, a Fund bears the market risk of an unfavorable change in the price of the individual security or securities index underlying the written option. Additionally, written call options may involve the risk of limited gains.
Each Fund may also purchase put and call options. When a Fund purchases a put or call option, an amount equal to the premium paid is included on the Fund’s Statement of Assets and Liabilities as an investment, and is subsequently marked-to-market to reflect the current market value of the option. If an option expires on the stipulated expiration date or if the Fund enters into a closing purchase or sale transaction, a gain or loss is realized. If the Fund exercises a call option on an individual security, the cost of the security acquired is increased by the premium paid for the call. If the Fund exercises a put option on an individual security, a gain or loss is realized from the sale of the underlying security, and the proceeds from such a sale are decreased by the premium originally paid. If the Fund exercises a put or a call option on a security index, a gain or loss is realized as determined by the premium originally paid, the exercise price and the market value of the index. Written and purchased options are non-income producing securities.
As of September 30, 2015, the Risk-Managed Balanced Fund engaged in written call and purchased put options transactions. All open option contracts are included on each Fund’s Schedule of Investments. The Risk-Managed Balanced Fund’s written options are collateralized by cash and/or securities held in a segregated account at the Fund’s custodian. The securities pledged as collateral are included on the Schedule of Investments. Such collateral is restricted from the Fund’s use. The cash collateral held for the custodian and/or borrowings from the custodian are included on the Statement of Assets and Liabilities.
The number of options contracts written and the premiums received by the Risk-Managed Balanced Fund during the year ended September 30, 2015, were as follows:
| | | | | | | | |
| | | Risk-Managed Balanced Fund | |
| | | Number of
Contracts | | | Premiums Received | |
Options outstanding, beginning of period | | | 20 | | | $ | 57,732 | |
Options written during period | | | 295 | | | | 384,152 | |
Options closed during period | | | (315 | ) | | | (441,884 | ) |
| | | | | | | | |
Options outstanding, end of period | | | - | | | $ | - | |
| | | | | | | | |
| | |
| 80 | | NOTESTO FINANCIAL STATEMENTS |
The following is a summary of how these derivatives are treated in the financial statements and their impact on the Funds:
Fair Values of Derivative Instruments as of September 30, 2015
| | | | | | | | | | |
| | | Asset Derivatives | | | Liability Derivatives |
Derivatives not accounted for as hedging instruments | | Statement of Assets and Liabilities Location | | Fair
Value | | | Statement of Assets and Liabilities Location | | Fair
Value |
Purchased option contracts | | | | | | | | | | |
Equity risk | | | | | | | | | | |
ICON Risk-Managed Balanced Fund | | Investments,
at value | | $ | 122,575 | | | | | |
Amount of Realized Gain or (Loss) on Derivatives Recognized in Operations
| | | | | | |
Derivatives not accounted for as hedging instruments | | Location of Gain/(Loss) on Derivatives
Recognized in Operations | | Amount | |
Purchased option contracts | | | | | | |
Equity risk | | | | | | |
ICON Risk-Managed Balanced Fund | | Net realized gain/(loss) from investment transactions | | $ | (15,979 | ) |
Written option contracts | | | | | | |
Equity risk | | | | | | |
ICON Risk-Managed Balanced Fund | | Net realized gain/(loss) from written option transactions | | $ | 152,398 | |
Change in Unrealized Appreciation/(Depreciation) on Derivatives Recognized in Operations
| | | | | | |
Derivatives not accounted for as hedging instruments | | Location of Gain/(Loss) on Derivatives Recognized in Operations | | Amount | |
Purchased option contracts | | | | | | |
Equity risk | | | | | | |
ICON Risk-Managed Balanced Fund | | Change in unrealized net appreciation/(depreciation) on investments | | $ | (47,655 | ) |
Written option contracts | | | | | | |
Equity risk | | | | | | |
ICON Risk-Managed Balanced Fund | | Change in unrealized net appreciation/(depreciation) on written options | | $ | (21,732 | ) |
| | | | |
| NOTESTO FINANCIAL STATEMENTS | | | 81 | |
NOTESTO FINANCIAL STATEMENTS (CONTINUED)
For the year ended September 30, 2015, the Fund’s quarterly holdings of options contracts were as follows:
| | | | | | | | |
| | | ICON Risk-
Managed
Balanced Fund | | | ICON Risk-
Managed
Balanced Fund | |
| Quarter Ended | | Number of Purchased Options
Contracts Outstanding | | | Number of
Written Options
Contracts
Outstanding | |
December 31, 2014 | | | 30 | | | | 25 | |
March 31, 2015 | | | 60 | | | | 10 | |
June 30, 2015 | | | 60 | | | | 10 | |
September 30, 2015 | | | 55 | | | | - | |
The Funds value derivatives at fair value, as described above, and recognize changes in fair value currently in the results of operations. Accordingly, the Funds do not follow hedge accounting, even for derivatives employed as economic hedges.
Short Sales
The Long/Short Fund may engage in short sales (selling securities it does not own) as part of its normal investment activities. The Long/Short Fund enters into short positions in equity securities identified as being overvalued in management’s opinion.
Short sales involve market risk. If a security sold short increases in price, the Long/Short Fund may have to cover its short position at a higher price than the short sale price, resulting in a loss. These short sales are collateralized by cash and/or securities held with the Fund’s prime broker and in a segregated account at the Fund’s prime broker. The collateral required is determined daily by reference to the market value of the short positions. Such collateral for the Fund is restricted from use. The cash collateral that is restricted from use is included on the Statement of Assets and Liabilities as “Deposits for short sales.” The securities pledged as collateral that are restricted from use are included on the Schedule of Investments. Dividends received on short sales are treated as an expense on the Statement of Operations. Liabilities for securities sold short are closed out by purchasing the applicable securities for delivery to the Fund’s prime broker. As of September 30, 2015, the Long/Short Fund did not engage in short selling.
| | |
| 82 | | NOTESTO FINANCIAL STATEMENTS |
Securities Lending
Under procedures adopted by the Board, the Funds may lend securities to certain approved brokers, dealers and other financial institutions to earn additional income. The Funds retain certain benefits of owning the securities, including receipt of dividends or interest generated by the security, but give up other rights including the right to vote proxies. The Funds retain the ability to recall the loans at any time and could do so in order to vote proxies or to sell the loaned securities. Each loan is collateralized by cash that generally exceeds the value of the securities on loan. The market value of the loaned securities is determined daily at the close of business of the Funds and any additional required collateral is delivered to each Fund on the next business day.
Generally, in the event of borrower default, the Funds have the right to use the collateral to offset any losses incurred. In the event the Funds are delayed or prevented from exercising their rights to dispose of the collateral, there may be a potential loss to the Funds. Some of these losses may be indemnified by the lending agent.
The Funds have elected to invest the cash collateral in the State Street Navigator Prime Portfolio which is disclosed on the Schedule of Investments. The Funds bear the risk of loss with respect to the investment of collateral. The net securities lending income earned by the Funds for the year ended September 30, 2015, is included in the Statement of Operations.
For the year ended September 30, 2015, the following Fund had securities with the following values on loan:
| | | | | | | | |
| Fund | | Loaned Securities | | | Collateral | |
ICON Bond Fund | | $ | 926,428 | | | $ | 974,488 | |
ICON Equity Income Fund | | | 4,718,991 | | | | 4,775,526 | |
ICON Fund | | | 1,879,600 | | | | 1,930,400 | |
ICON Long/Short Fund | | | 2,278,335 | | | | 2,281,325 | |
ICON Risk-Managed Balanced Fund | | | 1,502,085 | | | | 1,520,474 | |
The value of the collateral above could include collateral held for securities that were sold on or before September 30, 2015. It may also include collateral received from the pre-funding of security loans.
Income Taxes, Dividends, and Distributions
The Funds intend to continue to qualify as regulated investment companies under Subchapter M of the Internal Revenue Code and, accordingly, the
| | | | |
| NOTESTO FINANCIAL STATEMENTS | | | 83 | |
NOTESTO FINANCIAL STATEMENTS (CONTINUED)
Funds will generally not be subject to federal and state income taxes or federal excise taxes to the extent that they intend to make sufficient distributions of net investment income and net realized capital gains.
Dividends paid by the Funds from net investment income and distributions of net realized short-term gains are, for federal income tax purposes, taxable as ordinary income to shareholders.
Dividends and distributions to shareholders are recorded by the Funds on the ex-dividend/distribution date. The Bond Fund distributes net investment income, if any, to shareholders monthly. The Equity Income Fund and the Risk-Managed Balanced Fund intend to distribute net investment income, if any, to shareholders quarterly. The other Funds distribute income, if any, annually. The Funds distribute net realized capital gains, if any, to shareholders at least annually, if not offset by capital loss carryforwards. The Funds may utilize equalization accounting for tax purposes and designate earnings and profits, including net realized gains distributed to shareholders on redemption of shares, as part of the dividends paid deduction for income tax purposes. Income distributions and capital gain distributions are determined in accordance with income tax regulations, which may differ from accounting principles generally accepted in the United States of America.
Management has analyzed the Funds’ tax positions taken on federal income tax returns for all open tax periods and has concluded that no provision for federal income tax is required in the Funds’ financial statements.
The Funds file U.S. tax returns. While the statute of limitations remains open to examine the Funds’ U.S. tax returns filed for the past three years, no examinations are in progress or anticipated at this time. The Funds are not aware of any tax positions for which it is reasonably possible that the total amounts of unrecognized tax benefits will significantly change in the next twelve months.
Certain foreign countries impose a capital gains tax which is accrued by the Funds based on the unrealized appreciation, if any, on affected securities. Any accrual would reduce a Fund’s NAV. The tax is paid when the gain is realized.
Investment Income
Dividend income is recorded on the ex-dividend date. Non-cash dividends included in dividend income, if any, are recorded at the fair value of the
| | |
| 84 | | NOTESTO FINANCIAL STATEMENTS |
securities received. Interest income is accrued as earned. Certain dividends from foreign securities are recorded as soon as the Funds are informed of the dividend if such information is obtained subsequent to the ex-dividend date. Discounts and premiums on fixed income securities purchased are accreted or amortized to income over the life of the respective securities. Paydown gains and losses on mortgage-related and other asset-backed securities are recorded as components of interest income on the Statements of Operations.
Investment Transactions
Security transactions are accounted for no later than one business day after the trade date. However, for financial reporting purposes, security transactions are accounted for on the trade date. Gains and losses on securities sold are determined on the basis of identified cost.
Allocation of Expenses
Each class of a Fund’s shares bears expenses incurred specifically on its behalf and, in addition, each class bears a portion of general expenses, based upon relative net assets of each class. Expenses which cannot be directly attributed to a specific Fund in the Trust are apportioned between all Funds in the Trust based upon relative net assets. In calculating the net asset value per share of each class, investment income, realized and unrealized gains and losses and expenses other than class-specific expenses are allocated daily to each class of shares based upon the proportion of net assets.
Below are the class level expenses that are included on the Statement of Operations:
| | | | | | | | | | | | |
| Fund | | Legal Expense | | | Printing
and Postage Expense | | | Transfer Agent Expense | |
ICON Bond Fund | | | | |
Class S | | $ | 9,310 | | | $ | 15,146 | | | $ | 68,381 | |
Class C | | | 443 | | | | 926 | | | | 7,597 | |
Class A | | | 853 | | | | 1,224 | | | | 9,830 | |
ICON Equity Income Fund | | | | |
Class S | | | 2,537 | | | | 6,837 | | | | 33,430 | |
Class C | | | 746 | | | | 1,239 | | | | 11,080 | |
Class A | | | 1,542 | | | | 3,330 | | | | 22,899 | |
| | | | |
| NOTESTO FINANCIAL STATEMENTS | | | 85 | |
NOTESTO FINANCIAL STATEMENTS (CONTINUED)
| | | | | | | | | | | | |
| Fund | | Legal Expense | | | Printing
and Postage Expense | | | Transfer Agent Expense | |
ICON Fund | | | | |
Class S | | $ | 4,830 | | | $ | 12,891 | | | $ | 39,769 | |
Class C | | | 1,962 | | | | 3,964 | | | | 36,010 | |
Class A | | | 966 | | | | 1,890 | | | | 16,236 | |
ICON Long/Short Fund | | | | |
Class S | | | 2,295 | | | | 6,688 | | | | 38,807 | |
Class C | | | 829 | | | | 1,855 | | | | 15,919 | |
Class A | | | 1,215 | | | | 3,695 | | | | 20,082 | |
ICON Risk-Managed Balanced Fund | | | | |
Class S | | | 1,707 | | | | 1,409 | | | | 26,696 | |
Class C | | | 1,160 | | | | 2,774 | | | | 17,806 | |
Class A | | | 849 | | | | 2,477 | | | | 16,029 | |
3. Fees and Other Transactions with Affiliates
Investment Advisory Fees
ICON Advisers, Inc. (“ICON Advisers”) serves as investment adviser to the Funds and is responsible for managing the Funds’ portfolios of securities. ICON Advisers receives a monthly management fee that is computed daily at an annual rate of 0.60% of average daily net assets of the Bond Fund, 0.75% of average daily net assets of the Equity Income Fund, ICON Fund, Opportunities Fund and Risk-Managed Balanced Fund, and 0.85% of average daily net assets of the Long/Short Fund.
ICON Advisers has contractually agreed to limit the Funds’ expenses (exclusive of brokerage, interest, taxes, dividends on short sales and extraordinary expenses) to the extent necessary to ensure that the Funds’ expenses do not exceed the following amounts:
| | | | | | | | | | | | | | | | |
| Fund | | Fund | | | Class S | | | Class C | | | Class A | |
ICON Bond Fund | | | - | | | | 0.75% | | | | 1.60% | | | | 1.00% | |
ICON Equity Income Fund | | | - | | | | 1.20% | | | | 2.20% | | | | 1.45% | |
ICON Fund | | | - | | | | 1.25% | | | | 2.25% | | | | 1.50% | |
ICON Long/Short Fund | | | - | | | | 1.25% | | | | 2.30% | | | | 1.55% | |
ICON Opportunities Fund | | | 1.50% | | | | - | | | | - | | | | - | |
ICON Risk-Managed Balanced Fund | | | - | | | | 1.20% | | | | 2.20% | | | | 1.45% | |
The Funds’ expense limitations, excluding the Bond Fund Class A, all classes of the ICON Fund and the Opportunities Fund, will continue in effect until at least January 31, 2021. Limitations for the Bond Fund Class A, all classes of
| | |
| 86 | | NOTESTO FINANCIAL STATEMENTS |
the ICON Fund and the Opportunities Fund will continue in effect until at least January 31, 2016. To the extent ICON Advisers reimburses or absorbs fees and expenses, it may seek payment of such amounts for up to three years after the expenses were reimbursed or absorbed. A Fund will make no such payment, however, if the total Fund operating expenses exceed the expense limits in effect at the time the expenses were reimbursed or at the time these payments are proposed.
As of September 30, 2015 the following amounts were available for recoupment by ICON Advisers based upon their potential expiration dates:
| | | | | | | | | | | | |
| Fund | | 2016 | | | 2017 | | | 2018 | |
ICON Bond Fund | | $ | 148,484 | | | $ | 136,560 | | | $ | 180,067 | |
ICON Equity Income Fund | | | 52,885 | | | | 42,058 | | | | 31,087 | |
ICON Fund | | | 18,312 | | | | 6,978 | | | | 6,855 | |
ICON Long/Short Fund | | | 56,161 | | | | 50,612 | | | | 50,987 | |
ICON Opportunities Fund | | | 21,364 | | | | 22,580 | | | | 8,824 | |
ICON Risk-Managed Balanced Fund | | | 40,835 | | | | 29,444 | | | | 61,973 | |
Accounting, Custody and Transfer Agent Fees
State Street Bank and Trust Company (“State Street”) serves as the fund accounting agent for the Funds. For its services, the Trust pays State Street a fee that is calculated daily and paid monthly at an annual rate based on the aggregate average daily net assets of the Trust.
State Street is the custodian of the Trust’s investments. For its services, the Trust pays State Street asset-based fees that vary according to the number of positions and transactions, plus out-of-pocket expenses.
Boston Financial Data Services, Inc. (“BFDS”) is the Trust’s transfer agent. For these services, the Trust pays a per account fee, plus certain other transaction Cusip charges and out-of-pocket expenses. BFDS may pay each Fund transfer agent earnings credits. Transfer agent earnings credits are credits received for interest which results from overnight balances used by BFDS for clearing shareholder transactions.
Administrative Services
The Trust has entered into an administrative services agreement with ICON Advisers pursuant to which ICON Advisers oversees the administration of the Trust’s business and affairs. This agreement provides for an annual fee of 0.05% on the Trust’s first $1.5 billion of average daily net assets, 0.045% on
| | | | |
| NOTESTO FINANCIAL STATEMENTS | | | 87 | |
NOTESTO FINANCIAL STATEMENTS (CONTINUED)
the next $1.5 billion of average daily net assets, 0.040% on the next $2 billion of average daily net assets and 0.030% on average daily net assets over $5 billion. For the year ended September 30, 2015, each Fund’s payment for administrative services to ICON Advisers is included on the Statement of Operations. The administrative services agreement provides that ICON Advisers will not be liable for any error of judgment, mistake of law, or any loss suffered by the Trust in connection with matters to which the administrative services agreement relates, except for a loss resulting from willful misfeasance, bad faith or negligence by ICON Advisers in the performance of its duties.
ICON Advisers has a sub-administration agreement under which State Street assists ICON Advisers with the administration and business affairs of the Trust. For its services, ICON Advisers pays State Street a fee that is calculated daily and paid monthly at an annual rate based on the aggregate average daily net assets of the Trust.
Distribution Fees
The Funds have adopted a Distribution Plan pursuant to Rule 12b-1 under the 1940 Act (“12b-1 Plan”) under which the Funds are authorized to compensate the Funds’ distributor, ICON Distributors, Inc. (“IDI”) (an affiliate of the adviser) for the sale and distribution of shares and for other shareholder services. Under the 12b-1 Plan, Bond Fund Class C shareholders pay an annual distribution and service fee of 0.85% of average daily net assets and Class A shareholders pay an annual distribution and service fee of 0.25% of average daily net assets. The shareholders of the other Funds pay an annual distribution and service fee of 1.00% of average daily net assets for Class C shares and an annual distribution and service fee of 0.25% of average daily net assets for Class A shares. There is no annual distribution and service fee for Class S shares. The total amount paid under the 12b-1 plans by the Funds is shown on the Statement of Operations.
Other Related Parties
Certain Officers and Directors of ICON Advisers are also Officers and Trustees of the Funds; however, such Officers and Trustees (with the exception of the Chief Compliance Officer, “CCO”) receive no compensation from the Funds. The Trust paid 95% of the CCO’s salary and the remaining portion is paid by ICON Advisers. For the year ended September 30, 2015, the total related amounts paid by the Funds under this arrangement are included in Other Expenses on the Statement of Operations.
| | |
| 88 | | NOTESTO FINANCIAL STATEMENTS |
The Fund may reimburse ICON Advisers for legal work performed for the Fund by its attorneys outside of the advisory and administration contracts. The Board of Trustees reviews and approves such reimbursements. For the year ended September 30, 2015, the total related amounts paid by the Funds under this arrangement was $13,873 and is included in Other Expenses on the Statement of Operations.
4. Borrowings
The Trust has entered into a Line of Credit agreement/arrangement with State Street to provide temporary funding for redemption requests. Effective March 21, 2015, the maximum borrowing limit was changed from $150 million to $75 million. Interest on domestic borrowings is charged at a rate quoted and determined by State Street. The Risk-Managed Balanced and Long/Short Funds may also have borrowings with the prime broker as a result of brokerage requirements. Interest on domestic borrowing with the prime broker is charged at the Federal Funds rate plus 0.50%.
For the year ended September 30, 2015, the average outstanding loan by Fund was as follows:
| | | | | | | | |
| Fund* | | Average Borrowing
(10/1/14-9/30/15) | | | Average Interest Rates
(10/1/14-9/30/15) | |
ICON Bond Fund | | $ | 17,533 | | | | 1.37 | % |
ICON Equity Income Fund | | | 10,293 | | | | 1.37 | |
ICON Fund | | | 250,130 | | | | 1.37 | |
ICON Long/Short Fund | | | 230,776 | | | | 2.22 | |
ICON Opportunities Fund | | | 36,947 | | | | 1.37 | |
ICON Risk-Managed Balanced Fund | | | 6,272 | | | | 1.41 | |
| * | There were no outstanding borrowings under these agreements/arrangements as of September 30, 2015. |
5. Purchases and Sales of Investment Securities
For the year ended September 30, 2015, the aggregate cost of purchases and proceeds from sales of investment securities (excluding securities sold short, short-term securities and written options contracts) was as follows:
| | | | | | | | | | | | | | | | |
| Fund | | Purchases of
Securities | | | Proceeds
from Sales of
Securities | | | Purchases of
Long Term U.S.
Government
Obligations | | | Proceeds
from Sales of
Long-Term U.S.
Government
Obligations | |
ICON Bond Fund | | $ | 125,617,713 | | | $ | 116,231,019 | | | $ | 11,763,416 | | | $ | 17,507,702 | |
| | | | |
| NOTESTO FINANCIAL STATEMENTS | | | 89 | |
NOTESTO FINANCIAL STATEMENTS (CONTINUED)
| | | | | | | | | | | | | | | | |
| Fund | | Purchases of
Securities | | | Proceeds
from Sales of
Securities | | | Purchases of
Long Term U.S.
Government
Obligations | | | Proceeds
from Sales of
Long-Term U.S.
Government
Obligations | |
ICON Equity Income Fund | | $ | 89,522,091 | | | $ | 72,653,165 | | | $ | - | | | $ | - | |
ICON Fund | | | 35,702,280 | | | | 46,370,608 | | | | - | | | | - | |
ICON Long/Short Fund | | | 26,740,465 | | | | 28,861,194 | | | | - | | | | - | |
ICON Opportunities Fund | | | 9,257,303 | | | | 11,053,270 | | | | - | | | | - | |
ICON Risk-Managed Balanced Fund | | | 48,385,840 | | | | 37,543,727 | | | | 4,762,376 | | | | 2,848,633 | |
6. Federal Income Tax
The following information is presented on an income tax basis. Differences between U.S. GAAP and federal income tax purposes that are permanent in nature are reclassified within the capital accounts. Temporary differences do not require reclassification. Temporary and permanent differences do not impact the NAVs of the Funds. These differences are due to differing treatments for items such as deferrals of wash sale losses, foreign currency transactions, partnership adjustments, distribution recharacterization, and net investment losses.
For the year ended September 30, 2015, the following Funds had capital loss carryforwards:
| | | | | | | | |
| Fund | | Amounts | | | Expires | |
ICON Equity Income Fund | | $ | 633,993 | | | | 2017 | |
| | | 19,089,764 | | | | 2018 | |
ICON Fund | | | 17,897,797 | | | | 2018 | |
ICON Long/Short Fund | | | 33,675,748 | | | | 2017 | |
| | | 19,325,857 | | | | 2018 | |
ICON Risk-Managed Balanced Fund | | | 13,217,299 | | | | 2018 | |
Future capital loss carryforward utilization in any given year may be limited if there are substantial shareholder redemptions or contributions. During the year ended September 30, 2015, the following Funds utilized capital loss carryforwards:
| | | | |
| Fund | | Amount | |
ICON Equity Income Fund | | $ | 2,398,174 | |
ICON Fund | | | 3,100,699 | |
ICON Long/Short Fund | | | 3,830,377 | |
ICON Risk-Managed Balanced Fund | | | 318,827 | |
| | |
| 90 | | NOTESTO FINANCIAL STATEMENTS |
Under the Regulated Investment Company Modernization Act of 2010 (the “Act”) capital losses generated by a fund may be carried over indefinitely, but these losses must be used prior to the utilization of any pre-enactment capital losses. Since pre-enactment capital losses may only be carried forward for eight years there may be a greater likelihood that all or a portion of each fund’s pre-enactment capital losses will expire unused.
The tax characteristics of distributions paid to shareholders during the fiscal year ended September 30, 2015, were as follows:
| | | | | | | | | | | | | | | | |
| | | Distributions Paid from | | | Return of
Capital | | | Total
Distributions
Paid | |
| Fund | | Ordinary
Income | | | Net Long-
Term Gains | | | |
ICON Bond Fund | | $ | 4,946,691 | | | $ | 1,246,377 | | | $ | 319,369 | | | $ | 6,512,437 | |
ICON Equity Income Fund | | | 1,340,637 | | | | - | | | | - | | | | 1,340,637 | |
ICON Opportunities Fund | | | 126,909 | | | | 60,583 | | | | - | | | | 187,492 | |
ICON Risk-Managed Balanced Fund | | | 321,451 | | | | - | | | | - | | | | 321,451 | |
The tax characteristics of distributions paid to shareholders during the fiscal year ended September 30, 2014, were as follows:
| | | | | | | | | | | | |
| | | Distributions Paid from | | | | |
| Fund | | Ordinary
Income | | | Net Long-
Term Gains | | | Total Distributions
Paid | |
ICON Bond Fund | | $ | 4,279,532 | | | $ | 1,339,679 | | | $ | 5,619,211 | |
ICON Equity Income Fund | | | 731,816 | | | | - | | | | 731,816 | |
ICON Opportunities Fund | | | 20,853 | | | | - | | | | 20,853 | |
ICON Risk-Managed Balanced Fund | | | 1,049,673 | | | | - | | | | 1,049,673 | |
As of September 30, 2015, the components of accumulated earnings/(deficit) on a tax basis were as follows:
| | | | | | | | | | | | | | | | | | | | | | | | | | | | |
| Fund | | Undistributed
Ordinary
Income | | | Undistributed
Net Long-
Term-Gains | | | Late Year
Loss
Deferral** | | | Capital
Loss
Carryover | | | Accumulated
Capital and
Other Losses | | | Unrealized
Appreciation/
(Depreciation)* | | | Total
Accumulated
Earnings/
(Deficit) | |
ICON Bond Fund | | $ | - | | | $ | - | | | $ | (2,708,514 | ) | | $ | - | | | $ | - | | | $ | (1,674,516 | ) | | $ | (4,383,030 | ) |
ICON Equity Income Fund | | | 73,948 | | | | - | | | | - | | | | (19,723,757 | ) | | | - | | | | (3,383,190 | ) | | | (23,032,999 | ) |
ICON Fund | | | - | | | | - | | | | (1,605,734 | ) | | | (17,897,797 | ) | | | - | | | | (176,120 | ) | | | (19,679,651 | ) |
ICON Long/Short Fund | | | - | | | | - | | | | (2,368,847 | ) | | | (53,001,605 | ) | | | - | | | | 506,393 | | | | (54,864,059 | ) |
| | | | |
| NOTESTO FINANCIAL STATEMENTS | | | 91 | |
NOTESTO FINANCIAL STATEMENTS (CONTINUED)
| | | | | | | | | | | | | | | | | | | | | | | | | | | | |
| Fund | | Undistributed
Ordinary
Income | | | Undistributed
Net Long-
Term-Gains | | | Late Year
Loss
Deferral** | | | Capital
Loss
Carryover | | | Accumulated
Capital and
Other Losses | | | Unrealized
Appreciation/
(Depreciation)* | | | Total
Accumulated
Earnings/
(Deficit) | |
ICON Opportunities Fund | | $ | - | | | $ | - | | | $ | (70,964 | ) | | $ | - | | | $ | - | | | $ | (74,607 | ) | | $ | (145,571 | ) |
ICON Risk-Managed Balanced Fund | | | - | | | | - | | | | - | | | | (13,217,299 | ) | | | - | | | | (764,331 | ) | | | (13,981,630 | ) |
| * | Differences between the book-basis and tax-basis unrealized appreciation/(depreciation) are attributable primarily to tax deferral of losses on wash sales. |
| ** | The Funds have elected to defer certain qualified late-year losses in accordance with federal income tax rules. These losses are treated as having arisen on the first day of the following fiscal year. |
As of September 30, 2015, cost on investments for federal income tax purposes and the amount of net unrealized appreciation/(depreciation) were as follows:
| | | | | | | | | | | | | | | | |
| Fund | | Cost | | | Unrealized
Appreciation | | | Unrealized
(Depreciation) | | | Net
Appreciation/
(Depreciation) | |
ICON Bond Fund | | $ | 87,176,082 | | | $ | 189,557 | | | $ | (1,864,073 | ) | | $ | (1,674,516 | ) |
ICON Equity Income Fund | | | 50,184,105 | | | | 1,013,696 | | | | (4,396,784 | ) | | | (3,383,088 | ) |
ICON Fund | | | 56,587,822 | | | | 4,054,838 | | | | (4,230,958 | ) | | | (176,120 | ) |
ICON Long/Short Fund | | | 34,100,390 | | | | 2,785,241 | | | | (2,278,848 | ) | | | 506,393 | |
ICON Opportunities Fund | | | 11,128,088 | | | | 714,774 | | | | (789,381 | ) | | | (74,607 | ) |
ICON Risk-Managed Balanced Fund | | | 51,062,063 | | | | 1,547,442 | | | | (2,347,216 | ) | | | (799,774 | ) |
7. Subsequent Events
Management has evaluated the possibility of subsequent events and determined that there are no material events that would require adjustment to or disclosure in the Funds’ financial statements.
| | |
| 92 | | NOTESTO FINANCIAL STATEMENTS |
REPORTOF INDEPENDENT REGISTERED PUBLIC
ACCOUNTING FIRM
To the Board of Trustees and Shareholders of the ICON Funds:
In our opinion, the accompanying statements of assets and liabilities, including the schedules of investments, and the related statements of operations and of changes in net assets and the financial highlights present fairly, in all material respects, the financial position of ICON Bond Fund, ICON Equity Income Fund, ICON Fund, ICON Long/Short Fund, ICON Opportunities Fund, and ICON Risk-Managed Balanced Fund (six of the portfolios constituting ICON Funds, hereafter referred to as the “Funds”) at September 30, 2015, the results of each of their operations for the year then ended, the changes in each of their net assets for each of the two years in the period then ended and the financial highlights for each of the periods presented, in conformity with accounting principles generally accepted in the United States of America. These financial statements and financial highlights (hereafter referred to as “financial statements”) are the responsibility of the Funds’ management. Our responsibility is to express an opinion on these financial statements based on our audits. We conducted our audits of these financial statements in accordance with the standards of the Public Company Accounting Oversight Board (United States). Those standards require that we plan and perform the audit to obtain reasonable assurance about whether the financial statements are free of material misstatement. An audit includes examining, on a test basis, evidence supporting the amounts and disclosures in the financial statements, assessing the accounting principles used and significant estimates made by management, and evaluating the overall financial statement presentation. We believe that our audits, which included confirmation of securities at September 30, 2015 by correspondence with the custodian and brokers, provide a reasonable basis for our opinion.

Kansas City, Missouri
November 18, 2015
| | | | |
| REPORTOF ACCOUNTING FIRM | | | 93 | |
SIX MONTH HYPOTHETICAL EXPENSE EXAMPLE
SEPTEMBER 30, 2015 (UNAUDITED)
Example
As a shareholder of a Fund you may pay two types of fees: transaction fees and fund-related fees. Certain funds charge transaction fees, including sales charges (loads) on purchase payments, reinvested dividends, or other distributions; redemption fees; and exchange fees. Funds also incur various ongoing expenses, including management fees, distribution and/or service fees, and other fund expenses, which are indirectly paid by shareholders.
This Example is intended to help you understand your ongoing costs (in dollars) of investing in the various ICON Funds and to compare these costs with the ongoing costs of investing in other mutual funds. This Example is based on an investment of $1,000 invested at the beginning of the six-month period and held for the six-month period (4/01/15 – 9/30/15).
Actual Expenses
The first line in the table for each Fund provides information about actual account values and actual expenses. The Example includes, but is not limited to, management fees, 12b-1 fees, fund accounting, custody and transfer agent fees. However, the Example does not include client specific fees, such as the $15 fee charged to IRA accounts, or the $15 fee charged for wire redemptions. You may use this information, together with the amount you invested, to estimate the expenses that you paid over the period. Simply divide your account value by $1,000 (for example, an $8,600 account value divided by $1,000 = 8.6), then multiply the result by the number in the first line for each Fund under the heading entitled “Expenses Paid During Period” to estimate the expenses you paid on your account during this period.
Hypothetical Example for Comparison Purposes
The second line in the table for each Fund provides information about hypothetical account values and hypothetical expenses based on the Fund’s actual expense ratio and an assumed rate of return of 5% per year before expenses, which is not the Fund’s actual return. The hypothetical account values and expenses may not be used to estimate the actual ending account balance or expenses you paid for the period. You may use this information to compare the ongoing costs of investing in the Fund and other funds. To do so, compare this 5% hypothetical example with the 5% hypothetical examples that appear in the shareholder reports of the other funds. Please note that the expenses shown in the table are meant to highlight your ongoing costs only and do not reflect any transactional costs, such as sales charges (loads),
redemption fees, or exchange fees that may be charged by other funds. Therefore, this information is useful in comparing ongoing costs only, and will not help you determine the relative total costs of owning different funds.
| | | | | | | | | | | | | | | | |
| | | Beginning
Account Value 4/1/15 | | | Ending Account Value 9/30/15 | | | Expense Paid During Period 4/1/15 - 9/30/15* | | | Annualized Expense Ratio 4/1/15 - 9/30/15* | |
Actual Expenses | | | | | | | | | | | | | | | | |
ICON Bond Fund | | | | | | | | | | | | | | | | |
Class S | | $ | 1,000 | | | $ | 989.30 | | | $ | 3.74 | | | | 0.75% | |
Class C | | | 1,000 | | | | 985.20 | | | | 7.96 | | | | 1.60% | |
Class A | | | 1,000 | | | | 989.00 | | | | 4.99 | | | | 1.00% | |
ICON Equity Income Fund | | | | | | | | | | | | | | | | |
Class S | | | 1,000 | | | | 930.70 | | | | 5.81 | | | | 1.20% | |
Class C | | | 1,000 | | | | 926.50 | | | | 10.62 | | | | 2.20% | |
Class A | | | 1,000 | | | | 929.90 | | | | 7.02 | | | | 1.45% | |
ICON Fund | | | | | | | | | | | | | | | | |
Class S | | | 1,000 | | | | 846.40 | | | | 5.42 | | | | 1.17% | |
Class C | | | 1,000 | | | | 841.60 | | | | 10.39 | | | | 2.25% | |
Class A | | | 1,000 | | | | 844.90 | | | | 6.94 | | | | 1.50% | |
ICON Long/Short Fund | | | | | | | | | | | | | | | | |
Class S | | | 1,000 | | | | 874.00 | | | | 6.01 | | | | 1.28% | |
Class C | | | 1,000 | | | | 869.60 | | | | 10.92 | | | | 2.33% | |
Class A | | | 1,000 | | | | 872.80 | | | | 7.42 | | | | 1.58% | |
ICON Opportunites Fund | | | 1,000 | | | | 919.30 | | | | 7.22 | | | | 1.50% | |
ICON Risk-Managed Balanced Fund | | | | | | | | | | | | | | | | |
Class S | | | 1,000 | | | | 955.70 | | | | 5.88 | | | | 1.20% | |
Class C | | | 1,000 | | | | 951.10 | | | | 10.76 | | | | 2.20% | |
Class A | | | 1,000 | | | | 953.90 | | | | 7.10 | | | | 1.45% | |
Hypothetical (assuming a 5% return before expenses) | | | | | | | | | | | | | | | | |
ICON Bond Fund | | | | | | | | | | | | | | | | |
Class S | | | 1,000 | | | | 1,021.31 | | | | 3.80 | | | | | |
Class C | | | 1,000 | | | | 1,017.05 | | | | 8.09 | | | | | |
Class A | | | 1,000 | | | | 1,020.05 | | | | 5.06 | | | | | |
ICON Equity Income Fund | | | | | | | | | | | | | | | | |
Class S | | | 1,000 | | | | 1,019.05 | | | | 6.07 | | | | | |
Class C | | | 1,000 | | | | 1,014.04 | | | | 11.11 | | | | | |
Class A | | | 1,000 | | | | 1,017.80 | | | | 7.33 | | | | | |
ICON Fund | | | | | | | | | | | | | | | | |
Class S | | | 1,000 | | | | 1,019.20 | | | | 5.92 | | | | | |
Class C | | | 1,000 | | | | 1,013.79 | | | | 11.36 | | | | | |
Class A | | | 1,000 | | | | 1,017.55 | | | | 7.59 | | | | | |
| | | | | | | | | | | | | | |
| | | Beginning
Account Value 4/1/15 | | | Ending Account Value 9/30/15 | | | Expense Paid During Period 4/1/15 - 9/30/15* | | | Annualized Expense Ratio 4/1/15 - 9/30/15* |
ICON Long/Short Fund | | | | | | | | | | | | | | |
Class S | | $ | 1,000 | | | $ | 1,018.65 | | | $ | 6.48 | | | |
Class C | | | 1,000 | | | | 1,013.39 | | | | 11.76 | | | |
Class A | | | 1,000 | | | | 1,017.15 | | | | 7.99 | | | |
ICON Opportunities Fund | | | 1,000 | | | | 1,017.55 | | | | 7.59 | | | |
ICON Risk-Managed Balanced Fund | | | | | | | | | | | | | | |
Class S | | | 1,000 | | | | 1,019.05 | | | | 6.07 | | | |
Class C | | | 1,000 | | | | 1,014.04 | | | | 11.11 | | | |
Class A | | | 1,000 | | | | 1,017.80 | | | | 7.33 | | | |
| * | Expenses are equal to the Fund’s six month expense ratio annualized and multiplied by the average account value over the period, multiplied by 183/365 to reflect the one-half year period. |
Total returns exclude applicable sales charges. If sales charges were included (maximum 5.75%), returns would be lower.
BOARDOF TRUSTEESAND FUND OFFICERS
(UNAUDITED)
The ICON Funds Board of Trustees (“Board”) consists of four Trustees who oversee the 17 ICON Funds (the “Funds”). The Board is responsible for general oversight of the Funds’ business and for assuring that the Funds are managed in the best interest of the Funds’ shareholders. The Trustees, and their ages, and principal occupations are set forth below. The address of the Trustees is 5299 DTC Blvd., Suite 1200, Greenwood Village, CO 80111. Trustees have no official term of office and generally serve until they resign or are not re-elected.
Interested Trustee
Craig T. Callahan, 64, Chairman of the Board. Dr. Callahan has been a Trustee of the Funds since their inception. Dr. Callahan also serves as Chief Executive Officer (2013 to present); and Chairman of the Investment Committee (2005 to present) and served as the Chief Investment Officer (1991 to 2004) and President (2008 to 2013 and 2014 to present) of ICON Advisers. Dr. Callahan is also Executive Vice President (2005 to present); Director (1991 to present); and was previously President (1998 to 2005) and Chief Compliance Officer (2005) of IDI. Dr. Callahan also serves as the President (1998 to present) and Chairman of the Board of Directors (1994 to present) of ICON Management & Research Corporation (“IM&R”), the parent company of ICON Advisers and IDI.
Independent Trustees
Glen F. Bergert, 65. Mr. Bergert has been a Trustee of the Funds since 1999. Mr. Bergert is President of Venture Capital Management LLC (1997 to present), General Partner of SOGNO Partners LP, a venture capital company (2001 to present), General Partner of Bergert Properties, LLP, a real estate holding company (1997 to present), General Partner of Pyramid Real Estate Partnership, a real estate development company (1998 to present), General Partner of Chamois Partners, LP, a venture capital company (2004 to present) and was previously a General Partner with KPMG Peat Marwick, LLP (1979 to 1997). Mr. Bergert is also a Director of Delta Dental of California, an insurance company (2013 to present and 2006 to 2012), Delta Dental of Pennsylvania, an insurance company (1998 to 2009 and 2010 to present), Dentegra Group, Inc, an insurance holding company (2010 to 2014) and Delta Reinsurance Corporation (2000 to 2009 and 2011 to 2014). Mr. Bergert was a Director of Herre Bros, Inc., a contracting company (1998 to 2011).
John C. Pomeroy, Jr., 68. Mr. Pomeroy has been a Trustee of the Funds since November 2002. Mr. Pomeroy is Chief Investment Officer and Director
of Investments, Pennsylvania State University (2001 to present) and was Portfolio Manager and Product Manager, Trinity Investment Management Corporation (1989 to 2001).
R. Michael Sentel, 67. Mr. Sentel has been a Trustee of the Funds since their inception. Mr. Sentel is a Senior Attorney with the U.S. Department of Education (1996 to present). Mr. Sentel also provides legal representation as a sole practitioner with an emphasis on corporate and transactional law. He served as general counsel to numerous public companies and served on the board of directors of one of these clients. Mr. Sentel began his legal career with the U.S. Securities and Exchange Commission’s Division of Enforcement and served as a Branch Chief (1980 to 1981). Later he served as the Section Chief for the Professional Liability Section of the Federal Deposit Insurance Corp. with responsibility for the Rocky Mountain Region (1991 to 1994).
The Officers of the Funds are:
Craig T. Callahan, 64, Chairman of the Board. Dr. Callahan has been a Trustee of the Funds since their inception. Dr. Callahan also serves as Chief Executive Officer (2013 to present); President (1998 to 2013 and 2014 to present) and Chairman of the Investment Committee (2005 to present) and served as the Chief Investment Officer (1991 to 2004) of ICON Advisers. Dr. Callahan is also Executive Vice President (2005 to present); Director (1991 to present); and was previously President (1998 to 2005) and Chief Compliance Officer (2005) of IDI. Dr. Callahan also serves as the President (1998 to present) and Chairman of the Board of Directors (1994 to present) of IM&R, the parent company of ICON Advisers and IDI.
Donald Salcito, 62. Mr. Salcito serves as Vice President and Secretary of the Funds (November 15, 2006 to present). Mr. Salcito is also Executive Vice President and General Counsel (September 2005 to present) of ICON Advisers; Director of IM&R (2005 to present); Executive Vice President, Secretary, General Counsel of IDI (2005 to present). Previously, he was a Partner in various national law firms, practicing in the securities law area. (1980 to 2005).
Carrie M. Schoffman, 42. Ms. Schoffman has been a Vice President and Principal Financial Officer/Treasurer of the Funds since June 2013. Ms. Schoffman is also Chief Compliance Officer (2013 to present and 2004 to 2008) and Anti-Money Laundering Officer (2013 to present) of the ICON Funds. She is Senior Vice President (2011 to present) and Chief Compliance Officer (2013 to present and 2004 to 2011) of ICON Advisers. Previously, she was a Staff Accountant with the Securities and Exchange Commission (2003 to 2004) and also an Experienced Manager (2001 to 2003) and a Senior Associate/Associate (1996 to 2001) at PricewaterhouseCoopers LLP.
Lesley Caviness, 49. Ms. Caviness serves as Assistant Treasurer of the Funds (2014 to present). She has worked at ICON (2007-2008 and 2010-present) in fund accounting, compliance, business intelligence and performance capacities. Prior to working at ICON, Ms. Caviness was a Real Estate Broker at Seasons Real Estate Group (2008-2012) and Signature Real Estate (2014-present), Finance Manager at Navigant (2000-2007), and Associate/Senior Associate (1996 to 2000) at PricewaterhouseCoopers LLP.
OTHER INFORMATION (UNAUDITED)
Renewal of Investment Advisory Agreement
On August 10, 2015, the Board of Trustees, including all of the Trustees that are not “interested persons” of the Trust (the “Independent Trustees”), approved continuation of the Advisory Agreements with the Adviser for each Fund for an additional one-year term commencing October 1, 2015.
In determining to renew the investment advisory agreements between ICON Funds (the “Trust”) and ICON Advisers, Inc. (“ICON” or the “Adviser”) the Trustees requested, was provided with and reviewed data with respect to the Adviser, its personnel, and the services provided and to be provided to each Fund by the Adviser under the Trust’s Investment Advisory Agreement dated October 9, 1996, as amended (related to the Sector Funds, the International Funds and ICON Fund) and under the Trust’s Investment Advisory Agreement dated July 9, 2002 and effective October 1, 2002, as amended (related to the U.S. Diversified Funds — Bond, Risk-Managed Balanced, Equity Income, Opportunities and Long/Short Funds) (collectively, the “Advisory Agreements”), for an additional one-year term commencing October 1, 2015. The Trustees agreed that consideration of the Advisory Agreements should also include consideration of other agreements between the Adviser and the Trust that impact provisions of the Advisory Agreements, including expense limitation agreement as amended effective September 25, 2015.
The Trustees were provided with and reviewed data with respect to the Adviser, its personnel, and the services provided and to be provided to each Fund by the Adviser under the Trust’s Advisory Agreements, Administrative Services Agreement and Expense Limitation Agreement and the Distribution Agreement with ICON Distributors, Inc. (“IDI”). The data included information concerning advisory, distribution and administrative services provided to the Funds by ICON and its related companies; information concerning other businesses of those companies; comparative data obtained from Strategic Insight (“SI”) related to Fund performance and Fund expenses (the “SI Report”). The data also included an analysis of the management style to be applied and the style applied to the Funds’ ratings of the Funds’ performance in their management style on the AthenaInvest system (the “AthenaInvest Data”) and a presentation on the Adviser’s investment model.
The Board convened a meeting with SI on July 29, 2015 to discuss the SI Report and the information contained within the SI Report. Avi Nachmany, Co-Founder and Director of Research of SI and Kevin Shine, Senior Managing Director, U.S. Research & Advisory of SI, discussed the findings of the SI Report with the independent directors. Management personnel participated in the SI meeting convened to discuss the data for and with the Board. At the
meeting, SI discussed its methodology, peer selection and the difficulty with some sector funds, expenses and fees, and performance relative to the respective Fund’s peers. SI also discussed the Funds size and how a respective Fund’s size would affect economies of scale, in particular, operating expenses.
Also included in the 15(c) discussion was a briefing on factors affecting the ICON investment model; expenses and expense ratios of each Fund and other ICON managed products; relative performance of each Fund; status of expense reimbursements to the Funds by the Adviser; sales and marketing initiatives; specific business factors affecting IDI; the work load on ICON as adviser and administrator to the Funds; current profitability of ICON; staffing levels and staff morale.
The Independent Trustees were represented by independent legal counsel in this process. In August 2015, after participating in the meeting with SI and management, the Independent met separately as a group in private sessions with their independent legal counsel to review and discuss the foregoing information. Based on these discussions, independent legal counsel and/or the Lead Independent Trustee also contacted management to request additional information concerning the AthenaInvest rankings and other issue raised in the SI meeting. In addition, the Board received materials from legal counsel discussing the legal standards applicable to their consideration of the ICON-Trust agreements.
In considering the nature, extent and quality of the services provided by the Adviser, the Board reviewed information relating to ICON’s operations and personnel. Among other things, the Adviser provided biographical information on its professional staff and descriptions of its organizational and management structure. In the course of their deliberations the Board evaluated, among other things, information relating to the investment philosophy, strategies and techniques used in managing each Fund, the qualifications and experience of ICON’s investment personnel, ICON’s compliance programs, ICON’s brokerage practices, including the extent to which the Adviser obtains research through “soft dollar” arrangements with the Funds’ brokerage, compliance reports on the foregoing, and the financial and non-financial resources available to provide services required under the Advisory Agreement.
During the discussion, the SI Report and the AthenaInvest Data were discussed and management personnel showed performance for each fund and discussed the factors affecting performance. The Board inquired from SI whether there was any correlation between fund expenses and performance, and SI saw no correlation with the ICON Funds. During the discussion on performance, management personnel noted that from a strategy (Athena)
perspective, 2014 was very difficult for active managers. Behaviors that historically have been rewarded and led to high strategy consistency ratings were not rewarded in 2014. Those behaviors include willingness to look different from an index, concentration of securities, conviction in securities selections, and holding stocks similar to other managers in a stated strategy. Causing further frustration in 2014, many stock and industry moves were not based on value, as ICON measures it. Something changed entering 2015. Behaviors that have been associated with superior performance in the past have been rewarded in the first part of 2015. Industry and sector selection have been better contributors to performance the first half of 2015 meaning that, more than last year, sector and industry tilts have been rewarded. ICON measures how sector indexes are in correlation with the S&P 1500 and 600 Indexes on a trailing 13-week basis. In 2015, the correlations have dropped, indicating sector differences in performance. Along with the decreasing correlations, sector returns have changed from 2014. Utilities was #1 in 2014, but is the worst at #10 for 2015. Consumer Discretionary has swung from #6 in 2014 to #2 the first half of 2015. In summary, value has been useful in rotating and capturing the industry and sector leadership of 2015.
In addition, in 2014 large cap stocks beat small cap stocks. As indexes are market capitalization weighted, index huggers did well in 2014. For the first six months of 2015, S&P 500 Index gained 1.56% whereas the S&P Small Cap 600 Index beat it, gaining 4.15%. In this market setting the ICON Funds did well across the Fund family: sector funds, diversified funds and international funds.
The Trustees noted that Advisers’ performance relative to other valuation managers as judged by the AthenaInvest system is above the medium. SI also noted that from a performance point of view, the Funds in the SI Report are compared using the Morningstar data, and there is no Morningstar category for “all cap” funds, but all ICON Funds are improving.
The Board addressed style consistency with the Adviser. Management advised that, based on the Adviser’s own analysis, and with the restructuring of the Adviser, the Adviser has continued an additional level of review on the Portfolio Managers (“PMs”) to make sure they are adhering to the ICON System; the Senior Vice President of Fund Management has been systematically tracking the Funds’ performance; he evaluates each of the ICON Funds to help ensure all PMs are investing consistently and in accordance with the ICON System by evaluating the Funds from an attribution perspective in monthly meetings.
In connection with reviewing data bearing upon the nature, quality, and extent of services furnished by ICON to each Fund, the Board assessed data concerning ICON’s staffing, systems and facilities. The Board also assessed
ICON’s non-Trust business to see if there are any initiatives that would dilute service to the Trust. The Board concluded:
A. That the breadth and the quality of investment advisory and other services being provided to each Fund is satisfactory, as evidenced in part by efforts to address and improve the performance record of each Fund when compared with the performance records of a peer group of comparable funds and markets in general;
B. That the breadth and the quality of investment advisory and other services being provided to each Fund are satisfactory, the Adviser’s performance is competitive with other fund managers in the value style group, and the Adviser has applied a disciplined approach in the style specified in the Funds’ offering document;
C. That ICON has made significant expenditures in the past year and in prior years to ensure that it has the sophisticated systems and the highly trained personnel necessary for it to be able to continue to provide quality service to the Funds’ shareholders, including the dedication of substantial resources to ICON’s investment and methodology;
D. That the Board, after considering compliance reports and compliance initiatives undertaken during the year and conducting individual interviews with selected PMs, is satisfied with the research and portfolio management, that research and portfolio management is being constantly evaluated and improved upon; and that the PMs are evaluating trading services systematically, the Board concluded that the Adviser is providing the Funds with professional management of the nature, quality and scope required by the Funds; and
E. The risks assumed by ICON in providing investment advisory services to each Fund, including the capital commitments which have been made in the past and which continue to be made by ICON to ensure the continuation of the highest quality of service to the Trust, is made with the recognition that shareholders may redeem their shares at any time without notice and the Trust’s advisory relationship with ICON may be terminated at any time and must be renewed on an annual basis.
In considering the reasonableness of the fees paid to the Adviser for managing each Fund, the Board reviewed, among other things, data concerning other funds from the SI Report, financial statements of the Adviser and an analysis of the profitability of the Adviser, and its affiliates, and their relationship with each Fund over various time periods. Such analysis identified all revenues and other benefits received by the Adviser and its affiliates from managing each Fund, the costs associated with providing such services and the resulting profitability to the Adviser and its affiliates and a comparison of similar data from reports filed by publicly traded firms.
The Board assessed actual (net) fees for advisory services and Fund expense ratios under the contractual relationship (the Advisory agreements and the Expense Limitation Agreements) with the Adviser as opposed to the fees specified in the applicable Advisory Agreement and expense ratios without application of the expense limitations and concluded that the focus should be on actual expense ratios after application of the Expense Limitation Agreements.
The Board considered the current and anticipated asset levels of each Fund and the contractual commitments of the Adviser to waive fees and pay expenses of the Funds from time to time to limit the total expenses of the Funds. In this regard the Board discussed asset levels in each Fund covered by the Advisory Agreements. ICON’s ability to provide the services called for under the Advisory Agreements was assessed in light of current and projected asset levels. Fund expenses and expense ratios were also assessed in light of current and projected asset levels. The Board concluded that the Adviser has the resources necessary to provide the services called for under the Advisory Agreements; that profitability to the Adviser and its affiliates from their relationship with the Funds, and services provided to the Funds, is not excessive; and that the Adviser is not realizing material benefits from economies of scale that would warrant adjustments to the fees for any Fund at this time. The Board of Trustees concluded that, in light of the nature, extent and quality of the services provided by the Adviser and the levels of profitability associated with providing these services, the fees charged by the Adviser under the Advisory Agreements to each Fund are reasonable.
In connection with assessing data bearing on the fairness of fee arrangements, the Board considered the SI Report. It was noted that SI was selected at the May Board meeting to prepare its report, an extensive analysis of the expense data of other comparable funds; and that Trustee input was solicited and provided in the process. Among other information discussed, it was noted that:
A. the advisory fee structures of the Funds are within the range of funds considered in the comparison with advisory fees and expense ratios of other similarly managed funds as set forth in the comparative data;
B. ICON has contractually agreed to impose expense limitations on each and every Fund at a cost to ICON;
C. ICON has contractually committed to break points in its fees so that economies of scale could be realized as a Fund grows in assets, for the benefit of Fund shareholders.
The Board also considered the fees charged by the Adviser to other advisory clients as outlined in its Registration Application on Form ADV in connection
with assessing data bearing on the fairness of fee arrangements. The Trustees noted that certain ICON institutional/sub-advised type accounts have lower fees than the fees paid by the Funds for a number of reasons, including but not limited to, those clients call for different commitments of time, institutional clients have low and predictable turnover of assets, in competition joint costs are apportioned among paying customers according to elasticity of demand and the Adviser has a limited level of responsibility in sub-managed accounts, or accounts with an investor agent/advisor.
The Board noted that the Funds’ redemptions were similar to industry averages which showed two things: 1) that the Funds’ Performance was not adversely impacting fund redemptions, and 2) that the fees and costs were competitive when compared to size. The Board noted that there are thousands of mutual funds competing; that investors can search and trade funds on the internet or on platforms at very little or no cost; and that if the Adviser were overcharging for its services, with its performance being what it is, the Board would have expected redemptions in excess of industry norms.
The Board concluded that the Adviser is providing the Funds with professional management at a fair, reasonable and competitive price.
In connection with assessing the direct and indirect benefits to ICON from serving as the Funds’ adviser, the Board discussed services provided under the Distribution Agreement and the Administrative Services Agreement which are in addition to services under the Advisory Agreements. It was noted that IDI does not charge a fee to the Funds for its services and that ICON’s fee for administrative services appears to be consistent with such fees in other fund groups. The Board noted that ICON receives research assistance (primarily in the form of data) from the use of soft dollars generated from Fund portfolio transactions; that such research assists ICON in providing quality advisory services; that Trust and Adviser compliance personnel continuously evaluate and report on the soft-dollar arrangements and related costs; and the Board concluded that the arrangements are consistent with Fund brokerage practices and benefit the Funds and their shareholders.
Based on these considerations, the Board, including all of the Independent Trustees, concluded that: 1) the continuation of the Advisory Agreements was in the best interests of each Fund and its shareholders, 2) the services to be performed under the Advisory Agreements were required for the operation of the Funds, 3) the advisory services were satisfactory to the Funds in the past, and 4) the fees for the advisory services and other benefits from the relationship with the Trust received by ICON, and its affiliates, were consistent with fees paid by similar funds and other clients of ICON, and were reasonable in light of the comparative data, and within the range of what would have been negotiated at arm’s length in light of all the circumstances.
Supplemental Tax Information
For corporate shareholders, the following percentage of the total ordinary
income dividends paid during the fiscal year ended September 30, 2015,
qualifies for the corporate dividends received deduction for the following Funds:
| | | | |
| Fund | | Dividends
Received
Deduction | |
ICON Bond Fund | | | 2.3 | % |
ICON Equity Income Fund | | | 80.8 | |
ICON Opportunities Fund | | | 22.7 | |
ICON Risk-Managed Balanced Fund | | | 78.6 | |
For the fiscal year ended September 30, 2015, the following funds paid
qualified dividend income:
| | | | |
| Fund | | Amount | |
ICON Bond Fund | | | 9.6% | |
ICON Equity Income Fund | | | 90.3% | |
ICON Opportunities Fund | | | 23.1% | |
ICON Risk-Managed Balanced Fund | | | 92.3% | |
The Funds designate the following amounts, or the maximum amount
needed, as long-term capital gain distributions qualifying for the maximum
20% income tax rate for individuals:
| | | | |
| Fund | | Amount | |
ICON Bond Fund | | $ | 1,246,377 | |
ICON Opportunities Fund | | | 60,583 | |
Portfolio Holdings
Information related to the 10 largest portfolio holdings of each Fund is made available at www.iconfunds.com within approximately 10 business days after month-end. Additionally, a complete list of each Fund’s holdings is made available approximately 30 days after month-end. Each ICON Fund also files a complete schedule of portfolio holdings for the first and third quarters of its fiscal year with the Securities and Exchange Commission (the “Commission”) on Form N-Q. The ICON Funds’ Forms N-Q are available at www.sec.gov or may be reviewed and copied at the Commission’s Public Reference Room in Washington, DC. Information about the Public Reference Room may be obtained by calling 1-800-SEC-0330.
Proxy Voting
A summarized description of the policies and procedures the ICON Funds use to vote proxies is available free of charge at www.iconfunds.com or by calling 1-800-764-0442.
Information about how the ICON Funds voted proxies related to each Fund’s portfolio securities during the 12-month period ended June 30 is available free of charge at www.iconfunds.com or on the Commission’s website at www.sec.gov.
Cost Basis Information
Effective January 1, 2012, federal law requires mutual fund companies to maintain and report a shareholder’s cost basis by tax lot, gain/loss information and holding period of covered shares to the Internal Revenue Service on Form 1099. Covered shares are mutual fund shares acquired on or after January 1, 2012. A fund is not required to maintain and report information for shares not deemed as covered.
The new law requires each fund to elect a default tax identification methodology in order to perform the required reporting. As a result, the Trust has chosen Average Cost as its default tax identification methodology. This is the method each Fund will use. However, at the time of purchase or upon the sale of covered shares, shareholders may choose a different tax identification method. Furthermore, if you purchase shares through a financial intermediary, please contact the intermediary to find out what default tax identification method they will use. We recommend that you consult your tax adviser to determine which tax identification methodology best suits your individual tax situation.
For More Information
This report is for the general information of the Funds’ shareholders and is not authorized for distribution to prospective investors unless preceded or accompanied by a current prospectus. You may obtain a copy of the prospectus, which contains information about the investment objectives, risks, charges, expenses, and share classes of each ICON Fund, by visiting www.iconfunds.com or by calling 1-800-764-0442. Please read the prospectus carefully before investing.
ICON Distributors, Inc., Distributor.
ICON FUNDS PRIVACY INFORMATION
| | |
| FACTS | | WHAT DOES ICON DO
WITH YOUR PERSONAL INFORMATION? |
| | |
| Why? | | Financial companies choose how they share your personal information. Federal law gives consumers the right to limit some but not all sharing. Federal law also requires us to tell you how we collect, share, and protect your personal information. Please read this notice carefully to understand what we do. |
| | |
| What? | | The types of personal information we collect and share depend on the product or service you have with us. This information can include: n Social Security number and account balances n income and transaction history n checking account information and wire transfer instructions When you are no longer our customer, we continue to share your information as described in this notice. |
| | |
| How? | | All financial companies need to share customers’ personal information to run their everyday business. In the section below, we list the reasons financial companies can share their customers’ personal information; the reasons ICON chooses to share; and whether you can limit this sharing. |
| | | | |
| Reasons we can share your personal information | | Does ICON share? | | Can you limit this sharing? |
For our everyday business purposes — such as to process your transactions, maintain your account(s), respond to court orders and legal investigations, or report to credit bureaus | | Yes | | No |
For our marketing purposes — to offer our products and services to you | | No | | We don’t share |
| For joint marketing with other financial companies | | No | | We don’t share |
For our affiliates’ everyday business purposes — information about your transactions and experiences | | No | | We don’t share |
For our affiliates’ everyday business purposes — information about your creditworthiness | | No | | We don’t share |
| For nonaffiliates to market to you | | No | | We don’t share |
| | |
| Questions? | | Call 1-800-764-0442 for the ICON Funds and 1-800-828-4881 for ICON Advisers, Inc. and ICON Distributors, Inc. |
| | |
| 108 | | FUNDS PRIVACY INFORMATION |
| | |
| Who we are | | |
| Who is providing this notice? | | ICON Funds, ICON Advisers, Inc., and ICON Distributors, Inc. (collectively “ICON”) |
| What we do | | |
| How does ICON protect my personal information? | | To protect your personal information from unauthorized access and use, we use security measures that comply with federal law. These measures include computer safeguards and secured files and buildings. Contracts with our service providers require them to restrict access to your non-public personal information, and to maintain physical, electronic and procedural safeguards against unintended disclosure. |
| How does ICON collect my personal information? | | We collect your personal information, for example, when you n open an account or enter into an investment advisory contract n provide account information or give us your contact information n make a wire transfer We also collect your personal information from others, such as credit bureaus, affiliates, or other companies. |
| Why can’t I limit all sharing? | | Federal law gives you the right to limit only n sharing for affiliates’ everyday business purposes — information about your creditworthiness n affiliates from using your information to market to you n sharing for nonaffiliates to market to you State laws and individual companies may give you additional rights to limit sharing. |
| Definitions | | |
| Affiliates | | Companies related by common ownership or control. They can be financial and nonfinancial companies. n Our affiliates include financial companies such as ICON Funds, ICON Advisers, Inc., and ICON Distributors, Inc. |
| Nonaffiliates | | Companies not related by common ownership or control. They can be financial and nonfinancial companies. n Nonaffiliates we share with can include financial companies such as custodians, transfer agents, registered representatives, financial advisers and nonfinancial companies such as fulfillment, proxy voting, and class action service providers |
| Joint marketing | | A formal agreement between nonaffiliated financial companies that together market financial products or services to you. n ICON doesn’t jointly market |
| | | | |
| FUNDS PRIVACY INFORMATION | | | 109 | |
For more information about the ICON Funds, contact us:
| | |
| |
| By Telephone | | 1-800-764-0442 |
| |
| By Mail | | ICON Funds
P.O. Box 55452
Boston, MA 02205-8165 |
| |
| In Person | | ICON Funds
5299 DTC Boulevard, 12th Floor
Greenwood Village, CO 80111 |
| |
| On the Internet | | www.iconfunds.com |
| |
| By E-Mail | | info@iconadvisers.com |

2015 ANNUAL REPORT
ICON INTERNATIONAL FUNDS
INVESTMENT UPDATE
ICON Emerging Markets Fund
ICON International Equity Fund

1-800-764-0442 | www.iconfunds.com

You can now sign up for electronic delivery of ICON Fund shareholder reports, including prospectuses, annual reports, semiannual reports and proxy statements.
When these materials are available, you will receive an email from ICON with instructions on how to view the documents. Statements, transaction confirmations and other documents that are not available online will continue to be sent to you by U.S. mail.
Visit ICON’s website at www.iconfunds.com to learn more and sign up.
You may change or cancel your participation in eDelivery by visiting www.iconfunds.com, or you can request a hard copy of any of the materials free of charge by calling ICON Funds at 1-800-764-0442.
1-800-764-0442 • www.iconfunds.com

TABLEOF CONTENTS
ABOUT THIS REPORT (UNAUDITED)
Historical Returns
All total returns mentioned in this Report account for the change in a Fund’s per-share price and the reinvestment of any dividends, capital gain distributions and adjustments for financial statement purposes. If your account is set up to receive Fund distributions in cash rather than to reinvest them, your actual return may differ from these figures. The Funds’ performance results do not reflect the deduction of taxes that a shareholder would pay on Fund distributions or on the redemption of Fund shares. The Adviser may have reimbursed certain fees or expenses of some of the Funds. If not for these reimbursements, performance would have been lower. Fund results shown, unless otherwise indicated, are at net asset value. If a sales charge (maximum 5.75%) had been deducted, results would have been lower.
Past performance does not guarantee future results. Investment return and principal value will fluctuate so that an investor’s shares, when redeemed, may be worth more or less than their original cost. Performance results represent past performance, and current performance may be higher or lower. Please call 1-800-764-0442 or visit www.iconfunds.com for performance results current to the most recent month-end.
Portfolio Data
This Report reflects ICON’s portfolio holdings as of September 30, 2015, the end of the reporting period. The information is not a complete analysis of every aspect of any sector, industry, security or the Funds.
There are risks associated with mutual fund investing, including the loss of principal. The likelihood of loss may be greater if you invest for a shorter period of time. There is no assurance that the investment process will consistently lead to successful results.
An investment in a region fund may involve greater risk and volatility than a diversified fund. An investment concentrated in sectors and industries may involve greater risk and volatility than a more diversified investment.
Investments in foreign securities may entail unique risks, including political, market, and currency risks. Financial statements of foreign companies are governed by different accounting, auditing, and financial standards than U.S. companies and may be less transparent and uniform than in the United States. Many corporate governance standards, which help ensure the integrity of public information in the United States, do not exist in foreign countries. In general, there may be less governmental supervision of foreign
stock exchanges and securities brokers and issuers. The ICON system relies on the integrity of the financial statements released to the market as part of our analysis.
The prospectus and statement of additional information contain this and other information about the Funds and are available by visiting www.iconfunds.com or calling 1-800-764-0442. Please read the prospectus and statement of additional information carefully.
Financial Intermediary
If you purchase the Fund through a broker-dealer or other financial intermediary (such as a bank), the Fund and its related companies may pay the intermediary for the sale of Fund shares and related services. These payments may influence the broker-dealer or other intermediary and your salesperson to recommend the Fund over another investment. Ask your salesperson or visit your financial intermediary’s website for more information.
| | |
MANAGEMENT OVERVIEW (UNAUDITED) ICON EMERGING MARKETS FUND | | |
| Q. | How did the Fund perform relative to its benchmark? |
| A. | The ICON Emerging Markets Fund (the Fund) Class S returned -5.61% for the fiscal year ended September 30, 2015, while its benchmark, the MSCI Emerging Markets Index, returned -18.98%. Total returns for other periods and additional Class shares as of September 30, 2015, appear in the subsequent pages of this Fund’s Management Overview. |
| Q. | What primary factors were behind the Fund’s relative performance? |
| A. | Unlike the previous fiscal year’s gain, the emerging markets benchmark experienced a marked decline over the course of fiscal year 2015. While the U.S. economy continued to show signs of improvement relative to the rest of the world, headwinds investors faced internationally during the period included economic growth concerns, especially with respect to that of China and many of its emerging markets peers, currency volatility, and the prospect of the Federal Reserve raising rates for the first time since 2006. However, despite these headwinds, interest rates generally remained low and monetary policy continued to be accommodative globally. |
From a country perspective, Hungary was the sole country within the emerging markets benchmark to experience positive returns during the period. China was the second best performing country, despite its negative return for the fiscal year and its significant drop in performance that began in mid-2015. Greece, dealing with debt problems and a possibility of its exit from the Eurozone, was the worst performing country in the emerging markets space. While the Fund did not participate in Hungary’s upside move, China, an average underweight for the Fund during the period, was one of the larger contributors to relative performance. Having no position in Greece during the period also contributed to performance relative to the benchmark. Lastly, the Fund’s overweight position in India was the largest contributor to relative performance while the Fund’s underweight position in South Africa detracted the most from relative performance.
From a sector perspective, although each sector in the benchmark experienced a decline during the period, the Health Care sector was the best performing sector followed by Information Technology. The Fund had an overweight position relative to the benchmark in both sectors during the period, contributing to the Fund’s performance relative to the
benchmark. The Energy and Materials sectors were the two worst performing sectors during the period and the Fund’s underweight position in both sectors contributed to the Fund’s performance relative to the benchmark. Finally, the Financials sector, an average underweight in the Fund, was the largest contributor to relative performance while the Consumer Discretionary sector, an average overweight, was the largest and only detractor on a relative basis.
| Q. | How did the Fund’s composition affect performance? |
| A. | The top country contributors to Fund performance during the period were China, India, and Taiwan. South Korea, Brazil and South Africa detracted the most from Fund performance. Top sector contributors to Fund performance during the period included Health Care, led by the pharmaceuticals industry, and Industrials, an average sector overweight that was led by the airport services industry. The Consumer Discretionary sector, where the catalog retail industry was the largest detractor, and the Financials sector, where diversified banks was the largest detractor, detracted the most from Fund performance. |
From a total effect standpoint, countries that added the most to relative performance in addition to India included China and Brazil. Countries detracting the most from relative performance in addition to South Africa included Malaysia, an average underweight, and Taiwan. Sectors adding the most to relative performance from a total effect standpoint, in addition to Financials, included Industrials and Energy. As mentioned previously, the Consumer Discretionary sector was the only sector that detracted from relative performance from a total effect standpoint.
With equity valuations appearing to be stretched during the period, a higher than average allocation to cash was used for defensive purposes, which added significantly to benchmark relative performance. The Fund did not employ currency hedging during the period.
| Q. | What is your investment outlook for emerging markets? |
| A. | At the end of fiscal year 2015, the emerging markets value-to-price (V/P) ratio stood at 0.89, indicating that, on average, emerging markets stocks are overpriced according to our system. Having surpassed our estimates of fair value, we have built up a cash position that we intend to put toward better bargains as they present themselves. Economic growth outside of the United States remains a key concern for investors, particularly as it relates to China and many of its fellow emerging market countries. Despite the prospect of the Federal Reserve tightening monetary policy in the near term, monetary policy in general remains accommodative globally. |
Although our system continues to indicate emerging markets in general are overvalued, there are still areas demonstrating good bargains according to our methodology. Examples of countries where we see opportunities include India and Thailand, and the Fund is overweight in both countries. Industries in which we are finding opportunities include internet software & services, health care facilities and property & casualty insurance. Guided by our disciplined, systematic and non-emotional approach to investing, we remain ready to reallocate and adapt as our investment system dictates.
ICON Emerging Markets Fund
Country Composition
September 30, 2015
| | | | |
India | | | 21.5% | |
South Korea | | | 20.8% | |
South Africa | | | 9.4% | |
China | | | 8.5% | |
Hong Kong | | | 6.5% | |
Thailand | | | 4.4% | |
Turkey | | | 3.2% | |
Philippines | | | 2.8% | |
Mexico | | | 2.6% | |
Brazil | | | 2.2% | |
Taiwan | | | 2.2% | |
Malaysia | | | 0.9% | |
| | | | |
| | | 85.0% | |
| | | | |
Percentages are based upon common and preferred stocks as a percentage of net assets.
ICON Emerging Markets Fund
Sector Composition
September 30, 2015
| | | | |
Real Estate Investment Trusts | | | 26.6% | |
Information Technology | | | 13.7% | |
Consumer Discretionary | | | 13.1% | |
Leisure and Consumer Staples | | | 8.8% | |
Industrials | | | 7.5% | |
Health Care | | | 5.2% | |
Telecommunication Services | | | 3.3% | |
Utilities | | | 2.5% | |
Telecommunication & Utilities | | | 2.0% | |
Materials | | | 1.9% | |
Energy | | | 0.4% | |
| | | | |
| | | 85.0% | |
| | | | |
Percentages are based upon common and preferred stocks as a percentage of net assets.
ICON Emerging Markets Fund
Industry Composition
September 30, 2015
| | | | |
Diversified Banks | | | 11.1% | |
Multi-Sector Holdings | | | 5.0% | |
Internet Software & Services | | | 4.0% | |
Health Care Facilities | | | 3.4% | |
Technology Hardware, Storage & Peripherals | | | 3.3% | |
Wireless Telecommunication Services | | | 3.3% | |
Household Products | | | 3.2% | |
Gas Utilities | | | 2.6% | |
Automobile Manufacturers | | | 2.5% | |
Airport Services | | | 2.4% | |
Life & Health Insurance | | | 2.4% | |
Property & Casualty Insurance | | | 2.3% | |
Environmental & Facilities Services | | | 2.2% | |
Motorcycle Manufacturers | | | 2.2% | |
Semiconductors | | | 2.2% | |
Thrifts & Mortgage Finance | | | 2.2% | |
Tobacco | | | 2.2% | |
Cable & Satellite | | | 2.1% | |
Water Utilities | | | 1.9% | |
IT Consulting & Other Services | | | 1.8% | |
Pharmaceuticals | | | 1.8% | |
Electronic Manufacturing Services | | | 1.4% | |
Real Estate Development | | | 1.4% | |
Reinsurance | | | 1.4% | |
Casinos & Gaming | | | 1.3% | |
Diversified Chemicals | | | 1.3% | |
Marine Ports & Services | | | 1.2% | |
Broadcasting | | | 1.0% | |
Electronic Equipment & Instruments | | | 1.0% | |
Specialty Stores | | | 1.0% | |
Other Industries (each less than 1%) | | | 9.9% | |
| | | | |
| | | 85.0% | |
| | | | |
Percentages are based upon common and preferred stocks as a percentage of net assets.
ICON Emerging Markets Fund
Average Annual Total Return
as of September 30, 2015
| | | | | | | | | | | | | | | | | | | | | | | | | | | | |
| | | Inception
Date | | | 1 Year | | | 5 Years | | | 10 Years | | | Since Inception | | | Gross
Expense
Ratio* | | | Net
Expense
Ratio* | |
ICON Emerging Markets Fund - Class S | | | 2/25/97 | | | | -5.61% | | | | 1.23% | | | | 3.52% | | | | 2.58% | | | | 2.11% | | | | 1.88% | |
ICON Emerging Markets Fund - Class C | | | 1/25/08 | | | | -6.68% | | | | 0.24% | | | | N/A | | | | -1.11% | | | | 4.65% | | | | 2.78% | |
ICON Emerging Markets Fund - Class A | | | 5/31/06 | | | | -5.84% | | | | 1.02% | | | | N/A | | | | 1.48% | | | | 4.32% | | | | 1.95% | |
ICON Emerging Markets Fund - Class A (including maximum sales charge of 5.75%) | | | 5/31/06 | | | | -11.27% | | | | -0.16% | | | | N/A | | | | 0.84% | | | | 4.32% | | | | 1.95% | |
MSCI Emerging Markets Index | | | | | | | -18.98% | | | | -3.25% | | | | 4.60% | | | | 5.13% | | | | N/A | | | | N/A | |
Past performance is not a guarantee of future results. Information about these performance results and the comparative indexes can be found in the About This Report section. The Fund’s name and investment strategy changed effective May 5, 2014. The Fund’s past performance would have been different if the current strategy had been in effect. The Adviser has agreed to limit certain Fund expenses; without these limitations, returns would have been lower. The limitation provisions may be terminated in the future.
| * | Please see the most recent prospectus for details. |
Class C total returns exclude applicable sales charges. If sales charges were included returns would be lower.
ICON Emerging Markets Fund
Value of a $10,000 Investment
through September 30, 2015
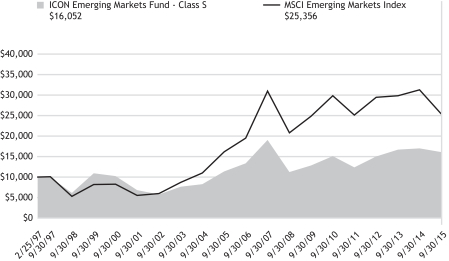
Past performance is not a guarantee of future results. The above graph compares a $10,000 investment made in the Emerging Markets Fund’s Class S shares on the Class’ inception date of 2/25/97 to a $10,000 investment made in an unmanaged securities index on that date. The Fund’s name and investment strategy changed effective May 5, 2014. The Fund’s past performance would have been different if the current strategy had been in effect. Performance for the Emerging Markets Fund’s other share classes will vary due to differences in charges and expenses. The Emerging Markets Fund’s performance in this chart and the performance table assumes the reinvestment of dividends, capital gain distributions and tax return of capital, but does not reflect the deduction of taxes that a shareholder would pay on Fund distributions or on the redemption of Fund shares.
ICON EMERGING MARKETS FUND
SCHEDULEOF INVESTMENTS
SEPTEMBER 30, 2015
| | | | | | | | |
| Shares or Principal Amount | | Value | |
| | | | | | | | |
| | Common Stocks (84.5%) | |
| | Agricultural Products (0.3%) | |
| | 22,000 | | | Genting Plantations Bhd* | | $ | 49,501 | |
| | | | | | | | |
| | Airport Services (2.4%) | |
| | 54,000 | | | Airports of Thailand PCL* | | | 419,138 | |
| | | | | | | | |
| | Apparel Retail (0.7%) | | | | |
| | 9,100 | | | Mr Price Group, Ltd.* | | | 127,032 | |
| | | | | | | | |
| | Automobile Manufacturers (2.5%) | |
| | 17,000 | | | Ford Otomotiv Sanayi* | | | 181,668 | |
| | 3,600 | | | Maruti Suzuki India, Ltd.* | | | 257,060 | |
| | | | | | | | |
| | | | | | | 438,728 | |
| | Brewers (0.7%) | | | | |
| | 24,500 | | | AMBEV S.A.** | | | 120,013 | |
| | | | | | | | |
| | Broadcasting (1.0%) | |
| | 30,000 | | | Zee Entertainment Enterprises, Ltd.* | | | 179,780 | |
| | | | | | | | |
| | Cable & Satellite (2.1%) | |
| | 2,870 | | | Naspers, Ltd., Class N* | | | 359,689 | |
| | | | | | | | |
| | Casinos & Gaming (1.3%) | |
| | 6,500 | | | Kangwon Land, Inc.* | | | 232,319 | |
| | | | | | | | |
| | Catalog Retail (0.7%) | |
| | 750 | | | CJ O Shopping Co., Ltd.* | | | 117,430 | |
| | | | | | | | |
| | Diversified Banks (10.6%) | |
| | 96,000 | | | Akbank T.A.S.* | | | 215,355 | |
| | 90,000 | | | BDO Unibank, Inc.* | | | 199,600 | |
| | 65,000 | | | Grupo Financiero Banorte S.A.B. de C.V., Class O** | | | 318,831 | |
| | 15,200 | | | HDFC Bank, Ltd.* | | | 248,541 | |
| | | | | | | | |
| Shares or Principal Amount | | Value | |
| | | | | | | | |
| | 88,700 | | | ICICI Bank, Ltd.* | | $ | 365,570 | |
| | 55,000 | | | Malayan Banking Bhd* | | | 107,297 | |
| | 10,800 | | | Standard Bank Group, Ltd.* | | | 105,453 | |
| | 25,400 | | | Yes Bank, Ltd.* | | | 283,809 | |
| | | | | | | | |
| | | | | | | 1,844,456 | |
| | Diversified Chemicals (1.3%) | |
| | 39,400 | | | Tata Chemicals, Ltd.* | | | 230,553 | |
| | | | | | | | |
| | Diversified Support Services (0.7%) | |
| | 1,200 | | | KEPCO Plant Service & Engineering Co., Ltd.* | | | 122,824 | |
| | | | | | | | |
| | Electronic Equipment & Instruments (1.0%) | |
| | 4,500 | | | SFA Engineering Corp.* | | | 171,202 | |
| | | | | | | | |
| | Electronic Manufacturing Services (1.4%) | |
| | 40,000 | | | AAC Technologies Holdings, Inc.* | | | 250,466 | |
| | | | | | | | |
| | Environmental & Facilities Services (2.2%) | |
| | 268,000 | | | China Everbright International, Ltd.* | | | 378,579 | |
| | | | | | | | |
| | Food Distributors (0.7%) | |
| | 5,700 | | | Hyundai Greenfood Co., Ltd.* | | | 123,467 | |
| | | | | | | | |
| | Gas Utilities (2.6%) | |
| | 42,000 | | | China Resources Gas Group, Ltd.* | | | 107,965 | |
| | 10,400 | | | Korea Gas Corp.* | | | 349,278 | |
| | | | | | | | |
| | | | | | | 457,243 | |
| | Health Care Facilities (3.4%) | | | | |
| | 8,200 | | | Apollo Hospitals Enterprise, Ltd.* | | | 180,002 | |
| | 159,000 | | | Life Healthcare Group Holdings, Ltd.* | | | 409,022 | |
| | | | | | | | |
| | | | | | | 589,024 | |
| | |
| 10 | | SCHEDULEOF INVESTMENTS |
| | | | | | | | |
| Shares or Principal Amount | | Value | |
| | | | | | | | |
| | Highways & Railtracks (0.6%) | |
| | 32,000 | | | CCR S.A.** | | $ | 98,232 | |
| | | | | | | | |
| | Hotels, Resorts & Cruise Lines (0.7%) | |
| | 1,000 | | | Hana Tour Service, Inc.* | | | 122,861 | |
| | | | | | | | |
| | Household Appliances (0.9%) | |
| | 2,200 | | | Coway Co., Ltd.* | | | 155,674 | |
| | | | | | | | |
| | Household Products (3.2%) | |
| | 780 | | | LG Household & Health Care, Ltd.* | | | 564,477 | |
| | | | | | | | |
| | Industrial Conglomerates (0.4%) | |
| | 12,000 | | | Beijing Enterprises Holdings, Ltd.* | | | 72,369 | |
| | | | | | | | |
| | Internet Software & Services (4.0%) | |
| | 240 | | | NAVER Corp.* | | | 104,025 | |
| | 35,045 | | | Tencent Holdings, Ltd.* | | | 591,653 | |
| | | | | | | | |
| | | | | | | 695,678 | |
| | IT Consulting & Other Services (1.8%) | |
| | 11,200 | | | Infosys, Ltd.* | | | 197,844 | |
| | 12,000 | | | Wipro, Ltd.* | | | 109,640 | |
| | | | | | | | |
| | | | | | | 307,484 | |
| | Life & Health Insurance (2.4%) | |
| | 50,000 | | | China Life Insurance Co. Ltd., Class H* | | | 174,219 | |
| | 49,000 | | | Ping An Insurance Group Co., Class H* | | | 245,171 | |
| | | | | | | | |
| | | | | | | 419,390 | |
| | Marine Ports & Services (1.2%) | |
| | 47,600 | | | Adani Ports and Special Economic Zone* | | | 217,449 | |
| | | | | | | | |
| | Motorcycle Manufacturers (2.2%) | |
| | 10,300 | | | Hero MotorCorp, Ltd.* | | | 376,881 | |
| | | | | | | | |
| | Multi-Sector Holdings (5.0%) | |
| | 17,000 | | | Ayala Corp.* | | | 279,150 | |
| | 53,000 | | | Haci Omer Sabanci Holding* | | | 155,511 | |
| | 23,900 | | | Remgro, Ltd.* | | | 435,906 | |
| | | | | | | | |
| | | | | | | 870,567 | |
| | | | | | | | |
| Shares or Principal Amount | | Value | |
| | | | | | | | |
| | Oil & Gas Storage & Transportation (0.4%) | |
| | 4,500 | | | Ultrapar Participacoes S.A.** | | $ | 75,823 | |
| | | | | | | | |
| | Personal Products (0.9%) | |
| | 16,000 | | | Hengan International Group Co., Ltd.* | | | 156,451 | |
| | | | | | | | |
| | Pharmaceuticals (1.8%) | |
| | 60,000 | | | China Medical System Holdings, Ltd.* | | | 68,518 | |
| | 3,800 | | | Dr. Reddy’s Laboratories, Ltd.* | | | 241,521 | |
| | | | | | | | |
| | | | | | | 310,039 | |
| | Property & Casualty Insurance (2.3%) | |
| | 8,000 | | | Hyundai Marine & Fire Insurance Co., Ltd.* | | | 204,117 | |
| | 820 | | | Samsung Fire & Marine Insurance Co., Ltd.* | | | 193,637 | |
| | | | | | | | |
| | | | | | | 397,754 | |
| | Real Estate Development (1.4%) | |
| | 106,000 | | | China Resources Land, Ltd.* | | | 250,299 | |
| | | | | | | | |
| | Real Estate Operating Companies (0.8%) | |
| | 116,000 | | | Central Pattana PCL* | | | 143,206 | |
| | | | | | | | |
| | Reinsurance (1.4%) | |
| | 20,784 | | | Korean Reinsurance Co.* | | | 250,233 | |
| | | | | | | | |
| | Semiconductors (2.2%) | |
| | 94,000 | | | Taiwan Semiconductor Manufacturing Co., Ltd.* | | | 376,721 | |
| | | | | | | | |
| | Soft Drinks (0.8%) | |
| | 25,000 | | | Arca Continental S.A.B. de C.V.** | | | 140,788 | |
| | | | | | | | |
| | Specialty Chemicals (0.6%) | |
| | 7,900 | | | Asian Paints, Ltd.* | | | 101,419 | |
| | | | | | | | |
| | Specialty Stores (1.0%) | | | | |
| | 1,890 | | | Hotel Shilla Co., Ltd.* | | | 184,216 | |
| | | | | | | | |
| | | | |
| SCHEDULEOF INVESTMENTS | | | 11 | |
| | | | | | | | |
| Shares or Principal Amount | | Value | |
| | | | | | | | |
| Technology Hardware, Storage &
Peripherals (3.3%) |
|
| | 596 | | | Samsung Electronics Co., Ltd.* | | $ | 571,834 | |
| | | | | | | | |
| | Thrifts & Mortgage Finance (2.2%) | |
| | 54,800 | | | LIC Housing Finance Ltd.* | | | 392,655 | |
| | | | | | | | |
| | Tobacco (2.2%) | | | | |
| | 75,200 | | | ITC, Ltd.* | | | 377,302 | |
| | | | | | | | |
| | Water Utilities (1.9%) | | | | |
| | 472,000 | | | Beijing Enterprises Water Group, Ltd.*† | | | 331,999 | |
| | | | | | | | |
| Wireless Telecommunication Services
(3.3%) |
|
| | 15,000 | | | Advanced Info Service PCL* | | | 93,555 | |
| | 50,000 | | | Intouch Holdings PCL, Class F* | | | 100,597 | |
| | 15,200 | | | MTN Group, Ltd.* | | | 195,461 | |
| | 810 | | | SK Telecom Co., Ltd.* | | | 179,687 | |
| | | | | | | | |
| | | | | | | 569,300 | |
| | | | | | | | |
| | | | | | | | |
| Shares or Principal Amount | | Value | |
| | | | | | | | |
| Total Common Stocks
(Cost $15,633,119) | | $ | 14,742,545 | |
| | Preferred Stock (0.5%) | | | | |
| | Diversified Banks (0.5%) | | | | |
| | 13,750 | | | Itau Unibanco Holding S.A.** | | | 91,944 | |
| | | | | | | | |
| Total Preferred Stocks
(Cost $196,055) | | | 91,944 | |
| | Short-Term Investments (14.8%) | |
| $ | 2,579,245 | | | State Street Euro Dollar Time Deposit (USD), 0.01%, 10/01/15 | | | 2,579,245 | |
| | | | | | | | |
| Total Short-Term Investments
(Cost $2,579,245) | | | 2,579,245 | |
| Total Investments 99.8%
(Cost $18,408,419) | | | 17,413,734 | |
| Other Assets Less Liabilities
0.2% | | | 35,645 | |
| | | | | | | | |
| | Net Assets 100.0% | | $ | 17,449,379 | |
| | | | | | | | |
The accompanying notes are an integral part of the financial statements.
| * | The value of foreign securities fair valued (Note 2) as of September 30, 2015 was 80.2% of net assets. |
| † | Non-income producing security. |
| ** | This security is considered a Level 1 security. See Note 2 for further details. |
| | |
| 12 | | SCHEDULEOF INVESTMENTS |
| | |
MANAGEMENT OVERVIEW (UNAUDITED) ICON INTERNATIONAL EQUITY FUND | | |
| Q. | How did the Fund perform relative to its benchmark? |
| A. | The ICON International Equity Fund (the Fund) Class S returned -3.15% for the fiscal year ended September 30, 2015, while the MSCI All Country World Index ex-United States (ACWI ex-U.S.) returned -11.78%. Total returns for other periods and additional Class shares as of September 30, 2015, appear in the subsequent pages of this Fund’s Management Overview. |
| Q. | What primary factors were behind the Fund’s relative performance? |
| A. | We finished fiscal year 2015 with global stock market losses as the global economy digested increased financial volatility and economic uncertainty. China found itself under the spotlight as continued slower growth brought forth worries about the ripple effects on the broader global economy. While other sectors and countries adjusted to this slowdown, China experienced large gyrations in its equity markets, which prompted government intervention in its markets. Japan experienced a slow recovery from recession, with the assistance of a stimulative monetary policy. However, the slow pace of the recovery begs the question of whether there is a need for further future policy action in Asia’s second largest economy. Europe generally experienced continued growth amidst the undercurrents of the domestic and global economy. Greece dominated headlines as fiscal problems and backlashes against austerity brought a real possibility of its exit from the Eurozone. As the period closed, we still saw modest upside in the global markets overall with some regions showing great bargains and others appearing slightly overpriced according to our system. |
At the beginning of the fiscal year, our valuation model signaled a modest 8% upside to fair value for global markets and pointed the Fund towards an overweight position in the cyclical sectors of the market such as Information Technology, Industrials, and Consumer Discretionary. From a regional perspective, the Fund maintained an overweight position in European equities as well as an underweight position in the Asia-Pacific region and Western Hemisphere. Emerging market equities remained overvalued according to our model and the Fund maintained an underweight position in those regions as well. Despite the ongoing issues looming over the world economy as well as rotations within the Fund that may seem contrarian, our discipline and focus on value guided our decisions, which we believe will benefit the Fund going forward.
As a multi-cap manager, we are not restricted by market capitalization. However, following our valuation readings led to a concentration in small and mid-cap companies during the period and an underweight position in large-cap stocks relative to the benchmark. Overall, large-cap stocks outperformed their small and mid-cap peers, which detracted from the fund’s relative performance.
Currency movements worldwide throughout the fiscal year also had a negative impact on the Fund’s returns. The U.S. dollar broadly strengthened throughout the year versus most of the underlying currencies of the holdings in the Fund. Currency hedging was not used during the fiscal year.
| Q. | How did the Fund’s composition affect performance? |
| A. | The Fund’s primary contributors to benchmark relative performance came from the Industrials and Information Technology sectors. Specifically, overweight positions in the diversified support services and industrial machinery industries within the Industrials sector and semiconductors and IT consulting & other services industries within the Information Technology Sector contributed to performance relative to the benchmark. Further, an underweight position in the poor performing Financials sector, specifically in the diversified banks industry, proved beneficial. |
Conversely, the Consumer Staples sector was a detractor, as the agricultural products and food retail industries hindered the Fund’s returns. The Energy sector was another notable source of relative underperformance as the sector was the worst performing sector for the period. The oil & gas equipment & services and oil & gas drilling industries suffered losses as commodity weakness had an adverse effect on companies’ stock prices. With the slight increase in interest rates and declines in stock prices, our valuation methodology is showing us slightly fewer bargains than we saw at the beginning of the year. As such, we see modest upside to the market, with the best bargains coming from the Financials and Industrials sectors.
While all geographic regions saw losses over the period, there were areas of clear differentiation among certain countries throughout the year. Most notably, emerging market countries saw larger losses, specifically in countries such as Brazil, Indonesia, Malaysia, and Russia. Conversely, countries in the developed world, specifically those in Europe, held up better throughout the year. As the period ended, the emerging markets and the Asia-Pacific region appeared overvalued according to our system while Europe and other developed markets in general showed the most upside globally.
| Q. | What is your investment outlook for the international equity market? |
| A. | Our system estimates that international equities, on average, still remain below our estimate of their intrinsic value. At the end of the period, international markets as a whole had an overall average value-to-price (V/P) ratio of 1.05, implying that, on average, our estimate of fair value for stocks is about 5% higher than where they are currently trading. Risk aversion amongst investors remains and corporate earnings have generally grown despite ongoing economic struggles and geopolitical concerns. While global economic growth has languished outside of the United States, interest rates remain low, thanks in great part to loose monetary policy and extraordinary central bank intervention. |
According to our valuation system, Europe represents the best opportunity from a regional perspective, with Asia-Pacific showing the least upside. Despite some improvements in sentiment and equity prices in the emerging market countries, overall they still remain overvalued according to our metrics and do not warrant an overweight exposure within the Fund. Based on our methodology, developed markets in Europe show attractive upside in countries such as Belgium, France, Germany, and Sweden. As of the end of the fiscal year 2015 we estimate that, on average, fair value for European equities is 25% higher than where prices are currently trading. Within the Western Hemisphere, Canada and Mexico look attractive to our system with Indonesia, the Philippines, and Thailand currently showing the most value in the Asia-Pacific region.
From a sector perspective, we are still tilted towards the Financials and Industrials sectors. Within our system, Energy is now the most over-valued sector, and represents an underweight position relative to the benchmark as we see little upside within this sector.
At ICON we continue to seek out industries that our system identifies as trading at a discount to fair value. Guided by our disciplined, systematic and non-emotional approach to investing, we see numerous opportunities amidst the recent turbulence and volatility. We believe it is nearly impossible to accurately time market bottoms and we believe rallies do not offer invitations. Therefore, given our current valuations, we remain almost fully invested. As market conditions dictate, we will adjust accordingly.
ICON International Equity Fund
Country Composition
September 30, 2015
| | | | |
Germany | | | 22.6% | |
United Kingdom | | | 12.8% | |
France | | | 11.6% | |
Canada | | | 6.7% | |
Japan | | | 5.8% | |
Switzerland | | | 5.4% | |
India | | | 4.7% | |
Denmark | | | 3.9% | |
Norway | | | 2.0% | |
Sweden | | | 2.0% | |
Belgium | | | 1.4% | |
Finland | | | 1.4% | |
Ireland | | | 1.4% | |
United States | | | 1.4% | |
Netherlands | | | 1.3% | |
South Korea | | | 1.3% | |
Isle Of Man | | | 1.1% | |
South Africa | | | 0.9% | |
China | | | 0.8% | |
Spain | | | 0.8% | |
Australia | | | 0.7% | |
Portugal | | | 0.7% | |
Hong Kong | | | 0.4% | |
Philippines | | | 0.4% | |
| | | | |
| | | 91.5% | |
| | | | |
Percentages are based upon common, preferred and real estate investment trusts stocks as a percentage of net assets. | |
ICON International Equity Fund
Sector Composition
September 30, 2015
| | | | |
Real Estate Investment Trusts | | | 19.2% | |
Industrials | | | 18.4% | |
Information Technology | | | 12.4% | |
Consumer Discretionary | | | 11.8% | |
Leisure and Consumer Staples | | | 9.9% | |
Health Care | | | 6.0% | |
Utilities | | | 5.3% | |
Materials | | | 5.2% | |
Energy | | | 1.9% | |
Telecommunication Services | | | 0.9% | |
Telecommunication & Utilities | | | 0.5% | |
| | | | |
| | | 91.5% | |
| | | | |
Percentages are based upon common, preferred and real estate investment trusts stocks as a percentage of net assets.
ICON International Equity Fund
Industry Composition
September 30, 2015
| | | | |
Pharmaceuticals | | | 4.6% | |
Diversified Banks | | | 4.3% | |
Data Processing & Outsourced Services | | | 3.3% | |
Life & Health Insurance | | | 3.3% | |
Multi-Utilities | | | 3.2% | |
Cable & Satellite | | | 3.1% | |
Electronic Equipment & Instruments | | | 2.9% | |
Packaged Foods & Meats | | | 2.9% | |
Specialty Chemicals | | | 2.6% | |
Industrial Conglomerates | | | 2.5% | |
Advertising | | | 2.4% | |
Airlines | | | 2.4% | |
Auto Parts & Equipment | | | 2.4% | |
Aerospace & Defense | | | 2.2% | |
Multi-line Insurance | | | 2.2% | |
Railroads | | | 2.1% | |
IT Consulting & Other Services | | | 2.0% | |
Research & Consulting Services | | | 1.8% | |
Building Products | | | 1.7% | |
Food Retail | | | 1.7% | |
Household Products | | | 1.7% | |
Semiconductors | | | 1.6% | |
Integrated Oil & Gas | | | 1.5% | |
Multi-Sector Holdings | | | 1.4% | |
Personal Products | | | 1.3% | |
Broadcasting | | | 1.2% | |
Diversified Support Services | | | 1.2% | |
Industrial Machinery | | | 1.2% | |
Integrated Telecommunication Services | | | 1.2% | |
Security & Alarm Services | | | 1.2% | |
Automobile Manufacturers | | | 1.1% | |
Diversified Capital Markets | | | 1.1% | |
Airport Services | | | 1.0% | |
Thrifts & Mortgage Finance | | | 1.0% | |
Water Utilities | | | 1.0% | |
Other Industries (each less than 1%) | | | 19.2% | |
| | | | |
| | | 91.5% | |
| | | | |
Percentages are based upon common, preferred and real estate investment trusts stocks as a percentage of net assets.
ICON International Equity Fund
Average Annual Total Return
as of September 30, 2015
| | | | | | | | | | | | | | | | | | | | | | | | | | | | |
| | | Inception
Date | | | 1 Year | | | 5 Years | | | 10 Years | | | Since
Inception | | | Gross
Expense
Ratio* | | | Net
Expense
Ratio* | |
ICON International Equity Fund - Class S | | | 2/18/97 | | | | -3.15% | | | | -0.81% | | | | 1.44% | | | | 4.77% | | | | 1.41% | | | | 1.41% | |
ICON International Equity Fund - Class C | | | 2/19/04 | | | | -4.20% | | | | -1.89% | | | | 0.27% | | | | 1.90% | | | | 2.82% | | | | 2.56% | |
ICON International Equity Fund - Class A | | | 5/31/06 | | | | -3.52% | | | | -1.17% | | | | N/A | | | | -1.02% | | | | 2.12% | | | | 1.81% | |
ICON International Equity Fund - Class A (including maximum sales charge of 5.75%) | | | 5/31/06 | | | | -9.06% | | | | -2.33% | | | | N/A | | | | -1.65% | | | | 2.12% | | | | 1.81% | |
MSCI ACWI ex-U.S. | | | | | | | -11.78% | | | | 2.27% | | | | 3.49% | | | | 4.53% | | | | N/A | | | | N/A | |
Past performance is not a guarantee of future results. Information about these performance results and the comparative indexes can be found in the About This Report section. The Fund’s name and investment strategy changed effective January 29, 2004. The Fund’s past performance would have been different if the current strategy had been in effect. The Adviser has agreed to limit certain Fund expenses; without these limitations, returns would have been lower. The limitation provisions may be terminated in the future.
| * | Please see the most recent prospectus for details. |
Class C total returns exclude applicable sales charges. If sales charges were included returns would be lower.
ICON International Equity Fund
Value of a $10,000 Investment
through September 30, 2015
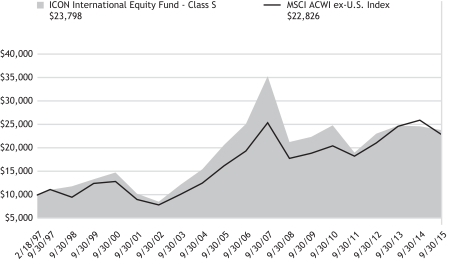
Past performance is not a guarantee of future results. The above graph compares a $10,000 investment made in the International Equity Fund’s Class S shares on the Class’ inception date of 2/18/97 to a $10,000 investment made in an unmanaged securities index on that date. The Fund’s name and investment strategy changed effective January 29, 2004. The Fund’s past performance would have been different if the current strategy had been in effect. Performance for the International Equity Fund’s other share classes will vary due to differences in charges and expenses. The International Equity Fund’s performance in this chart and the performance table assumes the reinvestment of dividends, capital gain distributions and tax return of capital, but does not reflect the deduction of taxes that a shareholder would pay on Fund distributions or on the redemption of Fund shares.
ICON INTERNATIONAL EQUITY FUND
SCHEDULEOF INVESTMENTS
SEPTEMBER 30, 2015
| | | | | | | | |
| Shares or Principal Amount | | Value | |
| | | | | | | | |
| | Common Stocks (89.0%) | |
| | Advertising (2.4%) | |
| | 19,500 | | | CyberAgent, Inc.*(a) | | $ | 762,814 | |
| | 50,000 | | | WPP PLC* | | | 1,040,950 | |
| | | | | | | | |
| | | | | | | 1,803,764 | |
| | Aerospace & Defense (2.2%) | | | | |
| | 5,400 | | | Airbus Group SE* | | | 319,788 | |
| | 87,000 | | | BAE Systems PLC* | | | 589,738 | |
| | 40,000 | | | Meggitt PLC* | | | 288,565 | |
| | 19,000 | | | Zodiac Aerospace* | | | 436,244 | |
| | | | | | | | |
| | | | | | | 1,634,335 | |
| | Airlines (2.4%) | |
| | 69,300 | | | Air Canada†** | | | 557,204 | |
| | 6,900 | | | American Airlines Group, Inc.** | | | 267,927 | |
| | 37,150 | | | Deutsche Lufthansa AG*† | | | 517,157 | |
| | 11,500 | | | Southwest Airlines Co.** | | | 437,460 | |
| | | | | | | | |
| | | | | | | 1,779,748 | |
| | Airport Services (1.0%) | |
| | 11,500 | | | Fraport AG Frankfurt Airport Services Worldwide* | | | 711,078 | |
| | | | | | | | |
| | Alternative Carriers (0.4%) | |
| | 63,000 | | | TalkTalk Telecom Group PLC*(a) | | | 299,997 | |
| | | | | | | | |
| | Application Software (0.8%) | |
| | 9,200 | | | SAP SE* | | | 596,010 | |
| | | | | | | | |
| | Asset Management & Custody Banks (0.7%) | |
| | 18,000 | | | Deutsche Beteiligungs AG* | | | 501,303 | |
| | | | | | | | |
| | Auto Parts & Equipment (2.4%) | |
| | 4,900 | | | Linamar Corp.** | | | 256,842 | |
| | 12,000 | | | Magna International, Inc.** | | | 575,586 | |
| | 33,000 | | | Martinrea International, Inc.** | | | 261,132 | |
| | 11,300 | | | Montupet* | | | 666,163 | |
| | | | | | | | |
| | | | | | | 1,759,723 | |
| | | | | | | | |
| Shares or Principal Amount | | Value | |
| | Automobile Manufacturers (1.1%) | |
| | 7,800 | | | Daimler AG* | | $ | 567,864 | |
| | 50,258 | | | Tata Motors, Ltd.*† | | | 228,161 | |
| | | | | | | | |
| | | | | | | 796,025 | |
| | Brewers (0.9%) | |
| | 18,200 | | | Royal Unibrew AS* | | | 681,433 | |
| | | | | | | | |
| | Broadcasting (1.2%) | |
| | 26,000 | | | Mediaset Espana Comunicacion S.A.* | | | 284,230 | |
| | 12,300 | | | ProSiebenSat.1 Media SE* | | | 603,753 | |
| | | | | | | | |
| | | | | | | 887,983 | |
| | Building Products (1.7%) | |
| | 16,000 | | | Assa Abloy AB* | | | 286,972 | |
| | 6,800 | | | Rockwool International AS, Class B* | | | 969,273 | |
| | | | | | | | |
| | | | | | | 1,256,245 | |
| | Cable & Satellite (3.1%) | |
| | 11,400 | | | Eutelsat Communications S.A.* | | | 349,650 | |
| | 5,138 | | | Naspers, Ltd., Class N* | | | 643,930 | |
| | 7,300 | | | Numericable-SFR SAS*† | | | 337,948 | |
| | 44,000 | | | Quebecor, Inc., Class B** | | | 963,087 | |
| | | | | | | | |
| | | | | | | 2,294,615 | |
| | Commodity Chemicals (0.9%) | |
| | 49,000 | | | Asahi Kasei Corp.* | | | 345,521 | |
| | 72,000 | | | Tosoh Corp.*(a) | | | 346,506 | |
| | | | | | | | |
| | | | | | | 692,027 | |
| | Communications Equipment (0.6%) | |
| | 43,000 | | | ADVA Optical Networking SE†** | | | 460,157 | |
| | | | | | | | |
| | Construction Materials (0.7%) | |
| | 4,200 | | | HeidelbergCement AG* | | | 288,422 | |
| | 4,630 | | | LafargeHolcim, Ltd.** | | | 241,191 | |
| | | | | | | | |
| | | | | | | 529,613 | |
| Data Processing & Outsourced Services
(3.3%) |
|
| | 169,000 | | | Optimal Payments PLC*† | | | 828,701 | |
| | |
| 20 | | SCHEDULEOF INVESTMENTS |
| | | | | | | | |
| Shares or Principal Amount | | Value | |
| | 33,500 | | | Wirecard AG* | | $ | 1,604,051 | |
| | | | | | | | |
| | | | | | | 2,432,752 | |
| | Distillers & Vintners (0.5%) | |
| | 15,000 | | | Diageo PLC* | | | 403,003 | |
| | | | | | | | |
| | Diversified Banks (4.3%) | | | | |
| | 86,000 | | | Axis Bank, Ltd.* | | | 655,029 | |
| | 42,900 | | | Commerzbank AG*† | | | 453,100 | |
| | 21,000 | | | DnB ASA* | | | 273,302 | |
| | 57,000 | | | HDFC Bank, Ltd.* | | | 932,027 | |
| | 250,000 | | | Lloyds Banking Group PLC* | | | 284,615 | |
| | 26,000 | | | Nordea Bank AB* | | | 290,069 | |
| | 27,000 | | | Skandinaviska Enskilda Banken AB* | | | 288,771 | |
| | | | | | | | |
| | | | | | | 3,176,913 | |
| | Diversified Capital Markets (1.1%) | |
| | 23,200 | | | Close Brothers Group PLC* | | | 524,757 | |
| | 12,000 | | | Deutsche Bank AG* | | | 323,846 | |
| | | | | | | | |
| | | | | | | 848,603 | |
| | Diversified Real Estate Activities (0.8%) | |
| | 5,800 | | | Daito Trust Construction Co., Ltd.* | | | 589,308 | |
| | | | | | | | |
| | Diversified Support Services (1.2%) | |
| | 38,000 | | | Babcock International Group PLC* | | | 525,700 | |
| | 6,600 | | | Cewe Stiftung & Co. KGAA* | | | 367,163 | |
| | | | | | | | |
| | | | | | | 892,863 | |
| | Electric Utilities (0.4%) | |
| | 146,000 | | | Power Grid Corp. of India, Ltd.* | | | 295,931 | |
| | | | | | | | |
| | Electronic Components (0.4%) | |
| | 20,600 | | | Japan Aviation Electronics Industry, Ltd.* | | | 309,417 | |
| | | | | | | | |
| | Electronic Equipment & Instruments (2.9%) | |
| | 5,157 | | | Ingenico Group* | | | 623,153 | |
| | 14,240 | | | Isra Vision AG* | | | 796,637 | |
| | 28,595 | | | Jenoptik AG* | | | 406,531 | |
| | 11,400 | | | Spectris PLC* | | | 291,678 | |
| | | | | | | | |
| | | | | | | 2,117,999 | |
| | Fertilizers & Agricultural Chemicals (0.3%) | |
| | 220,000 | | | Gujarat State Fertilizers & Chemicals, Ltd.* | | | 236,932 | |
| | | | | | | | |
| | | | | | | | |
| Shares or Principal Amount | | Value | |
| | Food Retail (1.7%) | |
| | 7,000 | | | Casino Guichard Perrachon S.A.* | | $ | 372,784 | |
| | 10,700 | | | Kesko Oyj, Class B* | | | 379,003 | |
| | 385,000 | | | Sonae SGPS S.A.* | | | 474,806 | |
| | | | | | | | |
| | | | | | | 1,226,593 | |
| | Gas Utilities (0.5%) | |
| | 12,000 | | | Korea Gas Corp.* | | | 403,014 | |
| | | | | | | | |
| | Health Care Equipment (0.8%) | |
| | 32,000 | | | GN Store Nord AS* | | | 574,872 | |
| | | | | | | | |
| | Household Products (1.1%) | |
| | 640 | | | LG Household & Health Care, Ltd.* | | | 463,161 | |
| | 16,000 | | | Pigeon Corp.** | | | 371,175 | |
| | | | | | | | |
| | | | | | | 834,336 | |
| | Hypermarkets & Super Centers (0.9%) | |
| | 11,500 | | | Carrefour S.A.** | | | 339,756 | |
| | 200,000 | | | Robinsons Retail Holdings, Inc.* | | | 312,837 | |
| | | | | | | | |
| | | | | | | 652,593 | |
| | Industrial Conglomerates (2.5%) | |
| | 3,198 | | | Daetwyler Holding AG*(a) | | | 434,128 | |
| | 25,000 | | | Indus Holding AG* | | | 1,118,574 | |
| | 3,650 | | | Siemens AG* | | | 326,080 | |
| | | | | | | | |
| | | | | | | 1,878,782 | |
| | Industrial Machinery (1.2%) | |
| | 1,400,000 | | | EVA Precision Industrial Holdings, Ltd.* | | | 276,484 | |
| | 8,000 | | | GEA Group AG* | | | 305,043 | |
| | 5,500 | | | NKT Holding AS* | | | 290,380 | |
| | | | | | | | |
| | | | | | | 871,907 | |
| | Integrated Oil & Gas (1.5%) | |
| | 73,300 | | | BP PLC** | | | 370,354 | |
| | 15,500 | | | Royal Dutch Shell PLC, Class B** | | | 366,486 | |
| | 8,200 | | | Total S.A.** | | | 368,340 | |
| | | | | | | | |
| | | | | | | 1,105,180 | |
| Integrated Telecommunication Services
(1.2%) |
|
| | 20,300 | | | Deutsche Telekom AG* | | | 361,370 | |
| | 28,000 | | | Telenor ASA*(a) | | | 523,224 | |
| | | | | | | | |
| | | | | | | 884,594 | |
| | | | |
| SCHEDULEOF INVESTMENTS | | | 21 | |
| | | | | | | | |
| Shares or Principal Amount | | Value | |
| | Internet Software & Services (0.8%) | |
| | 10,100 | | | Alibaba Group Holding, Ltd., ADR†** | | $ | 595,597 | |
| | | | | | | | |
| | IT Consulting & Other Services (2.0%) | |
| | 5,629 | | | Atos SE* | | | 432,680 | |
| | 8,000 | | | CANCOM SE* | | | 278,536 | |
| | 5,000 | | | Cap Gemini S.A.* | | | 446,514 | |
| | 14,000 | | | GFT Technologies SE* | | | 342,230 | |
| | | | | | | | |
| | | | | | | 1,499,960 | |
| | Leisure Products (0.9%) | |
| | 26,000 | | | Amer Sports OYJ* | | | 661,328 | |
| | | | | | | | |
| | Life & Health Insurance (3.3%) | |
| | 51,000 | | | Aegon N.V.* | | | 292,441 | |
| | 156,000 | | | Legal & General Group PLC* | | | 562,500 | |
| | 10,200 | | | NN Group** | | | 292,003 | |
| | 60,000 | | | Prudential PLC* | | | 1,265,791 | |
| | | | | | | | |
| | | | | | | 2,412,735 | |
| | Life Sciences Tools & Services (0.6%) | |
| | 3,100 | | | Tecan Group AG* | | | 436,490 | |
| | | | | | | | |
| | Multi-line Insurance (2.2%) | |
| | 4,000 | | | Allianz SE* | | | 628,371 | |
| | 24,400 | | | AXA S.A.* | | | 592,406 | |
| | 14,000 | | | Talanx AG* | | | 419,416 | |
| | | | | | | | |
| | | | | | | 1,640,193 | |
| | Multi-Sector Holdings (1.4%) | |
| | 13,500 | | | Groupe Bruxelles Lambert S.A.* | | | 1,018,764 | |
| | | | | | | | |
| | Multi-Utilities (3.2%) | |
| | 22,100 | | | Atco, Ltd., Class I** | | | 649,172 | |
| | 31,000 | | | E.ON SE* | | | 266,025 | |
| | 34,900 | | | Engie* | | | 564,699 | |
| | 48,500 | | | National Grid PLC* | | | 675,466 | |
| | 20,000 | | | RWE AG* | | | 227,274 | |
| | | | | | | | |
| | | | | | | 2,382,636 | |
| | Oil & Gas Storage & Transportation (0.4%) | |
| | 7,800 | | | Enbridge, Inc.** | | | 289,614 | |
| | | | | | | | |
| | Packaged Foods & Meats (2.9%) | |
| | 7,800 | | | Danone* | | | 492,360 | |
| | 14,400 | | | Nestle S.A.* | | | 1,082,961 | |
| | 230 | | | Orion Corp * | | | 183,158 | |
| | 17,000 | | | Saputo, Inc.** | | | 373,249 | |
| | | | | | | | |
| | | | | | | 2,131,728 | |
| | | | | | | | |
| Shares or Principal Amount | | Value | |
| | Paper Packaging (0.7%) | |
| | 19,300 | | | Smurfit Kappa Group PLC* | | $ | 519,981 | |
| | | | | | | | |
| | Personal Products (1.3%) | |
| | 8,400 | | | Kao Corp.** | | | 378,320 | |
| | 3,400 | | | L’Oreal S.A.* | | | 590,968 | |
| | | | | | | | |
| | | | | | | 969,288 | |
| | Pharmaceuticals (4.6%) | |
| | 2,800 | | | Bayer AG* | | | 359,235 | |
| | 33,000 | | | Cipla, Ltd.* | | | 320,741 | |
| | 5,600 | | | Novartis AG* | | | 514,706 | |
| | 7,000 | | | Novo Nordisk AS, Class B* | | | 377,752 | |
| | 4,000 | | | Roche Holding AG* | | | 1,061,886 | |
| | 7,900 | | | Shire PLC* | | | 540,060 | |
| | 1,500 | | | Valeant Pharmaceuticals International, Inc.†** | | | 267,741 | |
| | | | | | | | |
| | | | | | | 3,442,121 | |
| | Railroads (2.1%) | |
| | 3,600 | | | Canadian Pacific Railway, Ltd.** | | | 516,706 | |
| | 34,000 | | | VTG AG*(a) | | | 1,005,707 | |
| | | | | | | | |
| | | | | | | 1,522,413 | |
| | Real Estate Development (0.8%) | |
| | 145,321 | | | Oberoi Realty, Ltd.* | | | 605,807 | |
| | | | | | | | |
| | Real Estate Operating Companies (0.8%) | |
| | 6,000 | | | Deutsche EuroShop AG* | | | 269,799 | |
| | 10,200 | | | Vonovia SE* | | | 328,297 | |
| | | | | | | | |
| | | | | | | 598,096 | |
| | Reinsurance (0.8%) | |
| | 2,200 | | | Muenchener Rueckversicherungs Gesellschaft AG* | | | 410,882 | |
| | 2,300 | | | Swiss Re AG* | | | 197,333 | |
| | | | | | | | |
| | | | | | | 608,215 | |
| | Research & Consulting Services (1.8%) | |
| | 6,510 | | | Bertrandt AG* | | | 679,828 | |
| | 8,900 | | | Teleperformance* | | | 675,308 | |
| | | | | | | | |
| | | | | | | 1,355,136 | |
| | Security & Alarm Services (1.2%) | |
| | 21,500 | | | Loomis AB, Class B* | | | 563,516 | |
| | 67,500 | | | Prosegur Cia de Seguridad S.A.* | | | 325,031 | |
| | | | | | | | |
| | | | | | | 888,547 | |
| | |
| 22 | | SCHEDULEOF INVESTMENTS |
| | | | | | | | |
| Shares or Principal Amount | | Value | |
| | Semiconductors (1.6%) | |
| | 40,100 | | | ARM Holdings PLC* | | $ | 576,125 | |
| | 54,905 | | | Infineon Technologies AG* | | | 616,881 | |
| | | | | | | | |
| | | | | | | 1,193,006 | |
| | Specialized Finance (0.4%) | |
| | 95,000 | | | Power Finance Corp., Ltd.* | | | 333,380 | |
| | | | | | | | |
| | Specialty Chemicals (2.6%) | |
| | 111,640 | | | Borregaard ASA* | | | 672,465 | |
| | - | (b) | | Duk San Neolux Co., Ltd.*† | | | - | (b) |
| | 35,000 | | | Hitachi Chemical Co., Ltd.*(a) | | | 482,904 | |
| | 29,000 | | | Tokyo Ohka Kogyo Co., Ltd.* | | | 768,767 | |
| | | | | | | | |
| | | | | | | 1,924,136 | |
| | Thrifts & Mortgage Finance (1.0%) | |
| | 127,000 | | | Paragon Group of Cos. PLC* | | | 759,803 | |
| | | | | | | | |
| | Tires & Rubber (0.4%) | |
| | 3,200 | | | Cie Generale des Etablissements Michelin, Class B** | | | 291,132 | |
| | | | | | | | |
| | Trading Companies & Distributors (0.4%) | |
| | 114,000 | | | SIG PLC* | | | 299,713 | |
| | | | | | | | |
| | Trucking (0.7%) | |
| | 29,000 | | | TransForce, Inc.**(a) | | | 519,153 | |
| | | | | | | | |
| | Water Utilities (1.0%) | |
| | 32,700 | | | Pennon Group PLC* | | | 384,633 | |
| | 23,000 | | | United Utilities Group PLC* | | | 322,368 | |
| | | | | | | | |
| | | | | | | 707,001 | |
| | | | | | | | |
| Total Common Stocks
(Cost $72,099,089) | | | 66,025,621 | |
| | | | | | | | |
| Shares or Principal Amount | | Value | |
| | Preferred Stocks (0.9%) | |
| | Home Improvement Retail (0.3%) | |
| | 2,740 | | | Hornbach Holding AG* | | $ | 220,620 | |
| | | | | | | | |
| | Household Products (0.6%) | |
| | 4,700 | | | Henkel AG & Co. KGaA* | | | 484,078 | |
| | | | | | | | |
| Total Preferred Stocks
(Cost $747,656) | | | 704,698 | |
| | Real Estate Investment Trusts (1.6%) | |
| | 14,300 | | | Klepierre, REIT* | | | 648,109 | |
| | 173,000 | | | Charter Hall Group, REIT* | | | 531,191 | |
| | | | | | | | |
| Total Real Estate Investment
Trusts
(Cost $1,278,562) | | | 1,179,300 | |
| | Collateral for Securities on Loan (5.1%) | |
| | 3,785,339 | | | State Street Navigator Prime Portfolio, 0.20% | | | 3,785,339 | |
| | | | | | | | |
| Total Collateral for Securities
on Loan
(Cost $3,785,339) | | | 3,785,339 | |
| | Short-Term Investments (15.1%) | |
| $ | 11,214,677 | | | State Street Euro Dollar Time Deposit (USD), 0.01%, 10/01/15 | | | 11,214,677 | |
| | | | | | | | |
| Total Short-Term Investments
(Cost $11,214,677) | | | 11,214,677 | |
| Total Investments 111.7%
(Cost $89,125,323) | | | 82,909,635 | |
| Liabilities Less Other Assets
(11.7)% | | | (8,684,407 | ) |
| | | | | | | | |
| | Net Assets 100.0% | | $ | 74,225,228 | |
| | | | | | | | |
The accompanying notes are an integral part of the financial statements.
| * | The value of foreign securities fair valued (Note 2) as of September 30, 2015 was 78.0% of net assets. |
| † | Non-income producing security. |
| ** | This security is considered a Level 1 security. See Note 2 for further details. |
| (a) | All or a portion of the security was on loan as of September 30, 2015. |
| ADR | American Depositary Receipt |
| REIT | Real Estate Investment Trust |
| | | | |
| SCHEDULEOF INVESTMENTS | | | 23 | |
STATEMENTSOF ASSETSAND LIABILITIES
SEPTEMBER 30, 2015
| | | | | | | | |
| | | ICON
Emerging Markets
Fund | | | ICON
International
Equity Fund | |
Assets | | | | | | | | |
Investments, at cost | | $ | 18,408,419 | | | $ | 89,125,323 | |
| | | | | | | | |
Investments, at value† | | | 17,413,734 | | | | 82,909,635 | |
Foreign currency, at value(a) | | | 15,757 | | | | 43,958 | |
Receivables: | | | | | | | | |
Fund shares sold | | | 49,295 | | | | 93,574 | |
Expense reimbursements due from Adviser | | | 36,492 | | | | 12,169 | |
Dividends | | | 6,551 | | | | 52,637 | |
Foreign tax reclaims | | | 2,661 | | | | 65,734 | |
Other assets | | | 9,455 | | | | 21,774 | |
| | | | | | | | |
Total Assets | | | 17,533,945 | | | | 83,199,481 | |
| | | | | | | | |
Liabilities | | | | | | | | |
Payables: | | | | | | | | |
Fund shares redeemed | | | 21,007 | | | | 36,208 | |
Advisory fees | | | 14,540 | | | | 61,556 | |
Transfer agent fees | | | 5,361 | | | | 11,669 | |
Fund accounting fees | | | 784 | | | | 3,478 | |
Administration fees | | | 726 | | | | 3,077 | |
Accrued distribution fees | | | 623 | | | | 3,527 | |
Trustee fees | | | 455 | | | | 3,313 | |
Capital gains tax | | | 454 | | | | - | |
Investments purchased | | | - | | | | 5,006,685 | |
Payable for collateral received on securities loaned | | | - | | | | 3,785,339 | |
Accrued expenses | | | 40,616 | | | | 59,401 | |
| | | | | | | | |
Total Liabilities | | | 84,566 | | | | 8,974,253 | |
| | | | | | | | |
Net Assets - all share classes | | $ | 17,449,379 | | | $ | 74,225,228 | |
| | | | | | | | |
Net Assets - Class S | | $ | 16,122,801 | | | $ | 67,200,360 | |
| | | | | | | | |
Net Assets - Class C | | $ | 601,620 | | | $ | 3,299,387 | |
| | | | | | | | |
Net Assets - Class A | | $ | 724,958 | | | $ | 3,725,481 | |
| | | | | | | | |
| | | | | | | | |
| | | ICON
Emerging Markets
Fund | | | ICON
International
Equity Fund | |
Net Assets Consist of | | | | | | | | |
Paid-in capital | | $ | 26,190,223 | | | $ | 169,330,116 | |
Accumulated undistributed net investment income/(loss) | | | (19,769 | ) | | | (511,973 | ) |
Accumulated undistributed net realized gain/(loss) | | | (7,724,835 | ) | | | (88,364,836 | ) |
Unrealized appreciation/(depreciation) | | | (996,240 | ) | | | (6,228,079 | ) |
| | | | | | | | |
Net Assets | | $ | 17,449,379 | | | $ | 74,225,228 | |
| | | | | | | | |
Shares outstanding (unlimited shares authorized, no par value) | | | | | | | | |
Class S | | | 1,244,546 | | | | 5,909,082 | |
Class C | | | 48,893 | | | | 321,343 | |
Class A | | | 56,144 | | | | 331,482 | |
Net asset value (offering and redemption price per share) | | | | | | | | |
Class S | | $ | 12.95 | | | $ | 11.37 | |
Class C | | $ | 12.30 | | | $ | 10.27 | |
Class A | | $ | 12.91 | | | $ | 11.24 | |
Class A maximum offering price (100%/(100%-maximum sales charge)) of net asset value adjusted to the nearest cent per share | | $ | 13.69 | | | $ | 11.92 | |
| | |
† Includes securities on loan of | | $ | - | | | $ | 3,656,301 | |
| | |
(a) Foreign currency, at cost | | $ | 16,305 | | | $ | 44,611 | |
The accompanying notes are an integral part of the financial statements.
STATEMENTSOF OPERATIONS
FORTHEYEARENDED SEPTEMBER 30, 2015
| | | | | | | | |
| | | ICON
Emerging Markets
Fund | | | ICON
International
Equity Fund | |
Investment Income | | | | | | | | |
Interest | | $ | 494 | | | $ | 1,143 | |
Dividends | | | 182,308 | | | | 1,278,051 | |
Income from securities lending, net | | | - | | | | 47,040 | |
Foreign taxes withheld | | | (17,285 | ) | | | (129,985 | ) |
| | | | | | | | |
Total Investment Income | | | 165,517 | | | | 1,196,249 | |
| | | | | | | | |
Expenses | | | | | | | | |
Advisory fees | | | 121,707 | | | | 845,192 | |
Audit and tax service expense | | | 49,042 | | | | 51,125 | |
Registration fees: | | | | | | | | |
Class S | | | 16,184 | | | | 14,011 | |
Class C | | | 10,824 | | | | 11,055 | |
Class A | | | 10,251 | | | | 10,810 | |
Transfer agent fees | | | 29,110 | | | | 81,953 | |
Custody fees | | | 18,983 | | | | 45,758 | |
Distribution fees: | | | | | | | | |
Class C | | | 5,911 | | | | 40,707 | |
Class A | | | 1,196 | | | | 10,002 | |
Administration fees | | | 6,085 | | | | 42,259 | |
Fund accounting fees | | | 2,866 | | | | 19,707 | |
Insurance expense | | | 2,253 | | | | 7,403 | |
Trustee fees and expenses | | | 1,382 | | | | 11,444 | |
Interest expense | | | 512 | | | | 409 | |
Other expenses | | | 47,970 | | | | 97,873 | |
| | | | | | | | |
Total expenses before expense reimbursement | | | 324,276 | | | | 1,289,708 | |
Expense reimbursement by Adviser due to expense limitation agreement | | | (128,011 | ) | | | (34,663 | ) |
| | | | | | | | |
Net Expenses | | | 196,265 | | | | 1,255,045 | |
| | | | | | | | |
Net Investment Income/(Loss) | | | (30,748 | ) | | | (58,796 | ) |
| | | | | | | | |
Net Realized and Unrealized Gain/(Loss) | | | | | | | | |
Net realized gain/(loss) on: | | | | | | | | |
Investments | | | (248,300 | ) | | | (4,553,855 | ) |
Foreign currency | | | (19,620 | ) | | | (503,558 | ) |
Net realized capital gains tax | | | - | | | | (106,007 | ) |
Change in unrealized net appreciation/(depreciation) on: | | | | | | | | |
Investments and foreign currency | | | (787,160 | ) | | | 3,115,720 | |
Net unrealized capital gains tax | | | (26 | ) | | | 4,052 | |
| | | | | | | | |
Net realized and unrealized gain/(loss) | | | (1,055,106 | ) | | | (2,043,648 | ) |
| | | | | | | | |
Net Increase/(Decrease) in Net Assets Resulting From Operations | | $ | (1,085,854 | ) | | $ | (2,102,444 | ) |
| | | | | | | | |
The accompanying notes are an integral part of the financial statements.
(This page is intentionally left blank)
STATEMENTSOF CHANGESIN NET ASSETS
| | | | | | | | |
| | | ICON Emerging Markets Fund | |
| | | Year Ended
September 30,
2015 | | | Year Ended
September 30,
2014 | |
Operations | | | | | | | | |
Net investment income/(loss) | | $ | (30,748 | ) | | $ | (44,580 | ) |
Net realized gain/(loss) on investments | | | (248,300 | ) | | | 2,609,559 | |
Net realized gain/(loss) from foreign currency | | | (19,620 | ) | | | (37,546 | ) |
Net realized capital gains tax | | | - | | | | (52,013 | ) |
Change in net unrealized appreciation/(depreciation) | | | (787,186 | ) | | | (2,391,992 | ) |
| | | | | | | | |
Net increase/(decrease) in net assets resulting from operations | | | (1,085,854 | ) | | | 83,428 | |
| | | | | | | | |
Dividends and Distributions to Shareholders | | | | | | | | |
Net investment income | | | | | | | | |
Class S | | | - | | | | (59,304 | ) |
Class A | | | - | | | | (1,490 | ) |
| | | | | | | | |
Net decrease from dividends and distributions | | | - | | | | (60,794 | ) |
| | | | | | | | |
Fund Share Transactions | | | | | | | | |
Shares sold | | | | | | | | |
Class S | | | 20,067,880 | | | | 6,840,980 | |
Class C | | | 349,016 | | | | 123,445 | |
Class A | | | 862,982 | | | | 75,466 | |
Reinvested dividends and distributions | | | | | | | | |
Class S | | | - | | | | 56,463 | |
Class A | | | - | | | | 1,270 | |
Shares repurchased | | | | | | | | |
Class S | | | (11,885,964 | ) | | | (27,023,177 | ) |
Class C | | | (468,737 | ) | | | (198,478 | ) |
Class A | | | (398,743 | ) | | | (562,635 | ) |
| | | | | | | | |
Net increase/(decrease) from fund share transactions | | | 8,526,434 | | | | (20,686,666 | ) |
| | | | | | | | |
Total net increase/(decrease) in net assets | | | 7,440,580 | | | | (20,664,032 | ) |
Net Assets | | | | | | | | |
Beginning of year | | | 10,008,799 | | | | 30,672,831 | |
| | | | | | | | |
End of year | | $ | 17,449,379 | | | $ | 10,008,799 | |
| | | | | | | | |
| | | | | | |
| ICON International Equity Fund | |
Year Ended
September 30, 2015 | | | Year Ended
September 30,
2014 | |
| | | | | | |
| $ | (58,796 | ) | | $ | 210,917 | |
| | (4,553,855 | ) | | | 7,551,567 | |
| | (503,558 | ) | | | (271,659 | ) |
| | (106,007 | ) | | | (35,013 | ) |
| | 3,119,772 | | | | (11,815,994 | ) |
| | | | | | |
| | | | | | |
| | (2,102,444 | ) | | | (4,360,182 | ) |
| | | | | | |
| | | | | | |
| | | | | | |
| | (71,695 | ) | | | - | |
| | - | | | | - | |
| | | | | | |
| | (71,695 | ) | | | - | |
| | | | | | |
| | | | | | |
| | | | | | |
| | 4,506,506 | | | | 54,955,281 | |
| | 82,616 | | | | 194,693 | |
| | 1,145,130 | | | | 353,579 | |
| | | | | | |
| | 70,812 | | | | - | |
| | - | | | | - | |
| | | | | | |
| | (15,856,511 | ) | | | (12,360,031 | ) |
| | (1,251,157 | ) | | | (1,233,291 | ) |
| | (1,339,594 | ) | | | (1,312,960 | ) |
| | | | | | |
| | (12,642,198 | ) | | | 40,597,271 | |
| | | | | | |
| | (14,816,337 | ) | | | 36,237,089 | |
| | | | | | |
| | 89,041,565 | | | | 52,804,476 | |
| | | | | | |
| $ | 74,225,228 | | | $ | 89,041,565 | |
| | | | | | |
STATEMENTSOF CHANGESIN NET ASSETS (CONTINUED)
| | | | | | | | |
| | | ICON Emerging Markets Fund | |
| | | Year Ended
September 30,
2015 | | | Year Ended
September 30,
2014 | |
Transactions in Fund Shares | | | | | | | | |
Shares sold | | | | | | | | |
Class S | | | 1,456,599 | | | | 496,107 | |
Class C | | | 26,591 | | | | 9,218 | |
Class A | | | 62,831 | | | | 5,468 | |
Reinvested dividends and distributions | | | | | | | | |
Class S | | | - | | | | 4,198 | |
Class A | | | - | | | | 94 | |
Shares repurchased | | | | | | | | |
Class S | | | (863,679 | ) | | | (1,998,939 | ) |
Class C | | | (35,508 | ) | | | (15,076 | ) |
Class A | | | (28,954 | ) | | | (41,663 | ) |
| | | | | | | | |
Net increase/(decrease) | | | 617,880 | | | | (1,540,593 | ) |
| | | | | | | | |
Shares outstanding, beginning of year | | | 731,703 | | | | 2,272,296 | |
| | | | | | | | |
Shares outstanding, end of year | | | 1,349,583 | | | | 731,703 | |
| | | | | | | | |
Accumulated undistributed net investment income/(loss) | | $ | (19,769 | ) | | $ | (18,814 | ) |
| | | | | | | | |
The accompanying notes are an integral part of the financial statements.
| | | | | | |
| ICON International Equity Fund | |
Year Ended
September 30, 2015 | | | Year Ended
September 30,
2014 | |
| | | | | | |
| | | | | | |
| | 382,453 | | | | 4,258,487 | |
| | 7,381 | | | | 16,869 | |
| | 94,725 | | | | 28,338 | |
| | | | | | |
| | 6,089 | | | | - | |
| | - | | | | - | |
| | | | | | |
| | (1,317,093 | ) | | | (986,622 | ) |
| | (114,930 | ) | | | (107,336 | ) |
| | (114,235 | ) | | | (106,543 | ) |
| | | | | | |
| | (1,055,610 | ) | | | 3,103,193 | |
| | | | | | |
| | 7,617,517 | | | | 4,514,324 | |
| | | | | | |
| | 6,561,907 | | | | 7,617,517 | |
| | | | | | |
| | | | | | |
| $ | (511,973 | ) | | $ | 71,689 | |
| | | | | | |
FINANCIAL HIGHLIGHTS
| | | | | | | | | | | | | | | | | | | | | | | | |
| | | | | | Income/(loss) from investment operations | | | Less dividends and | |
| | | Net asset
value,
beginning
of period | | | Net
investment
income/
(loss)(x) | | | Net realized
and unrealized
gains/(losses)
on investments | | | Total from
investment
operations | | | Dividends
from net
investment
income | | | Distributions
from net
realized
gains | |
ICON Emerging Markets Fund | | | | | | | | | | | | | | | | | | | | | | | | |
Class S | | | | | | | | | | | | | | | | | | | | | | | | |
Year ended September 30, 2015 | | $ | 13.72 | | | $ | (0.03 | ) | | $ | (0.74 | ) | | $ | (0.77 | ) | | $ | - | | | $ | - | |
Year ended September 30, 2014 | | | 13.51 | | | | (0.03 | ) | | | 0.27 | | | | 0.24 | | | | (0.03 | ) | | | - | |
Year ended September 30, 2013 | | | 12.21 | | | | 0.06 | | | | 1.33 | | | | 1.39 | | | | (0.09 | ) | | | - | |
Year ended September 30, 2012 | | | 10.12 | | | | 0.11 | | | | 2.02 | | | | 2.13 | | | | (0.04 | ) | | | - | |
Year ended September 30, 2011 | | | 12.35 | | | | 0.07 | | | | (2.30 | ) | | | (2.23 | ) | | | - | | | | - | |
Class C | | | | | | | | | | | | | | | | | | | | | | | | |
Year ended September 30, 2015 | | | 13.18 | | | | (0.17 | ) | | | (0.71 | ) | | | (0.88 | ) | | | - | | | | - | |
Year ended September 30, 2014 | | | 13.06 | | | | (0.11 | ) | | | 0.23 | | | | 0.12 | | | | - | | | | - | |
Year ended September 30, 2013 | | | 11.84 | | | | (0.05 | ) | | | 1.28 | | | | 1.23 | | | | (0.01 | ) | | | - | |
Year ended September 30, 2012 | | | 9.88 | | | | 0.01 | | | | 1.95 | | | | 1.96 | | | | - | | | | - | |
Year ended September 30, 2011 | | | 12.17 | | | | (0.02 | ) | | | (2.27 | ) | | | (2.29 | ) | | | - | | | | - | |
Class A | | | | | | | | | | | | | | | | | | | | | | | | |
Year ended September 30, 2015 | | | 13.71 | | | | (0.07 | ) | | | (0.73 | ) | | | (0.80 | ) | | | - | | | | - | |
Year ended September 30, 2014 | | | 13.51 | | | | (0.04 | ) | | | 0.27 | | | | 0.23 | | | | (0.03 | ) | | | - | |
Year ended September 30, 2013 | | | 12.17 | | | | 0.04 | | | | 1.33 | | | | 1.37 | | | | (0.03 | ) | | | - | |
Year ended September 30, 2012 | | | 10.10 | | | | 0.09 | | | | 2.00 | | | | 2.09 | | | | (0.02 | ) | | | - | |
Year ended September 30, 2011 | | | 12.35 | | | | 0.04 | | | | (2.29 | ) | | | (2.25 | ) | | | - | | | | - | |
| | | | | | | | | | | | | | | | | | | | | | | | | | | | | | | | | | |
| distributions | | | | | | | | | | | | Ratio of expenses
to average net assets | | | Ratio of net investment
income/(loss)
to average net assets | | | | |
Total
dividends
and
distributions | | | Net asset
value, end
of period | | | Total
return* | | | Net assets,
end of
period (in
thousands) | | | Before
expense
limitation/
recoupment
and transfer
agent
earnings
credits | | | After
expense
limitation/
recoupment
and transfer
agent
earnings
credits | | | Before
expense
limitation/
recoupment
and transfer
agent
earnings
credits | | | After
expense
limitation/
recoupment
and transfer
agent
earnings
credits | | | Portfolio
turnover
rate(a) | |
| | | | | | | | | | | | | | | | | | | | | | | | | | | | | | | | | | |
| | | | | | | | | | | | | | | | | | | | | | | | | | | | | | | | | | |
| $ | - | | | $ | 12.95 | | | | (5.61 | )% | | $ | 16,123 | | | | 2.44 | % | | | 1.55 | % | | | (1.08 | )% | | | (0.19 | )% | | | 76.12 | % |
| | (0.03 | ) | | | 13.72 | | | | 1.78 | % | | | 8,942 | | | | 2.11 | % | | | 1.88 | %(d) | | | (0.42 | )% | | | (0.19 | )% | | | 92.17 | % |
| | (0.09 | ) | | | 13.51 | | | | 11.44 | % | | | 29,053 | | | | 1.64 | % | | | 1.64 | % | | | 0.46 | % | | | 0.46 | % | | | 59.98 | % |
| | (0.04 | ) | | | 12.21 | | | | 21.16 | % | | | 37,969 | | | | 1.50 | % | | | 1.50 | % | | | 0.96 | % | | | 0.96 | % | | | 71.84 | % |
| | - | | | | 10.12 | | | | (18.06 | )% | | | 55,637 | | | | 1.59 | % | | | 1.59 | % | | | 0.55 | % | | | 0.55 | % | | | 71.03 | % |
| | | | | | | | | | | | | | | | | | | | | | | | | | | | | | | | | | |
| | - | | | | 12.30 | | | | (6.68 | )% | | | 601 | | | | 5.11 | % | | | 2.55 | %(b) | | | (3.88 | )% | | | (1.32 | )% | | | 76.12 | % |
| | - | | | | 13.18 | | | | 0.92 | % | | | 762 | | | | 4.65 | % | | | 2.78 | %(b) | | | (2.70 | )% | | | (0.83 | )% | | | 92.17 | % |
| | (0.01 | ) | | | 13.06 | | | | 10.44 | % | | | 832 | | | | 3.76 | % | | | 2.56 | %(b) | | | (1.63 | )% | | | (0.43 | )% | | | 59.98 | % |
| | - | | | | 11.84 | | | | 19.84 | % | | | 869 | | | | 3.91 | % | | | 2.55 | %(b) | | | (1.28 | )% | | | 0.08 | % | | | 71.84 | % |
| | - | | | | 9.88 | | | | (18.82 | )% | | | 792 | | | | 4.40 | % | | | 2.55 | %(b) | | | (2.02 | )% | | | (0.17 | )% | | | 71.03 | % |
| | | | | | | | | | | | | | | | | | | | | | | | | | | | | | | | | | |
| | - | | | | 12.91 | | | | (5.84 | )% | | | 725 | | | | 4.75 | % | | | 1.80 | %(b) | | | (3.44 | )% | | | (0.49 | )% | | | 76.12 | % |
| | (0.03 | ) | | | 13.71 | | | | 1.68 | % | | | 305 | | | | 4.32 | % | | | 1.95 | %(b) | | | (2.65 | )% | | | (0.28 | )% | | | 92.17 | % |
| | (0.03 | ) | | | 13.51 | | | | 11.29 | % | | | 789 | | | | 2.97 | % | | | 1.81 | %(b) | | | (0.82 | )% | | | 0.34 | % | | | 59.98 | % |
| | (0.02 | ) | | | 12.17 | | | | 20.73 | % | | | 690 | | | | 2.88 | % | | | 1.80 | %(b) | | | (0.31 | )% | | | 0.77 | % | | | 71.84 | % |
| | - | | | | 10.10 | | | | (18.22 | )% | | | 768 | | | | 3.05 | % | | | 1.81 | %(b) | | | (0.97 | )% | | | 0.27 | % | | | 71.03 | % |
FINANCIAL HIGHLIGHTS (CONTINUED)
| | | | | | | | | | | | | | | | | | | | | | | | |
| | | | | | Income/(loss) from investment operations | | | Less dividends and | |
| | | Net asset
value,
beginning
of period | | | Net
investment
income/
(loss)(x) | | | Net realized
and unrealized
gains/(losses)
on investments | | | Total from
investment
operations | | | Dividends
from net
investment
income | | | Distributions
from net
realized
gains | |
ICON International Equity Fund | | | | | | | | | | | | | | | | | | | | | | | | |
Class S** | | | | | | | | | | | | | | | | | | | | | | | | |
Year ended September 30, 2015 | | $ | 11.75 | | | $ | - | (c) | | $ | (0.37 | ) | | $ | (0.37 | ) | | $ | (0.01 | ) | | $ | - | |
Year ended September 30, 2014 | | | 11.81 | | | | 0.06 | | | | (0.12 | ) | | | (0.06 | ) | | | - | | | | - | |
Year ended September 30, 2013 | | | 11.05 | | | | 0.07 | | | | 0.74 | | | | 0.81 | | | | - | (c) | | | (0.05 | ) |
Year ended September 30, 2012 | | | 9.22 | | | | 0.16 | | | | 1.78 | | | | 1.94 | | | | (0.11 | ) | | | - | |
Year ended September 30, 2011 | | | 12.11 | | | | 0.14 | | | | (2.95 | ) | | | (2.81 | ) | | | (0.08 | ) | | | - | |
Class C | | | | | | | | | | | | | | | | | | | | | | | | |
Year ended September 30, 2015 | | | 10.72 | | | | (0.12 | ) | | | (0.33 | ) | | | (0.45 | ) | | | - | | | | - | |
Year ended September 30, 2014 | | | 10.89 | | | | (0.08 | ) | | | (0.09 | ) | | | (0.17 | ) | | | - | | | | - | |
Year ended September 30, 2013 | | | 10.26 | | | | (0.04 | ) | | | 0.67 | | | | 0.63 | | | | - | | | | - | |
Year ended September 30, 2012 | | | 8.56 | | | | (0.02 | ) | | | 1.72 | | | | 1.70 | | | | - | | | | - | |
Year ended September 30, 2011 | | | 11.30 | | | | - | (c) | | | (2.74 | ) | | | (2.74 | ) | | | - | | | | - | |
Class A*** | | | | | | | | | | | | | | | | | | | | | | | | |
Year ended September 30, 2015 | | | 11.65 | | | | (0.04 | ) | | | (0.37 | ) | | | (0.41 | ) | | | - | | | | - | |
Year ended September 30, 2014 | | | 11.75 | | | | - | (c) | | | (0.10 | ) | | | (0.10 | ) | | | - | | | | - | |
Year ended September 30, 2013 | | | 10.99 | | | | 0.04 | | | | 0.73 | | | | 0.77 | | | | - | (c) | | | (0.01 | ) |
Year ended September 30, 2012 | | | 9.16 | | | | 0.11 | | | | 1.77 | | | | 1.88 | | | | (0.05 | ) | | | - | |
Year ended September 30, 2011 | | | 12.04 | | | | 0.10 | | | | (2.94 | ) | | | (2.84 | ) | | | (0.04 | ) | | | - | |
| (x) | Calculated using the average shares method. | |
| * | The total return calculation is for the period indicated and excludes any sales charges. | |
| ** | Class S shares were formerly named Class Z shares prior to January 23, 2012. | |
| *** | Class I shares merged into Class A on January 23, 2012. The results of each class prior to the merger may have been different than what is presented. | |
| (a) | Portfolio turnover is calculated at the Fund level and is not annualized for periods less than a year. | |
| (b) | The Fund’s operating expenses, not including interest expense, are contractually limited to the amounts discussed in Note 3. The ratios in these financial highlights reflect the limitation, including the interest expense. | |
| (c) | Amount less than $0.005. | |
| (d) | Effective May, 5, 2014, Class S’s operating expenses, not including interest expense, were contractually limited to the amounts discussed in Note 3. The ratios in these financial highlights reflect the limitation, including the interest expense. | |
| (e) | Percentage less than 0.005%. | |
The accompanying notes are an integral part of the financial statements.
| | | | | | | | | | | | | | | | | | | | | | | | | | | | | | | | | | |
| distributions | | | | | | | | | | | | Ratio of expenses
to average net assets | | | Ratio of net investment
income/(loss)
to average net assets | | | | |
Total
dividends
and
distributions | | | Net asset
value, end
of period | | | Total
return* | | | Net assets,
end of
period (in
thousands) | | | Before
expense
limitation/
recoupment
and transfer
agent
earnings
credits | | | After
expense
limitation/
recoupment
and transfer
agent
earnings
credits(b) | | | Before
expense
limitation/
recoupment
and transfer
agent
earnings
credits | | | After
expense
limitation/
recoupment
and transfer
agent
earnings
credits | | | Portfolio
turnover
rate(a) | |
| | | | | | | | | | | | | | | | | | | | | | | | | | | | | | | | | | |
| | | | | | | | | | | | | | | | | | | | | | | | | | | | | | | | | | |
| $ | (0.01 | ) | | $ | 11.37 | | | | (3.15 | )% | | $ | 67,201 | | | | 1.41 | % | | | 1.41 | % | | | - | %(e) | | | - | %(e) | | | 204.10 | % |
| | - | | | | 11.75 | | | | (0.51 | )% | | | 80,356 | | | | 1.41 | % | | | 1.41 | % | | | 0.44 | % | | | 0.44 | % | | | 192.93 | % |
| | (0.05 | ) | | | 11.81 | | | | 7.33 | % | | | 42,105 | | | | 1.45 | % | | | 1.45 | % | | | 0.65 | % | | | 0.65 | % | | | 137.83 | % |
| | (0.11 | ) | | | 11.05 | | | | 21.19 | % | | | 56,152 | | | | 1.39 | % | | | 1.39 | % | | | 1.47 | % | | | 1.47 | % | | | 121.82 | % |
| | (0.08 | ) | | | 9.22 | | | | (23.38 | )% | | | 6,826 | | | | 1.45 | % | | | 1.45 | % | | | 1.12 | % | | | 1.12 | % | | | 91.46 | % |
| | | | | | | | | | | | | | | | | | | | | | | | | | | | | | | | | | |
| | - | | | | 10.27 | | | | (4.20 | )% | | | 3,299 | | | | 2.96 | % | | | 2.55 | % | | | (1.56 | )% | | | (1.15 | )% | | | 204.10 | % |
| | - | | | | 10.72 | | | | (1.56 | )% | | | 4,597 | | | | 2.82 | % | | | 2.56 | % | | | (0.99 | )% | | | (0.73 | )% | | | 192.93 | % |
| | - | | | | 10.89 | | | | 6.14 | % | | | 5,657 | | | | 2.77 | % | | | 2.56 | % | | | (0.63 | )% | | | (0.42 | )% | | | 137.83 | % |
| | - | | | | 10.26 | | | | 19.86 | % | | | 6,773 | | | | 2.72 | % | | | 2.55 | % | | | (0.41 | )% | | | (0.24 | )% | | | 121.82 | % |
| | - | | | | 8.56 | | | | (24.25 | )% | | | 8,050 | | | | 2.64 | % | | | 2.55 | % | | | (0.11 | )% | | | (0.02 | )% | | | 91.46 | % |
| | | | | | | | | | | | | | | | | | | | | | | | | | | | | | | | | | |
| | - | | | | 11.24 | | | | (3.52 | )% | | | 3,725 | | | | 2.25 | % | | | 1.80 | % | | | (0.77 | )% | | | (0.32 | )% | | | 204.10 | % |
| | - | | | | 11.65 | | | | (0.85 | )% | | | 4,089 | | | | 2.12 | % | | | 1.81 | % | | | (0.27 | )% | | | 0.04 | % | | | 192.93 | % |
| | (0.01 | ) | | | 11.75 | | | | 7.03 | % | | | 5,043 | | | | 2.19 | % | | | 1.81 | % | | | (0.06 | )% | | | 0.32 | % | | | 137.83 | % |
| | (0.05 | ) | | | 10.99 | | | | 20.61 | % | | | 6,309 | | | | 2.01 | % | | | 1.80 | % | | | 0.85 | % | | | 1.06 | % | | | 121.82 | % |
| | (0.04 | ) | | | 9.16 | | | | (23.65 | )% | | | 2,640 | | | | 2.03 | % | | | 1.80 | % | | | 0.56 | % | | | 0.79 | % | | | 91.46 | % |
NOTESTO FINANCIAL STATEMENTS
SEPTEMBER 30, 2015
1. Organization
The ICON Emerging Markets Fund (“Emerging Markets Fund”) and ICON International Equity Fund (“International Equity Fund”) are series funds (individually a “Fund” and collectively, the “Funds”). The Funds are part of the ICON Funds (the “Trust”), a Massachusetts business trust registered under the Investment Company Act of 1940, as amended (the “1940 Act”) as an open-end investment management company. Each Fund offers three classes of shares: Class S, Class C and Class A. All classes have equal rights as to earnings, assets and voting privileges except that each Class may bear different distribution fees, registration costs, legal costs, mailing and printing costs and shareholder servicing costs and each Class has exclusive voting rights with respect to its distribution plan. There are currently fifteen other active Funds within the Trust. Those Funds are covered by separate prospectuses and shareholder reports.
Each Fund is authorized to issue an unlimited number of no par shares. The Funds primarily invest in foreign securities; the Emerging Markets Fund primarily invests in securities of issuers whose principal activities are in emerging market, or are economically tied to an emerging market country. The International Equity Fund primarily invests in foreign equity securities. Foreign equity securities refer to securities of issuers, wherever organized, whose securities are listed or traded principally on a recognized stock exchange or over-the-counter market outside the United States. The investment objective of each Fund is to provide long-term capital appreciation.
The Funds, like all investments in securities, have elements of risk, including risk of loss of principal. There is no assurance that the Funds will achieve their investment objectives and may underperform funds with similar investment objectives. An investment concentrated in sectors and industries involves greater risk and volatility than a more diversified investment. Investments in foreign securities and currency transactions may involve certain considerations and risks not typically associated with those of U.S. dollar-denominated transactions as a result of, among other factors, the possibility of less government supervision and regulation of foreign securities markets and the possibility of political or economic instability. Financial statements of foreign companies are governed by different accounting, auditing, and financial standards than U.S. companies and may be less transparent and uniform than in the United States. Many corporate governance standards, which help ensure the integrity of public information in the United States, may not exist in some foreign countries. In general,
| | |
| 36 | | NOTESTO FINANCIAL STATEMENTS |
there may be less governmental supervision of foreign stock exchanges and securities brokers and issuers. There are also risks associated with small-and mid-cap investing, including limited product lines, less liquidity, and small market share. Securities of emerging or developing market companies may be less liquid and more volatile than securities in countries with more mature markets.
In the normal course of business, the Funds may enter into various agreements that provide for general indemnifications. Each Fund’s maximum exposure under these arrangements is unknown as any potential exposure involving future claims that may be made against each Fund is unknown. However, based on experience, the Funds expect the risk of loss to be remote.
2. Significant Accounting Policies
The following is a summary of significant accounting policies consistently followed by the Funds in the preparation of their financial statements. The preparation of financial statements in conformity with accounting principles generally accepted in the United States of America requires management to make certain estimates and assumptions that affect the reported amounts of assets and liabilities, disclosure of contingent assets and liabilities at the date of the financial statements, and the reported amounts of income and expenses during the reporting period. Actual results may differ from these estimates.
Investment Valuation
The Funds’ securities and other assets, excluding options on securities indexes, are valued at the closing price as of the close of regular trading on the New York Stock Exchange (the “NYSE”) (normally 4 p.m. Eastern Standard Time) each day the NYSE is open, except that securities traded primarily on the NASDAQ Stock Market (“NASDAQ”) are normally valued by the Funds at the NASDAQ Official Closing Price provided by NASDAQ each business day. Options on securities indexes are valued at the close of the Chicago Board Options Exchange (normally 4:15 p.m. Eastern Standard Time) on each day the New York Stock Exchange is open for trading.
The Funds use pricing services to obtain the market value of securities in their portfolios; if a pricing service is not able to provide a price, or the pricing service’s valuation is considered inaccurate or does not in the Funds’ judgment reflect the market value of the security, prices may be obtained through market quotations from independent broker/dealers. If market quotations from these sources are not readily available, the Funds’ securities or other assets are
| | | | |
| NOTESTO FINANCIAL STATEMENTS | | | 37 | |
NOTESTO FINANCIAL STATEMENTS (CONTINUED)
valued at fair value as determined in good faith by the Funds’ Board of Trustees (“Board”) or pursuant to procedures approved by the Board.
Lacking any sales that day, a security is valued at the current closing bid price (or yield equivalent thereof) or based on quotes obtained from dealers making a market for the security. Options are valued at their closing mid-price on the market with the most volume. Mid-price is the average of the closing bid and closing ask prices. Debt securities with a remaining maturity of greater than 60 days are valued using the evaluated bid price supplied by the pricing service. The evaluated bid price supplied by the pricing service is based upon a matrix valuation system which considers such factors as security prices, yields, maturities and ratings. Short-term debt securities with remaining maturities of 60 days or less are generally valued at amortized cost or original cost plus accrued interest, which approximates market value. Currency rates as of the close of the NYSE are used to convert foreign security values into U.S. dollars.
Securities of investment companies that trade on an exchange are valued at the last sales price or official closing price as of the close of the customary trading session on the exchange where the security is principally traded. Investments in shares of funds that are not traded on an exchange are valued at the end of day net asset value per share of such fund. Securities in the underlying funds, including restricted securities are valued in accordance with the valuation policy of such fund.
The Funds’ securities traded in countries outside of the Western Hemisphere are fair valued daily by utilizing the quotations of an independent pricing service, unless the Board determines that use of another valuation methodology is appropriate. The purposes of daily fair valuation are to avoid stale prices and to take into account, among other things, any significant events occurring after the close of foreign markets. The pricing service uses statistical analyses and quantitative models to adjust local market prices using factors such as subsequent movements and changes in the prices of indexes, securities and exchange rates in other markets to determine fair value as of the time a Fund calculates its net asset value (“NAV”). The valuation assigned to fair-value securities for purposes of calculating a Fund’s NAV may differ from the security’s most recent closing market price and from the prices used by other mutual funds to calculate their NAVs.
| | |
| 38 | | NOTESTO FINANCIAL STATEMENTS |
Various inputs are used to determine the value of the Funds’ investments. These inputs are summarized in the three broad levels listed below:
Level 1 — quoted prices in active markets for identical securities.
Level 2 — significant observable inputs other than Level 1 quoted prices (including, but not limited to, quoted prices for similar securities, interest rates, prepayment speeds, and credit risk).
Level 3 — significant unobservable inputs.
Observable inputs are those based on market data obtained from sources independent of the Funds, and unobservable inputs reflect the Funds’ own assumptions based on the best information available. The input levels are not necessarily an indication of the risk or liquidity associated with investments at that level. For example, non-U.S. equity securities actively traded in foreign markets may be reflected in Level 2 despite the availability of closing prices, because the Funds evaluate and determine whether those closing prices reflect fair value at the close of the NYSE or require adjustment, as described above. The following table summarizes the Funds’ investments, based on the inputs used to determine their values on September 30, 2015:
| | | | | | | | | | | | | | | | |
| | | Level 1 | | | Level 2 | | | Level 3 | | | Total | |
ICON Emerging Markets Fund* | | | | | | | | | | | | | | | | |
Assets | | | | | | | | | | | | | | | | |
Common Stocks | | | | | | | | | | | | | | | | |
India | | $ | - | | | $ | 3,760,026 | | | $ | - | | | $ | 3,760,026 | |
South Korea | | | - | | | | 3,647,281 | | | | - | | | | 3,647,281 | |
South Africa | | | - | | | | 1,632,563 | | | | - | | | | 1,632,563 | |
China | | | - | | | | 1,486,478 | | | | - | | | | 1,486,478 | |
Hong Kong | | | - | | | | 1,141,211 | | | | - | | | | 1,141,211 | |
Other Countries | | | 753,687 | | | | 2,321,299 | | | | - | | | | 3,074,986 | |
Preferred Stock | | | 91,944 | | | | - | | | | - | | | | 91,944 | |
Short-Term Investments | | | - | | | | 2,579,245 | | | | - | | | | 2,579,245 | |
| | | | | | | | | | | | | | | | |
Total | | $ | 845,631 | | | $ | 16,568,103 | | | $ | - | | | $ | 17,413,734 | |
| | | | | | | | | | | | | | | | |
| | | | |
| NOTESTO FINANCIAL STATEMENTS | | | 39 | |
NOTESTO FINANCIAL STATEMENTS (CONTINUED)
| | | | | | | | | | | | | | | | |
| | | Level 1 | | | Level 2 | | | Level 3 | | | Total | |
ICON International Equity Fund* | | | | | | | | | | | | | | | | |
Assets | | | | | | | | | | | | | | | | |
Common Stocks | | | | | | | | | | | | | | | | |
Germany | | $ | 460,157 | | | $ | 15,680,463 | | | $ | - | | | $ | 16,140,620 | |
United Kingdom | | | 736,840 | | | | 9,095,402 | | | | - | | | | 9,832,242 | |
France | | | 999,228 | | | | 6,900,665 | | | | - | | | | 7,899,893 | |
Canada | | | 4,961,745 | | | | - | | | | - | | | | 4,961,745 | |
Japan | | | 749,495 | | | | 3,605,237 | | | | - | | | | 4,354,732 | |
Switzerland | | | 241,191 | | | | 3,727,504 | | | | - | | | | 3,968,695 | |
Other Countries | | | 1,860,728 | | | | 17,006,966 | | | | - | | | | 18,867,694 | |
Preferred Stocks | | | - | | | | 704,698 | | | | - | | | | 704,698 | |
Real Estate Investment Trusts | | | - | | | | 1,179,300 | | | | - | | | | 1,179,300 | |
Collateral for Securities on Loan | | | - | | | | 3,785,339 | | | | - | | | | 3,785,339 | |
Short-Term Investments | | | - | | | | 11,214,677 | | | | - | | | | 11,214,677 | |
| | | | | | | | | | | | | | | | |
Total | | $ | 10,009,384 | | | $ | 72,900,251 | | | $ | - | | | $ | 82,909,635 | |
| | | | | | | | | | | | | | | | |
| * | Please refer to the Schedule of Investments and the Sector/Industry Classification and Country Composition tables for additional security details. |
There were no significant Level 3 securities held in any of the Funds at September 30, 2015.
For the ICON Emerging Markets Fund, there was no transfer activity between Level 1 and Level 2 for the year ended September 30, 2015.
For the ICON International Equity Fund, common stocks valued at $370,354 were transferred from Level 2 to Level 1 during the year ended September 30, 2015. At September 30, 2014, these securities were valued using quoted market prices in active markets with fair value adjustment factors; at September 30, 2015, these securities were valued using quoted market prices in active markets without using fair value adjustment factors.
The end of year timing recognition is used for the transfers between levels of the Fund’s assets and liabilities.
| | |
| 40 | | NOTESTO FINANCIAL STATEMENTS |
A roll forward of fair value measurements using significant unobservable inputs (Level 3) for the year ended September 30, 2015 for the Emerging Markets Fund and the International Equity Fund, is as follows:
| | | | |
| | | Common Stocks
Hong Kong | |
ICON Emerging Markets Fund | | | | |
Beginning balance 9/30/14 | | $ | 0 | * |
Purchases | | | - | |
Sales | | | (28,220 | ) |
Accrued discounts/(premiums) | | | - | |
Total realized gains/(losses) | | | (673,960 | ) |
Total change in unrealized appreciation/(depreciation) | | | 702,180 | |
Transfers in to Level 3 | | | - | |
Transfers out of Level 3 | | | - | |
| | | | |
Ending balance 9/30/15 | | $ | 0 | |
| | | | |
Net change in unrealized appreciation/(depreciation) on investments held at 9/30/15 | | $ | - | |
| | | | |
ICON International Equity Fund | | | | |
Beginning balance 9/30/14 | | $ | 0 | * |
Purchases | | | - | |
Sales | | | (73,892 | ) |
Accrued discounts/(premiums) | | | - | |
Total realized gains/(losses) | | | (1,651,917 | ) |
Total change in unrealized appreciation/(depreciation) | | | 1,725,809 | |
Transfers in to Level 3 | | | - | |
Transfers out of Level 3 | | | - | |
| | | | |
Ending balance 9/30/15 | | $ | 0 | |
| | | | |
Net change in unrealized appreciation/(depreciation) on investments held at 9/30/15 | | $ | - | |
| | | | |
| * | Chaoda Modern Agriculture Holdings, Ltd. was illiquid and valued with a zero market value for the year ended September 30, 2014. |
Net realized gain/(loss) and net change in unrealized appreciation/depreciation is reflected on the Statement of Operations.
Fund Share Valuation
Fund shares are sold and redeemed on a daily basis at net asset value. Net asset value per share is determined daily as of the close of trading on the NYSE on each day the NYSE is open for trading by dividing the total value of the Fund’s investments and other assets, less liabilities, by the number of Fund shares outstanding.
| | | | |
| NOTESTO FINANCIAL STATEMENTS | | | 41 | |
NOTESTO FINANCIAL STATEMENTS (CONTINUED)
Foreign Currency Translation
The accounting records of the Funds are maintained in U.S. dollars. Investment securities and other assets and liabilities denominated in a foreign currency are translated daily into U.S. dollars at the prevailing rates of exchange. Income and expenses are translated into U.S. dollars at the prevailing exchange rate on the respective dates of the transactions. Purchases and sales of securities are translated into U.S. dollars at the contractual currency exchange rates established at the time of each trade.
The Funds do not isolate that portion of the results of operations resulting from changes in foreign exchange rates on investments from the fluctuations arising from changes in market prices of securities held. Net unrealized appreciation or depreciation on investments and foreign currency translations arise from changes in the value of assets and liabilities, resulting from changes in the exchange rates and changes in market prices of securities held.
Forward Foreign Currency Contracts
The Funds may enter into short-term forward foreign currency contracts. A forward foreign currency contract is an agreement between contracting parties to exchange an amount of currency at some future time at an agreed upon rate. The Funds use forward foreign currency contracts to manage foreign currency exposure with respect to transactional hedging, positional hedging, cross hedging and proxy hedging.
These contracts involve market risk and do not eliminate fluctuations in the prices of portfolio securities or prevent losses if the prices of those securities decline. The Funds could be exposed to risk if the value of the currency changes unfavorably. Additionally, the Funds could be exposed to counterparty risk if the counterparties are unable to meet the terms of the contracts.
These contracts are marked-to-market daily. Net realized gains and losses on foreign currency transactions represent disposition of foreign currencies, and the difference between the amount recorded at the time of the transaction and the U.S. dollar amount actually received. Any realized gain or loss incurred by the Funds due to foreign currency translation is included on the Statement of Operations. At September 30, 2015 and for the year then ended, the Emerging Markets Fund and International Equity Fund had no outstanding forward foreign currency contracts.
| | |
| 42 | | NOTESTO FINANCIAL STATEMENTS |
Securities Lending
Under procedures adopted by the Board, the Funds may lend securities to certain approved brokers, dealers and other financial institutions to earn additional income. The Funds retain certain benefits of owning the securities, including receipt of dividends or interest generated by the security, but give up other rights including the right to vote proxies. The Funds retain the ability to recall the loans at any time and could do so in order to vote proxies or to sell the loaned securities. Each loan is collateralized by cash that generally exceeds the value of the securities on loan. The market value of the loaned securities is determined daily at the close of business of the Funds and any additional required collateral is delivered to each Fund on the next business day.
Generally, in the event of borrower default, the Funds have the right to use the collateral to offset any losses incurred. In the event the Funds are delayed or prevented from exercising their rights to dispose of the collateral, there may be a potential loss to the Funds. Some of these losses may be indemnified by the lending agent.
The Funds have elected to invest the cash collateral in the State Street Navigator Prime Portfolio which is disclosed on the Schedule of Investments. The Funds bear the risk of loss with respect to the investment of collateral. The net securities lending income earned by the Funds for the year ended September 30, 2015, is included in the Statement of Operations.
For the year ended September 30, 2015, the following Fund had securities with the following values on loan:
| | | | | | | | |
| Fund | | Loaned Securities | | | Collateral | |
ICON International Equity Fund | | $ | 3,656,301 | | | $ | 3,785,339 | |
Income Taxes, Dividends, and Distributions
The Funds intend to continue to qualify as regulated investment companies under Subchapter M of the Internal Revenue Code and, accordingly, the Funds will generally not be subject to federal and state income taxes or federal excise taxes to the extent that they intend to make sufficient distributions of net investment income and net realized capital gains.
Dividends paid by the Funds from net investment income and distributions of net realized short-term gains are, for federal income tax purposes, taxable as ordinary income to shareholders.
| | | | |
| NOTESTO FINANCIAL STATEMENTS | | | 43 | |
NOTESTO FINANCIAL STATEMENTS (CONTINUED)
Dividends and distributions to shareholders are recorded by the Funds on the ex-dividend/distribution date. The Funds distribute income and net realized capital gains, if any, to shareholders at least annually, if not offset by capital loss carryforward. The Funds may utilize equalization accounting for tax purposes and designate earnings and profits, including net realized gains distributed to shareholders on redemption of shares, as part of the dividends paid deduction for income tax purposes. Income distributions and capital gain distributions are determined in accordance with income tax regulations, which may differ from accounting principles generally accepted in the United States of America.
Management has analyzed the Funds’ tax positions taken on federal income tax returns for all open tax years and has concluded that no provision for federal income tax is required in the Funds’ financial statements.
The Funds file U.S. tax returns. While the statute of limitations remains open to examine the Funds’ U.S. tax returns filed for the past three years, no examinations are in progress or anticipated at this time. The Funds are not aware of any tax positions for which it is reasonably possible that the total amounts of unrecognized tax benefits will significantly change in the next twelve months.
Certain foreign countries impose a capital gains tax which is accrued by the Funds based on the unrealized appreciation, if any, on affected securities. Any accrual would reduce a Fund’s NAV. The tax is paid when the gain is realized.
Investment Income
Dividend income is recorded on the ex-dividend date. Non-cash dividends included in dividend income, if any, are recorded at the fair value of the securities received. Interest income is accrued as earned. Certain dividends from foreign securities are recorded as soon as the Funds are informed of the dividend if such information is obtained subsequent to the ex-dividend date. Discounts and premiums on fixed income securities purchased are accreted or amortized to income over the life of the respective securities.
Investment Transactions
Security transactions are accounted for no later than one business day after the trade date. However, for financial reporting purposes, security transactions are accounted for on the trade date. Gains and losses on securities sold are determined on the basis of identified cost.
| | |
| 44 | | NOTESTO FINANCIAL STATEMENTS |
Allocation of Expenses
Each class of a Fund’s shares bears expenses incurred specifically on its behalf and, in addition, each class bears a portion of general expenses, based upon relative net assets of each class. Expenses which cannot be directly attributed to a specific Fund in the Trust are apportioned between all Funds in the Trust based upon relative net assets. In calculating the net asset value per share of each class, investment income, realized and unrealized gains and losses and expenses other than class-specific expenses are allocated daily to each class of shares based upon the proportion of net assets.
Below are the class level expenses that are included on the Statement of Operations:
| | | | | | | | | | | | |
| Fund | | Legal
Expense | | | Printing
And Postage
Expense | | | Transfer
Agent
Expense | |
ICON Emerging Markets Fund | | | | | | | | | | | | |
Class S | | $ | 1,160 | | | $ | 12,281 | | | $ | 26,446 | |
Class C | | | 61 | | | | 335 | | | | 1,427 | |
Class A | | | 52 | | | | 543 | | | | 1,237 | |
ICON International Equity Fund | | | | | | | | | | | | |
Class S | | | 8,852 | | | | 18,670 | | | | 56,171 | |
Class C | | | 466 | | | | 3,427 | | | | 12,805 | |
Class A | | | 470 | | | | 4,154 | | | | 12,977 | |
3. Fees and Other Transactions with Affiliates
Investment Advisory Fees
ICON Advisers, Inc. (“ICON Advisers”) serves as investment adviser to the Funds and is responsible for managing the Funds’ portfolios of securities. ICON Advisers receives a monthly management fee that is computed daily at an annual rate of 1.00% of each Fund’s average daily net assets.
ICON Advisers has contractually agreed to limit the Funds’ operating expenses (exclusive of brokerage, interest, taxes, and extraordinary expenses) to the extent necessary to ensure that the Funds’ expenses do not exceed the following amounts:
| | | | | | | | | | | | |
| Fund | | Class S | | | Class C | | | Class A | |
ICON Emerging Markets Fund | | | 1.55 | % | | | 2.55 | % | | | 1.80 | % |
ICON International Equity Fund | | | 1.55 | % | | | 2.55 | % | | | 1.80 | % |
| | | | |
| NOTESTO FINANCIAL STATEMENTS | | | 45 | |
NOTESTO FINANCIAL STATEMENTS (CONTINUED)
The Funds’ expense limitations will continue in effect until at least January 31, 2021 for Class A, Class C and International Equity Fund Class S. Effective May 5, 2014, ICON Advisers contractually agreed to limit the total expenses of the Emerging Markets Fund Class S shares to an annual rate of 1.55% in effect until at least January 31, 2016. To the extent ICON Advisers reimburses or absorbs fees and expenses, it may seek payment of such amounts for up to three years after the expenses were reimbursed or absorbed. A Fund will make no such payment, however, if the total Fund operating expenses exceed the expense limits in effect at the time the expenses were reimbursed or at the time these payments are proposed.
As of September 30, 2015 the following amounts were available for recoupment by ICON Advisers based upon their potential expiration dates:
| | | | | | | | | | | | |
| Fund | | 2016 | | | 2017 | | | 2018 | |
ICON Emerging Markets Fund | | $ | 18,421 | | | $ | 62,550 | | | $ | 128,011 | |
ICON International Equity Fund | | | 33,867 | | | | 29,665 | | | | 34,663 | |
Accounting, Custody and Transfer Agent Fees
State Street Bank and Trust Company (“State Street”) serves as the fund accounting agent for the Funds. For its services, the Trust pays State Street a fee that is calculated daily and paid monthly at an annual rate based on the aggregate average daily net assets of the Trust.
State Street is the custodian of the Trust’s investments. For its services, the Trust pays State Street asset-based fees that vary according to the number of positions and transactions, plus out-of-pocket expenses.
Boston Financial Data Services, Inc. (“BFDS”) is the Trust’s transfer agent. For these services, the Trust pays a per account fee, plus certain other transaction Cusip charges and out-of-pocket expenses. BFDS may pay each Fund transfer agent earnings credits. Transfer agent earnings credits are credits received for interest which results from overnight balances used by BFDS for clearing shareholder transactions.
Administrative Services
The Trust has entered into an administrative services agreement with ICON Advisers pursuant to which ICON Advisers oversees the administration of the Trust’s business and affairs. This agreement provides for an annual fee of 0.05% on the Trust’s first $1.5 billion of average daily net assets, 0.045% on the next $1.5 billion of average daily net assets, 0.040% on the next $2
| | |
| 46 | | NOTESTO FINANCIAL STATEMENTS |
billion of average daily net assets and 0.030% on average daily net assets over $5 billion. For the year ended September 30, 2015, each Fund’s payment for administrative services to ICON Advisers is included on the Statement of Operations. The administrative services agreement provides that ICON Advisers will not be liable for any error of judgment, mistake of law, or any loss suffered by the Trust in connection with matters to which the administrative services agreement relates, except for a loss resulting from willful misfeasance, bad faith or negligence by ICON Advisers in the performance of its duties.
ICON Advisers has a sub-administration agreement with State Street under which State Street assists ICON Advisers with the administration and business affairs of the Trust. For its services, ICON Advisers pays State Street a fee that is calculated daily and paid monthly at an annual rate based on the aggregate average daily net assets of the Trust.
Distribution Fees
The Funds have adopted a Distribution Plan pursuant to Rule 12b-1 under the 1940 Act (“12b-1 Plan”) under which the Funds are authorized to compensate the Funds’ distributor, ICON Distributors, Inc. (“IDI”) (an affiliate of the adviser) for the sale and distribution of shares and for other shareholder services. Under the 12b-1 Plan, Class A shareholders pay an annual distribution and service fee of 0.25% of average daily net assets. The Class C shareholders pay an annual distribution and service fee of 1.00% of average daily net assets. There is no annual distribution and service fee for Class S shares. The total amount paid under the 12b-1 plans by the Funds, if any, is shown on the Statement of Operations.
Other Related Parties
Certain Officers and Directors of ICON Advisers are also Officers and Trustees of the Funds; however, such Officers and Trustees (with the exception of the Chief Compliance Officer, “CCO”) receive no compensation from the Funds. The Trust paid 95% of the CCO’s salary and the remaining portion is paid by ICON Advisers. For the year ended September 30, 2015, the total related amounts paid by the Funds under this arrangement are included in Other Expenses on the Statement of Operations.
The Fund may reimburse ICON Advisers for legal work performed for the Fund by its attorneys outside of the advisory and administration contracts. The Board of Trustees reviews and approves such reimbursements. For the
| | | | |
| NOTESTO FINANCIAL STATEMENTS | | | 47 | |
NOTESTO FINANCIAL STATEMENTS (CONTINUED)
year ended September 30, 2015, the total related amounts paid by the Funds under this arrangement was $4,588 and is included in Other Expenses on the Statement of Operations.
4. Borrowings
The Trust has entered into a Line of Credit agreement/arrangement with State Street to provide temporary funding for redemption requests. Effective March 21, 2015, the maximum borrowing limit was changed from $150 million to $75 million. Interest on domestic borrowings is charged at a rate quoted and determined by State Street. The average interest rate charged for the year ended September 30, 2015 was 1.37%.
For the year ended September 30, 2015, the average outstanding loan by Fund was as follows:
| | | | |
| Fund | | Average Borrowing
(10/1/14-9/30/15) | |
ICON Emerging Markets Fund* | | $ | 36,324 | |
ICON International Equity Fund* | | | 29,651 | |
| * | There were no outstanding loans at September 30, 2015. |
5. Purchases and Sales of Investment Securities
For the year ended September 30, 2015, the aggregate cost of purchases and proceeds from sales of securities (excluding short-term securities) was as follows:
| | | | | | | | |
| Fund | | Purchases of
Securities | | | Proceeds
from Sales of
Securities | |
ICON Emerging Markets Fund | | $ | 15,737,371 | | | $ | 7,871,338 | |
ICON International Equity Fund | | | 157,337,460 | | | | 177,341,280 | |
6. Federal Income Tax
The following information is presented on an income tax basis. Differences between U.S. GAAP and federal income tax purposes that are permanent in nature are reclassified within the capital accounts. Temporary differences do not require reclassification. Temporary and permanent differences do not impact the NAVs of the Funds. These differences are due to differing treatments for items such as passive foreign investment companies, foreign currency transactions, and net investment losses.
| | |
| 48 | | NOTESTO FINANCIAL STATEMENTS |
For the year ended September 30, 2015 the following Funds had capital loss carryforwards:
| | | | | | | | |
| Fund | | Amounts | | | Expires | |
ICON Emerging Markets Fund | | $ | 7,143,674 | | | | 2017 | |
| | | 332,861 | | | | Unlimited | |
ICON International Equity Fund | | | 53,195,839 | | | | 2017 | |
| | | 27,012,993 | | | | 2018 | |
| | | 4,334,930 | | | | Unlimited | |
Under the Regulated Investment Company Modernization Act of 2010 (the “Act”) capital losses generated by a fund may be carried over indefinitely, but these losses must be used prior to the utilization of any pre-enactment capital losses. Since pre-enactment capital losses may only be carried forward for eight years there may be a greater likelihood that all or a portion of each fund’s pre-enactment capital losses will expire unused.
The tax characteristics of distributions paid to shareholders during the fiscal year ended September 30, 2015, were as follows:
| | | | | | | | | | | | |
| Fund | | Distributions
Paid from
Ordinary Income | | | Distributions
Paid from
Return of Capital | | | Total
Distributions
Paid | |
ICON International Equity Fund | | $ | 71,689 | | | $ | - | | | $ | 71,689 | |
The tax characteristics of distributions paid to shareholders during the fiscal year ended September 30, 2014, were as follows:
| | | | | | | | | | | | |
| Fund | | Distributions
Paid from
Ordinary Income | | | Distributions
Paid from
Return of Capital | | | Total
Distributions
Paid | |
ICON Emerging Markets Fund | | $ | 60,794 | | | $ | - | | | $ | 60,794 | |
As of September 30, 2015, the components of accumulated earnings/(deficit) on a tax basis were as follows:
| | | | | | | | | | | | | | | | | | | | |
| Fund | | Undistributed
Ordinary
Income | | | Late Year
Loss
Deferral** | | | Capital Loss
Carryover | | | Unrealized
Appreciation/
(Depreciation)* | | | Total
Accumulated
Earnings/
(Deficit) | |
ICON Emerging Markets Fund | | $ | - | | | $ | (249,486 | ) | | $ | (7,476,535 | ) | | $ | (1,014,823 | ) | | $ | (8,740,844 | ) |
ICON International Equity Fund | | | - | | | | (4,317,244 | ) | | | (84,543,762 | ) | | | (6,243,882 | ) | | | (95,104,888 | ) |
| * | Differences between the book-basis and tax-basis unrealized appreciation/(depreciation) are attributable primarily to investments in passive foreign investment companies. |
| | | | |
| NOTESTO FINANCIAL STATEMENTS | | | 49 | |
NOTESTO FINANCIAL STATEMENTS (CONTINUED)
| ** | The Funds have elected to defer certain qualified late-year losses in accordance with federal income tax rules. These losses are treated as having arisen on the first day of the following fiscal year. |
As of September 30, 2015, cost on investments for federal income tax purposes and the amount of net unrealized appreciation/(depreciation) were as follows:
| | | | | | | | | | | | | | | | |
| | | | | | Unrealized | | | Unrealized | | | Net
Appreciation/ | |
| Fund | | Cost | | | Appreciation | | | (Depreciation) | | | (Depreciation) | |
ICON Emerging Markets Fund | | $ | 18,427,002 | | | $ | 741,523 | | | $ | (1,754,791 | ) | | $ | (1,013,268 | ) |
ICON International Equity Fund | | | 89,142,511 | | | | 1,274,109 | | | | (7,506,985 | ) | | | (6,232,876 | ) |
7. Subsequent Events
Management has evaluated the possibility of subsequent events and determined that there are no material events that would require adjustment to or disclosure in the Funds’ financial statements.
| | |
| 50 | | NOTESTO FINANCIAL STATEMENTS |
REPORTOF INDEPENDENT REGISTERED PUBLIC
ACCOUNTING FIRM
To the Board of Trustees and Shareholders of the ICON Funds:
In our opinion, the accompanying statements of assets and liabilities, including the schedules of investments, and the related statements of operations and of changes in net assets and the financial highlights present fairly, in all material respects, the financial position of ICON Emerging Markets Fund and ICON International Equity Fund (two of the portfolios constituting ICON Funds, hereafter referred to as the “Funds”) at September 30, 2015, the results of each of their operations for the year then ended, the changes in each of their net assets for each of the two years in the period then ended and the financial highlights for each of the five years in the period then ended, in conformity with accounting principles generally accepted in the United States of America. These financial statements and financial highlights (hereafter referred to as “financial statements”) are the responsibility of the Funds’ management. Our responsibility is to express an opinion on these financial statements based on our audits. We conducted our audits of these financial statements in accordance with the standards of the Public Company Accounting Oversight Board (United States). Those standards require that we plan and perform the audit to obtain reasonable assurance about whether the financial statements are free of material misstatement. An audit includes examining, on a test basis, evidence supporting the amounts and disclosures in the financial statements, assessing the accounting principles used and significant estimates made by management, and evaluating the overall financial statement presentation. We believe that our audits, which included confirmation of securities at September 30, 2015 by correspondence with the custodian and brokers, provide a reasonable basis for our opinion.

Kansas City, Missouri
November 18, 2015
| | | | |
| REPORT OF ACCOUNTING FIRM | | | 51 | |
SIX MONTH HYPOTHETICAL EXPENSE EXAMPLE
SEPTEMBER 30, 2015 (UNAUDITED)
Example
As a shareholder of a Fund you may pay two types of fees: transaction fees and fund-related fees. Certain funds charge transaction fees, including sales charges (loads) on purchase payments, reinvested dividends, or other distributions; redemption fees; and exchange fees. Funds also incur various ongoing expenses, including management fees, distribution and/or service fees, and other fund expenses, which are indirectly paid by shareholders.
This Example is intended to help you understand your ongoing costs (in dollars) of investing in the various ICON Funds and to compare these costs with the ongoing costs of investing in other mutual funds. This Example is based on an investment of $1,000 invested at the beginning of the six-month period and held for the six-month period (4/01/15 – 9/30/15).
Actual Expenses
The first line in the table for each Fund provides information about actual account values and actual expenses. The Example includes, but is not limited to, management fees, 12b-1 fees, fund accounting, custody and transfer agent fees. However, the Example does not include client specific fees, such as the $15 fee charged to IRA accounts, or the $15 fee charged for wire redemptions. You may use this information, together with the amount you invested, to estimate the expenses that you paid over the period. Simply divide your account value by $1,000 (for example, an $8,600 account value divided by $1,000 = 8.6), then multiply the result by the number in the first line for each Fund under the heading entitled “Expenses Paid During Period” to estimate the expenses you paid on your account during this period.
Hypothetical Example for Comparison Purposes
The second line in the table for each Fund provides information about hypothetical account values and hypothetical expenses based on the Fund’s actual expense ratio and an assumed rate of return of 5% per year before expenses, which is not the Fund’s actual return. The hypothetical account values and expenses may not be used to estimate the actual ending account balance or expenses you paid for the period. You may use this information to compare the ongoing costs of investing in the Fund and other funds. To do so, compare this 5% hypothetical example with the 5% hypothetical examples that appear in the shareholder reports of the other funds. Please note that the expenses shown in the table are meant to highlight your ongoing costs only and do not reflect any transactional costs, such as sales charges (loads),
redemption fees, or exchange fees that may be charged by other funds. Therefore, this information is useful in comparing ongoing costs only, and will not help you determine the relative total costs of owning different funds.
| | | | | | | | | | | | | | | | |
| | | Beginning
Account
Value
4/1/15 | | | Ending
Account
Value
9/30/15 | | | Expense Paid
During Period
4/1/15 - 9/30/15* | | | Annualized
Expense Ratio
4/1/15 - 9/30/15* | |
Actual Expenses | | | | | | | | | | | | | |
ICON Emerging
Markets Fund | | | | | | | | | | | | | |
Class S | | $ | 1,000 | | | $ | 923.00 | | | $ | 7.52 | | | | 1.56% | |
Class C | | | 1,000 | | | | 917.90 | | | | 12.31 | | | | 2.56% | |
Class A | | | 1,000 | | | | 921.50 | | | | 8.72 | | | | 1.81% | |
ICON International
Equity Fund | | | | | | | | | | | | | | | | |
Class S | | | 1,000 | | | | 938.10 | | | | 7.14 | | | | 1.47% | |
Class C | | | 1,000 | | | | 932.80 | | | | 12.36 | | | | 2.55% | |
Class A | | | 1,000 | | | | 936.70 | | | | 8.74 | | | | 1.80% | |
Hypothetical (assuming a 5% return before expenses) | | | | | | | | | | | | | | | | |
ICON Emerging
Markets Fund | | | | | | | | | | | | | |
Class S | | | 1,000 | | | | 1,017.25 | | | | 7.89 | | | | | |
Class C | | | 1,000 | | | | 1,012.23 | | | | 12.91 | | | | | |
Class A | | | 1,000 | | | | 1,015.99 | | | | 9.15 | | | | | |
ICON International
Equity Fund | | | | | | | | | | | | | |
Class S | | | 1,000 | | | | 1,017.70 | | | | 7.44 | | | | | |
Class C | | | 1,000 | | | | 1,012.28 | | | | 12.86 | | | | | |
Class A | | | 1,000 | | | | 1,016.04 | | | | 9.10 | | | | | |
| * | Expenses are equal to the Fund’s six month expense ratio annualized, multiplied by the average account value over the period, multiplied by 183/365 to reflect the one-half year period. |
Total returns exclude applicable sales charges. If sales charges were included (maximum 5.75%), returns would be lower.
BOARDOF TRUSTEESAND FUND OFFICERS (UNAUDITED)
The ICON Funds Board of Trustees (“Board”) consists of four Trustees who oversee the 17 ICON Funds (the “Funds”). The Board is responsible for general oversight of the Funds’ business and for assuring that the Funds are managed in the best interest of the Funds’ shareholders. The Trustees, and their ages, and principal occupations are set forth below. The address of the Trustees is 5299 DTC Blvd., Suite 1200, Greenwood Village, CO 80111. Trustees have no official term of office and generally serve until they resign or are not re-elected.
Interested Trustee
Craig T. Callahan, 64, Chairman of the Board. Dr. Callahan has been a Trustee of the Funds since their inception. Dr. Callahan also serves as Chief Executive Officer (2013 to present); and Chairman of the Investment Committee (2005 to present) and served as the Chief Investment Officer (1991 to 2004) and President (2008 to 2013 and 2014 to present) of ICON Advisers. Dr. Callahan is also Executive Vice President (2005 to present); Director (1991 to present); and was previously President (1998 to 2005) and Chief Compliance Officer (2005) of IDI. Dr. Callahan also serves as the President (1998 to present) and Chairman of the Board of Directors (1994 to present) of ICON Management & Research Corporation (“IM&R”), the parent company of ICON Advisers and IDI.
Independent Trustees
Glen F. Bergert, 65. Mr. Bergert has been a Trustee of the Funds since 1999. Mr. Bergert is President of Venture Capital Management LLC (1997 to present), General Partner of SOGNO Partners LP, a venture capital company (2001 to present), General Partner of Bergert Properties, LLP, a real estate holding company (1997 to present), General Partner of Pyramid Real Estate Partnership, a real estate development company (1998 to present), General Partner of Chamois Partners, LP, a venture capital company (2004 to present) and was previously a General Partner with KPMG Peat Marwick, LLP (1979 to 1997). Mr. Bergert is also a Director of Delta Dental of California, an insurance company (2013 to present and 2006 to 2012), Delta Dental of Pennsylvania, an insurance company (1998 to 2009 and 2010 to present), Dentegra Group, Inc, an insurance holding company (2010 to 2014) and Delta Reinsurance Corporation (2000 to 2009 and 2011 to 2014). Mr. Bergert was a Director of Herre Bros, Inc., a contracting company (1998 to 2011).
John C. Pomeroy, Jr., 68. Mr. Pomeroy has been a Trustee of the Funds since November 2002. Mr. Pomeroy is Chief Investment Officer and Director of Investments, Pennsylvania State University (2001 to present) and was Portfolio Manager and Product Manager, Trinity Investment Management Corporation (1989 to 2001).
R. Michael Sentel, 67. Mr. Sentel has been a Trustee of the Funds since their inception. Mr. Sentel is a Senior Attorney with the U.S. Department of Education (1996 to present). Mr. Sentel also provides legal representation as a sole practitioner with an emphasis on corporate and transactional law. He served as general counsel to numerous public companies and served on the board of directors of one of these clients. Mr. Sentel began his legal career with the U.S. Securities and Exchange Commission’s Division of Enforcement and served as a Branch Chief (1980 to 1981). Later he served as the Section Chief for the Professional Liability Section of the Federal Deposit Insurance Corp. with responsibility for the Rocky Mountain Region (1991 to 1994).
The Officers of the Funds are:
Craig T. Callahan, 64, Chairman of the Board. Dr. Callahan has been a Trustee of the Funds since their inception. Dr. Callahan also serves as Chief Executive Officer (2013 to present); President (1998 to 2013 and 2014 to present) and Chairman of the Investment Committee (2005 to present) and served as the Chief Investment Officer (1991 to 2004) of ICON Advisers. Dr. Callahan is also Executive Vice President (2005 to present); Director (1991 to present); and was previously President (1998 to 2005) and Chief Compliance Officer (2005) of IDI. Dr. Callahan also serves as the President (1998 to present) and Chairman of the Board of Directors (1994 to present) of IM&R, the parent company of ICON Advisers and IDI.
Donald Salcito, 62. Mr. Salcito serves as Vice President and Secretary of the Funds (November 15, 2006 to present). Mr. Salcito is also Executive Vice President and General Counsel (September 2005 to present) of ICON Advisers; Director of IM&R (2005 to present); Executive Vice President, Secretary, General Counsel of IDI (2005 to present). Previously, he was a Partner in various national law firms, practicing in the securities law area. (1980 to 2005).
Carrie M. Schoffman, 42. Ms. Schoffman has been a Vice President and Principal Financial Officer/Treasurer of the Funds since June 2013. Ms. Schoffman is also Chief Compliance Officer (2013 to present and 2004 to 2008) and Anti-Money Laundering Officer (2013 to present) of the ICON Funds. She is Senior Vice President (2011 to present) and Chief Compliance Officer (2013 to present and 2004 to 2011) of ICON Advisers. Previously, she was a Staff Accountant with the Securities and Exchange Commission (2003 to 2004) and also an Experienced Manager (2001 to 2003) and a Senior Associate/Associate (1996 to 2001) at PricewaterhouseCoopers LLP.
Lesley Caviness, 49. Ms. Caviness serves as Assistant Treasurer of the Funds (2014 to present). She has worked at ICON (2007-2008 and 2010-present) in fund accounting, compliance, business intelligence and performance capacities. Prior to working at ICON, Ms. Caviness was a Real Estate Broker at Seasons Real Estate Group (2008-2012) and Signature Real Estate (2014-present), Finance Manager at Navigant (2000-2007), and Associate/Senior Associate (1996 to 2000) at PricewaterhouseCoopers LLP.
OTHER INFORMATION (UNAUDITED)
Renewal of Investment Advisory Agreement
On August 10, 2015, the Board of Trustees, including all of the Trustees that are not “interested persons” of the Trust (the “Independent Trustees”), approved continuation of the Advisory Agreements with the Adviser for each Fund for an additional one-year term commencing October 1, 2015.
In determining to renew the investment advisory agreements between ICON Funds (the “Trust”) and ICON Advisers, Inc. (“ICON” or the “Adviser”) the Trustees requested, was provided with and reviewed data with respect to the Adviser, its personnel, and the services provided and to be provided to each Fund by the Adviser under the Trust’s Investment Advisory Agreement dated October 9, 1996, as amended (related to the Sector Funds, the International Funds and ICON Fund) and under the Trust’s Investment Advisory Agreement dated July 9, 2002 and effective October 1, 2002, as amended (related to the U.S. Diversified Funds — Bond, Risk-Managed Balanced, Equity Income, Opportunities and Long/Short Funds) (collectively, the “Advisory Agreements”), for an additional one-year term commencing October 1, 2015. The Trustees agreed that consideration of the Advisory Agreements should also include consideration of other agreements between the Adviser and the Trust that impact provisions of the Advisory Agreements, including expense limitation agreement as amended effective September 25, 2015.
The Trustees were provided with and reviewed data with respect to the Adviser, its personnel, and the services provided and to be provided to each Fund by the Adviser under the Trust’s Advisory Agreements, Administrative Services Agreement and Expense Limitation Agreement and the Distribution Agreement with ICON Distributors, Inc. (“IDI”). The data included information concerning advisory, distribution and administrative services provided to the Funds by ICON and its related companies; information concerning other businesses of those companies; comparative data obtained from Strategic Insight (“SI”) related to Fund performance and Fund expenses (the “SI Report”). The data also included an analysis of the management style to be applied and the style applied to the Funds’ ratings of the Funds’ performance in their management style on the AthenaInvest system (the “AthenaInvest Data”) and a presentation on the Adviser’s investment model.
The Board convened a meeting with SI on July 29, 2015 to discuss the SI Report and the information contained within the SI Report. Avi Nachmany, Co-Founder and Director of Research of SI and Kevin Shine, Senior Managing Director, U.S. Research & Advisory of SI, discussed the findings of the SI Report with the independent directors. Management personnel participated
in the SI meeting convened to discuss the data for and with the Board. At the meeting, SI discussed its methodology, peer selection and the difficulty with some sector funds, expenses and fees, and performance relative to the respective Fund’s peers. SI also discussed the Funds size and how a respective Fund’s size would affect economies of scale, in particular, operating expenses.
Also included in the 15(c) discussion was a briefing on factors affecting the ICON investment model; expenses and expense ratios of each Fund and other ICON managed products; relative performance of each Fund; status of expense reimbursements to the Funds by the Adviser; sales and marketing initiatives; specific business factors affecting IDI; the work load on ICON as adviser and administrator to the Funds; current profitability of ICON; staffing levels and staff morale.
The Independent Trustees were represented by independent legal counsel in this process. In August 2015, after participating in the meeting with SI and management, the Independent met separately as a group in private sessions with their independent legal counsel to review and discuss the foregoing information. Based on these discussions, independent legal counsel and/or the Lead Independent Trustee also contacted management to request additional information concerning the AthenaInvest rankings and other issue raised in the SI meeting. In addition, the Board received materials from legal counsel discussing the legal standards applicable to their consideration of the ICON-Trust agreements.
In considering the nature, extent and quality of the services provided by the Adviser, the Board reviewed information relating to ICON’s operations and personnel. Among other things, the Adviser provided biographical information on its professional staff and descriptions of its organizational and management structure. In the course of their deliberations the Board evaluated, among other things, information relating to the investment philosophy, strategies and techniques used in managing each Fund, the qualifications and experience of ICON’s investment personnel, ICON’s compliance programs, ICON’s brokerage practices, including the extent to which the Adviser obtains research through “soft dollar” arrangements with the Funds’ brokerage, compliance reports on the foregoing, and the financial and non-financial resources available to provide services required under the Advisory Agreement.
During the discussion, the SI Report and the AthenaInvest Data were discussed and management personnel showed performance for each fund and discussed the factors affecting performance. The Board inquired from SI whether there was any correlation between fund expenses and performance, and SI saw no correlation with the ICON Funds. During the discussion on
performance, management personnel noted that from a strategy (Athena) perspective, 2014 was very difficult for active managers. Behaviors that historically have been rewarded and led to high strategy consistency ratings were not rewarded in 2014. Those behaviors include willingness to look different from an index, concentration of securities, conviction in securities selections, and holding stocks similar to other managers in a stated strategy. Causing further frustration in 2014, many stock and industry moves were not based on value, as ICON measures it. Something changed entering 2015. Behaviors that have been associated with superior performance in the past have been rewarded in the first part of 2015. Industry and sector selection have been better contributors to performance the first half of 2015 meaning that, more than last year, sector and industry tilts have been rewarded. ICON measures how sector indexes are in correlation with the S&P 1500 and 600 Indexes on a trailing 13-week basis. In 2015, the correlations have dropped, indicating sector differences in performance. Along with the decreasing correlations, sector returns have changed from 2014. Utilities was #1 in 2014, but is the worst at #10 for 2015. Consumer Discretionary has swung from #6 in 2014 to #2 the first half of 2015. In summary, value has been useful in rotating and capturing the industry and sector leadership of 2015.
In addition, in 2014 large cap stocks beat small cap stocks. As indexes are market capitalization weighted, index huggers did well in 2014. For the first six months of 2015, S&P 500 Index gained 1.56% whereas the S&P Small Cap 600 Index beat it, gaining 4.15%. In this market setting the ICON Funds did well across the Fund family: sector funds, diversified funds and international funds.
The Trustees noted that Advisers’ performance relative to other valuation managers as judged by the AthenaInvest system is above the medium. SI also noted that from a performance point of view, the Funds in the SI Report are compared using the Morningstar data, and there is no Morningstar category for “all cap” funds, but all ICON Funds are improving.
The Board addressed style consistency with the Adviser. Management advised that, based on the Adviser’s own analysis, and with the restructuring of the Adviser, the Adviser has continued an additional level of review on the Portfolio Managers (“PMs”) to make sure they are adhering to the ICON System; the Senior Vice President of Fund Management has been systematically tracking the Funds’ performance; he evaluates each of the ICON Funds to help ensure all PMs are investing consistently and in accordance with the ICON System by evaluating the Funds from an attribution perspective in monthly meetings.
In connection with reviewing data bearing upon the nature, quality, and extent of services furnished by ICON to each Fund, the Board assessed data concerning ICON’s staffing, systems and facilities. The Board also assessed ICON’s non-Trust business to see if there are any initiatives that would dilute service to the Trust. The Board concluded:
A. That the breadth and the quality of investment advisory and other services being provided to each Fund is satisfactory, as evidenced in part by efforts to address and improve the performance record of each Fund when compared with the performance records of a peer group of comparable funds and markets in general;
B. That the breadth and the quality of investment advisory and other services being provided to each Fund are satisfactory, the Adviser’s performance is competitive with other fund managers in the value style group, and the Adviser has applied a disciplined approach in the style specified in the Funds’ offering document;
C. That ICON has made significant expenditures in the past year and in prior years to ensure that it has the sophisticated systems and the highly trained personnel necessary for it to be able to continue to provide quality service to the Funds’ shareholders, including the dedication of substantial resources to ICON’s investment and methodology;
D. That the Board, after considering compliance reports and compliance initiatives undertaken during the year and conducting individual interviews with selected PMs, is satisfied with the research and portfolio management, that research and portfolio management is being constantly evaluated and improved upon; and that the PMs are evaluating trading services systematically, the Board concluded that the Adviser is providing the Funds with professional management of the nature, quality and scope required by the Funds; and
E. The risks assumed by ICON in providing investment advisory services to each Fund, including the capital commitments which have been made in the past and which continue to be made by ICON to ensure the continuation of the highest quality of service to the Trust, is made with the recognition that shareholders may redeem their shares at any time without notice and the Trust’s advisory relationship with ICON may be terminated at any time and must be renewed on an annual basis.
In considering the reasonableness of the fees paid to the Adviser for managing each Fund, the Board reviewed, among other things, data concerning other funds from the SI Report, financial statements of the Adviser and an analysis of the profitability of the Adviser, and its affiliates, and their relationship with each Fund over various time periods. Such
analysis identified all revenues and other benefits received by the Adviser and its affiliates from managing each Fund, the costs associated with providing such services and the resulting profitability to the Adviser and its affiliates and a comparison of similar data from reports filed by publicly traded firms.
The Board assessed actual (net) fees for advisory services and Fund expense ratios under the contractual relationship (the Advisory agreements and the Expense Limitation Agreements) with the Adviser as opposed to the fees specified in the applicable Advisory Agreement and expense ratios without application of the expense limitations and concluded that the focus should be on actual expense ratios after application of the Expense Limitation Agreements.
The Board considered the current and anticipated asset levels of each Fund and the contractual commitments of the Adviser to waive fees and pay expenses of the Funds from time to time to limit the total expenses of the Funds. In this regard the Board discussed asset levels in each Fund covered by the Advisory Agreements. ICON’s ability to provide the services called for under the Advisory Agreements was assessed in light of current and projected asset levels. Fund expenses and expense ratios were also assessed in light of current and projected asset levels. The Board concluded that the Adviser has the resources necessary to provide the services called for under the Advisory Agreements; that profitability to the Adviser and its affiliates from their relationship with the Funds, and services provided to the Funds, is not excessive; and that the Adviser is not realizing material benefits from economies of scale that would warrant adjustments to the fees for any Fund at this time. The Board of Trustees concluded that, in light of the nature, extent and quality of the services provided by the Adviser and the levels of profitability associated with providing these services, the fees charged by the Adviser under the Advisory Agreements to each Fund are reasonable.
In connection with assessing data bearing on the fairness of fee arrangements, the Board considered the SI Report. It was noted that SI was selected at the May Board meeting to prepare its report, an extensive analysis of the expense data of other comparable funds; and that Trustee input was solicited and provided in the process. Among other information discussed, it was noted that:
A. the advisory fee structures of the Funds are within the range of funds considered in the comparison with advisory fees and expense ratios of other similarly managed funds as set forth in the comparative data;
B. ICON has contractually agreed to impose expense limitations on each and every Fund at a cost to ICON;
C. ICON has contractually committed to break points in its fees so that economies of scale could be realized as a Fund grows in assets, for the benefit of Fund shareholders.
The Board also considered the fees charged by the Adviser to other advisory clients as outlined in its Registration Application on Form ADV in connection with assessing data bearing on the fairness of fee arrangements. The Trustees noted that certain ICON institutional/sub-advised type accounts have lower fees than the fees paid by the Funds for a number of reasons, including but not limited to, those clients call for different commitments of time, institutional clients have low and predictable turnover of assets, in competition joint costs are apportioned among paying customers according to elasticity of demand and the Adviser has a limited level of responsibility in sub-managed accounts, or accounts with an investor agent/advisor.
The Board noted that the Funds’ redemptions were similar to industry averages which showed two things: 1) that the Funds’ Performance was not adversely impacting fund redemptions, and 2) that the fees and costs were competitive when compared to size. The Board noted that there are thousands of mutual funds competing; that investors can search and trade funds on the internet or on platforms at very little or no cost; and that if the Adviser were overcharging for its services, with its performance being what it is, the Board would have expected redemptions in excess of industry norms.
The Board concluded that the Adviser is providing the Funds with professional management at a fair, reasonable and competitive price.
In connection with assessing the direct and indirect benefits to ICON from serving as the Funds’ adviser, the Board discussed services provided under the Distribution Agreement and the Administrative Services Agreement which are in addition to services under the Advisory Agreements. It was noted that IDI does not charge a fee to the Funds for its services and that ICON’s fee for administrative services appears to be consistent with such fees in other fund groups. The Board noted that ICON receives research assistance (primarily in the form of data) from the use of soft dollars generated from Fund portfolio transactions; that such research assists ICON in providing quality advisory services; that Trust and Adviser compliance personnel continuously evaluate and report on the soft-dollar arrangements and related costs; and the Board concluded that the arrangements are consistent with Fund brokerage practices and benefit the Funds and their shareholders.
Based on these considerations, the Board, including all of the Independent Trustees, concluded that: 1) the continuation of the Advisory Agreements was in the best interests of each Fund and its shareholders, 2) the services to be performed under the Advisory Agreements were required for the
operation of the Funds, 3) the advisory services were satisfactory to the Funds in the past, and 4) the fees for the advisory services and other benefits from the relationship with the Trust received by ICON, and its affiliates, were consistent with fees paid by similar funds and other clients of ICON, and were reasonable in light of the comparative data, and within the range of what would have been negotiated at arm’s length in light of all the circumstances.
Supplemental Tax Information
For the fiscal year ended September 30, 2015, the following funds paid qualified dividend income:
| | | | |
| Fund | | Amount | |
ICON Emerging Markets Fund | | | 100% | |
The Funds had no long-term capital gain distributions qualifying for the maximum 20% income tax rate for individuals.
Portfolio Holdings
Information related to the 10 largest portfolio holdings of each Fund is made available at www.iconfunds.com within approximately 10 business days after month-end. Additionally, a complete list of each Fund’s holdings is made available approximately 30 days after month-end. Each ICON Fund also files a complete schedule of portfolio holdings for the first and third quarters of its fiscal year with the Securities and Exchange Commission (the “Commission”) on Form N-Q. The ICON Funds’ Forms N-Q are available at www.sec.gov or may be reviewed and copied at the Commission’s Public Reference Room in Washington, DC. Information about the Public Reference Room may be obtained by calling 1-800-SEC-0330.
Proxy Voting
A summarized description of the policies and procedures the ICON Funds use to vote proxies is available free of charge at www.iconfunds.com or by calling 1-800-764-0442.
Information about how the ICON Funds voted proxies related to each Fund’s portfolio securities during the 12-month period ended June 30 is available free of charge at www.iconfunds.com or on the Commission’s website at www.sec.gov.
Cost Basis Information
Effective January 1, 2012, federal law requires mutual fund companies to maintain and report a shareholder’s cost basis by tax lot, gain/loss information and holding period of covered shares to the Internal Revenue Service on Form 1099. Covered shares are mutual fund shares acquired on or after January 1, 2012. A fund is not required to maintain and report information for shares not deemed as covered.
The new law requires each fund to elect a default tax identification methodology in order to perform the required reporting. As a result, the Trust has chosen Average Cost as its default tax identification methodology. This is the method each Fund will use. However, at the time of purchase or upon the sale of covered shares, shareholders may choose a different tax identification method. Furthermore, if you purchase shares through a financial intermediary, please contact the intermediary to find out what default tax identification method they will use. We recommend that you consult your tax adviser to determine which tax identification methodology best suits your individual tax situation.
For More Information
This report is for the general information of the Funds’ shareholders and is not authorized for distribution to prospective investors unless preceded or accompanied by a current prospectus. You may obtain a copy of the prospectus, which contains information about the investment objectives, risks, charges, expenses, and share classes of each ICON Fund, by visiting www.iconfunds.com or by calling 1-800-764-0442. Please read the prospectus carefully before investing.
ICON Distributors, Inc., Distributor.
ICON FUNDS PRIVACY INFORMATION
| | |
| FACTS | | WHAT DOES ICON DO WITH YOUR PERSONAL INFORMATION? |
| | |
| Why? | | Financial companies choose how they share your personal information. Federal law gives consumers the right to limit some but not all sharing. Federal law also requires us to tell you how we collect, share, and protect your personal information. Please read this notice carefully to understand what we do. |
| | |
| What? | | The types of personal information we collect and share depend on the product or service you have with us. This information can include: n Social Security number and account balances n income and transaction history n checking account information and wire transfer instructions When you are no longer our customer, we continue to share your information as described in this notice. |
| | |
| How? | | All financial companies need to share customers’ personal information to run their everyday business. In the section below, we list the reasons financial companies can share their customers’ personal information; the reasons ICON chooses to share; and whether you can limit this sharing. |
| | | | |
| Reasons we can share your personal information | | Does ICON share? | | Can you limit this sharing? |
For our everyday business purposes — such as to process your transactions, maintain your account(s), respond to court orders and legal investigations, or report to credit bureaus | | Yes | | No |
For our marketing purposes — to offer our products and services to you | | No | | We don’t share |
| For joint marketing with other financial companies | | No | | We don’t share |
For our affiliates’ everyday business purposes — information about your transactions and experiences | | No | | We don’t share |
For our affiliates’ everyday business purposes — information about your creditworthiness | | No | | We don’t share |
| For nonaffiliates to market to you | | No | | We don’t share |
| | |
| Questions? | | Call 1-800-764-0442 for the ICON Funds and 1-800-828-4881 for ICON Advisers, Inc. and ICON Distributors, Inc. |
| | | | |
| FUNDS PRIVACY INFORMATION | | | 65 | |
| | |
| Who we are | | |
| Who is providing this notice? | | ICON Funds, ICON Advisers, Inc., and ICON Distributors, Inc. (collectively “ICON”) |
| What we do | | |
| How does ICON protect my personal information? | | To protect your personal information from unauthorized access and use, we use security measures that comply with federal law. These measures include computer safeguards and secured files and buildings. Contracts with our service providers require them to restrict access to your non-public personal information, and to maintain physical, electronic and procedural safeguards against unintended disclosure. |
| How does ICON collect my personal information? | | We collect your personal information, for example, when you n open an account or enter into an investment advisory contract n provide account information or give us your contact information n make a wire transfer We also collect your personal information from others, such as credit bureaus, affiliates, or other companies. |
| Why can’t I limit all sharing? | | Federal law gives you the right to limit only n sharing for affiliates’ everyday business purposes — information about your creditworthiness n affiliates from using your information to market to you n sharing for nonaffiliates to market to you State laws and individual companies may give you additional rights to limit sharing. |
| Definitions | | |
| Affiliates | | Companies related by common ownership or control. They can be financial and nonfinancial companies. n Our affiliates include financial companies such as ICON Funds, ICON Advisers, Inc., and ICON Distributors, Inc. |
| Nonaffiliates | | Companies not related by common ownership or control. They can be financial and nonfinancial companies. n Nonaffiliates we share with can include financial companies such as custodians, transfer agents, registered representatives, financial advisers and nonfinancial companies such as fulfillment, proxy voting, and class action service providers |
| Joint marketing | | A formal agreement between nonaffiliated financial companies that together market financial products or services to you. n ICON doesn’t jointly market |
| | |
| 66 | | FUNDS PRIVACY INFORMATION |
(This page is intentionally left blank)
(This page is intentionally left blank)
(This page is intentionally left blank)
For more information about the ICON Funds, contact us:
| | |
| |
| By Telephone | | 1-800-764-0442 |
| |
| By Mail | | ICON Funds
P.O. Box 55452
Boston, MA 02205-8165 |
| |
| In Person | | ICON Funds
5299 DTC Boulevard, 12th Floor
Greenwood Village, CO 80111 |
| |
| On the Internet | | www.iconfunds.com |
| |
| By E-Mail | | info@iconadvisers.com |

2015 ANNUAL REPORT
ICON SECTOR FUNDS
INVESTMENT UPDATE
ICON Consumer Discretionary Fund
ICON Consumer Staples Fund
ICON Energy Fund
ICON Financial Fund
ICON Healthcare Fund
ICON Industrials Fund
ICON Information Technology Fund
ICON Materials Fund
ICON Utilities Fund

1-800-764-0442 | www.iconfunds.com

You can now sign up for electronic delivery of ICON Fund shareholder reports, including prospectuses, annual reports, semiannual reports and proxy statements.
When these materials are available, you will receive an email from ICON with instructions on how to view the documents. Statements, transaction confirmations and other documents that are not available online will continue to be sent to you by U.S. mail.
Visit ICON’s website at www.iconfunds.com to learn more and sign up.
You may change or cancel your participation in eDelivery by visiting www.iconfunds.com, or you can request a hard copy of any of the materials free of charge by calling ICON Funds at 1-800-764-0442.
1-800-764-0442 • www.iconfunds.com

TABLEOF CONTENTS
ABOUT THIS REPORT (UNAUDITED)
Historical Returns
All total returns mentioned in this Report account for the change in a Fund’s per-share price and the reinvestment of any dividends, capital gain distributions and adjustments for financial statement purposes. If your account is set up to receive Fund distributions in cash rather than to reinvest them, your actual return may differ from these figures. The Funds’ performance results do not reflect the deduction of taxes that a shareholder would pay on Fund distributions or on the redemption of Fund shares. The Adviser may have reimbursed certain fees or expenses of some of the Funds. If not for these reimbursements, performance would have been lower. Fund results shown, unless otherwise indicated, are at net asset value. If a sales charge (maximum 5.75%) had been deducted, results would have been lower.
Past performance does not guarantee future results. Investment return and principal value will fluctuate so that an investor’s shares, when redeemed, may be worth more or less than their original cost. Performance results represent past performance, and current performance may be higher or lower. Please call 1-800-764-0442 or visit www.iconfunds.com for performance results current to the most recent month-end.
Portfolio Data
This Report reflects ICON’s portfolio holdings as of September 30, 2015, the end of the reporting period. The information is not a complete analysis of every aspect of any sector, industry, security or the Funds.
There are risks associated with mutual fund investing, including the loss of principal. The likelihood of loss may be greater if you invest for a shorter period of time. There is no assurance that the investment process will consistently lead to successful results.
An investment concentrated in sectors and industries may involve greater risk and volatility than a more diversified investment. Investments in foreign securities may entail unique risks, including political, market, and currency risks. Financial statements of foreign companies are governed by different accounting, auditing, and financial standards than U.S. companies and may be less transparent and uniform than in the United States. Many corporate governance standards, which help ensure the integrity of public information in the United States, do not exist in foreign countries. In general, there may be less governmental supervision of foreign stock exchanges and securities brokers and issuers. The ICON system relies on the integrity of the financial statements released to the market as part of our analysis.
The prospectus and statement of additional information contain this and other information about the Funds and are available by visiting www.iconfunds.com or calling 1-800-764-0442. Please read the prospectus and statement of additional information carefully.
Financial Intermediary
If you purchase the Fund through a broker-dealer or other financial intermediary (such as a bank), the Fund and its related companies may pay the intermediary for the sale of Fund shares and related services. These payments may influence the broker-dealer or other intermediary and your salesperson to recommend the Fund over another investment. Ask your salesperson or visit your financial intermediary’s website for more information.
| | |
MANAGEMENT OVERVIEW (UNAUDITED) ICON CONSUMER DISCRETIONARY FUND | | |
| Q. | How did the Fund Perform relative to its benchmark? |
| A. | The ICON Consumer Discretionary Fund (the Fund) Class S returned 5.80% for the fiscal year ended September 30, 2015, while the benchmark S&P Composite 1500 Consumer Discretionary Index rose 12.57%. The broad market S&P Composite 1500 Index returned -0.30%. Total returns for other periods and additional Class shares as of September 30, 2015, appear in the subsequent pages of this Fund’s Management Overview. |
| Q. | What primary factors influenced the Fund’s relative performance during the period? |
| A. | While the U.S. equity market was generally flat over the past year, the Consumer Discretionary sector rose, outperforming the broad market. After a brief selloff in October 2014 amidst Ebola outbreak fears, equity markets continued their rise into the summer months of 2015. Aided by a backdrop of a resilient U.S. economy as well as an accommodative monetary policy, companies were able to build upon positive results from past years. However, in mid-August 2015, fears about slowing global growth and uncertainty regarding interest rate increases brought forth a broad selloff. Over the course of the fiscal year, economic growth generally remained positive and stable, consumer confidence rose, unemployment fell, and inflation remained subdued by historical standards. All these factors could remain as tailwinds for the U.S. consumer and should be supportive for companies and industries in this sector of the economy. |
| Q. | How did the Fund’s Composition affect performance? |
| A. | The auto parts & equipment industry was the greatest contributor to the Fund’s performance over the period on the industry level. The Fund was able to outperform the benchmark in this industry based on strong stock selection over the period thanks to companies such as Johnson Controls and Gentherm contributing to the industry’s returns. The hotels resorts & cruise lines industry was another positive contributor, as holdings in Royal Caribbean Cruise Lines and Norwegian Cruise Lines contributed positively to the Fund’s performance. |
The internet retail industry was the Fund’s largest detractor to relative performance on the industry level. An overweight position in laggard Zulily, as well as the Fund’s lack of exposure to Amazon.com and Netflix,
which posted large returns, ultimately contributed negatively to the performance of the Fund relative to the benchmark. The apparel accessories & luxury goods industry was another detractor to relative performance with Fund holdings in Michael Kors and Movado Group detracting from the Fund’s performance.
| Q. | What is your investment outlook for the Consumer Discretionary sector? |
| A. | At the close of the fiscal year, our model indicates the Consumer Discretionary sector has an overall average value-to-price (V/P) ratio of 1.04; or in other words, we believe the fair value for the stocks in the Consumer Discretionary sector as a whole is approximately 4% higher than where the stocks are currently trading. We currently see bargains in the automotive related industries, specifically auto parts & equipment, as well as the movies & entertainment and home improvement retail industries. As always, we look to value as our primary guide and will adjust our positioning as market conditions dictate. |
ICON Consumer Discretionary Fund
Sector Composition
September 30, 2015
| | | | |
Consumer Discretionary | | | 87.4% | |
Leisure and Consumer Staples | | | 3.1% | |
Industrials | | | 1.7% | |
Information Technology | | | 1.3% | |
| | | | |
| | | 93.5% | |
| | | | |
Percentages are based upon common stocks as a percentage of net assets.
ICON Consumer Discretionary Fund
Industry Composition
September 30, 2015
| | | | |
Movies & Entertainment | | | 18.9% | |
Home Improvement Retail | | | 13.3% | |
Auto Parts & Equipment | | | 11.7% | |
Specialty Stores | | | 10.0% | |
Apparel, Accessories & Luxury Goods | | | 4.3% | |
Cable & Satellite | | | 4.3% | |
Apparel Retail | | | 4.1% | |
Hotels, Resorts & Cruise Lines | | | 4.1% | |
Restaurants | | | 3.6% | |
Household Appliances | | | 3.4% | |
Consumer Electronics | | | 3.1% | |
| | | | |
Broadcasting | | | 2.6% | |
Airlines | | | 1.7% | |
Automobile Manufacturers | | | 1.7% | |
Household Products | | | 1.6% | |
Drug Retail | | | 1.5% | |
Footwear | | | 1.4% | |
Internet Software & Services | | | 1.3% | |
Computer & Electronics Retail | | | 0.9% | |
| | | | |
| | | 93.5% | |
| | | | |
Percentages are based upon common stocks as a percentage of net assets.
ICON Consumer Discretionary Fund
Average Annual Total Return
as of September 30, 2015
| | | | | | | | | | | | | | | | | | | | | | | | | | | | |
| | | Inception
Date | | | 1 Year | | | 5 Years | | | 10 Years | | | Since
Inception | | | Gross
Expense
Ratio* | | | Net
Expense
Ratio* | |
ICON Consumer Discretionary Fund - Class S | | | 7/9/97 | | | | 5.80% | | | | 15.79% | | | | 7.32% | | | | 5.86% | | | | 1.46% | | | | 1.46% | |
ICON Consumer Discretionary Fund - Class A | | | 9/30/10 | | | | 5.34% | | | | 15.18% | | | | N/A | | | | 15.18% | | | | 1.76% | | | | 1.76% | |
ICON Consumer Discretionary Fund - Class A (including maximum sales charge of 5.75%) | | | 9/30/10 | | | | -0.71% | | | | 13.83% | | | | N/A | | | | 13.83% | | | | 1.76% | | | | 1.76% | |
S&P 1500 Consumer Discretionary Index | | | | | | | 12.57% | | | | 19.00% | | | | 10.00% | | | | 8.64% | | | | N/A | | | | N/A | |
S&P Composite 1500 Index | | | | | | | -0.30% | | | | 13.34% | | | | 6.95% | | | | 6.53% | | | | N/A | | | | N/A | |
Past performance is not a guarantee of future results. The performance of the S&P 1500 Consumer Discretionary Index includes the reinvestment of the dividends and capital gain distributions beginning on January 1, 2002. Additional information about these performance results and the comparative indexes can be found in the About This Report section. The Adviser has agreed to limit certain Fund expenses; without these limitations, returns would have been lower. The limitation provisions may be terminated in the future.
| * | Please see the most recent prospectus for details. |
ICON Consumer Discretionary Fund
Value of a $10,000 Investment
through September 30, 2015
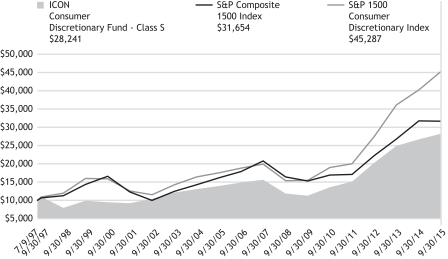
Past performance is not a guarantee of future results. The above graph compares a $10,000 investment made in the Fund’s Class S shares on the Class’ inception date of 7/9/97 to a $10,000 investment made in unmanaged securities indexes on that date. The Fund’s performance in this chart and the performance table assumes the reinvestment of dividends and capital gain distributions but does not reflect the deduction of taxes that a shareholder would pay on Fund distributions or on the redemption of Fund shares.
ICON CONSUMER DISCRETIONARY FUND
SCHEDULEOF INVESTMENTS
SEPTEMBER 30, 2015
| | | | | | | | |
| Shares or Principal Amount | | Value | |
| | | | | | | | |
| | Common Stocks (93.5%) | |
| | Airlines (1.7%) | |
| | 7,900 | | | American Airlines Group, Inc. | | $ | 306,757 | |
| | 13,200 | | | Southwest Airlines Co. | | | 502,128 | |
| | | | | | | | |
| | | | | | | 808,885 | |
| | Apparel Retail (4.1%) | |
| | 21,200 | | | TJX Cos., Inc. | | | 1,514,104 | |
| | 15,400 | | | Urban Outfitters, Inc.† | | | 452,452 | |
| | | | | | | | |
| | | | | | | 1,966,556 | |
| | Apparel, Accessories & Luxury Goods (4.3%) | |
| | 29,000 | | | Hanesbrands, Inc. | | | 839,260 | |
| | 63,100 | | | Kate Spade & Co.† | | | 1,205,841 | |
| | | | | | | | |
| | | | | | | 2,045,101 | |
| | Auto Parts & Equipment (11.7%) | |
| | 25,700 | | | Delphi Automotive PLC | | | 1,954,228 | |
| | 11,600 | | | Johnson Controls, Inc. | | | 479,776 | |
| | 11,400 | | | Lear Corp. | | | 1,240,092 | |
| | 40,300 | | | Magna International, Inc. | | | 1,934,803 | |
| | | | | | | | |
| | | | | | | 5,608,899 | |
| | Automobile Manufacturers (1.7%) | |
| | 6,300 | | | Daimler AG | | | 458,955 | |
| | 15,000 | | | Tata Motors, Ltd., ADR† (a) | | | 337,500 | |
| | | | | | | | |
| | | | | | | 796,455 | |
| | Broadcasting (2.6%) | |
| | 26,400 | | | CBS Corp., Class B | | | 1,053,360 | |
| | 4,100 | | | Scripps Networks Interactive, Inc., Class A | | | 201,679 | |
| | | | | | | | |
| | | | | | | 1,255,039 | |
| | | | | | | | |
| Shares or Principal Amount | | Value | |
| | | | | | | | |
| | Cable & Satellite (4.3%) | |
| | 27,000 | | | Comcast Corp., Class A | | $ | 1,535,760 | |
| | 14,100 | | | Starz, Class A† | | | 526,494 | |
| | | | | | | | |
| | | | | | | 2,062,254 | |
| | Computer & Electronics Retail (0.9%) | |
| | 10,292 | | | GameStop Corp., Class A(a) | | | 424,133 | |
| | | | | | | | |
| | Consumer Electronics (3.1%) | |
| | 47,300 | | | GoPro, Inc., Class A†(a) | | | 1,476,706 | |
| | | | | | | | |
| | Drug Retail (1.5%) | | | | |
| | 7,300 | | | CVS Health Corp. | | | 704,304 | |
| | | | | | | | |
| | Footwear (1.4%) | |
| | 11,700 | | | Deckers Outdoor Corp.† | | | 679,302 | |
| | | | | | | | |
| | Home Improvement Retail (13.3%) | |
| | 24,900 | | | Home Depot, Inc. | | | 2,875,701 | |
| | 50,800 | | | Lowe’s Cos., Inc. | | | 3,501,136 | |
| | | | | | | | |
| | | | | | | 6,376,837 | |
| | Hotels, Resorts & Cruise Lines (4.1%) | |
| | 9,000 | | | Diamond Resorts International, Inc.† | | | 210,510 | |
| | 24,000 | | | Norwegian Cruise Line Holdings, Ltd.† | | | 1,375,200 | |
| | 4,200 | | | Royal Caribbean Cruises, Ltd. | | | 374,178 | |
| | | | | | | | |
| | | | | | | 1,959,888 | |
| | Household Appliances (3.4%) | |
| | 11,200 | | | Whirlpool Corp. | | | 1,649,312 | |
| | | | | | | | |
| | Household Products (1.6%) | |
| | 10,900 | | | Procter & Gamble Co. | | | 784,146 | |
| | | | | | | | |
| | Internet Software & Services (1.3%) | |
| | 10,500 | | | Alibaba Group Holding, Ltd., ADR† | | | 619,185 | |
| | | | | | | | |
| | | | | | | | |
| Shares or Principal Amount | | Value | |
| | | | | | | | |
| | Movies & Entertainment (18.9%) | |
| | 43,300 | | | Cinemark Holdings, Inc. | | $ | 1,406,817 | |
| | 21,200 | | | Time Warner, Inc. | | | 1,457,500 | |
| | 82,100 | | | Twenty-First Century Fox, Inc., Class A | | | 2,215,058 | |
| | 11,300 | | | Viacom, Inc., Class B | | | 487,595 | |
| | 34,100 | | | Walt Disney Co. | | | 3,485,020 | |
| | | | | | | | |
| | | | | | | 9,051,990 | |
| | Restaurants (3.6%) | |
| | 30,400 | | | Starbucks Corp. | | | 1,727,936 | |
| | | | | | | | |
| | Specialty Stores (10.0%) | |
| | 41,819 | | | Party City Holdco, Inc.†(a) | | | 667,849 | |
| | 26,800 | | | Signet Jewelers, Ltd. | | | 3,648,284 | |
| | 2,800 | | | Tractor Supply Co. | | | 236,096 | |
| | 1,400 | | | Ulta Salon Cosmetics & Fragrance, Inc.† | | | 228,690 | |
| | | | | | | | |
| | | | | | | 4,780,919 | |
| | | | | | | | |
| Total Common Stocks
(Cost $46,876,298) | | | 44,777,847 | |
| | | | | | | | |
| Shares or Principal Amount | | Value | |
| | | | | | | | |
| | Collateral for Securities on Loan (6.0%) | |
| | 2,880,504 | | | State Street Navigator Prime Portfolio, 0.20% | | $ | 2,880,504 | |
| | | | | | | | |
| Total Collateral for Securities
on Loan
(Cost $2,880,504) | | | 2,880,504 | |
| | Short-Term Investments (10.1%) | |
| $ | 4,865,359 | | | State Street Euro Dollar Time Deposit (USD), 0.01%, 10/01/15 | | | 4,865,359 | |
| | | | | | | | |
| Total Short-Term Investments
(Cost $4,865,359) | | | 4,865,359 | |
| Total Investments 109.6%
(Cost $54,622,161) | | | 52,523,710 | |
| Liabilities Less Other Assets
(9.6)% | | | (4,611,655 | ) |
| | | | | | | | |
| | Net Assets 100.0% | | $ | 47,912,055 | |
| | | | | | | | |
The accompanying notes are an integral part of the financial statements.
| † | Non-income producing security. |
| (a) | All or a portion of the security was on loan as of September 30, 2015. |
| ADR | American Depositary Receipt |
| | |
MANAGEMENT OVERVIEW (UNAUDITED) ICON CONSUMER STAPLES FUND | | |
| Q. | How did the Fund perform relative to its benchmarks? |
| A. | The ICON Consumer Staples Fund (the Fund) Class S returned 8.66% for the fiscal year ended September 30, 2015, while its sector-specific benchmark, the S&P Composite 1500 Consumer Staples Index, returned 7.10%, and the S&P Composite 1500 Index returned -0.30%. Total returns for other periods and additional Class shares as of September 30, 2015, appear in the subsequent pages of this Fund’s Management Overview. |
| Q. | What primary factors were behind the Fund’s relative performance? |
| A. | In contrast to recent fiscal years, the broad U.S. market experienced slower growth over the course of fiscal year 2015. Investors faced several headwinds during the period including economic growth concerns internationally, especially with respect to that of China and Europe, and the prospect of the Federal Reserve raising rates for the first time since 2006. However, in general, interest rates remained relatively low, monetary policy was accommodative and the U.S. economy continued to show signs of improvement relative to the rest of the world. Having lagged during the previous fiscal year, the Consumer Staples sector outperformed the broad U.S. market during fiscal year 2015. |
From a valuation standpoint, according to our system, we began the period with an overall average value-to-price (V/P) ratio for the sector of 1.05. Industry leadership included the drug retail industry, in which the Fund was overweight relative to the benchmark, and the distillers & vintners industry, in which the Fund was underweight relative to the benchmark. Both industries had returns in excess of 26%. While the Fund participated in the upside move in the drug retail industry, the Fund’s underweight positioning in the distillers & vintners industry relative to the benchmark detracted from Fund performance on a relative basis.
| Q. | How did the Fund’s composition affect performance? |
| A. | The household products industry was the greatest contributor to the Fund’s performance over the period on the industry level. The Fund was able to outperform the benchmark in this industry in part due to an underweight position relative to the benchmark in laggard Procter & Gamble and an overweight position relative to the benchmark in Church & Dwight. The tobacco industry was another positive contributor as a position in Reynolds American contributed positively to the Fund’s performance relative to the benchmark. |
The food distributors industry was the Fund’s largest detractor to relative performance on the industry level. Overweight positions relative to the benchmark in laggards Andersons and United Natural Foods contributed negatively to the performance of the Fund relative to the benchmark. The food retail industry also detracted from relative performance due to an underweight position in Kroger, a well performing stock in the industry during the period.
| Q. | What is your investment outlook for the Consumer Staples sector? |
| A. | At the close of the fiscal year, our model indicates the Consumer Staples sector has an overall average V/P ratio of 1.03, meaning we believe the fair value for the stocks in the Consumer Staples sector as a whole is approximately 3% higher than where the stocks are currently trading. Our system currently sees value in the tobacco, agricultural products, and packaged foods & meats industries. As always, we look to value as our primary guide and will adjust our positioning as market conditions dictate. |
ICON Consumer Staples Fund
Sector Composition
September 30, 2015
| | | | |
Leisure and Consumer Staples | | | 92.6% | |
| | | | |
| | | 92.6% | |
| | | | |
Percentages are based upon common stocks as a percentage of net assets.
ICON Consumer Staples Fund
Industry Composition
September 30, 2015
| | | | |
Packaged Foods & Meats | | | 18.0% | |
Soft Drinks | | | 15.0% | |
Drug Retail | | | 13.1% | |
Tobacco | | | 11.7% | |
Household Products | | | 10.9% | |
Agricultural Products | | | 6.3% | |
Food Distributors | | | 5.2% | |
Hypermarkets & Super Centers | | | 5.1% | |
Food Retail | | | 4.4% | |
Brewers | | | 2.9% | |
| | | | |
| | | 92.6% | |
| | | | |
Percentages are based upon common stocks as a percentage of net assets.
ICON Consumer Staples Fund
Average Annual Total Return
as of September 30, 2015
| | | | | | | | | | | | | | | | | | | | | | | | | | | | |
| | | Inception
Date | | | 1 Year | | | 5 Years | | | 10 Years | | | Since Inception | | | Gross Expense Ratio* | | | Net Expense Ratio* | |
ICON Consumer Staples Fund - Class S | | | 5/9/97 | | | | 8.66% | | | | 12.47% | | | | 6.67% | | | | 8.53% | | | | 1.45% | | | | 1.45% | |
ICON Consumer Staples Fund - Class A | | | 9/30/10 | | | | 8.32% | | | | 12.37% | | | | N/A | | | | 12.37% | | | | 2.04% | | | | 1.75% | |
ICON Consumer Staples Fund - Class A (including maximum sales charge of 5.75%) | | | 9/30/10 | | | | 2.06% | | | | 11.05% | | | | N/A | | | | 11.05% | | | | 2.04% | | | | 1.75% | |
S&P 1500 Consumer Staples Index | | | | | | | 7.10% | | | | 14.51% | | | | 10.47% | | | | 7.99% | | | | N/A | | | | N/A | |
S&P Composite 1500 Index | | | | | | | -0.30% | | | | 13.34% | | | | 6.95% | | | | 7.04% | | | | N/A | | | | N/A | |
Past performance is not a guarantee of future results. The performance of the S&P 1500 Consumer Staples Index includes the reinvestment of the dividends and capital gain distributions beginning on January 1, 2002. Additional information about these performance results and the comparative indexes can be found in the About This Report section. The Adviser has agreed to limit certain Fund expenses; without these limitations, returns would have been lower. The limitation provisions may be terminated in the future.
| * | Please see the most recent prospectus for details. |
ICON Consumer Staples Fund
Value of a $10,000 Investment
through September 30, 2015
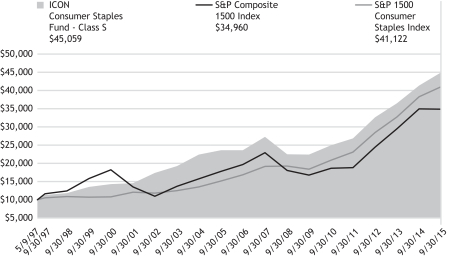
Past performance is not a guarantee of future results. The above graph compares a $10,000 investment made in the Fund’s Class S shares on the Class’ inception date of 5/9/97 to a $10,000 investment made in unmanaged securities indexes on that date. The Fund’s performance in this chart and the performance table assumes the reinvestment of dividends and capital gain distributions but does not reflect the deduction of taxes that a shareholder would pay on Fund distributions or on the redemption of Fund shares.
ICON CONSUMER STAPLES FUND
SCHEDULEOF INVESTMENTS
SEPTEMBER 30, 2015
| | | | | | | | |
| Shares or Principal Amount | | Value | |
| | | | | | | | |
| | | | | | | | |
| | Common Stocks (92.6%) | |
| | Agricultural Products (6.3%) | |
| | 5,700 | | | Bunge, Ltd. | | $ | 417,810 | |
| | 4,100 | | | Ingredion, Inc. | | | 357,971 | |
| | | | | | | | |
| | | | | | | 775,781 | |
| | Brewers (2.9%) | |
| | 1,700 | | | Boston Beer Co., Inc., Class A† | | | 358,037 | |
| | | | | | | | |
| | Drug Retail (13.1%) | |
| | 10,500 | | | CVS Health Corp. | | | 1,013,040 | |
| | 7,100 | | | Walgreens Boots Alliance, Inc. | | | 590,010 | |
| | | | | | | | |
| | | | | | | 1,603,050 | |
| | Food Distributors (5.2%) | |
| | 11,700 | | | Andersons, Inc. | | | 398,502 | |
| | 9,000 | | | SpartanNash Co. | | | 232,650 | |
| | | | | | | | |
| | | | | | | 631,152 | |
| | Food Retail (4.4%) | |
| | 12,000 | | | Kroger Co. | | | 432,840 | |
| | 3,500 | | | Whole Foods Market, Inc. | | | 110,775 | |
| | | | | | | | |
| | | | | | | 543,615 | |
| | Household Products (10.9%) | |
| | 5,400 | | | Church & Dwight Co., Inc. | | | 453,060 | |
| | 6,400 | | | Colgate-Palmolive Co. | | | 406,144 | |
| | 6,600 | | | Procter & Gamble Co. | | | 474,804 | |
| | | | | | | | |
| | | | | | | 1,334,008 | |
| | Hypermarkets & Super Centers (5.1%) | |
| | 4,300 | | | Costco Wholesale Corp. | | | 621,651 | |
| | | | | | | | |
| | | | | | | | |
| Shares or Principal Amount | | Value | |
| | Packaged Foods & Meats (18.0%) | |
| | 15,100 | | | Flowers Foods, Inc. | | $ | 373,574 | |
| | 5,300 | | | Hershey Co. | | | 486,964 | |
| | 4,300 | | | J.M. Smucker Co. | | | 490,587 | |
| | 19,800 | | | Tyson Foods, Inc., Class A | | | 853,380 | |
| | | | | | | | |
| | | | | | | 2,204,505 | |
| | Soft Drinks (15.0%) | |
| | 13,100 | | | Coca-Cola Co. | | | 525,572 | |
| | 6,300 | | | Dr. Pepper Snapple Group, Inc. | | | 498,015 | |
| | 1,900 | | | Monster Beverage Corp.† | | | 256,766 | |
| | 5,900 | | | PepsiCo, Inc. | | | 556,370 | |
| | | | | | | | |
| | | | | | | 1,836,723 | |
| | Tobacco (11.7%) | |
| | 10,000 | | | Altria Group, Inc. | | | 544,000 | |
| | 20,200 | | | Reynolds American, Inc. | | | 894,254 | |
| | | | | | | | |
| | | | | | | 1,438,254 | |
| | | | | | | | |
| Total Common Stocks
(Cost $10,243,330) | | | 11,346,776 | |
| | Short-Term Investments (7.2%) | |
| $ | 880,305 | | | State Street Euro Dollar Time Deposit (USD), 0.01%, 10/01/15 | | | 880,305 | |
| | | | | | | | |
| Total Short-Term Investments
(Cost $880,305) | | | 880,305 | |
| Total Investments 99.8%
(Cost $11,123,635) | | | 12,227,081 | |
| Other Assets Less Liabilities
0.2% | | | 26,350 | |
| | | | | | | | |
| | Net Assets 100.0% | | $ | 12,253,431 | |
| | | | | | | | |
The accompanying notes are an integral part of the financial statements.
| † | Non-income producing security. |
| | |
| 14 | | SCHEDULEOF INVESTMENTS |
| | |
MANAGEMENT OVERVIEW (UNAUDITED) ICON ENERGY FUND | | |
| Q. | How did the Fund perform relative to its benchmarks? |
| A. | For the fiscal year ending September 30, 2015, the ICON Energy Fund (the Fund) Class S returned -36.37%, underperforming its sector-specific benchmark, the S&P Composite 1500 Energy Index, which returned -31.01%. The Fund also lagged the broad benchmark, the S&P Composite 1500 Index, which returned -.30%. Total returns for other periods and additional Class shares as of September 30, 2015, appear in the subsequent pages of this Fund’s Management Overview. |
| Q. | What primary factors were behind the Fund’s relative performance? |
| A. | The Energy sector’s underperformance relative to the broader equities market for the fiscal year ending September 30, 2015, came as oil prices continued the decline that began in June 2014. During the period, the strengthening U.S. dollar created a headwind for commodities in general. Despite declining oil prices, U.S. oil production continued to rise with the aid of improved efficiencies and the development of unconventional resources. On September 26, 2014, the U.S. Department of Energy reported domestic oil production of 8,837 (thousands) barrels per day. By June 2015, oil production reached 9,610 (thousands) barrels per day. This increase in supply added additional pricing pressure. Further, on September 30, 2014, the ICE Brent Futures Contract (1-month) as reported by Bloomberg closed at 94.67 per barrel. By August 24, 2015, the same contract reached a low of 42.69, and by the end of fiscal year it closed at 48.37. Over the same period, the CME Natural Gas Futures Contract (1-month) as reported by Bloomberg fell from 4.21 to 2.52. Industries in the Energy sector with the most exposure to commodity pricing were among the worst performing industries in the sector. For example, during the fiscal year 2015, the oil & gas exploration & production industry returned -43.3%, the oil & gas equipment & service industry returned -36.1% and the oil & gas drilling industry returned -56.6%. |
| Q. | How did the Fund’s composition affect performance? |
| A. | In general, the Fund’s exposure to commodity sensitive industries detracted from the Fund’s performance relative to the benchmark. The oil & gas equipment & services industry, the Fund’s largest overweight relative to the benchmark during the fiscal year, was the largest detractor to Fund performance relative to the benchmark. Not only did |
| | this industry, as measured by the S&P 1500 Oil & Gas Equipment & Services Index, lag behind the broader S&P Energy Index, the stocks the Fund held in the industry lagged even further. Specifically, while the oil & gas equipment & services industry as a whole was down approximately 36% for the period, the stocks held by the Fund within the industry were down around 43%. |
The second largest detractor from the Fund’s performance from an attribution standpoint was its underweight position relative to the benchmark in the integrated oil & gas industry. The Fund’s average weight in this industry was about 8.5% over the fiscal year compared to an average weight of approximately 39.1% in the industry for the benchmark. The Fund’s integrated oil & gas industry holdings returned about -17.1%, while the benchmark’s integrated oil & gas industry holdings returned about -23.3%. The outperformance of the Fund’s holdings relative to the benchmark was not enough to overcome the large underweighting the Fund had in this industry.
The oil & gas refining & marketing industry was the second largest overweight industry in the Fund compared to the benchmark during the fiscal year. On average, the Fund’s holdings in this industry returned about 12.1%, and had a positive impact on the Fund’s performance compared to the benchmark. Additionally, the Fund held stocks from the Utilities sector that also had a positive effect on the Fund’s performance relative to the benchmark. However, the positive impact of these holdings was not enough to overcome the negative impacts discussed above.
| Q. | What is your investment outlook for the Energy sector? |
| A. | At the end of the fiscal year, the overall average value-to-price (V/P) ratio for the Energy sector was 1.03 while the V/P ratio for the overall market was 1.09. As discussed earlier, the last quarter of the fiscal year saw a large drop in commodity pricing, which, in turn, lead to downward pressure on forward looking earnings per share for companies with the most exposure to oil pricing. As a result of this negative pressure on a key component of our valuation equation in the Energy sector, the Fund has taken advantage of its ability to hold securities outside of the Energy sector. As of the end of the fiscal year, the Fund had holdings in both the gas utilities and multi-utilities industries in the Utilities sector. Additionally, the selloff of the oil & gas storage & transportation industry has provided an entry point to establish an overweight position in this industry. Over the course of the upcoming fiscal year we are looking for signs of stabilization in forward looking earnings within the Energy sector and will reposition the Fund as our valuation methodology dictates. |
ICON Energy Fund
Sector Composition
September 30, 2015
| | | | |
Energy | | | 86.9% | |
Utilities | | | 8.9% | |
| | | | |
| | | 95.8% | |
| | | | |
Percentages are based upon common stocks as a percentage of net assets.
ICON Energy Fund
Industry Composition
September 30, 2015
| | | | |
Integrated Oil & Gas | | | 22.8% | |
Oil & Gas Refining & Marketing | | | 17.5% | |
Oil & Gas Exploration & Production | | | 17.3% | |
Oil & Gas Equipment & Services | | | 14.4% | |
Oil & Gas Storage & Transportation | | | 11.7% | |
Multi-Utilities | | | 6.9% | |
Coal & Consumable Fuels | | | 3.2% | |
Gas Utilities | | | 2.0% | |
| | | | |
| | | 95.8% | |
| | | | |
Percentages are based upon common stocks as a percentage of net assets.
ICON Energy Fund
Average Annual Total Return
as of September 30, 2015
| | | | | | | | | | | | | | | | | | | | | | | | | | | | |
| | | Inception
Date | | | 1 Year | | | 5 Years | | | 10 Years | | | Since Inception | | | Gross Expense Ratio* | | | Net
Expense Ratio* | |
ICON Energy Fund - Class S | | | 11/5/97 | | | | -36.37% | | | | -1.46% | | | | 0.83% | | | | 8.14% | | | | 1.28% | | | | 1.28% | |
ICON Energy Fund - Class C | | | 9/30/10 | | | | -36.99% | | | | -2.50% | | | | N/A | | | | -2.50% | | | | 2.38% | | | | 2.38% | |
ICON Energy Fund - Class A | | | 9/30/10 | | | | -36.55% | | | | -1.75% | | | | N/A | | | | -1.75% | | | | 1.55% | | | | 1.55% | |
ICON Energy Fund - Class A (including maximum sales charge of 5.75%) | | | 9/30/10 | | | | -40.19% | | | | -2.91% | | | | N/A | | | | -2.91% | | | | 1.55% | | | | 1.55% | |
S&P 1500 Energy Index | | | | | | | -31.01% | | | | 3.29% | | | | 2.96% | | | | 6.90% | | | | N/A | | | | N/A | |
S&P Composite 1500 Index | | | | | | | -0.30% | | | | 13.34% | | | | 6.95% | | | | 6.33% | | | | N/A | | | | N/A | |
Past performance is not a guarantee of future results. Information about these performance results and the comparative indexes can be found in the About This Report section. The Adviser has agreed to limit certain Fund expenses; without these limitations, returns would have been lower. The limitation provisions may be terminated in the future.
| * | Please see the most recent prospectus for details. |
Class C total returns exclude applicable sales charges. If sales charges were included returns would be lower.
ICON Energy Fund
Value of a $10,000 Investment
through September 30, 2015
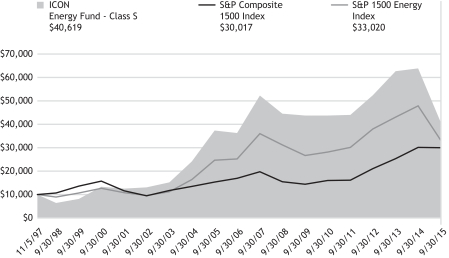
Past performance is not a guarantee of future results. The above graph compares a $10,000 investment made in the Fund’s Class S shares on the Class’ inception date of 11/5/97 to a $10,000 investment made in unmanaged securities indexes on that date. The Fund’s performance in this chart and the performance table assumes the reinvestment of dividends and capital gain distributions but does not reflect the deduction of taxes that a shareholder would pay on Fund distributions or on the redemption of Fund shares.
ICON ENERGY FUND
SCHEDULEOF INVESTMENTS
SEPTEMBER 30, 2015
| | | | | | | | |
| Shares or Principal Amount | | Value | |
| | | | | | | | |
| | Common Stocks (95.8%) | |
| | Coal & Consumable Fuels (3.2%) | |
| | 284,200 | | | Alliance Resource Partners L.P. | | $ | 6,326,292 | |
| | 471,900 | | | Consol Energy, Inc.(a) | | | 4,624,620 | |
| | | | | | | | |
| | | | | | | 10,950,912 | |
| | Gas Utilities (2.0%) | |
| | 120,600 | | | Southwest Gas Corp. | | | 7,033,392 | |
| | | | | | | | |
| | Integrated Oil & Gas (22.8%) | |
| | 369,700 | | | Chevron Corp. | | | 29,161,936 | |
| | 568,700 | | | Exxon Mobil Corp. | | | 42,282,845 | |
| | 151,700 | | | Royal Dutch Shell PLC, ADR | | | 7,189,063 | |
| | | | | | | | |
| | | | | | | 78,633,844 | |
| | Multi-Utilities (6.9%) | |
| | 166,800 | | | Ameren Corp. | | | 7,050,636 | |
| | 153,700 | | | Black Hills Corp. | | | 6,353,958 | |
| | 324,400 | | | CenterPoint Energy, Inc. | | | 5,852,176 | |
| | 127,600 | | | CMS Energy Corp. | | | 4,506,832 | |
| | | | | | | | |
| | | | | | | 23,763,602 | |
| | Oil & Gas Equipment & Services (14.4%) | |
| | 314,100 | | | Bristow Group, Inc. | | | 8,216,856 | |
| | 181,200 | | | Dril-Quip, Inc.† | | | 10,549,464 | |
| | 172,300 | | | National Oilwell Varco, Inc. | | | 6,487,095 | |
| | 271,300 | | | Oceaneering International, Inc. | | | 10,656,664 | |
| | 197,600 | | | Schlumberger, Ltd. | | | 13,628,472 | |
| | | | | | | | |
| | | | | | | 49,538,551 | |
| | | | | | | | |
| Shares or Principal Amount | | Value | |
| | | | | | | | |
| | Oil & Gas Exploration & Production (17.3%) | |
| | 229,000 | | | Cabot Oil & Gas Corp. | | $ | 5,005,940 | |
| | 121,300 | | | Continental Resources, Inc.† | | | 3,514,061 | |
| | 1,239,800 | | | Encana Corp. | | | 7,984,312 | |
| | 199,700 | | | EOG Resources, Inc. | | | 14,538,160 | |
| | 190,900 | | | EQT Corp. | | | 12,364,593 | |
| | 260,300 | | | Southwestern Energy Co.† | | | 3,303,207 | |
| | 586,947 | | | Stone Energy Corp.† | | | 2,911,257 | |
| | 1,126,100 | | | Ultra Petroleum Corp.†(a) | | | 7,195,779 | |
| | 201,134 | | | Whiting Petroleum Corp.† | | | 3,071,316 | |
| | | | | | | | |
| | | | | | | 59,888,625 | |
| | Oil & Gas Refining & Marketing (17.5%) | |
| | 321,600 | | | Marathon Petroleum Corp. | | | 14,899,728 | |
| | 258,200 | | | PBF Energy, Inc., Class A | | | 7,288,986 | |
| | 246,350 | | | Phillips 66 | | | 18,929,534 | |
| | 100,200 | | | Tesoro Corp. | | | 9,743,448 | |
| | 159,900 | | | Valero Energy Corp. | | | 9,609,990 | |
| | | | | | | | |
| | | | | | | 60,471,686 | |
| | Oil & Gas Storage & Transportation (11.7%) | |
| | 144,600 | | | Energy Transfer Partners L.P. | | | 5,938,722 | |
| | 168,000 | | | Magellan Midstream Partners L.P. | | | 10,098,480 | |
| | 281,500 | | | Plains All American Pipeline L.P. | | | 8,551,970 | |
| | 287,300 | | | Spectra Energy Corp. | | | 7,547,371 | |
| | |
| 20 | | SCHEDULEOF INVESTMENTS |
| | | | | | | | |
| Shares or Principal Amount | | Value | |
| | 258,600 | | | TransCanada Corp.(a) | | $ | 8,166,588 | |
| | | | | | | | |
| | | | | | | 40,303,131 | |
| | | | | | | | |
| Total Common Stocks
(Cost $428,806,378) | | | 330,583,743 | |
| | Collateral for Securities on Loan (5.5%) | |
| | 19,134,404 | | | State Street Navigator Prime Portfolio, 0.20% | | | 19,134,404 | |
| | | | | | | | |
| Total Collateral for Securities
on Loan
(Cost $19,134,404) | | | 19,134,404 | |
| | | | | | | | |
| Shares or Principal Amount | | Value | |
| | Short-Term Investments (4.3%) | |
| $ | 14,701,520 | | | State Street Euro Dollar Time Deposit (USD), 0.01%, 10/01/15 | | $ | 14,701,520 | |
| | | | | | | | |
| Total Short-Term Investments
(Cost $14,701,520) | | | 14,701,520 | |
| Total Investments 105.6%
(Cost $462,642,302) | | | 364,419,667 | |
| Liabilities Less Other Assets
(5.6)% | | | (19,373,477 | ) |
| | | | | | | | |
| | Net Assets 100.0% | | $ | 345,046,190 | |
| | | | | | | | |
The accompanying notes are an integral part of the financial statements.
| † | Non-income producing security. |
| (a) | All or a portion of the security was on loan as of September 30, 2015. |
| ADR | American Depositary Receipt |
| | | | |
| SCHEDULEOF INVESTMENTS | | | 21 | |
| | |
MANAGEMENT OVERVIEW (UNAUDITED) ICON FINANCIAL FUND | | |
| Q. | How did the Fund perform relative to its benchmarks? |
| A. | The ICON Financial Fund (the Fund) Class S returned -.55% for the fiscal year ending September 30, 2015, lagging both its sector-specific benchmark, the S&P Composite 1500 Financial Index, which returned 1.31%, and its broad benchmark, the S&P Composite 1500 Index, which returned -.30%. Total returns for other periods and additional Class shares as of September 30, 2015, appear in the subsequent pages of this Fund’s Management Overview. |
| Q. | What primary factors were behind the Fund’s relative performance? |
| A. | The Financial sector is heavily influenced by interest rates. For banking stocks, the difference between short-term interest rates and long-term interest rates can be particularly influential. Over the course of the fiscal year ending September 30, 2015, rates on the long-end of the yield curve declined from 3.20% to 2.85 % as measured by the 30-year U.S. Treasury Note. On the short-end, the 3-month U.S. Treasury Bill closed September 30, 2015, at -.02%. The difference between long-term and short-term rates created headwinds for large banks on two fronts. First, the low short-term rates can make attracting deposits difficult for banks. Second, the flattening yield curve reduces the revenue generated from both borrowing at the short-term end of the yield curve and issuing loans at the long-term end of the yield curve. |
By the end of the fiscal year 2015, year-over-year construction spending accelerated to an increase of about 13.7%, with residential construction being an important component of the increase. The increase in construction spending had a positive impact for both the property & casualty insurance and real estate services industries. The banks in the regional banks industry, which have less regulatory constrictions than larger banks, were able to make gains from the positive mortgage environment created by the increase in residential construction activity. Overall, while positive returns in the property & casualty insurance, real estate services, and regional banks industries helped the Financial sector outpace the broader market, the headwinds discussed above minimized the amount of outperformance.
| Q. | How did the Fund’s composition affect performance? |
| A. | One stock in the asset management & custody banks industry, SEI Investments Co., returned about 34.8% over the course of the fiscal year 2015. Despite the Fund’s overweight position relative to the benchmark in this security, the management & custody banks industry was one of the largest detractors from the Fund’s performance relative to the benchmark. The consumer finance industry was also a large detractor from the Fund’s relative performance. The Fund was overweight in the consumer finance industry relative to the benchmark and the Fund’s holdings in the industry returned about -9.2%, whereas the benchmark returned about -14.5% in the industry. Despite the Fund’s overweight and relative outperformance, the negative returns were still far below the Financial sector’s overall return of 1.31%. |
The Fund’s largest contributor to performance came from its overweight in the real estate services industry. One security, Jones Lang LaSalle Inc., was particularly helpful in this industry’s performance returning 14.18% for the fiscal year 2015. The regional banks and life & health insurance industries were the next biggest contributors to the Fund’s performance. However, the positive impact of holdings in these industries was not enough to overcome the underperformance of the consumer finance industry discussed above.
| Q. | What is your investment outlook for the Financials sector? |
| A. | As of September 30, 2015, the average value-to-price (V/P) ratio for the Financial sector was 1.28 while the average V/P ratio for the overall market was 1.09. Based on our valuation methodology, 20 of the 27 seven industries in the Financial sector had valuations above 1.10, eight of which had a V/P ratio greater than 1.20. As such, the Fund is heavily tilted towards these industries. We will continue to look for opportunities in the Financial sector over the year as guided by value. |
ICON Financial Fund
Sector Composition
September 30, 2015
| | | | |
Real Estate Investment Trusts | | | 98.1% | |
| | | | |
| | | 98.1% | |
| | | | |
Percentages are based upon common stocks as a percentage of net assets.
ICON Financial Fund
Industry Composition
September 30, 2015
| | | | |
Diversified Banks | | | 22.9% | |
Multi-line Insurance | | | 13.2% | |
Regional Banks | | | 10.6% | |
Consumer Finance | | | 9.8% | |
Asset Management & Custody Banks | | | 9.2% | |
Life & Health Insurance | | | 7.6% | |
Real Estate Services | | | 5.9% | |
Investment Banking & Brokerage | | | 4.2% | |
Insurance Brokers | | | 4.1% | |
Property & Casualty Insurance | | | 2.7% | |
Diversified Capital Markets | | | 2.6% | |
Specialized Finance | | | 2.3% | |
Mortgage REIT’s | | | 1.8% | |
Specialized REIT’s | | | 1.2% | |
| | | | |
| | | 98.1% | |
| | | | |
Percentages are based upon common stocks as a percentage of net assets.
ICON Financial Fund
Average Annual Total Return
as of September 30, 2015
| | | | | | | | | | | | | | | | | | | | | | | | | | | | |
| | | Inception
Date | | | 1 Year | | | 5 Years | | | 10 Years | | | Since Inception | | | Gross Expense Ratio* | | | Net
Expense Ratio* | |
ICON Financial Fund - Class S | | | 7/1/97 | | | | -0.55% | | | | 7.88% | | | | -1.86% | | | | 3.55% | | | | 1.64% | | | | 1.50% | |
ICON Financial Fund - Class A | | | 9/30/10 | | | | -0.69% | | | | 7.56% | | | | N/A | | | | 7.56% | | | | 2.35% | | | | 1.75% | |
ICON Financial Fund - Class A (including maximum sales charge of 5.75%) | | | 9/30/10 | | | | -6.38% | | | | 6.29% | | | | N/A | | | | 6.29% | | | | 2.35% | | | | 1.75% | |
S&P 1500 Financials Index | | | | | | | 1.31% | | | | 11.74% | | | | 0.22% | | | | 3.98% | | | | N/A | | | | N/A | |
S&P Composite 1500 Index | | | | | | | -0.30% | | | | 13.34% | | | | 6.95% | | | | 6.63% | | | | N/A | | | | N/A | |
Past performance is not a guarantee of future results. Information about these performance results and the comparative indexes can be found in the About This Report section. The Adviser has agreed to limit certain Fund expenses; without these limitations, returns would have been lower. The limitation provisions may be terminated in the future.
| * | Please see the most recent prospectus for details. |
ICON Financial Fund
Value of a $10,000 Investment
through September 30, 2015

Past performance is not a guarantee of future results. The above graph compares a $10,000 investment made in the Fund’s Class S shares on the Class’ inception date of 7/1/97 to a $10,000 investment made in unmanaged securities indexes on that date. The Fund’s performance in this chart and the performance table assumes the reinvestment of dividends and capital gain distributions but does not reflect the deduction of taxes that a shareholder would pay on Fund distributions or on the redemption of Fund shares.
ICON FINANCIAL FUND
SCHEDULEOF INVESTMENTS
SEPTEMBER 30, 2015
| | | | | | | | |
| Shares or Principal Amount | | Value | |
| | | | | | | | |
| | Common Stocks (98.1%) | |
| | Asset Management & Custody Banks (9.2%) | |
| | 3,700 | | | Affiliated Managers Group, Inc.† | | $ | 632,663 | |
| | 15,700 | | | GAMCO Investors, Inc., Class A | | | 861,930 | |
| | 25,600 | | | Invesco, Ltd. | | | 799,488 | |
| | 65,500 | | | Janus Capital Group, Inc. | | | 890,800 | |
| | 28,200 | | | Main Street Capital Corp.(a) | | | 751,812 | |
| | 22,400 | | | Waddell & Reed Financial, Inc., Class A | | | 778,848 | |
| | | | | | | | |
| | | | 4,715,541 | |
| | Consumer Finance (9.8%) | |
| | 43,200 | | | Ally Financial, Inc.† | | | 880,416 | |
| | 18,200 | | | American Express Co. | | | 1,349,166 | |
| | 19,900 | | | Discover Financial Services | | | 1,034,601 | |
| | 25,800 | | | Encore Capital Group, Inc.† (a) | | | 954,600 | |
| | 14,500 | | | PRA Group, Inc.† (a) | | | 767,340 | |
| | | | | | | | |
| | | | 4,986,123 | |
| | Diversified Banks (22.9%) | |
| | 166,300 | | | Bank of America Corp. | | | 2,590,954 | |
| | 46,400 | | | Citigroup, Inc. | | | 2,301,904 | |
| | 10,100 | | | Credicorp, Ltd. | | | 1,074,236 | |
| | 42,600 | | | JPMorgan Chase & Co. | | | 2,597,322 | |
| | 38,800 | | | U.S. Bancorp | | | 1,591,188 | |
| | 30,600 | | | Wells Fargo & Co. | | | 1,571,310 | |
| | | | | | | | |
| | | | 11,726,914 | |
| | Diversified Capital Markets (2.6%) | |
| | 48,600 | | | Deutsche Bank AG(a) | | | 1,310,256 | |
| | | | | | | | |
| | | | | | | | |
| Shares or Principal Amount | | Value | |
| | | | | | | | |
| | Insurance Brokers (4.1%) | |
| | 11,400 | | | Aon PLC | | $ | 1,010,154 | |
| | 26,100 | | | Arthur J Gallagher & Co. | | | 1,077,408 | |
| | | | | | | | |
| | | | 2,087,562 | |
| | Investment Banking & Brokerage (4.2%) | |
| | 40,900 | | | Charles Schwab Corp. | | | 1,168,104 | |
| | 36,700 | | | E*TRADE Financial Corp.† | | | 966,311 | |
| | | | | | | | |
| | | | 2,134,415 | |
| | Life & Health Insurance (7.6%) | |
| | 78,400 | | | CNO Financial Group, Inc. | | | 1,474,704 | |
| | 13,800 | | | Lincoln National Corp. | | | 654,948 | |
| | 34,000 | | | Sun Life Financial, Inc. | | | 1,096,840 | |
| | 21,400 | | | Unum Group | | | 686,512 | |
| | | | | | | | |
| | | | 3,913,004 | |
| | Mortgage REIT’s (1.8%) | |
| | 92,500 | | | Annaly Capital Management, Inc., REIT | | | 912,975 | |
| | | | | | | | |
| | Multi-line Insurance (13.2%) | |
| | 17,500 | | | American Financial Group, Inc. | | | 1,205,925 | |
| | 36,200 | | | American International Group, Inc. | | | 2,056,884 | |
| | 165,100 | | | Genworth Financial, Inc., Class A† | | | 762,762 | |
| | 35,824 | | | Horace Mann Educators Corp. | | | 1,190,073 | |
| | 43,810 | | | Kemper Corp. | | | 1,549,560 | |
| | | | | | | | |
| | | | | | | 6,765,204 | |
| | Property & Casualty Insurance (2.7%) | |
| | 37,700 | | | XL Group PLC | | | 1,369,264 | |
| | | | | | | | |
| | | | |
| SCHEDULEOF INVESTMENTS | | | 27 | |
| | | | | | | | |
| Shares or Principal Amount | | Value | |
| | | | | | | | |
| | Real Estate Services (5.9%) | |
| | 44,200 | | | CBRE Group, Inc., Class A† | | $ | 1,414,400 | |
| | 11,000 | | | Jones Lang LaSalle, Inc. | | | 1,581,470 | |
| | | | | | | | |
| | | | | | | 2,995,870 | |
| | Regional Banks (10.6%) | |
| | 24,400 | | | BancorpSouth, Inc. | | | 579,988 | |
| | 85,200 | | | Boston Private Financial Holdings, Inc. | | | 996,840 | |
| | 46,500 | | | Fifth Third Bancorp | | | 879,315 | |
| | 121,600 | | | First Commonwealth Financial Corp. | | | 1,105,344 | |
| | 10,200 | | | Signature Bank† | | | 1,403,112 | |
| | 3,800 | | | SVB Financial Group† | | | 439,052 | |
| | | | | | | | |
| | | | | | | 5,403,651 | |
| | Specialized Finance (2.3%) | |
| | 12,700 | | | MarketAxess Holdings, Inc. | | | 1,179,576 | |
| | | | | | | | |
| | | | | | | | |
| Shares or Principal Amount | | Value | |
| | | | | | | | |
| | | | | | | | |
| | Specialized REIT’s (1.2%) | |
| | 24,700 | | | Hospitality Properties Trust, REIT | | $ | 631,826 | |
| | | | | | | | |
| Total Common Stocks
(Cost $54,288,295) | | | 50,132,181 | |
| | Collateral for Securities on Loan (5.8%) | |
| | 2,940,646 | | | State Street Navigator Prime Portfolio, 0.20% | | | 2,940,646 | |
| | | | | | | | |
| Total Collateral for Securities
on Loan
(Cost $2,940,646) | | | 2,940,646 | |
| | Short-Term Investments (1.0%) | |
| $ | 520,335 | | | State Street Euro Dollar Time Deposit (USD), 0.01%, 10/01/15 | | | 520,335 | |
| | | | | | | | |
| Total Short-Term Investments
(Cost $520,335) | | | 520,335 | |
| Total Investments 104.9%
(Cost $57,749,276) | | | 53,593,162 | |
| Liabilities Less Other Assets
(4.9)% | | | (2,513,105 | ) |
| | | | | | | | |
| | Net Assets 100.0% | | $ | 51,080,057 | |
| | | | | | | | |
The accompanying notes are an integral part of the financial statements.
| † | Non-income producing security. |
| (a) | All or a portion of the security was on loan as of September 30, 2015. |
| REIT | Real Estate Investment Trust |
| | |
| 28 | | SCHEDULEOF INVESTMENTS |
| | |
MANAGEMENT OVERVIEW (UNAUDITED) ICON HEALTHCARE FUND | | |
| Q. | How did the Fund perform relative to its benchmarks? |
| A. | The ICON Healthcare Fund (the Fund) Class S returned 2.55% for the fiscal year ended September 30, 2015, under-performing its sector-specific benchmark, the S&P Composite 1500 Health Care Index, which returned 6.22%, but outperforming its broad benchmark, the S&P Composite 1500 Index, which returned -0.30%. Total returns for other periods and additional Class shares as of September 30, 2015, appear in the subsequent pages of this Fund’s Management Overview. |
| Q. | What primary factors were behind the Fund’s relative performance? |
| A. | While U.S. equity market was flat for much of the fiscal year ended September 30, 2015, the period wasn’t without its turbulence. After a brief selloff in October 2014 amidst Ebola outbreak fears, equity markets continued their rise into the summer months of 2015. Aided by a backdrop of a resilient U.S. economy as well as an accommodative monetary policy, companies were able to build upon positive results from past years. However, in mid-August 2015, fears about slowing global growth and uncertainty regarding interest rate increases brought forth a broad selloff. Despite finishing the fiscal year 2015 with positive returns, the Health Care sector was not immune from the selling pressure. After years of strong performance relative to the broad market, investors seemed willing to take their gains in this sector. Further complicating matters, the sector saw concerns about the regulation of pharmaceutical pricing practices weigh on investor sentiment as the fiscal year ended. The Health Care sector spent much of the year at or near our estimation of fair value. As the selling pressure took hold in the summer months 2015, we saw a gradual increase in value as the corresponding equity prices fell. |
| Q. | What were the Fund’s greatest contributors/detractors? |
| A. | Life sciences tools & services was the greatest industry contributor to the Fund’s performance relative to the benchmark during the fiscal year. Despite being underweight in the industry relative to the benchmark, the Fund outperformed based on individual stock selection within the industry over the period. Companies within the industry such as Covance and Cambrex were strong contributors to the Fund’s relative performance. Additionally, the health care services industry was a positive contributor to the Fund’s relative performance. Despite being |
| | underweight in the industry relative to the benchmark, the Fund outperformed based on individual stock selection within the industry over the period. Companies like BioTelemetry and Omnicare were strong contributors to relative performance. |
The managed health care industry was the Fund’s largest detractor to relative performance on an industry level, as the Fund was underweight this top performing industry relative to the benchmark. The pharmaceuticals industry was also a detractor to relative performance with holdings in Mallinckrodt and Jazz Pharmaceuticals contributing negative returns to the Fund’s performance. Additionally, as our value metrics indicated over-priced conditions for the Health Care stocks as whole for periods during the year, cash was held for temporary defensive reasons. The cash position was a detractor to performance during the period.
| Q. | What is your investment outlook for the Health Care sector? |
| A. | After positive returns for most of the past fiscal year, the Health Care sector has an overall average value-to-price (V/P) ratio of 1.05 according to our methodology; or in other words, we believe the fair value for the stocks in the Health Care sector as a whole is approximately 5% higher than where the stocks are currently trading. We currently see bargains in the biotechnology, health care distributors and pharmaceuticals industries. As always, we look to value as our primary guide and will adjust our positioning as market conditions dictate. |
ICON Healthcare Fund
Sector Composition
September 30, 2015
Percentages are based upon common stocks as a percentage of net assets.
ICON Healthcare Fund
Industry Composition
September 30, 2015
| | | | |
Biotechnology | | | 28.5% | |
Pharmaceuticals | | | 27.9% | |
Health Care Distributors | | | 14.5% | |
Managed Health Care | | | 10.1% | |
Health Care Services | | | 5.9% | |
Health Care Facilities | | | 5.8% | |
Health Care Equipment | | | 5.7% | |
Health Care Technology | | | 0.8% | |
| | | | |
| | | 99.2% | |
| | | | |
Percentages are based upon common stocks as a percentage of net assets.
ICON Healthcare Fund
Average Annual Total Return
as of September 30, 2015
| | | | | | | | | | | | | | | | | | | | | | | | | | | | |
| | | Inception
Date | | | 1 Year | | | 5 Years | | | 10 Years | | | Since Inception | | | Gross Expense Ratio* | | | Net
Expense Ratio* | |
ICON Healthcare Fund - Class S | | | 2/24/97 | | | | 2.55% | | | | 19.25% | | | | 7.73% | | | | 10.51% | | | | 1.36% | | | | 1.36% | |
ICON Healthcare Fund - Class A | | | 9/30/10 | | | | 2.33% | | | | 18.84% | | | | N/A | | | | 18.84% | | | | 1.62% | | | | 1.62% | |
ICON Healthcare Fund - Class A (including maximum sales charge of 5.75%) | | | 9/30/10 | | | | -3.54% | | | | 17.44% | | | | N/A | | | | 17.44% | | | | 1.62% | | | | 1.62% | |
S&P 1500 Health Care Index | | | | | | | 6.22% | | | | 19.33% | | | | 10.15% | | | | 9.29% | | | | N/A | | | | N/A | |
S&P Composite 1500 Index | | | | | | | -0.30% | | | | 13.34% | | | | 6.95% | | | | 7.08% | | | | N/A | | | | N/A | |
Past performance is not a guarantee of future results. Information about these performance results and the comparative indexes can be found in the About This Report section. The Adviser has agreed to limit certain Fund expenses; without these limitations, returns would have been lower. The limitation provisions may be terminated in the future.
| * | Please see the most recent prospectus for details. |
ICON Healthcare Fund
Value of a $10,000 Investment
through September 30, 2015
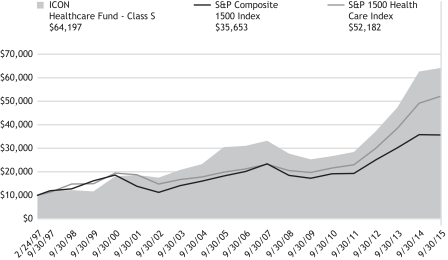
Past performance is not a guarantee of future results. The above graph compares a $10,000 investment made in the Fund’s Class S shares on the Class’ inception date of 2/24/97 to a $10,000 investment made in unmanaged securities indexes on that date. The Fund’s performance in this chart and the performance table assumes the reinvestment of dividends and capital gain distributions but does not reflect the deduction of taxes that a shareholder would pay on Fund distributions or on the redemption of Fund shares.
ICON HEALTHCARE FUND
SCHEDULEOF INVESTMENTS
SEPTEMBER 30, 2015
| | | | | | | | |
| Shares or Principal Amount | | Value | |
| | | | | | | | |
| | Common Stocks (99.2%) | |
| | Biotechnology (28.5%) | |
| | 128,000 | | | AbbVie, Inc. | | $ | 6,964,480 | |
| | 11,800 | | | Alexion Pharmaceuticals, Inc.† | | | 1,845,402 | |
| | 9,512 | | | AMAG Pharmaceuticals, Inc.† | | | 377,912 | |
| | 30,000 | | | Amgen, Inc. | | | 4,149,600 | |
| | 24,700 | | | Biogen, Inc.† | | | 7,207,707 | |
| | 76,300 | | | Celgene Corp.† | | | 8,253,371 | |
| | 26,782 | | | Gilead Sciences, Inc. | | | 2,629,724 | |
| | | | | | | | |
| | | | | | | 31,428,196 | |
| | Health Care Services (5.9%) | |
| | 332,423 | | | BioTelemetry, Inc.† | | | 4,068,858 | |
| | 11,000 | | | Express Scripts Holding Co.† | | | 890,560 | |
| | 14,200 | | | Laboratory Corp. of America Holdings† | | | 1,540,274 | |
| | | | | | | | |
| | | | | | | 6,499,692 | |
| | Health Care Distributors (14.5%) | |
| | 43,000 | | | AmerisourceBergen Corp. | | | 4,084,570 | |
| | 85,400 | | | Cardinal Health, Inc. | | | 6,560,428 | |
| | 29,100 | | | McKesson Corp. | | | 5,384,373 | |
| | | | | | | | |
| | | | | | | 16,029,371 | |
| | Health Care Equipment (5.7%) | |
| | 36,400 | | | Becton, Dickinson & Co. | | | 4,828,824 | |
| | 15,000 | | | Zimmer Biomet Holdings, Inc. | | | 1,408,950 | |
| | | | | | | | |
| | | | | | | 6,237,774 | |
| | Health Care Facilities (5.8%) | | | | |
| | 55,500 | | | Community Health Systems, Inc.† | | | 2,373,735 | |
| | | | | | | | |
| Shares or Principal Amount | | Value | |
| | | | | | | | |
| | 44,200 | | | HCA Holdings, Inc.† | | $ | 3,419,312 | |
| | 17,000 | | | HealthSouth Corp. | | | 652,290 | |
| | | | | | | | |
| | | | | | | 6,445,337 | |
| | Health Care Technology (0.8%) | |
| | 15,600 | | | Cerner Corp.† | | | 935,376 | |
| | | | | | | | |
| | Managed Health Care (10.1%) | |
| | 20,500 | | | Anthem, Inc. | | | 2,870,000 | |
| | 13,300 | | | CIGNA Corp. | | | 1,795,766 | |
| | 56,200 | | | UnitedHealth Group, Inc. | | | 6,519,762 | |
| | | | | | | | |
| | | | | | | 11,185,528 | |
| | Pharmaceuticals (27.9%) | |
| | 28,731 | | | Allergan PLC† | | | 7,809,373 | |
| | 68,000 | | | Bristol-Myers Squibb Co. | | | 4,025,600 | |
| | 32,000 | | | Eli Lilly & Co. | | | 2,678,080 | |
| | 35,800 | | | Jazz Pharmaceuticals PLC† | | | 4,754,598 | |
| | 28,700 | | | Johnson & Johnson | | | 2,679,145 | |
| | 44,001 | | | Mallinckrodt PLC† | | | 2,813,424 | |
| | 49,000 | | | Merck & Co., Inc. | | | 2,420,110 | |
| | 35,000 | | | Mylan N.V.† | | | 1,409,100 | |
| | 12,300 | | | Valeant Pharmaceuticals International, Inc.† | | | 2,194,074 | |
| | | | | | | | |
| | | | | | | 30,783,504 | |
| | | | | | | | |
| Total Common Stocks
(Cost $117,643,272) | | | 109,544,778 | |
| Total Investments 99.2%
(Cost $117,643,272) | | | 109,544,778 | |
| Other Assets Less Liabilities
0.8% | | | 881,440 | |
| | | | | | | | |
| | Net Assets 100.0% | | $ | 110,426,218 | |
| | | | | | | | |
The accompanying notes are an integral part of the financial statements.
| † | Non-income producing security. |
| | | | |
| SCHEDULEOF INVESTMENTS | | | 33 | |
| | |
MANAGEMENT OVERVIEW (UNAUDITED) ICON INDUSTRIALS FUND | | |
| Q. | How did the Fund perform relative to its benchmarks? |
| A. | The ICON Industrials Fund (the Fund) Class S shares returned -6.15% for the fiscal year ended September 30, 2015, while its sector-specific benchmark, the S&P Composite 1500 Industrials Index, returned -3.58%, and the S&P Composite 1500 Index returned -.30%. Total returns for other periods and additional Class shares as of September 30, 2015, appear in the subsequent pages of this Fund’s Management Overview. |
| Q. | What primary factors were behind the Fund’s relative performance? |
| A. | In contrast to recent fiscal years, the broad U.S. market experienced slower growth over the course of fiscal year 2015. Investors faced several headwinds during the period including economic growth concerns internationally, especially with respect to that of China and Europe, and the prospect of the Federal Reserve raising rates for the first time since 2006. However, in general, interest rates remained relatively low, monetary policy was accommodative and the U.S. economy continued to show signs of improvement relative to the rest of the world. The Industrials sector, however, again lagged the broad U.S. market during the period as it did in fiscal year 2014. |
From a valuation standpoint, according to our system, we began the period with an overall average value-to-price (V/P) ratio of 1.09 for the Industrials sector. Industry leadership during the period included the building products and airlines industries. The Fund had no position in the building products industry during the period, which detracted from performance relative to the benchmark. However, the Fund, on average, had an overweight position in the airlines industry, which contributed to Fund performance relative to the benchmark, primarily driven by overweight positions in Alaska Air Group and JetBlue Airways.
The Fund’s overweight position in the construction & engineering industry detracted the most from relative performance due in large part to positions in Fluor Corporation and Tutor Perini.
| Q. | How did the Fund’s composition affect performance? |
| A. | Industry-level returns within the Industrials sectors varied significantly, from 21% to -25%, demonstrating the large role that industry rotation can play in sector investing. |
Industries that detracted the most from absolute performance included positions in the construction & engineering, railroads and trading companies & distributors industries. The airlines industry was the largest contributor to performance followed by the industrial conglomerates and electrical components & equipment industries.
From a total effect standpoint, in addition to the construction & engineering industry, industries that detracted the most from benchmark relative performance included railroads and aerospace & defense. In the railroads industry, an overweight position in one security, Genesee & Wyoming, was a large detractor from relative performance. A position in Precision Castparts and having no position in Northrup Grumman were key drivers of relative underperformance in the aerospace & defense industry. In addition to airlines, industries that added the most to relative performance included electrical components & equipment and industrial machinery. Emerson Electric, a stock the Fund did not have a position in, was the largest driver of relative performance in the electrical components & equipment industry while an overweight position in Snap-on contributed the most to relative performance in the industrial machinery industry.
| Q. | What is your investment outlook for the Industrials sector? |
| A. | At the close of the fiscal year, the Industrials sector had an average overall V/P ratio of 1.09, an indication that our system still sees upside potential for the sector. Specific industries that are demonstrating value according to our system and where the Fund is overweight include airlines, trucking, and construction machinery & heavy trucks. As always, we look to value as our primary guide and will adjust our positioning as market conditions dictate. |
ICON Industrials Fund
Sector Composition
September 30, 2015
Percentages are based upon common stocks as a percentage of net assets.
ICON Industrials Fund
Industry Composition
September 30, 2015
| | | | |
Aerospace & Defense | | | 27.0% | |
Airlines | | | 18.4% | |
Railroads | | | 10.3% | |
Industrial Machinery | | | 8.7% | |
Trucking | | | 8.6% | |
Construction & Farm Machinery & Heavy Trucks | | | 7.0% | |
Construction & Engineering | | | 5.3% | |
Air Freight & Logistics | | | 4.2% | |
Industrial Conglomerates | | | 4.1% | |
Trading Companies & Distributors | | | 3.9% | |
| | | | |
| | | 97.5% | |
| | | | |
Percentages are based upon common stocks as a percentage of net assets.
ICON Industrials Fund
Average Annual Total Return
as of September 30, 2015
| | | | | | | | | | | | | | | | | | | | | | | | | | | | |
| | | Inception
Date | | | 1 Year | | | 5 Years | | | 10 Years | | | Since Inception | | | Gross Expense Ratio* | | | Net
Expense Ratio* | |
ICON Industrials Fund - Class S | | | 5/9/97 | | | | -6.15% | | | | 8.81% | | | | 4.50% | | | | 4.77% | | | | 1.41% | | | | 1.41% | |
ICON Industrials Fund - Class A | | | 9/30/10 | | | | -6.22% | | | | 8.23% | | | | N/A | | | | 8.23% | | | | 2.02% | | | | 1.75% | |
ICON Industrials Fund - Class A (including maximum sales charge of 5.75%) | | | 9/30/10 | | | | -11.64% | | | | 6.94% | | | | N/A | | | | 6.94% | | | | 2.02% | | | | 1.75% | |
S&P 1500 Industrials Index | | | | | | | -3.58% | | | | 12.59% | | | | 7.36% | | | | 7.24% | | | | N/A | | | | N/A | |
S&P Composite 1500 Index | | | | | | | -0.30% | | | | 13.34% | | | | 6.95% | | | | 7.04% | | | | N/A | | | | N/A | |
Past performance is not a guarantee of future results. Information about these performance results and the comparative indexes can be found in the About This Report section. The Adviser has agreed to limit certain Fund expenses; without these limitations, returns would have been lower. The limitation provisions may be terminated in the future.
| * | Please see the most recent prospectus for details. |
ICON Industrials Fund
Value of a $10,000 Investment
through September 30, 2015
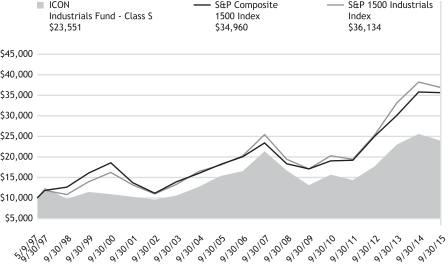
Past performance is not a guarantee of future results. The above graph compares a $10,000 investment made in the Fund’s Class S shares on the Class’ inception date of 5/9/97 to a $10,000 investment made in unmanaged securities indexes on that date. The Fund’s performance in this chart and the performance table assumes the reinvestment of dividends and capital gain distributions but does not reflect the deduction of taxes that a shareholder would pay on Fund distributions or on the redemption of Fund shares.
ICON INDUSTRIALS FUND
SCHEDULEOF INVESTMENTS
SEPTEMBER 30, 2015
| | | | | | | | |
| Shares or Principal Amount | | Value | |
| | | | | | | | |
| | Common Stocks (97.5%) | |
| | Aerospace & Defense (27.0%) | |
| | 5,000 | | | Boeing Co. | | $ | 654,750 | |
| | 11,000 | | | Curtiss-Wright Corp. | | | 686,620 | |
| | 5,900 | | | General Dynamics Corp. | | | 813,905 | |
| | 6,200 | | | Honeywell International, Inc. | | | 587,078 | |
| | 2,600 | | | Raytheon Co. | | | 284,076 | |
| | 3,000 | | | Spirit Aerosystems Holdings, Inc., Class A† | | | 145,020 | |
| | 9,400 | | | United Technologies Corp. | | | 836,506 | |
| | | | | | | | |
| | | | | | | 4,007,955 | |
| | Air Freight & Logistics (4.2%) | |
| | 4,300 | | | FedEx Corp. | | | 619,114 | |
| | | | | | | | |
| | Airlines (18.4%) | |
| | 9,600 | | | Alaska Air Group, Inc. | | | 762,720 | |
| | 26,600 | | | Delta Air Lines, Inc. | | | 1,193,542 | |
| | 29,900 | | | JetBlue Airways Corp.† | | | 770,523 | |
| | | | | | | | |
| | | | | | | 2,726,785 | |
| | Construction & Engineering (5.3%) | |
| | 9,900 | | | Fluor Corp. | | | 419,265 | |
| | 22,900 | | | Tutor Perini Corp.† | | | 376,934 | |
| | | | | | | | |
| | | | | | | 796,199 | |
| Construction & Farm Machinery & Heavy
Trucks (7.0%) |
|
| | 4,900 | | | Caterpillar, Inc. | | | 320,264 | |
| | 2,500 | | | Cummins, Inc. | | | 271,450 | |
| | 12,600 | | | Meritor, Inc.† | | | 133,938 | |
| | 3,500 | | | Wabtec Corp. | | | 308,175 | |
| | | | | | | | |
| | | | | | | 1,033,827 | |
| | Industrial Conglomerates (4.1%) | |
| | 7,200 | | | Danaher Corp. | | | 613,512 | |
| | | | | | | | |
| | Industrial Machinery (8.7%) | |
| | 5,700 | | | Crane Co. | | | 265,677 | |
| | 3,000 | | | Middleby Corp.† | | | 315,570 | |
| | | | | | | | |
| Shares or Principal Amount | | Value | |
| | | | | | | | |
| | 4,700 | | | Snap-on, Inc. | | $ | 709,418 | |
| | | | | | | | |
| | | | | | | 1,290,665 | |
| | Railroads (10.3%) | |
| | 9,900 | | | Genesee & Wyoming, Inc., Class A† | | | 584,892 | |
| | 10,700 | | | Union Pacific Corp. | | | 945,987 | |
| | | | | | | | |
| | | | | | | 1,530,879 | |
| | Trading Companies & Distributors (3.9%) | |
| | 11,700 | | | Fastenal Co.(a) | | | 428,337 | |
| | 2,600 | | | United Rentals, Inc.† | | | 156,130 | |
| | | | | | | | |
| | | | | | | 584,467 | |
| | Trucking (8.6%) | |
| | 3,600 | | | JB Hunt Transport Services, Inc. | | | 257,040 | |
| | 7,300 | | | Landstar System, Inc. | | | 463,331 | |
| | 7,500 | | | Ryder System, Inc. | | | 555,300 | |
| | | | | | | | |
| | | | | | | 1,275,671 | |
| | | | | | | | |
| Total Common Stocks
(Cost $13,349,263) | | | 14,479,074 | |
| | Collateral for Securities on Loan (2.9%) | |
| | 435,825 | | | State Street Navigator Prime Portfolio, 0.20% | | | 435,825 | |
| | | | | | | | |
| Total Collateral for Securities
on Loan
(Cost $435,825) | | | 435,825 | |
| | Short-Term Investments (2.7%) | |
| $ | 389,876 | | | State Street Euro Dollar Time Deposit (USD), 0.01%, 10/01/15 | | | 389,876 | |
| | | | | | | | |
| Total Short-Term Investments
(Cost $389,876) | | | 389,876 | |
| Total Investments 103.1%
(Cost $14,174,964) | | | 15,304,775 | |
| Liabilities Less Other Assets
(3.1)% | | | (457,723 | ) |
| | | | | | | | |
| | Net Assets 100.0% | | $ | 14,847,052 | |
| | | | | | | | |
The accompanying notes are an integral part of the financial statements.
| † | Non-income producing security. |
| (a) | All or a portion of the security was on loan as of September 30, 2015. |
| | | | |
| SCHEDULEOF INVESTMENTS | | | 39 | |
| | |
MANAGEMENT OVERVIEW (UNAUDITED) ICON INFORMATION TECHNOLOGY FUND | | |
| Q. | How did the Fund perform relative to its benchmarks? |
| A. | The ICON Information Technology Fund (the Fund) Class S shares returned 10.33% for the fiscal year ended September 30, 2015, while its sector-specific benchmark, the S&P Composite 1500 Information Technology Index, returned 2.44%, and the S&P Composite 1500 Index gained -.30%. Total returns for other periods and additional Class shares as of September 30, 2015, appear in the subsequent pages of this Fund’s Management Overview. |
| Q. | What primary factors were behind the Fund’s relative performance? |
| A. | In contrast to recent fiscal years, the broad U.S. market experienced slower growth over the course of fiscal year 2015. Investors faced several headwinds during the period including economic growth concerns internationally, especially with respect to that of China and Europe, and the prospect of the Federal Reserve raising rates for the first time since 2006. However, in general, interest rates remained relatively low, monetary policy was accommodative and the U.S. economy continued to show signs of improvement relative to the rest of the world. The Information Technology sector outperformed the broad U.S. market during the period. |
From a valuation standpoint, according to our system, we began the period with an overall average value-to-price (V/P) ratio of 1.08 for the Information Technology sector. Industry leadership during the period included the home entertainment, data processing & outsourced services, application software, and internet software & services industries. The Fund was overweight relative to the benchmark in each of these industries and participated in their gains. The Fund’s holdings in the data processing & outsourced services industry contributed the most to performance relative to the benchmark during the period, where positions in Total Systems and Visa led the way. The next biggest contributor to performance relative to the benchmark was the home entertainment software industry, driven in large part by positions in Electronic Arts and Activision Blizzard. The largest detractor to relative performance was the technology hardware storage & peripherals industry, primarily due to a position in Stratasys and an underweight position in Apple.
| Q. | How did the Fund’s composition affect performance? |
| A. | Industry returns within the sector varied significantly, from about 85% for the best performing industry to -25% for the worst performing industry, highlighting the significant role that industry rotation can play in sector investing. |
The top industry contributors to Fund performance during fiscal year 2015 were the data processing & outsourced services, internet software & services and home entertainment services industries. Industries that detracted the most from Fund performance included semiconductor equipment, electronic manufacturing services, and electronic equipment & instruments.
From a total effect standpoint, in addition to data processing & outsourced services industry, industries that contributed to Fund performance relative to the benchmark included home entertainment software and semiconductors. In addition to technology hardware storage & peripherals, industries that hurt the Fund relative to the benchmark included semiconductor equipment and electronic manufacturing services.
| Q. | What is your investment outlook for the Information Technology sector? |
| A. | Similar to where we started the period, at the close of the fiscal year the Information Technology sector had an average overall V/P ratio of 1.08, an indication that our system still sees upside potential for the sector. Specific industries that are demonstrating value according to our system and where the Fund is overweight include electronic manufacturing services, data processing & outsourced services, and semiconductors. As always, we look to value as our primary guide and will adjust our positioning as market conditions dictate. |
ICON Information Technology Fund
Sector Composition
September 30, 2015
| | | | |
Information Technology | | | 93.8% | |
| | | | |
| | | 93.8% | |
| | | | |
Percentages are based upon common stocks as a percentage of net assets.
ICON Information Technology Fund
Industry Composition
September 30, 2015
| | | | |
Internet Software & Services | | | 20.0% | |
Data Processing & Outsourced Services | | | 17.6% | |
Semiconductors | | | 13.6% | |
Technology Hardware, Storage & Peripherals | | | 7.0% | |
Systems Software | | | 5.9% | |
Electronic Manufacturing Services | | | 5.6% | |
Semiconductor Equipment | | | 5.2% | |
IT Consulting & Other Services | | | 4.4% | |
| | | | |
Application Software | | | 4.2% | |
Home Entertainment Software | | | 3.7% | |
Electronic Equipment & Instruments | | | 2.8% | |
Technology Distributors | | | 2.6% | |
Electronic Components | | | 1.2% | |
| | | | |
| | | 93.8% | |
| | | | |
Percentages are based upon common stocks as a percentage of net assets.
ICON Information Technology Fund
Average Annual Total Return
as of September 30, 2015
| | | | | | | | | | | | | | | | | | | | | | | | | | | | |
| | | Inception
Date | | | 1 Year | | | 5 Years | | | 10 Years | | | Since Inception | | | Gross Expense Ratio* | | | Net
Expense Ratio* | |
ICON Information Technology Fund - Class S | | | 2/19/97 | | | | 10.33% | | | | 13.18% | | | | 5.62% | | | | 8.19% | | | | 1.40% | | | | 1.40% | |
ICON Information Technology Fund - Class A | | | 9/30/10 | | | | 9.99% | | | | 12.72% | | | | N/A | | | | 12.72% | | | | 1.94% | | | | 1.75% | |
ICON Information Technology Fund - Class A (including maximum sales charge of 5.75%) | | | 9/30/10 | | | | 3.68% | | | | 11.40% | | | | N/A | | | | 11.40% | | | | 1.94% | | | | 1.75% | |
S&P 1500 Information Technology Index | | | | | | | 2.44% | | | | 13.90% | | | | 8.58% | | | | 7.13% | | | | N/A | | | | N/A | |
NASDAQ Composite Index | | | | | | | 2.82% | | | | 14.30% | | | | 7.94% | | | | 6.77% | | | | N/A | | | | N/A | |
S&P Composite 1500 Index | | | | | | | -0.30% | | | | 13.34% | | | | 6.95% | | | | 7.05% | | | | N/A | | | | N/A | |
Past performance is not a guarantee of future results. Information about these performance results and the comparative indexes can be found in the About This Report section. The Adviser has agreed to limit certain Fund expenses; without these limitations, returns would have been lower. The limitation provisions may be terminated in the future.
| * | Please see the most recent prospectus for details. |
ICON Information Technology Fund
Value of a $10,000 Investment
through September 30, 2015
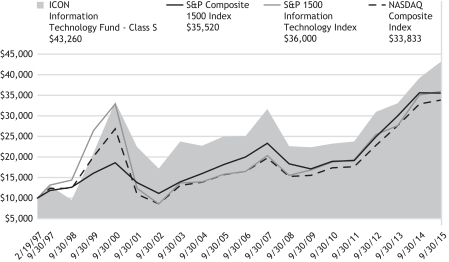
Past performance is not a guarantee of future results. The above graph compares a $10,000 investment made in the Fund’s Class S shares on the Class’ inception date of 2/19/97 to a $10,000 investment made in unmanaged securities indexes on that date. The Fund’s performance in this chart and the performance table assumes the reinvestment of dividends and capital gain distributions but does not reflect the deduction of taxes that a shareholder would pay on Fund distributions or on the redemption of Fund shares.
ICON INFORMATION TECHNOLOGY FUND
SCHEDULEOF INVESTMENTS
SEPTEMBER 30, 2015
| | | | | | | | |
| Shares or Principal Amount | | Value | |
| | | | | | | | |
| | Common Stocks (93.8%) | |
| | Application Software (4.2%) | |
| | 45,300 | | | Mentor Graphics Corp. | | $ | 1,115,739 | |
| | 13,300 | | | salesforce.com, Inc.† | | | 923,419 | |
| | | | | | | | |
| | | | | | | 2,039,158 | |
| Data Processing & Outsourced
Services (17.6%) |
|
| | 4,200 | | | Alliance Data Systems Corp.† | | | 1,087,716 | |
| | 9,500 | | | DST Systems, Inc. | | | 998,830 | |
| | 135,800 | | | Everi Holdings, Inc.† | | | 696,654 | |
| | 19,200 | | | Mastercard, Inc., Class A | | | 1,730,304 | |
| | 16,100 | | | MAXIMUS, Inc. | | | 958,916 | |
| | 44,280 | | | Visa, Inc., Class A | | | 3,084,545 | |
| | | | | | | | |
| | | | 8,556,965 | |
| | Electronic Components (1.2%) | |
| | 10,600 | | | Rogers Corp.† | | | 563,708 | |
| | | | | | | | |
| | Electronic Equipment & Instruments (2.8%) | |
| | 18,300 | | | FEI Co. | | | 1,336,632 | |
| | | | | | | | |
| | Electronic Manufacturing Services (5.6%) | |
| | 12,535 | | | IPG Photonics Corp.† | | | 952,284 | |
| | 17,400 | | | Methode Electronics, Inc. | | | 555,060 | |
| | 20,400 | | | TE Connectivity, Ltd. | | | 1,221,756 | |
| | | | | | | | |
| | | | | | | 2,729,100 | |
| | Home Entertainment Software (3.7%) | |
| | 15,300 | | | Activision Blizzard, Inc. | | | 472,617 | |
| | 19,300 | | | Electronic Arts, Inc.† | | | 1,307,575 | |
| | | | | | | | |
| | | | 1,780,192 | |
| | Internet Software & Services (20.0%) | |
| | 32,400 | | | Facebook, Inc., Class A† | | | 2,912,760 | |
| | 3,925 | | | Google, Inc., Class A† | | | 2,505,602 | |
| | | | | | | | |
| Shares or Principal Amount | | Value | |
| | | | | | | | |
| | 4,139 | | | Google, Inc., Class C† | | $ | 2,518,251 | |
| | 25,200 | | | j2 Global, Inc. | | | 1,785,420 | |
| | | | | | | | |
| | | | | | | 9,722,033 | |
| | IT Consulting & Other Services (4.4%) | |
| | 21,500 | | | Accenture PLC, Class A | | | 2,112,590 | |
| | | | | | | | |
| | Semiconductor Equipment (5.2%) | |
| | 19,600 | | | Advanced Energy Industries, Inc.† | | | 515,480 | |
| | 67,200 | | | Applied Materials, Inc. | | | 987,168 | |
| | 57,400 | | | Teradyne, Inc. | | | 1,033,774 | |
| | | | | | | | |
| | | | | | | 2,536,422 | |
| | Semiconductors (13.6%) | |
| | 8,800 | | | Avago Technologies, Ltd. | | | 1,100,088 | |
| | 22,900 | | | Microsemi Corp.† | | | 751,578 | |
| | 29,400 | | | Skyworks Solutions, Inc. | | | 2,475,774 | |
| | 27,500 | | | Synaptics, Inc.† | | | 2,267,650 | |
| | | | | | | | |
| | | | | | | 6,595,090 | |
| | Systems Software (5.9%) | |
| | 29,500 | | | Microsoft Corp. | | | 1,305,670 | |
| | 43,300 | | | Oracle Corp. | | | 1,563,996 | |
| | | | | | | | |
| | | | | | | 2,869,666 | |
| | Technology Distributors (2.6%) | |
| | 35,277 | | | ScanSource, Inc.† | | | 1,250,922 | |
| | | | | | | | |
| Technology Hardware, Storage &
Peripherals (7.0%) |
|
| | 31,000 | | | Apple, Inc. | | | 3,419,300 | |
| | | | | | | | |
| Total Common Stocks
(Cost $34,511,387) | | | 45,511,778 | |
| | | | |
| SCHEDULEOF INVESTMENTS | | | 45 | |
| | | | | | | | |
| Shares or Principal Amount | | Value | |
| | Short-Term Investments (5.3%) | |
| $ | 2,551,695 | | | State Street Euro Dollar Time Deposit (USD), 0.01%, 10/01/15 | | $ | 2,551,695 | |
| | | | | | | | |
| Total Short-Term Investments
(Cost $2,551,695) | | | 2,551,695 | |
| Total Investments 99.1%
(Cost $37,063,082) | | | 48,063,473 | |
| Other Assets Less Liabilities
0.9% | | | 449,028 | |
| | | | | | | | |
| | Net Assets 100.0% | | $ | 48,512,501 | |
| | | | | | | | |
The accompanying notes are an integral part of the financial statements.
| † | Non-income producing security. |
| | |
| 46 | | SCHEDULEOF INVESTMENTS |
| | | | |
MANAGEMENT OVERVIEW (UNAUDITED) ICON MATERIALS FUND | | | | |
| Q. | How did the Fund perform relative to its benchmarks? |
| A. | The ICON Materials Fund (the Fund) Class S shares returned -21.22% for the fiscal year ended September 30, 2015, while its sector-specific benchmark, the S&P Composite 1500 Materials Index, returned -17.93%, and the S&P Composite 1500 Index returned -0.30%. Total returns for other periods and additional Class shares as of September 30, 2015, appear in the subsequent pages of this Fund’s Management Overview. |
| Q. | What primary factors were behind the Fund’s relative performance? |
| A. | Fiscal year 2015 was a very tough year for all types of commodities and commodity related equities. The combination of a strengthening U.S. dollar and declining emerging market growth proved to be too much of a headwind for the sector, resulting in a large sell-off. Utilizing the Thomson Reuters/CoreCommodity CRB Commodity Index (CRB) as a proxy, commodities as a whole fell by over 30% during the fiscal year 2015. Further, while many investors focused on the decline in crude oil, metals as a whole also fell by approximately 30%, illustrating that the weak performance in commodities was not isolated to Energy sector commodities alone. Ultimately, the commodity and growth weakness bled through into the globally exposed Materials sector, generally resulting in revenue declines and falling equity prices. Over the course of the fiscal year only two industries within the Materials sector produced positive returns. |
According to our valuation methodology, we began fiscal year 2015 with an average value-to-price (V/P) ratio for the Materials Sector of 1.11, indicating we anticipated approximately 11% of upside in the sector over the next 9 to 12 months. However, due to the combination of falling forward looking growth rates and widening credit spreads within the Materials sector, we generally saw value decline in spite of dropping equity prices over the course of the fiscal year. This parallel downward shift in both value and price proved to be tough to navigate and the net result was an underperforming year for the Materials sector and the Fund.
| Q. | How did the Fund’s composition affect performance? |
| A. | Individual industry returns for the industries in the Materials sector varied wildly over the course of fiscal year 2015. The best performing |
| | industry returned over 19% for the year while the worst performing industry returned about -61%. This divergence highlights why we believe industry rotation is so important within a volatile sector such as Materials. Additionally, such a large variation in industry returns demonstrates how industry allocation can drive returns over the course of the year. |
The paper packaging industry was the only positive contributor to the Fund’s performance on an industry level during fiscal year 2015. This industry also produced the highest total effect relative to the benchmark as an overweight position in this outperforming industry helped Fund performance.
The top industry detractors from the Fund’s performance during fiscal year 2015 included the diversified chemicals, commodity chemicals, diversified metals & mining, fertilizers & agricultural chemicals, and construction materials industries. Relative total effect detractors from the Fund’s performance were largely focused in both the diversified chemicals and commodity chemicals industries as the Fund’s stock selections in both industries were hurt by weakness in both commodities and overseas growth.
| Q. | What is your investment outlook for the Materials sector? |
| A. | At the close of the fiscal year, the Materials sector had an overall average V/P ratio of 1.14, indicating that we see upside opportunity within the sector as a whole. While the volatility over the last 12 months has presented some opportunities due to depressed prices, we continue to remain cautious on commodity related securities as forward looking growth rates have yet to bottom out and reflect a turning of the current cycle. However, we do see opportunity in industries tied to domestic economic growth and those with decreased cyclical exposure. |
ICON Materials Fund
Sector Composition
September 30, 2015
| | | | |
Materials | | | 94.6% | |
Leisure and Consumer Staples | | | 3.8% | |
Industrials | | | 1.4% | |
| | | | |
| | | 99.8% | |
| | | | |
Percentages are based upon common stocks as a percentage of net assets.
ICON Materials Fund
Industry Composition
September 30, 2015
| | | | |
Construction Materials | | | 19.5% | |
Diversified Chemicals | | | 15.5% | |
Specialty Chemicals | | | 14.3% | |
Fertilizers & Agricultural Chemicals | | | 10.7% | |
Paper Products | | | 8.4% | |
Commodity Chemicals | | | 6.5% | |
Paper Packaging | | | 6.2% | |
Aluminum | | | 3.8% | |
Packaged Foods & Meats | | | 3.8% | |
Steel | | | 3.3% | |
Industrial Gases | | | 2.4% | |
Precious Metals & Minerals | | | 2.2% | |
Diversified Metals & Mining | | | 1.8% | |
Railroads | | | 1.4% | |
| | | | |
| | | 99.8% | |
| | | | |
Percentages are based upon common stocks as a percentage of net assets.
ICON Materials Fund
Average Annual Total Return
as of September 30, 2015
| | | | | | | | | | | | | | | | | | | | | | | | | | | | |
| | | Inception
Date | | | 1 Year | | | 5 Years | | | 10 Years | | | Since Inception | | | Gross Expense Ratio* | | | Net
Expense Ratio* | |
ICON Materials Fund - Class S | | | 5/5/97 | | | | -21.22% | | | | 4.14% | | | | 4.94% | | | | 3.70% | | | | 1.36% | | | | 1.36% | |
ICON Materials Fund - Class C | | | 9/30/10 | | | | -22.07% | | | | 3.02% | | | | N/A | | | | 3.02% | | | | 4.17% | | | | 2.50% | |
ICON Materials Fund - Class A | | | 9/30/10 | | | | -21.46% | | | | 3.79% | | | | N/A | | | | 3.79% | | | | 1.72% | | | | 1.72% | |
ICON Materials Fund - Class A (including maximum sales charge of 5.75%) | | | 9/30/10 | | | | -25.96% | | | | 2.57% | | | | N/A | | | | 2.57% | | | | 1.72% | | | | 1.72% | |
S&P 1500 Materials Index | | | | | | | -17.93% | | | | 6.97% | | | | 6.67% | | | | 5.83% | | | | N/A | | | | N/A | |
S&P Composite 1500 Index | | | | | | | -0.30% | | | | 13.34% | | | | 6.95% | | | | 7.00% | | | | N/A | | | | N/A | |
Past performance is not a guarantee of future results. Information about these performance results and the comparative indexes can be found in the About This Report section. The Adviser has agreed to limit certain Fund expenses; without these limitations, returns would have been lower. The limitation provisions may be terminated in the future.
| * | Please see the most recent prospectus for details. |
Class C total returns exclude applicable sales charges. If sales charges were included returns would be lower.
ICON Materials Fund
Value of a $10,000 Investment
through September 30, 2015
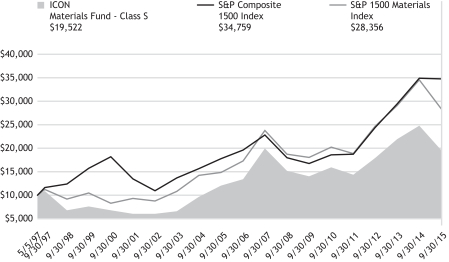
Past performance is not a guarantee of future results. The above graph compares a $10,000 investment made in the Fund’s Class S shares on the Class’ inception date of 5/5/97 to a $10,000 investment made in unmanaged securities indexes on that date. The Fund’s performance in this chart and the performance table assumes the reinvestment of dividends and capital gain distributions but does not reflect the deduction of taxes that a shareholder would pay on Fund distributions or on the redemption of Fund shares.
ICON MATERIALS FUND
SCHEDULEOF INVESTMENTS
SEPTEMBER 30, 2015
| | | | | | | | |
| Shares or Principal Amount | | Value | |
| | | | | | | | |
| | Common Stocks (99.8%) | |
| | Aluminum (3.8%) | |
| | 250,000 | | | Alcoa, Inc. | | $ | 2,415,000 | |
| | | | | | | | |
| | Commodity Chemicals (6.5%) | |
| | 41,000 | | | Cabot Corp. | | | 1,293,960 | |
| | 90,702 | | | Calgon Carbon Corp. | | | 1,413,137 | |
| | 44,939 | | | Methanex Corp. | | | 1,490,178 | |
| | | | | | | | |
| | | | | | | 4,197,275 | |
| | Construction Materials (19.5%) | |
| | 93,000 | | | Eagle Materials, Inc. | | | 6,363,060 | |
| | 105,000 | | | Headwaters, Inc.† | | | 1,974,000 | |
| | 115,000 | | | Lafarge S.A., ADR | | | 1,923,950 | |
| | 15,000 | | | Martin Marietta Materials, Inc. | | | 2,279,250 | |
| | | | | | | | |
| | | | | | | 12,540,260 | |
| | Diversified Chemicals (15.5%) | |
| | 125,000 | | | Dow Chemical Co. | | | 5,300,000 | |
| | 26,800 | | | E.I. du Pont de Nemours & Co. | | | 1,291,760 | |
| | 15,000 | | | Eastman Chemical Co. | | | 970,800 | |
| | 250,000 | | | Huntsman Corp. | | | 2,422,500 | |
| | | | | | | | |
| | | | | | | 9,985,060 | |
| | Diversified Metals & Mining (1.8%) | |
| | 120,000 | | | Freeport-McMoRan, Inc. | | | 1,162,800 | |
| | | | | | | | |
| | Fertilizers & Agricultural Chemicals (10.7%) | |
| | 5,500 | | | Agrium, Inc.(a) | | | 492,250 | |
| | 40,000 | | | FMC Corp. | | | 1,356,400 | |
| | 43,300 | | | Monsanto Co. | | | 3,695,222 | |
| | 22,000 | | | Scotts Miracle-Gro Co., Class A | | | 1,338,040 | |
| | | | | | | | |
| | | | | | | 6,881,912 | |
| | Industrial Gases (2.4%) | |
| | 8,500 | | | Airgas, Inc. | | | 759,305 | |
| | 8,000 | | | Praxair, Inc. | | | 814,880 | |
| | | | | | | | |
| | | | | | | 1,574,185 | |
| | | | | | | | |
| Shares or Principal Amount | | Value | |
| | | | | | | | |
| | Packaged Foods & Meats (3.8%) | |
| | 209,300 | | | Landec Corp.† | | $ | 2,442,531 | |
| | | | | | | | |
| | Paper Packaging (6.2%) | |
| | 7,200 | | | Avery Dennison Corp. | | | 407,304 | |
| | 165,000 | | | Graphic Packaging Holding Co. | | | 2,110,350 | |
| | 25,000 | | | Packaging Corp. of America | | | 1,504,000 | |
| | | | | | | | |
| | | | | | | 4,021,654 | |
| | Paper Products (8.4%) | |
| | 25,000 | | | Clearwater Paper Corp.† | | | 1,181,000 | |
| | 95,000 | | | International Paper Co. | | | 3,590,050 | |
| | 35,000 | | | PH Glatfelter Co. | | | 602,700 | |
| | | | | | | | |
| | | | | | | 5,373,750 | |
| | Precious Metals & Minerals (2.2%) | |
| | 135,000 | | | Stillwater Mining Co.† | | | 1,394,550 | |
| | | | | | | | |
| | Railroads (1.4%) | |
| | 10,000 | | | Union Pacific Corp. | | | 884,100 | |
| | | | | | | | |
| | Specialty Chemicals (14.3%) | |
| | 43,000 | | | Ashland, Inc. | | | 4,326,660 | |
| | 17,000 | | | Celanese Corp. | | | 1,005,890 | |
| | 20,000 | | | HB Fuller Co. | | | 678,800 | |
| | 60,000 | | | PolyOne Corp. | | | 1,760,400 | |
| | 20,000 | | | Valspar Corp. | | | 1,437,600 | |
| | | | | | | | |
| | | | | | | 9,209,350 | |
| | Steel (3.3%) | |
| | 20,000 | | | Nucor Corp. | | | 751,000 | |
| | 25,000 | | | Reliance Steel & Aluminum Co. | | | 1,350,250 | |
| | | | | | | | |
| | | | | | | 2,101,250 | |
| | | | | | | | |
| Total Common Stocks
(Cost $79,201,312) | | | 64,183,677 | |
| | |
| 52 | | SCHEDULEOF INVESTMENTS |
| | | | | | | | |
| Shares or Principal Amount | | Value | |
| | Collateral for Securities on Loan (0.8%) | |
| | 495,000 | | | State Street Navigator Prime Portfolio, 0.20% | | $ | 495,000 | |
| | | | | | | | |
| Total Collateral for Securities
on Loan
(Cost $495,000) | | | 495,000 | |
| | | | | | | | |
| Shares or Principal Amount | | Value | |
| | Short-Term Investments (0.2%) | |
| $ | 142,711 | | | State Street Euro Dollar Time Deposit (USD), 0.01%, 10/01/15 | | $ | 142,711 | |
| | | | | | | | |
| Total Short-Term Investments
(Cost $142,711) | | | 142,711 | |
| Total Investments 100.8%
(Cost $79,839,023) | | | 64,821,388 | |
| Liabilities Less Other Assets
(0.8)% | | | (505,067 | ) |
| | | | | | | | |
| | Net Assets 100.0% | | $ | 64,316,321 | |
| | | | | | | | |
The accompanying notes are an integral part of the financial statements.
| † | Non-income producing security. |
| (a) | All or a portion of the security was on loan as of September 30, 2015. |
| ADR | American Depositary Receipt |
| | | | |
| SCHEDULEOF INVESTMENTS | | | 53 | |
| | | | |
MANAGEMENT OVERVIEW (UNAUDITED) ICON UTILITIES FUND | | | | |
| Q. | How did the Fund perform relative to its benchmarks? |
| A. | For the fiscal year ending September 30, 2015, the ICON Utilities Fund (the Fund) Class S returned 4.93%, underperforming its sector-specific benchmark, the S&P Composite 1500 Utilities Index, which returned 6.47%. The broad benchmark, the S&P Composite 1500 Index, returned -.30%. Total returns for other periods and additional Class shares as of September 30, 2015, appear in the subsequent pages of this Fund’s Management Overview. |
| Q. | What primary factors were behind the Fund’s relative performance? |
| A. | According to our system, at the end of the prior fiscal year the Utility Sector had a value-to-price (V/P) ratio of 1.12 while the overall equity market had a V/P ratio of 1.06. In the relatively low interest environment that has persisted over the past few years some investors have sought yield through dividend yielding stocks. As the interest rate on the 10-Year U.S. Treasury Note fell from 2.49% on September 30, 2014, to 2.04% on September 30, 2015, the number of investors seeking stocks with higher yields increased, helping drive demand for stocks in the Utilities sector. |
In September 2015, many speculated that the Federal Reserve (the FED) would raise rates for the first time since 2006. Ultimately, the FED decided not to raise rates at that time and the yield on the 10-Year U.S. Treasury Note fell to 2.04% as of September 30, 2015. On average, as of the end of the fiscal year 2015, the dividend yield for stocks we track in the Utilities sector was 3.9%, making them an attractive alternative to treasuries from a yield standpoint.
| Q. | How did the Fund’s composition affect performance? |
| A. | Over the course of the fiscal year 2015, stock selection within the Fund played a large role in the Fund’s performance relative to the benchmark, especially for the stocks held in gas utilities and multi-utilities industries which have some exposure to the Energy sector. Stocks the Fund held in the gas utilities industry only returned about 2.5% while the benchmark for this industry had a weighted average return closer to 11.0%. In addition to these industries, under performance came from the Fund’s exposure to the Energy sector directly. While direct holdings in the Energy sector only comprised about 6% of the Fund over the course of the |
| | year, collectively they were the largest detractor from the Fund’s performance relative to the benchmark. |
Stock selection within the electric utilities industry was the biggest contributor to the Fund on a relative basis. The stocks held by the Fund from this industry had an average return of about 12.5% versus only about a 6% return for the industry as a whole. Additionally, the Fund’s low exposure to the independent power producers & energy traders industry, which had a particularly bad year, contributed positively to Fund performance. However, these positive contributions were not enough to offset the negative factors discussed above.
| Q. | What is your investment outlook for the Utilities sector? |
| A. | As of September 30, 2015, according to our valuation methodology, the Utilities sector had a V/P ratio of 1.12 while the average overall market V/P was 1.09. With V/P averages for the largest utilities industries between 1.14 and 1.17, the Fund currently has broad industry representation within the Fund. As always, we look to value as our primary guide and will adjust our positioning as market conditions dictate. |
ICON Utilities Fund
Sector Composition
September 30, 2015
| | | | |
Utilities | | | 86.5% | |
Telecommunication & Utilities | | | 7.4% | |
Energy | | | 2.8% | |
Telecommunication Services | | | 1.8% | |
| | | | |
| | | 98.5% | |
| | | | |
Percentages are based upon common stocks as a percentage of net assets.
ICON Utilities Fund
Industry Composition
September 30, 2015
| | | | |
Electric Utilities | | | 39.7% | |
Multi-Utilities | | | 34.1% | |
Integrated Telecommunication Services | | | 9.2% | |
Gas Utilities | | | 8.4% | |
Oil & Gas Storage & Transportation | | | 2.8% | |
Independent Power Producers & Energy Traders | | | 2.3% | |
Water Utilities | | | 2.0% | |
| | | | |
| | | 98.5% | |
| | | | |
Percentages are based upon common stocks as a percentage of net assets.
ICON Utilities Fund
Average Annual Total Return
as of September 30, 2015
| | | | | | | | | | | | | | | | | | | | | | | | | | | | |
| | | Inception
Date | | | 1 Year | | | 5 Years | | | 10 Years | | | Since Inception | | | Gross Expense Ratio* | | | Net
Expense Ratio* | |
ICON Utilities Fund - Class S | | | 7/9/97 | | | | 4.93% | | | | 9.57% | | | | 6.23% | | | | 7.78% | | | | 1.52% | | | | 1.50% | |
ICON Utilities Fund - Class A | | | 9/30/10 | | | | 4.63% | | | | 9.24% | | | | N/A | | | | 9.24% | | | | 1.81% | | | | 1.75% | |
ICON Utilities Fund - Class A (including maximum sales charge of 5.75%) | | | 9/30/10 | | | | -1.43% | | | | 7.94% | | | | N/A | | | | 7.94% | | | | 1.81% | | | | 1.75% | |
S&P 1500 Utilities Index | | | | | | | 6.47% | | | | 11.31% | | | | 7.04% | | | | 7.82% | | | | N/A | | | | N/A | |
S&P Composite 1500 Index | | | | | | | -0.30% | | | | 13.34% | | | | 6.95% | | | | 6.53% | | | | N/A | | | | N/A | |
Past performance is not a guarantee of future results. Information about these performance results and the comparative indexes can be found in the About This Report section. The Adviser has agreed to limit certain Fund expenses; without these limitations, returns would have been lower. The limitation provisions may be terminated in the future.
| * | Please see the most recent prospectus for details. |
ICON Utilities Fund
Value of a $10,000 Investment
through September 30, 2015
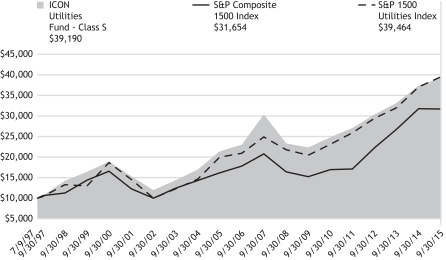
Past performance is not a guarantee of future results. The above graph compares a $10,000 investment made in the Fund’s Class S shares on the Class’ inception date of 7/9/97 to a $10,000 investment made in unmanaged securities indexes on that date. The Fund’s performance in this chart and the performance table assumes the reinvestment of dividends and capital gain distributions but does not reflect the deduction of taxes that a shareholder would pay on Fund distributions or on the redemption of Fund shares.
ICON UTILITIES FUND
SCHEDULEOF INVESTMENTS
SEPTEMBER 30, 2015
| | | | | | | | |
| Shares or Principal Amount | | Value | |
| | | | | | | | |
| | Common Stocks (98.5%) | |
| | Electric Utilities (39.7%) | |
| | 19,900 | | | ALLETE, Inc. | | $ | 1,004,751 | |
| | 13,800 | | | American Electric Power Co., Inc. | | | 784,668 | |
| | 15,700 | | | Duke Energy Corp. | | | 1,129,458 | |
| | 14,800 | | | Edison International | | | 933,436 | |
| | 16,500 | | | Eversource Energy | | | 835,230 | |
| | 18,800 | | | Great Plains Energy, Inc. | | | 507,976 | |
| | 22,800 | | | OGE Energy Corp. | | | 623,808 | |
| | 26,600 | | | Otter Tail Corp. | | | 693,196 | |
| | 6,500 | | | Pinnacle West Capital Corp. | | | 416,910 | |
| | 29,300 | | | UIL Holdings Corp. | | | 1,472,911 | |
| | 37,600 | | | Westar Energy, Inc. | | | 1,445,344 | |
| | | | | | | | |
| | | | 9,847,688 | |
| | Gas Utilities (8.4%) | |
| | 13,200 | | | National Fuel Gas Co. | | | 659,736 | |
| | 32,200 | | | South Jersey Industries, Inc. | | | 813,050 | |
| | 10,500 | | | Southwest Gas Corp. | | | 612,360 | |
| | | | | | | | |
| | | | 2,085,146 | |
| Independent Power Producers & Energy
Traders (2.3%) |
|
| | 57,400 | | | AES Corp. | | | 561,946 | |
| | | | | | | | |
| Integrated Telecommunication
Services (9.2%) |
|
| | 20,400 | | | BCE, Inc. | | | 835,584 | |
| | 47,000 | | | Spark New Zealand, Ltd., ADR | | | 447,440 | |
| | 23,000 | | | Verizon Communications, Inc. | | | 1,000,730 | |
| | | | | | | | |
| | | | 2,283,754 | |
| | Multi-Utilities (34.1%) | |
| | 32,700 | | | Ameren Corp. | | | 1,382,229 | |
| | | | | | | | |
| Shares or Principal Amount | | Value | |
| | 27,100 | | | Black Hills Corp. | | $ | 1,120,314 | |
| | 52,900 | | | CenterPoint Energy, Inc. | | | 954,316 | |
| | 39,776 | | | CMS Energy Corp. | | | 1,404,888 | |
| | 15,100 | | | DTE Energy Co. | | | 1,213,587 | |
| | 47,700 | | | MDU Resources Group, Inc. | | | 820,440 | |
| | 37,000 | | | Public Service Enterprise Group, Inc. | | | 1,559,920 | |
| | | | | | | | |
| | | | | | | 8,455,694 | |
| | Oil & Gas Storage & Transportation (2.8%) | |
| | 8,900 | | | Spectra Energy Corp. | | | 233,803 | |
| | 14,400 | | | TransCanada Corp.(a) | | | 454,752 | |
| | | | | | | | |
| | | | | | | 688,555 | |
| | Water Utilities (2.0%) | |
| | 18,600 | | | Aqua America, Inc. | | | 492,342 | |
| | | | | | | | |
| Total Common Stocks
(Cost $25,250,200) | | | 24,415,125 | |
| | Collateral for Securities on Loan (1.8%) | |
| | 453,600 | | | State Street Navigator Prime Portfolio, 0.20% | | | 453,600 | |
| | | | | | | | |
| Total Collateral for Securities
on Loan
(Cost $453,600) | | | 453,600 | |
| | Short-Term Investments (0.6%) | |
| $ | 149,764 | | | State Street Euro Dollar Time Deposit (USD), 0.01%, 10/01/15 | | | 149,764 | |
| | | | | | | | |
| Total Short-Term Investments
(Cost $149,764) | | | 149,764 | |
| Total Investments 100.9%
(Cost $25,853,564) | | | 25,018,489 | |
| Liabilities Less Other Assets
(0.9)% | | | (232,201 | ) |
| | | | | | | | |
| | Net Assets 100.0% | | $ | 24,786,288 | |
| | | | | | | | |
The accompanying notes are an integral part of the financial statements.
| (a) | All or a portion of the security was on loan as of September 30, 2015. |
| ADR | American Depositary Receipt |
| | |
| 58 | | SCHEDULEOF INVESTMENTS |
(This page is intentionally left blank)
STATEMENTSOF ASSETSAND LIABILITIES
SEPTEMBER 30, 2015
| | | | | | | | | | | | |
| | | ICON
Consumer
Discretionary
Fund | | | ICON
Consumer
Staples
Fund | | | ICON
Energy
Fund | |
Assets | | | | | | | | | | | | |
Investments, at cost | | $ | 54,622,161 | | | $ | 11,123,635 | | | $ | 462,642,302 | |
| | | | | | | | | | | | |
Investments, at value† | | | 52,523,710 | | | | 12,227,081 | | | | 364,419,667 | |
Receivables: | | | | | | | | | | | | |
Fund shares sold | | | 49,689 | | | | 59,965 | | | | 517,923 | |
Dividends | | | 22,371 | | | | 24,207 | | | | 171,955 | |
Expense reimbursements due from Adviser | | | 357 | | | | 13,851 | | | | - | |
Foreign tax reclaims | | | - | | | | - | | | | 14,319 | |
Other assets | | | 20,204 | | | | 8,378 | | | | 114,338 | |
| | | | | | | | | | | | |
Total Assets | | | 52,616,331 | | | | 12,333,482 | | | | 365,238,202 | |
| | | | | | | | | | | | |
Liabilities | | | | | | | | | | | | |
Payables: | | | | | | | | | | | | |
Payable for collateral received on securities loaned | | | 2,880,504 | | | | - | | | | 19,134,404 | |
Investments purchased | | | 1,718,138 | | | | - | | | | - | |
Advisory fees | | | 40,435 | | | | 9,833 | | | | 287,225 | |
Transfer agent fees | | | 17,869 | | | | 9,269 | | | | 190,660 | |
Fund shares redeemed | | | 7,414 | | | | 33,507 | | | | 403,698 | |
Fund accounting fees | | | 2,699 | | | | 668 | | | | 19,401 | |
Trustee fees | | | 2,277 | | | | 628 | | | | 18,062 | |
Administration fees | | | 2,022 | | | | 492 | | | | 14,361 | |
Accrued distribution fees | | | 976 | | | | 1,551 | | | | 11,776 | |
Accrued expenses | | | 31,942 | | | | 24,103 | | | | 112,425 | |
| | | | | | | | | | | | |
Total Liabilities | | | 4,704,276 | | | | 80,051 | | | | 20,192,012 | |
| | | | | | | | | | | | |
Net Assets - all share classes | | $ | 47,912,055 | | | $ | 12,253,431 | | | $ | 345,046,190 | |
| | | | | | | | | | | | |
Net Assets - Class S | | $ | 44,912,675 | | | $ | 8,651,448 | | | $ | 320,485,963 | |
| | | | | | | | | | | | |
Net Assets - Class C | | $ | - | | | $ | - | | | $ | 9,972,319 | |
| | | | | | | | | | | | |
Net Assets - Class A | | $ | 2,999,380 | | | $ | 3,601,983 | | | $ | 14,587,908 | |
| | | | | | | | | | | | |
| | | | | | | | | | | | |
| | | ICON
Consumer
Discretionary
Fund | | | ICON
Consumer
Staples
Fund | | | ICON
Energy
Fund | |
Net Assets Consist of | | | | | | | | | | | | |
Paid-in capital | | $ | 45,543,213 | | | $ | 8,441,345 | | | $ | 547,443,247 | |
Accumulated undistributed net investment income/(loss) | | | - | | | | 749 | | | | 1,363,789 | |
Accumulated undistributed net realized gain/(loss) | | | 4,467,293 | | | | 2,707,891 | | | | (105,538,371 | ) |
Unrealized appreciation/(depreciation) | | | (2,098,451 | ) | | | 1,103,446 | | | | (98,222,475 | ) |
| | | | | | | | | | | | |
Net Assets | | $ | 47,912,055 | | | $ | 12,253,431 | | | $ | 345,046,190 | |
| | | | | | | | | | | | |
Shares outstanding (unlimited shares authorized, no par value) | | | | | | | | | | | | |
Class S | | | 3,146,557 | | | | 940,168 | | | | 28,684,681 | |
Class C | | | - | | | | - | | | | 926,067 | |
Class A | | | 216,170 | | | | 391,942 | | | | 1,312,640 | |
Net asset value (offering and redemption price per share) | | | | | | | | | | | | |
Class S | | $ | 14.27 | | | $ | 9.20 | | | $ | 11.17 | |
Class C | | $ | - | | | $ | - | | | $ | 10.77 | |
Class A | | $ | 13.88 | | | $ | 9.19 | | | $ | 11.11 | |
Class A maximum offering price (100%/(100%-maximum sales charge)) of net asset value adjusted to the nearest cent per share | | $ | 14.73 | | | $ | 9.75 | | | $ | 11.79 | |
| | | |
† Includes securities on loan of | | $ | 2,906,189 | | | $ | - | | | $ | 19,050,378 | |
The accompanying notes are an integral part of the financial statements.
STATEMENTSOF ASSETSAND LIABILITIES
SEPTEMBER 30, 2015
| | | | | | | | | | | | |
| | | ICON
Financial
Fund | | | ICON
Healthcare
Fund | | | ICON
Industrials
Fund | |
Assets | | | | | | | | | | | | |
Investments, at cost | | $ | 57,749,276 | | | $ | 117,643,272 | | | $ | 14,174,964 | |
| | | | | | | | | | | | |
Investments, at value† | | | 53,593,162 | | | | 109,544,778 | | | | 15,304,775 | |
Cash | | | 332,447 | | | | - | | | | - | |
Receivables: | | | | | | | | | | | | |
Fund shares sold | | | 117,337 | | | | 26,917 | | | | 13,523 | |
Dividends | | | 59,434 | | | | 103,994 | | | | 5,556 | |
Expense reimbursements due from Adviser | | | 1,155 | | | | 1,541 | | | | 10,910 | |
Investments sold | | | - | | | | 6,434,970 | | | | - | |
Foreign tax reclaims | | | 189 | | | | 4,433 | | | | - | |
Other assets | | | 15,330 | | | | 32,494 | | | | 9,747 | |
| | | | | | | | | | | | |
Total Assets | | | 54,119,054 | | | | 116,149,127 | | | | 15,344,511 | |
| | | | | | | | | | | | |
Liabilities | | | | | | | | | | | | |
Payables: | | | | | | | | | | | | |
Payable for collateral received on securities loaned | | | 2,940,646 | | | | - | | | | 435,825 | |
Investments purchased | | | - | | | | 339,715 | | | | - | |
Advisory fees | | | 42,947 | | | | 105,834 | | | | 12,696 | |
Transfer agent fees | | | 12,389 | | | | 49,853 | | | | 10,393 | |
Fund shares redeemed | | | 5,847 | | | | 538,602 | | | | 8,022 | |
Fund accounting fees | | | 2,795 | | | | 7,399 | | | | 976 | |
Trustee fees | | | 1,701 | | | | 6,095 | | | | 1,304 | |
Administration fees | | | 2,148 | | | | 5,292 | | | | 635 | |
Accrued distribution fees | | | 782 | | | | 5,069 | | | | 271 | |
Due to custodian bank | | | - | | | | 4,618,341 | | | | - | |
Expense recoupment due to adviser | | | 618 | | | | - | | | | - | |
Accrued expenses | | | 29,124 | | | | 46,709 | | | | 27,337 | |
| | | | | | | | | | | | |
Total Liabilities | | | 3,038,997 | | | | 5,722,909 | | | | 497,459 | |
| | | | | | | | | | | | |
Net Assets - all share classes | | $ | 51,080,057 | | | $ | 110,426,218 | | | $ | 14,847,052 | |
| | | | | | | | | | | | |
Net Assets - Class S | | $ | 49,105,617 | | | $ | 95,109,448 | | | $ | 14,251,111 | |
| | | | | | | | | | | | |
Net Assets - Class A | | $ | 1,974,440 | | | $ | 15,316,770 | | | $ | 595,941 | |
| | | | | | | | | | | | |
| | | | | | | | | | | | |
| | | ICON
Financial
Fund | | | ICON
Healthcare
Fund | | | ICON
Industrials
Fund | |
Net Assets Consist of | | | | | | | | | | | | |
Paid-in capital | | $ | 141,706,322 | | | $ | 97,490,430 | | | $ | 33,173,843 | |
Accumulated undistributed net investment income/(loss) | | | - | | | | - | | | | (2,188 | ) |
Accumulated undistributed net realized gain/(loss) | | | (86,470,055 | ) | | | 21,034,282 | | | | (19,454,414 | ) |
Unrealized appreciation/(depreciation) | | | (4,156,210 | ) | | | (8,098,494 | ) | | | 1,129,811 | |
| | | | | | | | | | | | |
Net Assets | | $ | 51,080,057 | | | $ | 110,426,218 | | | $ | 14,847,052 | |
| | | | | | | | | | | | |
Shares outstanding (unlimited shares authorized, no par value) | | | | | | | | | | | | |
Class S | | | 6,340,785 | | | | 5,334,042 | | | | 1,302,366 | |
Class A | | | 252,618 | | | | 881,995 | | | | 54,883 | |
Net asset value (offering and redemption price per share) | | | | | | | | | | | | |
Class S | | $ | 7.74 | | | $ | 17.83 | | | $ | 10.94 | |
Class A | | $ | 7.82 | | | $ | 17.37 | | | $ | 10.86 | |
Class A maximum offering price (100%/(100%-maximum sales charge)) of net asset value adjusted to the nearest cent per share | | $ | 8.30 | | | $ | 18.43 | | | $ | 11.52 | |
| | | |
† Includes securities on loan of | | $ | 2,895,640 | | | $ | - | | | $ | 428,337 | |
The accompanying notes are an integral part of the financial statements.
STATEMENTSOF ASSETSAND LIABILITIES
SEPTEMBER 30, 2015
| | | | | | | | | | | | |
| | | ICON
Information
Technology
Fund | | | ICON
Materials
Fund | | | ICON
Utilities
Fund | |
Assets | | | | | | | | | | | | |
Investments, at cost | | $ | 37,063,082 | | | $ | 79,839,023 | | | $ | 25,853,564 | |
| | | | | | | | | | | | |
Investments, at value† | | | 48,063,473 | | | | 64,821,388 | | | | 25,018,489 | |
Receivables: | | | | | | | | | | | | |
Fund shares sold | | | 142,193 | | | | 77,811 | | | | 66,325 | |
Dividends | | | 2,470 | | | | 115,145 | | | | 120,210 | |
Expense reimbursements due from Adviser | | | 1,374 | | | | 1,337 | | | | 8,285 | |
Investments sold | | | 2,624,326 | | | | - | | | | 230,427 | |
Foreign tax reclaims | | | - | | | | - | | | | 1,257 | |
Other assets | | | 5,846 | | | | 21,740 | | | | 11,096 | |
| | | | | | | | | | | | |
Total Assets | | | 50,839,682 | | | | 65,037,421 | | | | 25,456,089 | |
| | | | | | | | | | | | |
Liabilities | | | | | | | | | | | | |
Payables: | | | | | | | | | | | | |
Payable for collateral received on securities loaned | | | - | | | | 495,000 | | | | 453,600 | |
Investments purchased | | | 2,103,456 | | | | - | | | | 146,651 | |
Advisory fees | | | 39,439 | | | | 57,327 | | | | 19,597 | |
Transfer agent fees | | | 20,059 | | | | 30,553 | | | | 7,668 | |
Fund shares redeemed | | | 125,478 | | | | 88,456 | | | | 11,145 | |
Fund accounting fees | | | 2,732 | | | | 3,993 | | | | 1,102 | |
Trustee fees | | | 2,177 | | | | 3,456 | | | | 775 | |
Administration fees | | | 1,972 | | | | 2,866 | | | | 980 | |
Accrued distribution fees | | | 959 | | | | 1,427 | | | | 2,586 | |
Expense recoupment due to adviser | | | - | | | | - | | | | 1,411 | |
Accrued expenses | | | 30,909 | | | | 38,022 | | | | 24,286 | |
| | | | | | | | | | | | |
Total Liabilities | | | 2,327,181 | | | | 721,100 | | | | 669,801 | |
| | | | | | | | | | | | |
Net Assets - all share classes | | $ | 48,512,501 | | | $ | 64,316,321 | | | $ | 24,786,288 | |
| | | | | | | | | | | | |
Net Assets - Class S | | $ | 45,342,508 | | | $ | 60,403,602 | | | $ | 19,107,499 | |
| | | | | | | | | | | | |
Net Assets - Class C | | $ | - | | | $ | 834,251 | | | $ | - | |
| | | | | | | | | | | | |
Net Assets - Class A | | $ | 3,169,993 | | | $ | 3,078,468 | | | $ | 5,678,789 | |
| | | | | | | | | | | | |
| | | | | | | | | | | | |
| | | ICON
Information
Technology
Fund | | | ICON
Materials
Fund | | | ICON
Utilities
Fund | |
Net Assets Consist of | | | | | | | | | | | | |
Paid-in capital | | $ | 38,156,532 | | | $ | 75,214,783 | | | $ | 25,760,494 | |
Accumulated undistributed net investment income/(loss) | | | (286,389 | ) | | | 213,172 | | | | 25,158 | |
Accumulated undistributed net realized gain/(loss) | | | (358,033 | ) | | | 3,906,001 | | | | (164,211 | ) |
Unrealized appreciation/(depreciation) | | | 11,000,391 | | | | (15,017,635 | ) | | | (835,153 | ) |
| | | | | | | | | | | | |
Net Assets | | $ | 48,512,501 | | | $ | 64,316,321 | | | $ | 24,786,288 | |
| | | | | | | | | | | | |
Shares outstanding (unlimited shares authorized, no par value) | | | | | | | | | | | | |
Class S | | | 3,032,033 | | | | 5,093,072 | | | | 2,378,043 | |
Class C | | | - | | | | 72,459 | | | | - | |
Class A | | | 216,404 | | | | 262,076 | | | | 717,011 | |
Net asset value (offering and redemption price per share) | | | | | | | | | | | | |
Class S | | $ | 14.95 | | | $ | 11.86 | | | $ | 8.03 | |
Class C | | $ | - | | | $ | 11.51 | | | $ | - | |
Class A | | $ | 14.65 | | | $ | 11.75 | | | $ | 7.92 | |
Class A maximum offering price (100%/(100%-maximum sales charge)) of net asset value adjusted to the nearest cent per share | | $ | 15.54 | | | $ | 12.47 | | | $ | 8.40 | |
| | | |
† Includes securities on loan of | | $ | - | | | $ | 492,250 | | | $ | 454,752 | |
The accompanying notes are an integral part of the financial statements.
STATEMENTSOF OPERATIONS
FORTHEYEARENDED SEPTEMBER 30, 2015
| | | | | | | | | | | | |
| | | ICON
Consumer
Discretionary
Fund | | | ICON
Consumer
Staples
Fund | | | ICON
Energy
Fund | |
Investment Income | | | | | | | | | | | | |
Interest | | $ | 459 | | | $ | 95 | | | $ | 1,270 | |
Dividends | | | 531,852 | | | | 298,475 | | | | 8,769,312 | |
Income from securities lending, net | | | 45,613 | | | | 1,226 | | | | 1,111,806 | |
Foreign taxes withheld | | | (3,689 | ) | | | – | | | | (58,388 | ) |
| | | | | | | | | | | | |
Total Investment Income | | | 574,235 | | | | 299,796 | | | | 9,824,000 | |
| | | | | | | | | | | | |
Expenses | | | | | | | | | | | | |
Advisory fees | | | 579,228 | | | | 158,515 | | | | 4,554,278 | |
Transfer agent fees | | | 101,988 | | | | 46,782 | | | | 986,536 | |
Registration fees: | | | | | | | | | | | | |
Class S | | | 20,405 | | | | 14,928 | | | | 49,612 | |
Class C* | | | 3,694 | | | | 2,593 | | | | 7,422 | |
Class A | | | 5,443 | | | | 4,528 | | | | 4,354 | |
Administration fees | | | 28,961 | | | | 7,926 | | | | 228,127 | |
Audit and tax service expense | | | 27,706 | | | | 26,802 | | | | 44,752 | |
Distribution fees: | | | | | | | | | | | | |
Class C* | | | 5,628 | | | | 16,122 | | | | 131,341 | |
Class A | | | 9,348 | | | | 7,194 | | | | 50,663 | |
Fund accounting fees | | | 13,444 | | | | 3,817 | | | | 108,278 | |
Trustee fees and expenses | | | 7,877 | | | | 2,389 | | | | 65,560 | |
Custody fees | | | 5,653 | | | | 2,174 | | | | 17,103 | |
Insurance expense | | | 4,750 | | | | 4,037 | | | | 79,738 | |
Interest expense | | | 543 | | | | 1,391 | | | | 2,350 | |
Recoupment of previously reimbursed expenses | | | – | | | | – | | | | – | |
Other expenses | | | 41,882 | | | | 19,734 | | | | 308,587 | |
| | | | | | | | | | | | |
Total expenses before expense reimbursement | | | 856,550 | | | | 318,932 | | | | 6,638,701 | |
Expense reimbursement by Adviser due to expense limitation agreement | | | (2,426 | ) | | | (56,452 | ) | | | – | |
| | | | | | | | | | | | |
Net Expenses | | | 854,124 | | | | 262,480 | | | | 6,638,701 | |
| | | | | | | | | | | | |
Net Investment Income/(Loss) | | | (279,889 | ) | | | 37,316 | | | | 3,185,299 | |
| | | | | | | | | | | | |
Net Realized and Unrealized Gain/(Loss) | | | | | | | | | | | | |
Net realized gain/(loss) on: | | | | | | | | | | | | |
Investments | | | 5,384,667 | | | | 2,707,892 | | | | (91,275,818 | ) |
Foreign currency | | | – | | | | – | | | | – | |
Change in unrealized net appreciation/(depreciation) on: | | | | | | | | | | | | |
Investments and foreign currency | | | (1,319,349 | ) | | | (738,309 | ) | | | (125,848,879 | ) |
| | | | | | | | | | | | |
Net realized and unrealized gain/(loss) | | | 4,065,318 | | | | 1,969,583 | | | | (217,124,697 | ) |
| | | | | | | | | | | | |
Net Increase/(Decrease) in Net Assets Resulting From Operations | | $ | 3,785,429 | | | $ | 2,006,899 | | | $ | (213,939,398 | ) |
| | | | | | | | | | | | |
The accompanying notes are an integral part of the financial statements.
| * | Class C shares merged into Class A shares on September 25, 2015, for each fund other than the ICON Energy Fund and ICON Materials Fund. The information presented is for expenses incurred before the merger. |
| | | | | | | | | | | | | | | | | | | | | | |
ICON
Financial
Fund | | | ICON
Healthcare
Fund | | | ICON
Industrials
Fund | | | ICON
Information
Technology
Fund | | | ICON
Materials
Fund | | | ICON
Utilities
Fund | |
| | | | | | | | | | | | | | | | | | | | | | |
| $ | 59,513 | | | $ | 174,389 | | | $ | 319 | | | $ | 37,743 | | | $ | 284 | | | $ | 724 | |
| | 807,965 | | | | 1,241,112 | | | | 511,960 | | | | 411,696 | | | | 1,490,134 | | | | 988,214 | |
| | 30,941 | | | | 4,350 | | | | 1,821 | | | | 5,535 | | | | 2,962 | | | | 6,425 | |
| | (2,074 | ) | | | (6,341 | ) | | | – | | | | – | | | | (9,304 | ) | | | (16,443 | ) |
| | | | | | | | | | | | | | | | | | | | | | |
| | 896,345 | | | | 1,413,510 | | | | 514,100 | | | | 454,974 | | | | 1,484,076 | | | | 978,920 | |
| | | | | | | | | | | | | | | | | | | | | | |
| | | | | | | | | | | | | | | | | | | | | | |
| | 444,486 | | | | 1,548,097 | | | | 321,964 | | | | 554,567 | | | | 875,156 | | | | 202,614 | |
| | 71,483 | | | | 258,005 | | | | 59,604 | | | | 98,432 | | | | 164,826 | | | | 44,987 | |
| | | | | | | | | | | | | | | | | | | | | | |
| | 19,552 | | | | 29,369 | | | | 17,515 | | | | 18,376 | | | | 22,957 | | | | 14,238 | |
| | 1,708 | | | | 4,188 | | | | 2,104 | | | | 2,320 | | | | 4,143 | | | | 4,422 | |
| | 2,948 | | | | 4,907 | | | | 2,900 | | | | 2,270 | | | | 4,432 | | | | 3,627 | |
| | 22,224 | | | | 77,404 | | | | 16,098 | | | | 27,728 | | | | 43,757 | | | | 10,131 | |
| | 26,992 | | | | 30,467 | | | | 27,207 | | | | 27,885 | | | | 28,883 | | | | 26,810 | |
| | | | | | | | | | | | | | | | | | | | | | |
| | 2,205 | | | | 18,492 | | | | 3,054 | | | | 5,570 | | | | 8,050 | | | | 20,654 | |
| | 2,082 | | | | 37,062 | | | | 883 | | | | 2,806 | | | | 12,363 | | | | 7,403 | |
| | 10,318 | | | | 35,943 | | | | 7,453 | | | | 12,996 | | | | 20,476 | | | | 4,808 | |
| | 5,373 | | | | 20,640 | | | | 4,871 | | | | 7,203 | | | | 12,088 | | | | 2,678 | |
| | 4,180 | | | | 7,237 | | | | 2,898 | | | | 3,010 | | | | 4,174 | | | | 4,431 | |
| | 2,041 | | | | 12,975 | | | | 4,092 | | | | 7,357 | | | | 9,672 | | | | 3,691 | |
| | 430 | | | | 4,401 | | | | 191 | | | | 678 | | | | 817 | | | | 598 | |
| | | | | | | | | | | | | | | | | | | | | | |
| | 23,714 | | | | 230 | | | | – | | | | 806 | | | | – | | | | 1,411 | |
| | 33,726 | | | | 83,861 | | | | 30,974 | | | | 40,182 | | | | 63,006 | | | | 18,258 | |
| | | | | | | | | | | | | | | | | | | | | | |
| | | | | | | | | | | | | | | | | | | | | | |
| | 673,462 | | | | 2,173,278 | | | | 501,808 | | | | 812,186 | | | | 1,274,800 | | | | 370,761 | |
| | | | | | | | | | | | | | | | | | | | | | |
| | (5,455 | ) | | | (2,687 | ) | | | (14,732 | ) | | | (3,495 | ) | | | (3,897 | ) | | | (38,184 | ) |
| | | | | | | | | | | | | | | | | | | | | | |
| | 668,007 | | | | 2,170,591 | | | | 487,076 | | | | 808,691 | | | | 1,270,903 | | | | 332,577 | |
| | | | | | | | | | | | | | | | | | | | | | �� |
| | 228,338 | | | | (757,081 | ) | | | 27,024 | | | | (353,717 | ) | | | 213,173 | | | | 646,343 | |
| | | | | | | | | | | | | | | | | | | | | | |
| | | | | | | | | | | | | | | | | | | | | | |
| | | | | | | | | | | | | | | | | | | | | | |
| | 2,241,254 | | | | 24,437,743 | | | | 6,859,443 | | | | 6,605,486 | | | | 13,500,660 | | | | 941,384 | |
| | – | | | | – | | | | – | | | | – | | | | – | | | | (882 | ) |
| | | | | | | | | | | | | | | | | | | | | | |
| | | | | | | | | | | | | | | | | | | | | | |
| | (4,690,498 | ) | | | (16,999,189 | ) | | | (7,128,021 | ) | | | (1,368,701 | ) | | | (32,304,609 | ) | | | (758,094 | ) |
| | | | | | | | | | | | | | | | | | | | | | |
| | (2,449,244 | ) | | | 7,438,554 | | | | (268,578 | ) | | | 5,236,785 | | | | (18,803,949 | ) | | | 182,408 | |
| | | | | | | | | | | | | | | | | | | | | | |
| | | | | | | | | | | | | | | | | | | | | | |
| $ | (2,220,906 | ) | | $ | 6,681,473 | | | $ | (241,554 | ) | | $ | 4,883,068 | | | $ | (18,590,776 | ) | | $ | 828,751 | |
| | | | | | | | | | | | | | | | | | | | | | |
STATEMENTSOF CHANGESIN NET ASSETS
| | | | | | | | | | | | | | | | |
| | | ICON
Consumer Discretionary Fund | | | ICON
Consumer Staples Fund | |
| | | Year Ended
September 30,
2015
| | | Year Ended
September 30,
2014
| | | Year Ended
September 30,
2015
| | | Year Ended
September 30,
2014
| |
Operations | | | | | | | | | | | | | | | | |
Net investment income/(loss) | | $ | (279,889 | ) | | $ | (219,047 | ) | | $ | 37,316 | | | $ | 323,098 | |
Net realized gain/(loss) | | | 5,384,667 | | | | 8,557,188 | | | | 2,707,892 | | | | 4,345,596 | |
Change in net unrealized appreciation/(depreciation) | | | (1,319,349 | ) | | | (6,120,506 | ) | | | (738,309 | ) | | | (319,405 | ) |
| | | | | | | | | | | | | | | | |
Net increase/(decrease) in net assets resulting from operations | | | 3,785,429 | | | | 2,217,635 | | | | 2,006,899 | | | | 4,349,289 | |
| | | | | | | | | | | | | | | | |
Dividends and Distributions to Shareholders | | | | | | | | | | | | | | | | |
Net investment income | | | | | | | | | | | | | | | | |
Class S | | | – | | | | – | | | | (182,080 | ) | | | (90,346 | ) |
Class C* | | | – | | | | – | | | | (27,681 | ) | | | – | |
Class A* | | | – | | | | – | | | | (55,273 | ) | | | (4,612 | ) |
Net realized gains | | | | | | | | | | | | | | | | |
Class S | | | (7,437,716 | ) | | | – | | | | (2,549,485 | ) | | | (3,012,548 | ) |
Class C* | | | (61,165 | ) | | | – | | | | (526,066 | ) | | | (170,527 | ) |
Class A* | | | (598,384 | ) | | | – | | | | (758,214 | ) | | | (227,301 | ) |
| | | | | | | | | | | | | | | | |
Net decrease from dividends and distributions | | | (8,097,265 | ) | | | – | | | | (4,098,799 | ) | | | (3,505,334 | ) |
| | | | | | | | | | | | | | | | |
Fund Share Transactions | | | | | | | | | | | | | | | | |
Shares sold | | | | | | | | | | | | | | | | |
Class S | | | 21,689,352 | | | | 41,907,118 | | | | 9,344,934 | | | | 10,374,445 | |
Class C* | | | 409,813 | | | | 145,190 | | | | 1,255,133 | | | | 509,133 | |
Class A* | | | 3,370,795 | | | | 940,301 | | | | 2,230,956 | | | | 453,023 | |
Reinvested dividends and distributions | | | | | | | | | | | | | | | | |
Class S | | | 7,360,142 | | | | – | | | | 2,554,153 | | | | 3,053,902 | |
Class C* | | | 52,431 | | | | – | | | | 201,008 | | | | 44,192 | |
Class A* | | | 539,623 | | | | – | | | | 688,039 | | | | 194,753 | |
Shares repurchased | | | | | | | | | | | | | | | | |
Class S | | | (35,671,860 | ) | | | (28,297,795 | ) | | | (27,906,883 | ) | | | (22,245,087 | ) |
Class C* | | | (952,038 | ) | | | (106,466 | ) | | | (2,486,008 | ) | | | (839,836 | ) |
Class A* | | | (3,081,029 | ) | | | (3,354,387 | ) | | | (1,473,943 | ) | | | (745,674 | ) |
| | | | | | | | | | | | | | | | |
Net increase/(decrease) from fund share transactions | | | (6,282,771 | ) | | | 11,233,961 | | | | (15,592,611 | ) | | | (9,201,149 | ) |
| | | | | | | | | | | | | | | | |
Total net increase/(decrease) in net assets | | | (10,594,607 | ) | | | 13,451,596 | | | | (17,684,511 | ) | | | (8,357,194 | ) |
Net Assets | | | | | | | | | | | | | | | | |
Beginning of year | | | 58,506,662 | | | | 45,055,066 | | | | 29,937,942 | | | | 38,295,136 | |
| | | | | | | | | | | | | | | | |
End of year | | $ | 47,912,055 | | | $ | 58,506,662 | | | $ | 12,253,431 | | | $ | 29,937,942 | |
| | | | | | | | | | | | | | | | |
| * | Class C shares merged into Class A shares on September 25, 2015, for each fund other than the ICON Energy Fund and ICON Materials Fund. The information presented includes the activity for Class C prior to the merger as well as Class C shares redeemed and Class A shares issued in connection with the merger. |
| ** | The ICON Financial Fund had a distribution in excess of net investment income during the fiscal year ending September 30, 2015. |
| | | | | | | | | | | | | | | | | | | | | | |
ICON
Energy Fund | | | ICON
Financial Fund | | | ICON
Healthcare Fund | |
Year Ended
September 30,
2015
| | | Year Ended
September 30,
2014
| | | Year Ended
September 30,
2015
| | | Year Ended
September 30,
2014
| | | Year Ended
September 30,
2015
| | | Year Ended
September 30,
2014
| |
| | | | | | | | | | | | | | | | | | | | | | |
| $ | 3,185,299 | | | $ | 3,085,543 | | | $ | 228,338 | | | $ | (12,681 | ) | | $ | (757,081 | ) | | $ | (620,050 | ) |
| | (91,275,818 | ) | | | 92,771,342 | | | | 2,241,254 | | | | 1,405,808 | | | | 24,437,743 | | | | 35,568,937 | |
| | | | | | | | | | | | | | | | | | | | | | |
| | (125,848,879 | ) | | | (79,071,399 | ) | | | (4,690,498 | ) | | | (493,598 | ) | | | (16,999,189 | ) | | | (5,261,635 | ) |
| | | | | | | | | | | | | | | | | | | | | | |
| | | | | | | | | | | | | | | | | | | | | | |
| | | | | | | | | | | | | | | | | | | | | | |
| | (213,939,398 | ) | | | 16,785,486 | | | | (2,220,906 | ) | | | 899,529 | | | | 6,681,473 | | | | 29,687,252 | |
| | | | | | | | | | | | | | | | | | | | | | |
| | | | | | | | | | | | | | | | | | | | | | |
| | | | | | | | | | | | | | | | | | | | | | |
| | | | | | | | | | | | | | | | | | | | | | |
| | (2,185,262 | ) | | | (1,893,617 | ) | | | (297,167 | )** | | | (278,278 | ) | | | – | | | | (127,305 | ) |
| | – | | | | – | | | | (1,205 | )** | | | – | | | | – | | | | – | |
| | (46,508 | ) | | | (21,999 | ) | | | (2,530 | )** | | | – | | | | – | | | | (3,215 | ) |
| | | | | | | | | | | | | | | | | | | | | | |
| | (91,546,420 | ) | | | (19,835,437 | ) | | | – | | | | – | | | | (29,325,742 | ) | | | (28,562,135 | ) |
| | (2,566,539 | ) | | | (474,214 | ) | | | – | | | | – | | | | (255,243 | ) | | | (77,969 | ) |
| | (4,344,666 | ) | | | (826,812 | ) | | | – | | | | – | | | | (3,330,588 | ) | | | (1,764,297 | ) |
| | | | | | | | | | | | | | | | | | | | | | |
| | | | | | | | | | | | | | | | | | | | | | |
| | (100,689,395 | ) | | | (23,052,079 | ) | | | (300,902 | ) | | | (278,278 | ) | | | (32,911,573 | ) | | | (30,534,921 | ) |
| | | | | | | | | | | | | | | | | | | | | | |
| | | | | | | | | | | | | | | | | | | | | | |
| | | | | | | | | | | | | | | | | | | | | | |
| | 155,430,206 | | | | 167,382,750 | | | | 33,196,366 | | | | 25,626,071 | | | | 82,146,215 | | | | 103,467,905 | |
| | 6,608,035 | | | | 5,878,324 | | | | 710,046 | | | | 76,434 | | | | 2,116,107 | | | | 472,054 | |
| | 9,095,784 | | | | 10,311,595 | | | | 2,012,530 | | | | 232,046 | | | | 12,844,606 | | | | 17,798,680 | |
| | | | | |
| | | | | | | | | | | | | | | | | | | | | | |
| | 89,035,364 | | | | 20,337,410 | | | | 294,149 | | | | 264,618 | | | | 27,557,080 | | | | 26,680,676 | |
| | 2,100,297 | | | | 353,636 | | | | 1,038 | | | | – | | | | 226,826 | | | | 56,771 | |
| | 3,519,414 | | | | 691,659 | | | | 1,970 | | | | – | | | | 3,195,114 | | | | 1,607,097 | |
| | | | | | | | | | | | | | | | | | | | | | |
| | (246,946,411 | ) | | | (226,299,050 | ) | | | (14,305,860 | ) | | | (5,998,164 | ) | | | (140,472,115 | ) | | | (74,118,289 | ) |
| | (7,362,690 | ) | | | (3,329,355 | ) | | | (716,985 | ) | | | (314,733 | ) | | | (2,684,340 | ) | | | (88,793 | ) |
| | (11,211,290 | ) | | | (10,095,019 | ) | | | (489,118 | ) | | | (695,372 | ) | | | (8,127,702 | ) | | | (11,351,623 | ) |
| | | | | | | | | | | | | | | | | | | | | | |
| | | | | | | | | | | | | | | | | | | | | | |
| | 268,709 | | | | (34,768,050 | ) | | | 20,704,136 | | | | 19,190,900 | | | | (23,198,209 | ) | | | 64,524,478 | |
| | | | | | | | | | | | | | | | | | | | | | |
| | | | | | | | | | | | | | | | | | | | | | |
| | (314,360,084 | ) | | | (41,034,643 | ) | | | 18,182,328 | | | | 19,812,151 | | | | (49,428,309 | ) | | | 63,676,809 | |
| | | | | | | | | | | | | | | | | | | | | | |
| | 659,406,274 | | | | 700,440,917 | | | | 32,897,729 | | | | 13,085,578 | | | | 159,854,527 | | | | 96,177,718 | |
| | | | | | | | | | | | | | | | | | | | | | |
| $ | 345,046,190 | | | $ | 659,406,274 | | | $ | 51,080,057 | | | $ | 32,897,729 | | | $ | 110,426,218 | | | $ | 159,854,527 | |
| | | | | | | | | | | | | | | | | | | | | | |
STATEMENTSOF CHANGESIN NET ASSETS (CONTINUED)
| | | | | | | | | | | | | | | | |
| | | ICON
Consumer Discretionary Fund | | | ICON
Consumer Staples Fund | |
| | | Year Ended
September 30,
2015
| | | Year Ended
September 30,
2014
| | | Year Ended
September 30,
2015
| | | Year Ended
September 30,
2014
| |
Transactions in Fund Shares | | | | | | | | | | | | | | | | |
Shares sold | | | | | | | | | | | | | | | | |
Class S | | | 1,413,797 | | | | 2,651,639 | | | | 914,672 | | | | 915,468 | |
Class C* | | | 29,106 | | | | 9,556 | | | | 124,315 | | | | 45,827 | |
Class A* | | | 218,030 | | | | 61,458 | | | | 234,942 | | | | 39,755 | |
Reinvested dividends and distributions | | | | | | | | | | | | | | | | |
Class S | | | 502,056 | | | | – | | | | 275,267 | | | | 282,148 | |
Class C* | | | 3,777 | | | | – | | | | 22,384 | | | | 4,161 | |
Class A* | | | 37,710 | | | | – | | | | 74,225 | | | | 17,945 | |
Shares repurchased | | | | | | | | | | | | | | | | |
Class S | | | (2,336,434 | ) | | | (1,835,870 | ) | | | (2,476,966 | ) | | | (1,993,855 | ) |
Class C* | | | (69,108 | ) | | | (7,003 | ) | | | (276,761 | ) | | | (77,614 | ) |
Class A* | | | (203,013 | ) | | | (227,736 | ) | | | (153,867 | ) | | | (65,428 | ) |
| | | | | | | | | | | | | | | | |
Net increase/(decrease) | | | (404,079 | ) | | | 652,044 | | | | (1,261,789 | ) | | | (831,593 | ) |
| | | | | | | | | | | | | | | | |
Shares outstanding, beginning of year | | | 3,766,806 | | | | 3,114,762 | | | | 2,593,899 | | | | 3,425,492 | |
| | | | | | | | | | | | | | | | |
Shares outstanding, end of year | | | 3,362,727 | | | | 3,766,806 | | | | 1,332,110 | | | | 2,593,899 | |
| | | | | | | | | | | | | | | | |
Accumulated undistributed net investment income/(loss) | | $ | – | | | $ | – | | | $ | 749 | | | $ | 228,467 | |
| | | | | | | | | | | | | | | | |
| * | Class C shares merged into Class A shares on September 25, 2015, for each fund other than the ICON Energy Fund and ICON Materials Fund. The information presented includes the activity for Class C prior to the merger as well as Class C shares redeemed and Class A shares issued in connection with the merger. |
The accompanying notes are an integral part of the financial statements.
| | | | | | | | | | | | | | | | | | | | | | |
ICON
Energy Fund | | | ICON
Financial Fund | | | ICON
Healthcare Fund | |
Year Ended
September 30,
2015
| | | Year Ended
September 30,
2014
| | | Year Ended
September 30,
2015
| | | Year Ended
September 30,
2014
| | | Year Ended
September 30,
2015
| | | Year Ended
September 30,
2014
| |
| | | | | | | | | | | | | | | | | | | | | | |
| | | | | | | | | | | | | | | | | | | | | | |
| | 11,026,018 | | | | 7,232,880 | | | | 3,898,005 | | | | 3,271,278 | | | | 3,948,413 | | | | 4,720,711 | |
| | 467,829 | | | | 259,250 | | | | 83,078 | | | | 9,829 | | | | 110,698 | | | | 22,892 | |
| | 602,723 | | | | 444,640 | | | | 244,185 | | | | 29,716 | | | | 646,369 | | | | 782,634 | |
| | | | | | | | | | | | | | | | | | | | | | |
| | | | | | | | | | | | | | | | | | | | | | |
| | 6,310,086 | | | | 893,167 | | | | 37,808 | | | | 34,681 | | | | 1,445,049 | | | | 1,412,423 | |
| | 153,195 | | | | 15,794 | | | | 135 | | | | – | | | | 12,714 | | | | 3,126 | |
| | 250,314 | | | | 30,456 | | | | 251 | | | | – | | | | 171,688 | | | | 86,357 | |
| | | | | | | | | | | | | | | | | | | | | | |
| | (16,249,675 | ) | | | (9,726,177 | ) | | | (1,717,118 | ) | | | (771,690 | ) | | | (6,673,617 | ) | | | (3,675,631 | ) |
| | (484,637 | ) | | | (146,695 | ) | | | (92,318 | ) | | | (41,878 | ) | | | (156,937 | ) | | | (4,505 | ) |
| | (743,141 | ) | | | (435,607 | ) | | | (60,426 | ) | | | (88,044 | ) | | | (430,358 | ) | | | (545,685 | ) |
| | | | | | | | | | | | | | | | | | | | | | |
| | 1,332,712 | | | | (1,432,292 | ) | | | 2,393,600 | | | | 2,443,892 | | | | (925,981 | ) | | | 2,802,322 | |
| | | | | | | | | | | | | | | | | | | | | | |
| | | | | | | | | | | | | | | | | | | | | | |
| | 29,590,676 | | | | 31,022,968 | | | | 4,199,803 | | | | 1,755,911 | | | | 7,142,018 | | | | 4,339,696 | |
| | | | | | | | | | | | | | | | | | | | | | |
| | | | | | | | | | | | | | | | | | | | | | |
| | 30,923,388 | | | | 29,590,676 | | | | 6,593,403 | | | | 4,199,803 | | | | 6,216,037 | | | | 7,142,018 | |
| | | | | | | | | | | | | | | | | | | | | | |
| | | | | | | | | | | | | | | | | | | | | | |
| | | | | | | | | | | | | | | | | | | | | | |
| $ | 1,363,789 | | | $ | 2,197,918 | | | $ | – | | | $ | (14,823 | ) | | $ | – | | | $ | – | |
| | | | | | | | | | | | | | | | | | | | | | |
STATEMENTSOF CHANGESIN NET ASSETS (CONTINUED)
| | | | | | | | | | | | | | | | |
| | | ICON
Industrials Fund | | | ICON
Information Technology Fund | |
| | | Year Ended
September 30,
2015
| | | Year Ended
September 30,
2014
| | | Year Ended
September 30,
2015
| | | Year Ended
September 30,
2014
| |
Operations | | | | | | | | | | | | | | | | |
Net investment income/(loss) | | $ | 27,024 | | | $ | 22,895 | | | $ | (353,717 | ) | | $ | (375,221 | ) |
Net realized gain/(loss) | | | 6,859,443 | | | | 4,402,315 | | | | 6,605,486 | | | | 17,646,371 | |
Change in net unrealized appreciation/(depreciation) | | | (7,128,021 | ) | | | (368,853 | ) | | | (1,368,701 | ) | | | (6,490,713 | ) |
| | | | | | | | | | | | | | | | |
Net increase/(decrease) in net assets resulting from operations | | | (241,554 | ) | | | 4,056,357 | | | | 4,883,068 | | | | 10,780,437 | |
| | | | | | | | | | | | | | | | |
Dividends and Distributions to Shareholders | | | | | | | | | | | | | | | | |
Net investment income | | | | | | | | | | | | | | | | |
Class S | | | (26,242 | ) | | | (197,919 | ) | | | – | | | | – | |
Class C* | | | – | | | | (974 | ) | | | – | | | | – | |
Class A* | | | – | | | | – | | | | – | | | | – | |
Net realized gains | | | | | | | | | | | | | | | | |
| | | | | | | | | | | | | | | | |
Net decrease from dividends and distributions | | | (26,242 | ) | | | (198,893 | ) | | | – | | | | – | |
| | | | | | | | | | | | | | | | |
Fund Share Transactions | | | | | | | | | | | | | | | | |
Shares sold | | | | | | | | | | | | | | | | |
Class S | | | 7,116,799 | | | | 11,135,221 | | | | 21,010,894 | | | | 8,709,140 | |
Class C* | | | 136,307 | | | | 221,178 | | | | 499,734 | | | | 92,744 | |
Class A* | | | 520,264 | | | | 212,076 | | | | 4,813,274 | | | | 248,732 | |
Reinvested dividends and distributions | | | | | | | | | | | | | | | | |
Class S | | | 25,951 | | | | 194,267 | | | | – | | | | – | |
Class C* | | | – | | | | 803 | | | | – | | | | – | |
Class A* | | | – | | | | – | | | | – | | | | – | |
Shares repurchased | | | | | | | | | | | | | | | | |
Class S | | | (28,551,022 | ) | | | (13,559,727 | ) | | | (30,795,176 | ) | | | (42,697,099 | ) |
Class C* | | | (389,916 | ) | | | (43,871 | ) | | | (929,352 | ) | | | (63,858 | ) |
Class A* | | | (199,180 | ) | | | (4,380,352 | ) | | | (2,189,088 | ) | | | (2,347,174 | ) |
| | | | | | | | | | | | | | | | |
Net increase/(decrease) from fund share transactions | | | (21,340,797 | ) | | | (6,220,405 | ) | | | (7,589,714 | ) | | | (36,057,515 | ) |
| | | | | | | | | | | | | | | | |
Total net increase/(decrease) in net assets | | | (21,608,593 | ) | | | (2,362,941 | ) | | | (2,706,646 | ) | | | (25,277,078 | ) |
Net Assets | | | | | | | | | | | | | | | | |
Beginning of year | | | 36,455,645 | | | | 38,818,586 | | | | 51,219,147 | | | | 76,496,225 | |
| | | | | | | | | | | | | | | | |
End of year | | $ | 14,847,052 | | | $ | 36,455,645 | | | $ | 48,512,501 | | | $ | 51,219,147 | |
| | | | | | | | | | | | | | | | |
| * | Class C shares merged into Class A shares on September 25, 2015, for each fund other than the ICON Energy Fund and ICON Materials Fund. The information presented includes the activity for Class C prior to the merger as well as Class C shares redeemed and Class A shares issued in connection with the merger. |
| | | | | | | | | | | | | | |
ICON
Materials Fund | | | ICON
Utilities Fund | |
Year Ended
September 30,
2015
| | | Year Ended
September 30,
2014
| | | Year Ended
September 30,
2015
| | | Year Ended
September 30,
2014
| |
| | | | | | | | | | | | | | |
| $ | 213,173 | | | $ | 208,264 | | | $ | 646,343 | | | $ | 932,643 | |
| | 13,500,660 | | | | 5,734,068 | | | | 940,502 | | | | 3,460,870 | |
| | | | | | | | | | | | | | |
| | (32,304,609 | ) | | | 3,387,627 | | | | (758,094 | ) | | | (41,712 | ) |
| | | | | | | | | | | | | | |
| | | | | | | | | | | | | | |
| | | | | | | | | | | | | | |
| | (18,590,776 | ) | | | 9,329,959 | | | | 828,751 | | | | 4,351,801 | |
| | | | | | | | | | | | | | |
| | | | | | | | | | | | | | |
| | | | | | | | | | | | | | |
| | | | | | | | | | | | | | |
| | (208,262 | ) | | | (335,560 | ) | | | (485,422 | ) | | | (783,820 | ) |
| | – | | | | – | | | | (44,880 | ) | | | (49,984 | ) |
| | – | | | | (12,325 | ) | | | (92,640 | ) | | | (65,419 | ) |
| | | | | | | | | | | | | | |
| | | | | | | | | | | | | | |
| | | | | | | | | | | | | | |
| | (208,262 | ) | | | (347,885 | ) | | | (622,942 | ) | | | (899,223 | ) |
| | | | | | | | | | | | | | |
| | | | | | | | | | | | | | |
| | | | | | | | | | | | | | |
| | 21,981,237 | | | | 43,480,999 | | | | 12,850,414 | | | | 3,908,224 | |
| | 609,433 | | | | 465,892 | | | | 1,076,770 | | | | 105,014 | |
| | 1,846,097 | | | | 6,611,987 | | | | 4,507,405 | | | | 1,191,616 | |
| | | | | | | | | | | | | | |
| | | | | | | | | | | | | | |
| | 200,552 | | | | 301,996 | | | | 455,862 | | | | 748,212 | |
| | – | | | | – | | | | 7,444 | | | | 11,949 | |
| | – | | | | 11,008 | | | | 80,869 | | | | 52,883 | |
| | | | | | | | | | | | | | |
| | (37,934,905 | ) | | | (24,468,828 | ) | | | (12,269,919 | ) | | | (18,863,423 | ) |
| | (216,420 | ) | | | (48,417 | ) | | | (3,353,179 | ) | | | (957,637 | ) |
| | (5,884,751 | ) | | | (705,580 | ) | | | (1,458,476 | ) | | | (1,319,199 | ) |
| | | | | | | | | | | | | | |
| | | | | | | | | | | | | | |
| | (19,398,757 | ) | | | 25,649,057 | | | | 1,897,190 | | | | (15,122,361 | ) |
| | | | | | | | | | | | | | |
| | | | | | | | | | | | | | |
| | (38,197,795 | ) | | | 34,631,131 | | | | 2,102,999 | | | | (11,669,783 | ) |
| | | | | | | | | | | | | | |
| | 102,514,116 | | | | 67,882,985 | | | | 22,683,289 | | | | 34,353,072 | |
| | | | | | | | | | | | | | |
| $ | 64,316,321 | | | $ | 102,514,116 | | | $ | 24,786,288 | | | $ | 22,683,289 | |
| | | | | | | | | | | | | | |
STATEMENTSOF CHANGESIN NET ASSETS (CONTINUED)
| | | | | | | | | | | | | | | | |
| | | ICON
Industrials Fund | | | ICON
Information Technology Fund | |
| | | Year Ended
September 30,
2015
| | | Year Ended
September 30,
2014
| | | Year Ended
September 30,
2015
| | | Year Ended
September 30,
2014
| |
Transactions in Fund Shares | | | | | | | | | | | | | | | | |
Shares sold | | | | | | | | | | | | | | | | |
Class S | | | 581,655 | | | | 968,544 | | | | 1,431,875 | | | | 675,116 | |
Class C* | | | 11,363 | | | | 19,526 | | | | 34,317 | | | | 7,757 | |
Class A* | | | 45,927 | | | | 17,942 | | | | 324,948 | | | | 19,562 | |
Reinvested dividends and distributions | | | | | | | | | | | | | | | | |
Class S | | | 2,223 | | | | 17,330 | | | | – | | | | – | |
Class C* | | | – | | | | 73 | | | | – | | | | – | |
Class A* | | | – | | | | – | | | | – | | | | – | |
Shares repurchased | | | | | | | | | | | | | | | | |
Class S | | | (2,357,106 | ) | | | (1,168,317 | ) | | | (2,116,872 | ) | | | (3,413,938 | ) |
Class C* | | | (35,500 | ) | | | (3,813 | ) | | | (65,286 | ) | | | (5,246 | ) |
Class A* | | | (16,775 | ) | | | (405,848 | ) | | | (142,668 | ) | | | (191,533 | ) |
| | | | | | | | | | | | | | | | |
Net increase/(decrease) | | | (1,768,213 | ) | | | (554,563 | ) | | | (533,686 | ) | | | (2,908,282 | ) |
| | | | | | | | | | | | | | | | |
Shares outstanding, beginning of year | | | 3,125,462 | | | | 3,680,025 | | | | 3,782,123 | | | | 6,690,405 | |
| | | | | | | | | | | | | | | | |
Shares outstanding, end of year | | | 1,357,249 | | | | 3,125,462 | | | | 3,248,437 | | | | 3,782,123 | |
| | | | | | | | | | | | | | | | |
Accumulated undistributed net investment income/(loss) | | $ | (2,188 | ) | | $ | 16,629 | | | $ | (286,389 | ) | | $ | (288,745 | ) |
| | | | | | | | | | | | | | | | |
| * | Class C shares merged into Class A shares on September 25, 2015, for each fund other than the ICON Energy Fund and ICON Materials Fund. The information presented includes the activity for Class C prior to the merger as well as Class C shares redeemed and Class A shares issued in connection with the merger. |
The accompanying notes are an integral part of the financial statements.
| | | | | | | | | | | | | | |
ICON
Materials Fund | | | ICON
Utilities Fund | |
Year Ended
September 30,
2015
| | | Year Ended
September 30,
2014
| | | Year Ended
September 30,
2015
| | | Year Ended
September 30,
2014
| |
| | | | | | | | | | | | | | |
| | | | | | | | | | | | | | |
| | 1,483,591 | | | | 2,950,323 | | | | 1,524,522 | | | | 507,380 | |
| | 41,945 | | | | 32,505 | | | | 132,246 | | | | 13,552 | |
| | 125,254 | | | | 455,567 | | | | 563,149 | | | | 152,325 | |
| | | | | | | | | | | | | | |
| | | | | | | | | | | | | | |
| | 13,699 | | | | 21,282 | | | | 55,665 | | | | 94,392 | |
| | – | | | | – | | | | 929 | | | | 1,526 | |
| | – | | | | 780 | | | | 9,994 | | | | 6,726 | |
| | | | | | | | | | | | | | |
| | (2,608,199 | ) | | | (1,667,011 | ) | | | (1,469,244 | ) | | | (2,368,098 | ) |
| | (15,147 | ) | | | (3,294 | ) | | | (421,473 | ) | | | (124,852 | ) |
| | (413,339 | ) | | | (47,170 | ) | | | (178,414 | ) | | | (173,414 | ) |
| | | | | | | | | | | | | | |
| | (1,372,196 | ) | | | 1,742,982 | | | | 217,374 | | | | (1,890,463 | ) |
| | | | | | | | | | | | | | |
| | | | | | | | | | | | | | |
| | 6,799,803 | | | | 5,056,821 | | | | 2,877,680 | | | | 4,768,143 | |
| | | | | | | | | | | | | | |
| | | | | | | | | | | | | | |
| | 5,427,607 | | | | 6,799,803 | | | | 3,095,054 | | | | 2,877,680 | |
| | | | | | | | | | | | | | |
| | | | | | | | | | | | | | |
| | | | | | | | | | | | | | |
| $ | 213,172 | | | $ | 208,261 | | | $ | 25,158 | | | $ | 36,466 | |
| | | | | | | | | | | | | | |
FINANCIAL HIGHLIGHTS
| | | | | | | | | | | | | | | | | | | | | | | | |
| | | | | | Income/(loss) from investment operations | | | Less dividends and | |
| | | Net asset
value,
beginning
of period | | | Net
investment
income/
(loss)(x) | | | Net realized
and unrealized
gains/(losses)
on investments | | | Total from
investment
operations | | | Dividends
from net
investment
income | | | Distributions
from net
realized
gains | |
ICON Consumer Discretionary Fund | | | | | | | | | | | | | | | | | | | | | | | | |
Class S | | | | | | | | | | | | | | | | | | | | | | | | |
Year ended September 30, 2015 | | $ | 15.55 | | | $ | (0.07 | ) | | $ | 1.03 | | | $ | 0.96 | | | $ | – | | | $ | (2.24 | ) |
Year ended September 30, 2014 | | | 14.50 | | | | (0.07 | ) | | | 1.12 | | | | 1.05 | | | | – | | | | – | |
Year ended September 30, 2013 | | | 11.82 | | | | (0.03 | ) | | | 2.73 | | | | 2.70 | | | | (0.02 | ) | | | – | |
Year ended September 30, 2012 | | | 8.79 | | | | 0.03 | | | | 3.00 | | | | 3.03 | | | | – | | | | – | |
Year ended September 30, 2011 | | | 7.92 | | | | (0.02 | ) | | | 0.89 | | | | 0.87 | | | | – | | | | – | |
Class A** | | | | | | | | | | | | | | | | | | | | | | | | |
Year ended September 30, 2015 | | | 15.24 | | | | (0.14 | ) | | | 1.02 | | | | 0.88 | | | | – | | | | (2.24 | ) |
Year ended September 30, 2014 | | | 14.25 | | | | (0.12 | ) | | | 1.11 | | | | 0.99 | | | | – | | | | – | |
Year ended September 30, 2013 | | | 11.65 | | | | (0.09 | ) | | | 2.69 | | | | 2.60 | | | | – | | | | – | |
Year ended September 30, 2012 | | | 8.75 | | | | (0.02 | ) | | | 2.92 | | | | 2.90 | | | | – | | | | – | |
Year ended September 30, 2011 | | | 7.92 | | | | (0.06 | ) | | | 0.89 | | | | 0.83 | | | | – | | | | – | |
ICON Consumer Staples Fund | | | | | | | | | | | | | | | | | | | | | | | | |
Class S | | | | | | | | | | | | | | | | | | | | | | | | |
Year ended September 30, 2015 | | | 11.55 | | | | 0.04 | | | | 0.98 | | | | 1.02 | | | | (0.22 | ) | | | (3.15 | ) |
Year ended September 30, 2014 | | | 11.18 | | | | 0.11 | | | | 1.31 | | | | 1.42 | | | | (0.03 | ) | | | (1.02 | ) |
Year ended September 30, 2013 | | | 10.20 | | | | 0.21 | | | | 0.98 | | | | 1.19 | | | | (0.21 | ) | | | – | |
Year ended September 30, 2012 | | | 8.61 | | | | 0.14 | | | | 1.69 | | | | 1.83 | | | | (0.24 | ) | | | – | |
Year ended September 30, 2011 | | | 8.08 | | | | 0.10 | | | | 0.52 | | | | 0.62 | | | | (0.09 | ) | | | – | |
Class A** | | | | | | | | | | | | | | | | | | | | | | | | |
Year ended September 30, 2015 | | | 11.58 | | | | 0.02 | | | | 0.97 | | | | 0.99 | | | | (0.23 | ) | | | (3.15 | ) |
Year ended September 30, 2014 | | | 11.23 | | | | 0.07 | | | | 1.32 | | | | 1.39 | | | | (0.02 | ) | | | (1.02 | ) |
Year ended September 30, 2013 | | | 10.24 | | | | 0.14 | | | | 1.03 | | | | 1.17 | | | | (0.18 | ) | | | – | |
Year ended September 30, 2012 | | | 8.68 | | | | 0.11 | | | | 1.68 | | | | 1.79 | | | | (0.23 | ) | | | – | |
Year ended September 30, 2011 | | | 8.08 | | | | 0.11 | | | | 0.58 | | | | 0.69 | | | | (0.09 | ) | | | – | |
| | | | | | | | | | | | | | | | | | | | | | | | | | | | | | | | | | |
| distributions | | | | | | | | | | | | Ratio of expenses
to average net assets | | | Ratio of net investment
income/(loss)
to average net assets | | | | |
Total
dividends
and
distributions | | | Net asset
value, end
of period | | | Total
return* | | | Net assets,
end of
period (in
thousands) | | | Before
expense
limitation/
recoupment
and transfer
agent
earnings
credits | | | After
expense
limitation/
recoupment
and transfer
agent
earnings
credits | | | Before
expense
limitation/
recoupment
and transfer
agent
earnings
credits | | | After
expense
limitation/
recoupment
and transfer
agent
earnings
credits | | | Portfolio
turnover
rate(a) | |
| | | | | | | | | | | | | | | | | | | | | | | | | | | | | | | | | | |
| | | | | | | | | | | | | | | | | | | | | | | | | | | | | | | | | | |
| $ | (2.24 | ) | | $ | 14.27 | | | | 5.80 | % | | $ | 44,913 | | | | 1.43 | % | | | 1.43 | %(b) | | | (0.44 | )% | | | (0.44 | )% | | | 200.66 | % |
| | – | | | | 15.55 | | | | 7.24 | % | | | 55,476 | | | | 1.46 | % | | | 1.46 | %(b) | | | (0.47 | )% | | | (0.47 | )% | | | 202.10 | % |
| | (0.02 | ) | | | 14.50 | | | | 22.91 | % | | | 39,883 | | | | 1.38 | % | | | 1.38 | %(b) | | | (0.21 | )% | | | (0.21 | )% | | | 87.00 | % |
| | – | | | | 11.82 | | | | 34.47 | % | | | 58,314 | | | | 1.40 | % | | | 1.40 | %(b) | | | 0.26 | % | | | 0.26 | % | | | 91.24 | % |
| | – | | | | 8.79 | | | | 10.98 | % | | | 34,123 | | | | 1.54 | % | | | 1.54 | %(b) | | | (0.23 | )% | | | (0.23 | )% | | | 107.57 | % |
| | | | | | | | | | | | | | | | | | | | | | | | | | | | | | | | | | |
| | (2.24 | ) | | | 13.88 | | | | 5.34 | % | | | 2,999 | | | | 1.91 | % | | | 1.91 | %(b) | | | (0.97 | )% | | | (0.97 | )% | | | 200.66 | % |
| | – | | | | 15.24 | | | | 6.95 | % | | | 2,492 | | | | 1.76 | % | | | 1.76 | %(b) | | | (0.80 | )% | | | (0.80 | )% | | | 202.10 | % |
| | – | | | | 14.25 | | | | 22.42 | % | | | 4,699 | | | | 1.78 | % | | | 1.78 | %(b) | | | (0.66 | )% | | | (0.66 | )% | | | 87.00 | % |
| | – | | | | 11.65 | | | | 33.03 | % | | | 1,542 | | | | 1.78 | % | | | 1.78 | %(b) | | | (0.20 | )% | | | (0.20 | )% | | | 91.24 | % |
| | – | | | | 8.75 | | | | 10.48 | % | | | 11 | | | | 18.49 | % | | | 1.98 | %(b) | | | (17.17 | )% | | | (0.66 | )% | | | 107.57 | % |
| | | | | | | | | | | | | | | | | | | | | | | | | | | | | | | | | | |
| | | | | | | | | | | | | | | | | | | | | | | | | | | | | | | | | | |
| | (3.37 | ) | | | 9.20 | | | | 8.66 | % | | | 8,651 | | | | 1.87 | % | | | 1.51 | %(b) | | | (0.01 | )% | | | 0.35 | % | | | 16.07 | % |
| | (1.05 | ) | | | 11.55 | | | | 13.32 | % | | | 25,731 | | | | 1.45 | % | | | 1.45 | %(b) | | | 0.94 | % | | | 0.94 | % | | | 52.38 | % |
| | (0.21 | ) | | | 11.18 | | | | 11.75 | % | | | 33,813 | | | | 1.51 | % | | | 1.51 | %(b) | | | 1.92 | % | | | 1.92 | % | | | 90.51 | % |
| | (0.24 | ) | | | 10.20 | | | | 21.50 | % | | | 37,567 | | | | 1.55 | % | | | 1.51 | %(b) | | | 1.40 | % | | | 1.44 | % | | | 81.81 | % |
| | (0.09 | ) | | | 8.61 | | | | 7.64 | % | | | 20,614 | | | | 1.57 | % | | | 1.50 | %(b) | | | 1.03 | % | | | 1.10 | % | | | 109.56 | % |
| | | | | | | | | | | | | | | | | | | | | | | | | | | | | | | | | | |
| | (3.38 | ) | | | 9.19 | | | | 8.32 | % | | | 3,602 | | | | 2.12 | % | | | 1.76 | %(b) | | | (0.15 | )% | | | 0.21 | % | | | 16.07 | % |
| | (1.04 | ) | | | 11.58 | | | | 12.99 | % | | | 2,740 | | | | 2.04 | % | | | 1.75 | %(b) | | | 0.35 | % | | | 0.64 | % | | | 52.38 | % |
| | (0.18 | ) | | | 11.23 | | | | 11.52 | % | | | 2,744 | | | | 1.84 | % | | | 1.75 | %(b) | | | 1.20 | % | | | 1.29 | % | | | 90.51 | % |
| | (0.23 | ) | | | 10.24 | | | | 20.94 | % | | | 1,499 | | | | 2.05 | % | | | 1.77 | %(b) | | | 0.82 | % | | | 1.10 | % | | | 81.81 | % |
| | (0.09 | ) | | | 8.68 | | | | 8.52 | % | | | 24 | | | | 7.60 | % | | | 1.75 | %(b) | | | (4.60 | )% | | | 1.25 | % | | | 109.56 | % |
FINANCIAL HIGHLIGHTS (CONTINUED)
| | | | | | | | | | | | | | | | | | | | | | | | |
| | | | | | Income/(loss) from investment operations | | | Less dividends and | |
| | | Net asset
value,
beginning
of period | | | Net
investment
income/
(loss)(x) | | | Net realized
and unrealized
gains/(losses)
on investments | | | Total from
investment
operations | | | Dividends
from net
investment
income | | | Distributions
from net
realized
gains | |
ICON Energy Fund | | | | | | | | | | | | | | | | | | | | | | | | |
Class S | | | | | | | | | | | | | | | | | | | | | | | | |
Year ended September 30, 2015 | | $ | 22.30 | | | $ | 0.11 | | | $ | (7.42 | ) | | $ | (7.31 | ) | | $ | (0.09 | ) | | $ | (3.73 | ) |
Year ended September 30, 2014 | | | 22.59 | | | | 0.11 | | | | 0.33 | | | | 0.44 | | | | (0.06 | ) | | | (0.67 | ) |
Year ended September 30, 2013 | | | 19.18 | | | | 0.18 | | | | 3.51 | | | | 3.69 | | | | (0.28 | ) | | | – | |
Year ended September 30, 2012 | | | 16.64 | | | | 0.16 | | | | 2.93 | | | | 3.09 | | | | (0.15 | ) | | | (0.40 | ) |
Year ended September 30, 2011 | | | 16.69 | | | | 0.16 | | | | – | | | | 0.16 | | | | (0.21 | ) | | | – | |
Class C | | | | | | | | | | | | | | | | | | | | | | | | |
Year ended September 30, 2015 | | | 21.74 | | | | (0.04 | ) | | | (7.20 | ) | | | (7.24 | ) | | | – | | | | (3.73 | ) |
Year ended September 30, 2014 | | | 22.21 | | | | (0.15 | ) | | | 0.35 | | | | 0.20 | | | | – | | | | (0.67 | ) |
Year ended September 30, 2013 | | | 18.87 | | | | (0.05 | ) | | | 3.48 | | | | 3.43 | | | | (0.09 | ) | | | – | |
Year ended September 30, 2012 | | | 16.47 | | | | (0.04 | ) | | | 2.88 | | | | 2.84 | | | | (0.04 | ) | | | (0.40 | ) |
Year ended September 30, 2011 | | | 16.69 | | | | (0.10 | ) | | | 0.09 | | | | (0.01 | ) | | | (0.21 | ) | | | – | |
Class A | | | | | | | | | | | | | | | | | | | | | | | | |
Year ended September 30, 2015 | | | 22.20 | | | | 0.07 | | | | (7.39 | ) | | | (7.32 | ) | | | (0.04 | ) | | | (3.73 | ) |
Year ended September 30, 2014 | | | 22.50 | | | | 0.04 | | | | 0.35 | | | | 0.39 | | | | (0.02 | ) | | | (0.67 | ) |
Year ended September 30, 2013 | | | 19.12 | | | | 0.11 | | | | 3.51 | | | | 3.62 | | | | (0.24 | ) | | | – | |
Year ended September 30, 2012 | | | 16.59 | | | | 0.11 | | | | 2.91 | | | | 3.02 | | | | (0.09 | ) | | | (0.40 | ) |
Year ended September 30, 2011 | | | 16.69 | | | | 0.08 | | | | 0.03 | | | | 0.11 | | | | (0.21 | ) | | | – | |
ICON Financial Fund | | | | | | | | | | | | | | | | | | | | | | | | |
Class S | | | | | | | | | | | | | | | | | | | | | | | | |
Year ended September 30, 2015 | | | 7.83 | | | | 0.04 | | | | (0.08 | ) | | | (0.04 | ) | | | (0.05 | ) | | | – | |
Year ended September 30, 2014 | | | 7.47 | | | | – | (c) | | | 0.54 | | | | 0.54 | | | | (0.18 | ) | | | – | |
Year ended September��30, 2013 | | | 6.04 | | | | 0.04 | | | | 1.44 | | | | 1.48 | | | | (0.05 | ) | | | – | |
Year ended September 30, 2012 | | | 4.69 | | | | 0.04 | | | | 1.34 | | | | 1.38 | | | | (0.03 | ) | | | – | |
Year ended September 30, 2011 | | | 5.55 | | | | 0.03 | | | | (0.87 | ) | | | (0.84 | ) | | | (0.02 | ) | | | – | |
Class A** | | | | | | | | | | | | | | | | | | | | | | | | |
Year ended September 30, 2015 | | | 7.89 | | | | 0.02 | | | | (0.07 | ) | | | (0.05 | ) | | | (0.02 | ) | | | – | |
Year ended September 30, 2014 | | | 7.37 | | | | (0.02 | ) | | | 0.54 | | | | 0.52 | | | | – | | | | – | |
Year ended September 30, 2013 | | | 5.99 | | | | 0.06 | | | | 1.38 | | | | 1.44 | | | | (0.06 | ) | | | – | |
Year ended September 30, 2012 | | | 4.68 | | | | 0.01 | | | | 1.33 | | | | 1.34 | | | | (0.03 | ) | | | – | |
Year ended September 30, 2011 | | | 5.55 | | | | 0.01 | | | | (0.86 | ) | | | (0.85 | ) | | | (0.02 | ) | | | – | |
| | | | | | | | | | | | | | | | | | | | | | | | | | | | | | | | | | |
| distributions | | | | | | | | | | | | Ratio of expenses
to average net assets | | | Ratio of net investment
income/(loss)
to average net assets | | | | |
Total
dividends
and
distributions | | | Net asset
value, end
of period | | | Total
return* | | | Net assets,
end of
period (in
thousands) | | | Before
expense
limitation/
recoupment
and transfer
agent
earnings
credits | | | After
expense
limitation/
recoupment
and transfer
agent
earnings
credits | | | Before
expense
limitation/
recoupment
and transfer
agent
earnings
credits | | | After
expense
limitation/
recoupment
and transfer
agent
earnings
credits | | | Portfolio
turnover
rate(a) | |
| | | | | | | | | | | | | | | | | | | | | | | | | | | | | | | | | | |
| | | | | | | | | | | | | | | | | | | | | | | | | | | | | | | | | | |
| $ | (3.82 | ) | | $ | 11.17 | | | | (36.37 | )% | | $ | 320,486 | | | | 1.42 | % | | | 1.42 | %(b) | | | 0.74 | % | | | 0.74 | % | | | 154.40 | % |
| | (0.73 | ) | | | 22.30 | | | | 1.92 | % | | | 615,541 | | | | 1.28 | % | | | 1.28 | %(b) | | | 0.46 | % | | | 0.46 | % | | | 96.79 | % |
| | (0.28 | ) | | | 22.59 | | | | 19.55 | % | | | 659,581 | | | | 1.29 | % | | | 1.29 | %(b) | | | 0.85 | % | | | 0.85 | % | | | 88.16 | % |
| | (0.55 | ) | | | 19.18 | | | | 18.87 | % | | | 567,054 | | | | 1.23 | % | | | 1.23 | %(b) | | | 0.87 | % | | | 0.87 | % | | | 74.41 | % |
| | (0.21 | ) | | | 16.64 | | | | 0.80 | % | | | 556,393 | | | | 1.20 | % | | | 1.20 | %(b) | | | 0.77 | % | | | 0.77 | % | | | 88.31 | % |
| | | | | | | | | | | | | | | | | | | | | | | | | | | | | | | | | | |
| | (3.73 | ) | | | 10.77 | | | | (36.99 | )% | | | 9,972 | | | | 2.43 | % | | | 2.43 | %(b) | | | (0.26 | )% | | | (0.26 | )% | | | 154.40 | % |
| | (0.67 | ) | | | 21.74 | | | | 0.83 | % | | | 17,170 | | | | 2.38 | % | | | 2.38 | %(b) | | | (0.65 | )% | | | (0.65 | )% | | | 96.79 | % |
| | (0.09 | ) | | | 22.21 | | | | 18.30 | % | | | 14,691 | | | | 2.35 | % | | | 2.35 | %(b) | | | (0.25 | )% | | | (0.25 | )% | | | 88.16 | % |
| | (0.44 | ) | | | 18.87 | | | | 17.50 | % | | | 8,257 | | | | 2.36 | % | | | 2.36 | %(b) | | | (0.20 | )% | | | (0.20 | )% | | | 74.41 | % |
| | (0.21 | ) | | | 16.47 | | | | (0.23 | )% | | | 4,718 | | | | 2.47 | % | | | 2.47 | %(b) | | | (0.47 | )% | | | (0.47 | )% | | | 88.31 | % |
| | | | | | | | | | | | | | | | | | | | | | | | | | | | | | | | | | |
| | (3.77 | ) | | | 11.11 | | | | (36.55 | )% | | | 14,588 | | | | 1.66 | % | | | 1.66 | %(b) | | | 0.50 | % | | | 0.50 | % | | | 154.40 | % |
| | (0.69 | ) | | | 22.20 | | | | 1.67 | % | | | 26,695 | | | | 1.55 | % | | | 1.55 | %(b) | | | 0.19 | % | | | 0.19 | % | | | 96.79 | % |
| | (0.24 | ) | | | 22.50 | | | | 19.21 | % | | | 26,170 | | | | 1.61 | % | | | 1.61 | %(b) | | | 0.51 | % | | | 0.51 | % | | | 88.16 | % |
| | (0.49 | ) | | | 19.12 | | | | 18.47 | % | | | 15,836 | | | | 1.55 | % | | | 1.55 | %(b) | | | 0.61 | % | | | 0.61 | % | | | 74.41 | % |
| | (0.21 | ) | | | 16.59 | | | | 0.49 | % | | | 6,005 | | | | 1.70 | % | | | 1.70 | %(b) | | | 0.38 | % | | | 0.38 | % | | | 88.31 | % |
| | | | | | | | | | | | | | | | | | | | | | | | | | | | | | | | | | |
| | | | | | | | | | | | | | | | | | | | | | | | | | | | | | | | | | |
| | (0.05 | ) | | | 7.74 | | | | (0.55 | )% | | | 49,106 | | | | 1.49 | % | | | 1.49 | %(b) | | | 0.52 | % | | | 0.52 | % | | | 51.35 | % |
| | (0.18 | ) | | | 7.83 | | | | 7.27 | % | | | 32,286 | | | | 1.64 | % | | | 1.50 | %(b) | | | (0.20 | )% | | | (0.06 | )% | | | 78.93 | % |
| | (0.05 | ) | | | 7.47 | | | | 24.68 | % | | | 11,853 | | | | 1.47 | % | | | 1.47 | %(b) | | | 0.65 | % | | | 0.65 | % | | | 95.21 | % |
| | (0.03 | ) | | | 6.04 | | | | 29.54 | % | | | 27,696 | | | | 1.39 | % | | | 1.39 | %(b) | | | 0.70 | % | | | 0.70 | % | | | 95.47 | % |
| | (0.02 | ) | | | 4.69 | | | | (15.18 | )% | | | 32,432 | | | | 1.40 | % | | | 1.40 | %(b) | | | 0.44 | % | | | 0.44 | % | | | 100.23 | % |
| | | | | | | | | | | | | | | | | | | | | | | | | | | | | | | | | | |
| | (0.02 | ) | | | 7.82 | | | | (0.69 | )% | | | 1,974 | | | | 2.19 | % | | | 1.75 | %(b) | | | (0.15 | )% | | | 0.29 | % | | | 51.35 | % |
| | – | | | | 7.89 | | | | 7.20 | % | | | 541 | | | | 2.35 | % | | | 1.75 | %(b) | | | (0.86 | )% | | | (0.26 | )% | | | 78.93 | % |
| | (0.06 | ) | | | 7.37 | | | | 24.20 | % | | | 936 | | | | 1.88 | % | | | 1.76 | %(b) | | | 0.82 | % | | | 0.94 | % | | | 95.21 | % |
| | (0.03 | ) | | | 5.99 | | | | 28.83 | % | | | 9,278 | | | | 1.80 | % | | | 1.77 | %(b) | | | 0.09 | % | | | 0.12 | % | | | 95.47 | % |
| | (0.02 | ) | | | 4.68 | | | | (15.36 | )% | | | 24 | | | | 7.37 | % | | | 1.75 | %(b) | | | (5.50 | )% | | | 0.12 | % | | | 100.23 | % |
FINANCIAL HIGHLIGHTS (CONTINUED)
| | | | | | | | | | | | | | | | | | | | | | | | |
| | | | | | Income/(loss) from investment operations | | | Less dividends and | |
| | | Net asset
value,
beginning
of period | | | Net
investment
income/
(loss)(x) | | | Net realized
and unrealized
gains/(losses)
on investments | | | Total from
investment
operations | | | Dividends
from net
investment
income | | | Distributions
from net
realized
gains | |
ICON Healthcare Fund | | | | | | | | | | | | | | | | | | | | | | | | |
Class S | | | | | | | | | | | | | | | | | | | | | | | | |
Year ended September 30, 2015 | | $ | 22.42 | | | $ | (0.09 | ) | | $ | 1.02 | | | $ | 0.93 | | | $ | – | | | $ | (5.52 | ) |
Year ended September 30, 2014 | | | 22.17 | | | | (0.11 | ) | | | 6.18 | | | | 6.07 | | | | (0.03 | ) | | | (5.79 | ) |
Year ended September 30, 2013 | | | 17.56 | | | | 0.03 | | | | 4.75 | | | | 4.78 | | | | (0.17 | ) | | | – | |
Year ended September 30, 2012 | | | 13.56 | | | | 0.17 | | | | 3.97 | | | | 4.14 | | | | (0.14 | ) | | | – | |
Year ended September 30, 2011 | | | 12.78 | | | | 0.12 | | | | 0.73 | | | | 0.85 | | | | (0.07 | ) | | | – | |
Class A** | | | | | | | | | | | | | | | | | | | | | | | | |
Year ended September 30, 2015 | | | 22.01 | | | | (0.14 | ) | | | 1.02 | | | | 0.88 | | | | – | | | | (5.52 | ) |
Year ended September 30, 2014 | | | 21.92 | | | | (0.14 | ) | | | 6.03 | | | | 5.89 | | | | (0.01 | ) | | | (5.79 | ) |
Year ended September 30, 2013 | | | 17.42 | | | | (0.03 | ) | | | 4.69 | | | | 4.66 | | | | (0.16 | ) | | | – | |
Year ended September 30, 2012 | | | 13.53 | | | | 0.11 | | | | 3.94 | | | | 4.05 | | | | (0.16 | ) | | | – | |
Year ended September 30, 2011 | | | 12.78 | | | | 0.12 | | | | 0.70 | | | | 0.82 | | | | (0.07 | ) | | | – | |
ICON Industrials Fund | | | | | | | | | | | | | | | | | | | | | | | | |
Class S | | | | | | | | | | | | | | | | | | | | | | | | |
Year ended September 30, 2015 | | | 11.67 | | | | 0.01 | | | | (0.73 | ) | | | (0.72 | ) | | | (0.01 | ) | | | – | |
Year ended September 30, 2014 | | | 10.56 | | | | 0.01 | | | | 1.16 | | | | 1.17 | | | | (0.06 | ) | | | – | |
Year ended September 30, 2013 | | | 8.26 | | | | 0.06 | | | | 2.35 | | | | 2.41 | | | | (0.11 | ) | | | – | |
Year ended September 30, 2012 | | | 6.80 | | | | 0.07 | | | | 1.48 | | | | 1.55 | | | | (0.09 | ) | | | – | |
Year ended September 30, 2011 | | | 7.47 | | | | 0.07 | | | | (0.67 | ) | | | (0.60 | ) | | | (0.07 | ) | | | – | |
Class A** | | | | | | | | | | | | | | | | | | | | | | | | |
Year ended September 30, 2015 | | | 11.58 | | | | (0.02 | ) | | | (0.70 | ) | | | (0.72 | ) | | | – | | | | – | |
Year ended September 30, 2014 | | | 10.45 | | | | (0.03 | ) | | | 1.16 | | | | 1.13 | | | | – | | | | – | |
Year ended September 30, 2013 | | | 8.10 | | | | – | (c) | | | 2.36 | | | | 2.36 | | | | (0.01 | ) | | | – | |
Year ended September 30, 2012 | | | 6.76 | | | | 0.08 | | | | 1.35 | | | | 1.43 | | | | (0.09 | ) | | | – | |
Year ended September 30, 2011 | | | 7.47 | | | | 0.05 | | | | (0.69 | ) | | | (0.64 | ) | | | (0.07 | ) | | | – | |
| | | | | | | | | | | | | | | | | | | | | | | | | | | | | | | | | | |
| distributions | | | | | | | | | | | | Ratio of expenses
to average net assets | | | Ratio of net investment
income/(loss)
to average net assets | | | | |
Total
dividends
and
distributions | | | Net asset
value, end
of period | | | Total
return* | | | Net assets,
end of
period (in
thousands) | | | Before
expense
limitation/
recoupment
and transfer
agent
earnings
credits | | | After
expense
limitation/
recoupment
and transfer
agent
earnings
credits(b) | | | Before
expense
limitation/
recoupment
and transfer
agent
earnings
credits | | | After
expense
limitation/
recoupment
and transfer
agent
earnings
credits | | | Portfolio
turnover
rate(a) | |
| | | | | | | | | | | | | | | | | | | | | | | | | | | | | | | | | | |
| | | | | | | | | | | | | | | | | | | | | | | | | | | | | | | | | | |
| $ | (5.52 | ) | | $ | 17.83 | | | | 2.55 | % | | $ | 95,109 | | | | 1.36 | % | | | 1.36 | % | | | (0.45 | )% | | | (0.45 | )% | | | 141.46 | % |
| | (5.82 | ) | | | 22.42 | | | | 32.27 | % | | | 148,261 | | | | 1.36 | % | | | 1.36 | % | | | (0.53 | )% | | | (0.53 | )% | | | 187.85 | % |
| | (0.17 | ) | | | 22.17 | | | | 27.48 | % | | | 92,171 | | | | 1.39 | % | | | 1.39 | % | | | 0.13 | % | | | 0.13 | % | | | 111.86 | % |
| | (0.14 | ) | | | 17.56 | | | | 30.76 | % | | | 100,938 | | | | 1.34 | % | | | 1.34 | % | | | 1.08 | % | | | 1.08 | % | | | 47.59 | % |
| | (0.07 | ) | | | 13.56 | | | | 6.66 | % | | | 75,116 | | | | 1.36 | % | | | 1.36 | % | | | 0.85 | % | | | 0.85 | % | | | 83.63 | % |
| | | | | | | | | | | | | | | | | | | | | | | | | | | | | | | | | | |
| | (5.52 | ) | | | 17.37 | | | | 2.33 | % | | | 15,317 | | | | 1.62 | % | | | 1.62 | % | | | (0.69 | )% | | | (0.69 | )% | | | 141.46 | % |
| | (5.80 | ) | | | 22.01 | | | | 31.72 | % | | | 10,878 | | | | 1.62 | % | | | 1.62 | % | | | (0.66 | )% | | | (0.66 | )% | | | 187.85 | % |
| | (0.16 | ) | | | 21.92 | | | | 26.95 | % | | | 3,748 | | | | 1.69 | % | | | 1.69 | % | | | (0.15 | )% | | | (0.15 | )% | | | 111.86 | % |
| | (0.16 | ) | | | 17.42 | | | | 30.19 | % | | | 390 | | | | 2.89 | % | | | 1.76 | % | | | (0.46 | )% | | | 0.67 | % | | | 47.59 | % |
| | (0.07 | ) | | | 13.53 | | | | 6.42 | % | | | 126 | | | | 7.15 | % | | | 1.75 | % | | | (4.58 | )% | | | 0.82 | % | | | 83.63 | % |
| | | | | | | | | | | | | | | | | | | | | | | | | | | | | | | | | | |
| | | | | | | | | | | | | | | | | | | | | | | | | | | | | | | | | | |
| | (0.01 | ) | | | 10.94 | | | | (6.15 | )% | | | 14,251 | | | | 1.53 | % | | | 1.50 | % | | | 0.07 | % | | | 0.10 | % | | | 22.51 | % |
| | (0.06 | ) | | | 11.67 | | | | 11.14 | % | | | 35,883 | | | | 1.41 | % | | | 1.41 | % | | | 0.07 | % | | | 0.07 | % | | | 30.09 | % |
| | (0.11 | ) | | | 10.56 | | | | 29.52 | % | | | 34,409 | | | | 1.46 | % | | | 1.46 | % | | | 0.60 | % | | | 0.60 | % | | | 45.66 | % |
| | (0.09 | ) | | | 8.26 | | | | 22.99 | % | | | 39,621 | | | | 1.40 | % | | | 1.40 | % | | | 0.91 | % | | | 0.91 | % | | | 33.73 | % |
| | (0.07 | ) | | | 6.80 | | | | (8.21 | )% | | | 50,653 | | | | 1.36 | % | | | 1.36 | % | | | 0.80 | % | | | 0.80 | % | | | 55.87 | % |
| | | | | | | | | | | | | | | | | | | | | | | | | | | | | | | | | | |
| | – | | | | 10.86 | | | | (6.22 | )% | | | 596 | | | | 2.67 | % | | | 1.75 | % | | | (1.11 | )% | | | (0.19 | )% | | | 22.51 | % |
| | – | | | | 11.58 | | | | 10.81 | % | | | 298 | | | | 2.02 | % | | | 1.75 | % | | | (0.56 | )% | | | (0.29 | )% | | | 30.09 | % |
| | (0.01 | ) | | | 10.45 | | | | 29.20 | % | | | 4,322 | | | | 2.09 | % | | | 1.75 | % | | | (0.32 | )% | | | 0.02 | % | | | 45.66 | % |
| | (0.09 | ) | | | 8.10 | | | | 21.21 | % | | | 163 | | | | 2.50 | % | | | 1.75 | % | | | 0.18 | % | | | 0.93 | % | | | 33.73 | % |
| | (0.07 | ) | | | 6.76 | | | | (8.75 | )% | | | 122 | | | | 3.46 | % | | | 1.75 | % | | | (1.12 | )% | | | 0.59 | % | | | 55.87 | % |
FINANCIAL HIGHLIGHTS (CONTINUED)
| | | | | | | | | | | | | | | | | | | | | | | | |
| | | | | | Income/(loss) from investment operations | | | Less dividends and | |
| | | Net asset
value,
beginning
of period | | | Net
investment
income/
(loss)(x) | | | Net realized
and unrealized
gains/(losses)
on investments | | | Total from
investment
operations | | | Dividends
from net
investment
income | | | Distributions
from net
realized
gains | |
ICON Information Technology Fund | | | | | | | | | | | | | | | | | | | | | | | | |
Class S | | | | | | | | | | | | | | | | | | | | | | | | |
Year ended September 30, 2015 | | $ | 13.55 | | | $ | (0.09 | ) | | $ | 1.49 | | | $ | 1.40 | | | $ | – | | | $ | – | |
Year ended September 30, 2014 | | | 11.44 | | | | (0.07 | ) | | | 2.18 | | | | 2.11 | | | | – | | | | – | |
Year ended September 30, 2013 | | | 10.72 | | | | (0.02 | ) | | | 0.74 | | | | 0.72 | | | | – | | | | – | |
Year ended September 30, 2012 | | | 8.22 | | | | (0.02 | ) | | | 2.52 | | | | 2.50 | | | | – | | | | – | |
Year ended September 30, 2011 | | | 8.05 | | | | (0.04 | ) | | | 0.21 | | | | 0.17 | | | | – | | | | – | |
Class A** | | | | | | | | | | | | | | | | | | | | | | | | |
Year ended September 30, 2015 | | | 13.32 | | | | (0.14 | ) | | | 1.47 | | | | 1.33 | | | | – | | | | – | |
Year ended September 30, 2014 | | | 11.30 | | | | (0.11 | ) | | | 2.13 | | | | 2.02 | | | | – | | | | – | |
Year ended September 30, 2013 | | | 10.65 | | | | (0.05 | ) | | | 0.70 | | | | 0.65 | | | | – | | | | – | |
Year ended September 30, 2012 | | | 8.20 | | | | (0.06 | ) | | | 2.51 | | | | 2.45 | | | | – | | | | – | |
Year ended September 30, 2011 | | | 8.05 | | | | (0.05 | ) | | | 0.20 | | | | 0.15 | | | | – | | | | – | |
ICON Materials Fund | | | | | | | | | | | | | | | | | | | | | | | | |
Class S | | | | | | | | | | | | | | | | | | | | | | | | |
Year ended September 30, 2015 | | | 15.09 | | | | 0.04 | | | | (3.23 | ) | | | (3.19 | ) | | | (0.04 | ) | | | – | |
Year ended September 30, 2014 | | | 13.43 | | | | 0.04 | | | | 1.68 | | | | 1.72 | | | | (0.06 | ) | | | – | |
Year ended September 30, 2013 | | | 11.12 | | | | 0.09 | | | | 2.40 | | | | 2.49 | | | | (0.18 | ) | | | – | |
Year ended September 30, 2012 | | | 9.00 | | | | 0.11 | | | | 2.11 | | | | 2.22 | | | | (0.10 | ) | | | – | |
Year ended September 30, 2011 | | | 10.06 | | | | 0.08 | | | | (1.08 | ) | | | (1.00 | ) | | | (0.06 | ) | | | – | |
Class C | | | | | | | | | | | | | | | | | | | | | | | | |
Year ended September 30, 2015 | | | 14.77 | | | | (0.11 | ) | | | (3.15 | ) | | | (3.26 | ) | | | – | | | | – | |
Year ended September 30, 2014 | | | 13.24 | | | | (0.12 | ) | | | 1.65 | | | | 1.53 | | | | – | | | | – | |
Year ended September 30, 2013 | | | 10.94 | | | | (0.04 | ) | | | 2.38 | | | | 2.34 | | | | (0.04 | ) | | | – | |
Year ended September 30, 2012 | | | 8.92 | | | | – | (c) | | | 2.08 | | | | 2.08 | | | | (0.06 | ) | | | – | |
Year ended September 30, 2011 | | | 10.06 | | | | (0.03 | ) | | | (1.05 | ) | | | (1.08 | ) | | | (0.06 | ) | | | – | |
Class A | | | | | | | | | | | | | | | | | | | | | | | | |
Year ended September 30, 2015 | | | 14.96 | | | | (0.01 | ) | | | (3.20 | ) | | | (3.21 | ) | | | – | | | | – | |
Year ended September 30, 2014 | | | 13.36 | | | | (0.01 | ) | | | 1.67 | | | | 1.66 | | | | (0.06 | ) | | | – | |
Year ended September 30, 2013 | | | 11.07 | | | | 0.05 | | | | 2.38 | | | | 2.43 | | | | (0.14 | ) | | | – | |
Year ended September 30, 2012 | | | 8.97 | | | | 0.08 | | | | 2.10 | | | | 2.18 | | | | (0.08 | ) | | | – | |
Year ended September 30, 2011 | | | 10.06 | | | | 0.05 | | | | (1.08 | ) | | | (1.03 | ) | | | (0.06 | ) | | | – | |
| | | | | | | | | | | | | | | | | | | | | | | | | | | | | | | | | | |
| distributions | | | | | | | | | | | | Ratio of expenses
to average net assets | | | Ratio of net investment
income/(loss)
to average net assets | | | | |
Total
dividends
and
distributions | | | Net asset
value, end
of period | | | Total
return* | | | Net assets,
end of
period (in
thousands) | | | Before
expense
limitation/
recoupment
and transfer
agent
earnings
credits | | | After
expense
limitation/
recoupment
and transfer
agent
earnings
credits | | | Before
expense
limitation/
recoupment
and transfer
agent
earnings
credits | | | After
expense
limitation/
recoupment
and transfer
agent
earnings
credits | | | Portfolio
turnover
rate(a) | |
| | | | | | | | | | | | | | | | | | | | | | | | | | | | | | | | | | |
| | | | | | | | | | | | | | | | | | | | | | | | | | | | | | | | | | |
| $ | – | | | $ | 14.95 | | | | 10.33 | % | | $ | 45,343 | | | | 1.44 | % | | | 1.44 | %(b) | | | (0.62 | )% | | | (0.62 | )% | | | 43.32 | % |
| | – | | | | 13.55 | | | | 18.44 | % | | | 50,363 | | | | 1.40 | % | | | 1.40 | %(b) | | | (0.56 | )% | | | (0.56 | )% | | | 47.88 | % |
| | – | | | | 11.44 | | | | 6.72 | % | | | 73,851 | | | | 1.38 | % | | | 1.38 | %(b) | | | (0.22 | )% | | | (0.22 | )% | | | 51.71 | % |
| | – | | | | 10.72 | | | | 30.41 | % | | | 83,330 | | | | 1.34 | % | | | 1.34 | %(b) | | | (0.20 | )% | | | (0.20 | )% | | | 35.22 | % |
| | – | | | | 8.22 | | | | 2.11 | % | | | 61,081 | | | | 1.34 | % | | | 1.34 | %(b) | | | (0.40 | )% | | | (0.40 | )% | | | 44.84 | % |
| | | | | | | | | | | | | | | | | | | | | | | | | | | | | | | | | | |
| | – | | | | 14.65 | | | | 9.99 | % | | | 3,170 | | | | 1.90 | % | | | 1.75 | %(b) | | | (1.07 | )% | | | (0.92 | )% | | | 43.32 | % |
| | – | | | | 13.32 | | | | 17.88 | % | | | 455 | | | | 1.94 | % | | | 1.75 | %(b) | | | (1.10 | )% | | | (0.91 | )% | | | 47.88 | % |
| | – | | | | 11.30 | | | | 6.10 | % | | | 2,330 | | | | 2.23 | % | | | 1.75 | %(b) | | | (0.94 | )% | | | (0.45 | )% | | | 51.71 | % |
| | – | | | | 10.65 | | | | 29.88 | % | | | 1,400 | | | | 2.87 | % | | | 1.75 | %(b) | | | (1.71 | )% | | | (0.59 | )% | | | 35.22 | % |
| | – | | | | 8.20 | | | | 1.86 | % | | | 1 | | | | 215.56 | % | | | 1.75 | %(b) | | | (214.36 | )% | | | (0.55 | )% | | | 44.84 | % |
| | | | | | | | | | | | | | | | | | | | | | | | | | | | | | | | | | |
| | | | | | | | | | | | | | | | | | | | | | | | | | | | | | | | | | |
| | (0.04 | ) | | | 11.86 | | | | (21.22 | )% | | | 60,404 | | | | 1.42 | % | | | 1.42 | %(b) | | | 0.27 | % | | | 0.27 | % | | | 48.11 | % |
| | (0.06 | ) | | | 15.09 | | | | 12.85 | % | | | 93,610 | | | | 1.36 | % | | | 1.36 | %(b) | | | 0.26 | % | | | 0.26 | % | | | 33.16 | % |
| | (0.18 | ) | | | 13.43 | | | | 22.73 | % | | | 65,782 | | | | 1.45 | % | | | 1.45 | %(b) | | | 0.72 | % | | | 0.72 | % | | | 55.66 | % |
| | (0.10 | ) | | | 11.12 | | | | 24.85 | % | | | 41,627 | | | | 1.39 | % | | | 1.39 | %(b) | | | 1.00 | % | | | 1.00 | % | | | 40.89 | % |
| | (0.06 | ) | | | 9.00 | | | | (10.07 | )% | | | 59,068 | | | | 1.33 | % | | | 1.33 | %(b) | | | 0.73 | % | | | 0.73 | % | | | 62.97 | % |
| | | | | | | | | | | | | | | | | | | | | | | | | | | | | | | | | | |
| | – | | | | 11.51 | | | | (22.07 | )% | | | 834 | | | | 2.94 | % | | | 2.50 | %(b) | | | (1.22 | )% | | | (0.78 | )% | | | 48.11 | % |
| | – | | | | 14.77 | | | | 11.56 | % | | | 675 | | | | 4.17 | % | | | 2.50 | %(b) | | | (2.51 | )% | | | (0.84 | )% | | | 33.16 | % |
| | (0.04 | ) | | | 13.24 | | | | 21.43 | % | | | 218 | | | | 4.12 | % | | | 2.50 | %(b) | | | (1.95 | )% | | | (0.33 | )% | | | 55.66 | % |
| | (0.06 | ) | | | 10.94 | | | | 23.36 | % | | | 195 | | | | 4.29 | % | | | 2.51 | %(b) | | | (1.82 | )% | | | (0.04 | )% | | | 40.89 | % |
| | (0.06 | ) | | | 8.92 | | | | (10.87 | )% | | | 120 | | | | 4.11 | % | | | 2.50 | %(b) | | | (1.91 | )% | | | (0.30 | )% | | | 62.97 | % |
| | | | | | | | | | | | | | | | | | | | | | | | | | | | | | | | | | |
| | – | | | | 11.75 | | | | (21.46 | )% | | | 3,078 | | | | 1.76 | % | | | 1.75 | %(b) | | | (0.06 | )% | | | (0.05 | )% | | | 48.11 | % |
| | (0.06 | ) | | | 14.96 | | | | 12.47 | % | | | 8,229 | | | | 1.72 | % | | | 1.72 | %(b) | | | (0.07 | )% | | | (0.07 | )% | | | 33.16 | % |
| | (0.14 | ) | | | 13.36 | | | | 22.24 | % | | | 1,883 | | | | 2.02 | % | | | 1.75 | %(b) | | | 0.17 | % | | | 0.44 | % | | | 55.66 | % |
| | (0.08 | ) | | | 11.07 | | | | 24.44 | % | | | 539 | | | | 2.12 | % | | | 1.76 | %(b) | | | 0.34 | % | | | 0.70 | % | | | 40.89 | % |
| | (0.06 | ) | | | 8.97 | | | | (10.37 | )% | | | 487 | | | | 2.26 | % | | | 1.74 | %(b) | | | (0.07 | )% | | | 0.45 | % | | | 62.97 | % |
FINANCIAL HIGHLIGHTS (CONTINUED)
| | | | | | | | | | | | | | | | | | | | | | | | |
| | | | | | Income/(loss) from investment operations | | | Less dividends and | |
| | | Net asset
value,
beginning
of period | | | Net
investment
income/
(loss)(x) | | | Net realized
and unrealized
gains/(losses)
on investments | | | Total from
investment
operations | | | Dividends
from net
investment
income | | | Distributions
from net
realized
gains | |
ICON Utilities Fund | | | | | | | | | | | | | | | | | | | | | | | | |
Class S | | | | | | | | | | | | | | | | | | | | | | | | |
Year ended September 30, 2015 | | $ | 7.90 | | | $ | 0.28 | | | $ | 0.11 | | | $ | 0.39 | | | $ | (0.26 | ) | | $ | – | |
Year ended September 30, 2014 | | | 7.22 | | | | 0.22 | | | | 0.69 | | | | 0.91 | | | | (0.23 | ) | | | – | |
Year ended September 30, 2013 | | | 6.81 | | | | 0.20 | | | | 0.43 | | | | 0.63 | | | | (0.22 | ) | | | – | |
Year ended September 30, 2012 | | | 6.29 | | | | 0.20 | | | | 0.55 | | | | 0.75 | | | | (0.23 | ) | | | – | |
Year ended September 30, 2011 | | | 6.15 | | | | 0.24 | | | | 0.31 | | | | 0.55 | | | | (0.41 | ) | | | – | |
Class A** | | | | | | | | | | | | | | | | | | | | | | | | |
Year ended September 30, 2015 | | | 7.81 | | | | 0.26 | | | | 0.11 | | | | 0.37 | | | | (0.26 | ) | | | – | |
Year ended September 30, 2014 | | | 7.14 | | | | 0.21 | | | | 0.68 | | | | 0.89 | | | | (0.22 | ) | | | – | |
Year ended September 30, 2013 | | | 6.73 | | | | 0.18 | | | | 0.42 | | | | 0.60 | | | | (0.19 | ) | | | – | |
Year ended September 30, 2012 | | | 6.24 | | | | 0.20 | | | | 0.53 | | | | 0.73 | | | | (0.24 | ) | | | – | |
Year ended September 30, 2011 | | | 6.15 | | | | 0.34 | | | | 0.17 | | | | 0.51 | | | | (0.42 | ) | | | – | |
| (x) | Calculated using the average shares method. | |
| * | The total return calculation is for the period indicated and excludes any sales charges. | |
| ** | Class C shares were merged into Class A on September 25, 2015. The amounts presented represent the results of the Class A shares for the periods prior to the merger and the results of the combined share class for the period subsequent to the merger. | |
| (a) | Portfolio turnover is calculated at the Fund level and is not annualized for periods less than a year. | |
| (b) | The Fund’s operating expenses, not including interest expense, are contractually limited to the amounts discussed in Note 3. The ratios in these financial highlights reflect the limitation, including the interest expense. | |
| (c) | Amount less than $0.005. | |
The accompanying notes are an integral part of the financial statements,
| | | | | | | | | | | | | | | | | | | | | | | | | | | | | | | | | | |
| distributions | | | | | | | | | | | | Ratio of expenses
to average net assets | | | Ratio of net investment
income/(loss)
to average net assets | | | | |
Total
dividends
and
distributions | | | Net asset
value, end
of period | | | Total
return* | | | Net assets,
end of
period (in
thousands) | | | Before
expense
limitation/
recoupment
and transfer
agent
earnings
credits | | | After
expense
limitation/
recoupment
and transfer
agent
earnings
credits(b) | | | Before
expense
limitation/
recoupment
and transfer
agent
earnings
credits | | | After
expense
limitation/
recoupment
and transfer
agent
earnings
credits | | | Portfolio
turnover
rate(a) | |
| | | | | | | | | | | | | | | | | | | | | | | | | | | | | | | | | | |
| | | | | | | | | | | | | | | | | | | | | | | | | | | | | | | | | | |
| $ | (0.26 | ) | | $ | 8.03 | | | | 4.93 | % | | $ | 19,107 | | | | 1.70 | % | | | 1.50 | % | | | 3.12 | % | | | 3.32 | % | | | 243.33 | % |
| | (0.23 | ) | | | 7.90 | | | | 12.69 | % | | | 17,920 | | | | 1.52 | % | | | 1.50 | % | | | 2.84 | % | | | 2.86 | % | | | 106.99 | % |
| | (0.22 | ) | | | 7.22 | | | | 9.25 | % | | | 29,117 | | | | 1.62 | % | | | 1.51 | % | | | 2.71 | % | | | 2.81 | % | | | 121.14 | % |
| | (0.23 | ) | | | 6.81 | | | | 12.01 | % | | | 23,524 | | | | 1.53 | % | | | 1.51 | % | | | 3.00 | % | | | 3.02 | % | | | 50.92 | % |
| | (0.41 | ) | | | 6.29 | | | | 9.16 | % | | | 21,313 | | | | 1.61 | % | | | 1.51 | % | | | 3.75 | % | | | 3.85 | % | | | 114.73 | % |
| | | | | | | | | | | | | | | | | | | | | | | | | | | | | | | | | | |
| | (0.26 | ) | | | 7.92 | | | | 4.63 | % | | | 5,679 | | | | 1.89 | % | | | 1.75 | % | | | 3.04 | % | | | 3.18 | % | | | 243.33 | % |
| | (0.22 | ) | | | 7.81 | | | | 12.44 | % | | | 2,517 | | | | 1.81 | % | | | 1.75 | % | | | 2.69 | % | | | 2.75 | % | | | 106.99 | % |
| | (0.19 | ) | | | 7.14 | | | | 8.96 | % | | | 2,402 | | | | 1.74 | % | | | 1.74 | % | | | 2.55 | % | | | 2.55 | % | | | 121.14 | % |
| | (0.24 | ) | | | 6.73 | | | | 11.81 | % | | | 7,113 | | | | 1.70 | % | | | 1.70 | % | | | 3.03 | % | | | 3.03 | % | | | 50.92 | % |
| | (0.42 | ) | | | 6.24 | | | | 8.56 | % | | | 449 | | | | 185.34 | % | | | 1.75 | % | | | (178.27 | )% | | | 5.32 | % | | | 114.73 | % |
NOTESTO FINANCIAL STATEMENTS
SEPTEMBER 30, 2015
1. Organization
The ICON Consumer Discretionary Fund, ICON Consumer Staples Fund, ICON Energy Fund, ICON Financial Fund, ICON Healthcare Fund, ICON Industrials Fund, ICON Information Technology Fund, ICON Materials Fund, and ICON Utilities Fund are series funds (individually a “Fund” and collectively, the “Funds”). The Funds are part of the ICON Funds (the “Trust”), a Massachusetts business trust registered under the Investment Company Act of 1940, as amended (the “1940 Act”) as an open-end non-diversified investment management company. Each Fund offers two classes of shares: Class A and Class S. The ICON Energy Fund and the ICON Materials Fund also offer a Class C share. On September 25, 2015, the Class C shares of the ICON Consumer Discretionary Fund, ICON Consumer Staples Fund, ICON Financial Fund, ICON Healthcare Fund, ICON Industrials Fund, ICON Information Technology Fund, and ICON Utilities Fund were merged into the respective Class A shares of the Fund. The Class C shares of each of the Funds noted above were closed. The merger activity is shown in the Statement of Changes in Net Assets. All classes have equal rights as to earnings, assets, and voting privileges except that each Class may bear different distribution fees, registration costs, legal costs, mailing and printing costs and shareholder servicing costs and each Class has exclusive voting rights with respect to its distribution plan. There are currently eight other active Funds within the Trust. Those Funds are covered by separate prospectuses and shareholder reports.
Each Fund is authorized to issue an unlimited number of no par shares. The Funds invest primarily in securities of companies whose principal business activities fall within specific sectors and industries. The investment objective of each Fund is to provide long-term capital appreciation.
The Funds, like all investments in securities, have elements of risk, including risk of loss of principal. There is no assurance that the Funds will achieve their investment objectives and may underperform funds with similar investment objectives. An investment concentrated in sectors and industries involves greater risk and volatility than a more diversified investment. Investments in foreign securities and currency transactions may involve certain considerations and risks not typically associated with those of U.S. dollar-denominated transactions as a result of, among other factors, the possibility of lower government supervision and regulation of foreign securities markets and the possibility of political or economic instability. Financial statements of foreign companies are governed by different
| | |
| 86 | | NOTESTO FINANCIAL STATEMENTS |
accounting, auditing, and financial standards than U.S. companies and may be less transparent and uniform than in the United States. Many corporate governance standards, which help ensure the integrity of public information in the United States, may not exist in some foreign countries. In general, there may be less governmental supervision of foreign stock exchanges and securities brokers and issuers. There are also risks associated with small-and mid-cap investing, including limited product lines, less liquidity and small market share.
The ICON Healthcare Fund has a significant weighting in the Biotechnology industry and the Pharmaceuticals industry, the ICON Industrials Fund has a significant weighting in the Aerospace & Defense industry, and the ICON Utilities Fund has a significant weighting in the Electric Utilities industry and the Multi-Utilities industry which may cause the Funds’ performance to be susceptible to the economic, business and/or other developments that may affect those industries.
In the normal course of business, the Funds may enter into various agreements that provide for general indemnifications. Each Fund’s maximum exposure under these arrangements is unknown as any potential exposure involving future claims that may be made against each Fund is unknown. However, based on experience, the Funds expect the risk of loss to be remote.
2. Significant Accounting Policies
The following is a summary of significant accounting policies consistently followed by the Funds in the preparation of their financial statements. The preparation of financial statements in conformity with accounting principles generally accepted in the United States of America requires management to make certain estimates and assumptions that affect the reported amounts of assets and liabilities, disclosure of contingent assets and liabilities at the date of the financial statements, and the reported amounts of income and expenses during the reporting period. Actual results may differ from these estimates.
Investment Valuation
The Funds’ securities and other assets, excluding options on securities indexes, are valued at the closing price as of the close of regular trading on the New York Stock Exchange (the “NYSE”) (normally 4 p.m. Eastern Standard Time) each day the NYSE is open, except that securities traded
| | | | |
| NOTESTO FINANCIAL STATEMENTS | | | 87 | |
NOTESTO FINANCIAL STATEMENTS (CONTINUED)
primarily on the NASDAQ Stock Market (“NASDAQ”) are normally valued by the Funds at the NASDAQ Official Closing Price provided by NASDAQ each business day. Options on securities indexes are valued at the close of the Chicago Board Options Exchange (normally 4:15 p.m. Eastern Standard Time) on each day the New York Stock Exchange is open for trading.
The Funds use pricing services to obtain the market value of securities in their portfolios; if a pricing service is not able to provide a price, or the pricing service’s valuation is considered inaccurate or does not in the Funds’ judgment reflect the market value of the security, prices may be obtained through market quotations from independent broker/dealers. If market quotations from these sources are not readily available, the Funds’ securities or other assets are valued at fair value as determined in good faith by the Funds’ Board of Trustees (“Board”) or pursuant to procedures approved by the Board.
Lacking any sales that day, a security is valued at the current closing bid price (or yield equivalent thereof) or based on quotes obtained from dealers making a market for the security. Options are valued at their closing mid-price on the market with the most volume. Mid-price is the average of the closing bid and closing ask prices. Debt securities with a remaining maturity of greater than 60 days are valued using the evaluated bid price supplied by the pricing service. The evaluated bid price supplied by the pricing service is based upon a matrix valuation system which considers such factors as security prices, yields, maturities and ratings. Short-term debt securities with remaining maturities of 60 days or less are generally valued at amortized cost or original cost plus accrued interest, which approximates market value. Currency rates as of the close of the NYSE are used to convert foreign security values into U.S. dollars.
Securities of investment companies that trade on an exchange are valued at the last sales price or official closing price as of the close of the customary trading session on the exchange where the security is principally traded. Investments in shares of funds that are not traded on an exchange are valued at the end of day net asset value per share of such fund. Securities in the underlying funds, including restricted securities are valued in accordance with the valuation policy of such fund.
The Funds’ securities traded in countries outside of the Western Hemisphere are fair valued daily by utilizing the quotations of an independent pricing service, unless the Board determines that use of another valuation methodology is appropriate. The purposes of daily fair valuation are to avoid
| | |
| 88 | | NOTESTO FINANCIAL STATEMENTS |
stale prices and to take into account, among other things, any significant events occurring after the close of foreign markets. The pricing service uses statistical analyses and quantitative models to adjust local market prices using factors such as subsequent movements and changes in the prices of indexes, securities and exchange rates in other markets to determine fair value as of the time a Fund calculates its net asset value (“NAV”). The valuation assigned to fair-value securities for purposes of calculating a Fund’s NAV may differ from the security’s most recent closing market price and from the prices used by other mutual funds to calculate their NAVs.
Various inputs are used to determine the value of the Funds’ investments. These inputs are summarized in the three broad levels listed below:
Level 1 — quoted prices in active markets for identical securities.
Level 2 — significant observable inputs other than Level 1 quoted prices (including, but not limited to, quoted prices for similar securities, interest rates, prepayment speeds, and credit risk).
Level 3 — significant unobservable inputs.
Observable inputs are those based on market data obtained from sources independent of the Funds, and unobservable inputs reflect the Funds’ own assumptions based on the best information available. The input levels are not necessarily an indication of the risk or liquidity associated with investments at that level. For example, non-U.S. equity securities actively traded in foreign markets may be reflected in Level 2 despite the availability of closing prices, because the Funds evaluate and determine whether those closing prices reflect fair value at the close of the NYSE or require adjustment, as described above. The following table summarizes the Funds’ investments, based on the inputs used to determine their values on September 30, 2015:
| | | | | | | | | | | | | | | | |
| | | Level 1 | | | Level 2 | | | Level 3 | | | Total | |
| | | | | | | | | | | | | | | | |
ICON Consumer Discretionary Fund* | | | | | | | | | |
Assets | | | | | | | | | | | | | | | | |
Common Stocks | | $ | 44,777,847 | | | $ | - | | | $ | - | | | $ | 44,777,847 | |
Collateral for Securities on Loan | | | - | | | | 2,880,504 | | | | - | | | | 2,880,504 | |
Short-Term Investments | | | - | | | | 4,865,359 | | | | - | | | | 4,865,359 | |
| | | | | | | | | | | | | | | | |
Total | | $ | 44,777,847 | | | $ | 7,745,863 | | | $ | - | | | $ | 52,523,710 | |
| | | | | | | | | | | | | | | | |
| | | | |
| NOTESTO FINANCIAL STATEMENTS | | | 89 | |
NOTESTO FINANCIAL STATEMENTS (CONTINUED)
| | | | | | | | | | | | | | | | |
| | | Level 1 | | | Level 2 | | | Level 3 | | | Total | |
| | | | | | | | | | | | | | | | |
ICON Consumer Staples Fund* | | | | | | | | | |
Assets | | | | | | | | | | | | | | | | |
Common Stocks | | $ | 11,346,776 | | | $ | - | | | $ | - | | | $ | 11,346,776 | |
Short-Term Investments | | | - | | | | 880,305 | | | | - | | | | 880,305 | |
| | | | | | | | | | | | | | | | |
Total | | $ | 11,346,776 | | | $ | 880,305 | | | $ | - | | | $ | 12,227,081 | |
| | | | | | | | | | | | | | | | |
ICON Energy Fund* | | | | | | | | | | | | | | | | |
Assets | | | | | | | | | | | | | | | | |
Common Stocks | | $ | 330,583,743 | | | $ | - | | | $ | - | | | $ | 330,583,743 | |
Collateral for Securities on Loan | | | - | | | | 19,134,404 | | | | - | | | | 19,134,404 | |
Short-Term Investments | | | - | | | | 14,701,520 | | | | - | | | | 14,701,520 | |
| | | | | | | | | | | | | | | | |
Total | | $ | 330,583,743 | | | $ | 33,835,924 | | | $ | - | | | $ | 364,419,667 | |
| | | | | | | | | | | | | | | | |
ICON Financial Fund* | | | | | | | | | | | | | | | | |
Assets | | | | | | | | | | | | | | | | |
Common Stocks | | $ | 50,132,181 | | | $ | - | | | $ | - | | | $ | 50,132,181 | |
Collateral for Securities on Loan | | | - | | | | 2,940,646 | | | | - | | | | 2,940,646 | |
Short-Term Investments | | | - | | | | 520,335 | | | | - | | | | 520,335 | |
| | | | | | | | | | | | | | | | |
Total | | $ | 50,132,181 | | | $ | 3,460,981 | | | $ | - | | | $ | 53,593,162 | |
| | | | | | | | | | | | | | | | |
ICON Healthcare Fund* | | | | | | | | | | | | | |
Assets | | | | | | | | | | | | | | | | |
Common Stocks | | $ | 109,544,778 | | | $ | - | | | $ | - | | | $ | 109,544,778 | |
| | | | | | | | | | | | | | | | |
Total | | $ | 109,544,778 | | | $ | - | | | $ | - | | | $ | 109,544,778 | |
| | | | | | | | | | | | | | | | |
ICON Industrials Fund* | | | | | | | | | | | | | | | | |
Assets | | | | | | | | | | | | | | | | |
Common Stocks | | $ | 14,479,074 | | | $ | - | | | $ | - | | | $ | 14,479,074 | |
Collateral for Securities on Loan | | | - | | | | 435,825 | | | | - | | | | 435,825 | |
Short-Term Investments | | | - | | | | 389,876 | | | | - | | | | 389,876 | |
| | | | | | | | | | | | | | | | |
Total | | $ | 14,479,074 | | | $ | 825,701 | | | $ | - | | | $ | 15,304,775 | |
| | | | | | | | | | | | | | | | |
| | |
| 90 | | NOTESTO FINANCIAL STATEMENTS |
| | | | | | | | | | | | | | | | |
| | | Level 1 | | | Level 2 | | | Level 3 | | | Total | |
| | | | | | | | | | | | | | | | |
ICON Information Technology Fund* | | | | | | | | | |
Assets | | | | | | | | | | | | | | | | |
Common Stocks | | $ | 45,511,778 | | | $ | - | | | $ | - | | | $ | 45,511,778 | |
Short-Term Investments | | | - | | | | 2,551,695 | | | | - | | | | 2,551,695 | |
| | | | | | | | | | | | | | | | |
Total | | $ | 45,511,778 | | | $ | 2,551,695 | | | $ | - | | | $ | 48,063,473 | |
| | | | | | | | | | | | | | | | |
ICON Materials Fund* | | | | | | | | | | | | | | | | |
Assets | | | | | | | | | | | | | | | | |
Common Stocks | | $ | 64,183,677 | | | $ | - | | | $ | - | | | $ | 64,183,677 | |
Collateral for Securities on Loan | | | - | | | | 495,000 | | | | - | | | | 495,000 | |
Short-Term Investments | | | - | | | | 142,711 | | | | - | | | | 142,711 | |
| | | | | | | | | | | | | | | | |
Total | | $ | 64,183,677 | | | $ | 637,711 | | | $ | - | | | $ | 64,821,388 | |
| | | | | | | | | | | | | | | | |
ICON Utilities Fund* | | | | | | | | | | | | | | | | |
Assets | | | | | | | | | | | | | | | | |
Common Stocks | | $ | 24,415,125 | | | $ | - | | | $ | - | | | $ | 24,415,125 | |
Collateral for Securities on Loan | | | - | | | | 453,600 | | | | - | | | | 453,600 | |
Short-Term Investments | | | - | | | | 149,764 | | | | - | | | | 149,764 | |
| | | | | | | | | | | | | | | | |
Total | | $ | 24,415,125 | | | $ | 603,364 | | | $ | - | | | $ | 25,018,489 | |
| | | | | | | | | | | | | | | | |
| * | Please refer to the Schedule of Investments and the Sector/Industry Classification tables for additional security details. |
No Level 3 securities were held in any of the Funds at September 30, 2015.
For the year ended September 30, 2015, there was no transfer activity between Level 1, Level 2 or Level 3. The end of period timing recognition is used for transfers between levels of the Fund’s assets and liabilities.
Fund Share Valuation
Fund shares are sold and redeemed on a daily basis at net asset value. Net asset value per share is determined daily as of the close of trading on the NYSE on each day the NYSE is open for trading by dividing the total value of the Fund’s investments and other assets, less liabilities, by the number of Fund shares outstanding.
| | | | |
| NOTESTO FINANCIAL STATEMENTS | | | 91 | |
NOTESTO FINANCIAL STATEMENTS (CONTINUED)
Foreign Currency Translation
The accounting records of the Funds are maintained in U.S. dollars. Investment securities and other assets and liabilities denominated in a foreign currency are translated daily into U.S. dollars at the prevailing rates of exchange. Income and expenses are translated into U.S. dollars at the prevailing exchange rate on the respective dates of the transactions. Purchases and sales of securities are translated into U.S. dollars at the contractual currency exchange rates established at the time of each trade.
The Funds do not isolate that portion of the results of operations resulting from changes in foreign exchange rates on investments from the fluctuations arising from changes in market prices of securities held. Net unrealized appreciation or depreciation on investments and foreign currency translations arise from changes in the value of assets and liabilities, resulting from changes in the exchange rates and changes in market prices of securities held.
Securities Lending
Under procedures adopted by the Board, the Funds may lend securities to certain approved brokers, dealers and other financial institutions to earn additional income. The Funds retain certain benefits of owning the securities, including receipt of dividends or interest generated by the security, but give up other rights including the right to vote proxies. The Funds retain the ability to recall the loans at any time and could do so in order to vote proxies or to sell the loaned securities. Each loan is collateralized by cash that generally exceeds the value of the securities on loan. The market value of the loaned securities is determined daily at the close of business of the Funds and any additional required collateral is delivered to each Fund on the next business day.
Generally, in the event of borrower default, the Funds have the right to use the collateral to offset any losses incurred. In the event the Funds are delayed or prevented from exercising their rights to dispose of the collateral, there may be a potential loss to the Funds. Some of these losses may be indemnified by the lending agent.
The Funds have elected to invest the cash collateral in the State Street Navigator Prime Portfolio which is disclosed on the Schedule of Investments. The Funds bear the risk of loss with respect to the investment of collateral. The net securities lending income earned by the Funds for the year ended September 30, 2015, is included in the Statement of Operations.
| | |
| 92 | | NOTESTO FINANCIAL STATEMENTS |
For the year ended September 30, 2015, the following Funds had securities with the following values on loan:
| | | | | | | | |
| Fund | | Loaned Securities | | | Collateral | |
ICON Consumer Discretionary Fund | | $ | 2,906,189 | | | $ | 2,880,504 | |
ICON Consumer Staples Fund | | | - | | | | - | |
ICON Energy Fund | | | 19,050,378 | | | | 19,134,404 | |
ICON Financial Fund | | | 2,895,640 | | | | 2,940,646 | |
ICON Healthcare Fund | | | - | | | | - | |
ICON Industrials Fund | | | 428,337 | | | | 435,825 | |
ICON Information Technology Fund | | | - | | | | - | |
ICON Materials Fund | | | 492,250 | | | | 495,000 | |
ICON Utilities Fund | | | 454,752 | | | | 453,600 | |
The value of the collateral above could include collateral held for securities that were sold on or before September 30, 2015. It may also include collateral received from the pre-funding of security loans.
Income Taxes, Dividends, and Distributions
The Funds intend to continue to qualify as regulated investment companies under Subchapter M of the Internal Revenue Code and, accordingly, the Funds will generally not be subject to federal and state income taxes or federal excise taxes to the extent that they intend to make sufficient distributions of net investment income and net realized capital gains.
Dividends paid by the Funds from net investment income and distributions of net realized short-term gains are, for federal income tax purposes, taxable as ordinary income to shareholders.
Dividends and distributions to shareholders are recorded by the Funds on the ex-dividend/distribution date. The Funds distribute income and net realized capital gains, if any, to shareholders at least annually, if not offset by capital loss carryforward. The Funds may utilize equalization accounting for tax purposes and designate earnings and profits, including net realized gains distributed to shareholders on redemption of shares, as part of the dividends paid deduction for income tax purposes. Income distributions and capital gain distributions are determined in accordance with income tax regulations, which may differ from accounting principles generally accepted in the United States of America.
Management has analyzed the Funds’ tax positions taken on federal income tax returns for all open tax periods and has concluded that no provision for federal income tax is required in the Funds’ financial statements.
| | | | |
| NOTESTO FINANCIAL STATEMENTS | | | 93 | |
NOTESTO FINANCIAL STATEMENTS (CONTINUED)
The Funds file U.S. tax returns. While the statute of limitations remains open to examine the Funds’ U.S. tax returns filed for the past three years, no examinations are in progress or anticipated at this time. The Funds are not aware of any tax positions for which it is reasonably possible that the total amounts of unrecognized tax benefits will significantly change in the next twelve months.
Certain foreign countries impose a capital gains tax which is accrued by the Funds based on the unrealized appreciation, if any, on affected securities. Any accrual would reduce a Fund’s NAV. The tax is paid when the gain is realized.
Investment Income
Dividend income is recorded on the ex-dividend date. Non-cash dividends included in dividend income, if any, are recorded at the fair value of the securities received. Interest income is accrued as earned. Certain dividends from foreign securities are recorded as soon as the Funds are informed of the dividend if such information is obtained subsequent to the ex-dividend date. Discounts and premiums on fixed income securities purchased are accreted or amortized to income over the life of the respective securities.
Investment Transactions
Security transactions are accounted for no later than one business day after the trade date. However, for financial reporting purposes, security transactions are accounted for on the trade date. Gains and losses on securities sold are determined on the basis of identified cost.
Allocation of Expenses
Each class of a Fund’s shares bears expenses incurred specifically on its behalf and, in addition, each class bears a portion of general expenses, based upon relative net assets of each class. Expenses which cannot be directly attributed to a specific Fund in the Trust are apportioned between all Funds in the Trust based upon relative net assets. In calculating the net asset value per share of each class, investment income, realized and unrealized gains and losses and expenses other than class-specific expenses are allocated daily to each class of shares based upon the proportion of net assets.
| | |
| 94 | | NOTESTO FINANCIAL STATEMENTS |
Below are the class level expenses that are included on the Statement of Operations:
| | | | | | | | | | | | |
| Fund* | | Legal
Expense | | | Printing
and Postage
Expense | | | Transfer
Agent
Expense | |
ICON Consumer Discretionary Fund | | | | | | | | | | | | |
Class S | | $ | 6,250 | | | $ | 13,871 | | | $ | 89,714 | |
Class C | | | 68 | | | | 127 | | | | 1,625 | |
Class A | | | 431 | | | | 1,113 | | | | 10,649 | |
ICON Consumer Staples Fund | | | | | | | | | | | | |
Class S | | | 1,412 | | | | 5,062 | | | | 36,267 | |
Class C | | | 217 | | | | 422 | | | | 3,109 | |
Class A | | | 391 | | | | 1,245 | | | | 7,406 | |
ICON Energy Fund | | | | | | | | | | | | |
Class S | | | 52,032 | | | | 83,894 | | | | 921,538 | |
Class C | | | 1,624 | | | | 2,429 | | | | 24,387 | |
Class A | | | 2,498 | | | | 4,163 | | | | 40,611 | |
ICON Financial Fund | | | | | | | | | | | | |
Class S | | | 4,599 | | | | 14,475 | | | | 67,884 | |
Class C | | | 28 | | | | 28 | | | | 645 | |
Class A | | | 95 | | | | 212 | | | | 2,954 | |
ICON Healthcare Fund | | | | | | | | | | | | |
Class S | | | 15,774 | | | | 18,876 | | | | 231,637 | |
Class C | | | 237 | | | | 207 | | | | 4,093 | |
Class A | | | 1,809 | | | | 2,132 | | | | 22,275 | |
ICON Industrials Fund | | | | | | | | | | | | |
Class S | | | 3,965 | | | | 11,749 | | | | 57,918 | |
Class C | | | 47 | | | | 68 | | | | 745 | |
Class A | | | 55 | | | | 113 | | | | 941 | |
ICON Information Technology Fund | | | | | | | | | | | | |
Class S | | | 6,111 | | | | 12,507 | | | | 95,912 | |
Class C | | | 68 | | | | 90 | | | | 1,044 | |
Class A | | | 149 | | | | 152 | | | | 1,476 | |
ICON Materials Fund | | | | | | | | | | | | |
Class S | | | 9,691 | | | | 20,977 | | | | 152,911 | |
Class C | | | 101 | | | | 218 | | | | 1,681 | |
Class A | | | 572 | | | | 1,650 | | | | 10,234 | |
ICON Utilities Fund | | | | | | | | | | | | |
Class S | | | 1,745 | | | | 3,554 | | | | 37,942 | |
Class C | | | 235 | | | | 329 | | | | 2,085 | |
Class A | | | 342 | | | | 703 | | | | 4,960 | |
| * | Class C shares merged into Class A shares on September 25, 2015, for each fund other than the ICON Energy Fund and ICON Materials Fund. The information presented is for expenses incurred before the merger. |
| | | | |
| NOTESTO FINANCIAL STATEMENTS | | | 95 | |
NOTESTO FINANCIAL STATEMENTS (CONTINUED)
3. Fees and Other Transactions with Affiliates
Investment Advisory Fees
ICON Advisers, Inc. (“ICON Advisers”) serves as investment adviser to the Funds and is responsible for managing the Funds’ portfolios of securities. ICON Advisers receives a monthly management fee that is computed daily at an annual rate of 1.00% on the first $500 million of average daily net assets, 0.95% on the next $250 million, 0.925% on the next $750 million, 0.90% on the next $3.5 billion, and 0.875% on average daily net assets over $5 billion.
ICON Advisers has contractually agreed to limit its Funds’ expenses (exclusive of brokerage, interest, taxes, dividends on short sales and extraordinary expenses) to the extent necessary to ensure that the Funds’ operating expenses do not exceed the following amounts:
| | | | | | | | | | | | |
| Fund | | Class S | | | Class C | | | Class A | |
ICON Consumer Discretionary Fund | | | 1.74% | | | | - | | | | 1.99% | |
ICON Consumer Staples Fund | | | 1.50% | | | | - | | | | 1.75% | |
ICON Energy Fund | | | 1.50% | | | | 2.50% | | | | 1.75% | |
ICON Financial Fund | | | 1.50% | | | | - | | | | 1.75% | |
ICON Healthcare Fund | | | 1.50% | | | | - | | | | 1.75% | |
ICON Industrials Fund | | | 1.50% | | | | - | | | | 1.75% | |
ICON Information Technology Fund | | | 1.50% | | | | - | | | | 1.75% | |
ICON Materials Fund | | | 1.50% | | | | 2.50% | | | | 1.75% | |
ICON Utilities Fund | | | 1.50% | | | | - | | | | 1.75% | |
The Funds’ expense limitations will continue in effect until at least January 31, 2016. To the extent ICON Advisers reimburses or absorbs fees and expenses, it may seek payment of such amounts for up to three years after the expenses were reimbursed or absorbed. A Fund will make no such payment, however, if the total Fund operating expenses exceed the expense limits in effect at the time the expenses were reimbursed or at the time these payments are proposed.
| | |
| 96 | | NOTESTO FINANCIAL STATEMENTS |
As of September 30, 2015 the following amounts were available for recoupment by ICON Advisers based upon their potential expiration dates:
| | | | | | | | | | | | |
| Fund | | 2016 | | | 2017 | | | 2018 | |
ICON Consumer Discretionary Fund | | $ | 1,881 | | | $ | 5,663 | | | $ | 2,426 | |
ICON Consumer Staples Fund | | | 3,344 | | | | 11,844 | | | | 56,452 | |
ICON Financial Fund | | | 7,072 | | | | 9,577 | | | | 5,455 | |
ICON Healthcare Fund | | | 3,191 | | | | 7,400 | | | | 2,687 | |
ICON Industrials Fund | | | 4,711 | | | | 7,089 | | | | 14,732 | |
ICON Information Technology Fund | | | 5,822 | | | | 7,936 | | | | 3,495 | |
ICON Materials Fund | | | 3,018 | | | | 8,051 | | | | 3,897 | |
ICON Utilities Fund | | | 24,519 | | | | 9,172 | | | | 38,184 | |
Accounting, Custody and Transfer Agent Fees
State Street Bank and Trust Company (“State Street”) serves as the fund accounting agent for the Funds. For its services, the Trust pays State Street a fee that is calculated daily and paid monthly at an annual rate based on the aggregate average daily net assets of the Trust.
State Street is the custodian of the Trust’s investments. For its services, the Trust pays State Street asset-based fees that vary according to the number of positions and transactions, plus out-of-pocket expenses.
Boston Financial Data Services, Inc. (“BFDS”) is the Trust’s transfer agent. For these services, the Trust pays a per account fee, plus certain other transaction Cusip charges and out-of-pocket expenses. BFDS may pay each Fund transfer agent earnings credits. Transfer agent earnings credits are credits received for interest which results from overnight balances used by BFDS for clearing shareholder transactions.
Administrative Services
The Trust has entered into an administrative services agreement with ICON Advisers pursuant to which ICON Advisers oversees the administration of the Trust’s business and affairs. This agreement provides for an annual fee of 0.05% on the Trust’s first $1.5 billion of average daily net assets, 0.045% on the next $1.5 billion of average daily net assets, 0.040% on the next $2 billion of average daily net assets and 0.030% on average daily net assets over $5 billion. For the year ended September 30, 2015, each Fund’s payment for administrative services to ICON Advisers is included on the Statement of Operations. The administrative services agreement provides that ICON Advisers will not be liable for any error of judgment, mistake of
| | | | |
| NOTESTO FINANCIAL STATEMENTS | | | 97 | |
NOTESTO FINANCIAL STATEMENTS (CONTINUED)
law, or any loss suffered by the Trust in connection with matters to which the administrative services agreement relates, except for a loss resulting from willful misfeasance, bad faith or negligence by ICON Advisers in the performance of its duties.
ICON Advisers has a sub-administration agreement under which State Street assists ICON Advisers with the administration and business affairs of the Trust. For its services, ICON Advisers pays State Street a fee that is calculated daily and paid monthly at an annual rate based on the aggregate average daily net assets of the Trust.
Distribution Fees
The Funds have adopted a Distribution Plan pursuant to Rule 12b-1 under the 1940 Act (“12b-1 Plan”) under which the Funds are authorized to compensate the Funds’ distributor, ICON Distributors, Inc. (“IDI”) (an affiliate of the adviser) for the sale and distribution of shares. Under the 12b-1 Plan, Class A shareholders pay an annual distribution and service fee of 0.25% of average daily net assets. The Class C shareholders pay an annual distribution and service fee of 1.00% of average daily net assets. There is no annual distribution and service fee for Class S shares. The total amount paid under the 12b-1 plans, if any, by the Funds is shown on the Statement of Operations.
Other Related Parties
Certain Officers and Directors of ICON Advisers are also Officers and Trustees of the Funds; however, such Officers and Trustees (with the exception of the Chief Compliance Officer, “CCO”) receive no compensation from the Funds. The Trust paid 95% of the CCO’s salary and the remaining portion is paid by ICON Advisers. For the year ended September 30, 2015, the total related amounts paid by the Funds under this arrangement are included in Other Expenses on the Statement of Operations.
The Fund may reimburse ICON Advisers for legal work performed for the Fund by its attorneys outside of the advisory and administration contracts. The Board of Trustees reviews and approves such reimbursements. For the year ended September 30, 2015, the total related amounts paid by the Funds under this arrangement was $58,463 and is included in Other Expenses on the Statement of Operations.
| | |
| 98 | | NOTESTO FINANCIAL STATEMENTS |
4. Borrowings
The Trust has entered into a Line of Credit agreement/arrangement with State Street to provide temporary funding for redemption requests. Effective March 21, 2015, the maximum borrowing limit was changed from $150 million to $75 million. Interest on domestic borrowings is charged at a rate quoted and determined by State Street. The average interest rate charged for the year ended September 30, 2015, was 1.37%.
For the year ended September 30, 2015, the average outstanding loan by Fund was as follows:
| | | | |
| Fund* | | Average Borrowing
(10/1/14-9/30/15) | |
ICON Consumer Discretionary Fund | | $ | 44,278 | |
ICON Consumer Staples Fund | | | 101,301 | |
ICON Energy Fund | | | 168,752 | |
ICON Financial Fund | | | 30,664 | |
ICON Healthcare Fund | | | 300,064 | |
ICON Industrials Fund | | | 13,625 | |
ICON Information Technology Fund | | | 48,929 | |
ICON Materials Fund | | | 59,112 | |
ICON Utilities Fund | | | 43,856 | |
| * | There were no outstanding loans at September 30, 2015. |
5. Purchases and Sales of Investment Securities
For the year ended September 30, 2015, the aggregate cost of purchases and proceeds from sales of investment securities (excluding short-term securities) was as follows:
| | | | | | | | |
| Fund | | Purchases of
Securities | | | Proceeds
From Sales of
Securities | |
ICON Consumer Discretionary Fund | | $ | 105,745,230 | | | $ | 122,164,169 | |
ICON Consumer Staples Fund | | �� | 2,458,231 | | | | 21,501,029 | |
ICON Energy Fund | | | 689,598,503 | | | | 766,589,096 | |
ICON Financial Fund | | | 43,559,612 | | | | 22,133,622 | |
ICON Healthcare Fund | | | 194,395,453 | | | | 217,372,744 | |
ICON Industrials Fund | | | 6,844,218 | | | | 27,988,503 | |
ICON Information Technology Fund | | | 22,354,753 | | | | 32,525,339 | |
ICON Materials Fund | | | 40,343,969 | | | | 55,204,033 | |
ICON Utilities Fund | | | 51,364,184 | | | | 49,271,063 | |
| | | | |
| NOTESTO FINANCIAL STATEMENTS | | | 99 | |
NOTESTO FINANCIAL STATEMENTS (CONTINUED)
6. Federal Income Tax
The following information is presented on an income tax basis. Differences between U.S. GAAP and federal income tax purposes that are permanent in nature are reclassified within the capital accounts. Temporary differences do not require reclassification. Temporary and permanent differences do not impact the NAVs of the Funds. These differences are due to differing treatments for items such as deferrals of wash sale losses, foreign currency transactions, partnership adjustments, and net investment losses.
For the year ended September 30, 2015, the following Funds had capital loss carryforwards:
| | | | | | | | |
| Fund | | Amounts | | | Expires | |
ICON Financial Fund | | $ | 42,760,779 | | | | 2017 | |
| | | 43,715,782 | | | | 2018 | |
ICON Industrials Fund | | | 19,454,414 | | | | 2018 | |
ICON Information Technology Fund | | | 357,887 | | | | 2018 | |
ICON Utilities Fund | | | 79,699 | | | | 2018 | |
Future capital loss carryforward utilization in any given year may be limited if there are substantial shareholder redemptions or contributions. During the year ended September 30, 2015, the following Funds utilized capital loss carryforwards:
| | | | |
| Fund | | Amount | |
ICON Financial Fund | | $ | 2,242,158 | |
ICON Industrials Fund | | | 6,885,305 | |
ICON Information Technology Fund | | | 6,605,630 | |
ICON Materials Fund | | | 9,498,011 | |
ICON Utilities Fund | | | 1,048,867 | |
Under the Regulated Investment Company Modernization Act of 2010 (the “Act”) capital losses generated by a fund may be carried over indefinitely, but these losses must be used prior to the utilization of any pre-enactment capital losses. Since pre-enactment capital losses may only be carried forward for eight years there may be a greater likelihood that all or a portion of each fund’s pre-enactment capital losses will expire unused.
| | |
| 100 | | NOTESTO FINANCIAL STATEMENTS |
The tax characteristics of distributions paid to shareholders during the fiscal year ended September 30, 2015, were as follows:
| | | | | | | | | | | | |
| | | Distributions Paid from | | | | |
| Fund | | Ordinary
Income | | | Realized
Gain/Loss | | | Total Distributions
Paid | |
ICON Consumer Discretionary Fund | | $ | 3,159,255 | | | $ | 4,938,010 | | | $ | 8,097,265 | |
ICON Consumer Staples Fund | | | 1,055,012 | | | | 3,043,787 | | | | 4,098,799 | |
ICON Energy Fund | | | 5,883,708 | | | | 94,805,687 | | | | 100,689,395 | |
ICON Financial Fund | | | 300,902 | | | | - | | | | 300,902 | |
ICON Healthcare Fund | | | 17,398,269 | | | | 15,513,304 | | | | 32,911,573 | |
ICON Industrials Fund | | | 26,242 | | | | - | | | | 26,242 | |
ICON Materials Fund | | | 208,262 | | | | - | | | | 208,262 | |
ICON Utilities Fund | | | 622,942 | | | | - | | | | 622,942 | |
The tax characteristics of distributions paid to shareholders during the fiscal year ended September 30, 2014, were as follows:
| | | | | | | | | | | | |
| | | Distributions Paid from | | | | |
| Fund | | Ordinary
Income | | | Realized
Gain/Loss | | | Total Distributions
Paid | |
ICON Consumer Staples Fund | | $ | 188,400 | | | $ | 3,316,934 | | | $ | 3,505,334 | |
ICON Energy Fund | | | 7,889,789 | | | | 15,162,290 | | | | 23,052,079 | |
ICON Financial Fund | | | 278,278 | | | | - | | | | 278,278 | |
ICON Healthcare Fund | | | 9,719,828 | | | | 20,815,093 | | | | 30,534,921 | |
ICON Industrials Fund | | | 198,893 | | | | - | | | | 198,893 | |
ICON Materials Fund | | | 347, 885 | | | | - | | | | 347,885 | |
ICON Utilities Fund | | | 899,223 | | | | - | | | | 899,223 | |
| | | | |
| NOTESTO FINANCIAL STATEMENTS | | | 101 | |
NOTESTO FINANCIAL STATEMENTS (CONTINUED)
As of September 30, 2015, the components of accumulated earnings/(deficit) on a tax basis were as follows:
| | | | | | | | | | | | | | | | | | | | | | | | |
| Fund | | Undistributed
Ordinary
Income | | | Undistributed
Capital Gains | | | Late Year Loss
Deferral** | | | Capital Loss
Carryover | | | Unrealized
Appreciation/
(Depreciation)* | | | Total
Accumulated
Earnings/
(Deficit) | |
ICON Consumer Discretionary Fund | | $ | 1,967,754 | | | $ | 2,499,539 | | | $ | - | | | $ | - | | | $ | (2,098,451 | ) | | $ | 2,368,842 | |
ICON Consumer Staples Fund | | | 526,008 | | | | 2,182,632 | | | | - | | | | - | | | | 1,103,446 | | | | 3,812,086 | |
ICON Energy Fund | | | 1,572,544 | | | | - | | | | (94,470,875 | ) | | | - | | | | (109,498,726 | ) | | | (202,397,057 | ) |
ICON Financial Fund | | | - | | | | - | | | | - | | | | (86,476,561 | ) | | | (4,149,704 | ) | | | (90,626,265 | ) |
ICON Healthcare Fund | | | 16,435,757 | | | | 4,598,525 | | | | - | | | | - | | | | (8,098,494 | ) | | | 12,935,788 | |
ICON Industrials Fund | | | - | | | | - | | | | (2,188 | ) | | | (19,454,414 | ) | | | 1,129,811 | | | | (18,326,791 | ) |
ICON Information Technology Fund | | | - | | | | - | | | | (286,389 | ) | | | (357,889 | ) | | | 11,000,247 | | | | 10,355,969 | |
ICON Materials Fund | | | 213,172 | | | | 3,909,487 | | | | - | | | | - | | | | (15,021,121 | ) | | | (10,898,462 | ) |
ICON Utilities Fund | | | 25,158 | | | | - | | | | - | | | | (79,699 | ) | | | (919,665 | ) | | | (974,206 | ) |
| * | Differences between the book-basis and tax-basis unrealized appreciation/(depreciation) are attributable primarily to tax deferral of losses on wash sales. |
| ** | The Funds have elected to defer certain qualified late-year losses in accordance with federal income tax rules. These losses are treated as having arisen on the first day of the following fiscal year. |
As of September 30, 2015, cost on investments for federal income tax purposes and the amount of net unrealized appreciation/(depreciation) were as follows:
| | | | | | | | | | | | | | | | |
| Fund | | Cost | | | Unrealized
Appreciation | | | Unrealized
(Depreciation) | | | Net
Appreciation/
(Depreciation) | |
ICON Consumer Discretionary Fund | | $ | 54,622,161 | | | $ | 2,134,670 | | | $ | (4,233,121 | ) | | $ | (2,098,451 | ) |
ICON Consumer Staples Fund | | | 11,123,635 | | | | 1,659,194 | | | | (555,748 | ) | | | 1,103,446 | |
ICON Energy Fund | | | 473,918,553 | | | | 5,167,398 | | | | (114,666,284 | ) | | | (109,498,886 | ) |
ICON Financial Fund | | | 57,742,770 | | | | 828,247 | | | | (4,977,855 | ) | | | (4,149,608 | ) |
ICON Healthcare Fund | | | 117,643,272 | | | | 2,845,144 | | | | (10,943,638 | ) | | | (8,098,494 | ) |
ICON Industrials Fund | | | 14,174,964 | | | | 2,605,805 | | | | (1,475,994 | ) | | | 1,129,811 | |
ICON Information Technology Fund | | | 37,063,226 | | | | 12,131,645 | | | | (1,131,398 | ) | | | 11,000,247 | |
ICON Materials Fund | | | 79,842,509 | | | | 2,206,734 | | | | (17,227,855 | ) | | | (15,021,121 | ) |
ICON Utilities Fund | | | 25,938,076 | | | | 347,742 | | | | (1,267,329 | ) | | | (919,587 | ) |
| | |
| 102 | | NOTESTO FINANCIAL STATEMENTS |
7. Subsequent Events
On October 15, 2015, the Board of Trustees of the ICON Materials Fund voted in favor of changing: (i) the name from the ICON Materials Fund to the ICON Natural Resources Fund, and (ii) its principal investment strategies from investing in the Materials sector to investing in companies with operations throughout the world that own, explore or develop natural resources and other basic commodities or supply goods and services to such companies. The change will be effective January 22, 2016. For these purposes, “natural resources” generally includes, but is not limited to: energy (such as electricity and gas utilities, producers and developers, equipment and services, storage and transportation, gas/oil refining and marketing, service and drilling, pipelines and master limited partnerships (MLPs)), alternative energy (such as uranium, coal, nuclear, hydrogen, wind, solar, fuel cells), industrial products (such as building materials, cement, packaging, chemicals, materials infrastructure, supporting transport and machinery), forest products (such as lumber, plywood, pulp, paper, newsprint, tissue), base metals (such as aluminum, copper, nickel, zinc, iron ore and steel), precious metals and minerals (such as gold, silver, platinum, diamonds), and agricultural products (grains and other foods, seeds, fertilizers, water). The Fund’s strategy change poses challenges and risks. The Fund’s principal investment risks will include global natural resources risk, foreign investment risk, developing and emerging markets risk, industry and concentration risk, regional focus risk and globalization risks. A Registration Statement relating to the name and strategy change has been filed with the United States Securities and Exchange Commission but has not yet become effective. You can find the change at: www.sec.gov or at www.iconfunds.com. You can also get this information at no cost by calling 1-800-764-0442, or by sending an email request to fulfillment@iconadvisers.com.
| | | | |
| NOTESTO FINANCIAL STATEMENTS | | | 103 | |
REPORTOF INDEPENDENT REGISTERED PUBLIC
ACCOUNTING FIRM
To the Board of Trustees and Shareholders of the ICON Funds:
In our opinion, the accompanying statements of assets and liabilities, including the schedules of investments, and the related statements of operations and of changes in net assets and the financial highlights present fairly, in all material respects, the financial position of ICON Consumer Discretionary Fund, ICON Consumer Staples Fund, ICON Energy Fund, ICON Financial Fund, ICON Healthcare Fund, ICON Industrials Fund, ICON Information Technology Fund, ICON Materials Fund, and ICON Utilities Fund (nine of the portfolios constituting ICON Funds, hereafter referred to as the “Funds”) at September 30, 2015, the results of each of their operations for the year then ended, the changes in each of their net assets for each of the two years in the period then ended and the financial highlights for each of the periods presented, in conformity with accounting principles generally accepted in the United States of America. These financial statements and financial highlights (hereafter referred to as “financial statements”) are the responsibility of the Funds’ management. Our responsibility is to express an opinion on these financial statements based on our audits. We conducted our audits of these financial statements in accordance with the standards of the Public Company Accounting Oversight Board (United States). Those standards require that we plan and perform the audit to obtain reasonable assurance about whether the financial statements are free of material misstatement. An audit includes examining, on a test basis, evidence supporting the amounts and disclosures in the financial statements, assessing the accounting principles used and significant estimates made by management, and evaluating the overall financial statement presentation. We believe that our audits, which included confirmation of securities at September 30, 2015 by correspondence with the custodian and brokers, provide a reasonable basis for our opinion.

Kansas City, Missouri
November 18, 2015
| | |
| 104 | | REPORTOF ACCOUNTING FIRM |
SIX MONTH HYPOTHETICAL EXPENSE EXAMPLE
SEPTEMBER 30, 2015 (UNAUDITED)
Example
As a shareholder of a Fund you may pay two types of fees: transaction fees and fund-related fees. Certain funds charge transaction fees, including sales charges (loads) on purchase payments, reinvested dividends, or other distributions; redemption fees; and exchange fees. Funds also incur various ongoing expenses, including management fees, distribution and/or service fees, and other fund expenses, which are indirectly paid by shareholders.
This Example is intended to help you understand your ongoing costs (in dollars) of investing in the various ICON Funds and to compare these costs with the ongoing costs of investing in other mutual funds. This Example is based on an investment of $1,000 invested at the beginning of the six-month period and held for the six-month period (4/01/15 – 9/30/15).
Actual Expenses
The first line in the table for each Fund provides information about actual account values and actual expenses. The Example includes, but is not limited to, management fees, 12b-1 fees, fund accounting, custody and transfer agent fees. However, the Example does not include client specific fees, such as the $15 fee charged to IRA accounts, or the $15 fee charged for wire redemptions. You may use this information, together with the amount you invested, to estimate the expenses that you paid over the period. Simply divide your account value by $1,000 (for example, an $8,600 account value divided by $1,000 = 8.6), then multiply the result by the number in the first line for each Fund under the heading entitled “Expenses Paid During Period” to estimate the expenses you paid on your account during this period.
Hypothetical Example for Comparison Purposes
The second line in the table for each Fund provides information about hypothetical account values and hypothetical expenses based on the Fund’s actual expense ratio and an assumed rate of return of 5% per year before expenses, which is not the Fund’s actual return. The hypothetical account values and expenses may not be used to estimate the actual ending account balance or expenses you paid for the period. You may use this information to compare the ongoing costs of investing in the Fund and other funds. To do so, compare this 5% hypothetical example with the 5% hypothetical examples that appear in the shareholder reports of the other funds. Please note that the expenses shown in the table are meant to highlight your ongoing costs only and do not reflect any transactional costs, such as sales charges (loads),
redemption fees, or exchange fees that may be charged by other funds. Therefore, this information is useful in comparing ongoing costs only, and will not help you determine the relative total costs of owning different funds.
| | | | | | | | | | | | | | | | |
| | | Beginning
Account
Value
4/1/15 | | | Ending Account
Value
9/30/15 | | | Expense Paid
During Period
4/1/15-9/30/15* | | | Annualized
Expense Ratio
4/1/15 - 9/30/15* | |
Actual Expenses | |
ICON Consumer Discretionary Fund | | | | | | | | | | | | | | | | |
Class S | | $ | 1,000 | | | $ | 952.00 | | | $ | 7.19 | | | | 1.47% | |
Class A | | | 1,000 | | | | 949.40 | | | | 10.26 | | | | 2.10% | |
ICON Consumer Staples Fund | | | | | | | | | | | | | | | | |
Class S | | | 1,000 | | | | 985.30 | | | | 7.47 | | | | 1.50% | |
Class A | | | 1,000 | | | | 983.60 | | | | 8.70 | | | | 1.75% | |
ICON Energy Fund | | | | | | | | | | | | | | | | |
Class S | | | 1,000 | | | | 799.60 | | | | 6.45 | | | | 1.43% | |
Class C | | | 1,000 | | | | 795.40 | | | | 10.98 | | | | 2.44% | |
Class A | | | 1,000 | | | | 798.70 | | | | 7.53 | | | | 1.67% | |
ICON Financial Fund | | | | | | | | | | | | | | | | |
Class S | | | 1,000 | | | | 929.20 | | | | 7.21 | | | | 1.49% | |
Class A | | | 1,000 | | | | 929.50 | | | | 8.51 | | | | 1.76% | |
ICON Healthcare Fund | | | | | | | | | | | | | | | | |
Class S | | | 1,000 | | | | 886.60 | | | | 6.67 | | | | 1.41% | |
Class A | | | 1,000 | | | | 885.80 | | | | 8.13 | | | | 1.72% | |
ICON Industrials Fund | | | | | | | | | | | | | | | | |
Class S | | | 1,000 | | | | 891.50 | | | | 7.82 | | | | 1.65% | |
Class A | | | 1,000 | | | | 891.60 | | | | 8.35 | | | | 1.76% | |
ICON Information Technology Fund | | | | | | | | | | | | | | | | |
Class S | | | 1,000 | | | | 969.50 | | | | 7.21 | | | | 1.46% | |
Class A | | | 1,000 | | | | 967.60 | | | | 8.63 | | | | 1.75% | |
ICON Materials Fund | | | | | | | | | | | | | | | | |
Class S | | | 1,000 | | | | 781.80 | | | | 6.52 | | | | 1.46% | |
Class C | | | 1,000 | | | | 777.70 | | | | 11.14 | | | | 2.50% | |
Class A | | | 1,000 | | | | 780.70 | | | | 7.99 | | | | 1.79% | |
ICON Utilities Fund | | | | | | | | | | | | | | | | |
Class S | | | 1,000 | | | | 968.20 | | | | 7.40 | | | | 1.50% | |
Class A | | | 1,000 | | | | 968.00 | | | | 8.68 | | | | 1.76% | |
| | | | | | | | | | | | | | |
| | | Beginning
Account
Value
4/1/15 | | | Ending Account
Value
9/30/15 | | | Expense Paid
During Period
4/1/15-9/30/15* | | | Annualized
Expense Ratio
4/1/15 - 9/30/15* |
Hypothetical (assuming a 5% return before expenses) | | | | | | | | | | | | | | |
ICON Consumer Discretionary Fund | | | | | | | | | | | | | | |
Class S | | $ | 1,000 | | | $ | 1,017.70 | | | $ | 7.44 | | | |
Class A | | | 1,000 | | | | 1,014.54 | | | | 10.61 | | | |
ICON Consumer Staples Fund | | | | | | | | | | | | | | |
Class S | | | 1,000 | | | | 1,017.55 | | | | 7.59 | | | |
Class A | | | 1,000 | | | | 1,016.29 | | | | 8.85 | | | |
ICON Energy Fund | | | | | | | | | | | | | | |
Class S | | | 1,000 | | | | 1,017.90 | | | | 7.23 | | | |
Class C | | | 1,000 | | | | 1,012.84 | | | | 12.31 | | | |
Class A | | | 1,000 | | | | 1,016.70 | | | | 8.44 | | | |
ICON Financial Fund | | | | | | | | | | | | | | |
Class S | | | 1,000 | | | | 1,017.60 | | | | 7.54 | | | |
Class A | | | 1,000 | | | | 1,016.24 | | | | 8.90 | | | |
ICON Healthcare Fund | | | | | | | | | | | | | | |
Class S | | | 1,000 | | | | 1,018.00 | | | | 7.13 | | | |
Class A | | | 1,000 | | | | 1,016.44 | | | | 8.69 | | | |
ICON Industrials Fund | | | | | | | | | | | | | | |
Class S | | | 1,000 | | | | 1,016.80 | | | | 8.34 | | | |
Class A | | | 1,000 | | | | 1,016.24 | | | | 8.90 | | | |
ICON Information Technology Fund | | | | | | | | | | | | | | |
Class S | | | 1,000 | | | | 1,017.75 | | | | 7.38 | | | |
Class A | | | 1,000 | | | | 1,016.29 | | | | 8.85 | | | |
ICON Materials Fund | | | | | | | | | | | | | | |
Class S | | | 1,000 | | | | 1,017.75 | | | | 7.38 | | | |
Class C | | | 1,000 | | | | 1,012.53 | | | | 12.61 | | | |
Class A | | | 1,000 | | | | 1,016.09 | | | | 9.05 | | | |
ICON Utilities Fund | | | | | | | | | | | | | | |
Class S | | | 1,000 | | | | 1,017.55 | | | | 7.59 | | | |
Class A | | | 1,000 | | | | 1,016.24 | | | | 8.90 | | | |
| * | Expenses are equal to the Fund’s six month expense ratio annualized and multiplied by the average account value over the period, multiplied by 183/365 to reflect the one-half year period. |
Total returns exclude applicable sales charges. If sales charges were included (maximum 5.75%), returns would be lower.
BOARDOF TRUSTEESAND FUND OFFICERS
(UNAUDITED)
The ICON Funds Board of Trustees (“Board”) consists of four Trustees who oversee the 17 ICON Funds (the “Funds”). The Board is responsible for general oversight of the Funds’ business and for assuring that the Funds are managed in the best interest of the Funds’ shareholders. The Trustees, and their ages, and principal occupations are set forth below. The address of the Trustees is 5299 DTC Blvd., Suite 1200, Greenwood Village, CO 80111. Trustees have no official term of office and generally serve until they resign or are not re-elected.
Interested Trustee
Craig T. Callahan, 64, Chairman of the Board. Dr. Callahan has been a Trustee of the Funds since their inception. Dr. Callahan also serves as Chief Executive Officer (2013 to present); and Chairman of the Investment Committee (2005 to present) and served as the Chief Investment Officer (1991 to 2004) and President (2008 to 2013 and 2014 to present) of ICON Advisers. Dr. Callahan is also Executive Vice President (2005 to present); Director (1991 to present); and was previously President (1998 to 2005) and Chief Compliance Officer (2005) of IDI. Dr. Callahan also serves as the President (1998 to present) and Chairman of the Board of Directors (1994 to present) of ICON Management & Research Corporation (“IM&R”), the parent company of ICON Advisers and IDI.
Independent Trustees
Glen F. Bergert, 65. Mr. Bergert has been a Trustee of the Funds since 1999. Mr. Bergert is President of Venture Capital Management LLC (1997 to present), General Partner of SOGNO Partners LP, a venture capital company (2001 to present), General Partner of Bergert Properties, LLP, a real estate holding company (1997 to present), General Partner of Pyramid Real Estate Partnership, a real estate development company (1998 to present), General Partner of Chamois Partners, LP, a venture capital company (2004 to present) and was previously a General Partner with KPMG Peat Marwick, LLP (1979 to 1997). Mr. Bergert is also a Director of Delta Dental of California, an insurance company (2013 to present and 2006 to 2012), Delta Dental of Pennsylvania, an insurance company (1998 to 2009 and 2010 to present), Dentegra Group, Inc, an insurance holding company (2010 to 2014) and Delta Reinsurance Corporation (2000 to 2009 and 2011 to 2014). Mr. Bergert was a Director of Herre Bros, Inc., a contracting company (1998 to 2011).
John C. Pomeroy, Jr., 68. Mr. Pomeroy has been a Trustee of the Funds since November 2002. Mr. Pomeroy is Chief Investment Officer and Director of Investments, Pennsylvania State University (2001 to present) and was Portfolio Manager and Product Manager, Trinity Investment Management Corporation (1989 to 2001).
R. Michael Sentel, 67. Mr. Sentel has been a Trustee of the Funds since their inception. Mr. Sentel is a Senior Attorney with the U.S. Department of Education (1996 to present). Mr. Sentel also provides legal representation as a sole practitioner with an emphasis on corporate and transactional law. He served as general counsel to numerous public companies and served on the board of directors of one of these clients. Mr. Sentel began his legal career with the U.S. Securities and Exchange Commission’s Division of Enforcement and served as a Branch Chief (1980 to 1981). Later he served as the Section Chief for the Professional Liability Section of the Federal Deposit Insurance Corp. with responsibility for the Rocky Mountain Region (1991 to 1994).
The Officers of the Funds are:
Craig T. Callahan, 64, Chairman of the Board. Dr. Callahan has been a Trustee of the Funds since their inception. Dr. Callahan also serves as Chief Executive Officer (2013 to present); President (1998 to 2013 and 2014 to present) and Chairman of the Investment Committee (2005 to present) and served as the Chief Investment Officer (1991 to 2004) of ICON Advisers. Dr. Callahan is also Executive Vice President (2005 to present); Director (1991 to present); and was previously President (1998 to 2005) and Chief Compliance Officer (2005) of IDI. Dr. Callahan also serves as the President (1998 to present) and Chairman of the Board of Directors (1994 to present) of IM&R, the parent company of ICON Advisers and IDI.
Donald Salcito, 62. Mr. Salcito serves as Vice President and Secretary of the Funds (November 15, 2006 to present). Mr. Salcito is also Executive Vice President and General Counsel (September 2005 to present) of ICON Advisers; Director of IM&R (2005 to present); Executive Vice President, Secretary, General Counsel of IDI (2005 to present). Previously, he was a Partner in various national law firms, practicing in the securities law area. (1980 to 2005).
Carrie M. Schoffman, 42. Ms. Schoffman has been a Vice President and Principal Financial Officer/Treasurer of the Funds since June 2013. Ms. Schoffman is also Chief Compliance Officer (2013 to present and 2004 to 2008) and Anti-Money Laundering Officer (2013 to present) of the ICON Funds. She is Senior Vice President (2011 to present) and Chief Compliance Officer (2013 to present and 2004 to 2011) of ICON Advisers. Previously, she was a Staff Accountant with the Securities and Exchange Commission
(2003 to 2004) and also an Experienced Manager (2001 to 2003) and a Senior Associate/Associate (1996 to 2001) at PricewaterhouseCoopers LLP.
Lesley Caviness, 49. Ms. Caviness serves as Assistant Treasurer of the Funds (2014 to present). She has worked at ICON (2007-2008 and 2010-present) in fund accounting, compliance, business intelligence and performance capacities. Prior to working at ICON, Ms. Caviness was a Real Estate Broker at Seasons Real Estate Group (2008-2012) and Signature Real Estate (2014-present), Finance Manager at Navigant (2000-2007), and Associate/Senior Associate (1996 to 2000) at PricewaterhouseCoopers LLP.
OTHER INFORMATION (UNAUDITED)
Renewal of Investment Advisory Agreement
On August 10, 2015, the Board of Trustees, including all of the Trustees that are not “interested persons” of the Trust (the “Independent Trustees”), approved continuation of the Advisory Agreements with the Adviser for each Fund for an additional one-year term commencing October 1, 2015.
In determining to renew the investment advisory agreements between ICON Funds (the “Trust”) and ICON Advisers, Inc. (“ICON” or the “Adviser”) the Trustees requested, was provided with and reviewed data with respect to the Adviser, its personnel, and the services provided and to be provided to each Fund by the Adviser under the Trust’s Investment Advisory Agreement dated October 9, 1996, as amended (related to the Sector Funds, the International Funds and ICON Fund) and under the Trust’s Investment Advisory Agreement dated July 9, 2002 and effective October 1, 2002, as amended (related to the U.S. Diversified Funds — Bond, Risk-Managed Balanced, Equity Income, Opportunities and Long/Short Funds) (collectively, the “Advisory Agreements”), for an additional one-year term commencing October 1, 2015. The Trustees agreed that consideration of the Advisory Agreements should also include consideration of other agreements between the Adviser and the Trust that impact provisions of the Advisory Agreements, including expense limitation agreement as amended effective September 25, 2015.
The Trustees were provided with and reviewed data with respect to the Adviser, its personnel, and the services provided and to be provided to each Fund by the Adviser under the Trust’s Advisory Agreements, Administrative Services Agreement and Expense Limitation Agreement and the Distribution Agreement with ICON Distributors, Inc. (“IDI”). The data included information concerning advisory, distribution and administrative services provided to the Funds by ICON and its related companies; information concerning other businesses of those companies; comparative data obtained from Strategic Insight (“SI”) related to Fund performance and Fund expenses (the “SI Report”). The data also included an analysis of the management style to be applied and the style applied to the Funds’ ratings of the Funds’ performance in their management style on the AthenaInvest system (the “AthenaInvest Data”) and a presentation on the Adviser’s investment model.
The Board convened a meeting with SI on July 29, 2015 to discuss the SI Report and the information contained within the SI Report. Avi Nachmany, Co-Founder and Director of Research of SI and Kevin Shine, Senior Managing Director, U.S. Research & Advisory of SI, discussed the findings of the SI Report with the independent directors. Management personnel participated in the SI meeting convened to discuss the data for and with the Board. At the
meeting, SI discussed its methodology, peer selection and the difficulty with some sector funds, expenses and fees, and performance relative to the respective Fund’s peers. SI also discussed the Funds size and how a respective Fund’s size would affect economies of scale, in particular, operating expenses.
Also included in the 15(c) discussion was a briefing on factors affecting the ICON investment model; expenses and expense ratios of each Fund and other ICON managed products; relative performance of each Fund; status of expense reimbursements to the Funds by the Adviser; sales and marketing initiatives; specific business factors affecting IDI; the work load on ICON as adviser and administrator to the Funds; current profitability of ICON; staffing levels and staff morale.
The Independent Trustees were represented by independent legal counsel in this process. In August 2015, after participating in the meeting with SI and management, the Independent met separately as a group in private sessions with their independent legal counsel to review and discuss the foregoing information. Based on these discussions, independent legal counsel and/or the Lead Independent Trustee also contacted management to request additional information concerning the AthenaInvest rankings and other issue raised in the SI meeting. In addition, the Board received materials from legal counsel discussing the legal standards applicable to their consideration of the ICON-Trust agreements.
In considering the nature, extent and quality of the services provided by the Adviser, the Board reviewed information relating to ICON’s operations and personnel. Among other things, the Adviser provided biographical information on its professional staff and descriptions of its organizational and management structure. In the course of their deliberations the Board evaluated, among other things, information relating to the investment philosophy, strategies and techniques used in managing each Fund, the qualifications and experience of ICON’s investment personnel, ICON’s compliance programs, ICON’s brokerage practices, including the extent to which the Adviser obtains research through “soft dollar” arrangements with the Funds’ brokerage, compliance reports on the foregoing, and the financial and non-financial resources available to provide services required under the Advisory Agreement.
During the discussion, the SI Report and the AthenaInvest Data were discussed and management personnel showed performance for each fund and discussed the factors affecting performance. The Board inquired from SI whether there was any correlation between fund expenses and performance, and SI saw no correlation with the ICON Funds. During the discussion on performance, management personnel noted that from a strategy (Athena) perspective, 2014
was very difficult for active managers. Behaviors that historically have been rewarded and led to high strategy consistency ratings were not rewarded in 2014. Those behaviors include willingness to look different from an index, concentration of securities, conviction in securities selections, and holding stocks similar to other managers in a stated strategy. Causing further frustration in 2014, many stock and industry moves were not based on value, as ICON measures it. Something changed entering 2015. Behaviors that have been associated with superior performance in the past have been rewarded in the first part of 2015. Industry and sector selection have been better contributors to performance the first half of 2015 meaning that, more than last year, sector and industry tilts have been rewarded. ICON measures how sector indexes are in correlation with the S&P 1500 and 600 Indexes on a trailing 13-week basis. In 2015, the correlations have dropped, indicating sector differences in performance. Along with the decreasing correlations, sector returns have changed from 2014. Utilities was #1 in 2014, but is the worst at #10 for 2015. Consumer Discretionary has swung from #6 in 2014 to #2 the first half of 2015. In summary, value has been useful in rotating and capturing the industry and sector leadership of 2015.
In addition, in 2014 large cap stocks beat small cap stocks. As indexes are market capitalization weighted, index huggers did well in 2014. For the first six months of 2015, S&P 500 Index gained 1.56% whereas the S&P Small Cap 600 Index beat it, gaining 4.15%. In this market setting the ICON Funds did well across the Fund family: sector funds, diversified funds and international funds.
The Trustees noted that Advisers’ performance relative to other valuation managers as judged by the AthenaInvest system is above the medium. SI also noted that from a performance point of view, the Funds in the SI Report are compared using the Morningstar data, and there is no Morningstar category for “all cap” funds, but all ICON Funds are improving.
The Board addressed style consistency with the Adviser. Management advised that, based on the Adviser’s own analysis, and with the restructuring of the Adviser, the Adviser has continued an additional level of review on the Portfolio Managers (“PMs”) to make sure they are adhering to the ICON System; the Senior Vice President of Fund Management has been systematically tracking the Funds’ performance; he evaluates each of the ICON Funds to help ensure all PMs are investing consistently and in accordance with the ICON System by evaluating the Funds from an attribution perspective in monthly meetings.
In connection with reviewing data bearing upon the nature, quality, and extent of services furnished by ICON to each Fund, the Board assessed data concerning ICON’s staffing, systems and facilities. The Board also assessed
ICON’s non-Trust business to see if there are any initiatives that would dilute service to the Trust. The Board concluded:
A. That the breadth and the quality of investment advisory and other services being provided to each Fund is satisfactory, as evidenced in part by efforts to address and improve the performance record of each Fund when compared with the performance records of a peer group of comparable funds and markets in general;
B. That the breadth and the quality of investment advisory and other services being provided to each Fund are satisfactory, the Adviser’s performance is competitive with other fund managers in the value style group, and the Adviser has applied a disciplined approach in the style specified in the Funds’ offering document;
C. That ICON has made significant expenditures in the past year and in prior years to ensure that it has the sophisticated systems and the highly trained personnel necessary for it to be able to continue to provide quality service to the Funds’ shareholders, including the dedication of substantial resources to ICON’s investment and methodology;
D. That the Board, after considering compliance reports and compliance initiatives undertaken during the year and conducting individual interviews with selected PMs, is satisfied with the research and portfolio management, that research and portfolio management is being constantly evaluated and improved upon; and that the PMs are evaluating trading services systematically, the Board concluded that the Adviser is providing the Funds with professional management of the nature, quality and scope required by the Funds; and
E. The risks assumed by ICON in providing investment advisory services to each Fund, including the capital commitments which have been made in the past and which continue to be made by ICON to ensure the continuation of the highest quality of service to the Trust, is made with the recognition that shareholders may redeem their shares at any time without notice and the Trust’s advisory relationship with ICON may be terminated at any time and must be renewed on an annual basis.
In considering the reasonableness of the fees paid to the Adviser for managing each Fund, the Board reviewed, among other things, data concerning other funds from the SI Report, financial statements of the Adviser and an analysis of the profitability of the Adviser, and its affiliates, and their relationship with each Fund over various time periods. Such analysis identified all revenues and other benefits received by the Adviser and its affiliates from managing each Fund, the costs associated with providing such services and the resulting profitability to the Adviser and its
affiliates and a comparison of similar data from reports filed by publicly traded firms.
The Board assessed actual (net) fees for advisory services and Fund expense ratios under the contractual relationship (the Advisory agreements and the Expense Limitation Agreements) with the Adviser as opposed to the fees specified in the applicable Advisory Agreement and expense ratios without application of the expense limitations and concluded that the focus should be on actual expense ratios after application of the Expense Limitation Agreements.
The Board considered the current and anticipated asset levels of each Fund and the contractual commitments of the Adviser to waive fees and pay expenses of the Funds from time to time to limit the total expenses of the Funds. In this regard the Board discussed asset levels in each Fund covered by the Advisory Agreements. ICON’s ability to provide the services called for under the Advisory Agreements was assessed in light of current and projected asset levels. Fund expenses and expense ratios were also assessed in light of current and projected asset levels. The Board concluded that the Adviser has the resources necessary to provide the services called for under the Advisory Agreements; that profitability to the Adviser and its affiliates from their relationship with the Funds, and services provided to the Funds, is not excessive; and that the Adviser is not realizing material benefits from economies of scale that would warrant adjustments to the fees for any Fund at this time. The Board of Trustees concluded that, in light of the nature, extent and quality of the services provided by the Adviser and the levels of profitability associated with providing these services, the fees charged by the Adviser under the Advisory Agreements to each Fund are reasonable.
In connection with assessing data bearing on the fairness of fee arrangements, the Board considered the SI Report. It was noted that SI was selected at the May Board meeting to prepare its report, an extensive analysis of the expense data of other comparable funds; and that Trustee input was solicited and provided in the process. Among other information discussed, it was noted that:
A. the advisory fee structures of the Funds are within the range of funds considered in the comparison with advisory fees and expense ratios of other similarly managed funds as set forth in the comparative data;
B. ICON has contractually agreed to impose expense limitations on each and every Fund at a cost to ICON;
C. ICON has contractually committed to break points in its fees so that economies of scale could be realized as a Fund grows in assets, for the benefit of Fund shareholders.
The Board also considered the fees charged by the Adviser to other advisory clients as outlined in its Registration Application on Form ADV in connection with assessing data bearing on the fairness of fee arrangements. The Trustees noted that certain ICON institutional/sub-advised type accounts have lower fees than the fees paid by the Funds for a number of reasons, including but not limited to, those clients call for different commitments of time, institutional clients have low and predictable turnover of assets, in competition joint costs are apportioned among paying customers according to elasticity of demand and the Adviser has a limited level of responsibility in sub-managed accounts, or accounts with an investor agent/advisor.
The Board noted that the Funds’ redemptions were similar to industry averages which showed two things: 1) that the Funds’ Performance was not adversely impacting fund redemptions, and 2) that the fees and costs were competitive when compared to size. The Board noted that there are thousands of mutual funds competing; that investors can search and trade funds on the internet or on platforms at very little or no cost; and that if the Adviser were overcharging for its services, with its performance being what it is, the Board would have expected redemptions in excess of industry norms.
The Board concluded that the Adviser is providing the Funds with professional management at a fair, reasonable and competitive price.
In connection with assessing the direct and indirect benefits to ICON from serving as the Funds’ adviser, the Board discussed services provided under the Distribution Agreement and the Administrative Services Agreement which are in addition to services under the Advisory Agreements. It was noted that IDI does not charge a fee to the Funds for its services and that ICON’s fee for administrative services appears to be consistent with such fees in other fund groups. The Board noted that ICON receives research assistance (primarily in the form of data) from the use of soft dollars generated from Fund portfolio transactions; that such research assists ICON in providing quality advisory services; that Trust and Adviser compliance personnel continuously evaluate and report on the soft-dollar arrangements and related costs; and the Board concluded that the arrangements are consistent with Fund brokerage practices and benefit the Funds and their shareholders.
Based on these considerations, the Board, including all of the Independent Trustees, concluded that: 1) the continuation of the Advisory Agreements was in the best interests of each Fund and its shareholders, 2) the services to be performed under the Advisory Agreements were required for the operation of the Funds, 3) the advisory services were satisfactory to the Funds in the past, and 4) the fees for the advisory services and other benefits from the relationship with the Trust received by ICON, and its
affiliates, were consistent with fees paid by similar funds and other clients of ICON, and were reasonable in light of the comparative data, and within the range of what would have been negotiated at arm’s length in light of all the circumstances.
Supplemental Tax Information
For corporate shareholders, the following percentage of the total ordinary income dividends paid during the fiscal year ended September 30, 2015, qualifies for the corporate dividends received deduction for the following Funds:
| | | | |
| Fund | | Dividends Received Deduction | |
ICON Consumer Discretionary Fund | | | 13.2 | % |
ICON Consumer Staples Fund | | | 77.3 | |
ICON Energy Fund | | | 91 | |
ICON Financial Fund | | | 100 | |
ICON Healthcare Fund | | | 4.2 | |
ICON Industrials Fund | | | 100 | |
ICON Materials Fund | | | 100 | |
ICON Utilities Fund | | | 100 | |
For the fiscal year ended September 30, 2015, the following funds paid qualified dividend income:
| | | | |
| Fund | | Amount | |
ICON Consumer Discretionary Fund | | | 13.6% | |
ICON Consumer Staples Fund | | | 78.7% | |
ICON Energy Fund | | | 99% | |
ICON Financial Fund | | | 100% | |
ICON Healthcare Fund | | | 4.3% | |
ICON Industrials Fund | | | 100% | |
ICON Materials Fund | | | 100% | |
ICON Utilities Fund | | | 100% | |
The Funds designate the following amounts, or the maximum amount needed, as long-term capital gain distributions qualifying for the maximum 20% income tax rate for individuals:
| | | | |
| Fund | | Amount | |
ICON Consumer Discretionary Fund | | $ | 4,938,010 | |
ICON Consumer Staples Fund | | | 3,043,787 | |
ICON Energy Fund | | | 94,805,687 | |
ICON Healthcare Fund | | | 15,513,304 | |
Portfolio Holdings
Information related to the 10 largest portfolio holdings of each Fund is made available at www.iconfunds.com within approximately 10 business days after month-end. Additionally, a complete list of each Fund’s holdings is made available approximately 30 days after month-end. Each ICON Fund also files a complete schedule of portfolio holdings for the first and third quarters of its fiscal year with the Securities and Exchange Commission (the “Commission”) on Form N-Q. The ICON Funds’ Forms N-Q are available at www.sec.gov or may be reviewed and copied at the Commission’s Public Reference Room in Washington, DC. Information about the Public Reference Room may be obtained by calling 1-800-SEC-0330.
Proxy Voting
A summarized description of the policies and procedures the ICON Funds use to vote proxies is available free of charge at www.iconfunds.com or by calling 1-800-764-0442.
Information about how the ICON Funds voted proxies related to each Fund’s portfolio securities during the 12-month period ended June 30 is available free of charge at www.iconfunds.com or on the Commission’s website at www.sec.gov.
Cost Basis Information
Effective January 1, 2012, federal law requires mutual fund companies to maintain and report a shareholder’s cost basis by tax lot, gain/loss information and holding period of covered shares to the Internal Revenue Service on Form 1099. Covered shares are mutual fund shares acquired on or after January 1, 2012. A fund is not required to maintain and report information for shares not deemed as covered.
The new law requires each fund to elect a default tax identification methodology in order to perform the required reporting. As a result, the Trust has chosen Average Cost as its default tax identification methodology. This is the method each Fund will use. However, at the time of purchase or upon the sale of covered shares, shareholders may choose a different tax identification method. Furthermore, if you purchase shares through a financial intermediary, please contact the intermediary to find out what default tax identification method they will use. We recommend that you consult your tax adviser to determine which tax identification methodology best suits your individual tax situation.
For More Information
This report is for the general information of the Funds’ shareholders and is not authorized for distribution to prospective investors unless preceded or accompanied by a current prospectus. You may obtain a copy of the prospectus, which contains information about the investment objectives, risks, charges, expenses, and share classes of each ICON Fund, by visiting www.iconfunds.com or by calling 1-800-764-0442. Please read the prospectus carefully before investing.
ICON Distributors, Inc., Distributor.
ICON FUNDS PRIVACY INFORMATION
| | |
| FACTS | | WHAT DOES ICON DO WITH YOUR PERSONAL INFORMATION? |
| | |
| Why? | | Financial companies choose how they share your personal information. Federal law gives consumers the right to limit some but not all sharing. Federal law also requires us to tell you how we collect, share, and protect your personal information. Please read this notice carefully to understand what we do. |
| | |
| What? | | The types of personal information we collect and share depend on the product or service you have with us. This information can include: n Social Security number and account balances n income and transaction history n checking account information and wire transfer instructions When you are no longer our customer, we continue to share your information as described in this notice. |
| | |
| How? | | All financial companies need to share customers’ personal information to run their everyday business. In the section below, we list the reasons financial companies can share their customers’ personal information; the reasons ICON chooses to share; and whether you can limit this sharing. |
| | | | |
| Reasons we can share your personal information | | Does ICON share? | | Can you limit this sharing? |
For our everyday business purposes — such as to process your transactions, maintain your account(s), respond to court orders and legal investigations, or report to credit bureaus | | Yes | | No |
For our marketing purposes — to offer our products and services to you | | No | | We don’t share |
| For joint marketing with other financial companies | | No | | We don’t share |
For our affiliates’ everyday business purposes — information about your transactions and experiences | | No | | We don’t share |
For our affiliates’ everyday business purposes — information about your creditworthiness | | No | | We don’t share |
| For nonaffiliates to market to you | | No | | We don’t share |
| | |
| Questions? | | Call 1-800-764-0442 for the ICON Funds and 1-800-828-4881 for ICON Advisers, Inc. and ICON Distributors, Inc. |
| | |
| 120 | | FUNDS PRIVACY INFORMATION |
| | |
| Who we are | | |
| Who is providing this notice? | | ICON Funds, ICON Advisers, Inc., and ICON Distributors, Inc. (collectively “ICON”) |
| What we do | | |
| How does ICON protect my personal information? | | To protect your personal information from unauthorized access and use, we use security measures that comply with federal law. These measures include computer safeguards and secured files and buildings. Contracts with our service providers require them to restrict access to your non-public personal information, and to maintain physical, electronic and procedural safeguards against unintended disclosure. |
| How does ICON collect my personal information? | | We collect your personal information, for example, when you n open an account or enter into an investment advisory contract n provide account information or give us your contact information n make a wire transfer We also collect your personal information from others, such as credit bureaus, affiliates, or other companies. |
| Why can’t I limit all sharing? | | Federal law gives you the right to limit only n sharing for affiliates’ everyday business purposes — information about your creditworthiness n affiliates from using your information to market to you n sharing for nonaffiliates to market to you State laws and individual companies may give you additional rights to limit sharing. |
| Definitions | | |
| Affiliates | | Companies related by common ownership or control. They can be financial and nonfinancial companies. n Our affiliates include financial companies such as ICON Funds, ICON Advisers, Inc., and ICON Distributors, Inc. |
| Nonaffiliates | | Companies not related by common ownership or control. They can be financial and nonfinancial companies. n Nonaffiliates we share with can include financial companies such as custodians, transfer agents, registered representatives, financial advisers and nonfinancial companies such as fulfillment, proxy voting, and class action service providers |
| Joint marketing | | A formal agreement between nonaffiliated financial companies that together market financial products or services to you. n ICON doesn’t jointly market |
| | | | |
| FUNDS PRIVACY INFORMATION | | | 121 | |
For more information about the ICON Funds, contact us:
| | |
| |
| By Telephone | | 1-800-764-0442 |
| |
| By Mail | | ICON Funds P.O. Box 55452 Boston, MA 02205-8165 |
| |
| In Person | | ICON Funds 5299 DTC Boulevard, 12th Floor Greenwood Village, CO 80111 |
| |
| On the Internet | | www.iconfunds.com |
| |
| By E-Mail | | info@iconadvisers.com |
Item 2. Code of Ethics.
(a) The registrant has adopted a code of ethics that applies to the registrant’s principal executive officer, principal financial officer, principal accounting officer or controller, or persons performing similar functions. This code of ethics is included as an Exhibit.
(b) Not used.
(c) There were no amendments, during the period covered by this report, to a provision of the code of ethics that applies to the Registrant’s principal executive officer, principal financial officer, principal accounting officer or controller, or persons performing similar functions, regardless of whether these individuals are employed by the Registrant or a third party, and that relates to any element of the code of ethics description.
(d) The registrant has not granted any waivers, including an implicit waiver, from a provision of the code of ethics that applies to the Registrant’s principal executive officer, principal financial officer, principal accounting officer or controller, or persons performing similar functions, regardless of whether these individuals are employed by the Registrant or a third party, that relates to one or more of the items set forth in paragraph (b) of this item’s instructions.
(e) Not applicable.
(f) See the attached Exhibit.
Item 3. Audit Committee Financial Expert.
3(a)(1) The Registrant’s Board of Trustees has determined that the registrant has at least one audit committee financial expert serving on its audit committee.
3(a)(2) The audit committee financial experts are Glen F. Bergert and R. Michael Sentel, who are “independent” for purposes of this Item 3 of Form N-CSR.
3(a)(3) Not applicable.
Item 4. Principal Accountant Fees and Services.
In each of the fiscal years ended September 30, 2015 and September 30, 2014, the aggregate Audit Fees billed (or to be billed) by PricewaterhouseCoopers LLP (“PwC”) for professional services rendered for the audits of the financial statements, or services that are normally provided in connection with statutory and regulatory filings or engagements as well as reimbursable expenses are listed below. All of the below fees were paid by the Registrant.
| | | | | | |
| 2015 | | | 2014 | |
| $ | 365,365 | | | $ | 375,563 | |
In each of the fiscal years ended September 30, 2015 and September 30, 2014, the aggregate Audit-Related Fees billed (or to be billed) by PwC for services rendered for assurance and related services to each fund that are reasonably related to the performance of the audit or review of the fund’s financial statements, but not reported as Audit Fees, are shown in the table below.
In each of the fiscal years ended September 30, 2015 and September 30, 2014 the aggregate Tax Fees billed (or to be billed) by PwC for professional services rendered for tax return preparation, tax compliance, tax advice and tax planning are shown in the table below. All of the below fees were paid by the Registrant.
| | | | | | |
| 2015 | | | 2014 | |
| $ | 134,800 | | | $ | 136,500 | |
In each of the fiscal years ended September 30, 2015 and September 30, 2014 the aggregate Other Fees billed (or to be billed) by PwC for all other non-audit services rendered are shown in the table below. All of the below fees were paid by the Registrant.
(e)(1) The audit committee of the Registrant’s Board of Trustees is required to pre-approve all services to be provided by the independent accountants to the Registrant or the Registrant’s investment adviser and to any entity controlling, controlled by or under common control with the investment adviser that provides on-going services to the Registrant to determine whether the services performed by the independent accountants impair their independence from the Registrant. The audit committee has delegated authority to the Chairman of the audit committee, subject to review and ratification by the full audit committee.
(e)(2) 100% of the fees were approved by the Registrant’s audit committee pursuant to paragraph (c)(7)(i)(C) if Rule 2-01 of Regulation S-X.
(f) For the fiscal year ended September 30, 2015, the percentage of hours spent on the audit of the Registrant’s financial statements that were attributed to work performed by persons who are not full-time, permanent employees of PwC was 0%.
(g) See Item 4(d) above.
(h) There were no non-audit fees provided by PwC in the fiscal year ending September 30, 2015 or September 30, 2014 to the investment adviser or to any entity controlling, controlled by, or under common control with the investment adviser that provides on-going services to the Registrant.
| Item 5. | Audit Committee of Listed Registrants. |
Not applicable.
(a) The schedule of investments in securities of unaffiliated issuers is included in Item 1.
(b) Not applicable.
Item 7. Disclosure of Proxy Voting Policies and Procedures for Closed-End Management Investment Companies.
Not applicable.
Item 8. Portfolio Managers of Closed-End Management Investment Companies.
Not applicable.
Item 9. Purchases of Equity Securities by Closed-End Management Investment Company and Affiliated Purchasers.
Not applicable.
Item 10. Submission of Matters to a Vote of Security Holders.
Not applicable.
Item 11. Controls and Procedures.
(a) The registrant’s principal executive officer and principal financial officer have concluded, based on their evaluation of the Registrant’s disclosure controls and procedures as conducted within 90 days of the filing date of this report, that these disclosure controls and procedures are adequately designed and are operating effectively to ensure that information required to be disclosed by the registrant on Form N-CSR is recorded, processed, summarized and reported within the time periods specified in the Securities and Exchange Commission’s rules and forms.
(b) There were no changes in the registrant’s internal control over financial reporting that occurred during the second fiscal quarter of the period covered by this report that have materially affected or are reasonably likely to materially affect, the registrant’s internal control over financial reporting.
Item 12. Exhibits.
(a)(1) The code of ethics is attached.
(a)(2) Certifications pursuant to Rule 30a-2(a) are attached.
(a)(3) Not applicable.
(b) Certifications pursuant to Rule 30a-2(b) are furnished herewith.
SIGNATURES
Pursuant to the requirements of the Securities Exchange Act of 1934 and the Investment Company Act of 1940, the registrant has duly caused this report to be signed on its behalf by the undersigned, thereunto duly authorized.
| | |
| By (Signature and Title)* | | /s/ Craig T. Callahan |
| | Craig T. Callahan, President and Chief Executive Officer (Principal Executive Officer) |
Pursuant to the requirements of the Securities Exchange Act of 1934 and the Investment Company Act of 1940, this report has been signed below by the following persons on behalf of the registrant and in the capacities and on the dates indicated.
| | |
| By (Signature and Title)* | | /s/ Craig T. Callahan |
| | Craig T. Callahan, President and Chief Executive Officer (Principal Executive Officer) |
| | |
| By (Signature and Title)* | | /s/ Carrie M. Schoffman |
| | Carrie M. Schoffman, Vice President, Chief Compliance Officer and Treasurer (Principal Financial Officer and Principal Accounting Officer) |
| * | Print the name and title of each signing officer under his or her signature. |