UNITED STATES
SECURITIES AND EXCHANGE COMMISSION
Washington, D.C. 20549
FORM N-CSR
CERTIFIED SHAREHOLDER REPORT OF REGISTERED
MANAGEMENT INVESTMENT COMPANIES
Investment Company Act file number 811-07883
ICON Funds
(Exact name of registrant as specified in charter)
5299 DTC Blvd. Suite 1200 Greenwood Village, CO 80111
(Address of principal executive offices) (Zip code)
Carrie Schoffman
5299 DTC Blvd. Suite 1200 Greenwood Village, CO 80111
(Name and address of agent for service)
Registrant’s telephone number, including area code: 303-790-1600
Date of fiscal year end: September 30, 2016
Date of reporting period: September 30, 2016
Item 1. Reports to Stockholders.
Diversified Funds
ICON Bond Fund
ICON Equity Income Fund
ICON Fund
ICON Long/Short Fund
ICON Opportunities Fund
ICON Risk-Managed Balanced Fund

You can now sign up for electronic delivery of ICON Fund shareholder reports, including prospectuses, annual reports, semiannual reports and proxy statements.
When these materials are available, you will receive an email from ICON with instructions on how to view the documents. Statements, transaction confirmations and other documents that are not available online will continue to be sent to you by U.S. mail.
Visit ICON’s website at www.iconfunds.com to learn more and sign up.
You may change or cancel your participation in eDelivery by visiting www.iconfunds.com, or you can request a hard copy of any of the materials free of charge by calling ICON Funds at 1-800-764-0442.
| | | | |
1-800-764-0442 | | ● | | www.iconfunds.com |
TABLE OF CONTENTS
| | |
| ICON Diversified Funds | | About This Report |
| | September 30, 2016 (Unaudited) |
Historical Returns
All total returns mentioned in this Report account for the change in a Fund’s per-share price and the reinvestment of any dividends, capital gain distributions and adjustments for financial statement purposes. If your account is set up to receive Fund distributions in cash rather than to reinvest them, your actual return may differ from these figures. The Funds’ performance results do not reflect the deduction of taxes that a shareholder would pay on Fund distributions or on the redemption of Fund shares. The Adviser may have reimbursed certain fees or expenses of some of the Funds. If not for these reimbursements, performance would have been lower. Fund results shown, unless otherwise indicated, are at net asset value. If a sales charge (maximum 5.75%) had been deducted, results would have been lower.
Past performance does not guarantee future results. Investment return and principal value will fluctuate so that an investor’s shares, when redeemed, may be worth more or less than their original cost. Performance results represent past performance, and current performance may be higher or lower. Please call 1-800-764-0442 or visit www.iconfunds.com for performance results current to the most recent month-end.
Portfolio Data
This Report reflects ICON’s portfolio holdings as of September 30, 2016, the end of the reporting period. The information is not a complete analysis of every aspect of any sector, industry, security or the Funds.
There are risks associated with mutual fund investing, including the loss of principal. The likelihood of loss may be greater if you invest for a shorter period of time. There is no assurance that the investment process will consistently lead to successful results.
There are risks associated with selling short, including the risk that the ICON Long/Short Fund may have to cover its short position at a higher price than the short price, resulting in a loss. The ICON Long/Short Fund’s loss on a short sale is potentially unlimited as a loss occurs when the value of a security sold short increases. Call options involve certain risks, such as limited gains and lack of liquidity in the underlying securities, and are not suitable for all investors.
Investing in fixed income securities such as bonds involves interest rate risk. When interest rates rise, the value of fixed income securities generally decreases. The ICON Bond Fund and ICON Equity Income Fund may invest up to 35% and 25% of its assets in high-yield bonds that are below investment grade, respectively. ICON Risk-Managed Balanced Fund may invest up to 10% of its assets in high-yield bonds that are below investment grade. High-yield bonds involve a greater risk of default and price volatility than U.S. Government and other higher-quality bonds.
An investment concentrated in sectors and industries may involve greater risk and volatility than a more diversified investment.
Investments in foreign securities may entail unique risks, including political, market, and currency risks. Financial statements of foreign companies are governed by different accounting, auditing, and financial standards than U.S. companies and may be less transparent and uniform than in the United States. Many corporate governance standards, which help ensure the integrity of public information in the United States, do not exist in foreign countries. In general, there may be less governmental supervision of foreign stock exchanges and securities brokers and issuers. The ICON system relies on the integrity of the financial statements released to the market as part of our analysis.
Investments in other mutual fund companies may entail certain risks. For example, the Fund’s performance depends on the underlying funds in which it invests, and it is subject to the risks of the underlying funds. Additionally, an investment by the Fund or underlying fund in exchange-traded funds generally presents the same primary risks as an investment in a mutual fund.
The prospectus and statement of additional information contain this and other information about the Funds and are available by visiting www.iconfunds.com or calling 1-800-764-0442. Please read the prospectus and statement of additional information carefully.
Financial Intermediary
If you purchase the Fund through a broker-dealer or other financial intermediary (such as a bank), the Fund and its related companies may pay the intermediary for the sale of Fund shares and related services. These payments may influence the broker-dealer or other intermediary and your salesperson to recommend the Fund over another investment. Ask your salesperson or visit your financial intermediary’s website for more information.
| | |
| ICON Bond Fund | | Management Overview |
| | September 30, 2016 (Unaudited) |
| Q. | How did the Fund perform relative to its benchmark? |
| A. | For the Fund’s fiscal year ended September 30, 2016, the ICON Bond Fund (the Fund) Class S shares outperformed its benchmark, the Barclays Capital U.S. Universal Index (ex-MBS). The Fund returned 7.54% while the Barclays Capital U.S. Universal Index (ex-MBS) returned 6.89%. Total returns for other periods and additional Class shares as of September 30, 2016, appear in the subsequent pages of this Fund’s Management Overview. |
| Q. | What primary factors were behind the Fund’s relative performance? |
| A. | Similar to last year, many investors began fiscal year 2016 anticipating upward pressure on interest rates as the Federal Reserve began a tightening cycle. However, as the year unfolded, the combination of falling commodity prices and global economic volatility created yet another year of falling interest rates and rallying bond prices. The yield on the 10-year U.S. Treasury began the fiscal year at about 2.04%, rose to 2.34% in mid-November 2015 as investors began pricing in the anticipated rate rise, fell to 1.36% in early July 2016 as prospects for increasing rates fell, and finally finished the fiscal year at 1.59%. In addition to the volatility in the U.S. Treasury market, corporate bond spreads experienced volatility of their own as default concerns for commodity related companies spiked when the price of oil and other industrial metals collapsed to current cycle lows during the first half of the fiscal year. However, those concerns were short-lived as the commodity market calmed and corporate bond spreads reversed course to finish the fiscal year slightly tighter than where they began. |
Over the course of the fiscal year, the Fund maintained a lower overall duration and underexposure to U.S. Treasuries relative to the benchmark, which proved to be a headwind from a curve return standpoint. However, this curve underperformance was offset by positive returns in specific segments of the corporate bond market, closed-end fund arbitrage plays, and investments in preferred securities, resulting in outperformance relative to the benchmark over the course of the fiscal year.
| Q. | How did the Fund’s composition affect performance? |
| A. | As stated above, the Fund outperformed its benchmark during the fiscal year. The outperformance stemmed from positive allocation effect, mainly from selections in the preferred share segment of the market and an overweight position in corporate credit which produced strong relative returns over the course of the fiscal year. Closed-end fund positions also produced strong returns relative to the benchmark, contributing positively to the Fund’s performance. The Fund also had positive selection effect in the corporate bond segment of the market where holdings within the Industrials, Financials, and Energy sectors of the market experienced larger spread tightening movement than the broad market. |
Negative allocation effect came from the Fund’s underexposure to both U.S. Treasuries and Securitized Debt. Based on our internal assumption of risk and returns, we felt as though an overweight allocation to these segments of the market was unwarranted and would rather look to focus on bottom up security selection.
| Q. | What is your investment outlook for the bond market? |
| A. | At the end of fiscal year 2016, both investment grade and high yield corporate bond spreads were trading at levels that we deemed close to fair value. With spreads at these levels we are focused on our bottom up approach to find issue specific opportunities. While we don’t anticipate a substantial upward movement in interest rates over the course of the next 12 months, the Fund is positioned in the lower portion of its duration range as we move into fiscal year 2017. We continue to shy away from interest rate forecasts and remain steadfast in our search for issue specific opportunities. While future bond market volatility might be substantial, we believe our bottom up investment methodology will help the Fund navigate the changing market. |
| | |
| |
| Annual Report | September 30, 2016 | | 3 |
| | |
| ICON Bond Fund | | Management Overview |
| | September 30, 2016 (Unaudited) |
Average Annual Total Return (as of September 30, 2016)
| | | | | | | | | | | | | | | | | | | | | | | | | | | | | | | | | | | |
| | | Inception Date | | 1 Year | | 5 Years | | 10 Years | | Since Inception | | Gross Expense
Ratio* | | Net Expense
Ratio* |
ICON Bond Fund - Class S | | | | 5/6/04 | | | | | 7.54% | | | | | 4.38% | | | | | 4.92% | | | | | 4.66% | | | | | 1.06% | | | | | 0.90% | |
ICON Bond Fund - Class C | | | | 10/21/02 | | | | | 6.59% | | | | | 3.49% | | | | | 4.04% | | | | | 4.13% | | | | | 2.34% | | | | | 1.75% | |
ICON Bond Fund - Class A | | | | 9/30/10 | | | | | 7.25% | | | | | 4.14% | | | | | N/A | | | | | 3.43% | | | | | 1.51% | | | | | 1.15% | |
ICON Bond Fund - Class A | | | | | | | | | | | | | | | | | | | | | | | | | | | | | | | | | | | |
(including maximum sales charge of 4.75%) | | | | 9/30/10 | | | | | 2.12% | | | | | 3.14% | | | | | N/A | | | | | 2.60% | | | | | 1.51% | | | | | 1.15% | |
Barclays Capital U.S. Universal Index | | | | | | | | | 6.11% | | | | | 3.62% | | | | | 5.00% | | | | | 5.09% | | | | | N/A | | | | | N/A | |
Barclays Capital U.S. Universal Index
(ex-MBS) | | | | | | | | | 6.89% | | | | | 3.96% | | | | | 5.06% | | | | | 5.30% | | | | | N/A | | | | | N/A | |
Past performance is not a guarantee of future results. Information about these performance results and the comparative indexes can be found in the About This Report section. The Adviser has agreed to limit certain Fund expenses; without these limitations, returns would have been lower. The limitation provisions may be terminated in the future.
| * | Please see the most recent prospectus for details. |
Class C total returns exclude applicable sales charges. If sales charges were included returns would be lower.
Value of a $10,000 Investment (through September 30, 2016)
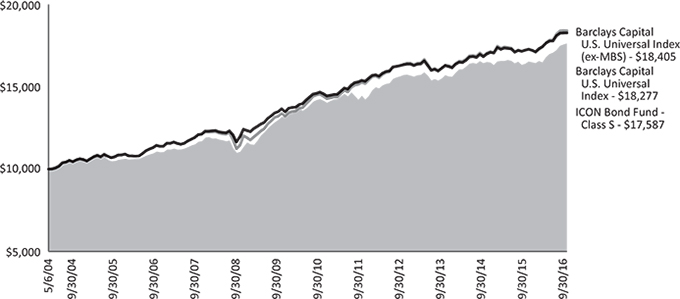
Past performance is not a guarantee of future results. The above graph compares a $10,000 investment made in the Bond Fund’s Class S shares on the Class’ inception date of 5/6/04 to a $10,000 investment made in an unmanaged securities index on that date. Performance for the Bond Fund’s other share classes will vary due to differences in charges and expenses. The Bond Fund’s performance in this chart and the performance table assumes the reinvestment of dividends and capital gain distributions but does not reflect the deduction of taxes that a shareholder would pay on Fund distributions or on the redemption of Fund shares.
| | |
| ICON Bond Fund | | Schedule of Investments |
| | September 30, 2016 |
| | | | | | | | | | |
| | | Shares or Principal Amount | | Value |
Corporate Bonds (59.18%) | | | | | | | | | | |
Consumer Discretionary (1.16%) | | | | | | | | | | |
International Game | | | | | | | | | | |
Technology | | | | | | | | | | |
5.35%, 10/15/23 | | | $ | 1,000,000 | | | | $ | 1,010,000 | |
| | | | | | | | | | |
| | |
Consumer Staples (13.55%) | | | | | | | | | | |
Bumble Bee Holdings, Inc. | | | | | | | | | | |
9.00%, 12/15/17(a) | | | | 650,000 | | | | | 653,250 | |
CVS Health Corp. | | | | | | | | | | |
4.75%, 12/01/22 | | | | 2,500,000 | | | | | 2,835,678 | |
Innovation Ventures LLC / | | | | | | | | | | |
Innovation Ventures | | | | | | | | | | |
Finance Corp. | | | | | | | | | | |
9.50%, 08/15/19(a) | | | | 1,500,000 | | | | | 1,577,250 | |
Kraft Heinz Foods Co. | | | | | | | | | | |
4.88%, 02/15/25(a) | | | | 3,711,000 | | | | | 4,093,426 | |
Molson Coors Brewing Co. | | | | | | | | | | |
3.00%, 07/15/26 | | | | 1,300,000 | | | | | 1,309,842 | |
WhiteWave Foods Co. | | | | | | | | | | |
5.38%, 10/01/22 | | | | 1,200,000 | | | | | 1,363,500 | |
| | | | | | | | | | |
| | | | | | | | | 11,832,946 | |
| | | | | | | | | | |
| | |
Financial (24.96%) | | | | | | | | | | |
Aircastle, Ltd. | | | | | | | | | | |
5.00%, 04/01/23 | | | | 1,400,000 | | | | | 1,463,000 | |
Ally Financial, Inc. | | | | | | | | | | |
8.00%, 03/15/20 | | | | 2,493,000 | | | | | 2,848,252 | |
American Equity Investment | | | | | | | | | | |
Life Holding Co. | | | | | | | | | | |
6.63%, 07/15/21 | | | | 500,000 | | | | | 521,188 | |
Berkshire Hathaway, Inc. | | | | | | | | | | |
2.75%, 03/15/23 | | | | 500,000 | | | | | 519,825 | |
E*TRADE Financial Corp. | | | | | | | | | | |
5.38%, 11/15/22 | | | | 500,000 | | | | | 533,010 | |
Infinity Property & Casualty Corp. | | | | | | | | | | |
5.00%, 09/19/22 | | | | 640,000 | | | | | 679,146 | |
International Lease Finance Corp. | | | | | | | | | | |
5.88%, 08/15/22 | | | | 1,500,000 | | | | | 1,663,125 | |
KeyCorp Capital II | | | | | | | | | | |
6.88%, 03/17/29 | | | | 1,094,000 | | | | | 1,241,865 | |
Liberty Mutual Insurance Co. | | | | | | | | | | |
7.88%, 10/15/26(a) | | | | 1,135,000 | | | | | 1,442,613 | |
MBIA, Inc. | | | | | | | | | | |
6.63%, 10/01/28 | | | | 2,439,000 | | | | | 2,512,170 | |
MetLife Capital Trust IV | | | | | | | | | | |
7.88%, 12/15/37(a) | | | | 1,000,000 | | | | | 1,254,598 | |
Neuberger Berman Group | | | | | | | | | | |
LLC / Neuberger Berman | | | | | | | | | | |
Finance Corp. | | | | | | | | | | |
5.88%, 03/15/22(a) | | | | 765,000 | | | | | 798,469 | |
NTC Capital I, Series A | | | | | | | | | | |
1.20%, 01/15/27(b) | | | | 1,500,000 | | | | | 1,297,500 | |
| | | | | | | | | | |
| | | Shares or
Principal Amount | | Value |
Financial (continued) | | | | | | | | | | |
Prudential Financial, Inc. | | | | | | | | | | |
8.88%, 06/15/38(b) | | | $ | 1,000,000 | | | | $ | 1,110,000 | |
SouthTrust Bank | | | | | | | | | | |
6.13%, 01/09/28 | | | | 750,000 | | | | | 910,490 | |
State Street Capital Trust I | | | | | | | | | | |
1.38%, 05/15/28(b) | | | | 1,250,000 | | | | | 1,125,000 | |
USB Realty Corp. | | | | | | | | | | |
1.83%, 01/15/17(a)(b) | | | | 2,100,000 | | | | | 1,884,750 | |
| | | | | | | | | | |
| | | | | | | | | 21,805,001 | |
| | | | | | | | | | |
| | |
Health Care (6.44%) | | | | | | | | | | |
Amsurg Corp. | | | | | | | | | | |
5.63%, 11/30/20 | | | | 300,000 | | | | | 308,250 | |
HCA Holdings, Inc. | | | | | | | | | | |
5.25%, 04/15/25 | | | | 2,500,000 | | | | | 2,665,625 | |
Highmark, Inc., | | | | | | | | | | |
6.13%, 05/15/41(a)(c) | | | | 600,000 | | | | | 585,286 | |
St. Jude Medical, Inc. | | | | | | | | | | |
3.88%, 09/15/25 | | | | 1,935,000 | | | | | 2,063,544 | |
| | | | | | | | | | |
| | | | | | | | | 5,622,705 | |
| | | | | | | | | | |
| | |
Industrials (7.00%) | | | | | | | | | | |
General Electric Co., Series D | | | | | | | | | | |
5.00%, 01/21/21(b) | | | | 1,625,000 | | | | | 1,728,025 | |
Ingersoll-Rand Co. | | | | | | | | | | |
6.39%, 11/15/27 | | | | 1,260,000 | | | | | 1,495,730 | |
Overseas Shipholding Group, Inc. | | | | | | | | | | |
8.13%, 03/30/18(c) | | | | 1,000,000 | | | | | 1,052,500 | |
Spirit AeroSystems, Inc. | | | | | | | | | | |
5.25%, 03/15/22 | | | | 1,750,000 | | | | | 1,839,414 | |
| | | | | | | | | | |
| | | | | | | | | 6,115,669 | |
| | | | | | | | | | |
| | |
Information Technology (3.09%) | | | | | | | | | | |
Lender Processing Services, | | | | | | | | | | |
Inc. / Black Knight | | | | | | | | | | |
Lending Solutions, Inc. | | | | | | | | | | |
5.75%, 04/15/23 | | | | 2,565,000 | | | | | 2,699,662 | |
| | | | | | | | | | |
| | |
Materials (0.60%) | | | | | | | | | | |
USG Corp. | | | | | | | | | | |
5.88%, 11/01/21(a) | | | | 500,000 | | | | | 523,125 | |
| | | | | | | | | | |
| | |
Telecommunication Services (2.38%) | | | | | | | | | | |
EarthLink Holdings Corp. | | | | | | | | | | |
7.38%, 06/01/20 | | | | 1,000,000 | | | | | 1,051,250 | |
Lee Enterprises, Inc. | | | | | | | | | | |
9.50%, 03/15/22(a)(d) | | | | 1,000,000 | | | | | 1,032,500 | |
| | | | | | | | | | |
| | | | | | | | | 2,083,750 | |
| | | | | | | | | | |
| | |
Total Corporate Bonds | | | | | | | | | | |
(Cost $51,062,150) | | | | | | | | | 51,692,858 | |
| | | | | | | | | | |
| | |
The accompanying notes are an integral part of the financial statements. |
| Annual Report | September 30, 2016 | | 5 |
| | |
| ICON Bond Fund | | Schedule of Investments |
| | September 30, 2016 |
| | | | | | | | |
| | | Shares or Principal Amount | | | Value | |
| |
Convertible Corporate Bonds (2.38%) | |
Telecommunication Services (2.38%) | |
Clearwire Communications LLC / Clearwire Finance, Inc. 8.25%, 12/01/40(a) | | $ | 2,000,000 | | | $ | 2,077,500 | |
| | | | | | | | |
| |
Total Convertible Corporate Bonds (Cost $2,032,341) | | | | 2,077,500 | |
| | | | | | | | |
|
U.S. Treasury Obligations (3.43%) | |
U.S. Treasury Note 1.50%, 08/15/26 | | | 1,000,000 | | | | 990,977 | |
U.S. Treasury Note 1.63%, 02/15/26 | | | 2,000,000 | | | | 2,004,922 | |
| | | | | | | | |
| |
Total U.S. Treasury Obligations (Cost $2,957,717) | | | | 2,995,899 | |
| | | | | | | | |
|
Collateralized Mortgage Obligations (12.56%) | |
Citigroup Mortgage Loan Trust, Inc.,
Series 2013-J1, Class B3
3.54%, 02/25/38(a)(b)(c) | | | 480,268 | | | | 470,699 | |
Green Tree, Inc.,
Series 2008-HE1, Class A
9.50%, 03/25/38(a)(b)(c) | | | 425,715 | | | | 449,897 | |
MASTR Seasoned Securitization Trust, Inc.,
Series 2005-1, Class 1A1
6.52%, 09/25/32(b) | | | 1,060,839 | | | | 1,146,938 | |
Mill City Mortgage Trust,
Series 2015-1, Class M3
3.20%, 10/25/32(a)(b)(c) | | | 800,000 | | | | 781,497 | |
New Residential Mortgage Loan Trust,
Series 2016-1A, Class B3
5.56%, 03/25/56(a)(b)(c) | | | 489,658 | | | | 511,588 | |
Sequoia Mortgage Trust, Inc.,
Series 2013-12, Class B3
4.23%, 12/25/43(a)(b)(c) | | | 755,957 | | | | 766,794 | |
Towd Point Mortgage Trust, Inc.,
Series 2015-1, Class A5
3.51%, 06/25/29(a)(b)(c) | | | 2,500,000 | | | | 2,461,658 | |
Towd Point Mortgage Trust, Inc.,
Series 2015-4, Class M2
3.75%, 01/25/27(a)(b)(c) | | | 2,000,000 | | | | 1,984,399 | |
| | | | | | | | |
| | | Shares or Principal Amount | | | Value | |
| |
Collateralized Mortgage Obligations (continued) | |
Towd Point Mortgage Trust, Inc.,
Series 2015-2, Class 2M1
3.75%,
12/25/24(a)(b)(c) | | $ | 1,500,000 | | | $ | 1,560,369 | |
Towd Point Mortgage Trust, Inc.,
Series 2015-6, Class M2
3.75%,
02/25/28(a)(b)(c) | | | 300,000 | | | | 304,303 | |
Velocity Commercial Capital Loan Trust, Inc.,
Series 2014-1, Class M3
6.89%,
02/25/24(a)(b)(c) | | | 500,000 | | | | 530,313 | |
| | | | | | | | |
| |
Total Collateralized Mortgage Obligations (Cost $10,903,445) | | | | 10,968,455 | |
| | | | | | | | |
|
Preferred Stocks (5.39%) | |
Diversified Banks (4.11%) | |
GMAC Capital Trust I, Series 2 | | | 141,292 | | | | 3,590,229 | |
| | | | | | | | |
|
Diversified Operations (0.83%) | |
Pitney Bowes International Holdings, Inc., Series F(a)(c) | | | 700 | | | | 721,219 | |
| | | | | | | | |
| | |
Office REIT’s (0.45%) | | | | | | | | |
Gramercy Property Trust, Inc.,
Series A(c)(d) | | | 14,634 | | | | 397,167 | |
| | | | | | | | |
| |
Total Preferred Stocks (Cost $4,548,684) | | | | 4,708,615 | |
| | | | | | | | |
|
Closed-End Mutual Funds (9.79%) | |
BlackRock Income Trust, Inc.(d) | | | 99,117 | | | | 642,278 | |
Deutsche High Income Trust | | | 187,002 | | | | 1,722,289 | |
Deutsche Multi-Market Income Trust | | | 182,344 | | | | 1,559,041 | |
Deutsche Strategic Income Trust | | | 16,735 | | | | 202,828 | |
First Trust Mortgage Income Fund | | | 68,894 | | | | 992,763 | |
Franklin Limited Duration Income Trust(d) | | | 88,437 | | | | 1,069,203 | |
Morgan Stanley Income Securities, Inc. | | | 72,031 | | | | 1,362,827 | |
| | |
The accompanying notes are an integral part of the financial statements. |
| 6 | | www.iconfunds.com |
| | |
| ICON Bond Fund | | Schedule of Investments |
| | September 30, 2016 |
| | | | | | | | |
| | | Shares or
Principal
Amount | | | Value | |
| |
Closed-End Mutual Funds (continued) | |
Pacholder High Yield Fund, Inc. | | | 140,118 | | | $ | 999,041 | |
| | | | | | | | |
| |
Total Closed-End Mutual Funds (Cost $8,292,846) | | | | 8,550,270 | |
| | | | | | | | |
|
Collateral for Securities on Loan (1.25%) | |
State Street Navigator Prime Portfolio, 0.30% | | | 1,092,875 | | | | 1,092,875 | |
| | | | | | | | |
| |
Total Collateral for Securities on Loan (Cost $1,092,875) | | | | 1,092,875 | |
| | | | | | | | |
|
Short-Term Investments (6.45%) | |
Time Deposits (6.45%) | |
State Street Euro Dollar Time Deposit (USD), 0.01%, 10/03/16 | | | 5,636,472 | | | | 5,636,472 | |
| | | | | | | | |
| |
Total Short-Term Investments (Cost $5,636,472) | | | | 5,636,472 | |
| | | | | | | | |
| |
Total Investments (100.43%) (Cost $86,526,530) | | | $ | 87,722,944 | |
| |
Liabilities Less Other Assets (-0.43%) | | | | (377,105) | |
| | | | | | | | |
| |
Net Assets (100.00%) | | | $ | 87,345,839 | |
| | | | | | | | |
| (a) | Security exempt from registration under Rule 144A of the Securities Act of 1933. These securities may be resold in the ordinary course of business in transactions exempt from registration, normally to qualified institutional buyers. As of September 30, 2016, these securities had a total aggregate market value of $26,465,503, representing 30.30% of net assets. |
| (b) | Floating Rate Security. Rate disclosed is as of September 30, 2016. |
| (c) | These securities are considered to be illiquid. The aggregate value of these securities at September 30, 2016 was $12,577,689, which represent 14.40% of the Fund’s net assets. |
| (d) | All or a portion of the security was on loan as of September 30, 2016. |
REIT - Real Estate Investment Trust
| | | | |
Credit Diversification (September 30, 2016) | |
A-* | | | 1.31% | |
A3 | | | 6.91% | |
Aa2 | | | 0.59% | |
Aa3 | | | 1.04% | |
Aaa | | | 3.43% | |
B1 | | | 3.94% | |
B2 | | | 1.93% | |
B3 | | | 2.16% | |
Ba1 | | | 9.51% | |
Ba2 | | | 1.16% | |
Ba3 | | | 5.06% | |
Baa1 | | | 3.83% | |
Baa2 | | | 15.32% | |
Baa3 | | | 9.79% | |
BBB* | | | 0.54% | |
BBB-* | | | 0.60% | |
Caa1 | | | 1.20% | |
NR | | | 9.23% | |
| | | | |
Total: | | | 77.55% | |
| | | | |
| * | Reflects S&P Rating for securities where Moody’s rating is unavailable. |
Percentages are based upon U.S. Treasury obligations, collateralized mortgage obligations, corporate and convertible corporate bond investments as a percentage of net assets. Ratings based on Moody’s Investors Service, Inc.
| | |
The accompanying notes are an integral part of the financial statements. |
| Annual Report | September 30, 2016 | | 7 |
| | |
| ICON Equity Income Fund | | Management Overview |
| | September 30, 2016 (Unaudited) |
| Q. | How did the Fund perform relative to its benchmarks? |
| A. | The ICON Equity Income Fund (the Fund) Class S shares returned 13.30% for the fiscal year ending September 30, 2016, lagging its benchmark, the S&P Composite 1500 Index, which returned 15.49% during the fiscal year. Total returns for other periods and additional Class shares as of September 30, 2016, appear in the subsequent pages of this Fund’s Management Overview. |
| Q. | What primary factors were behind the Fund’s relative performance? |
| A. | As the fiscal year began, our valuation methodology calculated an overall average value-to-price (V/P) ratio for the equity market of 1.09, meaning we believed fair value for the equity market as a whole was approximately 9% higher than where stocks were trading. While we were anticipating positive returns, the market exceeded our expectations. Stocks with high dividend yields did particularly well over the course of the fiscal year. For example, the Utilities and Telecommunication Services sectors, both comprised largely of stocks with high dividend yields, were up 18.7% and 26.6%, respectively, for the one year period ending September 30, 2016, as measured by the S&P 1500 Utilities Index and the S&P 1500 Telecommunication Services Index. In part, the demand for high dividend yielding stocks came from the decline in interest rates as the 10-year U.S. Treasury fell from approximately 2.04% to approximately 1.60% over the course of the year. High dividend yielding stocks can be an attractive income alternative in a low interest rate environment. |
| | Despite the Fund’s tilt toward relatively high dividend yielding stocks, it still lagged the S&P 1500 Index, primarily due to the Fund’s positions in fixed income. |
| Q. | How did the Fund’s composition affect performance? |
| A. | The Fund’s stock selection within the Information Technology sector was the largest detractor to the Fund’s performance relative to the benchmark. The Fund’s holdings in the Information Technology sector returned about 8.5% while the benchmark returns for this sector were above 22%. The Fund’s holdings in the Technology Hardware, Storage & Peripherals industry were particularly difficult for the Fund, with a net loss to the Fund versus a positive return for the benchmark. Further, the Fund’s use of protective puts resulted in a net loss for the Fund as the market rose. |
| | The Utilities sector helped to offset some of the losses from the Information Technology sector. The Fund was overweight the Utilities sector compared to the benchmark and this overweight position coupled with stock selection within the sector contributed to the Fund’s performance. The Fund’s holdings in the Multi-Utilities industry were particularly beneficial to the Fund. |
| Q. | What is the outlook for the ICON Equity Income Fund? |
| A. | The overall average V/P ratio for the stocks we track within our system was 1.09 as of September 30, 2016. Given this V/P ratio, we believe the market can continue to rise over the next year, and the Fund currently has an equity to fixed income allocation of approximately 90% equity and 10% fixed income. Additionally, based on our valuation readings, the Fund has a notable position in the Financial sector. We will continue to monitor the equity market to find the best combination of value and dividend for our investors. |
| | |
| ICON Equity Income Fund | | Management Overview |
| | September 30, 2016 (Unaudited) |
Average Annual Total Return (as of September 30, 2016)
| | | | | | | | | | | | | | | | | | | | | | | | | | | | | | | | | | | |
| | | Inception Date | | 1 Year | | 5 Years | | 10 Years | | Since Inception | | Gross Expense Ratio* | | Net Expense Ratio* |
ICON Equity Income Fund - Class S | | 5/10/04 | | | | 13.30% | | | | | 13.04% | | | | | 5.80% | | | | | 6.69% | | | | | 1.60% | | | | | 1.55% | |
ICON Equity Income Fund - Class C | | 11/8/02 | | | | 12.15% | | | | | 11.93% | | | | | 4.74% | | | | | 6.91% | | | | | 2.69% | | | | | 2.55% | |
ICON Equity Income Fund - Class A | | 5/31/06 | | | | 12.97% | | | | | 12.76% | | | | | 5.52% | | | | | 5.38% | | | | | 1.87% | | | | | 1.80% | |
ICON Equity Income Fund - Class A | | | | | | | | | | | | | | | | | | | | | | | | | | | | | | | | |
(including maximum sales charge of 5.75%) | | 5/31/06 | | | | 6.49% | | | | | 11.43% | | | | | 4.90% | | | | | 4.78% | | | | | 1.87% | | | | | 1.80% | |
S&P Composite 1500 Index | | | | | | 15.49% | | | | | 16.44% | | | | | 7.44% | | | | | 9.10% | | | | | N/A | | | | | N/A | |
Past performance is not a guarantee of future results. Information about these performance results and the comparative indexes can be found in the About This Report section. The Adviser has agreed to limit certain Fund expenses; without these limitations, returns would have been lower. The limitation provisions may be terminated in the future.
| * | Please see the most recent prospectus for details. |
Class C total returns exclude applicable sales charges. If sales charges were included returns would be lower.
Value of a $10,000 Investment (through September 30, 2016)
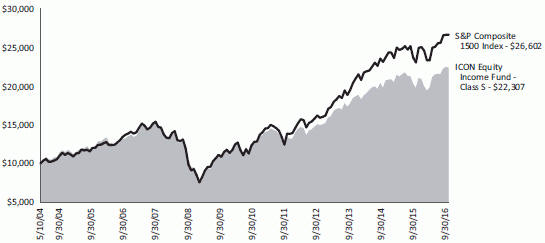
Past performance is not a guarantee of future results. The above graph compares a $10,000 investment made in the Equity Income Fund’s Class S shares on the Class’ inception date of 5/10/04 to a $10,000 investment made in an unmanaged securities index on that date. Performance for the Equity Income Fund’s other share classes will vary due to differences in charges and expenses. The Equity Income Fund’s performance in this chart and the performance table assumes the reinvestment of dividends and capital gain distributions but does not reflect the deduction of taxes that a shareholder would pay on Fund distributions or on the redemption of Fund shares.
| | |
| |
| Annual Report | September 30, 2016 | | 9 |
| | |
| ICON Equity Income Fund | | Schedule of Investments |
| | September 30, 2016 |
| | | | | | | | |
| | | Shares or Principal Amount | | | Value | |
| |
Corporate Bonds (1.60%) | |
Financial (1.20%) | |
E*TRADE Financial Corp.
5.38%, 11/15/22 | | $ | 200,000 | | | $ | 213,204 | |
Ironshore Holdings U.S., Inc.
8.50%, 05/15/20(a) | | | 500,000 | | | | 568,251 | |
| | | | | | | | |
| | | | | | | 781,455 | |
| | | | | | | | |
|
Materials (0.40%) | |
Westlake Chemical Corp.
4.88%, 05/15/23(a) | | | 250,000 | | | | 261,733 | |
| | | | | | | | |
| |
Total Corporate Bonds (Cost $1,043,622) | | | | 1,043,188 | |
| | | | | | | | |
|
Convertible Corporate Bonds (0.40%) | |
Telecommunication Services (0.40%) | |
Clearwire Communications LLC / Clearwire Finance, Inc.
8.25%, 12/01/40(a) | | | 250,000 | | | | 259,688 | |
| | | | | | | | |
| |
Total Convertible Corporate Bonds (Cost $254,981) | | | | 259,688 | |
| | | | | | | | |
|
Collateralized Mortgage Obligations (1.03%) | |
Green Tree, Inc.,
Series 2008-HE1, Class A
9.50%, 03/25/38(a)(b)(c) | | | 170,286 | | | | 179,958 | |
Towd Point Mortgage Trust, Inc.,
Series 2015-1, Class A5
3.51%, 06/25/29(a)(b)(c) | | | 500,000 | | | | 492,332 | |
| | | | | | | | |
| |
Total Collateralized Mortgage Obligations (Cost $675,503) | | | | 672,290 | |
| | | | | | | | |
|
Common Stocks (89.38%) | |
Aerospace & Defense (1.66%) | |
Boeing Co. | | | 8,200 | | | | 1,080,268 | |
| | | | | | | | |
|
Apparel Retail (1.55%) | |
Buckle, Inc.(d) | | | 42,000 | | | | 1,009,260 | |
| | | | | | | | |
|
Asset Management & Custody Banks (1.74%) | |
Legg Mason, Inc. | | | 33,800 | | | | 1,131,624 | |
| | | | | | | | |
|
Auto Parts & Equipment (1.96%) | |
Magna International, Inc. | | | 29,700 | | | | 1,275,615 | |
| | | | | | | | |
|
Automobile Manufacturers (2.63%) | |
Ford Motor Co. | | | 91,100 | | | | 1,099,577 | |
| | | | | | | | |
| | | Shares or Principal Amount | | | Value | |
| |
Automobile Manufacturers (continued) | |
Nissan Motor Co., Ltd., Sponsored ADR | | | 31,400 | | | $ | 616,696 | |
| | | | | | | | |
| | | | | | | 1,716,273 | |
| | | | | | | | |
|
Biotechnology (1.75%) | |
AbbVie, Inc. | | | 18,100 | | | | 1,141,567 | |
| | | | | | | | |
|
Communications Equipment (1.74%) | |
Harris Corp. | | | 12,400 | | | | 1,135,964 | |
| | | | | | | | |
|
Data Processing & Outsourced Services (4.45%) | |
Automatic Data Processing, Inc. | | | 13,100 | | | | 1,155,420 | |
Broadridge Financial Solutions, Inc. | | | 9,400 | | | | 637,226 | |
Xerox Corp. | | | 109,600 | | | | 1,110,248 | |
| | | | | | | | |
| | | | | | | 2,902,894 | |
| | | | | | | | |
|
Electric Utilities (0.82%) | |
American Electric Power Co., Inc. | | | 8,300 | | | | 532,943 | |
| | | | | | | | |
|
Electronic Manufacturing Services (1.89%) | |
TE Connectivity, Ltd. | | | 19,100 | | | | 1,229,658 | |
| | | | | | | | |
|
Fertilizers & Agricultural Chemicals (1.66%) | |
Agrium, Inc.(d) | | | 11,900 | | | | 1,079,211 | |
| | | | | | | | |
|
Gas Utilities (0.95%) | |
National Fuel Gas Co. | | | 11,400 | | | | 616,398 | |
| | | | | | | | |
|
Health Care Distributors (1.90%) | |
Cardinal Health, Inc. | | | 15,900 | | | | 1,235,430 | |
| | | | | | | | |
|
Home Improvement Retail (1.90%) | |
Home Depot, Inc. | | | 9,600 | | | | 1,235,328 | |
| | | | | | | | |
|
Homefurnishing Retail (1.28%) | |
Williams-Sonoma, Inc.(d) | | | 16,300 | | | | 832,604 | |
| | | | | | | | |
|
Hotels, Resorts & Cruise Lines (3.50%) | |
Royal Caribbean Cruises, Ltd. | | | 17,000 | | | | 1,274,150 | |
Wyndham Worldwide Corp. | | | 15,000 | | | | 1,009,950 | |
| | | | | | | | |
| | | | | | | 2,284,100 | |
| | | | | | | | |
|
Household Appliances (1.64%) | |
Whirlpool Corp. | | | 6,600 | | | | 1,070,256 | |
| | | | | | | | |
|
Housewares & Specialties (1.88%) | |
Tupperware Brands Corp. | | | 18,700 | | | | 1,222,419 | |
| | | | | | | | |
|
Integrated Telecommunication Services (2.84%) | |
AT&T, Inc. | | | 29,500 | | | | 1,197,995 | |
BCE, Inc. | | | 14,200 | | | | 655,756 | |
| | | | | | | | |
| | | | | | | 1,853,751 | |
| | | | | | | | |
| | |
The accompanying notes are an integral part of the financial statements. |
| 10 | | www.iconfunds.com |
| | |
| ICON Equity Income Fund | | Schedule of Investments |
| | September 30, 2016 |
| | | | | | | | |
| | | Shares or Principal Amount | | | Value | |
| |
Life & Health Insurance (2.06%) | | | | | | | | |
Lincoln National Corp. | | | 28,600 | | | $ | 1,343,628 | |
| | | | | | | | |
|
Mortgage REIT’s (0.98%) | |
Annaly Capital Management, Inc., REIT | | | 61,000 | | | | 640,500 | |
| | | | | | | | |
|
Movies & Entertainment (3.61%) | |
Regal Entertainment Group, Class A(d) | | | 53,700 | | | | 1,167,975 | |
Time Warner, Inc. | | | 14,900 | | | | 1,186,189 | |
| | | | | | | | |
| | | | | | | 2,354,164 | |
| | | | | | | | |
|
Multi-line Insurance (3.74%) | |
Hartford Financial Services Group, Inc. | | | 29,700 | | | | 1,271,754 | |
Horace Mann Educators Corp. | | | 31,900 | | | | 1,169,135 | |
| | | | | | | | |
| | | | | | | 2,440,889 | |
| | | | | | | | |
|
Multi-Utilities (2.22%) | |
Dominion Resources, Inc. | | | 11,500 | | | | 854,105 | |
DTE Energy Co. | | | 6,300 | | | | 590,121 | |
| | | | | | | | |
| | | | | | | 1,444,226 | |
| | | | | | | | |
|
Oil & Gas Equipment & Services (1.12%) | |
Bristow Group, Inc.(d) | | | 51,900 | | | | 727,638 | |
| | | | | | | | |
|
Oil & Gas Exploration & Production (1.00%) | |
Cabot Oil & Gas Corp. | | | 25,200 | | | | 650,160 | |
| | | | | | | | |
|
Oil & Gas Refining & Marketing (2.63%) | |
HollyFrontier Corp. | | | 32,300 | | | | 791,350 | |
Tesoro Corp. | | | 11,600 | | | | 922,896 | |
| | | | | | | | |
| | | | | | | 1,714,246 | |
| | | | | | | | |
|
Oil & Gas Storage & Transportation (1.47%) | |
Ship Finance International, Ltd.(d) | | | 65,200 | | | | 960,396 | |
| | | | | | | | |
|
Packaged Foods & Meats (1.80%) | |
B&G Foods, Inc. | | | 23,800 | | | | 1,170,484 | |
| | | | | | | | |
|
Paper Packaging (1.00%) | |
International Paper Co. | | | 13,600 | | | | 652,528 | |
| | | | | | | | |
|
Pharmaceuticals (5.83%) | |
Bristol-Myers Squibb Co. | | | 11,800 | | | | 636,256 | |
Eli Lilly & Co. | | | 8,800 | | | | 706,288 | |
Merck & Co., Inc. | | | 10,300 | | | | 642,823 | |
Novo Nordisk A/S, Sponsored ADR | | | 16,600 | | | | 690,394 | |
Pfizer, Inc. | | | 33,100 | | | | 1,121,097 | |
| | | | | | | | |
| | | | | | | 3,796,858 | |
| | | | | | | | |
|
Property & Casualty Insurance (5.97%) | |
AmTrust Financial Services, Inc. | | | 38,800 | | | | 1,041,004 | |
Chubb, Ltd. | | | 7,700 | | | | 967,505 | |
| | | | | | | | |
| | | Shares or Principal Amount | | | Value | |
| |
Property & Casualty Insurance (continued) | |
Stewart Information Services Corp. | | | 28,100 | | | $ | 1,249,045 | |
XL Group PLC | | | 18,900 | | | | 635,607 | |
| | | | | | | | |
| | | | | | | 3,893,161 | |
| | | | | | | | |
|
Railroads (1.80%) | |
Union Pacific Corp. | | | 12,000 | | | | 1,170,360 | |
| | | | | | | | |
|
Regional Banks (4.24%) | |
Fifth Third Bancorp | | | 62,900 | | | | 1,286,934 | |
KeyCorp | | | 88,200 | | | | 1,073,394 | |
M&T Bank Corp. | | | 3,500 | | | | 406,350 | |
| | | | | | | | |
| | | | | | | 2,766,678 | |
| | | | | | | | |
|
Semiconductor Equipment (1.78%) | |
Teradyne, Inc. | | | 53,700 | | | | 1,158,846 | |
| | | | | | | | |
|
Semiconductors (3.52%) | |
Intel Corp. | | | 34,000 | | | | 1,283,500 | |
QUALCOMM, Inc. | | | 14,800 | | | | 1,013,800 | |
| | | | | | | | |
| | | | | | | 2,297,300 | |
| | | | | | | | |
|
Technology Hardware, Storage & Peripherals (2.46%) | |
Apple, Inc. | | | 14,200 | | | | 1,605,310 | |
| | | | | | | | |
|
Thrifts & Mortgage Finance (2.88%) | |
Dime Community Bancshares, Inc. | | | 57,700 | | | | 967,052 | |
New York Community Bancorp, Inc. | | | 64,100 | | | | 912,143 | |
| | | | | | | | |
| | | | | | | 1,879,195 | |
| | | | | | | | |
|
Tobacco (1.53%) | |
Reynolds American, Inc. | | | 21,200 | | | | 999,580 | |
| | | | | | | | |
| | |
Total Common Stocks (Cost $56,577,813) | | | | | | | 58,251,710 | |
| | | | | | | | |
|
Preferred Stocks (1.93%) | |
Consumer Finance (0.47%) | |
Discover Financial Services,
Series B(d) | | | 11,792 | | | | 307,535 | |
| | | | | | | | |
|
Diversified Banks (0.42%) | |
GMAC Capital Trust I, Series 2 | | | 10,800 | | | | 274,428 | |
| | | | | | | | |
|
Mortgage REIT’s (0.56%) | |
Annaly Capital Management, Inc., Series E | | | 14,225 | | | | 360,035 | |
| | | | | | | | |
| | |
The accompanying notes are an integral part of the financial statements. |
| Annual Report | September 30, 2016 | | 11 |
| | |
| ICON Equity Income Fund | | Schedule of Investments |
| | September 30, 2016 |
| | | | | | | | |
| | | Shares or Principal Amount | | | Value | |
| |
Office REIT’s (0.48%) | | | | | | | | |
Gramercy Property Trust, Inc., Series A(c) | | | 11,573 | | | $ | 314,091 | |
| | | | | | | | |
| |
Total Preferred Stocks (Cost $1,214,672) | | | | 1,256,089 | |
| | | | | | | | |
|
Convertible Preferred Stocks (0.40%) | |
Diversified Banks (0.40%) | | | | | | | | |
Wells Fargo & Co., Series L | | | 200 | | | | 261,720 | |
| | | | | | | | |
| |
Total Convertible Preferred Stocks (Cost $246,404) | | | | 261,720 | |
|
Closed-End Mutual Funds (3.88%) | |
BlackRock Income Trust, Inc. | | | 47,970 | | | | 310,846 | |
Blackstone / GSO Senior Floating Rate Term Fund | | | 6,558 | | | | 110,502 | |
Deutsche Global High Income Fund, Inc. | | | 10,000 | | | | 84,100 | |
Deutsche High Income Opportunities Fund, Inc. | | | 13,342 | | | | 188,789 | |
Deutsche High Income Trust | | | 36,761 | | | | 338,569 | |
Deutsche Multi-Market Income Trust | | | 42,005 | | | | 359,143 | |
Deutsche Strategic Income Trust | | | 16,113 | | | | 195,289 | |
Franklin Limited Duration Income Trust | | | 26,467 | | | | 319,986 | |
Morgan Stanley Income Securities, Inc. | | | 12,866 | | | | 243,425 | |
Pacholder High Yield Fund, Inc. | | | 11,866 | | | | 84,605 | |
Wells Fargo Multi-Sector Income Fund | | | 22,462 | | | | 291,332 | |
| | | | | | | | |
| |
Total Closed-End Mutual Funds (Cost $2,415,180) | | | | 2,526,586 | |
| | | | | | | | |
| | |
Underlying Security/Expiration
Date/Exercise Price | | Contracts | | | Value | |
| |
Put Options Purchased (0.08%) | |
S&P 500 Index 01/20/17, 1,800 | | | 60 | | | | 54,000 | |
| | | | | | | | |
| | |
Total Put Options Purchased (Cost $254,882) | | | | | | | 54,000 | |
| | | | | | | | |
| | | | | | | | |
| | | Shares or Principal Amount | | | Value | |
| |
Collateral for Securities on Loan (9.19%) | |
State Street Navigator Prime Portfolio, 0.30% | | | 5,989,261 | | | $ | 5,989,261 | |
| | | | | | | | |
| |
Total Collateral for Securities on Loan (Cost $5,989,261) | | | | 5,989,261 | |
| | | | | | | | |
|
Short-Term Investments (0.29%) | |
Time Deposits (0.29%) | |
State Street Euro Dollar Time Deposit (USD), 0.01%, 10/03/16 | | | 190,554 | | | | 190,554 | |
| | | | | | | | |
| |
Total Short-Term Investments (Cost $190,554) | | | | 190,554 | |
| | | | | | | | |
Total Investments (108.18%) (Cost $68,862,872) | | | $ | 70,505,086 | |
| |
Liabilities Less Other Assets (-8.18%) | | | | (5,329,915) | |
| | | | | | | | |
| |
Net Assets (100.00%) | | | $ | 65,175,171 | |
| | | | | | | | |
| (a) | Security exempt from registration under Rule 144A of the Securities Act of 1933. These securities may be resold in the ordinary course of business in transactions exempt from registration, normally to qualified institutional buyers. As of September 30, 2016, these securities had a total aggregate market value of $1,761,962, representing 2.70% of net assets. |
| (b) | Floating Rate Security. Rate disclosed is as of September 30, 2016. |
| (c) | These securities are considered to be illiquid. The aggregate value of these securities at September 30, 2016 was $986,381, which represent 1.51% of the Fund’s net assets. |
| (d) | All or a portion of the security was on loan as of September 30, 2016. |
ADR - American Depositary Receipt
REIT - Real Estate Investment Trust
| | |
The accompanying notes are an integral part of the financial statements. |
| 12 | | www.iconfunds.com |
| | |
| ICON Equity Income Fund | | Schedule of Investments |
| | September 30, 2016 |
| | | | |
| Sector Composition (September 30, 2016) | | | |
| |
Financial | | | 23.46% | |
Consumer Discretionary | | | 19.95% | |
Information Technology | | | 15.84% | |
Health Care | | | 9.48% | |
Energy | | | 6.22% | |
Utilities | | | 3.99% | |
Industrials | | | 3.46% | |
Consumer Staples | | | 3.33% | |
Telecommunication Services | | | 2.84% | |
Materials | | | 2.66% | |
Real Estate | | | 0.48% | |
| | | | |
| | | 91.71% | |
| | | | |
Percentages are based upon common, preferred, and convertible preferred stocks as a percentage of net assets.
| | | | |
| Industry Composition (September 30, 2016) | | | |
| |
Property & Casualty Insurance | | | 5.97% | |
Pharmaceuticals | | | 5.83% | |
Data Processing & Outsourced Services | | | 4.45% | |
Regional Banks | | | 4.24% | |
Multi-line Insurance | | | 3.74% | |
Movies & Entertainment | | | 3.61% | |
Semiconductors | | | 3.52% | |
Hotels, Resorts & Cruise Lines | | | 3.50% | |
Thrifts & Mortgage Finance | | | 2.88% | |
Integrated Telecommunication Services | | | 2.84% | |
Oil & Gas Refining & Marketing | | | 2.63% | |
Automobile Manufacturers | | | 2.63% | |
Technology Hardware, Storage & Peripherals | | | 2.46% | |
Multi-Utilities | | | 2.22% | |
Life & Health Insurance | | | 2.06% | |
Auto Parts & Equipment | | | 1.96% | |
Home Improvement Retail | | | 1.90% | |
Health Care Distributors | | | 1.90% | |
Electronic Manufacturing Services | | | 1.89% | |
Housewares & Specialties | | | 1.88% | |
Railroads | | | 1.80% | |
Packaged Foods & Meats | | | 1.80% | |
Semiconductor Equipment | | | 1.78% | |
Biotechnology | | | 1.75% | |
Asset Management & Custody Banks | | | 1.74% | |
Communications Equipment | | | 1.74% | |
Fertilizers & Agricultural Chemicals | | | 1.66% | |
Aerospace & Defense | | | 1.66% | |
Household Appliances | | | 1.64% | |
Apparel Retail | | | 1.55% | |
Mortgage REIT’s | | | 1.54% | |
Tobacco | | | 1.53% | |
Oil & Gas Storage & Transportation | | | 1.47% | |
Homefurnishing Retail | | | 1.28% | |
Oil & Gas Equipment & Services | | | 1.12% | |
Paper Packaging | | | 1.00% | |
Oil & Gas Exploration & Production | | | 1.00% | |
Other Industries (each less than 1%) | | | 3.54% | |
| | | | |
| | | 91.71% | |
| | | | |
Percentages are based upon common, preferred, and convertible preferred stocks as a percentage of net assets.
| | |
The accompanying notes are an integral part of the financial statements. |
| Annual Report | September 30, 2016 | | 13 |
| | |
| ICON Fund | | Management Overview |
| | September 30, 2016 (Unaudited) |
| Q. | How did the Fund perform relative to its benchmarks? |
| A. | The ICON Fund (the Fund) Class S returned 1.81% for the fiscal year ending September 30, 2016, while its benchmark, the S&P 1500 Index, returned 15.49%. Total returns for other periods and additional Class shares as of September 30, 2016, appear in the subsequent pages of this Fund’s Management Overview. |
| Q. | What primary factors were behind the Fund’s relative performance? |
| A. | From September 30, 2015, through the market low of February 11, 2016, the Fund underperformed, dropping more than the broad market. The market drop in December 2015 and January 2016, coming after the Federal Reserve raised its target for the Federal Funds rate and hinted at many more increases in 2016, was particularly difficult for the Fund. The Fund’s overweight position in the Financial sector relative to the benchmark hurt performance as the sector stumbled, we believe due to falling interest rates and investor concern that Federal Funds rate hikes would slow the economy. The market rebounded from its February 11, 2016 low and the Fund participated, outperforming its benchmark through September 30, 2016, but the gains were not enough to make up for the underperformance of late 2015 and early 2016. |
| Q. | How did the Fund’s composition affect performance? |
| A. | The five biggest contributors to Fund performance were Thor Industries, Center Point Energy, Martin Marietta Materials, CMS Energy Corporation and Ashland. Thor Industries is in the Consumer Discretionary sector, CMS Energy and CenterPoint Energy are in the Utilities sector and Martin Marietta Materials and Ashland are in the Materials sector. |
The five largest detractors from Fund performance were Encore Capital Group, Polaris Industries, Signature Bank, McKesson Corporation and Royal Caribbean Cruises. Encore, Polaris Industries and McKesson Corporation were sold. The other two remain in the portfolio.
| Q. | What is your investment outlook for the overall market? |
| A. | From December 1, 2014, the broad market was in a sideways range for approximately 19 months. On every advance prices ran into what we have called a “value ceiling” and went no higher. Our estimation of fair value had generally been growing since 2009, but paused and actually declined in 2015 and early 2016. However, in the spring of 2016, our estimate of fair value began growing again and prices responded with many indexes breaking out to all-time highs in August. We ended September 2016 with an overall average market value-to-price (V/P) ratio of 1.09, meaning stock prices in general would need to move higher over the next year to reach our estimate of fair value. As we wrote a year ago, “[w]e do not see any of the behaviors and signs we believe are typical of market peaks and expect the six-year-old bull market to resume.” With a current overall market V/P ratio of 1.09 as of September 30, 2016, we have the same view as we did a year ago. |
| | |
| ICON Fund | | Management Overview |
| | September 30, 2016 (Unaudited) |
Average Annual Total Return (as of September 30, 2016)
| | | | | | | | | | | | | | | | | | | | | | | | | | | | | | | | | | | |
| | | Inception
Date | | 1 Year | | 5 Years | | 10 Years | | Since
Inception | | Gross Expense
Ratio* | | Net Expense
Ratio* |
ICON Fund - Class S | | 5/6/04 | | | | 1.81% | | | | | 9.95% | | | | | 1.03% | | | | | 3.04% | | | | | 1.09% | | | | | 1.09% | |
ICON Fund - Class C | | 11/28/00 | | | | 0.65% | | | | | 8.81% | | | | | 0.26% | | | | | 2.56% | | | | | 2.27% | | | | | 2.25% | |
ICON Fund - Class A | | 5/31/06 | | | | 1.37% | | | | | 9.57% | | | | | 0.50% | | | | | 0.04% | | | | | 1.55% | | | | | 1.50% | |
ICON Fund - Class A (including maximum sales charge of 5.75%) | | 5/31/06 | | | | -4.45% | | | | | 8.27% | | | | | -0.09% | | | | | -0.53% | | | | | 1.55% | | | | | 1.50% | |
S&P Composite 1500 Index | | | | | | 15.49% | | | | | 16.44% | | | | | 7.44% | | | | | 5.61% | | | | | N/A | | | | | N/A | |
Past performance is not a guarantee of future results. Information about these performance results and the comparative indexes can be found in the About This Report section. The Since Inception performance results for Class C shares include returns for certain time periods that were restarted as of June 8, 2004.
| * | Please see the most recent prospectus for details. |
Class C total returns exclude applicable sales charges. If sales charges were included returns would be lower.
Value of a $10,000 Investment (through September 30, 2016)
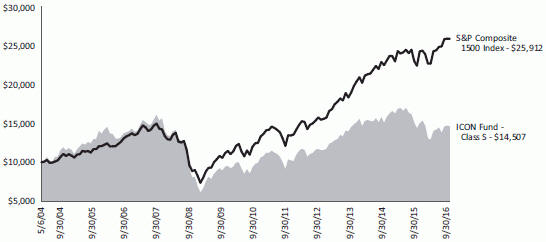
Past performance is not a guarantee of future results. The above graph compares a $10,000 investment made in the ICON Fund’s Class S shares on the Class’ inception date of 5/6/04 to a $10,000 investment made in an unmanaged securities index on that date. Performance for the ICON Fund’s other share classes will vary due to differences in charges and expenses. The ICON Fund’s performance in this chart and the performance table assumes the reinvestment of dividends and capital gain distributions but does not reflect the deduction of taxes that a shareholder would pay on Fund distributions or on the redemption of Fund shares.
| | |
| |
| Annual Report | September 30, 2016 | | 15 |
| | |
| ICON Fund | | Schedule of Investments |
| | September 30, 2016 |
| | | | | | | | |
| | | Shares or Principal Amount | | | Value | |
| |
Common Stocks (100.01%) | |
Application Software (2.84%) | |
Adobe Systems, Inc.(a) | | | 12,000 | | | $ | 1,302,480 | |
| | | | | | | | |
|
Asset Management & Custody Banks (2.89%) | |
Janus Capital Group, Inc. | | | 94,900 | | | | 1,329,549 | |
| | | | | | | | |
|
Auto Parts & Equipment (2.23%) | |
Magna International, Inc. | | | 23,800 | | | | 1,022,210 | |
| | | | | | | | |
|
Automobile Manufacturers (2.97%) | |
Thor Industries, Inc. | | | 16,100 | | | | 1,363,670 | |
| | | | | | | | |
|
Biotechnology (6.28%) | |
Celgene Corp.(a) | | | 20,400 | | | | 2,132,412 | |
Vertex Pharmaceuticals, Inc.(a) | | | 8,600 | | | | 750,006 | |
| | | | | | | | |
| | | | | | | 2,882,418 | |
| | | | | | | | |
|
Building Products (2.34%) | |
Masco Corp. | | | 31,300 | | | | 1,073,903 | |
| | | | | | | | |
|
Construction Materials (4.33%) | |
Martin Marietta Materials, Inc. | | | 11,100 | | | | 1,988,121 | |
| | | | | | | | |
|
Data Processing & Outsourced Services (1.68%) | |
Total System Services, Inc. | | | 16,400 | | | | 773,260 | |
| | | | | | | | |
|
Diversified Banks (6.20%) | |
Bank of America Corp. | | | 182,000 | | | | 2,848,300 | |
| | | | | | | | |
|
Electronic Components (1.49%) | |
Rogers Corp.(a) | | | 11,200 | | | | 684,096 | |
| | | | | | | | |
|
Home Improvement Retail (5.30%) | |
Home Depot, Inc. | | | 18,900 | | | | 2,432,052 | |
| | | | | | | | |
|
Homebuilding (3.38%) | |
PulteGroup, Inc. | | | 77,500 | | | | 1,553,100 | |
| | | | | | | | |
|
Hotels, Resorts & Cruise Lines (4.90%) | |
Royal Caribbean Cruises, Ltd. | | | 13,200 | | | | 989,340 | |
Wyndham Worldwide Corp. | | | 18,700 | | | | 1,259,071 | |
| | | | | | | | |
| | | | | | | 2,248,411 | |
| | | | | | | | |
|
Household Appliances (3.04%) | |
Whirlpool Corp. | | | 8,600 | | | | 1,394,576 | |
| | | | | | | | |
|
Internet & Direct Marketing Retail (2.01%) | |
Amazon.com, Inc.(a) | | | 1,100 | | | | 921,041 | |
| | | | | | | | |
|
Internet Software & Services (2.93%) | |
CoStar Group, Inc.(a) | | | 3,900 | | | | 844,467 | |
Facebook, Inc., Class A(a) | | | 3,900 | | | | 500,253 | |
| | | | | | | | |
| | | | | | | 1,344,720 | |
| | | | | | | | |
| | | | | | | | |
| | | Shares or Principal Amount | | | Value | |
| |
Life & Health Insurance (2.23%) | |
CNO Financial Group, Inc. | | | 67,100 | | | $ | 1,024,617 | |
| | | | | | | | |
|
Movies & Entertainment (1.25%) | |
Twenty-First Century Fox, Inc., Class A | | | 23,800 | | | | 576,436 | |
| | | | | | | | |
|
Multi-line Insurance (2.11%) | |
American International Group, Inc. | | | 16,300 | | | | 967,242 | |
| | | | | | | | |
|
Paper Packaging (2.56%) | |
Avery Dennison Corp. | | | 15,100 | | | | 1,174,629 | |
| | | | | | | | |
|
Pharmaceuticals (4.05%) | |
Jazz Pharmaceuticals PLC(a) | | | 15,300 | | | | 1,858,644 | |
| | | | | | | | |
|
Real Estate Services (1.87%) | |
CBRE Group, Inc., Class A(a) | | | 30,700 | | | | 858,986 | |
| | | | | | | | |
|
Regional Banks (15.18%) | |
Fifth Third Bancorp | | | 92,300 | | | | 1,888,458 | |
First Commonwealth Financial Corp. | | | 168,300 | | | | 1,698,147 | |
Signature Bank(a) | | | 18,300 | | | | 2,167,635 | |
SVB Financial Group(a) | | | 11,000 | | | | 1,215,940 | |
| | | | | | | | |
| | | | | | | 6,970,180 | |
| | | | | | | | |
|
Semiconductors (10.87%) | |
Broadcom, Ltd. | | | 5,500 | | | | 948,860 | |
NXP Semiconductors N.V.(a) | | | 17,600 | | | | 1,795,376 | |
Skyworks Solutions, Inc. | | | 29,500 | | | | 2,246,130 | |
| | | | | | | | |
| | | | | | | 4,990,366 | |
| | | | | | | | |
|
Specialty Chemicals (5.08%) | |
Ashland, Inc. | | | 20,100 | | | | 2,330,595 | |
| | | | | | | | |
| |
Total Common Stocks (Cost $44,291,780) | | | | 45,913,602 | |
| | | | | | | | |
| |
Total Investments (100.01%) (Cost $44,291,780) | | | $ | 45,913,602 | |
| |
Liabilities Less Other Assets (-0.01%) | | | | (6,684) | |
| | | | | | | | |
| |
Net Assets (100.00%) | | | $ | 45,906,918 | |
| | | | | | | | |
| (a) | Non-income producing security. |
| | |
The accompanying notes are an integral part of the financial statements. |
| 16 | | www.iconfunds.com |
| | |
| ICON Fund | | Schedule of Investments |
| | September 30, 2016 |
| | | | |
Sector Composition (September 30, 2016) | |
| |
| |
Financial | | | 28.61% | |
Consumer Discretionary | | | 25.08% | |
Information Technology | | | 19.81% | |
Materials | | | 11.97% | |
Health Care | | | 10.33% | |
Industrials | | | 2.34% | |
Real Estate | | | 1.87% | |
| | | | |
| | | 100.01% | |
| | | | |
Percentages are based upon common stocks as a percentage of net assets.
| | | | |
Industry Composition (September 30, 2016) | |
| |
| |
Regional Banks | | | 15.18% | |
Semiconductors | | | 10.87% | |
Biotechnology | | | 6.28% | |
Diversified Banks | | | 6.20% | |
Home Improvement Retail | | | 5.30% | |
Specialty Chemicals | | | 5.08% | |
Hotels, Resorts & Cruise Lines | | | 4.90% | |
Construction Materials | | | 4.33% | |
Pharmaceuticals | | | 4.05% | |
Homebuilding | | | 3.38% | |
Household Appliances | | | 3.04% | |
Automobile Manufacturers | | | 2.97% | |
Internet Software & Services | | | 2.93% | |
Asset Management & Custody Banks | | | 2.89% | |
Application Software | | | 2.84% | |
Paper Packaging | | | 2.56% | |
Building Products | | | 2.34% | |
Auto Parts & Equipment | | | 2.23% | |
Life & Health Insurance | | | 2.23% | |
Multi-line Insurance | | | 2.11% | |
Internet & Direct Marketing Retail | | | 2.01% | |
Real Estate Services | | | 1.87% | |
Data Processing & Outsourced Services | | | 1.68% | |
Electronic Components | | | 1.49% | |
Movies & Entertainment | | | 1.25% | |
| | | | |
| | | 100.01% | |
| | | | |
Percentages are based upon common stocks as a percentage of net assets.
| | |
The accompanying notes are an integral part of the financial statements. |
| Annual Report | September 30, 2016 | | 17 |
| | |
| ICON Long/Short Fund | | Management Overview |
| | September 30, 2016 (Unaudited) |
| Q. | How did the Fund perform relative to its benchmarks? |
| A. | The ICON Long/Short Fund (the Fund) Class S returned 1.69% for the fiscal year ending September 30, 2016, while its benchmark, the S&P 1500 Index, returned 15.49%. Total returns for other periods and additional Class shares as of September 30, 2016, appear in the subsequent pages of this Fund’s Management Overview. |
| Q. | What primary factors were behind the Fund’s relative performance? |
| A. | From September 30, 2015, through the market low of February 11, 2016, the Fund underperformed, dropping more than the broad market. The market drop in December 2015 and January 2016, after the Federal Reserve raised its target for the Federal Funds rate and hinted at many more increases in 2016, was particularly difficult for the Fund. The Fund’s overweight position in the Financial sector relative to the benchmark hurt performance as the sector stumbled, we believe due to falling interest rates and investor concern that Federal Funds rate hikes would slow the economy. The market rebounded from its February 11, 2016 low and the Fund participated, outperforming its benchmark through September 30, 2016, but the gains were not enough to make up for the underperformance of late 2015 and early 2016. |
| Q. | How did the Fund’s composition affect performance? |
| A. | The five biggest contributors to Fund performance were Thor Industries, CMS Energy Corporation, Rogers Corporation, CenterPoint Energy and Martin Marietta Materials. Thor Industries is in the Consumer Discretionary sector, CMS Energy and CenterPoint Energy are in the Utilities sector, Rogers Corporation is in the Information Technology sector, and Martin Marietta is in the Materials sector. |
| | The five largest detractors from Fund performance were Encore Capital Group, Signature Bank, McKesson Corporation, Polaris Industries and Royal Caribbean Cruises. Encore Capital Group, Polaris Industries and McKesson Corporation were sold. The other two remain in the portfolio. |
| Q. | What is your investment outlook for the overall market? |
| A. | From December 1, 2014, the broad market was in a sideways range for approximately 19 months. On every advance prices ran into what we have called a “value ceiling” and went no higher. Our estimation of fair value had generally been growing since 2009, but paused and actually declined in 2015 and early 2016. However, in the spring of 2016, our estimate of fair value began growing again and prices responded with many indexes breaking out to all-time highs in August. We ended September 2016 with an overall average market value-to-price (V/P) ratio of 1.09, meaning stock prices in general would need to move higher over the next year to reach our estimate of fair value. As we wrote a year ago, “[w]e do not see any of the behaviors and signs we believe are typical of market peaks and expect the six-year-old bull market to resume.” With a current overall market V/P ratio of 1.09 as of September 30, 2016, we have the same view as we did a year ago. |
| | |
| ICON Long/Short Fund | | Management Overview |
| | September 30, 2016 (Unaudited) |
Average Annual Total Return (as of September 30, 2016)
| | | | | | | | | | | | | | |
| | | Inception Date | | 1 Year | | 5 Years | | 10 Years | | Since
Inception | | Gross Expense
Ratio* | | Net Expense
Ratio* |
|
ICON Long/Short Fund - Class S | | 5/6/04 | | 1.69% | | 10.00% | | 1.95% | | 3.59% | | 1.37% | | 1.28% |
ICON Long/Short Fund - Class C | | 10/17/02 | | 0.67% | | 8.86% | | 0.94% | | 4.33% | | 2.53% | | 2.33% |
ICON Long/Short Fund - Class A | | 5/31/06 | | 1.40% | | 9.68% | | 1.69% | | 1.44% | | 1.73% | | 1.58% |
ICON Long/Short Fund - Class A | | | | | | | | | | | | | | |
(including maximum sales charge of 5.75%) | | 5/31/06 | | -4.42% | | 8.39% | | 1.09% | | 0.86% | | 1.73% | | 1.58% |
S&P Composite 1500 Index | | | | 15.49% | | 16.44% | | 7.44% | | 9.20% | | N/A | | N/A |
Past performance is not a guarantee of future results. Information about these performance results and the comparative indexes can be found in the About This Report section. The Adviser has agreed to limit certain Fund expenses; without these limitations, returns would have been lower. The limitation provisions may be terminated in the future.
| * | Please see the most recent prospectus for details. |
Class C total returns exclude applicable sales charges. If sales charges were included returns would be lower.
Value of a $10,000 Investment (through September 30, 2016)
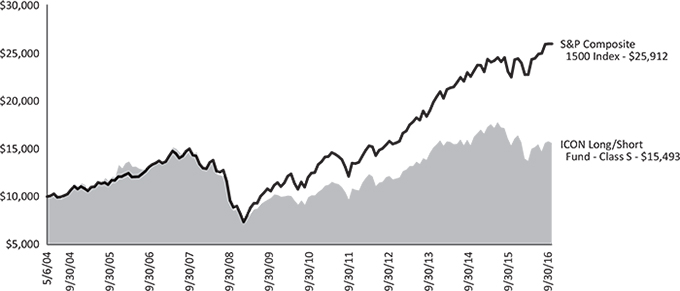
Past performance is not a guarantee of future results. The above graph compares a $10,000 investment made in the Long/Short Fund’s Class S shares on the Class’ inception date of 5/6/04 to a $10,000 investment made in an unmanaged securities index on that date. Performance for the Long/Short Fund’s other share classes will vary due to differences in charges and expenses. The Long/Short Fund’s performance in this chart and the performance table assumes the reinvestment of dividends and capital gain distributions but does not reflect the deduction of taxes that a shareholder would pay on Fund distributions or on the redemption of Fund shares.
| | |
| |
| Annual Report | September 30, 2016 | | 19 |
| | |
| ICON Long/Short Fund | | Schedule of Investments |
| | September 30, 2016 |
| | | | | | | | |
| | | Shares or Principal Amount | | | Value | |
| |
Common Stocks (100.44%) | | | | | |
Application Software (2.41%) | | | | | |
Adobe Systems, Inc.(a) | | | 3,700 | | | $ | 401,598 | |
| | | | | | | | |
|
Asset Management & Custody Banks (4.11%) | |
Janus Capital Group, Inc. | | | 48,800 | | | | 683,688 | |
| | | | | | | | |
| |
Auto Parts & Equipment (1.52%) | | | | | |
Magna International, Inc. | | | 5,900 | | | | 253,405 | |
| | | | | | | | |
| |
Automobile Manufacturers (3.31%) | | | | | |
Thor Industries, Inc. | | | 6,500 | | | | 550,550 | |
| | | | | | | | |
| |
Biotechnology (6.84%) | | | | | |
Celgene Corp.(a) | | | 7,300 | | | | 763,069 | |
Vertex Pharmaceuticals, Inc.(a) | | | 4,300 | | | | 375,003 | |
| | | | | | | | |
| | | | | | | 1,138,072 | |
| | | | | | | | |
Building Products (3.73%) | | | | | |
Masco Corp. | | | 18,100 | | | | 621,011 | |
| | | | | | | | |
| |
Construction Materials (3.98%) | | | | | |
Martin Marietta Materials, Inc. | | | 3,700 | | | | 662,707 | |
| | | | | | | | |
|
Data Processing & Outsourced Services (7.10%) | |
MasterCard, Inc., Class A | | | 8,000 | | | | 814,160 | |
Total System Services, Inc. | | | 7,800 | | | | 367,770 | |
| | | | | | | | |
| | | | | | | 1,181,930 | |
| | | | | | | | |
Diversified Banks (6.65%) | | �� | | | |
Bank of America Corp. | | | 70,700 | | | | 1,106,455 | |
| | | | | | | | |
| |
Home Improvement Retail (2.55%) | | | | | |
Home Depot, Inc. | | | 3,300 | | | | 424,644 | |
| | | | | | | | |
| |
Homebuilding (4.25%) | | | | | |
PulteGroup, Inc. | | | 35,300 | | | | 707,412 | |
| | | | | | | | |
| |
Hotels, Resorts & Cruise Lines (6.72%) | | | | | |
Royal Caribbean Cruises, Ltd. | | | 4,600 | | | | 344,770 | |
Wyndham Worldwide Corp. | | | 11,500 | | | | 774,295 | |
| | | | | | | | |
| | | | | | | 1,119,065 | |
| | | | | | | | |
Household Appliances (3.70%) | | | | | |
Whirlpool Corp. | | | 3,800 | | | | 616,208 | |
| | | | | | | | |
| |
Insurance Brokers (3.06%) | | | | | |
Arthur J Gallagher & Co. | | | 10,000 | | | | 508,700 | |
| | | | | | | | |
| |
Internet & Direct Marketing Retail (1.01%) | | | | | |
Amazon.com, Inc.(a) | | | 200 | | | | 167,462 | |
| | | | | | | | |
| |
Internet Software & Services (0.91%) | | | | | |
CoStar Group, Inc.(a) | | | 700 | | | | 151,571 | |
| | | | | | | | |
| | | | | | | | |
| | | Shares or Principal Amount | | | Value | |
| |
Life & Health Insurance (1.39%) | | | | | |
CNO Financial Group, Inc. | | | 15,100 | | | $ | 230,577 | |
| | | | | | | | |
| |
Multi-line Insurance (1.93%) | | | | | |
American International Group, Inc. | | | 5,400 | | | | 320,436 | |
| | | | | | | | |
| |
Pharmaceuticals (4.74%) | | | | | |
Jazz Pharmaceuticals PLC(a) | | | 6,500 | | | | 789,620 | |
| | | | | | | | |
| |
Real Estate Services (1.03%) | | | | | |
CBRE Group, Inc., Class A(a) | | | 6,100 | | | | 170,678 | |
| | | | | | | | |
| |
Regional Banks (17.57%) | | | | | |
Fifth Third Bancorp | | | 29,400 | | | | 601,524 | |
First Commonwealth Financial Corp. | | | 49,800 | | | | 502,482 | |
Signature Bank(a) | | | 9,200 | | | | 1,089,740 | |
SVB Financial Group(a) | | | 6,600 | | | | 729,564 | |
| | | | | | | | |
| | | | | | | 2,923,310 | |
| | | | | | | | |
| |
Semiconductors (8.72%) | | | | | |
NXP Semiconductors N.V.(a) | | | 5,200 | | | | 530,452 | |
Skyworks Solutions, Inc. | | | 12,100 | | | | 921,294 | |
| | | | | | | | |
| | | | | | | 1,451,746 | |
| | | | | | | | |
| |
Specialty Chemicals (3.21%) | | | | | |
Ashland, Inc. | | | 4,600 | | | | 533,370 | |
| | | | | | | | |
| |
Total Common Stocks (Cost $16,198,973) | | | | 16,714,215 | |
| | | | | | | | |
| |
Total Investments (100.44%) (Cost $16,198,973) | | | $ | 16,714,215 | |
| |
Liabilities Less Other Assets (-0.44%) | | | | (73,407) | |
| | | | | | | | |
| |
Net Assets (100.00%) | | | $ | 16,640,808 | |
| | | | | | | | |
| (a) | Non-income producing security. |
| | | | |
Sector Composition (September 30, 2016) | | | |
| |
| |
Financial | | | 34.71% | |
Consumer Discretionary | | | 23.06% | |
Information Technology | | | 19.14% | |
Health Care | | | 11.58% | |
Materials | | | 7.19% | |
Industrials | | | 3.73% | |
Real Estate | | | 1.03% | |
| | | | |
| | | 100.44% | |
| | | | |
Percentages are based upon common stocks as a percentage of net assets.
| | |
The accompanying notes are an integral part of the financial statements. |
| 20 | | www.iconfunds.com |
| | |
| ICON Long/Short Fund | | Schedule of Investments |
| | September 30, 2016 |
| | | | |
Industry Composition (September 30, 2016) | | | |
| |
| |
Regional Banks | | | 17.57% | |
Semiconductors | | | 8.72% | |
Data Processing & Outsourced Services | | | 7.10% | |
Biotechnology | | | 6.84% | |
Hotels, Resorts & Cruise Lines | | | 6.72% | |
Diversified Banks | | | 6.65% | |
Pharmaceuticals | | | 4.74% | |
Homebuilding | | | 4.25% | |
Asset Management & Custody Banks | | | 4.11% | |
Construction Materials | | | 3.98% | |
Building Products | | | 3.73% | |
Household Appliances | | | 3.70% | |
Automobile Manufacturers | | | 3.31% | |
Specialty Chemicals | | | 3.21% | |
Insurance Brokers | | | 3.06% | |
Home Improvement Retail | | | 2.55% | |
Application Software | | | 2.41% | |
Multi-line Insurance | | | 1.93% | |
Auto Parts & Equipment | | | 1.52% | |
Life & Health Insurance | | | 1.39% | |
Real Estate Services | | | 1.03% | |
Internet & Direct Marketing Retail | | | 1.01% | |
Other Industries (each less than 1%) | | | 0.91% | |
| | | | |
| | | 100.44% | |
| | | | |
Percentages are based upon common stocks as a percentage of net assets.
| | |
The accompanying notes are an integral part of the financial statements. |
| Annual Report | September 30, 2016 | | 21 |
| | |
| ICON Opportunities Fund | | Management Overview |
| | September 30, 2016 (Unaudited) |
| Q. | How did the Fund perform relative to its benchmarks? |
| A. | The ICON Opportunities Fund (the Fund) returned 10.76% for the fiscal year ending September 30, 2016, while its benchmark, the S&P Small- Cap 600 Index, returned 18.12%. Total returns for other periods as of September 30, 2016, appear in the subsequent pages of this Fund’s Management Overview. |
| Q. | What primary factors were behind the Fund’s relative performance? |
| A. | For both the fiscal year ended September 30, 2016, and off the market low of February 11, 2016, through September 30, 2016, the S&P Small- Cap 600 Index beat the S&P 500 Index (large cap). From September 30, 2015 through the market low of February 11, 2016 the Fund underperformed and dropped more than its benchmark, the S&P Small-Cap 600 Index. The market drop in December 2015 and January 2016, coming after the Federal Reserve raised its target for the Federal Funds rate and hinted at many more increases in 2016, was particularly difficult for the Fund. The Fund’s overweight position in the Financial sector hurt performance as the sector stumbled, we believe due to falling interest rates and investor concern that Federal Funds rate hikes would slow the economy. The market rebounded from its February 11, 2016 low through September 30, 2016, and the Fund participated in the rebound, but the gains were not enough to make up for the underperformance of late 2015 and early 2016. |
| Q. | How did the Fund’s composition affect performance? |
| A. | The five biggest contributors to Fund performance were Coherent, Inc., BioTelemetry, Inc., Thor Industries, Avery Dennison Corporation and Advanced Energy Industries. Coherent, Inc. and Advanced Energy Industries are in the Information Technology sector, BioTelemetry, Inc. is in the Health Care sector, Thor Industries is in the Consumer Discretionary sector, and Avery Dennison Corporation is in the Materials sector. |
| | The five largest detractors from Fund performance were Sucampo Pharmaceuticals, Inc., PRA Group, Encore Capital Group, Acadia Healthcare Company and Libbey. PRA Group, Encore Capital Group and Libbey have been sold. The other two remain in the portfolio. |
| Q. | What is your investment outlook for the overall market? |
| A. | From December 1, 2014, the broad market was in a sideways range for approximately 19 months. On every advance prices ran into what we have called a “value ceiling” and went no higher. Our estimation of fair value had generally been growing since 2009, but paused and actually declined in 2015 and early 2016. However, in the spring of 2016, our estimate of fair value began growing again and prices responded with many indexes breaking out to all-time highs in August. We ended September 2016 with an overall average market value-to-price (V/P) ratio of 1.09, meaning stock prices in general would need to move higher over the next year to reach our estimate of fair value. As we wrote a year ago, “[w]e do not see any of the behaviors and signs we believe are typical of market peaks and expect the six-year-old bull market to resume.” With a current overall market V/P ratio of 1.09 as of September 30, 2016, we have the same view as we did a year ago. |
| | |
| ICON Opportunities Fund | | Management Overview |
| | September 30, 2016 (Unaudited) |
Average Annual Total Return (as of September 30, 2016)
| | | | | | | | | | |
| | | Inception Date | | 1 Year | | Since Inception | | Gross Expense Ratio* | | Net Expense Ratio* |
|
ICON Opportunities Fund | | 9/28/12 | | 10.76% | | 11.18% | | 1.58% | | 1.50% |
S&P Small Cap Total Return | | | | 18.12% | | 14.25% | | N/A | | N/A |
Past performance is not a guarantee of future results. Information about these performance results and the comparative indexes can be found in the About This Report section. The Adviser has agreed to limit certain Fund expenses; without these limitations, returns would have been lower. The limitation provisions may be terminated in the future.
| * | Please see the most recent prospectus for details. |
Value of a $10,000 Investment (through September 30, 2016)
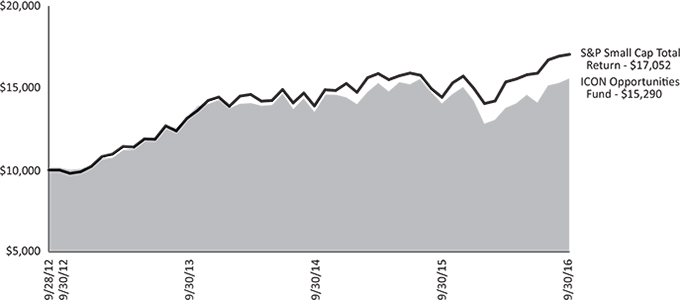
Past performance is not a guarantee of future results. The above graph compares a $10,000 investment made in the Opportunities Fund on the inception date of 9/28/12 to a $10,000 investment made in an unmanaged securities index on that date. The Opportunities Fund’s performance in this chart and the performance table assumes the reinvestment of dividends and capital gain distributions but does not reflect the deduction of taxes that a shareholder would pay on Fund distributions or on the redemption of Fund shares.
| | |
| |
| Annual Report | September 30, 2016 | | 23 |
| | |
| ICON Opportunities Fund | | Schedule of Investments |
| | September 30, 2016 |
| | | | | | | | |
| | | Shares or Principal Amount | | | Value | |
| |
Common Stocks (100.07%) | | | | | |
Aerospace & Defense (2.72%) | | | | | |
Curtiss-Wright Corp. | | | 1,749 | | | $ | 159,351 | |
Hexcel Corp. | | | 6,255 | | | | 277,097 | |
| | | | | | | | |
| | | | | | | 436,448 | |
| | | | | | | | |
Asset Management & Custody Banks (3.21%) | |
Janus Capital Group, Inc. | | | 36,800 | | | | 515,568 | |
| | | | | | | | |
| |
Auto Parts & Equipment (7.58%) | | | | | |
Modine Manufacturing Co.(a) | | | 57,948 | | | | 687,263 | |
Tower International, Inc. | | | 22,000 | | | | 530,200 | |
| | | | | | | | |
| | | | | | | 1,217,463 | |
| | | | | | | | |
| |
Automobile Manufacturers (2.95%) | | | | | |
Thor Industries, Inc. | | | 5,601 | | | | 474,405 | |
| | | | | | | | |
| |
Biotechnology (3.64%) | | | | | |
Enzymotec, Ltd.(a) | | | 31,417 | | | | 219,919 | |
Ligand Pharmaceuticals, Inc.(a) | | | 3,575 | | | | 364,864 | |
| | | | | | | | |
| | | | | | | 584,783 | |
| | | | | | | | |
Building Products (7.09%) | | | | | |
Armstrong World Industries,
Inc.(a) | | | 3,900 | | | | 161,148 | |
Builders FirstSource, Inc.(a) | | | 41,500 | | | | 477,665 | |
PGT, Inc.(a) | | | 46,900 | | | | 500,423 | |
| | | | | | | | |
| | | | | | | 1,139,236 | |
| | | | | | | | |
Communications Equipment (8.04%) | | | | | |
ARRIS International PLC(a) | | | 5,700 | | | | 161,481 | |
CalAmp Corp.(a) | | | 31,800 | | | | 443,610 | |
Finisar Corp.(a) | | | 23,000 | | | | 685,400 | |
| | | | | | | | |
| | | | | | | 1,290,491 | |
| | | | | | | | |
| |
Electronic Components (1.58%) | | | | | |
Rogers Corp.(a) | | | 4,160 | | | | 254,093 | |
| | | | | | | | |
|
Electronic Equipment & Instruments (3.03%) | |
Coherent, Inc.(a) | | | 4,394 | | | | 485,713 | |
| | | | | | | | |
|
Electronic Manufacturing Services (6.15%) | |
Fabrinet(a) | | | 13,100 | | | | 584,129 | |
IPG Photonics Corp.(a) | | | 4,900 | | | | 403,515 | |
| | | | | | | | |
| | | | | | | 987,644 | |
| | | | | | | | |
Health Care Equipment (2.88%) | | | | | |
LivaNova PLC(a) | | | 7,700 | | | | 462,847 | |
| | | | | | | | |
| |
Health Care Facilities (3.02%) | | | | | |
Acadia Healthcare Co., Inc.(a) | | | 9,800 | | | | 485,590 | |
| | | | | | | | |
| |
Heavy Electrical Equipment (1.38%) | | | | | |
AZZ, Inc. | | | 3,400 | | | | 221,918 | |
| | | | | | | | |
| |
Home Furnishings (2.07%) | | | | | |
La-Z-Boy, Inc. | | | 13,500 | | | | 331,560 | |
| | | | | | | | |
| | | | | | | | |
| | | Shares or Principal Amount | | | Value | |
| |
Homebuilding (6.51%) | | | | | |
KB Home | | | 35,000 | | | $ | 564,200 | |
M/I Homes, Inc.(a) | | | 20,400 | | | | 480,828 | |
| | | | | | | | |
| | | | | | | 1,045,028 | |
| | | | | | | | |
|
Internet & Direct Marketing Retail (2.35%) | |
Nutrisystem, Inc. | | | 12,700 | | | | 377,063 | |
| | | | | | | | |
| |
Internet Software & Services (2.54%) | | | | | |
j2 Global, Inc. | | | 6,114 | | | | 407,254 | |
| | | | | | | | |
| |
Leisure Products (3.49%) | | | | | |
Brunswick Corp. | | | 11,500 | | | | 560,970 | |
| | | | | | | | |
| |
Life & Health Insurance (1.82%) | | | | | |
CNO Financial Group, Inc. | | | 19,100 | | | | 291,657 | |
| | | | | | | | |
| |
Multi-line Insurance (1.85%) | | | | | |
Horace Mann Educators Corp. | | | 8,100 | | | | 296,865 | |
| | | | | | | | |
| |
Paper Packaging (1.79%) | | | | | |
Avery Dennison Corp. | | | 3,700 | | | | 287,823 | |
| | | | | | | | |
| |
Pharmaceuticals (4.99%) | | | | | |
Impax Laboratories, Inc.(a) | | | 21,100 | | | | 500,070 | |
Sucampo Pharmaceuticals, Inc., Class A(a) | | | 24,521 | | | | 301,853 | |
| | | | | | | | |
| | | | | | | 801,923 | |
| | | | | | | | |
| |
Regional Banks (6.41%) | | | | | |
Bank of the Ozarks, Inc. | | | 5,600 | | | | 215,040 | |
First Commonwealth Financial Corp. | | | 40,000 | | | | 403,600 | |
Webster Financial Corp. | | | 10,800 | | | | 410,508 | |
| | | | | | | | |
| | | | | | | 1,029,148 | |
| | | | | | | | |
| |
Semiconductor Equipment (6.58%) | | | | | |
Advanced Energy Industries,
Inc.(a) | | | 5,200 | | | | 246,064 | |
Photronics, Inc.(a) | | | 30,700 | | | | 316,517 | |
Teradyne, Inc. | | | 22,909 | | | | 494,376 | |
| | | | | | | | |
| | | | | | | 1,056,957 | |
| | | | | | | | |
| |
Semiconductors (5.68%) | | | | | |
MACOM Technology Solutions Holdings, Inc.(a) | | | 13,100 | | | | 554,654 | |
Microsemi Corp.(a) | | | 8,500 | | | | 356,830 | |
| | | | | | | | |
| | | | | | | 911,484 | |
| | | | | | | | |
Textiles (0.72%) | | | | | |
Culp, Inc. | | | 3,900 | | | | 116,103 | |
| | | | | | | | |
| | |
Total Common Stocks (Cost $15,107,975) | | | | | | | 16,070,034 | |
| | | | | | | | |
| | |
The accompanying notes are an integral part of the financial statements. |
| 24 | | www.iconfunds.com |
| | |
| ICON Opportunities Fund | | Schedule of Investments |
| | September 30, 2016 |
| | | | | | | | |
| | | Shares or Principal Amount | | | Value | |
| |
Short-Term Investments (0.17%) | | | | | |
Time Deposits (0.17%) | | | | | | | | |
State Street Euro Dollar Time Deposit (USD),
0.01%, 10/03/16 | | | 27,464 | | | $ | 27,464 | |
| | | | | | | | |
| | |
Total Short-Term Investments (Cost $27,464) | | | | | | | 27,464 | |
| | | | | | | | |
| | |
Total Investments (100.24%) (Cost $15,135,439) | | | | | | $ | 16,097,498 | |
| |
Liabilities Less Other Assets (-0.24%) | | | | (38,601) | |
| | | | | | | | |
Net Assets (100.00%) | | | | | | $ | 16,058,897 | |
| | | | | | | | |
| (a) | Non-income producing security. |
| | | | |
Sector Composition (September 30, 2016) | | | | |
| |
Information Technology | | | 33.60% | |
Consumer Discretionary | | | 25.67% | |
Health Care | | | 14.53% | |
Financial | | | 13.29% | |
Industrials | | | 11.19% | |
Materials | | | 1.79% | |
| | | | |
| | | 100.07% | |
| | | | |
Percentages are based upon common stocks as a percentage of net assets.
| | | | |
Industry Composition (September 30, 2016) | |
| |
Communications Equipment | | | 8.04% | |
Auto Parts & Equipment | | | 7.58% | |
Building Products | | | 7.09% | |
Semiconductor Equipment | | | 6.58% | |
Homebuilding | | | 6.51% | |
Regional Banks | | | 6.41% | |
Electronic Manufacturing Services | | | 6.15% | |
Semiconductors | | | 5.68% | |
Pharmaceuticals | | | 4.99% | |
Biotechnology | | | 3.64% | |
Leisure Products | | | 3.49% | |
Asset Management & Custody Banks | | | 3.21% | |
Electronic Equipment & Instruments | | | 3.03% | |
Health Care Facilities | | | 3.02% | |
Automobile Manufacturers | | | 2.95% | |
Health Care Equipment | | | 2.88% | |
Aerospace & Defense | | | 2.72% | |
Internet Software & Services | | | 2.54% | |
Internet & Direct Marketing Retail | | | 2.35% | |
Home Furnishings | | | 2.07% | |
Multi-line Insurance | | | 1.85% | |
Life & Health Insurance | | | 1.82% | |
Paper Packaging | | | 1.79% | |
Electronic Components | | | 1.58% | |
Heavy Electrical Equipment | | | 1.38% | |
Other Industries (each less than 1%) | | | 0.72% | |
| | | | |
| | | 100.07% | |
| | | | |
Percentages are based upon common stocks as a percentage of net assets.
| | |
The accompanying notes are an integral part of the financial statements. |
| Annual Report | September 30, 2016 | | 25 |
| | |
| ICON Risk-Managed Balanced Fund | | Management Overview |
| | September 30, 2016 (Unaudited) |
| Q. | How did the Fund perform relative to its benchmarks? |
| A. | The Risk-Managed Balanced Fund (the Fund) Class S shares returned 4.39% for the fiscal year ended September 30, 2016. The S&P 1500 Index returned 15.49% and the Balanced Blended Benchmark returned 11.84%. The Balanced Blended Benchmark is based on a weighting of 60% S&P 1500 Index and 40% Barclays Capital U.S. Universal Index, rebalanced monthly. Total returns for other periods and additional Class shares as of September 30, 2016, appear in the subsequent pages of this Fund’s Management Overview. |
| Q. | What primary factors influenced the Fund’s relative performance during the period? |
| A. | Fiscal year 2016 proved to be a challenging year for our investment process and for the ICON Risk-Managed Balanced Fund. A combination of underperforming equity securities, especially in the segments of the market that our system found to be the most attractive, and a challenging hedging environment lead to underperformance relative to the benchmarks. |
| | According to our valuation methodology, we began fiscal year 2016 with an overall average value-to-price (V/P) ratio for the domestic market of 1.08, indicating the domestic market was priced approximately 8% below our estimate of fair value. Based on this outlook we positioned the Fund in a relatively neutral stance with an approximate 60% equities / 40% fixed income allocation. Additionally, we implemented a hedge strategy by both buying out-of-the-money S&P 500 put options and writing out-of-the-money S&P 500 call options in an attempt to reduce the effects of market volatility on the Fund. From the beginning of the fiscal year through the end of December 2015, the equity market produced a strong return of approximately 7% and the bond market fell by approximately 0.50%. While the Fund was able to mitigate losses in the bond market and participate in this upward move, equity underperformance and hedging losses due to the strong upward move in the equity market resulted in underperformance relative to the benchmark during this initial market move. |
| | In early January 2016, our equity valuation model viewed the overall broad domestic market as approximately 5% below our estimate of fair value. While our return expectations were relatively low for the overall market, our system did see distinct valuation differences at both a sector and industry level. While the Fund was slightly underweight equities relative to the blended benchmark, overweight positions were taken in the Financials, Utilities, and Materials sectors in an attempt to take advantage of what we believed to be attractive segments of the market. Additionally, given the lower overall market value readings, the Fund bought out-of-the-money S&P 500 put options and wrote out- of-the-money S&P 500 call options in an attempt to reduce the effects of market based volatility on the Fund. Relative to the fixed income portion of the benchmark, the fixed income portion of the Fund began 2016 with an overweight position in the corporate debt segment of the market and a lower overall duration and treasury exposure. We continued to look for “event driven” opportunities in both credit risk and closed-end fund arbitrage as well. |
| | 2016 began with a rather aggressive sell-off as investors digested both macro-economic concerns and the continuation of lower overall interest rates. The combination of these two factors not only pulled down the broad market but also caused the most damage to the Financials sector. Unfortunately, due to our overweight position in this sector, our downside participation during the sell-off was substantially higher than we would have liked. Additionally, our lack of exposure to U.S. Treasuries, generally lower duration, and an aggressive widening of credit spreads resulted in fixed income underperformance as the yield on the 10-year U.S. Treasury fell by 0.61% from a yield of 2.27% on 12/31/15 to a yield of 1.66% on 02/11/16. However, our hedge profile did add value during this time as put option contracts increased in price in response to the increase in market volatility. |
| | Around mid-February, the market began to stabilize and our equity valuation model indicated that many segments of the market had become substantially more attractive. Based on this, we increased exposure to both common stocks and equity based closed-end funds. Both of these moves proved to be beneficial as the market rebounded throughout the remainder of the time period. However, due to the aggressive V-shape rebound in the market our written call option positions ran aggressively against us and our long put option contracts fell quickly, detracting from overall fund performance. |
| | Ultimately, over fiscal year 2016, while the Fund was able to produce positive risk adjusted returns during a volatile time period, underperformance from the Fund’s equity holdings coupled with losses from its options positions resulted in underperformance relative to the benchmark. |
| Q. | How did the Fund’s composition affect performance? |
| A. | Focusing on the equity portion of the Fund, the largest sector contributors to performance over fiscal year 2016 were the Information Technology, Industrials, and Utilities sectors. The Fund was either overweight the sectors as a whole or held equity securities that produced positive selection effect. Sectors that detracted from Fund performance include the Financials, Real Estate, and Energy sectors. Of these three, the Financials sector produced the largest negative total effect due to the combination of both overweight positions and underperforming equity selections. |
| | |
| ICON Risk-Managed Balanced Fund | | Management Overview |
| | September 30, 2016 (Unaudited) |
| | Moving to individual stock performance within the Fund, the largest positive contributors to performance were Facebook, Masco, ITC Holdings Corp, Honeywell International, and St Jude Medical. The five largest detractors from performance were Encore Capital Group, CBRE Group, Signet Jewelers, Allergan, and Plains All-American Pipeline. |
| | Focusing on the fixed income portion of the Fund, while we maintained a lower overall duration relative to the fixed income benchmark, the Fund was able to outperform due to strong bottom up bond selections and allocations towards both the preferred and closed-end fund segments of the market. Specific preferred positions that contributed to performance include Ally Financial, Gramercy Property Trust, and Equity Commonwealth. |
| Q. | What is your investment outlook? |
| A. | Our equity valuations concluded fiscal year 2016 with an overall average V/P ratio of 1.09, giving us confidence there is room for the market to rise in the coming year. Currently, our system indicates noticeable discrepancies in sector opportunities. Specifically, we see the Financials and Consumer Discretionary sectors as good bargains. Additionally, our valuation system has identified specific industry opportunities in both the Health Care and Information Technology sectors. The Fund began the year with a slight underweight exposure to the equity market with its allocation and the equity hedge has recently been reduced targeting an equity beta at the upper end of our historical range. In the fixed income portion of the Fund, we continue to be very selective in our individual bond holdings as credit spreads are at levels that we deem as close to historical fair value. We also continue to see opportunities in the closed-end fund market. As always, we look to value as our primary guide and will adjust our positioning as market conditions dictate. |
| | |
| |
| Annual Report | September 30, 2016 | | 27 |
| | |
| ICON Risk-Managed Balanced Fund | | Management Overview |
| | September 30, 2016 (Unaudited) |
Average Annual Total Return (as of September 30, 2016)
| | | | | | | | | | | | | | | | | | |
| | | Inception Date | | 1 Year | | | 5 Years | | | 10 Years | | Since
Inception | | Gross Expense
Ratio* | | Net Expense
Ratio* |
|
ICON Risk-Managed Balanced Fund - Class S | | 5/6/04 | | | 4.39% | | | | 7.28% | | | 3.56% | | 3.95% | | 1.42% | | 1.28% |
ICON Risk-Managed Balanced Fund - Class C | | 11/21/02 | | | 3.35% | | | | 6.23% | | | 2.53% | | 4.08% | | 2.46% | | 2.28% |
ICON Risk-Managed Balanced Fund - Class A | | 5/31/06 | | | 4.18% | | | | 7.02% | | | 3.32% | | 3.26% | | 2.50% | | 2.25% |
ICON Risk-Managed Balanced Fund - Class A (including maximum sales charge of 5.75%) | | 5/31/06 | | | -1.78% | | | | 5.76% | | | 2.71% | | 2.67% | | 2.50% | | 2.25% |
S&P Composite 1500 Index | | | | | 15.49% | | | | 16.44% | | | 7.44% | | 8.78% | | N/A | | N/A |
Past performance is not a guarantee of future results. Information about these performance results and the comparative indexes can be found in the About This Report section. The Adviser has agreed to limit certain Fund expenses; without these limitations, returns would have been lower. The limitation provisions may be terminated in the future.
| * | Please see the most recent prospectus for details. |
Class C total returns exclude applicable sales charges. If sales charges were included returns would be lower.
Value of a $10,000 Investment (through September 30, 2016)
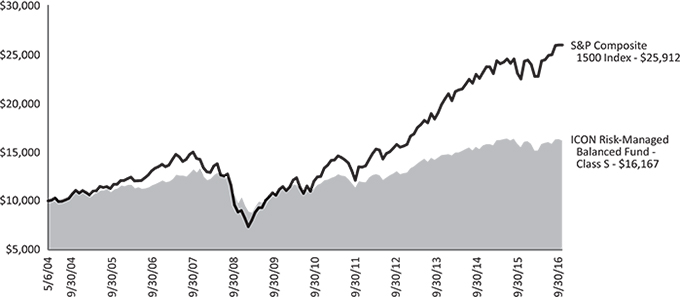
Past performance is not a guarantee of future results. The above graph compares a $10,000 investment made in the Risk-Managed Balanced Fund’s Class S shares on the Class’ inception date of 5/6/04 to a $10,000 investment made in an unmanaged securities index on that date. Performance for the Risk-Managed Balanced Fund’s other share classes will vary due to differences in charges and expenses. The Risk-Managed Balanced Fund’s performance in this chart and the performance table assumes the reinvestment of dividends and capital gain distributions but does not reflect the deduction of taxes that a shareholder would pay on Fund distributions or on the redemption of Fund shares.
| | |
| ICON Risk-Managed Balanced Fund | | Schedule of Investments |
| | September 30, 2016 |
| | | | | | | | |
| | | Shares or Principal
Amount | | | Value | |
| |
Corporate Bonds (20.08%) | | | | | |
Consumer Discretionary (0.23%) | | | | | |
International Game Technology | | | | | | | | |
5.35%, 10/15/23 | | $ | 100,000 | | | $ | 101,000 | |
| | | | | | | | |
| |
Consumer Staples (3.34%) | | | | | |
Bumble Bee Holdings, Inc. | | | | | | | | |
9.00%,
12/15/17(a) | | | 350,000 | | | | 351,750 | |
CVS Health Corp. | | | | | | | | |
2.75%, 12/01/22 | | | 200,000 | | | | 205,982 | |
CVS Health Corp. | | | | | | | | |
4.75%, 12/01/22 | | | 250,000 | | | | 283,568 | |
Kraft Heinz Foods Co. | | | | | | | | |
4.88%,
02/15/25(a) | | | 395,000 | | | | 435,706 | |
Molson Coors Brewing Co. | | | | | | | | |
3.00%, 07/15/26 | | | 200,000 | | | | 201,514 | |
| | | | | | | | |
| | | | | | | 1,478,520 | |
| | | | | | | | |
Financial (9.75%) | | | | | | | | |
Aircastle, Ltd. | | | | | | | | |
5.00%, 04/01/23 | | | 100,000 | | | | 104,500 | |
Ally Financial, Inc. | | | | | | | | |
8.00%, 03/15/20 | | | 240,000 | | | | 274,200 | |
American Equity Investment Life Holding Co. | | | | | | | | |
6.63%, 07/15/21 | | | 200,000 | | | | 208,475 | |
Berkshire Hathaway, Inc. | | | | | | | | |
2.75%, 03/15/23 | | | 250,000 | | | | 259,912 | |
Chubb INA Holdings, Inc. | | | | | | | | |
8.88%, 08/15/29 | | | 300,000 | | | | 462,332 | |
Citigroup, Inc., | | | | | | | | |
6.88%, 06/01/25 | | | 250,000 | | | | 313,604 | |
City National Corp. | | | | | | | | |
5.25%, 09/15/20 | | | 378,000 | | | | 426,107 | |
E*TRADE Financial Corp. | | | | | | | | |
5.38%, 11/15/22 | | | 260,000 | | | | 277,165 | |
ILFC E-Capital Trust II | | | | | | | | |
4.25%,
12/21/65(a)(b) | | | 100,000 | | | | 79,750 | |
International Lease Finance Corp. | | | | | | | | |
5.88%, 08/15/22 | | | 300,000 | | | | 332,625 | |
MetLife Capital Trust IV | | | | | | | | |
7.88%,
12/15/37(a) | | | 210,000 | | | | 263,466 | |
Neuberger Berman Group LLC / Neuberger Berman Finance Corp. | | | | | | | | |
5.88%,
03/15/22(a) | | | 200,000 | | | | 208,750 | |
NTC Capital I, Series A | | | | | | | | |
1.20%,
01/15/27(b) | | | 200,000 | | | | 173,000 | |
PNC Preferred Funding Trust II | | | | | | | | |
2.07%,
03/31/16(a)(b) | | | 151,000 | | | | 144,205 | |
Prudential Financial, Inc. | | | | | | | | |
8.88%,
06/15/38(b) | | | 200,000 | | | | 222,000 | |
| | | | | | | | |
| | | Shares or Principal
Amount | | | Value | |
| |
Financial (continued) | | | | | | | | |
SouthTrust Bank | | | | | | | | |
6.13%, 01/09/28 | | $ | 250,000 | | | $ | 303,497 | |
State Street Capital Trust I | | | | | | | | |
1.38%,
05/15/28(b) | | | 150,000 | | | | 135,000 | |
USB Realty Corp. | | | | | | | | |
1.83%,
01/15/17(a)(b) | | | 150,000 | | | | 134,625 | |
| | | | | | | | |
| | | | | | | 4,323,213 | |
| | | | | | | | |
Health Care (2.08%) | | | | | | | | |
HCA Holdings, Inc. | | | | | | | | |
5.25%, 04/15/25 | | | 400,000 | | | | 426,500 | |
Highmark, Inc., | | | | | | | | |
6.13%,
05/15/41(a)(c) | | | 125,000 | | | | 121,934 | |
St. Jude Medical, Inc. | | | | | | | | |
3.88%, 09/15/25 | | | 350,000 | | | | 373,251 | |
| | | | | | | | |
| | | | | | | 921,685 | |
| | | | | | | | |
Industrials (2.93%) | | | | | | | | |
General Electric Co., Series D | | | | | | | | |
5.00%,
01/21/21(b) | | | 500,000 | | | | 531,700 | |
Ingersoll-Rand Co. | | | | | | | | |
6.39%, 11/15/27 | | | 150,000 | | | | 178,063 | |
Ingersoll-Rand Co. | | | | | | | | |
6.44%, 11/15/27 | | | 51,000 | | | | 62,553 | |
Spirit AeroSystems, Inc. | | | | | | | | |
5.25%, 03/15/22 | | | 500,000 | | | | 525,547 | |
| | | | | | | | |
| | | | | | | 1,297,863 | |
| | | | | | | | |
Information Technology (1.05%) | | | | | |
Lender Processing Services, Inc. / Black Knight Lending Solutions, Inc. | | | | | | | | |
5.75%, 04/15/23 | | | 444,000 | | | | 467,310 | |
| | | | | | | | |
| |
Telecommunication Services (0.70%) | | | | | |
EarthLink Holdings Corp. | | | | | | | | |
7.38%, 06/01/20 | | | 100,000 | | | | 105,125 | |
Lee Enterprises, Inc. | | | | | | | | |
9.50%,
03/15/22(a)(d) | | | 200,000 | | | | 206,500 | |
| | | | | | | | |
| | | | | | | 311,625 | |
| | | | | | | | |
| | |
Total Corporate Bonds (Cost $8,768,890) | | | | | | | 8,901,216 | |
| | | | | | | | |
| |
Convertible Corporate Bonds (0.94%) | | | | | |
Telecommunication Services (0.94%) | | | | | |
Clearwire Communications LLC / Clearwire Finance, Inc. | | | | | | | | |
8.25%,
12/01/40(a) | | | 400,000 | | | | 415,500 | |
| | | | | | | | |
| |
Total Convertible Corporate Bonds (Cost $407,216) | | | | 415,500 | |
| | | | | | | | |
| | |
The accompanying notes are an integral part of the financial statements. |
| Annual Report | September 30, 2016 | | 29 |
| | |
| ICON Risk-Managed Balanced Fund | | Schedule of Investments |
| | September 30, 2016 |
| | | | | | | | |
| | | Shares or Principal
Amount | | | Value | |
| |
U.S. Treasury Obligations (6.48%) | | | | | |
U.S. Treasury Note | | | | | | | | |
1.50%, 08/15/26 | | $ | 500,000 | | | $ | 495,488 | |
U.S. Treasury Note | | | | | | | | |
1.63%, 02/15/26 | | | 1,600,000 | | | | 1,603,938 | |
U.S. Treasury Note | | | | | | | | |
1.88%, 05/31/22 | | | 750,000 | | | | 774,287 | |
| | | | | | | | |
| |
Total U.S. Treasury Obligations (Cost $2,814,480) | | | | 2,873,713 | |
| | | | | | | | |
| |
Collateralized Mortgage Obligations (8.04%) | | | | | |
Citigroup Mortgage Loan Trust, Inc., | | | | | | | | |
Series 2013-J1, Class B3 | | | | | | | | |
3.54%,
02/25/38(a)(b)(c) | | | 192,107 | | | | 188,280 | |
Green Tree, Inc., | | | | | | | | |
Series 2008-HE1, Class A | | | | | | | | |
9.50%,
03/25/38(a)(b)(c) | | | 255,429 | | | | 269,938 | |
MASTR Seasoned Securitization Trust, Inc., | | | | | | | | |
Series 2005-1, Class 1A1 | | | | | | | | |
6.52%,
09/25/32(b) | | | 321,466 | | | | 347,557 | |
Mill City Mortgage Trust, | | | | | | | | |
Series 2015-1, Class M3 | | | | | | | | |
3.20%,
10/25/32(a)(b)(c) | | | 200,000 | | | | 195,374 | |
New Residential Mortgage Loan Trust, | | | | | | | | |
Series 2016-1A, Class B3 | | | | | | | | |
5.56%,
03/25/56(a)(b)(c) | | | 337,864 | | | | 352,995 | |
Sequoia Mortgage Trust, Inc., | | | | | | | | |
Series 2013-12, Class B3 | | | | | | | | |
4.23%,
12/25/43(a)(b)(c) | | | 212,613 | | | | 215,661 | |
Towd Point Mortgage Trust, Inc., | | | | | | | | |
Series 2015-1, Class A5 | | | | | | | | |
3.51%,
06/25/29(a)(b)(c) | | | 300,000 | | | | 295,399 | |
Towd Point Mortgage Trust, Inc., | | | | | | | | |
Series 2015-2, Class 2M1 | | | | | | | | |
3.75%,
12/25/24(a)(b)(c) | | | 400,000 | | | | 416,098 | |
Towd Point Mortgage Trust, Inc., | | | | | | | | |
Series 2016-2, Class M2 | | | | | | | | |
3.00%,
07/25/29(a)(b)(c) | | | 500,000 | | | | 467,734 | |
Towd Point Mortgage Trust, Inc., | | | | | | | | |
Series 2015-6, Class M2 | | | | | | | | |
3.75%,
02/25/28(a)(b)(c) | | | 700,000 | | | | 710,040 | |
| | | | | | | | |
| | | Shares or Principal
Amount | | | Value | |
| |
Collateralized Mortgage Obligations (continued) | | | | | |
Velocity Commercial Capital Loan Trust, Inc., | | | | | | | | |
Series 2014-1, Class M3 | | | | | | | | |
6.89%,
02/25/24(a)(b)(c) | | $ | 100,000 | | | $ | 106,062 | |
| | | | | | | | |
| |
Total Collateralized Mortgage Obligations (Cost $3,555,406) | | | | 3,565,138 | |
| | | | | | | | |
| |
Common Stocks (52.02%) | | | | | |
Aerospace & Defense (2.22%) | | | | | |
B/E Aerospace, Inc. | | | 6,000 | | | | 309,960 | |
Boeing Co. | | | 1,000 | | | | 131,740 | |
Orbital ATK, Inc. | | | 4,195 | | | | 319,785 | |
Spirit AeroSystems Holdings, Inc., Class A(e) | | | 5,000 | | | | 222,700 | |
| | | | | | | | |
| | | | | | | 984,185 | |
| | | | | | | | |
Air Freight & Logistics (0.11%) | | | | | |
Echo Global Logistics, Inc.(e) | | | 2,089 | | | | 48,172 | |
| | | | | | | | |
| | |
Airlines (0.44%) | | | | | | | | |
Delta Air Lines, Inc. | | | 5,000 | | | | 196,800 | |
| | | | | | | | |
| |
Apparel, Accessories & Luxury Goods (0.47%) | | | | | |
Hanesbrands, Inc. | | | 8,200 | | | | 207,050 | |
| | | | | | | | |
| |
Asset Management & Custody Banks (0.22%) | | | | | |
Invesco, Ltd. | | | 3,100 | | | | 96,937 | |
| | | | | | | | |
| |
Auto Parts & Equipment (0.68%) | | | | | |
Magna International, Inc. | | | 7,000 | | | | 300,650 | |
| | | | | | | | |
| | |
Biotechnology (1.92%) | | | | | | | | |
AbbVie, Inc. | | | 5,000 | | | | 315,350 | |
Amgen, Inc. | | | 600 | | | | 100,086 | |
Celgene Corp.(e) | | | 1,500 | | | | 156,795 | |
China Biologic Products, Inc.(e) | | | 500 | | | | 62,240 | |
Gilead Sciences, Inc. | | | 1,500 | | | | 118,680 | |
Shire PLC, ADR | | | 500 | | | | 96,930 | |
| | | | | | | | |
| | | | | | | 850,081 | |
| | | | | | | | |
Broadcasting (0.27%) | | | | | | | | |
CBS Corp., Class B | | | 2,200 | | | | 120,428 | |
| | | | | | | | |
| |
Building Products (0.84%) | | | | | |
Masco Corp. | | | 5,000 | | | | 171,550 | |
PGT, Inc.(e) | | | 19,000 | | | | 202,730 | |
| | | | | | | | |
| | | | | | | 374,280 | |
| | | | | | | | |
Cable & Satellite (0.79%) | | | | | |
Comcast Corp., Class A | | | 5,300 | | | | 351,602 | |
| | | | | | | | |
| | |
The accompanying notes are an integral part of the financial statements. |
| 30 | | www.iconfunds.com |
| | |
| ICON Risk-Managed Balanced Fund | | Schedule of Investments |
| | September 30, 2016 |
| | | | | | | | |
| | | Shares or Principal
Amount | | | Value | |
| |
Computer & Electronics Retail (0.19%) | | | | | |
GameStop Corp., Class A(d) | | | 3,000 | | | $ | 82,770 | |
| | | | | | | | |
| |
Construction Machinery & Heavy Trucks (0.29%) | | | | | |
Allison Transmission Holdings, Inc. | | | 4,500 | | | | 129,060 | |
| | | | | | | | |
| |
Construction Materials (0.49%) | | | | | |
Martin Marietta Materials, Inc. | | | 600 | | | | 107,466 | |
Summit Materials, Inc., Class A(e) | | | 6,000 | | | | 111,300 | |
| | | | | | | | |
| | | | | | | 218,766 | |
| | | | | | | | |
Consumer Finance (1.91%) | | | | | |
Ally Financial, Inc. | | | 19,000 | | | | 369,930 | |
Discover Financial Services | | | 8,400 | | | | 475,020 | |
| | | | | | | | |
| | | | | | | 844,950 | |
| | | | | | | | |
Data Processing & Outsourced Services (3.08%) | | | | | |
DST Systems, Inc. | | | 1,500 | | | | 176,880 | |
MasterCard, Inc., Class A | | | 5,500 | | | | 559,735 | |
Visa, Inc., Class A | | | 6,400 | | | | 529,280 | |
Xerox Corp. | | | 10,000 | | | | 101,300 | |
| | | | | | | | |
| | | | | | | 1,367,195 | |
| | | | | | | | |
Diversified Banks (1.45%) | | | | | |
Bank of America Corp. | | | 24,000 | | | | 375,600 | |
JPMorgan Chase & Co. | | | 2,000 | | | | 133,180 | |
Wells Fargo & Co. | | | 3,000 | | | | 132,840 | |
| | | | | | | | |
| | | | | | | 641,620 | |
| | | | | | | | |
Drug Retail (1.75%) | | | | | |
CVS Health Corp. | | | 4,200 | | | | 373,758 | |
Walgreens Boots Alliance, Inc. | | | 5,000 | | | | 403,100 | |
| | | | | | | | |
| | | | | | | 776,858 | |
| | | | | | | | |
Electric Utilities (0.42%) | | | | | |
ALLETE, Inc. | | | 1,500 | | | | 89,430 | |
OGE Energy Corp. | | | 3,000 | | | | 94,860 | |
| | | | | | | | |
| | | | | | | 184,290 | |
| | | | | | | | |
Electronic Equipment & Instruments (0.12%) | | | | | |
VeriFone Systems, Inc.(e) | | | 3,500 | | | | 55,090 | |
| | | | | | | | |
| |
Electronic Manufacturing Services (1.94%) | | | | | |
IPG Photonics Corp.(e) | | | 3,793 | | | | 312,354 | |
TE Connectivity, Ltd. | | | 8,500 | | | | 547,230 | |
| | | | | | | | |
| | | | | | | 859,584 | |
| | | | | | | | |
Footwear (1.24%) | | | | | | | | |
NIKE, Inc., Class B | | | 7,000 | | | | 368,550 | |
Skechers U.S.A., Inc., Class A(e) | | | 8,000 | | | | 183,200 | |
| | | | | | | | |
| | | | | | | 551,750 | |
| | | | | | | | |
General Merchandise Stores (0.34%) | | | | | |
Dollar General Corp. | | | 1,000 | | | | 69,990 | |
Dollar Tree, Inc.(e) | | | 1,000 | | | | 78,930 | |
| | | | | | | | |
| | | | | | | 148,920 | |
| | | | | | | | |
| | | | | | | | |
| | | Shares or Principal
Amount | | | Value | |
| |
Health Care Distributors (1.09%) | | | | | |
Cardinal Health, Inc. | | | 1,500 | | | $ | 116,550 | |
McKesson Corp. | | | 2,200 | | | | 366,850 | |
| | | | | | | | |
| | | | | | | 483,400 | |
| | | | | | | | |
Health Care Equipment (0.53%) | | | | | |
Stryker Corp. | | | 900 | | | | 104,769 | |
Zimmer Biomet Holdings, Inc. | | | 1,000 | | | | 130,020 | |
| | | | | | | | |
| | | | | | | 234,789 | |
| | | | | | | | |
Health Care Facilities (1.18%) | | | | | |
HCA Holdings,
Inc.(e) | | | 6,500 | | | | 491,595 | |
Tenet Healthcare Corp.(e) | | | 1,500 | | | | 33,990 | |
| | | | | | | | |
| | | | | | | 525,585 | |
| | | | | | | | |
Health Care Services (0.30%) | | | | | |
MEDNAX, Inc.(e) | | | 2,000 | | | | 132,500 | |
| | | | | | | | |
| |
Health Care Technology (0.36%) | | | | | |
Allscripts Healthcare Solutions, Inc.(e) | | | 12,000 | | | | 158,040 | |
| | | | | | | | |
| |
Home Improvement Retail (0.50%) | | | | | |
Home Depot, Inc. | | | 500 | | | | 64,340 | |
Lowe’s Cos., Inc. | | | 2,200 | | | | 158,862 | |
| | | | | | | | |
| | | | | | | 223,202 | |
| | | | | | | | |
Homefurnishing Retail (0.14%) | | | | | |
Aaron’s, Inc. | | | 2,500 | | | | 63,550 | |
| | | | | | | | |
| |
Hotels, Resorts & Cruise Lines (1.26%) | | | | | |
Royal Caribbean Cruises, Ltd. | | | 2,500 | | | | 187,375 | |
Wyndham Worldwide Corp. | | | 5,500 | | | | 370,315 | |
| | | | | | | | |
| | | | | | | 557,690 | |
| | | | | | | | |
Household Appliances (0.55%) | | | | | |
Whirlpool Corp. | | | 1,500 | | | | 243,240 | |
| | | | | | | | |
| |
Housewares & Specialties (0.18%) | | | | | |
Newell Rubbermaid, Inc. | | | 1,500 | | | | 78,990 | |
| | | | | | | | |
| |
Human Resource & Employment Services (0.78%) | | | | | |
Kforce, Inc. | | | 3,000 | | | | 61,470 | |
Korn/Ferry International | | | 3,000 | | | | 63,000 | |
ManpowerGroup, Inc. | | | 1,000 | | | | 72,260 | |
On Assignment, Inc.(e) | | | 2,000 | | | | 72,580 | |
Robert Half International, Inc. | | | 2,000 | | | | 75,720 | |
| | | | | | | | |
| | | | | | | 345,030 | |
| | | | | | | | |
Industrial Conglomerates (1.13%) | | | | | |
Honeywell International, Inc. | | | 4,300 | | | | 501,337 | |
| | | | | | | | |
| |
Internet Software & Services (2.10%) | | | | | |
Akamai Technologies, Inc.(e) | | | 2,000 | | | | 105,980 | |
Alphabet, Inc., Class C(e) | | | 401 | | | | 311,693 | |
Facebook, Inc., Class A(e) | | | 4,000 | | | | 513,080 | |
| | | | | | | | |
| | | | | | | 930,753 | |
| | | | | | | | |
| | |
The accompanying notes are an integral part of the financial statements. |
| Annual Report | September 30, 2016 | | 31 |
| | |
| ICON Risk-Managed Balanced Fund | | Schedule of Investments |
| | September 30, 2016 |
| | | | | | |
| | | Shares or Principal
Amount | | Value | |
| |
IT Consulting & Other Services (0.21%) | | | | |
Cognizant Technology Solutions Corp.,
Class A(e) | | 2,000 | | $ | 95,420 | |
| | | | | | |
| |
Leisure Products (0.44%) | | | | |
Brunswick Corp. | | 4,000 | | | 195,120 | |
| | | | | | |
| |
Life & Health Insurance (0.48%) | | | | |
Lincoln National Corp. | | 4,500 | | | 211,410 | |
| | | | | | |
| |
Managed Health Care (1.50%) | | | | |
Aetna, Inc. | | 3,500 | | | 404,075 | |
CIGNA Corp. | | 2,000 | | | 260,640 | |
| | | | | | |
| | | | | 664,715 | |
| | | | | | |
Movies & Entertainment (1.12%) | | | | |
Time Warner, Inc. | | 3,500 | | | 278,635 | |
Twenty-First Century Fox, Inc., Class A | | 9,000 | | | 217,980 | |
| | | | | | |
| | | | | 496,615 | |
| | | | | | |
Multi-line Insurance (0.47%) | | | | |
American International Group, Inc. | | 3,500 | | | 207,690 | |
| | | | | | |
| |
Multi-Sector Holdings (0.78%) | | | | |
Berkshire Hathaway, Inc., Class B(e) | | 2,400 | | | 346,728 | |
| | | | | | |
| |
Multi-Utilities (0.79%) | | | | |
CMS Energy Corp. | | 3,200 | | | 134,432 | |
Sempra Energy | | 2,000 | | | 214,380 | |
| | | | | | |
| | | | | 348,812 | |
| | | | | | |
Oil & Gas Equipment & Services (0.67%) | | | | |
Schlumberger, Ltd. | | 3,800 | | | 298,832 | |
| | | | | | |
| |
Oil & Gas Exploration & Production (0.31%) | | | | |
Synergy Resources
Corp.(e) | | 20,000 | | | 138,600 | |
| | | | | | |
| |
Oil & Gas Refining & Marketing (0.58%) | | | | |
Marathon Petroleum Corp. | | 5,000 | | | 202,950 | |
Valero Energy Corp. | | 1,000 | | | 53,000 | |
| | | | | | |
| | | | | 255,950 | |
| | | | | | |
Paper Packaging (0.64%) | | | | |
Graphic Packaging Holding Co. | | 15,000 | | | 209,850 | |
International Paper Co. | | 1,500 | | | 71,970 | |
| | | | | | |
| | | | | 281,820 | |
| | | | | | |
Pharmaceuticals (3.22%) | | | | |
Allergan PLC(e) | | 2,100 | | | 483,651 | |
Bristol-Myers Squibb Co. | | 4,500 | | | 242,640 | |
Eli Lilly & Co. | | 3,000 | | | 240,780 | |
Jazz Pharmaceuticals
PLC(e) | | 2,000 | | | 242,960 | |
Roche Holding AG, Sponsored ADR | | 4,000 | | | 123,880 | |
| | | | | | |
| | | Shares or Principal
Amount | | Value | |
| |
Pharmaceuticals (continued) | | | | |
Teva Pharmaceutical Industries, Ltd., Sponsored ADR | | 2,000 | | $ | 92,020 | |
| | | | | | |
| | | | | 1,425,931 | |
| | | | | | |
Property & Casualty Insurance (0.38%) | | | | |
XL Group PLC | | 5,000 | | | 168,150 | |
| | | | | | |
| |
Railroads (0.40%) | | | | |
Union Pacific Corp. | | 1,800 | | | 175,554 | |
| | | | | | |
| |
Real Estate Services (1.52%) | | | | |
CBRE Group, Inc., Class A(e) | | 20,000 | | | 559,600 | |
Jones Lang LaSalle, Inc. | | 1,000 | | | 113,790 | |
| | | | | | |
| | | | | 673,390 | |
| | | | | | |
Regional Banks (1.84%) | | | | |
Signature Bank(e) | | 3,800 | | | 450,110 | |
SVB Financial Group(e) | | 3,300 | | | 364,782 | |
| | | | | | |
| | | | | 814,892 | |
| | | | | | |
Restaurants (0.82%) | | | | |
McDonald’s Corp. | | 800 | | | 92,288 | |
Starbucks Corp. | | 5,000 | | | 270,700 | |
| | | | | | |
| | | | | 362,988 | |
| | | | | | |
Semiconductors (1.50%) | | | | |
Broadcom, Ltd. | | 2,000 | | | 345,040 | |
Microsemi Corp.(e) | | 2,500 | | | 104,950 | |
Skyworks Solutions, Inc. | | 2,000 | | | 152,280 | |
Synaptics, Inc.(e) | | 1,100 | | | 64,438 | |
| | | | | | |
| | | | | 666,708 | |
| | | | | | |
Specialty Chemicals (0.88%) | | | | |
Ashland, Inc. | | 1,000 | | | 115,950 | |
Sherwin-Williams Co. | | 1,000 | | | 276,660 | |
| | | | | | |
| | | | | 392,610 | |
| | | | | | |
Technology Hardware, Storage & Peripherals (0.98%) | | | | |
Apple, Inc. | | 2,900 | | | 327,845 | |
Super Micro Computer, Inc.(e) | | 4,573 | | | 106,871 | |
| | | | | | |
| | | | | 434,716 | |
| | | | | | |
Trading Companies & Distributors (0.35%) | | | | |
Air Lease Corp. | | 5,401 | | | 154,361 | |
| | | | | | |
| |
Trucking (0.54%) | | | | |
Hertz Global Holdings,
Inc.(e) | | 6,000 | | | 240,960 | |
| | | | | | |
| |
Wireless Telecommunication Services (0.32%) | | | | |
T-Mobile U.S., Inc.(e) | | 3,000 | | | 140,160 | |
| | | | | | |
| |
Total Common Stocks (Cost $22,590,536) | | | 23,061,276 | |
| | | | | | |
| | |
The accompanying notes are an integral part of the financial statements. |
| 32 | | www.iconfunds.com |
| | |
| ICON Risk-Managed Balanced Fund | | Schedule of Investments |
| | September 30, 2016 |
| | | | | | |
| | | Shares or Principal
Amount | | Value | |
| |
Preferred Stocks (1.83%) | | | | |
Consumer Finance (0.09%) | | | | |
Discover Financial Services, Series B | | 1,500 | | $ | 39,120 | |
| | | | | | |
| |
Diversified Banks (1.00%) | | | | |
GMAC Capital Trust I, Series 2 | | 17,471 | | | 443,938 | |
| | | | | | |
| |
Diversified Operations (0.05%) | | | | |
Pitney Bowes International Holdings, Inc.,
Series F(a)(c) | | 20 | | | 20,606 | |
| | | | | | |
| |
Office REIT’s (0.44%) | | | | |
Gramercy Property Trust, Inc., Series A(c) | | 7,179 | | | 194,838 | |
| | | | | | |
| |
Reinsurance (0.25%) | | | | |
Maiden Holdings North America, Ltd. | | 4,151 | | | 111,787 | |
| | | | | | |
| |
Total Preferred Stocks (Cost $800,023) | | | 810,289 | |
| | | | | | |
| |
Closed-End Mutual Funds (8.22%) | | | | |
BlackRock Enhanced Government | | 8,923 | | | 122,870 | |
BlackRock Income Trust, Inc. | | 66,244 | | | 429,261 | |
Delaware Investments Dividend & Income Fund, Inc.(d) | | 15,845 | | | 156,865 | |
Deutsche Global High Income Fund, Inc. | | 5,840 | | | 49,114 | |
Deutsche High Income Trust | | 53,989 | | | 497,239 | |
Deutsche Multi-Market Income Trust | | 40,897 | | | 349,669 | |
Deutsche Strategic Income Trust | | 6,098 | | | 73,908 | |
First Trust Enhanced Equity Income Fund | | 8,043 | | | 107,454 | |
First Trust Mortgage Income Fund | | 20,588 | | | 296,673 | |
Franklin Limited Duration Income Trust | | 23,771 | | | 287,391 | |
JPMorgan China Region Fund, Inc. | | 4,481 | | | 78,731 | |
Korea Equity Fund, Inc. | | 14,725 | | | 125,310 | |
Madison Strategic Sector Premium Fund | | 15,777 | | | 185,380 | |
Morgan Stanley Income Securities, Inc. | | 17,867 | | | 338,044 | |
| | | | | | | | |
| | | Shares or Principal
Amount | | | Value | |
| |
Closed-End Mutual Funds (continued) | | | | | |
Nuveen Global Equity Income Fund | | | 8,537 | | | $ | 101,932 | |
Pacholder High Yield Fund, Inc. | | | 16,966 | | | | 120,968 | |
Virtus Total Return Fund | | | 51,212 | | | | 242,745 | |
Wells Fargo Multi-Sector Income Fund | | | 6,372 | | | | 82,645 | |
| | | | | | | | |
| |
Total Closed-End Mutual Funds (Cost $3,549,200) | | | | 3,646,199 | |
| | | | | | | | |
| |
Exchange Traded Funds (1.74%) | | | | | |
iShares Currency Hedged MSCI Eurozone ETF | | | 15,000 | | | | 371,850 | |
iShares Europe ETF(d) | | | 10,100 | | | | 397,738 | |
| | | | | | | | |
| |
Total Exchange Traded Funds (Cost $840,581) | | | | 769,588 | |
| | | | | | | | |
| | |
Underlying Security/
Expiration Date/
Exercise Price | | Contracts | | | Value | |
| |
Put Options Purchased (0.16%) | | | | | |
S&P 500 Index | | | | | | | | |
12/16/16, 1,800 | | | 60 | | | | 30,000 | |
S&P 500 Index | | | | | | | | |
10/21/16, 2,050 | | | 15 | | | | 5,220 | |
S&P 500 Index | | | | | | | | |
01/20/17, 1,800 | | | 40 | | | | 36,000 | |
| | | | | | | | |
| | | | | | | 71,220 | |
| | | | | | | | |
| |
Total Put Options Purchased (Cost $399,527) | | | | 71,220 | |
| | | | | | | | |
| | |
| | | Shares or Principal
Amount | | | Value | |
| |
Collateral for Securities on Loan (0.96%) | | | | | |
State Street Navigator Prime Portfolio, 0.30% | | | 426,194 | | | | 426,194 | |
| | | | | | | | |
| |
Total Collateral for Securities on Loan
(Cost $426,194) | | | | 426,194 | |
| | | | | | | | |
| |
Short-Term Investments (0.16%) | | | | | |
Time Deposits (0.16%) | | | | | | | | |
State Street Euro Dollar Time Deposit (USD), | | | | | | | | |
0.01%, 10/03/16 | | | 71,708 | | | | 71,708 | |
| | | | | | | | |
| |
Total Short-Term Investments (Cost $71,708) | | | | 71,708 | |
| | | | | | | | |
| | |
The accompanying notes are an integral part of the financial statements. |
| Annual Report | September 30, 2016 | | 33 |
| | |
| ICON Risk-Managed Balanced Fund | | Schedule of Investments |
| | September 30, 2016 |
| | | | |
| | | Value | |
| |
Total Investments (100.63%) (Cost $44,223,761) | | $ | 44,612,041 | |
| |
Liabilities Less Other Assets (-0.63%) | | | (278,288) | |
| | | | |
| |
Net Assets (100.00%) | | $ | 44,333,753 | |
| | | | |
| (a) | Security exempt from registration under Rule 144A of the Securities Act of 1933. These securities may be resold in the ordinary course of business in transactions exempt from registration, normally to qualified institutional buyers. As of September 30, 2016, these securities had a total aggregate market value of $5,600,373, representing 12.63% of net assets. |
| (b) | Floating Rate Security. Rate disclosed is as of September 30, 2016. |
| (c) | These securities are considered to be illiquid. The aggregate value of these securities at September 30, 2016 was $3,554,959, which represent 8.02% of the Fund’s net assets. |
| (d) | All or a portion of the security was on loan as of September 30, 2016. |
| (e) | Non-income producing security. |
ADR - American Depositary Receipt
REIT - Real Estate Investment Trust
| | | | |
| Industry Composition (September 30, 2016) | | | |
| |
| |
Pharmaceuticals | | | 3.22% | |
Data Processing & Outsourced Services | | | 3.08% | |
Diversified Banks | | | 2.45% | |
Aerospace & Defense | | | 2.22% | |
Internet Software & Services | | | 2.10% | |
Consumer Finance | | | 2.00% | |
Electronic Manufacturing Services | | | 1.94% | |
Biotechnology | | | 1.92% | |
Regional Banks | | | 1.84% | |
Drug Retail | | | 1.75% | |
Real Estate Services | | | 1.52% | |
Managed Health Care | | | 1.50% | |
Semiconductors | | | 1.50% | |
Hotels, Resorts & Cruise Lines | | | 1.26% | |
Footwear | | | 1.24% | |
Health Care Facilities | | | 1.18% | |
Industrial Conglomerates | | | 1.13% | |
Movies & Entertainment | | | 1.12% | |
Health Care Distributors | | | 1.09% | |
Other Industries (each less than 1%) | | | 19.79% | |
| | | | |
| | | 53.85% | |
| | | | |
Percentages are based upon common and preferred stocks as a percentage of net assets.
| | | | |
| Sector Composition (September 30, 2016) | | | |
| |
| |
Health Care | | | 10.10% | |
Information Technology | | | 9.93% | |
Consumer Discretionary | | | 8.99% | |
Financial | | | 8.87% | |
Industrials | | | 7.10% | |
Materials | | | 2.01% | |
Real Estate | | | 1.96% | |
Consumer Staples | | | 1.75% | |
Energy | | | 1.56% | |
Utilities | | | 1.21% | |
Telecommunication Services | | | 0.32% | |
Diversified | | | 0.05% | |
| | | | |
| | | 53.85% | |
| | | | |
Percentages are based upon common and preferred stocks as a percentage of net assets.
| | | | |
| Credit Diversification (September 30, 2016) | | | |
| |
| |
A-* | | | 0.78% | |
A3 | | | 4.20% | |
Aa2 | | | 0.59% | |
Aa3 | | | 0.68% | |
Aaa | | | 6.48% | |
B1 | | | 0.94% | |
B2 | | | 1.26% | |
Ba1 | | | 1.95% | |
Ba2 | | | 0.23% | |
Ba3 | | | 1.03% | |
Baa1 | | | 2.61% | |
Baa2 | | | 3.79% | |
Baa3 | | | 4.51% | |
BBB* | | | 0.42% | |
BBB-* | | | 0.47% | |
NR | | | 5.60% | |
| | | | |
Total: | | | 35.54% | |
| | | | |
| * | Reflects S&P Rating for securities where Moody’s rating is unavailable. |
Percentages are based upon U.S. Treasury obligations, collateralized mortgage obligations, corporate and convertible corporate bond investments as a percentage of net assets. Ratings based on Moody’s Investors Service, Inc.
| | |
The accompanying notes are an integral part of the financial statements. |
| 34 | | www.iconfunds.com |
| | |
| ICON Diversified Funds | | Statements of Assets and Liabilities |
| | September 30, 2016 |
| | | | | | | | | | | | |
| | | ICON Bond Fund | | | ICON Equity Income
Fund | | | ICON Fund | |
| |
Assets | | | | | | | | | | | | |
Investments, at cost | | $ | 86,526,530 | | | $ | 68,862,872 | | | $ | 44,291,780 | |
| | | | |
Investments, at value(a) | | | 87,722,944 | | | | 70,505,086 | | | | 45,913,602 | |
Foreign currency, at value (Cost $–, $8,423 and $–, respectively) | | | – | | | | 8,423 | | | | – | |
Receivables: | | | | | | | | | | | | |
Investments sold | | | – | | | | 3,438,114 | | | | 471,971 | |
Fund shares sold | | | 107,669 | | | | 339,156 | | | | 2,285 | |
Expense reimbursements due from Adviser | | | 39,000 | | | | 808 | | | | 2,474 | |
Interest | | | 808,511 | | | | 34,472 | | | | – | |
Dividends | | | 5,483 | | | | 171,749 | | | | 31,234 | |
Foreign tax reclaims | | | – | | | | 1,782 | | | | – | |
Other assets | | | 22,137 | | | | 44,420 | | | | 19,604 | |
| | | | |
Total assets | | | 88,705,744 | | | | 74,544,010 | | | | 46,441,170 | |
| | | | |
| | | |
Liabilities | | | | | | | | | | | | |
Payables: | | | | | | | | | | | | |
Payable for collateral received on securities loaned | | | 1,092,875 | | | | 5,989,261 | | | | – | |
Loan payable, at value (Cost $–, $– and $431,277) | | | – | | | | – | | | | 431,277 | |
Investments purchased | | | – | | | | 3,108,822 | | | | – | |
Fund shares redeemed | | | 141,865 | | | | 112,529 | | | | 21,646 | |
Distributions due to shareholders | | | 20,120 | | | | 50,807 | | | | – | |
Advisory fees | | | 43,108 | | | | 40,116 | | | | 28,255 | |
Transfer agent fees | | | 8,647 | | | | 11,724 | | | | 7,985 | |
Fund accounting fees | | | 4,725 | | | | 3,340 | | | | 1,881 | |
Accrued distribution fees | | | 4,474 | | | | 11,976 | | | | 10,585 | |
Trustee fees and expenses | | | 3,677 | | | | 2,661 | | | | 1,977 | |
Administration fees | | | 3,716 | | | | 2,744 | | | | 1,950 | |
Accrued expenses | | | 36,698 | | | | 34,859 | | | | 28,696 | |
| | | | |
Total liabilities | | | 1,359,905 | | | | 9,368,839 | | | | 534,252 | |
| | | | |
Net Assets - all share classes | | $ | 87,345,839 | | | $ | 65,175,171 | | | $ | 45,906,918 | |
| | | | |
Net Assets - Class S | | $ | 76,656,414 | | | $ | 37,867,930 | | | $ | 28,896,978 | |
| | | | |
Net Assets - Class C | | $ | 4,589,592 | | | $ | 10,531,959 | | | $ | 11,519,992 | |
| | | | |
Net Assets - Class A | | $ | 6,099,833 | | | $ | 16,775,282 | | | $ | 5,489,948 | |
| | | | |
| | | |
Net Assets Consists of | | | | | | | | | | | | |
Paid-in capital | | $ | 88,517,949 | | | $ | 84,209,406 | | | $ | 64,945,079 | |
Accumulated undistributed net investment income/(loss) | | | 123,417 | | | | 31,918 | | | | – | |
Accumulated undistributed net realized gain/(loss) | | | (2,491,941) | | | | (20,708,406) | | | | (20,659,983) | |
Unrealized appreciation/(depreciation) | | | 1,196,414 | | | | 1,642,253 | | | | 1,621,822 | |
| | | | |
Net Assets | | $ | 87,345,839 | | | $ | 65,175,171 | | | $ | 45,906,918 | |
| | | | |
| | | |
Shares outstanding (unlimited shares authorized, no par value) | | | | | | | | | | | | |
Class S | | | 8,025,162 | | | | 2,425,082 | | | | 2,053,038 | |
Class C | | | 478,920 | | | | 668,436 | | | | 924,713 | |
Class A | | | 641,456 | | | | 1,076,989 | | | | 412,376 | |
Net asset value (offering and redemption price per share) | | | | | | | | | | | | |
Class S | | $ | 9.55 | | | $ | 15.62 | | | $ | 14.08 | |
Class C | | $ | 9.58 | | | $ | 15.76 | | | $ | 12.46 | |
Class A | | $ | 9.51 | | | $ | 15.58 | | | $ | 13.31 | |
Class A maximum offering price (100%/ (100%-maximum sales charge)) of net asset value adjusted to the nearest cent per share | | $ | 9.98 | | | $ | 16.53 | | | $ | 14.13 | |
| | | |
(a) Includes securities on loan of | | $ | 1,065,671 | | | $ | 5,888,869 | | | $ | – | |
| | |
The accompanying notes are an integral part of the financial statements. |
| Annual Report | September 30, 2016 | | 35 |
| | |
| ICON Diversified Funds | | Statements of Assets and Liabilities |
| | September 30, 2016 |
| | | | | | | | | | | | |
| | | ICON Long/Short
Fund | | | ICON Opportunities
Fund | | | ICON Risk-Managed
Balanced Fund | |
| |
Assets | | | | | | | | | | | | |
Investments, at cost | | $ | 16,198,973 | | | $ | 15,135,439 | | | $ | 44,223,761 | |
| | | | |
Investments, at value(a) | | | 16,714,215 | | | | 16,097,498 | | | | 44,612,041 | |
Receivables: | | | | | | | | | | | | |
Investments sold | | | 472,646 | | | | – | | | | 207,129 | |
Fund shares sold | | | 976 | | | | 604 | | | | 80,879 | |
Expense reimbursements due from Adviser | | | 3,605 | | | | – | | | | 10,110 | |
Interest | | | – | | | | – | | | | 137,087 | |
Dividends | | | 10,419 | | | | 273 | | | | 16,492 | |
Foreign tax reclaims | | | – | | | | – | | | | – | |
Other assets | | | 17,961 | | | | 7,674 | | | | 22,039 | |
| | | | |
Total assets | | | 17,219,822 | | | | 16,106,049 | | | | 45,085,777 | |
| | | | |
| | | |
Liabilities | | | | | | | | | | | | |
Payables: | | | | | | | | | | | | |
Payable for collateral received on securities loaned | | | – | | | | – | | | | 426,194 | |
Loan payable, at value (Cost $498,627, $– and $–) | | | 498,627 | | | | – | | | | – | |
Expense recoupment due to Adviser | | | – | | | | 3,706 | | | | – | |
Investments purchased | | | – | | | | – | | | | 97,686 | |
Fund shares redeemed | | | 30,325 | | | | 7,943 | | | | 127,129 | |
Distributions due to shareholders | | | – | | | | – | | | | 7,753 | |
Advisory fees | | | 12,086 | | | | 9,518 | | | | 27,906 | |
Transfer agent fees | | | 6,821 | | | | 2,357 | | | | 10,265 | |
Fund accounting fees | | | 1,012 | | | | 1,072 | | | | 4,739 | |
Accrued distribution fees | | | 4,643 | | | | – | | | | 14,384 | |
Trustee fees and expenses | | | 756 | | | | 506 | | | | 1,940 | |
Administration fees | | | 737 | | | | 630 | | | | 1,927 | |
Accrued expenses | | | 24,007 | | | | 21,420 | | | | 32,101 | |
| | | | |
Total liabilities | | | 579,014 | | | | 47,152 | | | | 752,024 | |
| | | | |
Net Assets - all share classes | | $ | 16,640,808 | | | $ | 16,058,897 | | | $ | 44,333,753 | |
| | | | |
Net Assets - Class S | | $ | 7,113,901 | | | $ | – | | | $ | 20,087,384 | |
| | | | |
Net Assets - Class C | | $ | 4,211,085 | | | $ | – | | | $ | 15,151,197 | |
| | | | |
Net Assets - Class A | | $ | 5,315,822 | | | $ | – | | | $ | 9,095,172 | |
| | | | |
| | | |
Net Assets Consists of | | | | | | | | | | | | |
Paid-in capital | | $ | 71,239,732 | | | $ | 15,007,079 | | | $ | 56,946,628 | |
Accumulated undistributed net investment income/(loss) | | | (6,963) | | | | (30,697) | | | | 68,236 | |
Accumulated undistributed net realized gain/(loss) | | | (55,107,203) | | | | 120,456 | | | | (13,069,391) | |
Unrealized appreciation/(depreciation) | | | 515,242 | | | | 962,059 | | | | 388,280 | |
| | | | |
Net Assets | | $ | 16,640,808 | | | $ | 16,058,897 | | | $ | 44,333,753 | |
| | | | |
| | | |
Shares outstanding (unlimited shares authorized, no par value) | | | | | | | 1,089,148 | | | | | |
Class S | | | 380,324 | | | | – | | | | 1,389,269 | |
Class C | | | 252,924 | | | | – | | | | 1,141,951 | |
Class A | | | 292,676 | | | | – | | | | 644,651 | |
Net asset value (offering and redemption price per share) | | | | | | $ | 14.74 | | | | | |
Class S | | $ | 18.70 | | | $ | – | | | $ | 14.46 | |
Class C | | $ | 16.65 | | | $ | – | | | $ | 13.27 | |
Class A | | $ | 18.16 | | | $ | – | | | $ | 14.11 | |
Class A maximum offering price (100%/ (100%-maximum sales charge)) of net asset value adjusted to the nearest cent per share | | $ | 19.27 | | | $ | – | | | $ | 14.97 | |
| | | |
(a) Includes securities on loan of | | $ | – | | | $ | – | | | $ | 419,967 | |
| | |
The accompanying notes are an integral part of the financial statements. |
| 36 | | www.iconfunds.com |
| | |
| ICON Diversified Funds | | Statements of Operations |
| | Year Ended September 30, 2016 |
| | | | | | | | | | | | |
| | | ICON Bond Fund | | | ICON Equity
Income Fund | | | ICON Fund | |
Investment Income | | | | | | | | | | | | |
Interest | | $ | 3,141,390 | | | $ | 116,333 | | | $ | 1,155 | |
Dividends | | | 562,160 | | | | 2,294,606 | | | | 744,606 | |
Foreign taxes withheld | | | – | | | | (23,016) | | | | (1,161) | |
Income from securities lending, net | | | 14,170 | | | | 221,774 | | | | 9,160 | |
Other income | | | – | | | | 14 | | | | – | |
| | | | |
Total investment income | | | 3,717,720 | | | | 2,609,711 | | | | 753,760 | |
| | | | |
Expenses | | | | | | | | | | | | |
Advisory fees | | | 511,458 | | | | 378,644 | | | | 373,960 | |
Administration fees | | | 42,743 | | | | 25,318 | | | | 24,996 | |
Transfer agent fees | | | 86,772 | | | | 81,098 | | | | 82,909 | |
Distribution fees: | | | | | | | | | | | | |
Class C | | | 39,066 | | | | 76,325 | | | | 124,186 | |
Class A | | | 16,084 | | | | 36,994 | | | | 15,833 | |
Registration fees | | | 36,254 | | | | 37,350 | | | | 33,244 | |
Audit and tax service expense | | | 26,515 | | | | 21,082 | | | | 17,326 | |
Fund accounting fees | | | 33,910 | | | | 20,618 | | | | 18,221 | |
Trustee fees and expenses | | | 13,976 | | | | 8,422 | | | | 7,974 | |
Insurance expense | | | 11,456 | | | | 5,169 | | | | 8,441 | |
Custody fees | | | 7,234 | | | | 6,605 | | | | 3,169 | |
Printing fees | | | 12,589 | | | | 12,722 | | | | 11,359 | |
Interest expense | | | 415 | | | | 315 | | | | 4,942 | |
Recoupment of previously reimbursed expenses | | | – | | | | 16,522 | | | | 2,969 | |
Other expenses | | | 38,700 | | | | 28,546 | | | | 24,394 | |
| | | | |
Total expenses before expense reimbursement | | | 877,172 | | | | 755,730 | | | | 753,923 | |
Expense reimbursement by Adviser due to expense limitation agreement | | | (180,193) | | | | (35,317) | | | | (28,516) | |
| | | | |
Net Expenses | | | 696,979 | | | | 720,413 | | | | 725,407 | |
| | | | |
Net Investment Income/(Loss) | | | 3,020,741 | | | | 1,889,298 | | | | 28,353 | |
| | | | |
Realized and Unrealized Gain/(Loss) | | | | | | | | | | | | |
Net realized gain/(loss) on: | | | | | | | | | | | | |
Investments | | | 240,106 | | | | (994,897) | | | | (1,328,436) | |
Foreign currency | | | – | | | | 198 | | | | – | |
Long-term capital gain distributions from other investment companies | | | 7,949 | | | | 987 | | | | – | |
| | | | |
| | | 248,055 | | | | (993,712) | | | | (1,328,436) | |
| | | | |
Change in unrealized net appreciation/(depreciation) on: | | | | | | | | | | | | |
Investments and foreign currency | | | 2,838,297 | | | | 5,024,516 | | | | 1,797,942 | |
| | | | |
| | | 2,838,297 | | | | 5,024,516 | | | | 1,797,942 | |
| | | | |
Net realized and unrealized gain/(loss) | | | 3,086,352 | | | | 4,030,804 | | | | 469,506 | |
| | | | |
Net Increase/(Decrease) in Net Assets Resulting From Operations | | $ | 6,107,093 | | | $ | 5,920,102 | | | $ | 497,859 | |
| | | | |
| | |
The accompanying notes are an integral part of the financial statements. |
| Annual Report | September 30, 2016 | | 37 |
| | |
| ICON Diversified Funds | | Statements of Operations |
| | Year Ended September 30, 2016 |
| | | | | | | | | | | | |
| | | ICON Long/
Short Fund | | | ICON Opportunities
Fund | | | ICON Risk-Managed
Balanced Fund | |
Investment Income | | | | | | | | | | | | |
Interest | | $ | 9 | | | $ | 58 | | | $ | 621,620 | |
Dividends | | | 327,853 | | | | 140,673 | | | | 651,342 | |
Foreign taxes withheld | | | (221) | | | | – | | | | (2,390) | |
Income from securities lending, net | | | 2,780 | | | | – | | | | 15,046 | |
Other income | | | – | | | | – | | | | 4,043 | |
| | | | |
Total investment income | | | 330,421 | | | | 140,731 | | | | 1,289,661 | |
| | | | |
Expenses | | | | | | | | | | | | |
Advisory fees | | | 183,086 | | | | 83,499 | | | | 380,666 | |
Administration fees | | | 10,795 | | | | 5,568 | | | | 25,443 | |
Transfer agent fees | | | 58,674 | | | | 18,369 | | | | 90,855 | |
Distribution fees: | | | | | | | | | | | | |
Class C | | | 50,066 | | | | – | | | | 151,556 | |
Class A | | | 17,453 | | | | – | | | | 22,909 | |
Registration fees | | | 34,976 | | | | 9,519 | | | | 38,822 | |
Audit and tax service expense | | | 18,873 | | | | 16,353 | | | | 23,608 | |
Fund accounting fees | | | 8,409 | | | | 5,344 | | | | 26,291 | |
Trustee fees and expenses | | | 3,383 | | | | 1,789 | | | | 8,300 | |
Insurance expense | | | 4,732 | | | | 1,538 | | | | 4,064 | |
Custody fees | | | 3,127 | | | | 2,546 | | | | 11,486 | |
Printing fees | | | 6,165 | | | | 6,145 | | | | 11,254 | |
Interest expense | | | 6,842 | | | | 664 | | | | 2,630 | |
Recoupment of previously reimbursed expenses | | | 9,867 | | | | 11,396 | | | | 5,313 | |
Other expenses | | | 13,321 | | | | 8,190 | | | | 27,346 | |
| | | | |
Total expenses before expense reimbursement | | | 429,769 | | | | 170,920 | | | | 830,543 | |
Expense reimbursement by Adviser due to expense limitation agreement | | | (80,331) | | | | (3,029) | | | | (44,620) | |
| | | | |
Net Expenses | | | 349,438 | | | | 167,891 | | | | 785,923 | |
| | | | |
Net Investment Income/(Loss) | | | (19,017) | | | | (27,160) | | | | 503,738 | |
| | | | |
Realized and Unrealized Gain/(Loss) | | | | | | | | | | | | |
Net realized gain/(loss) on: | | | | | | | | | | | | |
Investments | | | 67,924 | | | | 143,820 | | | | 267,235 | |
Foreign currency | | | – | | | | – | | | | (69) | |
Written options | | | – | | | | – | | | | (146,066) | |
Long-term capital gain distributions from other investment companies | | | – | | | | – | | | | 11,386 | |
| | | | |
| | | 67,924 | | | | 143,820 | | | | 132,486 | |
| | | | |
Change in unrealized net appreciation/(depreciation) on: | | | | | | | | | | | | |
Investments and foreign currency | | | 8,849 | | | | 1,036,666 | | | | 1,179,154 | |
| | | | |
| | | 8,849 | | | | 1,036,666 | | | | 1,179,154 | |
| | | | |
Net realized and unrealized gain/(loss) | | | 76,773 | | | | 1,180,486 | | | | 1,311,640 | |
| | | | |
Net Increase/(Decrease) in Net Assets Resulting From Operations | | $ | 57,756 | | | $ | 1,153,326 | | | $ | 1,815,378 | |
| | | | |
| | |
The accompanying notes are an integral part of the financial statements. |
| 38 | | www.iconfunds.com |
| | |
| ICON Diversified Funds | | Statements of Changes in Net Assets |
| | |
| | | | | | | | | | | | | | | | |
| | | ICON Bond Fund | | | ICON Equity Income Fund | |
| | | Year Ended
September 30, 2016 | | | Year Ended
September 30, 2015 | | | Year Ended
September 30, 2016 | | | Year Ended
September 30, 2015 | |
Operations | | | | | | | | | | | | | | | | |
Net investment income/(loss) | | $ | 3,020,741 | | | $ | 3,856,226 | | | $ | 1,889,298 | | | $ | 1,436,199 | |
Net realized gain/(loss) | | | 240,106 | | | | (2,721,154) | | | | (994,699) | | | | 2,378,033 | |
Net realized gain/(loss) on long-term capital gain distributions from other investment companies | | | 7,949 | | | | – | | | | 987 | | | | – | |
Change in net unrealized appreciation/(depreciation) | | | 2,838,297 | | | | (1,322,993) | | | | 5,024,516 | | | | (3,911,455) | |
| | | | |
Net increase/(decrease) in net assets resulting from operations | | | 6,107,093 | | | | (187,921) | | | | 5,920,102 | | | | (97,223) | |
| | | | |
Dividends and Distributions to Shareholders | | | | | | | | | | | | | | | | |
Net investment income | | | | | | | | | | | | | | | | |
Class S | | | (2,609,859) | | | | (4,367,039) (a) | | | | (1,164,475) | | | | (760,578) | |
Class C | | | (127,022) | | | | (198,438) (a) | | | | (220,158) | | | | (154,918) | |
Class A | | | (213,454) | | | | (381,214) (a) | | | | (536,706) | | | | (425,141) | |
Net realized gains | | | | | | | | | | | | | | | | |
Class S | | | – | | | | (1,100,327) | | | | – | | | | – | |
Class C | | | – | | | | (49,999) | | | | – | | | | – | |
Class A | | | – | | | | (96,051) | | | | – | | | | – | |
Return of capital | | | | | | | | | | | | | | | | |
Class S | | | – | | | | (281,945) | | | | – | | | | – | |
Class C | | | – | | | | (12,812) | | | | – | | | | – | |
Class A | | | – | | | | (24,612) | | | | – | | | | – | |
| | | | |
Net decrease from dividends and distributions | | | (2,950,335) | | | | (6,512,437) | | | | (1,921,339) | | | | (1,340,637) | |
| | | | |
Fund Share Transactions | | | | | | | | | | | | | | | | |
Shares sold | | | | | | | | | | | | | | | | |
Class S | | | 23,652,490 | | | | 19,939,410 | | | | 22,323,535 | | | | 22,636,893 | |
Class C | | | 2,037,494 | | | | 2,204,299 | | | | 4,965,537 | | | | 2,336,246 | |
Class A | | | 3,634,359 | | | | 5,041,777 | | | | 5,435,514 | | | | 2,127,508 | |
Reinvested dividends and distributions | | | | | | | | | | | | | | | | |
Class S | | | 2,285,962 | | | | 5,264,217 | | | | 1,105,137 | | | | 715,630 | |
Class C | | | 92,020 | | | | 160,822 | | | | 167,115 | | | | 105,154 | |
Class A | | | 108,802 | | | | 245,318 | | | | 459,085 | | | | 385,989 | |
Shares repurchased | | | | | | | | | | | | | | | | |
Class S | | | (25,213,749) | | | | (33,725,086) | | | | (10,457,028) | | | | (7,873,137) | |
Class C | | | (1,852,274) | | | | (843,849) | | | | (2,082,558) | | | | (796,100) | |
Class A | | | (5,687,994) | | | | (1,286,486) | | | | (3,382,907) | | | | (2,907,210) | |
| | | | |
Net increase/(decrease) from fund share transactions | | | (942,890) | | | | (2,999,578) | | | | 18,533,430 | | | | 16,730,973 | |
| | | | |
Total net increase/(decrease) in net assets | | | 2,213,868 | | | | (9,699,936) | | | | 22,532,193 | | | | 15,293,113 | |
Net Assets | | | | | | | | | | | | | | | | |
Beginning of year | | | 85,131,971 | | | | 94,831,907 | | | | 42,642,978 | | | | 27,349,865 | |
| | | | |
End of year | | $ | 87,345,839 | | | $ | 85,131,971 | | | $ | 65,175,171 | | | $ | 42,642,978 | |
| | | | |
Accumulated undistributed net investment income/(loss) | | $ | 123,417 | | | $ | (2,398) | | | $ | 31,918 | | | $ | 73,948 | |
| | | | |
| (a) | The ICON Bond Fund had a distribution in excess of net investment income during the fiscal year ended September 30, 2015. |
| | |
The accompanying notes are an integral part of the financial statements. |
| Annual Report | September 30, 2016 | | 39 |
| | |
| ICON Diversified Funds | | Statements of Changes in Net Assets |
| | |
| | | | | | | | | | | | | | | | |
| | | ICON Bond Fund | | | ICON Equity Income Fund | |
| | | Year Ended
September 30, 2016 | | | Year Ended
September 30, 2015 | | | Year Ended
September 30, 2016 | | | Year Ended
September 30, 2015 | |
Transactions in Fund Shares | | | | | | | | | | | | | | | | |
Shares sold | | | | | | | | | | | | | | | | |
Class S | | | 2,542,262 | | | | 2,079,890 | | | | 1,471,811 | | | | 1,503,214 | |
Class C | | | 218,630 | | | | 230,646 | | | | 323,130 | | | | 150,250 | |
Class A | | | 394,911 | | | | 531,071 | | | | 358,450 | | | | 137,103 | |
Issued to shareholders in reinvestment of distributions | | | | | | | | | | | | | | | | |
Class S | | | 245,654 | | | | 556,451 | | | | 73,747 | | | | 46,951 | |
Class C | | | 9,850 | | | | 16,961 | | | | 11,022 | | | | 6,871 | |
Class A | | | 11,757 | | | | 26,037 | | | | 30,748 | | | | 25,418 | |
Shares repurchased | | | | | | | | | | | | | | | | |
Class S | | | (2,710,665) | | | | (3,548,159) | | | | (706,603) | | | | (503,502) | |
Class C | | | (197,764) | | | | (89,159) | | | | (138,110) | | | | (51,185) | |
Class A | | | (619,858) | | | | (136,282) | | | | (224,896) | | | | (186,068) | |
| | | | |
Net increase/(decrease) | | | (105,223) | | | | (332,544) | | | | 1,199,299 | | | | 1,129,052 | |
| | | | |
Shares outstanding, beginning of year | | | 9,250,761 | | | | 9,583,305 | | | | 2,971,208 | | | | 1,842,156 | |
| | | | |
Shares outstanding, end of year | | | 9,145,538 | | | | 9,250,761 | | | | 4,170,507 | | | | 2,971,208 | |
| | | | |
| | |
The accompanying notes are an integral part of the financial statements. |
| 40 | | www.iconfunds.com |
| | |
| ICON Diversified Funds | | Statements of Changes in Net Assets |
| | |
| | | | | | | | | | | | | | | | |
| | | ICON Fund | | | ICON Long/Short Fund | |
| | | Year Ended
September 30, 2016 | | | Year Ended
September 30, 2015 | | | Year Ended
September 30, 2016 | | | Year Ended
September 30, 2015 | |
Operations | | | | | | | | | | | | | | | | |
Net investment income/(loss) | | $ | 28,353 | | | $ | (305,707) | | | $ | (19,017) | | | $ | (272,826) | |
Net realized gain/(loss) | | | (1,328,436) | | | | 1,666,949 | | | | 67,924 | | | | 1,596,940 | |
Change in net unrealized appreciation/(depreciation) | | | 1,797,942 | | | | (3,490,916) | | | | 8,849 | | | | (1,334,483) | |
| | | | |
Net increase/(decrease) in net assets resulting from operations | | | 497,859 | | | | (2,129,674) | | | | 57,756 | | | | (10,369) | |
| | | | |
| | | | |
Fund Share Transactions | | | | | | | | | | | | | | | | |
Shares sold | | | | | | | | | | | | | | | | |
Class S | | | 1,519,056 | | | | 2,650,530 | | | | 1,759,878 | | | | 13,446,762 | |
Class C | | | 455,017 | | | | 570,850 | | | | 196,083 | | | | 1,135,887 | |
Class A | | | 356,458 | | | | 673,069 | | | | 635,346 | | | | 2,023,326 | |
Shares repurchased | | | | | | | | | | | | | | | | |
Class S | | | (6,734,706) | | | | (9,474,040) | | | | (11,978,015) | | | | (12,681,757) | |
Class C | | | (2,714,880) | | | | (3,146,732) | | | | (2,239,810) | | | | (1,710,185) | |
Class A | | | (1,906,267) | | | | (1,412,280) | | | | (4,472,867) | | | | (4,078,006) | |
| | | | |
Net decrease from fund share transactions | | | (9,025,322) | | | | (10,138,603) | | | | (16,099,385) | | | | (1,863,973) | |
| | | | |
| | | | |
Total net decrease in net assets | | | (8,527,463) | | | | (12,268,277) | | | | (16,041,629) | | | | (1,874,342) | |
| | | | |
Net Assets | | | | | | | | | | | | | | | | |
Beginning of year | | | 54,434,381 | | | | 66,702,658 | | | | 32,682,437 | | | | 34,556,779 | |
| | | | |
End of year | | $ | 45,906,918 | | | $ | 54,434,381 | | | $ | 16,640,808 | | | $ | 32,682,437 | |
| | | | |
| | | | |
Accumulated undistributed net investment income/(loss) | | $ | – | | | $ | (171,984) | | | $ | (6,963) | | | $ | (195,326) | |
| | | | |
Transactions in Fund Shares | | | | | | | | | | | | | | | | |
Shares sold | | | | | | | | | | | | | | | | |
Class S | | | 108,905 | | | | 174,791 | | | | 98,051 | | | | 668,902 | |
Class C | | | 37,939 | | | | 40,080 | | | | 11,912 | | | | 60,489 | |
Class A | | | 27,328 | | | | 44,868 | | | | 36,303 | | | | 100,326 | |
Shares repurchased | | | | | | | | | | | | | | | | |
Class S | | | (492,502) | | | | (601,521) | | | | (652,902) | | | | (627,870) | |
Class C | | | (223,446) | | | | (226,313) | | | | (139,906) | | | | (93,775) | |
Class A | | | (147,621) | | | | (95,562) | | | | (256,603) | | | | (207,860) | |
| | | | |
Net decrease | | | (689,397) | | | | (663,657) | | | | (903,145) | | | | (99,788) | |
| | | | |
Shares outstanding, beginning of year | | | 4,079,524 | | | | 4,743,181 | | | | 1,829,069 | | | | 1,928,857 | |
| | | | |
Shares outstanding, end of year | | | 3,390,127 | | | | 4,079,524 | | | | 925,924 | | | | 1,829,069 | |
| | | | |
| | |
The accompanying notes are an integral part of the financial statements. |
| Annual Report | September 30, 2016 | | 41 |
| | |
| ICON Diversified Funds | | Statements of Changes in Net Assets |
| | |
| | | | | | | | | | | | | | | | |
| | | ICON Opportunities Fund | | | ICON Risk-Managed Balanced Fund | |
| | | Year Ended
September 30, 2016 | | | Year Ended
September 30, 2015 | | | Year Ended
September 30, 2016 | | | Year Ended
September 30, 2015 | |
Operations | | | | | | | | | | | | | | | | |
Net investment income/(loss) | | $ | (27,160) | | | $ | (80,515) | | | $ | 503,738 | | | $ | 293,801 | |
Net realized gain/(loss) | | | 143,820 | | | | 29,960 | | | | 121,100 | | | | 446,087 | |
Net realized gain/(loss) on long-term capital gain distributions from other investment companies | | | – | | | | – | | | | 11,386 | | | | – | |
Change in net unrealized appreciation/(depreciation) | | | 1,036,666 | | | | 587,690 | | | | 1,179,154 | | | | (1,184,909) | |
| | | | |
Net increase/(decrease) in net assets resulting from operations | | | 1,153,326 | | | | 537,135 | | | | 1,815,378 | | | | (445,021) | |
| | | | |
| | | | |
Dividends and Distributions to Shareholders | | | | | | | | | | | | | | | | |
Net investment income | | | – | | | | (126,909) | | | | | | | | | |
Class S | | | – | | | | – | | | | (301,369) | | | | (195,258) (a) | |
Class C | | | – | | | | – | | | | (60,049) | | | | (45,453) (a) | |
Class A | | | – | | | | – | | | | (92,328) | | | | (80,740) (a) | |
Net realized gains | | | (10,170) | | | | (60,583) (b) | | | | | | | | | |
| | | | |
Net decrease from dividends and distributions | | | (10,170) | | | | (187,492) | | | | (453,746) | | | | (321,451) | |
| | | | |
| | | | |
Fund Share Transactions | | | | | | | | | | | | | | | | |
Shares sold | | | 6,108,876 | | | | 1,123,562 | | | | | | | | | |
Class S | | | – | | | | – | | | | 15,411,061 | | | | 20,735,760 | |
Class C | | | – | | | | – | | | | 7,253,783 | | | | 5,157,125 | |
Class A | | | – | | | | – | | | | 4,152,730 | | | | 7,372,991 | |
Reinvested dividends and distributions | | | 10,162 | | | | 182,711 | | | | | | | | | |
Class S | | | – | | | | – | | | | 259,419 | | | | 158,420 | |
Class C | | | – | | | | – | | | | 46,376 | | | | 36,577 | |
Class A | | | – | | | | – | | | | 79,762 | | | | 63,152 | |
Shares repurchased | | | (2,250,264) | | | | (2,741,644) | | | | | | | | | |
Class S | | | – | | | | – | | | | (22,982,522) | | | | (13,651,238) | |
Class C | | | – | | | | – | | | | (5,595,969) | | | | (1,464,014) | |
Class A | | | – | | | | – | | | | (3,836,027) | | | | (6,013,030) | |
| | | | |
Net increase/(decrease) from fund share transactions | | | 3,868,774 | | | | (1,435,371) | | | | (5,211,387) | | | | 12,395,743 | |
| | | | |
Total net increase/(decrease) in net assets | | | 5,011,930 | | | | (1,085,728) | | | | (3,849,755) | | | | 11,629,271 | |
| | | | |
Net Assets | | | | | | | | | | | | | | | | |
Beginning of year | | | 11,046,967 | | | | 12,132,695 | | | | 48,183,508 | | | | 36,554,237 | |
| | | | |
End of year | | $ | 16,058,897 | | | $ | 11,046,967 | | | $ | 44,333,753 | | | $ | 48,183,508 | |
| | | | |
Accumulated undistributed net investment income/(loss) | | $ | (30,697) | | | $ | (57,770) | | | $ | 68,236 | | | $ | (3,654) | |
| | | | |
| (a) | The ICON Risk-Managed Balanced Fund had a distribution in excess of net investment income during the fiscal year ended September 30, 2015. |
| (b) | The ICON Opportunities Fund had a distribution in excess of net realized gain during the fiscal year ended September 30, 2015. |
| | |
The accompanying notes are an integral part of the financial statements. |
| 42 | | www.iconfunds.com |
| | |
| ICON Diversified Funds | | Statements of Changes in Net Assets |
| | |
| | | | | | | | | | | | | | | | |
| | | ICON Opportunities Fund | | | ICON Risk-Managed Balanced Fund | |
| | | Year Ended
September 30, 2016 | | | Year Ended
September 30, 2015 | | | Year Ended
September 30, 2016 | | | Year Ended
September 30, 2015 | |
Transactions in Fund Shares | | | | | | | | | | | | | | | | |
Shares sold | | | 426,361 | | | | 79,579 | | | | | | | | | |
Class S | | | – | | | | – | | | | 1,094,151 | | | | 1,429,825 | |
Class C | | | – | | | | – | | | | 554,021 | | | | 385,869 | |
Class A | | | – | | | | – | | | | 298,768 | | | | 521,467 | |
Issued to shareholders in reinvestment of distributions | | | 753 | | | | 13,494 | | | | | | | | | |
Class S | | | – | | | | – | | | | 18,182 | | | | 11,119 | |
Class C | | | – | | | | – | | | | 3,547 | | | | 2,801 | |
Class A | | | – | | | | – | | | | 5,727 | | | | 4,524 | |
Shares repurchased | | | (167,271) | | | | (194,321) | | | | | | | | | |
Class S | | | – | | | | – | | | | (1,625,982) | | | | (973,454) | |
Class C | | | – | | | | – | | | | (429,201) | | | | (109,255) | |
Class A | | | – | | | | – | | | | (277,104) | | | | (421,260) | |
| | | | |
Net increase/(decrease) | | | 259,843 | | | | (101,248) | | | | (357,891) | | | | 851,636 | |
| | | | |
Shares outstanding, beginning of year | | | 829,305 | | | | 930,553 | | | | 3,533,762 | | | | 2,682,126 | |
| | | | |
Shares outstanding, end of year | | | 1,089,148 | | | | 829,305 | | | | 3,175,871 | | | | 3,533,762 | |
| | | | |
| | |
The accompanying notes are an integral part of the financial statements. |
| Annual Report | September 30, 2016 | | 43 |
| | |
| ICON Bond Fund | | Financial Highlights |
| | For a Share Outstanding Throughout the Years Presented |
| | | | | | | | | | | | | | | | | | | | |
| Class S(a) | | Year Ended
September 30,
2016 | | | Year Ended
September 30,
2015 | | | Year Ended
September 30,
2014 | | | Year Ended
September 30,
2013 | | | Year Ended
September 30,
2012 | |
Net asset value, beginning of period | | $ | 9.20 | | | $ | 9.90 | | | $ | 9.89 | | | $ | 10.51 | | | $ | 10.11 | |
Income/(loss) from investment operations: | | | | | | | | | | | | | | | | | | | | |
Net investment income/(loss)(b) | | | 0.34 | | | | 0.41 | | | | 0.43 | (c) | | | 0.24 | | | | 0.38 | |
Net realized and unrealized
gains/(losses) on investments | | | 0.34 | | | | (0.44) | | | | 0.15 | | | | (0.32) | | | | 0.59 | |
| | | | | |
Total from investment operations | | | 0.68 | | | | (0.03) | | | | 0.58 | | | | (0.08) | | | | 0.97 | |
| | | | | |
Less dividends and distributions: | | | | | | | | | | | | | | | | | | | | |
Dividends from net investment income | | | (0.33) | | | | (0.51) | | | | (0.44) | | | | (0.24) | | | | (0.40) | |
Distributions from net realized gains | | | – | | | | (0.13) | | | | (0.13) | | | | (0.30) | | | | (0.17) | |
Return of capital | | | – | | | | (0.03) | | | | – | | | | – | | | | – | |
| | | | | |
Total dividends and distributions | | | (0.33) | | | | (0.67) | | | | (0.57) | | | | (0.54) | | | | (0.57) | |
| | | | | |
Net asset value, end of period | | $ | 9.55 | | | $ | 9.20 | | | $ | 9.90 | | | $ | 9.89 | | | $ | 10.51 | |
| | | | | |
Total Return | | | 7.54 | % | | | (0.28) | % | | | 6.01 | % | | | (0.84) | % | | | 9.93 | % |
Ratios and Supplemental Data | | | | | | | | | | | | | | | | | | | | |
Net assets, end of period (in 000s) | | $ | 76,656 | | | $ | 73,152 | | | $ | 87,675 | | | $ | 88,313 | | | $ | 81,381 | |
Ratio of expenses to average net assets | | | | | | | | | | | | | | | | | | | | |
Before expense limitation | | | 0.93 | % | | | 0.91 | % | | | 0.86 | % | | | 0.89 | % | | | 0.88 | % |
After expense limitation/
recoupment (d) | | | 0.75 | % | | | 0.75 | % | | | 0.75 | % | | | 0.75 | % | | | 0.75 | % |
Ratio of net investment income/(loss) to average net assets | | | | | | | | | | | | | | | | | | | | |
Before expense limitation | | | 3.43 | % | | | 4.10 | % | | | 4.22 | % | | | 2.19 | % | | | 3.46 | % |
After expense limitation/
recoupment | | | 3.61 | % | | | 4.26 | % | | | 4.33 | %(c) | | | 2.33 | % | | | 3.59 | % |
Portfolio turnover rate | | | 141 | % | | | 153 | % | | | 176 | % | | | 97 | % | | | 51 | % |
| (a) | Class S shares were formerly named Class Z shares prior to January 23, 2012. |
| (b) | Calculated using the average shares method. |
| (c) | Investment income per share of Class S reflects a large, non-recurring dividend which amounted to $0.07 per share. Excluding this non- recurring dividend, the ratio of net investment income/(loss) to average net assets would have been 3.59% for Class S. |
| (d) | The Fund’s operating expenses, not including interest expense, are contractually limited to the amounts discussed in Note 3. The ratios in these financial highlights reflect the limitation, including the interest expense, when applicable. |
| | |
The accompanying notes are an integral part of the financial statements. |
| 44 | | www.iconfunds.com |
| | |
| ICON Bond Fund | | Financial Highlights |
| | For a Share Outstanding Throughout the Years Presented |
| | | | | | | | | | | | | | | | | | | | |
| Class C | | Year Ended
September 30,
2016 | | | Year Ended
September 30,
2015 | | | Year Ended
September 30,
2014 | | | Year Ended
September 30,
2013 | | | Year Ended
September 30,
2012 | |
Net asset value, beginning of period | | $ | 9.24 | | | $ | 9.94 | | | $ | 9.93 | | | $ | 10.55 | | | $ | 10.15 | |
Income/(loss) from investment
operations: | | | | | | | | | | | | | | | | | | | | |
Net investment income/(loss)(a) | | | 0.26 | | | | 0.32 | | | | 0.34 | (b) | | | 0.15 | | | | 0.31 | |
Net realized and unrealized
gains/(losses) on investments | | | 0.34 | | | | (0.43) | | | | 0.15 | | | | (0.32) | | | | 0.57 | |
| | | | | |
Total from investment operations | | | 0.60 | | | | (0.11) | | | | 0.49 | | | | (0.17) | | | | 0.88 | |
| | | | | |
Less dividends and distributions: | | | | | | | | | | | | | | | | | | | | |
Dividends from net investment
income | | | (0.26) | | | | (0.43) | | | | (0.35) | | | | (0.15) | | | | (0.31) | |
Distributions from net realized
gains | | | – | | | | (0.13) | | | | (0.13) | | | | (0.30) | | | | (0.17) | |
Return of capital | | | – | | | | (0.03) | | | | – | | | | – | | | | – | |
| | | | | |
Total dividends and distributions | | | (0.26) | | | | (0.59) | | | | (0.48) | | | | (0.45) | | | | (0.48) | |
| | | | | |
Net asset value, end of period | | $ | 9.58 | | | $ | 9.24 | | | $ | 9.94 | | | $ | 9.93 | | | $ | 10.55 | |
| | | | | |
Total Return(c) | | | 6.59% | | | | (1.10)% | | | | 5.10% | | | | (1.66)% | | | | 8.98% | |
Ratios and Supplemental Data | | | | | | | | | | | | | | | | | | | | |
Net assets, end of period (in 000s) | | $ | 4,590 | | | $ | 4,142 | | | $ | 2,879 | | | $ | 3,008 | | | $ | 3,772 | |
Ratio of expenses to average net
assets | | | | | | | | | | | | | | | | | | | | |
Before expense limitation | | | 2.10% | | | | 2.19% | | | | 2.27% | | | | 2.06% | | | | 2.28% | |
After expense limitation/
recoupment (d) | | | 1.60% | | | | 1.60% | | | | 1.60% | | | | 1.60% | | | | 1.60% | |
Ratio of net investment income/(loss) to average net assets | | | | | | | | | | | | | | | | | | | | |
Before expense limitation | | | 2.28% | | | | 2.76% | | | | 2.75% | | | | 1.02% | | | | 2.35% | |
After expense limitation/
recoupment | | | 2.78% | | | | 3.35% | | | | 3.42%( | b) | | | 1.48% | | | | 3.03% | |
Portfolio turnover rate | | | 141% | | | | 153% | | | | 176% | | | | 97% | | | | 51% | |
| (a) | Calculated using the average shares method. |
| (b) | Investment income per share of Class C reflects a large, non-recurring dividend which amounted to $0.06 per share. Excluding this non- recurring dividend, the ratio of net investment income/(loss) to average net assets would have been 2.84% for Class C. |
| (c) | The total return calculation excludes any sales charges. |
| (d) | The Fund’s operating expenses, not including interest expense, are contractually limited to the amounts discussed in Note 3. The ratios in these financial highlights reflect the limitation, including the interest expense, when applicable. |
| | |
The accompanying notes are an integral part of the financial statements. |
| Annual Report | September 30, 2016 | | 45 |
| | |
| ICON Bond Fund | | Financial Highlights |
| | For a Share Outstanding Throughout the Years Presented |
| | | | | | | | | | | | | | | | | | | | |
| Class A(a) | | Year Ended
September 30,
2016 | | | Year Ended
September 30,
2015 | | | Year Ended
September 30,
2014 | | | Year Ended
September 30,
2013 | | | Year Ended
September 30,
2012 | |
Net asset value, beginning of period | | $ | 9.17 | | | $ | 9.86 | | | $ | 9.89 | | | $ | 10.51 | | | $ | 10.11 | |
Income/(loss) from investment operations: | | | | | | | | | | | | | | | | | | | | |
Net investment income/(loss)(b) | | | 0.31 | | | | 0.36 | | | | 0.43 | (c) | | | 0.21 | | | | 0.36 | |
Net realized and unrealized gains/(losses) on investments | | | 0.34 | | | | (0.41) | | | | 0.12 | | | | (0.32) | | | | 0.58 | |
| | | | | |
Total from investment operations | | | 0.65 | | | | (0.05) | | | | 0.55 | | | | (0.11) | | | | 0.94 | |
| | | | | |
Less dividends and distributions: | | | | | | | | | | | | | | | | | | | | |
Dividends from net investment income | | | (0.31) | | | | (0.48) | | | | (0.45) | | | | (0.21) | | | | (0.37) | |
Distributions from net realized gains | | | – | | | | (0.13) | | | | (0.13) | | | | (0.30) | | | | (0.17) | |
Return of capital | | | – | | | | (0.03) | | | | – | | | | – | | | | – | |
| | | | | |
Total dividends and distributions | | | (0.31) | | | | (0.64) | | | | (0.58) | | | | (0.51) | | | | (0.54) | |
| | | | | |
Net asset value, end of period | | $ | 9.51 | | | $ | 9.17 | | | $ | 9.86 | | | $ | 9.89 | | | $ | 10.51 | |
| | | | | |
Total Return(d) | | | 7.25 | % | | | (0.44) | % | | | 5.77 | % | | | (1.08) | % | | | 9.66 | % |
Ratios and Supplemental Data | | | | | | | | | | | | | | | | | | | | |
Net assets, end of period (in 000s) | | $ | 6,100 | | | $ | 7,838 | | | $ | 4,278 | | | $ | 6,792 | | | $ | 7,515 | |
Ratio of expenses to average net assets | | | | | | | | | | | | | | | | | | | | |
Before expense limitation | | | 1.38 | % | | | 1.36 | % | | | 1.44 | % | | | 1.34 | % | | | 1.31 | % |
After expense limitation/ recoupment (e) | | | 1.00 | % | | | 1.00 | % | | | 1.00 | % | | | 1.00 | % | | | 1.00 | % |
Ratio of net investment income/(loss) to average net assets | | | | | | | | | | | | | | | | | | | | |
Before expense limitation | | | 2.98 | % | | | 3.50 | % | | | 3.84 | % | | | 1.71 | % | | | 3.13 | % |
After expense limitation/ recoupment | | | 3.36 | % | | | 3.86 | % | | | 4.28 | %(c) | | | 2.06 | % | | | 3.44 | % |
Portfolio turnover rate | | | 141 | % | | | 153 | % | | | 176 | % | | | 97 | % | | | 51 | % |
| (a) | Class I shares merged into Class A on January 23, 2012. The results of each class prior to the merger may have been different than what is presented. |
| (b) | Calculated using the average shares method. |
| (c) | Investment income per share of Class A reflects a large, non-recurring dividend which amounted to $0.08 per share. Excluding this non- recurring dividend, the ratio of net investment income/(loss) to average net assets would have been 3.55% for Class A. |
| (d) | The total return calculation excludes any sales charges. |
| (e) | The Fund’s operating expenses, not including interest expense, are contractually limited to the amounts discussed in Note 3. The ratios in these financial highlights reflect the limitation, including the interest expense, when applicable. |
| | |
The accompanying notes are an integral part of the financial statements. |
| 46 | | www.iconfunds.com |
| | |
| ICON Equity Income Fund | | Financial Highlights |
| | For a Share Outstanding Throughout the Years Presented |
| | | | | | | | | | | | | | | | | | | | |
| Class S(a) | | Year Ended
September 30,
2016 | | | Year Ended
September 30,
2015 | | | Year Ended
September 30,
2014 | | | Year Ended
September 30,
2013 | | | Year Ended
September 30,
2012 | |
Net asset value, beginning of period | | $ | 14.36 | | | $ | 14.87 | | | $ | 13.80 | | | $ | 12.18 | | | $ | 10.21 | |
Income/(loss) from investment operations: | | | | | | | | | | | | | | | | | | | | |
Net investment income/(loss)(b) | | | 0.60 | | | | 0.56 | | | | 0.52 | | | | 0.47 | | | | 0.43 | |
Net realized and unrealized gains/(losses) on investments | | | 1.27 | | | | (0.56) | | | | 1.04 | | | | 1.65 | | | | 2.03 | |
Total from investment operations | | | 1.87 | | | | (0.00) | (c) | | | 1.56 | | | | 2.12 | | | | 2.46 | |
Less dividends and distributions: | | | | | | | | | | | | | | | | | | | | |
Dividends from net investment income | | | (0.61) | | | | (0.51) | | | | (0.49) | | | | (0.50) | | | | (0.49) | |
Total dividends and distributions | | | (0.61) | | | | (0.51) | | | | (0.49) | | | | (0.50) | | | | (0.49) | |
Net asset value, end of period | | $ | 15.62 | | | $ | 14.36 | | | $ | 14.87 | | | $ | 13.80 | | | $ | 12.18 | |
| | |
Total Return | | | 13.30 | % | | | (0.17) | % | | | 11.36 | % | | | 17.76 | % | | | 24.43 | % |
Ratios and Supplemental Data | | | | | | | | | | | | | | | | | | | | |
Net assets, end of period (in 000s) | | $ | 37,868 | | | $ | 22,779 | | | $ | 8,022 | | | $ | 5,116 | | | $ | 7,123 | |
Ratio of expenses to average net assets | | | | | | | | | | | | | | | | | | | | |
Before expense limitation | | | 1.24 | % | | | 1.25 | % | | | 1.38 | % | | | 1.53 | % | | | 1.47 | % |
After expense limitation/ recoupment (d) | | | 1.20 | % | | | 1.20 | % | | | 1.20 | % | | | 1.21 | % | | | 1.21 | % |
Ratio of net investment income/(loss) to average net assets | | | | | | | | | | | | | | | | | | | | |
Before expense limitation | | | 3.91 | % | | | 3.52 | % | | | 3.36 | % | | | 3.28 | % | | | 3.31 | % |
After expense limitation/ recoupment | | | 3.95 | % | | | 3.57 | % | | | 3.54 | % | | | 3.60 | % | | | 3.57 | % |
Portfolio turnover rate | | | 145 | % | | | 174 | % | | | 148 | % | | | 163 | % | | | 122 | % |
| (a) | Class S shares were formerly named Class Z shares prior to January 23, 2012. |
| (b) | Calculated using the average shares method. |
| (c) | Amount less than $(0.005). |
| (d) | The Fund’s operating expenses, not including interest expense, are contractually limited to the amounts discussed in Note 3. The ratios in these financial highlights reflect the limitation, including the interest expense, when applicable. |
| | |
The accompanying notes are an integral part of the financial statements. |
| Annual Report | September 30, 2016 | | 47 |
| | |
| ICON Equity Income Fund | | Financial Highlights |
| | For a Share Outstanding Throughout the Years Presented |
| | | | | | | | | | | | | | | | | | | | |
| Class C | | Year Ended
September 30,
2016 | | | Year Ended
September 30,
2015 | | | Year Ended
September 30,
2014 | | | Year Ended
September 30,
2013 | | | Year Ended
September 30,
2012 | |
Net asset value, beginning of period | | $ | 14.45 | | | $ | 14.96 | | | $ | 13.88 | | | $ | 12.25 | | | $ | 10.16 | |
Income/(loss) from investment operations: | | | | | | | | | | | | | | | | | | | | |
Net investment income/(loss)(a) | | | 0.45 | | | | 0.40 | | | | 0.36 | | | | 0.35 | | | | 0.29 | |
Net realized and unrealized gains/(losses) on investments | | | 1.28 | | | | (0.56) | | | | 1.06 | | | | 1.65 | | | | 2.06 | |
Total from investment operations | | | 1.73 | | | | (0.16) | | | | 1.42 | | | | 2.00 | | | | 2.35 | |
Less dividends and distributions: | | | | | | | | | | | | | | | | | | | | |
Dividends from net investment income | | | (0.42) | | | | (0.35) | | | | (0.34) | | | | (0.37) | | | | (0.26) | |
Total dividends and distributions | | | (0.42) | | | | (0.35) | | | | (0.34) | | | | (0.37) | | | | (0.26) | |
Net asset value, end of period | | $ | 15.76 | | | $ | 14.45 | | | $ | 14.96 | | | $ | 13.88 | | | $ | 12.25 | |
| | |
Total Return(b) | | | 12.15 | % | | | (1.16) | % | | | 10.26 | % | | | 16.58 | % | | | 23.31 | % |
Ratios and Supplemental Data | | | | | | | | | | | | | | | | | | | | |
Net assets, end of period (in 000s) | | $ | 10,532 | | | $ | 6,825 | | | $ | 5,481 | | | $ | 5,423 | | | $ | 5,146 | |
Ratio of expenses to average net assets | | | | | | | | | | | | | | | | | | | | |
Before expense limitation | | | 2.34 | % | | | 2.34 | % | | | 2.45 | % | | | 2.42 | % | | | 2.62 | % |
After expense limitation/ recoupment (c) | | | 2.20 | % | | | 2.20 | % | | | 2.20 | % | | | 2.21 | % | | | 2.20 | % |
Ratio of net investment income/(loss) to average net assets | | | | | | | | | | | | | | | | | | | | |
Before expense limitation | | | 2.80 | % | | | 2.40 | % | | | 2.21 | % | | | 2.49 | % | | | 2.09 | % |
After expense limitation/ recoupment | | | 2.94 | % | | | 2.54 | % | | | 2.46 | % | | | 2.70 | % | | | 2.51 | % |
Portfolio turnover rate | | | 145 | % | | | 174 | % | | | 148 | % | | | 163 | % | | | 122 | % |
| (a) | Calculated using the average shares method. |
| (b) | The total return calculation excludes any sales charges. |
| (c) | The Fund’s operating expenses, not including interest expense, are contractually limited to the amounts discussed in Note 3. The ratios in these financial highlights reflect the limitation, including the interest expense, when applicable. |
| | |
The accompanying notes are an integral part of the financial statements. |
| 48 | | www.iconfunds.com |
| | |
| ICON Equity Income Fund | | Financial Highlights |
| | For a Share Outstanding Throughout the Years Presented |
| | | | | | | | | | | | | | | | | | | | |
| Class A(a) | | Year Ended
September 30,
2016 | | | Year Ended
September 30,
2015 | | | Year Ended
September 30,
2014 | | | Year Ended
September 30,
2013 | | | Year Ended
September 30,
2012 | |
Net asset value, beginning of period | | $ | 14.29 | | | $ | 14.79 | | | $ | 13.73 | | | $ | 12.12 | | | $ | 10.15 | |
Income/(loss) from investment operations: | | | | | | | | | | | | | | | | | | | | |
Net investment income/(loss)(b) | | | 0.56 | | | | 0.50 | | | | 0.47 | | | | 0.45 | | | | 0.39 | |
Net realized and unrealized gains/(losses) on investments | | | 1.26 | | | | (0.53) | | | | 1.04 | | | | 1.63 | | | | 2.03 | |
Total from investment operations | | | 1.82 | | | | (0.03) | | | | 1.51 | | | | 2.08 | | | | 2.42 | |
Less dividends and distributions: | | | | | | | | | | | | | | | | | | | | |
Dividends from net investment income | | | (0.53) | | | | (0.47) | | | | (0.45) | | | | (0.47) | | | | (0.45) | |
Total dividends and distributions | | | (0.53) | | | | (0.47) | | | | (0.45) | | | | (0.47) | | | | (0.45) | |
Net asset value, end of period | | $ | 15.58 | | | $ | 14.29 | | | $ | 14.79 | | | $ | 13.73 | | | $ | 12.12 | |
| | |
Total Return(c) | | | 12.97 | % | | | (0.38) | % | | | 11.07 | % | | | 17.49 | % | | | 24.10 | % |
Ratios and Supplemental Data | | | | | | | | | | | | | | | | | | | | |
Net assets, end of period (in 000s) | | $ | 16,775 | | | $ | 13,039 | | | $ | 13,847 | | | $ | 12,798 | | | $ | 10,758 | |
Ratio of expenses to average net assets | | | | | | | | | | | | | | | | | | | | |
Before expense limitation | | | 1.54 | % | | | 1.52 | % | | | 1.59 | % | | | 1.68 | % | | | 1.69 | % |
After expense limitation/recoupment(d) | | | 1.45 | % | | | 1.45 | % | | | 1.45 | % | | | 1.46 | % | | | 1.45 | % |
Ratio of net investment income/(loss) to average net assets | | | | | | | | | | | | | | | | | | | | |
Before expense limitation | | | 3.64 | % | | | 3.14 | % | | | 3.08 | % | | | 3.24 | % | | | 3.11 | % |
After expense limitation/recoupment | | | 3.73 | % | | | 3.21 | % | | | 3.22 | % | | | 3.45 | % | | | 3.35 | % |
Portfolio turnover rate | | | 145 | % | | | 174 | % | | | 148 | % | | | 163 | % | | | 122 | % |
| (a) | Class I shares merged into Class A on January 23, 2012. The results of each class prior to the merger may have been different than what is presented. |
| (b) | Calculated using the average shares method. |
| (c) | The total return calculation excludes any sales charges. |
| (d) | The Fund’s operating expenses, not including interest expense, are contractually limited to the amounts discussed in Note 3. The ratios in these financial highlights reflect the limitation, including the interest expense, when applicable. |
| | |
The accompanying notes are an integral part of the financial statements. |
| Annual Report | September 30, 2016 | | 49 |
| | |
| ICON Fund | | Financial Highlights |
| | For a Share Outstanding Throughout the Years Presented |
| | | | | | | | | | | | | | | | | | | | |
| Class S(a) | | Year Ended
September 30,
2016 | | | Year Ended
September 30,
2015 | | | Year Ended
September 30,
2014 | | | Year Ended
September 30,
2013 | | | Year Ended
September 30,
2012 | |
Net asset value, beginning of period | | $ | 13.83 | | | $ | 14.52 | | | $ | 14.00 | | | $ | 11.34 | | | $ | 8.82 | |
Income/(loss) from investment operations: | | | | | | | | | | | | | | | | | | | | |
Net investment income/(loss)(b) | | | 0.05 | | | | (0.02) | | | | 0.00 | (c) | | | 0.07 | | | | 0.07 | |
Net realized and unrealized gains/(losses) on investments | | | 0.20 | | | | (0.67) | | | | 0.52 | | | | 2.66 | | | | 2.45 | |
Total from investment operations | | | 0.25 | | | | (0.69) | | | | 0.52 | | | | 2.73 | | | | 2.52 | |
Less dividends and distributions: | | | | | | | | | | | | | | | | | | | | |
Dividends from net investment income | | | – | | | | – | | | | – | | | | (0.07) | | | | – | |
Total dividends and distributions | | | – | | | | – | | | | – | | | | (0.07) | | | | – | |
Net asset value, end of period | | $ | 14.08 | | | $ | 13.83 | | | $ | 14.52 | | | $ | 14.00 | | | $ | 11.34 | |
| | |
Total Return | | | 1.81 | % | | | (4.75) | % | | | 3.71 | % | | | 24.27 | % | | | 28.57 | % |
Ratios and Supplemental Data | | | | | | | | | | | | | | | | | | | | |
Net assets, end of period (in 000s) | | $ | 28,897 | | | $ | 33,695 | | | $ | 41,577 | | | $ | 6,986 | | | $ | 22,952 | |
Ratio of expenses to average net assets | | | | | | | | | | | | | | | | | | | | |
Before expense limitation | | | 1.12 | % | | | 1.09 | % | | | 1.10 | % | | | 1.23 | % | | | 1.18 | % |
After expense limitation/ recoupment(d) | | | 1.12 | % | | | 1.09 | % | | | 1.10 | % | | | 1.23 | % | | | 1.18 | % |
Ratio of net investment income/(loss) to average net assets | | | | | | | | | | | | | | | | | | | | |
Before expense limitation | | | 0.39 | % | | | (0.11) | % | | | 0.02 | % | | | 0.59 | % | | | 0.61 | % |
After expense limitation/ recoupment | | | 0.39 | % | | | (0.11) | % | | | 0.02 | % | | | 0.59 | % | | | 0.61 | % |
Portfolio turnover rate | | | 31 | % | | | 54 | % | | | 65 | % | | | 33 | % | | | 24 | % |
| (a) | Class S shares were formerly named Class Z shares prior to January 23, 2012. |
| (b) | Calculated using the average shares method. |
| (c) | Amount less than $0.005. |
| (d) | The Fund’s operating expenses, not including interest expense, are contractually limited to the amounts discussed in Note 3. The ratios in these financial highlights reflect the limitation, including the interest expense, when applicable. |
| | |
The accompanying notes are an integral part of the financial statements. |
| 50 | | www.iconfunds.com |
| | |
| ICON Fund | | Financial Highlights |
| | For a Share Outstanding Throughout the Years Presented |
| | | | | | | | | | | | | | | | | | | | |
| Class C | | Year Ended
September 30,
2016 | | | Year Ended
September 30,
2015 | | | Year Ended
September 30,
2014 | | | Year Ended
September 30,
2013 | | | Year Ended
September 30,
2012 | |
Net asset value, beginning of period | | $ | 12.38 | | | $ | 13.15 | | | $ | 12.82 | | | $ | 10.42 | | | $ | 8.17 | |
Income/(loss) from investment operations: | | | | | | | | | | | | | | | | | | | | |
Net investment income/(loss)(a) | | | (0.09) | (b) | | | (0.18) | | | | (0.14) | | | | (0.07) | | | | (0.04) | |
Net realized and unrealized gains/(losses) on investments | | | 0.17 | | | | (0.59) | | | | 0.47 | | | | 2.47 | | | | 2.29 | |
Total from investment operations | | | 0.08 | | | | (0.77) | | | | 0.33 | | | | 2.40 | | | | 2.25 | |
Net asset value, end of period | | $ | 12.46 | | | $ | 12.38 | | | $ | 13.15 | | | $ | 12.82 | | | $ | 10.42 | |
| | | | | | | | | | | | | | | | | | | | | |
Total Return(c) | | | 0.65 | % | | | (5.86) | % | | | 2.57 | % | | | 23.03 | % | | | 27.54 | % |
Ratios and Supplemental Data | | | | | | | | | | | | | | | | | | | | |
Net assets, end of period (in 000s) | | $ | 11,520 | | | $ | 13,745 | | | $ | 17,050 | | | $ | 18,848 | | | $ | 18,378 | |
Ratio of expenses to average net assets | | | | | | | | | | | | | | | | | | | | |
Before expense limitation | | | 2.41 | % | | | 2.27 | % | | | 2.26 | % | | | 2.32 | % | | | 2.35 | % |
After expense limitation/ recoupment (d) | | | 2.26 | % | | | 2.25 | % | | | 2.25 | % | | | 2.26 | % | | | 2.28 | % |
Ratio of net investment income/(loss) to average net assets | | | | | | | | | | | | | | | | | | | | |
Before expense limitation | | | (0.90) | % | | | (1.29) | % | | | (1.09) | % | | | (0.64) | % | | | (0.48) | % |
After expense limitation/ recoupment | | | (0.75) | % | | | (1.27) | % | | | (1.08) | % | | | (0.58) | % | | | (0.41) | % |
Portfolio turnover rate | | | 31 | % | | | 54 | % | | | 65 | % | | | 33 | % | | | 24 | % |
| (a) | Calculated using the average shares method. |
| (b) | The per share amount does not correspond to activity reflected in the Statement of Operations due to class specific expenses during the period. |
| (c) | The total return calculation excludes any sales charges. |
| (d) | The Fund’s operating expenses, not including interest expense, are contractually limited to the amounts discussed in Note 3. The ratios in these financial highlights reflect the limitation, including the interest expense, when applicable. |
| | |
The accompanying notes are an integral part of the financial statements. |
| Annual Report | September 30, 2016 | | 51 |
| | |
| ICON Fund | | Financial Highlights |
| | For a Share Outstanding Throughout the Years Presented |
| | | | | | | | | | | | | | | | | | | | |
| Class A(a) | | Year Ended
September 30,
2016 | | | Year Ended
September 30,
2015 | | | Year Ended
September 30,
2014 | | | Year Ended
September 30,
2013 | | | Year Ended
September 30,
2012 | |
Net asset value, beginning of period | | $ | 13.13 | | | $ | 13.84 | | | $ | 13.39 | | | $ | 10.85 | | | $ | 8.46 | |
Income/(loss) from investment operations: | | | | | | | | | | | | | | | | | | | | |
Net investment income/(loss)(b) | | | 0.00 | (c) | | | (0.08) | | | | (0.05) | | | | 0.02 | | | | 0.03 | |
Net realized and unrealized gains/(losses) on investments | | | 0.18 | | | | (0.63) | | | | 0.50 | | | | 2.56 | | | | 2.36 | |
Total from investment operations | | | 0.18 | | | | (0.71) | | | | 0.45 | | | | 2.58 | | | | 2.39 | |
Less dividends and distributions: | | | | | | | | | | | | | | | | | | | | |
Dividends from net investment income | | | – | | | | – | | | | – | | | | (0.04) | | | | – | |
Total dividends and distributions | | | – | | | | – | | | | – | | | | (0.04) | | | | – | |
Net asset value, end of period | | $ | 13.31 | | | $ | 13.13 | | | | $13.84 | | | | $13.39 | | | | $10.85 | |
| | |
Total Return(d) | | | 1.37 | % | | | (5.13) | % | | | 3.36 | % | | | 23.90 | % | | | 28.25 | % |
Ratios and Supplemental Data | | | | | | | | | | | | | | | | | | | | |
Net assets, end of period (in 000s) | | $ | 5,490 | | | $ | 6,994 | | | $ | 8,076 | | | $ | 10,000 | | | $ | 12,401 | |
Ratio of expenses to average net assets | | | | | | | | | | | | | | | | | | | | |
Before expense limitation | | | 1.67 | % | | | 1.55 | % | | | 1.56 | % | | | 1.58 | % | | | 1.54 | % |
After expense limitation/recoupment (e) | | | 1.51 | % | | | 1.50 | % | | | 1.50 | % | | | 1.51 | % | | | 1.54 | % |
Ratio of net investment income/(loss) to average net assets | | | | | | | | | | | | | | | | | | | | |
Before expense limitation | | | (0.16) | % | | | (0.57) | % | | | (0.38) | % | | | 0.12 | % | | | 0.27 | % |
After expense limitation/recoupment | | | 0.00 | %(f) | | | (0.52) | % | | | (0.32) | % | | | 0.19 | % | | | 0.27 | % |
Portfolio turnover rate | | | 31 | % | | | 54 | % | | | 65 | % | | | 33 | % | | | 24 | % |
| (a) | Class I shares merged into Class A on January 23, 2012. The results of each class prior to the merger may have been different than what is presented. |
| (b) | Calculated using the average shares method. |
| (c) | Amount less than $0.005. |
| (d) | The total return calculation excludes any sales charges. |
| (e) | The Fund’s operating expenses, not including interest expense, are contractually limited to the amounts discussed in Note 3. The ratios in these financial highlights reflect the limitation, including the interest expense, when applicable. |
| (f) | Less than 0.005% of average net assets. |
| | |
The accompanying notes are an integral part of the financial statements. |
| 52 | | www.iconfunds.com |
| | |
| ICON Long/Short Fund | | Financial Highlights |
| | For a Share Outstanding Throughout the Years Presented |
| | | | | | | | | | | | | | | | | | | | |
| Class S(a) | | Year Ended
September 30,
2016 | | | Year Ended
September 30,
2015 | | | Year Ended
September 30,
2014 | | | Year Ended
September 30,
2013 | | | Year Ended
September 30,
2012 | |
Net asset value, beginning of period | | $ | 18.39 | | | $ | 18.41 | | | $ | 17.48 | | | $ | 14.56 | | | $ | 11.61 | |
Income/(loss) from investment operations: | | | | | | | | | | | | | | | | | | | | |
Net investment income/(loss)(b) | | | 0.04 | (c) | | | (0.09) | | | | (0.06) | | | | 0.01 | | | | 0.02 | |
Net realized and unrealized gains/(losses) on investments | | | 0.27 | | | | 0.07 | | | | 0.99 | | | | 2.91 | | | | 2.93 | |
Total from investment operations | | | 0.31 | | | | (0.02) | | | | 0.93 | | | | 2.92 | | | | 2.95 | |
Net asset value, end of period | | $ | 18.70 | | | $ | 18.39 | | | $ | 18.41 | | | $ | 17.48 | | | $ | 14.56 | |
| | | | | | | | | | | | | | | | | | | | | |
Total Return | | | 1.69 | % | | | (0.11) | % | | | 5.32 | % | | | 20.05 | % | | | 25.41 | % |
Ratios and Supplemental Data | | | | | | | | | | | | | | | | | | | | |
Net assets, end of period (in 000s) | | $ | 7,114 | | | $ | 17,196 | | | $ | 16,465 | | | $ | 4,774 | | | $ | 3,471 | |
Ratio of expenses to average net assets | | | | | | | | | | | | | | | | | | | | |
Before expense limitation | | | 1.63 | % | | | 1.37 | % | | | 1.45 | % | | | 1.53 | % | | | 2.18 | % |
After expense limitation/ recoupment (d) | | | 1.28 | % | | | 1.28 | % | | | 1.32 | % | | | 1.32 | % | | | 1.35 | % |
Ratio of net investment income/(loss) to average net assets | | | | | | | | | | | | | | | | | | | | |
Before expense limitation | | | (0.11) | % | | | (0.52) | % | | | (0.47) | % | | | (0.14) | % | | | (0.70) | % |
After expense limitation/ recoupment | | | 0.24 | % | | | (0.43) | % | | | (0.34) | % | | | 0.07 | % | | | 0.13 | % |
Portfolio turnover rate | | | 20 | % | | | 74 | % | | | 65 | % | | | 33 | % | | | 54 | % |
| (a) | Class S shares were formerly named Class Z shares prior to January 23, 2012. |
| (b) | Calculated using the average shares method. |
| (c) | The per share amount does not correspond to activity reflected in the Statement of Operations due to class specific expenses during the period. |
| (d) | The Fund’s operating expenses, not including interest expense or dividends on short positions, are contractually limited to the amounts discussed in Note 3. The ratios in these financial highlights reflect the limitation, including the interest expense and dividends on short positions, when applicable. |
| | |
The accompanying notes are an integral part of the financial statements. |
| Annual Report | September 30, 2016 | | 53 |
| | |
| ICON Long/Short Fund | | Financial Highlights |
| | For a Share Outstanding Throughout the Years Presented |
| | | | | | | | | | | | | | | | | | | | |
| Class C | | Year Ended
September 30,
2016 | | | Year Ended
September 30,
2015 | | | Year Ended
September 30,
2014 | | | Year Ended
September 30,
2013 | | | Year Ended
September 30,
2012 | |
Net asset value, beginning of period | | $ | 16.54 | | | $ | 16.74 | | | $ | 16.05 | | | $ | 13.52 | | | $ | 10.89 | |
Income/(loss) from investment operations: | | | | | | | | | | | | | | | | | | | | |
Net investment income/(loss)(a) | | | (0.13) | | | | (0.27) | | | | (0.24) | | | | (0.14) | | | | (0.11) | |
Net realized and unrealized gains/(losses) on investments | | | 0.24 | | | | 0.07 | | | | 0.93 | | | | 2.67 | | | | 2.74 | |
Total from investment operations | | | 0.11 | | | | (0.20) | | | | 0.69 | | | | 2.53 | | | | 2.63 | |
Net asset value, end of period | | $ | 16.65 | | | $ | 16.54 | | | $ | 16.74 | | | $ | 16.05 | | | $ | 13.52 | |
| | | | | | | | | | | | | | | | | | | | | |
Total Return(b) | | | 0.67 | % | | | (1.19) | % | | | 4.30 | % | | | 18.71 | % | | | 24.15 | % |
Ratios and Supplemental Data | | | | | | | | | | | | | | | | | | | | |
Net assets, end of period (in 000s) | | $ | 4,211 | | | $ | 6,300 | | | $ | 6,932 | | | $ | 6,108 | | | $ | 6,004 | |
Ratio of expenses to average net assets | | | | | | | | | | | | | | | | | | | | |
Before expense limitation | | | 2.76 | % | | | 2.53 | % | | | 2.57 | % | | | 2.62 | % | | | 2.95 | % |
After expense limitation/ recoupment (c) | | | 2.33 | % | | | 2.33 | % | | | 2.38 | % | | | 2.37 | % | | | 2.41 | % |
Ratio of net investment income/(loss) to average net assets | | | | | | | | | | | | | | | | | | | | |
Before expense limitation | | | (1.21) | % | | | (1.68) | % | | | (1.58) | % | | | (1.21) | % | | | (1.44) | % |
After expense limitation/ recoupment | | | (0.78) | % | | | (1.48) | % | | | (1.39) | % | | | (0.96) | % | | | (0.90) | % |
Portfolio turnover rate | | | 20 | % | | | 74 | % | | | 65 | % | | | 33 | % | | | 54 | % |
| (a) | Calculated using the average shares method. |
| (b) | The total return calculation excludes any sales charges. |
| (c) | The Fund’s operating expenses, not including interest expense or dividends on short positions, are contractually limited to the amounts discussed in Note 3. The ratios in these financial highlights reflect the limitation, including the interest expense and dividends on short positions, when applicable. |
| | |
The accompanying notes are an integral part of the financial statements. |
| 54 | | www.iconfunds.com |
| | |
| ICON Long/Short Fund | | Financial Highlights |
| | For a Share Outstanding Throughout the Years Presented |
| | | | | | | | | | | | | | | | | | | | |
| Class A(a) | | Year Ended
September 30,
2016 | | | Year Ended
September 30,
2015 | | | Year Ended
September 30,
2014 | | | Year Ended
September 30,
2013 | | | Year Ended
September 30,
2012 | |
Net asset value, beginning of period | | $ | 17.91 | | | $ | 17.99 | | | $ | 17.13 | | | $ | 14.31 | | | $ | 11.44 | |
Income/(loss) from investment operations: | | | | | | | | | | | | | | | | | | | | |
Net investment income/(loss)(b) | | | (0.01) | | | | (0.15) | | | | (0.12) | | | | (0.02) | | | | (0.02) | |
Net realized and unrealized gains/(losses) on investments | | | 0.26 | | | | 0.07 | | | | 0.98 | | | | 2.84 | | | | 2.89 | |
Total from investment operations | | | 0.25 | | | | (0.08) | | | | 0.86 | | | | 2.82 | | | | 2.87 | |
Net asset value, end of period | | $ | 18.16 | | | $ | 17.91 | | | $ | 17.99 | | | $ | 17.13 | | | $ | 14.31 | |
| | | | | | | | | | | | | | | | | | | | | |
Total Return(c) | | | 1.40 | % | | | (0.44) | % | | | 5.02 | % | | | 19.71 | % | | | 25.09 | % |
Ratios and Supplemental Data | | | | | | | | | | | | | | | | | | | | |
Net assets, end of period (in 000s) | | $ | 5,316 | | | $ | 9,186 | | | $ | 11,160 | | | $ | 8,813 | | | $ | 15,687 | |
Ratio of expenses to average net assets | | | | | | | | | | | | | | | | | | | | |
Before expense limitation | | | 1.95 | % | | | 1.73 | % | | | 1.81 | % | | | 1.91 | % | | | 2.09 | % |
After expense limitation/ recoupment (d) | | | 1.58 | % | | | 1.58 | % | | | 1.63 | % | | | 1.61 | % | | | 1.65 | % |
Ratio of net investment income/(loss) to average net assets | | | | | | | | | | | | | | | | | | | | |
Before expense limitation | | | (0.40) | % | | | (0.89) | % | | | (0.82) | % | | | (0.45) | % | | | (0.58) | % |
After expense limitation/ recoupment | | | (0.03) | % | | | (0.74) | % | | | (0.64) | % | | | (0.16) | % | | | (0.14) | % |
Portfolio turnover rate | | | 20 | % | | | 74 | % | | | 65 | % | | | 33 | % | | | 54 | % |
| (a) | Class I shares merged into Class A on January 23, 2012. The results of each class prior to the merger may have been different than what is presented. |
| (b) | Calculated using the average shares method. |
| (c) | The total return calculation excludes any sales charges. |
| (d) | The Fund’s operating expenses, not including interest expense or dividends on short positions, are contractually limited to the amounts discussed in Note 3. The ratios in these financial highlights reflect the limitation, including the interest expense and dividends on short positions, when applicable. |
| | |
The accompanying notes are an integral part of the financial statements. |
| Annual Report | September 30, 2016 | | 55 |
| | |
| ICON Opportunities Fund | | Financial Highlights |
| | For a Share Outstanding Throughout the Years Presented |
| | | | | | | | | | | | | | | | |
| | | Year Ended
September 30,
2016 | | | Year Ended
September 30,
2015 | | | Year Ended
September 30,
2014 | | | Year Ended
September 30,
2013 (a) | |
Net asset value, beginning of period | | $ | 13.32 | | | $ | 13.04 | | | $ | 13.02 | | | $ | 10.00 | |
Income/(loss) from investment operations: | | | | | | | | | | | | | | | | |
Net investment income/(loss)(b) | | | (0.03) | | | | (0.09) | | | | (0.12) | | | | (0.01) | |
Net realized and unrealized gains/(losses) on investments | | | 1.46 | | | | 0.58 | | | | 0.41 | (c) | | | 3.03 | |
Total from investment operations | | | 1.43 | | | | 0.49 | | | | 0.29 | | | | 3.02 | |
Less dividends and distributions: | | | | | | | | | | | | | | | | |
Distributions from net realized gains | | | (0.01) | | | | (0.21) | | | | (0.27) | | | | – | |
Total dividends and distributions | | | (0.01) | | | | (0.21) | | | | (0.27) | | | | – | |
Net asset value, end of period | | $ | 14.74 | | | $ | 13.32 | | | $ | 13.04 | | | $ | 13.02 | |
| | | | | | | | | | | | | | | | | |
Total Return | | | 10.76 | % | | | 3.75 | % | | | 2.19 | % | | | 30.20 | % |
Ratios and Supplemental Data | | | | | | | | | | | | | | | | |
Net assets, end of period (in 000s) | | $ | 16,059 | | | $ | 11,047 | | | $ | 12,133 | | | $ | 442 | |
Ratio of expenses to average net assets | | | | | | | | | | | | | | | | |
Before expense limitation | | | 1.53 | % | | | 1.58 | % | | | 2.44 | % | | | 12.47 | % |
After expense limitation/ recoupment (d) | | | 1.51 | % | | | 1.50 | % | | | 1.50 | % | | | 1.52 | % |
Ratio of net investment income/(loss) to average net assets | | | | | | | | | | | | | | | | |
Before expense limitation | | | (0.27) | % | | | (0.72) | % | | | (1.81) | % | | | (11.02) | % |
After expense limitation/ recoupment | | | (0.25) | % | | | (0.65) | % | | | (0.87) | % | | | (0.07) | % |
Portfolio turnover rate | | | 95 | % | | | 76 | % | | | 46 | % | | | 52 | % |
| (a) | Commenced operations on October 1, 2012. |
| (b) | Calculated using the average shares method. |
| (c) | The per share amount does not correspond to activity reflected in the Statement of Operations due to class specific expenses during the period. |
| (d) | The Fund’s operating expenses, not including interest expense, are contractually limited to the amounts discussed in Note 3. The ratios in these financial highlights reflect the limitation, including the interest expense, when applicable. |
| | |
The accompanying notes are an integral part of the financial statements. |
| 56 | | www.iconfunds.com |
| | |
| ICON Risk-Managed Balanced Fund | | Financial Highlights |
| | For a Share Outstanding Throughout the Years Presented |
| | | | | | | | | | | | | | | | | | | | |
| Class S(a) | | Year Ended
September 30,
2016 | | | Year Ended
September 30,
2015 | | | Year Ended
September 30,
2014 | | | Year Ended
September 30,
2013 | | | Year Ended
September 30,
2012 | |
Net asset value, beginning of period | | | $ 14.02 | | | | $ 13.98 | | | | $ 13.40 | | | | $ 12.32 | | | | $ 10.88 | |
Income/(loss) from investment operations: | | | | | | | | | | | | | | | | | | | | |
Net investment income/(loss)(b) | | | 0.19 | | | | 0.18 | | | | 0.24 | | | | 0.24 | | | | 0.15 | |
Net realized and unrealized gains/(losses) on investments | | | 0.42 | | | | 0.01 | | | | 0.56 | | | | 1.04 | | | | 1.44 | |
Total from investment operations | | | 0.61 | | | | 0.19 | | | | 0.80 | | | | 1.28 | | | | 1.59 | |
Less dividends and distributions: | | | | | | | | | | | | | | | | | | | | |
Dividends from net investment income | | | (0.17) | | | | (0.15) | | | | (0.22) | | | | (0.20) | | | | (0.15) | |
Total dividends and distributions | | | (0.17) | | | | (0.15) | | | | (0.22) | | | | (0.20) | | | | (0.15) | |
Net asset value, end of period | | | $ 14.46 | | | | $ 14.02 | | | | $ 13.98 | | | | $ 13.40 | | | | $ 12.32 | |
| | | | | | | | | | | | | | | | | | | | | |
Total Return | | | 4.39 | % | | | 1.35 | % | | | 6.02 | % | | | 10.51 | % | | | 14.65 | % |
Ratios and Supplemental Data | | | | | | | | | | | | | | | | | | | | |
Net assets, end of period (in 000s) | | | $ 20,087 | | | | $ 26,677 | | | | $ 20,071 | | | | $ 43,350 | | | | $ 6,692 | |
Ratio of expenses to average net assets | | | | | | | | | | | | | | | | | | | | |
Before expense limitation | | | 1.27 | % | | | 1.34 | % | | | 1.22 | % | | | 1.43 | % | | | 1.80 | % |
After expense limitation/ recoupment (c) | | | 1.20 | % | | | 1.20 | % | | | 1.20 | % | | | 1.21 | % | | | 1.24 | % |
Ratio of net investment income/(loss) to average net assets | | | | | | | | | | | | | | | | | | | | |
Before expense limitation | | | 1.27 | % | | | 1.09 | % | | | 1.72 | % | | | 1.65 | % | | | 0.69 | % |
After expense limitation/ recoupment | | | 1.34 | % | | | 1.23 | % | | | 1.74 | % | | | 1.87 | % | | | 1.25 | % |
Portfolio turnover rate | | | 109 | % | | | 119 | % | | | 137 | % | | | 98 | % | | | 71 | % |
| (a) | Class S shares were formerly named Class Z shares prior to January 23, 2012. |
| (b) | Calculated using the average shares method. |
| (c) | The Fund’s operating expenses, not including interest expense, are contractually limited to the amounts discussed in Note 3. The ratios in these financial highlights reflect the limitation, including the interest expense, when applicable. |
| | |
The accompanying notes are an integral part of the financial statements. |
| Annual Report | September 30, 2016 | | 57 |
| | |
| ICON Risk-Managed Balanced Fund | | Financial Highlights |
| | For a Share Outstanding Throughout the Years Presented |
| | | | | | | | | | | | | | | | | | | | |
| Class C | | Year Ended
September 30,
2016 | | | Year Ended
September 30,
2015 | | | Year Ended
September 30,
2014 | | | Year Ended
September 30,
2013 | | | Year Ended
September 30,
2012 | |
Net asset value, beginning of period | | $ | 12.89 | | | $ | 12.90 | | | $ | 12.39 | | | $ | 11.41 | | | $ | 10.09 | |
Income/(loss) from investment operations: | | | | | | | | | | | | | | | | | | | | |
Net investment income/(loss)(a) | | | 0.04 | | | | 0.03 | | | | 0.09 | | | | 0.09 | | | | 0.02 | |
Net realized and unrealized gains/(losses) on investments | | | 0.39 | | | | 0.01 | | | | 0.54 | | | | 0.98 | | | | 1.34 | |
Total from investment operations | | | 0.43 | | | | 0.04 | | | | 0.63 | | | | 1.07 | | | | 1.36 | |
Less dividends and distributions: | | | | | | | | | | | | | | | | | | | | |
Dividends from net investment income | | | (0.05) | | | | (0.05) | | | | (0.12) | | | | (0.09) | | | | (0.04) | |
Total dividends and distributions | | | (0.05) | | | | (0.05) | | | | (0.12) | | | | (0.09) | | | | (0.04) | |
Net asset value, end of period | | $ | 13.27 | | | $ | 12.89 | | | $ | 12.90 | | | $ | 12.39 | | | $ | 11.41 | |
| | | | | | | | | | | | | | | | | | | | | |
Total Return(b) | | | 3.35% | | | | 0.31% | | | | 5.06% | | | | 9.45% | | | | 13.47% | |
Ratios and Supplemental Data | | | | | | | | | | | | | | | | | | | | |
Net assets, end of period (in 000s) | | $ | 15,151 | | | $ | 13,061 | | | $ | 9,469 | | | $ | 5,667 | | | $ | 2,243 | |
Ratio of expenses to average net assets | | | | | | | | | | | | | | | | | | | | |
Before expense limitation | | | 2.29% | | | | 2.38% | | | | 2.33% | | | | 2.72% | | | | 3.25% | |
After expense limitation/ recoupment(c) | | | 2.20% | | | | 2.20% | | | | 2.20% | | | | 2.22% | | | | 2.23% | |
Ratio of net investment income/(loss) to average net assets | | | | | | | | | | | | | | | | | | | | |
Before expense limitation | | | 0.24% | | | | 0.06% | | | | 0.61% | | | | 0.22% | | | | (0.79)% | |
After expense limitation/ recoupment | | | 0.33% | | | | 0.24% | | | | 0.74% | | | | 0.72% | | | | 0.23% | |
Portfolio turnover rate | | | 109% | | | | 119% | | | | 137% | | | | 98% | | | | 71% | |
| (a) | Calculated using the average shares method. |
| (b) | The total return calculation excludes any sales charges. |
| (c) | The Fund’s operating expenses, not including interest expense, are contractually limited to the amounts discussed in Note 3. The ratios in these financial highlights reflect the limitation, including the interest expense, when applicable. |
| | |
The accompanying notes are an integral part of the financial statements. |
| 58 | | www.iconfunds.com |
| | |
| ICON Risk-Managed Balanced Fund | | Financial Highlights |
| | For a Share Outstanding Throughout the Years Presented |
| | | | | | | | | | | | | | | | | | | | |
| Class A(a) | | Year Ended
September 30,
2016 | | | Year Ended
September 30,
2015 | | | Year Ended
September 30,
2014 | | | Year Ended
September 30,
2013 | | | Year Ended
September 30,
2012 | |
Net asset value, beginning of period | | | $ 13.68 | | | | $ 13.69 | | | | $ 13.12 | | | | $ 12.06 | | | | $ 10.66 | |
Income/(loss) from investment operations: | | | | | | | | | | | | | | | | | | | | |
Net investment income/(loss)(b) | | | 0.15 | | | | 0.14 | | | | 0.20 | | | | 0.18 | | | | 0.11 | |
Net realized and unrealized gains/(losses) on investments | | | 0.42 | | | | 0.00 | (c) | | | 0.57 | | | | 1.05 | | | | 1.41 | |
Total from investment operations | | | 0.57 | | | | 0.14 | | | | 0.77 | | | | 1.23 | | | | 1.52 | |
Less dividends and distributions: | | | | | | | | | | | | | | | | | | | | |
Dividends from net investment income | | | (0.14) | | | | (0.15) | | | | (0.20) | | | | (0.17) | | | | (0.12) | |
Total dividends and distributions | | | (0.14) | | | | (0.15) | | | | (0.20) | | | | (0.17) | | | | (0.12) | |
Net asset value, end of period | | | $ 14.11 | | | | $ 13.68 | | | | $ 13.69 | | | | $ 13.12 | | | | $ 12.06 | |
| | | | | | | | | | | | | | | | | | | | | |
Total Return(d) | | | 4.18 | % | | | 1.00 | % | | | 5.88 | % | | | 10.28 | % | | | 14.28 | % |
Ratios and Supplemental Data | | | | | | | | | | | | | | | | | | | | |
Net assets, end of period
(in 000s) | | | $ 9,095 | | | | $ 8,446 | | | | $ 7,014 | | | | $ 7,819 | | | | $ 4,045 | |
Ratio of expenses to average net assets | | | | | | | | | | | | | | | | | | | | |
Before expense limitation | | | 1.60 | % | | | 1.70 | % | | | 1.65 | % | | | 2.12 | % | | | 2.16 | % |
After expense limitation/ recoupment (e) | | | 1.45 | % | | | 1.45 | % | | | 1.45 | % | | | 1.47 | % | | | 1.48 | % |
Ratio of net investment income/(loss) to average net assets | | | | | | | | | | | | | | | | | | | | |
Before expense limitation | | | 0.93 | % | | | 0.71 | % | | | 1.29 | % | | | 0.81 | % | | | 0.28 | % |
After expense limitation/ recoupment | | | 1.08 | % | | | 0.96 | % | | | 1.49 | % | | | 1.46 | % | | | 0.96 | % |
Portfolio turnover rate | | | 109 | % | | | 119 | % | | | 137 | % | | | 98 | % | | | 71 | % |
| (a) | Class I shares merged into Class A on January 23, 2012. The results of each class prior to the merger may have been different than what is presented. |
| (b) | Calculated using the average shares method. |
| (c) | Amount less than $0.005. |
| (d) | The total return calculation excludes any sales charges. |
| (e) | The Fund’s operating expenses, not including interest expense, are contractually limited to the amounts discussed in Note 3. The ratios in these financial highlights reflect the limitation, including the interest expense, when applicable. |
| | |
The accompanying notes are an integral part of the financial statements. |
| Annual Report | September 30, 2016 | | 59 |
| | |
| ICON Diversified Funds | | Notes to Financial Statements |
| | September 30, 2016 |
1. ORGANIZATION
The ICON Bond Fund (“Bond Fund”), ICON Equity Income Fund (“Equity Income Fund”), ICON Fund (“ICON Fund”), ICON Long/Short Fund (“Long/ Short Fund”), ICON Opportunities Fund (“Opportunities Fund”) and ICON Risk-Managed Balanced Fund (“Risk-Managed Balanced Fund”) are a series of funds (individually a “Fund” and collectively, the “Funds”). The Funds are part of the ICON Funds (the “Trust”), a Massachusetts business trust registered under the Investment Company Act of 1940, as amended (the “1940 Act”) as an open-end investment management company. Each Fund, with the exception of the Opportunities Fund, offers three classes of shares: Class S, Class C and Class A. The Opportunities Fund is a single-class fund. All classes have equal rights as to earnings, assets and voting privileges except that each Class may bear different distribution fees, registration costs, legal costs, mailing and printing costs and shareholder servicing costs and each Class has exclusive voting rights with respect to its distribution plan. There are currently eleven other active Funds within the Trust. Those Funds are covered by separate prospectuses and shareholder reports.
Each Fund is authorized to issue an unlimited number of no par shares. The investment objective of the Bond Fund is to maximize total return. The investment objective of the Equity Income Fund is modest capital appreciation and income. The investment objective of the ICON Fund is long-term capital appreciation with a secondary objective of capital preservation. The investment objective of the Opportunities Fund is to provide capital appreciation. The investment objective of the Long/Short Fund is capital appreciation. The investment objective of the Risk-Managed Balanced Fund is modest capital appreciation and income.
The Funds, like all investments in securities, have elements of risk, including risk of loss of principal. There is no assurance that the Funds will achieve their investment objectives and may underperform funds with similar investment objectives. An investment concentrated in sectors and industries involves greater risk and volatility than a more diversified investment. Securities of small companies generally involve greater risks than investments in larger companies. Small company securities tend to be more volatile and less liquid than equity securities of larger companies. Investing in fixed income securities such as bonds involves interest rate risk. When interest rates rise, the value of fixed income securities generally decreases. Additionally, the Bond Fund, Equity Income Fund and Risk-Managed Balanced Fund may invest in medium-and lower-quality debt securities. High-yield bonds, also known as “junk bonds” are speculative investments and involve a greater risk of default and price volatility than U.S. government and other high-quality bonds. Junk bonds are also less liquid (more difficult to sell) than equities and higher credit bonds. These illiquid securities are harder to sell; or value, especially in changing markets, such as periods with rising interest rates.
The Bond Fund, Equity Income Fund and Risk-Managed Balanced Fund may invest in mortgage-related securities, which are interests in pools of mortgage loans made to residential home buyers, including mortgage loans made by savings and loan institutions, mortgage bankers, commercial banks and others. Pools of mortgage loans are assembled as securities for sale to investors by various governmental and government-related organizations. The Bond Fund, Equity Income Fund and Risk-Managed Balanced Fund also may invest in debt securities that are secured with collateral consisting of mortgage related securities (a Collateralized Mortgage Obligations or “CMO”), and in other types of mortgage-related securities. CMOs are debt obligations of a legal entity that are collateralized by whole mortgage loans or private mortgage bonds and divided into classes. CMOs are typically structured into multiple classes, often referred to as “tranches,” with each class bearing a different stated maturity and entitled to a different schedule for payments of principal and interest, including prepayments. CMOs may be less liquid and may exhibit greater price volatility than other types of mortgage-related or asset-backed securities. Many of the risks of investing in mortgage-related securities secured by commercial mortgage loans reflect the effects of local and other economic conditions on real estate markets, the ability of tenants to make lease payments, and the ability of a property to attract and retain tenants. These securities may be less liquid and may exhibit greater price volatility than other types of mortgage-related or other asset-backed securities. Other asset-backed securities are created from many types of assets, including auto loans, credit card receivables, home equity loans, and student loans. The ICON Fund and Long/Short Fund also may invest in such securities for temporary defensive purposes.
The Long/Short Fund may engage in short selling; there are risks associated with selling short, including the risk that the Long/Short Fund may have to cover its short position at a higher price than the short sale, resulting in a loss. The Long/Short Fund’s loss on a short sale is potentially unlimited as a loss occurs when the value of a security sold short increases.
The Risk-Managed Balanced Fund invests in call options; selling/writing call options involve certain risks, such as limited gains and lack of liquidity of the underlying securities, and are not suitable for all investors.
Investments in foreign securities and currency transactions may involve certain considerations and risks not typically associated with those of U.S. dollar-denominated transactions as a result of, among other factors, the possibility of less government supervision and regulation of foreign securities markets and the possibility of political or economic instability. Financial statements of foreign companies are governed by different accounting, auditing, and financial standards than U.S. companies and may be less transparent and uniform than in the United States. Many corporate governance standards, which help ensure the integrity of public information in the United States, may not exist in some foreign countries. In general, there may be less governmental supervision of foreign stock exchanges and securities brokers and issuers. There are also risks associated with small- and mid-cap investing, including limited product lines, less liquidity and small market share.
| | |
| ICON Diversified Funds | | Notes to Financial Statements |
| | September 30, 2016 |
The ICON Fund has a significant weighting in the Financial and Consumer Discretionary sectors, the Long/Short Fund has a significant weighting in the Financial sector and the Opportunities Fund has a significant weighting in the Information Technology and Consumer Discretionary sectors which may cause the Funds’ performance to be susceptible to the economic, business and/or other developments that may affect those sectors.
In the normal course of business, the Funds may enter into various agreements that provide for general indemnifications. Each Fund’s maximum exposure under these arrangements is unknown as any potential exposure involving future claims that may be made against each Fund is unknown. However, based on experience, the Funds expect the risk of loss to be remote.
2. SIGNIFICANT ACCOUNTING POLICIES
The following is a summary of significant accounting policies consistently followed by the Funds in the preparation of their financial statements. The preparation of financial statements in conformity with accounting principles generally accepted in the United States of America (“GAAP”) requires management to make certain estimates and assumptions that affect the reported amounts of assets and liabilities, disclosure of contingent assets and liabilities at the date of the financial statements, and the reported amounts of income and expenses during the reporting period. Actual results may differ from these estimates. Each Fund is considered an investment company under GAAP and follows the accounting and reporting guidance applicable to investment companies in the Financial Accounting Standards Board Accounting Standards Codification Topic 946.
Investment Valuation
The Funds’ securities and other assets, excluding options on securities indexes, are valued at the closing price as of the close of regular trading on the New York Stock Exchange (the “NYSE”) (normally 4 p.m. Eastern Standard Time) each day the NYSE is open, except that securities traded primarily on the NASDAQ Stock Market (“NASDAQ”) are normally valued by the Funds at the NASDAQ Official Closing Price provided by NASDAQ each business day. If the NYSE closes unexpectedly and there is active trading on other exchanges, the securities will be valued at the Valuation Time based off of those exchanges. Options on securities indexes are valued at the close of the Chicago Board Options Exchange (normally 4:15 p.m. Eastern Standard Time) on each day the NYSE is open for trading.
The Funds use pricing services to obtain the market value of securities in their portfolios. If a pricing service is not able to provide a price, or the pricing service’s valuation is considered inaccurate or does not, in the Funds’ judgment, reflect the market value of the security, prices may be obtained through market quotations from independent broker/dealers. If market quotations from these sources are not readily available, the Funds’ securities or other assets are valued at fair value as determined in good faith by the Funds’ Board of Trustees (the “Board”) or pursuant to procedures approved by the Board.
Lacking any sales that day, a security is valued at the current closing bid price (or yield equivalent thereof) or based on quotes obtained from dealers making a market for the security. Exchange traded options are valued at the composite price, using the National Best Bid and Offer quotes (“NBBO”). NBBO consists of the highest bid price and lowest ask price across any of the exchanges on which an option is quoted, thus providing a view across the entire U.S. options marketplace. Debt securities with a remaining maturity of greater than 60 days are valued using the evaluated bid price supplied by the pricing service. The evaluated bid price supplied by the pricing service is based upon a matrix valuation system which considers such factors as security prices, yields, maturities and ratings. Short-term debt securities with remaining maturities of 60 days or less are generally valued at amortized cost or original cost plus accrued interest, which approximates market value. Currency rates as of the close of the NYSE are used to convert foreign security values into U.S. dollars.
Mortgage-related and asset-backed securities are typically issued as separate tranches, or classes, of securities within each deal. These securities are also normally valued by pricing service providers that use broker-dealer quotations, reported trades or valuation estimates from their internal pricing models. The pricing models for these securities usually consider tranche level attributes, current market data, estimated cash flows and market based yield spreads for each tranche, and incorporate deal collateral performance, as available. Mortgage-related and asset-backed securities that use similar valuation techniques and inputs as described above are categorized as Level 2 of the fair value hierarchy.
Securities of investment companies that trade on an exchange are valued at the last sales price or official closing price as of the close of the customary trading session on the exchange where the security is principally traded. Investments in shares of funds that are not traded on an exchange are valued at the end of day net asset value per share of such fund. Securities in the underlying funds, including restricted securities are valued in accordance with the valuation policy of such fund.
The Funds’ securities traded in countries outside of the Western Hemisphere are fair valued daily by utilizing the quotations of an independent pricing service, unless the Board determines that use of another valuation methodology is appropriate. The purposes of daily fair valuation are to avoid stale prices and to take into account, among other things, any significant events occurring after the close of foreign markets. The pricing service uses statistical analyses and quantitative models to adjust local market prices using factors such as subsequent movements and changes in the prices of indexes, securities and exchange rates in other markets to determine fair value as of the time a Fund calculates its net asset value
| | |
| |
| Annual Report | September 30, 2016 | | 61 |
| | |
| ICON Diversified Funds | | Notes to Financial Statements |
| | September 30, 2016 |
(“NAV”). The valuation assigned to fair-value securities for purposes of calculating each Fund’s NAV may differ from the security’s most recent closing market price and from the prices used by other mutual funds to calculate their NAVs.
Various inputs are used to determine the value of the Funds’ investments. These inputs are summarized in the three broad levels listed below:
| | |
Level 1 — | | quoted prices in active markets for identical securities. |
Level 2 — | | significant observable inputs other than Level 1 quoted prices (including, but not limited to, quoted prices for similar securities, interest rates, prepayment speeds, and credit risk). |
Level 3 — | | significant unobservable inputs. |
Observable inputs are those based on market data obtained from sources independent of the Funds, and unobservable inputs reflect the Funds’ own assumptions based on the best information available. The input levels are not necessarily an indication of the risk or liquidity associated with investments at that level. For example, non-U.S. equity securities actively traded in foreign markets may be reflected in Level 2 despite the availability of closing prices, because the Funds evaluate and determine whether those closing prices reflect fair value at the close of the NYSE or require adjustment, as described above. The following table summarizes the Funds’ investments, based on the inputs used to determine their values on September 30, 2016:
ICON Bond Fund
| | | | | | | | | | | | | | | | |
| Investments in Securities at Value* | | Level 1 - Quoted and Unadjusted Prices | | | Level 2 - Other Significant Observable Inputs | | | Level 3 - Significant
Unobservable Inputs | | | Total | |
Corporate Bonds | | $ | – | | | $ | 51,692,858 | | | $ | – | | | $ | 51,692,858 | |
Convertible Corporate Bonds | | | – | | | | 2,077,500 | | | | – | | | | 2,077,500 | |
U.S. Treasury Obligations | | | – | | | | 2,995,899 | | | | – | | | | 2,995,899 | |
Collateralized Mortgage Obligations | | | – | | | | 10,968,455 | | | | – | | | | 10,968,455 | |
Preferred Stocks | | | 4,708,615 | | | | – | | | | – | | | | 4,708,615 | |
Closed-End Mutual Funds | | | 8,550,270 | | | | – | | | | – | | | | 8,550,270 | |
Collateral for Securities on Loan | | | – | | | | 1,092,875 | | | | – | | | | 1,092,875 | |
Short-Term Investments | | | – | | | | 5,636,472 | | | | – | | | | 5,636,472 | |
Total | | $ | 13,258,885 | | | $ | 74,464,059 | | | $ | – | | | $ | 87,722,944 | |
| | | | | | | | | | | | | | | | | |
| | | | |
| ICON Equity Income Fund | | | | | | | | | | | | | | | | |
| Investments in Securities at Value* | | Level 1 - Quoted and Unadjusted Prices | | | Level 2 - Other Significant
Observable Inputs | | | Level 3 - Significant
Unobservable Inputs | | | Total | |
Corporate Bonds | | $ | – | | | $ | 1,043,188 | | | $ | – | | | $ | 1,043,188 | |
Convertible Corporate Bonds | | | – | | | | 259,688 | | | | – | | | | 259,688 | |
Collateralized Mortgage Obligations | | | – | | | | 672,290 | | | | – | | | | 672,290 | |
Common Stocks | | | 58,251,710 | | | | – | | | | – | | | | 58,251,710 | |
Preferred Stocks | | | 1,256,089 | | | | – | | | | – | | | | 1,256,089 | |
Convertible Preferred Stocks | | | 261,720 | | | | – | | | | – | | | | 261,720 | |
Closed-End Mutual Funds | | | 2,526,586 | | | | – | | | | – | | | | 2,526,586 | |
Put Options Purchased | | | 54,000 | | | | – | | | | – | | | | 54,000 | |
Collateral for Securities on Loan | | | – | | | | 5,989,261 | | | | – | | | | 5,989,261 | |
Short-Term Investments | | | – | | | | 190,554 | | | | – | | | | 190,554 | |
Total | | $ | 62,350,105 | | | $ | 8,154,981 | | | $ | – | | | $ | 70,505,086 | |
| | | | | | | | | | | | | | | | | |
| | | | |
| ICON Fund | | | | | | | | | | | | | | | | |
| Investments in Securities at Value* | | Level 1 - Quoted and Unadjusted Prices | | | Level 2 - Other Significant Observable Inputs | | | Level 3 - Significant Unobservable Inputs | | | Total | |
Common Stocks | | $ | 45,913,602 | | | $ | – | | | $ | – | | | $ | 45,913,602 | |
Total | | $ | 45,913,602 | | | $ | – | | | $ | – | | | $ | 45,913,602 | |
| | | | | | | | | | | | | | | | | |
| | |
| ICON Diversified Funds | | Notes to Financial Statements |
| | September 30, 2016 |
ICON Long/Short Fund
| | | | | | | | | | | | | | | | |
| Investments in Securities at Value* | | Level 1 - Quoted
and Unadjusted
Prices | | | Level 2 - Other
Significant
Observable Inputs | | | Level 3 - Significant
Unobservable
Inputs | | | Total | |
Common Stocks | | $ | 16,714,215 | | | $ | – | | | $ | – | | | $ | 16,714,215 | |
Total | | $ | 16,714,215 | | | $ | – | | | $ | – | | | $ | 16,714,215 | |
| | | | | | | | | | | | | | | | | |
| | | | |
ICON Opportunities Fund | | | | | | | | | | | | | | | | |
| Investments in Securities at Value* | | Level 1 - Quoted
and Unadjusted
Prices | | | Level 2 - Other
Significant
Observable Inputs | | | Level 3 -Significant
Unobservable Inputs | | | Total | |
Common Stocks | | $ | 16,070,034 | | | $ | – | | | $ | – | | | $ | 16,070,034 | |
Short-Term Investments | | | – | | | | 27,464 | | | | – | | | | 27,464 | |
Total | | $ | 16,070,034 | | | $ | 27,464 | | | $ | – | | | $ | 16,097,498 | |
| | | | | | | | | | | | | | | | | |
| | | | |
ICON Risk-Managed Balanced Fund | | | | | | | | | | | | | | | | |
| Investments in Securities at Value* | | Level 1 - Quoted
and Unadjusted
Prices | | | Level 2 - Other
Significant
Observable Inputs | | | Level 3 -Significant
Unobservable Inputs | | | Total | |
Corporate Bonds | | $ | – | | | $ | 8,901,216 | | | $ | – | | | $ | 8,901,216 | |
Convertible Corporate Bonds | | | – | | | | 415,500 | | | | – | | | | 415,500 | |
U.S. Treasury Obligations | | | – | | | | 2,873,713 | | | | – | | | | 2,873,713 | |
Collateralized Mortgage Obligations | | | – | | | | 3,565,138 | | | | – | | | | 3,565,138 | |
Common Stocks | | | 23,061,276 | | | | – | | | | – | | | | 23,061,276 | |
Preferred Stocks | | | 810,289 | | | | – | | | | – | | | | 810,289 | |
Closed-End Mutual Funds | | | 3,646,199 | | | | – | | | | – | | | | 3,646,199 | |
Exchange Traded Funds | | | 769,588 | | | | – | | | | – | | | | 769,588 | |
Put Options Purchased | | | 71,220 | | | | – | | | | – | | | | 71,220 | |
Collateral for Securities on Loan | | | – | | | | 426,194 | | | | – | | | | 426,194 | |
Short-Term Investments | | | – | | | | 71,708 | | | | – | | | | 71,708 | |
Total | | $ | 28,358,572 | | | $ | 16,253,469 | | | $ | – | | | $ | 44,612,041 | |
| | | | | | | | | | | | | | | | | |
| * | Please refer to the Schedule of Investments and the Sector/Industry Classification and Credit Diversification tables for additional security details. |
There were no Level 3 securities held in any of the Funds at September 30, 2016.
For the year ended September 30, 2016, there was no transfer activity between Level 1, Level 2 or Level 3.
The end of period timing recognition is used for transfers between levels of each Fund’s assets and liabilities.
Fund Share Valuation
Fund shares are sold and redeemed on a daily basis at net asset value. Net asset value per share is determined daily as of the close of trading on the NYSE on each day the NYSE is open for trading by dividing the total value of each Fund’s investments and other assets, less liabilities, by the number of Fund shares outstanding.
| | |
| |
| Annual Report | September 30, 2016 | | 63 |
| | |
| ICON Diversified Funds | | Notes to Financial Statements |
| | September 30, 2016 |
Foreign Currency Translation
The accounting records of the Funds are maintained in U.S. dollars. Investment securities and other assets and liabilities denominated in a foreign currency are translated daily into U.S. dollars at the prevailing rates of exchange. Income and expenses are translated into U.S. dollars at the prevailing exchange rate on the respective dates of the transactions. Purchases and sales of securities are translated into U.S. dollars at the contractual currency exchange rates established at the time of each trade.
The Funds do not isolate that portion of the results of operations resulting from changes in foreign exchange rates on investments from the fluctuations arising from changes in market prices of securities held. Net unrealized appreciation or depreciation on investments and foreign currency translations arise from changes in the value of assets and liabilities resulting from changes in the exchange rates and changes in market prices of securities held.
Options Transactions
The Funds’ use of derivatives for the year ended September 30, 2016 was limited to purchased and written options.
The Risk-Managed Balanced Fund’s primary investment strategy involves the use of options. Each of the other Funds may also purchase and/or write (sell) call and put options on any security in which it may invest. The Funds utilize options to hedge against changes in market conditions or to provide market exposure while trying to reduce transaction costs.
Option contracts involve market risk and liquidity risk and can be highly volatile. Should prices of securities or securities indexes move in an unexpected manner, the Funds may not achieve the desired benefits and may realize losses and thus be in a worse position than if such strategies had not been utilized.
When a Fund writes a put or call option, an amount equal to the premium received is included on the Statements of Assets and Liabilities as a liability. The amount of the liability is subsequently marked-to-market to reflect the current market value of the option. If an option expires on its stipulated expiration date or if the Fund enters into a closing purchase transaction, a gain or loss is realized. If a written call option on an individual security is exercised, a gain or loss is realized for the sale of the underlying security, and the proceeds from the sale are increased by the premium originally received. If a written call option on a securities index is exercised, a gain or loss is realized as determined by the premium originally received, the exercise price and the market value of the index. If a written put option on an individual security is exercised, the cost of the security acquired is decreased by the premium originally received. As a writer of an option, a Fund bears the market risk of an unfavorable change in the price of the individual security or securities index underlying the written option. Additionally, written call options may involve the risk of limited gains.
Each Fund may also purchase put and call options. When a Fund purchases a put or call option, an amount equal to the premium paid is included on the Fund’s Statement of Assets and Liabilities as an investment, and is subsequently marked-to-market to reflect the current market value of the option. If an option expires on the stipulated expiration date or if the Fund enters into a closing purchase or sale transaction, a gain or loss is realized. If the Fund exercises a call option on an individual security, the cost of the security acquired is increased by the premium paid for the call. If the Fund exercises a put option on an individual security, a gain or loss is realized from the sale of the underlying security, and the proceeds from such a sale are decreased by the premium originally paid. If the Fund exercises a put or a call option on a security index, a gain or loss is realized as determined by the premium originally paid, the exercise price and the market value of the index. Written and purchased options are non-income producing securities.
As of September 30, 2016, the Equity Income Fund engaged in purchased put option transactions and the Risk-Managed Balanced Fund engaged in written call and purchased put options transactions. All open option contracts are included on each Fund’s Schedule of Investments. The Risk-Managed Balanced Fund’s written options were collateralized by cash and/or securities held in a segregated account at the Fund’s custodian during the year. The securities pledged as collateral would be included on the Schedule of Investments if they were held at year end. Such collateral is restricted from the Fund’s use. The cash collateral held for the custodian and/or borrowings from the custodian if any, is included on the Statements of Assets and Liabilities.
| | |
| ICON Diversified Funds | | Notes to Financial Statements |
| | September 30, 2016 |
The number of options contracts written and the premiums received by the Risk-Managed Balanced Fund during the year ended September 30, 2016, were as follows:
| | | | |
| | | ICON Risk-Managed Balanced Fund |
| | | Number of Contracts | | Premiums Received |
Options outstanding, beginning of year | | – | | $ – |
Options written during year | | (190) | | (272,758) |
Options closed during year | | 175 | | 268,583 |
Options exercised during year | | 15 | | 4,175 |
| | |
Options outstanding, end of year | | – | | $ – |
| | |
The following is a summary of how these derivatives are treated in the financial statements and their impact on the Funds:
| | | | | | | | | | | | | | | | |
| ICON Equity Income Fund | | Asset Derivatives | | | Liability Derivatives | |
| Risk Exposure | | Statements of Assets and
Liabilities Location | | | Fair Value | | | Statements of Assets and
Liabilities Location | | | Fair Value | |
Equity Contracts (Purchased Options) | | | Investments, at value | | | $ | 54,000 | | | | N/A | | | | N/A | |
Total | | | | | | $ | 54,000 | | | | | | | $ | – | |
| | | | | | | | | | | | | | | | | |
| ICON Risk-Managed Balanced Fund | | Asset Derivatives | | | Liability Derivatives | |
| Risk Exposure | | Statements of Assets and
Liabilities Location | | | Fair Value | | | Statements of Assets and
Liabilities Location | | | Fair Value | |
Equity Contracts (Purchased Options) | | | Investments, at value | | | $ | 71,220 | | | | N/A | | | | N/A | |
| |
Total | | | | | | $ | 71,220 | | | | | | | $ | – | |
| |
| | | | | | | | | | |
ICON Equity Income Fund Risk Exposure | | Statements of Operations Location | | Realized
Gain/(Loss) on
Derivatives
Recognized
in Income | | | Change in
Unrealized Appreciation/
(Depreciation)
on Derivatives
Recognized
in Income | |
Equity Contracts
(Purchased Options) | | Net realized gain/(loss) on investments/ Change in unrealized net appreciation/(depreciation) on investments and foreign currency | | $ | (281,853) | | | $ | (200,882) | |
| | |
Total | | | | $ | (281,853) | | | $ | (200,882) | |
| | |
ICON Risk-Managed Balanced Fund Risk Exposure | | Statements of Operations Location | | Realized
Gain/(Loss) on
Derivatives
Recognized
in Income | | | Change in
Unrealized Appreciation/
(Depreciation)
on Derivatives
Recognized
in Income | |
Equity Contracts
(Purchased Options) | | Net realized gain/(loss) on investments/ Change in unrealized net appreciation/(depreciation) on investments and foreign currency | | $ | (672,809) | | | $ | (292,850) | |
Equity Contracts
(Written Options) | | Net realized gain/(loss) on written options/ Change in unrealized net appreciation/(depreciation) on written options | | | (146,066) | | | | – | |
| | | | | | | | | | | |
Total | | | | $ | (818,875) | | | $ | (292,850) | |
| | | | | | | | | | | |
| | |
| |
| Annual Report | September 30, 2016 | | 65 |
| | |
| ICON Diversified Funds | | Notes to Financial Statements |
| | September 30, 2016 |
The average purchased and written option contracts during the year ended September 30, 2016, was as follows:
| | | | |
ICON Equity Income Fund Derivative Type | | Unit of Measurement | | Average+ |
|
Purchased Options | | Contracts | | 129++ |
| | |
ICON Risk-Managed Balanced Fund Derivative Type | | Unit of Measurement | | Average+ |
|
Purchased Options | | Contracts | | 159++ |
Written Options | | Contracts | | 28++ |
| + | The average is calculated based on the actual number of days with outstanding derivatives. |
| ++ | During the year ended September 30, 2016, the Equity Income Fund had outstanding purchased option contracts for 192 days and the Risk-Managed Balanced Fund had outstanding purchased option contracts for the entire year and outstanding written option contracts for 257 days. |
The Funds value derivatives at fair value, as described above, and recognize changes in fair value currently in the results of operations. Accordingly, the Funds do not follow hedge accounting, even for derivatives employed as economic hedges.
Short Sales
The Long/Short Fund may engage in short sales (selling securities it does not own) as part of its normal investment activities. The Long/Short Fund enters into short positions in equity securities identified as being overvalued in management’s opinion.
Short sales involve market risk. If a security sold short increases in price, the Long/Short Fund may have to cover its short position at a higher price than the short sale price, resulting in a loss. These short sales are collateralized by cash and/or securities held with the Fund’s prime broker and in a segregated account at the Fund’s prime broker. The collateral required is determined daily by reference to the market value of the short positions. Such collateral for the Fund is restricted from use. The cash collateral that is restricted from use is included on the Statements of Assets and Liabilities as “Deposits for short sales.” The securities pledged as collateral that are restricted from use are included on the Schedule of Investments. Dividends received on short sales are treated as an expense on the Statements of Operations. Liabilities for securities sold short are closed out by purchasing the applicable securities for delivery to the Fund’s prime broker. As of and for the year ended September 30, 2016, the Long/Short Fund did not engage in short selling.
Securities Lending
Under procedures adopted by the Board, the Funds may lend securities to certain approved brokers, dealers and other financial institutions to earn additional income. Cash collateral is received in exchange for securities on loan in the amount of at least 102% of the value of U.S. securities loaned or at least 105% of the value of non-U.S. securities loaned, marked to market daily. The Funds retain certain benefits of owning the securities, including receipt of dividends or interest generated by the security, but give up other rights including the right to vote proxies. The Funds retain the ability to recall the loans at any time and could do so in order to vote proxies or to sell the loaned securities. Each loan is collateralized by cash that generally exceeds the value of the securities on loan. The market value of the loaned securities is determined daily at the close of business of the Funds and any additional required collateral is delivered to each Fund on the next business day.
Generally, in the event of borrower default, the Funds have the right to use the collateral to offset any losses incurred. In the event the Funds are delayed or prevented from exercising their rights to dispose of the collateral, there may be a potential loss to the Funds. Some of these losses may be indemnified by the lending agent.
The Funds have elected to invest the cash collateral in the State Street Navigator Prime Portfolio which is disclosed on the Schedule of Investments. The Funds bear the risk of loss with respect to the investment of collateral. The net securities lending income earned by the Funds for the year ended September 30, 2016, is included in the Statements of Operations.
The value of the collateral could include collateral held for securities that were sold on or before September 30, 2016. It may also include collateral received from the pre-funding of security loans.
| | |
| ICON Diversified Funds | | Notes to Financial Statements |
| | September 30, 2016 |
The following table indicates the total amount of securities loaned by type, reconciled to gross liability payable upon return of the securities loaned by the Funds as of September 30, 2016:
| | | | | | | | | | | | | | | | | | | | | | | | | | | | |
| | | Remaining contractual maturity of the lending agreement | | | | | | | |
| | | Overnight &
Continuous | | | Up to 30 days | | | 30-90 days | | | Greater than
90 days | | | Market Value | | | Collateral
Received | | | Excess amount
due to
counterparty | |
| |
Securities Lending Transactions | | | | | | | | | | | | | | | | | | | | | | | | | | | | |
ICON Bond Fund | | | | | | | | | | | | | | | | | | | | | | | | | | | | |
Corporate Securities | | $ | 1,032,500 | | | $ | – | | | $ | – | | | $ | – | | | $ | 1,032,500 | | | $ | 1,055,000 | | | $ | 22,500 | |
Equity Securities | | | 33,171 | | | | – | | | | – | | | | – | | | | 33,171 | | | | 37,875 | | | | 4,704 | |
| | | | | | | | | | | | | | | | | | | | |
Total | | | | | | | | | | | | | | | | | | | 1,065,671 | | | | 1,092,875 | | | | 27,204 | |
ICON Equity Income Fund | | | | | | | | | | | | | | | | | | | | | | | | | | | | |
Equity Securities | | | 5,888,869 | | | | – | | | | – | | | | – | | | | 5,888,869 | | | | 5,989,261 | | | | 100,392 | |
ICON Risk-Managed Balanced Fund | | | | | | | | | | | | | | | | | | | | | | | | | | | | |
Equity Securities | | | 419,967 | | | | – | | | | – | | | | – | | | | 419,967 | | | | 426,194 | | | | 6,227 | |
Income Taxes, Dividends, and Distributions
The Funds intend to continue to qualify as regulated investment companies under Subchapter M of the Internal Revenue Code and, accordingly, the Funds will generally not be subject to federal and state income taxes or federal excise taxes to the extent that they intend to make sufficient distributions of net investment income and net realized capital gains.
Dividends paid by the Funds from net investment income and distributions of net realized short-term gains are, for federal income tax purposes, taxable as ordinary income to shareholders.
Dividends and distributions to shareholders are recorded by the Funds on the ex-dividend/distribution date. The Bond Fund distributes net investment income, if any, to shareholders monthly. The Equity Income Fund and the Risk-Managed Balanced Fund intend to distribute net investment income, if any, to shareholders quarterly. The other Funds distribute income, if any, annually. The Funds distribute net realized capital gains, if any, to shareholders at least annually, if not offset by capital loss carryforwards. The Funds may utilize equalization accounting for tax purposes and designate earnings and profits, including net realized gains distributed to shareholders on redemption of shares, as part of the dividends paid deduction for income tax purposes. Income distributions and capital gain distributions are determined in accordance with income tax regulations, which may differ from accounting principles generally accepted in the United States of America.
Management has analyzed the Funds’ tax positions taken on federal income tax returns for all open tax periods and has concluded that no provision for federal income tax is required in the Funds’ financial statements.
The Funds file U.S. tax returns. While the statute of limitations remains open to examine the Funds’ U.S. tax returns filed for the past three years, no examinations are in progress or anticipated at this time. The Funds are not aware of any tax positions for which it is reasonably possible that the total amounts of unrecognized tax benefits will significantly change in the next twelve months.
Certain foreign countries impose a capital gains tax which is accrued by the Funds based on the unrealized appreciation, if any, on affected securities. Any accrual would reduce a Fund’s NAV. The tax is paid when the gain is realized.
Investment Income
Dividend income is recorded on the ex-dividend date. Non-cash dividends included in dividend income, if any, are recorded at the fair value of the securities received. Interest income is accrued as earned. Certain dividends from foreign securities are recorded as soon as the Funds are informed of the dividend if such information is obtained subsequent to the ex-dividend date. Discounts and premiums on fixed income securities purchased are accreted or amortized to income over the life of the respective securities based on the effective yield. Paydown gains and losses on mortgage-related and other asset-backed securities are recorded as components of interest income on the Statements of Operations.
| | |
| |
| Annual Report | September 30, 2016 | | 67 |
| | |
| ICON Diversified Funds | | Notes to Financial Statements |
| | September 30, 2016 |
Investment Transactions
Security transactions are accounted for no later than one business day after the trade date. However, for financial reporting purposes, security transactions are accounted for on the trade date. Gains and losses on securities sold are determined on the basis of identified cost.
Withholding Tax
Withholding taxes on foreign dividends have been provided for in accordance with the Funds’ understanding of the applicable country’s tax rules and rates. The ability of issuers of debt securities held by the Funds to meet their obligations may be effected by economic and political developments in specific country or region.
Other
The Funds hold certain investments which pay dividends to their shareholders based upon available funds from operations. It is possible for these dividends to exceed the underlying investments’ taxable earnings and profits resulting in the excess portion of such dividends being designated as a return of capital. Distributions received from investments in securities that represent a return of capital or capital gains are recorded as a reduction of the cost of investments or as a realized gain, respectively.
Allocation of Expenses
Each class of a Fund’s shares bears expenses incurred specifically on its behalf and, in addition, each class bears a portion of general expenses, based upon relative net assets of each class. Expenses which cannot be directly attributed to a specific Fund in the Trust are apportioned between all Funds in the Trust based upon relative net assets. In calculating the net asset value per share of each class, investment income, realized and unrealized gains and losses and expenses other than class-specific expenses are allocated daily to each class of shares based upon the proportion of net assets.
Below are additional class level expenses that are included on the Statements of Operations:
| | | | | | | | | | | | |
| Fund | | Printing Fees | | | Transfer Agent Fees* | | | Registration Fees | |
| |
ICON Bond Fund | | | | | | | | | | | | |
Class S | | $ | 10,684 | | | $ | 63,315 | | | $ | 16,938 | |
Class C | | | 975 | | | | 9,755 | | | | 9,552 | |
Class A | | | 930 | | | | 9,898 | | | | 9,764 | |
ICON Equity Income Fund | | | | | | | | | | | | |
Class S | | | 8,203 | | | | 39,528 | | | | 14,142 | |
Class C | | | 1,459 | | | | 13,907 | | | | 10,317 | |
Class A | | | 3,060 | | | | 22,794 | | | | 12,891 | |
ICON Fund | | | | | | | | | | | | |
Class S | | | 6,924 | | | | 25,867 | | | | 11,932 | |
Class C | | | 2,926 | | | | 36,736 | | | | 10,888 | |
Class A | | | 1,509 | | | | 15,770 | | | | 10,424 | |
ICON Long/Short Fund | | | | | | | | | | | | |
Class S | | | 2,517 | | | | 20,995 | | | | 10,957 | |
Class C | | | 1,504 | | | | 14,967 | | | | 11,020 | |
Class A | | | 2,144 | | | | 19,094 | | | | 12,999 | |
ICON Risk-Managed Balanced Fund | | | | | | | | | | | | |
Class S | | | 6,039 | | | | 47,498 | | | | 12,384 | |
Class C | | | 3,156 | | | | 23,606 | | | | 12,878 | |
Class A | | | 2,059 | | | | 14,969 | | | | 13,560 | |
| * | Transfer agent out of pocket fees are a Fund level expense. |
3. FEES AND OTHER TRANSACTIONS WITH AFFILIATES
Investment Advisory Fees
ICON Advisers, Inc. (“ICON Advisers”) serves as investment adviser to the Funds and is responsible for managing the Funds’ portfolios of securities. ICON Advisers receives a monthly management fee that is computed daily at an annual rate of 0.60% of average daily net assets of the Bond Fund,
| | |
| ICON Diversified Funds | | Notes to Financial Statements |
| | September 30, 2016 |
0.75% of average daily net assets of the Equity Income Fund, ICON Fund, Opportunities Fund and Risk-Managed Balanced Fund, and 0.85% of average daily net assets of the Long/Short Fund.
ICON Advisers has contractually agreed to limit the Funds’ expenses (exclusive of brokerage, interest, taxes, dividends on short sales, acquired fund fees and expenses and extraordinary expenses) to the extent necessary to ensure that the Funds’ expenses do not exceed the following amounts:
| | | | | | | | | | | | | | | | | | | | |
| Fund | | Fund | | | Class S | | | Class C | | | Class A | | | | |
| |
ICON Bond Fund | | | – | | | | 0.75% | | | | 1.60% | | | | 1.00% | | | | | |
ICON Equity Income Fund | | | – | | | | 1.20% | | | | 2.20% | | | | 1.45% | | | | | |
ICON Fund | | | – | | | | 1.25% | | | | 2.25% | | | | 1.50% | | | | | |
ICON Long/Short Fund | | | – | | | | 1.25% | | | | 2.30% | | | | 1.55% | | | | | |
ICON Opportunities Fund | | | 1.50% | | | | – | | | | – | | | | – | | | | | |
ICON Risk-Managed Balanced Fund | | | – | | | | 1.20% | | | | 2.20% | | | | 1.45% | | | | | |
The Funds’ expense limitations, excluding the Bond Fund Class A, all classes of the ICON Fund and the Opportunities Fund, will continue in effect until at least January 31, 2021. Limitations for the Bond Fund Class A, all classes of the ICON Fund and the Opportunities Fund will continue in effect until at least January 31, 2017. To the extent ICON Advisers reimburses or absorbs fees and expenses, it may seek payment of such amounts for up to three years after the expenses were reimbursed or absorbed. A Fund will make no such payment, however, if the total Fund operating expenses exceed the expense limits in effect at the time these payments are proposed.
As of September 30, 2016 the following amounts were available for recoupment by ICON Advisers based upon their potential expiration dates:
| | | | | | | | | | | | |
| Fund | | Expires
2017 | | | Expires
2018 | | | Expires
2019 | |
| |
ICON Bond Fund | | $ | 136,560 | | | $ | 180,067 | | | $ | 180,193 | |
ICON Equity Income Fund | | | 34,431 | | | | 31,087 | | | | 35,317 | |
ICON Fund | | | 5,855 | | | | 6,855 | | | | 28,516 | |
ICON Long/Short Fund | | | 46,283 | | | | 50,987 | | | | 80,331 | |
ICON Opportunities Fund | | | 22,580 | | | | 8,824 | | | | 3,029 | |
ICON Risk-Managed Balanced Fund | | | 27,233 | | | | 61,973 | | | | 44,620 | |
Accounting, Custody and Transfer Agent Fees
Effective March 1, 2016, ALPS Fund Services (“ALPS”) serves as the fund accounting agent for the Funds. Prior to March 1, 2016, State Street Bank and Trust Company (“State Street”) served as the fund accounting agent for the Funds. For its services, the Trust pays ALPS a fee that is calculated daily and paid monthly at an annual rate based on the aggregate average daily net assets of the Trust.
State Street is the custodian of the Trust’s investments. For its services, the Trust pays State Street asset-based fees that vary according to the number of positions and transactions, plus out-of-pocket expenses.
Effective April 9, 2016, ALPS became the transfer agent for the Trust. For these services, the Trust pays an annual fee plus annual base fee per Fund, per account fees and out-of-pocket expenses. Prior to April 9, 2016, Boston Financial Data Services, Inc. was the Trust’s transfer agent.
Administrative Services
The Trust has entered into an administrative services agreement with ICON Advisers pursuant to which ICON Advisers oversees the administration of the Trust’s business and affairs. This agreement provides for an annual fee of 0.05% on the Trust’s first $1.5 billion of average daily net assets, 0.045% on the next $1.5 billion of average daily net assets, 0.040% on the next $2 billion of average daily net assets and 0.030% on average daily net assets over $5 billion. For the year ended September 30, 2016, each Fund’s payment for administrative services to ICON Advisers is included on the Statements of Operations. The administrative services agreement provides that ICON Advisers will not be liable for any error of judgment, mistake of law, or any loss suffered by the Trust in connection with matters to which the administrative services agreement relates, except for a loss resulting from willful misfeasance, bad faith or negligence by ICON Advisers in the performance of its duties.
Effective March 1, 2016, ICON Advisers has a sub-administration agreement with ALPS under which ALPS assists ICON Advisers with the administration and business affairs of the Trust. For its services, ICON Advisers pays ALPS a fee that is calculated daily and paid monthly at an annual rate based on the aggregate average daily net assets of the Trust. Prior to March 1, 2016, the sub-administration agreement was between ICON Advisers and State Street.
| | |
| |
| Annual Report | September 30, 2016 | | 69 |
| | |
| ICON Diversified Funds | | Notes to Financial Statements |
| | September 30, 2016 |
Distribution Fees
The Funds have adopted a non-compensatory Distribution Plan pursuant to Rule 12b-1 under the 1940 Act (“12b-1 Plan”) under which the Funds are authorized to compensate the Funds’ distributor, ICON Distributors, Inc. (“IDI”) (an affiliate of the adviser) for the sale and distribution of shares and for other shareholder services. Under the 12b-1 Plan, the Distribution Plan provides for reimbursement of expenses incurred by IDI related to distribution and marketing. The Bond Fund Class C shareholders pay an annual distribution and service fee of 0.85% of average daily net assets and Class A shareholders pay an annual distribution and service fee of 0.25% of average daily net assets. The shareholders of the other Funds pay an annual distribution and service fee of 1.00% of average daily net assets for Class C shares and an annual distribution and service fee of 0.25% of average daily net assets for Class A shares. There is no annual distribution and service fee for Class S shares. The total amount paid under the 12b-1 plans by the Funds is shown on the Statements of Operations.
In addition, IDI, as Distributor, receives a contingent deferred sales charge at a rate of 1.00% of the purchase price for the sale of Class C shares within one year of purchase. For Class A shares, the public offering price equals net asset value plus the applicable sales charge, which is a maximum of 5.75% (4.75% for Class A shares of the ICON Bond Fund). IDI receives a portion of this sales charge and may redistribute it as dealer discounts and brokerage commissions to non-related parties.
Other Related Parties
Certain Officers and Directors of ICON Advisers are also Officers and Trustees of the Funds; however, such Officers and Trustees (with the exception of the Chief Compliance Officer, “CCO”) receive no compensation from the Funds. The Trust paid 95% of the CCO’s salary and the remaining portion, along with other employee related expenses, is paid by ICON Advisers. For the year ended September 30, 2016, the total related amounts paid by the Funds under this arrangement are included in Other Expenses on the Statements of Operations.
The Funds may reimburse ICON Advisers for legal work performed for the Funds by its attorneys outside of the advisory and administration contracts. The Board reviews and approves such reimbursements. For the year ended September 30, 2016, the total related amounts paid by the Funds under this arrangement was $4,806 and is included in Other Expenses on the Statements of Operations.
The Funds engaged in cross trades with each other during the year ended September 30, 2016 pursuant to Rule 17a-7 under the 1940 Act. Generally, cross trading is the buying or selling of portfolio securities between funds to which the Adviser serves as the investment adviser. The Board of Trustees previously adopted procedures that apply to transactions between the Funds and its affiliates pursuant to Rule 17a-7. At its regularly scheduled meetings, the Board of Trustees reviews such transactions as of the most current calendar quarter for compliance with the requirements set forth by Rule 17a-7 and the Funds’ procedures. The procedures require that the transactions be a purchase or sale for no consideration other than cash payment against prompt delivery of a security for which market quotations are readily available, and be consistent with the investment policies of each Fund.
4. BORROWINGS
The Trust has entered into a uncommitted, unsecured, revolving Line of Credit agreement/arrangement with State Street to provide temporary funding for redemption requests. Effective March 21, 2016, the maximum borrowing limit was changed from $75 million to $50 million. Interest on domestic borrowings is charged at a rate quoted and determined by State Street. The Line of Credit agreement/arrangement expires on March 20, 2017.
As of September 30, 2016, the ICON Fund and the Long/Short Fund had outstanding borrowings in the amount of $431,277 and $498,627, respectively.
For the year ended September 30, 2016, the average outstanding loan by Fund was as follows:
| | | | | | |
| Fund | | Average Borrowing
(10/01/15 - 9/30/16)^ | | | Average Interest Rates
(10/1/15 - 9/30/16)^ |
|
ICON Bond Fund* | | $ | 1,201,046 | | | 1.38% |
ICON Equity Income Fund* | | | 429,200 | | | 1.70% |
ICON Fund | | | 558,003 | | | 1.64% |
ICON Long/Short Fund | | | 629,367 | | | 1.64% |
ICON Opportunities Fund* | | | 100,612 | | | 1.67% |
ICON Risk-Managed Balanced Fund* | | | 919,209 | | | 1.72% |
| * | There were no outstanding borrowings under this agreement/arrangement as of September 30, 2016. |
| ^ | The average is calculated based on the actual number of days with outstanding borrowings. |
| | |
| ICON Diversified Funds | | Notes to Financial Statements |
| | September 30, 2016 |
5. PURCHASES AND SALES OF INVESTMENT SECURITIES
For the year ended September 30, 2016, the aggregate cost of purchases and proceeds from sales of investment securities (excluding securities sold short, short-term securities and written options contracts) was as follows:
| | | | | | | | | | | | | | | | |
| Fund | | Purchases of
Securities | | | Proceeds from Sales
of Securities | | | Purchases of Long
Term U.S.
Government
Obligations | | | Proceeds from Sales
of Long Term U.S.
Government
Obligations | |
| |
ICON Bond Fund | | $ | 111,565,515 | | | | $ 114,417,196 | | | | $ 2,956,094 | | | | $ 4,805,127 | |
ICON Equity Income Fund | | | 90,748,139 | | | | 71,956,202 | | | | – | | | | – | |
ICON Fund | | | 14,991,678 | | | | 23,251,853 | | | | – | | | | – | |
ICON Long/Short Fund | | | 4,378,720 | | | | 20,066,737 | | | | – | | | | – | |
ICON Opportunities Fund | | | 14,498,227 | | | | 10,409,779 | | | | – | | | | – | |
ICON Risk-Managed Balanced Fund | | | 49,670,512 | | | | 53,618,359 | | | | 2,573,250 | | | | 2,731,490 | |
6. FEDERAL INCOME TAX
The following information is presented on an income tax basis. Differences between GAAP and federal income tax purposes that are permanent in nature are reclassified within the capital accounts. Temporary differences do not require reclassification. Temporary and permanent differences do not impact the NAVs of the Funds. These differences are primarily due to differing treatments for items such as deferrals of wash sale losses, foreign currency transactions, partnership adjustments, net investment losses, and the treatment of TIPS, trust preferred securities, and paydowns.
For the year ended September 30, 2016, the following Funds had capital loss carryforwards:
| | | | | | | | |
| Fund | | Expiring in 2017 | | | Expiring in 2018 | |
| |
ICON Equity Income Fund | | $ | – | | | $ | 19,024,268 | |
ICON Fund | | | – | | | | 17,897,797 | |
ICON Long/Short Fund | | | 33,675,749 | | | | 19,325,857 | |
ICON Risk-Managed Balanced Fund | | | – | | | | 12,982,796 | |
Future capital loss carryforward utilization in any given year may be limited if there are substantial shareholder redemptions or contributions. During the year ended September 30, 2016, the following Funds utilized capital loss carryforwards:
| | | | |
| Fund | | Amount | |
| |
ICON Equity Income Fund | | | $ 701,417 | |
ICON Risk-Managed Balanced Fund | | | 237,622 | |
The capital losses with no expiration were as follows:
| | | | | | | | |
| Fund | | Short-Term | | | Long-Term | |
| |
ICON Bond Fund | | | $ 778,218 | | | | $ 1,152,209 | |
ICON Fund | | | 1,433,750 | | | | – | |
ICON Long/Short Fund | | | 1,444,669 | | | | – | |
Under the Regulated Investment Company Modernization Act of 2010 (the “Act”) capital losses generated by a Fund may be carried over indefinitely, but these losses must be used prior to the utilization of any pre-enactment capital losses. Since pre-enactment capital losses may only be carried forward for eight years there may be a greater likelihood that all or a portion of each Fund’s pre-enactment capital losses will expire unused.
The tax characteristics of distributions paid to shareholders during the fiscal year ended September 30, 2016, were as follows:
| | | | | | | | |
| Fund | | Ordinary Income | | | Long-Term Capital
Gains | |
| |
ICON Bond Fund | | $ | 2,950,335 | | | $ | – | |
ICON Equity Income Fund | | | 1,921,339 | | | | – | |
ICON Opportunities Fund | | | – | | | | 10,170 | |
ICON Risk-Managed Balanced Fund | | | 453,746 | | | | – | |
| | |
| |
| Annual Report | September 30, 2016 | | 71 |
| | |
| ICON Diversified Funds | | Notes to Financial Statements |
| | September 30, 2016 |
The tax characteristics of distributions paid to shareholders during the fiscal year ended September 30, 2015, were as follows:
| | | | | | | | | | | | |
| Fund | | Ordinary Income | | | Long-Term Capital
Gains | | | Return of Capital | |
| |
ICON Bond Fund | | $ | 4,946,691 | | | $ | 1,246,377 | | | $ | 319,369 | |
ICON Equity Income Fund | | | 1,340,637 | | | | – | | | | – | |
ICON Opportunities Fund | | | 126,909 | | | | 60,583 | | | | – | |
ICON Risk-Managed Balanced Fund | | | 321,451 | | | | – | | | | – | |
As of September 30, 2016, the components of accumulated earnings/(deficit) on a tax basis were as follows:
| | | | | | | | | | | | | | | | | | | | | | | | |
| Fund | | Undistributed
Ordinary
Income | | | Undistributed
Capital Gains | | | Late Year Loss
Deferral* | | | Capital Loss
Carryforward and
Other Losses | | | Unrealized
Appreciation/
(Depreciation)** | | | Total
Accumulated
Earnings/
(Deficit) | |
| |
ICON Bond Fund | | $ | 158,476 | | | $ | – | | | $ | (554,807) | | | $ | (1,965,486) | | | $ | 1,189,707 | | | $ | (1,172,110) | |
ICON Equity Income Fund | | | 35,661 | | | | – | | | | (1,876,410) | | | | (19,028,011) | | | | 1,834,525 | | | | (19,034,235) | |
ICON Fund | | | – | | | | – | | | | (1,328,436) | | | | (19,331,547) | | | | 1,621,822 | | | | (19,038,161) | |
ICON Long/Short Fund | | | – | | | | – | | | | (667,891) | | | | (54,446,275) | | | | 515,242 | | | | (54,598,924) | |
ICON Opportunities Fund | | | – | | | | 221,529 | | | | (30,697) | | | | – | | | | 860,986 | | | | 1,051,818 | |
ICON Risk-Managed Balanced Fund | | | 69,429 | | | | – | | | | (411,465) | | | | (12,983,989) | | | | 713,150 | | | | (12,612,875) | |
| * | The Funds have elected to defer certain qualified late-year losses in accordance with federal income tax rules. These losses are treated as having arisen on the first day of the following fiscal year. |
| ** | Differences between the book-basis and tax-basis unrealized appreciation/(depreciation) are attributable primarily to tax deferral of losses on wash sales. |
As of September 30, 2016, cost on investments for federal income tax purposes and the amount of net unrealized appreciation/(depreciation) were as follows:
| | | | | | | | | | | | | | | | | | | | |
| Fund | | Gross Appreciation
(excess of value over
tax cost) | | | Gross Depreciation
(excess of tax cost
over value) | | | Net Appreciation of
Foreign Currency
and Derivatives | | | Net Unrealized
Appreciation | | | Cost of Investments
for Income Tax
Purposes | |
| |
ICON Bond Fund | | $ | 1,478,937 | | | $ | (289,230) | | | $ | – | | | $ | 1,189,707 | | | $ | 86,533,237 | |
ICON Equity Income Fund | | | 3,305,238 | | | | (1,671,634) | | | | 200,921 | | | | 1,834,525 | | | | 68,670,600 | |
ICON Fund | | | 4,320,515 | | | | (2,698,693) | | | | – | | | | 1,621,822 | | | | 44,291,780 | |
ICON Long/Short Fund | | | 1,618,545 | | | | (1,103,303) | | | | – | | | | 515,242 | | | | 16,198,973 | |
ICON Opportunities Fund | | | 1,579,860 | | | | (718,874) | | | | – | | | | 860,986 | | | | 15,236,512 | |
ICON Risk-Managed Balanced Fund | | | 2,122,188 | | | | (1,737,345) | | | | 328,307 | | | | 713,150 | | | | 43,898,891 | |
7. SUBSEQUENT EVENTS
On October 14, 2016, the State Street Navigator Prime Portfolio, the collateral vehicle for securities lending, became the State Street Navigator Securities Lending Government Money Market Portfolio (“Government Money Market Portfolio”). The Government Money Market Portfolio will seek: (i) current income to the extent consistent with the preservation of capital and liquidity; and (ii) the maintenance of a stable $1.00 per share net asset value.
In addition to the current expense waiver through 1/31/2021, on November 14, 2016, ICON Advisers contractually agreed to limit the total expenses of the ICON Equity Income Fund for one year (excluding interest, taxes, brokerage, acquired fund fees and expenses and extraordinary expenses) to an annual rate for Class A of 1.24%, an annual rate for Class C of 1.99%, and an annual rate of 0.99% for Class S. This expense limitation may revert back to the current limits any time after January 31, 2018 upon 30 days’ written notice of termination to the Fund’s Board of Trustees. The new expense limitation will become effective with the filing of the annual registration statement in January 2017.
8. CHANGE OF INDEPENDENT REGISTERED PUBLIC ACCOUNTING FIRM
The Audit Committee of the Board of the Funds dismissed PricewaterhouseCoopers LLP (“PwC”), as the independent registered public accounting firm of the Funds and appointed Cohen & Company, Ltd. (“Cohen”) effective July 27, 2016.
| | |
| ICON Diversified Funds | | Report of Independent Registered Public Accounting Firm |
To the Shareholders and Board of Trustees of
ICON Funds
We have audited the accompanying statements of assets and liabilities, including the schedules of investments, of ICON Bond Fund, ICON Equity Income Fund, ICON Fund, ICON Long/Short Fund, ICON Opportunities Fund, and ICON Risk-Managed Balanced Fund (the “Funds”, each a series of ICON Funds) as of September 30, 2016, and the related statements of operations and changes in net assets, and the financial highlights for the year then ended. These financial statements and financial highlights are the responsibility of the Funds’ management. Our responsibility is to express an opinion on these financial statements and financial highlights based on our audit. The Funds’ financial statements and financial highlights for the years ended September 30, 2015 and prior, were audited by other auditors, whose report dated November 18, 2015 expressed an unqualified opinion on those financial statements and financial highlights.
We conducted our audit in accordance with the standards of the Public Company Accounting Oversight Board (United States). Those standards require that we plan and perform the audit to obtain reasonable assurance about whether the financial statements and financial highlights are free of material misstatement. An audit includes examining, on a test basis, evidence supporting the amounts and disclosures in the financial statements. Our procedures included confirmation of securities owned as of September 30, 2016, by correspondence with the custodian and brokers. An audit also includes assessing the accounting principles used and significant estimates made by management, as well as evaluating the overall financial statement presentation. We believe that our audit provides a reasonable basis for our opinion.
In our opinion, the financial statements and financial highlights referred to above present fairly, in all material respects, the financial position of each of the Funds as of September 30, 2016, the results of their operations, the changes in their net assets, and their financial highlights for year then ended, in conformity with accounting principles generally accepted in the United States of America.

COHEN & COMPANY, LTD.
Cleveland, Ohio
November 23, 2016
| | |
| |
| Annual Report | September 30, 2016 | | 73 |
| | |
| ICON Diversified Funds | | Disclosure of Fund Expenses |
| | September 30, 2016 (Unaudited) |
Example
As a shareholder of a Fund you may pay two types of fees: transaction fees and fund-related fees. Certain funds charge transaction fees, including sales charges (loads) on purchase payments, reinvested dividends, or other distributions; redemption fees; and exchange fees. Funds also incur various ongoing expenses, including management fees, distribution and/or service fees, and other fund expenses, which are indirectly paid by shareholders.
This Example is intended to help you understand your ongoing costs (in dollars) of investing in the various ICON Funds and to compare these costs with the ongoing costs of investing in other mutual funds. This Example is based on an investment of $1,000 invested at the beginning of the six-month period and held for the six-month period (4/01/16 – 9/30/16).
Actual Expenses
The first line in the table for each Fund provides information about actual account values and actual expenses. The Example includes, but is not limited to, management fees, 12b-1 fees, fund accounting, custody and transfer agent fees. However, the Example does not include client specific fees, such as the $15 fee charged to IRA accounts, or the $15 fee charged for wire redemptions. You may use this information, together with the amount you invested, to estimate the expenses that you paid over the period. Simply divide your account value by $1,000 (for example, an $8,600 account value divided by $1,000 = 8.6), then multiply the result by the number in the first line for each Fund under the heading entitled “Expenses Paid During Period” to estimate the expenses you paid on your account during this period.
Hypothetical Example for Comparison Purposes
The second line in the table for each Fund provides information about hypothetical account values and hypothetical expenses based on the Fund’s actual expense ratio and an assumed rate of return of 5% per year before expenses, which is not the Fund’s actual return. The hypothetical account values and expenses may not be used to estimate the actual ending account balance or expenses you paid for the period. You may use this information to compare the ongoing costs of investing in the Fund and other funds. To do so, compare this 5% hypothetical example with the 5% hypothetical examples that appear in the shareholder reports of the other funds. Please note that the expenses shown in the table are meant to highlight your ongoing costs only and do not reflect any transactional costs, such as sales charges (loads), redemption fees, or exchange fees that may be charged by other funds. Therefore, this information is useful in comparing ongoing costs only, and will not help you determine the relative total costs of owning different funds.
| | | | | | | | | | | | | | | | |
| | | Beginning Account
Value April 1, 2016 | | | Ending Account
Value
September 30, 2016 | | | Expense Ratio(a) | | | Expenses Paid
During period
April 1, 2016 -
September 30, 2016(b) | |
| |
ICON Bond Fund | | | | | | | | | | | | | | | | |
Class S | | | | | | | | | | | | | | | | |
Actual | | | $ 1,000.00 | | | | $ 1,049.70 | | | | 0.75% | | | | $ 3.84 | |
Hypothetical (5% return before expenses) | | | $ 1,000.00 | | | | $ 1,021.25 | | | | 0.75% | | | | $ 3.79 | |
Class C | | | | | | | | | | | | | | | | |
Actual | | | $ 1,000.00 | | | | $ 1,044.70 | | | | 1.61% | | | | $ 8.23 | |
Hypothetical (5% return before expenses) | | | $ 1,000.00 | | | | $ 1,016.95 | | | | 1.61% | | | | $ 8.12 | |
Class A | | | | | | | | | | | | | | | | |
Actual | | | $ 1,000.00 | | | | $ 1,048.70 | | | | 1.00% | | | | $ 5.12 | |
Hypothetical (5% return before expenses) | | | $ 1,000.00 | | | | $ 1,020.00 | | | | 1.00% | | | | $ 5.05 | |
| | | | |
ICON Equity Income Fund | | | | | | | | | | | | | | | | |
Class S | | | | | | | | | | | | | | | | |
Actual | | | $ 1,000.00 | | | | $ 1,056.70 | | | | 1.20% | | | | $ 6.17 | |
Hypothetical (5% return before expenses) | | | $ 1,000.00 | | | | $ 1,019.00 | | | | 1.20% | | | | $ 6.06 | |
Class C | | | | | | | | | | | | | | | | |
Actual | | | $ 1,000.00 | | | | $ 1,051.50 | | | | 2.20% | | | | $ 11.28 | |
Hypothetical (5% return before expenses) | | | $ 1,000.00 | | | | $ 1,014.00 | | | | 2.20% | | | | $ 11.08 | |
Class A | | | | | | | | | | | | | | | | |
Actual | | | $ 1,000.00 | | | | $ 1,055.50 | | | | 1.45% | | | | $ 7.45 | |
Hypothetical (5% return before expenses) | | | $ 1,000.00 | | | | $ 1,017.75 | | | | 1.45% | | | | $ 7.31 | |
| | |
| ICON Diversified Funds | | Disclosure of Fund Expenses |
| | September 30, 2016 (Unaudited) |
| | | | | | | | | | | | | | | | |
| | | Beginning Account
Value April 1, 2016 | | | Ending Account
Value
September 30, 2016 | | | Expense Ratio(a) | | | Expenses Paid
During period April 1, 2016 -
September 30, 2016(b) | |
| |
ICON Fund | | | | | | | | | | | | | | | | |
Class S | | | | | | | | | | | | | | | | |
Actual | | | $ 1,000.00 | | | | $ 1,043.00 | | | | 1.09% | | | | $ 5.57 | |
Hypothetical (5% return before expenses) | | | $ 1,000.00 | | | | $ 1,019.55 | | | | 1.09% | | | | $ 5.50 | |
Class C | | | | | | | | | | | | | | | | |
Actual | | | $ 1,000.00 | | | | $ 1,036.60 | | | | 2.27% | | | | $ 11.56 | |
Hypothetical (5% return before expenses) | | | $ 1,000.00 | | | | $ 1,013.65 | | | | 2.27% | | | | $ 11.43 | |
Class A | | | | | | | | | | | | | | | | |
Actual | | | $ 1,000.00 | | | | $ 1,040.70 | | | | 1.52% | | | | $ 7.75 | |
Hypothetical (5% return before expenses) | | | $ 1,000.00 | | | | $ 1,017.40 | | | | 1.52% | | | | $ 7.67 | |
| | | | |
ICON Long/Short Fund | | | | | | | | | | | | | | | | |
Class S | | | | | | | | | | | | | | | | |
Actual | | | $ 1,000.00 | | | | $ 1,040.60 | | | | 1.26% | | | | $ 6.43 | |
Hypothetical (5% return before expenses) | | | $ 1,000.00 | | | | $ 1,018.70 | | | | 1.26% | | | | $ 6.36 | |
Class C | | | | | | | | | | | | | | | | |
Actual | | | $ 1,000.00 | | | | $ 1,035.40 | | | | 2.31% | | | | $ 11.75 | |
Hypothetical (5% return before expenses) | | | $ 1,000.00 | | | | $ 1,013.45 | | | | 2.31% | | | | $ 11.63 | |
Class A | | | | | | | | | | | | | | | | |
Actual | | | $ 1,000.00 | | | | $ 1,039.50 | | | | 1.56% | | | | $ 7.95 | |
Hypothetical (5% return before expenses) | | | $ 1,000.00 | | | | $ 1,017.20 | | | | 1.56% | | | | $ 7.87 | |
| | | | |
ICON Opportunities Fund | | | | | | | | | | | | | | | | |
Actual | | | $ 1,000.00 | | | | $ 1,129.50 | | | | 1.51% | | | | $ 8.04 | |
Hypothetical (5% return before expenses) | | | $ 1,000.00 | | | | $ 1,017.45 | | | | 1.51% | | | | $ 7.62 | |
| | | | |
ICON Risk-Managed Balanced Fund | | | | | | | | | | | | | | | | |
Class S | | | | | | | | | | | | | | | | |
Actual | | | $ 1,000.00 | | | | $ 1,023.40 | | | | 1.20% | | | | $ 6.07 | |
Hypothetical (5% return before expenses) | | | $ 1,000.00 | | | | $ 1,019.00 | | | | 1.20% | | | | $ 6.06 | |
Class C | | | | | | | | | | | | | | | | |
Actual | | | $ 1,000.00 | | | | $ 1,019.00 | | | | 2.20% | | | | $ 11.10 | |
Hypothetical (5% return before expenses) | | | $ 1,000.00 | | | | $ 1,014.00 | | | | 2.20% | | | | $ 11.08 | |
Class A | | | | | | | | | | | | | | | | |
Actual | | | $ 1,000.00 | | | | $ 1,022.80 | | | | 1.45% | | | | $ 7.33 | |
Hypothetical (5% return before expenses) | | | $ 1,000.00 | | | | $ 1,017.75 | | | | 1.45% | | | | $ 7.31 | |
| (a) | The Fund’s expense ratios have been annualized based on the Fund’s most recent fiscal half-year expenses. |
| (b) | Expenses are equal to the Fund’s annualized expense ratio multiplied by the average account value over the period, multiplied by the number of days in the most recent fiscal half-year 183/366 (to reflect the half-year period). |
Total returns exclude applicable sales charges. If sales charges were included (maximum 5.75%), returns would be lower.
| | |
| |
| Annual Report | September 30, 2016 | | 75 |
| | |
| ICON Diversified Funds | | Board of Trustees and Fund Officers |
| | September 30, 2016 (Unaudited) |
The ICON Funds Board of Trustees (the “Board”) consists of four Trustees who oversee the 17 ICON Funds (the “Funds”). The Board is responsible for general oversight of the Funds’ business and for assuring that the Funds are managed in the best interest of the Funds’ shareholders. The Trustees, and their ages, and principal occupations are set forth below. The address of the Trustees is 5299 DTC Blvd., Suite 1200, Greenwood Village, CO 80111. Trustees have no official term of office and generally serve until they resign or are not re-elected.
Interested Trustee
Craig T. Callahan, 65, Chairman of the Board. Dr. Callahan has been a Trustee of the Funds since their inception. Dr. Callahan also serves as Chief Executive Officer (2013 to present); and Chairman of the Investment Committee (2005 to present) and served as the Chief Investment Officer (1991 to 2004) and President (2008 to 2013 and 2014 to present) of ICON Advisers. Dr. Callahan is also Executive Vice President (2005 to present); Director (1991 to present); and was previously President (1998 to 2005) and Chief Compliance Officer (2005) of IDI. Dr. Callahan also serves as the President (1998 to present) and Chairman of the Board of Directors (1994 to present) of ICON Management & Research Corporation (“IM&R”), the parent company of ICON Advisers and IDI.
Independent Trustees
Glen F. Bergert, 66, Mr. Bergert has been a Trustee of the Funds since 1999. Mr. Bergert is President of Venture Capital Management LLC (1997 to present), General Partner of SOGNO Partners LP, a venture capital company (2001 to 2015), General Partner of Bergert Properties, LLP, a real estate holding company (1997 to present), General Partner of Pyramid Real Estate Partnership, a real estate development company (1998 to present), General Partner of Chamois Partners, LP, a venture capital company (2004 to present) and was previously a General Partner with KPMG Peat Marwick, LLP (1979 to 1997). Mr. Bergert is also a Director of Delta Dental of California, an insurance company (2013 to present and 2006 to 2012), Delta Dental of Pennsylvania, an insurance company (1998 to 2009 and 2010 to present), Dentegra Group, Inc, an insurance holding company (2010 to 2014) and Delta Reinsurance Corporation (2015 to present; 2011 to 2014 and 2000 to 2009).
John C. Pomeroy, Jr., 69. Mr. Pomeroy has been a Trustee of the Funds since November 2002. Mr. Pomeroy is Chief Investment Officer and Director of Investments, Pennsylvania State University (2001 to present) and was Portfolio Manager and Product Manager, Trinity Investment Management Corporation (1989 to 2001).
R. Michael Sentel, 68. Mr. Sentel has been a Trustee of the Funds since their inception. Mr. Sentel is a Senior Attorney with the U.S. Department of Education (1996 to present). Mr. Sentel also provides legal representation as a sole practitioner with an emphasis on corporate and transactional law. He served as general counsel to numerous public companies and served on the board of directors of one of these clients. Mr. Sentel began his legal career with the U.S. Securities and Exchange Commission’s Division of Enforcement and served as a Branch Chief (1980 to 1981). Later he served as the Section Chief for the Professional Liability Section of the Federal Deposit Insurance Corp. with responsibility for the Rocky Mountain Region (1991 to 1994).
The Officers of the Funds are:
Craig T. Callahan, 65, Chairman of the Board. Dr. Callahan has been a Trustee of the Funds since their inception. Dr. Callahan also serves as Chief Executive Officer (2013 to present); President (1998 to 2013 and 2014 to present) and Chairman of the Investment Committee (2005 to present) and served as the Chief Investment Officer (1991 to 2004) of ICON Advisers. Dr. Callahan is also Executive Vice President (2005 to present); Director (1991 to present); and was previously President (1998 to 2005) and Chief Compliance Officer (2005) of IDI. Dr. Callahan also serves as the President (1998 to present) and Chairman of the Board of Directors (1994 to present) of IM&R, the parent company of ICON Advisers and IDI.
Donald Salcito, 63. Mr. Salcito serves as Vice President and Secretary of the Funds (November 15, 2006 to present). Mr. Salcito is also Executive Vice President and General Counsel (September 2005 to present) of ICON Advisers; Director of IM&R (2005 to present); Executive Vice President, Secretary, General Counsel of IDI (2005 to present). Previously, he was a Partner in various national law firms, practicing in the securities law area. (1980 to 2005).
Carrie M. Schoffman, 43. Ms. Schoffman has been a Vice President and Principal Financial Officer/Treasurer of the Funds since June 2013. Ms. Schoffman is also Chief Compliance Officer (2013 to present and 2004 to 2008) and Anti-Money Laundering Officer (2013 to present) of the ICON Funds. She is Senior Vice President (2011 to present) and Chief Compliance Officer (2013 to present and 2004 to 2011) of ICON Advisers. Previously, she was a Staff Accountant with the Securities and Exchange Commission (2003 to 2004) and also an Experienced Manager (2001 to 2003) and a Senior Associate/Associate (1996 to 2001) at PricewaterhouseCoopers LLP.
Lesley Caviness, 50. Ms. Caviness serves as Assistant Treasurer of the Funds (2014 to present). She has worked at ICON (2007 to 2008 and 2010 to present) in fund accounting, compliance, business intelligence and performance capacities. Prior to working at ICON, Ms. Caviness was a Real Estate Broker at Seasons Real Estate Group (2008 to 2012) and Signature Real Estate (2014 to present), Finance Manager at Navigant (2000 to 2007), and Associate/Senior Associate (1996 to 2000) at PricewaterhouseCoopers LLP.
| | |
| ICON Diversified Funds | | Additional Information |
| | September 30, 2016 (Unaudited) |
Renewal of Investment Advisory Agreement
On August 22, 2016, the Board of Trustees, including all of the Trustees that are not “interested persons” of the Trust (the “Independent Trustees”), approved continuation of the Advisory Agreements (as defined below) with the Adviser for each Fund for an additional one-year term commencing October 1, 2016.
In determining to renew the investment advisory agreements between ICON Funds (the “Trust”) and ICON Advisers, Inc. (“ICON” or the “Adviser”) the Trustees requested, were provided with and reviewed data with respect to the Adviser, its personnel, and the services provided and to be provided to each Fund by the Adviser under the Trust’s Investment Advisory Agreement dated October 9, 1996, as amended (related to the Sector Funds, the International Funds and ICON Fund) and under the Trust’s Investment Advisory Agreement dated July 9, 2002 and effective October 1, 2002, as amended (related to the U.S. Diversified Funds — Bond, Risk-Managed Balanced, Equity Income, Opportunities and Long/Short Funds) (collectively, the “Advisory Agreements”).
The Trustees agreed that consideration of the Advisory Agreements should also include consideration of other agreements between the Adviser and the Trust that impact provisions of the Advisory Agreements, including expense limitation agreements as amended effective April 11, 2016. The Trustees were provided with and reviewed data with respect to the Adviser, its personnel, and the services provided and to be provided to each Fund by the Adviser under the Trust’s Advisory Agreements, Administrative Services Agreement and Expense Limitation Agreement and the Distribution Agreement with ICON Distributors, Inc. (“IDI”). The data included information concerning advisory, distribution and administrative services provided to the Funds by ICON and its related companies; information concerning other businesses of those companies; and comparative data obtained from Strategic Insight (“SI”) related to Fund performance and Fund expenses (the “SI Report”).
The Board convened a meeting with SI on August 10, 2016 to discuss the SI Report and the information contained within the SI Report. Kevin Shine, Senior Managing Director, U.S. Research & Advisory of SI, Alana Burke, Vice President, Corporate Accounts and Joe Frelix, project manager on the15(c) report, discussed the findings of the SI Report with the Independent Trustees. Management personnel participated in the SI meeting convened to discuss the data for and with the Board. At the meeting, SI discussed its methodology, peer selection and the difficulty with some sector funds, expenses and fees, and performance relative to the respective Fund’s peers. SI also discussed the Funds size and how a respective Fund’s size would affect economies of scale, in particular, operating expenses. In addition, the Trustees asked SI for a Mutual Fund Administration Analysis (the “SI Admin Analysis”). Mr. Shine walked the Trustees through the SI Admin Analysis.
Also included in the 15(c) discussion was a briefing on factors affecting the ICON investment model; expenses and expense ratios of each Fund and other ICON managed products; relative performance of each Fund; status of expense reimbursements to the Funds by the Adviser; sales and marketing initiatives; specific business factors affecting IDI; the work load on ICON as adviser and administrator to the Funds; current profitability of ICON; staffing levels and staff morale.
The Independent Trustees were represented by independent legal counsel in this process. In August 2016, after participating in the meeting with SI and management, the Independent Trustees met separately as a group in private sessions with their independent legal counsel to review and discuss the foregoing information. Based on these discussions, independent legal counsel and/or the Lead Independent Trustee also contacted management to request additional information from SI. The Board received materials from independent legal counsel discussing the legal standards applicable to their consideration of the ICON-Trust agreements.
In considering the nature, extent and quality of the services provided by the Adviser, the Board reviewed information relating to ICON’s operations and personnel. Among other things, the Adviser provided biographical information on its professional staff and descriptions of its organizational and management structure. In the course of their deliberations the Board evaluated, among other things, information relating to the investment philosophy, strategies and techniques used in managing each Fund, the qualifications and experience of ICON’s investment personnel, ICON’s compliance programs, ICON’s brokerage practices, including the extent to which the Adviser obtains research through “soft dollar” arrangements with the Funds’ brokerage, compliance reports on the foregoing, and the financial and non-financial resources available to provide services required under the Advisory Agreement.
During the discussion, the SI Report and the SI Admin Analysis were discussed and management personnel showed performance for each Fund and discussed the factors affecting performance. The Board inquired from SI whether there was any correlation between fund expenses and performance, and SI saw no direct correlation with the ICON Funds other than the obvious observation that higher expenses reduce performance.
During the discussion on performance, management personnel noted that 2015 was very difficult for active managers. Unlike indexes, ICON is an active manager that is willing to look different from an index.
Management elaborated further on performance. For the one year ended May 31, 2014, only three of ICON’s funds beat their respective benchmarks: Consumer Staples, Information Technology, and Long/Short. For the one year ended June 30, 2016, four of the ICON funds beat their respective benchmarks: Emerging Markets, International Equity, Information Technology, and Utilities. However, on a one year basis, eight are in
| | |
| |
| Annual Report | September 30, 2016 | | 77 |
| | |
| ICON Diversified Funds | | Additional Information |
| | September 30, 2016 (Unaudited) |
the top third of their peer groups of which six of those eight are in the top quartile. The low point in the S & P 1500 Index was February 11, 2016. Since February 11 until July, 2016, ICON performed better than the indexes, as seven of the 12 domestic equity funds beat their respective indexes. Also during that same time period, the equity portion of the ICON Equity Income Fund beat the S&P 1500 Index. Five of the nine ICON Sector Funds beat their index for that same period.
Management noted that Advisers’ performance relative to other valuation managers as judged by the AthenaInvest system is above the medium. SI also noted that from a performance point of view, the Funds in the SI Report are compared using the Morningstar data, and there is no Morningstar category for “all cap” funds, but all ICON Funds are improving.
The Board addressed style consistency with the Adviser. Management advised that, based on the Adviser’s own analysis, and with the restructuring of the Adviser, the Adviser has continued an additional level of review on the Portfolio Managers (“PMs”) to make sure they are adhering to the ICON System; the Senior Vice President of Fund Management has been systematically tracking the Funds’ performance; he evaluates each of the ICON Funds to help ensure all PMs are investing consistently and in accordance with the ICON System by evaluating the Funds from an attribution perspective in monthly meetings.
In connection with reviewing data bearing upon the nature, quality, and extent of services furnished by ICON to each Fund, the Board assessed data concerning ICON’s staffing, systems and facilities. The Board also assessed ICON’s non-Trust business to see if there are any initiatives that would dilute service to the Trust. The Board concluded:
| | A. | That the breadth and the quality of investment advisory and other services being provided to each Fund is satisfactory, as evidenced in part by efforts to address and improve the performance record of each Fund when compared with the performance records of a peer group of comparable funds and markets in general; |
| | B. | That the breadth and the quality of investment advisory and other services being provided to each Fund are satisfactory, the Adviser’s performance is competitive with other fund managers in the value style group, and the Adviser has applied a disciplined approach in the style specified in the Funds’ offering document; |
| | C. | That ICON has made significant expenditures in the past year and in prior years to ensure that it has reasonably sophisticated systems and the highly trained personnel necessary for it to be able to continue to provide quality service to the Funds’ shareholders, including the dedication of substantial resources to ICON’s investment and methodology; |
| | D. | That the Board, after considering compliance reports and compliance initiatives undertaken during the year and conducting individual interviews with selected PMs, is satisfied with the research and portfolio management, that research and portfolio management is being constantly evaluated and improved upon; and that the PMs are evaluating trading services systematically, the Board concluded that the Adviser is providing the Funds with professional management of the nature, quality and scope required by the Funds; and |
| | E. | The risks assumed by ICON in providing investment advisory services to each Fund, including the capital commitments which have been made in the past and which continue to be made by ICON to ensure the continuation of the highest quality of service to the Trust, is made with the recognition that shareholders may redeem their shares at any time without notice and the Trust’s advisory relationship with ICON may be terminated at any time and must be renewed on an annual basis. |
In considering the reasonableness of the fees paid to the Adviser for managing each Fund, the Board reviewed, among other things, data concerning other funds from the SI Report, financial statements of the Adviser and an analysis of the profitability of the Adviser, and its affiliates, and their relationship with each Fund over various time periods, and the SI Admin Analysis. Such analysis identified all revenues and other benefits received by the Adviser and its affiliates from managing each Fund, the costs associated with providing such services and the resulting profitability to the Adviser and its affiliates and a comparison of similar data from reports filed by publicly traded firms.
The Board assessed actual (net) fees for advisory services and Fund expense ratios under the contractual relationship (the Advisory agreements, the Administration Agreement and the Expense Limitation Agreements) with the Adviser as opposed to the fees specified in the applicable Advisory Agreement and expense ratios without application of the expense limitations and the low cost of the Administration Agreement and concluded that the focus should be on actual expense ratios after application of the Expense Limitation Agreements.
The Board considered the current and anticipated asset levels of each Fund and the contractual commitments of the Adviser to waive fees and pay expenses of the Funds from time to time to limit the total expenses of the Funds. The Board also considered the Adviser’s contractual commitment regarding administration and the fact it would continue to lose money on administration. In this regard the Board discussed asset levels in each Fund covered by the Advisory Agreements. ICON’s ability to provide the services called for under the Advisory Agreements was assessed in light of current and projected asset levels. Fund expenses and expense ratios were also assessed in light of current and projected asset levels. The Board concluded that the Adviser has the resources necessary to provide the services called for under the Advisory Agreements; that profitability to the
| | |
| ICON Diversified Funds | | Additional Information |
| | September 30, 2016 (Unaudited) |
Adviser and its affiliates from their relationship with the Funds, and services provided to the Funds, is not excessive; and that the Adviser is not realizing material benefits from economies of scale that would warrant adjustments to the fees for any Fund at this time. The Board of Trustees concluded that, in light of the nature, extent and quality of the services provided by the Adviser and the levels of profitability associated with providing these services, the fees charged by the Adviser under the Advisory Agreements to each Fund are reasonable.
In connection with assessing data bearing on the fairness of fee arrangements, the Board considered the SI Report and the SI Admin Analysis. It was noted that SI was selected at the May Board meeting to prepare its reports, an extensive analysis of the expense data of other comparable funds; and that Trustee input was solicited and provided in the process. Among other information discussed, it was noted that:
| | A. | the advisory fee structures of the Funds are within the range of funds considered in the comparison with advisory fees and expense ratios of other similarly managed funds as set forth in the comparative data; |
| | B. | ICON has contractually agreed to impose expense limitations on each and every Fund at a cost to ICON; |
| | C. | ICON has contractually committed to break points in its fees so that economies of scale could be realized as a Fund grows in assets, for the benefit of Fund shareholders; |
| | D. | ICON has contractually committed to providing Administration services to the Funds at a cost below the average to its peer group, and within the mutual fund universe of open-end fund managers with less than $10 billion in assets under management, at less than 50% of the fee of those funds, at a loss to ICON. |
The Board also considered the fees charged by the Adviser to other advisory clients as outlined in its Registration Application on Form ADV in connection with assessing data bearing on the fairness of fee arrangements. The Trustees noted that certain ICON institutional/sub-advised type accounts have lower fees than the fees paid by the Funds for a number of reasons, including but not limited to, those clients call for different commitments of time, institutional clients have low and predictable turnover of assets, in competition joint costs are apportioned among paying customers according to elasticity of demand and the Adviser has a limited level of responsibility in sub-managed accounts, or accounts with an investor agent/advisor.
The Board noted that the Funds’ redemptions were similar to industry averages which showed two things: 1) that the Funds’ Performance was not adversely impacting fund redemptions, and 2) that the fees and costs were competitive when compared to size. The Board noted that there are thousands of mutual funds competing; that investors can search and trade funds on the internet or on platforms at very little or no cost; and that if the Adviser were overcharging for its services, the Board would have expected redemptions in excess of industry norms.
The Board concluded that the Adviser is providing the Funds with professional management at a fair, reasonable and competitive price.
In connection with assessing the direct and indirect benefits to ICON from serving as the Funds’ adviser, the Board discussed services provided under the Distribution Agreement and the Administrative Services Agreement which are in addition to services under the Advisory Agreements. It was noted that IDI does not charge a fee to the Funds for its services and that ICON’s fee for administrative services ICON appears from the SI Admin Analysis to be below the average to its peer group, and within the mutual fund universe of open-end fund managers with less than $10 billion in assets under management, at less than 50% of the fee of those funds, at a loss to ICON. The Board noted that ICON receives research assistance (primarily in the form of data) from the use of soft dollars generated from Fund portfolio transactions; that such research assists ICON in providing quality advisory services; that Trust and Adviser compliance personnel continuously evaluate and report on the soft-dollar arrangements and related costs; and the Board concluded that the arrangements are consistent with Fund brokerage practices and benefit the Funds and their shareholders.
Based on these considerations, the Board, including all of the Independent Trustees, concluded that: 1) the continuation of the Advisory Agreements was in the best interests of each Fund and its shareholders, 2) the services to be performed under the Advisory Agreements were required for the operation of the Funds, 3) the advisory services were satisfactory to the Funds in the past, and 4) the fees for the advisory services and other benefits from the relationship with the Trust received by ICON, and its affiliates, were consistent with fees paid by similar funds and other clients of ICON, and were reasonable in light of the comparative data, and within the range of what would have been negotiated at arm’s length in light of all the circumstances.
| | |
| |
| Annual Report | September 30, 2016 | | 79 |
| | |
| ICON Diversified Funds | | Additional Information |
| | September 30, 2016 (Unaudited) |
Supplemental Tax Information
Pursuant to Section 852(b)(3) of the Internal Revenue Code the following Fund designates the amount listed below as long-term capital gain dividends:
| | | | |
Opportunities Fund | | $ | 10,170 | |
The following Funds designate the percentages listed below of the income dividends distributed in 2015 as qualified dividend income (QDI) as defined in Section 1(h)(11) of the Internal Revenue Code:
| | | | |
Bond Fund | | | 3.03% | |
Equity Income Fund | | | 84.84% | |
Risk-Managed Balanced Fund | | | 90.87% | |
The following Funds designate the percentages listed below of the income dividends distributed in 2015 as qualifying for the corporate dividends received deduction (DRD) as defined in Section 854(b)(2) of the Internal Revenue Code:
| | | | |
ICON Equity Income Fund | | | 74.17% | |
ICON Risk-Managed Balanced Fund | | | 81.70% | |
Portfolio Holdings
Information related to the 10 largest portfolio holdings of each Fund is made available at www.iconfunds.com within approximately 10 business days after month-end. Additionally, a complete list of each Fund’s holdings is made available approximately 30 days after month-end. Each ICON Fund also files a complete schedule of portfolio holdings for the first and third quarters of its fiscal year with the Securities and Exchange Commission (the “Commission”) on Form N-Q. The ICON Funds’ Forms N-Q are available at www.sec.gov or may be reviewed and copied at the Commission’s Public Reference Room in Washington, DC. Information about the Public Reference Room may be obtained by calling 1-800-SEC-0330.
Proxy Voting
A summarized description of the policies and procedures the ICON Funds use to vote proxies is available free of charge at www.iconfunds.com or by calling 1-800-764-0442.
Information about how the ICON Funds voted proxies related to each Fund’s portfolio securities during the 12-month period ended June 30 is available free of charge at www.iconfunds.com or on the Commission’s website at www.sec.gov.
For More Information
This report is for the general information of the Funds’ shareholders and is not authorized for distribution to prospective investors unless preceded or accompanied by a current prospectus. You may obtain a copy of the prospectus, which contains information about the investment objectives, risks, charges, expenses, and share classes of each ICON Fund, by visiting www.iconfunds.com or by calling 1-800-764-0442. Please read the prospectus carefully before investing.
ICON Distributors, Inc., Distributor.
| | |
| ICON Diversified Funds | | Privacy Policy |
| | September 30, 2016 (Unaudited) |
| | |
| FACTS | | WHAT DOES ICON DO WITH YOUR PERSONAL INFORMATION? |
Why? | | Financial companies choose how they share your personal information. Federal law gives consumers the right to limit some but not all sharing. Federal law also requires us to tell you how we collect, share, and protect your personal information. |
| | | Please read this notice carefully to understand what we do. |
What? | | The types of personal information we collect and share depend on the product or service you have with us. This information can include: |
| |
| | • Social Security number and account balances • income and transaction history • checking account information and wire transfer instructions |
| |
| | | When you are no longer our customer, we continue to share your information as described in this notice. |
How? | | All financial companies need to share customers’ personal information to run their everyday business. In the section below, we list the reasons financial companies can share their customers’ personal information; the reasons ICON chooses to share; and whether you can limit this sharing. |
| | | | | | | | |
| | | Reasons we can share your personal information | | | | Does ICON share? | | Can you limit this sharing? |
| | | For our everyday business purposes — such as to process your transactions, maintain your account(s), respond to court orders and legal investigations, or report to credit bureaus | | | | Yes | | No |
| | | For our marketing purposes — to offer our products and services to you | | | | No | | We don’t share |
| | | For joint marketing with other financial companies | | | | No | | We don’t share |
| | | For our affiliates’ everyday business purposes — information about your transactions and experiences | | | | No | | We don’t share |
| | | For our affiliates’ everyday business purposes — information about your creditworthiness | | | | No | | We don’t share |
| | | For nonaffiliates to market to you | | | | No | | We don’t share |
| | |
Questions? | | Call 1-800-764-0442 for the ICON Funds and 1-800-828-4881 for ICON Advisers, Inc. and ICON Distributors, Inc. |
| | |
| |
| Annual Report | September 30, 2016 | | 81 |
| | |
| ICON Diversified Funds | | Privacy Policy |
| | September 30, 2016 (Unaudited) |
| | |
Who We Are | | |
Who is providing this notice? | | ICON Funds, ICON Advisers, Inc., and ICON Distributors, Inc. (collectively “ICON”) |
What We Do | | |
How does ICON protect my personal information? | | To protect your personal information from unauthorized access and use, we use security measures that comply with federal law. These measures include computer safeguards and secured files and buildings. Contracts with our service providers require them to restrict access to your non-public personal information, and to maintain physical, electronic and procedural safeguards against unintended disclosure. |
How does ICON collect my personal information? | | We collect your personal information, for example, when you • open an account or enter into an investment advisory contract • provide account information or give us your contact information • make a wire transfer We also collect your personal information from others, such as credit bureaus, affiliates, or other companies. |
Why can’t I limit all sharing? | | Federal law gives you the right to limit only • sharing for affiliates’ everyday business purposes — information about your creditworthiness • affiliates from using your information to market to you • sharing for nonaffiliates to market to you State laws and individual companies may give you additional rights to limit sharing. |
Definitions | | |
Affiliates | | Companies related by common ownership or control. They can be financial and nonfinancial companies. • Our affiliates include financial companies such as ICON Funds, ICON Advisers, Inc., and ICON Distributors, Inc. |
Nonaffiliates | | Companies not related by common ownership or control. They can be financial and nonfinancial companies. • Nonaffiliates we share with can include financial companies such as custodians, transfer agents, registered representatives, financial advisers and nonfinancial companies such as fulfillment, proxy voting, and class action service providers |
Joint marketing | | A formal agreement between nonaffiliated financial companies that together market financial products or services to you. • ICON doesn’t jointly market |
Page Intentionally Left Blank

For more information about the ICON Funds, contact us:
| | | | |
By Telephone | | 1-800-764-0442 |
By E-Mail | | info@iconadvisers.com |
By Mail | | ICON Funds | P.O. Box 1920 | Denver, CO 80201 |
In Person | | ICON Funds | 5299 DTC Boulevard, 12th Floor |
| | Greenwood Village, CO 80111 |
On the Internet | | www.iconfunds.com |


ANNUAL REPORT
September 30, 2016

International Funds
ICON Emerging Markets Fund
ICON International Equity Fund

You can now sign up for electronic delivery of ICON Fund shareholder reports, including prospectuses, annual reports, semiannual reports and proxy statements.
When these materials are available, you will receive an email from ICON with instructions on how to view the documents. Statements, transaction confirmations and other documents that are not available online will continue to be sent to you by U.S. mail.
Visit ICON’s website at www.iconfunds.com to learn more and sign up.
You may change or cancel your participation in eDelivery by visiting www.iconfunds.com, or you can request a hard copy of any of the materials free of charge by calling ICON Funds at 1-800-764-0442.
| | |
1-800-764-0442 | | • www.iconfunds.com |
TABLE OF CONTENTS
| | |
| ICON International Funds | | About This Report |
| | September 30, 2016 (Unaudited) |
Historical Returns
All total returns mentioned in this Report account for the change in a Fund’s per-share price and the reinvestment of any dividends, capital gain distributions and adjustments for financial statement purposes. If your account is set up to receive Fund distributions in cash rather than to reinvest them, your actual return may differ from these figures. The Funds’ performance results do not reflect the deduction of taxes that a shareholder would pay on Fund distributions or on the redemption of Fund shares. The Adviser may have reimbursed certain fees or expenses of some of the Funds. If not for these reimbursements, performance would have been lower. Fund results shown, unless otherwise indicated, are at net asset value. If a sales charge (maximum 5.75%) had been deducted, results would have been lower.
Past performance does not guarantee future results. Investment return and principal value will fluctuate so that an investor’s shares, when redeemed, may be worth more or less than their original cost. Performance results represent past performance, and current performance may be higher or lower. Please call 1-800-764-0442 or visit www.iconfunds.com for performance results current to the most recent month-end.
Portfolio Data
This Report reflects ICON’s portfolio holdings as of September 30, 2016, the end of the reporting period. The information is not a complete analysis of every aspect of any sector, industry, security or the Funds.
There are risks associated with mutual fund investing, including the loss of principal. The likelihood of loss may be greater if you invest for a shorter period of time. There is no assurance that the investment process will consistently lead to successful results.
An investment in a region fund may involve greater risk and volatility than a diversified fund. An investment concentrated in sectors and industries may involve greater risk and volatility than a more diversified investment.
Investments in foreign securities may entail unique risks, including political, market, and currency risks. Financial statements of foreign companies are governed by different accounting, auditing, and financial standards than U.S. companies and may be less transparent and uniform than in the United States. Many corporate governance standards, which help ensure the integrity of public information in the United States, do not exist in foreign countries. In general, there may be less governmental supervision of foreign stock exchanges and securities brokers and issuers. The ICON system relies on the integrity of the financial statements released to the market as part of our analysis.
The prospectus and statement of additional information contain this and other information about the Funds and are available by visiting www.iconfunds.com or calling 1-800-764-0442. Please read the prospectus and statement of additional information carefully.
Financial Intermediary
If you purchase the Fund through a broker-dealer or other financial intermediary (such as a bank), the Fund and its related companies may pay the intermediary for the sale of Fund shares and related services. These payments may influence the broker-dealer or other intermediary and your salesperson to recommend the Fund over another investment. Ask your salesperson or visit your financial intermediary’s website for more information.
| | |
The accompanying notes are an integral part of the financial statements. |
| 2 | | www.iconfunds.com |
| | |
| ICON Emerging Markets Fund | | Management Overview |
| | September 30, 2016 (Unaudited) |
| Q. | How did the Fund perform relative to its benchmark? |
| A. | The ICON Emerging Markets Fund (the Fund) Class S returned 10.27% for the fiscal year ended September 30, 2016, while its benchmark, the MSCI Emerging Markets Index, returned 17.21%. Total returns for other periods and additional Class shares as of September 30, 2016, appear in the subsequent pages of this Fund’s Management Overview. |
| Q. | What primary factors were behind the Fund’s relative performance? |
| A. | After the previous fiscal year’s losses, the emerging markets benchmark experienced a strong reversal and ended the fiscal year 2016 with gains. It appears that investor sentiment on emerging markets improved as perceptions of attractive valuations and stronger earnings and economic growth led investors to this space and away from less enticing countries in the developed world. Despite slower overall global growth, emerging market countries managed to outpace their developed market peers as emerging markets credit spreads underwent a widespread contraction, bolstering equity risk sentiment. Brazil led the way, reversing 3 years of losses as its president was impeached on corruption charges and stocks in the natural resources segment of the market recovered. Brazil was not alone as the boom in natural resources stocks helped many other countries in the Asia-Pacific region as well. Similarly, global strength in the Information Technology sector benefitted the emerging markets given their high exposure to the sector, particularly in countries in the Asia-Pacific. Global concerns, such as worry over the Chinese economy and its currency volatility as well as uncertainty regarding future U.S. interest rate policy, impacted the emerging markets. However, despite these headwinds, interest rates generally remained low and monetary policy continued to be accommodative globally which has ultimately provided a supportive backdrop for emerging markets. |
| | At the beginning of the fiscal year, our overall average value-to-price (V/P) ratio for emerging markets stood at 0.89, indicating that, on average, emerging markets stocks were overpriced according to our system. Given this relatively low V/P ratio, the Fund took a more defensive stance including an increased allocation to cash given the over-priced conditions. The Fund’s cash holdings helped early in the fiscal year as stocks moved lower. However, as stock prices reversed and climbed higher during the fiscal year, our V/P readings were slower to improve and we continued to hold some cash, which proved to be a drag on performance. From a regional perspective, our valuation model pointed the Fund towards countries in the Asia-Pacific region and away from Latin American and European countries. Throughout the year, many countries, sectors, and individual stocks that looked relatively expensive or over-priced according to our valuation metrics outperformed those that our system indicated were better bargains. Despite the ongoing issues looming over the world economy as well as rotations within the Fund that may have seemed contrarian at times, our discipline and focus on value guided our decisions, which we believe will benefit the Fund going forward. |
| Q. | How did the Fund’s composition affect performance? |
| A. | The Fund’s primary contributors to benchmark relative performance came from the traditional economically defensive sectors of Consumer Staples, Utilities, and Telecommunication Services. Specifically, overweight positions in the Personal Products industry within the Consumer Staples sector and the Wireless Telecommunications industry within the Telecommunication Services sector contributed to positive performance relative to the benchmark. Conversely, the Materials sector was a detractor, as the Fund’s underweight position in the outperforming Steel industry and overweight position in the underperforming Paper Products industry hindered the Fund’s relative returns versus the benchmark. The Fund’s overweight positions in the Health Care and Industrials sectors also detracted from returns as these two sectors lagged the benchmark for the period. Further, as discussed above, with our valuation system showing overvalued conditions for much of the year, the Fund’s defensive cash position was detrimental to returns as the emerging markets benchmark experienced gains over the year. The Fund did not employ currency hedging during the period. |
While all geographic regions saw gains over the period, there were areas of clear differentiation among certain countries throughout the year. At the country level, China, Thailand, and India were the biggest contributors to relative performance as strong stock selection within these countries proved beneficial. Despite showing the least value according to our system, Western Hemisphere equities had the highest returns, with Brazil being a notable standout. Unfortunately, our value readings for Brazil showed less upside relative to other countries and the Fund maintained an underweight position there which ultimately detracted from relative performance. While South Korea performed well as a country, the Fund’s stock selection within the country detracted from benchmark relative performance as well.
| Q. | What is your investment outlook for emerging markets? |
| A. | At the end of fiscal year 2016, our overall average V/P ratio for emerging markets was 1.09, indicating that, on average, there is 9% upside to fair value for emerging markets equities according to our system. Despite the rally the emerging markets have experienced over the past year, we still see opportunities in this space as earnings and economic growth in the emerging market countries remain more robust than the developed world. While worries persist about the pace of global growth and the prospect of the U.S. tightening its monetary policy, global monetary policy remains accommodative and corporate earnings are forecasted to continue to grow. |
According to our system, we see the best bargains in the Asia-Pacific regions, specifically in countries like Thailand, Philippines, and South Korea. The Western Hemisphere and Europe regions show the least upside according to our system as countries like Greece, Poland, Peru, and Turkey look relatively less attractive. From a sector perspective, the Financial, Utilities, and Information Technology sectors are showing the most value in our models. Guided by our disciplined, systematic and non-emotional approach to investing, we remain ready to reallocate and adapt as our investment system dictates.
| | |
| |
| Annual Report | September 30, 2016 | | 3 |
| | |
| ICON Emerging Markets Fund | | Management Overview |
| | September 30, 2016 (Unaudited) |
Average Annual Total Return (as of September 30, 2016)
| | | | | | | | | | | | | | | | | | | | | | | | | | | | |
| | | Inception Date | | | 1 Year | | | 5 Years | | | 10 Years | | | Since Inception | | | Gross Expense
Ratio* | | | Net Expense
Ratio* | |
ICON Emerging Markets Fund - Class S | | | 2/25/97 | | | | 10.27 | % | | | 7.42 | % | | | 2.88 | % | | | 2.96 | % | | | 2.44 | % | | | 1.55 | % |
ICON Emerging Markets Fund - Class C | | | 1/25/08 | | | | 9.11 | % | | | 6.34 | % | | | N/A | | | | 0.02 | % | | | 5.11 | % | | | 2.55 | % |
ICON Emerging Markets Fund - Class A | | | 5/31/06 | | | | 9.99 | % | | | 7.19 | % | | | 2.63 | % | | | 2.27 | % | | | 4.75 | % | | | 1.80 | % |
ICON Emerging Markets Fund - Class A (including maximum sales charge of 5.75%) | | | 5/31/06 | | | | 3.65 | % | | | 5.92 | % | | | 2.03 | % | | | 1.69 | % | | | 4.75 | % | | | 1.80 | % |
MSCI Emerging Markets Index | | | | | | | 17.21 | % | | | 3.39 | % | | | 4.28 | % | | | 5.72 | % | | | N/A | | | | N/A | |
Past performance is not a guarantee of future results. Information about these performance results and the comparative indexes can be found in the About This Report section. The Fund’s name and investment strategy changed effective May 5, 2014. The Fund’s past performance would have been different if the current strategy had been in effect. The Adviser has agreed to limit certain Fund expenses; without these limitations, returns would have been lower. The limitation provisions may be terminated in the future.
| * | Please see the most recent prospectus for details. |
Class C total returns exclude applicable sales charges. If sales charges were included returns would be lower.
Value of a $10,000 Investment (through September 30, 2016)
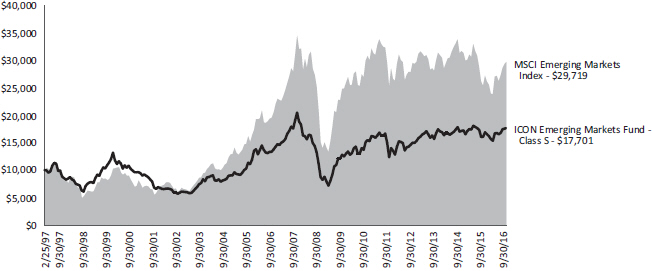
Past performance is not a guarantee of future results. The above graph compares a $10,000 investment made in the Emerging Markets Fund’s Class S shares on the Class’ inception date of 2/25/97 to a $10,000 investment made in an unmanaged securities index on that date. The Fund’s name and investment strategy changed effective May 5, 2014. The Fund’s past performance would have been different if the current strategy had been in effect. Performance for the Emerging Markets Fund’s other share classes will vary due to differences in charges and expenses. The Emerging Markets Fund’s performance in this chart and the performance table assumes the reinvestment of dividends, capital gain distributions and tax return of capital, but does not reflect the deduction of taxes that a shareholder would pay on Fund distributions or on the redemption of Fund shares.
| | |
The accompanying notes are an integral part of the financial statements. |
| 4 | | www.iconfunds.com |
| | |
| ICON Emerging Markets Fund | | Schedule of Investments |
| | | | | | | | |
| | | Shares or Principal
Amount | | | Value | |
Common Stocks (88.42%) | |
Advertising (0.48%) | |
Nasmedia Co., Ltd. | | | 6,835 | | | $ | 265,898 | |
| | | | | | | | |
|
Aerospace & Defense (2.40%) | |
AviChina Industry & Technology Co., Ltd., Class H | | | 460,000 | | | | 312,015 | |
Korea Aerospace Industries, Ltd. | | | 14,800 | | | | 1,031,419 | |
| | | | | | | | |
| | | | | | | 1,343,434 | |
| | | | | | | | |
|
Apparel, Accessories & Luxury Goods (0.50%) | |
Youngone Corp. | | | 8,200 | | | | 276,956 | |
| | | | | | | | |
|
Application Software (1.15%) | |
Com2uSCorp(a) | | | 2,500 | | | | 228,087 | |
Oracle Financial Services Software, Ltd. | | | 8,500 | | | | 412,213 | |
| | | | | | | | |
| | | | | | | 640,300 | |
| | | | | | | | |
|
Auto Parts & Equipment (0.14%) | |
Mahle-Metal Leve S.A.(a) | | | 11,000 | | | | 78,505 | |
| | | | | | | | |
|
Automobile Manufacturers (1.19%) | |
Chongqing Changan Automobile Co., Ltd., Class B | | | 160,000 | | | | 261,277 | |
Dongfeng Motor Group Co., Ltd., Class H | | | 402,000 | | | | 405,396 | |
| | | | | | | | |
| | | | | | | 666,673 | |
| | | | | | | | |
Automotive Retail (0.55%) | |
Super Group, Ltd.(a) | | | 100,000 | | | | 309,492 | |
| | | | | | | | |
|
Building Products (1.83%) | |
China Lesso Group Holdings, Ltd. | | | 552,000 | | | | 377,038 | |
Dynasty Ceramic PCL | | | 1,000,000 | | | | 125,812 | |
LG Hausys, Ltd. | | | 2,700 | | | | 258,942 | |
Sintex Industries, Ltd. | | | 220,402 | | | | 259,999 | |
| | | | | | | | |
| | | | | | | 1,021,791 | |
| | | | | | | | |
|
Cable & Satellite (0.39%) | |
KT Skylife Co., Ltd.(a) | | | 15,000 | | | | 218,900 | |
| | | | | | | | |
|
Casinos & Gaming (0.74%) | |
Kangwon Land, Inc. | | | 11,600 | | | | 414,504 | |
| | | | | | | | |
|
Commodity Chemicals (4.14%) | |
Formosa Plastics Corp. | | | 213,000 | | | | 530,429 | |
LG Chem, Ltd. | | | 2,200 | | | | 486,580 | |
Lotte Chemical Corp. | | | 3,190 | | | | 869,570 | |
PTT Global Chemical PCL(a) | | | 250,000 | | | | 426,134 | |
| | | | | | | | |
| | | | | | | 2,312,713 | |
| | | | | | | | |
| | | | | | | | |
| | | | | | | | |
| | | Shares or Principal
Amount | | | Value | |
Construction & Engineering (1.10%) | |
China Communications Construction Co., Ltd., Class H | | | 280,000 | | | $ | 297,150 | |
China State Construction International Holdings, Ltd. | | | 240,000 | | | | 317,571 | |
| | | | | | | | |
| | | | | | | 614,721 | |
| | | | | | | | |
Construction Materials (2.37%) | |
Anhui Conch Cement Co., Ltd., Class H | | | 302,000 | | | | 834,689 | |
PPC, Ltd. | | | 1,240,000 | | | | 486,930 | |
| | | | | | | | |
| | | | | | | 1,321,619 | |
| | | | | | | | |
Consumer Electronics (0.57%) | |
Skyworth Digital Holdings, Ltd. | | | 440,000 | | | | 319,451 | |
| | | | | | | | |
| | |
Consumer Finance (0.18%) | | | | | | | | |
Credito Real SAB de CV SOFOM ER | | | 60,000 | | | | 103,044 | |
| | | | | | | | |
|
Data Processing & Outsourced Services (1.61%) | |
Cielo S.A. | | | 89,300 | | | | 897,352 | |
| | | | | | | | |
|
Department Stores (1.20%) | |
El Puerto de Liverpool SAB de CV, Class 1(a) | | | 48,000 | | | | 502,533 | |
Grupo Sanborns SAB de CV(a) | | | 150,000 | | | | 169,729 | |
| | | | | | | | |
| | | | | | | 672,262 | |
| | | | | | | | |
Diversified Banks (4.95%) | |
Akbank T.A.S. | | | 160,000 | | | | 428,629 | |
Bank Negara Indonesia Persero Tbk PT | | | 660,000 | | | | 281,552 | |
Bank of China, Ltd., Class H | | | 610,000 | | | | 281,701 | |
Bank Pan Indonesia Tbk PT(a) | | | 2,000,000 | | | | 126,683 | |
China Construction Bank Corp., Class H | | | 720,000 | | | | 540,748 | |
Industrial & Commercial Bank of China, Ltd., Class H | | | 980,000 | | | | 621,977 | |
Shinhan Financial Group Co., Ltd. | | | 13,300 | | | | 487,108 | |
| | | | | | | | |
| | | | | | | 2,768,398 | |
| | | | | | | | |
Diversified Capital Markets (0.89%) | |
China Everbright, Ltd. | | | 240,000 | | | | 494,968 | |
| | | | | | | | |
|
Diversified Real Estate Activities (0.61%) | |
Robinsons Land Corp. | | | 530,000 | | | | 339,183 | |
| | | | | | | | |
|
Diversified Support Services (1.03%) | |
KEPCO Plant Service & Engineering Co., Ltd. | | | 10,900 | | | | 574,035 | |
| | | | | | | | |
| | |
| |
| Annual Report | September 30, 2016 | | 5 |
| | |
| ICON Emerging Markets Fund | | Schedule of Investments |
| | September 30, 2016 |
| | | | | | | | |
| | | Shares or Principal
Amount | | | Value | |
Electric Utilities (0.91%) | |
Korea Electric Power Corp. | | | 10,400 | | | $ | 509,457 | |
| | | | | | | | |
|
Electronic Components (1.65%) | |
Tongda Group Holdings, Ltd. | | | 3,750,000 | | | | 919,786 | |
| | | | | | | | |
|
Electronic Equipment & Instruments (3.38%) | |
Coretronic Corp. | | | 316,000 | | | | 345,050 | |
Flytech Technology Co., Ltd. | | | 114,000 | | | | 395,373 | |
SFA Engineering Corp. | | | 23,400 | | | | 1,149,432 | |
| | | | | | | | |
| | | | | | | 1,889,855 | |
| | | | | | | | |
Electronic Manufacturing Services (0.26%) | |
Inari Amertron Bhd | | | 180,000 | | | | 144,505 | |
| | | | | | | | |
|
Environmental & Facilities Services (0.71%) | |
China Everbright International, Ltd. | | | 330,000 | | | | 395,638 | |
| | | | | | | | |
|
Food Distributors (0.60%) | |
Hyundai Greenfood Co., Ltd. | | | 23,000 | | | | 337,280 | |
| | | | | | | | |
|
Gas Utilities (1.35%) | |
GAIL India, Ltd. | | | 67,000 | | | | 377,916 | |
Infraestructura Energetica Nova SAB de CV | | | 96,000 | | | | 373,954 | |
| | | | | | | | |
| | | | | | | 751,870 | |
| | | | | | | | |
Gold (3.91%) | |
AngloGold Ashanti, Ltd.(a) | | | 34,600 | | | | 552,989 | |
Gold Fields, Ltd. | | | 111,000 | | | | 538,066 | |
Sibanye Gold, Ltd. | | | 156,000 | | | | 554,642 | |
Zijin Mining Group Co., Ltd., Class H | | | 1,680,000 | | | | 538,339 | |
| | | | | | | | |
| | | | | | | 2,184,036 | |
| | | | | | | | |
Health Care Equipment (2.62%) | |
i-SENS, Inc.(a) | | | 23,100 | | | | 667,948 | |
Value Added Technologies Co., Ltd. | | | 23,100 | | | | 793,237 | |
| | | | | | | | |
| | | | | | | 1,461,185 | |
| | | | | | | | |
|
Health Care Facilities (0.93%) | |
Netcare, Ltd. | | | 212,000 | | | | 520,391 | |
| | | | | | | | |
|
Health Care Supplies (0.48%) | |
Kossan Rubber Industries | | | 160,000 | | | | 266,183 | |
| | | | | | | | |
|
Home Entertainment Software (1.56%) | |
NCSoft Corp. | | | 2,500 | | | | 674,377 | |
Neowiz Games Corp.(a) | | | 18,000 | | | | 197,122 | |
| | | | | | | | |
| | | | | | | 871,499 | |
| | | | | | | | |
Home Furnishings (0.86%) | |
Hanssem Co., Ltd. | | | 3,000 | | | | 481,538 | |
| | | | | | | | |
| | | | | | | | |
| | | Shares or Principal
Amount | | | Value | |
Independent Power Producers & Energy Traders (0.36%) | |
China Power International Development, Ltd. | | | 520,000 | | | $ | 201,474 | |
| | | | | | | | |
|
Industrial Conglomerates (1.80%) | |
Beijing Enterprises Holdings, Ltd. | | | 92,000 | | | | 469,500 | |
LG Corp. | | | 9,100 | | | | 537,770 | |
| | | | | | | | |
| | | | | | | 1,007,270 | |
| | | | | | | | |
Integrated Telecommunication Services (1.51%) | | | | | |
Magyar Telekom Telecommunications PLC(a) | | | 514,000 | | | | 844,175 | |
| | | | | | | | |
| |
Internet & Direct Marketing Retail (0.72%) | | | | | |
GS Home Shopping, Inc. | | | 2,700 | | | | 404,043 | |
| | | | | | | | |
| |
Internet Software & Services (1.05%) | | | | | |
Tencent Holdings, Ltd. | | | 21,045 | | | | 585,094 | |
| | | | | | | | |
| |
IT Consulting & Other Services (1.00%) | | | | | |
Infosys, Ltd. | | | 36,000 | | | | 559,881 | |
| | | | | | | | |
|
Life & Health Insurance (0.78%) | |
Hanwha Life Insurance Co., Ltd.(a) | | | 42,500 | | | | 222,863 | |
Samsung Life Insurance Co., Ltd. | | | 2,200 | | | | 211,278 | |
| | | | | | | | |
| | | | | | | 434,141 | |
| | | | | | | | |
Movies & Entertainment (0.85%) | |
Loen Entertainment, Inc.(a) | | | 6,700 | | | | 475,845 | |
| | | | | | | | |
| |
Oil & Gas Exploration & Production (1.93%) | | | | | |
CNOOC, Ltd. | | | 740,000 | | | | 933,520 | |
QGEP Participacoes S.A.(a) | | | 101,900 | | | | 145,699 | |
| | | | | | | | |
| | | | | | | 1,079,219 | |
| | | | | | | | |
Oil & Gas Refining & Marketing (1.79%) | | | | | |
SK Innovation Co., Ltd.(a) | | | 2,000 | | | | 296,334 | |
S-Oil Corp.(a) | | | 9,500 | | | | 705,903 | |
| | | | | | | | |
| | | | | | | 1,002,237 | |
| | | | | | | | |
Oil & Gas Storage & Transportation (0.42%) | | | | | |
Kunlun Energy Co., Ltd. | | | 300,000 | | | | 231,907 | |
| | | | | | | | |
| |
Other Diversified Financial Services (1.30%) | | | | | |
Fubon Financial Holding Co., Ltd. | | | 490,000 | | | | 728,094 | |
| | | | | | | | |
|
Packaged Foods & Meats (1.77%) | |
Grupo Lala SAB de CV | | | 95,000 | | | | 181,281 | |
Maeil Dairy Industry Co., Ltd. | | | 12,600 | | | | 395,167 | |
Orion Corp. | | | 550 | | | | 414,504 | |
| | | | | | | | |
| | | | | | | 990,952 | |
| | | | | | | | |
|
Personal Products (2.22%) | |
Cosmax, Inc. | | | 1,400 | | | | 193,580 | |
| | |
The accompanying notes are an integral part of the financial statements. |
| 6 | | www.iconfunds.com |
| | |
| ICON Emerging Markets Fund | | Schedule of Investments |
| | September 30, 2016 |
| | | | | | | | |
| | | Shares or Principal
Amount | | | Value | |
|
Personal Products (continued) | |
LG Household & Health Care, Ltd. | | | 1,200 | | | $ | 1,044,297 | |
| | | | | | | | |
| | | | | | | 1,237,877 | |
| | | | | | | | |
Pharmaceuticals (3.08%) | |
Caregen Co., Ltd. | | | 4,600 | | | | 429,473 | |
CSPC Pharmaceutical Group, Ltd. | | | 560,000 | | | | 562,233 | |
Granules India, Ltd. | | | 100,000 | | | | 175,211 | |
Sihuan Pharmaceutical Holdings Group, Ltd. | | | 1,193,000 | | | | 262,985 | |
Sino Biopharmaceutical, Ltd. | | | 225,000 | | | | 152,197 | |
Teva Pharmaceutical Industries, Ltd., Sponsored ADR | | | 3,000 | | | | 138,030 | |
| | | | | | | | |
| | | | | | | 1,720,129 | |
| | | | | | | | |
Property & Casualty Insurance (1.69%) | |
Hyundai Marine & Fire Insurance Co., Ltd. | | | 8,000 | | | | 264,115 | |
KB Insurance Co., Ltd. | | | 14,000 | | | | 347,252 | |
Samsung Fire & Marine Insurance Co., Ltd. | | | 1,300 | | | | 331,112 | |
| | | | | | | | |
| | | | | | | 942,479 | |
| | | | | | | | |
Real Estate Development (3.71%) | |
AP Thailand PCL | | | 3,150,000 | | | | 660,999 | |
China Overseas Land & Investment, Ltd. | | | 68,000 | | | | 233,783 | |
China Resources Land, Ltd. | | | 106,000 | | | | 298,857 | |
Filinvest Land, Inc. | | | 7,607,000 | | | | 288,303 | |
Sino-Ocean Group Holding, Ltd. | | | 700,000 | | | | 324,969 | |
Yanlord Land Group, Ltd. | | | 260,000 | | | | 267,433 | |
| | | | | | | | |
| | | | | | | 2,074,344 | |
| | | | | | | | |
|
Real Estate Operating Companies (0.85%) | |
Central Pattana PCL | | | 280,000 | | | | 472,741 | |
| | | | | | | | |
|
Regional Banks (1.66%) | |
BNK Financial Group, Inc. | | | 51,000 | | | | 399,242 | |
DGB Financial Group, Inc. | | | 38,000 | | | | 312,892 | |
Huishang Bank Corp., Ltd., Class H | | | 415,000 | | | | 213,769 | |
| | | | | | | | |
| | | | | | | 925,903 | |
| | | | | | | | |
Reinsurance (0.39%) | |
Korean Reinsurance Co. | | | 20,784 | | | | 220,004 | |
| | | | | | | | |
|
Renewable Electricity (1.49%) | |
Huaneng Renewables Corp., Ltd., Class H | | | 2,370,000 | | | | 833,248 | |
| | | | | | | | |
|
Security & Alarm Services (0.61%) | |
S-1 Corp.(a) | | | 3,700 | | | | 341,832 | |
| | | | | | | | |
| | | | | | | | |
| | | Shares or Principal
Amount | | | Value | |
Semiconductor Equipment (2.26%) | | | | | |
Advanced Process Systems Corp.(a) | | | 16,827 | | | $ | 377,236 | |
Jusung Engineering Co., Ltd.(a) | | | 50,362 | | | | 485,728 | |
Wonik Holdings Co., Ltd.(a) | | | 60,000 | | | | 402,037 | |
| | | | | | | | |
| | | | | | | 1,265,001 | |
| | | | | | | | |
Semiconductors (1.65%) | |
Malaysian Pacific Industries Bhd | | | 139,000 | | | | 262,169 | |
Phison Electronics Corp. | | | 50,000 | | | | 381,857 | |
Taiwan Semiconductor Manufacturing Co., Ltd. | | | 47,000 | | | | 276,273 | |
| | | | | | | | |
| | | | | | | 920,299 | |
| | | | | | | | |
Soft Drinks (0.55%) | |
Arca Continental SAB de CV | | | 52,000 | | | | 309,483 | |
| | | | | | | | |
|
Steel (0.26%) | |
Feng Hsin Steel Co., Ltd. | | | 112,000 | | | | 146,169 | |
| | | | | | | | |
|
Systems Software (1.09%) | |
Asseco Poland S.A. | | | 41,900 | | | | 610,841 | |
| | | | | | | | |
|
Technology Hardware, Storage & Peripherals (1.74%) | |
Samsung Electronics Co., Ltd. | | | 666 | | | | 970,204 | |
| | | | | | | | |
|
Thrifts & Mortgage Finance (0.70%) | |
LIC Housing Finance, Ltd. | | | 44,800 | | | | 390,476 | |
| | | | | | | | |
|
Water Utilities (0.43%) | |
Beijing Enterprises Water Group, Ltd. | | | 352,000 | | | | 239,967 | |
| | | | | | | | |
|
Wireless Telecommunication Services (1.52%) | |
China Mobile, Ltd. | | | 21,000 | | | | 257,972 | |
Intouch Holdings PCL, Class F | | | 50,000 | | | | 78,094 | |
SK Telecom Co., Ltd. | | | 2,500 | | | | 512,602 | |
| | | | | | | | |
| | | | | | | 848,668 | |
| | | | | | | | |
| |
Total Common Stocks
(Cost $48,384,789) | | | | 49,401,419 | |
| | | | | | | | |
|
Short-Term Investments (17.09%) | |
Money Market Funds (5.37%) | | | | | | | | |
State Street Global Advisors Treasury Fund (0.11% 7 Day Yield) | | | 3,000,000 | | | | 3,000,000 | |
| | | | | | | | |
| | |
| |
| Annual Report | September 30, 2016 | | 7 |
| | |
| ICON Emerging Markets Fund | | Schedule of Investments |
| | September 30, 2016 |
| | | | | | | | |
| | | Shares or Principal
Amount | | | Value | |
Time Deposits (11.72%) | | | | | | | | |
State Street Euro Dollar Time Deposit (USD), 0.01%, 10/03/16 | | | 6,548,311 | | | $ | 6,548,311 | |
| | | | | | | | |
| |
Total Short-Term Investments
(Cost $ 9,548,311) | | | | 9,548,311 | |
| | | | | | | | |
| |
Total Investments (105.51%)
(Cost $ 57,933,100) | | | $ | 58,949,730 | |
| | |
Liabilities Less Other Assets (-5.51%) | | | | | | | (3,079,373) | |
| | | | | | | | |
| | |
Net Assets (100.00%) | | | | | | $ | 55,870,357 | |
| | | | | | | | |
| (a) | Non-income producing security. |
ADR - American Depositary Receipt
| | | | |
| Country Composition (September 30, 2016) | |
| |
South Korea | | | 36.18% | |
China | | | 13.59% | |
Hong Kong | | | 8.61% | |
South Africa | | | 5.29% | |
Taiwan | | | 5.02% | |
India | | | 3.90% | |
Thailand | | | 3.16% | |
Mexico | | | 2.92% | |
Brazil | | | 2.01% | |
Hungary | | | 1.51% | |
Philippines | | | 1.13% | |
Poland | | | 1.09% | |
Turkey | | | 0.77% | |
Myanmar | | | 0.73% | |
Indonesia | | | 0.73% | |
Bermuda | | | 0.57% | |
Singapore | | | 0.48% | |
Malaysia | | | 0.48% | |
Israel | | | 0.25% | |
| | | | |
| | | 88.42% | |
| | | | |
Percentages are based upon common stocks as a percentage of net assets.
| | |
The accompanying notes are an integral part of the financial statements. |
| 8 | | www.iconfunds.com |
| | |
| ICON Emerging Markets Fund | | Schedule of Investments |
| | September 30, 2016 |
| | | | |
Sector Composition (September 30, 2016) | |
| |
Information Technology | | | 18.40% | |
Financial | | | 13.15% | |
Materials | | | 10.68% | |
Industrials | | | 9.48% | |
Consumer Discretionary | | | 8.19% | |
Health Care | | | 7.11% | |
Consumer Staples | | | 5.14% | |
Real Estate | | | 4.56% | |
Utilities | | | 4.54% | |
Energy | | | 4.14% | |
Telecommunication Services | | | 3.03% | |
| | | | |
| | | 88.42% | |
| | | | |
Percentages are based upon common stocks as a percentage of net assets.
| | | | |
Industry Composition (September 30, 2016) | |
| |
Diversified Banks | | | 4.95% | |
Commodity Chemicals | | | 4.14% | |
Gold | | | 3.91% | |
Real Estate Development | | | 3.71% | |
Electronic Equipment & Instruments | | | 3.38% | |
Pharmaceuticals | | | 3.08% | |
Health Care Equipment | | | 2.62% | |
Aerospace & Defense | | | 2.40% | |
Construction Materials | | | 2.37% | |
Semiconductor Equipment | | | 2.26% | |
Personal Products | | | 2.22% | |
Oil & Gas Exploration & Production | | | 1.93% | |
Building Products | | | 1.83% | |
Industrial Conglomerates Oil & Gas Refining & Marketing | |
| 1.80%
1.79% |
|
Packaged Foods & Meats | | | 1.77% | |
Technology Hardware, Storage & Peripherals | | | 1.74% | |
Property & Casualty Insurance | | | 1.69% | |
Regional Banks | | | 1.66% | |
Semiconductors | | | 1.65% | |
Electronic Components | | | 1.65% | |
Data Processing & Outsourced Services | | | 1.61% | |
Home Entertainment Software | | | 1.56% | |
Wireless Telecommunication Services | | | 1.52% | |
Integrated Telecommunication Services | | | 1.51% | |
Renewable Electricity | | | 1.49% | |
Gas Utilities | | | 1.35% | |
Other Diversified Financial Services | | | 1.30% | |
Department Stores | | | 1.20% | |
Automobile Manufacturers | | | 1.19% | |
Application Software | | | 1.15% | |
Construction & Engineering | | | 1.10% | |
Systems Software | | | 1.09% | |
Internet Software & Services | | | 1.05% | |
Diversified Support Services | | | 1.03% | |
IT Consulting & Other Services | | | 1.00% | |
Other Industries (each less than 1%) | | | 16.72% | |
| | | | |
| | | 88.42% | |
| | | | |
Percentages are based upon common stocks as a percentage of net assets.
| | |
| |
| Annual Report | September 30, 2016 | | 9 |
| | |
| ICON International Equity Fund | | Management Overview |
| | September 30, 2016 (Unaudited) |
| | Q. | How did the Fund perform relative to its benchmark? |
| | A. | The ICON International Equity Fund (the Fund) Class S returned 5.01% for the fiscal year ended September 30, 2016, while the MSCI All Country World Index ex-United States (ACWI ex-U.S.) returned 9.80%. Total returns for other periods and additional Class shares as of September 30, 2016, appear in the subsequent pages of this Fund’s Management Overview. |
| | Q. | What primary factors were behind the Fund’s relative performance? |
| | A. | We finished fiscal year 2016 with global stock market gains as investors shrugged off worries associated with economic uncertainty and financial volatility and once again returned to buying equities after the prior year’s losses. In Asia, China’s economic growth continued to slow and the Yuan’s devaluation versus the U.S. Dollar persisted throughout the year. Japan remained in a deflationary environment with declining economic growth, causing the Bank of Japan to take further accommodative monetary policy steps to stimulate its ailing economy. Europe generally experienced continued growth, although the year was most notably highlighted by Britain’s vote to leave the European Union, commonly referred to as “Brexit.” While Brexit brought volatility in European markets, it quickly subsided as markets absorbed the worries and continued their march higher. In Latin America, Brazil stood out as a leader despite its President’s impeachment amidst a corruption scandal. While the country still remains in a deep recession, investors turned positive on the country in hopes of a future turnaround. As the period closes, we still see upside in the global markets overall with some regions showing great bargains and others appearing slightly overpriced according to our system. |
At the beginning of the fiscal year, our valuation model signaled a modest 9% upside to fair value for global markets and pointed the Fund towards an overweight position in the cyclical sectors of the market such as the Information Technology and Industrials sectors. From a regional perspective, the Fund began the fiscal year with an overweight position in Europe, but pared that back throughout the year, increasing its allocation to countries in the Asia-Pacific region as their valuations improved. Emerging market equities began as an underweight, yet their exposure was increased throughout the year to an overweight position in the Fund relative to the benchmark as bargains began to emerge after prior periods of overvalued conditions. Despite the ongoing issues looming over the world economy as well as rotations within the Fund that may have seemed contrarian at times, our discipline and focus on value guided our decisions, which we believe will benefit the Fund going forward.
As a multi-cap manager, we are not restricted by market capitalization. However, following our valuation readings led to a concentration in small and mid-cap companies during the period and an underweight position in large-cap stocks relative to the benchmark. Overall, large-cap stocks outperformed their small and mid-cap peers, which detracted from the Fund’s performance relative to the benchmark.
Currency movements worldwide throughout the fiscal year also had a positive impact on the Fund’s returns. The U.S. dollar slightly weakened throughout the year versus most of the underlying currencies of the Fund’s holdings. Currency hedging was utilized for a small part of the fiscal year on the Japanese Yen which proved to be beneficial to the Fund.
| | Q. | How did the Fund’s composition affect performance? |
| | A. | The Fund’s primary contributors to benchmark relative performance came from the Consumer Discretionary and Consumer Staples sectors. Specifically, overweight positions in the Cable & Satellite industry and underweight positions in the Automobile Manufacturers industry within the Consumer Discretionary sector and stock selection in the Personal Products and Packaged Foods & Meats industries within the Consumer Staples Sector contributed to performance relative to the benchmark. Further, an overweight in the Data Processing & Outsourced Services industry within the Information Technology sector proved beneficial. |
Conversely, the Fund’s holdings in the Materials sector detracted from relative performance, as the Gold and Diversified Metals & Mining industries hindered the Fund’s relative returns versus the benchmark. The Industrials sector was another notable source of relative underperformance as the Trading Companies & Distributors and Industrial Machinery industries detracted from the Fund’s returns. Health Care stood out as the worst performing sector over the period as the Pharmaceuticals industry suffered losses and the Fund’s overweight position within this sector ultimately detracted from returns relative to the benchmark. With continued lower, and more recently negative, interest rates globally as well as tighter credit spreads, our valuation methodology is showing us better bargains than we saw at the beginning of the fiscal year.
While all geographic regions saw gains over the period, there were areas of clear differentiation among certain countries throughout the year. Despite showing the most value according to our system, European equities had the lowest returns while regions with lower valuations for much of the year, notably the Western Hemisphere and Asia-Pacific regions, outperformed. Those countries with larger concentrations to natural resources related stocks were standouts, including Brazil, Canada, Australia and Russia. The leadership in the natural resources related sectors resulted in emerging market countries outperforming their developed peers for the period. The Fund’s allocations to developed markets, most notably United Kingdom exposure amidst the Brexit volatility, contributed to underperformance relative to the benchmark for the fiscal year. As the period ended, the emerging markets still showed value across our system, although Europe and other developed markets in general showed more upside globally.
| | |
The accompanying notes are an integral part of the financial statements. |
| 10 | | www.iconfunds.com |
| | |
| ICON International Equity Fund | | Management Overview |
| | September 30, 2016 (Unaudited) |
| | Q. | What is your investment outlook for the international equity market? |
| | A. | Our system estimates that international equities, on average, still remain below our estimate of their intrinsic value. At the end of the period, international markets as a whole had an overall average value-to-price (V/P) ratio of 1.23, implying that, on average, our estimate of fair value for stocks is about 23% higher than where they are currently trading. Risk aversion amongst investors remains and corporate earnings have generally grown, albeit at a slowing pace, despite ongoing economic struggles and geopolitical concerns. While global economic growth has languished outside of the United States, interest rates remain low, thanks in large part to accommodative monetary policy and extraordinary central bank intervention. |
According to our valuation system, Europe represents the best opportunity from a regional perspective, with Western Hemisphere showing the least upside. Dramatic improvements in sentiment and increased valuations according to our system in the emerging market countries led us to an overweight position to select areas. Based on our methodology, developed markets in Europe show attractive upside in countries such as Belgium, Italy, United Kingdom, France, and Germany. As of the end of the fiscal year 2016 we estimate that, on average, fair value for European equities is 22% higher than where prices are currently trading. Within the Western Hemisphere, Canada looks attractive to our system with Thailand, the Philippines, and South Korea currently showing the most value in the Asia- Pacific region.
From a sector perspective, we are still tilted towards the Information Technology and Health Care sectors. Within our system, Energy is the most over-valued sector, and represents an underweight position relative to the benchmark as we see little upside within this sector.
At ICON we continue to seek out industries that our system identifies as trading at a discount to fair value. Guided by our disciplined, systematic and non-emotional approach to investing, we see numerous opportunities amidst the recent turbulence and volatility. We believe it is nearly impossible to accurately time market bottoms and we believe rallies do not offer invitations. Therefore, given our current valuations, we remain almost fully invested. As market conditions dictate, we will adjust accordingly.
| | |
| |
| Annual Report | September 30, 2016 | | 11 |
| | |
| ICON International Equity Fund | | Management Overview |
| | September 30, 2016 (Unaudited) |
| | | | | | | | | | | | | | | | | | | | | | | | | | |
Average Annual Total Return (as of September 30, 2016) | | | | | | | | | | | | | | | | | | | | | |
| | | Inception Date | | 1 Year | | | 5 Years | | | 10 Years | | | Since
Inception | | | Gross Expense
Ratio* | | | Net Expense
Ratio* | |
ICON International Equity Fund — Class S | | 2/18/97 | | | 5.01 | % | | | 5.65 | % | | | -0.03 | % | | | 4.78 | % | | | 1.41 | % | | | 1.41 | % |
ICON International Equity Fund — Class C | | 2/19/04 | | | 3.80 | % | | | 4.49 | % | | | -1.19 | % | | | 2.05 | % | | | 2.96 | % | | | 2.55 | % |
ICON International Equity Fund — Class A | | 5/31/06 | | | 4.63 | % | | | 5.26 | % | | | -0.43 | % | | | -0.49 | % | | | 2.25 | % | | | 1.80 | % |
ICON International Equity Fund — Class A
(including maximum sales charge of 5.75%) | | 5/31/06 | | | -1.42 | % | | | 4.01 | % | | | -1.02 | % | | | -1.06 | % | | | 2.25 | % | | | 1.80 | % |
MSCI ACWI ex-U.S. | | | | | 9.80 | % | | | 6.52 | % | | | 2.63 | % | | | 5.15 | % | | | N/A | | | | N/A | |
Past performance is not a guarantee of future results. Information about these performance results and the comparative indexes can be found in the About This Report section. The Fund’s name and investment strategy changed effective January 29, 2004. The Fund’s past performance would have been different if the current strategy had been in effect. The Adviser has agreed to limit certain Fund expenses; without these limitations, returns would have been lower. The limitation provisions may be terminated in the future.
| * | Please see the most recent prospectus for details. |
Class C total returns exclude applicable sales charges. If sales charges were included returns would be lower.
Value of a $10,000 Investment (through September 30, 2016)
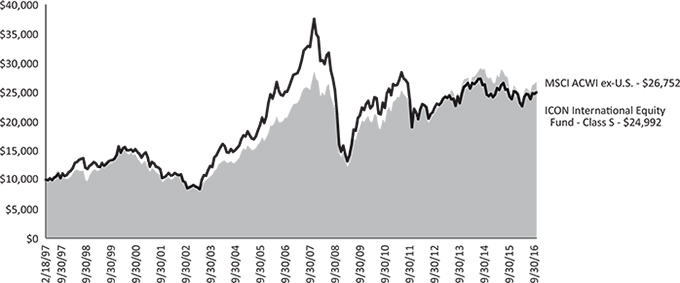
Past performance is not a guarantee of future results. The above graph compares a $10,000 investment made in the International Equity Fund’s Class S shares on the Class’ inception date of 2/18/97 to a $10,000 investment made in an unmanaged securities index on that date. The Fund’s name and investment strategy changed effective January 29, 2004. The Fund’s past performance would have been different if the current strategy had been in effect. Performance for the International Equity Fund’s other share classes will vary due to differences in charges and expenses. The International Equity Fund’s performance in this chart and the performance table assumes the reinvestment of dividends, capital gain distributions and tax return of capital, but does not reflect the deduction of taxes that a shareholder would pay on Fund distributions or on the redemption of Fund shares.
| | |
| ICON International Equity Fund | | Schedule of Investments |
| | September 30, 2016 |
| | | | | | | | |
| | | Shares or Principal
Amount | | | Value | |
Common Stocks (89.44%) | | | | | | | | |
Advertising (0.78%) | | | | | | | | |
Nasmedia Co., Ltd. | | | 2,960 | | | $ | 115,151 | |
Stroeer SE & Co. KGaA (a) | | | 7,400 | | | | 322,144 | |
| | | | | | | | |
| | | | | | | 437,295 | |
| | | | | | | | |
|
Aerospace & Defense (1.28%) | |
Korea Aerospace Industries, Ltd. | | | 8,600 | | | | 599,338 | |
Ultra Electronics Holdings PLC | | | 4,900 | | | | 112,564 | |
| | | | | | | | |
| | | | | | | 711,902 | |
| | | | | | | | |
|
Airlines (0.68%) | |
Japan Airlines Co., Ltd. | | | 12,800 | | | | 376,262 | |
| | | | | | | | |
| | | | | | | | |
|
Apparel, Accessories & Luxury Goods (0.30%) | |
Luxottica Group S.p.A. | | | 3,500 | | | | 167,171 | |
| | | | | | | | |
| | | | | | | | |
|
Application Software (0.73%) | |
Com2uSCorp(b) | | | 1,600 | | | | 145,976 | |
Oracle Financial Services Software, Ltd. | | | 5,400 | | | | 261,876 | |
| | | | | | | | |
| | | | | | | 407,852 | |
| | | | | | | | |
|
Auto Parts & Equipment (0.44%) | |
Mahle-Metal Leve S.A.(b) | | | 5,800 | | | | 41,394 | |
Martinrea International, Inc.(a) | | | 33,000 | | | | 205,000 | |
| | | | | | | | |
| | | | | | | 246,394 | |
| | | | | | | | |
|
Automotive Retail (0.56%) | |
Super Group, Ltd.(b) | | | 100,000 | | | | 309,492 | |
| | | | | | | | |
|
Biotechnology (3.40%) | |
Alexion Pharmaceuticals, Inc.(b) | | | 2,300 | | | | 281,842 | |
Amgen, Inc. | | | 1,700 | | | | 283,577 | |
Bavarian Nordic A/S(a)(b) | | | 7,062 | | | | 267,325 | |
Celgene Corp.(b) | | | 3,500 | | | | 365,855 | |
Shire PLC | | | 5,500 | | | | 355,648 | |
Sirtex Medical, Ltd.(a) | | | 14,000 | | | | 340,323 | |
| | | | | | | | |
| | | | | | | 1,894,570 | |
| | | | | | | | |
|
Brewers (1.55%) | |
Asahi Group Holdings, Ltd.(a) | | | 23,700 | | | | 863,326 | |
| | | | | | | | |
| | | | | | | | |
|
Building Products (0.78%) | |
China Lesso Group Holdings, Ltd. | | | 300,000 | | | | 204,912 | |
Sintex Industries, Ltd. | | | 194,851 | | | | 229,857 | |
| | | | | | | | |
| | | | | | | 434,769 | |
| | | | | | | | |
|
Cable & Satellite (0.84%) | |
Sky PLC | | | 40,600 | | | | 470,559 | |
| | | | | | | | |
| | | | | | | | |
|
Commodity Chemicals (2.62%) | |
Formosa Plastics Corp. | | | 113,000 | | | | 281,401 | |
LG Chem, Ltd. | | | 1,200 | | | | 265,407 | |
Lotte Chemical Corp. | | | 1,600 | | | | 436,148 | |
| | | | | | | | |
| | | Shares or Principal
Amount | | | Value | |
Commodity Chemicals (continued) | | | | | |
PTT Global Chemical PCL(b) | | | 150,000 | | | $ | 255,681 | |
Toray Industries, Inc.(a) | | | 23,000 | | | | 224,008 | |
| | | | | | | | |
| | | | | | | 1,462,645 | |
| | | | | | | | |
|
Communications Equipment (2.15%) | |
ADVA Optical Networking SE(b) | | | 64,200 | | | | 647,514 | |
Telefonaktiebolaget LM Ericsson, Class B | | | 76,000 | | | | 548,741 | |
| | | | | | | | |
| | | | | | | 1,196,255 | |
| | | | | | | | |
|
Construction & Engineering (0.91%) | |
China Communications Construction Co., Ltd., Class H | | | 190,000 | | | | 201,637 | |
China State Construction International Holdings, Ltd. | | | 230,000 | | | | 304,339 | |
| | | | | | | | |
| | | | | | | 505,976 | |
| | | | | | | | |
|
Construction Materials (1.20%) | |
Anhui Conch Cement Co., Ltd., Class H | | | 152,000 | | | | 420,108 | |
PPC, Ltd. | | | 630,000 | | | | 247,392 | |
| | | | | | | | |
| | | | | | | 667,500 | |
| | | | | | | | |
|
Consumer Electronics (0.31%) | |
Skyworth Digital Holdings, Ltd. | | | 240,000 | | | | 174,246 | |
| | | | | | | | |
| | | | | | | | |
|
Consumer Finance (0.36%) | |
Credit Saison Co., Ltd. | | | 12,000 | | | | 199,227 | |
| | | | | | | | |
|
Data Processing & Outsourced Services (2.14%) | |
Cielo S.A. | | | 41,600 | | | | 418,027 | |
Paysafe Group PLC(a)(b) | | | 134,000 | | | | 774,107 | |
| | | | | | | | |
| | | | | | | 1,192,134 | |
| | | | | | | | |
|
Department Stores (0.15%) | |
Grupo Sanborns SAB de CV(b) | | | 75,000 | | | | 84,864 | |
| | | | | | | | |
|
Diversified Banks (1.43%) | |
Akbank T.A.S. | | | 60,000 | | | | 160,736 | |
Bank Negara Indonesia Persero Tbk PT | | | 400,000 | | | | 170,638 | |
Industrial & Commercial Bank of China, Ltd., Class H | | | 300,000 | | | | 190,401 | |
Shinhan Financial Group Co., Ltd. | | | 7,500 | | | | 274,685 | |
| | | | | | | | |
| | | | | | | 796,460 | |
| | | | | | | | |
|
Diversified Real Estate Activities (1.74%) | |
Mitsui Fudosan Co., Ltd. | | | 9,000 | | | | 191,470 | |
Nomura Real Estate Holdings, Inc. | | | 24,600 | | | | 415,823 | |
Patrizia Immobilien AG(b) | | | 8,800 | | | | 192,753 | |
Robinsons Land Corp. | | | 270,000 | | | | 172,791 | |
| | | | | | | | |
| | | | | | | 972,837 | |
| | | | | | | | |
| | |
The accompanying notes are an integral part of the financial statements. |
| Annual Report | September 30, 2016 | | 13 |
| | |
| ICON International Equity Fund | | Schedule of Investments |
| | September 30, 2016 |
| | | | | | | | |
| | | Shares or Principal
Amount | | | Value | |
Diversified Support Services (0.80%) | | | | | |
KEPCO Plant Service & Engineering Co., Ltd. | | | 8,500 | | | $ | 447,642 | |
| | | | | | | | |
|
Drug Retail (0.97%) | |
Ain Holdings, Inc. | | | 4,000 | | | | 272,329 | |
Sundrug Co., Ltd. | | | 3,200 | | | | 268,606 | |
| | | | | | | | |
| | | | | | | 540,935 | |
| | | | | | | | |
Electric Utilities (1.43%) | |
Enel S.p.A. | | | 120,000 | | | | 534,807 | |
Korea Electric Power Corp. | | | 5,400 | | | | 264,526 | |
| | | | | | | | |
| | | | | | | 799,333 | |
| | | | | | | | |
Electronic Components (0.98%) | |
Laird PLC(b) | | | 25,486 | | | | 104,862 | |
Tongda Group Holdings, Ltd. | | | 1,800,000 | | | | 441,497 | |
| | | | | | | | |
| | | | | | | 546,359 | |
| | | | | | | | |
Electronic Equipment & Instruments (2.93%) | |
Hitachi, Ltd. | | | 48,000 | | | | 224,956 | |
Ingenico Group S.A. | | | 8,557 | | | | 748,173 | |
SFA Engineering Corp. | | | 13,500 | | | | 663,134 | |
| | | | | | | | |
| | | | | | | 1,636,263 | |
| | | | | | | | |
Electronic Manufacturing Services (0.22%) | |
Inari Amertron Bhd | | | 150,000 | | | | 120,421 | |
| | | | | | | | |
|
Environmental & Facilities Services (0.56%) | |
China Everbright | | | | | | | | |
International, Ltd. | | | 260,000 | | | | 311,715 | |
| | | | | | | | |
|
Food Distributors (0.76%) | |
Hyundai Greenfood Co., Ltd. | | | 29,000 | | | | 425,266 | |
| | | | | | | | |
|
Food Retail (0.90%) | |
Alimentation Couche-Tard, Inc., Class B | | | 10,400 | | | | 504,007 | |
| | | | | | | | |
|
Gas Utilities (0.78%) | |
GAIL India, Ltd. | | | 36,000 | | | | 203,059 | |
Infraestructura Energetica Nova SAB de CV | | | 60,000 | | | | 233,722 | |
| | | | | | | | |
| | | | | | | 436,781 | |
| | | | | | | | |
Gold (5.45%) | | | | | | | | |
AngloGold Ashanti, Ltd.(b) | | | 21,000 | | | | 335,629 | |
Barrick Gold Corp. | | | 32,600 | | | | 577,231 | |
Gold Fields, Ltd. | | | 67,500 | | | | 327,202 | |
Randgold Resources, Ltd. | | | 5,900 | | | | 591,323 | |
SEMAFO, Inc.(b) | | | 131,000 | | | | 545,188 | |
Sibanye Gold, Ltd. | | | 95,000 | | | | 337,763 | |
Zijin Mining Group Co., Ltd., Class H | | | 1,020,000 | | | | 326,849 | |
| | | | | | | | |
| | | | | | | 3,041,185 | |
| | | | | | | | |
Health Care Equipment (1.05%) | |
Getinge AB, Class B(a) | | | 13,000 | | | | 252,018 | |
i-SENS, Inc.(b) | | | 5,300 | | | | 153,252 | |
| | | | | | | | |
| | | Shares or Principal
Amount | | | Value | |
Health Care Equipment (continued) | | | | | |
Value Added Technologies Co., Ltd. | | | 5,300 | | | $ | 181,998 | |
| | | | | | | | |
| | | | | | | 587,268 | |
| | | | | | | | |
Health Care Facilities (0.84%) | |
Netcare, Ltd. | | | 190,000 | | | | 466,388 | |
| | | | | | | | |
|
Home Entertainment Software (2.26%) | |
Capcom Co., Ltd. | | | 12,900 | | | | 317,378 | |
GungHo Online Entertainment, Inc.(a) | | | 93,000 | | | | 228,520 | |
NCSoft Corp. | | | 1,500 | | | | 404,626 | |
Square Enix Holdings Co., Ltd. | | | 9,000 | | | | 310,348 | |
| | | | | | | | |
| | | | | | | 1,260,872 | |
| | | | | | | | |
Home Furnishings (0.60%) | |
Hanssem Co., Ltd. | | | 2,100 | | | | 337,077 | |
| | | | | | | | |
|
Home Improvement Retail (0.34%) | |
Hornbach Holding AG & Co. KGaA | | | 2,740 | | | | 188,365 | |
| | | | | | | | |
|
Homefurnishing Retail (0.41%) | |
Nitori Holdings Co., Ltd. | | | 1,900 | | | | 227,758 | |
| | | | | | | | |
|
Hotels, Resorts & Cruise Lines (0.65%) | |
TUI AG | | | 25,500 | | | | 363,823 | |
| | | | | | | | |
|
Independent Power Producers & Energy Traders (0.67%) | |
Electric Power Development Co., Ltd.(a) | | | 15,500 | | | | 372,532 | |
| | | | | | | | |
|
Industrial Conglomerates (1.02%) | |
Beijing Enterprises Holdings, Ltd. | | | 38,000 | | | | 193,924 | |
LG Corp. | | | 6,300 | | | | 372,302 | |
| | | | | | | | |
| | | | | | | 566,226 | |
| | | | | | | | |
Integrated Telecommunication Services (2.30%) | |
BT Group PLC | | | 53,000 | | | | 266,660 | |
Deutsche Telekom AG | | | 20,300 | | | | 341,051 | |
Magyar Telekom Telecommunications
PLC(b) | | | 234,000 | | | | 384,313 | |
Telenor ASA | | | 17,000 | | | | 292,330 | |
| | | | | | | | |
| | | | | | | 1,284,354 | |
| | | | | | | | |
Internet & Direct Marketing Retail (0.48%) | |
GS Home Shopping, Inc. | | | 1,800 | | | | 269,362 | |
| | | | | | | | |
|
Internet Software & Services (0.67%) | |
COOKPAD, Inc.(a) | | | 39,000 | | | | 374,539 | |
| | | | | | | | |
|
IT Consulting & Other Services (2.25%) | |
CANCOM SE | | | 5,000 | | | | 261,238 | |
Fujitsu, Ltd. | | | 72,000 | | | | 387,477 | |
GFT Technologies SE | | | 15,200 | | | | 313,256 | |
| | |
The accompanying notes are an integral part of the financial statements. |
| 14 | | www.iconfunds.com |
| | |
| ICON International Equity Fund | | Schedule of Investments |
| | September 30, 2016 |
| | | | | | | | |
| | | Shares or Principal
Amount | | | Value | |
IT Consulting & Other Services (continued) | | | | | | | | |
Infosys, Ltd. | | | 19,000 | | | $ | 295,493 | |
| | | | | | | | |
| | | | | | | 1,257,464 | |
| | | | | | | | |
|
Life & Health Insurance (0.55%) | |
Hanwha Life Insurance Co., Ltd.(b) | | | 29,000 | | | | 152,072 | |
NN Group N.V. | | | 5,000 | | | | 153,502 | |
| | | | | | | | |
| | | | | | | 305,574 | |
| | | | | | | | |
|
Movies & Entertainment (0.45%) | |
Loen Entertainment, Inc.(b) | | | 3,500 | | | | 248,576 | |
| | | | | | | | |
|
Multi-line Insurance (0.96%) | |
Allianz SE | | | 1,200 | | | | 178,332 | |
AXA S.A. | | | 8,400 | | | | 178,603 | |
Talanx AG | | | 5,900 | | | | 180,039 | |
| | | | | | | | |
| | | | | | | 536,974 | |
| | | | | | | | |
|
Multi-Utilities (3.72%) | |
ACEA S.p.A | | | 22,600 | | | | 284,089 | |
Canadian Utilities, Ltd., Class A | | | 19,800 | | | | 558,707 | |
Engie S.A. | | | 34,900 | | | | 541,115 | |
Veolia Environnement S.A. | | | 30,000 | | | | 691,248 | |
| | | | | | | | |
| | | | | | | 2,075,159 | |
| | | | | | | | |
|
Oil & Gas Exploration & Production (0.42%) | |
CNOOC, Ltd. | | | 187,000 | | | | 235,903 | |
| | | | | | | | |
|
Oil & Gas Refining & Marketing (0.97%) | |
SK Innovation Co., Ltd.(b) | | | 1,100 | | | | 162,984 | |
S-Oil Corp.(b) | | | 5,100 | | | | 378,958 | |
| | | | | | | | |
| | | | | | | 541,942 | |
| | | | | | | | |
|
Other Diversified Financial Services (0.90%) | |
Fubon Financial Holding Co., Ltd. | | | 187,000 | | | | 277,864 | |
ORIX Corp. | | | 15,000 | | | | 221,290 | |
| | | | | | | | |
| | | | | | | 499,154 | |
| | | | | | | | |
|
Packaged Foods & Meats (0.77%) | |
Maeil Dairy Industry Co., Ltd. | | | 7,600 | | | | 238,355 | |
Orion Corp. | | | 250 | | | | 188,410 | |
| | | | | | | | |
| | | | | | | 426,765 | |
| | | | | | | | |
|
Paper Products (0.57%) | |
Oji Holdings Corp. | | | 80,000 | | | | 317,083 | |
| | | | | | | | |
|
Personal Products (1.70%) | |
LG Household & Health Care, Ltd. | | | 535 | | | | 465,583 | |
Pola Orbis Holdings, Inc. | | | 5,400 | | | | 483,391 | |
| | | | | | | | |
| | | | | | | 948,974 | |
| | | | | | | | |
|
Pharmaceuticals (8.70%) | |
Bayer AG | | | 4,700 | | | | 472,023 | |
Caregen Co., Ltd. | | | 3,300 | | | | 308,100 | |
Cipla, Ltd. | | | 33,000 | | | | 287,962 | |
CSPC Pharmaceutical Group, Ltd. | | | 310,000 | | | | 311,236 | |
Granules India, Ltd. | | | 60,000 | | | | 105,126 | |
| | | | | | | | |
| | | Shares or Principal
Amount | | | Value | |
Pharmaceuticals (continued) | |
Nichi-iko Pharmaceutical Co., Ltd.(a) | | | 14,000 | | | $ | 268,376 | |
Novartis AG | | | 5,600 | | | | 441,954 | |
Novo Nordisk A/S, Class B | | | 7,300 | | | | 304,255 | |
Roche Holding AG | | | 4,000 | | | | 993,994 | |
Sanofi | | | 4,300 | | | | 327,449 | |
Sihuan Pharmaceutical Holdings Group, Ltd. | | | 800,000 | | | | 176,352 | |
Teva Pharmaceutical Industries, Ltd., Sponsored ADR | | | 10,400 | | | | 478,504 | |
Valeant Pharmaceuticals International, Inc.(b) | | | 6,500 | | | | 159,484 | |
Vectura Group PLC(b) | | | 120,000 | | | | 215,420 | |
| | | | | | | | |
| | | | | | | 4,850,235 | |
| | | | | | | | |
|
Property & Casualty Insurance (0.32%) | |
KB Insurance Co., Ltd. | | | 7,200 | | | | 178,587 | |
| | | | | | | | |
|
Railroads (0.43%) | |
VTG AG | | | 8,419 | | | | 239,053 | |
| | | | | | | | |
|
Real Estate Development (1.84%) | |
AP Thailand PCL | | | 1,300,000 | | | | 272,793 | |
China Overseas Land & Investment, Ltd. | | | 90,000 | | | | 309,420 | |
Filinvest Land, Inc. | | | 3,803,000 | | | | 144,133 | |
Sino-Ocean Group Holding, Ltd. | | | 350,000 | | | | 162,484 | |
Yanlord Land Group, Ltd. | | | 134,000 | | | | 137,831 | |
| | | | | | | | |
| | | | | | | 1,026,661 | |
| | | | | | | | |
|
Real Estate Operating Companies (1.24%) | |
Aeon Mall Co., Ltd. | | | 27,800 | | | | 439,098 | |
Central Pattana PCL | | | 150,000 | | | | 253,254 | |
| | | | | | | | |
| | | | | | | 692,352 | |
| | | | | | | | |
|
Regional Banks (0.45%) | |
BNK Financial Group, Inc. | | | 32,000 | | | | 250,505 | |
| | | | | | | | |
|
Renewable Electricity (1.07%) | |
Huaneng Renewables Corp., Ltd., Class H | | | 1,700,000 | | | | 597,688 | |
| | | | | | | | |
|
Retail REIT’s (2.11%) | |
Klepierre, REIT | | | 14,300 | | | | 656,413 | |
Wereldhave N.V., REIT | | | 10,300 | | | | 521,462 | |
| | | | | | | | |
| | | | | | | 1,177,875 | |
| | | | | | | | |
|
Security & Alarm Services (0.36%) | |
S-1 Corp.(b) | | | 2,200 | | | | 203,252 | |
| | | | | | | | |
|
Semiconductor Equipment (1.40%) | |
Advanced Process Systems Corp.(b) | | | 12,744 | | | | 285,701 | |
Jusung Engineering Co., Ltd.(b) | | | 25,745 | | | | 248,304 | |
| | |
The accompanying notes are an integral part of the financial statements. |
| Annual Report | September 30, 2016 | | 15 |
| | |
| ICON International Equity Fund | | Schedule of Investments |
| | September 30, 2016 |
| | | | | | | | |
| | | Shares or Principal
Amount | | | Value | |
Semiconductor Equipment (continued) | | | | | | | | |
Wonik Holdings Co., Ltd.(b) | | | 37,000 | | | $ | 247,923 | |
| | | | | | | | |
| | | | | | | 781,928 | |
| | | | | | | | |
|
Semiconductors (1.05%) | |
Malaysian Pacific Industries Bhd | | | 73,000 | | | | 137,686 | |
NXP Semiconductors N.V.(b) | | | 4,400 | | | | 448,844 | |
| | | | | | | | |
| | | | | | | 586,530 | |
| | | | | | | | |
|
Soft Drinks (0.29%) | |
Arca Continental SAB de CV | | | 27,000 | | | | 160,693 | |
| | | | | | | | |
|
Specialized Finance (0.36%) | |
Mitsubishi UFJ Lease & Finance Co., Ltd. | | | 44,000 | | | | 201,913 | |
| | | | | | | | |
|
Systems Software (0.73%) | |
Asseco Poland S.A. | | | 27,800 | | | | 405,284 | |
| | | | | | | | |
|
Technology Hardware, Storage & Peripherals (0.65%) | |
Samsung Electronics Co., Ltd. | | | 250 | | | | 364,191 | |
| | | | | | | | |
|
Water Utilities (0.29%) | |
Beijing Enterprises Water Group, Ltd. | | | 240,000 | | | | 163,614 | |
| | | | | | | | |
|
Wireless Telecommunication Services (3.47%) | |
Drillisch AG(a) | | | 13,000 | | | | 631,789 | |
NTT DOCOMO, Inc. | | | 7,800 | | | | 198,143 | |
SK Telecom Co., Ltd. | | | 2,000 | | | | 410,081 | |
SoftBank Group Corp. | | | 10,700 | | | | 693,452 | |
| | | | | | | | |
| | | | | | | 1,933,465 | |
| | | | | | | | |
| | |
Total Common Stocks
(Cost $50,829,091) | | | | | | | 49,887,601 | |
| | | | | | | | |
|
Preferred Stocks (0.14%) | |
Building Products (0.14%) | | | | | | | | |
Villeroy & Boch AG | | | 5,000 | | | | 79,729 | |
| | | | | | | | |
| | |
Total Preferred Stocks (Cost $78,261) | | | | | | | 79,729 | |
| | | | | | | | |
|
Collateral for Securities on Loan (7.47%) | |
State Street Navigator Prime Portfolio, 0.30% | | | 4,165,210 | | | | 4,165,210 | |
| | | | | | | | |
| |
Total Collateral for Securities on Loan
(Cost $4,165,210) | | | | 4,165,210 | |
| | | | | | | | |
| | | | | | | | |
| | | Shares or Principal
Amount | | | Value | |
Short-Term Investments (13.98%) | | | | | | | | |
Time Deposits (13.98%) | | | | | | | | |
State Street Euro Dollar Time Deposit (USD), 0.01%, 10/03/16 | | | 7,794,962 | | | $ | 7,794,962 | |
| | | | | | | | |
| | |
Total Short-Term Investments
(Cost $7,794,962) | | | | | | | 7,794,962 | |
| | | | | | | | |
| | |
Total Investments (111.03%) | | | | | | | | |
| (Cost $62,867,524) | | | | | | $ | 61,927,502 | |
| | |
Liabilities Less Other Assets (-11.03%) | | | | | | | (6,152,861) | |
| | | | | | | | |
| | |
Net Assets (100.00%) | | | | | | $ | 55,774,641 | |
| | | | | | | | |
| (a) | All or a portion of the security was on loan as of September 30, 2016. |
| (b) | Non-income producing security. |
ADR - American Depositary Receipt
REIT - Real Estate Investment Trust
| | |
The accompanying notes are an integral part of the financial statements. |
| 16 | | www.iconfunds.com |
| | |
| ICON International Equity Fund | | Schedule of Investments |
| | September 30, 2016 |
| | | | |
| Country Composition (September 30, 2016) | | | |
South Korea | | | 17.34% | |
Japan | | | 14.49% | |
Germany | | | 7.91% | |
France | | | 5.64% | |
Canada | | | 4.56% | |
China | | | 4.19% | |
Hong Kong | | | 3.97% | |
South Africa | | | 3.64% | |
Switzerland | | | 2.57% | |
India | | | 2.48% | |
United Kingdom | | | 2.10% | |
Ireland | | | 2.03% | |
Netherlands | | | 2.01% | |
Italy | | | 1.77% | |
United States | | | 1.67% | |
Sweden | | | 1.44% | |
Thailand | | | 1.40% | |
Jersey | | | 1.06% | |
Denmark | | | 1.02% | |
Taiwan | | | 1.00% | |
Israel | | | 0.86% | |
Mexico | | | 0.86% | |
Brazil | | | 0.82% | |
Poland | | | 0.73% | |
Hungary | | | 0.69% | |
Australia | | | 0.61% | |
Philippines | | | 0.57% | |
Norway | | | 0.52% | |
Myanmar | | | 0.47% | |
Bermuda | | | 0.31% | |
Indonesia | | | 0.31% | |
Turkey | | | 0.29% | |
Singapore | | | 0.25% | |
| | | | |
| | | 89.58% | |
| | | | |
Percentages are based upon common and preferred stocks as a percentage of net assets.
| | | | |
| Sector Composition (September 30, 2016) | | | |
Information Technology | | | 18.16% | |
Health Care | | | 13.99% | |
Materials | | | 9.84% | |
Utilities | | | 7.96% | |
Industrials | | | 6.96% | |
Consumer Staples | | | 6.94% | |
Consumer Discretionary | | | 6.31% | |
Real Estate | | | 6.27% | |
Financial | | | 5.99% | |
Telecommunication Services | | | 5.77% | |
Energy | | | 1.39% | |
| | | | |
| | | 89.58% | |
| | | | |
Percentages are based upon common and preferred stocks as a percentage of net assets.
| | |
The accompanying notes are an integral part of the financial statements. |
| Annual Report | September 30, 2016 | | 17 |
| | |
| ICON International Equity Fund | | Schedule of Investments |
| | September 30, 2016 |
| | | | |
Industry Composition (September 30, 2016) | |
Pharmaceuticals | | | 8.70% | |
Gold | | | 5.45% | |
Multi-Utilities | | | 3.72% | |
Wireless Telecommunication Services | | | 3.47% | |
Biotechnology | | | 3.40% | |
Electronic Equipment & Instruments | | | 2.93% | |
Commodity Chemicals | | | 2.62% | |
Integrated Telecommunication Services | | | 2.30% | |
Home Entertainment Software | | | 2.26% | |
IT Consulting & Other Services | | | 2.25% | |
Communications Equipment | | | 2.15% | |
Data Processing & Outsourced Services | | | 2.14% | |
Retail REIT’s | | | 2.11% | |
Real Estate Development | | | 1.84% | |
Diversified Real Estate Activities | | | 1.74% | |
Personal Products | | | 1.70% | |
Brewers | | | 1.55% | |
Electric Utilities | | | 1.43% | |
Diversified Banks | | | 1.43% | |
Semiconductor Equipment | | | 1.40% | |
Aerospace & Defense | | | 1.28% | |
Real Estate Operating Companies | | | 1.24% | |
Construction Materials | | | 1.20% | |
Renewable Electricity | | | 1.07% | |
Semiconductors | | | 1.05% | |
Health Care Equipment | | | 1.05% | |
Industrial Conglomerates | | | 1.02% | |
Other Industries (each less than 1%) | | | 27.08% | |
| | | | |
| | | 89.58% | |
| | | | |
Percentages are based upon common and preferred stocks as a percentage of net assets.
| | |
The accompanying notes are an integral part of the financial statements. |
| 18 | | www.iconfunds.com |
| | |
| ICON International Funds | | Statements of Assets and Liabilities |
| | September 30, 2016 |
| | | | | | | | |
| | | ICON Emerging
Markets Fund | | | ICON International
Equity Fund | |
| |
Assets | | | | | | | | |
Investments, at cost | | $ | 57,933,100 | | | $ | 62,867,524 | |
| | | | |
Investments, at value(a) | | | 58,949,730 | | | | 61,927,502 | |
Cash | | | – | | | | 3,989 | |
Foreign currency, at value (Cost $26,512 and $3,749, respectively) | | | 26,563 | | | | 3,885 | |
Receivables: | | | | | | | | |
Investments sold | | | 1,244,647 | | | | 635,119 | |
Fund shares sold | | | 308,392 | | | | 895 | |
Expense reimbursements due from Adviser | | | 40,903 | | | | 13,314 | |
Dividends | | | 30,399 | | | | 59,031 | |
Foreign tax reclaims | | | – | | | | 53,622 | |
Other assets | | | 10,431 | | | | 13,992 | |
| | | | |
Total assets | | | 60,611,065 | | | | 62,711,349 | |
| | | | |
| | |
Liabilities | | | | | | | | |
Payables: | | | | | | | | |
Payable for collateral received on securities loaned | | | – | | | | 4,165,210 | |
Payable to custodian | | | 2,981,949 | | | | – | |
Investments purchased | | | 1,616,787 | | | | 2,610,618 | |
Fund shares redeemed | | | 18,312 | | | | 39,936 | |
Advisory fees | | | 44,851 | | | | 46,280 | |
Transfer agent fees | | | 17,586 | | | | 6,187 | |
Fund accounting fees | | | 6,261 | | | | 9,350 | |
Accrued distribution fees | | | 2,624 | | | | 3,015 | |
Trustee fees and expenses | | | 2,225 | | | | 2,397 | |
Administration fees | | | 2,306 | | | | 2,394 | |
Accrued expenses | | | 47,807 | | | | 51,321 | |
| | | | |
Total liabilities | | | 4,740,708 | | | | 6,936,708 | |
| | | | |
Net Assets - all share classes | | $ | 55,870,357 | | | $ | 55,774,641 | |
| | | | |
Net Assets - Class S | | $ | 45,786,335 | | | $ | 50,004,737 | |
| | | | |
Net Assets - Class C | | $ | 1,011,704 | | | $ | 2,940,958 | |
| | | | |
Net Assets - Class A | | $ | 9,072,318 | | | $ | 2,828,946 | |
| | | | |
| | |
Net Assets Consists of | | | | | | | | |
Paid-in capital | | $ | 60,486,102 | | | $ | 147,782,786 | |
Accumulated undistributed net investment income/(loss) | | | (121,597) | | | | (227,984) | |
Accumulated undistributed net realized gain/(loss) | | | (5,511,331) | | | | (90,837,619) | |
Unrealized appreciation/(depreciation) | | | 1,017,183 | | | | (942,542) | |
| | | | |
Net Assets | | $ | 55,870,357 | | | $ | 55,774,641 | |
| | | | |
Shares outstanding (unlimited shares authorized, no par value) | | | | | | | | |
Class S | | | 3,206,841 | | | | 4,188,597 | |
Class C | | | 75,376 | | | | 275,867 | |
Class A | | | 639,079 | | | | 240,636 | |
Net asset value (offering and redemption price per share) | | | | | | | | |
Class S | | $ | 14.28 | | | $ | 11.94 | |
Class C | | $ | 13.42 | | | $ | 10.66 | |
Class A | | $ | 14.20 | | | $ | 11.76 | |
Class A maximum offering price (100%/ (100%-maximum sales charge)) of net asset value adjusted to the nearest cent per share | | $ | 15.06 | | | $ | 12.48 | |
(a) Includes securities on loan of | | $ | – | | | $ | 3,991,129 | |
| | |
The accompanying notes are an integral part of the financial statements. |
| Annual Report | September 30, 2016 | | 19 |
| | |
| ICON International Funds | | Statements of Operations |
| | Year Ended September 30, 2016 |
| | | | | | | | |
| | | ICON Emerging
Markets Fund | | | ICON International Equity Fund | |
| |
Investment Income | | | | | | | | |
Interest | | $ | 3,007 | | | $ | 1,167 | |
Dividends | | | 625,999 | | | | 1,287,060 | |
Foreign taxes withheld | | | (78,829) | | | | (115,582) | |
Income from securities lending, net | | | – | | | | 96,251 | |
Other income | | | – | | | | 18,177 | |
| | | | |
Total investment income | | | 550,177 | | | | 1,287,073 | |
| | | | |
Expenses | | | | | | | | |
Advisory fees | | | 352,367 | | | | 674,958 | |
Administration fees | | | 17,684 | | | | 33,827 | |
Transfer agent fees | | | 87,600 | | | | 72,097 | |
Distribution fees: | | | | | | | | |
Class C | | | 8,490 | | | | 30,710 | |
Class A | | | 14,933 | | | | 8,310 | |
Registration fees | | | 34,626 | | | | 35,870 | |
Audit and tax service expense | | | 28,040 | | | | 29,795 | |
Fund accounting fees | | | 29,743 | | | | 49,452 | |
Trustee fees and expenses | | | 6,101 | | | | 10,751 | |
Insurance expense | | | 1,416 | | | | 10,665 | |
Custody fees | | | 43,711 | | | | 40,888 | |
Printing fees | | | 14,931 | | | | 15,109 | |
Recoupment of previously reimbursed expenses | | | 14,744 | | | | – | |
Other expenses | | | 36,066 | | | | 48,913 | |
| | | | |
Total expenses before expense reimbursement | | | 690,452 | | | | 1,061,345 | |
Expense reimbursement by Adviser due to expense limitation agreement | | | (119,653) | | | | (38,568) | |
| | | | |
Net Expenses | | | 570,799 | | | | 1,022,777 | |
| | | | |
Net Investment Income/(Loss) | | | (20,622) | | | | 264,296 | |
| | | | |
Realized and Unrealized Gain/(Loss) | | | | | | | | |
Net realized gain/(loss) on: | | | | | | | | |
Investments | | | 2,213,629 | | | | (2,385,798) | |
Foreign currency | | | (66,421) | | | | (251,095) | |
Capital gains tax | | | (79,455) | | | | (63,731) | |
| | | | |
| | | 2,067,753 | | | | (2,700,624) | |
| | | | |
Change in unrealized net appreciation/(depreciation) on: | | | | | | | | |
Investments and foreign currency | | | 2,012,969 | | | | 5,285,537 | |
Capital gains tax | | | 454 | | | | – | |
| | | | |
| | | 2,013,423 | | | | 5,285,537 | |
| | | | |
Net realized and unrealized gain/(loss) | | | 4,081,176 | | | | 2,584,913 | |
| | | | |
Net Increase/(Decrease) in Net Assets Resulting From Operations | | $ | 4,060,554 | | | $ | 2,849,209 | |
| | | | |
| | |
The accompanying notes are an integral part of the financial statements. |
| 20 | | www.iconfunds.com |
| | |
| ICON International Funds | | Statements of Changes in Net Assets |
| | |
| | | | | | | | | | | | | | | | |
| | | ICON Emerging Markets Fund | | | ICON International Equity Fund | |
| | | Year Ended | | | Year Ended | | | Year Ended | | | Year Ended | |
| | | September 30, 2016 | | | September 30, 2015 | | | September 30, 2016 | | | September 30, 2015 | |
Operations | | | | | | | | | | | | | | | | |
Net investment income/(loss) | | $ | (20,622) | | | $ | (30,748) | | | $ | 264,296 | | | $ | (58,796) | |
Net realized gain/(loss)(a) | | | 2,067,753 | | | | (267,920) | | | | (2,700,624) | | | | (5,163,420) | |
Change in net unrealized appreciation/(depreciation) | | | 2,013,423 | | | | (787,186) | | | | 5,285,537 | | | | 3,119,772 | |
| | | | |
Net increase/(decrease) in net assets resulting from operations | | | 4,060,554 | | | | (1,085,854) | | | | 2,849,209 | | | | (2,102,444) | |
| | | | |
| | | | |
Dividends and Distributions to Shareholders | | | | | | | | | | | | | | | | |
Net investment income | | | | | | | | | | | | | | | | |
Class S | | | – | | | | – | | | | – | | | | (71,695) | |
| | | | |
Net decrease from dividends and distributions | | | – | | | | – | | | | – | | | | (71,695) | |
| | | | |
| | | | |
Fund Share Transactions | | | | | | | | | | | | | | | | |
Shares sold | | | | | | | | | | | | | | | | |
Class S | | | 35,539,610 | | | | 20,067,880 | | | | 3,354,948 | | | | 4,506,506 | |
Class C | | | 823,176 | | | | 349,016 | | | | 81,425 | | | | 82,616 | |
Class A | | | 12,243,987 | | | | 862,982 | | | | 175,210 | | | | 1,145,130 | |
Reinvested dividends and distributions | | | | | | | | | | | | | | | | |
Class S | | | – | | | | – | | | | – | | | | 70,812 | |
Shares repurchased | | | | | | | | | | | | | | | | |
Class S | | | (9,328,014) | | | | (11,885,964) | | | | (23,174,814) | | | | (15,856,511) | |
Class C | | | (459,358) | | | | (468,737) | | | | (552,431) | | | | (1,251,157) | |
Class A | | | (4,458,977) | | | | (398,743) | | | | (1,184,134) | | | | (1,339,594) | |
| | | | |
Net increase/(decrease) from fund share transactions | | | 34,360,424 | | | | 8,526,434 | | | | (21,299,796) | | | | (12,642,198) | |
| | | | |
Total net increase/(decrease) in net assets | | | 38,420,978 | | | | 7,440,580 | | | | (18,450,587) | | | | (14,816,337) | |
Net Assets | | | | | | | | | | | | | | | | |
Beginning of year | | | 17,449,379 | | | | 10,008,799 | | | | 74,225,228 | | | | 89,041,565 | |
| | | | |
End of year | | $ | 55,870,357 | | | $ | 17,449,379 | | | $ | 55,774,641 | | | $ | 74,225,228 | |
| | | | |
Accumulated undistributed net investment income/(loss) | | $ | (121,597) | | | $ | (19,769) | | | $ | (227,984) | | | $ | (511,973) | |
| | | | |
| | | | |
Transactions in Fund Shares | | | | | | | | | | | | | | | | |
Shares sold | | | | | | | | | | | | | | | | |
Class S | | | 2,656,595 | | | | 1,456,599 | | | | 291,975 | | | | 382,453 | |
Class C | | | 64,476 | | | | 26,591 | | | | 7,727 | | | | 7,381 | |
Class A | | | 918,881 | | | | 62,831 | | | | 15,507 | | | | 94,725 | |
Issued to shareholders in reinvestment of distributions | | | | | | | | | | | | | | | | |
Class S | | | – | | | | – | | | | – | | | | 6,089 | |
Shares repurchased | | | | | | | | | | | | | | | | |
Class S | | | (694,300) | | | | (863,679) | | | | (2,012,460) | | | | (1,317,093) | |
Class C | | | (37,993) | | | | (35,508) | | | | (53,203) | | | | (114,930) | |
Class A | | | (335,946) | | | | (28,954) | | | | (106,353) | | | | (114,235) | |
| | | | |
Net increase/(decrease) | | | 2,571,713 | | | | 617,880 | | | | (1,856,807) | | | | (1,055,610) | |
| | | | |
Shares outstanding, beginning of year | | | 1,349,583 | | | | 731,703 | | | | 6,561,907 | | | | 7,617,517 | |
| | | | |
Shares outstanding, end of year | | | 3,921,296 | | | | 1,349,583 | | | | 4,705,100 | | | | 6,561,907 | |
| | | | |
| (a) | The September 30, 2015 presentation has been changed to conform to industry standards and had no effect on the Funds’ change in net assets. |
| | |
The accompanying notes are an integral part of the financial statements. |
| Annual Report | September 30, 2016 | | 21 |
| | |
| ICON Emerging Markets Fund | | Financial Highlights |
| | For a Share Outstanding Throughout the Years Presented |
| | | | | | | | | | | | | | | | | | | | |
| Class S | | Year Ended
September 30,
2016 | | | Year Ended
September 30,
2015 | | | Year Ended
September 30,
2014 | | | Year Ended
September 30,
2013 | | | Year Ended
September 30,
2012 | |
Net asset value, beginning of period | | $ | 12.95 | | | $ | 13.72 | | | $ | 13.51 | | | $ | 12.21 | | | $ | 10.12 | |
| | | | | |
Income/(loss) from investment operations: | | | | | | | | | | | | | | | | | | | | |
Net investment income/(loss)(a) | | | (0.00) | (b) | | | (0.03) | | | | (0.03) | | | | 0.06 | | | | 0.11 | |
Net realized and unrealized gains/(losses) on investments | | | 1.33 | | | | (0.74) | | | | 0.27 | | | | 1.33 | | | | 2.02 | |
Total from investment operations | | | 1.33 | | | | (0.77) | | | | 0.24 | | | | 1.39 | | | | 2.13 | |
Less dividends and distributions: | | | | | | | | | | | | | | | | | | | | |
Dividends from net investment income | | | – | | | | – | | | | (0.03) | | | | (0.09) | | | | (0.04) | |
Total dividends and distributions | | | – | | | | – | | | | (0.03) | | | | (0.09) | | | | (0.04) | |
Net asset value, end of period | | $ | 14.28 | | | $ | 12.95 | | | $ | 13.72 | | | $ | 13.51 | | | $ | 12.21 | |
Total Return | | | 10.27 | % | | | (5.61 | )% | | | 1.78 | % | | | 11.44 | % | | | 21.16 | % |
Ratios and Supplemental Data | | | | | | | | | | | | | | | | | | | | |
Net assets, end of period (in 000s) | | $ | 45,786 | | | $ | 16,123 | | | $ | 8,942 | | | $ | 29,053 | | | $ | 37,969 | |
| | | | | |
Ratio of expenses to average net assets | | | | | | | | | | | | | | | | | | | | |
Before expense limitation | | | 1.85 | % | | | 2.44 | % | | | 2.11 | % | | | 1.64 | % | | | 1.50 | % |
After expense limitation/ recoupment | | | 1.55 | % | | | 1.55 | % | | | 1.88 | %(c) | | | 1.64 | % | | | 1.50 | % |
Ratio of net investment income/(loss) to average net assets | | | | | | | | | | | | | | | | | | | | |
Before expense limitation | | | (0.32 | )% | | | (1.08 | )% | | | (0.42 | )% | | | 0.46 | % | | | 0.96 | % |
After expense limitation/
recoupment | | | (0.02 | )% | | | (0.19 | )% | | | (0.19 | )% | | | 0.46 | % | | | 0.96 | % |
Portfolio turnover rate | | | 156 | % | | | 76 | % | | | 92 | % | | | 60 | % | | | 72 | % |
| (a) | Calculated using the average shares method. |
| (b) | Amount less than $(0.005). |
| (c) | Effective May 5, 2014, Class S’s operating expenses, not including interest expense, were contractually limited to the amounts discussed in Note 3. The ratios in these financial highlights reflect the limitation, including the interest expense. |
| | |
The accompanying notes are an integral part of the financial statements. |
| 22 | | www.iconfunds.com |
| | |
| ICON Emerging Markets Fund | | Financial Highlights |
| | For a Share Outstanding Throughout the Years Presented |
| | | | | | | | | | | | | | | | | | | | |
| Class C | | Year Ended
September 30,
2016 | | | Year Ended
September 30,
2015 | | | Year Ended
September 30,
2014 | | | Year Ended
September 30,
2013 | | | Year Ended
September 30,
2012 | |
Net asset value, beginning of period | | $ | 12.30 | | | $ | 13.18 | | | $ | 13.06 | | | $ | 11.84 | | | $ | 9.88 | |
| | | | | |
Income/(loss) from investment
operations: | | | | | | | | | | | | | | | | | | | | |
Net investment income/(loss)(a) | | | (0.15) | | | | (0.17) | | | | (0.11) | | | | (0.05) | | | | 0.01 | |
Net realized and unrealized
gains/(losses) on investments | | | 1.27 | | | | (0.71) | | | | 0.23 | | | | 1.28 | | | | 1.95 | |
Total from investment operations | | | 1.12 | | | | (0.88) | | | | 0.12 | | | | 1.23 | | | | 1.96 | |
Less dividends and distributions: | | | | | | | | | | | | | | | | | | | | |
Dividends from net investment
income | | | – | | | | – | | | | – | | | | (0.01) | | | | – | |
Total dividends and distributions | | | – | | | | – | | | | – | | | | (0.01) | | | | – | |
Net asset value, end of period | | $ | 13.42 | | | $ | 12.30 | | | $ | 13.18 | | | $ | 13.06 | | | $ | 11.84 | |
Total Return(b) | | | 9.11 | % | | | (6.68) | % | | | 0.92 | % | | | 10.44 | % | | | 19.84 | % |
Ratios and Supplemental Data | | | | | | | | | | | | | | | | | | | | |
Net assets, end of period (in 000s) | | $ | 1,012 | | | $ | 601 | | | $ | 762 | | | $ | 832 | | | $ | 869 | |
Ratio of expenses to average net
assets | | | | | | | | | | | | | | | | | | | | |
Before expense limitation | | | 4.07 | % | | | 5.11 | % | | | 4.65 | % | | | 3.76 | % | | | 3.91 | % |
After expense limitation/
recoupment (c) | | | 2.55 | % | | | 2.55 | % | | | 2.78 | % | | | 2.56 | % | | | 2.55 | % |
Ratio of net investment
income/(loss) to average net
assets | | | | | | | | | | | | | | | | | | | | |
Before expense limitation | | | (2.67) | % | | | (3.88) | % | | | (2.70) | % | | | (1.63) | % | | | (1.28) | % |
After expense limitation/
recoupment | | | (1.15) | % | | | (1.32) | % | | | (0.83) | % | | | (0.43) | % | | | 0.08 | % |
Portfolio turnover rate | | | 156 | % | | | 76 | % | | | 92 | % | | | 60 | % | | | 72 | % |
| (a) | Calculated using the average shares method. |
| (b) | The total return calculation excludes any sales charges. |
| (c) | The Fund’s operating expenses, not including interest expense, are contractually limited to the amounts discussed in Note 3. The ratios in these financial highlights reflect the limitation, including the interest expense, when applicable. |
| | |
The accompanying notes are an integral part of the financial statements. |
| Annual Report | September 30, 2016 | | 23 |
| | |
| ICON Emerging Markets Fund | | Financial Highlights |
| | For a Share Outstanding Throughout the Years Presented |
| | | | | | | | | | | | | | | | | | | | |
| | | Year Ended
September 30, | | | Year Ended
September 30, | | | Year Ended
September 30, | | | Year Ended
September 30, | | | Year Ended
September 30, | |
| Class A | | 2016 | | | 2015 | | | 2014 | | | 2013 | | | 2012 | |
Net asset value, beginning of period | | $ | 12.91 | | | $ | 13.71 | | | $ | 13.51 | | | $ | 12.17 | | | $ | 10.10 | |
| | | | | |
Income/(loss) from investment operations: | | | | | | | | | | | | | | | | | | | | |
Net investment income/(loss)(a) | | | (0.01) | | | | (0.07) | | | | (0.04) | | | | 0.04 | | | | 0.09 | |
Net realized and unrealized gains/(losses) on investments | | | 1.30 | | | | (0.73) | | | | 0.27 | | | | 1.33 | | | | 2.00 | |
Total from investment operations | | | 1.29 | | | | (0.80) | | | | 0.23 | | | | 1.37 | | | | 2.09 | |
| | | | | |
Less dividends and distributions: | | | | | | | | | | | | | | | | | | | | |
Dividends from net investment income | | | – | | | | – | | | | (0.03) | | | | (0.03) | | | | (0.02) | |
Total dividends and distributions | | | – | | | | – | | | | (0.03) | | | | (0.03) | | | | (0.02) | |
| | | | | |
Net asset value, end of period | | $ | 14.20 | | | $ | 12.91 | | | $ | 13.71 | | | $ | 13.51 | | | $ | 12.17 | |
| | | | | |
Total Return(b) | | | 9.99 | % | | | (5.84) | % | | | 1.68 | % | | | 11.29 | % | | | 20.73 | % |
| | | | | |
Ratios and Supplemental Data | | | | | | | | | | | | | | | | | | | | |
Net assets, end of period (in 000s) | | $ | 9,072 | | | $ | 725 | | | $ | 305 | | | $ | 789 | | | $ | 690 | |
| | | | | |
Ratio of expenses to average net assets | | | | | | | | | | | | | | | | | | | | |
Before expense limitation | | | 2.16 | % | | | 4.75 | % | | | 4.32 | % | | | 2.97 | % | | | 2.88 | % |
After expense limitation/ recoupment (c) | | | 1.80 | % | | | 1.80 | % | | | 1.95 | % | | | 1.81 | % | | | 1.80 | % |
Ratio of net investment income/(loss) to average net assets | | | | | | | | | | | | | | | | | | | | |
Before expense limitation | | | (0.43) | % | | | (3.44) | % | | | (2.65) | % | | | (0.82) | % | | | (0.31) | % |
After expense limitation/recoupment | | | (0.07) | % | | | (0.49) | % | | | (0.28) | % | | | 0.34 | % | | | 0.77 | % |
Portfolio turnover rate | | | 156 | % | | | 76 | % | | | 92 | % | | | 60 | % | | | 72 | % |
| (a) | Calculated using the average shares method. |
| (b) | The total return calculation excludes any sales charges. |
| (c) | The Fund’s operating expenses, not including interest expense, are contractually limited to the amounts discussed in Note 3. The ratios in these financial highlights reflect the limitation, including the interest expense, when applicable. |
| | |
The accompanying notes are an integral part of the financial statements. |
| 24 | | www.iconfunds.com |
| | |
| ICON International Equity Fund | | Financial Highlights |
| | For a Share Outstanding Throughout the Years Presented |
| | | | | | | | | | | | | | | | | | | | |
| Class S(a) | | Year Ended September 30, 2016 | | | Year Ended September 30, 2015 | | | Year Ended September 30, 2014 | | | Year Ended September 30, 2013 | | | Year Ended September 30, 2012 | |
| |
Net asset value, beginning of period | | $ | 11.37 | | | $ | 11.75 | | | $ | 11.81 | | | $ | 11.05 | | | $ | 9.22 | |
| | | | | |
Income/(loss) from investment operations: | | | | | | | | | | | | | | | | | | | | |
Net investment income/(loss)(b) | | | 0.05 | | | | 0.00 | (c) | | | 0.06 | | | | 0.07 | | | | 0.16 | |
Net realized and unrealized gains/(losses) on investments | | | 0.52 | | | | (0.37) | | | | (0.12) | | | | 0.74 | | | | 1.78 | |
| |
Total from investment operations | | | 0.57 | | | | (0.37) | | | | (0.06) | | | | 0.81 | | | | 1.94 | |
| |
| | | | | |
Less dividends and distributions: | | | | | | | | | | | | | | | | | | | | |
Dividends from net investment income | | | – | | | | (0.01) | | | | – | | | | (0.00) | (d) | | | (0.11) | |
Distributions from net realized gains | | | – | | | | – | | | | – | | | | (0.05) | | | | – | |
| |
Total dividends and distributions | | | – | | | | (0.01) | | | | – | | | | (0.05) | | | | (0.11) | |
| |
| | | | | |
Net asset value, end of period | | $ | 11.94 | | | $ | 11.37 | | | $ | 11.75 | | | $ | 11.81 | | | $ | 11.05 | |
| |
Total Return | | | 5.01% | | | | (3.15)% | | | | (0.51)% | | | | 7.33% | | | | 21.19% | |
| | | | | |
Ratios and Supplemental Data | | | | | | | | | | | | | | | | | | | | |
Net assets, end of period (in 000s) | | $ | 50,005 | | | $ | 67,201 | | | $ | 80,356 | | | $ | 42,105 | | | $ | 56,152 | |
Ratio of expenses to average net assets | | | | | | | | | | | | | | | | | | | | |
Before expense limitation | | | 1.45% | | | | 1.41% | | | | 1.41% | | | | 1.45% | | | | 1.39% | |
After expense limitation/recoupment (e) | | | 1.45% | | | | 1.41% | | | | 1.41% | | | | 1.45% | | | | 1.39% | |
Ratio of net investment income/(loss) to average net assets | | | | | | | | | | | | | | | | | | | | |
Before expense limitation | | | 0.45% | | | | 0.00% | (f) | | | 0.44% | | | | 0.65% | | | | 1.47% | |
After expense limitation/recoupment | | | 0.45% | | | | 0.00% | (f) | | | 0.44% | | | | 0.65% | | | | 1.47% | |
Portfolio turnover rate | | | 198% | | | | 204 | % | | | 193% | | | | 138% | | | | 122% | |
| (a) | Class S shares were formerly named Class Z shares prior to January 23, 2012. |
| (b) | Calculated using the average shares method. |
| (c) | Amount less than $0.005. |
| (d) | Amount less than $(0.005). |
| (e) | The Fund’s operating expenses, not including interest expense, are contractually limited to the amounts discussed in Note 3. The ratios in these financial highlights reflect the limitation, including the interest expense, when applicable. |
| (f) | Less than 0.005% of average net assets. |
| | |
The accompanying notes are an integral part of the financial statements. |
| Annual Report | September 30, 2016 | | 25 |
| | |
| ICON International Equity Fund | | Financial Highlights |
| | For a Share Outstanding Throughout the Years Presented |
| | | | | | | | | | | | | | | | | | | | |
| Class C | | Year Ended
September 30,
2016 | | | Year Ended
September 30,
2015 | | | Year Ended
September 30,
2014 | | | Year Ended
September 30,
2013 | | | Year Ended
September 30,
2012 | |
Net asset value, beginning of period | | $ | 10.27 | | | $ | 10.72 | | | $ | 10.89 | | | $ | 10.26 | | | $ | 8.56 | |
| | | | | |
Income/(loss) from investment operations: | | | | | | | | | | | | | | | | | | | | |
Net investment income/(loss)(a) | | | (0.09) | (b) | | | (0.12) | | | | (0.08) | | | | (0.04) | | | | (0.02) | |
Net realized and unrealized gains/(losses) on investments | | | 0.48 | | | | (0.33) | | | | (0.09) | | | | 0.67 | | | | 1.72 | |
Total from investment operations | | | 0.39 | | | | (0.45) | | | | (0.17) | | | | 0.63 | | | | 1.70 | |
| | | | | |
Net asset value, end of period | | $ | 10.66 | | | $ | 10.27 | | | $ | 10.72 | | | $ | 10.89 | | | $ | 10.26 | |
| | | | | |
Total Return(c) | | | 3.80 | % | | | (4.20) | % | | | (1.56) | % | | | 6.14 | % | | | 19.86% | |
| | | | | |
Ratios and Supplemental Data | | | | | | | | | | | | | | | | | | | | |
Net assets, end of period (in 000s) | | $ | 2,941 | | | $ | 3,299 | | | $ | 4,597 | | | $ | 5,657 | | | $ | 6,773 | |
| | | | | |
Ratio of expenses to average net assets | | | | | | | | | | | | | | | | | | | | |
Before expense limitation | | | 3.13 | % | | | 2.96 | % | | | 2.82 | % | | | 2.77 | % | | | 2.72% | |
After expense limitation/ recoupment (d) | | | 2.55 | % | | | 2.55 | % | | | 2.56 | % | | | 2.56 | % | | | 2.55% | |
Ratio of net investment income/(loss) to average net assets | | | | | | | | | | | | | | | | | | | | |
Before expense limitation | | | (1.40) | % | | | (1.56) | % | | | (0.99) | % | | | (0.63) | % | | | (0.41)% | |
After expense limitation/ recoupment | | | (0.82) | % | | | (1.15) | % | | | (0.73) | % | | | (0.42) | % | | | (0.24)% | |
Portfolio turnover rate | | | 198 | % | | | 204 | % | | | 193 | % | | | 138 | % | | | 122% | |
| (a) | Calculated using the average shares method. |
| (b) | The per share amount does not correspond to activity reflected in the Statement of Operations due to class specific expenses during the period. |
| (c) | The total return calculation excludes any sales charges. |
| (d) | The Fund’s operating expenses, not including interest expense, are contractually limited to the amounts discussed in Note 3. The ratios in these financial highlights reflect the limitation, including the interest expense, when applicable. |
| | |
The accompanying notes are an integral part of the financial statements. |
| 26 | | www.iconfunds.com |
| | |
| ICON International Equity Fund | | Financial Highlights |
| | For a Share Outstanding Throughout the Years Presented |
| | | | | | | | | | | | | | | | | | | | |
Class A(a) | | Year Ended
September 30,
2016 | | | Year Ended
September 30,
2015 | | | Year Ended
September 30,
2014 | | | Year Ended
September 30,
2013 | | | Year Ended
September 30,
2012 | |
| |
Net asset value, beginning of period | | $ | 11.24 | | | $ | 11.65 | | | $ | 11.75 | | | $ | 10.99 | | | $ | 9.16 | |
Income/(loss) from investment
operations: | | | | | | | | | | | | | | | | | | | | |
Net investment income/(loss)(b) | | | 0.05 | | | | (0.04) | | | | 0.00(c) | | | | 0.04 | | | | 0.11 | |
Net realized and unrealized
gains/(losses) on investments | | | 0.47 | | | | (0.37) | | | | (0.10) | | | | 0.73 | | | | 1.77 | |
| |
Total from investment operations | | | 0.52 | | | | (0.41) | | | | (0.10) | | | | 0.77 | | | | 1.88 | |
| |
Less dividends and distributions: | | | | | | | | | | | | | | | | | | | | |
Dividends from net investment
income | | | – | | | | – | | | | – | | | | (0.00) | (d) | | | (0.05) | |
Distributions from net realized
gains | | | – | | | | – | | | | – | | | | (0.01) | | | | – | |
| |
Total dividends and distributions | | | – | | | | – | | | | – | | | | (0.01) | | | | (0.05) | |
| |
Net asset value, end of period | | $ | 11.76 | | | $ | 11.24 | | | $ | 11.65 | | | $ | 11.75 | | | $ | 10.99 | |
| |
Total Return(e) | | | 4.63 | % | | | (3.52) | % | | | (0.85) | % | | | 7.03 | % | | | 20.61% | |
Ratios and Supplemental Data | | | | | | | | | | | | | | | | | | | | |
Net assets, end of period (in 000s) | | $ | 2,829 | | | $ | 3,725 | | | $ | 4,089 | | | $ | 5,043 | | | $ | 6,309 | |
Ratio of expenses to average net assets | | | | | | | | | | | | | | | | | | | | |
Before expense limitation | | | 2.43 | % | | | 2.25 | % | | | 2.12 | % | | | 2.19 | % | | | 2.01% | |
After expense limitation/
recoupment (f) | | | 1.80 | % | | | 1.80 | % | | | 1.81 | % | | | 1.81 | % | | | 1.80% | |
Ratio of net investment
income/(loss) to average net assets | | | | | | | | | | | | | | | | | | | | |
Before expense limitation | | | (0.19) | % | | | (0.77) | % | | | (0.27) | % | | | (0.06) | % | | | 0.85% | |
After expense limitation/
recoupment | | | 0.44 | % | | | (0.32) | % | | | 0.04 | % | | | 0.32 | % | | | 1.06% | |
Portfolio turnover rate | | | 198 | % | | | 204 | % | | | 193 | % | | | 138 | % | | | 122% | |
| (a) | Class I shares merged into Class A on January 23, 2012. The results of each class prior to the merger may have been different than what is presented. |
| (b) | Calculated using the average shares method. |
| (c) | Amount less than $0.005. |
| (d) | Amount less than $(0.005). |
| (e) | The total return calculation excludes any sales charges. |
| (f) | The Fund’s operating expenses, not including interest expense, are contractually limited to the amounts discussed in Note 3. The ratios in these financial highlights reflect the limitation, including the interest expense, when applicable. |
| | |
The accompanying notes are an integral part of the financial statements. |
| Annual Report | September 30, 2016 | | 27 |
| | |
| ICON International Funds | | Notes to Financial Statements |
| | September 30, 2016 |
1. ORGANIZATION
The ICON Emerging Markets Fund (“Emerging Markets Fund”) and ICON International Equity Fund (“International Equity Fund”) are series funds (individually a “Fund” and collectively, the “Funds”). The Funds are part of the ICON Funds (the “Trust”), a Massachusetts business trust registered under the Investment Company Act of 1940, as amended (the “1940 Act”) as an open-end investment management company. Each Fund offers three classes of shares: Class S, Class C and Class A. All classes have equal rights as to earnings, assets and voting privileges except that each Class may bear different distribution fees, registration costs, legal costs, mailing and printing costs and shareholder servicing costs and each Class has exclusive voting rights with respect to its distribution plan. There are currently fifteen other active Funds within the Trust. Those Funds are covered by separate prospectuses and shareholder reports.
Each Fund is authorized to issue an unlimited number of no par shares. The Funds primarily invest in foreign securities; the Emerging Markets Fund primarily invests in securities of issuers whose principal activities are in emerging markets, or are economically tied to an emerging market country. The International Equity Fund primarily invests in foreign equity securities. Foreign equity securities refer to securities of issuers, wherever organized, whose securities are listed or traded principally on a recognized stock exchange or over-the-counter market outside the United States. The investment objective of each Fund is to provide long-term capital appreciation.
The Funds, like all investments in securities, have elements of risk, including risk of loss of principal. There is no assurance that the Funds will achieve their investment objectives and may underperform funds with similar investment objectives. An investment concentrated in sectors and industries involves greater risk and volatility than a more diversified investment. Investments in foreign securities and currency transactions may involve certain considerations and risks not typically associated with those of U.S. dollar-denominated transactions as a result of, among other factors, the possibility of less government supervision and regulation of foreign securities markets and the possibility of political or economic instability. Financial statements of foreign companies are governed by different accounting, auditing, and financial standards than U.S. companies and may be less transparent and uniform than in the United States. Many corporate governance standards, which help ensure the integrity of public information in the United States, may not exist in some foreign countries. In general, there may be less governmental supervision of foreign stock exchanges and securities brokers and issuers. There are also risks associated with small-and mid-cap investing, including limited product lines, less liquidity, and small market share. Securities of emerging or developing market companies may be less liquid and more volatile than securities in countries with more mature markets.
The Emerging Markets Fund has a significant weighting in South Korea which may cause the Fund’s performance to be susceptible to the economic, business and/or other developments that may affect that country.
In the normal course of business, the Funds may enter into various agreements that provide for general indemnifications. Each Fund’s maximum exposure under these arrangements is unknown as any potential exposure involving future claims that may be made against each Fund is unknown. However, based on experience, the Funds expect the risk of loss to be remote.
2. SIGNIFICANT ACCOUNTING POLICIES
The following is a summary of significant accounting policies consistently followed by the Funds in the preparation of their financial statements. The preparation of financial statements in conformity with accounting principles generally accepted in the United States of America (“GAAP”) requires management to make certain estimates and assumptions that affect the reported amounts of assets and liabilities, disclosure of contingent assets and liabilities at the date of the financial statements, and the reported amounts of income and expenses during the reporting period. Actual results may differ from these estimates. Each Fund is considered an investment company under GAAP and follows the accounting and reporting guidance applicable to investment companies in the Financial Accounting Standards Board Accounting Standards Codification Topic 946.
Investment Valuation
The Funds’ securities and other assets, excluding options on securities indexes, are valued at the closing price as of the close of regular trading on the New York Stock Exchange (the “NYSE”) (normally 4 p.m. Eastern Standard Time) each day the NYSE is open, except that securities traded primarily on the NASDAQ Stock Market (“NASDAQ”) are normally valued by the Funds at the NASDAQ Official Closing Price provided by NASDAQ each business day. If the NYSE closes unexpectedly and there is active trading on other exchanges, the securities will be valued at the Valuation Time based off of those exchanges. Options on securities indexes are valued at the close of the Chicago Board Options Exchange (normally 4:15 p.m. Eastern Standard Time) on each day the NYSE is open for trading.
The Funds use pricing services to obtain the market value of securities in their portfolios. If a pricing service is not able to provide a price, or the pricing service’s valuation is considered inaccurate or does not, in the Funds’ judgment, reflect the market value of the security, prices may be obtained through market quotations from independent broker/dealers. If market quotations from these sources are not readily available, the
| | |
| ICON International Funds | | Notes to Financial Statements |
| | September 30, 2016 |
Funds’ securities or other assets are valued at fair value as determined in good faith by the Funds’ Board of Trustees (the “Board”) or pursuant to procedures approved by the Board.
Lacking any sales that day, a security is valued at the current closing bid price (or yield equivalent thereof) or based on quotes obtained from dealers making a market for the security. Exchange traded options are valued at the composite price, using the National Best Bid and Offer quotes (“NBBO”). NBBO consists of the highest bid price and lowest ask price across any of the exchanges on which an option is quoted, thus providing a view across the entire U.S. options marketplace. Debt securities with a remaining maturity of greater than 60 days are valued using the evaluated bid price supplied by the pricing service. The evaluated bid price supplied by the pricing service is based upon a matrix valuation system which considers such factors as security prices, yields, maturities and ratings. Short-term debt securities with remaining maturities of 60 days or less are generally valued at amortized cost or original cost plus accrued interest, which approximates market value. Currency rates as of the close of the NYSE are used to convert foreign security values into U.S. dollars.
Securities of investment companies that trade on an exchange are valued at the last sales price or official closing price as of the close of the customary trading session on the exchange where the security is principally traded. Investments in shares of funds that are not traded on an exchange are valued at the end of day net asset value per share of such fund. Securities in the underlying funds, including restricted securities are valued in accordance with the valuation policy of such fund.
The Funds’ securities traded in countries outside of the Western Hemisphere are fair valued daily by utilizing the quotations of an independent pricing service, unless the Board determines that use of another valuation methodology is appropriate. The purposes of daily fair valuation are to avoid stale prices and to take into account, among other things, any significant events occurring after the close of foreign markets. The pricing service uses statistical analyses and quantitative models to adjust local market prices using factors such as subsequent movements and changes in the prices of indexes, securities and exchange rates in other markets to determine fair value as of the time a Fund calculates its net asset value (“NAV”). The valuation assigned to fair-value securities for purposes of calculating a Fund’s NAV may differ from the security’s most recent closing market price and from the prices used by other mutual funds to calculate their NAVs.
Various inputs are used to determine the value of the Funds’ investments. These inputs are summarized in the three broad levels listed below:
Level 1 — quoted prices in active markets for identical securities.
Level 2 — significant observable inputs other than Level 1 quoted prices (including, but not limited to, quoted prices for similar securities, interest rates, prepayment speeds, and credit risk).
Level 3 — significant unobservable inputs.
Observable inputs are those based on market data obtained from sources independent of the Funds, and unobservable inputs reflect the Funds’ own assumptions based on the best information available. The input levels are not necessarily an indication of the risk or liquidity associated with investments at that level. For example, non-U.S. equity securities actively traded in foreign markets may be reflected in Level 2 despite the availability of closing prices, because the Funds evaluate and determine whether those closing prices reflect fair value at the close of the NYSE or require adjustment, as described above. The following table summarizes the Funds’ investments, based on the inputs used to determine their values on September 30, 2016:
ICON Emerging Markets Fund
| | | | | | | | | | | | | | | | |
Investments in Securities at Value* | | Level 1 - Quoted and Unadjusted Prices | | | Level 2 - Other Significant Observable Inputs | | | Level 3 - Significant Unobservable Inputs | | | Total | |
| | | | |
| | | | |
Common Stocks | | | | | | | | | | | | | | | | |
Gas Utilities | | $ | 373,954 | | | $ | 377,916 | | | $ | – | | | $ | 751,870 | |
Oil & Gas Exploration & Production | | | 145,699 | | | | 933,520 | | | | – | | | | 1,079,219 | |
Packaged Foods & Meats | | | 181,281 | | | | 809,671 | | | | – | | | | 990,952 | |
Pharmaceuticals | | | 138,030 | | | | 1,582,099 | | | | – | | | | 1,720,129 | |
Semiconductors | | | 262,169 | | | | 658,130 | | | | – | | | | 920,299 | |
Other | | | 2,780,826 | | | | 41,158,124 | | | | – | | | | 43,938,950 | |
Short-Term Investments | | | | | | | | | | | | | | | | |
Money Market Funds | | | 3,000,000 | | | | – | | | | – | | | | 3,000,000 | |
Time Deposits | | | – | | | | 6,548,311 | | | | – | | | | 6,548,311 | |
Total | | $ | 6,881,959 | | | $ | 52,067,771 | | | $ | – | | | $ | 58,949,730 | |
| | |
| |
| Annual Report | September 30, 2016 | | 29 |
| | |
| ICON International Funds | | Notes to Financial Statements |
| | September 30, 2016 |
ICON International Equity Fund
| | | | | | | | | | | | | | | | |
| Investments in Securities at Value* | | Level 1 - Quoted
and Unadjusted
Prices | | | Level 2 - Other
Significant
Observable Inputs | | | Level 3 - Significant
Unobservable
Inputs | | | Total | |
Common Stocks | | | | | | | | | | | | | | | | |
Biotechnology | | $ | 931,274 | | | $ | 963,296 | | | $ | – | | | $ | 1,894,570 | |
Data Processing & Outsourced Services | | | 418,027 | | | | 774,107 | | | | – | | | | 1,192,134 | |
Gas Utilities | | | 233,722 | | | | 203,059 | | | | – | | | | 436,781 | |
Gold | | | 1,122,419 | | | | 1,918,766 | | | | – | | | | 3,041,185 | |
Multi-Utilities | | | 842,796 | | | | 1,232,363 | | | | – | | | | 2,075,159 | |
Pharmaceuticals | | | 853,408 | | | | 3,996,827 | | | | – | | | | 4,850,235 | |
Other | | | 2,012,401 | | | | 34,385,136 | | | | – | | | | 36,397,537 | |
Preferred Stocks | | | 79,729 | | | | – | | | | – | | | | 79,729 | |
Collateral for Securities on Loan | | | – | | | | 4,165,210 | | | | – | | | | 4,165,210 | |
Short-Term Investments | | | – | | | | 7,794,962 | | | | – | | | | 7,794,962 | |
Total | | $ | 6,493,776 | | | $ | 55,433,726 | | | $ | – | | | $ | 61,927,502 | |
| * | Please refer to the Schedule of Investments and the Sector/Industry Classification and Country Composition tables for additional security details. |
There were no Level 3 securities held in any of the Funds at September 30, 2016.
For the Emerging Markets Fund, there was no transfer activity between Level 1 and Level 2 for the year ended September 30, 2016.
For the International Equity Fund, common stocks valued at $801,016 were transferred from Level 1 to Level 2 during the year ended September 30, 2016. At September 30, 2015, these securities were valued using quoted market prices in active markets without using fair value adjustment factors; at September 30, 2016, these securities were valued using quoted market prices in active markets with fair value adjustment factors.
The end of period timing recognition is used for the transfers between levels of each Fund’s assets and liabilities.
Fund Share Valuation
Fund shares are sold and redeemed on a daily basis at net asset value. Net asset value per share is determined daily as of the close of trading on the NYSE on each day the NYSE is open for trading by dividing the total value of the Fund’s investments and other assets, less liabilities, by the number of Fund shares outstanding.
Foreign Currency Translation
The accounting records of the Funds are maintained in U.S. dollars. Investment securities and other assets and liabilities denominated in a foreign currency are translated daily into U.S. dollars at the prevailing rates of exchange. Income and expenses are translated into U.S. dollars at the prevailing exchange rate on the respective dates of the transactions. Purchases and sales of securities are translated into U.S. dollars at the contractual currency exchange rates established at the time of each trade.
The Funds do not isolate that portion of the results of operations resulting from changes in foreign exchange rates on investments from the fluctuations arising from changes in market prices of securities held. Net unrealized appreciation or depreciation on investments and foreign currency translations arise from changes in the value of assets and liabilities resulting from changes in the exchange rates and changes in market prices of securities held.
Forward Foreign Currency Contracts
The Funds may enter into short-term forward foreign currency contracts. A forward foreign currency contract is an agreement between contracting parties to exchange an amount of currency at some future time at an agreed upon rate. The Funds use forward foreign currency contracts to manage foreign currency exposure with respect to transactional hedging, positional hedging, cross hedging and proxy hedging.
These contracts involve market risk and do not eliminate fluctuations in the prices of portfolio securities or prevent losses if the prices of those securities decline. The Funds could be exposed to risk if the value of the currency changes unfavorably. Additionally, the Funds could be exposed to counterparty risk if the counterparties are unable to meet the terms of the contracts.
| | |
| ICON International Funds | | Notes to Financial Statements |
| | September 30, 2016 |
These contracts are marked-to-market daily. Net realized gains and losses on foreign currency transactions represent disposition of foreign currencies, and the difference between the amount recorded at the time of the transaction and the U.S. dollar amount actually received. Any realized gain or loss incurred by the Funds due to foreign currency translation is included on the Statements of Operations. At September 30, 2016 and for the year then ended, the Emerging Markets Fund and International Equity Fund had no outstanding forward foreign currency contracts.
Securities Lending
Under procedures adopted by the Board, the Funds may lend securities to certain approved brokers, dealers and other financial institutions to earn additional income. Cash collateral is received in exchange for securities on loan in the amount of at least 102% of the value of U.S. securities loaned or at least 105% of the value of non-U.S. securities loaned, marked to market daily. The Funds retain certain benefits of owning the securities, including receipt of dividends or interest generated by the security, but give up other rights including the right to vote proxies. The Funds retain the ability to recall the loans at any time and could do so in order to vote proxies or to sell the loaned securities. Each loan is collateralized by cash that generally exceeds the value of the securities on loan. The market value of the loaned securities is determined daily at the close of business of the Funds and any additional required collateral is delivered to each Fund on the next business day.
Generally, in the event of borrower default, the Funds have the right to use the collateral to offset any losses incurred. In the event the Funds are delayed or prevented from exercising their rights to dispose of the collateral, there may be a potential loss to the Funds. Some of these losses may be indemnified by the lending agent.
The Funds have elected to invest the cash collateral in the State Street Navigator Prime Portfolio which is disclosed on the Schedule of Investments. The Funds bear the risk of loss with respect to the investment of collateral. The net securities lending income earned by the Funds for the year ended September 30, 2016, is included in the Statements of Operations.
The value of the collateral could include collateral held for securities that were sold on or before September 30, 2016. It may also include collateral received from the pre-funding of security loans.
The following table indicates the total amount of securities loaned by type, reconciled to gross liability payable upon return of the securities loaned by the Fund as of September 30, 2016:
| | | | | | | | | | | | | | | | | | | | | | | | | | | | |
| | | Remaining contractual maturity of the lending agreement | | | | | | | |
| | | Overnight &
Continuous | | | Up to 30 days | | | 30-90 days | | | Greater than
90 days | | | Market Value | | | Collateral
Received | | | Excess amount
due to
counterparty | |
Securities Lending Transactions | | | | | | | | | | | | | | | | | | | | | | | | | | | | |
ICON International Equity Fund | | | | | | | | | | | | | | | | | | | | | | | | | | | | |
Equity Securities | | $ | 3,991,129 | | | $ | – | | | $ | – | | | $ | – | | | $ | 3,991,129 | | | $ | 4,165,210 | | | $ | 174,081 | |
Income Taxes, Dividends, and Distributions
The Funds intend to continue to qualify as regulated investment companies under Subchapter M of the Internal Revenue Code and, accordingly, the Funds will generally not be subject to federal and state income taxes or federal excise taxes to the extent that they intend to make sufficient distributions of net investment income and net realized capital gains.
Dividends paid by the Funds from net investment income and distributions of net realized short-term gains are, for federal income tax purposes, taxable as ordinary income to shareholders.
Dividends and distributions to shareholders are recorded by the Funds on the ex-dividend/distribution date. The Funds distribute income and net realized capital gains, if any, to shareholders at least annually, if not offset by capital loss carryforward. The Funds may utilize equalization accounting for tax purposes and designate earnings and profits, including net realized gains distributed to shareholders on redemption of shares, as part of the dividends paid deduction for income tax purposes. Income distributions and capital gain distributions are determined in accordance with income tax regulations, which may differ from accounting principles generally accepted in the United States of America.
Management has analyzed the Funds’ tax positions taken on federal income tax returns for all open tax years and has concluded that no provision for federal income tax is required in the Funds’ financial statements.
The Funds file U.S. tax returns. While the statute of limitations remains open to examine the Funds’ U.S. tax returns filed for the past three years, no examinations are in progress or anticipated at this time. The Funds are not aware of any tax positions for which it is reasonably possible that the total amounts of unrecognized tax benefits will significantly change in the next twelve months.
| | |
| |
| Annual Report | September 30, 2016 | | 31 |
| | |
| ICON International Funds | | Notes to Financial Statements |
| | September 30, 2016 |
Certain foreign countries impose a capital gains tax which is accrued by the Funds based on the unrealized appreciation, if any, on affected securities. Any accrual would reduce a Fund’s NAV. The tax is paid when the gain is realized and is included in capital gains tax in the Statements of Operations.
Investment Income
Dividend income is recorded on the ex-dividend date. Non-cash dividends included in dividend income, if any, are recorded at the fair value of the securities received. Interest income is accrued as earned. Certain dividends from foreign securities are recorded as soon as the Funds are informed of the dividend if such information is obtained subsequent to the ex-dividend date. Discounts and premiums on fixed income securities purchased are accreted or amortized to income over the life of the respective securities based on effective yield.
Investment Transactions
Security transactions are accounted for no later than one business day after the trade date. However, for financial reporting purposes, security transactions are accounted for on the trade date. Gains and losses on securities sold are determined on the basis of identified cost.
Withholding Tax
Withholding taxes on foreign dividends have been provided for in accordance with the Funds’ understanding of the applicable country’s tax rules and rates. The ability of issuers of debt securities held by the Funds to meet their obligations may be effected by economic and political developments in specific country or region.
Other
The Funds hold certain investments which pay dividends to their shareholders based upon available funds from operations. It is possible for these dividends to exceed the underlying investments’ taxable earnings and profits resulting in the excess portion of such dividends being designated as a return of capital. Distributions received from investments in securities that represent a return of capital or capital gains are recorded as a reduction of the cost of investments or as a realized gain, respectively.
Allocation of Expenses
Each class of a Fund’s shares bears expenses incurred specifically on its behalf and, in addition, each class bears a portion of general expenses, based upon relative net assets of each class. Expenses which cannot be directly attributed to a specific Fund in the Trust are apportioned between all Funds in the Trust based upon relative net assets. In calculating the net asset value per share of each class, investment income, realized and unrealized gains and losses and expenses other than class-specific expenses are allocated daily to each class of shares based upon the proportion of net assets.
Below are additional class level expenses that are included on the Statements of Operations:
| | | | | | | | | | | | |
| Fund | | Printing Fees | | | Transfer Agent Fees* | | | Registration Fees | |
ICON Emerging Markets Fund | | | | | | | | | | | | |
Class S | | | $ 12,054 | | | | $ 64,026 | | | | $ 15,530 | |
Class C | | | 703 | | | | 2,903�� | | | | 9,757 | |
Class A | | | 2,174 | | | | 12,735 | | | | 9,339 | |
ICON International Equity Fund | | | | | | | | | | | | |
Class S | | | 11,895 | | | | 41,326 | | | | 14,467 | |
Class C | | | 1,366 | | | | 13,286 | | | | 9,548 | |
Class A | | | 1,848 | | | | 14,206 | | | | 11,855 | |
| * | Transfer agent out of pocket fees are a Fund level expense. |
| | |
| ICON International Funds | | Notes to Financial Statements |
| | September 30, 2016 |
3. FEES AND OTHER TRANSACTIONS WITH AFFILIATES
Investment Advisory Fees
ICON Advisers, Inc. (“ICON Advisers”) serves as investment adviser to the Funds and is responsible for managing the Funds’ portfolios of securities. ICON Advisers receives a monthly management fee that is computed daily at an annual rate of 1.00% of each Fund’s average daily net assets. ICON Advisers has contractually agreed to limit the Funds’ operating expenses (exclusive of brokerage, interest, taxes, acquired fund fees and expenses and extraordinary expenses) to the extent necessary to ensure that the Funds’ expenses do not exceed the following amounts:
| | | | | | |
| Fund | | Class S | | Class C | | Class A |
ICON Emerging Markets Fund | | 1.55% | | 2.55% | | 1.80% |
ICON International Equity Fund | | 1.55% | | 2.55% | | 1.80% |
The Funds’ expense limitations will continue in effect until at least January 31, 2021 for Class A, Class C and International Equity Fund Class S. Effective May 5, 2014, ICON Advisers contractually agreed to limit the total expenses of the Emerging Markets Fund Class S shares to an annual rate of 1.55% in effect until at least January 31, 2017. To the extent ICON Advisers reimburses or absorbs fees and expenses, it may seek payment of such amounts for up to three years after the expenses were reimbursed or absorbed. A Fund will make no such payment, however, if the total Fund operating expenses exceed the expense limits in effect at the time these payments are proposed.
As of September 30, 2016 the following amounts were available for recoupment by ICON Advisers based upon their potential expiration dates:
| | | | | | | | | | | | | | | | | | | | | | | | |
| Fund | | | | | Expires 2017 | | | | | | Expires 2018 | | | | | | Expires 2019 | |
ICON Emerging Markets Fund | | $ | | | | | 49,592 | | | $ | | | | | 128,006 | | | $ | | | | | 119,653 | |
ICON International Equity Fund | | | | | | | 29,665 | | | | | | | | 34,662 | | | | | | | | 38,568 | |
Accounting, Custody and Transfer Agent Fees
Effective March 1, 2016, ALPS Fund Services (“ALPS”) serves as the fund accounting agent for the Funds. Prior to March 1, 2016, State Street Bank and Trust Company (“State Street”) served as the fund accounting agent for the Funds. For its services, the Trust pays ALPS a fee that is calculated daily and paid monthly at an annual rate based on the aggregate average daily net assets of the Trust.
State Street is the custodian of the Trust’s investments. For its services, the Trust pays State Street asset-based fees that vary according to the number of positions and transactions, plus out-of-pocket expenses.
Effective April 9, 2016, ALPS became the transfer agent for the Trust. For these services, the Trust pays an annual fee plus annual base fee per Fund, per account fees and out-of-pocket expenses. Prior to April 9, 2016, Boston Financial Data Services, Inc. was the Trust’s transfer agent.
Administrative Services
The Trust has entered into an administrative services agreement with ICON Advisers pursuant to which ICON Advisers oversees the administration of the Trust’s business and affairs. This agreement provides for an annual fee of 0.05% on the Trust’s first $1.5 billion of average daily net assets, 0.045% on the next $1.5 billion of average daily net assets, 0.040% on the next $2 billion of average daily net assets and 0.030% on average daily net assets over $5 billion. For the year ended September 30, 2016, each Fund’s payment for administrative services to ICON Advisers is included on the Statements of Operations. The administrative services agreement provides that ICON Advisers will not be liable for any error of judgment, mistake of law, or any loss suffered by the Trust in connection with matters to which the administrative services agreement relates, except for a loss resulting from willful misfeasance, bad faith or negligence by ICON Advisers in the performance of its duties.
Effective March 1, 2016, ICON Advisers has a sub-administration agreement with ALPS under which ALPS assists ICON Advisers with the administration and business affairs of the Trust. For its services, ICON Advisers pays ALPS a fee that is calculated daily and paid monthly at an annual rate based on the aggregate average daily net assets of the Trust. Prior to March 1, 2016, the sub-administration agreement was between ICON Advisers and State Street.
Distribution Fees
The Funds have adopted a non-compensatory Distribution Plan pursuant to Rule 12b-1 under the 1940 Act (“12b-1 Plan”) under which the Funds are authorized to compensate the Funds’ distributor, ICON Distributors, Inc. (“IDI”) (an affiliate of the adviser) for the sale and distribution of shares
| | |
| |
| Annual Report | September 30, 2016 | | 33 |
| | |
| ICON International Funds | | Notes to Financial Statements |
| | September 30, 2016 |
and for other shareholder services. Under the 12b-1 Plan, the Distribution Plan provides for reimbursement of expenses incurred by IDI related to distribution and marketing. The shareholders of the Funds pay an annual distribution and service fee of 1.00% of average daily net assets for Class C shares and an annual distribution and service fee of 0.25% of average daily net assets for Class A shares. There is no annual distribution and service fee for Class S shares. The total amount paid under the 12b-1 plans by the Funds is shown on the Statements of Operations.
In addition, IDI, as Distributor, receives a contingent deferred sales charge at a rate of 1.00% of the purchase price for the sale of Class C shares within one year of purchase. For Class A shares, the public offering price equals net asset value plus the applicable sales charge, which is a maximum of 5.75%. IDI receives a portion of this sales charge and may redistribute it as dealer discounts and brokerage commissions to non-related parties.
Other Related Parties
Certain Officers and Directors of ICON Advisers are also Officers and Trustees of the Funds; however, such Officers and Trustees (with the exception of the Chief Compliance Officer, “CCO”) receive no compensation from the Funds. The Trust paid 95% of the CCO’s salary and the remaining portion, along with other employee related expenses, is paid by ICON Advisers. For the year ended September 30, 2016, the total related amounts paid by the Funds under this arrangement are included in Other Expenses on the Statements of Operations.
The Funds may reimburse ICON Advisers for legal work performed for the Funds by its attorneys outside of the advisory and administration contracts. The Board of Trustees reviews and approves such reimbursements. For the year ended September 30, 2016, the total related amounts paid by the Funds under this arrangement was $1,718 and is included in Other Expenses on the Statements of Operations.
The Funds engaged in cross trades with each other during the year ended September 30, 2016 pursuant to Rule 17a-7 under the 1940 Act. Generally, cross trading is the buying or selling of portfolio securities between funds to which the Adviser serves as the investment adviser. The Board of Trustees previously adopted procedures that apply to transactions between the Funds and its affiliates pursuant to Rule 17a-7. At its regularly scheduled meetings, the Board of Trustees reviews such transactions as of the most current calendar quarter for compliance with the requirements set forth by Rule 17a-7 and the Funds’ procedures. The procedures require that the transactions be a purchase or sale for no consideration other than cash payment against prompt delivery of a security for which market quotations are readily available, and be consistent with the investment policies of each Fund.
4. BORROWINGS
The Trust has entered into a uncommitted, unsecured, revolving Line of Credit agreement/arrangement with State Street to provide temporary funding for redemption requests. Effective March 21, 2016, the maximum borrowing limit was changed from $75 million to $50 million. Interest on domestic borrowings is charged at a rate quoted and determined by State Street. The Line of Credit agreement/arrangement expires on March 20, 2017.
For the year ended September 30, 2016, there were no outstanding borrowings under this agreement/arrangement.
5. PURCHASES AND SALES OF INVESTMENT SECURITIES
For the year ended September 30, 2016, the aggregate cost of purchases and proceeds from sales of securities (excluding short-term securities) was as follows:
| | | | | | |
| Fund | | Purchases of
Securities | | | Proceeds from Sales
of Securities |
ICON Emerging Markets Fund | | $ | 74,101,089 | | | $ 43,680,300 |
ICON International Equity Fund | | | 111,325,450 | | | 132,122,729 |
6. FEDERAL INCOME TAX
The following information is presented on an income tax basis. Differences between GAAP and federal income tax purposes that are permanent in nature are reclassified within the capital accounts. Temporary differences do not require reclassification. Temporary and permanent differences do not impact the NAVs of the Funds. These differences are due to differing treatments for items such as passive foreign investment companies, foreign currency transactions, foreign capital gain tax treatment, and net investment losses.
| | |
| ICON International Funds | | Notes to Financial Statements |
| | September 30, 2016 |
For the year ended September 30, 2016 the following Funds had capital loss carryforwards:
| | | | | | | | |
| Fund | | Expiring in 2017 | | | Expiring in 2018 | |
ICON Emerging Markets Fund | | $ | 5,511,331 | | | $ | – | |
ICON International Equity Fund | | | 53,195,839 | | | | 27,012,993 | |
For Emerging Markets Fund, the capital loss carryovers used during the year ended September 30, 2016 was $1,965,204.
For International Equity Fund, the short-term and long-term capital losses with no expiration were $5,701,835 and $1,856,542, respectively.
Under the Regulated Investment Company Modernization Act of 2010 (the “Act”) capital losses generated by a Fund may be carried over indefinitely, but these losses must be used prior to the utilization of any pre-enactment capital losses. Since pre-enactment capital losses may only be carried forward for eight years there may be a greater likelihood that all or a portion of each Fund’s pre-enactment capital losses will expire unused.
The Funds did not pay distributions to shareholders during the fiscal year ended September 30, 2016.
The tax characteristics of distributions paid to shareholders during the fiscal year ended September 30, 2015, were as follows:
| | | | | | | | |
| Fund | | Ordinary Income | | | Long-Term Capital Gains | |
ICON International Equity Fund | | $ | 71,689 | | | $ | - | |
As of September 30, 2016, the components of accumulated earnings/(deficit) on a tax basis were as follows:
| | | | | | | | | | | | | | | | | | | | |
| Fund | | Undistributed
Ordinary Income | | | Late Year Loss
Deferral* | | | Capital Loss
Carryforward | | | Unrealized
Appreciation/
(Depreciation)** | | | Total Accumulated
Earnings/(Deficit) | |
ICON Emerging Markets Fund | | $ | – | | | $ | (17,461) | | | $ | (5,511,331) | | | $ | 913,047 | | | $ | (4,615,745) | |
ICON International Equity Fund | | | – | | | | (3,287,282) | | | | (87,767,209) | | | | (953,654) | | | | (92,008,145) | |
| * | The Funds have elected to defer certain qualified late-year losses in accordance with federal income tax rules. These losses are treated as having arisen on the first day of the following fiscal year. |
| ** | Differences between the book-basis and tax-basis unrealized appreciation/(depreciation) are attributable primarily to investments in passive foreign investment companies. |
As of September 30, 2016, cost on investments for federal income tax purposes and the amount of net unrealized appreciation/(depreciation) were as follows:
| | | | | | | | | | | | | | | | | | | | | | | | |
| Fund | | Gross Appreciation
(excess of value over
tax cost) | | | Gross Depreciation
(excess of tax cost
over value) | | | Net Appreciation/
(Depreciation) of
Foreign Currency | | | Net Unrealized
Appreciation/
(Depreciation) | | | Cost of Investments
for Income Tax
Purposes | |
ICON Emerging Markets Fund | | $ | 3,207,947 | | | $ | (2,295,453) | | | $ | 553 | | | $ | | | | | 913,047 | | | $ | 58,037,236 | |
ICON International Equity Fund | | | 2,875,956 | | | | (3,827,090) | | | | (2,520) | | | | | | | | (953,654) | | | | 62,878,636 | |
7. SUBSEQUENT EVENTS
On October 14, 2016, the State Street Navigator Prime Portfolio, the collateral vehicle for securities lending, became the State Street Navigator Securities Lending Government Money Market Portfolio (“Government Money Market Portfolio”). The Government Money Market Portfolio will seek: (i) current income to the extent consistent with the preservation of capital and liquidity; and (ii) the maintenance of a stable $1.00 per share net asset value.
On November 14, 2016, the ICON Funds Board of Trustees approved the closing of ICON Emerging Markets Class C shares to new investors effective immediately and the merger of the ICON Emerging Markets Class C shares into the Class A shares on or around February 15, 2017.
8. CHANGE OF INDEPENDENT REGISTERED PUBLIC ACCOUNTING FIRM
The Audit Committee of the Board of the Funds dismissed PricewaterhouseCoopers LLP (“PwC”), as the independent registered public accounting firm of the Funds and appointed Cohen & Company, Ltd. (“Cohen”) effective July 27, 2016.
| | |
| |
| Annual Report | September 30, 2016 | | 35 |
| | |
| ICON International Funds | | Report of Independent Registered Public Accounting Firm |
| | |
To the Shareholders and Board of Trustees of
ICON Funds
We have audited the accompanying statements of assets and liabilities, including the schedules of investments, of the ICON Emerging Markets Fund and ICON International Fund (the “Funds”, each a series of ICON Funds) as of September 30, 2016, and the related statements of operations and changes in net assets, and the financial highlights for the year then ended. These financial statements and financial highlights are the responsibility of the Funds’ management. Our responsibility is to express an opinion on these financial statements and financial highlights based on our audit. The Funds’ financial statements and financial highlights for the years ended September 30, 2015 and prior, were audited by other auditors, whose report dated November 18, 2015 expressed an unqualified opinion on those financial statements and financial highlights.
We conducted our audit in accordance with the standards of the Public Company Accounting Oversight Board (United States). Those standards require that we plan and perform the audit to obtain reasonable assurance about whether the financial statements and financial highlights are free of material misstatement. An audit includes examining, on a test basis, evidence supporting the amounts and disclosures in the financial statements. Our procedures included confirmation of securities owned as of September 30, 2016, by correspondence with the custodian and brokers or by other appropriate auditing procedures where replies from brokers were not received. An audit also includes assessing the accounting principles used and significant estimates made by management, as well as evaluating the overall financial statement presentation. We believe that our audit provides a reasonable basis for our opinion.
In our opinion, the financial statements and financial highlights referred to above present fairly, in all material respects, the financial position of each of the Funds as of September 30, 2016, the results of their operations, the changes in their net assets, and their financial highlights for year then ended, in conformity with accounting principles generally accepted in the United States of America.
COHEN & COMPANY, LTD.
Cleveland, Ohio
November 23, 2016
| | |
| ICON International Funds | | Disclosure of Fund Expenses |
| | September 30, 2016 (Unaudited) |
Example
As a shareholder of a Fund you may pay two types of fees: transaction fees and fund-related fees. Certain funds charge transaction fees, including sales charges (loads) on purchase payments, reinvested dividends, or other distributions; redemption fees; and exchange fees. Funds also incur various ongoing expenses, including management fees, distribution and/or service fees, and other fund expenses, which are indirectly paid by shareholders.
This Example is intended to help you understand your ongoing costs (in dollars) of investing in the various ICON Funds and to compare these costs with the ongoing costs of investing in other mutual funds. This Example is based on an investment of $1,000 invested at the beginning of the six-month period and held for the six-month period (4/01/16 – 9/30/16).
Actual Expenses
The first line in the table for each Fund provides information about actual account values and actual expenses. The Example includes, but is not limited to, management fees, 12b-1 fees, fund accounting, custody and transfer agent fees. However, the Example does not include client specific fees, such as the $15 fee charged to IRA accounts, or the $15 fee charged for wire redemptions. You may use this information, together with the amount you invested, to estimate the expenses that you paid over the period. Simply divide your account value by $1,000 (for example, an $8,600 account value divided by $1,000 = 8.6), then multiply the result by the number in the first line for each Fund under the heading entitled “Expenses Paid During Period” to estimate the expenses you paid on your account during this period.
Hypothetical Example for Comparison Purposes
The second line in the table for each Fund provides information about hypothetical account values and hypothetical expenses based on the Fund’s actual expense ratio and an assumed rate of return of 5% per year before expenses, which is not the Fund’s actual return. The hypothetical account values and expenses may not be used to estimate the actual ending account balance or expenses you paid for the period. You may use this information to compare the ongoing costs of investing in the Fund and other funds. To do so, compare this 5% hypothetical example with the 5% hypothetical examples that appear in the shareholder reports of the other funds. Please note that the expenses shown in the table are meant to highlight your ongoing costs only and do not reflect any transactional costs, such as sales charges (loads), redemption fees, or exchange fees that may be charged by other funds. Therefore, this information is useful in comparing ongoing costs only, and will not help you determine the relative total costs of owning different funds.
| | | | | | | | |
| | | Beginning Account
Value April 1, 2016 | | Ending Account
Value
September 30, 2016 | | Expense Ratio(a) | | Expenses Paid
During period April 1, 2016 -
September 30, 2016(b) |
ICON Emerging Markets Fund | | | | | | | | |
Class S | | | | | | | | |
Actual | | $ 1,000.00 | | $ 1,060.10 | | 1.55% | | $ 7.98 |
Hypothetical (5% return before expenses) | | $ 1,000.00 | | $ 1,017.25 | | 1.55% | | $ 7.82 |
Class C | | | | | | | | |
Actual | | $ 1,000.00 | | $ 1,055.00 | | 2.55% | | $ 13.10 |
Hypothetical (5% return before expenses) | | $ 1,000.00 | | $ 1,012.25 | | 2.55% | | $ 12.83 |
Class A | | | | | | | | |
Actual | | $ 1,000.00 | | $ 1,058.90 | | 1.80% | | $ 9.27 |
Hypothetical (5% return before expenses) | | $ 1,000.00 | | $ 1,016.00 | | 1.80% | | $ 9.07 |
| | | | |
ICON International Equity Fund | | | | | | | | |
Class S | | | | | | | | |
Actual | | $ 1,000.00 | | $ 1,032.90 | | 1.45% | | $ 7.37 |
Hypothetical (5% return before expenses) | | $ 1,000.00 | | $ 1,017.75 | | 1.45% | | $ 7.31 |
Class C | | | | | | | | |
Actual | | $ 1,000.00 | | $ 1,027.00 | | 2.55% | | $ 12.92 |
Hypothetical (5% return before expenses) | | $ 1,000.00 | | $ 1,012.25 | | 2.55% | | $ 12.83 |
Class A | | | | | | | | |
Actual | | $ 1,000.00 | | $ 1,030.70 | | 1.80% | | $ 9.14 |
Hypothetical (5% return before expenses) | | $ 1,000.00 | | $ 1,016.00 | | 1.80% | | $ 9.07 |
| | |
| |
| Annual Report | September 30, 2016 | | 37 |
| | |
| ICON International Funds | | Disclosure of Fund Expenses |
| | September 30, 2016 (Unaudited) |
| (a) | The Fund’s expense ratios have been annualized based on the Fund’s most recent fiscal half-year expenses. |
| (b) | Expenses are equal to the Fund’s annualized expense ratio multiplied by the average account value over the period, multiplied by the number of days in the most recent fiscal half-year 183/366 (to reflect the half-year period). |
Total returns exclude applicable sales charges. If sales charges were included (maximum 5.75%), returns would be lower.
| | |
| ICON International Funds | | Board of Trustees and Fund Officers |
| | September 30, 2016 (Unaudited) |
The ICON Funds Board of Trustees (the “Board”) consists of four Trustees who oversee the 17 ICON Funds (the “Funds”). The Board is responsible for general oversight of the Funds’ business and for assuring that the Funds are managed in the best interest of the Funds’ shareholders. The Trustees, and their ages, and principal occupations are set forth below. The address of the Trustees is 5299 DTC Blvd., Suite 1200, Greenwood Village, CO 80111. Trustees have no official term of office and generally serve until they resign or are not re-elected.
Interested Trustee
Craig T. Callahan, 65, Chairman of the Board. Dr. Callahan has been a Trustee of the Funds since their inception. Dr. Callahan also serves as Chief Executive Officer (2013 to present); and Chairman of the Investment Committee (2005 to present) and served as the Chief Investment Officer (1991 to 2004) and President (2008 to 2013 and 2014 to present) of ICON Advisers. Dr. Callahan is also Executive Vice President (2005 to present); Director (1991 to present); and was previously President (1998 to 2005) and Chief Compliance Officer (2005) of IDI. Dr. Callahan also serves as the President (1998 to present) and Chairman of the Board of Directors (1994 to present) of ICON Management & Research Corporation (“IM&R”), the parent company of ICON Advisers and IDI.
Independent Trustees
Glen F. Bergert, 66. Mr. Bergert has been a Trustee of the Funds since 1999. Mr. Bergert is President of Venture Capital Management LLC (1997 to present), General Partner of SOGNO Partners LP, a venture capital company (2001 to 2015), General Partner of Bergert Properties, LLP, a real estate holding company (1997 to present), General Partner of Pyramid Real Estate Partnership, a real estate development company (1998 to present), General Partner of Chamois Partners, LP, a venture capital company (2004 to present) and was previously a General Partner with KPMG Peat Marwick, LLP (1979 to 1997). Mr. Bergert is also a Director of Delta Dental of California, an insurance company (2013 to present and 2006 to 2012), Delta Dental of Pennsylvania, an insurance company (1998 to 2009 and 2010 to present), Dentegra Group, Inc, an insurance holding company (2010 to 2014) and Delta Reinsurance Corporation (2015 to present; 2011 to 2014 and 2000 to 2009).
John C. Pomeroy, Jr., 69. Mr. Pomeroy has been a Trustee of the Funds since November 2002. Mr. Pomeroy is Chief Investment Officer and Director of Investments, Pennsylvania State University (2001 to present) and was Portfolio Manager and Product Manager, Trinity Investment Management Corporation (1989 to 2001).
R. Michael Sentel, 68. Mr. Sentel has been a Trustee of the Funds since their inception. Mr. Sentel is a Senior Attorney with the U.S. Department of Education (1996 to present). Mr. Sentel also provides legal representation as a sole practitioner with an emphasis on corporate and transactional law. He served as general counsel to numerous public companies and served on the board of directors of one of these clients. Mr. Sentel began his legal career with the U.S. Securities and Exchange Commission’s Division of Enforcement and served as a Branch Chief (1980 to 1981). Later he served as the Section Chief for the Professional Liability Section of the Federal Deposit Insurance Corp. with responsibility for the Rocky Mountain Region (1991 to 1994).
The Officers of the Funds are:
Craig T. Callahan, 65, Chairman of the Board. Dr. Callahan has been a Trustee of the Funds since their inception. Dr. Callahan also serves as Chief Executive Officer (2013 to present); President (1998 to 2013 and 2014 to present) and Chairman of the Investment Committee (2005 to present) and served as the Chief Investment Officer (1991 to 2004) of ICON Advisers. Dr. Callahan is also Executive Vice President (2005 to present); Director (1991 to present); and was previously President (1998 to 2005) and Chief Compliance Officer (2005) of IDI. Dr. Callahan also serves as the President (1998 to present) and Chairman of the Board of Directors (1994 to present) of IM&R, the parent company of ICON Advisers and IDI.
Donald Salcito, 63. Mr. Salcito serves as Vice President and Secretary of the Funds (November 15, 2006 to present). Mr. Salcito is also Executive Vice President and General Counsel (September 2005 to present) of ICON Advisers; Director of IM&R (2005 to present); Executive Vice President, Secretary, General Counsel of IDI (2005 to present). Previously, he was a Partner in various national law firms, practicing in the securities law area. (1980 to 2005).
Carrie M. Schoffman, 43. Ms. Schoffman has been a Vice President and Principal Financial Officer/Treasurer of the Funds since June 2013. Ms. Schoffman is also Chief Compliance Officer (2013 to present and 2004 to 2008) and Anti-Money Laundering Officer (2013 to present) of the ICON Funds. She is Senior Vice President (2011 to present) and Chief Compliance Officer (2013 to present and 2004 to 2011) of ICON Advisers. Previously, she was a Staff Accountant with the Securities and Exchange Commission (2003 to 2004) and also an Experienced Manager (2001 to 2003) and a Senior Associate/Associate (1996 to 2001) at PricewaterhouseCoopers LLP.
Lesley Caviness, 50. Ms. Caviness serves as Assistant Treasurer of the Funds (2014 to present). She has worked at ICON (2007 to 2008 and 2010 to present) in fund accounting, compliance, business intelligence and performance capacities. Prior to working at ICON, Ms. Caviness was a Real Estate Broker at Seasons Real Estate Group (2008 to 2012) and Signature Real Estate (2014 to present), Finance Manager at Navigant (2000 to 2007), and Associate/Senior Associate (1996 to 2000) at PricewaterhouseCoopers LLP.
| | |
| |
| Annual Report | September 30, 2016 | | 39 |
| | |
| ICON International Funds | | Additional Information |
| | September 30, 2016 (Unaudited) |
Renewal of Investment Advisory Agreement
On August 22, 2016, the Board of Trustees, including all of the Trustees that are not “interested persons” of the Trust (the “Independent Trustees”), approved continuation of the Advisory Agreements (as defined below) with the Adviser for each Fund for an additional one-year term commencing October 1, 2016.
In determining to renew the investment advisory agreements between ICON Funds (the “Trust”) and ICON Advisers, Inc. (“ICON” or the “Adviser”) the Trustees requested, were provided with and reviewed data with respect to the Adviser, its personnel, and the services provided and to be provided to each Fund by the Adviser under the Trust’s Investment Advisory Agreement dated October 9, 1996, as amended (related to the Sector Funds, the International Funds and ICON Fund) and under the Trust’s Investment Advisory Agreement dated July 9, 2002 and effective October 1, 2002, as amended (related to the U.S. Diversified Funds — Bond, Risk-Managed Balanced, Equity Income, Opportunities and Long/Short Funds) (collectively, the “Advisory Agreements”).
The Trustees agreed that consideration of the Advisory Agreements should also include consideration of other agreements between the Adviser and the Trust that impact provisions of the Advisory Agreements, including expense limitation agreements as amended effective April 11, 2016. The Trustees were provided with and reviewed data with respect to the Adviser, its personnel, and the services provided and to be provided to each Fund by the Adviser under the Trust’s Advisory Agreements, Administrative Services Agreement and Expense Limitation Agreement and the Distribution Agreement with ICON Distributors, Inc. (“IDI”). The data included information concerning advisory, distribution and administrative services provided to the Funds by ICON and its related companies; information concerning other businesses of those companies; and comparative data obtained from Strategic Insight (“SI”) related to Fund performance and Fund expenses (the “SI Report”).
The Board convened a meeting with SI on August 10, 2016 to discuss the SI Report and the information contained within the SI Report. Kevin Shine, Senior Managing Director, U.S. Research & Advisory of SI, Alana Burke, Vice President, Corporate Accounts and Joe Frelix, project manager on the15(c) report, discussed the findings of the SI Report with the Independent Trustees. Management personnel participated in the SI meeting convened to discuss the data for and with the Board. At the meeting, SI discussed its methodology, peer selection and the difficulty with some sector funds, expenses and fees, and performance relative to the respective Fund’s peers. SI also discussed the Funds size and how a respective Fund’s size would affect economies of scale, in particular, operating expenses. In addition, the Trustees asked SI for a Mutual Fund Administration Analysis (the “SI Admin Analysis”). Mr. Shine walked the Trustees through the SI Admin Analysis.
Also included in the 15(c) discussion was a briefing on factors affecting the ICON investment model; expenses and expense ratios of each Fund and other ICON managed products; relative performance of each Fund; status of expense reimbursements to the Funds by the Adviser; sales and marketing initiatives; specific business factors affecting IDI; the work load on ICON as adviser and administrator to the Funds; current profitability of ICON; staffing levels and staff morale.
The Independent Trustees were represented by independent legal counsel in this process. In August 2016, after participating in the meeting with SI and management, the Independent Trustees met separately as a group in private sessions with their independent legal counsel to review and discuss the foregoing information. Based on these discussions, independent legal counsel and/or the Lead Independent Trustee also contacted management to request additional information from SI. The Board received materials from independent legal counsel discussing the legal standards applicable to their consideration of the ICON-Trust agreements.
In considering the nature, extent and quality of the services provided by the Adviser, the Board reviewed information relating to ICON’s operations and personnel. Among other things, the Adviser provided biographical information on its professional staff and descriptions of its organizational and management structure. In the course of their deliberations the Board evaluated, among other things, information relating to the investment philosophy, strategies and techniques used in managing each Fund, the qualifications and experience of ICON’s investment personnel, ICON’s compliance programs, ICON’s brokerage practices, including the extent to which the Adviser obtains research through “soft dollar” arrangements with the Funds’ brokerage, compliance reports on the foregoing, and the financial and non-financial resources available to provide services required under the Advisory Agreement.
During the discussion, the SI Report and the SI Admin Analysis were discussed and management personnel showed performance for each Fund and discussed the factors affecting performance. The Board inquired from SI whether there was any correlation between fund expenses and performance, and SI saw no direct correlation with the ICON Funds other than the obvious observation that higher expenses reduce performance.
During the discussion on performance, management personnel noted that 2015 was very difficult for active managers. Unlike indexes, ICON is an active manager that is willing to look different from an index.
Management elaborated further on performance. For the one year ended May 31, 2014, only three of ICON’s funds beat their respective benchmarks: Consumer Staples, Information Technology, and Long/Short. For the one year ended June 30, 2016, four of the ICON funds beat their
| | |
| ICON International Funds | | Additional Information |
| | September 30, 2016 (Unaudited) |
respective benchmarks: Emerging Markets, International Equity, Information Technology, and Utilities. However, on a one year basis, eight are in the top third of their peer groups of which six of those eight are in the top quartile. The low point in the S & P 1500 Index was February 11, 2016. Since February 11 until July, 2016, ICON performed better than the indexes, as seven of the 12 domestic equity funds beat their respective indexes. Also during that same time period, the equity portion of the ICON Equity Income Fund beat the S&P 1500 Index. Five of the nine ICON Sector Funds beat their index for that same period.
Management noted that Advisers’ performance relative to other valuation managers as judged by the AthenaInvest system is above the medium. SI also noted that from a performance point of view, the Funds in the SI Report are compared using the Morningstar data, and there is no Morningstar category for “all cap” funds, but all ICON Funds are improving.
The Board addressed style consistency with the Adviser. Management advised that, based on the Adviser’s own analysis, and with the restructuring of the Adviser, the Adviser has continued an additional level of review on the Portfolio Managers (“PMs”) to make sure they are adhering to the ICON System; the Senior Vice President of Fund Management has been systematically tracking the Funds’ performance; he evaluates each of the ICON Funds to help ensure all PMs are investing consistently and in accordance with the ICON System by evaluating the Funds from an attribution perspective in monthly meetings.
In connection with reviewing data bearing upon the nature, quality, and extent of services furnished by ICON to each Fund, the Board assessed data concerning ICON’s staffing, systems and facilities. The Board also assessed ICON’s non-Trust business to see if there are any initiatives that would dilute service to the Trust. The Board concluded:
| | A. | That the breadth and the quality of investment advisory and other services being provided to each Fund is satisfactory, as evidenced in part by efforts to address and improve the performance record of each Fund when compared with the performance records of a peer group of comparable funds and markets in general; |
| | B. | That the breadth and the quality of investment advisory and other services being provided to each Fund are satisfactory, the Adviser’s performance is competitive with other fund managers in the value style group, and the Adviser has applied a disciplined approach in the style specified in the Funds’ offering document; |
| | C. | That ICON has made significant expenditures in the past year and in prior years to ensure that it has reasonably sophisticated systems and the highly trained personnel necessary for it to be able to continue to provide quality service to the Funds’ shareholders, including the dedication of substantial resources to ICON’s investment and methodology; |
| | D. | That the Board, after considering compliance reports and compliance initiatives undertaken during the year and conducting individual interviews with selected PMs, is satisfied with the research and portfolio management, that research and portfolio management is being constantly evaluated and improved upon; and that the PMs are evaluating trading services systematically, the Board concluded that the Adviser is providing the Funds with professional management of the nature, quality and scope required by the Funds; and |
| | E. | The risks assumed by ICON in providing investment advisory services to each Fund, including the capital commitments which have been made in the past and which continue to be made by ICON to ensure the continuation of the highest quality of service to the Trust, is made with the recognition that shareholders may redeem their shares at any time without notice and the Trust’s advisory relationship with ICON may be terminated at any time and must be renewed on an annual basis. |
In considering the reasonableness of the fees paid to the Adviser for managing each Fund, the Board reviewed, among other things, data concerning other funds from the SI Report, financial statements of the Adviser and an analysis of the profitability of the Adviser, and its affiliates, and their relationship with each Fund over various time periods, and the SI Admin Analysis. Such analysis identified all revenues and other benefits received by the Adviser and its affiliates from managing each Fund, the costs associated with providing such services and the resulting profitability to the Adviser and its affiliates and a comparison of similar data from reports filed by publicly traded firms.
The Board assessed actual (net) fees for advisory services and Fund expense ratios under the contractual relationship (the Advisory agreements, the Administration Agreement and the Expense Limitation Agreements) with the Adviser as opposed to the fees specified in the applicable Advisory Agreement and expense ratios without application of the expense limitations and the low cost of the Administration Agreement and concluded that the focus should be on actual expense ratios after application of the Expense Limitation Agreements.
The Board considered the current and anticipated asset levels of each Fund and the contractual commitments of the Adviser to waive fees and pay expenses of the Funds from time to time to limit the total expenses of the Funds. The Board also considered the Adviser’s contractual commitment regarding administration and the fact it would continue to lose money on administration. In this regard the Board discussed asset levels in each Fund covered by the Advisory Agreements. ICON’s ability to provide the services called for under the Advisory Agreements was assessed in light of current and projected asset levels. Fund expenses and expense ratios were also assessed in light of current and projected asset levels. The Board
| | |
| |
| Annual Report | September 30, 2016 | | 41 |
| | |
| ICON International Funds | | Additional Information |
| | September 30, 2016 (Unaudited) |
concluded that the Adviser has the resources necessary to provide the services called for under the Advisory Agreements; that profitability to the Adviser and its affiliates from their relationship with the Funds, and services provided to the Funds, is not excessive; and that the Adviser is not realizing material benefits from economies of scale that would warrant adjustments to the fees for any Fund at this time. The Board of Trustees concluded that, in light of the nature, extent and quality of the services provided by the Adviser and the levels of profitability associated with providing these services, the fees charged by the Adviser under the Advisory Agreements to each Fund are reasonable.
In connection with assessing data bearing on the fairness of fee arrangements, the Board considered the SI Report and the SI Admin Analysis. It was noted that SI was selected at the May Board meeting to prepare its reports, an extensive analysis of the expense data of other comparable funds; and that Trustee input was solicited and provided in the process. Among other information discussed, it was noted that:
| | A. | the advisory fee structures of the Funds are within the range of funds considered in the comparison with advisory fees and expense ratios of other similarly managed funds as set forth in the comparative data; |
| | B. | ICON has contractually agreed to impose expense limitations on each and every Fund at a cost to ICON; |
| | C. | ICON has contractually committed to break points in its fees so that economies of scale could be realized as a Fund grows in assets, for the benefit of Fund shareholders; |
| | D. | ICON has contractually committed to providing Administration services to the Funds at a cost below the average to its peer group, and within the mutual fund universe of open-end fund managers with less than $10 billion in assets under management, at less than 50% of the fee of those funds, at a loss to ICON. |
The Board also considered the fees charged by the Adviser to other advisory clients as outlined in its Registration Application on Form ADV in connection with assessing data bearing on the fairness of fee arrangements. The Trustees noted that certain ICON institutional/sub-advised type accounts have lower fees than the fees paid by the Funds for a number of reasons, including but not limited to, those clients call for different commitments of time, institutional clients have low and predictable turnover of assets, in competition joint costs are apportioned among paying customers according to elasticity of demand and the Adviser has a limited level of responsibility in sub-managed accounts, or accounts with an investor agent/advisor.
The Board noted that the Funds’ redemptions were similar to industry averages which showed two things: 1) that the Funds’ Performance was not adversely impacting fund redemptions, and 2) that the fees and costs were competitive when compared to size. The Board noted that there are thousands of mutual funds competing; that investors can search and trade funds on the internet or on platforms at very little or no cost; and that if the Adviser were overcharging for its services, the Board would have expected redemptions in excess of industry norms.
The Board concluded that the Adviser is providing the Funds with professional management at a fair, reasonable and competitive price.
In connection with assessing the direct and indirect benefits to ICON from serving as the Funds’ adviser, the Board discussed services provided under the Distribution Agreement and the Administrative Services Agreement which are in addition to services under the Advisory Agreements. It was noted that IDI does not charge a fee to the Funds for its services and that ICON’s fee for administrative services ICON appears from the SI Admin Analysis to be below the average to its peer group, and within the mutual fund universe of open-end fund managers with less than $10 billion in assets under management, at less than 50% of the fee of those funds, at a loss to ICON. The Board noted that ICON receives research assistance (primarily in the form of data) from the use of soft dollars generated from Fund portfolio transactions; that such research assists ICON in providing quality advisory services; that Trust and Adviser compliance personnel continuously evaluate and report on the soft-dollar arrangements and related costs; and the Board concluded that the arrangements are consistent with Fund brokerage practices and benefit the Funds and their shareholders.
Based on these considerations, the Board, including all of the Independent Trustees, concluded that: 1) the continuation of the Advisory Agreements was in the best interests of each Fund and its shareholders, 2) the services to be performed under the Advisory Agreements were required for the operation of the Funds, 3) the advisory services were satisfactory to the Funds in the past, and 4) the fees for the advisory services and other benefits from the relationship with the Trust received by ICON, and its affiliates, were consistent with fees paid by similar funds and other clients of ICON, and were reasonable in light of the comparative data, and within the range of what would have been negotiated at arm’s length in light of all the circumstances.
| | |
| ICON International Funds | | Additional Information |
| | September 30, 2016 (Unaudited) |
Portfolio Holdings
Information related to the 10 largest portfolio holdings of each Fund is made available at www.iconfunds.com within approximately 10 business days after month-end. Additionally, a complete list of each Fund’s holdings is made available approximately 30 days after month-end. Each ICON Fund also files a complete schedule of portfolio holdings for the first and third quarters of its fiscal year with the Securities and Exchange Commission (the “Commission”) on Form N-Q. The ICON Funds’ Forms N-Q are available at www.sec.gov or may be reviewed and copied at the Commission’s Public Reference Room in Washington, DC. Information about the Public Reference Room may be obtained by calling 1-800-SEC-0330.
Proxy Voting
A summarized description of the policies and procedures the ICON Funds use to vote proxies is available free of charge at www.iconfunds.com or by calling 1-800-764-0442.
Information about how the ICON Funds voted proxies related to each Fund’s portfolio securities during the 12-month period ended June 30 is available free of charge at www.iconfunds.com or on the Commission’s website at www.sec.gov.
For More Information
This report is for the general information of the Funds’ shareholders and is not authorized for distribution to prospective investors unless preceded or accompanied by a current prospectus. You may obtain a copy of the prospectus, which contains information about the investment objectives, risks, charges, expenses, and share classes of each ICON Fund, by visiting www.iconfunds.com or by calling 1-800-764-0442. Please read the prospectus carefully before investing.
ICON Distributors, Inc., Distributor.
| | |
| |
| Annual Report | September 30, 2016 | | 43 |
| | |
| ICON International Funds | | Privacy Policy |
| | September 30, 2016 (Unaudited) |
| | | | |
FACTS | | WHAT DOES ICON DO WITH YOUR PERSONAL INFORMATION? | | |
Why? | | Financial companies choose how they share your personal information. Federal law gives consumers the right to limit some but not all sharing. Federal law also requires us to tell you how we collect, share, and protect your personal information. Please read this notice carefully to understand what we do. | | |
�� What? | | The types of personal information we collect and share depend on the product or service you have with us. This information can include: | | |
| | • Social Security number and account balances | | |
| | • income and transaction history | | |
| | • checking account information and wire transfer instructions | | |
| | | When you are no longer our customer, we continue to share your information as described in this notice. | | |
How? | | All financial companies need to share customers’ personal information to run their everyday business. In the section below, we list the reasons financial companies can share their customers’ personal information; the reasons ICON chooses to share; and whether you can limit this sharing. | | |
| | | | | | | | |
| | | | |
Reasons we can share your personal information | | | | Does ICON share? | | Can you limit this sharing? | | |
| | | | |
For our everyday business purposes — such as to process your transactions, maintain your account(s), respond to court orders and legal investigations, or report to credit bureaus | | | | Yes | | No | | |
| | | | |
For our marketing purposes — to offer our products and services to you | | | | No | | We don’t share | | |
| | | | |
For joint marketing with other financial companies | | | | No | | We don’t share | | |
| | | | |
For our affiliates’ everyday business purposes — information about your transactions and experiences | | | | No | | We don’t share | | |
| | | | |
For our affiliates’ everyday business purposes — information about your creditworthiness | | | | No | | We don’t share | | |
| | | | |
For nonaffiliates to market to you | | | | No | | We don’t share | | |
| | | | | | | | |
| |
Questions? | | Call 1-800-764-0442 for the ICON Funds and 1-800-828-4881 for ICON Advisers, Inc. and ICON Distributors, Inc. |
| | |
| ICON International Funds | | Privacy Policy |
| | September 30, 2016 (Unaudited) |
| | | | | | |
| |
Who We Are | | |
| | | |
Who is providing this notice? | | | | ICON Funds, ICON Advisers, Inc., and ICON Distributors, Inc. (collectively “ICON”) | | |
| |
What We Do | | |
| | | |
How does ICON protect my personal information? | | | | To protect your personal information from unauthorized access and use, we use security measures that comply with federal law. These measures include computer safeguards and secured files and buildings. Contracts with our service providers require them to restrict access to your non-public personal information, and to maintain physical, electronic and procedural safeguards against unintended disclosure. | | |
| | | |
How does ICON collect my personal information? | | | | We collect your personal information, for example, when you | | |
| | | | • open an account or enter into an investment advisory contract | | |
| | | | • provide account information or give us your contact information | | |
| | | | • make a wire transfer | | |
| | | | | We also collect your personal information from others, such as credit bureaus, affiliates, or other companies. | | |
| | | |
Why can’t I limit all sharing? | | | | Federal law gives you the right to limit only | | |
| | | | • sharing for affiliates’ everyday business purposes—information about your creditworthiness | | |
| | | | • affiliates from using your information to market to you | | |
| | | | • sharing for nonaffiliates to market to you | | |
| | | | | State laws and individual companies may give you additional rights to limit sharing. | | |
| |
Definitions | | |
| | | |
Affiliates | | | | Companies related by common ownership or control. They can be financial and nonfinancial companies. | | |
| | | | | • Our affiliates include financial companies such as ICON Funds, ICON Advisers, Inc., and ICON Distributors, Inc. | | |
| | | |
Nonaffiliates | | | | Companies not related by common ownership or control. They can be financial and nonfinancial companies. | | |
| | | | | • Nonaffiliates we share with can include financial companies such as custodians, transfer agents, registered representatives, financial advisers and nonfinancial companies such as fulfillment, proxy voting, and class action service providers | | |
| | | |
Joint marketing | | | | A formal agreement between nonaffiliated financial companies that together market financial products or services to you. | | |
| | | | | • ICON doesn’t jointly market | | |
| | |
| |
| Annual Report | September 30, 2016 | | 45 |
| | |
For more information about the ICON Funds, contact us: |
By Telephone | | 1-800-764-0442 |
| |
By E-Mail | | info@iconadvisers.com |
| |
By Mail | | ICON Funds | P.O. Box 1920 | Denver, CO 80201 |
| |
In Person | | ICON Funds | 5299 DTC Boulevard, 12th Floor |
| |
| | Greenwood Village, CO 80111 |
| |
On the Internet | | www.iconfunds.com |

Sector Funds
ICON Consumer Discretionary Fund
ICON Consumer Staples Fund
ICON Energy Fund
ICON Financial Fund
ICON Healthcare Fund
ICON Industrials Fund
ICON Information Technology Fund
ICON Natural Resources Fund
ICON Utilities Fund
You can now sign up for electronic delivery of ICON Fund shareholder reports, including prospectuses, annual reports, semiannual reports and proxy statements.
When these materials are available, you will receive an email from ICON with instructions on how to view the documents. Statements, transaction confirmations and other documents that are not available online will continue to be sent to you by U.S. mail.
Visit ICON’s website at www.iconfunds.com to learn more and sign up.
You may change or cancel your participation in eDelivery by visiting www.iconfunds.com, or you can request a hard copy of any of the materials free of charge by calling ICON Funds at 1-800-764-0442.
|
1-800-764-0442 ● www.iconfunds.com |
TABLE OF CONTENTS
| | |
| ICON Sector Funds | | About This Report |
| | September 30, 2016 (Unaudited) |
Historical Returns
All total returns mentioned in this Report account for the change in a Fund’s per-share price and the reinvestment of any dividends, capital gain distributions and adjustments for financial statement purposes. If your account is set up to receive Fund distributions in cash rather than to reinvest them, your actual return may differ from these figures. The Funds’ performance results do not reflect the deduction of taxes that a shareholder would pay on Fund distributions or on the redemption of Fund shares. The Adviser may have reimbursed certain fees or expenses of some of the Funds. If not for these reimbursements, performance would have been lower. Fund results shown, unless otherwise indicated, are at net asset value. If a sales charge (maximum 5.75%) had been deducted, results would have been lower.
Past performance does not guarantee future results. Investment return and principal value will fluctuate so that an investor’s shares, when redeemed, may be worth more or less than their original cost. Performance results represent past performance, and current performance may be higher or lower. Please call 1-800-764-0442 or visit www.iconfunds.com for performance results current to the most recent month-end.
Portfolio Data
This Report reflects ICON’s portfolio holdings as of September 30, 2016, the end of the reporting period. The information is not a complete analysis of every aspect of any sector, industry, security or the Funds.
There are risks associated with mutual fund investing, including the loss of principal. The likelihood of loss may be greater if you invest for a shorter period of time. There is no assurance that the investment process will consistently lead to successful results.
An investment concentrated in sectors and industries may involve greater risk and volatility than a more diversified investment. Investments in foreign securities may entail unique risks, including political, market, and currency risks. Financial statements of foreign companies are governed by different accounting, auditing, and financial standards than U.S. companies and may be less transparent and uniform than in the United States. Many corporate governance standards, which help ensure the integrity of public information in the United States, do not exist in foreign countries. In general, there may be less governmental supervision of foreign stock exchanges and securities brokers and issuers. The ICON system relies on the integrity of the financial statements released to the market as part of our analysis.
The prospectus and statement of additional information contain this and other information about the Funds and are available by visiting www.iconfunds.com or calling 1-800-764-0442. Please read the prospectus and statement of additional information carefully.
Financial Intermediary
If you purchase the Fund through a broker-dealer or other financial intermediary (such as a bank), the Fund and its related companies may pay the intermediary for the sale of Fund shares and related services. These payments may influence the broker-dealer or other intermediary and your salesperson to recommend the Fund over another investment. Ask your salesperson or visit your financial intermediary’s website for more information.
| | |
| ICON Consumer Discretionary Fund | | Management Overview |
| | September 30, 2016 (Unaudited) |
| Q. | How did the Fund Perform relative to its benchmark? |
| A. | The ICON Consumer Discretionary Fund (the Fund) Class S returned 4.49% for the fiscal year ended September 30, 2016, while the benchmark S&P 1500 Consumer Discretionary Index rose 8.49%. The broad market S&P 1500 Index returned 15.49%. Total returns for other periods and additional Class shares as of September 30, 2016, appear in the subsequent pages of this Fund’s Management Overview. |
| Q. | What primary factors influenced the Fund’s relative performance during the period? |
| A. | Despite positive returns for the year, the Consumer Discretionary sector lagged the overall U.S. equity market. Investors in the Consumer Discretionary sector faced a number of headwinds including a rising U.S. dollar and its effect on earnings, growing competitive pressures from online retailers, and relatively tepid income growth for the U.S. workforce as a whole. Despite these headwinds, and aided by a resilient U.S. economy, stable consumer sentiment, and an accommodative monetary policy, investors were generally rewarded with positive performance in the sector. However, while the sector posted positive returns overall, there was notable performance dispersion at the industry level. Over the fiscal year 2016, economic growth remained positive and stable, unemployment fell, and inflation remained subdued by historical standards. We believe these factors could remain as tailwinds for the U.S. consumer and should be supportive for companies and industries in this sector of the economy. |
| Q. | How did the Fund’s Composition affect performance? |
| A. | The Apparel & Accessories & Luxury Goods industry was the greatest contributor to the Fund’s performance over the period on an industry level. The Fund was able to outperform the benchmark in this industry based on strong stock selection over the period thanks to companies such as Lululemon Athletica and Kate Spade contributing to the industry’s returns. The Homebuilding industry was another positive contributor, as holdings in LGI Homes contributed positively to the Fund’s performance. |
The Internet & Direct Marketing Retail industry was the largest detractor to the Fund’s relative performance on the industry level. The Fund had no exposure to Amazon.com which posted large returns, thus the Fund’s lack of exposure contributed negatively to the performance of the Fund relative to the benchmark. Specialty Stores was another industry detractor to relative performance as Fund holdings in Signet Jewelers and Party City detracted from the Fund’s performance.
| Q. | What is your investment outlook for the Consumer Discretionary sector? |
| A. | At the close of the fiscal year, our model indicates the Consumer Discretionary sector has a an overall average value-to-price (V/P) ratio of 1.14; or in other words, we believe the fair value for the stocks in the Consumer Discretionary sector as a whole is approximately 14% higher than where the stocks are currently trading. We currently see bargains in the automotive related industries, specifically Auto Parts & Equipment as well as the discount-related stocks within the retailing industry group. As always, we look to value as our primary guide and will adjust our positioning as market conditions dictate. |
| | |
| |
| Annual Report | September 30, 2016 | | 3 |
| | |
| ICON Consumer Discretionary Fund | | Management Overview |
| | September 30, 2016 (Unaudited) |
Average Annual Total Return (as of September 30, 2016)
| | | | | | | | | | | | | | |
| | | Inception Date | | 1 Year | | 5 Years | | 10 Years | | Since
Inception | | Gross Expense
Ratio* | | Net Expense
Ratio* |
ICON Consumer Discretionary Fund - Class S | | 7/9/97 | | 4.49% | | 14.40% | | 7.15% | | 5.79% | | 1.43% | | 1.43% |
ICON Consumer Discretionary Fund - Class A | | 9/30/10 | | 3.86% | | 13.76% | | N/A | | 13.21% | | 1.91% | | 1.91% |
ICON Consumer Discretionary Fund - Class A | | | | | | | | | | | | | | |
(including maximum sales charge of 5.75%) | | 9/30/10 | | -2.14% | | 12.43% | | N/A | | 12.10% | | 1.91% | | 1.91% |
S&P 1500 Consumer Discretionary Index | | | | 8.49% | | 19.69% | | 10.11% | | 8.63% | | N/A | | N/A |
S&P Composite 1500 Index | | | | 15.49% | | 16.44% | | 7.44% | | 6.97% | | N/A | | N/A |
Past performance is not a guarantee of future results. The performance of the S&P 1500 Consumer Discretionary Index includes the reinvestment of the dividends and capital gain distributions beginning on January 1, 2002. Additional information about these performance results and the comparative indexes can be found in the About This Report section. The Adviser has agreed to limit certain Fund expenses; without these limitations, returns would have been lower. The limitation provisions may be terminated in the future.
| * | Please see the most recent prospectus for details. |
Value of a $10,000 Investment (through September 30, 2016)
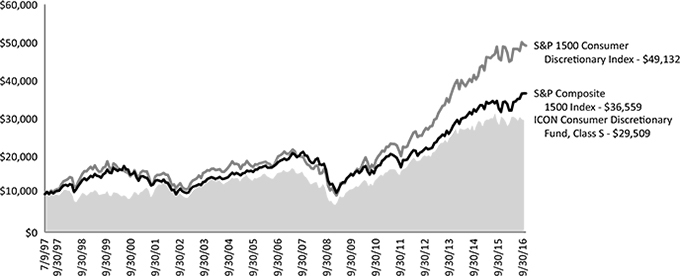
Past performance is not a guarantee of future results. The above graph compares a $10,000 investment made in the Fund’s Class S shares on the Class’ inception date of 7/9/97 to a $10,000 investment made in unmanaged securities indexes on that date. The Fund’s performance in this chart and the performance table assumes the reinvestment of dividends and capital gain distributions but does not reflect the deduction of taxes that a shareholder would pay on Fund distributions or on the redemption of Fund shares.
| | |
| ICON Consumer Discretionary Fund | | Schedule of Investments |
| | September 30, 2016 |
| | | | | | |
| | | Shares or Principal
Amount | | Value | |
| |
Common Stocks (95.44%) | | | | | | |
Apparel Retail (2.22%) | | | | | | |
Ross Stores, Inc. | | 6,100 | | $ | 392,230 | |
TJX Cos., Inc. | | 6,500 | | | 486,070 | |
| | | | | | |
| | | | | 878,300 | |
| | | | | | |
Apparel, Accessories & Luxury Goods (3.01%) | |
Hanesbrands, Inc. | | 16,400 | | | 414,100 | |
lululemon athletica, Inc.(a) | | 12,800 | | | 780,544 | |
| | | | | | |
| | | | | 1,194,644 | |
| | | | | | |
Auto Parts & Equipment (2.01%) | | | | | | |
Delphi Automotive PLC | | 4,100 | | | 292,412 | |
Modine Manufacturing Co.(a) | | 33,900 | | | 402,054 | |
Visteon Corp. | | 1,400 | | | 100,324 | |
| | | | | | |
| | | | | 794,790 | |
| | | | | | |
Automotive Retail (6.46%) | | | | | | |
AutoZone, Inc.(a) | | 1,800 | | | 1,383,012 | |
O’Reilly Automotive, Inc.(a) | | 4,200 | | | 1,176,462 | |
| | | | | | |
| | | | | 2,559,474 | |
| | | | | | |
Broadcasting (4.29%) | | | | | | |
CBS Corp., Class B | | 15,500 | | | 848,470 | |
Discovery Communications,
Inc., Class A(a) | | 16,700 | | | 449,564 | |
TEGNA, Inc. | | 18,400 | | | 402,224 | |
| | | | | | |
| | | | | 1,700,258 | |
| | | | | | |
Cable & Satellite (5.99%) | | | | | | |
Comcast Corp., Class A | | 35,800 | | | 2,374,972 | |
| | | | | | |
|
Computer & Electronics Retail (0.99%) | |
GameStop Corp., Class A(b) | | 14,200 | | | 391,778 | |
| | | | | | |
| | |
Footwear (2.39%) | | | | | | |
NIKE, Inc., Class B | | 18,000 | | | 947,700 | |
| | | | | | |
|
General Merchandise Stores (6.87%) | |
Dollar General Corp. | | 19,300 | | | 1,350,807 | |
Dollar Tree, Inc.(a) | | 17,400 | | | 1,373,382 | |
| | | | | | |
| | | | | 2,724,189 | |
| | | | | | |
Home Improvement Retail (2.60%) | |
Home Depot, Inc. | | 8,000 | | | 1,029,440 | |
| | | | | | |
| | |
Homefurnishing Retail (3.03%) | | | | | | |
Aaron’s, Inc. | | 47,200 | | | 1,199,824 | |
| | | | | | |
|
Hotels, Resorts & Cruise Lines (3.91%) | |
Norwegian Cruise Line
Holdings, Ltd.(a) | | 29,000 | | | 1,093,300 | |
Wyndham Worldwide Corp. | | 6,800 | | | 457,844 | |
| | | | | | |
| | | | | 1,551,144 | |
| | | | | | |
Household Appliances (2.00%) | | | | | | |
Whirlpool Corp. | | 4,900 | | | 794,584 | |
| | | | | | |
| | | | | | |
| | | Shares or Principal
Amount | | Value | |
| |
Internet & Direct Marketing Retail (2.23%) | |
Priceline Group, Inc.(a) | | 600 | | $ | 882,894 | |
| | | | | | |
| | |
Leisure Products (6.27%) | | | | | | |
Brunswick Corp. | | 26,800 | | | 1,307,304 | |
Smith & Wesson Holding
Corp.(a)(b) | | 44,300 | | | 1,177,937 | |
| | | | | | |
| | | | | 2,485,241 | |
| | | | | | |
Movies & Entertainment (18.40%) | |
Cinemark Holdings, Inc. | | 43,300 | | | 1,657,524 | |
Time Warner, Inc. | | 21,200 | | | 1,687,732 | |
Twenty-First Century Fox,
Inc., Class A | | 82,100 | | | 1,988,462 | |
Walt Disney Co. | | 21,100 | | | 1,959,346 | |
| | | | | | |
| | | | | 7,293,064 | |
| | | | | | |
Publishing (1.03%) | | | | | | |
Gannett Co., Inc. | | 34,900 | | | 406,236 | |
| | | | | | |
| | |
Restaurants (10.78%) | | | | | | |
Chipotle Mexican Grill,
Inc.(a)(b) | | 500 | | | 211,750 | |
McDonald’s Corp. | | 20,600 | | | 2,376,416 | |
Starbucks Corp. | | 31,100 | | | 1,683,754 | |
| | | | | | |
| | | | | 4,271,920 | |
| | | | | | |
Specialized Consumer Services (1.69%) | |
H&R Block, Inc. | | 18,000 | | | 416,700 | |
Liberty Tax, Inc. | | 19,745 | | | 252,342 | |
| | | | | | |
| | | | | 669,042 | |
| | | | | | |
Specialty Stores (9.27%) | | | | | | |
Five Below, Inc.(a) | | 33,200 | | | 1,337,628 | |
Signet Jewelers, Ltd. | | 20,800 | | | 1,550,224 | |
Ulta Salon Cosmetics &
Fragrance, Inc.(a) | | 3,300 | | | 785,334 | |
| | | | | | |
| | | | | 3,673,186 | |
| | | | | | |
| | |
Total Common Stocks (Cost $40,126,040) | | | | | 37,822,680 | |
| | | | | | |
|
Collateral for Securities on Loan (4.50%) | |
State Street Navigator Prime
Portfolio, 0.30% | | 1,782,625 | | | 1,782,625 | |
| | | | | | |
| |
Total Collateral for Securities on Loan (Cost $1,782,625) | | | 1,782,625 | |
| | | | | | |
| | |
The accompanying notes are an integral part of the financial statements. |
| Annual Report | September 30, 2016 | | 5 |
| | |
| ICON Consumer Discretionary Fund | | Schedule of Investments |
| | September 30, 2016 |
| | | | | | | | |
| | | Shares or
Principal
Amount | | | Value | |
| |
Short-Term Investments (6.91%) | |
Time Deposits (6.91%) | | | | | | | | |
State Street Euro Dollar Time
Deposit (USD),
0.01%, 10/03/16 | | | 2,739,714 | | | $ | 2,739,714 | |
| | | | | | | | |
| | |
Total Short-Term Investments (Cost $2,739,714) | | | | | | | 2,739,714 | |
| | | | | | | | |
| | |
Total Investments (106.85%) (Cost $44,648,379) | | | | | | $ | 42,345,019 | |
| | |
Liabilities Less Other Assets (-6.85%) | | | | | | | (2,714,258) | |
| | | | | | | | |
| | |
Net Assets (100.00%) | | | | | | $ | 39,630,761 | |
| | | | | | | | |
| (a) | Non-income producing security. |
| (b) | All or a portion of the security was on loan as of September 30, 2016. |
| | | | |
Sector Composition (September 30, 2016) | | | | |
| |
Consumer Discretionary | | | 95.44% | |
| | | | |
| | | 95.44% | |
| | | | |
Percentages are based upon common stocks as a percentage of net assets.
| | | | |
Industry Composition (September 30, 2016) | |
| |
Movies & Entertainment | | | 18.40% | |
Restaurants | | | 10.78% | |
Specialty Stores | | | 9.27% | |
General Merchandise Stores | | | 6.87% | |
Automotive Retail | | | 6.46% | |
Leisure Products | | | 6.27% | |
Cable & Satellite | | | 5.99% | |
Broadcasting | | | 4.29% | |
Hotels, Resorts & Cruise Lines | | | 3.91% | |
Homefurnishing Retail | | | 3.03% | |
Apparel, Accessories & Luxury Goods | | | 3.01% | |
Home Improvement Retail | | | 2.60% | |
Footwear | | | 2.39% | |
Internet & Direct Marketing Retail | | | 2.23% | |
Apparel Retail | | | 2.22% | |
Auto Parts & Equipment | | | 2.01% | |
Household Appliances | | | 2.00% | |
Specialized Consumer Services | | | 1.69% | |
Publishing | | | 1.03% | |
Other Industries (each less than 1%) | | | 0.99% | |
| | | | |
| | | 95.44% | |
| | | | |
Percentages are based upon common stocks as a percentage of net assets.
| | |
The accompanying notes are an integral part of the financial statements. |
| 6 | | www.iconfunds.com |
| | |
| ICON Consumer Staples Fund | | Management Overview |
| | September 30, 2016 (Unaudited) |
| Q. | How did the Fund perform relative to its benchmarks? |
| A. | The ICON Consumer Staples Fund (the Fund) Class S returned 12.09% for the fiscal year ended September 30, 2016, while its sector-specific benchmark, the S&P 1500 Consumer Staples Index, returned 15.60%, and the S&P 1500 Index returned 15.49%. Total returns for other periods and additional Class shares as of September 30, 2016, appear in the subsequent pages of this Fund’s Management Overview. |
| Q. | What primary factors were behind the Fund’s relative performance? |
| A. | While the broad market was generally higher over the past year, the Consumer Staples sector slightly outperformed the overall U.S. equity market. Faced with a historically low interest rate environment, many investors sought out market sectors with lower historical volatility and higher than average dividend yields. We believe this global search for what has been coined as “bond proxies,” brought forth huge demand and performance gains for sectors like Telecommunication Services, Utilities, and Consumer Staples. Despite spending the year trading at higher prices indicative of very little future upside, according to our models, stocks in the Consumer Staples sector maintained strong leadership throughout much of the year. We feel this leadership could come to an end if interest rates move higher in the future. Over the fiscal year ended September 30, 2016, economic growth remained positive and stable, unemployment fell, and inflation remained subdued by historical standards. All these factors could remain as tailwinds for the U.S. consumer and should be supportive for companies and industries in this sector of the economy. |
| Q. | How did the Fund’s composition affect performance? |
| A. | The Packaged Foods & Meats industry was the greatest contributor to the Fund’s performance over the period on an industry level. The Fund was able to outperform the benchmark in this industry based on strong stock selection over the period thanks to overweight positions in Tyson Foods and WhiteWave Foods, both of which performed well during the fiscal year. The Soft Drinks industry was another positive contributor as Monster Beverage posted strong gains, contributing positively to the Fund’s performance. |
| | The Household Products industry was the Fund’s largest detractor to relative performance on the industry level. An underweight position in Procter & Gamble proved to be a detractor, contributing negatively to the performance of the Fund relative to the benchmark. The Drug Retail industry also detracted from relative performance as overweight positions in CVS Health and Walgreens Boots Alliance detracted from the Fund’s returns. Additionally, due to our valuation methodology indicating relatively low value for the sector, cash was held during the year for defensive purposes which ultimately dragged against the Fund’s returns as the sector experienced gains for the year. |
| Q. | What is your investment outlook for the Consumer Staples sector? |
| A. | At the close of the fiscal year, our model indicates the Consumer Staples sector has a an overall average value-to-price (V/P) ratio of 1.07; or in other words, we believe the fair value for the stocks in the Consumer Staples sector as a whole is approximately 7% higher than where the stocks are currently trading. We currently see bargains in the Tobacco, Soft Drinks, and Drug Retail industries. As always, we look to value as our primary guide and will adjust our positioning as market conditions dictate. |
| | |
| |
| Annual Report | September 30, 2016 | | 7 |
| | |
| ICON Consumer Staples Fund | | Management Overview |
| | September 30, 2016 (Unaudited) |
Average Annual Total Return (as of September 30, 2016)
| | | | | | | | | | | | | | |
| | | Inception
Date | | 1 Year | | 5 Years | | 10 Years | | Since
Inception | | Gross Expense
Ratio* | | Net Expense
Ratio* |
ICON Consumer Staples Fund - Class S | | 5/9/97 | | 12.09% | | 13.38% | | 7.88% | | 8.71% | | 1.87% | | 1.51% |
ICON Consumer Staples Fund - Class A | | 9/30/10 | | 11.93% | | 13.06% | | N/A | | 12.29% | | 2.12% | | 1.76% |
ICON Consumer Staples Fund - Class A | | | | | | | | | | | | | | |
(including maximum sales charge of 5.75%) | | 9/30/10 | | 5.50% | | 11.73% | | N/A | | 11.20% | | 2.12% | | 1.76% |
S&P 1500 Consumer Staples Index | | | | 15.60% | | 15.51% | | 10.92% | | 8.37% | | N/A | | N/A |
S&P Composite 1500 Index | | | | 15.49% | | 16.44% | | 7.44% | | 7.46% | | N/A | | N/A |
Past performance is not a guarantee of future results. The performance of the S&P 1500 Consumer Staples Index includes the reinvestment of the dividends and capital gain distributions beginning on January 1, 2002. Additional information about these performance results and the comparative indexes can be found in the About This Report section. The Adviser has agreed to limit certain Fund expenses; without these limitations, returns would have been lower. The limitation provisions may be terminated in the future.
| * | Please see the most recent prospectus for details. |
Value of a $10,000 Investment (through September 30, 2016)
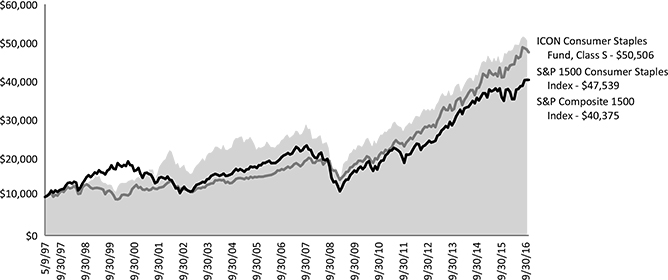
Past performance is not a guarantee of future results. The above graph compares a $10,000 investment made in the Fund’s Class S shares on the Class’ inception date of 5/9/97 to a $10,000 investment made in unmanaged securities indexes on that date. The Fund’s performance in this chart and the performance table assumes the reinvestment of dividends and capital gain distributions but does not reflect the deduction of taxes that a shareholder would pay on Fund distributions or on the redemption of Fund shares.
| | |
| ICON Consumer Staples Fund | | Schedule of Investments |
| | September 30, 2016 |
| | | | | | |
| | | Shares or
Principal Amount | | Value | |
| |
Common Stocks (91.77%) | | | | | | |
Agricultural Products (4.45%) | | | | |
Bunge, Ltd. | | 30,200 | | $ | 1,788,746 | |
| | | | | | |
| | |
Brewers (1.04%) | | | | | | |
Molson Coors Brewing Co.,
Class B | | 3,800 | | | 417,240 | |
| | | | | | |
| |
Distillers & Vintners (4.02%) | | | | |
Constellation Brands, Inc.,
Class A | | 9,700 | | | 1,614,953 | |
| | | | | | |
| | |
Drug Retail (9.50%) | | | | | | |
CVS Health Corp. | | 13,400 | | | 1,192,466 | |
Walgreens Boots Alliance,
Inc. | | 32,600 | | | 2,628,212 | |
| | | | | | |
| | | | | 3,820,678 | |
| | | | | | |
Food Retail (4.09%) | | | | | | |
Kroger Co. | | 55,400 | | | 1,644,272 | |
| | | | | | |
| |
Household Products (8.22%) | | | | |
Kimberly-Clark Corp. | | 16,700 | | | 2,106,538 | |
Orchids Paper Products Co.(a) | | 20,344 | | | 553,967 | |
Procter & Gamble Co. | | 7,200 | | | 646,200 | |
| | | | | | |
| | | | | 3,306,705 | |
| | | | | | |
Packaged Foods & Meats (24.31%) | | | | |
Blue Buffalo Pet Products,
Inc.(b) | | 33,400 | | | 793,584 | |
Cal-Maine Foods, Inc.(a) | | 1,800 | | | 69,372 | |
Dean Foods Co. | | 18,000 | | | 295,200 | |
Flowers Foods, Inc.(a) | | 15,100 | | | 228,312 | |
General Mills, Inc. | | 18,400 | | | 1,175,392 | |
Hormel Foods Corp. | | 23,400 | | | 887,562 | |
J.M. Smucker Co. | | 8,800 | | | 1,192,752 | |
Kellogg Co. | | 15,500 | | | 1,200,785 | |
Mondelez International, Inc.,
Class A | | 45,600 | | | 2,001,840 | |
Pinnacle Foods, Inc. | | 6,000 | | | 301,020 | |
Snyder’s-Lance, Inc. | | 7,000 | | | 235,060 | |
TreeHouse Foods, Inc.(b) | | 16,000 | | | 1,395,040 | |
| | | | | | |
| | | | | 9,775,919 | |
| | | | | | |
Personal Products (3.83%) | | | | |
Estee Lauder Cos., Inc.,
Class A | | 17,400 | | | 1,540,944 | |
| | | | | | |
| | |
Soft Drinks (17.18%) | | | | | | |
Coca-Cola Co. | | 66,800 | | | 2,826,976 | |
Dr. Pepper Snapple Group,
Inc. | | 13,200 | | | 1,205,292 | |
Monster Beverage Corp. | | 5,500 | | | 807,455 | |
PepsiCo, Inc. | | 19,000 | | | 2,066,630 | |
| | | | | | |
| | | | | 6,906,353 | |
| | | | | | |
Tobacco (15.13%) | | | | | | |
Altria Group, Inc. | | 44,000 | | | 2,782,120 | |
| | | | | | |
| | | Shares or
Principal Amount | | Value | |
| |
Tobacco (continued) | | | | | | |
Philip Morris International,
Inc. | | 13,400 | | $ | 1,302,748 | |
Reynolds American, Inc. | | 42,400 | | | 1,999,160 | |
| | | | | | |
| | | | | 6,084,028 | |
| | | | | | |
Total Common Stocks (Cost $36,948,310) | | | | | 36,899,838 | |
| | | | | | |
|
Collateral for Securities on Loan (2.01%) | |
State Street Navigator Prime
Portfolio, 0.30% | | 807,060 | | | 807,060 | |
| | | | | | |
| |
Total Collateral for Securities on Loan (Cost $807,060) | | | 807,060 | |
| | | | | | |
| |
Short-Term Investments (26.55%) | | | | |
Money Market Funds (12.44%) | | | | |
State Street Global Advisors
Treasury Fund (0.11% 7
Day Yield) | | 5,000,000 | | | 5,000,000 | |
| | | | | | |
| | |
Time Deposits (14.11%) | | | | | | |
State Street Euro Dollar Time
Deposit (USD),
0.01%, 10/03/16 | | 5,673,964 | | | 5,673,964 | |
| | | | | | |
| |
Total Short-Term Investments (Cost $10,673,964) | | | 10,673,964 | |
| | | | | | |
| | |
Total Investments (120.33%) (Cost $48,429,334) | | | | $ | 48,380,862 | |
| |
Liabilities Less Other Assets (-20.33%) | | | (8,172,765) | |
| | | | | | |
| | |
Net Assets (100.00%) | | | | $ | 40,208,097 | |
| | | | | | |
| (a) | All or a portion of the security was on loan as of September 30, 2016. |
| (b) | Non-income producing security. |
| | |
The accompanying notes are an integral part of the financial statements. |
| Annual Report | September 30, 2016 | | 9 |
| | |
| ICON Consumer Staples Fund | | Schedule of Investments |
| | September 30, 2016 |
| | | | |
| Sector Composition (September 30, 2016) | |
| |
Consumer Staples | | | 91.77% | |
| | | | |
| | | 91.77% | |
| | | | |
Percentages are based upon common stocks as a percentage of net assets.
| | | | |
| Industry Composition (September 30, 2016) | |
| |
Packaged Foods & Meats | | | 24.31% | |
Soft Drinks | | | 17.18% | |
Tobacco | | | 15.13% | |
Drug Retail | | | 9.50% | |
Household Products | | | 8.22% | |
Agricultural Products | | | 4.45% | |
Food Retail | | | 4.09% | |
Distillers & Vintners | | | 4.02% | |
Personal Products | | | 3.83% | |
Brewers | | | 1.04% | |
| | | | |
| | | 91.77% | |
| | | | |
Percentages are based upon common stocks as a percentage of net assets.
| | |
The accompanying notes are an integral part of the financial statements. |
| 10 | | www.iconfunds.com |
| | |
| ICON Energy Fund | | Management Overview |
| | September 30, 2016 (Unaudited) |
| Q. | How did the Fund perform relative to its benchmarks? |
| A. | For the fiscal year ending September 30, 2016, the ICON Energy Fund (the Fund) Class S returned 14.55%, underperforming its sector-specific benchmark, the S&P 1500 Energy Index, which returned 18.26%. The Fund also lagged the broad benchmark, the S&P 1500 Index, which returned 15.49%. Total returns for other periods and additional Class shares as of September 30, 2016, appear in the subsequent pages of this Fund’s Management Overview. |
| Q. | What primary factors were behind the Fund’s relative performance? |
| A. | The Energy sector’s outperformance relative to the broad market came despite oil prices having a volatile year. From early October 2015 to mid-February 2016 the price per barrel of oil fell by over 47% to hit a low for the period about $26.11 per barrel. The low price of oil sparked anticipation of reduced oil production and we saw a traumatic reduction in oil rig count in the U.S. By May of 2016 the U.S. rig count fell to 316 from the 809 rigs reported at the beginning of the fiscal year. From the February 2016 low to June 2016 oil gained about 95% to reach its high for the period of $51.23 per barrel. The fiscal year ended with an announcement from the Organization of Petroleum Exporting Countries (OPEC) that it had agreed to curtail production to support oil pricing. This production curtailment reversed an 8 year trend of OPEC’s resistance to engage in production cuts to support oil pricing. Despite all the volatility, the price of oil gained over 6% for the fiscal year ended September 30, 2016. Outside of oil, natural gas, had a strong but volatile year as well with the natural gas one month forward contract gaining about 15% for the one year period ended September 30, 2016. One factor in the rise in natural gas was increased demand from Mexico for U.S. natural gas. This increase was due in part to Mexico’s passage of several aggressive energy bills in 2013 and 2014. Mexico’s energy reforms included a plan to reduce the cost of electricity production by replacing the less efficient diesel and oil electrical pants with natural gas electrical plants. |
| Q. | How did the Fund’s composition affect performance? |
| A. | The Oil & Gas Equipment & Services industry was the largest detractor to the Fund’s performance relative to the benchmark at the industry level. The Fund’s stock selection within this industry detracted from performance with the Fund’s holdings in the industry gaining around 2% compared to the over 13% gain for the benchmark. One stock within the Oil & Gas Equipment & Services industry, Oceaneering International, was the single largest detractor to the Fund’s relative performance as the stock dropped 27.54% over the course of the fiscal year. Another detractor from benchmark relative performance was the Fund’s stock selection in the Coal & Consumable Fuels industry as one stock, Alliance Resource Partners, L.P., was down approximately 37% for the year. Lastly, The Fund’s underweight position in the Integrated Oil & Gas industry detracted from performance relative to the benchmark. |
The greatest contributor to the Fund’s performance on an industry level were the Fund’s holdings in the Oil & Gas Storage & Transportation industry. During the first three months of the fiscal year the Fund had an underweight position in the Oil & Gas Storage & Transportation industry relative to the benchmark. During that time, the industry declined approximately 30%. However, by the end of January 2016, the Fund was overweight this industry relative to the benchmark and from the end of December 2015 through the end of September 2016, the industry gained over 60%. Looking at the entire fiscal year ended September 30, 2016 the Fund’s holdings in the Oil & Gas Storage & Transportation industry gained over 50% compared the benchmark’s gain of approximately 13% in the industry.
| Q. | What is your investment outlook for the Energy sector? |
| A. | At the end of the fiscal year, the overall average value-to-price (V/P) ratio for the Energy sector was 1.01 while the V/P ratio for the overall market was 1.09. With the recent run up in the Oil & Gas Storage & Transportation industry, the Fund’s position in the industry was reduced but remains slightly overweighed relative to the benchmark. Additionally the Fund also has a slight overweight Oil & Gas Refining & Marketing industry. Over the course of the upcoming fiscal year we are looking for signs of stabilization in forward looking earnings within the Energy sector and will reposition the Fund as our valuation methodology dictates. |
| | |
| |
| Annual Report | September 30, 2016 | | 11 |
| | |
| ICON Energy Fund | | Management Overview |
| | September 30, 2016 (Unaudited) |
Average Annual Total Return (as of September 30, 2016)
| | | | | | | | | | | | | | | | | | | | | | | | | | | | |
| | | Inception
Date | | | 1 Year | | | 5 Years | | | 10 Years | | | Since
Inception | | | Gross Expense
Ratio* | | | Net Expense
Ratio* | |
| |
ICON Energy Fund - Class S | | | 11/5/97 | | | | 14.55 | % | | | 1.09 | % | | | 2.50 | % | | | 8.47 | % | | | 1.42 | % | | | 1.42% | |
ICON Energy Fund - Class C | | | 9/30/10 | | | | 13.31 | % | | | 0.01 | % | | | N/A | | | | -0.03 | % | | | 2.43 | % | | | 2.43% | |
ICON Energy Fund - Class A | | | 9/30/10 | | | | 14.19 | % | | | 0.79 | % | | | N/A | | | | 0.74 | % | | | 1.66 | % | | | 1.66% | |
ICON Energy Fund - Class A | | | | | | | | | | | | | | | | | | | | | | | | | | | | |
(including maximum sales charge of 5.75%) | | | 9/30/10 | | | | 7.61 | % | | | -0.39 | % | | | N/A | | | | -0.25 | % | | | 1.66 | % | | | 1.66% | |
S&P 1500 Energy Index | | | | | | | 18.26 | % | | | 5.35 | % | | | 4.45 | % | | | 7.47 | % | | | N/A | | | | N/A | |
S&P Composite 1500 Index | | | | | | | 15.49 | % | | | 16.44 | % | | | 7.44 | % | | | 6.80 | % | | | N/A | | | | N/A | |
Past performance is not a guarantee of future results. Information about these performance results and the comparative indexes can be found in the About This Report section. The Adviser has agreed to limit certain Fund expenses; without these limitations, returns would have been lower. The limitation provisions may be terminated in the future.
| * | Please see the most recent prospectus for details. |
Class C total returns exclude applicable sales charges. If sales charges were included returns would be lower.
Value of a $10,000 Investment (through September 30, 2016)

Past performance is not a guarantee of future results. The above graph compares a $10,000 investment made in the Fund’s Class S shares on the Class’ inception date of 11/5/97 to a $10,000 investment made in unmanaged securities indexes on that date. The Fund’s performance in this chart and the performance table assumes the reinvestment of dividends and capital gain distributions but does not reflect the deduction of taxes that a shareholder would pay on Fund distributions or on the redemption of Fund shares.
| | |
| ICON Energy Fund | | Schedule of Investments |
| | September 30, 2016 |
| | | | | | |
| | | Shares or
Principal
Amount | | Value | |
| |
Common Stocks (98.00%) | |
Integrated Oil & Gas (27.85%) | |
Chevron Corp. | | 259,500 | | $ | 26,707,740 | |
Eni S.p.A., Sponsored ADR(a) | | 225,000 | | | 6,495,750 | |
Exxon Mobil Corp. | | 462,500 | | | 40,367,000 | |
Royal Dutch Shell PLC, Sponsored ADR, Class A | | 228,200 | | | 11,425,974 | |
Suncor Energy, Inc. | | 472,200 | | | 13,117,716 | |
| | | | | | |
| | | | | 98,114,180 | |
| | | | | | |
Oil & Gas Equipment & Services (20.24%) | |
Baker Hughes, Inc. | | 109,000 | | | 5,501,230 | |
Bristow Group, Inc.(a) | | 442,000 | | | 6,196,840 | |
Dril-Quip, Inc.(b) | | 153,400 | | | 8,550,516 | |
Matrix Service Co.(b) | | 189,000 | | | 3,545,640 | |
National Oilwell Varco, Inc. | | 95,500 | | | 3,508,670 | |
Oceaneering International, Inc. | | 271,300 | | | 7,463,463 | |
RPC, Inc.(a)(b) | | 467,000 | | | 7,845,600 | |
Schlumberger, Ltd. | | 284,550 | | | 22,377,012 | |
Tenaris S.A., ADR(a) | | 222,600 | | | 6,321,840 | |
| | | | | | |
| | | | | 71,310,811 | |
| | | | | | |
Oil & Gas Exploration & Production (32.05%) | |
Antero Resources Corp.(b) | | 128,300 | | | 3,457,685 | |
Cabot Oil & Gas Corp. | | 404,800 | | | 10,443,840 | |
Carrizo Oil & Gas, Inc.(b) | | 149,500 | | | 6,072,690 | |
Chesapeake Energy Corp.(a)(b) | | 1,302,850 | | | 8,168,869 | |
Cimarex Energy Co. | | 52,500 | | | 7,054,425 | |
Continental Resources, Inc.(b) | | 126,950 | | | 6,596,322 | |
Denbury Resources, Inc.(a)(b) | | 1,020,450 | | | 3,296,054 | |
Diamondback Energy, Inc.(b) | | 129,050 | | | 12,458,487 | |
EOG Resources, Inc. | | 120,100 | | | 11,614,871 | |
EQT Corp. | | 99,400 | | | 7,218,428 | |
Gulfport Energy Corp.(b) | | 157,100 | | | 4,438,075 | |
Matador Resources Co.(b) | | 220,400 | | | 5,364,536 | |
Newfield Exploration Co.(b) | | 39,000 | | | 1,694,940 | |
Southwestern Energy Co.(b) | | 303,000 | | | 4,193,520 | |
Synergy Resources Corp.(b) | | 1,728,550 | | | 11,978,852 | |
W&T Offshore, Inc.(a)(b) | | 1,480,900 | | | 2,606,384 | |
Whiting Petroleum Corp.(a)(b) | | 713,434 | | | 6,235,413 | |
| | | | | | |
| | | | | 112,893,391 | |
| | | | | | |
Oil & Gas Refining & Marketing (8.82%) | |
HollyFrontier Corp. | | 229,600 | | | 5,625,200 | |
Marathon Petroleum Corp. | | 130,950 | | | 5,315,260 | |
PBF Energy, Inc., Class A(a) | | 152,500 | | | 3,452,600 | |
Phillips 66 | | 109,050 | | | 8,783,978 | |
Tesoro Corp. | | 56,900 | | | 4,526,964 | |
Valero Energy Corp. | | 63,150 | | | 3,346,950 | |
| | | | | | |
| | | | | 31,050,952 | |
| | | | | | |
| | | | | | | | |
| | | Shares or
Principal
Amount | | | Value | |
| |
Oil & Gas Storage & Transportation (9.04%) | |
Golar LNG, Ltd.(a) | | | 329,000 | | | $ | 6,974,800 | |
Magellan Midstream Partners L.P. | | | 141,500 | | | | 10,009,710 | |
Ship Finance International, Ltd.(a) | | | 326,700 | | | | 4,812,291 | |
Teekay Corp. | | | 200,000 | | | | 1,542,000 | |
Teekay LNG Partners L.P. | | | 446,700 | | | | 6,758,571 | |
Williams Cos., Inc. | | | 57,120 | | | | 1,755,298 | |
| | | | | | | | |
| | | | | | | 31,852,670 | |
| | | | | | | | |
| | |
Total Common Stocks (Cost $342,828,109) | | | | | | | 345,222,004 | |
| | | | | | | | |
| |
Collateral for Securities on Loan (12.11%) | | | | | |
State Street Navigator Prime Portfolio, 0.30% | | | 42,662,836 | | | | 42,662,836 | |
| | | | | | | | |
| |
Total Collateral for Securities on Loan (Cost $42,662,836) | | | | 42,662,836 | |
| | | | | | | | |
|
Short-Term Investments (0.65%) | |
Time Deposits (0.65%) | |
State Street Euro Dollar Time Deposit (USD), 0.01%, 10/03/16 | | | 2,281,409 | | | | 2,281,409 | |
| | | | | | | | |
| | |
Total Short-Term Investments (Cost $2,281,409) | | | | | | | 2,281,409 | |
| | | | | | | | |
| | |
Total Investments (110.76%) (Cost $387,772,354) | | | | | | $ | 390,166,249 | |
| |
Liabilities Less Other Assets (-10.76%) | | | | (37,897,704) | |
| | | | | | | | |
| | |
Net Assets (100.00%) | | | | | | $ | 352,268,545 | |
| | | | | | | | |
| (a) | All or a portion of the security was on loan as of September 30, 2016. |
| (b) | Non-income producing security. |
ADR - American Depositary Receipt
| | | | |
| Sector Composition (September 30, 2016) | | | |
| |
Energy | | | 98.00 | % |
| | | | |
| | | 98.00 | % |
| | | | |
Percentages are based upon common stocks as a percentage of net assets.
| | |
The accompanying notes are an integral part of the financial statements. |
| Annual Report | September 30, 2016 | | 13 |
| | |
| ICON Energy Fund | | Schedule of Investments |
| | September 30, 2016 |
| | | | |
| Industry Composition (September 30, 2016) | | | |
| |
Oil & Gas Exploration & Production | | | 32.05% | |
Integrated Oil & Gas | | | 27.85% | |
Oil & Gas Equipment & Services | | | 20.24% | |
Oil & Gas Storage & Transportation | | | 9.04% | |
Oil & Gas Refining & Marketing | | | 8.82% | |
| | | | |
| | | 98.00% | |
| | | | |
Percentages are based upon common stocks as a percentage of net assets.
| | |
The accompanying notes are an integral part of the financial statements. |
| 14 | | www.iconfunds.com |
| | |
| ICON Financial Fund | | Management Overview |
| | September 30, 2016 (Unaudited) |
| Q. | How did the Fund perform relative to its benchmarks? |
| A. | The ICON Financial Fund (the Fund) Class S returned -.90% for the fiscal year ending September 30, 2016, lagging both its sector-specific benchmark, the S&P 1500 Financials Index, which returned 8.43%, and its broad benchmark, the S&P 1500 Index, which returned 15.49%. Total returns for other periods and additional Class shares as of September 30, 2016 appear in the subsequent pages of this Fund’s Management Overview. |
| Q. | What primary factors were behind the Fund’s relative performance? |
| A. | Despite the Financial sector having the highest overall average value-to-price (V/P) ratio according to our valuation model of all sectors we track, the Financial sector struggled over the course of the fiscal year ending September 30, 2016. The Financial sector is heavily influenced by interest rates and for banking stocks the difference between short-term interest rates and long-term interest rates can be particularly influential. Over the course of the fiscal year rates on the long end of the yield curve declined, with the yield on 30-year U.S. Treasury Note falling from 2.85% to 2.32%. On the short end, the yield on the 3-month U.S. Treasury Bill actually rose slightly from -.02% to .28%. This flattening of the yield curve created headwinds for banks by increasing the cost to borrow at the short end of the yield curve and reducing the income generated by loans at the long end of the yield curve. |
Further struggles for the Financial sector came from the still unfolding Wells Fargo scandal. In early September 2016, Wells Fargo was fined and publicly reprimanded for creating false customer accounts. Upon the announcement of the fine, Wells Fargo stock fell over 11%. This incident appears to have reignited the negative view of the Financial sector.
| Q. | How did the Fund’s composition affect performance? |
| A. | The biggest detractor to the Fund’s performance relative to the benchmark was the Fund’s overweight position in the Real Estate Services industry. Over the course of the fiscal year ended September 30, 2016, the industry lost over 14%. Additional losses came from stock selection in the Life & Health Insurance industry. Specifically, the Fund’s position in CNO Financial Group, which lost over 17% over the course of the fiscal year, was the largest single detractor from the Fund’s performance. Losses in the Consumer Finance industry and Asset Management & Custody Bank industry detracted from the Fund’s performance relative to the benchmark. |
These losses were offset in part by the Fund’s holdings in the Mortgage REITs industry. Further losses were offset by the Fund’s holdings in the data processing industry within the Information Technology sector. Specifically Mastercard Inc., which gained more than 10% over the course of the fiscal year. However, the positive impact of holdings in these industries was not enough to overcome the underperformance discussed earlier.
It is important to note that the creation of the Real Estate sector in the Global Industry Classification Standards (GICS) in August 2016 impacted the Financial sector as several industries were moved out of the Financial sector and into the Real Estate sector.
| Q. | What is your investment outlook for the Financials sector? |
| A. | As of September 30, 2016, ICON’s overall average V/P ratio for the Financial sector was 1.32 while ICON’s overall average V/P ratio for the entire market was 1.09. Based on our valuation methodology, 65% industries in the financial sector have valuations above 1.10. Going into the next fiscal year, the Fund has notable overweight positions in the Thrifts & Mortgage Finance industry and the Multi-line Insurance industry. We will continue to look for opportunities in the Financial sector over the year as guided by value. |
| | |
| |
| Annual Report | September 30, 2016 | | 15 |
| | |
| ICON Financial Fund | | Management Overview |
| | September 30, 2016 (Unaudited) |
Average Annual Total Return (as of September 30, 2016)
| | | | | | | | | | | | | | | | | | | | | | | | | | | | |
| | | Inception
Date | | | 1 Year | | | 5 Years | | | 10 Years | | | Since
Inception | | | Gross Expense
Ratio* | | | Net Expense
Ratio* | |
ICON Financial Fund - Class S | | | 7/1/97 | | | | -0.90% | | | | 11.29% | | | | -3.35% | | | | 3.31% | | | | 1.56% | | | | 1.56% | |
ICON Financial Fund - Class A | | | 9/30/10 | | | | -1.41% | | | | 10.90% | | | | N/A | | | | 6.01% | | | | 2.26% | | | | 1.82% | |
ICON Financial Fund - Class A | | | | | | | | | | | | | | | | | | | | | | | | | | | | |
(including maximum sales charge of 5.75%) | | | 9/30/10 | | | | -7.11% | | | | 9.57% | | | | N/A | | | | 4.97% | | | | 2.26% | | | | 1.82% | |
S&P 1500 Financials Index | | | | | | | 8.43% | | | | 17.38% | | | | -0.78% | | | | 4.21% | | | | N/A | | | | N/A | |
S&P Composite 1500 Index | | | | | | | 15.49% | | | | 16.44% | | | | 7.44% | | | | 7.07% | | | | N/A | | | | N/A | |
Past performance is not a guarantee of future results. Information about these performance results and the comparative indexes can be found in the About This Report section. The Adviser has agreed to limit certain Fund expenses; without these limitations, returns would have been lower. The limitation provisions may be terminated in the future.
| * | Please see the most recent prospectus for details. |
Value of a $10,000 Investment (through September 30, 2016)
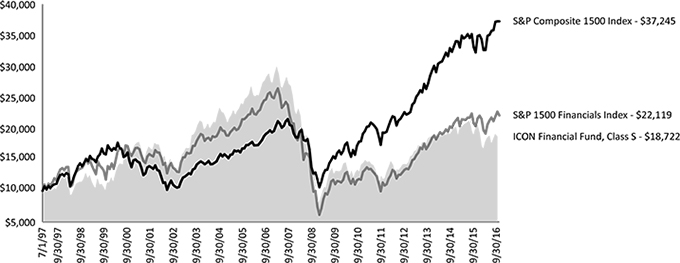
Past performance is not a guarantee of future results. The above graph compares a $10,000 investment made in the Fund’s Class S shares on the Class’ inception date of 7/1/97 to a $10,000 investment made in unmanaged securities indexes on that date. The Fund’s performance in this chart and the performance table assumes the reinvestment of dividends and capital gain distributions but does not reflect the deduction of taxes that a shareholder would pay on Fund distributions or on the redemption of Fund shares.
| | |
| ICON Financial Fund | | Schedule of Investments |
| | September 30, 2016 |
| | | | | | |
| | | Shares or Principal Amount | | Value | |
| |
Common Stocks (100.21%) | | | | |
Asset Management & Custody Banks (5.38%) | |
Affiliated Managers Group,
Inc.(a) | | 4,500 | | $ | 651,150 | |
GAMCO Investors, Inc.,
Class A | | 13,100 | | | 372,957 | |
Janus Capital Group, Inc. | | 78,600 | | | 1,101,186 | |
Legg Mason, Inc. | | 10,200 | | | 341,496 | |
| | | | | | |
| | | | | 2,466,789 | |
| | | | | | |
Consumer Finance (7.11%) | | | | |
Ally Financial, Inc. | | 17,900 | | | 348,513 | |
American Express Co. | | 14,900 | | | 954,196 | |
Capital One Financial Corp. | | 11,100 | | | 797,313 | |
Discover Financial Services | | 20,600 | | | 1,164,930 | |
| | | | | | |
| | | | | 3,264,952 | |
| | | | | | |
Data Processing & Outsourced Services (3.62%) | |
Euronet Worldwide, Inc.(a) | | 10,100 | | | 826,483 | |
MasterCard, Inc., Class A | | 8,200 | | | 834,514 | |
| | | | | | |
| | | | | 1,660,997 | |
| | | | | | |
Diversified Banks (24.49%) | |
Bank of America Corp. | | 169,100 | | | 2,646,415 | |
Citigroup, Inc. | | 38,400 | | | 1,813,632 | |
JPMorgan Chase & Co. | | 43,300 | | | 2,883,347 | |
U.S. Bancorp | | 38,800 | | | 1,664,132 | |
Wells Fargo & Co. | | 50,400 | | | 2,231,712 | |
| | | | | | |
| | | | | 11,239,238 | |
| | | | | | |
Financial Exchanges & Data (1.01%) | | | | |
MarketAxess Holdings, Inc. | | 2,800 | | | 463,652 | |
| | | | | | |
|
Insurance Brokers (5.69%) | |
Aon PLC | | 11,400 | | | 1,282,386 | |
Arthur J Gallagher & Co. | | 26,100 | | | 1,327,707 | |
| | | | | | |
| | | | | 2,610,093 | |
| | | | | | |
Investment Banking & Brokerage (2.33%) | | | | |
E*TRADE Financial Corp.(a) | | 36,700 | | | 1,068,704 | |
| | | | | | |
|
Life & Health Insurance (7.72%) | |
CNO Financial Group, Inc. | | 67,700 | | | 1,033,779 | |
Lincoln National Corp. | | 13,800 | | | 648,324 | |
Sun Life Financial, Inc.(b) | | 34,000 | | | 1,106,360 | |
Unum Group | | 21,400 | | | 755,634 | |
| | | | | | |
| | | | | 3,544,097 | |
| | | | | | |
Mortgage REIT’s (3.75%) | | | | |
Annaly Capital Management,
Inc., REIT | | 100,400 | | | 1,054,200 | |
MFA Financial, Inc., REIT | | 89,400 | | | 668,712 | |
| | | | | | |
| | | | | 1,722,912 | |
| | | | | | |
Multi-line Insurance (6.01%) | | | | |
American International
Group, Inc. | | 25,800 | | | 1,530,972 | |
Horace Mann Educators
Corp. | | 33,424 | | | 1,224,989 | |
| | | | | | |
| | | | | 2,755,961 | |
| | | | | | |
| | | | | | |
| | | Shares or Principal Amount | | Value | |
| |
Multi-Sector Holdings (3.93%) | |
Berkshire Hathaway, Inc.,
Class B(a) | | 12,500 | | $ | 1,805,875 | |
| | | | | | |
|
Other Diversified Financial Services (1.23%) | |
Voya Financial, Inc. | | 19,600 | | | 564,872 | |
| | | | | | |
| |
Property & Casualty Insurance (5.23%) | | | | |
AmTrust Financial Services,
Inc. | | 27,500 | | | 737,825 | |
XL Group PLC | | 49,500 | | | 1,664,685 | |
| | | | | | |
| | | | | 2,402,510 | |
| | | | | | |
Real Estate Services (6.06%) | | | | | | |
CBRE Group, Inc., Class A(a) | | 38,300 | | | 1,071,634 | |
Colliers International Group,
Inc. | | 14,900 | | | 626,843 | |
Jones Lang LaSalle, Inc. | | 9,500 | | | 1,081,005 | |
| | | | | | |
| | | | | 2,779,482 | |
| | | | | | |
Regional Banks (12.12%) | | | | | | |
BancorpSouth, Inc. | | 20,500 | | | 475,600 | |
Fifth Third Bancorp | | 70,600 | | | 1,444,476 | |
First Commonwealth
Financial Corp. | | 150,300 | | | 1,516,527 | |
First Midwest Bancorp, Inc. | | 42,300 | | | 818,928 | |
Signature Bank(a) | | 7,500 | | | 888,375 | |
SVB Financial Group(a) | | 3,800 | | | 420,052 | |
| | | | | | |
| | | | | 5,563,958 | |
| | | | | | |
Thrifts & Mortgage Finance (4.53%) | | | | |
BofI Holding, Inc.(a)(b) | | 19,200 | | | 430,080 | |
Dime Community
Bancshares, Inc. | | 36,043 | | | 604,081 | |
New York Community
Bancorp, Inc. | | 42,600 | | | 606,198 | |
Radian Group, Inc. | | 32,300 | | | 437,665 | |
| | | | | | |
| | | | | 2,078,024 | |
| | | | | | |
Total Common Stocks (Cost $47,278,764) | | | | | 45,992,116 | |
| | | | | | |
| |
Collateral for Securities on Loan (1.10%) | | | | |
State Street Navigator Prime
Portfolio, 0.30% | | 502,800 | | | 502,800 | |
| | | | | | |
| |
Total Collateral for Securities on Loan (Cost $502,800) | | | 502,800 | |
| | | | | | |
| | |
Total Investments (101.31%) (Cost $47,781,564) | | | | $ | 46,494,916 | |
| |
Liabilities Less Other Assets (-1.31%) | | | (599,542) | |
| | | | | | |
| | |
Net Assets (100.00%) | | | | $ | 45,895,374 | |
| | | | | | |
| | |
The accompanying notes are an integral part of the financial statements. |
| Annual Report | September 30, 2016 | | 17 |
| | |
| ICON Financial Fund | | Schedule of Investments |
| | September 30, 2016 |
| (a) | Non-income producing security. |
| (b) | All or a portion of the security was on loan as of September 30, 2016. |
REIT - Real Estate Investment Trust
| | | | |
| Sector Composition (September 30, 2016) | | | |
| |
Financial | | | 90.53% | |
Real Estate | | | 6.06% | |
Information Technology | | | 3.62% | |
| | | | |
| | | 100.21% | |
| | | | |
Percentages are based upon common stocks as a percentage of net assets.
| | | | |
| Industry Composition (September 30, 2016) | | | |
| |
Diversified Banks | | | 24.49% | |
Regional Banks | | | 12.12% | |
Life & Health Insurance | | | 7.72% | |
Consumer Finance | | | 7.11% | |
Real Estate Services | | | 6.06% | |
Multi-line Insurance | | | 6.01% | |
Insurance Brokers | | | 5.69% | |
Asset Management & Custody Banks | | | 5.38% | |
Property & Casualty Insurance | | | 5.23% | |
Thrifts & Mortgage Finance | | | 4.53% | |
Multi-Sector Holdings | | | 3.93% | |
Mortgage REIT’s | | | 3.75% | |
Data Processing & Outsourced Services | | | 3.62% | |
Investment Banking & Brokerage | | | 2.33% | |
Other Diversified Financial Services | | | 1.23% | |
Financial Exchanges & Data | | | 1.01% | |
| | | | |
| | | 100.21% | |
| | | | |
Percentages are based upon common stocks as a percentage of net assets.
| | |
The accompanying notes are an integral part of the financial statements. |
| 18 | | www.iconfunds.com |
| | |
| ICON Healthcare Fund | | Management Overview |
| | September 30, 2016 (Unaudited) |
| Q. | How did the Fund perform relative to its benchmarks? |
| A. | The ICON Healthcare Fund Class S returned 9.44% for the fiscal year ended September 30, 2016, under-performing its sector-specific benchmark, the S&P 1500 Health Care Index, which returned 11.01%, and under-performing its broad benchmark, the S&P 1500 Index, which returned 15.49%. Total returns for other periods and additional Class shares as of September 30, 2016 appear in the subsequent pages of this Fund’s Management Overview. |
| Q. | What primary factors were behind the Fund’s relative performance? |
| A. | While the broad market ended the past fiscal year on strong gains, the period wasn’t without its turbulence. January saw a selloff after the Federal Reserve hiked interest rates in the prior month. Equities rallied into the summer, but experienced another shock as Britain voted to leave the European Union. Brexit, as this came to be called, caused a sharp selloff in global stock markets, yet those losses were quickly erased as the rally steadily marched higher. While worries about global monetary policy and uncertainty surrounding the upcoming U.S. presidential election persist, the Health Care sector dealt with a number of its own unique challenges. Drug pricing concerns carried over from the past year and scrutiny surrounding this broad issue intensified as some companies had to defend their practices to Congress. Drug pricing has also made its way into political speeches for the upcoming election. The focus on this topic seems to be weighing on sentiment for pharmaceutical and biotechnology stocks. In addition, general health care utilization activity, after effects of the Affordable Care Act legislation, and merger and acquisition activity shaped the landscape for Health Care stocks over the year. The Health Care sector showed modest upside to our estimation of fair value for most of the year, with a slight increase as the period ended. |
| Q. | What were the Fund’s greatest contributors/detractors? |
| A. | Biotechnology was the greatest industry contributor to the Fund’s outperformance relative to the benchmark during the fiscal year as the Fund outperformed based on individual stock selection within the industry. Companies like Eagle Pharmaceuticals, Alexion Pharmaceuticals, and AbbVie were notable contributors. Additionally, the Health Care Services industry was a positive contributor to the Fund’s relative performance as the Fund was able to outperform based on individual stock selection within the industry. The Fund’s holdings in companies like BioTelemetry, MEDNAX, and Laboratory Corporation of America Holdings contributed to this industry’s returns. |
The Pharmaceutical industry was the Fund’s largest detractor to relative performance on an industry level. Specifically, stock selection within the industry had a negative effect on performance as an overweight position in Valeant Pharmaceuticals International, and underweight position in Johnson & Johnson detracted from relative returns. Additionally, the Health Care Distributors industry was a detractor from relative performance as the Fund was overweight this negatively performing industry for the year.
| Q. | What is your investment outlook for the Health Care sector? |
| A. | After positive returns for most of the past fiscal year, the Health Care sector has an overall average value-to-price (V/P) ratio of 1.07 according to our methodology; or in other words, we believe the overall average fair value for the Health Care sector is approximately 7% higher than where it is currently trading. We currently see broad value across most industries, most notably in the Pharmaceuticals and Managed Health Care industries. As always, we look to value as our primary guide and will adjust our positioning as market conditions dictate. |
| | |
| |
| Annual Report | September 30, 2016 | | 19 |
| | |
| ICON Healthcare Fund | | Management Overview |
| | September 30, 2016 (Unaudited) |
Average Annual Total Return (as of September 30, 2016)
| | | | | | | | | | | | | | |
| | | Inception
Date | | 1 Year | | 5 Years | | 10 Years | | Since
Inception | | Gross Expense
Ratio* | | Net Expense
Ratio* |
|
ICON Healthcare Fund - Class S | | 2/24/97 | | 9.44% | | 19.87% | | 8.54% | | 10.46% | | 1.36% | | 1.36% |
ICON Healthcare Fund - Class A | | 9/30/10 | | 9.03% | | 19.42% | | N/A | | 17.15% | | 1.62% | | 1.62% |
ICON Healthcare Fund - Class A | | | | | | | | | | | | | | |
(including maximum sales charge of 5.75%) | | 9/30/10 | | 2.76% | | 18.01% | | N/A | | 16.00% | | 1.62% | | 1.62% |
S&P 1500 Health Care Index | | | | 11.01% | | 20.33% | | 10.57% | | 9.38% | | N/A | | N/A |
S&P Composite 1500 Index | | | | 15.49% | | 16.44% | | 7.44% | | 7.49% | | N/A | | N/A |
Past performance is not a guarantee of future results. Information about these performance results and the comparative indexes can be found in the About This Report section. The Adviser has agreed to limit certain Fund expenses; without these limitations, returns would have been lower. The limitation provisions may be terminated in the future.
| * | Please see the most recent prospectus for details. |
Value of a $10,000 Investment (through September 30, 2016)
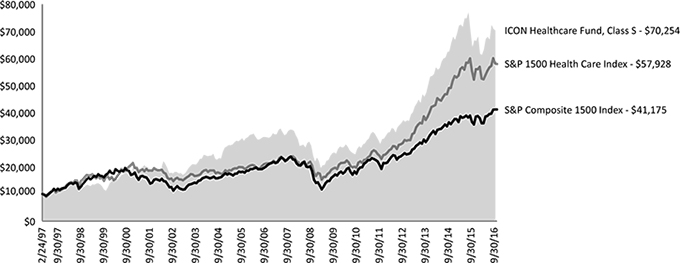
Past performance is not a guarantee of future results. The above graph compares a $10,000 investment made in the Fund’s Class S shares on the Class’ inception date of 2/24/97 to a $10,000 investment made in unmanaged securities indexes on that date. The Fund’s performance in this chart and the performance table assumes the reinvestment of dividends and capital gain distributions but does not reflect the deduction of taxes that a shareholder would pay on Fund distributions or on the redemption of Fund shares.
| | |
| ICON Healthcare Fund | | Schedule of Investments |
| | September 30, 2016 |
| | | | | | |
| | | Shares or Principal Amount | | Value | |
| |
Common Stocks (97.25%) | |
Biotechnology (28.20%) | |
AbbVie, Inc. | | 42,300 | | $ | 2,667,861 | |
Alexion Pharmaceuticals,
Inc.(a) | | 19,600 | | | 2,401,784 | |
AMAG Pharmaceuticals,
Inc.(a)(b) | | 39,100 | | | 958,341 | |
Amgen, Inc. | | 21,800 | | | 3,636,458 | |
Celgene Corp.(a) | | 55,300 | | | 5,780,509 | |
Emergent BioSolutions,
Inc.(a) | | 30,000 | | | 945,900 | |
Gilead Sciences, Inc. | | 36,300 | | | 2,872,056 | |
Ligand Pharmaceuticals,
Inc.(a) | | 4,000 | | | 408,240 | |
Regeneron Pharmaceuticals,
Inc.(a) | | 2,200 | | | 884,444 | |
Shire PLC, ADR | | 8,200 | | | 1,589,652 | |
Vertex Pharmaceuticals,
Inc.(a) | | 8,400 | | | 732,564 | |
| | | | | | |
| | | | | 22,877,809 | |
| | | | | | |
Health Care Equipment (23.48%) | |
Abbott Laboratories | | 22,600 | | | 955,754 | |
Becton, Dickinson and Co. | | 7,500 | | | 1,347,975 | |
Boston Scientific Corp.(a) | | 104,000 | | | 2,475,200 | |
CR Bard, Inc. | | 2,000 | | | 448,560 | |
Hologic, Inc.(a) | | 32,400 | | | 1,258,092 | |
Integer Holdings Corp.(a) | | 14,000 | | | 303,660 | |
LivaNova PLC(a) | | 8,000 | | | 480,880 | |
Medtronic PLC | | 42,800 | | | 3,697,920 | |
STERIS PLC | | 22,400 | | | 1,637,440 | |
Stryker Corp. | | 25,100 | | | 2,921,891 | |
Teleflex, Inc. | | 12,300 | | | 2,067,015 | |
Zimmer Biomet Holdings,
Inc. | | 11,200 | | | 1,456,224 | |
| | | | | | |
| | | | | 19,050,611 | |
| | | | | | |
Health Care Facilities (2.92%) | |
Acadia Healthcare Co.,
Inc.(a) | | 6,700 | | | 331,985 | |
Community Health Systems,
Inc.(a) | | 28,000 | | | 323,120 | |
HCA Holdings, Inc.(a) | | 8,000 | | | 605,040 | |
Tenet Healthcare Corp.(a) | | 49,000 | | | 1,110,340 | |
| | | | | | |
| | | | | 2,370,485 | |
| | | | | | |
Health Care Services (4.62%) | |
BioTelemetry, Inc.(a) | | 143,492 | | | 2,664,647 | |
DaVita, Inc.(a) | | 16,400 | | | 1,083,548 | |
| | | | | | |
| | | | | 3,748,195 | |
| | | | | | |
Health Care Supplies (1.52%) | |
Cooper Cos., Inc. | | 6,900 | | | 1,236,894 | |
| | | | | | |
Life Sciences Tools & Services (3.60%) | |
Albany Molecular Research,
Inc.(a)(b) | | 52,000 | | | 858,520 | |
Charles River Laboratories
International, Inc.(a) | | 24,800 | | | 2,066,832 | |
| | | | | | |
| | | | | 2,925,352 | |
| | | | | | |
| | | | | | | | |
| | | Shares or Principal
Amount | | | Value | |
| |
Managed Health Care (2.03%) | |
Anthem, Inc. | | | 4,900 | | | $ | 614,019 | |
CIGNA Corp. | | | 4,700 | | | | 612,504 | |
UnitedHealth Group, Inc. | | | 3,000 | | | | 420,000 | |
| | | | | | | | |
| | | | | | | 1,646,523 | |
| | | | | | | | |
Pharmaceuticals (30.88%) | |
Allergan PLC(a) | | | 20,500 | | | | 4,721,355 | |
Bayer AG, Sponsored ADR | | | 8,000 | | | | 804,000 | |
Bristol-Myers Squibb Co. | | | 55,500 | | | | 2,992,560 | |
Corcept Therapeutics, Inc.(a) | | | 92,300 | | | | 599,950 | |
Eli Lilly & Co. | | | 26,000 | | | | 2,086,760 | |
Endo International PLC(a) | | | 18,000 | | | | 362,700 | |
Horizon Pharma PLC(a) | | | 35,000 | | | | 634,550 | |
Innoviva, Inc.(a)(b) | | | 32,500 | | | | 357,175 | |
Jazz Pharmaceuticals PLC(a) | | | 16,700 | | | | 2,028,716 | |
Mylan N.V.(a) | | | 35,000 | | | | 1,334,200 | |
Novo Nordisk A/S, Sponsored ADR | | | 11,500 | | | | 478,285 | |
Pacira Pharmaceuticals,
Inc.(a) | | | 23,000 | | | | 787,060 | |
Perrigo Co. PLC | | | 6,300 | | | | 581,679 | |
Pfizer, Inc. | | | 60,000 | | | | 2,032,200 | |
Roche Holding AG,
Sponsored ADR | | | 66,200 | | | | 2,050,214 | |
Sucampo Pharmaceuticals,
Inc., Class A(a) | | | 64,400 | | | | 792,764 | |
Teva Pharmaceutical
Industries, Ltd.,
Sponsored ADR | | | 44,000 | | | | 2,024,440 | |
Valeant Pharmaceuticals
International, Inc.(a) | | | 15,700 | | | | 385,435 | |
| | | | | | | | |
| | | | | | | 25,054,043 | |
| | | | | | | | |
| | |
Total Common Stocks (Cost $80,639,654) | | | | | | | 78,909,912 | |
| | | | | | | | |
|
Collateral for Securities on Loan (1.91%) | |
State Street Navigator Prime
Portfolio, 0.30% | | | 1,546,000 | | | | 1,546,000 | |
| | | | | | | | |
| |
Total Collateral for Securities on Loan (Cost $1,546,000) | | | | 1,546,000 | |
| | | | | | | | |
|
Short-Term Investments (8.68%) | |
Time Deposits (8.68%) | |
State Street Euro Dollar Time Deposit (USD), | | | | | | | | |
0.01%, 10/03/16 | | | 7,042,553 | | | | 7,042,553 | |
| | | | | | | | |
| | |
Total Short-Term Investments (Cost $7,042,553) | | | | | | | 7,042,553 | |
| | | | | | | | |
| | |
The accompanying notes are an integral part of the financial statements. |
| Annual Report | September 30, 2016 | | 21 |
| | |
| ICON Healthcare Fund | | Schedule of Investments |
| | September 30, 2016 |
| | | | |
| | | Value | |
| |
Total Investments (107.84%) (Cost $89,228,207) | | $ | 87,498,465 | |
| |
Liabilities Less Other Assets (-7.84%) | | | (6,359,506) | |
| | | | |
| |
Net Assets (100.00%) | | $ | 81,138,959 | |
| | | | |
| (a) | Non-income producing security. |
| (b) | All or a portion of the security was on loan as of September 30, 2016. |
ADR - American Depositary Receipt
| | | | |
| Sector Composition (September 30, 2016) | | | |
| |
Health Care | | | 97.25% | |
| | | | |
| | | 97.25% | |
| | | | |
Percentages are based upon common stocks as a percentage of net assets.
| | | | |
| Industry Composition (September 30, 2016) | | | |
| |
| |
Pharmaceuticals | | | 30.88% | |
Biotechnology | | | 28.20% | |
Health Care Equipment | | | 23.48% | |
Health Care Services | | | 4.62% | |
Life Sciences Tools & Services | | | 3.60% | |
Health Care Facilities | | | 2.92% | |
Managed Health Care | | | 2.03% | |
Health Care Supplies | | | 1.52% | |
| | | | |
| | | 97.25% | |
| | | | |
Percentages are based upon common stocks as a percentage of net assets.
| | |
The accompanying notes are an integral part of the financial statements. |
| 22 | | www.iconfunds.com |
| | |
| ICON Industrials Fund | | Management Overview |
| | September 30, 2016 (Unaudited) |
| Q. | How did the Fund perform relative to its benchmarks? |
| A. | The ICON Industrials Fund (the Fund) Class S shares returned 12.07% for the fiscal year ended September 30, 2016, while its sector-specific benchmark, the S&P 1500 Industrials Index, returned 19.76%, and the S&P Composite 1500 Index returned 15.49%. Total returns for other periods and additional Class shares as of September 30, 2016, appear in the subsequent pages of this Fund’s Management Overview. |
| Q. | What primary factors were behind the Fund’s relative performance? |
| A. | Despite numerous macro-economic concerns and relatively negative investor sentiment, fiscal year 2016 produced strong gains for the cyclically sensitive Industrials sector. While the gains were relatively broad based from an industry standpoint, companies that derive a large portion of their revenues from either infrastructure buildouts or commodity extraction stood out during the fiscal year. Industries tied to infrastructure, such as the Industrial Machinery, Building Products, and Construction & Engineering industries, benefitted from a rebound in residential and commercial construction as well as the continued national focus on rebuilding our country’s roads and bridges. Further, the Heavy Electrical Equipment industry and the Construction & Farm Machinery & Heavy Trucks industry, both tied to the extraction of commodities, benefitted from a strong rebound in industrial commodities. These industries, which had been beaten down the previous year, experienced significant gains from those depressed levels and helped the Industrials sector outpace the broad market. |
| Q. | How did the Fund’s composition affect performance? |
| A. | From a valuation standpoint, according to our system, we began the period with a value-to-price (V/P) ratio of 1.09 for the Industrials sector indicating opportunity for upside returns within the sector. Despite this opportunity at the sector level, industry returns within the Industrials sector varied significantly, from approximately 52% for the best performing industry to approximately -6% for the worst performing industry, demonstrating the large role that industry rotation can play in sector investing. Additionally, industry leadership flipped aggressively with prior year losers rallying and prior year winners faltering. |
Relative to the benchmark, industries that contributed the most to the Fund’s performance included the Construction & Engineering, Human Resources & Employment Services, Trading Companies & Distributors, and Research & Consulting Services industries. All these industries produced positive total effect due to overweight industry positions and holdings that outperformed the benchmark.
Relative to the benchmark, industries that detracted the most from the Fund’s performance included the Airlines, Industrial Machinery, Aerospace & Defense, Railroads and Construction & Farm Machinery & Heavy Trucks industries. Either overweight positions or underperforming holdings in these industries resulted in relative underperformance during the fiscal year.
| Q. | What is your investment outlook for the Industrials sector? |
| A. | At the end of fiscal year 2016 the Industrials sector had a V/P ratio of approximately 1.02, an indication that our system has relatively muted return expectations for the Industrials sector over the next 9 to 12 months. Specific industries that are demonstrating value according to our system include Commercial Printing, Railroads, and Agriculture & Farm Machinery. We continue to look for industries that our system identifies as trading at a discount to fair value. Guided by our disciplined, systematic and non-emotional approach to investing, we remain watchful for new prospective investments and ready to reallocate and adapt as our investment system dictates. |
| | |
| |
| Annual Report | September 30, 2016 | | 23 |
| | |
| ICON Industrials Fund | | Management Overview |
| | September 30, 2016 (Unaudited) |
Average Annual Total Return (as of September 30, 2016)
| | | | | | | | | | | | | | |
| | | Inception
Date | | 1 Year | | 5 Years | | 10 Years | | Since
Inception | | Gross Expense
Ratio* | | Net Expense
Ratio* |
|
ICON Industrials Fund - Class S | | 5/9/97 | | 12.07% | | 13.24% | | 4.94% | | 5.13% | | 1.53% | | 1.50% |
ICON Industrials Fund - Class A | | 9/30/10 | | 11.79% | | 12.71% | | N/A | | 8.81% | | 2.67% | | 1.75% |
ICON Industrials Fund - Class A (including maximum sales charge of 5.75%) | | 9/30/10 | | 5.38% | | 11.39% | | N/A | | 7.74% | | 2.67% | | 1.75% |
S&P 1500 Industrials Index | | | | 19.76% | | 17.80% | | 8.07% | | 7.85% | | N/A | | N/A |
S&P Composite 1500 Index | | | | 15.49% | | 16.44% | | 7.44% | | 7.46% | | N/A | | N/A |
Past performance is not a guarantee of future results. Information about these performance results and the comparative indexes can be found in the About This Report section. The Adviser has agreed to limit certain Fund expenses; without these limitations, returns would have been lower. The limitation provisions may be terminated in the future.
| * | Please see the most recent prospectus for details. |
Value of a $10,000 Investment (through September 30, 2016)
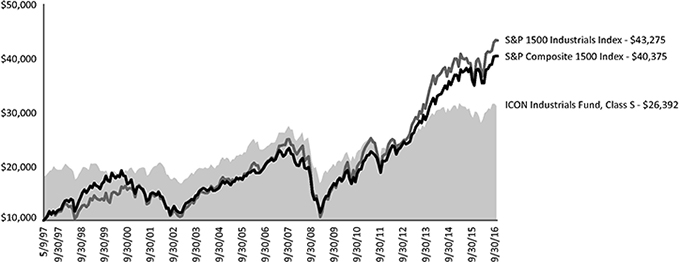
Past performance is not a guarantee of future results. The above graph compares a $10,000 investment made in the Fund’s Class S shares on the Class’ inception date of 5/9/97 to a $10,000 investment made in unmanaged securities indexes on that date. The Fund’s performance in this chart and the performance table assumes the reinvestment of dividends and capital gain distributions but does not reflect the deduction of taxes that a shareholder would pay on Fund distributions or on the redemption of Fund shares.
| | |
| ICON Industrials Fund | | Schedule of Investments |
| | September 30, 2016 |
| | | | | | | | |
| | | Shares or Principal
Amount | | | Value | |
| |
Common Stocks (92.62%) | |
Aerospace & Defense (20.19%) | |
B/E Aerospace, Inc. | | | 13,500 | | | $ | 697,410 | |
Boeing Co. | | | 7,000 | | | | 922,180 | |
General Dynamics Corp. | | | 1,900 | | | | 294,804 | |
Hexcel Corp. | | | 5,000 | | | | 221,500 | |
Orbital ATK, Inc. | | | 17,390 | | | | 1,325,640 | |
Raytheon Co. | | | 1,100 | | | | 149,743 | |
Spirit AeroSystems Holdings,
Inc., Class A(a) | | | 14,000 | | | | 623,560 | |
United Technologies Corp. | | | 7,900 | | | | 802,640 | |
| | | | | | | | |
| | | | | | | 5,037,477 | |
| | | | | | | | |
Air Freight & Logistics (2.50%) | |
Echo Global Logistics, Inc.(a) | | | 20,973 | | | | 483,637 | |
FedEx Corp. | | | 800 | | | | 139,744 | |
| | | | | | | | |
| | | | | | | 623,381 | |
| | | | | | | | |
Airlines (3.63%) | |
Alaska Air Group, Inc. | | | 6,600 | | | | 434,676 | |
Delta Air Lines, Inc. | | | 12,000 | | | | 472,320 | |
| | | | | | | | |
| | | | | | | 906,996 | |
| | | | | | | | |
Building Products (15.35%) | |
Apogee Enterprises, Inc. | | | 10,000 | | | | 446,900 | |
Builders FirstSource, Inc.(a) | | | 35,000 | | | | 402,850 | |
Fortune Brands Home &
Security, Inc. | | | 1,500 | | | | 87,150 | |
Masco Corp. | | | 34,500 | | | | 1,183,695 | |
PGT, Inc.(a) | | | 115,000 | | | | 1,227,050 | |
Quanex Building Products
Corp. | | | 28,000 | | | | 483,280 | |
| | | | | | | | |
| | | | | | | 3,830,925 | |
| | | | | | | | |
Commercial Printing (2.06%) | |
Deluxe Corp. | | | 7,700 | | | | 514,514 | |
| | | | | | | | |
|
Construction & Engineering (6.39%) | |
AECOM(a) | | | 17,500 | | | | 520,275 | |
Comfort Systems U.S.A., Inc. | | | 18,500 | | | | 542,235 | |
Dycom Industries, Inc.(a) | | | 6,500 | | | | 531,570 | |
| | | | | | | | |
| | | | | | | 1,594,080 �� | |
| | | | | | | | |
Construction Machinery & Heavy Trucks (5.17%) | |
Allison Transmission
Holdings, Inc. | | | 45,000 | | | | 1,290,600 | |
| | | | | | | | |
|
Human Resource & Employment Services (13.17%) | |
Kforce, Inc. | | | 34,000 | | | | 696,660 | |
Korn/Ferry International | | | 30,500 | | | | 640,500 | |
ManpowerGroup, Inc. | | | 9,000 | | | | 650,340 | |
On Assignment, Inc.(a) | | | 17,000 | | | | 616,930 | |
Robert Half International, Inc. | | | 18,000 | | | | 681,480 | |
| | | | | | | | |
| | | | | | | 3,285,910 | |
| | | | | | | | |
Industrial Conglomerates (6.40%) | |
Carlisle Cos., Inc. | | | 5,000 | | | | 512,850 | |
Honeywell International, Inc. | | | 9,300 | | | | 1,084,287 | |
| | | | | | | | |
| | | | | | | 1,597,137 | |
| | | | | | | | |
| | | | | | |
| | | Shares or Principal
Amount | | Value | |
| |
Industrial Machinery (5.37%) | |
Crane Co. | | 5,700 | | $ | 359,157 | |
Middleby Corp.(a) | | 4,000 | | | 494,480 | |
Snap-on, Inc. | | 3,200 | | | 486,272 | |
| | | | | | |
| | | | | 1,339,909 | |
| | | | | | |
Railroads (1.84%) | |
Union Pacific Corp. | | 4,700 | | | 458,391 | |
| | | | | | |
|
Research & Consulting Services (2.40%) | |
Hill International, Inc.(a) | | 130,061 | | | 599,581 | |
| | | | | | |
|
Trading Companies & Distributors (5.15%) | |
Air Lease Corp. | | 45,000 | | | 1,286,100 | |
| | | | | | |
|
Trucking (3.00%) | |
Hertz Global Holdings, Inc.(a) | | 14,400 | | | 578,304 | |
JB Hunt Transport Services, Inc. | | 2,100 | | | 170,394 | |
| | | | | | |
| | | | | 748,698 | |
| | | | | | |
Total Common Stocks (Cost $21,773,155) | | | | | 23,113,699 | |
| | | | | | |
|
Short-Term Investments (10.38%) | |
Time Deposits (10.38%) | |
State Street Euro Dollar Time Deposit (USD),
0.01%, 10/03/16 | | 2,590,162 | | | 2,590,162 | |
| | | | | | |
| | |
Total Short-Term Investments (Cost $2,590,162) | | | | | 2,590,162 | |
| | | | | | |
| | |
Total Investments (103.00%) (Cost $24,363,317) | | | | $ | 25,703,861 | |
| | |
Liabilities Less Other Assets (-3.00%) | | | | | (748,994) | |
| | | | | | |
Net Assets (100.00%) | | | | $ | 24,954,867 | |
| | | | | | |
| (a) | Non-income producing security. |
| | |
The accompanying notes are an integral part of the financial statements. |
| Annual Report | September 30, 2016 | | 25 |
| | |
| ICON Industrials Fund | | Schedule of Investments |
| | September 30, 2016 |
| | | | |
| Sector Composition (September 30, 2016) | | | |
| |
| |
Industrials | | | 92.62% | |
| | | | |
| | | 92.62% | |
| | | | |
Percentages are based upon common stocks as a percentage of net assets.
| | | | |
| Industry Composition (September 30, 2016) | | | |
| |
| |
Aerospace & Defense | | | 20.19% | |
Building Products | | | 15.35% | |
Human Resource & Employment Services | | | 13.17% | |
Industrial Conglomerates | | | 6.40% | |
Construction & Engineering | | | 6.39% | |
Industrial Machinery | | | 5.37% | |
Construction Machinery & Heavy Trucks | | | 5.17% | |
Trading Companies & Distributors | | | 5.15% | |
Airlines | | | 3.63% | |
Trucking | | | 3.00% | |
Air Freight & Logistics | | | 2.50% | |
Research & Consulting Services | | | 2.40% | |
Commercial Printing | | | 2.06% | |
Railroads | | | 1.84% | |
| | | | |
| | | 92.62% | |
| | | | |
Percentages are based upon common stocks as a percentage of net assets.
| | |
The accompanying notes are an integral part of the financial statements. |
| 26 | | www.iconfunds.com |
| | |
| ICON Information Technology Fund | | Management Overview |
| | September 30, 2016 (Unaudited) |
| Q. | How did the Fund perform relative to its benchmarks? |
| A. | The ICON Information Technology Fund (the Fund) Class S shares returned 20.13% for the fiscal year ended September 30, 2016, while its sector-specific benchmark, the S&P 1500 Information Technology Index, returned 22.83%, and the S&P 1500 Index gained 15.49%. Total returns for other periods and additional Class shares as of September 30, 2016, appear in the subsequent pages of this Fund’s Management Overview. |
| Q. | What primary factors were behind the Fund’s relative performance? |
| A. | The Information Technology sector continues to shift as cloud based applications continue to gain market share. Bloomberg reported anticipated enterprise application growth for cloud based products to grow by 15.6% from 2014 to 2019, while on-site enterprise applications growth is projected to be only 3.9% for that same time period. Cloud exposure is spread across many industries within the Information Technology sector as different types of companies try to cash in on this growth engine. Examples range from Microsoft in the System Software industry, Cisco Systems in the Communication Equipment industry, and HP Inc. in the Technology Hardware, Storage & Peripherals industry just to name a few. Returns for all three of these companies outpaced the S&P 1500 Information Technology Index over the fiscal year. Many companies used merger and acquisition activity to get exposure to cloud based products as well as data analytics. In the fiscal year ending September 30, 2014 there were 27 acquisitions while there were 42 acquisitions in the fiscal year ending September 30, 2016. |
| Q. | How did the Fund’s composition affect performance? |
| A. | Stock selection in the Data Processing & Outsourced Services industry and the Semiconductors industry detracted from performance relative to the benchmark. During the course of the fiscal year ended September 30, 2016, the Fund’s positions in the Data Processing & Outsourced Services industry returned less than 1% while the benchmark holdings in the industry gained over 17%. Everi Holdings was the largest single detractor from the Data Processing & Outsourced Services industry, losing over 24% the day after reporting its first quarter earnings. |
These losses were offset in part by the Fund’s overweight position in the Semiconductor Equipment industry. During the course of the fiscal year, the Fund had an average position of around 6.5% in the Semiconductor Equipment industry while the benchmark’s average position was close to 1.5%. The Fund’s position in this industry returned about 65% for the fiscal year.
| Q. | What is your investment outlook for the Information Technology sector? |
| A. | At the end of fiscal year 2016, the Information Technology sector had a value-to-price (V/P) ratio of 1.09 according to ICON’s valuation methodology, an indication that our system still sees upside potential for the sector. Specific industries that are demonstrating value according to our system include both the Semiconductor Equipment industry and the Data Processing & Outsourced Services industry, and, as a result, the Fund is overweight in those two industries relative to the benchmark. We will continue to look for opportunities in the Information Technology sector over the year as guided by value. |
| | |
| |
| Annual Report | September 30, 2016 | | 27 |
| | |
| ICON Information Technology Fund | | Management Overview |
| | September 30, 2016 (Unaudited) |
Average Annual Total Return (as of September 30, 2016)
| | | | | | | | | | | | | | |
| | | Inception
Date | | 1 Year | | 5 Years | | 10 Years | | Since
Inception | | Gross Expense
Ratio* | | Net Expense
Ratio* |
|
ICON Information Technology Fund - Class S | | 2/19/97 | | 20.13% | | 16.92% | | 7.55% | | 8.77% | | 1.44% | | 1.44% |
ICON Information Technology Fund - Class A | | 9/30/10 | | 19.80% | | 16.44% | | N/A | | 13.87% | | 1.90% | | 1.75% |
ICON Information Technology Fund - Class A
(including maximum sales charge of 5.75%) | | 9/30/10 | | 12.93% | | 15.07% | | N/A | | 12.75% | | 1.90% | | 1.75% |
S&P 1500 Information Technology Index | | | | 22.83% | | 17.99% | | 10.36% | | 7.87% | | N/A | | N/A |
NASDAQ Composite Index | | | | 14.97% | | 17.07% | | 8.93% | | 7.17% | | N/A | | N/A |
S&P Composite 1500 Index | | | | 15.49% | | 16.44% | | 7.44% | | 7.46% | | N/A | | N/A |
Past performance is not a guarantee of future results. Information about these performance results and the comparative indexes can be found in the About This Report section. The Adviser has agreed to limit certain Fund expenses; without these limitations, returns would have been lower. The limitation provisions may be terminated in the future.
| * | Please see the most recent prospectus for details. |
Value of a $10,000 Investment (through September 30, 2016)
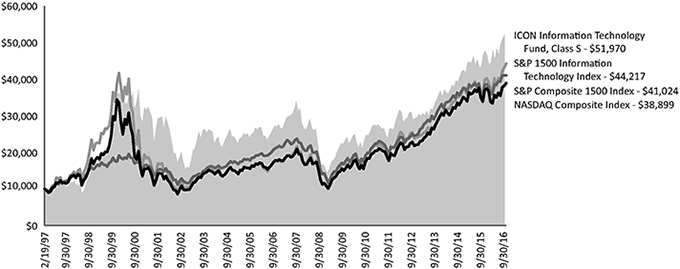
Past performance is not a guarantee of future results. The above graph compares a $10,000 investment made in the Fund’s Class S shares on the Class’ inception date of 2/19/97 to a $10,000 investment made in unmanaged securities indexes on that date. The Fund’s performance in this chart and the performance table assumes the reinvestment of dividends and capital gain distributions but does not reflect the deduction of taxes that a shareholder would pay on Fund distributions or on the redemption of Fund shares.
| | |
| ICON Information Technology Fund | | Schedule of Investments |
| | September 30, 2016 |
| | | | | | |
| | | Shares or
Principal
Amount | | Value | |
| |
Common Stocks (99.14%) | |
Application Software (5.08%) | | | | |
CDK Global, Inc. | | 22,100 | | $ | 1,267,656 | |
Mentor Graphics Corp. | | 51,100 | | | 1,351,084 | |
| | | | | | |
| | | | | 2,618,740 | |
| | | | | | |
Communications Equipment (4.02%) | |
Cisco Systems, Inc. | | 32,100 | | | 1,018,212 | |
Digi International, Inc.(a) | | 16,100 | | | 183,540 | |
Harris Corp. | | 9,500 | | | 870,295 | |
| | | | | | |
| | | | | 2,072,047 | |
| | | | | | |
Data Processing & Outsourced Services (14.97%) | |
Automatic Data Processing, Inc. | | 9,900 | | | 873,180 | |
Broadridge Financial Solutions, Inc. | | 7,300 | | | 494,867 | |
DST Systems, Inc. | | 4,400 | | | 518,848 | |
Euronet Worldwide, Inc.(a) | | 7,400 | | | 605,542 | |
MasterCard, Inc., Class A | | 14,700 | | | 1,496,019 | |
MAXIMUS, Inc. | | 22,500 | | | 1,272,600 | |
Total System Services, Inc. | | 12,000 | | | 565,800 | |
Visa, Inc., Class A | | 14,180 | | | 1,172,686 | |
Xerox Corp. | | 71,200 | | | 721,256 | |
| | | | | | |
| | | | | 7,720,798 | |
| | | | | | |
Electronic Components (1.87%) | | | | |
Rogers Corp.(a) | | 15,800 | | | 965,064 | |
| | | | | | |
|
Electronic Equipment & Instruments (3.53%) | |
Fitbit, Inc., Class A(a)(b) | | 54,400 | | | 807,296 | |
Keysight Technologies, Inc.(a) | | 16,600 | | | 526,054 | |
OSI Systems, Inc.(a) | | 7,500 | | | 490,350 | |
| | | | | | |
| | | | | 1,823,700 | |
| | | | | | |
Electronic Manufacturing Services (4.28%) | |
Fabrinet(a) | | 12,400 | | | 552,916 | |
IPG Photonics Corp.(a) | | 8,835 | | | 727,562 | |
TE Connectivity, Ltd. | | 14,400 | | | 927,072 | |
| | | | | | |
| | | | | 2,207,550 | |
| | | | | | |
Home Entertainment Software (4.55%) | | | | |
Activision Blizzard, Inc. | | 29,100 | | | 1,289,130 | |
Electronic Arts, Inc.(a) | | 12,400 | | | 1,058,960 | |
| | | | | | |
| | | | | 2,348,090 | |
| | | | | | |
Internet Software & Services (19.44%) | | | | |
Alphabet, Inc., Class A(a) | | 3,200 | | | 2,572,992 | |
Alphabet, Inc., Class C(a) | | 3,439 | | | 2,673,101 | |
eBay, Inc.(a) | | 18,600 | | | 611,940 | |
Facebook, Inc., Class A(a) | | 29,000 | | | 3,719,830 | |
j2 Global, Inc. | | 6,800 | | | 452,948 | |
| | | | | | |
| | | | | 10,030,811 | |
| | | | | | |
IT Consulting & Other Services (1.22%) | |
Cognizant Technology
Solutions Corp.,
Class A(a) | | 13,200 | | | 629,772 | |
| | | | | | |
| | | | | | | | |
| | | Shares or
Principal
Amount | | | Value | |
| |
Semiconductor Equipment (7.00%) | |
Advanced Energy Industries, Inc.(a) | | | 22,197 | | | $ | 1,050,362 | |
Applied Materials, Inc. | | | 16,900 | | | | 509,535 | |
Photronics, Inc.(a) | | | 89,200 | | | | 919,652 | |
Teradyne, Inc. | | | 52,400 | | | | 1,130,792 | |
| | | | | | | | |
| | | | | | | 3,610,341 | |
| | | | | | | | |
Semiconductors (10.53%) | | | | | |
Broadcom, Ltd. | | | 5,300 | | | | 914,356 | |
Intel Corp. | | | 51,400 | | | | 1,940,350 | |
Monolithic Power Systems, Inc. | | | 8,400 | | | | 676,200 | |
QUALCOMM, Inc. | | | 11,600 | | | | 794,600 | |
Skyworks Solutions, Inc. | | | 14,500 | | | | 1,104,030 | |
| | | | | | | | |
| | | | | | | 5,429,536 | |
| | | | | | | | |
Systems Software (5.61%) | | | | | |
Microsoft Corp. | | | 29,500 | | | | 1,699,200 | |
Oracle Corp. | | | 30,400 | | | | 1,194,112 | |
| | | | | | | | |
| | | | | | | 2,893,312 | |
| | | | | | | | |
Technology Distributors (1.08%) | | | | | |
PC Connection, Inc. | | | 21,100 | | | | 557,462 | |
| | | | | | | | |
|
Technology Hardware, Storage & Peripherals (15.96%) | |
Apple, Inc. | | | 62,000 | | | | 7,009,100 | |
Electronics For Imaging,
Inc.(a) | | | 25,000 | | | | 1,223,000 | |
| | | | | | | | |
| | | | | | | 8,232,100 | |
| | | | | | | | |
Total Common Stocks (Cost $41,205,367) | | | | | | | 51,139,323 | |
| | | | | | | | |
|
Collateral for Securities on Loan (1.59%) | |
State Street Navigator Prime Portfolio, 0.30% | | | 823,500 | | | | 823,500 | |
| | | | | | | | |
| |
Total Collateral for Securities on Loan (Cost $823,500) | | | | 823,500 | |
| | | | | | | | |
| |
Short-Term Investments (0.61%) | | | | | |
Time Deposits (0.61%) | | | | | |
State Street Euro Dollar Time Deposit (USD),
0.01%, 10/03/16 | | | 314,271 | | | | 314,271 | |
| | | | | | | | |
| | |
Total Short-Term Investments (Cost $314,271) | | | | | | | 314,271 | |
| | | | | | | | |
| | |
Total Investments (101.34%) (Cost $42,343,138) | | | | | | $ | 52,277,094 | |
| |
Liabilities Less Other Assets (-1.34%) | | | | (693,252) | |
| | | | | | | | |
| | |
Net Assets (100.00%) | | | | | | $ | 51,583,842 | |
| | | | | | | | |
| | |
The accompanying notes are an integral part of the financial statements. |
| Annual Report | September 30, 2016 | | 29 |
| | |
| ICON Information Technology Fund | | Schedule of Investments |
| | September 30, 2016 |
| (a) | Non-income producing security. |
| (b) | All or a portion of the security was on loan as of September 30, 2016. |
| | | | |
| Sector Composition (September 30, 2016) | |
| |
| |
Information Technology | | | 99.14% | |
| | | | |
| | | 99.14% | |
| | | | |
Percentages are based upon common stocks as a percentage of net assets.
| | | | |
| Industry Composition (September 30, 2016) | |
| |
| |
Internet Software & Services | | | 19.44% | |
Technology Hardware, Storage & Peripherals | | | 15.96% | |
Data Processing & Outsourced Services | | | 14.97% | |
Semiconductors | | | 10.53% | |
Semiconductor Equipment | | | 7.00% | |
Systems Software | | | 5.61% | |
Application Software | | | 5.08% | |
Home Entertainment Software | | | 4.55% | |
Electronic Manufacturing Services | | | 4.28% | |
Communications Equipment | | | 4.02% | |
Electronic Equipment & Instruments | | | 3.53% | |
Electronic Components | | | 1.87% | |
IT Consulting & Other Services | | | 1.22% | |
Technology Distributors | | | 1.08% | |
| | | | |
| | | 99.14% | |
| | | | |
Percentages are based upon common stocks as a percentage of net assets.
| | |
The accompanying notes are an integral part of the financial statements. |
| 30 | | www.iconfunds.com |
| | |
| ICON Natural Resources Fund | | Management Overview |
| | September 30, 2016 (Unaudited) |
| Q. | How did the Fund perform relative to its benchmarks? |
| A. | The ICON Natural Resources Fund returned 17.24% for the fiscal year ended September 30, 2016, while the S&P Composite 1500 Index rose by 15.49%. Total returns for other periods and additional Class shares as of September 30, 2016 appear in the subsequent pages of this Fund’s Management Overview. |
| Q. | What primary factors were behind the Fund’s relative performance? |
| A. | While fiscal year 2016 produced strong returns from start to finish, it was a tale of two different markets largely driven by macro-economic shocks and general commodity movements. The year began with a strong rally that reversed rather quickly as commodities resumed their downward spiral, falling by approximately 20% before finding a bottom in the middle of February 2016. This aggressive sell-off hit industrial metals and oil the hardest, resulting in negative returns in industries tied to these commodities such as the Copper, Aluminum, Diversified Metals & Mining, Oil & Gas Drilling, and Oil & Gas Exploration & Transportation industries. Our valuation methodology pointed us away from this segment of the market resulting in the Fund having lower downside capture numbers relative to the benchmark to start off the fiscal year. |
The second half of fiscal year 2016 proved to be the exact opposite of the first half as commodities, and the equities tied to those commodities, rebounded aggressively. The largest returns stemmed from the Energy sector as companies that were on the brink of default when oil was trading below $30 a barrel experience strong relief rallies as oil rebounded finishing the fiscal year at approximately $48 a barrel. While we increased exposure to the Energy sector over the course of the fiscal year, the Fund was underweight during this rebound resulting in underperformance relative to the benchmark over the course of the second half of the year.
One specific segment within Natural Resource, gold miners, produced consistently strong returns over the course of the fiscal year in spite of variable market movements. Similar to the rest of the commodity space, gold miners have been in decline for several years and experienced a significant rebound rally during fiscal year 2016 with some companies within the segment producing triple digit returns. Our valuation methodology continued to view this space as generally overvalued and we avoided taking a position, which lead to underperformance relative to the benchmark.
| Q. | How did the Fund’s composition affect performance? |
| A. | Individual industry returns for the industries in Natural Resources segment of the market varied wildly over the course of fiscal year 2016. The best performing industry was up over 46% while the worst was down over 48%. This divergence highlights why we believe industry rotation is so important within a volatile market segment such as Natural Resources. Additionally, variation in industry returns shows how industry allocation can drive the majority of returns over the course of the year. |
Positive industry contributors to the Fund’s performance during fiscal year 2016 included Diversified Chemicals, Construction Materials, Specialty Chemicals, Paper Packaging, and Integrated Oil & Gas. Negative industry detractors from the Fund’s performance during fiscal year 2016 included Precious Metals & Minerals, Oil & Gas Refining & Marketing, Paper Products, Coal & Consumable Fuels, and Aluminum.
| Q. | What is your investment outlook for the Materials sector? |
| A. | At the close of the fiscal year, the Natural Resource segment of the market was trading relatively close to fair value based on our valuation methodology, indicating that we see muted upside return expectations for fiscal year 2017. While the volatility over the past 12 months has presented certain opportunities due to depressed prices, we continue to remain cautious on commodity related names as demand from emerging market economies continues to wane and forward looking growth rates remain relatively depressed. However, we do see opportunity in industries that are tied to domestic economic growth and decreased cyclical exposure. |
| | |
| |
| Annual Report | September 30, 2016 | | 31 |
| | |
| ICON Natural Resources Fund | | Management Overview |
| | September 30, 2016 (Unaudited) |
Average Annual Total Return (as of September 30, 2016)
| | | | | | | | | | | | | | |
| | | Inception Date | | 1 Year | | 5 Years | | 10 Years | | Since
Inception | | Gross Expense
Ratio* | | Net Expense Ratio* |
|
ICON Natural Resources Fund - Class S | | 5/5/97 | | 17.24% | | 9.82% | | 5.50% | | 4.36% | | 1.42% | | 1.42% |
ICON Natural Resources Fund - Class C | | 9/30/10 | | 16.11% | | 8.62% | | N/A | | 5.10% | | 2.94% | | 2.50% |
ICON Natural Resources Fund - Class A | | 9/30/10 | | 17.05% | | 9.48% | | N/A | | 5.89% | | 1.76% | | 1.75% |
ICON Natural Resources Fund - Class A | | | | | | | | | | | | | | |
(including maximum sales charge of 5.75%) | | 9/30/10 | | 10.29% | | 8.19% | | N/A | | 4.86% | | 1.76% | | 1.75% |
S&P 1500 Materials Index | | | | 24.87% | | 13.43% | | 7.41% | | 6.73% | | N/A | | N/A |
S&P Composite 1500 Index | | | | 15.49% | | 16.44% | | 7.44% | | 7.43% | | N/A | | N/A |
Past performance is not a guarantee of future results. Information about these performance results and the comparative indexes can be found in the About This Report section. The Adviser has agreed to limit certain Fund expenses; without these limitations, returns would have been lower. The limitation provisions may be terminated in the future.
| * | Please see the most recent prospectus for details. |
Class C total returns exclude applicable sales charges. If sales charges were included returns would be lower.
Value of a $10,000 Investment (through September 30, 2016)
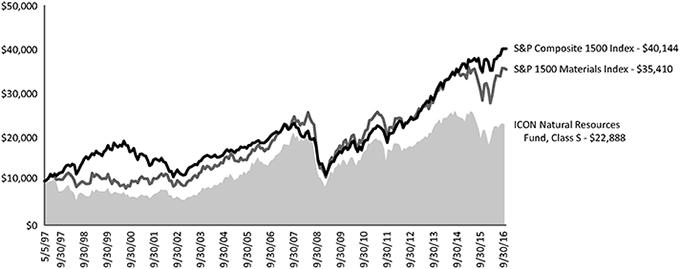
Past performance is not a guarantee of future results. The above graph compares a $10,000 investment made in the Fund’s Class S shares on the Class’ inception date of 5/5/97 to a $10,000 investment made in unmanaged securities indexes on that date. The Fund’s name changed effective January 22, 2016 and the investment strategy changed effective August 18, 2016. The Fund’s past performance would have been different if the current strategy had been in effect. The Fund’s performance in this chart and the performance table assumes the reinvestment of dividends and capital gain distributions but does not reflect the deduction of taxes that a shareholder would pay on Fund distributions or on the redemption of Fund shares.
| | |
| ICON Natural Resources Fund | | Schedule of Investments |
| | September 30, 2016 |
| | | | | | |
| | | Shares or
Principal
Amount | | Value | |
| |
Common Stocks (82.04%) | |
Building Products (7.79%) | |
Apogee Enterprises, Inc. | | 16,000 | | $ | 715,040 | |
Fortune Brands Home & Security,
Inc. | | 9,500 | | | 551,950 | |
Masco Corp. | | 60,000 | | | 2,058,600 | |
PGT, Inc.(a) | | 211,300 | | | 2,254,571 | |
| | | | | | |
| | | | | 5,580,161 | |
| | | | | | |
Coal & Consumable Fuels (2.81%) | |
Cameco Corp.(b) | | 235,000 | | | 2,011,600 | |
| | | | | | |
| | |
Commodity Chemicals (4.47%) | | | | | | |
Cabot Corp. | | 7,000 | | | 366,870 | |
LyondellBasell Industries N.V.,
Class A | | 20,000 | | | 1,613,200 | |
Methanex Corp. | | 9,939 | | | 354,624 | |
Olin Corp. | | 42,339 | | | 868,796 | |
| | | | | | |
| | | | | 3,203,490 | |
| | | | | | |
Construction & Engineering (1.92%) | |
Comfort Systems U.S.A., Inc. | | 46,940 | | | 1,375,812 | |
| | | | | | |
| | |
Construction Materials (8.34%) | | | | | | |
Buzzi Unicem S.p.A. | | 60,000 | | | 1,230,288 | |
Eagle Materials, Inc. | | 13,000 | | | 1,004,900 | |
Headwaters, Inc.(a) | | 75,000 | | | 1,269,000 | |
Martin Marietta Materials, Inc. | | 5,500 | | | 985,105 | |
Summit Materials, Inc., Class A(a) | | 80,000 | | | 1,484,000 | |
| | | | | | |
| | | | | 5,973,293 | |
| | | | | | |
Copper (0.53%) | |
Freeport-McMoRan, Inc. | | 35,000 | | | 380,100 | |
| | | | | | |
| | |
Diversified Chemicals (14.42%) | | | | | | |
Dow Chemical Co. | | 68,745 | | | 3,563,053 | |
Eastman Chemical Co. | | 40,000 | | | 2,707,200 | |
Huntsman Corp. | | 250,000 | | | 4,067,500 | |
| | | | | | |
| | | | | 10,337,753 | |
| | | | | | |
Fertilizers & Agricultural Chemicals (4.65%) | |
Agrium, Inc.(b) | | 5,500 | | | 498,795 | |
CF Industries Holdings, Inc. | | 90,000 | | | 2,191,500 | |
Monsanto Co. | | 6,300 | | | 643,860 | |
| | | | | | |
| | | | | 3,334,155 | |
| | | | | | |
Integrated Oil & Gas (4.19%) | |
BP PLC | | 215,000 | | | 1,253,180 | |
Royal Dutch Shell PLC, Sponsored
ADR, Class A | | 35,000 | | | 1,752,450 | |
| | | | | | |
| | | | | 3,005,630 | |
| | | | | | |
Oil & Gas Equipment & Services (2.41%) | |
Schlumberger, Ltd. | | 22,000 | | | 1,730,080 | |
| | | | | | |
|
Oil & Gas Exploration & Production (4.82%) | |
Diamondback Energy, Inc.(a) | | 16,000 | | | 1,544,640 | |
| | | | | | |
| | | Shares or
Principal
Amount | | Value | |
| |
Oil & Gas Exploration & Production (continued) | |
Synergy Resources Corp.(a) | | 275,000 | | $ | 1,905,750 | |
| | | | | | |
| | | | | 3,450,390 | |
| | | | | | |
Oil & Gas Refining & Marketing (4.47%) | |
PBF Energy, Inc., Class A(b) | | 31,214 | | | 706,685 | |
Phillips 66 | | 8,000 | | | 644,400 | |
Tesoro Corp. | | 10,000 | | | 795,600 | |
Valero Energy Corp. | | 20,000 | | | 1,060,000 | |
| | | | | | |
| | | | | 3,206,685 | |
| | | | | | |
Oil & Gas Storage & Transportation (1.47%) | |
Enbridge, Inc. | | 24,000 | | | 1,054,796 | |
| | | | | | |
| | |
Paper Packaging (8.53%) | | | | | | |
Avery Dennison Corp. | | 2,200 | | | 171,138 | |
Graphic Packaging Holding Co. | | 290,000 | | | 4,057,100 | |
International Paper Co. | | 30,000 | | | 1,439,400 | |
Smurfit Kappa Group PLC | | 20,000 | | | 447,053 | |
| | | | | | |
| | | | | 6,114,691 | |
| | | | | | |
Research & Consulting Services (3.36%) | | | | |
Hill International, Inc.(a) | | 522,440 | | | 2,408,448 | |
| | | | | | |
|
Specialty Chemicals (7.31%) | |
Ashland, Inc. | | 6,000 | | | 695,700 | |
Celanese Corp., Class A | | 17,000 | | | 1,131,520 | |
PolyOne Corp. | | 60,000 | | | 2,028,600 | |
Sherwin-Williams Co. | | 5,000 | | | 1,383,300 | |
| | | | | | |
| | | | | 5,239,120 | |
| | | | | | |
Steel (0.55%) | | | | | | |
Nucor Corp. | | 8,000 | | | 395,600 | |
| | | | | | |
| | |
Total Common Stocks (Cost $59,303,835) | | | | | 58,801,804 | |
| | | | | | |
|
Exchange Traded Funds (10.31%) | |
iShares North American Natural
Resources ETF(b) | | 112,000 | | | 3,859,520 | |
Energy Select Sector SPDR Fund(b) | | 50,000 | | | 3,530,500 | |
| | | | | | |
| | |
Total Exchange Traded Funds (Cost $6,681,608) | | | | | 7,390,020 | |
| | | | | | |
|
Collateral for Securities on Loan (9.08%) | |
State Street Navigator Prime
Portfolio, 0.30% | | 6,505,465 | | | 6,505,465 | |
| | | | | | |
| | |
Total Collateral for Securities on Loan (Cost $6,505,465) | | | | | 6,505,465 | |
| | | | | | |
| | |
The accompanying notes are an integral part of the financial statements. |
| Annual Report | September 30, 2016 | | 33 |
| | |
| ICON Natural Resources Fund | | Schedule of Investments |
| | September 30, 2016 |
| | | | | | | | |
| | | Shares or
Principal
Amount | | | Value | |
| |
Short-Term Investments (8.74%) | |
Time Deposits (8.74%) | | | | | | | | |
State Street Euro Dollar Time
Deposit (USD),
0.01%, 10/03/16 | | | 6,265,943 | | | $ | 6,265,943 | |
| | | | | | | | |
| | |
Total Short-Term Investments (Cost $6,265,943) | | | | | | | 6,265,943 | |
| | | | | | | | |
| | |
Total Investments (110.17%) (Cost $78,756,851) | | | | | | $ | 78,963,232 | |
| |
Liabilities Less Other Assets (-10.17%) | | | | (7,290,850) | |
| | | | | | | | |
| | |
Net Assets (100.00%) | | | | | | $ | 71,672,382 | |
| | | | | | | | |
| (a) | Non-income producing security. |
| (b) | All or a portion of the security was on loan as of September 30, 2016. |
ADR - American Depositary Receipt
| | | | |
| Sector Composition (September 30, 2016) | |
| |
Materials | | | 48.80% | |
Energy | | | 20.17% | |
Industrials | | | 13.07% | |
| | | | |
| | | 82.04% | |
| | | | |
Percentages are based upon common stocks as a percentage of net assets.
| | | | |
| Industry Composition (September 30, 2016) | |
| |
Diversified Chemicals | | | 14.42% | |
Paper Packaging | | | 8.53% | |
Construction Materials | | | 8.34% | |
Building Products | | | 7.79% | |
Specialty Chemicals | | | 7.31% | |
Oil & Gas Exploration & Production | | | 4.82% | |
Fertilizers & Agricultural Chemicals | | | 4.65% | |
Commodity Chemicals | | | 4.47% | |
Oil & Gas Refining & Marketing | | | 4.47% | |
Integrated Oil & Gas | | | 4.19% | |
Research & Consulting Services | | | 3.36% | |
Coal & Consumable Fuels | | | 2.81% | |
Oil & Gas Equipment & Services | | | 2.41% | |
Construction & Engineering | | | 1.92% | |
Oil & Gas Storage & Transportation | | | 1.47% | |
Other Industries (each less than 1%) | | | 1.08% | |
| | | | |
| | | 82.04% | |
| | | | |
Percentages are based upon common stocks as a percentage of net assets.
| | |
The accompanying notes are an integral part of the financial statements. |
| 34 | | www.iconfunds.com |
| | |
| ICON Utilities Fund | | Management Overview |
| | September 30, 2016 (Unaudited) |
| Q. | How did the Fund perform relative to its benchmarks? |
| A. | The ICON Utilities Fund (the Fund) Class S returned 21.74% for the fiscal year ended September 30, 2016, beating its sector-specific benchmark, the S&P 1500 Utilities Index, which returned 18.71%. The broad benchmark, the S&P 1500 Index, returned 15.49%. Total returns for other periods and additional Class shares as of September 30, 2016, appear in the subsequent pages of this Fund’s Management Overview. |
| Q. | What primary factors were behind the Fund’s relative performance? |
| A. | According to our valuation methodology, at the end of the prior fiscal year, the Utilities sector had a value-to-price (V/P) ratio of 1.12 while the average V/P ratio for the overall equity market stood at 1.09. As the yield on the 10-year U.S. Treasury Note generally fell throughout the year, from 2.04% on September 30, 2015 to 1.60% on September 30, 2016, investors sought higher income elsewhere, increasing demand for dividend yielding stocks in the Utilities sector. On average, as of the end of the fiscal year 2016, the dividend yield for stocks we track in the Utilities sector was 3.33%, making them an attractive alternative to treasuries from a yield stand-point. |
| | The Fund did have exposure to stocks outside of the Utilities sector, including companies in the Oil & Gas storage & Transportation industry. Many of the companies in this industry supply natural gas for electricity generation and redistribution for companies within the Utilities sector. Over the course of the year, the Fund’s weighted average holdings in the Oil & Gas Storage & Transportation industry was around 5.6% and these positions returned about 47%. The Fund’s holdings in the Telecommunication Services sector had positive performance as well. In general, the stocks the Fund held outside of the Utilities sector have similar dividend characteristic to the stocks within the Utilities sector. |
| Q. | How did the Fund’s composition affect performance? |
| A. | Over the course of the fiscal year, stock selection played a large role in the Fund’s performance relative to the benchmark. This is true specifically for the stocks held in the Fund from the Multi-Utilities industry. The stocks held in the Fund from the Multi-Utilities industry returned approximately 24% over the fiscal year while the benchmark’s holdings in the industry gained about 17%. Additionally the Fund was overweight compared to the benchmark in this industry, adding to the Fund’s relative out performance in the industry. The largest industry detractor from the Fund’s performance relative to the benchmark came from an overweight position in the Gas Utilities industry as the Fund’s stock selection within the industry led to the Fund underperforming in this industry compared to the benchmark. |
| Q. | What is your investment outlook for the Utilities sector? |
| A. | As of September 30, 2016, according to our valuation methodology, the Utilities sector had a V/P ratio of 1.13. Given these V/P readings we generally have a positive outlook for the sector and remain optimistic for the year ahead. However, because the Utilities sector is seen by some investors as an alternative to fixed income in a low interest rate environment, an increase in interest rates might make the Utilities sector less attractive, creating a short term headwind for the sector. As always, we look to value as our primary guide and will adjust our positioning as market conditions dictate. |
| | |
| |
| Annual Report | September 30, 2016 | | 35 |
| | |
| ICON Utilities Fund | | Management Overview |
| | September 30, 2016 (Unaudited) |
Average Annual Total Return (as of September 30, 2016)
| | | | | | | | | | | | | | |
| | | Inception
Date | | 1 Year | | 5 Years | | 10 Years | | Since
Inception | | Gross Expense
Ratio* | | Net Expense
Ratio* |
|
ICON Utilities Fund - Class S | | 7/9/97 | | 21.74% | | 11.99% | | 7.55% | | 8.47% | | 1.70% | | 1.50% |
ICON Utilities Fund - Class A | | 9/30/10 | | 21.29% | | 11.69% | | N/A | | 11.17% | | 1.89% | | 1.75% |
ICON Utilities Fund - Class A (including maximum sales charge of 5.75%) | | 9/30/10 | | 14.36% | | 10.38% | | N/A | | 10.06% | | 1.89% | | 1.75% |
S&P 1500 Utilities Index | | | | 18.71% | | 12.61% | | 8.39% | | 8.36% | | N/A | | N/A |
S&P Composite 1500 Index | | | | 15.49% | | 16.44% | | 7.44% | | 6.97% | | N/A | | N/A |
Past performance is not a guarantee of future results. Information about these performance results and the comparative indexes can be found in the About This Report section. The Adviser has agreed to limit certain Fund expenses; without these limitations, returns would have been lower. The limitation provisions may be terminated in the future.
| * | Please see the most recent prospectus for details. |
Value of a $10,000 Investment (through September 30, 2016)
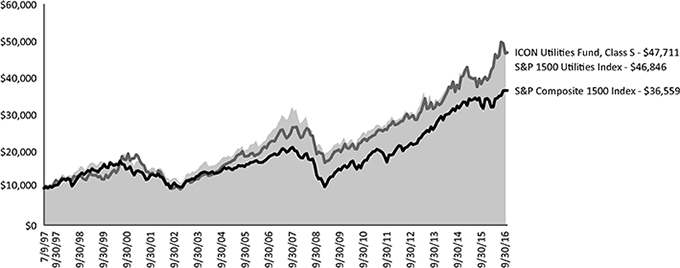
Past performance is not a guarantee of future results. The above graph compares a $10,000 investment made in the Fund’s Class S shares on the Class’ inception date of 7/9/97 to a $10,000 investment made in unmanaged securities indexes on that date. The Fund’s performance in this chart and the performance table assumes the reinvestment of dividends and capital gain distributions but does not reflect the deduction of taxes that a shareholder would pay on Fund distributions or on the redemption of Fund shares.
| | |
| ICON Utilities Fund | | Schedule of Investments |
| | September 30, 2016 |
| | | | | | |
| | | Shares or
Principal Amount | | Value | |
| |
Common Stocks (97.41%) | | | | | | |
Communications Equipment (1.86%) | | | | |
Harris Corp. | | 12,100 | | $ | 1,108,481 | |
| | | | | | |
Electric Utilities (36.43%) | | | | | | |
Alliant Energy Corp. | | 42,900 | | | 1,643,499 | |
American Electric Power Co.,
Inc. | | 56,100 | | | 3,602,181 | |
Duke Energy Corp. | | 23,200 | | | 1,856,928 | |
Edison International | | 50,200 | | | 3,626,950 | |
Eversource Energy | | 52,900 | | | 2,866,122 | |
Great Plains Energy, Inc. | | 48,500 | | | 1,323,565 | |
Hawaiian Electric Industries,
Inc. | | 29,500 | | | 880,575 | |
NextEra Energy, Inc. | | 13,900 | | | 1,700,248 | |
OGE Energy Corp. | | 63,500 | | | 2,007,870 | |
Pinnacle West Capital Corp. | | 29,600 | | | 2,249,304 | |
| | | | | | |
| | | | | 21,757,242 | |
| | | | | | |
Electronic Manufacturing Services (1.38%) | |
TE Connectivity, Ltd. | | 12,800 | | | 824,064 | |
| | | | | | |
| | |
Gas Utilities (5.84%) | | | | | | |
National Fuel Gas Co. | | 40,900 | | | 2,211,463 | |
South Jersey Industries, Inc. | | 22,100 | | | 653,055 | |
Spire, Inc. | | 9,800 | | | 624,652 | |
| | | | | | |
| | | | | 3,489,170 | |
| | | | | | |
Independent Power Producers & Energy Traders (3.17%) | |
AES Corp. | | 55,000 | | | 706,750 | |
Calpine Corp.(a) | | 94,100 | | | 1,189,424 | |
| | | | | | |
| | | | | 1,896,174 | |
| | | | | | |
Integrated Telecommunication Services (5.15%) | |
AT&T, Inc. | | 47,000 | | | 1,908,670 | |
BCE, Inc. | | 25,300 | | | 1,168,354 | |
| | | | | | |
| | | | | 3,077,024 | |
| | | | | | |
Multi-Utilities (34.78%) | | | | | | |
Ameren Corp. | | 64,400 | | | 3,167,192 | |
Avista Corp. | | 23,800 | | | 994,602 | |
Black Hills Corp. | | 14,400 | | | 881,568 | |
CenterPoint Energy, Inc. | | 74,700 | | | 1,735,281 | |
CMS Energy Corp. | | 40,576 | | | 1,704,597 | |
Dominion Resources, Inc. | | 38,200 | | | 2,837,114 | |
DTE Energy Co. | | 34,400 | | | 3,222,248 | |
NiSource, Inc. | | 39,900 | | | 961,989 | |
Public Service Enterprise
Group, Inc. | | 18,100 | | | 757,847 | |
SCANA Corp. | | 15,700 | | | 1,136,209 | |
Sempra Energy | | 31,500 | | | 3,376,485 | |
| | | | | | |
| | | | | 20,775,132 | |
| | | | | | |
Oil & Gas Exploration & Production (1.33%) | | | | | | |
Cabot Oil & Gas Corp. | | 30,800 | | | 794,640 | |
| | | | | | |
| | | | | | |
Oil & Gas Storage & Transportation (4.95%) | | | | | | |
Magellan Midstream Partners L.P. | | 19,100 | | | 1,351,134 | |
| | | | | | | | |
| | | Shares or
Principal Amount | | | Value | |
| |
Oil & Gas Storage & Transportation (continued) | |
Ship Finance International,
Ltd.(b) | | | 76,100 | | | $ | 1,120,953 | |
Teekay Corp. | | | 63,000 | | | | 485,730 | |
| | | | | | | | |
| | | | | | | 2,957,817 | |
| | | | | | | | |
| | |
Semiconductors (1.06%) | | | | | | | | |
Monolithic Power Systems,
Inc. | | | 7,900 | | | | 635,950 | |
| | | | | | | | |
| | |
Water Utilities (1.46%) | | | | | | | | |
Aqua America, Inc. | | | 28,600 | | | | 871,728 | |
| | | | | | | | |
| | |
Total Common Stocks (Cost $57,229,931) | | | | | | | 58,187,422 | |
| | | | | | | | |
| | |
Underlying Security/Expiration Date/Exercise Price | | Contracts | | | Value | |
| |
Put Options Purchased (0.53%) | |
Utilities Select Sector SPDR Fund
12/16/16, 50 | | | 900 | | | | 208,800 | |
Utilities Select Sector SPDR Fund
10/21/16, 51 | | | 500 | | | | 107,500 | |
| | | | | | | | |
| | | | | | | 316,300 | |
| | | | | | | | |
| | |
Total Put Options Purchased (Cost $235,691) | | | | | | | 316,300 | |
| | | | | | | | |
| | |
| | | Shares or
Principal
Amount | | | Value | |
| |
Collateral for Securities on Loan (1.91%) | |
State Street Navigator Prime Portfolio, 0.30% | | | 1,141,500 | | | | 1,141,500 | |
| | | | | | | | |
| |
Total Collateral for Securities on Loan (Cost $1,141,500) | | | | 1,141,500 | |
| | | | | | | | |
| | |
Short-Term Investments (1.92%) | | | | | | | | |
Time Deposits (1.92%) | | | | | | | | |
State Street Euro Dollar Time Deposit (USD), 0.01%, 10/03/16 | | | 1,144,742 | | | | 1,144,742 | |
| | | | | | | | |
Total Short-Term Investments (Cost $1,144,742) | | | | 1,144,742 | |
| | | | | | | | |
Total Investments (101.77%) (Cost $59,751,864) | | | | | | $ | 60,789,964 | |
Liabilities Less Other Assets (-1.77%) | | | | | | | (1,058,431) | |
| | | | | | | | |
Net Assets (100.00%) | | | | | | $ | 59,731,533 | |
| | | | | | | | |
| | |
The accompanying notes are an integral part of the financial statements. |
| Annual Report | September 30, 2016 | | 37 |
| | |
| ICON Utilities Fund | | Schedule of Investments |
| | September 30, 2016 |
| (a) | Non-income producing security. |
| (b) | All or a portion of the security was on loan as of September 30, 2016. |
| | | | |
| Sector Composition (September 30, 2016) | | | |
| |
Utilities | | | 81.68% | |
Energy | | | 6.28% | |
Telecommunication Services | | | 5.15% | |
Information Technology | | | 4.30% | |
| | | | |
| | | 97.41% | |
| | | | |
Percentages are based upon common stocks as a percentage of net assets.
| | | | |
| Industry Composition (September 30, 2016) | | | |
| |
Electric Utilities | | | 36.43% | |
Multi-Utilities | | | 34.78% | |
Gas Utilities | | | 5.84% | |
Integrated Telecommunication Services | | | 5.15% | |
Oil & Gas Storage & Transportation | | | 4.95% | |
Independent Power Producers & Energy Traders | | | 3.17% | |
Communications Equipment | | | 1.86% | |
Water Utilities | | | 1.46% | |
Electronic Manufacturing Services | | | 1.38% | |
Oil & Gas Exploration & Production | | | 1.33% | |
Semiconductors | | | 1.06% | |
| | | | |
| | | 97.41% | |
| | | | |
Percentages are based upon common stocks as a percentage of net assets.
| | |
The accompanying notes are an integral part of the financial statements. |
| 38 | | www.iconfunds.com |
| | |
| ICON Sector Funds | | Statements of Assets and Liabilities |
| | September 30, 2016 |
| | | | | | | | | | | | |
| | | ICON Consumer
Discretionary Fund | | ICON Consumer
Staples Fund | | ICON Energy Fund | |
Assets | | | | | | | | | | | | |
Investments, at cost | | $ | 44,648,379 | | | $ | 48,429,334 | | | $ | 387,772,354 | |
| | | | |
Investments, at value(a) | | | 42,345,019 | | | | 48,380,862 | | | | 390,166,249 | |
Receivables: | | | | | | | | | | | | |
Investments sold | | | 1,205,395 | | | | – | | | | 12,424,552 | |
Fund shares sold | | | 2,684 | | | | 120,483 | | | | 317,563 | |
Expense reimbursements due from Adviser | | | 1,330 | | | | 6,957 | | | | – | |
Dividends | | | 27,528 | | | | 88,546 | | | | 385,284 | |
Foreign tax reclaims | | | – | | | | – | | | | 14,319 | |
Other assets | | | 7,062 | | | | 11,158 | | | | 106,937 | |
| | | | |
Total assets | | | 43,589,018 | | | | 48,608,006 | | | | 403,414,904 | |
| | | | |
| | | |
Liabilities | | | | | | | | | | | | |
Payables: | | | | | | | | | | | | |
Payable for collateral received on securities loaned | | | 1,782,625 | | | | 807,060 | | | | 42,662,836 | |
Payable to custodian | | | – | | | | 4,997,860 | | | | – | |
Investments purchased | | | 2,068,016 | | | | 2,453,345 | | | | 7,438,901 | |
Fund shares redeemed | | | 34,123 | | | | 66,859 | | | | 478,397 | |
Advisory fees | | | 32,850 | | | | 33,224 | | | | 281,961 | |
Transfer agent fees | | | 7,923 | | | | 10,690 | | | | 137,132 | |
Fund accounting fees | | | 1,956 | | | | 1,990 | | | | 10,948 | |
Accrued distribution fees | | | 495 | | | | 1,731 | | | | 10,883 | |
Trustee fees and expenses | | | 1,744 | | | | 1,696 | | | | 14,657 | |
Administration fees | | | 1,706 | | | | 1,716 | | | | 14,507 | |
Accrued expenses | | | 26,819 | | | | 23,738 | | | | 96,137 | |
| | | | |
Total liabilities | | | 3,958,257 | | | | 8,399,909 | | | | 51,146,359 | |
| | | | |
Net Assets - all share classes | | $ | 39,630,761 | | | $ | 40,208,097 | | | $ | 352,268,545 | |
| | | | |
Net Assets - Class S | | $ | 37,263,151 | | | $ | 31,798,893 | | | $ | 327,497,266 | |
| | | | |
Net Assets - Class C | | $ | – | | | $ | – | | | $ | 10,123,542 | |
| | | | |
Net Assets - Class A | | $ | 2,367,610 | | | $ | 8,409,204 | | | $ | 14,647,737 | |
| | | | |
| | | |
Net Assets Consists of | | | | | | | | | | | | |
Paid-in capital | | $ | 39,678,667 | | | $ | 37,182,312 | | | $ | 508,102,164 | |
Accumulated undistributed net investment income/(loss) | | | – | | | | 33,122 | | | | (33,682) | |
Accumulated undistributed net realized gain/(loss) | | | 2,255,454 | | | | 3,041,135 | | | | (158,193,832) | |
Unrealized appreciation/(depreciation) | | | (2,303,360) | | | | (48,472) | | | | 2,393,895 | |
| | | | |
Net Assets | | $ | 39,630,761 | | | $ | 40,208,097 | | | $ | 352,268,545 | |
| | | | |
| | | |
Shares outstanding (unlimited shares authorized, no par value) | | | | | | | | | | | | |
Class S | | | 2,750,033 | | | | 3,982,674 | | | | 25,872,744 | |
Class C | | | – | | | | – | | | | 833,969 | |
Class A | | | 181,315 | | | | 1,056,629 | | | | 1,162,441 | |
Net asset value (offering and redemption price per share) | | | | | | | | | | | | |
Class S | | $ | 13.55 | | | $ | 7.98 | | | $ | 12.66 | |
Class C | | $ | – | | | $ | – | | | $ | 12.14 | |
Class A | | $ | 13.06 | | | $ | 7.96 | | | $ | 12.60 | |
Class A maximum offering price (100%/ (100%-maximum sales charge)) of net asset value adjusted to the nearest cent per share | | $ | 13.85 | | | $ | 8.44 | | | $ | 13.37 | |
| | | |
(a) Includes securities on loan of | | $ | 1,781,465 | | | $ | 779,737 | | | $ | 41,762,067 | |
| | |
The accompanying notes are an integral part of the financial statements. |
| Annual Report | September 30, 2016 | | 39 |
| | |
| ICON Sector Funds | | Statements of Assets and Liabilities |
| | September 30, 2016 |
| | | | | | | | | | | | |
| | | ICON Financial Fund | | ICON Healthcare Fund | | ICON Industrials Fund |
Assets | | | | | | | | | | | | |
Investments, at cost | | $ | 47,781,564 | | | $ | 89,228,207 | | | $ | 24,363,317 | |
| | | | |
Investments, at value(a) | | | 46,494,916 | | | | 87,498,465 | | | | 25,703,861 | |
Foreign currency, at value (Cost $8,921, $– and $–, respectively) | | | 8,921 | | | | – | | | | – | |
Receivables: | | | | | | | | | | | | |
Investments sold | | | – | | | | 38,660 | | | | – | |
Fund shares sold | | | 31,580 | | | | 16,288 | | | | 26 | |
Expense reimbursements due from Adviser | | | 3,105 | | | | – | | | | 3,959 | |
Dividends | | | 70,810 | | | | 29,818 | | | | 5,619 | |
Foreign tax reclaims | | | – | | | | 3,827 | | | | – | |
Other assets | | | 9,491 | | | | 11,941 | | | | 7,294 | |
| | | | |
Total assets | | | 46,618,823 | | | | 87,598,999 | | | | 25,720,759 | |
| | | | |
| | | |
Liabilities | | | | | | | | | | | | |
Payables: | | | | | | | | | | | | |
Payable for collateral received on securities loaned | | | 502,800 | | | | 1,546,000 | | | | – | |
Loan payable, at value (Cost $100,081, $– and $–) | | | 100,081 | | | | – | | | | – | |
Expense recoupment due to Adviser | | | – | | | | 4,155 | | | | – | |
Investments purchased | | | – | | | | 4,763,837 | | | | 688,466 | |
Fund shares redeemed | | | 41,586 | | | | 10,762 | | | | 26,984 | |
Advisory fees | | | 38,216 | | | | 66,526 | | | | 19,417 | |
Transfer agent fees | | | 7,229 | | | | 22,628 | | | | 5,720 | |
Fund accounting fees | | | 2,154 | | | | 3,175 | | | | 1,433 | |
Accrued distribution fees | | | 538 | | | | 1,058 | | | | 234 | |
Trustee fees and expenses | | | 1,927 | | | | 3,450 | | | | 709 | |
Administration fees | | | 1,964 | | | | 3,451 | | | | 991 | |
Accrued expenses | | | 26,954 | | | | 34,998 | | | | 21,938 | |
| | | | |
Total liabilities | | | 723,449 | | | | 6,460,040 | | | | 765,892 | |
| | | | |
Net Assets - all share classes | | $ | 45,895,374 | | | $ | 81,138,959 | | | $ | 24,954,867 | |
| | | | |
Net Assets - Class S | | $ | 43,353,774 | | | $ | 76,217,584 | | | $ | 23,956,789 | |
| | | | |
Net Assets - Class A | | $ | 2,541,600 | | | $ | 4,921,375 | | | $ | 998,078 | |
| | | | |
| | | |
Net Assets Consists of | | | | | | | | | | | | |
Paid-in capital | | $ | 138,026,167 | | | $ | 81,764,791 | | | $ | 41,850,875 | |
Accumulated undistributed net investment income/(loss) | | | 487,449 | | | | (63,244) | | | | (22,535) | |
Accumulated undistributed net realized gain/(loss) | | | (91,331,594) | | | | 1,167,154 | | | | (18,214,017) | |
Unrealized appreciation/(depreciation) | | | (1,286,648) | | | | (1,729,742) | | | | 1,340,544 | |
| | | | |
Net Assets | | $ | 45,895,374 | | | $ | 81,138,959 | | | $ | 24,954,867 | |
| | | | |
| | | |
Shares outstanding (unlimited shares authorized, no par value) | | | | | | | | | | | | |
Class S | | | 5,654,114 | | | | 4,947,704 | | | | 1,953,540 | |
Class A | | | 329,586 | | | | 331,596 | | | | 82,224 | |
Net asset value (offering and redemption price per share) | | | | | | | | | | | | |
Class S | | $ | 7.67 | | | $ | 15.40 | | | $ | 12.26 | |
Class A | | $ | 7.71 | | | $ | 14.84 | | | $ | 12.14 | |
Class A maximum offering price (100%/ (100%-maximum sales charge)) of net asset value adjusted to the nearest cent per share | | $ | 8.18 | | | $ | 15.75 | | | $ | 12.88 | |
| | | |
(a) Includes securities on loan of | | $ | 495,160 | | | $ | 1,522,070 | | | $ | – | |
| | |
The accompanying notes are an integral part of the financial statements. |
| 40 | | www.iconfunds.com |
| | |
| ICON Sector Funds | | Statements of Assets and Liabilities |
| | September 30, 2016 |
| | | | | | | | | | | | |
| | | ICON Information
Technology Fund | | ICON Natural
Resources Fund | | ICON Utilities Fund | |
Assets | | | | | | | | | | | | |
Investments, at cost | | $ | 42,343,138 | | | $ | 78,756,851 | | | $ | 59,751,864 | |
| | | | |
Investments, at value(a) | | | 52,277,094 | | | | 78,963,232 | | | | 60,789,964 | |
Receivables: | | | | | | | | | | | | |
Investments sold | | | 425,578 | | | | 1,628,149 | | | | 1,433,785 | |
Fund shares sold | | | 39,360 | | | | 109,235 | | | | 419,599 | |
Expense reimbursements due from Adviser | | | 224 | | | | 68,539 | | | | 4,876 | |
Dividends | | | 16,054 | | | | 114,731 | | | | 193,892 | |
Foreign tax reclaims | | | – | | | | 833 | | | | – | |
Other assets | | | 8,529 | | | | 14,648 | | | | 25,417 | |
| | | | |
Total assets | | | 52,766,839 | | | | 80,899,367 | | | | 62,867,533 | |
| | | | |
| | | |
Liabilities | | | | | | | | | | | | |
Payables: | | | | | | | | | | | | |
Payable for collateral received on securities loaned | | | 823,500 | | | | 6,505,465 | | | | 1,141,500 | |
Investments purchased | | | 245,087 | | | | 2,354,077 | | | | 1,721,830 | |
Fund shares redeemed | | | 24,019 | | | | 233,675 | | | | 117,639 | |
Distributions due to shareholders | | | – | | | | – | | | | 49,985 | |
Advisory fees | | | 41,634 | | | | 58,706 | | | | 48,562 | |
Transfer agent fees | | | 14,421 | | | | 29,848 | | | | 16,289 | |
Fund accounting fees | | | 2,251 | | | | 3,043 | | | | 2,483 | |
Accrued distribution fees | | | 527 | | | | 2,133 | | | | 3,169 | |
Trustee fees and expenses | | | 1,994 | | | | 3,058 | | | | 2,827 | |
Administration fees | | | 2,124 | | | | 3,026 | | | | 2,598 | |
Accrued expenses | | | 27,440 | | | | 33,954 | | | | 29,118 | |
| | | | |
Total liabilities | | | 1,182,997 | | | | 9,226,985 | | | | 3,136,000 | |
| | | | |
Net Assets - all share classes | | $ | 51,583,842 | | | $ | 71,672,382 | | | $ | 59,731,533 | |
| | | | |
Net Assets - Class S | | $ | 48,952,961 | | | $ | 65,787,313 | | | $ | 43,863,813 | |
| | | | |
Net Assets - Class C | | $ | – | | | $ | 1,434,502 | | | $ | – | |
| | | | |
Net Assets - Class A | | $ | 2,630,881 | | | $ | 4,450,567 | | | $ | 15,867,720 | |
| | | | |
| | | |
Net Assets Consists of | | | | | | | | | | | | |
Paid-in capital | | $ | 32,776,198 | | | $ | 76,480,544 | | | $ | 54,513,606 | |
Accumulated undistributed net investment income/(loss) | | | – | | | | 400,690 | | | | 22,990 | |
Accumulated undistributed net realized gain/(loss) | | | 8,873,688 | | | | (5,415,227) | | | | 4,156,752 | |
Unrealized appreciation/(depreciation) | | | 9,933,956 | | | | 206,375 | | | | 1,038,185 | |
| | | | |
Net Assets | | $ | 51,583,842 | | | $ | 71,672,382 | | | $ | 59,731,533 | |
| | | | |
| | | |
Shares outstanding (unlimited shares authorized, no par value) | | | | | | | | | | | | |
Class S | | | 2,726,177 | | | | 5,129,815 | | | | 4,623,967 | |
Class C | | | – | | | | 116,014 | | | | – | |
Class A | | | 149,939 | | | | 349,577 | | | | 1,697,039 | |
Net asset value (offering and redemption price per share) | | | | | | | | | | | | |
Class S | | $ | 17.96 | | | $ | 12.82 | | | $ | 9.49 | |
Class C | | $ | – | | | $ | 12.36 | | | $ | – | |
Class A | | $ | 17.55 | | | $ | 12.73 | | | $ | 9.35 | |
Class A maximum offering price (100%/ (100%-maximum sales charge)) of net asset value adjusted to the nearest cent per share | | $ | 18.62 | | | $ | 13.51 | | | $ | 9.92 | |
| | | |
(a) Includes securities on loan of | | $ | 801,360 | | | $ | 6,414,211 | | | $ | 1,120,953 | |
| | |
The accompanying notes are an integral part of the financial statements. |
| Annual Report | September 30, 2016 | | 41 |
| | |
| ICON Sector Funds | | Statements of Operations |
| | Year Ended September 30, 2016 |
| | | | | | | | | | | | |
| | | ICON Consumer
Discretionary Fund | | ICON Consumer
Staples Fund | | ICON Energy Fund |
Investment Income | | | | | | | | | | | | |
Interest | | $ | 654 | | | $ | 3,252 | | | $ | 1,023 | |
Dividends | | | 521,596 | | | | 384,685 | | | | 11,474,238 | |
Foreign taxes withheld | | | (2,925) | | | | – | | | | (207,358) | |
Income from securities lending, net | | | 26,483 | | | | 9,916 | | | | 684,231 | |
| | | | |
Total investment income | | | 545,808 | | | | 397,853 | | | | 11,952,134 | |
| | | | |
Expenses | | | | | | | | | | | | |
Advisory fees | | | 452,667 | | | | 227,890 | | | | 3,428,145 | |
Administration fees | | | 22,696 | | | | 11,394 | | | | 171,802 | |
Transfer agent fees | | | 66,031 | | | | 59,171 | | | | 806,805 | |
Distribution fees: | | | | | | | | | | | | |
Class C | | | – | | | | – | | | | 95,696 | |
Class A | | | 7,600 | | | | 18,194 | | | | 34,812 | |
Registration fees | | | 28,409 | | | | 25,863 | | | | 54,814 | |
Audit and tax service expense | | | 18,161 | | | | 16,991 | | | | 34,532 | |
Fund accounting fees | | | 17,177 | | | | 9,605 | | | | 118,076 | |
Trustee fees and expenses | | | 7,263 | | | | 4,008 | | | | 55,485 | |
Insurance expense | | | 7,349 | | | | 2,130 | | | | 61,030 | |
Custody fees | | | 4,477 | | | | 3,295 | | | | 12,430 | |
Printing fees | | | 12,699 | | | | 7,027 | | | | 74,541 | |
Interest expense | | | 94 | | | | 1,329 | | | | 1,157 | |
Recoupment of previously reimbursed expenses | | | – | | | | 15,155 | | | | – | |
Other expenses | | | 21,196 | | | | 12,021 | | | | 133,033 | |
| | | | |
Total expenses before expense reimbursement | | | 665,819 | | | | 414,073 | | | | 5,082,358 | |
Expense reimbursement by Adviser due to expense limitation agreement | | | (4,288) | | | | (51,650) | | | | – | |
| | | | |
Net Expenses | | | 661,531 | | | | 362,423 | | | | 5,082,358 | |
| | | | |
Net Investment Income/(Loss) | | | (115,723) | | | | 35,430 | | | | 6,869,776 | |
| | | | |
| | | |
Realized and Unrealized Gain/(Loss) | | | | | | | | | | | | |
Net realized gain/(loss) on: | | | | | | | | | | | | |
Investments | | | 2,371,232 | | | | 3,041,135 | | | | (57,721,087) | |
Foreign currency | | | – | | | | – | | | | 605 | |
| | | | |
| | | 2,371,232 | | | | 3,041,135 | | | | (57,720,482) | |
| | | | |
Change in unrealized net appreciation/(depreciation) on: | | | | | | | | | | | | |
Investments and foreign currency | | | (204,909) | | | | (1,151,918) | | | | 100,616,370 | |
| | | | |
| | | (204,909) | | | | (1,151,918) | | | | 100,616,370 | |
| | | | |
Net realized and unrealized gain/(loss) | | | 2,166,323 | | | | 1,889,217 | | | | 42,895,888 | |
| | | | |
Net Increase/(Decrease) in Net Assets Resulting From Operations | | $ | 2,050,600 | | | $ | 1,924,647 | | | $ | 49,765,664 | |
| | | | |
| | |
The accompanying notes are an integral part of the financial statements. |
| 42 | | www.iconfunds.com |
| | |
| ICON Sector Funds | | Statements of Operations |
| | Year Ended September 30, 2016 |
| | | | | | | | | | | | |
| | | ICON Financial Fund | | ICON Healthcare
Fund | | ICON Industrials
Fund |
Investment Income | | | | | | | | | | | | |
Interest | | $ | 66 | | | $ | 554 | | | $ | 153 | |
Dividends | | | 1,165,780 | | | | 982,095 | | | | 216,090 | |
Foreign taxes withheld | | | (6,229) | | | | (2,918) | | | | – | |
Income from securities lending, net | | | 35,443 | | | | 29,526 | | | | 1,655 | |
Other income | | | – | | | | 11,826 | | | | – | |
| | | | |
Total investment income | | | 1,195,060 | | | | 1,021,083 | | | | 217,898 | |
| | | | |
Expenses | | | | | | | | | | | | |
Advisory fees | | | 498,102 | | | | 867,577 | | | | 159,835 | |
Administration fees | | | 25,147 | | | | 43,503 | | | | 8,011 | |
Transfer agent fees | | | 67,791 | | | | 161,988 | | | | 37,466 | |
Distribution fees: | | | | | | | | | | | | |
Class A | | | 6,029 | | | | 21,015 | | | | 1,912 | |
Registration fees | | | 26,489 | | | | 42,769 | | | | 21,962 | |
Audit and tax service expense | | | 18,190 | | | | 19,915 | | | | 16,918 | |
Fund accounting fees | | | 18,984 | | | | 30,153 | | | | 6,969 | |
Trustee fees and expenses | | | 7,974 | | | | 13,827 | | | | 2,456 | |
Insurance expense | | | 5,121 | | | | 19,380 | | | | 4,389 | |
Custody fees | | | 3,844 | | | | 4,834 | | | | 3,018 | |
Printing fees | | | 13,698 | | | | 18,052 | | | | 10,327 | |
Interest expense | | | 715 | | | | 2,484 | | | | – | |
Recoupment of previously reimbursed expenses | | | – | | | | – | | | | 5,222 | |
Other expenses | | | 24,340 | | | | 34,821 | | | | 8,312 | |
| | | | |
Total expenses before expense reimbursement | | | 716,424 | | | | 1,280,318 | | | | 286,797 | |
Expense reimbursement by Adviser due to expense limitation agreement | | | (8,903) | | | | (3,006) | | | | (44,625) | |
| | | | |
Net Expenses | | | 707,521 | | | | 1,277,312 | | | | 242,172 | |
| | | | |
Net Investment Income/(Loss) | | | 487,539 | | | | (256,229) | | | | (24,274) | |
| | | | |
| | | |
Realized and Unrealized Gain/(Loss) | | | | | | | | | | | | |
Net realized gain/(loss) on: | | | | | | | | | | | | |
Investments | | | (4,872,050) | | | | 1,360,141 | | | | 1,229,396 | |
Foreign currency | | | (90) | | | | – | | | | – | |
Long-term capital gain distributions from other investment companies | | | 3,543 | | | | – | | | | – | |
| | | | |
| | | (4,868,597) | | | | 1,360,141 | | | | 1,229,396 | |
| | | | |
Change in unrealized net appreciation/(depreciation) on: | | | | | | | | | | | | |
Investments and foreign currency | | | 2,869,562 | | | | 6,368,752 | | | | 210,733 | |
| | | | |
| | | 2,869,562 | | | | 6,368,752 | | | | 210,733 | |
| | | | |
Net realized and unrealized gain/(loss) | | | (1,999,035) | | | | 7,728,893 | | | | 1,440,129 | |
| | | | |
Net Increase/(Decrease) in Net Assets Resulting From Operations | | $ | (1,511,496) | | | $ | 7,472,664 | | | $ | 1,415,855 | |
| | | | |
| | |
The accompanying notes are an integral part of the financial statements. |
| Annual Report | September 30, 2016 | | 43 |
| | |
| ICON Sector Funds | | Statements of Operations |
| | Year Ended September 30, 2016 |
| | | | | | | | | | | | |
| | | ICON Information
Technology Fund | | ICON Natural
Resources Fund(a) | | ICON Utilities Fund |
Investment Income | | | | | | | | | | | | |
Interest | | $ | 130 | | | $ | 656 | | | $ | 124 | |
Dividends | | | 467,451 | | | | 1,583,165 | | | | 2,141,065 | |
Foreign taxes withheld | | | – | | | | (29,895) | | | | (17,926) | |
Income from securities lending, net | | | 9,569 | | | | 29,109 | | | | 44,515 | |
Other income | | | 1,175 | | | | 6 | | | | – | |
| | | | |
Total investment income | | | 478,325 | | | | 1,583,041 | | | | 2,167,778 | |
| | | | |
Expenses | | | | | | | | | | | | |
Advisory fees | | | 465,306 | | | | 691,011 | | | | 452,604 | |
Administration fees | | | 23,312 | | | | 34,640 | | | | 22,783 | |
Transfer agent fees | | | 94,908 | | | | 162,930 | | | | 87,574 | |
Distribution fees: | | | | | | | | | | | | |
Class C | | | – | | | | 10,865 | | | | – | |
Class A | | | 5,138 | | | | 10,226 | | | | 26,359 | |
Registration fees | | | 25,146 | | | | 32,898 | | | | 24,905 | |
Audit and tax service expense | | | 18,053 | | | | 22,065 | | | | 17,680 | |
Fund accounting fees | | | 17,452 | | | | 25,461 | | | | 17,525 | |
Trustee fees and expenses | | | 7,494 | | | | 11,176 | | | | 8,007 | |
Insurance expense | | | 6,916 | | | | 11,286 | | | | 2,478 | |
Custody fees | | | 4,163 | | | | 5,957 | | | | 4,155 | |
Printing fees | | | 14,991 | | | | 69,412 | | | | 15,660 | |
Interest expense | | | 748 | | | | 539 | | | | 1,807 | |
Recoupment of previously reimbursed expenses | | | 1,032 | | | | 346 | | | | 36,164 | |
Other expenses | | | 21,820 | | | | 43,515 | | | | 22,199 | |
| | | | |
Total expenses before expense reimbursement | | | 706,479 | | | | 1,132,327 | | | | 739,900 | |
Expense reimbursement by Adviser due to expense limitation agreement | | | (8,637) | | | | (73,898) | | | | (31,947) | |
| | | | |
Net Expenses | | | 697,842 | | | | 1,058,429 | | | | 707,953 | |
| | | | |
Net Investment Income/(Loss) | | | (219,517) | | | | 524,612 | | | | 1,459,825 | |
| | | | |
| | | |
Realized and Unrealized Gain/(Loss) | | | | | | | | | | | | |
Net realized gain/(loss) on: | | | | | | | | | | | | |
Investments | | | 9,737,627 | | | | (4,578,566) | | | | 4,282,912 | |
Foreign currency | | | – | | | | (11,991) | | | | 649 | |
| | | | |
| | | 9,737,627 | | | | (4,590,557) | | | | 4,283,561 | |
| | | | |
Change in unrealized net appreciation/(depreciation) on: | | | | | | | | | | | | |
Investments and foreign currency | | | (1,066,435) | | | | 15,224,010 | | | | 1,873,338 | |
| | | | |
| | | (1,066,435) | | | | 15,224,010 | | | | 1,873,338 | |
| | | | |
Net realized and unrealized gain/(loss) | | | 8,671,192 | | | | 10,633,453 | | | | 6,156,899 | |
| | | | |
Net Increase/(Decrease) in Net Assets Resulting From Operations | | $ | 8,451,675 | | | $ | 11,158,065 | | | $ | 7,616,724 | |
| | | | |
| (a) | Prior to January 22, 2016, the ICON Natural Resources Fund was known as the ICON Materials Fund. |
| | |
The accompanying notes are an integral part of the financial statements. |
| 44 | | www.iconfunds.com |
Page Intentionally Left Blank
| | |
| ICON Sector Funds | | Statements of Changes in Net Assets |
| | |
| | | | | | | | | | | | | | | | |
| | | ICON Consumer Discretionary Fund | | ICON Consumer Staples Fund |
| |
| | | Year Ended
September 30, 2016 | | Year Ended
September 30, 2015 | | Year Ended
September 30, 2016 | | Year Ended
September 30, 2015 |
| |
Operations | | | | | | | | | | | | | | | | |
Net investment income/(loss) | | $ | (115,723) | | | $ | (279,889) | | | $ | 35,430 | | | $ | 37,316 | |
Net realized gain/(loss) | | | 2,371,232 | | | | 5,384,667 | | | | 3,041,135 | | | | 2,707,892 | |
Change in net unrealized appreciation/(depreciation) | | | (204,909) | | | | (1,319,349) | | | | (1,151,918) | | | | (738,309) | |
| | | | |
Net increase/(decrease) in net assets resulting from operations | | | 2,050,600 | | | | 3,785,429 | | | | 1,924,647 | | | | 2,006,899 | |
| | | | |
| | | | |
Dividends and Distributions to Shareholders | | | | | | | | | | | | | | | | |
Net investment income | | | | | | | | | | | | | | | | |
Class S | | | – | | | | – | | | | (2,775) | | | | (182,080) | |
Class C(a) | | | – | | | | – | | | | – | | | | (27,681) | |
Class A(a) | | | – | | | | – | | | | (282) | | | | (55,273) | |
Net realized gains | | | | | | | | | | | | | | | | |
Class S | | | (4,142,603) | | | | (7,437,716) | | | | (1,689,533) | | | | (2,549,485) | |
Class C(a) | | | – | | | | (61,165) | | | | – | | | | (526,066) | |
Class A(a) | | | (324,745) | | | | (598,384) | | | | (1,018,358) | | | | (758,214) | |
| | | | |
Net decrease from dividends and distributions | | | (4,467,348) | | | | (8,097,265) | | | | (2,710,948) | | | | (4,098,799) | |
| | | | |
| | | | |
Fund Share Transactions | | | | | | | | | | | | | | | | |
Shares sold | | | | | | | | | | | | | | | | |
Class S | | | 3,598,562 | | | | 21,689,352 | | | | 31,781,091 | | | | 9,344,934 | |
Class C(a) | | | – | | | | 409,813 | | | | – | | | | 1,255,133 | |
Class A(a) | | | 978,272 | | | | 3,370,795 | | | | 9,210,875 | | | | 2,230,956 | |
Reinvested dividends and distributions | | | | | | | | | | | | | | | | |
Class S | | | 4,104,730 | | | | 7,360,142 | | | | 1,604,272 | | | | 2,554,153 | |
Class C(a) | | | – | | | | 52,431 | | | | – | | | | 201,008 | |
Class A(a) | | | 289,861 | | | | 539,623 | | | | 808,132 | | | | 688,039 | |
Shares repurchased | | | | | | | | | | | | | | | | |
Class S | | | (13,145,470) | | | | (35,671,860) | | | | (9,693,926) | | | | (27,906,883) | |
Class C(a) | | | – | | | | (952,038) | | | | – | | | | (2,486,008) | |
Class A(a) | | | (1,690,501) | | | | (3,081,029) | | | | (4,969,477) | | | | (1,473,943) | |
| | | | |
Net increase/(decrease) from fund share transactions | | | (5,864,546) | | | | (6,282,771) | | | | 28,740,967 | | | | (15,592,611) | |
| | | | |
Total net increase/(decrease) in net assets | | | (8,281,294) | | | | (10,594,607) | | | | 27,954,666 | | | | (17,684,511) | |
| | | | |
Net Assets | | | | | | | | | | | | | | | | |
Beginning of year | | | 47,912,055 | | | | 58,506,662 | | | | 12,253,431 | | | | 29,937,942 | |
| | | | |
End of year | | $ | 39,630,761 | | | $ | 47,912,055 | | | $ | 40,208,097 | | | $ | 12,253,431 | |
| | | | |
Accumulated undistributed net investment income/(loss) | | $ | – | | | $ | – | | | $ | 33,122 | | | $ | 749 | |
| | | | |
| | |
The accompanying notes are an integral part of the financial statements. |
| 46 | | www.iconfunds.com |
| | |
| ICON Sector Funds | | Statements of Changes in Net Assets |
| | |
| | | | | | | | |
| | | ICON Consumer Discretionary Fund | | ICON Consumer Staples Fund |
|
| | | Year Ended
September 30, 2016 | | Year Ended
September 30, 2015 | | Year Ended
September 30, 2016 | | Year Ended
September 30, 2015 |
|
Transactions in Fund Shares | | | | | | | | |
Shares sold | | | | | | | | |
Class S | | 251,318 | | 1,413,797 | | 3,991,017 | | 914,672 |
Class C(a) | | – | | 29,106 | | – | | 124,315 |
Class A(a) | | 70,735 | | 218,030 | | 1,184,079 | | 234,942 |
Issued to shareholders in reinvestment of distributions | | | | | | | | |
Class S | | 307,240 | | 502,056 | | 212,768 | | 275,267 |
Class C(a) | | – | | 3,777 | | – | | 22,384 |
Class A(a) | | 22,418 | | 37,710 | | 107,322 | | 74,225 |
Shares repurchased | | | | | | | | |
Class S | | (955,082) | | (2,336,434) | | (1,161,279) | | (2,476,966) |
Class C(a) | | – | | (69,108) | | – | | (276,761) |
Class A(a) | | (128,008) | | (203,013) | | (626,714) | | (153,867) |
| | |
Net increase/(decrease) | | (431,379) | | (404,079) | | 3,707,193 | | (1,261,789) |
| | |
Shares outstanding, beginning of year | | 3,362,727 | | 3,766,806 | | 1,332,110 | | 2,593,899 |
| | |
Shares outstanding, end of year | | 2,931,348 | | 3,362,727 | | 5,039,303 | | 1,332,110 |
| | |
| (a) | Class C shares merged into Class A shares on September 25, 2015. The information presented includes the activity for Class C prior to the merger as well as Class C shares redeemed and Class A shares issued in connection with the merger. |
| | |
The accompanying notes are an integral part of the financial statements. |
| Annual Report | September 30, 2016 | | 47 |
| | |
| ICON Sector Funds | | Statements of Changes in Net Assets |
| | |
| | | | | | | | | | | | | | | | |
| | | ICON Energy Fund | | ICON Financial Fund |
| |
| | | Year Ended
September 30, 2016 | | Year Ended
September 30, 2015 | | Year Ended
September 30, 2016 | | Year Ended
September 30, 2015 | |
| |
Operations | | | | | | | | | | | | | | | | |
Net investment income/(loss) | | $ | 6,869,776 | | | $ | 3,185,299 | | | $ | 487,539 | | | $ | 228,338 | |
Net realized gain/(loss) | | | (57,720,482) | | | | (91,275,818) | | | | (4,872,140) | | | | 2,241,254 | |
Net realized gain/(loss) on long-term capital gain distributions from other investment companies | | | – | | | | – | | | | 3,543 | | | | – | |
Change in net unrealized appreciation/(depreciation) | | | 100,616,370 | | | | (125,848,879) | | | | 2,869,562 | | | | (4,690,498) | |
| | | | |
Net increase/(decrease) in net assets resulting from operations | | | 49,765,664 | | | | (213,939,398) | | | | (1,511,496) | | | | (2,220,906) | |
| | | | |
| | | | |
Dividends and Distributions to Shareholders | | | | | | | | | | | | | | | | |
Net investment income | | | | | | | | | | | | | | | | |
Class S | | | (3,080,658) | | | | (2,185,262) | | | | – | | | | (297,167) | (a) |
Class C(b) | | | (46,988) | | | | – | | | | – | | | | (1,205) | (a) |
Class A(b) | | | (87,124) | | | | (46,508) | | | | – | | | | (2,530) | (a) |
Net realized gains | | | | | | | | | | | | | | | | |
Class S | | | – | | | | (91,546,420) | | | | – | | | | – | |
Class C(b) | | | – | | | | (2,566,539) | | | | – | | | | – | |
Class A(b) | | | – | | | | (4,344,666) | | | | – | | | | – | |
| | | | |
Net decrease from dividends and distributions | | | (3,214,770) | | | | (100,689,395) | | | | – | | | | (300,902) | |
| | | | |
| | | | |
Fund Share Transactions | | | | | | | | | | | | | | | | |
Shares sold | | | | | | | | | | | | | | | | |
Class S | | | 109,808,067 | | | | 155,430,206 | | | | 11,122,679 | | | | 33,196,366 | |
Class C(b) | | | 1,926,758 | | | | 6,608,035 | | | | – | | | | 710,046 | |
Class A(b) | | | 4,574,292 | | | | 9,095,784 | | | | 1,691,237 | | | | 2,012,530 | |
Reinvested dividends and distributions | | | | | | | | | | | | | | | | |
Class S | | | 2,963,225 | | | | 89,035,364 | | | | – | | | | 294,149 | |
Class C(b) | | | 40,797 | | | | 2,100,297 | | | | – | | | | 1,038 | |
Class A(b) | | | 66,909 | | | | 3,519,414 | | | | – | | | | 1,970 | |
Shares repurchased | | | | | | | | | | | | | | | | |
Class S | | | (149,229,594) | | | | (246,946,411) | | | | (15,374,878) | | | | (14,305,860) | |
Class C(b) | | | (2,980,604) | | | | (7,362,690) | | | | – | | | | (716,985) | |
Class A(b) | | | (6,498,389) | | | | (11,211,290) | | | | (1,112,225) | | | | (489,118) | |
| | | | |
Net increase/(decrease) from fund share transactions | | | (39,328,539) | | | | 268,709 | | | | (3,673,187) | | | | 20,704,136 | |
| | | | |
| | | | |
Total net increase/(decrease) in net assets | | | 7,222,355 | | | | (314,360,084) | | | | (5,184,683) | | | | 18,182,328 | |
| | | | |
Net Assets | | | | | | | | | | | | | | | | |
Beginning of year | | | 345,046,190 | | | | 659,406,274 | | | | 51,080,057 | | | | 32,897,729 | |
| | | | |
End of year | | $ | 352,268,545 | | | $ | 345,046,190 | | | $ | 45,895,374 | | | $ | 51,080,057 | |
| | | | |
| | | | |
Accumulated undistributed net investment income/(loss) | | $ | (33,682) | | | $ | 1,363,789 | | | $ | 487,449 | | | $ | – | |
| | | | |
| | |
The accompanying notes are an integral part of the financial statements. |
| 48 | | www.iconfunds.com |
| | |
| ICON Sector Funds | | Statements of Changes in Net Assets |
| | |
| | | | | | | | | | | | | | | | |
| | | ICON Energy Fund | | ICON Financial Fund |
| |
| | | Year Ended
September 30, 2016 | | Year Ended
September 30, 2015 | | Year Ended
September 30, 2016 | | Year Ended
September 30, 2015 |
Transactions in Fund Shares | | | | | | | | | | | | | | | | |
Shares sold | | | | | | | | | | | | | | | | |
Class S | | | 9,937,173 | | | | 11,026,018 | | | | 1,386,325 | | | | 3,898,005 | |
Class C(b) | | | 173,976 | | | | 467,829 | | | | – | | | | 83,078 | |
Class A(b) | | | 405,435 | | | | 602,723 | | | | 225,786 | | | | 244,185 | |
Issued to shareholders in reinvestment of distributions | | | | | | | | | | | | | | | | |
Class S | | | 278,237 | | | | 6,310,086 | | | | – | | | | 37,808 | |
Class C(b) | | | 3,961 | | | | 153,195 | | | | – | | | | 135 | |
Class A(b) | | | 6,295 | | | | 250,314 | | | | – | | | | 251 | |
Shares repurchased | | | | | | | | | | | | | | | | |
Class S | | | (13,027,347) | | | | (16,249,675) | | | | (2,072,996) | | | | (1,717,118) | |
Class C(b) | | | (270,035) | | | | (484,637) | | | | – | | | | (92,318) | |
Class A(b) | | | (561,929) | | | | (743,141) | | | | (148,818) | | | | (60,426) | |
| | | | |
Net increase/(decrease) | | | (3,054,234) | | | | 1,332,712 | | | | (609,703) | | | | 2,393,600 | |
| | | | |
Shares outstanding, beginning of year | | | 30,923,388 | | | | 29,590,676 | | | | 6,593,403 | | | | 4,199,803 | |
| | | | |
Shares outstanding, end of year | | | 27,869,154 | | | | 30,923,388 | | | | 5,983,700 | | | | 6,593,403 | |
| | | | |
| (a) | The ICON Financial Fund had a distribution in excess of net investment income during the fiscal year ended September 30, 2015. |
| (b) | Class C shares of the ICON Financial Fund merged into Class A shares on September 25, 2015. The information presented includes the activity for Class C prior to the merger as well as Class C shares redeemed and Class A shares issued in connection with the merger. |
| | |
The accompanying notes are an integral part of the financial statements. |
| Annual Report | September 30, 2016 | | 49 |
| | |
| ICON Sector Funds | | Statements of Changes in Net Assets |
| | |
| | | | | | | | | | | | | | | | |
| | | ICON Healthcare Fund | | ICON Industrials Fund |
| |
| | | Year Ended
September 30, 2016 | | Year Ended
September 30, 2015 | | Year Ended
September 30, 2016 | | Year Ended
September 30, 2015 | |
| |
Operations | | | | | | | | | | | | | | | | |
Net investment income/(loss) | | $ | (256,229) | | | $ | (757,081) | | | $ | (24,274) | | | $ | 27,024 | |
Net realized gain/(loss) | | | 1,360,141 | | | | 24,437,743 | | | | 1,229,396 | | | | 6,859,443 | |
Change in net unrealized appreciation/(depreciation) | | | 6,368,752 | | | | (16,999,189) | | | | 210,733 | | | | (7,128,021) | |
| | | | |
Net increase/(decrease) in net assets resulting from operations | | | 7,472,664 | | | | 6,681,473 | | | | 1,415,855 | | | | (241,554) | |
| | | | |
| | | | |
Dividends and Distributions to Shareholders | | | | | | | | | | | | | | | | |
Net investment income | | | | | | | | | | | | | | | | |
Class S | | | – | | | | – | | | | – | | | | (26,242) | |
Net realized gains | | | | | | | | | | | | | | | | |
Class S | | | (18,074,605) | | | | (29,325,742) | | | | – | | | | – | |
Class C(a) | | | – | | | | (255,243) | | | | – | | | | – | |
Class A(a) | | | (2,959,679) | | | | (3,330,588) | | | | – | | | | – | |
| | | | |
Net decrease from dividends and distributions | | | (21,034,284) | | | | (32,911,573) | | | | – | | | | (26,242) | |
| | | | |
| | | | |
Fund Share Transactions | | | | | | | | | | | | | | | | |
Shares sold | | | | | | | | | | | | | | | | |
Class S | | | 8,840,606 | | | | 82,146,215 | | | | 13,580,388 | | | | 7,116,799 | |
Class C(a) | | | – | | | | 2,116,107 | | | | – | | | | 136,307 | |
Class A(a) | | | 1,044,829 | | | | 12,844,606 | | | | 865,729 | | | | 520,264 | |
Reinvested dividends and distributions | | | | | | | | | | | | | | | | |
Class S | | | 17,161,570 | | | | 27,557,080 | | | | – | | | | 25,951 | |
Class C(a) | | | – | | | | 226,826 | | | | – | | | | – | |
Class A(a) | | | 2,747,924 | | | | 3,195,114 | | | | – | | | | – | |
Shares repurchased | | | | | | | | | | | | | | | | |
Class S | | | (33,976,571) | | | | (140,472,115) | | | | (5,225,967) | | | | (28,551,022) | |
Class C(a) | | | – | | | | (2,684,340) | | | | – | | | | (389,916) | |
Class A(a) | | | (11,543,997) | | | | (8,127,702) | | | | (528,190) | | | | (199,180) | |
| | | | |
Net increase/(decrease) from fund share transactions | | | (15,725,639) | | | | (23,198,209) | | | | 8,691,960 | | | | (21,340,797) | |
| | | | |
| | | | |
Total net increase/(decrease) in net assets | | | (29,287,259) | | | | (49,428,309) | | | | 10,107,815 | | | | (21,608,593) | |
| | | | |
Net Assets | | | | | | | | | | | | | | | | |
Beginning of year | | | 110,426,218 | | | | 159,854,527 | | | | 14,847,052 | | | | 36,455,645 | |
| | | | |
End of year | | $ | 81,138,959 | | | $ | 110,426,218 | | | $ | 24,954,867 | | | $ | 14,847,052 | |
| | | | |
| | | | |
Accumulated undistributed net investment income/(loss) | | $ | (63,244) | | | $ | – | | | $ | (22,535) | | | $ | (2,188) | |
| | | | |
| | |
The accompanying notes are an integral part of the financial statements. |
| 50 | | www.iconfunds.com |
| | |
| ICON Sector Funds | | Statements of Changes in Net Assets |
| | |
| | | | | | | | | | | | | | | | |
| | | ICON Healthcare Fund | | ICON Industrials Fund |
| |
| | | Year Ended
September 30, 2016 | | Year Ended
September 30, 2015 | | Year Ended
September 30, 2016 | | Year Ended
September 30, 2015 | |
| |
Transactions in Fund Shares | | | | | | | | | | | | | | | | |
Shares sold | | | | | | | | | | | | | | | | |
Class S | | | 571,957 | | | | 3,948,413 | | | | 1,102,557 | | | | 581,655 | |
Class C(a) | | | – | | | | 110,698 | | | | – | | | | 11,363 | |
Class A(a) | | | 67,963 | | | | 646,369 | | | | 72,878 | | | | 45,927 | |
Issued to shareholders in reinvestment of distributions | | | | | | | | | | | | | | | | |
Class S | | | 1,165,868 | | | | 1,445,049 | | | | – | | | | 2,223 | |
Class C(a) | | | – | | | | 12,714 | | | | – | | | | – | |
Class A(a) | | | 193,108 | | | | 171,688 | | | | – | | | | – | |
Shares repurchased | | | | | | | | | | | | | | | | |
Class S | | | (2,124,163) | | | | (6,673,617) | | | | (451,383) | | | | (2,357,106) | |
Class C(a) | | | – | | | | (156,937) | | | | – | | | | (35,500) | |
Class A(a) | | | (811,470) | | | | (430,358) | | | | (45,537) | | | | (16,775) | |
| | | | |
Net increase/(decrease) | | | (936,737) | | | | (925,981) | | | | 678,515 | | | | (1,768,213) | |
| | | | |
Shares outstanding, beginning of year | | | 6,216,037 | | | | 7,142,018 | | | | 1,357,249 | | | | 3,125,462 | |
| | | | |
Shares outstanding, end of year | | | 5,279,300 | | | | 6,216,037 | | | | 2,035,764 | | | | 1,357,249 | |
| | | | |
| (a) | Class C shares merged into Class A shares on September 25, 2015. The information presented includes the activity for Class C prior to the merger as well as Class C shares redeemed and Class A shares issued in connection with the merger. |
| | |
The accompanying notes are an integral part of the financial statements. |
| Annual Report | September 30, 2016 | | 51 |
| | |
| ICON Sector Funds | | Statements of Changes in Net Assets |
| | |
| | | | | | | | | | | | | | | | |
| | | ICON Information Technology Fund | | | ICON Natural Resources Fund | |
| |
| | | Year Ended
September 30, 2016 | | | Year Ended
September 30, 2015 | | | Year Ended
September 30, 2016(a) | | | Year Ended
September 30, 2015 | |
| |
Operations | | | | | | | | | | | | | | | | |
Net investment income/(loss) | | $ | (219,517) | | | $ | (353,717) | | | $ | 524,612 | | | $ | 213,173 | |
Net realized gain/(loss) | | | 9,737,627 | | | | 6,605,486 | | | | (4,590,557) | | | | 13,500,660 | |
Change in net unrealized appreciation/(depreciation) | | | (1,066,435) | | | | (1,368,701) | | | | 15,224,010 | | | | (32,304,609) | |
| | | | |
Net increase/(decrease) in net assets resulting from operations | | | 8,451,675 | | | | 4,883,068 | | | | 11,158,065 | | | | (18,590,776) | |
| | | | |
| | | | |
Dividends and Distributions to Shareholders | | | | | | | | | | | | | | | | |
Net investment income | | | | | | | | | | | | | | | | |
Class S | | | – | | | | – | | | | (322,749) | | | | (208,262) | |
Class A(b) | | | – | | | | – | | | | (2,353) | | | | – | |
Net realized gains | | | | | | | | | | | | | | | | |
Class S | | | – | | | | – | | | | (4,489,113) | | | | – | |
Class C(b) | | | – | | | | – | | | | (52,186) | | | | – | |
Class A(b) | | | – | | | | – | | | | (201,365) | | | | – | |
| | | | |
Net decrease from dividends and distributions | | | – | | | | – | | | | (5,067,766) | | | | (208,262) | |
| | | | |
| | | | |
Fund Share Transactions | | | | | | | | | | | | | | | | |
Shares sold | | | | | | | | | | | | | | | | |
Class S | | | 18,296,541 | | | | 21,010,894 | | | | 16,580,790 | | | | 21,981,237 | |
Class C(b) | | | – | | | | 499,734 | | | | 828,203 | | | | 609,433 | |
Class A(b) | | | 1,908,013 | | | | 4,813,274 | | | | 4,545,786 | | | | 1,846,097 | |
Reinvested dividends and distributions | | | | | | | | | | | | | | | | |
Class S | | | – | | | | – | | | | 4,690,853 | | | | 200,552 | |
Class C(b) | | | – | | | | – | | | | 43,566 | | | | – | |
Class A(b) | | | – | | | | – | | | | 183,313 | | | | – | |
Shares repurchased | | | | | | | | | | | | | | | | |
Class S | | | (22,597,870) | | | | (30,795,176) | | | | (21,368,193) | | | | (37,934,905) | |
Class C(b) | | | – | | | | (929,352) | | | | (401,215) | | | | (216,420) | |
Class A(b) | | | (2,987,018) | | | | (2,189,088) | | | | (3,837,341) | | | | (5,884,751) | |
| | | | |
Net increase/(decrease) from fund share transactions | | | (5,380,334) | | | | (7,589,714) | | | | 1,265,762 | | | | (19,398,757) | |
| | | | |
Total net increase/(decrease) in net assets | | | 3,071,341 | | | | (2,706,646) | | | | 7,356,061 | | | | (38,197,795) | |
| | | | |
Net Assets | | | | | | | | | | | | | | | | |
Beginning of year | | | 48,512,501 | | | | 51,219,147 | | | | 64,316,321 | | | | 102,514,116 | |
| | | | |
End of year | | $ | 51,583,842 | | | $ | 48,512,501 | | | $ | 71,672,382 | | | $ | 64,316,321 | |
| | | | |
Accumulated undistributed net investment income/(loss) | | $ | – | | | $ | (286,389) | | | $ | 400,690 | | | $ | 213,172 | |
| | | | |
| | |
The accompanying notes are an integral part of the financial statements. |
| 52 | | www.iconfunds.com |
| | |
| ICON Sector Funds | | Statements of Changes in Net Assets |
| | |
| | | | | | | | | | | | | | | | |
| | | ICON Information Technology Fund | | ICON Natural Resources Fund |
| |
| | | Year Ended
September 30, 2016 | | Year Ended
September 30, 2015 | | Year Ended
September 30, 2016(a) | | Year Ended
September 30, 2015 | |
| |
Transactions in Fund Shares | | | | | | | | | | | | | | | | |
Shares sold | | | | | | | | | | | | | | | | |
Class S | | | 1,105,056 | | | | 1,431,875 | | | | 1,391,294 | | | | 1,483,591 | |
Class C(b) | | | – | | | | 34,317 | | | | 72,656 | | | | 41,945 | |
Class A(b) | | | 119,658 | | | | 324,948 | | | | 384,690 | | | | 125,254 | |
Issued to shareholders in reinvestment of distributions | | | | | | | | | | | | | | | | |
Class S | | | – | | | | – | | | | 422,219 | | | | 13,699 | |
Class C(b) | | | – | | | | – | | | | 4,038 | | | | – | |
Class A(b) | | | – | | | | – | | | | 16,604 | | | | – | |
Shares repurchased | | | | | | | | | | | | | | | | |
Class S | | | (1,410,912) | | | | (2,116,872) | | | | (1,776,770) | | | | (2,608,199) | |
Class C(b) | | | – | | | | (65,286) | | | | (33,139) | | | | (15,147) | |
Class A(b) | | | (186,123) | | | | (142,668) | | | | (313,793) | | | | (413,339) | |
| | | | |
Net increase/(decrease) | | | (372,321) | | | | (533,686) | | | | 167,799 | | | | (1,372,196) | |
| | | | |
Shares outstanding, beginning of year | | | 3,248,437 | | | | 3,782,123 | | | | 5,427,607 | | | | 6,799,803 | |
| | | | |
Shares outstanding, end of year | | | 2,876,116 | | | | 3,248,437 | | | | 5,595,406 | | | | 5,427,607 | |
| | | | |
| (a) | Prior to January 22, 2016, the ICON Natural Resources Fund was known as the ICON Materials Fund. |
| (b) | Class C shares of the ICON Information Technology Fund merged into Class A shares on September 25, 2015. The information presented includes the activity for Class C prior to the merger as well as Class C shares redeemed and Class A shares issued in connection with the merger. |
| | |
The accompanying notes are an integral part of the financial statements. |
| Annual Report | September 30, 2016 | | 53 |
| | |
| ICON Sector Funds | | Statements of Changes in Net Assets |
| | |
| | | | | | | | |
| | | ICON Utilities Fund |
| |
| | | Year Ended
September 30, 2016 | | Year Ended
September 30, 2015 | |
| |
Operations | | | | | | | | |
Net investment income/(loss) | | $ | 1,459,825 | | | $ | 646,343 | |
Net realized gain/(loss) | | | 4,283,561 | | | | 940,502 | |
Change in net unrealized appreciation/(depreciation) | | | 1,873,338 | | | | (758,094) | |
| | | | |
Net increase/(decrease) in net assets resulting from operations | | | 7,616,724 | | | | 828,751 | |
| | | | |
| | |
Dividends and Distributions to Shareholders | | | | | | | | |
Net investment income | | | | | | | | |
Class S | | | (1,106,247) | | | | (485,422) | |
Class C(a) | | | – | | | | (44,880) | |
Class A(a) | | | (318,477) | | | | (92,640) | |
| | | | |
Net decrease from dividends and distributions | | | (1,424,724) | | | | (622,942) | |
| | | | |
| | |
Fund Share Transactions | | | | | | | | |
Shares sold | | | | | | | | |
Class S | | | 50,937,665 | | | | 12,850,414 | |
Class C(a) | | | – | | | | 1,076,770 | |
Class A(a) | | | 12,140,072 | | | | 4,507,405 | |
Reinvested dividends and distributions | | | | | | | | |
Class S | | | 1,060,746 | | | | 455,862 | |
Class C(a) | | | – | | | | 7,444 | |
Class A(a) | | | 221,423 | | | | 80,869 | |
Shares repurchased | | | | | | | | |
Class S | | | (31,789,944) | | | | (12,269,919) | |
Class C(a) | | | – | | | | (3,353,179) | |
Class A(a) | | | (3,816,717) | | | | (1,458,476) | |
| | | | |
Net increase from fund share transactions | | | 28,753,245 | | | | 1,897,190 | |
| | | | |
Total net increase in net assets | | | 34,945,245 | | | | 2,102,999 | |
| | |
Net Assets | | | | | | | | |
Beginning of year | | | 24,786,288 | | | | 22,683,289 | |
| | | | |
End of year | | $ | 59,731,533 | | | $ | 24,786,288 | |
| | | | |
| | |
Accumulated undistributed net investment income/(loss) | | $ | 22,990 | | | $ | 25,158 | |
| | | | |
| | |
Transactions in Fund Shares | | | | | | | | |
Shares sold | | | | | | | | |
Class S | | | 5,504,446 | | | | 1,524,522 | |
Class C(a) | | | – | | | | 132,246 | |
Class A(a) | | | 1,380,355 | | | | 563,149 | |
Issued to shareholders in reinvestment of distributions | | | | | | | | |
Class S | | | 114,167 | | | | 55,665 | |
Class C(a) | | | – | | | | 929 | |
Class A(a) | | | 23,829 | | | | 9,994 | |
Shares repurchased | | | | | | | | |
Class S | | | (3,372,689) | | | | (1,469,244) | |
Class C(a) | | | – | | | | (421,473) | |
Class A(a) | | | (424,156) | | | | (178,414) | |
| | | | |
Net increase | | | 3,225,952 | | | | 217,374 | |
| | | | |
Shares outstanding, beginning of year | | | 3,095,054 | | | | 2,877,680 | |
| | | | |
Shares outstanding, end of year | | | 6,321,006 | | | | 3,095,054 | |
| | | | |
| (a) | Class C shares merged into Class A shares on September 25, 2015. The information presented includes the activity for Class C prior to the merger as well as Class C shares redeemed and Class A shares issued in connection with the merger. | |
| | |
The accompanying notes are an integral part of the financial statements. |
| 54 | | www.iconfunds.com |
| | |
| ICON Consumer Discretionary Fund | | Financial Highlights |
| | For a Share Outstanding Throughout the Years Presented |
| | | | | | | | | | | | | | | | | | | | |
| Class S | | Year Ended
September 30,
2016 | | Year Ended
September 30,
2015 | | Year Ended
September 30,
2014 | | Year Ended
September 30,
2013 | | Year Ended
September 30,
2012 | |
| |
Net asset value, beginning of period | | $ | 14.27 | | | $ | 15.55 | | | $ | 14.50 | | | $ | 11.82 | | | $ | 8.79 | |
| | | | | |
Income/(loss) from investment operations: | | | | | | | | | | | | | | | | | | | | |
Net investment income/(loss)(a) | | | (0.03) | | | | (0.07) | | | | (0.07) | | | | (0.03) | | | | 0.03 | |
Net realized and unrealized gains/(losses) on investments | | | 0.65 | | | | 1.03 | | | | 1.12 | | | | 2.73 | | | | 3.00 | |
| |
Total from investment operations | | | 0.62 | | | | 0.96 | | | | 1.05 | | | | 2.70 | | | | 3.03 | |
| |
| | | | | |
Less dividends and distributions: | | | | | | | | | | | | | | | | | | | | |
Dividends from net investment income | | | – | | | | – | | | | – | | | | (0.02) | | | | – | |
Distributions from net realized gains | | | (1.34) | | | | (2.24) | | | | – | | | | – | | | | – | |
| |
Total dividends and distributions | | | (1.34) | | | | (2.24) | | | | – | | | | (0.02) | | | | – | |
| |
| | | | | |
Net asset value, end of period | | $ | 13.55 | | | $ | 14.27 | | | $ | 15.55 | | | $ | 14.50 | | | $ | 11.82 | |
| |
| | | | | |
Total Return | | | 4.49 | % | | | 5.80 | % | | | 7.24 | % | | | 22.91 | % | | | 34.47% | |
| | | | | |
Ratios and Supplemental Data | | | | | | | | | | | | | | | | | | | | |
Net assets, end of period (in 000s) | | $ | 37,263 | | | $ | 44,913 | | | $ | 55,476 | | | $ | 39,883 | | | $ | 58,314 | |
| | | | | |
Ratio of expenses to average net assets | | | | | | | | | | | | | | | | | | | | |
Before expense limitation | | | 1.42 | % | | | 1.43 | % | | | 1.46 | % | | | 1.38 | % | | | 1.40% | |
After expense limitation/
recoupment(b) | | | 1.42 | % | | | 1.43 | % | | | 1.46 | % | | | 1.38 | % | | | 1.40% | |
| | | | | |
Ratio of net investment income/(loss) to average net assets | | | | | | | | | | | | | | | | | | | | |
Before expense limitation | | | (0.22) | % | | | (0.44) | % | | | (0.47) | % | | | (0.21) | % | | | 0.26% | |
After expense limitation/
recoupment | | | (0.22) | % | | | (0.44) | % | | | (0.47) | % | | | (0.21) | % | | | 0.26% | |
Portfolio turnover rate | | | 158 | % | | | 201 | % | | | 202 | % | | | 87 | % | | | 91% | |
| (a) | Calculated using the average shares method. |
| (b) | The Fund’s operating expenses, not including interest expense, are contractually limited to the amounts discussed in Note 3. The ratios in these financial highlights reflect the limitation, including the interest expense, when applicable. |
| | |
The accompanying notes are an integral part of the financial statements. |
| Annual Report | September 30, 2016 | | 55 |
| | |
| ICON Consumer Discretionary Fund | | Financial Highlights |
| | For a Share Outstanding Throughout the Years Presented |
| | | | | | | | | | | | | | | | | | | | |
| Class A(a) | | Year Ended
September 30,
2016 | | Year Ended
September 30,
2015 | | Year Ended
September 30,
2014 | | Year Ended
September 30,
2013 | | Year Ended
September 30,
2012 | |
| |
Net asset value, beginning of period | | $ | 13.88 | | | $ | 15.24 | | | $ | 14.25 | | | $ | 11.65 | | | $ | 8.75 | |
| | | | | |
Income/(loss) from investment operations: | | | | | | | | | | | | | | | | | | | | |
Net investment income/(loss) (b) | | | (0.10) | | | | (0.14) | | | | (0.12) | | | | (0.09) | | | | (0.02) | |
Net realized and unrealized gains/(losses) on investments | | | 0.62 | | | | 1.02 | | | | 1.11 | | | | 2.69 | | | | 2.92 | |
| |
Total from investment operations | | | 0.52 | | | | 0.88 | | | | 0.99 | | | | 2.60 | | | | 2.90 | |
| |
| | | | | |
Less dividends and distributions: | | | | | | | | | | | | | | | | | | | | |
Distributions from net realized gains | | | (1.34) | | | | (2.24) | | | | – | | | | – | | | | – | |
| |
Total dividends and distributions | | | (1.34) | | | | (2.24) | | | | – | | | | – | | | | – | |
| |
| | | | | |
Net asset value, end of period | | $ | 13.06 | | | $ | 13.88 | | | $ | 15.24 | | | $ | 14.25 | | | $ | 11.65 | |
| |
| | | | | |
Total Return(c) | | | 3.86 | % | | | 5.34 | % | | | 6.95 | % | | | 22.42 | % | | | 33.03% | |
| | | | | |
Ratios and Supplemental Data | | | | | | | | | | | | | | | | | | | | |
Net assets, end of period (in 000s) | | $ | 2,368 | | | $ | 2,999 | | | $ | 2,492 | | | $ | 4,699 | | | $ | 1,542 | |
| | | | | |
Ratio of expenses to average net assets | | | | | | | | | | | | | | | | | | | | |
Before expense limitation | | | 2.13 | % | | | 1.91 | % | | | 1.76 | % | | | 1.78 | % | | | 1.78% | |
After expense limitation/
recoupment (d) | | | 1.99 | % | | | 1.91 | % | | | 1.76 | % | | | 1.78 | % | | | 1.78% | |
Ratio of net investment income/(loss) to average net assets | | | | | | | | | | | | | | | | | | | | |
Before expense limitation | | | (0.92) | % | | | (0.97) | % | | | (0.80) | % | | | (0.66) | % | | | (0.20)% | |
After expense limitation/recoupment | | | (0.78) | % | | | (0.97) | % | | | (0.80) | % | | | (0.66) | % | | | (0.20)% | |
Portfolio turnover rate | | | 158 | % | | | 201 | % | | | 202 | % | | | 87 | % | | | 91% | |
| (a) | Class C shares were merged into Class A on September 25, 2015. The amounts presented represent the results of the Class A shares for the periods prior to the merger and the results of the combined share class for the period subsequent to the merger. |
| (b) | Calculated using the average shares method. |
| (c) | The total return calculation excludes any sales charges. |
| (d) | The Fund’s operating expenses, not including interest expense, are contractually limited to the amounts discussed in Note 3. The ratios in these financial highlights reflect the limitation, including the interest expense, when applicable. |
| | |
The accompanying notes are an integral part of the financial statements. |
| 56 | | www.iconfunds.com |
| | |
| ICON Consumer Staples Fund | | Financial Highlights |
| | For a Share Outstanding Throughout the Years Presented |
| | | | | | | | | | | | | | | | | | | | |
| Class S | | Year Ended
September 30,
2016 | | | Year Ended
September 30,
2015 | | | Year Ended
September 30,
2014 | | | Year Ended
September 30,
2013 | | | Year Ended
September 30,
2012 | |
Net asset value, beginning of period | | $ | 9.20 | | | $ | 11.55 | | | $ | 11.18 | | | $ | 10.20 | | | $ | 8.61 | |
| | | | | |
Income/(loss) from investment operations: | | | | | | | | | | | | | | | | | | | | |
Net investment income/(loss)(a) | | | 0.02 | | | | 0.04 | | | | 0.11 | | | | 0.21 | | | | 0.14 | |
Net realized and unrealized gains/(losses) on investments | | | 0.96 | | | | 0.98 | | | | 1.31 | | | | 0.98 | | | | 1.69 | |
| |
Total from investment operations | | | 0.98 | | | | 1.02 | | | | 1.42 | | | | 1.19 | | | | 1.83 | |
| |
| | | | | |
Less dividends and distributions: | | | | | | | | | | | | | | | | | | | | |
Dividends from net investment income | | | (0.00) | (b) | | | (0.22) | | | | (0.03) | | | | (0.21) | | | | (0.24) | |
Distributions from net realized gains | | | (2.20) | | | | (3.15) | | | | (1.02) | | | | – | | | | – | |
| |
Total dividends and distributions | | | (2.20) | | | | (3.37) | | | | (1.05) | | | | (0.21) | | | | (0.24) | |
| |
| | | | | |
Net asset value, end of period | | $ | 7.98 | | | $ | 9.20 | | | $ | 11.55 | | | $ | 11.18 | | | $ | 10.20 | |
| |
| | | | | |
Total Return | | | 12.09 | % | | | 8.66 | % | | | 13.32 | % | | | 11.75 | % | | | 21.50% | |
| | | | | |
Ratios and Supplemental Data | | | | | | | | | | | | | | | | | | | | |
Net assets, end of period (in 000s) | | $ | 31,799 | | | $ | 8,651 | | | $ | 25,731 | | | $ | 33,813 | | | $ | 37,567 | |
| | | | | |
Ratio of expenses to average net assets | | | | | | | | | | | | | | | | | | | | |
Before expense limitation | | | 1.74 | % | | | 1.87 | % | | | 1.45 | % | | | 1.51 | % | | | 1.55% | |
After expense limitation/
recoupment (c) | | | 1.51 | % | | | 1.51 | % | | | 1.45 | % | | | 1.51 | % | | | 1.51% | |
Ratio of net investment income/(loss) to average net assets | | | | | | | | | | | | | | | | | | | | |
Before expense limitation | | | 0.00% | (d) | | | (0.01) | % | | | 0.94 | % | | | 1.92 | % | | | 1.40% | |
After expense limitation/recoupment | | | 0.23 | % | | | 0.35 | % | | | 0.94 | % | | | 1.92 | % | | | 1.44% | |
Portfolio turnover rate | | | 125 | % | | | 16 | % | | | 52 | % | | | 91 | % | | | 82% | |
| (a) | Calculated using the average shares method. |
| (b) | Amount less than $(0.005). |
| (c) | The Fund’s operating expenses, not including interest expense, are contractually limited to the amounts discussed in Note 3. The ratios in these financial highlights reflect the limitation, including the interest expense, when applicable. |
| (d) | Less than 0.005% of average net assets. |
| | |
The accompanying notes are an integral part of the financial statements. |
| Annual Report | September 30, 2016 | | 57 |
| | |
| ICON Consumer Staples Fund | | Financial Highlights |
| | For a Share Outstanding Throughout the Years Presented |
| | | | | | | | | | | | | | | | | | | | |
| Class A(a) | | Year Ended
September 30,
2016 | | | Year Ended
September 30,
2015 | | | Year Ended
September 30,
2014 | | | Year Ended
September 30,
2013 | | | Year Ended
September 30,
2012 | |
| |
Net asset value, beginning of period | | $ | 9.19 | | | $ | 11.58 | | | $ | 11.23 | | | $ | 10.24 | | | $ | 8.68 | |
| | | | | |
Income/(loss) from investment operations: | | | | | | | | | | | | | | | | | | | | |
Net investment income/(loss)(b) | | | (0.00)( | c)(d) | | | 0.02 | | | | 0.07 | | | | 0.14 | | | | 0.11 | |
Net realized and unrealized gains/(losses) on investments | | | 0.97 | | | | 0.97 | | | | 1.32 | | | | 1.03 | | | | 1.68 | |
| |
Total from investment operations | | | 0.97 | | | | 0.99 | | | | 1.39 | | | | 1.17 | | | | 1.79 | |
| |
| | | | | |
Less dividends and distributions: | | | | | | | | | | | | | | | | | | | | |
Dividends from net investment income | | | (0.00) | (d) | | | (0.23) | | | | (0.02) | | | | (0.18) | | | | (0.23) | |
Distributions from net realized gains | | | (2.20) | | | | (3.15) | | | | (1.02) | | | | – | | | | – | |
| |
Total dividends and distributions | | | (2.20) | | | | (3.38) | | | | (1.04) | | | | (0.18) | | | | (0.23) | |
| |
| | | | | |
Net asset value, end of period | | $ | 7.96 | | | $ | 9.19 | | | $ | 11.58 | | | $ | 11.23 | | | $ | 10.24 | |
| |
| | | | | |
Total Return(e) | | | 11.93 | % | | | 8.32 | % | | | 12.99 | % | | | 11.52 | % | | | 20.94% | |
| | | | | |
Ratios and Supplemental Data | | | | | | | | | | | | | | | | | | | | |
Net assets, end of period (in 000s) | | $ | 8,409 | | | $ | 3,602 | | | $ | 2,740 | | | $ | 2,744 | | | $ | 1,499 | |
| | | | | |
Ratio of expenses to average net assets | | | | | | | | | | | | | | | | | | | | |
Before expense limitation | | | 1.97 | % | | | 2.12 | % | | | 2.04 | % | | | 1.84 | % | | | 2.05% | |
After expense limitation/ recoupment (f) | | | 1.76 | % | | | 1.76 | % | | | 1.75 | % | | | 1.75 | % | | | 1.77% | |
Ratio of net investment income/(loss) to average net assets | | | | | | | | | | | | | | | | | | | | |
Before expense limitation | | | (0.23) | % | | | (0.15) | % | | | 0.35 | % | | | 1.20 | % | | | 0.82% | |
After expense limitation/ recoupment | | | (0.02) | % | | | 0.21 | % | | | 0.64 | % | | | 1.29 | % | | | 1.10% | |
Portfolio turnover rate | | | 125 | % | | | 16 | % | | | 52 | % | | | 91 | % | | | 82% | |
| (a) | Class C shares were merged into Class A on September 25, 2015. The amounts presented represent the results of the Class A shares for the periods prior to the merger and the results of the combined share class for the period subsequent to the merger. |
| (b) | Calculated using the average shares method. |
| (c) | The per share amount does not correspond to activity reflected in the Statement of Operations due to class specific expenses during the period. |
| (d) | Amount less than $(0.005). |
| (e) | The total return calculation excludes any sales charges. |
| (f) | The Fund’s operating expenses, not including interest expense, are contractually limited to the amounts discussed in Note 3. The ratios in these financial highlights reflect the limitation, including the interest expense, when applicable. |
| | |
The accompanying notes are an integral part of the financial statements. |
| 58 | | www.iconfunds.com |
| | |
| ICON Energy Fund | | Financial Highlights |
| | For a Share Outstanding Throughout the Years Presented |
| | | | | | | | | | | | | | | | | | | | |
| Class S | | Year Ended
September 30,
2016 | | | Year Ended
September 30,
2015 | | | Year Ended
September 30,
2014 | | | Year Ended
September 30,
2013 | | | Year Ended
September 30,
2012 | |
| |
Net asset value, beginning of period | | $ | 11.17 | | | $ | 22.30 | | | $ | 22.59 | | | $ | 19.18 | | | $ | 16.64 | |
| | | | | |
Income/(loss) from investment operations: | | | | | | | | | | | | | | | | | | | | |
Net investment income/(loss)(a) | | | 0.24 | | | | 0.11 | | | | 0.11 | | | | 0.18 | | | | 0.16 | |
Net realized and unrealized
gains/(losses) on investments | | | 1.36 | | | | (7.42) | | | | 0.33 | | | | 3.51 | | | | 2.93 | |
| |
Total from investment operations | | | 1.60 | | | | (7.31) | | | | 0.44 | | | | 3.69 | | | | 3.09 | |
| |
| | | | | |
Less dividends and distributions: | | | | | | | | | | | | | | | | | | | | |
Dividends from net investment income | | | (0.11) | | | | (0.09) | | | | (0.06) | | | | (0.28) | | | | (0.15) | |
Distributions from net realized gains | | | – | | | | (3.73) | | | | (0.67) | | | | – | | | | (0.40) | |
| |
Total dividends and distributions | | | (0.11) | | | | (3.82) | | | | (0.73) | | | | (0.28) | | | | (0.55) | |
| |
| | | | | |
Net asset value, end of period | | $ | 12.66 | | | $ | 11.17 | | | $ | 22.30 | | | $ | 22.59 | | | $ | 19.18 | |
| |
| | | | | |
Total Return | | | 14.55 | % | | | (36.37) | % | | | 1.92 | % | | | 19.55 | % | | | 18.87% | |
| | | | | |
Ratios and Supplemental Data | | | | | | | | | | | | | | | | | | | | |
Net assets, end of period (in 000s) | | $ | 327,497 | | | $ | 320,486 | | | $ | 615,541 | | | $ | 659,581 | | | $ | 567,054 | |
| | | | | |
Ratio of expenses to average net assets | | | | | | | | | | | | | | | | | | | | |
Before expense limitation | | | 1.44 | % | | | 1.42 | % | | | 1.28 | % | | | 1.29 | % | | | 1.23% | |
After expense limitation/ recoupment (b) | | | 1.44 | % | | | 1.42 | % | | | 1.28 | % | | | 1.29 | % | | | 1.23% | |
Ratio of net investment income/(loss) to average net assets | | | | | | | | | | | | | | | | | | | | |
Before expense limitation | | | 2.04 | % | | | 0.74 | % | | | 0.46 | % | | | 0.85 | % | | | 0.87% | |
After expense limitation/
recoupment | | | 2.04 | % | | | 0.74 | % | | | 0.46 | % | | | 0.85 | % | | | 0.87% | |
Portfolio turnover rate | | | 99 | % | | | 154 | % | | | 97 | % | | | 88 | % | | | 74% | |
| (a) | Calculated using the average shares method. |
| (b) | The Fund’s operating expenses, not including interest expense, are contractually limited to the amounts discussed in Note 3. The ratios in these financial highlights reflect the limitation, including the interest expense, when applicable. |
| | |
The accompanying notes are an integral part of the financial statements. |
| Annual Report | September 30, 2016 | | 59 |
| | |
| ICON Energy Fund | | Financial Highlights |
| | For a Share Outstanding Throughout the Years Presented |
| | | | | | | | | | | | | | | | | | | | |
| Class C | | Year Ended
September 30,
2016 | | | Year Ended
September 30,
2015 | | | Year Ended
September 30,
2014 | | | Year Ended
September 30,
2013 | | | Year Ended
September 30,
2012 | |
| |
Net asset value, beginning of period | | $ | 10.77 | | | $ | 21.74 | | | $ | 22.21 | | | $ | 18.87 | | | $ | 16.47 | |
| | | | | |
Income/(loss) from investment operations: | | | | | | | | | | | | | | | | | | | | |
Net investment income/(loss)(a) | | | 0.11 | | | | (0.04) | | | | (0.15) | | | | (0.05) | | | | (0.04) | |
Net realized and unrealized gains/(losses) on investments | | | 1.31 | | | | (7.20) | | | | 0.35 | | | | 3.48 | | | | 2.88 | |
| |
Total from investment operations | | | 1.42 | | | | (7.24) | | | | 0.20 | | | | 3.43 | | | | 2.84 | |
| |
| | | | | |
Less dividends and distributions: | | | | | | | | | | | | | | | | | | | | |
Dividends from net investment income | | | (0.05) | | | | – | | | | – | | | | (0.09) | | | | (0.04) | |
Distributions from net realized gains | | | – | | | | (3.73) | | | | (0.67) | | | | – | | | | (0.40) | |
| |
Total dividends and distributions | | | (0.05) | | | | (3.73) | | | | (0.67) | | | | (0.09) | | | | (0.44) | |
| |
| | | | | |
Net asset value, end of period | | $ | 12.14 | | | $ | 10.77 | | | $ | 21.74 | | | $ | 22.21 | | | $ | 18.87 | |
| |
| | | | | |
Total Return(b) | | | 13.31 | % | | | (36.99) | % | | | 0.83 | % | | | 18.30 | % | | | 17.50% | |
| | | | | |
Ratios and Supplemental Data | | | | | | | | | | | | | | | | | | | | |
Net assets, end of period (in 000s) | | $ | 10,124 | | | $ | 9,972 | | | $ | 17,170 | | | $ | 14,691 | | | $ | 8,257 | |
| | | | | |
Ratio of expenses to average net assets | | | | | | | | | | | | | | | | | | | | |
Before expense limitation | | | 2.49 | % | | | 2.43 | % | | | 2.38 | % | | | 2.35 | % | | | 2.36% | |
After expense limitation/ recoupment (c) | | | 2.49 | % | | | 2.43 | % | | | 2.38 | % | | | 2.35 | % | | | 2.36% | |
Ratio of net investment income/(loss) to average net assets | | | | | | | | | | | | | | | | | | | | |
Before expense limitation | | | 0.99 | % | | | (0.26) | % | | | (0.65) | % | | | (0.25) | % | | | (0.20)% | |
After expense limitation/ recoupment | | | 0.99 | % | | | (0.26) | % | | | (0.65) | % | | | (0.25) | % | | | (0.20)% | |
Portfolio turnover rate | | | 99 | % | | | 154 | % | | | 97 | % | | | 88 | % | | | 74% | |
| (a) | Calculated using the average shares method. |
| (b) | The total return calculation excludes any sales charges. |
| (c) | The Fund’s operating expenses, not including interest expense, are contractually limited to the amounts discussed in Note 3. The ratios in these financial highlights reflect the limitation, including the interest expense, when applicable. |
| | |
The accompanying notes are an integral part of the financial statements. |
| 60 | | www.iconfunds.com |
| | |
| ICON Energy Fund | | Financial Highlights |
| | For a Share Outstanding Throughout the Years Presented |
| | | | | | | | | | | | | | | | | | | | |
| Class A | | Year Ended
September 30,
2016 | | | Year Ended
September 30,
2015 | | | Year Ended
September 30,
2014 | | | Year Ended
September 30,
2013 | | | Year Ended
September 30,
2012 | |
| |
Net asset value, beginning of period | | $ | 11.11 | | | $ | 22.20 | | | $ | 22.50 | | | $ | 19.12 | | | $ | 16.59 | |
| | | | | |
Income/(loss) from investment operations: | | | | | | | | | | | | | | | | | | | | |
Net investment income/(loss)(a) | | | 0.21 | | | | 0.07 | | | | 0.04 | | | | 0.11 | | | | 0.11 | |
Net realized and unrealized gains/(losses) on investments | | | 1.35 | | | | (7.39) | | | | 0.35 | | | | 3.51 | | | | 2.91 | |
| |
Total from investment operations | | | 1.56 | | | | (7.32) | | | | 0.39 | | | | 3.62 | | | | 3.02 | |
| |
| | | | | |
Less dividends and distributions: | | | | | | | | | | | | | | | | | | | | |
Dividends from net investment income | | | (0.07) | | | | (0.04) | | | | (0.02) | | | | (0.24) | | | | (0.09) | |
Distributions from net realized gains | | | – | | | | (3.73) | | | | (0.67) | | | | – | | | | (0.40) | |
| |
Total dividends and distributions | | | (0.07) | | | | (3.77) | | | | (0.69) | | | | (0.24) | | | | (0.49) | |
| |
| | | | | |
Net asset value, end of period | | $ | 12.60 | | | $ | 11.11 | | | $ | 22.20 | | | $ | 22.50 | | | $ | 19.12 | |
| |
| | | | | |
Total Return(b) | | | 14.19 | % | | | (36.55) | % | | | 1.67 | % | | | 19.21 | % | | | 18.47% | |
| | | | | |
Ratios and Supplemental Data | | | | | | | | | | | | | | | | | | | | |
Net assets, end of period (in 000s) | | $ | 14,648 | | | $ | 14,588 | | | $ | 26,695 | | | $ | 26,170 | | | $ | 15,836 | |
| | | | | |
Ratio of expenses to average net assets | | | | | | | | | | | | | | | | | | | | |
Before expense limitation | | | 1.73 | % | | | 1.66 | % | | | 1.55 | % | | | 1.61 | % | | | 1.55% | |
After expense limitation/ recoupment (c) | | | 1.73 | % | | | 1.66 | % | | | 1.55 | % | | | 1.61 | % | | | 1.55% | |
Ratio of net investment income/(loss) to average net assets | | | | | | | | | | | | | | | | | | | | |
Before expense limitation | | | 1.77 | % | | | 0.50 | % | | | 0.19 | % | | | 0.51 | % | | | 0.61% | |
After expense limitation/ recoupment | | | 1.77 | % | | | 0.50 | % | | | 0.19 | % | | | 0.51 | % | | | 0.61% | |
Portfolio turnover rate | | | 99 | % | | | 154 | % | | | 97 | % | | | 88 | % | | | 74% | |
| (a) | Calculated using the average shares method. |
| (b) | The total return calculation excludes any sales charges. |
| (c) | The Fund’s operating expenses, not including interest expense, are contractually limited to the amounts discussed in Note 3. The ratios in these financial highlights reflect the limitation, including the interest expense, when applicable. |
| | |
The accompanying notes are an integral part of the financial statements. |
| Annual Report | September 30, 2016 | | 61 |
| | |
| ICON Financial Fund | | Financial Highlights |
| | For a Share Outstanding Throughout the Years Presented |
| | | | | | | | | | | | | | | | | | | | |
| Class S | | Year Ended
September 30,
2016 | | | Year Ended
September 30,
2015 | | | Year Ended
September 30,
2014 | | | Year Ended
September 30,
2013 | | | Year Ended
September 30,
2012 | |
| |
Net asset value, beginning of period | | $ | 7.74 | | | $ | 7.83 | | | $ | 7.47 | | | $ | 6.04 | | | $ | 4.69 | |
| | | | | |
Income/(loss) from investment operations: | | | | | | | | | | | | | | | | | | | | |
Net investment income/(loss)(a) | | | 0.08 | | | | 0.04 | | | | 0.00 | (b) | | | 0.04 | | | | 0.04 | |
Net realized and unrealized gains/(losses) on investments | | | (0.15) | | | | (0.08) | | | | 0.54 | | | | 1.44 | | | | 1.34 | |
| |
Total from investment operations | | | (0.07) | | | | (0.04) | | | | 0.54 | | | | 1.48 | | | | 1.38 | |
| |
| | | | | |
Less dividends and distributions: | | | | | | | | | | | | | | | | | | | | |
Dividends from net investment income | | | – | | | | (0.05) | | | | (0.18) | | | | (0.05) | | | | (0.03) | |
| |
Total dividends and distributions | | | – | | | | (0.05) | | | | (0.18) | | | | (0.05) | | | | (0.03) | |
| | | | | |
Net asset value, end of period | | $ | 7.67 | | | $ | 7.74 | | | $ | 7.83 | | | $ | 7.47 | | | $ | 6.04 | |
| |
| | | | | |
Total Return | | | (0.90) | % | | | (0.55) | % | | | 7.27 | % | | | 24.68 | % | | | 29.54% | |
| | | | | |
Ratios and Supplemental Data | | | | | | | | | | | | | | | | | | | | |
Net assets, end of period (in 000s) | | $ | 43,354 | | | $ | 49,106 | | | $ | 32,286 | | | $ | 11,853 | | | $ | 27,696 | |
| | | | | |
Ratio of expenses to average net assets | | | | | | | | | | | | | | | | | | | | |
Before expense limitation | | | 1.40 | % | | | 1.49 | % | | | 1.64 | % | | | 1.47 | % | | | 1.39% | |
After expense limitation/ recoupment (c) | | | 1.40 | % | | | 1.49 | % | | | 1.50 | % | | | 1.47 | % | | | 1.39% | |
Ratio of net investment income/(loss) to average net assets | | | | | | | | | | | | | | | | | | | | |
Before expense limitation | | | 1.00 | % | | | 0.52 | % | | | (0.20) | % | | | 0.65 | % | | | 0.70% | |
After expense limitation/ recoupment | | | 1.00 | % | | | 0.52 | % | | | (0.06) | % | | | 0.65 | % | | | 0.70% | |
Portfolio turnover rate | | | 49 | % | | | 51 | % | | | 79 | % | | | 95 | % | | | 95% | |
| (a) | Calculated using the average shares method. |
| (b) | Amount less than $0.005. |
| (c) | The Fund’s operating expenses, not including interest expense, are contractually limited to the amounts discussed in Note 3. The ratios in these financial highlights reflect the limitation, including the interest expense, when applicable. |
| | |
The accompanying notes are an integral part of the financial statements. |
| 62 | | www.iconfunds.com |
| | |
| ICON Financial Fund | | Financial Highlights |
| | For a Share Outstanding Throughout the Years Presented |
| | | | | | | | | | | | | | | | | | | | |
| Class A(a) | | Year Ended
September 30, 2016 | | | Year Ended
September 30, 2015 | | | Year Ended
September 30, 2014 | | | Year Ended
September 30, 2013 | | | Year Ended
September 30, 2012 | |
| |
Net asset value, beginning of period | | $ | 7.82 | | | $ | 7.89 | | | $ | 7.37 | | | $ | 5.99 | | | $ | 4.68 | |
| | | | | |
Income/(loss) from investment
operations: | | | | | | | | | | | | | | | | | | | | |
Net investment income/(loss)(b) | | | 0.05 | | | | 0.02 | | | | (0.02) | | | | 0.06 | | | | 0.01 | |
Net realized and unrealized
gains/(losses) on investments | | | (0.16) | | | | (0.07) | | | | 0.54 | | | | 1.38 | | | | 1.33 | |
| |
Total from investment operations | | | (0.11) | | | | (0.05) | | | | 0.52 | | | | 1.44 | | | | 1.34 | |
| |
| | | | | |
Less dividends and distributions: | | | | | | | | | | | | | | | | | | | | |
Dividends from net investment
income | | | – | | | | (0.02) | | | | – | | | | (0.06) | | | | (0.03) | |
| |
Total dividends and distributions | | | – | | | | (0.02) | | | | – | | | | (0.06) | | | | (0.03) | |
| |
| | | | | |
Net asset value, end of period | | $ | 7.71 | | | $ | 7.82 | | | $ | 7.89 | | | $ | 7.37 | | | $ | 5.99 | |
| |
| | | | | |
Total Return(c) | | | (1.41) | % | | | (0.69) | % | | | 7.20 | % | | | 24.20 | % | | | 28.83% | |
| | | | | |
Ratios and Supplemental Data | | | | | | | | | | | | | | | | | | | | |
Net assets, end of period (in 000s) | | $ | 2,542 | | | $ | 1,974 | | | $ | 541 | | | $ | 936 | | | $ | 9,278 | |
| | | | | |
Ratio of expenses to average net
assets | | | | | | | | | | | | | | | | | | | | |
Before expense limitation | | | 2.12 | % | | | 2.19 | % | | | 2.35 | % | | | 1.88 | % | | | 1.80% | |
After expense limitation/ recoupment (d) | | | 1.75 | % | | | 1.75 | % | | | 1.75 | % | | | 1.76 | % | | | 1.77% | |
Ratio of net investment
income/(loss) to average net
assets | | | | | | | | | | | | | | | | | | | | |
Before expense limitation | | | 0.26 | % | | | (0.15) | % | | | (0.86) | % | | | 0.82 | % | | | 0.09% | |
After expense limitation/
recoupment | | | 0.63 | % | | | 0.29 | % | | | (0.26) | % | | | 0.94 | % | | | 0.12% | |
Portfolio turnover rate | | | 49 | % | | | 51 | % | | | 79 | % | | | 95 | % | | | 95% | |
| (a) | Class C shares were merged into Class A on September 25, 2015. The amounts presented represent the results of the Class A shares for the periods prior to the merger and the results of the combined share class for the period subsequent to the merger. |
| (b) | Calculated using the average shares method. |
| (c) | The total return calculation excludes any sales charges. |
| (d) | The Fund’s operating expenses, not including interest expense, are contractually limited to the amounts discussed in Note 3. The ratios in these financial highlights reflect the limitation, including the interest expense, when applicable. |
| | |
The accompanying notes are an integral part of the financial statements. |
| Annual Report | September 30, 2016 | | 63 |
| | |
| ICON Healthcare Fund | | Financial Highlights |
| | For a Share Outstanding Throughout the Years Presented |
| | | | | | | | | | | | | | | | | | | | |
| Class S | | Year Ended
September 30,
2016 | | | Year Ended
September 30,
2015 | | | Year Ended
September 30,
2014 | | | Year Ended
September 30,
2013 | | | Year Ended
September 30,
2012 | |
| |
Net asset value, beginning of period | | $ | 17.83 | | | $ | 22.42 | | | $ | 22.17 | | | $ | 17.56 | | | $ | 13.56 | |
| | | | | |
Income/(loss) from investment operations: | | | | | | | | | | | | | | | | | | | | |
Net investment income/(loss)(a) | | | (0.04) | | | | (0.09) | | | | (0.11) | | | | 0.03 | | | | 0.17 | |
Net realized and unrealized
gains/(losses) on investments | | | 1.54 | | | | 1.02 | | | | 6.18 | | | | 4.75 | | | | 3.97 | |
| |
Total from investment operations | | | 1.50 | | | | 0.93 | | | | 6.07 | | | | 4.78 | | | | 4.14 | |
| |
| | | | | |
Less dividends and distributions: | | | | | | | | | | | | | | | | | | | | |
Dividends from net investment income | | | – | | | | – | | | | (0.03) | | | | (0.17) | | | | (0.14) | |
Distributions from net realized gains | | | (3.93) | | | | (5.52) | | | | (5.79) | | | | – | | | | – | |
| |
Total dividends and distributions | | | (3.93) | | | | (5.52) | | | | (5.82) | | | | (0.17) | | | | (0.14) | |
| |
| | | | | |
Net asset value, end of period | | $ | 15.40 | | | $ | 17.83 | | | $ | 22.42 | | | $ | 22.17 | | | $ | 17.56 | |
| |
| | | | | |
Total Return | | | 9.44 | % | | | 2.55 | % | | | 32.27 | % | | | 27.48 | % | | | 30.76% | |
| | | | | |
Ratios and Supplemental Data | | | | | | | | | | | | | | | | | | | | |
Net assets, end of period (in 000s) | | $ | 76,218 | | | $ | 95,109 | | | $ | 148,261 | | | $ | 92,171 | | | $ | 100,938 | |
| | | | | |
Ratio of expenses to average net assets | | | | | | | | | | | | | | | | | | | | |
Before expense limitation | | | 1.44 | % | | | 1.36 | % | | | 1.36 | % | | | 1.39 | % | | | 1.34% | |
After expense limitation/ recoupment (b) | | | 1.44 | % | | | 1.36 | % | | | 1.36 | % | | | 1.39 | % | | | 1.34% | |
Ratio of net investment income/(loss) to average net assets | | | | | | | | | | | | | | | | | | | | |
Before expense limitation | | | (0.26) | % | | | (0.45) | % | | | (0.53) | % | | | 0.13 | % | | | 1.08% | |
After expense limitation/ recoupment | | | (0.26) | % | | | (0.45) | % | | | (0.53) | % | | | 0.13 | % | | | 1.08% | |
Portfolio turnover rate | | | 107 | % | | | 141 | % | | | 188 | % | | | 112 | % | | | 48% | |
| (a) | Calculated using the average shares method. |
| (b) | The Fund’s operating expenses, not including interest expense, are contractually limited to the amounts discussed in Note 3. The ratios in these financial highlights reflect the limitation, including the interest expense, when applicable. |
| | |
The accompanying notes are an integral part of the financial statements. |
| 64 | | www.iconfunds.com |
| | |
| ICON Healthcare Fund | | Financial Highlights |
| | For a Share Outstanding Throughout the Years Presented |
| | | | | | | | | | | | | | | | | | | | |
| Class A(a) | | Year Ended
September 30,
2016 | | | Year Ended
September 30,
2015 | | | Year Ended
September 30,
2014 | | | Year Ended
September 30,
2013 | | | Year Ended
September 30,
2012 | |
| |
Net asset value, beginning of period | | $ | 17.37 | | | $ | 22.01 | | | $ | 21.92 | | | $ | 17.42 | | | $ | 13.53 | |
| | | | | |
Income/(loss) from investment operations: | | | | | | | | | | | | | | | | | | | | |
Net investment income/(loss)(b) | | | (0.09) | | | | (0.14) | | | | (0.14) | | | | (0.03) | | | | 0.11 | |
Net realized and unrealized
gains/(losses) on investments | | | 1.49 | | | | 1.02 | | | | 6.03 | | | | 4.69 | | | | 3.94 | |
| |
Total from investment operations | | | 1.40 | | | | 0.88 | | | | 5.89 | | | | 4.66 | | | | 4.05 | |
| |
| | | | | |
Less dividends and distributions: | | | | | | | | | | | | | | | | | | | | |
Dividends from net investment income | | | – | | | | – | | | | (0.01) | | | | (0.16) | | | | (0.16) | |
Distributions from net realized gains | | | (3.93) | | | | (5.52) | | | | (5.79) | | | | – | | | | – | |
| |
Total dividends and distributions | | | (3.93) | | | | (5.52) | | | | (5.80) | | | | (0.16) | | | | (0.16) | |
| |
| | | | | |
Net asset value, end of period | | $ | 14.84 | | | $ | 17.37 | | | $ | 22.01 | | | $ | 21.92 | | | $ | 17.42 | |
| |
| | | | | |
Total Return(c) | | | 9.03 | % | | | 2.33 | % | | | 31.72 | % | | | 26.95 | % | | | 30.19% | |
| | | | | |
Ratios and Supplemental Data | | | | | | | | | | | | | | | | | | | | |
Net assets, end of period (in 000s) | | $ | 4,921 | | | $ | 15,317 | | | $ | 10,878 | | | $ | 3,748 | | | $ | 390 | |
| | | | | |
Ratio of expenses to average net assets | | | | | | | | | | | | | | | | | | | | |
Before expense limitation | | | 1.79 | % | | | 1.62 | % | | | 1.62 | % | | | 1.69 | % | | | 2.89% | |
After expense limitation/recoupment (d) | | | 1.75 | % | | | 1.62 | % | | | 1.62 | % | | | 1.69 | % | | | 1.76% | |
Ratio of net investment income/(loss) to average net assets | | | | | | | | | | | | | | | | | | | | |
Before expense limitation | | | (0.63) | % | | | (0.69) | % | | | (0.66) | % | | | (0.15) | % | | | (0.46)% | |
After expense limitation/recoupment | | | (0.59) | % | | | (0.69) | % | | | (0.66) | % | | | (0.15) | % | | | 0.67% | |
Portfolio turnover rate | | | 107 | % | | | 141 | % | | | 188 | % | | | 112 | % | | | 48% | |
| (a) | Class C shares were merged into Class A on September 25, 2015. The amounts presented represent the results of the Class A shares for the periods prior to the merger and the results of the combined share class for the period subsequent to the merger. |
| (b) | Calculated using the average shares method. |
| (c) | The total return calculation excludes any sales charges. |
| (d) | The Fund’s operating expenses, not including interest expense, are contractually limited to the amounts discussed in Note 3. The ratios in these financial highlights reflect the limitation, including the interest expense, when applicable. |
| | |
The accompanying notes are an integral part of the financial statements. |
| Annual Report | September 30, 2016 | | 65 |
| | |
| ICON Industrials Fund | | Financial Highlights |
| | For a Share Outstanding Throughout the Years Presented |
| | | | | | | | | | | | | | | | | | | | |
| Class S | | Year Ended
September 30,
2016 | | | Year Ended
September 30,
2015 | | | Year Ended
September 30,
2014 | | | Year Ended
September 30,
2013 | | | Year Ended
September 30,
2012 | |
| |
Net asset value, beginning of period | | $ | 10.94 | | | $ | 11.67 | | | $ | 10.56 | | | $ | 8.26 | | | $ | 6.80 | |
| | | | | |
Income/(loss) from investment operations: | | | | | | | | | | | | | | | | | | | | |
Net investment income/(loss)(a) | | | (0.02) | | | | 0.01 | | | | 0.01 | | | | 0.06 | | | | 0.07 | |
Net realized and unrealized
gains/(losses) on investments | | | 1.34 | | | | (0.73) | | | | 1.16 | | | | 2.35 | | | | 1.48 | |
| |
Total from investment operations | | | 1.32 | | | | (0.72) | | | | 1.17 | | | | 2.41 | | | | 1.55 | |
| |
| | | | | |
Less dividends and distributions: | | | | | | | | | | | | | | | | | | | | |
Dividends from net investment income | | | – | | | | (0.01) | | | | (0.06) | | | | (0.11) | | | | (0.09) | |
| |
Total dividends and distributions | | | – | | | | (0.01) | | | | (0.06) | | | | (0.11) | | | | (0.09) | |
| |
| | | | | |
Net asset value, end of period | | $ | 12.26 | | | $ | 10.94 | | | $ | 11.67 | | | $ | 10.56 | | | $ | 8.26 | |
| |
| | | | | |
Total Return | | | 12.07 | % | | | (6.15) | % | | | 11.14 | % | | | 29.52 | % | | | 22.99% | |
| | | | | |
Ratios and Supplemental Data | | | | | | | | | | | | | | | | | | | | |
Net assets, end of period (in 000s) | | $ | 23,957 | | | $ | 14,251 | | | $ | 35,883 | | | $ | 34,409 | | | $ | 39,621 | |
| | | | | |
Ratio of expenses to average net assets | | | | | | | | | | | | | | | | | | | | |
Before expense limitation | | | 1.73 | % | | | 1.53 | % | | | 1.41 | % | | | 1.46 | % | | | 1.40% | |
After expense limitation/recoupment(b) | | | 1.50 | % | | | 1.50 | % | | | 1.41 | % | | | 1.46 | % | | | 1.40% | |
Ratio of net investment income/(loss) to average net assets | | | | | | | | | | | | | | | | | | | | |
Before expense limitation | | | (0.37) | % | | | 0.07 | % | | | 0.07 | % | | | 0.60 | % | | | 0.91% | |
After expense limitation/recoupment | | | (0.14) | % | | | 0.10 | % | | | 0.07 | % | | | 0.60 | % | | | 0.91% | |
Portfolio turnover rate | | | 87 | % | | | 23 | % | | | 30 | % | | | 46 | % | | | 34% | |
| (a) | Calculated using the average shares method. |
| (b) | The Fund’s operating expenses, not including interest expense, are contractually limited to the amounts discussed in Note 3. The ratios in these financial highlights reflect the limitation, including the interest expense, when applicable. |
| | |
The accompanying notes are an integral part of the financial statements. |
| 66 | | www.iconfunds.com |
| | |
| ICON Industrials Fund | | Financial Highlights |
| | For a Share Outstanding Throughout the Years Presented |
| | | | | | | | | | | | | | | | | | | | | | | | |
| Class A(a) | | Year Ended
September 30,
2016 | | | Year Ended
September 30,
2015 | | | Year Ended
September 30,
2014 | | | Year Ended
September 30,
2013 | | | Year Ended
September 30,
2012 | | | | |
| |
Net asset value, beginning of period | | $ | 10.86 | | | $ | 11.58 | | | $ | 10.45 | | | $ | 8.10 | | | $ | 6.76 | | | | | |
| | | | | | |
Income/(loss) from investment
operations: | | | | | | | | | | | | | | | | | | | | | | | | |
Net investment income/(loss)(b) | | | (0.04) | | | | (0.02) | | | | (0.03) | | | | 0.00 | (c) | | | 0.08 | | | | | |
Net realized and unrealized
gains/(losses) on investments | | | 1.32 | | | | (0.70) | | | | 1.16 | | | | 2.36 | | | | 1.35 | | | | | |
| |
Total from investment operations | | | 1.28 | | | | (0.72) | | | | 1.13 | | | | 2.36 | | | | 1.43 | | | | | |
| |
| | | | | | |
Less dividends and distributions: | | | | | | | | | | | | | | | | | | | | | | | | |
Dividends from net investment
income | | | – | | | | – | | | | – | | | | (0.01) | | | | (0.09) | | | | | |
| |
Total dividends and distributions | | | – | | | | – | | | | – | | | | (0.01) | | | | (0.09) | | | | | |
| |
| | | | | | |
Net asset value, end of period | | $ | 12.14 | | | $ | 10.86 | | | $ | 11.58 | | | $ | 10.45 | | | $ | 8.10 | | | | | |
| |
| | | | | | |
Total Return(d) | | | 11.79 | % | | | (6.22) | % | | | 10.81 | % | | | 29.20 | % | | | 21.21 | % | | | | |
| | | | | | |
Ratios and Supplemental Data | | | | | | | | | | | | | | | | | | | | | | | | |
Net assets, end of period (in 000s) | | $ | 998 | | | $ | 596 | | | $ | 298 | | | $ | 4,322 | | | $ | 163 | | | | | |
| | | | | | |
Ratio of expenses to average net assets | | | | | | | | | | | | | | | | | | | | | | | | |
Before expense limitation | | | 2.96 | % | | | 2.67 | % | | | 2.02 | % | | | 2.09 | % | | | 2.50 | % | | | | |
After expense limitation/
recoupment(e) | | | 1.75 | % | | | 1.75 | % | | | 1.75 | % | | | 1.75 | % | | | 1.75 | % | | | | |
Ratio of net investment
income/(loss) to average net assets | | | | | | | | | | | | | | | | | | | | | | | | |
Before expense limitation | | | (1.59) | % | | | (1.11) | % | | | (0.56) | % | | | (0.32) | % | | | 0.18 | % | | | | |
After expense limitation/
recoupment | | | (0.38) | % | | | (0.19) | % | | | (0.29) | % | | | 0.02 | % | | | 0.93 | % | | | | |
Portfolio turnover rate | | | 87 | % | | | 23 | % | | | 30 | % | | | 46 | % | | | 34 | % | | | | |
| (a) | Class C shares were merged into Class A on September 25, 2015. The amounts presented represent the results of the Class A shares for the periods prior to the merger and the results of the combined share class for the period subsequent to the merger. |
| (b) | Calculated using the average shares method. |
| (c) | Amount less than $0.005. |
| (d) | The total return calculation excludes any sales charges. |
| (e) | The Fund’s operating expenses, not including interest expense, are contractually limited to the amounts discussed in Note 3. The ratios in these financial highlights reflect the limitation, including the interest expense, when applicable. |
| | |
The accompanying notes are an integral part of the financial statements. |
| Annual Report | September 30, 2016 | | 67 |
| | |
| ICON Information Technology Fund | | Financial Highlights |
| | For a Share Outstanding Throughout the Years Presented |
| | | | | | | | | | | | | | | | | | | | | | | | |
| Class S | | Year Ended
September 30,
2016 | | | Year Ended
September 30,
2015 | | | Year Ended
September 30,
2014 | | | Year Ended
September 30,
2013 | | | Year Ended
September 30,
2012 | | | | |
| |
Net asset value, beginning of period | | $ | 14.95 | | | $ | 13.55 | | | $ | 11.44 | | | $ | 10.72 | | | $ | 8.22 | | | | | |
| | | | | | |
Income/(loss) from investment
operations: | | | | | | | | | | | | | | | | | | | | | | | | |
Net investment income/(loss)(a) | | | (0.07) | | | | (0.09) | | | | (0.07) | | | | (0.02) | | | | (0.02) | | | | | |
Net realized and unrealized
gains/(losses) on investments | | | 3.08 | | | | 1.49 | | | | 2.18 | | | | 0.74 | | | | 2.52 | | | | | |
| |
Total from investment operations | | | 3.01 | | | | 1.40 | | | | 2.11 | | | | 0.72 | | | | 2.50 | | | | | |
| |
| | | | | | |
Net asset value, end of period | | $ | 17.96 | | | $ | 14.95 | | | $ | 13.55 | | | $ | 11.44 | | | $ | 10.72 | | | | | |
| |
| | | | | | |
Total Return | | | 20.13 | % | | | 10.33 | % | | | 18.44 | % | | | 6.72 | % | | | 30.41 | % | | | | |
| | | | | | |
Ratios and Supplemental Data | | | | | | | | | | | | | | | | | | | | | | | | |
Net assets, end of period (in 000s) | | $ | 48,953 | | | $ | 45,343 | | | $ | 50,363 | | | $ | 73,851 | | | $ | 83,330 | | | | | |
| | | | | | |
Ratio of expenses to average net assets | | | | | | | | | | | | | | | | | | | | | | | | |
Before expense limitation | | | 1.49 | % | | | 1.44 | % | | | 1.40 | % | | | 1.38 | % | | | 1.34 | % | | | | |
After expense limitation/ recoupment (b) | | | 1.49 | % | | | 1.44 | % | | | 1.40 | % | | | 1.38 | % | | | 1.34 | % | | | | |
Ratio of net investment
income/(loss) to average net assets | | | | | | | | | | | | | | | | | | | | | | | | |
Before expense limitation | | | (0.46) | % | | | (0.62) | % | | | (0.56) | % | | | (0.22) | % | | | (0.20) | % | | | | |
After expense limitation/ recoupment | | | (0.46) | % | | | (0.62) | % | | | (0.56) | % | | | (0.22) | % | | | (0.20) | % | | | | |
Portfolio turnover rate | | | 94 | % | | | 43 | % | | | 48 | % | | | 52 | % | | | 35 | % | | | | |
| (a) | Calculated using the average shares method. |
| (b) | The Fund’s operating expenses, not including interest expense, are contractually limited to the amounts discussed in Note 3. The ratios in these financial highlights reflect the limitation, including the interest expense, when applicable. |
| | |
The accompanying notes are an integral part of the financial statements. |
| 68 | | www.iconfunds.com |
| | |
| ICON Information Technology Fund | | Financial Highlights |
| | For a Share Outstanding Throughout the Years Presented |
| | | | | | | | | | | | | | | | | | | | | | | | |
| Class A(a) | | Year Ended
September 30,
2016 | | | Year Ended
September 30,
2015 | | | Year Ended
September 30,
2014 | | | Year Ended
September 30,
2013 | | | Year Ended
September 30,
2012 | | | | |
| |
Net asset value, beginning of period | | $ | 14.65 | | | $ | 13.32 | | | $ | 11.30 | | | $ | 10.65 | | | $ | 8.20 | | | | | |
| | | | | | |
Income/(loss) from investment
operations: | | | | | | | | | | | | | | | | | | | | | | | | |
Net investment income/(loss)(b) | | | (0.11) | | | | (0.14) | | | | (0.11) | | | | (0.05) | | | | (0.06) | | | | | |
Net realized and unrealized
gains/(losses) on investments | | | 3.01 | | | | 1.47 | | | | 2.13 | | | | 0.70 | | | | 2.51 | | | | | |
| |
Total from investment operations | | | 2.90 | | | | 1.33 | | | | 2.02 | | | | 0.65 | | | | 2.45 | | | | | |
| |
| | | | | | |
Net asset value, end of period | | $ | 17.55 | | | $ | 14.65 | | | $ | 13.32 | | | $ | 11.30 | | | $ | 10.65 | | | | | |
| |
| | | | | | |
Total Return(c) | | | 19.80 | % | | | 9.99 | % | | | 17.88 | % | | | 6.10 | % | | | 29.88 | % | | | | |
| | | | | | |
Ratios and Supplemental Data | | | | | | | | | | | | | | | | | | | | | | | | |
Net assets, end of period (in 000s) | | $ | 2,631 | | | $ | 3,170 | | | $ | 455 | | | $ | 2,330 | | | $ | 1,400 | | | | | |
| | | | | | |
Ratio of expenses to average net assets | | | | | | | | | | | | | | | | | | | | | | | | |
Before expense limitation | | | 2.17 | % | | | 1.90 | % | | | 1.94 | % | | | 2.23 | % | | | 2.87 | % | | | | |
After expense limitation/
recoupment (d) | | | 1.75 | % | | | 1.75 | % | | | 1.75 | % | | | 1.75 | % | | | 1.75 | % | | | | |
Ratio of net investment
income/(loss) to average net assets | | | | | | | | | | | | | | | | | | | | | | | | |
Before expense limitation | | | (1.12) | % | | | (1.07) | % | | | (1.10) | % | | | (0.94) | % | | | (1.71) | % | | | | |
After expense limitation/
recoupment | | | (0.70) | % | | | (0.92) | % | | | (0.91) | % | | | (0.45) | % | | | (0.59) | % | | | | |
Portfolio turnover rate | | | 94 | % | | | 43 | % | | | 48 | % | | | 52 | % | | | 35 | % | | | | |
| (a) | Class C shares were merged into Class A on September 25, 2015. The amounts presented represent the results of the Class A shares for the periods prior to the merger and the results of the combined share class for the period subsequent to the merger. |
| (b) | Calculated using the average shares method. |
| (c) | The total return calculation excludes any sales charges. |
| (d) | The Fund’s operating expenses, not including interest expense, are contractually limited to the amounts discussed in Note 3. The ratios in these financial highlights reflect the limitation, including the interest expense, when applicable. |
| | |
The accompanying notes are an integral part of the financial statements. |
| Annual Report | September 30, 2016 | | 69 |
| | |
| ICON Natural Resources Fund | | Financial Highlights |
| | For a Share Outstanding Throughout the Years Presented |
| | | | | | | | | | | | | | | | | | | | | | | | |
| Class S | | Year Ended
September 30,
2016 (a) | | | Year Ended
September 30,
2015 | | | Year Ended
September 30,
2014 | | | Year Ended
September 30,
2013 | | | Year Ended
September 30,
2012 | | | | |
| |
Net asset value, beginning of period | | $ | 11.86 | | | $ | 15.09 | | | $ | 13.43 | | | $ | 11.12 | | | $ | 9.00 | | | | | |
| | | | | | |
Income/(loss) from investment
operations: | | | | | | | | | | | | | | | | | | | | | | | | |
Net investment income/(loss)(b) | | | 0.10 | | | | 0.04 | | | | 0.04 | | | | 0.09 | | | | 0.11 | | | | | |
Net realized and unrealized
gains/(losses) on investments | | | 1.80 | | | | (3.23) | | | | 1.68 | | | | 2.40 | | | | 2.11 | | | | | |
| |
Total from investment operations | | | 1.90 | | | | (3.19) | | | | 1.72 | | | | 2.49 | | | | 2.22 | | | | | |
| |
| | | | | | |
Less dividends and distributions: | | | | | | | | | | | | | | | | | | | | | | | | |
Dividends from net investment
income | | | (0.06) | | | | (0.04) | | | | (0.06) | | | | (0.18) | | | | (0.10) | | | | | |
Distributions from net realized
gains | | | (0.88) | | | | – | | | | – | | | | – | | | | – | | | | | |
| |
Total dividends and distributions | | | (0.94) | | | | (0.04) | | | | (0.06) | | | | (0.18) | | | | (0.10) | | | | | |
| |
| | | | | | |
Net asset value, end of period | | $ | 12.82 | | | $ | 11.86 | | | $ | 15.09 | | | $ | 13.43 | | | $ | 11.12 | | | | | |
| |
| | | | | | |
Total Return | | | 17.24 | % | | | (21.22) | % | | | 12.85 | % | | | 22.73 | % | | | 24.85 | % | | | | |
| | | | | | |
Ratios and Supplemental Data | | | | | | | | | | | | | | | | | | | | | | | | |
Net assets, end of period
(in 000s) | | $ | 65,787 | | | $ | 60,404 | | | $ | 93,610 | | | $ | 65,782 | | | $ | 41,627 | | | | | |
| | | | | | |
Ratio of expenses to average net assets | | | | | | | | | | | | | | | | | | | | | | | | |
Before expense limitation | | | 1.59 | % | | | 1.42 | % | | | 1.36 | % | | | 1.45 | % | | | 1.39 | % | | | | |
After expense limitation/
recoupment (c) | | | 1.50 | % | | | 1.42 | % | | | 1.36 | % | | | 1.45 | % | | | 1.39 | % | | | | |
Ratio of net investment
income/(loss) to average net assets | | | | | | | | | | | | | | | | | | | | | | | | |
Before expense limitation | | | 0.70 | % | | | 0.27 | % | | | 0.26 | % | | | 0.72 | % | | | 1.00 | % | | | | |
After expense limitation/
recoupment | | | 0.79 | % | | | 0.27 | % | | | 0.26 | % | | | 0.72 | % | | | 1.00 | % | | | | |
Portfolio turnover rate | | | 81 | % | | | 48 | % | | | 33 | % | | | 56 | % | | | 41 | % | | | | |
| (a) | Prior to January 22, 2016, the ICON Natural Resources Fund was known as the ICON Materials Fund. |
| (b) | Calculated using the average shares method. |
| (c) | The Fund’s operating expenses, not including interest expense, are contractually limited to the amounts discussed in Note 3. The ratios in these financial highlights reflect the limitation, including the interest expense, when applicable. |
| | |
The accompanying notes are an integral part of the financial statements. |
| 70 | | www.iconfunds.com |
| | |
| ICON Natural Resources Fund | | Financial Highlights |
| | For a Share Outstanding Throughout the Years Presented |
| | | | | | | | | | | | | | | | | | | | |
| Class C | | Year Ended
September 30,
2016 (a) | | | Year Ended
September 30,
2015 | | | Year Ended
September 30,
2014 | | | Year Ended
September 30,
2013 | | | Year Ended
September 30,
2012 | |
| |
Net asset value, beginning of period | | $ | 11.51 | | | $ | 14.77 | | | $ | 13.24 | | | $ | 10.94 | | | $ | 8.92 | |
| | | | | |
Income/(loss) from investment operations: | | | | | | | | | | | | | | | | | | | | |
Net investment income/(loss)(b) | | | (0.03) (c | ) | | | (0.11) | | | | (0.12) | | | | (0.04) | | | | 0.00 (d | ) |
Net realized and unrealized | | | 1.76 | | | | | | | | | | | | | | | | | |
gains/(losses) on investments | | | | | | | (3.15) | | | | 1.65 | | | | 2.38 | | | | 2.08 | |
| |
Total from investment operations | | | 1.73 | | | | (3.26) | | | | 1.53 | | | | 2.34 | | | | 2.08 | |
| |
| | | | | |
Less dividends and distributions: | | | | | | | | | | | | | | | | | | | | |
Dividends from net investment income | | | – | | | | – | | | | – | | | | (0.04) | | | | (0.06) | |
Distributions from net realized gains | | | (0.88) | | | | – | | | | – | | | | – | | | | – | |
| |
Total dividends and distributions | | | (0.88) | | | | – | | | | – | | | | (0.04) | | | | (0.06) | |
| |
| | | | | |
Net asset value, end of period | | $ | 12.36 | | | $ | 11.51 | | | $ | 14.77 | | | $ | 13.24 | | | $ | 10.94 | |
| |
| | | | | |
Total Return(e) | | | 16.11% | | | | (22.07)% | | | | 11.56% | | | | 21.43% | | | | 23.36% | |
| | | | | |
Ratios and Supplemental Data | | | | | | | | | | | | | | | | | | | | |
Net assets, end of period (in 000s) | | $ | 1,435 | | | $ | 834 | | | $ | 675 | | | $ | 218 | | | $ | 195 | |
| | | | | |
Ratio of expenses to average net assets | | | | | | | | | | | | | | | | | | | | |
Before expense limitation | | | 3.01% | | | | 2.94% | | | | 4.17% | | | | 4.12% | | | | 4.29% | |
After expense limitation/ | | | | | | | | | | | | | | | | | | | | |
recoupment (f) | | | 2.51% | | | | 2.50% | | | | 2.50% | | | | 2.50% | | | | 2.51% | |
Ratio of net investment income/(loss) to average net assets | | | | | | | | | | | | | | | | | | | | |
Before expense limitation | | | (0.73)% | | | | (1.22)% | | | | (2.51)% | | | | (1.95)% | | | | (1.82)% | |
After expense limitation/ recoupment | | | (0.23)% | | | | (0.78)% | | | | (0.84)% | | | | (0.33)% | | | | (0.04)% | |
Portfolio turnover rate | | | 81% | | | | 48% | | | | 33% | | | | 56% | | | | 41% | |
| (a) | Prior to January 22, 2016, the ICON Natural Resources Fund was known as the ICON Materials Fund. |
| (b) | Calculated using the average shares method. |
| (c) | The per share amount does not correspond to activity reflected in the Statement of Operations due to class specific expenses during the period. |
| (d) | Amount less than $0.005. |
| (e) | The total return calculation excludes any sales charges. |
| (f) | The Fund’s operating expenses, not including interest expense, are contractually limited to the amounts discussed in Note 3. The ratios in these financial highlights reflect the limitation, including the interest expense, when applicable. |
| | |
The accompanying notes are an integral part of the financial statements. |
| Annual Report | September 30, 2016 | | 71 |
| | |
| ICON Natural Resources Fund | | Financial Highlights |
| | For a Share Outstanding Throughout the Years Presented |
| | | | | | | | | | | | | | | | | | | | |
| Class A | | Year Ended
September 30,
2016 (a) | | | Year Ended
September 30,
2015 | | | Year Ended
September 30,
2014 | | | Year Ended
September 30,
2013 | | | Year Ended
September 30,
2012 | |
| |
Net asset value, beginning of period | | $ | 11.75 | | | $ | 14.96 | | | $ | 13.36 | | | $ | 11.07 | | | $ | 8.97 | |
| | | | | |
Income/(loss) from investment operations: | | | | | | | | | | | | | | | | | | | | |
Net investment income/(loss)(b) | | | 0.06 | | | | (0.01) | | | | (0.01) | | | | 0.05 | | | | 0.08 | |
Net realized and unrealized gains/(losses) on investments | | | 1.81 | | | | (3.20) | | | | 1.67 | | | | 2.38 | | | | 2.10 | |
| |
Total from investment operations | | | 1.87 | | | | (3.21) | | | | 1.66 | | | | 2.43 | | | | 2.18 | |
| |
| | | | | |
Less dividends and distributions: | | | | | | | | | | | | | | | | | | | | |
Dividends from net investment income | | | (0.01) | | | | – | | | | (0.06) | | | | (0.14) | | | | (0.08) | |
Distributions from net realized gains | | | (0.88) | | | | – | | | | – | | | | – | | | | – | |
| |
Total dividends and distributions | | | (0.89) | | | | – | | | | (0.06) | | | | (0.14) | | | | (0.08) | |
| |
| | | | | |
Net asset value, end of period | | $ | 12.73 | | | $ | 11.75 | | | $ | 14.96 | | | $ | 13.36 | | | $ | 11.07 | |
| |
| | | | | |
Total Return(c) | | | 17.05 | % | | | (21.46) | % | | | 12.47 | % | | | 22.24 | % | | | 24.44% | |
| | | | | |
Ratios and Supplemental Data | | | | | | | | | | | | | | | | | | | | |
Net assets, end of period (in 000s) | | $ | 4,451 | | | $ | 3,078 | | | $ | 8,229 | | | $ | 1,883 | | | $ | 539 | |
| | | | | |
Ratio of expenses to average net assets | | | | | | | | | | | | | | | | | | | | |
Before expense limitation | | | 2.02 | % | | | 1.76 | % | | | 1.72 | % | | | 2.02 | % | | | 2.12% | |
After expense limitation/ recoupment (d) | | | 1.75 | % | | | 1.75 | % | | | 1.72 | % | | | 1.75 | % | | | 1.76% | |
| | | | | |
Ratio of net investment income/(loss) to average net assets | | | | | | | | | | | | | | | | | | | | |
Before expense limitation | | | 0.24 | % | | | (0.06) | % | | | (0.07) | % | | | 0.17 | % | | | 0.34% | |
After expense limitation/ recoupment | | | 0.51 | % | | | (0.05) | % | | | (0.07) | % | | | 0.44 | % | | | 0.70% | |
| | | | | |
Portfolio turnover rate | | | 81 | % | | | 48 | % | | | 33 | % | | | 56 | % | | | 41% | |
| (a) | Prior to January 22, 2016, the ICON Natural Resources Fund was known as the ICON Materials Fund. |
| (b) | Calculated using the average shares method. |
| (c) | The total return calculation excludes any sales charges. |
| (d) | The Fund’s operating expenses, not including interest expense, are contractually limited to the amounts discussed in Note 3. The ratios in these financial highlights reflect the limitation, including the interest expense, when applicable. |
| | |
The accompanying notes are an integral part of the financial statements. |
| 72 | | www.iconfunds.com |
| | |
| ICON Utilities Fund | | Financial Highlights |
| | For a Share Outstanding Throughout the Years Presented |
| | | | | | | | | | | | | | | | | | | | |
| Class S | | Year Ended
September 30,
2016 | | | Year Ended
September 30,
2015 | | | Year Ended
September 30,
2014 | | | Year Ended
September 30,
2013 | | | Year Ended
September 30,
2012 | |
| |
Net asset value, beginning of period | | $ | 8.03 | | | $ | 7.90 | | | $ | 7.22 | | | $ | 6.81 | | | $ | 6.29 | |
| | | | | |
Income/(loss) from investment operations: | | | | | | | | | | | | | | | | | | | | |
Net investment income/(loss)(a) | | | 0.30 | | | | 0.28 | | | | 0.22 | | | | 0.20 | | | | 0.20 | |
Net realized and unrealized gains/(losses) on investments | | | 1.43 | | | | 0.11 | | | | 0.69 | | | | 0.43 | | | | 0.55 | |
| |
Total from investment operations | | | 1.73 | | | | 0.39 | | | | 0.91 | | | | 0.63 | | | | 0.75 | |
| |
| | | | | |
Less dividends and distributions: | | | | | | | | | | | | | | | | | | | | |
Dividends from net investment income | | | (0.27) | | | | (0.26) | | | | (0.23) | | | | (0.22) | | | | (0.23) | |
| |
Total dividends and distributions | | | (0.27) | | | | (0.26) | | | | (0.23) | | | | (0.22) | | | | (0.23) | |
| |
| | | | | |
Net asset value, end of period | | $ | 9.49 | | | $ | 8.03 | | | $ | 7.90 | | | $ | 7.22 | | | $ | 6.81 | |
| |
| | | | | |
Total Return | | | 21.74 | % | | | 4.93 | % | | | 12.69 | % | | | 9.25 | % | | | 12.01% | |
| | | | | |
Ratios and Supplemental Data | | | | | | | | | | | | | | | | | | | | |
Net assets, end of period (in 000s) | | $ | 43,864 | | | $ | 19,107 | | | $ | 17,920 | | | $ | 29,117 | | | $ | 23,524 | |
| | | | | |
Ratio of expenses to average net assets | | | | | | | | | | | | | | | | | | | | |
Before expense limitation | | | 1.59 | % | | | 1.70 | % | | | 1.52 | % | | | 1.62 | % | | | 1.53% | |
After expense limitation/ recoupment (b) | | | 1.50 | % | | | 1.50 | % | | | 1.50 | % | | | 1.51 | % | | | 1.51% | |
| | | | | |
Ratio of net investment income/(loss) to average net assets | | | | | | | | | | | | | | | | | | | | |
Before expense limitation | | | 3.15 | % | | | 3.12 | % | | | 2.84 | % | | | 2.71 | % | | | 3.00% | |
After expense limitation/ recoupment | | | 3.24 | % | | | 3.32 | % | | | 2.86 | % | | | 2.81 | % | | | 3.02% | |
| | | | | |
Portfolio turnover rate | | | 168 | % | | | 243 | % | | | 107 | % | | | 121 | % | | | 51% | |
| (a) | Calculated using the average shares method. |
| (b) | The Fund’s operating expenses, not including interest expense, are contractually limited to the amounts discussed in Note 3. The ratios in these financial highlights reflect the limitation, including the interest expense, when applicable. |
| | |
The accompanying notes are an integral part of the financial statements. |
| Annual Report | September 30, 2016 | | 73 |
| | |
| ICON Utilities Fund | | Financial Highlights |
| | For a Share Outstanding Throughout the Years Presented |
| | | | | | | | | | | | | | | | | | | | |
| Class A(a) | | Year Ended
September 30,
2016 | | | Year Ended
September 30,
2015 | | | Year Ended
September 30,
2014 | | | Year Ended
September 30,
2013 | | | Year Ended
September 30,
2012 | |
| |
Net asset value, beginning of period | | $ | 7.92 | | | $ | 7.81 | | | $ | 7.14 | | | $ | 6.73 | | | $ | 6.24 | |
| | | | | |
Income/(loss) from investment operations: | | | | | | | | | | | | | | | | | | | | |
Net investment income/(loss)(b) | | | 0.28 | | | | 0.26 | | | | 0.21 | | | | 0.18 | | | | 0.20 | |
Net realized and unrealized gains/(losses) on investments | | | 1.40 | | | | 0.11 | | | | 0.68 | | | | 0.42 | | | | 0.53 | |
| |
Total from investment operations | | | 1.68 | | | | 0.37 | | | | 0.89 | | | | 0.60 | | | | 0.73 | |
| |
| | | | | |
Less dividends and distributions: | | | | | | | | | | | | | | | | | | | | |
Dividends from net investment income | | | (0.25) | | | | (0.26) | | | | (0.22) | | | | (0.19) | | | | (0.24) | |
| |
Total dividends and distributions | | | (0.25) | | | | (0.26) | | | | (0.22) | | | | (0.19) | | | | (0.24) | |
| |
| | | | | |
Net asset value, end of period | | $ | 9.35 | | | $ | 7.92 | | | $ | 7.81 | | | $ | 7.14 | | | $ | 6.73 | |
| |
| | | | | |
Total Return(c) | | | 21.29 | % | | | 4.63 | % | | | 12.44 | % | | | 8.96 | % | | | 11.81% | |
| | | | | |
Ratios and Supplemental Data | | | | | | | | | | | | | | | | | | | | |
Net assets, end of period (in 000s) | | $ | 15,868 | | | $ | 5,679 | | | $ | 2,517 | | | $ | 2,402 | | | $ | 7,113 | |
| | | | | |
Ratio of expenses to average net assets | | | | | | | | | | | | | | | | | | | | |
Before expense limitation | | | 1.79 | % | | | 1.89 | % | | | 1.81 | % | | | 1.74 | % | | | 1.70% | |
After expense limitation/ recoupment (d) | | | 1.75 | % | | | 1.75 | % | | | 1.75 | % | | | 1.74 | % | | | 1.70% | |
Ratio of net investment income/(loss) to average net assets | | | | | | | | | | | | | | | | | | | | |
Before expense limitation | | | 3.10 | % | | | 3.04 | % | | | 2.69 | % | | | 2.55 | % | | | 3.03% | |
After expense limitation/ recoupment | | | 3.14 | % | | | 3.18 | % | | | 2.75 | % | | | 2.55 | % | | | 3.03% | |
Portfolio turnover rate | | | 168 | % | | | 243 | % | | | 107 | % | | | 121 | % | | | 51% | |
| (a) | Class C shares were merged into Class A on September 25, 2015. The amounts presented represent the results of the Class A shares for the (b) periods prior to the merger and the results of the combined share class for the period subsequent to the merger. |
| (b) | Calculated using the average shares method. |
| (c) | The total return calculation excludes any sales charges. |
| (d) | The Fund’s operating expenses, not including interest expense, are contractually limited to the amounts discussed in Note 3. The ratios in these financial highlights reflect the limitation, including the interest expense, when applicable. |
| | |
The accompanying notes are an integral part of the financial statements. |
| 74 | | www.iconfunds.com |
| | |
| ICON Sector Funds | | Notes to Financial Statements |
| | September 30, 2016 |
1. ORGANIZATION
The ICON Consumer Discretionary Fund (“Consumer Discretionary Fund”), ICON Consumer Staples Fund (“Consumer Staples Fund”), ICON Energy Fund (“Energy Fund”), ICON Financial Fund (“Financial Fund”), ICON Healthcare Fund (“Healthcare Fund”), ICON Industrials Fund (“Industrials Fund”), ICON Information Technology Fund (“Information Technology Fund”), ICON Natural Resources Fund (formerly ICON Materials Fund) (“Natural Resources Fund”) and ICON Utilities Fund (“Utilities Fund”) are series funds (individually a “Fund” and collectively, the “Funds”). The Funds are part of the ICON Funds (the “Trust”), a Massachusetts business trust registered under the Investment Company Act of 1940, as amended (the “1940 Act”) as an open-end non-diversified investment management company. Each Fund offers two classes of shares: Class A and Class S. The Energy Fund and the Natural Resources Fund also offer a Class C share. On September 25, 2015, the Class C shares of the Consumer Discretionary Fund, Consumer Staples Fund, Financial Fund, Healthcare Fund, Industrials Fund, Information Technology Fund, and Utilities Fund were merged into the respective Class A shares of the Fund. The Class C shares of each of the Funds noted above were closed. The merger activity is shown in the Statements of Changes in Net Assets. All classes have equal rights as to earnings, assets, and voting privileges except that each Class may bear different distribution fees, registration costs, legal costs, mailing and printing costs and shareholder servicing costs and each Class has exclusive voting rights with respect to its distribution plan. There are currently eight other active Funds within the Trust. Those Funds are covered by separate prospectuses and shareholder reports.
Each Fund is authorized to issue an unlimited number of no par shares. The Funds invest primarily in securities of companies whose principal business activities fall within specific sectors and industries. The investment objective of each Fund is to provide long-term capital appreciation.
The Funds, like all investments in securities, have elements of risk, including risk of loss of principal. There is no assurance that the Funds will achieve their investment objectives and may underperform funds with similar investment objectives. An investment concentrated in sectors and industries involves greater risk and volatility than a more diversified investment. Investments in foreign securities and currency transactions may involve certain considerations and risks not typically associated with those of U.S. dollar-denominated transactions as a result of, among other factors, the possibility of lower government supervision and regulation of foreign securities markets and the possibility of political or economic instability. Financial statements of foreign companies are governed by different accounting, auditing, and financial standards than U.S. companies and may be less transparent and uniform than in the United States. Many corporate governance standards, which help ensure the integrity of public information in the United States, may not exist in some foreign countries. In general, there may be less governmental supervision of foreign stock exchanges and securities brokers and issuers. There are also risks associated with small-and mid-cap investing, including limited product lines, less liquidity and small market share.
The Energy Fund has a significant weighting in the Oil & Gas Exploration & Production industry and the Integrated Oil & Gas industry, the Healthcare Fund has a significant weighting in the Pharmaceuticals industry and the Biotechnology industry and the Utilities Fund has a significant weighting in the Electric Utilities industry and the Multi-Utilities industry which may cause the Funds’ performance to be susceptible to the economic, business and/or other developments that may affect those industries.
In the normal course of business, the Funds may enter into various agreements that provide for general indemnifications. Each Fund’s maximum exposure under these arrangements is unknown as any potential exposure involving future claims that may be made against each Fund is unknown. However, based on experience, the Funds expect the risk of loss to be remote.
2. SIGNIFICANT ACCOUNTING POLICIES
The following is a summary of significant accounting policies consistently followed by the Funds in the preparation of their financial statements. The preparation of financial statements in conformity with accounting principles generally accepted in the United States of America (“GAAP”) requires management to make certain estimates and assumptions that affect the reported amounts of assets and liabilities, disclosure of contingent assets and liabilities at the date of the financial statements, and the reported amounts of income and expenses during the reporting period. Actual results may differ from these estimates. Each Fund is considered an investment company under GAAP and follows the accounting and reporting guidance applicable to investment companies in the Financial Accounting Standards Board Accounting Standards Codification Topic 946.
Investment Valuation
The Funds’ securities and other assets, excluding options on securities indexes, are valued at the closing price as of the close of regular trading on the New York Stock Exchange (the “NYSE”) (normally 4 p.m. Eastern Standard Time) each day the NYSE is open, except that securities traded primarily on the NASDAQ Stock Market (“NASDAQ”) are normally valued by the Funds at the NASDAQ Official Closing Price provided by NASDAQ each business day. If the NYSE closes unexpectedly and there is active trading on other exchanges, the securities will be valued at the Valuation Time based off of those exchanges. Options on securities indexes are valued at the close of the Chicago Board Options Exchange (normally 4:15 p.m. Eastern Standard Time) on each day the NYSE is open for trading.
| | |
| |
| Annual Report | September 30, 2016 | | 75 |
| | |
| ICON Sector Funds | | Notes to Financial Statements |
| | September 30, 2016 |
The Funds use pricing services to obtain the market value of securities in their portfolios. If a pricing service is not able to provide a price, or the pricing service’s valuation is considered inaccurate or does not, in the Funds’ judgment, reflect the market value of the security, prices may be obtained through market quotations from independent broker/dealers. If market quotations from these sources are not readily available, the Funds’ securities or other assets are valued at fair value as determined in good faith by the Funds’ Board of Trustees (the “Board”) or pursuant to procedures approved by the Board.
Lacking any sales that day, a security is valued at the current closing bid price (or yield equivalent thereof) or based on quotes obtained from dealers making a market for the security. Exchange traded options are valued at the composite price, using the National Best Bid and Offer quotes (“NBBO”). NBBO consists of the highest bid price and lowest ask price across any of the exchanges on which an option is quoted, thus providing a view across the entire U.S. options marketplace. Debt securities with a remaining maturity of greater than 60 days are valued using the evaluated bid price supplied by the pricing service. The evaluated bid price supplied by the pricing service is based upon a matrix valuation system which considers such factors as security prices, yields, maturities and ratings. Short-term debt securities with remaining maturities of 60 days or less are generally valued at amortized cost or original cost plus accrued interest, which approximates market value. Currency rates as of the close of the NYSE are used to convert foreign security values into U.S. dollars.
Securities of investment companies that trade on an exchange are valued at the last sales price or official closing price as of the close of the customary trading session on the exchange where the security is principally traded. Investments in shares of funds that are not traded on an exchange are valued at the end of day net asset value per share of such fund. Securities in the underlying funds, including restricted securities are valued in accordance with the valuation policy of such fund.
The Funds’ securities traded in countries outside of the Western Hemisphere are fair valued daily by utilizing the quotations of an independent pricing service, unless the Board determines that use of another valuation methodology is appropriate. The purposes of daily fair valuation are to avoid stale prices and to take into account, among other things, any significant events occurring after the close of foreign markets. The pricing service uses statistical analyses and quantitative models to adjust local market prices using factors such as subsequent movements and changes in the prices of indexes, securities and exchange rates in other markets to determine fair value as of the time a Fund calculates its net asset value (“NAV”). The valuation assigned to fair-value securities for purposes of calculating a Fund’s NAV may differ from the security’s most recent closing market price and from the prices used by other mutual funds to calculate their NAVs.
Various inputs are used to determine the value of the Funds’ investments. These inputs are summarized in the three broad levels listed below:
| | |
| Level 1 — | | quoted prices in active markets for identical securities. |
| Level 2 — | | significant observable inputs other than Level 1 quoted prices (including, but not limited to, quoted prices for similar securities, |
| | interest rates, prepayment speeds, and credit risk). |
| Level 3 — | | significant unobservable inputs. |
Observable inputs are those based on market data obtained from sources independent of the Funds, and unobservable inputs reflect the Funds’ own assumptions based on the best information available. The input levels are not necessarily an indication of the risk or liquidity associated with investments at that level. For example, non-U.S. equity securities actively traded in foreign markets may be reflected in Level 2 despite the availability of closing prices, because the Funds evaluate and determine whether those closing prices reflect fair value at the close of the NYSE or require adjustment, as described above. The following table summarizes the Funds’ investments, based on the inputs used to determine their values on September 30, 2016:
ICON Consumer Discretionary Fund
| | | | | | | | | | | | | | | | |
| Investments in Securities at Value* | | Level 1 - Quoted
and Unadjusted
Prices | | | Level 2 - Other
Significant
Observable Inputs | | | Level 3 - Significant
Unobservable
Inputs | | | Total | |
| |
Common Stocks | | $ | 37,822,680 | | | $ | – | | | $ | – | | | $ | 37,822,680 | |
Collateral for Securities on Loan | | | – | | | | 1,782,625 | | | | – | | | | 1,782,625 | |
Short-Term Investments | | | – | | | | 2,739,714 | | | | – | | | | 2,739,714 | |
| |
Total | | $ | 37,822,680 | | | $ | 4,522,339 | | | $ | – | | | $ | 42,345,019 | |
| |
| | |
| ICON Sector Funds | | Notes to Financial Statements |
| | September 30, 2016 |
ICON Consumer Staples Fund
| | | | | | | | | | | | | | | | | | | | | | |
| Investments in Securities at Value* | | Level 1 - Quoted
and Unadjusted
Prices | | Level 2 - Other
Significant
Observable Inputs | | Level 3 - Significant
Unobservable
Inputs | | Total | |
| |
Common Stocks | | $ | 36,899,838 | | | | | $ | – | | | | | $ | – | | | | | $ | 36,899,838 | |
Collateral for Securities on Loan | | | – | | | | | | 807,060 | | | | | | – | | | | | | 807,060 | |
Short-Term Investments | | | | | | | | | | | | | | | | | | | | | | |
Money Market Funds | | | 5,000,000 | | | | | | – | | | | | | – | | | | | | 5,000,000 | |
Time Deposits | | | – | | | | | | 5,673,964 | | | | | | – | | | | | | 5,673,964 | |
| |
Total | | $ | 41,899,838 | | | | | $ | 6,481,024 | | | | | $ | – | | | | | $ | 48,380,862 | |
| |
ICON Energy Fund | | | | | | | | | | | | | | | | | | | | | | |
| Investments in Securities at Value* | | Level 1 - Quoted
and Unadjusted
Prices | | Level 2 - Other
Significant
Observable Inputs | | Level 3 - Significant
Unobservable
Inputs | | Total | |
| |
Common Stocks | | $ | 345,222,004 | | | | | $ | – | | | | | $ | – | | | | | $ | 345,222,004 | |
Collateral for Securities on Loan | | | – | | | | | | 42,662,836 | | | | | | – | | | | | | 42,662,836 | |
Short-Term Investments | | | – | | | | | | 2,281,409 | | | | | | – | | | | | | 2,281,409 | |
| |
Total | | $ | 345,222,004 | | | | | $ | 44,944,245 | | | | | $ | – | | | | | $ | 390,166,249 | |
| |
ICON Financial Fund | | | | | | | | | | | | | | | | | | | | | | |
| Investments in Securities at Value* | | Level 1 - Quoted
and Unadjusted
Prices | | Level 2 - Other
Significant
Observable Inputs | | Level 3 - Significant
Unobservable
Inputs | | Total | |
| |
Common Stocks | | $ | 45,992,116 | | | | | $ | – | | | | | $ | – | | | | | $ | 45,992,116 | |
Collateral for Securities on Loan | | | – | | | | | | 502,800 | | | | | | – | | | | | | 502,800 | |
| |
Total | | $ | 45,992,116 | | | | | $ | 502,800 | | | | | $ | – | | | | | $ | 46,494,916 | |
| |
ICON Healthcare Fund | | | | | | | | | | | | | | | | | | | | | | |
| Investments in Securities at Value* | | Level 1 - Quoted
and Unadjusted
Prices | | Level 2 - Other
Significant
Observable Inputs | | Level 3 - Significant
Unobservable
Inputs | | Total | |
| |
Common Stocks | | $ | 78,909,912 | | | | | $ | – | | | | | $ | – | | | | | $ | 78,909,912 | |
Collateral for Securities on Loan | | | – | | | | | | 1,546,000 | | | | | | – | | | | | | 1,546,000 | |
Short-Term Investments | | | – | | | | | | 7,042,553 | | | | | | – | | | | | | 7,042,553 | |
| |
Total | | $ | 78,909,912 | | | | | $ | 8,588,553 | | | | | $ | – | | | | | $ | 87,498,465 | |
| |
ICON Industrials Fund | | | | | | | | | | | | | | | | | | | | | | |
| Investments in Securities at Value* | | Level 1 - Quoted
and Unadjusted
Prices | | Level 2 - Other
Significant
Observable Inputs | | Level 3 - Significant
Unobservable
Inputs | | Total | |
| |
Common Stocks | | $ | 23,113,699 | | | | | $ | – | | | | | $ | – | | | | | $ | 23,113,699 | |
Short-Term Investments | | | – | | | | | | 2,590,162 | | | | | | – | | | | | | 2,590,162 | |
| |
Total | | $ | 23,113,699 | | | | | $ | 2,590,162 | | | | | $ | – | | | | | $ | 25,703,861 | |
| |
ICON Information Technology Fund | | | | | | | | | | | | | | | | | | | | | | |
| Investments in Securities at Value* | | Level 1 - Quoted
and Unadjusted
Prices | | Level 2 - Other
Significant
Observable Inputs | | Level 3 - Significant
Unobservable
Inputs | | Total | |
| |
Common Stocks | | $ | 51,139,323 | | | | | $ | – | | | | | $ | – | | | | | $ | 51,139,323 | |
Collateral for Securities on Loan | | | – | | | | | | 823,500 | | | | | | – | | | | | | 823,500 | |
Short-Term Investments | | | – | | | | | | 314,271 | | | | | | – | | | | | | 314,271 | |
| |
Total | | $ | 51,139,323 | | | | | $ | 1,137,771 | | | | | $ | – | | | | | $ | 52,277,094 | |
| |
| | |
| |
| Annual Report | September 30, 2016 | | 77 |
| | |
| ICON Sector Funds | | Notes to Financial Statements |
| | September 30, 2016 |
| | | | | | | | | | | | | | | | | | | | | | |
ICON Natural Resources Fund | | | | | | | | | | | | | | | | | | | | | | |
| Investments in Securities at Value* | | Level 1 - Quoted
and Unadjusted
Prices | | Level 2 - Other
Significant
Observable Inputs | | Level 3 - Significant
Unobservable
Inputs | | Total | |
| |
Common Stocks | | | | | | | | | | | | | | | | | | | | | | |
Construction Materials | | $ | 4,743,005 | | | | | $ | 1,230,288 | | | | | $ | – | | | | | $ | 5,973,293 | |
Integrated Oil & Gas | | | 1,752,450 | | | | | | 1,253,180 | | | | | | – | | | | | | 3,005,630 | |
Paper Packaging | | | 5,667,638 | | | | | | 447,053 | | | | | | – | | | | | | 6,114,691 | |
Other | | | 43,708,190 | | | | | | – | | | | | | – | | | | | | 43,708,190 | |
Exchange Traded Funds | | | 7,390,020 | | | | | | – | | | | | | – | | | | | | 7,390,020 | |
Collateral for Securities on Loan | | | – | | | | | | 6,505,465 | | | | | | – | | | | | | 6,505,465 | |
Short-Term Investments | | | – | | | | | | 6,265,943 | | | | | | – | | | | | | 6,265,943 | |
| |
Total | | $ | 63,261,303 | | | | | $ | 15,701,929 | | | | | $ | – | | | | | $ | 78,963,232 | |
| |
ICON Utilities Fund | | | | | | | | | | | | | | | | | | | | | | |
| Investments in Securities at Value* | | Level 1 - Quoted
and Unadjusted
Prices | | Level 2 - Other
Significant
Observable Inputs | | Level 3 - Significant
Unobservable
Inputs | | Total | |
| |
Common Stocks | | $ | 58,187,422 | | | | | $ | – | | | | | $ | – | | | | | $ | 58,187,422 | |
Put Options Purchased | | | 316,300 | | | | | | – | | | | | | – | | | | | | 316,300 | |
Collateral for Securities on Loan | | | – | | | | | | 1,141,500 | | | | | | – | | | | | | 1,141,500 | |
Short-Term Investments | | | – | | | | | | 1,144,742 | | | | | | – | | | | | | 1,144,742 | |
| |
Total | | $ | 58,503,722 | | | | | $ | 2,286,242 | | | | | $ | – | | | | | $ | 60,789,964 | |
| |
| * | Please refer to the Schedule of Investments and the Sector/Industry Classification tables for additional security details. |
No Level 3 securities were held in any of the Funds at September 30, 2016.
For the year ended September 30, 2016, there was no transfer activity between Level 1, Level 2 or Level 3.
The end of period timing recognition is used for the transfers between levels of each Fund’s assets and liabilities.
Fund Share Valuation
Fund shares are sold and redeemed on a daily basis at net asset value. Net asset value per share is determined daily as of the close of trading on the NYSE on each day the NYSE is open for trading by dividing the total value of the Fund’s investments and other assets, less liabilities, by the number of Fund shares outstanding.
Foreign Currency Translation
The accounting records of the Funds are maintained in U.S. dollars. Investment securities and other assets and liabilities denominated in a foreign currency are translated daily into U.S. dollars at the prevailing rates of exchange. Income and expenses are translated into U.S. dollars at the prevailing exchange rate on the respective dates of the transactions. Purchases and sales of securities are translated into U.S. dollars at the contractual currency exchange rates established at the time of each trade.
The Funds do not isolate that portion of the results of operations resulting from changes in foreign exchange rates on investments from the fluctuations arising from changes in market prices of securities held. Net unrealized appreciation or depreciation on investments and foreign currency translations arise from changes in the value of assets and liabilities resulting from changes in the exchange rates and changes in market prices of securities held.
| | |
| ICON Sector Funds | | Notes to Financial Statements |
| | September 30, 2016 |
Options Transactions
The Funds’ use of derivatives for the year ended September 30, 2016 was limited to purchased options.
The Funds may purchase and/or write (sell) call and put options on any security in which it may invest. The Funds utilize options to hedge against changes in market conditions or to provide market exposure while trying to reduce transaction costs.
Option contracts involve market risk and liquidity risk and can be highly volatile. Should prices of securities or securities indexes move in an unexpected manner, the Funds may not achieve the desired benefits and may realize losses and thus be in a worse position than if such strategies had not been utilized.
When a Fund writes a put or call option, an amount equal to the premium received is included on the Statements of Assets and Liabilities as a liability. The amount of the liability is subsequently marked-to-market to reflect the current market value of the option. If an option expires on its stipulated expiration date or if the Fund enters into a closing purchase transaction, a gain or loss is realized. If a written call option on an individual security is exercised, a gain or loss is realized for the sale of the underlying security, and the proceeds from the sale are increased by the premium originally received. If a written call option on a securities index is exercised, a gain or loss is realized as determined by the premium originally received, the exercise price and the market value of the index. If a written put option on an individual security is exercised, the cost of the security acquired is decreased by the premium originally received. As a writer of an option, a Fund bears the market risk of an unfavorable change in the price of the individual security or securities index underlying the written option. Additionally, written call options may involve the risk of limited gains.
Each Fund may also purchase put and call options. When a Fund purchases a put or call option, an amount equal to the premium paid is included on the Fund’s Statement of Assets and Liabilities as an investment, and is subsequently marked-to-market to reflect the current market value of the option. If an option expires on the stipulated expiration date or if the Fund enters into a closing purchase or sale transaction, a gain or loss is realized. If the Fund exercises a call option on an individual security, the cost of the security acquired is increased by the premium paid for the call. If the Fund exercises a put option on an individual security, a gain or loss is realized from the sale of the underlying security, and the proceeds from such a sale are decreased by the premium originally paid. If the Fund exercises a put or a call option on a security index, a gain or loss is realized as determined by the premium originally paid, the exercise price and the market value of the index. Written and purchased options are non-income producing securities.
As of September 30, 2016, the Utilities Fund engaged in purchased put option transactions. All open option contracts are included on each Fund’s Schedule of Investments.
The following is a summary of how these derivatives are treated in the financial statements and their impact on the Funds:
| | | | | | | | | | | | | | |
| ICON Utilities Fund | | Asset Derivatives | | | Liability Derivatives | |
| | | |
| Risk Exposure | | Statements of Assets and Liabilities Location | | Fair Value | | | Statements of Assets and
Liabilities Location | | | Fair Value | |
| |
Equity Contracts (Purchased Options) | | Investments, at value | | $ | 316,300 | | | | N/A | | | | N/A | |
| |
Total | | | | $ | 316,300 | | | | | | | $ | – | |
| |
| | | | | | | | | | |
ICON Energy Fund Risk Exposure | | Statements of Operations Location | | Realized
Gain/(Loss) on
Derivatives
Recognized
in Income | | | Change in
Unrealized Appreciation/
(Depreciation) on Derivatives
Recognized in Income | |
| |
Equity Contracts
(Purchased Options) | | Net realized gain/(loss) on investments/change in unrealized net appreciation/(depreciation) on investments and foreign currency | | $ | (425,394 | ) | | $ | – | |
| |
Total | | | | $ | (425,394 | ) | | $ | – | |
| |
| | |
| |
| Annual Report | September 30, 2016 | | 79 |
| | |
| ICON Sector Funds | | Notes to Financial Statements |
| | September 30, 2016 |
| | | | | | | | | | |
ICON Consumer Staples Fund Risk Exposure | | Statements of Operations Location | | Realized Gain/(Loss) on
Derivatives Recognized in Income | | | Change in Unrealized Appreciation/ (Depreciation) on Derivatives Recognized in Income | |
| |
Equity Contracts
(Purchased Options) | | Net realized gain/(loss) on investments/ Change in unrealized net appreciation/(depreciation) on investments and foreign currency | | | $ (79,107) | | | | $ – | |
| |
Total | | | | | $ (79,107) | | | | $ – | |
| |
| | | |
ICON Financial Fund Risk Exposure | | Statements of Operations Location | | Realized Gain/(Loss) on Derivatives Recognized in Income | | | Change in Unrealized Appreciation/ (Depreciation) on Derivatives Recognized in Income | |
| |
Equity Contracts
(Purchased Options) | | Net realized gain/(loss) on investments/ change in unrealized net appreciation/(depreciation) on investments and foreign currency | | | $ (239,271) | | | | $ – | |
| |
Total | | | | | $ (239,271) | | | | $ – | |
| |
| | | |
ICON Natural Resources Fund Risk Exposure | | Statements of Operations Location | | Realized Gain/(Loss) on
Derivatives Recognized in Income | | | Change in Unrealized Appreciation/ (Depreciation) on Derivatives Recognized in Income | |
| |
Equity Contracts
(Purchased Options) | | Net realized gain/(loss) on investments/ change in unrealized net appreciation/(depreciation) on investments and foreign currency | | | $ (183,964) | | | | $ – | |
| |
Total | | | | | $ (183,964) | | | | $ – | |
| |
| | | |
ICON Utilities Fund Risk Exposure | | Statements of Operations Location | | Realized Gain/(Loss) on Derivatives Recognized in Income | | | Change in Unrealized Appreciation/ (Depreciation) on Derivatives Recognized in Income | |
| |
Equity Contracts
(Purchased Options) | | Net realized gain/(loss) on investments/ change in unrealized net appreciation/(depreciation) on investments and foreign currency | | | $ 74,007 | | | | $ 80,609 | |
| |
Total | | | | | $ 74,007 | | | | $ 80,609 | |
| |
| | |
| ICON Sector Funds | | Notes to Financial Statements |
| | September 30, 2016 |
The average purchased option contracts during the year ended September 30, 2016, was as follows:
| | | | | | | | | | | | |
ICON Consumer Staples Fund | | | | | | | | | | | | |
| Derivative Type | | Unit of Measurement | | | Average Contracts+ | | | Days Held | |
Purchased Options | | | Contracts | | | | 1,263 | | | | 76 | |
| | | |
ICON Energy Fund | | | | | | | | | | | | |
| Derivative Type | | Unit of Measurement | | | Average Contracts+ | | | Days Held | |
Purchased Options | | | Contracts | | | | 5,675 | | | | 220 | |
| | | |
ICON Financial Fund | | | | | | | | | | | | |
| Derivative Type | | Unit of Measurement | | | Average Contracts+ | | | Days Held | |
Purchased Options | | | Contracts | | | | 1,283 | | | | 123 | |
| | | |
ICON Natural Resources Fund | | | | | | | | | | | | |
| Derivative Type | | Unit of Measurement | | | Average Contracts+ | | | Days Held | |
Purchased Options | | | Contracts | | | | 3,950 | | | | 80 | |
| | | |
ICON Utilities Fund | | | | | | | | | | | | |
| Derivative Type | | Unit of Measurement | | | Average Contracts+ | | | Days Held | |
Purchased Options | | | Contracts | | | | 1,578 | | | | 64 | |
| + | The average is calculated based on the actual number of days with outstanding derivatives. |
The Funds value derivatives at fair value, as described above, and recognize changes in fair value currently in the results of operations. Accordingly the Funds do not follow hedge accounting, even for derivatives employed as economic hedges.
Securities Lending
Under procedures adopted by the Board, the Funds may lend securities to certain approved brokers, dealers and other financial institutions to earn additional income. Cash collateral is received in exchange for securities on loan in the amount of at least 102% of the value of U.S. securities loaned or at least 105% of the value of non-U.S. securities loaned, marked to market daily. The Funds retain certain benefits of owning the securities, including receipt of dividends or interest generated by the security, but give up other rights including the right to vote proxies. The Funds retain the ability to recall the loans at any time and could do so in order to vote proxies or to sell the loaned securities. Each loan is collateralized by cash that generally exceeds the value of the securities on loan. The market value of the loaned securities is determined daily at the close of business of the Funds and any additional required collateral is delivered to each Fund on the next business day.
Generally, in the event of borrower default, the Funds have the right to use the collateral to offset any losses incurred. In the event the Funds are delayed or prevented from exercising their rights to dispose of the collateral, there may be a potential loss to the Funds. Some of these losses may be indemnified by the lending agent.
The Funds have elected to invest the cash collateral in the State Street Navigator Prime Portfolio which is disclosed on the Schedule of Investments. The Funds bear the risk of loss with respect to the investment of collateral. The net securities lending income earned by the Funds for the year ended September 30, 2016, is included in the Statements of Operations.
The value of the collateral could include collateral held for securities that were sold on or before September 30, 2016. It may also include collateral received from the pre-funding of security loans.
The following table indicates the total amount of securities loaned by type, reconciled to gross liability payable upon return of the securities loaned by the Funds as of September 30, 2016:
| | | | | | | | | | | | | | | | | | | | | | | | | | | | |
| | | Remaining contractual maturity of the lending agreement | | | | | | | |
| | | Overnight &
Continuous | | | Up to 30 days | | | 30-90 days | | | Greater than
90 days | | | Market Value | | | Collateral
Received | | | Excess amount due to
counterparty | |
Securities Lending Transactions ICON Consumer Discretionary Fund | | | | | | | | | | | | | | | | | | | | | | | | | | | | |
Equity Securities | | $ | 1,781,465 | | | $ | – | | | $ | – | | | $ | – | | | $ | 1,781,465 | | | $ | 1,782,625 | | | $ | 1,160 | |
| | |
| |
| Annual Report | September 30, 2016 | | 81 |
| | |
| ICON Sector Funds | | Notes to Financial Statements |
| | September 30, 2016 |
| | | | | | | | | | | | | | | | | | | | | | | | | | | | |
| | | Remaining contractual maturity of the lending agreement | | | | | | | |
| | | Overnight &
Continuous | | | Up to 30 days | | | 30-90 days | | | Greater than
90 days | | | Market Value | | | Collateral Received | | | Excess amount
due to
counterparty | |
Securities Lending Transactions | | | | | | | | | | | | | | | | | | | | | | | | | | | | |
ICON Consumer Staples Fund | | | | | | | | | | | | | | | | | | | | | | | | | | | | |
Equity Securities | | | 779,737 | | | | – | | | | – | | | | – | | | | 779,737 | | | | 807,060 | | | | 27,323 | |
ICON Energy Fund | | | | | | | | | | | | | | | | | | | | | | | | | | | | |
Equity Securities | | | 41,762,067 | | | | – | | | | – | | | | – | | | | 41,762,067 | | | | 42,662,836 | | | | 900,769 | |
ICON Financial Fund | | | | | | | | | | | | | | | | | | | | | | | | | | | | |
Equity Securities | | | 495,160 | | | | – | | | | – | | | | – | | | | 495,160 | | | | 502,800 | | | | 7,640 | |
ICON Healthcare Fund | | | | | | | | | | | | | | | | | | | | | | | | | | | | |
Equity Securities | | | 1,522,070 | | | | – | | | | – | | | | – | | | | 1,522,070 | | | | 1,546,000 | | | | 23,930 | |
ICON Information Technology Fund | | | | | | | | | | | | | | | | | | | | | | | | | | | | |
Equity Securities | | | 801,360 | | | | – | | | | – | | | | – | | | | 801,360 | | | | 823,500 | | | | 22,140 | |
ICON Natural Resources Fund | | | | | | | | | | | | | | | | | | | | | | | | | | | | |
Equity Securities | | | 6,414,211 | | | | – | | | | – | | | | – | | | | 6,414,211 | | | | 6,505,465 | | | | 91,254 | |
ICON Utilities Fund | | | | | | | | | | | | | | | | | | | | | | | | | | | | |
Equity Securities | | | 1,120,953 | | | | – | | | | – | | | | – | | | | 1,120,953 | | | | 1,141,500 | | | | 20,547 | |
Income Taxes, Dividends, and Distributions
The Funds intend to continue to qualify as regulated investment companies under Subchapter M of the Internal Revenue Code and, accordingly, the Funds will generally not be subject to federal and state income taxes or federal excise taxes to the extent that they intend to make sufficient distributions of net investment income and net realized capital gains.
Dividends paid by the Funds from net investment income and distributions of net realized short-term gains are, for federal income tax purposes, taxable as ordinary income to shareholders.
Dividends and distributions to shareholders are recorded by the Funds on the ex-dividend/distribution date. The Funds distribute income and net realized capital gains, if any, to shareholders at least annually, if not offset by capital loss carryforward. The Funds may utilize equalization accounting for tax purposes and designate earnings and profits, including net realized gains distributed to shareholders on redemption of shares, as part of the dividends paid deduction for income tax purposes. Income distributions and capital gain distributions are determined in accordance with income tax regulations, which may differ from accounting principles generally accepted in the United States of America.
Management has analyzed the Funds’ tax positions taken on federal income tax returns for all open tax periods and has concluded that no provision for federal income tax is required in the Funds’ financial statements.
The Funds file U.S. tax returns. While the statute of limitations remains open to examine the Funds’ U.S. tax returns filed for the past three years, no examinations are in progress or anticipated at this time. The Funds are not aware of any tax positions for which it is reasonably possible that the total amounts of unrecognized tax benefits will significantly change in the next twelve months.
Certain foreign countries impose a capital gains tax which is accrued by the Funds based on the unrealized appreciation, if any, on affected securities. Any accrual would reduce a Fund’s NAV. The tax is paid when the gain is realized.
Investment Income
Dividend income is recorded on the ex-dividend date. Non-cash dividends included in dividend income, if any, are recorded at the fair value of the securities received. Interest income is accrued as earned. Certain dividends from foreign securities are recorded as soon as the Funds are informed of the dividend if such information is obtained subsequent to the ex-dividend date. Discounts and premiums on fixed income securities purchased are accreted or amortized to income over the life of the respective securities based on the effective yield.
Investment Transactions
Security transactions are accounted for no later than one business day after the trade date. However, for financial reporting purposes, security transactions are accounted for on the trade date. Gains and losses on securities sold are determined on the basis of identified cost.
| | |
| ICON Sector Funds | | Notes to Financial Statements |
| | September 30, 2016 |
Withholding Tax
Withholding taxes on foreign dividends have been provided for in accordance with the Funds’ understanding of the applicable country’s tax rules and rates. The ability of issuers of debt securities held by the Funds to meet their obligations may be effected by economic and political developments in specific country or region.
Other
The Funds hold certain investments which pay dividends to their shareholders based upon available funds from operations. It is possible for these dividends to exceed the underlying investments’ taxable earnings and profits resulting in the excess portion of such dividends being designated as a return of capital. Distributions received from investments in securities that represent a return of capital or capital gains are recorded as a reduction of the cost of investments or as a realized gain, respectively.
Allocation of Expenses
Each class of a Fund’s shares bears expenses incurred specifically on its behalf and, in addition, each class bears a portion of general expenses, based upon relative net assets of each class. Expenses which cannot be directly attributed to a specific Fund in the Trust are apportioned between all Funds in the Trust based upon relative net assets. In calculating the net asset value per share of each class, investment income, realized and unrealized gains and losses and expenses other than class-specific expenses are allocated daily to each class of shares based upon the proportion of net assets.
Below are additional class level expenses that are included on the Statements of Operations:
| | | | | | | | | | | | |
| Fund | | Printing Fees | | | Transfer Agent Fees* | | | Registration Fees | |
ICON Consumer Discretionary Fund | | | | | | | | | | | | |
Class S | | $ | 11,374 | | | $ | 54,272 | | | $ | 18,632 | |
Class A | | | 1,325 | | | | 8,803 | | | | 9,777 | |
ICON Consumer Staples Fund | | | | | | | | | | | | |
Class S | | | 4,163 | | | | 40,238 | | | | 15,016 | |
Class A | | | 2,864 | | | | 15,550 | | | | 10,847 | |
ICON Energy Fund | | | | | | | | | | | | |
Class S | | | 68,704 | �� | | | 704,338 | | | | 41,600 | |
Class C | | | 2,495 | | | | 20,081 | | | | 6,275 | |
Class A | | | 3,342 | | | | 30,526 | | | | 6,939 | |
ICON Financial Fund | | | | | | | | | | | | |
Class S | | | 12,496 | | | | 57,558 | | | | 18,870 | |
Class A | | | 1,202 | | | | 7,018 | | | | 7,619 | |
ICON Healthcare Fund | | | | | | | | | | | | |
Class S | | | 15,621 | | | | 133,583 | | | | 33,418 | |
Class A | | | 2,431 | | | | 16,285 | | | | 9,351 | |
ICON Industrials Fund | | | | | | | | | | | | |
Class S | | | 9,541 | | | | 30,559 | | | | 16,622 | |
Class A | | | 786 | | | | 4,237 | | | | 5,340 | |
ICON Information Technology Fund | | | | | | | | | | | | |
Class S | | | 13,986 | | | | 82,524 | | | | 18,919 | |
Class A | | | 1,005 | | | | 6,112 | | | | 6,227 | |
ICON Natural Resources Fund | | | | | | | | | | | | |
Class S | | | 63,927 | | | | 143,867 | | | | 19,832 | |
Class C | | | 1,334 | | | | 2,602 | | | | 4,406 | |
Class A | | | 4,151 | | | | 8,836 | | | | 8,660 | |
ICON Utilities Fund | | | | | | | | | | | | |
Class S | | | 13,585 | | | | 63,983 | | | | 16,142 | |
Class A | | | 2,075 | | | | 15,512 | | | | 8,763 | |
| * | Transfer agent out of pocket fees are a Fund level expense. |
| | |
| |
| Annual Report | September 30, 2016 | | 83 |
| | |
| ICON Sector Funds | | Notes to Financial Statements |
| | September 30, 2016 |
3. FEES AND OTHER TRANSACTIONS WITH AFFILIATES
Investment Advisory Fees
ICON Advisers, Inc. (“ICON Advisers”) serves as investment adviser to the Funds and is responsible for managing the Funds’ portfolios of securities. ICON Advisers receives a monthly management fee that is computed daily at an annual rate of 1.00% on the first $500 million of average daily net assets, 0.95% on the next $250 million, 0.925% on the next $750 million, 0.90% on the next $3.5 billion, and 0.875% on average daily net assets over $5 billion.
ICON Advisers has contractually agreed to limit its Funds’ expenses (exclusive of brokerage, interest, taxes, dividends on short sales, acquired fund fees and expenses and extraordinary expenses) to the extent necessary to ensure that the Funds’ operating expenses do not exceed the following amounts:
| | | | | | | | |
| Fund | | Class S | | Class C | | | Class A |
ICON Consumer Discretionary Fund | | 1.74% | | | – | | | 1.99% |
ICON Consumer Staples Fund | | 1.50% | | | – | | | 1.75% |
ICON Energy Fund | | 1.50% | | | 2.50% | | | 1.75% |
ICON Financial Fund | | 1.50% | | | – | | | 1.75% |
ICON Healthcare Fund | | 1.50% | | | – | | | 1.75% |
ICON Industrials Fund | | 1.50% | | | – | | | 1.75% |
ICON Information Technology Fund | | 1.50% | | | – | | | 1.75% |
ICON Natural Resources Fund | | 1.50% | | | 2.50% | | | 1.75% |
ICON Utilities Fund | | 1.50% | | | – | | | 1.75% |
The Funds’ expense limitations will continue in effect until at least January 31, 2017. To the extent ICON Advisers reimburses or absorbs fees and expenses, it may seek payment of such amounts for up to three years after the expenses were reimbursed or absorbed. A Fund will make no such payment, however, if the total Fund operating expenses exceed the expense limits in effect at the time these payments are proposed.
As of September 30, 2016 the following amounts were available for recoupment by ICON Advisers based upon their potential expiration dates:
| | | | | | | | | | | | |
| Fund | | Expires
2017 | | | Expires
2018 | | | Expires
2019 | |
ICON Consumer Discretionary Fund | | $ | – | | | $ | – | | | $ | 4,288 | |
ICON Consumer Staples Fund | | | 7,639 | | | | 37,969 | | | | 51,650 | |
ICON Financial Fund | | | 5,985 | | | | 3,685 | | | | 8,903 | |
ICON Healthcare Fund | | | – | | | | – | | | | 3,006 | |
ICON Industrials Fund | | | 1,798 | | | | 7,666 | | | | 44,625 | |
ICON Information Technology Fund | | | 1,744 | | | | 1,632 | | | | 8,637 | |
ICON Natural Resources Fund | | | 8,051 | | | | 3,552 | | | | 73,898 | |
ICON Utilities Fund | | | 498 | | | | 30,739 | | | | 31,947 | |
Accounting, Custody and Transfer Agent Fees
Effective March 1, 2016, ALPS Fund Services (“ALPS”) serves as the fund accounting agent for the Funds. Prior to March 1, 2016, State Street Bank and Trust Company (“State Street”) served as the fund accounting agent for the Funds. For its services, the Trust pays ALPS a fee that is calculated daily and paid monthly at an annual rate based on the aggregate average daily net assets of the Trust.
State Street is the custodian of the Trust’s investments. For its services, the Trust pays State Street asset-based fees that vary according to the number of positions and transactions, plus out-of-pocket expenses.
Effective April 9, 2016, ALPS became the transfer agent for the Trust. For these services, the Trust pays an annual fee plus annual base fee per Fund, per account fees and out-of-pocket expenses. Prior to April 9, 2016, Boston Financial Data Services, Inc. was the Trust’s transfer agent.
Administrative Services
The Trust has entered into an administrative services agreement with ICON Advisers pursuant to which ICON Advisers oversees the administration of the Trust’s business and affairs. This agreement provides for an annual fee of 0.05% on the Trust’s first $1.5 billion of average daily net assets, 0.045% on the next $1.5 billion of average daily net assets, 0.040% on the next $2 billion of average daily net assets and 0.030% on average daily
| | |
| ICON Sector Funds | | Notes to Financial Statements |
| | September 30, 2016 |
net assets over $5 billion. For the year ended September 30, 2016, each Fund’s payment for administrative services to ICON Advisers is included on the Statements of Operations. The administrative services agreement provides that ICON Advisers will not be liable for any error of judgment, mistake of law, or any loss suffered by the Trust in connection with matters to which the administrative services agreement relates, except for a loss resulting from willful misfeasance, bad faith or negligence by ICON Advisers in the performance of its duties.
Effective March 1, 2016, ICON Advisers has a sub-administration agreement with ALPS under which ALPS assists ICON Advisers with the administration and business affairs of the Trust. For its services, ICON Advisers pays ALPS a fee that is calculated daily and paid monthly at an annual rate based on the aggregate average daily net assets of the Trust. Prior to March 1, 2016, the sub-administration agreement was between ICON Advisers and State Street.
Distribution Fees
The Funds have adopted a non-compensatory Distribution Plan pursuant to Rule 12b-1 under the 1940 Act (“12b-1 Plan”) under which the Funds are authorized to compensate the Funds’ distributor, ICON Distributors, Inc. (“IDI”) (an affiliate of the adviser) for the sale and distribution of shares and for other shareholder services. Under the 12b-1 Plan, the Distribution Plan provides for reimbursement of expenses incurred by IDI related to distribution and marketing. The shareholders of the Funds pay an annual distribution and service fee of 1.00% of average daily net assets for Class C shares and an annual distribution and service fee of 0.25% of average daily net assets for Class A shares. There is no annual distribution and service fee for Class S shares. The total amount paid under the 12b-1 plans by the Funds is shown on the Statements of Operations.
In addition, IDI, as Distributor, receives a contingent deferred sales charge at a rate of 1.00% of the purchase price for the sale of Class C shares within one year of purchase. For Class A shares, the public offering price equals net asset value plus the applicable sales charge, which is a maximum of 5.75%. IDI receives a portion of this sales charge and may redistribute it as dealer discounts and brokerage commissions to non-related parties.
Other Related Parties
Certain Officers and Directors of ICON Advisers are also Officers and Trustees of the Funds; however, such Officers and Trustees (with the exception of the Chief Compliance Officer, “CCO”) receive no compensation from the Funds. The Trust paid 95% of the CCO’s salary and the remaining portion, along with other employee related expenses, is paid by ICON Advisers. For the year ended September 30, 2016, the total related amounts paid by the Funds under this arrangement are included in Other Expenses on the Statements of Operations.
The Funds may reimburse ICON Advisers for legal work performed for the Funds by its attorneys outside of the advisory and administration contracts. The Board reviews and approves such reimbursements. For the year ended September 30, 2016, the total related amounts paid by the Funds under this arrangement was $26,077 and is included in Other Expenses on the Statements of Operations.
The Funds engaged in cross trades with each other during the year ended September 30, 2016 pursuant to Rule 17a-7 under the 1940 Act. Generally, cross trading is the buying or selling of portfolio securities between funds to which the Adviser serves as the investment adviser. The Board of Trustees previously adopted procedures that apply to transactions between the Funds and its affiliates pursuant to Rule 17a-7. At its regularly scheduled meetings, the Board of Trustees reviews such transactions as of the most current calendar quarter for compliance with the requirements set forth by Rule 17a-7 and the Funds’ procedures. The procedures require that the transactions be a purchase or sale for no consideration other than cash payment against prompt delivery of a security for which market quotations are readily available, and be consistent with the investment policies of each Fund.
4. BORROWINGS
The Trust has entered into a uncommitted, unsecured, revolving Line of Credit agreement/arrangement with State Street to provide temporary funding for redemption requests. Effective March 21, 2016, the maximum borrowing limit was changed from $75 million to $50 million. Interest on domestic borrowings is charged at a rate quoted and determined by State Street. The Line of Credit agreement/arrangement expires on March 20, 2017.
As of September 30, 2016, the Financial Fund had an outstanding borrowing in the amount of $100,081.
| | |
| |
| Annual Report | September 30, 2016 | | 85 |
| | |
| ICON Sector Funds | | Notes to Financial Statements |
| | September 30, 2016 |
For the year ended September 30, 2016, the average outstanding loan by Fund was as follows:
| | | | | | |
| Fund | | Average Borrowing
(10/01/15 - 9/30/16)^ | | | Average Interest Rates
(10/01/15 - 9/30/16)^ |
|
ICON Consumer Discretionary Fund* | | $ | 130,031 | | | 1.63% |
ICON Consumer Staples Fund* | | | 638,591 | | | 1.69% |
ICON Energy Fund* | | | 2,280,791 | | | 1.73% |
ICON Financial Fund | | | 259,635 | | | 1.60% |
ICON Healthcare Fund* | | | 1,519,099 | | | 1.58% |
ICON Information Technology Fund* | | | 611,476 | | | 1.62% |
ICON Natural Resources Fund* | | | 420,607 | | | 1.57% |
ICON Utilities Fund* | | | 1,248,569 | | | 1.64% |
| * | There were no outstanding borrowings under this agreement/arrangement as of September 30, 2016. |
| ^ | The average is calculated based on the actual number of days with outstanding borrowings. |
5. PURCHASES AND SALES OF INVESTMENT SECURITIES
For the year ended September 30, 2016, the aggregate cost of purchases and proceeds from sales of investment securities (excluding short-term securities) was as follows:
| | | | | | | | | | |
| Fund | | Purchases of
Securities | | Proceeds from Sales
of Securities |
ICON Consumer Discretionary Fund | | | $ | 62,541,904 | | | | $ | 71,659,741 | |
ICON Consumer Staples Fund | | | | 46,530,223 | | | | | 22,943,541 | |
ICON Energy Fund | | | | 330,143,210 | | | | | 357,575,012 | |
ICON Financial Fund | | | | 23,957,754 | | | | | 26,277,257 | |
ICON Healthcare Fund | | | | 88,081,913 | | | | | 126,352,008 | |
ICON Industrials Fund | | | | 20,122,707 | | | | | 12,923,460 | |
ICON Information Technology Fund | | | | 43,113,426 | | | | | 46,143,872 | |
ICON Natural Resources Fund | | | | 51,400,004 | | | | | 60,211,144 | |
ICON Utilities Fund | | | | 101,921,794 | | | | | 74,131,559 | |
6. FEDERAL INCOME TAX
The following information is presented on an income tax basis. Differences between GAAP and federal income tax purposes that are permanent in nature are reclassified within the capital accounts. Temporary differences do not require reclassification. Temporary and permanent differences do not impact the NAVs of the Funds. These differences are due to differing treatments for items such as deferrals of wash sale losses, foreign currency transactions, partnership adjustments, and net investment losses.
For the year ended September 30, 2016, the following Funds had capital loss carryforwards:
| | | | | | | | |
| Fund | | Expiring in 2017 | | | Expiring in 2018 | |
| |
ICON Financial Fund | | $ | 42,575,056 | | | $ | 43,715,782 | |
ICON Industrials Fund | | | – | | | | 18,214,017 | |
Future capital loss carryforward utilization in any given year may be limited if there are substantial shareholder redemptions or contributions. During the year ended September 30, 2016, the following Funds utilized capital loss carryforwards:
| | | | |
| Fund | | Amount | |
| |
ICON Financial Fund | | $ | 185,723 | |
ICON Industrials Fund | | | 1,229,396 | |
ICON Information Technology Fund | | | 357,889 | |
ICON Utilities Fund | | | 87,574 | |
For Energy Fund, the short-term and long-term capital losses with no expiration were $80,771,602 and $27,925,037, respectively.
| | |
| ICON Sector Funds | | Notes to Financial Statements |
| | September 30, 2016 |
Under the Regulated Investment Company Modernization Act of 2010 (the “Act”) capital losses generated by a Fund may be carried over indefinitely, but these losses must be used prior to the utilization of any pre-enactment capital losses. Since pre-enactment capital losses may only be carried forward for eight years there may be a greater likelihood that all or a portion of each Fund’s pre-enactment capital losses will expire unused.
The tax characteristics of distributions paid to shareholders during the fiscal year ended September 30, 2016, were as follows:
| | | | | | | | |
| Fund | | Ordinary Income | | | Long-Term Capital
Gains | |
| |
ICON Consumer Discretionary Fund | | $ | 1,967,808 | | | $ | 2,499,540 | |
ICON Consumer Staples Fund | | | 528,316 | | | | 2,182,632 | |
ICON Energy Fund | | | 3,214,770 | | | | – | |
ICON Healthcare Fund | | | 16,435,757 | | | | 4,598,527 | |
ICON Natural Resources Fund | | | 325,103 | | | | 4,742,663 | |
ICON Utilities Fund | | | 1,424,724 | | | | – | |
The tax characteristics of distributions paid to shareholders during the fiscal year ended September 30, 2015, were as follows:
| | | | | | | | |
| Fund | | Ordinary Income | | | Long-Term Capital
Gains | |
| |
ICON Consumer Discretionary Fund | | $ | 3,159,255 | | | $ | 4,938,010 | |
ICON Consumer Staples Fund | | | 1,055,012 | | | | 3,043,787 | |
ICON Energy Fund | | | 5,883,708 | | | | 94,805,687 | |
ICON Financial Fund | | | 300,902 | | | | – | |
ICON Healthcare Fund | | | 17,398,269 | | | | 15,513,304 | |
ICON Industrials Fund | | | 26,242 | | | | – | |
ICON Natural Resources Fund | | | 208,262 | | | | – | |
ICON Utilities Fund | | | 622,942 | | | | – | |
As of September 30, 2016, the components of accumulated earnings/(deficit) on a tax basis were as follows:
| | | | | | | | | | | | | | | | | | | | | | | | |
| Fund | | Undistributed
Ordinary Income | | | Undistributed Capital Gains | | | Late Year Loss
Deferral* | | | Capital Loss
Carryforward
and Other Losses | | | Unrealized
Appreciation/ (Depreciation)** | | | Total Accumulated
Earnings/(Deficit) | |
| |
ICON Consumer Discretionary Fund | | $ | 584,789 | | | $ | 1,670,665 | | | $ | – | | | $ | – | | | $ | (2,303,360) | | | $ | (47,906) | |
ICON Consumer Staples Fund | | | 1,732,630 | | | | 1,341,627 | | | | – | | | | – | | | | (48,472) | | | | 3,025,785 | |
ICON Energy Fund | | | 784,757 | | | | – | | | | (42,235,817) | | | | (110,650,408) | *** | | | (3,732,151) | | | | (155,833,619) | |
ICON Financial Fund | | | 487,449 | | | | – | | | | (4,992,037) | | | | (86,290,838) | | | | (1,335,367) | | | | (92,130,793) | |
ICON Healthcare Fund | | | – | | | | 1,215,858 | | | | (63,244) | | | | – | | | | (1,778,446) | | | | (625,832) | |
ICON Industrials Fund | | | – | | | | – | | | | (22,535) | | | | (18,214,017) | | | | 1,340,544 | | | | (16,896,008) | |
ICON Information Technology Fund | | | 474,618 | | | | 8,402,419 | | | | – | | | | – | | | | 9,930,607 | | | | 18,807,644 | |
ICON Natural Resources Fund | | | 400,690 | | | | – | | | | (5,415,227) | | | | – | | | | 206,375 | | | | (4,808,162) | |
ICON Utilities Fund | | | 3,119,151 | | | | 1,047,759 | | | | – | | | | – | | | | 1,051,017 | | | | 5,217,927 | |
| * | The Funds have elected to defer certain qualified late-year losses in accordance with federal income tax rules. These losses are treated as having arisen on the first day of the following fiscal year. |
| ** | Differences between the book-basis and tax-basis unrealized appreciation/(depreciation) are attributable primarily to tax deferral of losses on wash sales. |
| *** | Includes $1,953,769 of deferred passive losses for partnership investments. |
| | |
| |
| Annual Report | September 30, 2016 | | 87 |
| | |
| ICON Sector Funds | | Notes to Financial Statements |
| | September 30, 2016 |
As of September 30, 2016, cost on investments for federal income tax purposes and the amount of net unrealized appreciation/(depreciation) were as follows:
| | | | | | | | | | | | | | | | | | | | |
| Fund | | Gross Appreciation
(excess of value over
tax cost) | | | Gross Depreciation
(excess of tax cost
over value) | | | Net Appreciation/
(Depreciation) of
Foreign Currency | | | Net Unrealized
Appreciation/ (Depreciation) | | | Cost of Investments
for Income Tax
Purposes | |
| |
ICON Consumer Discretionary Fund | | $ | 1,072,882 | | | $ | (3,376,242 | ) | | $ | – | | | $ | (2,303,360) | | | $ | 44,648,379 | |
ICON Consumer Staples Fund | | | 1,269,743 | | | | (1,318,215 | ) | | | – | | | | (48,472) | | | | 48,429,334 | |
ICON Energy Fund | | | 32,926,021 | | | | (36,658,172 | ) | | | – | | | | (3,732,151) | | | | 393,898,400 | |
ICON Financial Fund | | | 2,012,727 | | | | (3,348,094 | ) | | | – | | | | (1,335,367) | | | | 47,830,283 | |
ICON Healthcare Fund | | | 2,154,853 | | | | (3,933,299 | ) | | | – | | | | (1,778,446) | | | | 89,276,911 | |
ICON Industrials Fund | | | 1,878,155 | | | | (537,611 | ) | | | – | | | | 1,340,544 | | | | 24,363,317 | |
ICON Information Technology Fund | | | 10,461,507 | | | | (530,900 | ) | | | – | | | | 9,930,607 | | | | 42,346,487 | |
ICON Natural Resources Fund | | | 4,683,104 | | | | (4,476,723 | ) | | | (6) | | | | 206,375 | | | | 78,756,851 | |
ICON Utilities Fund | | | 2,345,263 | | | | (1,294,331 | ) | | | 85 | | | | 1,051,017 | | | | 59,739,032 | |
7. SUBSEQUENT EVENTS
On October 14, 2016, the State Street Navigator Prime Portfolio, the collateral vehicle for securities lending, became the State Street Navigator Securities Lending Government Money Market Portfolio (“Government Money Market Portfolio”). The Government Money Market Portfolio will seek: (i) current income to the extent consistent with the preservation of capital and liquidity; and (ii) the maintenance of a stable $1.00 per share net asset value.
8. CHANGE OF INDEPENDENT REGISTERED PUBLIC ACCOUNTING FIRM
The Audit Committee of the Board of the Funds dismissed PricewaterhouseCoopers LLP (“PwC”), as the independent registered public accounting firm of the Funds and appointed Cohen & Company, Ltd. (“Cohen”) effective July 27, 2016.
| | |
| ICON Sector Funds | | Report of Independent Registered Public Accounting Firm |
To the Shareholders and Board of Trustees of ICON Funds
We have audited the accompanying statements of assets and liabilities, including the schedules of investments, of ICON Consumer Discretionary Fund, ICON Consumer Staples Fund, ICON Energy Fund, ICON Financial Fund, ICON Healthcare Fund, ICON Industrials Fund, ICON Information Technology Fund, ICON Natural Resources Fund, and ICON Utilities Fund (the “Funds”, each a series of ICON Funds) as of September 30, 2016, and the related statements of operations and changes in net assets, and the financial highlights for the year then ended. These financial statements and financial highlights are the responsibility of the Funds’ management. Our responsibility is to express an opinion on these financial statements and financial highlights based on our audit. The Funds’ financial statements and financial highlights for the years ended September 30, 2015 and prior, were audited by other auditors, whose report dated November 18, 2015 expressed an unqualified opinion on those financial statements and financial highlights.
We conducted our audit in accordance with the standards of the Public Company Accounting Oversight Board (United States). Those standards require that we plan and perform the audit to obtain reasonable assurance about whether the financial statements and financial highlights are free of material misstatement. An audit includes examining, on a test basis, evidence supporting the amounts and disclosures in the financial statements. Our procedures included confirmation of securities owned as of September 30, 2016, by correspondence with the custodian and brokers or by other appropriate auditing procedures where replies from brokers were not received. An audit also includes assessing the accounting principles used and significant estimates made by management, as well as evaluating the overall financial statement presentation. We believe that our audit provides a reasonable basis for our opinion.
In our opinion, the financial statements and financial highlights referred to above present fairly, in all material respects, the financial position of each of the Funds as of September 30, 2016, the results of their operations, the changes in their net assets, and their financial highlights for year then ended, in conformity with accounting principles generally accepted in the United States of America.

COHEN & COMPANY, LTD.
Cleveland, Ohio
November 23, 2016
| | |
| |
| Annual Report | September 30, 2016 | | 89 |
| | |
| ICON Sector Funds | | Disclosure of Fund Expenses |
| | September 30, 2016 (Unaudited) |
Example
As a shareholder of a Fund you may pay two types of fees: transaction fees and fund-related fees. Certain funds charge transaction fees, including sales charges (loads) on purchase payments, reinvested dividends, or other distributions; redemption fees; and exchange fees. Funds also incur various ongoing expenses, including management fees, distribution and/or service fees, and other fund expenses, which are indirectly paid by shareholders.
This Example is intended to help you understand your ongoing costs (in dollars) of investing in the various ICON Funds and to compare these costs with the ongoing costs of investing in other mutual funds. This Example is based on an investment of $1,000 invested at the beginning of the six-month period and held for the six-month period (4/01/16 – 9/30/16).
Actual Expenses
The first line in the table for each Fund provides information about actual account values and actual expenses. The Example includes, but is not limited to, management fees, 12b-1 fees, fund accounting, custody and transfer agent fees. However, the Example does not include client specific fees, such as the $15 fee charged to IRA accounts, or the $15 fee charged for wire redemptions. You may use this information, together with the amount you invested, to estimate the expenses that you paid over the period. Simply divide your account value by $1,000 (for example, an $8,600 account value divided by $1,000 = 8.6), then multiply the result by the number in the first line for each Fund under the heading entitled “Expenses Paid During Period” to estimate the expenses you paid on your account during this period.
Hypothetical Example for Comparison Purposes
The second line in the table for each Fund provides information about hypothetical account values and hypothetical expenses based on the Fund’s actual expense ratio and an assumed rate of return of 5% per year before expenses, which is not the Fund’s actual return. The hypothetical account values and expenses may not be used to estimate the actual ending account balance or expenses you paid for the period. You may use this information to compare the ongoing costs of investing in the Fund and other funds. To do so, compare this 5% hypothetical example with the 5% hypothetical examples that appear in the shareholder reports of the other funds. Please note that the expenses shown in the table are meant to highlight your ongoing costs only and do not reflect any transactional costs, such as sales charges (loads), redemption fees, or exchange fees that may be charged by other funds. Therefore, this information is useful in comparing ongoing costs only, and will not help you determine the relative total costs of owning different funds.
| | | | | | | | | | | | | | | | |
| | | Beginning Account
Value April 1, 2016 | | | Ending Account
Value
September 30, 2016 | | | Expense Ratio(a) | | | Expenses Paid
During period April 1, 2016 -
September 30, 2016(b) | |
| |
ICON Consumer Discretionary Fund | | | | | | | | | | | | | | | | |
Class S | | | | | | | | | | | | | | | | |
Actual | | | $ 1,000.00 | | | | $ 970.60 | | | | 1.38% | | | | $ 6.80 | |
Hypothetical (5% return before expenses) | | | $ 1,000.00 | | | | $ 1,018.10 | | | | 1.38% | | | | $ 6.96 | |
Class A | | | | | | | | | | | | | | | | |
Actual | | | $ 1,000.00 | | | | $ 968.10 | | | | 1.99% | | | | $ 9.79 | |
Hypothetical (5% return before expenses) | | | $ 1,000.00 | | | | $ 1,015.05 | | | | 1.99% | | | | $ 10.02 | |
| | | | |
ICON Consumer Staples Fund | | | | | | | | | | | | | | | | |
Class S | | | | | | | | | | | | | | | | |
Actual | | | $ 1,000.00 | | | | $ 1,020.50 | | | | 1.51% | | | | $ 7.63 | |
Hypothetical (5% return before expenses) | | | $ 1,000.00 | | | | $ 1,017.45 | | | | 1.51% | | | | $ 7.62 | |
Class A | | | | | | | | | | | | | | | | |
Actual | | | $ 1,000.00 | | | | $ 1,020.50 | | | | 1.76% | | | | $ 8.89 | |
Hypothetical (5% return before expenses) | | | $ 1,000.00 | | | | $ 1,016.20 | | | | 1.76% | | | | $ 8.87 | |
| | |
| ICON Sector Funds | | Disclosure of Fund Expenses |
| | September 30, 2016 (Unaudited) |
| | | | | | | | |
| | | Beginning Account
Value April 1, 2016 | | Ending Account
Value
September 30, 2016 | | Expense Ratio(a) | | Expenses Paid During period April 1, 2016 -
September 30, 2016(b) |
|
ICON Energy Fund | | | | | | | | |
Class S | | | | | | | | |
Actual | | $ 1,000.00 | | $ 1,123.30 | | 1.39% | | $ 7.38 |
Hypothetical (5% return before expenses) | | $ 1,000.00 | | $ 1,018.05 | | 1.39% | | $ 7.01 |
Class C | | | | | | | | |
Actual | | $ 1,000.00 | | $ 1,116.80 | | 2.47% | | $ 13.07 |
Hypothetical (5% return before expenses) | | $ 1,000.00 | | $ 1,012.65 | | 2.47% | | $ 12.43 |
Class A | | | | | | | | |
Actual | | $ 1,000.00 | | $ 1,121.00 | | 1.71% | | $ 9.07 |
Hypothetical (5% return before expenses) | | $ 1,000.00 | | $ 1,016.45 | | 1.71% | | $ 8.62 |
| | | | |
ICON Financial Fund | | | | | | | | |
Class S | | | | | | | | |
Actual | | $ 1,000.00 | | $ 1,046.40 | | 1.39% | | $ 7.11 |
Hypothetical (5% return before expenses) | | $ 1,000.00 | | $ 1,018.05 | | 1.39% | | $ 7.01 |
Class A | | | | | | | | |
Actual | | $ 1,000.00 | | $ 1,043.30 | | 1.76% | | $ 8.99 |
Hypothetical (5% return before expenses) | | $ 1,000.00 | | $ 1,016.20 | | 1.76% | | $ 8.87 |
| | | | |
ICON Healthcare Fund | | | | | | | | |
Class S | | | | | | | | |
Actual | | $ 1,000.00 | | $ 1,111.90 | | 1.37% | | $ 7.23 |
Hypothetical (5% return before expenses) | | $ 1,000.00 | | $ 1,018.15 | | 1.37% | | $ 6.91 |
Class A | | | | | | | | |
Actual | | $ 1,000.00 | | $ 1,109.90 | | 1.75% | | $ 9.23 |
Hypothetical (5% return before expenses) | | $ 1,000.00 | | $ 1,016.25 | | 1.75% | | $ 8.82 |
| | | | |
ICON Industrials Fund | | | | | | | | |
Class S | | | | | | | | |
Actual | | $ 1,000.00 | | $ 1,068.90 | | 1.50% | | $ 7.76 |
Hypothetical (5% return before expenses) | | $ 1,000.00 | | $ 1,017.50 | | 1.50% | | $ 7.57 |
Class A | | | | | | | | |
Actual | | $ 1,000.00 | | $ 1,067.70 | | 1.76% | | $ 9.10 |
Hypothetical (5% return before expenses) | | $ 1,000.00 | | $ 1,016.20 | | 1.76% | | $ 8.87 |
| | | | |
ICON Information Technology Fund | | | | | | | | |
Class S | | | | | | | | |
Actual | | $ 1,000.00 | | $ 1,087.20 | | 1.47% | | $ 7.67 |
Hypothetical (5% return before expenses) | | $ 1,000.00 | | $ 1,017.65 | | 1.47% | | $ 7.41 |
Class A | | | | | | | | |
Actual | | $ 1,000.00 | | $ 1,085.30 | | 1.75% | | $ 9.12 |
Hypothetical (5% return before expenses) | | $ 1,000.00 | | $ 1,016.25 | | 1.75% | | $ 8.82 |
| | | | |
ICON Natural Resources Fund | | | | | | | | |
Class S | | | | | | | | |
Actual | | $ 1,000.00 | | $ 1,077.30 | | 1.51% | | $ 7.84 |
Hypothetical (5% return before expenses) | | $ 1,000.00 | | $ 1,017.45 | | 1.51% | | $ 7.62 |
Class C | | | | | | | | |
Actual | | $ 1,000.00 | | $ 1,072.00 | | 2.51% | | $ 13.00 |
Hypothetical (5% return before expenses) | | $ 1,000.00 | | $ 1,012.45 | | 2.51% | | $ 12.63 |
Class A | | | | | | | | |
Actual | | $ 1,000.00 | | $ 1,077.00 | | 1.75% | | $ 9.09 |
Hypothetical (5% return before expenses) | | $ 1,000.00 | | $ 1,016.25 | | 1.75% | | $ 8.82 |
| | |
| |
| Annual Report | September 30, 2016 | | 91 |
| | |
| ICON Sector Funds | | Disclosure of Fund Expenses |
| | September 30, 2016 (Unaudited) |
| | | | | | | | |
| | | Beginning Account
Value April 1, 2016 | | Ending Account
Value
September 30, 2016 | | Expense Ratio(a) | | Expenses Paid During period April 1, 2016 -
September 30, 2016(b) |
|
ICON Utilities Fund | | | | | | | | |
Class S | | | | | | | | |
Actual | | $ 1,000.00 | | $ 1,032.90 | | 1.50% | | $ 7.62 |
Hypothetical (5% return before expenses) | | $ 1,000.00 | | $ 1,017.50 | | 1.50% | | $ 7.57 |
Class A | | | | | | | | |
Actual | | $ 1,000.00 | | $ 1,031.40 | | 1.75% | | $ 8.89 |
Hypothetical (5% return before expenses) | | $ 1,000.00 | | $ 1,016.25 | | 1.75% | | $ 8.82 |
| (a) | The Fund’s expense ratios have been annualized based on the Fund’s most recent fiscal half-year expenses. |
| (b) | Expenses are equal to the Fund’s annualized expense ratio multiplied by the average account value over the period, multiplied by the number of days in the most recent fiscal half-year 183/366 (to reflect the half-year period). |
Total returns exclude applicable sales charges. If sales charges were included (maximum 5.75%), returns would be lower.
| | |
| ICON Sector Funds | | Board of Trustees and Fund Officers |
| | September 30, 2016 (Unaudited) |
The ICON Funds Board of Trustees (the “Board”) consists of four Trustees who oversee the 17 ICON Funds (the “Funds”). The Board is responsible for general oversight of the Funds’ business and for assuring that the Funds are managed in the best interest of the Funds’ shareholders. The Trustees, and their ages, and principal occupations are set forth below. The address of the Trustees is 5299 DTC Blvd., Suite 1200, Greenwood Village, CO 80111. Trustees have no official term of office and generally serve until they resign or are not re-elected.
Interested Trustee
Craig T. Callahan, 65, Chairman of the Board. Dr. Callahan has been a Trustee of the Funds since their inception. Dr. Callahan also serves as Chief Executive Officer (2013 to present); and Chairman of the Investment Committee (2005 to present) and served as the Chief Investment Officer (1991 to 2004) and President (2008 to 2013 and 2014 to present) of ICON Advisers. Dr. Callahan is also Executive Vice President (2005 to present); Director (1991 to present); and was previously President (1998 to 2005) and Chief Compliance Officer (2005) of IDI. Dr. Callahan also serves as the President (1998 to present) and Chairman of the Board of Directors (1994 to present) of ICON Management & Research Corporation (“IM&R”), the parent company of ICON Advisers and IDI.
Independent Trustees
Glen F. Bergert, 66. Mr. Bergert has been a Trustee of the Funds since 1999. Mr. Bergert is President of Venture Capital Management LLC (1997 to present), General Partner of SOGNO Partners LP, a venture capital company (2001 to 2015), General Partner of Bergert Properties, LLP, a real estate holding company (1997 to present), General Partner of Pyramid Real Estate Partnership, a real estate development company (1998 to present), General Partner of Chamois Partners, LP, a venture capital company (2004 to present) and was previously a General Partner with KPMG Peat Marwick, LLP (1979 to 1997). Mr. Bergert is also a Director of Delta Dental of California, an insurance company (2013 to present and 2006 to 2012), Delta Dental of Pennsylvania, an insurance company (1998 to 2009 and 2010 to present), Dentegra Group, Inc, an insurance holding company (2010 to 2014) and Delta Reinsurance Corporation (2015 to present; 2011 to 2014 and 2000 to 2009).
John C. Pomeroy, Jr., 69. Mr. Pomeroy has been a Trustee of the Funds since November 2002. Mr. Pomeroy is Chief Investment Officer and Director of Investments, Pennsylvania State University (2001 to present) and was Portfolio Manager and Product Manager, Trinity Investment Management Corporation (1989 to 2001).
R. Michael Sentel, 68. Mr. Sentel has been a Trustee of the Funds since their inception. Mr. Sentel is a Senior Attorney with the U.S. Department of Education (1996 to present). Mr. Sentel also provides legal representation as a sole practitioner with an emphasis on corporate and transactional law. He served as general counsel to numerous public companies and served on the board of directors of one of these clients. Mr. Sentel began his legal career with the U.S. Securities and Exchange Commission’s Division of Enforcement and served as a Branch Chief (1980 to 1981). Later he served as the Section Chief for the Professional Liability Section of the Federal Deposit Insurance Corp. with responsibility for the Rocky Mountain Region (1991 to 1994).
The Officers of the Funds are:
Craig T. Callahan, 65, Chairman of the Board. Dr. Callahan has been a Trustee of the Funds since their inception. Dr. Callahan also serves as Chief Executive Officer (2013 to present); President (1998 to 2013 and 2014 to present) and Chairman of the Investment Committee (2005 to present) and served as the Chief Investment Officer (1991 to 2004) of ICON Advisers. Dr. Callahan is also Executive Vice President (2005 to present); Director (1991 to present); and was previously President (1998 to 2005) and Chief Compliance Officer (2005) of IDI. Dr. Callahan also serves as the President (1998 to present) and Chairman of the Board of Directors (1994 to present) of IM&R, the parent company of ICON Advisers and IDI.
Donald Salcito, 63. Mr. Salcito serves as Vice President and Secretary of the Funds (November 15, 2006 to present). Mr. Salcito is also Executive Vice President and General Counsel (September 2005 to present) of ICON Advisers; Director of IM&R (2005 to present); Executive Vice President, Secretary, General Counsel of IDI (2005 to present). Previously, he was a Partner in various national law firms, practicing in the securities law area. (1980 to 2005).
Carrie M. Schoffman, 43. Ms. Schoffman has been a Vice President and Principal Financial Officer/Treasurer of the Funds since June 2013. Ms. Schoffman is also Chief Compliance Officer (2013 to present and 2004 to 2008) and Anti-Money Laundering Officer (2013 to present) of the ICON Funds. She is Senior Vice President (2011 to present) and Chief Compliance Officer (2013 to present and 2004 to 2011) of ICON Advisers. Previously, she was a Staff Accountant with the Securities and Exchange Commission (2003 to 2004) and also an Experienced Manager (2001 to 2003) and a Senior Associate/Associate (1996 to 2001) at PricewaterhouseCoopers LLP.
Lesley Caviness, 50. Ms. Caviness serves as Assistant Treasurer of the Funds (2014 to present). She has worked at ICON (2007 to 2008 and 2010 to present) in fund accounting, compliance, business intelligence and performance capacities. Prior to working at ICON, Ms. Caviness was a Real Estate Broker at Seasons Real Estate Group (2008 to 2012) and Signature Real Estate (2014 to present), Finance Manager at Navigant (2000 to 2007), and Associate/Senior Associate (1996 to 2000) at PricewaterhouseCoopers LLP.
| | |
| |
| Annual Report | September 30, 2016 | | 93 |
| | |
| ICON Sector Funds | | Additional Information |
| | September 30, 2016 (Unaudited) |
Renewal of Investment Advisory Agreement
On August 22, 2016, the Board of Trustees, including all of the Trustees that are not “interested persons” of the Trust (the “Independent Trustees”), approved continuation of the Advisory Agreements (as defined below) with the Adviser for each Fund for an additional one-year term commencing October 1, 2016.
In determining to renew the investment advisory agreements between ICON Funds (the “Trust”) and ICON Advisers, Inc. (“ICON” or the “Adviser”) the Trustees requested, were provided with and reviewed data with respect to the Adviser, its personnel, and the services provided and to be provided to each Fund by the Adviser under the Trust’s Investment Advisory Agreement dated October 9, 1996, as amended (related to the Sector Funds, the International Funds and ICON Fund) and under the Trust’s Investment Advisory Agreement dated July 9, 2002 and effective October 1, 2002, as amended (related to the U.S. Diversified Funds — Bond, Risk-Managed Balanced, Equity Income, Opportunities and Long/Short Funds) (collectively, the “Advisory Agreements”).
The Trustees agreed that consideration of the Advisory Agreements should also include consideration of other agreements between the Adviser and the Trust that impact provisions of the Advisory Agreements, including expense limitation agreements as amended effective April 11, 2016. The Trustees were provided with and reviewed data with respect to the Adviser, its personnel, and the services provided and to be provided to each Fund by the Adviser under the Trust’s Advisory Agreements, Administrative Services Agreement and Expense Limitation Agreement and the Distribution Agreement with ICON Distributors, Inc. (“IDI”). The data included information concerning advisory, distribution and administrative services provided to the Funds by ICON and its related companies; information concerning other businesses of those companies; and comparative data obtained from Strategic Insight (“SI”) related to Fund performance and Fund expenses (the “SI Report”).
The Board convened a meeting with SI on August 10, 2016 to discuss the SI Report and the information contained within the SI Report. Kevin Shine, Senior Managing Director, U.S. Research & Advisory of SI, Alana Burke, Vice President, Corporate Accounts and Joe Frelix, project manager on the15(c) report, discussed the findings of the SI Report with the Independent Trustees. Management personnel participated in the SI meeting convened to discuss the data for and with the Board. At the meeting, SI discussed its methodology, peer selection and the difficulty with some sector funds, expenses and fees, and performance relative to the respective Fund’s peers. SI also discussed the Funds size and how a respective Fund’s size would affect economies of scale, in particular, operating expenses. In addition, the Trustees asked SI for a Mutual Fund Administration Analysis (the “SI Admin Analysis”). Mr. Shine walked the Trustees through the SI Admin Analysis.
Also included in the 15(c) discussion was a briefing on factors affecting the ICON investment model; expenses and expense ratios of each Fund and other ICON managed products; relative performance of each Fund; status of expense reimbursements to the Funds by the Adviser; sales and marketing initiatives; specific business factors affecting IDI; the work load on ICON as adviser and administrator to the Funds; current profitability of ICON; staffing levels and staff morale.
The Independent Trustees were represented by independent legal counsel in this process. In August 2016, after participating in the meeting with SI and management, the Independent Trustees met separately as a group in private sessions with their independent legal counsel to review and discuss the foregoing information. Based on these discussions, independent legal counsel and/or the Lead Independent Trustee also contacted management to request additional information from SI. The Board received materials from independent legal counsel discussing the legal standards applicable to their consideration of the ICON-Trust agreements.
In considering the nature, extent and quality of the services provided by the Adviser, the Board reviewed information relating to ICON’s operations and personnel. Among other things, the Adviser provided biographical information on its professional staff and descriptions of its organizational and management structure. In the course of their deliberations the Board evaluated, among other things, information relating to the investment philosophy, strategies and techniques used in managing each Fund, the qualifications and experience of ICON’s investment personnel, ICON’s compliance programs, ICON’s brokerage practices, including the extent to which the Adviser obtains research through “soft dollar” arrangements with the Funds’ brokerage, compliance reports on the foregoing, and the financial and non-financial resources available to provide services required under the Advisory Agreement.
During the discussion, the SI Report and the SI Admin Analysis were discussed and management personnel showed performance for each Fund and discussed the factors affecting performance. The Board inquired from SI whether there was any correlation between fund expenses and performance, and SI saw no direct correlation with the ICON Funds other than the obvious observation that higher expenses reduce performance.
During the discussion on performance, management personnel noted that 2015 was very difficult for active managers. Unlike indexes, ICON is an active manager that is willing to look different from an index.
Management elaborated further on performance. For the one year ended May 31, 2014, only three of ICON’s funds beat their respective benchmarks: Consumer Staples, Information Technology, and Long/Short. For the one year ended June 30, 2016, four of the ICON funds beat their respective benchmarks: Emerging Markets, International Equity, Information Technology, and Utilities. However, on a one year basis, eight are in
| | |
| ICON Sector Funds | | Additional Information |
| | September 30, 2016 (Unaudited) |
the top third of their peer groups of which six of those eight are in the top quartile. The low point in the S & P 1500 Index was February 11, 2016. Since February 11 until July, 2016, ICON performed better than the indexes, as seven of the 12 domestic equity funds beat their respective indexes. Also during that same time period, the equity portion of the ICON Equity Income Fund beat the S&P 1500 Index. Five of the nine ICON Sector Funds beat their index for that same period.
Management noted that Advisers’ performance relative to other valuation managers as judged by the AthenaInvest system is above the medium. SI also noted that from a performance point of view, the Funds in the SI Report are compared using the Morningstar data, and there is no Morningstar category for “all cap” funds, but all ICON Funds are improving.
The Board addressed style consistency with the Adviser. Management advised that, based on the Adviser’s own analysis, and with the restructuring of the Adviser, the Adviser has continued an additional level of review on the Portfolio Managers (“PMs”) to make sure they are adhering to the ICON System; the Senior Vice President of Fund Management has been systematically tracking the Funds’ performance; he evaluates each of the ICON Funds to help ensure all PMs are investing consistently and in accordance with the ICON System by evaluating the Funds from an attribution perspective in monthly meetings.
In connection with reviewing data bearing upon the nature, quality, and extent of services furnished by ICON to each Fund, the Board assessed data concerning ICON’s staffing, systems and facilities. The Board also assessed ICON’s non-Trust business to see if there are any initiatives that would dilute service to the Trust. The Board concluded:
| | A. | That the breadth and the quality of investment advisory and other services being provided to each Fund is satisfactory, as evidenced in part by efforts to address and improve the performance record of each Fund when compared with the performance records of a peer group of comparable funds and markets in general; |
| | B. | That the breadth and the quality of investment advisory and other services being provided to each Fund are satisfactory, the Adviser’s performance is competitive with other fund managers in the value style group, and the Adviser has applied a disciplined approach in the style specified in the Funds’ offering document; |
| | C. | That ICON has made significant expenditures in the past year and in prior years to ensure that it has reasonably sophisticated systems and the highly trained personnel necessary for it to be able to continue to provide quality service to the Funds’ shareholders, including the dedication of substantial resources to ICON’s investment and methodology; |
| | D. | That the Board, after considering compliance reports and compliance initiatives undertaken during the year and conducting individual interviews with selected PMs, is satisfied with the research and portfolio management, that research and portfolio management is being constantly evaluated and improved upon; and that the PMs are evaluating trading services systematically, the Board concluded that the Adviser is providing the Funds with professional management of the nature, quality and scope required by the Funds; and |
| | E. | The risks assumed by ICON in providing investment advisory services to each Fund, including the capital commitments which have been made in the past and which continue to be made by ICON to ensure the continuation of the highest quality of service to the Trust, is made with the recognition that shareholders may redeem their shares at any time without notice and the Trust’s advisory relationship with ICON may be terminated at any time and must be renewed on an annual basis. |
In considering the reasonableness of the fees paid to the Adviser for managing each Fund, the Board reviewed, among other things, data concerning other funds from the SI Report, financial statements of the Adviser and an analysis of the profitability of the Adviser, and its affiliates, and their relationship with each Fund over various time periods, and the SI Admin Analysis. Such analysis identified all revenues and other benefits received by the Adviser and its affiliates from managing each Fund, the costs associated with providing such services and the resulting profitability to the Adviser and its affiliates and a comparison of similar data from reports filed by publicly traded firms.
The Board assessed actual (net) fees for advisory services and Fund expense ratios under the contractual relationship (the Advisory agreements, the Administration Agreement and the Expense Limitation Agreements) with the Adviser as opposed to the fees specified in the applicable Advisory Agreement and expense ratios without application of the expense limitations and the low cost of the Administration Agreement and concluded that the focus should be on actual expense ratios after application of the Expense Limitation Agreements.
The Board considered the current and anticipated asset levels of each Fund and the contractual commitments of the Adviser to waive fees and pay expenses of the Funds from time to time to limit the total expenses of the Funds. The Board also considered the Adviser’s contractual commitment regarding administration and the fact it would continue to lose money on administration. In this regard the Board discussed asset levels in each Fund covered by the Advisory Agreements. ICON’s ability to provide the services called for under the Advisory Agreements was assessed in light of current and projected asset levels. Fund expenses and expense ratios were also assessed in light of current and projected asset levels. The Board concluded that the Adviser has the resources necessary to provide the services called for under the Advisory Agreements; that profitability to the
| | |
| |
| Annual Report | September 30, 2016 | | 95 |
| | |
| ICON Sector Funds | | Additional Information |
| | September 30, 2016 (Unaudited) |
Adviser and its affiliates from their relationship with the Funds, and services provided to the Funds, is not excessive; and that the Adviser is not realizing material benefits from economies of scale that would warrant adjustments to the fees for any Fund at this time. The Board of Trustees concluded that, in light of the nature, extent and quality of the services provided by the Adviser and the levels of profitability associated with providing these services, the fees charged by the Adviser under the Advisory Agreements to each Fund are reasonable.
In connection with assessing data bearing on the fairness of fee arrangements, the Board considered the SI Report and the SI Admin Analysis. It was noted that SI was selected at the May Board meeting to prepare its reports, an extensive analysis of the expense data of other comparable funds; and that Trustee input was solicited and provided in the process. Among other information discussed, it was noted that:
| | A. | the advisory fee structures of the Funds are within the range of funds considered in the comparison with advisory fees and expense ratios of other similarly managed funds as set forth in the comparative data; |
| | B. | ICON has contractually agreed to impose expense limitations on each and every Fund at a cost to ICON; |
| | C. | ICON has contractually committed to break points in its fees so that economies of scale could be realized as a Fund grows in assets, for the benefit of Fund shareholders; |
| | D. | ICON has contractually committed to providing Administration services to the Funds at a cost below the average to its peer group, and within the mutual fund universe of open-end fund managers with less than $10 billion in assets under management, at less than 50% of the fee of those funds, at a loss to ICON. |
The Board also considered the fees charged by the Adviser to other advisory clients as outlined in its Registration Application on Form ADV in connection with assessing data bearing on the fairness of fee arrangements. The Trustees noted that certain ICON institutional/sub-advised type accounts have lower fees than the fees paid by the Funds for a number of reasons, including but not limited to, those clients call for different commitments of time, institutional clients have low and predictable turnover of assets, in competition joint costs are apportioned among paying customers according to elasticity of demand and the Adviser has a limited level of responsibility in sub-managed accounts, or accounts with an investor agent/advisor.
The Board noted that the Funds’ redemptions were similar to industry averages which showed two things: 1) that the Funds’ Performance was not adversely impacting fund redemptions, and 2) that the fees and costs were competitive when compared to size. The Board noted that there are thousands of mutual funds competing; that investors can search and trade funds on the internet or on platforms at very little or no cost; and that if the Adviser were overcharging for its services, the Board would have expected redemptions in excess of industry norms.
The Board concluded that the Adviser is providing the Funds with professional management at a fair, reasonable and competitive price.
In connection with assessing the direct and indirect benefits to ICON from serving as the Funds’ adviser, the Board discussed services provided under the Distribution Agreement and the Administrative Services Agreement which are in addition to services under the Advisory Agreements. It was noted that IDI does not charge a fee to the Funds for its services and that ICON’s fee for administrative services ICON appears from the SI Admin Analysis to be below the average to its peer group, and within the mutual fund universe of open-end fund managers with less than $10 billion in assets under management, at less than 50% of the fee of those funds, at a loss to ICON. The Board noted that ICON receives research assistance (primarily in the form of data) from the use of soft dollars generated from Fund portfolio transactions; that such research assists ICON in providing quality advisory services; that Trust and Adviser compliance personnel continuously evaluate and report on the soft-dollar arrangements and related costs; and the Board concluded that the arrangements are consistent with Fund brokerage practices and benefit the Funds and their shareholders.
Based on these considerations, the Board, including all of the Independent Trustees, concluded that: 1) the continuation of the Advisory Agreements was in the best interests of each Fund and its shareholders, 2) the services to be performed under the Advisory Agreements were required for the operation of the Funds, 3) the advisory services were satisfactory to the Funds in the past, and 4) the fees for the advisory services and other benefits from the relationship with the Trust received by ICON, and its affiliates, were consistent with fees paid by similar funds and other clients of ICON, and were reasonable in light of the comparative data, and within the range of what would have been negotiated at arm’s length in light of all the circumstances.
| | |
| ICON Sector Funds | | Additional Information |
| | September 30, 2016 (Unaudited) |
Supplemental Tax Information
Pursuant to Section 852(b)(3) of the Internal Revenue Code the following Funds designate the amounts listed below as long-term capital gain dividends:
| | | | |
ICON Consumer Discretionary Fund | | $ | 2,499,540 | |
ICON Consumer Staples Fund | | $ | 2,182,632 | |
ICON Healthcare Fund | | $ | 4,598,525 | |
ICON Natural Resources Fund | | $ | 4,742,663 | |
The following Funds designate the percentages listed below of the income dividends distributed in 2015 as qualified dividend income (QDI) as defined in Section 1(h)(11) of the Internal Revenue Code:
| | | | |
ICON Consumer Discretionary Fund | | | 17.63 | % |
ICON Consumer Staples Fund | | | 53.02 | % |
ICON Energy Fund | | | 100.00 | % |
ICON Financial Fund | | | 100.00 | % |
ICON Healthcare Fund | | | 5.73 | % |
ICON Industrials Fund | | | 100.00 | % |
ICON Natural Resources Fund | | | 100.00 | % |
ICON Utilities Fund | | | 100.00 | % |
The following Funds designate the percentages listed below of the income dividends distributed in 2015 as qualifying for the corporate dividends received deduction (DRD) as defined in Section 854(b)(2)of the Internal Revenue Code:
| | | | |
ICON Consumer Discretionary Fund | | | 14.46 | % |
ICON Consumer Staples Fund | | | 51.31 | % |
ICON Energy Fund | | | 100.00 | % |
ICON Financial Fund | | | 100.00 | % |
ICON Healthcare Fund | | | 5.48 | % |
ICON Industrials Fund | | | 100.00 | % |
ICON Natural Resources Fund | | | 100.00 | % |
ICON Utilities Fund | | | 100.00 | % |
Portfolio Holdings
Information related to the 10 largest portfolio holdings of each Fund is made available at www.iconfunds.com within approximately 10 business days after month-end. Additionally, a complete list of each Fund’s holdings is made available approximately 30 days after month-end. Each ICON Fund also files a complete schedule of portfolio holdings for the first and third quarters of its fiscal year with the Securities and Exchange Commission (the “Commission”) on Form N-Q. The ICON Funds’ Forms N-Q are available at www.sec.gov or may be reviewed and copied at the Commission’s Public Reference Room in Washington, DC. Information about the Public Reference Room may be obtained by calling 1-800-SEC-0330.
Proxy Voting
A summarized description of the policies and procedures the ICON Funds use to vote proxies is available free of charge at www.iconfunds.com or by calling 1-800-764-0442.
Information about how the ICON Funds voted proxies related to each Fund’s portfolio securities during the 12-month period ended June 30 is available free of charge at www.iconfunds.com or on the Commission’s website at www.sec.gov.
| | |
| |
| Annual Report | September 30, 2016 | | 97 |
| | |
| ICON Sector Funds | | Additional Information |
| | September 30, 2016 (Unaudited) |
Shareholder Meeting
On August 11, 2016, the ICON Natural Resources Fund held a Special Meeting of Shareholders for the purpose of voting on a proposal to approve and understand that the Fund’s Investment Restrictions and designation as a sector fund which “concentrates its investments in the industries or groups of industries within the sector(s)” allows the Fund to concentrate within the Natural Resources space in sectors in an amount determined by the Adviser in the Adviser’s sole discretion. The proposal was approved with the following votes:
| | | | |
Affirmative | | | 2,689,700.028 | |
Against | | | 268,515.240 | |
Abstain | | | 59,774.353 | |
For More Information
This report is for the general information of the Funds’ shareholders and is not authorized for distribution to prospective investors unless preceded or accompanied by a current prospectus. You may obtain a copy of the prospectus, which contains information about the investment objectives, risks, charges, expenses, and share classes of each ICON Fund, by visiting www.iconfunds.com or by calling 1-800-764-0442. Please read the prospectus carefully before investing.
ICON Distributors, Inc., Distributor.
| | |
| ICON Sector Funds | | Privacy Policy |
| | September 30, 2016 (Unaudited) |
| | |
FACTS | | WHAT DOES ICON DO WITH YOUR PERSONAL INFORMATION? |
Why? | | Financial companies choose how they share your personal information. Federal law gives consumers the right to limit some but not all sharing. Federal law also requires us to tell you how we collect, share, and protect your personal information. Please read this notice carefully to understand what we do. |
| |
| | |
What? | | The types of personal information we collect and share depend on the product or service you have with us. This information can include: |
| |
| | • Social Security number and account balances |
| | • income and transaction history |
| | • checking account information and wire transfer instructions |
| | | When you are no longer our customer, we continue to share your information as described in this notice. |
How? | | All financial companies need to share customers’ personal information to run their everyday business. In the section below, we list the reasons financial companies can share their customers’ personal information; the reasons ICON chooses to share; and whether you can limit this sharing. |
| |
| | |
| | | | |
| | |
Reasons we can share your personal information | | Does ICON share? | | Can you limit this sharing? |
For our everyday business purposes — such as to process your transactions, maintain your account(s), respond to court orders and legal investigations, or report to credit bureaus | | Yes | | No |
For our marketing purposes — to offer our products and services to you | | No | | We don’t share |
For joint marketing with other financial companies | | No | | We don’t share |
For our affiliates’ everyday business purposes — information about your transactions and experiences | | No | | We don’t share |
For our affiliates’ everyday business purposes — information about your creditworthiness | | No | | We don’t share |
For nonaffiliates to market to you | | No | | We don’t share |
| | |
Questions? | | Call 1-800-764-0442 for the ICON Funds and 1-800-828-4881 for ICON Advisers, Inc. and ICON Distributors, Inc. |
| | |
| |
| Annual Report | September 30, 2016 | | 99 |
| | |
| ICON Sector Funds | | Privacy Policy |
| | September 30, 2016 (Unaudited) |
| | |
| |
Who We Are | | |
Who is providing this notice? | | ICON Funds, ICON Advisers, Inc., and ICON Distributors, Inc. (collectively “ICON”) |
What We Do | | |
How does ICON protect my personal information? | | To protect your personal information from unauthorized access and use, we use security measures that comply with federal law. These measures include computer safeguards and secured files and buildings. Contracts with our service providers require them to restrict access to your non-public personal information, and to maintain physical, electronic and procedural safeguards against unintended disclosure. |
How does ICON collect my personal information? | | We collect your personal information, for example, when you |
| | | • open an account or enter into an investment advisory contract |
| | | • provide account information or give us your contact information |
| | | • make a wire transfer |
| | | We also collect your personal information from others, such as credit bureaus, affiliates, or other companies. |
Why can’t I limit all sharing? | | Federal law gives you the right to limit only |
| | | • sharing for affiliates’ everyday business purposes — information about your creditworthiness |
| | | • affiliates from using your information to market to you |
| | | • sharing for nonaffiliates to market to you |
| | | State laws and individual companies may give you additional rights to limit sharing. |
Definitions | | |
Affiliates | | Companies related by common ownership or control. They can be financial and nonfinancial companies. |
| | | • Our affiliates include financial companies such as ICON Funds, ICON Advisers, Inc., and ICON Distributors, Inc. |
Nonaffiliates | | Companies not related by common ownership or control. They can be financial and nonfinancial companies. |
| | | • Nonaffiliates we share with can include financial companies such as custodians, transfer agents, registered representatives, financial advisers and nonfinancial companies such as fulfillment, proxy voting, and class action service providers |
Joint marketing | | A formal agreement between nonaffiliated financial companies that together market financial products or services to you. |
| | | • ICON doesn’t jointly market |

For more information about the ICON Funds, contact us:
| | |
By Telephone | | 1-800-764-0442 |
By E-Mail | | info@iconadvisers.com |
By Mail | | ICON Funds | P.O. Box 1920 | Denver, CO 80201 |
In Person | | ICON Funds | 5299 DTC Boulevard, 12th Floor |
| | Greenwood Village, CO 80111 |
On the Internet | | www.iconfunds.com |
Item 2. Code of Ethics.
(a) The registrant has adopted a code of ethics that applies to the registrant’s principal executive officer, principal financial officer, principal accounting officer or controller, or persons performing similar functions. This code of ethics is included as an Exhibit.
(b) Not used.
(c) There were no amendments, during the period covered by this report, to a provision of the code of ethics that applies to the Registrant’s principal executive officer, principal financial officer, principal accounting officer or controller, or persons performing similar functions, regardless of whether these individuals are employed by the Registrant or a third party, and that relates to any element of the code of ethics description.
(d) The registrant has not granted any waivers, including an implicit waiver, from a provision of the code of ethics that applies to the Registrant’s principal executive officer, principal financial officer, principal accounting officer or controller, or persons performing similar functions, regardless of whether these individuals are employed by the Registrant or a third party, that relates to one or more of the items set forth in paragraph (b) of this item’s instructions.
(e) Not applicable.
(f) See the attached Exhibit.
Item 3. Audit Committee Financial Expert.
3(a)(1) The Registrant’s Board of Trustees has determined that the registrant has at least one audit committee financial expert serving on its audit committee.
3(a)(2) The audit committee financial experts are Glen F. Bergert and R. Michael Sentel, who are “independent” for purposes of this Item 3 of Form N-CSR.
3(a)(3) Not applicable.
Item 4. Principal Accountant Fees and Services.
In each of the fiscal years ended September 30, 2016 and September 30, 2015, the aggregate Audit Fees billed (or to be billed) by Cohen & Company, LTD. (“Cohen”) and PricewaterhouseCoopers LLP (“PwC”), respectively, for professional services rendered for the audits of the financial statements, or services that are normally provided in connection with statutory and regulatory filings or engagements as well as reimbursable expenses are listed below. All of the below fees were paid by the Registrant.
| | | | | | |
| 2016 | | | 2015 | |
| | $216,000 | | | $ | 365,365 | |
In each of the fiscal years ended September 30, 2016 and September 30, 2015, the aggregate Audit-Related Fees billed (or to be billed) by Cohen and PwC, respectively, for services rendered for assurance and related services to each fund that are reasonably related to the performance of the audit or review of the fund’s financial statements, but not reported as Audit Fees, are shown in the table below.
In each of the fiscal years ended September 30, 2016 and September 30, 2015 the aggregate Tax Fees billed (or to be billed) by Cohen and PwC, respectively, for professional services rendered for tax return preparation, tax compliance, tax advice and tax planning are shown in the table below. All of the below fees were paid by the Registrant.
| | | | | | |
| 2016 | | | 2015 | |
| | $81,000 | | | $ | 134,800 | |
In each of the fiscal years ended September 30, 2015 and September 30, 2014 the aggregate Other Fees billed (or to be billed) by Cohen and PwC, respectively, for all other non-audit services rendered are shown in the table below. All of the below fees were paid by the Registrant.
(e)(1) The audit committee of the Registrant’s Board of Trustees is required to pre-approve all services to be provided by the independent accountants to the Registrant or the Registrant’s investment adviser and to any entity controlling, controlled by or under common control with the investment adviser that provides on-going services to the Registrant to determine whether the services performed by the independent accountants impair their independence from the Registrant. The audit committee has delegated authority to the Chairman of the audit committee, subject to review and ratification by the full audit committee.
(e)(2) 100% of the fees were approved by the Registrant’s audit committee pursuant to paragraph (c)(7)(i)(C) if Rule 2-01 of Regulation S-X.
(f) For the fiscal year ended September 30, 2016, the percentage of hours spent on the audit of the Registrant’s financial statements that were attributed to work performed by persons who are not full-time, permanent employees of Cohen was 12%.
(g) See Item 4(d) above.
(h) There were no non-audit fees provided by Cohen or PwC respectively, in the fiscal year ending September 30, 2016 or September 30, 2015 to the investment adviser or to any entity controlling, controlled by, or under common control with the investment adviser that provides on-going services to the Registrant.
| Item 5. | Audit Committee of Listed Registrants. |
Not applicable.
(a) The schedule of investments in securities of unaffiliated issuers is included in Item 1.
(b) Not applicable.
Item 7. Disclosure of Proxy Voting Policies and Procedures for Closed-End Management Investment Companies.
Not applicable.
Item 8. Portfolio Managers of Closed-End Management Investment Companies.
Not applicable.
Item 9. Purchases of Equity Securities by Closed-End Management Investment Company and Affiliated Purchasers.
Not applicable.
Item 10. Submission of Matters to a Vote of Security Holders.
Not applicable.
Item 11. Controls and Procedures.
(a) The registrant’s principal executive officer and principal financial officer have concluded, based on their evaluation of the Registrant’s disclosure controls and procedures as conducted within 90 days of the filing date of this report, that these disclosure controls and procedures are adequately designed and are operating effectively to ensure that information required to be disclosed by the registrant on Form N-CSR is recorded, processed, summarized and reported within the time periods specified in the Securities and Exchange Commission’s rules and forms.
(b) There were no changes in the registrant’s internal control over financial reporting that occurred during the second fiscal quarter of the period covered by this report that have materially affected or are reasonably likely to materially affect, the registrant’s internal control over financial reporting.
Item 12. Exhibits.
(a)(1) The code of ethics is attached.
(a)(2) Certifications pursuant to Rule 30a-2(a) are attached.
(a)(3) Not applicable.
(b) Certifications pursuant to Rule 30a-2(b) are furnished herewith.
SIGNATURES
Pursuant to the requirements of the Securities Exchange Act of 1934 and the Investment Company Act of 1940, the registrant has duly caused this report to be signed on its behalf by the undersigned, thereunto duly authorized.
| | |
| By (Signature and Title)* | | /s/ Craig T. Callahan |
| | Craig T. Callahan, President and Chief Executive Officer (Principal Executive Officer) |
Pursuant to the requirements of the Securities Exchange Act of 1934 and the Investment Company Act of 1940, this report has been signed below by the following persons on behalf of the registrant and in the capacities and on the dates indicated.
| | |
| By (Signature and Title)* | | /s/ Craig T. Callahan |
| | Craig T. Callahan, President and Chief Executive Officer (Principal Executive Officer) |
| | |
| By (Signature and Title)* | | /s/ Carrie M. Schoffman |
| | Carrie M. Schoffman, Vice President, Chief Compliance Officer and Treasurer (Principal Financial Officer and Principal Accounting Officer) |
| * | Print the name and title of each signing officer under his or her signature. |