Table of Contents
UNITED STATES
SECURITIES AND EXCHANGE COMMISSION
Washington, D.C. 20549
FORM N-CSR/A
CERTIFIED SHAREHOLDER REPORT OF REGISTERED
MANAGEMENT INVESTMENT COMPANIES
Investment Company Act file number 811-07883
ICON Funds
(Exact name of registrant as specified in charter)
5299 DTC Blvd. Suite 1200 Greenwood Village, CO 80111
(Address of principal executive offices) (Zip code)
Carrie M. Schoffman 5299 DTC Blvd. Suite 1200 Greenwood Village, CO 80111
(Name and address of agent for service)
Registrant’s telephone number, including area code: 303-790-1600
Date of fiscal year end: September 30, 2015
Date of reporting period: March 31, 2015
Table of Contents
Item 1. Reports to Stockholders.
Table of Contents

2015 ANNUAL REPORT
ICON INTERNATIONAL FUNDS
INVESTMENT UPDATE
ICON Emerging Markets Fund
ICON International Equity Fund

1-800-764-0442 | www.iconfunds.com
Table of Contents

You can now sign up for electronic delivery of ICON Fund shareholder reports, including prospectuses, annual reports, semiannual reports and proxy statements.
When these materials are available, you will receive an email from ICON with instructions on how to view the documents. Statements, transaction confirmations and other documents that are not available online will continue to be sent to you by U.S. mail.
Visit ICON’s website at www.iconfunds.com to learn more and sign up.
You may change or cancel your participation in eDelivery by visiting www.iconfunds.com, or you can request a hard copy of any of the materials free of charge by calling ICON Funds at 1-800-764-0442.
1-800-764-0442 • www.iconfunds.com
Table of Contents

| 2 | ||||
Management Overview (Unaudited) and Schedules of Investments | ||||
| 4 | ||||
| 13 | ||||
| 24 | ||||
| 32 | ||||
| 36 | ||||
| 51 | ||||
| 52 | ||||
| 54 | ||||
| 57 | ||||
| 65 | ||||
Table of Contents
Historical Returns
All total returns mentioned in this Report account for the change in a Fund’s per-share price and the reinvestment of any dividends, capital gain distributions and adjustments for financial statement purposes. If your account is set up to receive Fund distributions in cash rather than to reinvest them, your actual return may differ from these figures. The Funds’ performance results do not reflect the deduction of taxes that a shareholder would pay on Fund distributions or on the redemption of Fund shares. The Adviser may have reimbursed certain fees or expenses of some of the Funds. If not for these reimbursements, performance would have been lower. Fund results shown, unless otherwise indicated, are at net asset value. If a sales charge (maximum 5.75%) had been deducted, results would have been lower.
Past performance does not guarantee future results. Investment return and principal value will fluctuate so that an investor’s shares, when redeemed, may be worth more or less than their original cost. Performance results represent past performance, and current performance may be higher or lower. Please call 1-800-764-0442 or visit www.iconfunds.com for performance results current to the most recent month-end.
Portfolio Data
This Report reflects ICON’s portfolio holdings as of September 30, 2015, the end of the reporting period. The information is not a complete analysis of every aspect of any sector, industry, security or the Funds.
There are risks associated with mutual fund investing, including the loss of principal. The likelihood of loss may be greater if you invest for a shorter period of time. There is no assurance that the investment process will consistently lead to successful results.
An investment in a region fund may involve greater risk and volatility than a diversified fund. An investment concentrated in sectors and industries may involve greater risk and volatility than a more diversified investment.
Investments in foreign securities may entail unique risks, including political, market, and currency risks. Financial statements of foreign companies are governed by different accounting, auditing, and financial standards than U.S. companies and may be less transparent and uniform than in the United States. Many corporate governance standards, which help ensure the integrity of public information in the United States, do not exist in foreign countries. In general, there may be less governmental supervision of foreign
| 2 | ABOUT THIS REPORT |
Table of Contents
stock exchanges and securities brokers and issuers. The ICON system relies on the integrity of the financial statements released to the market as part of our analysis.
The prospectus and statement of additional information contain this and other information about the Funds and are available by visiting www.iconfunds.com or calling 1-800-764-0442. Please read the prospectus and statement of additional information carefully.
Financial Intermediary
If you purchase the Fund through a broker-dealer or other financial intermediary (such as a bank), the Fund and its related companies may pay the intermediary for the sale of Fund shares and related services. These payments may influence the broker-dealer or other intermediary and your salesperson to recommend the Fund over another investment. Ask your salesperson or visit your financial intermediary’s website for more information.
| ABOUT THIS REPORT | 3 |
Table of Contents
| Q. | How did the Fund perform relative to its benchmark? |
| A. | The ICON Emerging Markets Fund (the Fund) Class S returned -5.61% for the fiscal year ended September 30, 2015, while its benchmark, the MSCI Emerging Markets Index, returned -18.98%. Total returns for other periods and additional Class shares as of September 30, 2015, appear in the subsequent pages of this Fund’s Management Overview. |
| Q. | What primary factors were behind the Fund’s relative performance? |
| A. | Unlike the previous fiscal year’s gain, the emerging markets benchmark experienced a marked decline over the course of fiscal year 2015. While the U.S. economy continued to show signs of improvement relative to the rest of the world, headwinds investors faced internationally during the period included economic growth concerns, especially with respect to that of China and many of its emerging markets peers, currency volatility, and the prospect of the Federal Reserve raising rates for the first time since 2006. However, despite these headwinds, interest rates generally remained low and monetary policy continued to be accommodative globally. |
From a country perspective, Hungary was the sole country within the emerging markets benchmark to experience positive returns during the period. China was the second best performing country, despite its negative return for the fiscal year and its significant drop in performance that began in mid-2015. Greece, dealing with debt problems and a possibility of its exit from the Eurozone, was the worst performing country in the emerging markets space. While the Fund did not participate in Hungary’s upside move, China, an average underweight for the Fund during the period, was one of the larger contributors to relative performance. Having no position in Greece during the period also contributed to performance relative to the benchmark. Lastly, the Fund’s overweight position in India was the largest contributor to relative performance while the Fund’s underweight position in South Africa detracted the most from relative performance.
From a sector perspective, although each sector in the benchmark experienced a decline during the period, the Health Care sector was the best performing sector followed by Information Technology. The Fund had an overweight position relative to the benchmark in both sectors during the period, contributing to the Fund’s performance relative to the
| 4 | MANAGEMENT OVERVIEW |
Table of Contents
benchmark. The Energy and Materials sectors were the two worst performing sectors during the period and the Fund’s underweight position in both sectors contributed to the Fund’s performance relative to the benchmark. Finally, the Financials sector, an average underweight in the Fund, was the largest contributor to relative performance while the Consumer Discretionary sector, an average overweight, was the largest and only detractor on a relative basis.
| Q. | How did the Fund’s composition affect performance? |
| A. | The top country contributors to Fund performance during the period were China, India, and Taiwan. South Korea, Brazil and South Africa detracted the most from Fund performance. Top sector contributors to Fund performance during the period included Health Care, led by the pharmaceuticals industry, and Industrials, an average sector overweight that was led by the airport services industry. The Consumer Discretionary sector, where the catalog retail industry was the largest detractor, and the Financials sector, where diversified banks was the largest detractor, detracted the most from Fund performance. |
From a total effect standpoint, countries that added the most to relative performance in addition to India included China and Brazil. Countries detracting the most from relative performance in addition to South Africa included Malaysia, an average underweight, and Taiwan. Sectors adding the most to relative performance from a total effect standpoint, in addition to Financials, included Industrials and Energy. As mentioned previously, the Consumer Discretionary sector was the only sector that detracted from relative performance from a total effect standpoint.
With equity valuations appearing to be stretched during the period, a higher than average allocation to cash was used for defensive purposes, which added significantly to benchmark relative performance. The Fund did not employ currency hedging during the period.
| Q. | What is your investment outlook for emerging markets? |
| A. | At the end of fiscal year 2015, the emerging markets value-to-price (V/P) ratio stood at 0.89, indicating that, on average, emerging markets stocks are overpriced according to our system. Having surpassed our estimates of fair value, we have built up a cash position that we intend to put toward better bargains as they present themselves. Economic growth outside of the United States remains a key concern for investors, particularly as it relates to China and many of its fellow emerging market countries. Despite the prospect of the Federal Reserve tightening monetary policy in the near term, monetary policy in general remains accommodative globally. |
| MANAGEMENT OVERVIEW | 5 |
Table of Contents
Although our system continues to indicate emerging markets in general are overvalued, there are still areas demonstrating good bargains according to our methodology. Examples of countries where we see opportunities include India and Thailand, and the Fund is overweight in both countries. Industries in which we are finding opportunities include internet software & services, health care facilities and property & casualty insurance. Guided by our disciplined, systematic and non-emotional approach to investing, we remain ready to reallocate and adapt as our investment system dictates.
ICON Emerging Markets Fund
Country Composition
September 30, 2015
India | 21.5% | |||
South Korea | 20.8% | |||
South Africa | 9.4% | |||
China | 8.5% | |||
Hong Kong | 6.5% | |||
Thailand | 4.4% | |||
Turkey | 3.2% | |||
Philippines | 2.8% | |||
Mexico | 2.6% | |||
Brazil | 2.2% | |||
Taiwan | 2.2% | |||
Malaysia | 0.9% | |||
|
| |||
| 85.0% | ||||
|
|
Percentages are based upon common and preferred stocks as a percentage of net assets.
ICON Emerging Markets Fund
Sector Composition
September 30, 2015
Financials | 26.6% | |||
Information Technology | 13.7% | |||
Consumer Discretionary | 13.1% | |||
Consumer Staples | 8.8% | |||
Industrials | 7.5% | |||
Health Care | 5.2% | |||
Telecommunication Services | 3.3% | |||
Utilities | 4.5% | |||
Materials | 1.9% | |||
Energy | 0.4% | |||
|
| |||
| 85.0% | ||||
|
|
Percentages are based upon common and preferred stocks as a percentage of net assets.
| 6 | MANAGEMENT OVERVIEW |
Table of Contents
ICON Emerging Markets Fund
Industry Composition
September 30, 2015
Diversified Banks | 11.1% | |||
Multi-Sector Holdings | 5.0% | |||
Internet Software & Services | 4.0% | |||
Health Care Facilities | 3.4% | |||
Technology Hardware, Storage & Peripherals | 3.3% | |||
Wireless Telecommunication Services | 3.3% | |||
Household Products | 3.2% | |||
Gas Utilities | 2.6% | |||
Automobile Manufacturers | 2.5% | |||
Airport Services | 2.4% | |||
Life & Health Insurance | 2.4% | |||
Property & Casualty Insurance | 2.3% | |||
Environmental & Facilities Services | 2.2% | |||
Motorcycle Manufacturers | 2.2% | |||
Semiconductors | 2.2% | |||
Thrifts & Mortgage Finance | 2.2% | |||
Tobacco | 2.2% | |||
Cable & Satellite | 2.1% | |||
Water Utilities | 1.9% | |||
IT Consulting & Other Services | 1.8% | |||
Pharmaceuticals | 1.8% | |||
Electronic Manufacturing Services | 1.4% | |||
Real Estate Development | 1.4% | |||
Reinsurance | 1.4% | |||
Casinos & Gaming | 1.3% | |||
Diversified Chemicals | 1.3% | |||
Marine Ports & Services | 1.2% | |||
Broadcasting | 1.0% | |||
Electronic Equipment & Instruments | 1.0% | |||
Specialty Stores | 1.0% | |||
Other Industries (each less than 1%) | 9.9% | |||
|
| |||
| 85.0% | ||||
|
|
Percentages are based upon common and preferred stocks as a percentage of net assets.
| MANAGEMENT OVERVIEW | 7 |
Table of Contents
ICON Emerging Markets Fund
Average Annual Total Return
as of September 30, 2015
| Inception Date | 1 Year | 5 Years | 10 Years | Since Inception | Gross Expense Ratio* | Net Expense Ratio* | ||||||||||||||||||||||
ICON Emerging Markets Fund - Class S | 2/25/97 | -5.61% | 1.23% | 3.52% | 2.58% | 2.11% | 1.88% | |||||||||||||||||||||
ICON Emerging Markets Fund - Class C | 1/25/08 | -6.68% | 0.24% | N/A | -1.11% | 4.65% | 2.78% | |||||||||||||||||||||
ICON Emerging Markets Fund - Class A | 5/31/06 | -5.84% | 1.02% | N/A | 1.48% | 4.32% | 1.95% | |||||||||||||||||||||
ICON Emerging Markets Fund - Class A (including maximum sales charge of 5.75%) | 5/31/06 | -11.27% | -0.16% | N/A | 0.84% | 4.32% | 1.95% | |||||||||||||||||||||
MSCI Emerging Markets Index | -18.98% | -3.25% | 4.60% | 5.13% | N/A | N/A | ||||||||||||||||||||||
Past performance is not a guarantee of future results. Information about these performance results and the comparative indexes can be found in the About This Report section. The Fund’s name and investment strategy changed effective May 5, 2014. The Fund’s past performance would have been different if the current strategy had been in effect. The Adviser has agreed to limit certain Fund expenses; without these limitations, returns would have been lower. The limitation provisions may be terminated in the future.
| * | Please see the most recent prospectus for details. |
Class C total returns exclude applicable sales charges. If sales charges were included returns would be lower.
| 8 | MANAGEMENT OVERVIEW |
Table of Contents
ICON Emerging Markets Fund
Value of a $10,000 Investment
through September 30, 2015
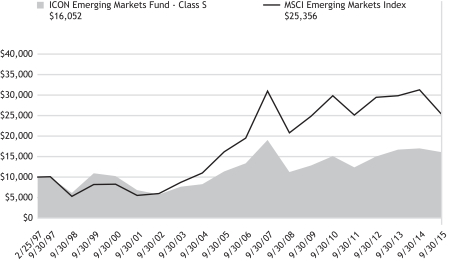
Past performance is not a guarantee of future results. The above graph compares a $10,000 investment made in the Emerging Markets Fund’s Class S shares on the Class’ inception date of 2/25/97 to a $10,000 investment made in an unmanaged securities index on that date. The Fund’s name and investment strategy changed effective May 5, 2014. The Fund’s past performance would have been different if the current strategy had been in effect. Performance for the Emerging Markets Fund’s other share classes will vary due to differences in charges and expenses. The Emerging Markets Fund’s performance in this chart and the performance table assumes the reinvestment of dividends, capital gain distributions and tax return of capital, but does not reflect the deduction of taxes that a shareholder would pay on Fund distributions or on the redemption of Fund shares.
| MANAGEMENT OVERVIEW | 9 |
Table of Contents
ICON EMERGING MARKETS FUND
SCHEDULEOF INVESTMENTS
SEPTEMBER 30, 2015
| Shares or Principal Amount | Value | |||||||
| Common Stocks (84.5%) | ||||||||
| Agricultural Products (0.3%) | ||||||||
| 22,000 | Genting Plantations Bhd* | $ | 49,501 | |||||
|
| |||||||
| Airport Services (2.4%) | ||||||||
| 54,000 | Airports of Thailand PCL* | 419,138 | ||||||
|
| |||||||
| Apparel Retail (0.7%) | ||||||||
| 9,100 | Mr Price Group, Ltd.* | 127,032 | ||||||
|
| |||||||
| Automobile Manufacturers (2.5%) | ||||||||
| 17,000 | Ford Otomotiv Sanayi* | 181,668 | ||||||
| 3,600 | Maruti Suzuki India, Ltd.* | 257,060 | ||||||
|
| |||||||
| 438,728 | ||||||||
| Brewers (0.7%) | ||||||||
| 24,500 | AMBEV S.A.** | 120,013 | ||||||
|
| |||||||
| Broadcasting (1.0%) | ||||||||
| 30,000 | Zee Entertainment Enterprises, Ltd.* | 179,780 | ||||||
|
| |||||||
| Cable & Satellite (2.1%) | ||||||||
| 2,870 | Naspers, Ltd., Class N* | 359,689 | ||||||
|
| |||||||
| Casinos & Gaming (1.3%) | ||||||||
| 6,500 | Kangwon Land, Inc.* | 232,319 | ||||||
|
| |||||||
| Catalog Retail (0.7%) | ||||||||
| 750 | CJ O Shopping Co., Ltd.* | 117,430 | ||||||
|
| |||||||
| Diversified Banks (10.6%) | ||||||||
| 96,000 | Akbank T.A.S.* | 215,355 | ||||||
| 90,000 | BDO Unibank, Inc.* | 199,600 | ||||||
| 65,000 | Grupo Financiero Banorte S.A.B. de C.V., Class O** | 318,831 | ||||||
| 15,200 | HDFC Bank, Ltd.* | 248,541 | ||||||
| Shares or Principal Amount | Value | |||||||
| 88,700 | ICICI Bank, Ltd.* | $ | 365,570 | |||||
| 55,000 | Malayan Banking Bhd* | 107,297 | ||||||
| 10,800 | Standard Bank Group, Ltd.* | 105,453 | ||||||
| 25,400 | Yes Bank, Ltd.* | 283,809 | ||||||
|
| |||||||
| 1,844,456 | ||||||||
| Diversified Chemicals (1.3%) | ||||||||
| 39,400 | Tata Chemicals, Ltd.* | 230,553 | ||||||
|
| |||||||
| Diversified Support Services (0.7%) | ||||||||
| 1,200 | KEPCO Plant Service & Engineering Co., Ltd.* | 122,824 | ||||||
|
| |||||||
| Electronic Equipment & Instruments (1.0%) | ||||||||
| 4,500 | SFA Engineering Corp.* | 171,202 | ||||||
|
| |||||||
| Electronic Manufacturing Services (1.4%) | ||||||||
| 40,000 | AAC Technologies Holdings, Inc.* | 250,466 | ||||||
|
| |||||||
| Environmental & Facilities Services (2.2%) | ||||||||
| 268,000 | China Everbright International, Ltd.* | 378,579 | ||||||
|
| |||||||
| Food Distributors (0.7%) | ||||||||
| 5,700 | Hyundai Greenfood Co., Ltd.* | 123,467 | ||||||
|
| |||||||
| Gas Utilities (2.6%) | ||||||||
| 42,000 | China Resources Gas Group, Ltd.* | 107,965 | ||||||
| 10,400 | Korea Gas Corp.* | 349,278 | ||||||
|
| |||||||
| 457,243 | ||||||||
| Health Care Facilities (3.4%) | ||||||||
| 8,200 | Apollo Hospitals Enterprise, Ltd.* | 180,002 | ||||||
| 159,000 | Life Healthcare Group Holdings, Ltd.* | 409,022 | ||||||
|
| |||||||
| 589,024 | ||||||||
| 10 | SCHEDULEOF INVESTMENTS |
Table of Contents
| Shares or Principal Amount | Value | |||||||
| Highways & Railtracks (0.6%) | ||||||||
| 32,000 | CCR S.A.** | $ | 98,232 | |||||
|
| |||||||
| Hotels, Resorts & Cruise Lines (0.7%) | ||||||||
| 1,000 | Hana Tour Service, Inc.* | 122,861 | ||||||
|
| |||||||
| Household Appliances (0.9%) | ||||||||
| 2,200 | Coway Co., Ltd.* | 155,674 | ||||||
|
| |||||||
| Household Products (3.2%) | ||||||||
| 780 | LG Household & Health Care, Ltd.* | 564,477 | ||||||
|
| |||||||
| Industrial Conglomerates (0.4%) | ||||||||
| 12,000 | Beijing Enterprises Holdings, Ltd.* | 72,369 | ||||||
|
| |||||||
| Internet Software & Services (4.0%) | ||||||||
| 240 | NAVER Corp.* | 104,025 | ||||||
| 35,045 | Tencent Holdings, Ltd.* | 591,653 | ||||||
|
| |||||||
| 695,678 | ||||||||
| IT Consulting & Other Services (1.8%) | ||||||||
| 11,200 | Infosys, Ltd.* | 197,844 | ||||||
| 12,000 | Wipro, Ltd.* | 109,640 | ||||||
|
| |||||||
| 307,484 | ||||||||
| Life & Health Insurance (2.4%) | ||||||||
| 50,000 | China Life Insurance Co. Ltd., Class H* | 174,219 | ||||||
| 49,000 | Ping An Insurance Group Co., Class H* | 245,171 | ||||||
|
| |||||||
| 419,390 | ||||||||
| Marine Ports & Services (1.2%) | ||||||||
| 47,600 | Adani Ports and Special Economic Zone* | 217,449 | ||||||
|
| |||||||
| Motorcycle Manufacturers (2.2%) | ||||||||
| 10,300 | Hero MotorCorp, Ltd.* | 376,881 | ||||||
|
| |||||||
| Multi-Sector Holdings (5.0%) | ||||||||
| 17,000 | Ayala Corp.* | 279,150 | ||||||
| 53,000 | Haci Omer Sabanci Holding* | 155,511 | ||||||
| 23,900 | Remgro, Ltd.* | 435,906 | ||||||
|
| |||||||
| 870,567 | ||||||||
| Shares or Principal Amount | Value | |||||||
| Oil & Gas Storage & Transportation (0.4%) | ||||||||
| 4,500 | Ultrapar Participacoes S.A.** | $ | 75,823 | |||||
|
| |||||||
| Personal Products (0.9%) | ||||||||
| 16,000 | Hengan International Group Co., Ltd.* | 156,451 | ||||||
|
| |||||||
| Pharmaceuticals (1.8%) | ||||||||
| 60,000 | China Medical System Holdings, Ltd.* | 68,518 | ||||||
| 3,800 | Dr. Reddy’s Laboratories, Ltd.* | 241,521 | ||||||
|
| |||||||
| 310,039 | ||||||||
| Property & Casualty Insurance (2.3%) | ||||||||
| 8,000 | Hyundai Marine & Fire Insurance Co., Ltd.* | 204,117 | ||||||
| 820 | Samsung Fire & Marine Insurance Co., Ltd.* | 193,637 | ||||||
|
| |||||||
| 397,754 | ||||||||
| Real Estate Development (1.4%) | ||||||||
| 106,000 | China Resources Land, Ltd.* | 250,299 | ||||||
|
| |||||||
| Real Estate Operating Companies (0.8%) | ||||||||
| 116,000 | Central Pattana PCL* | 143,206 | ||||||
|
| |||||||
| Reinsurance (1.4%) | ||||||||
| 20,784 | Korean Reinsurance Co.* | 250,233 | ||||||
|
| |||||||
| Semiconductors (2.2%) | ||||||||
| 94,000 | Taiwan Semiconductor Manufacturing Co., Ltd.* | 376,721 | ||||||
|
| |||||||
| Soft Drinks (0.8%) | ||||||||
| 25,000 | Arca Continental S.A.B. de C.V.** | 140,788 | ||||||
|
| |||||||
| Specialty Chemicals (0.6%) | ||||||||
| 7,900 | Asian Paints, Ltd.* | 101,419 | ||||||
|
| |||||||
| Specialty Stores (1.0%) | ||||||||
| 1,890 | Hotel Shilla Co., Ltd.* | 184,216 | ||||||
|
| |||||||
| SCHEDULEOF INVESTMENTS | 11 |
Table of Contents
| Shares or Principal Amount | Value | |||||||
| | Technology Hardware, Storage & Peripherals (3.3%) | | ||||||
| 596 | Samsung Electronics Co., Ltd.* | $ | 571,834 | |||||
|
| |||||||
| Thrifts & Mortgage Finance (2.2%) | ||||||||
| 54,800 | LIC Housing Finance Ltd.* | 392,655 | ||||||
|
| |||||||
| Tobacco (2.2%) | ||||||||
| 75,200 | ITC, Ltd.* | 377,302 | ||||||
|
| |||||||
| Water Utilities (1.9%) | ||||||||
| 472,000 | Beijing Enterprises Water Group, Ltd.*† | 331,999 | ||||||
|
| |||||||
| | Wireless Telecommunication Services (3.3%) | | ||||||
| 15,000 | Advanced Info Service PCL* | 93,555 | ||||||
| 50,000 | Intouch Holdings PCL, Class F* | 100,597 | ||||||
| 15,200 | MTN Group, Ltd.* | 195,461 | ||||||
| 810 | SK Telecom Co., Ltd.* | 179,687 | ||||||
|
| |||||||
| 569,300 | ||||||||
|
| |||||||
| Shares or Principal Amount | Value | |||||||
|
| Total Common Stocks (Cost $15,633,119) | $ | 14,742,545 | |||||
| Preferred Stock (0.5%) | ||||||||
| Diversified Banks (0.5%) | ||||||||
| 13,750 | Itau Unibanco Holding S.A.** | 91,944 | ||||||
|
| |||||||
|
| Total Preferred Stocks (Cost $196,055) | 91,944 | ||||||
| Short-Term Investments (14.8%) | ||||||||
| $ | 2,579,245 | State Street Euro Dollar Time Deposit (USD), 0.01%, 10/01/15 | 2,579,245 | |||||
|
| |||||||
|
| Total Short-Term Investments (Cost $2,579,245) | 2,579,245 | ||||||
|
| Total Investments 99.8% (Cost $18,408,419) | 17,413,734 | ||||||
| | Other Assets Less Liabilities 0.2% | 35,645 | ||||||
|
| |||||||
| Net Assets 100.0% | $ | 17,449,379 | ||||||
|
| |||||||
The accompanying notes are an integral part of the financial statements.
| * | The value of foreign securities fair valued (Note 2) as of September 30, 2015 was 80.2% of net assets. |
| † | Non-income producing security. |
| ** | This security is considered a Level 1 security. See Note 2 for further details. |
| 12 | SCHEDULEOF INVESTMENTS |
Table of Contents
MANAGEMENT OVERVIEW (UNAUDITED) |
| Q. | How did the Fund perform relative to its benchmark? |
| A. | The ICON International Equity Fund (the Fund) Class S returned -3.15% for the fiscal year ended September 30, 2015, while the MSCI All Country World Index ex-United States (ACWI ex-U.S.) returned -11.78%. Total returns for other periods and additional Class shares as of September 30, 2015, appear in the subsequent pages of this Fund’s Management Overview. |
| Q. | What primary factors were behind the Fund’s relative performance? |
| A. | We finished fiscal year 2015 with global stock market losses as the global economy digested increased financial volatility and economic uncertainty. China found itself under the spotlight as continued slower growth brought forth worries about the ripple effects on the broader global economy. While other sectors and countries adjusted to this slowdown, China experienced large gyrations in its equity markets, which prompted government intervention in its markets. Japan experienced a slow recovery from recession, with the assistance of a stimulative monetary policy. However, the slow pace of the recovery begs the question of whether there is a need for further future policy action in Asia’s second largest economy. Europe generally experienced continued growth amidst the undercurrents of the domestic and global economy. Greece dominated headlines as fiscal problems and backlashes against austerity brought a real possibility of its exit from the Eurozone. As the period closed, we still saw modest upside in the global markets overall with some regions showing great bargains and others appearing slightly overpriced according to our system. |
At the beginning of the fiscal year, our valuation model signaled a modest 8% upside to fair value for global markets and pointed the Fund towards an overweight position in the cyclical sectors of the market such as Information Technology, Industrials, and Consumer Discretionary. From a regional perspective, the Fund maintained an overweight position in European equities as well as an underweight position in the Asia-Pacific region and Western Hemisphere. Emerging market equities remained overvalued according to our model and the Fund maintained an underweight position in those regions as well. Despite the ongoing issues looming over the world economy as well as rotations within the Fund that may seem contrarian, our discipline and focus on value guided our decisions, which we believe will benefit the Fund going forward.
| MANAGEMENT OVERVIEW | 13 |
Table of Contents
As a multi-cap manager, we are not restricted by market capitalization. However, following our valuation readings led to a concentration in small and mid-cap companies during the period and an underweight position in large-cap stocks relative to the benchmark. Overall, large-cap stocks outperformed their small and mid-cap peers, which detracted from the fund’s relative performance.
Currency movements worldwide throughout the fiscal year also had a negative impact on the Fund’s returns. The U.S. dollar broadly strengthened throughout the year versus most of the underlying currencies of the holdings in the Fund. Currency hedging was not used during the fiscal year.
| Q. | How did the Fund’s composition affect performance? |
| A. | The Fund’s primary contributors to benchmark relative performance came from the Industrials and Information Technology sectors. Specifically, overweight positions in the diversified support services and industrial machinery industries within the Industrials sector and semiconductors and IT consulting & other services industries within the Information Technology Sector contributed to performance relative to the benchmark. Further, an underweight position in the poor performing Financials sector, specifically in the diversified banks industry, proved beneficial. |
Conversely, the Consumer Staples sector was a detractor, as the agricultural products and food retail industries hindered the Fund’s returns. The Energy sector was another notable source of relative underperformance as the sector was the worst performing sector for the period. The oil & gas equipment & services and oil & gas drilling industries suffered losses as commodity weakness had an adverse effect on companies’ stock prices. With the slight increase in interest rates and declines in stock prices, our valuation methodology is showing us slightly fewer bargains than we saw at the beginning of the year. As such, we see modest upside to the market, with the best bargains coming from the Financials and Industrials sectors.
While all geographic regions saw losses over the period, there were areas of clear differentiation among certain countries throughout the year. Most notably, emerging market countries saw larger losses, specifically in countries such as Brazil, Indonesia, Malaysia, and Russia. Conversely, countries in the developed world, specifically those in Europe, held up better throughout the year. As the period ended, the emerging markets and the Asia-Pacific region appeared overvalued according to our system while Europe and other developed markets in general showed the most upside globally.
| 14 | MANAGEMENT OVERVIEW |
Table of Contents
| Q. | What is your investment outlook for the international equity market? |
| A. | Our system estimates that international equities, on average, still remain below our estimate of their intrinsic value. At the end of the period, international markets as a whole had an overall average value-to-price (V/P) ratio of 1.05, implying that, on average, our estimate of fair value for stocks is about 5% higher than where they are currently trading. Risk aversion amongst investors remains and corporate earnings have generally grown despite ongoing economic struggles and geopolitical concerns. While global economic growth has languished outside of the United States, interest rates remain low, thanks in great part to loose monetary policy and extraordinary central bank intervention. |
According to our valuation system, Europe represents the best opportunity from a regional perspective, with Asia-Pacific showing the least upside. Despite some improvements in sentiment and equity prices in the emerging market countries, overall they still remain overvalued according to our metrics and do not warrant an overweight exposure within the Fund. Based on our methodology, developed markets in Europe show attractive upside in countries such as Belgium, France, Germany, and Sweden. As of the end of the fiscal year 2015 we estimate that, on average, fair value for European equities is 25% higher than where prices are currently trading. Within the Western Hemisphere, Canada and Mexico look attractive to our system with Indonesia, the Philippines, and Thailand currently showing the most value in the Asia-Pacific region.
From a sector perspective, we are still tilted towards the Financials and Industrials sectors. Within our system, Energy is now the most over-valued sector, and represents an underweight position relative to the benchmark as we see little upside within this sector.
At ICON we continue to seek out industries that our system identifies as trading at a discount to fair value. Guided by our disciplined, systematic and non-emotional approach to investing, we see numerous opportunities amidst the recent turbulence and volatility. We believe it is nearly impossible to accurately time market bottoms and we believe rallies do not offer invitations. Therefore, given our current valuations, we remain almost fully invested. As market conditions dictate, we will adjust accordingly.
| MANAGEMENT OVERVIEW | 15 |
Table of Contents
ICON International Equity Fund
Country Composition
September 30, 2015
Germany | 22.6% | |||
United Kingdom | 12.8% | |||
France | 11.6% | |||
Canada | 6.7% | |||
Japan | 5.8% | |||
Switzerland | 5.4% | |||
India | 4.7% | |||
Denmark | 3.9% | |||
Norway | 2.0% | |||
Sweden | 2.0% | |||
Belgium | 1.4% | |||
Finland | 1.4% | |||
Ireland | 1.4% | |||
United States | 1.4% | |||
Netherlands | 1.3% | |||
South Korea | 1.3% | |||
Isle Of Man | 1.1% | |||
South Africa | 0.9% | |||
China | 0.8% | |||
Spain | 0.8% | |||
Australia | 0.7% | |||
Portugal | 0.7% | |||
Hong Kong | 0.4% | |||
Philippines | 0.4% | |||
|
| |||
| 91.5% | ||||
|
| |||
Percentages are based upon common, preferred and real estate investment trusts stocks as a percentage of net assets. |
| |||
ICON International Equity Fund
Sector Composition
September 30, 2015
Financials | 19.2% | |||
Industrials | 18.4% | |||
Information Technology | 12.4% | |||
Consumer Discretionary | 11.8% | |||
Consumer Staples | 9.9% | |||
Health Care | 6.0% | |||
Utilities | 5.8% | |||
Materials | 5.2% | |||
Energy | 1.9% | |||
Telecommunication Services | 0.9% | |||
|
| |||
| 91.5% | ||||
|
|
Percentages are based upon common, preferred and real estate investment trusts stocks as a percentage of net assets.
| 16 | MANAGEMENT OVERVIEW |
Table of Contents
ICON International Equity Fund
Industry Composition
September 30, 2015
Pharmaceuticals | 4.6% | |||
Diversified Banks | 4.3% | |||
Data Processing & Outsourced Services | 3.3% | |||
Life & Health Insurance | 3.3% | |||
Multi-Utilities | 3.2% | |||
Cable & Satellite | 3.1% | |||
Electronic Equipment & Instruments | 2.9% | |||
Packaged Foods & Meats | 2.9% | |||
Specialty Chemicals | 2.6% | |||
Industrial Conglomerates | 2.5% | |||
Advertising | 2.4% | |||
Airlines | 2.4% | |||
Auto Parts & Equipment | 2.4% | |||
Aerospace & Defense | 2.2% | |||
Multi-line Insurance | 2.2% | |||
Railroads | 2.1% | |||
IT Consulting & Other Services | 2.0% | |||
Research & Consulting Services | 1.8% | |||
Building Products | 1.7% | |||
Food Retail | 1.7% | |||
Household Products | 1.7% | |||
Semiconductors | 1.6% | |||
Integrated Oil & Gas | 1.5% | |||
Multi-Sector Holdings | 1.4% | |||
Personal Products | 1.3% | |||
Broadcasting | 1.2% | |||
Diversified Support Services | 1.2% | |||
Industrial Machinery | 1.2% | |||
Integrated Telecommunication Services | 1.2% | |||
Security & Alarm Services | 1.2% | |||
Automobile Manufacturers | 1.1% | |||
Diversified Capital Markets | 1.1% | |||
Airport Services | 1.0% | |||
Thrifts & Mortgage Finance | 1.0% | |||
Water Utilities | 1.0% | |||
Other Industries (each less than 1%) | 19.2% | |||
|
| |||
| 91.5% | ||||
|
|
Percentages are based upon common, preferred and real estate investment trusts stocks as a percentage of net assets.
| MANAGEMENT OVERVIEW | 17 |
Table of Contents
ICON International Equity Fund
Average Annual Total Return
as of September 30, 2015
| Inception Date | 1 Year | 5 Years | 10 Years | Since Inception | Gross Expense Ratio* | Net Expense Ratio* | ||||||||||||||||||||||
ICON International Equity Fund - Class S | 2/18/97 | -3.15% | -0.81% | 1.44% | 4.77% | 1.41% | 1.41% | |||||||||||||||||||||
ICON International Equity Fund - Class C | 2/19/04 | -4.20% | -1.89% | 0.27% | 1.90% | 2.82% | 2.56% | |||||||||||||||||||||
ICON International Equity Fund - Class A | 5/31/06 | -3.52% | -1.17% | N/A | -1.02% | 2.12% | 1.81% | |||||||||||||||||||||
ICON International Equity Fund - Class A (including maximum sales charge of 5.75%) | 5/31/06 | -9.06% | -2.33% | N/A | -1.65% | 2.12% | 1.81% | |||||||||||||||||||||
MSCI ACWI ex-U.S. | -11.78% | 2.27% | 3.49% | 4.53% | N/A | N/A | ||||||||||||||||||||||
Past performance is not a guarantee of future results. Information about these performance results and the comparative indexes can be found in the About This Report section. The Fund’s name and investment strategy changed effective January 29, 2004. The Fund’s past performance would have been different if the current strategy had been in effect. The Adviser has agreed to limit certain Fund expenses; without these limitations, returns would have been lower. The limitation provisions may be terminated in the future.
| * | Please see the most recent prospectus for details. |
Class C total returns exclude applicable sales charges. If sales charges were included returns would be lower.
| 18 | MANAGEMENT OVERVIEW |
Table of Contents
ICON International Equity Fund
Value of a $10,000 Investment
through September 30, 2015
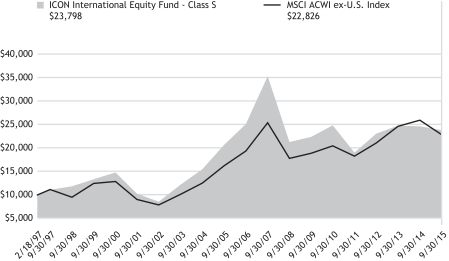
Past performance is not a guarantee of future results. The above graph compares a $10,000 investment made in the International Equity Fund’s Class S shares on the Class’ inception date of 2/18/97 to a $10,000 investment made in an unmanaged securities index on that date. The Fund’s name and investment strategy changed effective January 29, 2004. The Fund’s past performance would have been different if the current strategy had been in effect. Performance for the International Equity Fund’s other share classes will vary due to differences in charges and expenses. The International Equity Fund’s performance in this chart and the performance table assumes the reinvestment of dividends, capital gain distributions and tax return of capital, but does not reflect the deduction of taxes that a shareholder would pay on Fund distributions or on the redemption of Fund shares.
| MANAGEMENT OVERVIEW | 19 |
Table of Contents
ICON INTERNATIONAL EQUITY FUND
SCHEDULEOF INVESTMENTS
SEPTEMBER 30, 2015
| Shares or Principal Amount | Value | |||||||
| Common Stocks (89.0%) | ||||||||
| Advertising (2.4%) | ||||||||
| 19,500 | CyberAgent, Inc.*(a) | $ | 762,814 | |||||
| 50,000 | WPP PLC* | 1,040,950 | ||||||
|
| |||||||
| 1,803,764 | ||||||||
| Aerospace & Defense (2.2%) | ||||||||
| 5,400 | Airbus Group SE* | 319,788 | ||||||
| 87,000 | BAE Systems PLC* | 589,738 | ||||||
| 40,000 | Meggitt PLC* | 288,565 | ||||||
| 19,000 | Zodiac Aerospace* | 436,244 | ||||||
|
| |||||||
| 1,634,335 | ||||||||
| Airlines (2.4%) | ||||||||
| 69,300 | Air Canada†** | 557,204 | ||||||
| 6,900 | American Airlines Group, Inc.** | 267,927 | ||||||
| 37,150 | Deutsche Lufthansa AG*† | 517,157 | ||||||
| 11,500 | Southwest Airlines Co.** | 437,460 | ||||||
|
| |||||||
| 1,779,748 | ||||||||
| Airport Services (1.0%) | ||||||||
| 11,500 | Fraport AG Frankfurt Airport Services Worldwide* | 711,078 | ||||||
|
| |||||||
| Alternative Carriers (0.4%) | ||||||||
| 63,000 | TalkTalk Telecom Group PLC*(a) | 299,997 | ||||||
|
| |||||||
| Application Software (0.8%) | ||||||||
| 9,200 | SAP SE* | 596,010 | ||||||
|
| |||||||
| Asset Management & Custody Banks (0.7%) | ||||||||
| 18,000 | Deutsche Beteiligungs AG* | 501,303 | ||||||
|
| |||||||
| Auto Parts & Equipment (2.4%) | ||||||||
| 4,900 | Linamar Corp.** | 256,842 | ||||||
| 12,000 | Magna International, Inc.** | 575,586 | ||||||
| 33,000 | Martinrea International, Inc.** | 261,132 | ||||||
| 11,300 | Montupet* | 666,163 | ||||||
|
| |||||||
| 1,759,723 | ||||||||
| Shares or Principal Amount | Value | |||||||
| Automobile Manufacturers (1.1%) | ||||||||
| 7,800 | Daimler AG* | $ | 567,864 | |||||
| 50,258 | Tata Motors, Ltd.*† | 228,161 | ||||||
|
| |||||||
| 796,025 | ||||||||
| Brewers (0.9%) | ||||||||
| 18,200 | Royal Unibrew AS* | 681,433 | ||||||
|
| |||||||
| Broadcasting (1.2%) | ||||||||
| 26,000 | Mediaset Espana Comunicacion S.A.* | 284,230 | ||||||
| 12,300 | ProSiebenSat.1 Media SE* | 603,753 | ||||||
|
| |||||||
| 887,983 | ||||||||
| Building Products (1.7%) | ||||||||
| 16,000 | Assa Abloy AB* | 286,972 | ||||||
| 6,800 | Rockwool International AS, Class B* | 969,273 | ||||||
|
| |||||||
| 1,256,245 | ||||||||
| Cable & Satellite (3.1%) | ||||||||
| 11,400 | Eutelsat Communications S.A.* | 349,650 | ||||||
| 5,138 | Naspers, Ltd., Class N* | 643,930 | ||||||
| 7,300 | Numericable-SFR SAS*† | 337,948 | ||||||
| 44,000 | Quebecor, Inc., Class B** | 963,087 | ||||||
|
| |||||||
| 2,294,615 | ||||||||
| Commodity Chemicals (0.9%) | ||||||||
| 49,000 | Asahi Kasei Corp.* | 345,521 | ||||||
| 72,000 | Tosoh Corp.*(a) | 346,506 | ||||||
|
| |||||||
| 692,027 | ||||||||
| Communications Equipment (0.6%) | ||||||||
| 43,000 | ADVA Optical Networking SE†** | 460,157 | ||||||
|
| |||||||
| Construction Materials (0.7%) | ||||||||
| 4,200 | HeidelbergCement AG* | 288,422 | ||||||
| 4,630 | LafargeHolcim, Ltd.** | 241,191 | ||||||
|
| |||||||
| 529,613 | ||||||||
| | Data Processing & Outsourced Services (3.3%) | | ||||||
| 169,000 | Optimal Payments PLC*† | 828,701 | ||||||
| 20 | SCHEDULEOF INVESTMENTS |
Table of Contents
| Shares or Principal Amount | Value | |||||||
| 33,500 | Wirecard AG* | $ | 1,604,051 | |||||
|
| |||||||
| 2,432,752 | ||||||||
| Distillers & Vintners (0.5%) | ||||||||
| 15,000 | Diageo PLC* | 403,003 | ||||||
|
| |||||||
| Diversified Banks (4.3%) | ||||||||
| 86,000 | Axis Bank, Ltd.* | 655,029 | ||||||
| 42,900 | Commerzbank AG*† | 453,100 | ||||||
| 21,000 | DnB ASA* | 273,302 | ||||||
| 57,000 | HDFC Bank, Ltd.* | 932,027 | ||||||
| 250,000 | Lloyds Banking Group PLC* | 284,615 | ||||||
| 26,000 | Nordea Bank AB* | 290,069 | ||||||
| 27,000 | Skandinaviska Enskilda Banken AB* | 288,771 | ||||||
|
| |||||||
| 3,176,913 | ||||||||
| Diversified Capital Markets (1.1%) | ||||||||
| 23,200 | Close Brothers Group PLC* | 524,757 | ||||||
| 12,000 | Deutsche Bank AG* | 323,846 | ||||||
|
| |||||||
| 848,603 | ||||||||
| Diversified Real Estate Activities (0.8%) | ||||||||
| 5,800 | Daito Trust Construction Co., Ltd.* | 589,308 | ||||||
|
| |||||||
| Diversified Support Services (1.2%) | ||||||||
| 38,000 | Babcock International Group PLC* | 525,700 | ||||||
| 6,600 | Cewe Stiftung & Co. KGAA* | 367,163 | ||||||
|
| |||||||
| 892,863 | ||||||||
| Electric Utilities (0.4%) | ||||||||
| 146,000 | Power Grid Corp. of India, Ltd.* | 295,931 | ||||||
|
| |||||||
| Electronic Components (0.4%) | ||||||||
| 20,600 | Japan Aviation Electronics Industry, Ltd.* | 309,417 | ||||||
|
| |||||||
| Electronic Equipment & Instruments (2.9%) | ||||||||
| 5,157 | Ingenico Group* | 623,153 | ||||||
| 14,240 | Isra Vision AG* | 796,637 | ||||||
| 28,595 | Jenoptik AG* | 406,531 | ||||||
| 11,400 | Spectris PLC* | 291,678 | ||||||
|
| |||||||
| 2,117,999 | ||||||||
| Fertilizers & Agricultural Chemicals (0.3%) | ||||||||
| 220,000 | Gujarat State Fertilizers & Chemicals, Ltd.* | 236,932 | ||||||
|
| |||||||
| Shares or Principal Amount | Value | |||||||
| Food Retail (1.7%) | ||||||||
| 7,000 | Casino Guichard Perrachon S.A.* | $ | 372,784 | |||||
| 10,700 | Kesko Oyj, Class B* | 379,003 | ||||||
| 385,000 | Sonae SGPS S.A.* | 474,806 | ||||||
|
| |||||||
| 1,226,593 | ||||||||
| Gas Utilities (0.5%) | ||||||||
| 12,000 | Korea Gas Corp.* | 403,014 | ||||||
|
| |||||||
| Health Care Equipment (0.8%) | ||||||||
| 32,000 | GN Store Nord AS* | 574,872 | ||||||
|
| |||||||
| Household Products (1.1%) | ||||||||
| 640 | LG Household & Health Care, Ltd.* | 463,161 | ||||||
| 16,000 | Pigeon Corp.** | 371,175 | ||||||
|
| |||||||
| 834,336 | ||||||||
| Hypermarkets & Super Centers (0.9%) | ||||||||
| 11,500 | Carrefour S.A.** | 339,756 | ||||||
| 200,000 | Robinsons Retail Holdings, Inc.* | 312,837 | ||||||
|
| |||||||
| 652,593 | ||||||||
| Industrial Conglomerates (2.5%) | ||||||||
| 3,198 | Daetwyler Holding AG*(a) | 434,128 | ||||||
| 25,000 | Indus Holding AG* | 1,118,574 | ||||||
| 3,650 | Siemens AG* | 326,080 | ||||||
|
| |||||||
| 1,878,782 | ||||||||
| Industrial Machinery (1.2%) | ||||||||
| 1,400,000 | EVA Precision Industrial Holdings, Ltd.* | 276,484 | ||||||
| 8,000 | GEA Group AG* | 305,043 | ||||||
| 5,500 | NKT Holding AS* | 290,380 | ||||||
|
| |||||||
| 871,907 | ||||||||
| Integrated Oil & Gas (1.5%) | ||||||||
| 73,300 | BP PLC** | 370,354 | ||||||
| 15,500 | Royal Dutch Shell PLC, Class B** | 366,486 | ||||||
| 8,200 | Total S.A.** | 368,340 | ||||||
|
| |||||||
| 1,105,180 | ||||||||
| | Integrated Telecommunication Services (1.2%) | | ||||||
| 20,300 | Deutsche Telekom AG* | 361,370 | ||||||
| 28,000 | Telenor ASA*(a) | 523,224 | ||||||
|
| |||||||
| 884,594 | ||||||||
| SCHEDULEOF INVESTMENTS | 21 |
Table of Contents
| Shares or Principal Amount | Value | |||||||
| Internet Software & Services (0.8%) | ||||||||
| 10,100 | Alibaba Group Holding, Ltd., ADR†** | $ | 595,597 | |||||
|
| |||||||
| IT Consulting & Other Services (2.0%) | ||||||||
| 5,629 | Atos SE* | 432,680 | ||||||
| 8,000 | CANCOM SE* | 278,536 | ||||||
| 5,000 | Cap Gemini S.A.* | 446,514 | ||||||
| 14,000 | GFT Technologies SE* | 342,230 | ||||||
|
| |||||||
| 1,499,960 | ||||||||
| Leisure Products (0.9%) | ||||||||
| 26,000 | Amer Sports OYJ* | 661,328 | ||||||
|
| |||||||
| Life & Health Insurance (3.3%) | ||||||||
| 51,000 | Aegon N.V.* | 292,441 | ||||||
| 156,000 | Legal & General Group PLC* | 562,500 | ||||||
| 10,200 | �� | NN Group** | 292,003 | |||||
| 60,000 | Prudential PLC* | 1,265,791 | ||||||
|
| |||||||
| 2,412,735 | ||||||||
| Life Sciences Tools & Services (0.6%) | ||||||||
| 3,100 | Tecan Group AG* | 436,490 | ||||||
|
| |||||||
| Multi-line Insurance (2.2%) | ||||||||
| 4,000 | Allianz SE* | 628,371 | ||||||
| 24,400 | AXA S.A.* | 592,406 | ||||||
| 14,000 | Talanx AG* | 419,416 | ||||||
|
| |||||||
| 1,640,193 | ||||||||
| Multi-Sector Holdings (1.4%) | ||||||||
| 13,500 | Groupe Bruxelles Lambert S.A.* | 1,018,764 | ||||||
|
| |||||||
| Multi-Utilities (3.2%) | ||||||||
| 22,100 | Atco, Ltd., Class I** | 649,172 | ||||||
| 31,000 | E.ON SE* | 266,025 | ||||||
| 34,900 | Engie* | 564,699 | ||||||
| 48,500 | National Grid PLC* | 675,466 | ||||||
| 20,000 | RWE AG* | 227,274 | ||||||
|
| |||||||
| 2,382,636 | ||||||||
| Oil & Gas Storage & Transportation (0.4%) | ||||||||
| 7,800 | Enbridge, Inc.** | 289,614 | ||||||
|
| |||||||
| Packaged Foods & Meats (2.9%) | ||||||||
| 7,800 | Danone* | 492,360 | ||||||
| 14,400 | Nestle S.A.* | 1,082,961 | ||||||
| 230 | Orion Corp * | 183,158 | ||||||
| 17,000 | Saputo, Inc.** | 373,249 | ||||||
|
| |||||||
| 2,131,728 | ||||||||
| Shares or Principal Amount | Value | |||||||
| Paper Packaging (0.7%) | ||||||||
| 19,300 | Smurfit Kappa Group PLC* | $ | 519,981 | |||||
|
| |||||||
| Personal Products (1.3%) | ||||||||
| 8,400 | Kao Corp.** | 378,320 | ||||||
| 3,400 | L’Oreal S.A.* | 590,968 | ||||||
|
| |||||||
| 969,288 | ||||||||
| Pharmaceuticals (4.6%) | ||||||||
| 2,800 | Bayer AG* | 359,235 | ||||||
| 33,000 | Cipla, Ltd.* | 320,741 | ||||||
| 5,600 | Novartis AG* | 514,706 | ||||||
| 7,000 | Novo Nordisk AS, Class B* | 377,752 | ||||||
| 4,000 | Roche Holding AG* | 1,061,886 | ||||||
| 7,900 | Shire PLC* | 540,060 | ||||||
| 1,500 | Valeant Pharmaceuticals International, Inc.†** | 267,741 | ||||||
|
| |||||||
| 3,442,121 | ||||||||
| Railroads (2.1%) | ||||||||
| 3,600 | Canadian Pacific Railway, Ltd.** | 516,706 | ||||||
| 34,000 | VTG AG*(a) | 1,005,707 | ||||||
|
| |||||||
| 1,522,413 | ||||||||
| Real Estate Development (0.8%) | ||||||||
| 145,321 | Oberoi Realty, Ltd.* | 605,807 | ||||||
|
| |||||||
| Real Estate Operating Companies (0.8%) | ||||||||
| 6,000 | Deutsche EuroShop AG* | 269,799 | ||||||
| 10,200 | Vonovia SE* | 328,297 | ||||||
|
| |||||||
| 598,096 | ||||||||
| Reinsurance (0.8%) | ||||||||
| 2,200 | Muenchener Rueckversicherungs Gesellschaft AG* | 410,882 | ||||||
| 2,300 | Swiss Re AG* | 197,333 | ||||||
|
| |||||||
| 608,215 | ||||||||
| Research & Consulting Services (1.8%) | ||||||||
| 6,510 | Bertrandt AG* | 679,828 | ||||||
| 8,900 | Teleperformance* | 675,308 | ||||||
|
| |||||||
| 1,355,136 | ||||||||
| Security & Alarm Services (1.2%) | ||||||||
| 21,500 | Loomis AB, Class B* | 563,516 | ||||||
| 67,500 | Prosegur Cia de Seguridad S.A.* | 325,031 | ||||||
|
| |||||||
| 888,547 | ||||||||
| 22 | SCHEDULEOF INVESTMENTS |
Table of Contents
| Shares or Principal Amount | Value | |||||||
| Semiconductors (1.6%) | ||||||||
| 40,100 | ARM Holdings PLC* | $ | 576,125 | |||||
| 54,905 | Infineon Technologies AG* | 616,881 | ||||||
|
| |||||||
| 1,193,006 | ||||||||
| Specialized Finance (0.4%) | ||||||||
| 95,000 | Power Finance Corp., Ltd.* | 333,380 | ||||||
|
| |||||||
| Specialty Chemicals (2.6%) | ||||||||
| 111,640 | Borregaard ASA* | 672,465 | ||||||
| - | (b) | Duk San Neolux Co., Ltd.*† | - | (b) | ||||
| 35,000 | Hitachi Chemical Co., Ltd.*(a) | 482,904 | ||||||
| 29,000 | Tokyo Ohka Kogyo Co., Ltd.* | 768,767 | ||||||
|
| |||||||
| 1,924,136 | ||||||||
| Thrifts & Mortgage Finance (1.0%) | ||||||||
| 127,000 | Paragon Group of Cos. PLC* | 759,803 | ||||||
|
| |||||||
| Tires & Rubber (0.4%) | ||||||||
| 3,200 | Cie Generale des Etablissements Michelin, Class B** | 291,132 | ||||||
|
| |||||||
| Trading Companies & Distributors (0.4%) | ||||||||
| 114,000 | SIG PLC* | 299,713 | ||||||
|
| |||||||
| Trucking (0.7%) | ||||||||
| 29,000 | TransForce, Inc.**(a) | 519,153 | ||||||
|
| |||||||
| Water Utilities (1.0%) | ||||||||
| 32,700 | Pennon Group PLC* | 384,633 | ||||||
| 23,000 | United Utilities Group PLC* | 322,368 | ||||||
|
| |||||||
| 707,001 | ||||||||
|
| |||||||
|
| Total Common Stocks (Cost $72,099,089) | 66,025,621 | ||||||
| Shares or Principal Amount | Value | |||||||
| Preferred Stocks (0.9%) | ||||||||
| Home Improvement Retail (0.3%) | ||||||||
| 2,740 | Hornbach Holding AG* | $ | 220,620 | |||||
|
| |||||||
| Household Products (0.6%) | ||||||||
| 4,700 | Henkel AG & Co. KGaA* | 484,078 | ||||||
|
| |||||||
|
| Total Preferred Stocks (Cost $747,656) | 704,698 | ||||||
| Real Estate Investment Trusts (1.6%) | ||||||||
| 14,300 | Klepierre, REIT* | 648,109 | ||||||
| 173,000 | Charter Hall Group, REIT* | 531,191 | ||||||
|
| |||||||
|
| Total Real Estate Investment Trusts (Cost $1,278,562) | 1,179,300 | ||||||
| Collateral for Securities on Loan (5.1%) | ||||||||
| 3,785,339 | State Street Navigator Prime Portfolio, 0.20% | 3,785,339 | ||||||
|
| |||||||
|
| Total Collateral for Securities on Loan (Cost $3,785,339) | 3,785,339 | ||||||
| Short-Term Investments (15.1%) | ||||||||
| $ | 11,214,677 | State Street Euro Dollar Time Deposit (USD), 0.01%, 10/01/15 | 11,214,677 | |||||
|
| |||||||
|
| Total Short-Term Investments (Cost $11,214,677) | 11,214,677 | ||||||
|
| Total Investments 111.7% (Cost $89,125,323) | 82,909,635 | ||||||
| | Liabilities Less Other Assets (11.7)% | (8,684,407 | ) | |||||
|
| |||||||
| Net Assets 100.0% | $ | 74,225,228 | ||||||
|
| |||||||
The accompanying notes are an integral part of the financial statements.
| * | The value of foreign securities fair valued (Note 2) as of September 30, 2015 was 78.0% of net assets. |
| † | Non-income producing security. |
| ** | This security is considered a Level 1 security. See Note 2 for further details. |
| (a) | All or a portion of the security was on loan as of September 30, 2015. |
| (b) | Value is less than 1. |
| ADR | American Depositary Receipt |
| REIT | Real Estate Investment Trust |
| SCHEDULEOF INVESTMENTS | 23 |
Table of Contents
STATEMENTSOF ASSETSAND LIABILITIES
SEPTEMBER 30, 2015
| ICON Emerging Markets Fund | ICON International Equity Fund | |||||||
Assets | ||||||||
Investments, at cost | $ | 18,408,419 | $ | 89,125,323 | ||||
|
|
|
| |||||
Investments, at value† | 17,413,734 | 82,909,635 | ||||||
Foreign currency, at value(a) | 15,757 | 43,958 | ||||||
Receivables: | ||||||||
Fund shares sold | 49,295 | 93,574 | ||||||
Expense reimbursements due from Adviser | 36,492 | 12,169 | ||||||
Dividends | 6,551 | 52,637 | ||||||
Foreign tax reclaims | 2,661 | 65,734 | ||||||
Other assets | 9,455 | 21,774 | ||||||
|
|
|
| |||||
Total Assets | 17,533,945 | 83,199,481 | ||||||
|
|
|
| |||||
Liabilities | ||||||||
Payables: | ||||||||
Fund shares redeemed | 21,007 | 36,208 | ||||||
Advisory fees | 14,540 | 61,556 | ||||||
Transfer agent fees | 5,361 | 11,669 | ||||||
Fund accounting fees | 784 | 3,478 | ||||||
Administration fees | 726 | 3,077 | ||||||
Accrued distribution fees | 623 | 3,527 | ||||||
Trustee fees | 455 | 3,313 | ||||||
Capital gains tax | 454 | - | ||||||
Investments purchased | - | 5,006,685 | ||||||
Payable for collateral received on securities loaned | - | 3,785,339 | ||||||
Accrued expenses | 40,616 | 59,401 | ||||||
|
|
|
| |||||
Total Liabilities | 84,566 | 8,974,253 | ||||||
|
|
|
| |||||
Net Assets - all share classes | $ | 17,449,379 | $ | 74,225,228 | ||||
|
|
|
| |||||
Net Assets - Class S | $ | 16,122,801 | $ | 67,200,360 | ||||
|
|
|
| |||||
Net Assets - Class C | $ | 601,620 | $ | 3,299,387 | ||||
|
|
|
| |||||
Net Assets - Class A | $ | 724,958 | $ | 3,725,481 | ||||
|
|
|
| |||||
| 24 | FINANCIAL STATEMENTS |
Table of Contents
| ICON Emerging Markets Fund | ICON International Equity Fund | |||||||
Net Assets Consist of | ||||||||
Paid-in capital | $ | 26,190,223 | $ | 169,330,116 | ||||
Accumulated undistributed net investment income/(loss) | (19,769 | ) | (511,973 | ) | ||||
Accumulated undistributed net realized gain/(loss) | (7,724,835 | ) | (88,364,836 | ) | ||||
Unrealized appreciation/(depreciation) | (996,240 | ) | (6,228,079 | ) | ||||
|
|
|
| |||||
Net Assets | $ | 17,449,379 | $ | 74,225,228 | ||||
|
|
|
| |||||
Shares outstanding (unlimited shares authorized, no par value) | ||||||||
Class S | 1,244,546 | 5,909,082 | ||||||
Class C | 48,893 | 321,343 | ||||||
Class A | 56,144 | 331,482 | ||||||
Net asset value (offering and redemption price per share) | ||||||||
Class S | $ | 12.95 | $ | 11.37 | ||||
Class C | $ | 12.30 | $ | 10.27 | ||||
Class A | $ | 12.91 | $ | 11.24 | ||||
Class A maximum offering price (100%/(100%-maximum sales charge)) of net asset value adjusted to the nearest cent per share | $ | 13.69 | $ | 11.92 | ||||
† Includes securities on loan of | $ | - | $ | 3,656,301 | ||||
(a) Foreign currency, at cost | $ | 16,305 | $ | 44,611 | ||||
The accompanying notes are an integral part of the financial statements.
| FINANCIAL STATEMENTS | 25 |
Table of Contents
STATEMENTSOF OPERATIONS
FORTHEYEARENDED SEPTEMBER 30, 2015
| ICON Emerging Markets Fund | ICON International Equity Fund | |||||||
Investment Income | ||||||||
Interest | $ | 494 | $ | 1,143 | ||||
Dividends | 182,308 | 1,278,051 | ||||||
Income from securities lending, net | - | 47,040 | ||||||
Foreign taxes withheld | (17,285 | ) | (129,985 | ) | ||||
|
|
|
| |||||
Total Investment Income | 165,517 | 1,196,249 | ||||||
|
|
|
| |||||
Expenses | ||||||||
Advisory fees | 121,707 | 845,192 | ||||||
Audit and tax service expense | 49,042 | 51,125 | ||||||
Registration fees: | ||||||||
Class S | 16,184 | 14,011 | ||||||
Class C | 10,824 | 11,055 | ||||||
Class A | 10,251 | 10,810 | ||||||
Transfer agent fees | 29,110 | 81,953 | ||||||
Custody fees | 18,983 | 45,758 | ||||||
Distribution fees: | ||||||||
Class C | 5,911 | 40,707 | ||||||
Class A | 1,196 | 10,002 | ||||||
Administration fees | 6,085 | 42,259 | ||||||
Fund accounting fees | 2,866 | 19,707 | ||||||
Insurance expense | 2,253 | 7,403 | ||||||
Trustee fees and expenses | 1,382 | 11,444 | ||||||
Interest expense | 512 | 409 | ||||||
Other expenses | 47,970 | 97,873 | ||||||
|
|
|
| |||||
Total expenses before expense reimbursement | 324,276 | 1,289,708 | ||||||
Expense reimbursement by Adviser due to expense limitation agreement | (128,011 | ) | (34,663 | ) | ||||
|
|
|
| |||||
Net Expenses | 196,265 | 1,255,045 | ||||||
|
|
|
| |||||
Net Investment Income/(Loss) | (30,748 | ) | (58,796 | ) | ||||
|
|
|
| |||||
Net Realized and Unrealized Gain/(Loss) | ||||||||
Net realized gain/(loss) on: | ||||||||
Investments | (248,300 | ) | (4,553,855 | ) | ||||
Foreign currency | (19,620 | ) | (503,558 | ) | ||||
Net realized capital gains tax | - | (106,007 | ) | |||||
Change in unrealized net appreciation/(depreciation) on: | ||||||||
Investments and foreign currency | (787,160 | ) | 3,115,720 | |||||
Net unrealized capital gains tax | (26 | ) | 4,052 | |||||
|
|
|
| |||||
Net realized and unrealized gain/(loss) | (1,055,106 | ) | (2,043,648 | ) | ||||
|
|
|
| |||||
Net Increase/(Decrease) in Net Assets Resulting From Operations | $ | (1,085,854 | ) | $ | (2,102,444 | ) | ||
|
|
|
| |||||
The accompanying notes are an integral part of the financial statements.
| 26 | FINANCIAL STATEMENTS |
Table of Contents
(This page is intentionally left blank)
Table of Contents
STATEMENTSOF CHANGESIN NET ASSETS
| ICON Emerging Markets Fund | ||||||||
| Year Ended September 30, 2015 | Year Ended September 30, 2014 | |||||||
Operations | ||||||||
Net investment income/(loss) | $ | (30,748 | ) | $ | (44,580 | ) | ||
Net realized gain/(loss) on investments | (248,300 | ) | 2,609,559 | |||||
Net realized gain/(loss) from foreign currency | (19,620 | ) | (37,546 | ) | ||||
Net realized capital gains tax | - | (52,013 | ) | |||||
Change in net unrealized appreciation/(depreciation) | (787,186 | ) | (2,391,992 | ) | ||||
|
|
|
| |||||
Net increase/(decrease) in net assets resulting from operations | (1,085,854 | ) | 83,428 | |||||
|
|
|
| |||||
Dividends and Distributions to Shareholders | ||||||||
Net investment income | ||||||||
Class S | - | (59,304 | ) | |||||
Class A | - | (1,490 | ) | |||||
|
|
|
| |||||
Net decrease from dividends and distributions | - | (60,794 | ) | |||||
|
|
|
| |||||
Fund Share Transactions | ||||||||
Shares sold | ||||||||
Class S | 20,067,880 | 6,840,980 | ||||||
Class C | 349,016 | 123,445 | ||||||
Class A | 862,982 | 75,466 | ||||||
Reinvested dividends and distributions | ||||||||
Class S | - | 56,463 | ||||||
Class A | - | 1,270 | ||||||
Shares repurchased | ||||||||
Class S | (11,885,964 | ) | (27,023,177 | ) | ||||
Class C | (468,737 | ) | (198,478 | ) | ||||
Class A | (398,743 | ) | (562,635 | ) | ||||
|
|
|
| |||||
Net increase/(decrease) from fund share transactions | 8,526,434 | (20,686,666 | ) | |||||
|
|
|
| |||||
Total net increase/(decrease) in net assets | 7,440,580 | (20,664,032 | ) | |||||
Net Assets | ||||||||
Beginning of year | 10,008,799 | 30,672,831 | ||||||
|
|
|
| |||||
End of year | $ | 17,449,379 | $ | 10,008,799 | ||||
|
|
|
| |||||
| 28 | FINANCIAL STATEMENTS |
Table of Contents
| ICON International Equity Fund | ||||||
Year Ended 2015 | Year Ended September 30, 2014 | |||||
| $ | (58,796 | ) | $ | 210,917 | ||
| (4,553,855 | ) | 7,551,567 | ||||
| (503,558 | ) | (271,659 | ) | |||
| (106,007 | ) | (35,013 | ) | |||
| 3,119,772 | (11,815,994 | ) | ||||
|
|
|
| |||
| (2,102,444 | ) | (4,360,182 | ) | |||
|
|
|
| |||
| (71,695 | ) | - | ||||
| - | - | |||||
|
|
|
| |||
| (71,695 | ) | - | ||||
|
|
|
| |||
| 4,506,506 | 54,955,281 | |||||
| 82,616 | 194,693 | |||||
| 1,145,130 | 353,579 | |||||
| 70,812 | - | |||||
| - | - | |||||
| (15,856,511 | ) | (12,360,031 | ) | |||
| (1,251,157 | ) | (1,233,291 | ) | |||
| (1,339,594 | ) | (1,312,960 | ) | |||
|
|
|
| |||
| (12,642,198 | ) | 40,597,271 | ||||
|
|
|
| |||
| (14,816,337 | ) | 36,237,089 | ||||
| 89,041,565 | 52,804,476 | |||||
|
|
|
| |||
| $ | 74,225,228 | $ | 89,041,565 | |||
|
|
|
| |||
| FINANCIAL STATEMENTS | 29 |
Table of Contents
STATEMENTSOF CHANGESIN NET ASSETS (CONTINUED)
| ICON Emerging Markets Fund | ||||||||
| Year Ended September 30, 2015 | Year Ended September 30, 2014 | |||||||
Transactions in Fund Shares | ||||||||
Shares sold | ||||||||
Class S | 1,456,599 | 496,107 | ||||||
Class C | 26,591 | 9,218 | ||||||
Class A | 62,831 | 5,468 | ||||||
Reinvested dividends and distributions | ||||||||
Class S | - | 4,198 | ||||||
Class A | - | 94 | ||||||
Shares repurchased | ||||||||
Class S | (863,679 | ) | (1,998,939 | ) | ||||
Class C | (35,508 | ) | (15,076 | ) | ||||
Class A | (28,954 | ) | (41,663 | ) | ||||
|
|
|
| |||||
Net increase/(decrease) | 617,880 | (1,540,593 | ) | |||||
|
|
|
| |||||
Shares outstanding, beginning of year | 731,703 | 2,272,296 | ||||||
|
|
|
| |||||
Shares outstanding, end of year | 1,349,583 | 731,703 | ||||||
|
|
|
| |||||
Accumulated undistributed net investment income/(loss) | $ | (19,769 | ) | $ | (18,814 | ) | ||
|
|
|
| |||||
The accompanying notes are an integral part of the financial statements.
| 30 | FINANCIAL STATEMENTS |
Table of Contents
| ICON International Equity Fund | ||||||
Year Ended 2015 | Year Ended September 30, 2014 | |||||
| 382,453 | 4,258,487 | |||||
| 7,381 | 16,869 | |||||
| 94,725 | 28,338 | |||||
| 6,089 | - | |||||
| - | - | |||||
| (1,317,093 | ) | (986,622 | ) | |||
| (114,930 | ) | (107,336 | ) | |||
| (114,235 | ) | (106,543 | ) | |||
|
|
|
| |||
| (1,055,610 | ) | 3,103,193 | ||||
|
|
|
| |||
| 7,617,517 | 4,514,324 | |||||
|
|
|
| |||
| 6,561,907 | 7,617,517 | |||||
|
|
|
| |||
| $ | (511,973 | ) | $ | 71,689 | ||
|
|
|
| |||
| FINANCIAL STATEMENTS | 31 |
Table of Contents
| Income/(loss) from investment operations | Less dividends and | |||||||||||||||||||||||
| Net asset value, beginning of period | Net investment income/ (loss)(x) | Net realized and unrealized gains/(losses) on investments | Total from investment operations | Dividends from net investment income | Distributions from net realized gains | |||||||||||||||||||
ICON Emerging Markets Fund | ||||||||||||||||||||||||
Class S | ||||||||||||||||||||||||
Year ended September 30, 2015 | $ | 13.72 | $ | (0.03 | ) | $ | (0.74 | ) | $ | (0.77 | ) | $ | - | $ | - | |||||||||
Year ended September 30, 2014 | 13.51 | (0.03 | ) | 0.27 | 0.24 | (0.03 | ) | - | ||||||||||||||||
Year ended September 30, 2013 | 12.21 | 0.06 | 1.33 | 1.39 | (0.09 | ) | - | |||||||||||||||||
Year ended September 30, 2012 | 10.12 | 0.11 | 2.02 | 2.13 | (0.04 | ) | - | |||||||||||||||||
Year ended September 30, 2011 | 12.35 | 0.07 | (2.30 | ) | (2.23 | ) | - | - | ||||||||||||||||
Class C | ||||||||||||||||||||||||
Year ended September 30, 2015 | 13.18 | (0.17 | ) | (0.71 | ) | (0.88 | ) | - | - | |||||||||||||||
Year ended September 30, 2014 | 13.06 | (0.11 | ) | 0.23 | 0.12 | - | - | |||||||||||||||||
Year ended September 30, 2013 | 11.84 | (0.05 | ) | 1.28 | 1.23 | (0.01 | ) | - | ||||||||||||||||
Year ended September 30, 2012 | 9.88 | 0.01 | 1.95 | 1.96 | - | - | ||||||||||||||||||
Year ended September 30, 2011 | 12.17 | (0.02 | ) | (2.27 | ) | (2.29 | ) | - | - | |||||||||||||||
Class A | ||||||||||||||||||||||||
Year ended September 30, 2015 | 13.71 | (0.07 | ) | (0.73 | ) | (0.80 | ) | - | - | |||||||||||||||
Year ended September 30, 2014 | 13.51 | (0.04 | ) | 0.27 | 0.23 | (0.03 | ) | - | ||||||||||||||||
Year ended September 30, 2013 | 12.17 | 0.04 | 1.33 | 1.37 | (0.03 | ) | - | |||||||||||||||||
Year ended September 30, 2012 | 10.10 | 0.09 | 2.00 | 2.09 | (0.02 | ) | - | |||||||||||||||||
Year ended September 30, 2011 | 12.35 | 0.04 | (2.29 | ) | (2.25 | ) | - | - | ||||||||||||||||
| 32 | FINANCIAL HIGHLIGHTS |
Table of Contents
| distributions | Ratio of expenses to average net assets | Ratio of net investment income/(loss) to average net assets | ||||||||||||||||||||||||||||||||
| Total dividends and distributions | Net asset value, end of period | Total return* | Net assets, end of period (in thousands) | Before expense limitation/ recoupment and transfer agent earnings credits | After expense limitation/ recoupment and transfer agent earnings credits | Before expense limitation/ recoupment and transfer agent earnings credits | After expense limitation/ recoupment and transfer agent earnings credits | Portfolio turnover rate(a) | ||||||||||||||||||||||||||
| $ | - | $ | 12.95 | (5.61 | )% | $ | 16,123 | 2.44 | % | 1.55 | % | (1.08 | )% | (0.19 | )% | 76.12 | % | |||||||||||||||||
| (0.03 | ) | 13.72 | 1.78 | % | 8,942 | 2.11 | % | 1.88 | %(d) | (0.42 | )% | (0.19 | )% | 92.17 | % | |||||||||||||||||||
| (0.09 | ) | 13.51 | 11.44 | % | 29,053 | 1.64 | % | 1.64 | % | 0.46 | % | 0.46 | % | 59.98 | % | |||||||||||||||||||
| (0.04 | ) | 12.21 | 21.16 | % | 37,969 | 1.50 | % | 1.50 | % | 0.96 | % | 0.96 | % | 71.84 | % | |||||||||||||||||||
| - | 10.12 | (18.06 | )% | 55,637 | 1.59 | % | 1.59 | % | 0.55 | % | 0.55 | % | 71.03 | % | ||||||||||||||||||||
| - | 12.30 | (6.68 | )% | 601 | 5.11 | % | 2.55 | %(b) | (3.88 | )% | (1.32 | )% | 76.12 | % | ||||||||||||||||||||
| - | 13.18 | 0.92 | % | 762 | 4.65 | % | 2.78 | %(b) | (2.70 | )% | (0.83 | )% | 92.17 | % | ||||||||||||||||||||
| (0.01 | ) | 13.06 | 10.44 | % | 832 | 3.76 | % | 2.56 | %(b) | (1.63 | )% | (0.43 | )% | 59.98 | % | |||||||||||||||||||
| - | 11.84 | 19.84 | % | 869 | 3.91 | % | 2.55 | %(b) | (1.28 | )% | 0.08 | % | 71.84 | % | ||||||||||||||||||||
| - | 9.88 | (18.82 | )% | 792 | 4.40 | % | 2.55 | %(b) | (2.02 | )% | (0.17 | )% | 71.03 | % | ||||||||||||||||||||
| - | 12.91 | (5.84 | )% | 725 | 4.75 | % | 1.80 | %(b) | (3.44 | )% | (0.49 | )% | 76.12 | % | ||||||||||||||||||||
| (0.03 | ) | 13.71 | 1.68 | % | 305 | 4.32 | % | 1.95 | %(b) | (2.65 | )% | (0.28 | )% | 92.17 | % | |||||||||||||||||||
| (0.03 | ) | 13.51 | 11.29 | % | 789 | 2.97 | % | 1.81 | %(b) | (0.82 | )% | 0.34 | % | 59.98 | % | |||||||||||||||||||
| (0.02 | ) | 12.17 | 20.73 | % | 690 | 2.88 | % | 1.80 | %(b) | (0.31 | )% | 0.77 | % | 71.84 | % | |||||||||||||||||||
| - | 10.10 | (18.22 | )% | 768 | 3.05 | % | 1.81 | %(b) | (0.97 | )% | 0.27 | % | 71.03 | % | ||||||||||||||||||||
| FINANCIAL HIGHLIGHTS | 33 |
Table of Contents
FINANCIAL HIGHLIGHTS (CONTINUED)
| Income/(loss) from investment operations | Less dividends and | |||||||||||||||||||||||
| Net asset value, beginning of period | Net investment income/ (loss)(x) | Net realized and unrealized gains/(losses) on investments | Total from investment operations | Dividends from net investment income | Distributions from net realized gains | |||||||||||||||||||
ICON International Equity Fund | ||||||||||||||||||||||||
Class S** | ||||||||||||||||||||||||
Year ended September 30, 2015 | $ | 11.75 | $ | - | (c) | $ | (0.37 | ) | $ | (0.37 | ) | $ | (0.01 | ) | $ | - | ||||||||
Year ended September 30, 2014 | 11.81 | 0.06 | (0.12 | ) | (0.06 | ) | - | - | ||||||||||||||||
Year ended September 30, 2013 | 11.05 | 0.07 | 0.74 | 0.81 | - | (c) | (0.05 | ) | ||||||||||||||||
Year ended September 30, 2012 | 9.22 | 0.16 | 1.78 | 1.94 | (0.11 | ) | - | |||||||||||||||||
Year ended September 30, 2011 | 12.11 | 0.14 | (2.95 | ) | (2.81 | ) | (0.08 | ) | - | |||||||||||||||
Class C | ||||||||||||||||||||||||
Year ended September 30, 2015 | 10.72 | (0.12 | ) | (0.33 | ) | (0.45 | ) | - | - | |||||||||||||||
Year ended September 30, 2014 | 10.89 | (0.08 | ) | (0.09 | ) | (0.17 | ) | - | - | |||||||||||||||
Year ended September 30, 2013 | 10.26 | (0.04 | ) | 0.67 | 0.63 | - | - | |||||||||||||||||
Year ended September 30, 2012 | 8.56 | (0.02 | ) | 1.72 | 1.70 | - | - | |||||||||||||||||
Year ended September 30, 2011 | 11.30 | - | (c) | (2.74 | ) | (2.74 | ) | - | - | |||||||||||||||
Class A*** | ||||||||||||||||||||||||
Year ended September 30, 2015 | 11.65 | (0.04 | ) | (0.37 | ) | (0.41 | ) | - | - | |||||||||||||||
Year ended September 30, 2014 | 11.75 | - | (c) | (0.10 | ) | (0.10 | ) | - | - | |||||||||||||||
Year ended September 30, 2013 | 10.99 | 0.04 | 0.73 | 0.77 | - | (c) | (0.01 | ) | ||||||||||||||||
Year ended September 30, 2012 | 9.16 | 0.11 | 1.77 | 1.88 | (0.05 | ) | - | |||||||||||||||||
Year ended September 30, 2011 | 12.04 | 0.10 | (2.94 | ) | (2.84 | ) | (0.04 | ) | - | |||||||||||||||
| (x) | Calculated using the average shares method. |
| * | The total return calculation is for the period indicated and excludes any sales charges. |
| ** | Class S shares were formerly named Class Z shares prior to January 23, 2012. |
| *** | Class I shares merged into Class A on January 23, 2012. The results of each class prior to the merger may have been different than what is presented. |
| (a) | Portfolio turnover is calculated at the Fund level and is not annualized for periods less than a year. |
| (b) | The Fund’s operating expenses, not including interest expense, are contractually limited to the amounts discussed in Note 3. The ratios in these financial highlights reflect the limitation, including the interest expense. |
| (c) | Amount less than $0.005. |
| (d) | Effective May, 5, 2014, Class S’s operating expenses, not including interest expense, were contractually limited to the amounts discussed in Note 3. The ratios in these financial highlights reflect the limitation, including the interest expense. |
| (e) | Percentage less than 0.005%. |
The accompanying notes are an integral part of the financial statements.
| 34 | FINANCIAL HIGHLIGHTS |
Table of Contents
| distributions | Ratio of expenses to average net assets | Ratio of net investment income/(loss) to average net assets | ||||||||||||||||||||||||||||||||
| Total dividends and distributions | Net asset value, end of period | Total return* | Net assets, end of period (in thousands) | Before expense limitation/ recoupment and transfer agent earnings credits | After expense limitation/ recoupment and transfer agent earnings credits(b) | Before expense limitation/ recoupment and transfer agent earnings credits | After expense limitation/ recoupment and transfer agent earnings credits | Portfolio turnover rate(a) | ||||||||||||||||||||||||||
| $ | (0.01 | ) | $ | 11.37 | (3.15 | )% | $ | 67,201 | 1.41 | % | 1.41 | % | - | %(e) | - | %(e) | 204.10 | % | ||||||||||||||||
| - | 11.75 | (0.51 | )% | 80,356 | 1.41 | % | 1.41 | % | 0.44 | % | 0.44 | % | 192.93 | % | ||||||||||||||||||||
| (0.05 | ) | 11.81 | 7.33 | % | 42,105 | 1.45 | % | 1.45 | % | 0.65 | % | 0.65 | % | 137.83 | % | |||||||||||||||||||
| (0.11 | ) | 11.05 | 21.19 | % | 56,152 | 1.39 | % | 1.39 | % | 1.47 | % | 1.47 | % | 121.82 | % | |||||||||||||||||||
| (0.08 | ) | 9.22 | (23.38 | )% | 6,826 | 1.45 | % | 1.45 | % | 1.12 | % | 1.12 | % | 91.46 | % | |||||||||||||||||||
| - | 10.27 | (4.20 | )% | 3,299 | 2.96 | % | 2.55 | % | (1.56 | )% | (1.15 | )% | 204.10 | % | ||||||||||||||||||||
| - | 10.72 | (1.56 | )% | 4,597 | 2.82 | % | 2.56 | % | (0.99 | )% | (0.73 | )% | 192.93 | % | ||||||||||||||||||||
| - | 10.89 | 6.14 | % | 5,657 | 2.77 | % | 2.56 | % | (0.63 | )% | (0.42 | )% | 137.83 | % | ||||||||||||||||||||
| - | 10.26 | 19.86 | % | 6,773 | 2.72 | % | 2.55 | % | (0.41 | )% | (0.24 | )% | 121.82 | % | ||||||||||||||||||||
| - | 8.56 | (24.25 | )% | 8,050 | 2.64 | % | 2.55 | % | (0.11 | )% | (0.02 | )% | 91.46 | % | ||||||||||||||||||||
| - | 11.24 | (3.52 | )% | 3,725 | 2.25 | % | 1.80 | % | (0.77 | )% | (0.32 | )% | 204.10 | % | ||||||||||||||||||||
| �� | - | 11.65 | (0.85 | )% | 4,089 | 2.12 | % | 1.81 | % | (0.27 | )% | 0.04 | % | 192.93 | % | |||||||||||||||||||
| (0.01 | ) | 11.75 | 7.03 | % | 5,043 | 2.19 | % | 1.81 | % | (0.06 | )% | 0.32 | % | 137.83 | % | |||||||||||||||||||
| (0.05 | ) | 10.99 | 20.61 | % | 6,309 | 2.01 | % | 1.80 | % | 0.85 | % | 1.06 | % | 121.82 | % | |||||||||||||||||||
| (0.04 | ) | 9.16 | (23.65 | )% | 2,640 | 2.03 | % | 1.80 | % | 0.56 | % | 0.79 | % | 91.46 | % | |||||||||||||||||||
| FINANCIAL HIGHLIGHTS | 35 |
Table of Contents
SEPTEMBER 30, 2015
1. Organization
The ICON Emerging Markets Fund (“Emerging Markets Fund”) and ICON International Equity Fund (“International Equity Fund”) are series funds (individually a “Fund” and collectively, the “Funds”). The Funds are part of the ICON Funds (the “Trust”), a Massachusetts business trust registered under the Investment Company Act of 1940, as amended (the “1940 Act”) as an open-end investment management company. Each Fund offers three classes of shares: Class S, Class C and Class A. All classes have equal rights as to earnings, assets and voting privileges except that each Class may bear different distribution fees, registration costs, legal costs, mailing and printing costs and shareholder servicing costs and each Class has exclusive voting rights with respect to its distribution plan. There are currently fifteen other active Funds within the Trust. Those Funds are covered by separate prospectuses and shareholder reports.
Each Fund is authorized to issue an unlimited number of no par shares. The Funds primarily invest in foreign securities; the Emerging Markets Fund primarily invests in securities of issuers whose principal activities are in emerging market, or are economically tied to an emerging market country. The International Equity Fund primarily invests in foreign equity securities. Foreign equity securities refer to securities of issuers, wherever organized, whose securities are listed or traded principally on a recognized stock exchange or over-the-counter market outside the United States. The investment objective of each Fund is to provide long-term capital appreciation.
The Funds, like all investments in securities, have elements of risk, including risk of loss of principal. There is no assurance that the Funds will achieve their investment objectives and may underperform funds with similar investment objectives. An investment concentrated in sectors and industries involves greater risk and volatility than a more diversified investment. Investments in foreign securities and currency transactions may involve certain considerations and risks not typically associated with those of U.S. dollar-denominated transactions as a result of, among other factors, the possibility of less government supervision and regulation of foreign securities markets and the possibility of political or economic instability. Financial statements of foreign companies are governed by different accounting, auditing, and financial standards than U.S. companies and may be less transparent and uniform than in the United States. Many corporate governance standards, which help ensure the integrity of public information in the United States, may not exist in some foreign countries. In general,
| 36 | NOTESTO FINANCIAL STATEMENTS |
Table of Contents
there may be less governmental supervision of foreign stock exchanges and securities brokers and issuers. There are also risks associated with small-and mid-cap investing, including limited product lines, less liquidity, and small market share. Securities of emerging or developing market companies may be less liquid and more volatile than securities in countries with more mature markets.
In the normal course of business, the Funds may enter into various agreements that provide for general indemnifications. Each Fund’s maximum exposure under these arrangements is unknown as any potential exposure involving future claims that may be made against each Fund is unknown. However, based on experience, the Funds expect the risk of loss to be remote.
2. Significant Accounting Policies
The following is a summary of significant accounting policies consistently followed by the Funds in the preparation of their financial statements. The preparation of financial statements in conformity with accounting principles generally accepted in the United States of America requires management to make certain estimates and assumptions that affect the reported amounts of assets and liabilities, disclosure of contingent assets and liabilities at the date of the financial statements, and the reported amounts of income and expenses during the reporting period. Actual results may differ from these estimates.
Investment Valuation
The Funds’ securities and other assets, excluding options on securities indexes, are valued at the closing price as of the close of regular trading on the New York Stock Exchange (the “NYSE”) (normally 4 p.m. Eastern Standard Time) each day the NYSE is open, except that securities traded primarily on the NASDAQ Stock Market (“NASDAQ”) are normally valued by the Funds at the NASDAQ Official Closing Price provided by NASDAQ each business day. Options on securities indexes are valued at the close of the Chicago Board Options Exchange (normally 4:15 p.m. Eastern Standard Time) on each day the New York Stock Exchange is open for trading.
The Funds use pricing services to obtain the market value of securities in their portfolios; if a pricing service is not able to provide a price, or the pricing service’s valuation is considered inaccurate or does not in the Funds’ judgment reflect the market value of the security, prices may be obtained through market quotations from independent broker/dealers. If market quotations from these sources are not readily available, the Funds’ securities or other assets are
| NOTESTO FINANCIAL STATEMENTS | 37 |
Table of Contents
NOTESTO FINANCIAL STATEMENTS (CONTINUED)
valued at fair value as determined in good faith by the Funds’ Board of Trustees (“Board”) or pursuant to procedures approved by the Board.
Lacking any sales that day, a security is valued at the current closing bid price (or yield equivalent thereof) or based on quotes obtained from dealers making a market for the security. Options are valued at their closing mid-price on the market with the most volume. Mid-price is the average of the closing bid and closing ask prices. Debt securities with a remaining maturity of greater than 60 days are valued using the evaluated bid price supplied by the pricing service. The evaluated bid price supplied by the pricing service is based upon a matrix valuation system which considers such factors as security prices, yields, maturities and ratings. Short-term debt securities with remaining maturities of 60 days or less are generally valued at amortized cost or original cost plus accrued interest, which approximates market value. Currency rates as of the close of the NYSE are used to convert foreign security values into U.S. dollars.
Securities of investment companies that trade on an exchange are valued at the last sales price or official closing price as of the close of the customary trading session on the exchange where the security is principally traded. Investments in shares of funds that are not traded on an exchange are valued at the end of day net asset value per share of such fund. Securities in the underlying funds, including restricted securities are valued in accordance with the valuation policy of such fund.
The Funds’ securities traded in countries outside of the Western Hemisphere are fair valued daily by utilizing the quotations of an independent pricing service, unless the Board determines that use of another valuation methodology is appropriate. The purposes of daily fair valuation are to avoid stale prices and to take into account, among other things, any significant events occurring after the close of foreign markets. The pricing service uses statistical analyses and quantitative models to adjust local market prices using factors such as subsequent movements and changes in the prices of indexes, securities and exchange rates in other markets to determine fair value as of the time a Fund calculates its net asset value (“NAV”). The valuation assigned to fair-value securities for purposes of calculating a Fund’s NAV may differ from the security’s most recent closing market price and from the prices used by other mutual funds to calculate their NAVs.
| 38 | NOTESTO FINANCIAL STATEMENTS |
Table of Contents
Various inputs are used to determine the value of the Funds’ investments. These inputs are summarized in the three broad levels listed below:
Level 1 — quoted prices in active markets for identical securities.
Level 2 — significant observable inputs other than Level 1 quoted prices (including, but not limited to, quoted prices for similar securities, interest rates, prepayment speeds, and credit risk).
Level 3 — significant unobservable inputs.
Observable inputs are those based on market data obtained from sources independent of the Funds, and unobservable inputs reflect the Funds’ own assumptions based on the best information available. The input levels are not necessarily an indication of the risk or liquidity associated with investments at that level. For example, non-U.S. equity securities actively traded in foreign markets may be reflected in Level 2 despite the availability of closing prices, because the Funds evaluate and determine whether those closing prices reflect fair value at the close of the NYSE or require adjustment, as described above. The following table summarizes the Funds’ investments, based on the inputs used to determine their values on September 30, 2015:
| Level 1 | Level 2 | Level 3 | Total | |||||||||||||
ICON Emerging Markets Fund* | ||||||||||||||||
Assets | ||||||||||||||||
Common Stocks | ||||||||||||||||
India | $ | - | $ | 3,760,026 | $ | - | $ | 3,760,026 | ||||||||
South Korea | - | 3,647,281 | - | 3,647,281 | ||||||||||||
South Africa | - | 1,632,563 | - | 1,632,563 | ||||||||||||
China | - | 1,486,478 | - | 1,486,478 | ||||||||||||
Hong Kong | - | 1,141,211 | - | 1,141,211 | ||||||||||||
Other Countries | 753,687 | 2,321,299 | - | 3,074,986 | ||||||||||||
Preferred Stock | 91,944 | - | - | 91,944 | ||||||||||||
Short-Term Investments | - | 2,579,245 | - | 2,579,245 | ||||||||||||
|
|
|
|
|
|
|
| |||||||||
Total | $ | 845,631 | $ | 16,568,103 | $ | - | $ | 17,413,734 | ||||||||
|
|
|
|
|
|
|
| |||||||||
| NOTESTO FINANCIAL STATEMENTS | 39 |
Table of Contents
NOTESTO FINANCIAL STATEMENTS (CONTINUED)
| Level 1 | Level 2 | Level 3 | Total | |||||||||||||
ICON International Equity Fund* | ||||||||||||||||
Assets | ||||||||||||||||
Common Stocks | ||||||||||||||||
Germany | $ | 460,157 | $ | 15,680,463 | $ | - | $ | 16,140,620 | ||||||||
United Kingdom | 736,840 | 9,095,402 | - | 9,832,242 | ||||||||||||
France | 999,228 | 6,900,665 | - | 7,899,893 | ||||||||||||
Canada | 4,961,745 | - | - | 4,961,745 | ||||||||||||
Japan | 749,495 | 3,605,237 | - | 4,354,732 | ||||||||||||
Switzerland | 241,191 | 3,727,504 | - | 3,968,695 | ||||||||||||
Other Countries | 1,860,728 | 17,006,966 | - | 18,867,694 | ||||||||||||
Preferred Stocks | - | 704,698 | - | 704,698 | ||||||||||||
Real Estate Investment Trusts | - | 1,179,300 | - | 1,179,300 | ||||||||||||
Collateral for Securities on Loan | - | 3,785,339 | - | 3,785,339 | ||||||||||||
Short-Term Investments | - | 11,214,677 | - | 11,214,677 | ||||||||||||
|
|
|
|
|
|
|
| |||||||||
Total | $ | 10,009,384 | $ | 72,900,251 | $ | - | $ | 82,909,635 | ||||||||
|
|
|
|
|
|
|
| |||||||||
| * | Please refer to the Schedule of Investments and the Sector/Industry Classification and Country Composition tables for additional security details. |
There were no significant Level 3 securities held in any of the Funds at September 30, 2015.
For the ICON Emerging Markets Fund, there was no transfer activity between Level 1 and Level 2 for the year ended September 30, 2015.
For the ICON International Equity Fund, common stocks valued at $370,354 were transferred from Level 2 to Level 1 during the year ended September 30, 2015. At September 30, 2014, these securities were valued using quoted market prices in active markets with fair value adjustment factors; at September 30, 2015, these securities were valued using quoted market prices in active markets without using fair value adjustment factors.
The end of year timing recognition is used for the transfers between levels of the Fund’s assets and liabilities.
| 40 | NOTESTO FINANCIAL STATEMENTS |
Table of Contents
A roll forward of fair value measurements using significant unobservable inputs (Level 3) for the year ended September 30, 2015 for the Emerging Markets Fund and the International Equity Fund, is as follows:
| Common Stocks Hong Kong | ||||
ICON Emerging Markets Fund | ||||
Beginning balance 9/30/14 | $ | 0 | * | |
Purchases | - | |||
Sales | (28,220 | ) | ||
Accrued discounts/(premiums) | - | |||
Total realized gains/(losses) | (673,960 | ) | ||
Total change in unrealized appreciation/(depreciation) | 702,180 | |||
Transfers in to Level 3 | - | |||
Transfers out of Level 3 | - | |||
|
| |||
Ending balance 9/30/15 | $ | 0 | ||
|
| |||
Net change in unrealized appreciation/(depreciation) on investments held at 9/30/15 | $ | - | ||
|
| |||
ICON International Equity Fund | ||||
Beginning balance 9/30/14 | $ | 0 | * | |
Purchases | - | |||
Sales | (73,892 | ) | ||
Accrued discounts/(premiums) | - | |||
Total realized gains/(losses) | (1,651,917 | ) | ||
Total change in unrealized appreciation/(depreciation) | 1,725,809 | |||
Transfers in to Level 3 | - | |||
Transfers out of Level 3 | - | |||
|
| |||
Ending balance 9/30/15 | $ | 0 | ||
|
| |||
Net change in unrealized appreciation/(depreciation) on investments held at 9/30/15 | $ | - | ||
|
| |||
| * | Chaoda Modern Agriculture Holdings, Ltd. was illiquid and valued with a zero market value for the year ended September 30, 2014. |
Net realized gain/(loss) and net change in unrealized appreciation/depreciation is reflected on the Statement of Operations.
Fund Share Valuation
Fund shares are sold and redeemed on a daily basis at net asset value. Net asset value per share is determined daily as of the close of trading on the NYSE on each day the NYSE is open for trading by dividing the total value of the Fund’s investments and other assets, less liabilities, by the number of Fund shares outstanding.
| NOTESTO FINANCIAL STATEMENTS | 41 |
Table of Contents
NOTESTO FINANCIAL STATEMENTS (CONTINUED)
Foreign Currency Translation
The accounting records of the Funds are maintained in U.S. dollars. Investment securities and other assets and liabilities denominated in a foreign currency are translated daily into U.S. dollars at the prevailing rates of exchange. Income and expenses are translated into U.S. dollars at the prevailing exchange rate on the respective dates of the transactions. Purchases and sales of securities are translated into U.S. dollars at the contractual currency exchange rates established at the time of each trade.
The Funds do not isolate that portion of the results of operations resulting from changes in foreign exchange rates on investments from the fluctuations arising from changes in market prices of securities held. Net unrealized appreciation or depreciation on investments and foreign currency translations arise from changes in the value of assets and liabilities, resulting from changes in the exchange rates and changes in market prices of securities held.
Forward Foreign Currency Contracts
The Funds may enter into short-term forward foreign currency contracts. A forward foreign currency contract is an agreement between contracting parties to exchange an amount of currency at some future time at an agreed upon rate. The Funds use forward foreign currency contracts to manage foreign currency exposure with respect to transactional hedging, positional hedging, cross hedging and proxy hedging.
These contracts involve market risk and do not eliminate fluctuations in the prices of portfolio securities or prevent losses if the prices of those securities decline. The Funds could be exposed to risk if the value of the currency changes unfavorably. Additionally, the Funds could be exposed to counterparty risk if the counterparties are unable to meet the terms of the contracts.
These contracts are marked-to-market daily. Net realized gains and losses on foreign currency transactions represent disposition of foreign currencies, and the difference between the amount recorded at the time of the transaction and the U.S. dollar amount actually received. Any realized gain or loss incurred by the Funds due to foreign currency translation is included on the Statement of Operations. At September 30, 2015 and for the year then ended, the Emerging Markets Fund and International Equity Fund had no outstanding forward foreign currency contracts.
| 42 | NOTESTO FINANCIAL STATEMENTS |
Table of Contents
Securities Lending
Under procedures adopted by the Board, the Funds may lend securities to certain approved brokers, dealers and other financial institutions to earn additional income. The Funds retain certain benefits of owning the securities, including receipt of dividends or interest generated by the security, but give up other rights including the right to vote proxies. The Funds retain the ability to recall the loans at any time and could do so in order to vote proxies or to sell the loaned securities. Each loan is collateralized by cash that generally exceeds the value of the securities on loan. The market value of the loaned securities is determined daily at the close of business of the Funds and any additional required collateral is delivered to each Fund on the next business day.
Generally, in the event of borrower default, the Funds have the right to use the collateral to offset any losses incurred. In the event the Funds are delayed or prevented from exercising their rights to dispose of the collateral, there may be a potential loss to the Funds. Some of these losses may be indemnified by the lending agent.
The Funds have elected to invest the cash collateral in the State Street Navigator Prime Portfolio which is disclosed on the Schedule of Investments. The Funds bear the risk of loss with respect to the investment of collateral. The net securities lending income earned by the Funds for the year ended September 30, 2015, is included in the Statement of Operations.
For the year ended September 30, 2015, the following Fund had securities with the following values on loan:
| Fund | Loaned Securities | Collateral | ||||||
ICON International Equity Fund | $ | 3,656,301 | $ | 3,785,339 | ||||
Income Taxes, Dividends, and Distributions
The Funds intend to continue to qualify as regulated investment companies under Subchapter M of the Internal Revenue Code and, accordingly, the Funds will generally not be subject to federal and state income taxes or federal excise taxes to the extent that they intend to make sufficient distributions of net investment income and net realized capital gains.
Dividends paid by the Funds from net investment income and distributions of net realized short-term gains are, for federal income tax purposes, taxable as ordinary income to shareholders.
| NOTESTO FINANCIAL STATEMENTS | 43 |
Table of Contents
NOTESTO FINANCIAL STATEMENTS (CONTINUED)
Dividends and distributions to shareholders are recorded by the Funds on the ex-dividend/distribution date. The Funds distribute income and net realized capital gains, if any, to shareholders at least annually, if not offset by capital loss carryforward. The Funds may utilize equalization accounting for tax purposes and designate earnings and profits, including net realized gains distributed to shareholders on redemption of shares, as part of the dividends paid deduction for income tax purposes. Income distributions and capital gain distributions are determined in accordance with income tax regulations, which may differ from accounting principles generally accepted in the United States of America.
Management has analyzed the Funds’ tax positions taken on federal income tax returns for all open tax years and has concluded that no provision for federal income tax is required in the Funds’ financial statements.
The Funds file U.S. tax returns. While the statute of limitations remains open to examine the Funds’ U.S. tax returns filed for the past three years, no examinations are in progress or anticipated at this time. The Funds are not aware of any tax positions for which it is reasonably possible that the total amounts of unrecognized tax benefits will significantly change in the next twelve months.
Certain foreign countries impose a capital gains tax which is accrued by the Funds based on the unrealized appreciation, if any, on affected securities. Any accrual would reduce a Fund’s NAV. The tax is paid when the gain is realized.
Investment Income
Dividend income is recorded on the ex-dividend date. Non-cash dividends included in dividend income, if any, are recorded at the fair value of the securities received. Interest income is accrued as earned. Certain dividends from foreign securities are recorded as soon as the Funds are informed of the dividend if such information is obtained subsequent to the ex-dividend date. Discounts and premiums on fixed income securities purchased are accreted or amortized to income over the life of the respective securities.
Investment Transactions
Security transactions are accounted for no later than one business day after the trade date. However, for financial reporting purposes, security transactions are accounted for on the trade date. Gains and losses on securities sold are determined on the basis of identified cost.
| 44 | NOTESTO FINANCIAL STATEMENTS |
Table of Contents
Allocation of Expenses
Each class of a Fund’s shares bears expenses incurred specifically on its behalf and, in addition, each class bears a portion of general expenses, based upon relative net assets of each class. Expenses which cannot be directly attributed to a specific Fund in the Trust are apportioned between all Funds in the Trust based upon relative net assets. In calculating the net asset value per share of each class, investment income, realized and unrealized gains and losses and expenses other than class-specific expenses are allocated daily to each class of shares based upon the proportion of net assets.
Below are the class level expenses that are included on the Statement of Operations:
| Fund | Legal Expense | Printing And Postage Expense | Transfer Agent Expense | |||||||||
ICON Emerging Markets Fund | ||||||||||||
Class S | $ | 1,160 | $ | 12,281 | $ | 26,446 | ||||||
Class C | 61 | 335 | 1,427 | |||||||||
Class A | 52 | 543 | 1,237 | |||||||||
ICON International Equity Fund | ||||||||||||
Class S | 8,852 | 18,670 | 56,171 | |||||||||
Class C | 466 | 3,427 | 12,805 | |||||||||
Class A | 470 | 4,154 | 12,977 | |||||||||
3. Fees and Other Transactions with Affiliates
Investment Advisory Fees
ICON Advisers, Inc. (“ICON Advisers”) serves as investment adviser to the Funds and is responsible for managing the Funds’ portfolios of securities. ICON Advisers receives a monthly management fee that is computed daily at an annual rate of 1.00% of each Fund’s average daily net assets.
ICON Advisers has contractually agreed to limit the Funds’ operating expenses (exclusive of brokerage, interest, taxes, and extraordinary expenses) to the extent necessary to ensure that the Funds’ expenses do not exceed the following amounts:
| Fund | Class S | Class C | Class A | |||||||||
ICON Emerging Markets Fund | 1.55 | % | 2.55 | % | 1.80 | % | ||||||
ICON International Equity Fund | 1.55 | % | 2.55 | % | 1.80 | % | ||||||
| NOTESTO FINANCIAL STATEMENTS | 45 |
Table of Contents
NOTESTO FINANCIAL STATEMENTS (CONTINUED)
The Funds’ expense limitations will continue in effect until at least January 31, 2021 for Class A, Class C and International Equity Fund Class S. Effective May 5, 2014, ICON Advisers contractually agreed to limit the total expenses of the Emerging Markets Fund Class S shares to an annual rate of 1.55% in effect until at least January 31, 2016. To the extent ICON Advisers reimburses or absorbs fees and expenses, it may seek payment of such amounts for up to three years after the expenses were reimbursed or absorbed. A Fund will make no such payment, however, if the total Fund operating expenses exceed the expense limits in effect at the time the expenses were reimbursed or at the time these payments are proposed.
As of September 30, 2015 the following amounts were available for recoupment by ICON Advisers based upon their potential expiration dates:
| Fund | 2016 | 2017 | 2018 | |||||||||
ICON Emerging Markets Fund | $ | 18,421 | $ | 62,550 | $ | 128,011 | ||||||
ICON International Equity Fund | 33,867 | 29,665 | 34,663 | |||||||||
Accounting, Custody and Transfer Agent Fees
State Street Bank and Trust Company (“State Street”) serves as the fund accounting agent for the Funds. For its services, the Trust pays State Street a fee that is calculated daily and paid monthly at an annual rate based on the aggregate average daily net assets of the Trust.
State Street is the custodian of the Trust’s investments. For its services, the Trust pays State Street asset-based fees that vary according to the number of positions and transactions, plus out-of-pocket expenses.
Boston Financial Data Services, Inc. (“BFDS”) is the Trust’s transfer agent. For these services, the Trust pays a per account fee, plus certain other transaction Cusip charges and out-of-pocket expenses. BFDS may pay each Fund transfer agent earnings credits. Transfer agent earnings credits are credits received for interest which results from overnight balances used by BFDS for clearing shareholder transactions.
Administrative Services
The Trust has entered into an administrative services agreement with ICON Advisers pursuant to which ICON Advisers oversees the administration of the Trust’s business and affairs. This agreement provides for an annual fee of 0.05% on the Trust’s first $1.5 billion of average daily net assets, 0.045% on the next $1.5 billion of average daily net assets, 0.040% on the next $2
| 46 | NOTESTO FINANCIAL STATEMENTS |
Table of Contents
billion of average daily net assets and 0.030% on average daily net assets over $5 billion. For the year ended September 30, 2015, each Fund’s payment for administrative services to ICON Advisers is included on the Statement of Operations. The administrative services agreement provides that ICON Advisers will not be liable for any error of judgment, mistake of law, or any loss suffered by the Trust in connection with matters to which the administrative services agreement relates, except for a loss resulting from willful misfeasance, bad faith or negligence by ICON Advisers in the performance of its duties.
ICON Advisers has a sub-administration agreement with State Street under which State Street assists ICON Advisers with the administration and business affairs of the Trust. For its services, ICON Advisers pays State Street a fee that is calculated daily and paid monthly at an annual rate based on the aggregate average daily net assets of the Trust.
Distribution Fees
The Funds have adopted a Distribution Plan pursuant to Rule 12b-1 under the 1940 Act (“12b-1 Plan”) under which the Funds are authorized to compensate the Funds’ distributor, ICON Distributors, Inc. (“IDI”) (an affiliate of the adviser) for the sale and distribution of shares and for other shareholder services. Under the 12b-1 Plan, Class A shareholders pay an annual distribution and service fee of 0.25% of average daily net assets. The Class C shareholders pay an annual distribution and service fee of 1.00% of average daily net assets. There is no annual distribution and service fee for Class S shares. The total amount paid under the 12b-1 plans by the Funds, if any, is shown on the Statement of Operations.
Other Related Parties
Certain Officers and Directors of ICON Advisers are also Officers and Trustees of the Funds; however, such Officers and Trustees (with the exception of the Chief Compliance Officer, “CCO”) receive no compensation from the Funds. The Trust paid 95% of the CCO’s salary and the remaining portion is paid by ICON Advisers. For the year ended September 30, 2015, the total related amounts paid by the Funds under this arrangement are included in Other Expenses on the Statement of Operations.
The Fund may reimburse ICON Advisers for legal work performed for the Fund by its attorneys outside of the advisory and administration contracts. The Board of Trustees reviews and approves such reimbursements. For the
| NOTESTO FINANCIAL STATEMENTS | 47 |
Table of Contents
NOTESTO FINANCIAL STATEMENTS (CONTINUED)
year ended September 30, 2015, the total related amounts paid by the Funds under this arrangement was $4,588 and is included in Other Expenses on the Statement of Operations.
4. Borrowings
The Trust has entered into a Line of Credit agreement/arrangement with State Street to provide temporary funding for redemption requests. Effective March 21, 2015, the maximum borrowing limit was changed from $150 million to $75 million. Interest on domestic borrowings is charged at a rate quoted and determined by State Street. The average interest rate charged for the year ended September 30, 2015 was 1.37%.
For the year ended September 30, 2015, the average outstanding loan by Fund was as follows:
| Fund | Average Borrowing (10/1/14-9/30/15) | |||
ICON Emerging Markets Fund* | $ | 36,324 | ||
ICON International Equity Fund* | 29,651 | |||
| * | There were no outstanding loans at September 30, 2015. |
5. Purchases and Sales of Investment Securities
For the year ended September 30, 2015, the aggregate cost of purchases and proceeds from sales of securities (excluding short-term securities) was as follows:
| Fund | Purchases of Securities | Proceeds from Sales of Securities | ||||||
ICON Emerging Markets Fund | $ | 15,737,371 | $ | 7,871,338 | ||||
ICON International Equity Fund | 157,337,460 | 177,341,280 | ||||||
6. Federal Income Tax
The following information is presented on an income tax basis. Differences between U.S. GAAP and federal income tax purposes that are permanent in nature are reclassified within the capital accounts. Temporary differences do not require reclassification. Temporary and permanent differences do not impact the NAVs of the Funds. These differences are due to differing treatments for items such as passive foreign investment companies, foreign currency transactions, and net investment losses.
| 48 | NOTESTO FINANCIAL STATEMENTS |
Table of Contents
For the year ended September 30, 2015 the following Funds had capital loss carryforwards:
| Fund | Amounts | Expires | ||||||
ICON Emerging Markets Fund | $ | 7,143,674 | 2017 | |||||
| 332,861 | Unlimited | |||||||
ICON International Equity Fund | 53,195,839 | 2017 | ||||||
| 27,012,993 | 2018 | |||||||
| 4,334,930 | Unlimited | |||||||
Under the Regulated Investment Company Modernization Act of 2010 (the “Act”) capital losses generated by a fund may be carried over indefinitely, but these losses must be used prior to the utilization of any pre-enactment capital losses. Since pre-enactment capital losses may only be carried forward for eight years there may be a greater likelihood that all or a portion of each fund’s pre-enactment capital losses will expire unused.
The tax characteristics of distributions paid to shareholders during the fiscal year ended September 30, 2015, were as follows:
| Fund | Distributions Paid from Ordinary Income | Distributions Paid from Return of Capital | Total Distributions Paid | |||||||||
ICON International Equity Fund | $ | 71,689 | $ | - | $ | 71,689 | ||||||
The tax characteristics of distributions paid to shareholders during the fiscal year ended September 30, 2014, were as follows:
| Fund | Distributions Paid from Ordinary Income | Distributions Paid from Return of Capital | Total Distributions Paid | |||||||||
ICON Emerging Markets Fund | $ | 60,794 | $ | - | $ | 60,794 | ||||||
As of September 30, 2015, the components of accumulated earnings/(deficit) on a tax basis were as follows:
| Fund | Undistributed Ordinary Income | Late Year Loss Deferral** | Capital Loss Carryover | Unrealized Appreciation/ (Depreciation)* | Total Accumulated Earnings/ (Deficit) | |||||||||||||||
ICON Emerging Markets Fund | $ | - | $ | (249,486 | ) | $ | (7,476,535 | ) | $ | (1,014,823 | ) | $ | (8,740,844 | ) | ||||||
ICON International Equity Fund | - | (4,317,244 | ) | (84,543,762 | ) | (6,243,882 | ) | (95,104,888 | ) | |||||||||||
| * | Differences between the book-basis and tax-basis unrealized appreciation/(depreciation) are attributable primarily to investments in passive foreign investment companies. |
| NOTESTO FINANCIAL STATEMENTS | 49 |
Table of Contents
NOTESTO FINANCIAL STATEMENTS (CONTINUED)
| ** | The Funds have elected to defer certain qualified late-year losses in accordance with federal income tax rules. These losses are treated as having arisen on the first day of the following fiscal year. |
As of September 30, 2015, cost on investments for federal income tax purposes and the amount of net unrealized appreciation/(depreciation) were as follows:
| Unrealized | Unrealized | Net Appreciation/ | ||||||||||||||
| Fund | Cost | Appreciation | (Depreciation) | (Depreciation) | ||||||||||||
ICON Emerging Markets Fund | $ | 18,427,002 | $ | 741,523 | $ | (1,754,791 | ) | $ | (1,013,268 | ) | ||||||
ICON International Equity Fund | 89,142,511 | 1,274,109 | (7,506,985 | ) | (6,232,876 | ) | ||||||||||
7. Subsequent Events
Management has evaluated the possibility of subsequent events and determined that there are no material events that would require adjustment to or disclosure in the Funds’ financial statements.
| 50 | NOTESTO FINANCIAL STATEMENTS |
Table of Contents
REPORTOF INDEPENDENT REGISTERED PUBLIC
ACCOUNTING FIRM
To the Board of Trustees and Shareholders of the ICON Funds:
In our opinion, the accompanying statements of assets and liabilities, including the schedules of investments, and the related statements of operations and of changes in net assets and the financial highlights present fairly, in all material respects, the financial position of ICON Emerging Markets Fund and ICON International Equity Fund (two of the portfolios constituting ICON Funds, hereafter referred to as the “Funds”) at September 30, 2015, the results of each of their operations for the year then ended, the changes in each of their net assets for each of the two years in the period then ended and the financial highlights for each of the five years in the period then ended, in conformity with accounting principles generally accepted in the United States of America. These financial statements and financial highlights (hereafter referred to as “financial statements”) are the responsibility of the Funds’ management. Our responsibility is to express an opinion on these financial statements based on our audits. We conducted our audits of these financial statements in accordance with the standards of the Public Company Accounting Oversight Board (United States). Those standards require that we plan and perform the audit to obtain reasonable assurance about whether the financial statements are free of material misstatement. An audit includes examining, on a test basis, evidence supporting the amounts and disclosures in the financial statements, assessing the accounting principles used and significant estimates made by management, and evaluating the overall financial statement presentation. We believe that our audits, which included confirmation of securities at September 30, 2015 by correspondence with the custodian and brokers, provide a reasonable basis for our opinion.

Kansas City, Missouri
November 18, 2015
| REPORT OF ACCOUNTING FIRM | 51 |
Table of Contents
SIX MONTH HYPOTHETICAL EXPENSE EXAMPLE
SEPTEMBER 30, 2015 (UNAUDITED)
Example
As a shareholder of a Fund you may pay two types of fees: transaction fees and fund-related fees. Certain funds charge transaction fees, including sales charges (loads) on purchase payments, reinvested dividends, or other distributions; redemption fees; and exchange fees. Funds also incur various ongoing expenses, including management fees, distribution and/or service fees, and other fund expenses, which are indirectly paid by shareholders.
This Example is intended to help you understand your ongoing costs (in dollars) of investing in the various ICON Funds and to compare these costs with the ongoing costs of investing in other mutual funds. This Example is based on an investment of $1,000 invested at the beginning of the six-month period and held for the six-month period (4/01/15 – 9/30/15).
Actual Expenses
The first line in the table for each Fund provides information about actual account values and actual expenses. The Example includes, but is not limited to, management fees, 12b-1 fees, fund accounting, custody and transfer agent fees. However, the Example does not include client specific fees, such as the $15 fee charged to IRA accounts, or the $15 fee charged for wire redemptions. You may use this information, together with the amount you invested, to estimate the expenses that you paid over the period. Simply divide your account value by $1,000 (for example, an $8,600 account value divided by $1,000 = 8.6), then multiply the result by the number in the first line for each Fund under the heading entitled “Expenses Paid During Period” to estimate the expenses you paid on your account during this period.
Hypothetical Example for Comparison Purposes
The second line in the table for each Fund provides information about hypothetical account values and hypothetical expenses based on the Fund’s actual expense ratio and an assumed rate of return of 5% per year before expenses, which is not the Fund’s actual return. The hypothetical account values and expenses may not be used to estimate the actual ending account balance or expenses you paid for the period. You may use this information to compare the ongoing costs of investing in the Fund and other funds. To do so, compare this 5% hypothetical example with the 5% hypothetical examples that appear in the shareholder reports of the other funds. Please note that the expenses shown in the table are meant to highlight your ongoing costs only and do not reflect any transactional costs, such as sales charges (loads),
| 52 | EXPENSE EXAMPLE |
Table of Contents
redemption fees, or exchange fees that may be charged by other funds. Therefore, this information is useful in comparing ongoing costs only, and will not help you determine the relative total costs of owning different funds.
| Beginning Account Value 4/1/15 | Ending Account Value 9/30/15 | Expense Paid During Period 4/1/15 - 9/30/15* | Annualized Expense Ratio 4/1/15 - 9/30/15* | |||||||||||||
Actual Expenses |
| |||||||||||||||
ICON Emerging |
| |||||||||||||||
Class S | $ | 1,000 | $ | 923.00 | $ | 7.52 | 1.56% | |||||||||
Class C | 1,000 | 917.90 | 12.31 | 2.56% | ||||||||||||
Class A | 1,000 | 921.50 | 8.72 | 1.81% | ||||||||||||
ICON International | ||||||||||||||||
Class S | 1,000 | 938.10 | 7.14 | 1.47% | ||||||||||||
Class C | 1,000 | 932.80 | 12.36 | 2.55% | ||||||||||||
Class A | 1,000 | 936.70 | 8.74 | 1.80% | ||||||||||||
Hypothetical (assuming a 5% return before expenses) | ||||||||||||||||
ICON Emerging |
| |||||||||||||||
Class S | 1,000 | 1,017.25 | 7.89 | |||||||||||||
Class C | 1,000 | 1,012.23 | 12.91 | |||||||||||||
Class A | 1,000 | 1,015.99 | 9.15 | |||||||||||||
ICON International |
| |||||||||||||||
Class S | 1,000 | 1,017.70 | 7.44 | |||||||||||||
Class C | 1,000 | 1,012.28 | 12.86 | |||||||||||||
Class A | 1,000 | 1,016.04 | 9.10 | |||||||||||||
| * | Expenses are equal to the Fund’s six month expense ratio annualized, multiplied by the average account value over the period, multiplied by 183/365 to reflect the one-half year period. |
Total returns exclude applicable sales charges. If sales charges were included (maximum 5.75%), returns would be lower.
| EXPENSE EXAMPLE | 53 |
Table of Contents
BOARDOF TRUSTEESAND FUND OFFICERS (UNAUDITED)
The ICON Funds Board of Trustees (“Board”) consists of four Trustees who oversee the 17 ICON Funds (the “Funds”). The Board is responsible for general oversight of the Funds’ business and for assuring that the Funds are managed in the best interest of the Funds’ shareholders. The Trustees, and their ages, and principal occupations are set forth below. The address of the Trustees is 5299 DTC Blvd., Suite 1200, Greenwood Village, CO 80111. Trustees have no official term of office and generally serve until they resign or are not re-elected.
Interested Trustee
Craig T. Callahan, 64, Chairman of the Board. Dr. Callahan has been a Trustee of the Funds since their inception. Dr. Callahan also serves as Chief Executive Officer (2013 to present); and Chairman of the Investment Committee (2005 to present) and served as the Chief Investment Officer (1991 to 2004) and President (2008 to 2013 and 2014 to present) of ICON Advisers. Dr. Callahan is also Executive Vice President (2005 to present); Director (1991 to present); and was previously President (1998 to 2005) and Chief Compliance Officer (2005) of IDI. Dr. Callahan also serves as the President (1998 to present) and Chairman of the Board of Directors (1994 to present) of ICON Management & Research Corporation (“IM&R”), the parent company of ICON Advisers and IDI.
Independent Trustees
Glen F. Bergert, 65. Mr. Bergert has been a Trustee of the Funds since 1999. Mr. Bergert is President of Venture Capital Management LLC (1997 to present), General Partner of SOGNO Partners LP, a venture capital company (2001 to present), General Partner of Bergert Properties, LLP, a real estate holding company (1997 to present), General Partner of Pyramid Real Estate Partnership, a real estate development company (1998 to present), General Partner of Chamois Partners, LP, a venture capital company (2004 to present) and was previously a General Partner with KPMG Peat Marwick, LLP (1979 to 1997). Mr. Bergert is also a Director of Delta Dental of California, an insurance company (2013 to present and 2006 to 2012), Delta Dental of Pennsylvania, an insurance company (1998 to 2009 and 2010 to present), Dentegra Group, Inc, an insurance holding company (2010 to 2014) and Delta Reinsurance Corporation (2000 to 2009 and 2011 to 2014). Mr. Bergert was a Director of Herre Bros, Inc., a contracting company (1998 to 2011).
| 54 | TRUSTEESAND OFFICERS |
Table of Contents
John C. Pomeroy, Jr., 68. Mr. Pomeroy has been a Trustee of the Funds since November 2002. Mr. Pomeroy is Chief Investment Officer and Director of Investments, Pennsylvania State University (2001 to present) and was Portfolio Manager and Product Manager, Trinity Investment Management Corporation (1989 to 2001).
R. Michael Sentel, 67. Mr. Sentel has been a Trustee of the Funds since their inception. Mr. Sentel is a Senior Attorney with the U.S. Department of Education (1996 to present). Mr. Sentel also provides legal representation as a sole practitioner with an emphasis on corporate and transactional law. He served as general counsel to numerous public companies and served on the board of directors of one of these clients. Mr. Sentel began his legal career with the U.S. Securities and Exchange Commission’s Division of Enforcement and served as a Branch Chief (1980 to 1981). Later he served as the Section Chief for the Professional Liability Section of the Federal Deposit Insurance Corp. with responsibility for the Rocky Mountain Region (1991 to 1994).
The Officers of the Funds are:
Craig T. Callahan, 64, Chairman of the Board. Dr. Callahan has been a Trustee of the Funds since their inception. Dr. Callahan also serves as Chief Executive Officer (2013 to present); President (1998 to 2013 and 2014 to present) and Chairman of the Investment Committee (2005 to present) and served as the Chief Investment Officer (1991 to 2004) of ICON Advisers. Dr. Callahan is also Executive Vice President (2005 to present); Director (1991 to present); and was previously President (1998 to 2005) and Chief Compliance Officer (2005) of IDI. Dr. Callahan also serves as the President (1998 to present) and Chairman of the Board of Directors (1994 to present) of IM&R, the parent company of ICON Advisers and IDI.
Donald Salcito, 62. Mr. Salcito serves as Vice President and Secretary of the Funds (November 15, 2006 to present). Mr. Salcito is also Executive Vice President and General Counsel (September 2005 to present) of ICON Advisers; Director of IM&R (2005 to present); Executive Vice President, Secretary, General Counsel of IDI (2005 to present). Previously, he was a Partner in various national law firms, practicing in the securities law area. (1980 to 2005).
Carrie M. Schoffman, 42. Ms. Schoffman has been a Vice President and Principal Financial Officer/Treasurer of the Funds since June 2013. Ms. Schoffman is also Chief Compliance Officer (2013 to present and 2004 to 2008) and Anti-Money Laundering Officer (2013 to present) of the ICON Funds. She is Senior Vice President (2011 to present) and Chief Compliance Officer (2013 to present and 2004 to 2011) of ICON Advisers. Previously, she was a Staff Accountant with the Securities and Exchange Commission (2003 to 2004) and also an Experienced Manager (2001 to 2003) and a Senior Associate/Associate (1996 to 2001) at PricewaterhouseCoopers LLP.
| TRUSTEESAND OFFICERS | 55 |
Table of Contents
Lesley Caviness, 49. Ms. Caviness serves as Assistant Treasurer of the Funds (2014 to present). She has worked at ICON (2007-2008 and 2010-present) in fund accounting, compliance, business intelligence and performance capacities. Prior to working at ICON, Ms. Caviness was a Real Estate Broker at Seasons Real Estate Group (2008-2012) and Signature Real Estate (2014-present), Finance Manager at Navigant (2000-2007), and Associate/Senior Associate (1996 to 2000) at PricewaterhouseCoopers LLP.
| 56 | TRUSTEESAND OFFICERS |
Table of Contents
Renewal of Investment Advisory Agreement
On August 10, 2015, the Board of Trustees, including all of the Trustees that are not “interested persons” of the Trust (the “Independent Trustees”), approved continuation of the Advisory Agreements with the Adviser for each Fund for an additional one-year term commencing October 1, 2015.
In determining to renew the investment advisory agreements between ICON Funds (the “Trust”) and ICON Advisers, Inc. (“ICON” or the “Adviser”) the Trustees requested, was provided with and reviewed data with respect to the Adviser, its personnel, and the services provided and to be provided to each Fund by the Adviser under the Trust’s Investment Advisory Agreement dated October 9, 1996, as amended (related to the Sector Funds, the International Funds and ICON Fund) and under the Trust’s Investment Advisory Agreement dated July 9, 2002 and effective October 1, 2002, as amended (related to the U.S. Diversified Funds — Bond, Risk-Managed Balanced, Equity Income, Opportunities and Long/Short Funds) (collectively, the “Advisory Agreements”), for an additional one-year term commencing October 1, 2015. The Trustees agreed that consideration of the Advisory Agreements should also include consideration of other agreements between the Adviser and the Trust that impact provisions of the Advisory Agreements, including expense limitation agreement as amended effective September 25, 2015.
The Trustees were provided with and reviewed data with respect to the Adviser, its personnel, and the services provided and to be provided to each Fund by the Adviser under the Trust’s Advisory Agreements, Administrative Services Agreement and Expense Limitation Agreement and the Distribution Agreement with ICON Distributors, Inc. (“IDI”). The data included information concerning advisory, distribution and administrative services provided to the Funds by ICON and its related companies; information concerning other businesses of those companies; comparative data obtained from Strategic Insight (“SI”) related to Fund performance and Fund expenses (the “SI Report”). The data also included an analysis of the management style to be applied and the style applied to the Funds’ ratings of the Funds’ performance in their management style on the AthenaInvest system (the “AthenaInvest Data”) and a presentation on the Adviser’s investment model.
The Board convened a meeting with SI on July 29, 2015 to discuss the SI Report and the information contained within the SI Report. Avi Nachmany, Co-Founder and Director of Research of SI and Kevin Shine, Senior Managing Director, U.S. Research & Advisory of SI, discussed the findings of the SI Report with the independent directors. Management personnel participated
| OTHER INFORMATION | 57 |
Table of Contents
in the SI meeting convened to discuss the data for and with the Board. At the meeting, SI discussed its methodology, peer selection and the difficulty with some sector funds, expenses and fees, and performance relative to the respective Fund’s peers. SI also discussed the Funds size and how a respective Fund’s size would affect economies of scale, in particular, operating expenses.
Also included in the 15(c) discussion was a briefing on factors affecting the ICON investment model; expenses and expense ratios of each Fund and other ICON managed products; relative performance of each Fund; status of expense reimbursements to the Funds by the Adviser; sales and marketing initiatives; specific business factors affecting IDI; the work load on ICON as adviser and administrator to the Funds; current profitability of ICON; staffing levels and staff morale.
The Independent Trustees were represented by independent legal counsel in this process. In August 2015, after participating in the meeting with SI and management, the Independent met separately as a group in private sessions with their independent legal counsel to review and discuss the foregoing information. Based on these discussions, independent legal counsel and/or the Lead Independent Trustee also contacted management to request additional information concerning the AthenaInvest rankings and other issue raised in the SI meeting. In addition, the Board received materials from legal counsel discussing the legal standards applicable to their consideration of the ICON-Trust agreements.
In considering the nature, extent and quality of the services provided by the Adviser, the Board reviewed information relating to ICON’s operations and personnel. Among other things, the Adviser provided biographical information on its professional staff and descriptions of its organizational and management structure. In the course of their deliberations the Board evaluated, among other things, information relating to the investment philosophy, strategies and techniques used in managing each Fund, the qualifications and experience of ICON’s investment personnel, ICON’s compliance programs, ICON’s brokerage practices, including the extent to which the Adviser obtains research through “soft dollar” arrangements with the Funds’ brokerage, compliance reports on the foregoing, and the financial and non-financial resources available to provide services required under the Advisory Agreement.
During the discussion, the SI Report and the AthenaInvest Data were discussed and management personnel showed performance for each fund and discussed the factors affecting performance. The Board inquired from SI whether there was any correlation between fund expenses and performance, and SI saw no correlation with the ICON Funds. During the discussion on
| 58 | OTHER INFORMATION |
Table of Contents
performance, management personnel noted that from a strategy (Athena) perspective, 2014 was very difficult for active managers. Behaviors that historically have been rewarded and led to high strategy consistency ratings were not rewarded in 2014. Those behaviors include willingness to look different from an index, concentration of securities, conviction in securities selections, and holding stocks similar to other managers in a stated strategy. Causing further frustration in 2014, many stock and industry moves were not based on value, as ICON measures it. Something changed entering 2015. Behaviors that have been associated with superior performance in the past have been rewarded in the first part of 2015. Industry and sector selection have been better contributors to performance the first half of 2015 meaning that, more than last year, sector and industry tilts have been rewarded. ICON measures how sector indexes are in correlation with the S&P 1500 and 600 Indexes on a trailing 13-week basis. In 2015, the correlations have dropped, indicating sector differences in performance. Along with the decreasing correlations, sector returns have changed from 2014. Utilities was #1 in 2014, but is the worst at #10 for 2015. Consumer Discretionary has swung from #6 in 2014 to #2 the first half of 2015. In summary, value has been useful in rotating and capturing the industry and sector leadership of 2015.
In addition, in 2014 large cap stocks beat small cap stocks. As indexes are market capitalization weighted, index huggers did well in 2014. For the first six months of 2015, S&P 500 Index gained 1.56% whereas the S&P Small Cap 600 Index beat it, gaining 4.15%. In this market setting the ICON Funds did well across the Fund family: sector funds, diversified funds and international funds.
The Trustees noted that Advisers’ performance relative to other valuation managers as judged by the AthenaInvest system is above the medium. SI also noted that from a performance point of view, the Funds in the SI Report are compared using the Morningstar data, and there is no Morningstar category for “all cap” funds, but all ICON Funds are improving.
The Board addressed style consistency with the Adviser. Management advised that, based on the Adviser’s own analysis, and with the restructuring of the Adviser, the Adviser has continued an additional level of review on the Portfolio Managers (“PMs”) to make sure they are adhering to the ICON System; the Senior Vice President of Fund Management has been systematically tracking the Funds’ performance; he evaluates each of the ICON Funds to help ensure all PMs are investing consistently and in accordance with the ICON System by evaluating the Funds from an attribution perspective in monthly meetings.
| OTHER INFORMATION | 59 |
Table of Contents
In connection with reviewing data bearing upon the nature, quality, and extent of services furnished by ICON to each Fund, the Board assessed data concerning ICON’s staffing, systems and facilities. The Board also assessed ICON’s non-Trust business to see if there are any initiatives that would dilute service to the Trust. The Board concluded:
A. That the breadth and the quality of investment advisory and other services being provided to each Fund is satisfactory, as evidenced in part by efforts to address and improve the performance record of each Fund when compared with the performance records of a peer group of comparable funds and markets in general;
B. That the breadth and the quality of investment advisory and other services being provided to each Fund are satisfactory, the Adviser’s performance is competitive with other fund managers in the value style group, and the Adviser has applied a disciplined approach in the style specified in the Funds’ offering document;
C. That ICON has made significant expenditures in the past year and in prior years to ensure that it has the sophisticated systems and the highly trained personnel necessary for it to be able to continue to provide quality service to the Funds’ shareholders, including the dedication of substantial resources to ICON’s investment and methodology;
D. That the Board, after considering compliance reports and compliance initiatives undertaken during the year and conducting individual interviews with selected PMs, is satisfied with the research and portfolio management, that research and portfolio management is being constantly evaluated and improved upon; and that the PMs are evaluating trading services systematically, the Board concluded that the Adviser is providing the Funds with professional management of the nature, quality and scope required by the Funds; and
E. The risks assumed by ICON in providing investment advisory services to each Fund, including the capital commitments which have been made in the past and which continue to be made by ICON to ensure the continuation of the highest quality of service to the Trust, is made with the recognition that shareholders may redeem their shares at any time without notice and the Trust’s advisory relationship with ICON may be terminated at any time and must be renewed on an annual basis.
In considering the reasonableness of the fees paid to the Adviser for managing each Fund, the Board reviewed, among other things, data concerning other funds from the SI Report, financial statements of the Adviser and an analysis of the profitability of the Adviser, and its affiliates, and their relationship with each Fund over various time periods. Such
| 60 | OTHER INFORMATION |
Table of Contents
analysis identified all revenues and other benefits received by the Adviser and its affiliates from managing each Fund, the costs associated with providing such services and the resulting profitability to the Adviser and its affiliates and a comparison of similar data from reports filed by publicly traded firms.
The Board assessed actual (net) fees for advisory services and Fund expense ratios under the contractual relationship (the Advisory agreements and the Expense Limitation Agreements) with the Adviser as opposed to the fees specified in the applicable Advisory Agreement and expense ratios without application of the expense limitations and concluded that the focus should be on actual expense ratios after application of the Expense Limitation Agreements.
The Board considered the current and anticipated asset levels of each Fund and the contractual commitments of the Adviser to waive fees and pay expenses of the Funds from time to time to limit the total expenses of the Funds. In this regard the Board discussed asset levels in each Fund covered by the Advisory Agreements. ICON’s ability to provide the services called for under the Advisory Agreements was assessed in light of current and projected asset levels. Fund expenses and expense ratios were also assessed in light of current and projected asset levels. The Board concluded that the Adviser has the resources necessary to provide the services called for under the Advisory Agreements; that profitability to the Adviser and its affiliates from their relationship with the Funds, and services provided to the Funds, is not excessive; and that the Adviser is not realizing material benefits from economies of scale that would warrant adjustments to the fees for any Fund at this time. The Board of Trustees concluded that, in light of the nature, extent and quality of the services provided by the Adviser and the levels of profitability associated with providing these services, the fees charged by the Adviser under the Advisory Agreements to each Fund are reasonable.
In connection with assessing data bearing on the fairness of fee arrangements, the Board considered the SI Report. It was noted that SI was selected at the May Board meeting to prepare its report, an extensive analysis of the expense data of other comparable funds; and that Trustee input was solicited and provided in the process. Among other information discussed, it was noted that:
A. the advisory fee structures of the Funds are within the range of funds considered in the comparison with advisory fees and expense ratios of other similarly managed funds as set forth in the comparative data;
B. ICON has contractually agreed to impose expense limitations on each and every Fund at a cost to ICON;
| OTHER INFORMATION | 61 |
Table of Contents
C. ICON has contractually committed to break points in its fees so that economies of scale could be realized as a Fund grows in assets, for the benefit of Fund shareholders.
The Board also considered the fees charged by the Adviser to other advisory clients as outlined in its Registration Application on Form ADV in connection with assessing data bearing on the fairness of fee arrangements. The Trustees noted that certain ICON institutional/sub-advised type accounts have lower fees than the fees paid by the Funds for a number of reasons, including but not limited to, those clients call for different commitments of time, institutional clients have low and predictable turnover of assets, in competition joint costs are apportioned among paying customers according to elasticity of demand and the Adviser has a limited level of responsibility in sub-managed accounts, or accounts with an investor agent/advisor.
The Board noted that the Funds’ redemptions were similar to industry averages which showed two things: 1) that the Funds’ Performance was not adversely impacting fund redemptions, and 2) that the fees and costs were competitive when compared to size. The Board noted that there are thousands of mutual funds competing; that investors can search and trade funds on the internet or on platforms at very little or no cost; and that if the Adviser were overcharging for its services, with its performance being what it is, the Board would have expected redemptions in excess of industry norms.
The Board concluded that the Adviser is providing the Funds with professional management at a fair, reasonable and competitive price.
In connection with assessing the direct and indirect benefits to ICON from serving as the Funds’ adviser, the Board discussed services provided under the Distribution Agreement and the Administrative Services Agreement which are in addition to services under the Advisory Agreements. It was noted that IDI does not charge a fee to the Funds for its services and that ICON’s fee for administrative services appears to be consistent with such fees in other fund groups. The Board noted that ICON receives research assistance (primarily in the form of data) from the use of soft dollars generated from Fund portfolio transactions; that such research assists ICON in providing quality advisory services; that Trust and Adviser compliance personnel continuously evaluate and report on the soft-dollar arrangements and related costs; and the Board concluded that the arrangements are consistent with Fund brokerage practices and benefit the Funds and their shareholders.
Based on these considerations, the Board, including all of the Independent Trustees, concluded that: 1) the continuation of the Advisory Agreements was in the best interests of each Fund and its shareholders, 2) the services to be performed under the Advisory Agreements were required for the
| 62 | OTHER INFORMATION |
Table of Contents
operation of the Funds, 3) the advisory services were satisfactory to the Funds in the past, and 4) the fees for the advisory services and other benefits from the relationship with the Trust received by ICON, and its affiliates, were consistent with fees paid by similar funds and other clients of ICON, and were reasonable in light of the comparative data, and within the range of what would have been negotiated at arm’s length in light of all the circumstances.
Supplemental Tax Information
For the fiscal year ended September 30, 2015, the following funds paid qualified dividend income:
| Fund | Amount | |||
ICON Emerging Markets Fund | 100% | |||
The Funds had no long-term capital gain distributions qualifying for the maximum 20% income tax rate for individuals.
Portfolio Holdings
Information related to the 10 largest portfolio holdings of each Fund is made available at www.iconfunds.com within approximately 10 business days after month-end. Additionally, a complete list of each Fund’s holdings is made available approximately 30 days after month-end. Each ICON Fund also files a complete schedule of portfolio holdings for the first and third quarters of its fiscal year with the Securities and Exchange Commission (the “Commission”) on Form N-Q. The ICON Funds’ Forms N-Q are available at www.sec.gov or may be reviewed and copied at the Commission’s Public Reference Room in Washington, DC. Information about the Public Reference Room may be obtained by calling 1-800-SEC-0330.
Proxy Voting
A summarized description of the policies and procedures the ICON Funds use to vote proxies is available free of charge at www.iconfunds.com or by calling 1-800-764-0442.
Information about how the ICON Funds voted proxies related to each Fund’s portfolio securities during the 12-month period ended June 30 is available free of charge at www.iconfunds.com or on the Commission’s website at www.sec.gov.
| OTHER INFORMATION | 63 |
Table of Contents
Cost Basis Information
Effective January 1, 2012, federal law requires mutual fund companies to maintain and report a shareholder’s cost basis by tax lot, gain/loss information and holding period of covered shares to the Internal Revenue Service on Form 1099. Covered shares are mutual fund shares acquired on or after January 1, 2012. A fund is not required to maintain and report information for shares not deemed as covered.
The new law requires each fund to elect a default tax identification methodology in order to perform the required reporting. As a result, the Trust has chosen Average Cost as its default tax identification methodology. This is the method each Fund will use. However, at the time of purchase or upon the sale of covered shares, shareholders may choose a different tax identification method. Furthermore, if you purchase shares through a financial intermediary, please contact the intermediary to find out what default tax identification method they will use. We recommend that you consult your tax adviser to determine which tax identification methodology best suits your individual tax situation.
For More Information
This report is for the general information of the Funds’ shareholders and is not authorized for distribution to prospective investors unless preceded or accompanied by a current prospectus. You may obtain a copy of the prospectus, which contains information about the investment objectives, risks, charges, expenses, and share classes of each ICON Fund, by visiting www.iconfunds.com or by calling 1-800-764-0442. Please read the prospectus carefully before investing.
ICON Distributors, Inc., Distributor.
| 64 | OTHER INFORMATION |
Table of Contents
ICON FUNDS PRIVACY INFORMATION
| FACTS | WHAT DOES ICON DO WITH YOUR PERSONAL INFORMATION? | |
| Why? | Financial companies choose how they share your personal information. Federal law gives consumers the right to limit some but not all sharing. Federal law also requires us to tell you how we collect, share, and protect your personal information. Please read this notice carefully to understand what we do. | |
| What? | The types of personal information we collect and share depend on the product or service you have with us. This information can include:
n Social Security number and account balances
n income and transaction history
n checking account information and wire transfer instructions
When you are no longer our customer, we continue to share your information as described in this notice. | |
| How? | All financial companies need to share customers’ personal information to run their everyday business. In the section below, we list the reasons financial companies can share their customers’ personal information; the reasons ICON chooses to share; and whether you can limit this sharing. |
| Reasons we can share your personal information | Does ICON share? | Can you limit this sharing? | ||
For our everyday business purposes — such as to process your transactions, maintain your account(s), respond to court orders and legal investigations, or report to credit bureaus | Yes | No | ||
For our marketing purposes — to offer our products and services to you | No | We don’t share | ||
| For joint marketing with other financial companies | No | We don’t share | ||
For our affiliates’ everyday business purposes — information about your transactions and experiences | No | We don’t share | ||
For our affiliates’ everyday business purposes — information about your creditworthiness | No | We don’t share | ||
| For nonaffiliates to market to you | No | We don’t share |
| Questions? | Call 1-800-764-0442 for the ICON Funds and 1-800-828-4881 for ICON Advisers, Inc. and ICON Distributors, Inc. |
| FUNDS PRIVACY INFORMATION | 65 |
Table of Contents
| Page 2 |
| Who we are | ||
| Who is providing this notice? | ICON Funds, ICON Advisers, Inc., and ICON Distributors, Inc. (collectively “ICON”) | |
| What we do | ||
| How does ICON protect my personal information? | To protect your personal information from unauthorized access and use, we use security measures that comply with federal law. These measures include computer safeguards and secured files and buildings.
Contracts with our service providers require them to restrict access to your non-public personal information, and to maintain physical, electronic and procedural safeguards against unintended disclosure. | |
| How does ICON collect my personal information? | We collect your personal information, for example, when you
n open an account or enter into an investment advisory contract
n provide account information or give us your contact information
n make a wire transfer
We also collect your personal information from others, such as credit bureaus, affiliates, or other companies. | |
| Why can’t I limit all sharing? | Federal law gives you the right to limit only
n sharing for affiliates’ everyday business purposes — information about your creditworthiness
n affiliates from using your information to market to you
n sharing for nonaffiliates to market to you
State laws and individual companies may give you additional rights to limit sharing. | |
| Definitions | ||
| Affiliates | Companies related by common ownership or control. They can be financial and nonfinancial companies.
n Our affiliates include financial companies such as ICON Funds, ICON Advisers, Inc., and ICON Distributors, Inc. | |
| Nonaffiliates | Companies not related by common ownership or control. They can be financial and nonfinancial companies.
n Nonaffiliates we share with can include financial companies such as custodians, transfer agents, registered representatives, financial advisers and nonfinancial companies such as fulfillment, proxy voting, and class action service providers | |
| Joint marketing | A formal agreement between nonaffiliated financial companies that together market financial products or services to you.
n ICON doesn’t jointly market |
| 66 | FUNDS PRIVACY INFORMATION |
Table of Contents
For more information about the ICON Funds, contact us:
| By Telephone | 1-800-764-0442 | |
| By Mail | ICON Funds P.O. Box 55452 Boston, MA 02205-8165 | |
| In Person | ICON Funds 5299 DTC Boulevard, 12th Floor Greenwood Village, CO 80111 | |
| On the Internet | www.iconfunds.com | |
| By E-Mail | info@iconadvisers.com | |
Table of Contents
SIGNATURES
Pursuant to the requirements of the Securities Exchange Act of 1934 and the Investment Company Act of 1940, the registrant has duly caused this report to be signed on its behalf by the undersigned, thereunto duly authorized.
(Registrant) | ICON Funds |
By (Signature and Title)* | /s/ Craig T. Callahan | |
| Craig T. Callahan, President and Chief Executive Officer (Principal Executive Officer) |
Date February 5, 2016
Pursuant to the requirements of the Securities Exchange Act of 1934 and the Investment Company Act of 1940, this report has been signed below by the following persons on behalf of the registrant and in the capacities and on the dates indicated.
By (Signature and Title)* | /s/ Craig T. Callahan | |
| Craig T. Callahan, President and Chief Executive Officer (Principal Executive Officer) |
Date February 5, 2016
By (Signature and Title)* | /s/ Carrie M. Schoffman | |
Carrie M. Schoffman, Vice President, Treasurer (Principal Financial Officer and Principal Accounting Officer) |
Date February 5, 2016
| * | Print the name and title of each signing officer under his or her signature. |