Table of Contents
UNITED STATES
SECURITIES AND EXCHANGE COMMISSION
Washington, D.C. 20549
FORM N-CSR
CERTIFIED SHAREHOLDER REPORT OF REGISTERED
MANAGEMENT INVESTMENT COMPANIES
Investment Company Act file number 811-07883
ICON Funds
(Exact name of registrant as specified in charter)
5299 DTC Blvd. Suite 1200 Greenwood Village, CO 80111
(Address of principal executive offices) (Zip code)
Carrie M. Schoffman 5299 DTC Blvd. Suite 1200 Greenwood Village, CO 80111
(Name and address of agent for service)
Registrant’s telephone number, including area code: 303-790-1600
Date of fiscal year end: September 30, 2013
Date of reporting period: September 30, 2013
Table of Contents
Item 1. Reports to Stockholders.
Table of Contents

2013 ANNUAL REPORT
ICON DIVERSIFIED FUNDS
INVESTMENT UPDATE
ICON Bond Fund
ICON Equity Income Fund
ICON Fund
ICON Long/Short Fund
ICON Opportunities Fund
ICON Risk-Managed Balanced Fund (formerly, ICON Risk-Managed Equity Fund)

1-800-764-0442 | www.iconfunds.com
AR-DIV-13-W37522
Table of Contents

You can now sign up for electronic delivery of ICON Fund shareholder reports, including prospectuses, annual reports, semiannual reports and proxy statements.
When these materials are available, you will receive an email from ICON with instructions on how to view the documents. Statements, transaction confirmations and other documents that are not available online will continue to be sent to you by U.S. mail.
Visit ICON’s website at www.iconfunds.com to learn more and sign up.
You may change or cancel your participation in eDelivery by visiting www.iconfunds.com, or you can request a hard copy of any of the materials free of charge by calling ICON Funds at 1-800-764-0442.
1-800-764-0442 • www.iconfunds.com
Table of Contents

| 2 | ||||
Management Overview (Unaudited) and Schedules of Investments | ||||
| 6 | ||||
| 14 | ||||
| 22 | ||||
| 28 | ||||
| 35 | ||||
ICON Risk-Managed Balanced Fund (formerly, ICON Risk-Managed Equity Fund) | 40 | |||
| 52 | ||||
| 64 | ||||
| 70 | ||||
| 91 | ||||
| 92 | ||||
| 95 | ||||
| 97 | ||||
Table of Contents
Historical Returns
All total returns mentioned in this Report account for the change in a Fund’s per-share price and the reinvestment of any dividends, capital gain distributions and adjustments for financial statement purposes. If your account is set up to receive Fund distributions in cash rather than to reinvest them, your actual return may differ from these figures. The Funds’ performance results do not reflect the deduction of taxes that a shareholder would pay on Fund distributions or on the redemption of Fund shares. The Adviser may have reimbursed certain fees or expenses of some of the Funds. If not for these reimbursements, performance would have been lower. Fund results shown, unless otherwise indicated, are at net asset value. If a sales charge (maximum 5.75%) had been deducted, results would have been lower.
Past performance does not guarantee future results. Investment return and principal value will fluctuate so that an investor’s shares, when redeemed, may be worth more or less than their original cost. Performance results represent past performance, and current performance may be higher or lower. Please call 1-800-764-0442 or visit www.iconfunds.com for performance results current to the most recent month-end.
Portfolio Data
This Report reflects ICON’s views, opinions and portfolio holdings as of September 30, 2013, the end of the reporting period. The information is not a complete analysis of every aspect of any sector, industry, security or the Funds.
Opinions and forecasts regarding industries, companies and/or themes, and portfolio composition and holdings are subject to change at any time based on market and other conditions, and should not be construed as a recommendation of any specific security, industry or sector. Each Fund’s holdings as of September 30, 2013 are included in each Fund’s Schedule of Investments.
According to ICON, value investing is an analytical approach to investing that employs various factors, including projecting earnings growth estimates, in an effort to determine whether securities are over- or underpriced relative to ICON’s estimates of their intrinsic value. Value investing involves risks and uncertainties and does not guarantee better performance or lower costs than other investment methodologies. ICON’s value-to-price ratio (“V/P”) is a ratio of intrinsic value, as calculated using ICON’s proprietary valuation methodology, of a broad range of domestic and international securities within ICON’s system as compared to the current market price of those securities. The ICON system relies on the integrity of the financial statements released to the market as part of our analysis.
| 2 | ABOUT THIS REPORT |
Table of Contents
This Report contains statements regarding industry or sector themes, new market themes, investment outlook, relative strength, value-to-price ratios, and investment team expectations, beliefs, goals and the like that are based on current expectations, recent individual stock performance relative to current market prices, estimates of company values and other information supplied to the market by the companies we follow. Words such as “expects,” “suggests,” “anticipates,” “targets,” “goals,” “value,” “intrinsic value,” “indicates,” “believes,” “considers,” “estimates,” variations of such words and similar expressions are intended to identify forward looking statements, which are not statements of historical fact. Forward looking statements are not guarantees of future performance and involve certain risks, uncertainties and assumptions that are difficult to assess. These risks and uncertainties are based on a number of important factors, including, among others: stock price fluctuations; the integrity and accuracy of historical and projected financial and other information supplied by companies to the public or assumptions based on such information supplied; interest rates; bond yields; future earnings growth rates; the risks noted in this Report and other factors beyond the control of our investment team but used by the investment team to influence their assumptions. Therefore, actual outcomes may differ materially from what is expressed in such forward looking statements.
There are risks associated with mutual fund investing, including the loss of principal. The likelihood of loss may be greater if you invest for a shorter period of time. There is no assurance that the investment process will consistently lead to successful results.
There are risks associated with selling short, including the risk that the ICON Long/Short Fund may have to cover its short position at a higher price than the short price, resulting in a loss. The ICON Long/Short Fund’s loss on a short sale is potentially unlimited as a loss occurs when the value of a security sold short increases. Call options involve certain risks, such as limited gains and lack of liquidity in the underlying securities, and are not suitable for all investors.
Investing in fixed income securities such as bonds involves interest rate risk. When interest rates rise, the value of fixed income securities generally decreases. The ICON Bond Fund and ICON Equity Income Fund may invest up to 25% of their assets in high-yield bonds that are below investment grade. ICON Risk-Managed Balanced Fund may invest up to 10% of its assets in high-yield bonds that are below investment grade. High-yield bonds involve a greater risk of default and price volatility than U.S. Government and other higher-quality bonds.
An investment concentrated in sectors and industries may involve greater risk and volatility than a more diversified investment.
| ABOUT THIS REPORT | 3 |
Table of Contents
Investments in foreign securities may entail unique risks, including political, market, and currency risks. Financial statements of foreign companies are governed by different accounting, auditing, and financial standards than U.S. companies and may be less transparent and uniform than in the United States. Many corporate governance standards, which help ensure the integrity of public information in the United States, do not exist in foreign countries. In general, there may be less governmental supervision of foreign stock exchanges and securities brokers and issuers. The ICON system relies on the integrity of financial statements released to the market as part of our analysis.
Investments in other mutual fund companies may entail certain risks. For example, the Fund’s performance depends on the underlying funds in which it invests, and it is subject to the risks of the underlying funds. Additionally, an investment by the Fund or underlying fund in exchange-traded funds generally presents the same primary risks as an investment in a mutual fund.
The prospectus and statement of additional information contain this and other information about the Funds and are available by visiting www.iconfunds.com or calling 1-800-764-0442. Please read the prospectus and statement of additional information carefully.
Comparative Indexes
The comparative indexes discussed in this Report are meant to provide a basis for judging a Fund’s performance against specific securities indexes. Each index shown accounts for both change in the security price and reinvestment of dividends and distributions (except as noted), but does not reflect the costs of managing a mutual fund. The Funds’ portfolios may significantly differ in holdings and composition from the index. Individuals cannot invest directly in an index.
| • | The unmanaged Standard & Poor’s (“S&P”) Composite 1500 Index (“S&P Composite 1500 Index”) is a broad-based capitalization-weighted index comprising 1,500 stocks of large-cap, mid-cap, and small-cap U.S. companies. |
| • | The unmanaged Barclays Capital U.S. Universal Index (ex-MBS) represents the union of the U.S. Aggregate Index, the U.S. High-Yield Corporate Index, the 144A Index, the Eurodollar Index and the Emerging Markets Index. All securities in this market-value weighted index have at least one year remaining to maturity and meet certain minimum issue size criteria. |
| • | The unmanaged Standard & Poor’s (“S&P”) SmallCap 600 Index (“S&P SmallCap 600 Index”) is a broad-based capitalization-weighted index comprising 600 stocks of small-cap U.S. companies. |
| 4 | ABOUT THIS REPORT |
Table of Contents
Index returns and statistical data included in this Report are provided by FactSet Research Systems.
Financial Intermediary
If you purchase the Fund through a broker-dealer or other financial intermediary (such as a bank), the Fund and its related companies may pay the intermediary for the sale of Fund shares and related services. These payments may influence the broker-dealer or other intermediary and your salesperson to recommend the Fund over another investment. Ask your salesperson or visit your financial intermediary’s website for more information.
| ABOUT THIS REPORT | 5 |
Table of Contents
Class S Class C Class A | IOBZX IOBCX IOBAX |
| Q. | How did the Fund perform relative to its benchmark? |
| A. | The ICON Bond Fund Class S (“Bond Fund”) returned -0.84% for the fiscal year ended September 30, 2013, outperforming its benchmark, the Barclays Capital US Universal Index, which returned -1.00%. Total returns for other periods and additional Class shares as of September 30, 2013 appear in the subsequent pages of this Fund’s Management Overview. |
| Q. | What primary factors were behind the Fund’s relative performance? |
| A. | While the equity market continued its upward trend during fiscal year 2013, the fixed income market saw broad based declines as investors began to anticipate a change in Federal Reserve policy. This sentiment shift resulted in a strong upward movement in interest rates and a general sell-off in many fixed income asset classes. Bond market volatility can best be highlighted by breaking down the fiscal year into two specific time periods. During the first seven months of the fiscal year (09/30/12 – 04/30/13), bond market volatility was relatively low as the US Generic Government 10-Year Yield maintained a relatively tight range between 1.60% and 2.00%. During this time period, corporate bonds led the fixed income market with especially strong returns emerging from the high yield space. Due to our credit upgrade focus, the Bond Fund was able to outperform its benchmark during the first seven months of the fiscal year as the Bond Fund benefited from a general corporate bond overweight and positive selection effect from issue specific holdings. The final five months of the year were a different situation as investors evidently anticipated a tapering of the quantitative easing program implemented by the Federal Reserve. This anticipation led to a sell-off in the fixed income market, as virtually all segments of this market experienced declines with the largest losses stemming from the long-end of the treasury curve. The Bond Fund was again able to outperform during this sell-off as our avoidance of long duration treasuries and continued focus on credit upgrade ideas helped us to avoid some of the worst performing areas in the bond market. |
| Q. | How did the Fund’s composition affect performance? |
| A. | As stated above, over the entire fiscal year the Bond Fund’s overweight position in corporate bonds contributed positively to performance. The Bond Fund’s corporate bond allocation resulted in relative outperformance as valuation attractiveness pointed us towards an overweight position in both the investment grade and high yield segments |
| 6 | MANAGEMENT OVERVIEW |
Table of Contents
| of the market. Both of these areas outperformed the broad fixed income market during the fiscal year. Furthermore, not only was the Bond Fund overweight a strong performing segment of the fixed income market, but our focus on bottom up bond selection also proved beneficial to fund performance. Finally, a small allocation to floating rate securities within the Bond Fund contributed positively to overall performance as these securities performed well during the interest rate sell-off that took place in the last five months of the fiscal year. |
| Q. | What is your investment outlook for the bond market? |
| A. | We believe that the fixed income market is in a transition that requires active management, including both the flexibility and willingness to be creative, in an attempt to find value going forward. More specifically, we believe our value-oriented, bottom-up bond selection ideology will help us navigate the changing fixed income environment. While interest rate forecasting is not a factor in our valuation system, we don’t anticipate a substantial upward movement in interest rates over the course of the next year. At ICON, we remain steadfast in our search for issue specific opportunities. These holdings will tend to be based on opportunities characteristic of credit upgrades, special situations, or anticipated future bond tenders. While the bond market could experience volatility in the upcoming year, we believe our unique investment methodology will help navigate the changing market and add value for our shareholders. |
ICON Bond Fund
Credit Diversification
September 30, 2013
Aaa | 17.4% | |||
Aa2 | 2.9% | |||
Aa3 | 2.6% | |||
A1 | 2.5% | |||
A2 | 2.0% | |||
A3 | 4.6% | |||
Baa1 | 14.5% | |||
Baa2 | 14.2% | |||
Baa3 | 6.5% | |||
Bbb- | 1.0% | * |
Ba1 | 1.9% | |||
Ba2 | 1.4% | |||
Ba3 | 0.8% | |||
B1 | 5.6% | |||
B2 | 3.7% | |||
B3 | 0.5% | |||
Caa1 | 1.5% | |||
|
| |||
| 83.6% | ||||
|
|
* Reflects S&P Rating of BBB- since a Moody’s rating is unavailable for Icahn Enterprises L.P. / Icahn Enterprises Finance Corp. as of September 30, 2013.
Percentages are based upon U.S. Treasury obligations, corporate and foreign corporate bond investments as a percentage of net assets. Ratings based on Moody’s Investors Service, Inc.
| MANAGEMENT OVERVIEW | 7 |
Table of Contents
ICON Bond Fund
Average Annual Total Return
as of September 30, 2013
| Inception Date | 1 Year | 5 Years | 10 Years | Since Inception | Gross Expense Ratio* | Net Expense Ratio* | ||||||||||||||||||||||
ICON Bond Fund - | 5/6/04 | -0.84% | 6.53% | N/A | 4.75% | 0.88% | 0.75% | |||||||||||||||||||||
ICON Bond Fund - | 10/21/02 | -1.66% | 5.63% | 3.73% | 4.31% | 2.28% | 1.60% | |||||||||||||||||||||
ICON Bond Fund - | 9/30/10 | -1.08% | N/A | N/A | 2.74% | 1.31% | 1.00% | |||||||||||||||||||||
ICON Bond Fund - | 9/30/10 | -5.75% | N/A | N/A | 1.08% | 1.31% | 1.00% | |||||||||||||||||||||
Barclays Capital U.S. Universal Index | -1.00% | 5.93% | 4.91% | 5.32% | N/A | N/A | ||||||||||||||||||||||
Barclays Capital U.S. Universal Index (ex-MBS) | -0.92% | 6.44% | 4.91% | 5.53% | N/A | N/A | ||||||||||||||||||||||
Past performance is not a guarantee of future results. Information about these performance results and the comparative indexes can be found in the About This Report section. The Adviser has agreed to limit certain Fund expenses; without these limitations, returns would have been lower. The limitation provisions may be terminated in the future.
| * | Please see the most recent prospectus for details. |
Class C total returns exclude applicable sales charges. If sales charges were included returns would be lower.
| 8 | MANAGEMENT OVERVIEW |
Table of Contents
ICON Bond Fund
Value of a $10,000 Investment
through September 30, 2013
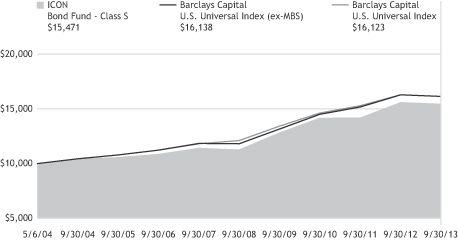
Past performance is not a guarantee of future results. The above graph compares a $10,000 investment made in the Bond Fund’s Class S shares on the Class’ inception date of 5/6/04 to a $10,000 investment made in an unmanaged securities index on that date. Performance for the Bond Fund’s other share classes will vary due to differences in charges and expenses. The Bond Fund’s performance in this chart and the performance table assumes the reinvestment of dividends and capital gain distributions but does not reflect the deduction of taxes that a shareholder would pay on Fund distributions or on the redemption of Fund shares.
| MANAGEMENT OVERVIEW | 9 |
Table of Contents
ICON BOND FUND
SCHEDULEOF INVESTMENTS
SEPTEMBER 30, 2013
| Shares or Principal Amount | Interest Rate | Maturity Date | Value | |||||||||||||
| Corporate Bonds (61.4%) | ||||||||||||||||
| $ | 1,152,000 | Altria Group, Inc. | 9.25 | % | 08/06/19 | $ | 1,521,335 | |||||||||
| 1,000,000 | American Express Co. | 7.00 | % | 03/19/18 | 1,204,795 | |||||||||||
| 500,000 | AmeriGas Finance LLC/AmeriGas Finance Corp. | 7.00 | % | 05/20/22 | 520,000 | |||||||||||
| 3,000,000 | AT&T, Inc.(a) | 2.63 | % | 12/01/22 | 2,688,849 | |||||||||||
| 500,000 | B/E Aerospace, Inc. | 6.88 | % | 10/01/20 | 546,250 | |||||||||||
| 950,000 | Berkshire Hathaway Finance Corp.(a) | 4.25 | % | 01/15/21 | 1,017,039 | |||||||||||
| 700,000 | Berkshire Hathaway Finance Corp. | 3.00 | % | 05/15/22 | 679,874 | |||||||||||
| 2,500,000 | Celgene Corp. | 3.25 | % | 08/15/22 | 2,370,580 | |||||||||||
| 1,000,000 | Clearwire Communications LLC / Clearwire Finance, Inc.(b) | 12.00 | % | 12/01/15 | 1,046,250 | |||||||||||
| 450,000 | Coca-Cola Co. | 4.88 | % | 03/15/19 | 510,521 | |||||||||||
| 500,000 | Coca-Cola Co. | 3.30 | % | 09/01/21 | 511,647 | |||||||||||
| 450,000 | Comcast Cable Holdings, LLC | 9.46 | % | 11/15/22 | 634,376 | |||||||||||
| 400,000 | Constellation Brands, Inc. | 7.25 | % | 09/01/16 | 455,000 | |||||||||||
| 1,500,000 | DaVita HealthCare Partners, Inc. | 5.75 | % | 08/15/22 | 1,483,125 | |||||||||||
| 300,000 | Denali Borrower LLC / Denali Finance Corp.(b) | 5.63 | % | 10/15/20 | 291,375 | |||||||||||
| 2,000,000 | DIRECTV Holdings LLC / DIRECTV Financing Co., Inc. | 3.80 | % | 03/15/22 | 1,866,698 | |||||||||||
| 900,000 | Dollar General Corp. | 4.13 | % | 07/15/17 | 956,486 | |||||||||||
| 2,000,000 | Dollar General Corp. | 3.25 | % | 04/15/23 | 1,821,398 | |||||||||||
| 500,000 | Ecolab, Inc. | 4.35 | % | 12/08/21 | 526,809 | |||||||||||
| 800,000 | Endo Health Solutions, Inc. | 7.00 | % | 07/15/19 | 824,000 | |||||||||||
| 450,000 | Entergy Corp. | 3.63 | % | 09/15/15 | 466,326 | |||||||||||
| 3,500,000 | Fiserv, Inc. | 3.50 | % | 10/01/22 | 3,313,698 | |||||||||||
| 1,000,000 | Freescale Semiconductor, Inc.(b) | 10.13 | % | 03/15/18 | 1,093,000 | |||||||||||
| 1,000,000 | Gap, Inc. | 5.95 | % | 04/12/21 | 1,108,005 | |||||||||||
| 500,000 | Google, Inc. | 3.63 | % | 05/19/21 | 523,683 | |||||||||||
| 1,500,000 | HCP, Inc. | 6.30 | % | 09/15/16 | 1,696,126 | |||||||||||
| 1,200,000 | HCP, Inc. | 6.70 | % | 01/30/18 | 1,397,326 | |||||||||||
| 500,000 | HOA Restaurant Group LLC / HOA Finance Corp.(b) | 11.25 | % | 04/01/17 | 510,000 | |||||||||||
| 450,000 | Hospira, Inc. | 6.05 | % | 03/30/17 | 493,650 | |||||||||||
| 1,000,000 | Icahn Enterprises L.P. / Icahn Enterprises Finance Corp.(a)(b) | 6.00 | % | 08/01/20 | 1,000,000 | |||||||||||
| 500,000 | International Lease Finance Corp. | 4.88 | % | 04/01/15 | 517,128 | |||||||||||
| 1,300,000 | Jarden Corp. | 7.50 | % | 01/15/20 | 1,408,875 | |||||||||||
| 10 | SCHEDULEOF INVESTMENTS |
Table of Contents
| Shares or Principal Amount | Interest Rate | Maturity Date | Value | |||||||||||||
| $ | 800,000 | Johnson & Johnson | 5.55 | % | 08/15/17 | $ | 925,516 | |||||||||
| 900,000 | Kellogg Co. | 4.00 | % | 12/15/20 | 952,640 | |||||||||||
| 850,000 | L Brands, Inc. | 5.63 | % | 02/15/22 | 871,250 | |||||||||||
| 500,000 | Life Technologies Corp. | 3.50 | % | 01/15/16 | 519,677 | |||||||||||
| 1,400,000 | Lockheed Martin Corp. | 4.25 | % | 11/15/19 | 1,521,594 | |||||||||||
| 1,400,000 | Lorillard Tobacco Co.(a) | 6.88 | % | 05/01/20 | 1,610,006 | |||||||||||
| 500,000 | Mead Johnson Nutrition Co. | 4.90 | % | 11/01/19 | 553,301 | |||||||||||
| 300,000 | MeadWestvaco Corp.(a) | 7.38 | % | 09/01/19 | 350,418 | |||||||||||
| 800,000 | Merck & Co., Inc. | 6.00 | % | 09/15/17 | 931,218 | |||||||||||
| 950,000 | Morgan Stanley(c) | 3.50 | % | 10/15/20 | 951,775 | |||||||||||
| 500,000 | National City Corp. | 6.88 | % | 05/15/19 | 596,602 | |||||||||||
| 1,000,000 | North Atlantic Trading Co.(b) | 11.50 | % | 07/15/16 | 1,072,500 | |||||||||||
| 900,000 | Novartis Capital Corp. | 4.40 | % | 04/24/20 | 988,136 | |||||||||||
| 1,163,000 | NVR, Inc. | 3.95 | % | 09/15/22 | 1,126,510 | |||||||||||
| 900,000 | PepsiCo, Inc. | 5.00 | % | 06/01/18 | 1,019,156 | |||||||||||
| 500,000 | PepsiCo, Inc. | 3.13 | % | 11/01/20 | 507,554 | |||||||||||
| 500,000 | Permian Holdings, Inc.(b) | 10.50 | % | 01/15/18 | 487,500 | |||||||||||
| 1,500,000 | Prudential Financial, Inc.(d) | 8.88 | % | 06/15/38 | 1,815,000 | |||||||||||
| 1,250,000 | Regency Energy Partners L.P. / Regency Energy Finance Corp. | 5.50 | % | 04/15/23 | 1,200,000 | |||||||||||
| 500,000 | Thermo Fisher Scientific, Inc. | 3.60 | % | 08/15/21 | 491,995 | |||||||||||
| 500,000 | Torchmark Corp. | 6.38 | % | 06/15/16 | 548,560 | |||||||||||
| 500,000 | United Parcel Service, Inc. | 5.13 | % | 04/01/19 | 574,194 | |||||||||||
| 1,000,000 | United Refining Co. | 10.50 | % | 02/28/18 | 1,115,000 | |||||||||||
| 850,000 | Valmont Industries, Inc. | 6.63 | % | 04/20/20 | 978,061 | |||||||||||
| 450,000 | Vornado Realty L.P. | 4.25 | % | 04/01/15 | 467,168 | |||||||||||
| 300,000 | Vulcan Materials Co. | 6.50 | % | 12/01/16 | 330,000 | |||||||||||
| 700,000 | Wal-Mart Stores, Inc. | 3.25 | % | 10/25/20 | 721,533 | |||||||||||
| 1,700,000 | Walt Disney Co., Series C | 6.00 | % | 07/17/17 | 1,971,184 | |||||||||||
|
| |||||||||||||||
|
| Total Corporate Bonds (Cost $59,654,366) | 60,202,272 | ||||||||||||||
| U.S. Treasury Obligations (16.4%) | ||||||||||||||||
| 1,500,000 | U.S. Treasury Note | 1.88 | % | 08/31/17 | 1,548,750 | |||||||||||
| 1,000,000 | U.S. Treasury Note | 3.63 | % | 02/15/20 | 1,110,938 | |||||||||||
| 1,000,000 | U.S. Treasury Note | 2.13 | % | 08/15/21 | 991,875 | |||||||||||
| 1,500,000 | U.S. Treasury Note | 1.25 | % | 01/31/19 | 1,481,016 | |||||||||||
| 2,000,000 | U.S. Treasury Note | 0.25 | % | 02/28/15 | 2,001,328 | |||||||||||
| 2,000,000 | U.S. Treasury Note | 0.38 | % | 03/15/16 | 1,996,250 | |||||||||||
| 2,000,000 | U.S. Treasury Note | 0.13 | % | 12/31/14 | 1,998,984 | |||||||||||
| 1,000,000 | U.S. Treasury Note | 1.13 | % | 12/31/19 | 958,750 | |||||||||||
| 2,000,000 | U.S. Treasury Note | 0.25 | % | 01/31/15 | 2,001,876 | |||||||||||
| 1,000,000 | U.S. Treasury Note | 0.38 | % | 02/15/16 | 998,984 | |||||||||||
| SCHEDULEOF INVESTMENTS | 11 |
Table of Contents
| Shares or Principal Amount | Interest Rate | Maturity Date | Value | |||||||||||||
| $ | 1,000,000 | U.S. Treasury Note | 0.63 | % | 08/31/17 | $ | 984,453 | |||||||||
|
| |||||||||||||||
|
| Total U.S. Treasury Obligations (Cost $16,031,921) | 16,073,204 | ||||||||||||||
| Foreign Corporate Bonds (5.8%) | ||||||||||||||||
| 1,000,000 | Avanti Communications Group PLC(b) | 10.00 | % | 10/01/19 | 1,010,000 | |||||||||||
| 2,200,000 | LyondellBasell Industries | 5.00 | % | 04/15/19 | 2,421,641 | |||||||||||
| 800,000 | LyondellBasell Industries | 6.00 | % | 11/15/21 | 913,064 | |||||||||||
| 1,000,000 | Shelf Drilling Holdings Ltd.(a)(b) | 8.63 | % | 11/01/18 | 1,062,500 | |||||||||||
| 300,000 | Telefonica Emisiones SAU | 6.42 | % | 06/20/16 | 329,638 | |||||||||||
|
| |||||||||||||||
|
| Total Foreign Corporate Bonds (Cost $5,740,039) | 5,736,843 | ||||||||||||||
| Shares or Principal Amount | Value | |||||||||||||||
| Closed-End Mutual Funds (9.4%) | ||||||||||||||||
| 275,000 | American Strategic Income Portfolio, Inc. II(a) | $ | 2,230,250 | |||||||||||||
| 305,610 | American Strategic Income Portfolio, Inc. III(a) | 2,114,821 | ||||||||||||||
| 225,852 | BlackRock Enhanced Government Fund, Inc. | 3,207,099 | ||||||||||||||
| 76,912 | Federated Enhanced Treasury Income Fund | 989,088 | ||||||||||||||
| 20,000 | John Hancock Premium Dividend Fund | 239,400 | ||||||||||||||
| 18,229 | Nuveen Mortgage Opportunity Term Fund | 433,121 | ||||||||||||||
|
| |||||||||||||||
|
| Total Closed-End Mutual Funds (Cost $9,213,531) | 9,213,779 | ||||||||||||||
| Preferred Stocks (1.0%) | ||||||||||||||||
| 26,000 | Gramercy Property Trust, Inc., Series A | 895,440 | ||||||||||||||
| 4,900 | Oxford Lane Capital Corp., Series 2017 | 126,175 | ||||||||||||||
|
| |||||||||||||||
|
| Total Preferred Stocks (Cost $1,003,614) | 1,021,615 | ||||||||||||||
| Collateral for Securities on Loan (7.4%) | ||||||||||||||||
| 7,297,402 | State Street Navigator Prime Portfolio, 0.17% | 7,297,402 | ||||||||||||||
|
| |||||||||||||||
|
| Total Collateral for Securities on Loan (Cost $7,297,402) | 7,297,402 | ||||||||||||||
| Short-Term Investments (7.7%) | ||||||||||||||||
| $ | 7,524,839 | State Street Euro Dollar Time Deposit (USD), 0.01%, 10/01/13 | 7,524,839 | |||||||||||||
|
| |||||||||||||||
|
| Total Short-Term Investments (Cost $7,524,839) | 7,524,839 | ||||||||||||||
| 12 | SCHEDULEOF INVESTMENTS |
Table of Contents
| Shares or Principal Amount | Value | |||||||||
| Total Investments 109.1% (Cost $106,465,712) | $ | 107,069,954 | ||||||||
| Liabilities Less Other Assets (9.1)% | (8,957,104 | ) | ||||||||
|
| |||||||||
| Net Assets 100.0% | $ | 98,112,850 | ||||||||
|
| |||||||||
The accompanying notes are an integral part of the financial statements.
| (a) | All or a portion of the security was on loan as of September 30, 2013. |
| (b) | 144A - Exempt from registration under Rule 144A of the Securities Act of 1933. These securities may be resold in transactions exempt from registration, typically only to qualified institutional buyers. Unless otherwise indicated, these securities are not considered to be illiquid. |
| (c) | Step Bond - the coupon is at a fixed rate and resets at a specific date and rate. The rate disclosed is as of September 30, 2013. |
| (d) | Floating Rate Security. Rate disclosed is as of September 30, 2013. |
| SCHEDULEOF INVESTMENTS | 13 |
Table of Contents
MANAGEMENT OVERVIEW (UNAUDITED) ICON EQUITY INCOME FUND | Class S Class C Class A | IOEZX IOECX IEQAX |
| Q. | How did the Fund perform relative to its benchmark? |
| A. | The ICON Equity Income Fund Class S (“Equity Income Fund”) returned 17.76% for the fiscal year ended September 30, 2013, underperforming its benchmark, the S&P Composite 1500 Index, which rose 20.43%. Total returns for other periods and additional Class shares as of September 30, 2013, appear in the subsequent pages of this Fund’s Management Overview. |
| Q. | What primary factors were behind the Fund’s relative performance? |
| A. | At the start of the fiscal year, the overall equity market was showing a V/P of 1.39. As economic conditions improved equity market prices moved higher. For example, the unemployment rate, which broke below 8% at the end of September 2012, continued to improve over the course of the year and stood at 7.3% by the end of August 2013. With such strong valuation readings and improving economic indicators, it is not surprising that the equity markets, as measured by the S&P Composite 1500 Index, were able to obtain returns higher than 20% for the year. The Equity Income Fund’s focus on securities with strong dividend payments hindered performance. Doing a decomposition of returns of the S&P Composite 1500 Index by dividend yield, we found that the stocks that had dividend yields of 2% or less on average returned approximately 23% and those with dividend yields greater than 2% on average returned approximately 17% for the period. |
| Q. | How did the Fund’s composition affect performance? |
| A. | Based on ICON’s proprietary valuation system, the Consumer Discretionary sector started off with attractive valuations and, as a result, comprised a significant portion of the Equity Income Fund. As the year progressed, prices within the Consumer Discretionary sector rose and valuations became less appealing under our system. As a result, the Equity Income Fund’s holdings in this sector were reduced from almost 16% to under 9% during the fiscal year. A combination of stock selection and timing caused the Consumer Discretionary holdings within the Equity Income Fund to underperform those in the Consumer Discretionary segment of the S&P Composite 1500 index. The Health Care sector was also a net detractor from the Equity Income Fund’s relative performance as the Equity Income Fund was underweight this strong performing sector. |
| 14 | MANAGEMENT OVERVIEW |
Table of Contents
Over the course of the fiscal year the Equity Income Fund, based on strong valuations, had notable exposure to both the Energy and Materials sectors. Good stock selection in these two sectors within the Equity Income Fund had a positive impact on benchmark relative performance.
| Q. | What is your investment outlook for the overall equity market? |
| A. | At the end of the fiscal year our system calculates an overall market V/P of 0.99. Nonetheless we see attractive valuations for some sectors and industries. As of September 2013, the Energy, Materials and Utilities sectors, for example, have value-to-price ratios solidly above 1.00 under our system. As a result, the Equity Income Fund finished the fiscal year overweight each of these sectors. Still, with low overall market valuations, we will proceed cautiously while looking to capitalize on opportunities where and when they present themselves. |
ICON Equity Income Fund
Sector Composition
September 30, 2013
Consumer Staples | 13.2% | |||
Financial | 13.2% | |||
Energy | 12.3% | |||
Utilities | 12.3% | |||
Industrials | 10.3% | |||
Consumer Discretionary | 9.5% | |||
Materials | 7.6% | |||
Information Technology | 6.8% | |||
Health Care | 1.8% | |||
|
| |||
| 87.0% | ||||
|
|
Percentages are based upon common, preferred and convertible preferred stocks as a percentage of net assets.
| MANAGEMENT OVERVIEW | 15 |
Table of Contents
ICON Equity Income Fund
Industry Composition
September 30, 2013
Tobacco | 5.7% | |||
Commodity Chemicals | 3.9% | |||
Integrated Oil & Gas | 3.9% | |||
Steel | 3.7% | |||
Electric Utilities | 3.6% | |||
Diversified Banks | 3.5% | |||
Soft Drinks | 3.4% | |||
Specialized REIT’s | 3.3% | |||
Gas Utilities | 3.2% | |||
Department Stores | 2.6% | |||
Oil & Gas Equipment & Services | 2.6% | |||
Aerospace & Defense | 2.5% | |||
Industrial Machinery | 2.3% | |||
Packaged Foods & Meats | 2.2% | |||
Asset Management & Custody Banks | 2.0% | |||
Computer Hardware | 2.0% | |||
Integrated Telecommunication Services | 2.0% | |||
Agricultural Products | 1.9% | |||
Diversified Support Services | 1.9% | |||
Electronic Equipment & Instruments | 1.9% | |||
Housewares & Specialties | 1.9% | |||
Multi-Utilities | 1.9% |
Publishing | 1.9% | |||
Advertising | 1.7% | |||
Oil & Gas Exploration & Production | 1.7% | |||
Railroads | 1.7% | |||
Systems Software | 1.7% | |||
Oil & Gas Drilling | 1.6% | |||
Oil & Gas Storage & Transportation | 1.6% | |||
Consumer Finance | 1.4% | |||
Retail REIT’s | 1.2% | |||
Data Processing & Outsourced Services | 1.1% | |||
Office Services & Supplies | 1.1% | |||
Specialized Finance | 1.0% | |||
Water Utilities | 1.0% | |||
Other Industries (each less than 1%) | 6.4% | |||
|
| |||
| 87.0% | ||||
|
|
Percentages are based upon common, preferred and convertible preferred stocks as a percentage of net assets.
| 16 | MANAGEMENT OVERVIEW |
Table of Contents
ICON Equity Income Fund
Average Annual Total Return
as of September 30, 2013
| Inception Date | 1 Year | 5 Years | 10 Years | Since Inception | Gross Expense Ratio* | Net Expense Ratio* | ||||||||||||||||||||||
ICON Equity Income Fund - Class S | 5/10/04 | 17.76% | 7.60% | N/A | 6.27% | 1.47% | 1.21% | |||||||||||||||||||||
ICON Equity Income Fund - Class C | 11/8/02 | 16.58% | 6.53% | 5.90% | 6.90% | 2.62% | 2.20% | |||||||||||||||||||||
ICON Equity Income Fund - Class A | 5/31/06 | 17.49% | 7.31% | N/A | 4.44% | 1.69% | 1.45% | |||||||||||||||||||||
ICON Equity Income Fund - Class A (including maximum sales charge of 5.75%) | 5/31/06 | 10.73% | 6.05% | N/A | 3.60% | 1.69% | 1.45% | |||||||||||||||||||||
S&P Composite 1500 Index | 20.43% | 10.35% | 7.97% | 8.60% | N/A | N/A | ||||||||||||||||||||||
Past performance is not a guarantee of future results. Information about these performance results and the comparative indexes can be found in the About This Report section. The Adviser has agreed to limit certain Fund expenses; without these limitations, returns would have been lower. The limitation provisions may be terminated in the future.
| * | Please see the most recent prospectus for details. |
Class C total returns exclude applicable sales charges. If sales charges were included returns would be lower.
| MANAGEMENT OVERVIEW | 17 |
Table of Contents
ICON Equity Income Fund
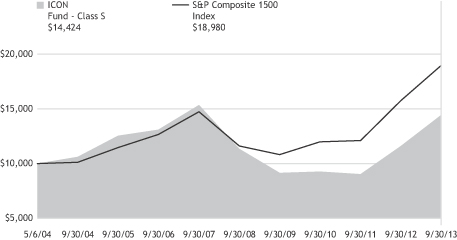
Value of a $10,000 Investment
through September 30, 2013

Past performance is not a guarantee of future results. The above graph compares a $10,000 investment made in the Equity Income Fund’s Class S shares on the Class’ inception date of 5/10/04 to a $10,000 investment made in an unmanaged securities index on that date. Performance for the Equity Income Fund’s other share classes will vary due to differences in charges and expenses. The Equity Income Fund’s performance in this chart and the performance table assumes the reinvestment of dividends and capital gain distributions but does not reflect the deduction of taxes that a shareholder would pay on Fund distributions or on the redemption of Fund shares.
| 18 | MANAGEMENT OVERVIEW |
Table of Contents
ICON EQUITY INCOME FUND
SCHEDULEOF INVESTMENTS
SEPTEMBER 30, 2013
| Shares or Principal Amount | Value | |||||||
| Common Stocks (79.6%) | ||||||||
| 9,800 | American Eagle Outfitters, Inc. | $ | 137,102 | |||||
| 5,500 | American Water Works Co., Inc. | 227,040 | ||||||
| 1,000 | Apple, Inc. | 476,750 | ||||||
| 10,900 | BCE, Inc. | 465,430 | ||||||
| 13,700 | CA, Inc. | 406,479 | ||||||
| 4,300 | Campbell Soup Co. | 175,053 | ||||||
| 3,400 | Chevron Corp. | 413,100 | ||||||
| 2,000 | CNOOC, Ltd., ADR | 403,600 | ||||||
| 8,800 | Coca-Cola Co. | 333,344 | ||||||
| 11,600 | ConAgra Foods, Inc. | 351,944 | ||||||
| 3,500 | ConocoPhillips | 243,285 | ||||||
| 3,400 | Crane Co. | 209,678 | ||||||
| 10,200 | Dr. Pepper Snapple Group, Inc. | 457,164 | ||||||
| 3,400 | DST Systems, Inc. | 256,394 | ||||||
| 7,100 | Ensco PLC, Class A | 381,625 | ||||||
| 5,300 | EPR Properties, REIT | 258,322 | ||||||
| 3,100 | Exxon Mobil Corp. | 266,724 | ||||||
| 4,000 | General Dynamics Corp. | 350,080 | ||||||
| 9,800 | Golar LNG Ltd. | 369,166 | ||||||
| 17,200 | Healthcare Services Group, Inc. | 443,072 | ||||||
| 4,800 | HollyFrontier Corp. | 202,128 | ||||||
| 1,700 | Ingredion, Inc. | 112,489 | ||||||
| 8,400 | Invesco, Ltd. | 267,960 | ||||||
| 15,100 | Knoll, Inc. | 255,794 | ||||||
| 5,100 | Koppers Holdings, Inc. | 217,515 | ||||||
| 7,800 | Laclede Group, Inc. | 351,000 | ||||||
| 8,200 | Lorillard, Inc. | 367,196 | ||||||
| 6,300 | LyondellBasell Industries, Class A | 461,349 | ||||||
| 5,400 | Macy’s, Inc. | 233,658 | ||||||
| 1,900 | McDonald’s Corp. | 182,799 | ||||||
| 3,600 | McGraw-Hill Financial Inc | 236,124 | ||||||
| Shares or Principal Amount | Value | |||||||
| 4,600 | Methanex Corp. | $ | 235,842 | |||||
| 24,100 | MFA Financial, Inc., REIT | 179,545 | ||||||
| 7,000 | MTS Systems Corp. | 450,450 | ||||||
| 6,800 | Nordstrom, Inc. | 382,160 | ||||||
| 5,100 | Norfolk Southern Corp. | 394,485 | ||||||
| 3,700 | Northern Trust Corp. | 201,243 | ||||||
| 9,400 | Nucor Corp. | 460,788 | ||||||
| 3,600 | Oceaneering International, Inc. | 292,464 | ||||||
| 26,500 | PDL BioPharma, Inc.(a) | 211,205 | ||||||
| 5,800 | Philip Morris International, Inc. | 502,222 | ||||||
| 9,300 | Quality Systems, Inc. | 202,089 | ||||||
| 4,100 | Rayonier, Inc., REIT | 228,165 | ||||||
| 7,200 | Realty Income Corp., REIT(a) | 286,200 | ||||||
| 5,600 | Republic Services, Inc. | 186,816 | ||||||
| 9,400 | Reynolds American, Inc. | 458,532 | ||||||
| 4,100 | Rogers Communications, Inc., Class B | 176,341 | ||||||
| 18,900 | RPC, Inc.(a) | 292,383 | ||||||
| 6,600 | South Jersey Industries, Inc. | 386,628 | ||||||
| 23,800 | Steel Dynamics, Inc. | 397,698 | ||||||
| 5,000 | Tupperware Brands Corp. | 431,850 | ||||||
| 6,400 | U.S. Bancorp | 234,112 | ||||||
| 11,700 | UIL Holdings Corp. | 435,006 | ||||||
| 2,200 | United Technologies Corp. | 237,204 | ||||||
| 15,700 | Valassis Communications, Inc.(a) | 453,416 | ||||||
| 4,700 | Ventas, Inc., REIT | 289,050 | ||||||
| 5,500 | Wells Fargo & Co. | 227,260 | ||||||
| 12,700 | Westar Energy, Inc.(a) | 389,255 | ||||||
| 16,200 | Xcel Energy, Inc. | 447,282 | ||||||
|
| |||||||
|
| Total Common Stocks (Cost $17,700,975) | 18,583,055 | ||||||
| SCHEDULEOF INVESTMENTS | 19 |
Table of Contents
| Shares or Principal Amount | Value | |||||||
| Preferred Stocks (2.8%) | ||||||||
| 14,100 | Discover Financial Services, Series B(a) | $ | 331,632 | |||||
| 15,000 | Stanley Black & Decker, Inc. | 330,300 | ||||||
|
| |||||||
|
| Total Preferred Stocks (Cost $724,305) | 661,932 | ||||||
| Shares or Principal Amount | Value | |||||||
| Convertible Preferred Stocks (4.6%) | ||||||||
| 3,100 | Bunge, Ltd. | $ | 326,399 | |||||
| 300 | Interpublic Group of Cos., Inc., Series B | 401,187 | ||||||
| 300 | Wells Fargo & Co., Series L | 341,253 | ||||||
|
| |||||||
|
| Total Convertible Preferred Stocks (Cost $1,098,324) | 1,068,839 | ||||||
| Shares or Principal Amount | Interest Rate | Maturity Date | Value | |||||||||||||
| Corporate Bonds (5.4%) | ||||||||||||||||
| $ | 300,000 | Altria Group, Inc. | 9.95 | % | 11/10/38 | $ | 447,834 | |||||||||
| 150,000 | B/E Aerospace, Inc. | 6.88 | % | 10/01/20 | 163,875 | |||||||||||
| 350,000 | Commercial Metals Co. | 7.35 | % | 08/15/18 | 379,750 | |||||||||||
| 300,000 | Dollar General Corp. | 3.25 | % | 04/15/23 | 273,210 | |||||||||||
|
| |||||||||||||||
|
| Total Corporate Bonds (Cost $1,294,443) | 1,264,669 | ||||||||||||||
| Foreign Corporate Bonds (1.2%) | ||||||||||||||||
| 250,000 | Shelf Drilling Holdings Ltd.(a)(b) | 8.63 | % | 11/01/18 | 265,625 | |||||||||||
|
| |||||||||||||||
|
| Total Foreign Corporate Bonds (Cost $266,263) | 265,625 | ||||||||||||||
| Shares or Principal Amount | Value | |||||||||||||||
| Exchange Traded Funds (3.3%) | ||||||||||||||||
| 3,500 | iShares iBoxx Investment Grade Corporate Bond(a) | $ | 397,320 | |||||||||||||
| 9,400 | SPDR Barclays High Yield Bond ETF | 374,496 | ||||||||||||||
|
| |||||||||||||||
|
| Total Exchange Traded Funds (Cost $767,315) | 771,816 | ||||||||||||||
| Closed-End Mutual Fund (1.0%) | ||||||||||||||||
| 18,000 | Federated Enhanced Treasury Income Fund | 231,480 | ||||||||||||||
|
| |||||||||||||||
|
| Total Closed-End Mutual Funds (Cost $232,153) | 231,480 | ||||||||||||||
| Collateral for Securities on Loan (10.2%) | ||||||||||||||||
| 2,389,304 | State Street Navigator Prime Portfolio, 0.17% | 2,389,304 | ||||||||||||||
|
| |||||||||||||||
|
| Total Collateral for Securities on Loan (Cost $2,389,304) | 2,389,304 | ||||||||||||||
| Short-Term Investments (2.2%) | ||||||||||||||||
| $ | 510,943 | State Street Euro Dollar Time Deposit (USD), 0.01%, 10/01/13 | 510,943 | |||||||||||||
|
| |||||||||||||||
| 20 | SCHEDULEOF INVESTMENTS |
Table of Contents
| Shares or Principal Amount | Value | |||||||||
| Total Short-Term Investments (Cost $510,943) | $ | 510,943 | ||||||||
| Total Investments 110.3% (Cost $24,984,025) | 25,747,663 | |||||||||
| Liabilities Less Other Assets (10.3)% | (2,410,447 | ) | ||||||||
|
| |||||||||
| Net Assets 100.0% | $ | 23,337,216 | ||||||||
|
| |||||||||
The accompanying notes are an integral part of the financial statements.
| (a) | All or a portion of the security was on loan as of September 30, 2013. |
| (b) | 144A - Exempt from registration under Rule 144A of the Securities Act of 1933. These securities may be resold in transactions exempt from registration, typically only to qualified institutional buyers. Unless otherwise indicated, these securities are not considered to be illiquid. |
| ADR | American Depositary Receipt |
| REIT | Real Estate Investment Trust |
| SCHEDULEOF INVESTMENTS | 21 |
Table of Contents
MANAGEMENT OVERVIEW (UNAUDITED) ICON FUND | Class S Class C Class A | ICNZX ICNCX ICNAX |
| Q. | How did the Fund perform relative to its benchmark? |
| A. | The ICON Fund Class S (“ICON Fund”) shares returned 24.27% for the fiscal year ended September 30, 2013, while its stated benchmark the S&P Composite 1500 Index gained 20.43%. Total returns for other periods and additional Class shares as of September 30, 2013 appear in the subsequent pages of this Fund’s Management Overview. |
| Q. | What primary factors were behind the Fund’s relative performance? |
The S & P Composite 1500 Index gained 20.43% during the fiscal year. On September 30, 2012 we measured an overall market V/P of 1.39. With value as our guide, we were correctly bullish over this period. We generally reduced cash and tilted toward industries and sectors where we saw the greatest value. As the ICON domestic market V/P dropped toward 1.00 in July 2013, we sold portions of three over-priced equity positions in mid-July. As more positions appeared over-priced under our system they were sold in September. As a result of selling and holding cash, the fund ended the fiscal year with 9.1% in cash.
ICON Fund’s largest sector weights on September 30, 2012 were Consumer Discretionary (29.6%), Industrials (24.9%) and Information Technology (16.5%) and there were no positions in the Consumer Staples, Utilities or Telecommunication Services sectors. These weightings did not change much until the sales mentioned above in July and September, which reduced the larger sector weightings. Based on S&P Composite 1500 sector indexes, Consumer Discretionary and Industrials were the best two performing sectors over the year, while Telecommunication Services and Utilities were the worst two performing sectors. The theme was not constant through the fiscal year. From late February 2013 through mid-April 2013 there was a brief theme reversal when the defensive sectors led and the cyclical sectors lagged. We did not react to that reversal and instead rode through it with fairly constant sector tilts.
| Q. | How did the Fund’s composition affect performance? |
| A. | The largest contributors to ICON Fund’s performance came from the Energy sector. In the oil & gas equipment & services industry, Dril-Quip, Inc. and Oceaneering International, Inc. were purchased December 18, 2012 and were up 58.4% and 52.9%, respectively, from that date until the |
| 22 | MANAGEMENT OVERVIEW |
Table of Contents
| end of the fiscal year. Those December purchases made oil & gas services & equipment the largest industry holding of the ICON Fund. One Healthcare stock in the pharmaceuticals industry contributed 2.83 percentage points of return as Questcorp Pharmaceuticals, Inc. gained 222.76% for the year. You may recall that Questcorp hurt performance the previous year, but was retained in the portfolio based on value. The Consumer Discretionary sector was one of ICON Fund’s largest weighted sectors at almost triple its benchmark weight, as investors, concerned with the potential fiscal cliff and the sequester, were giving us many Consumer Discretionary stocks at significant discounts to our estimate of fair value. Two Consumer Discretionary sector contributors to performance were Viacom, Inc., Class B, up 58.75% for the 12-month period, and Nike Inc., Class B, up 55.35% for the 12-month period. |
Stocks that hurt performance came from the Information Technology sector. Apple Inc.’s price fell 26.84% over the period concurrent with analysts revising forecasted earnings downward. International Business Machines Corp. also posted (9.09)%, and was a drag on performance. Similar to Apple, Inc., F5 Networks, Inc. had its price drop as analysts cut their earnings outlook in early 2013. F5 Networks was sold from ICON Fund on April 23, 2013.
Q. What is your investment outlook for the overall market?
| A. | Last year we wrote, “going into the new fiscal year, ICON’s valuation system shows a market V/P of 1.39, suggesting there is still plenty of room for the market to appreciate towards fair value. Because of this valuation reading, we believe we are still in a bull market and we continue to position ICON Fund long in industries that show great value according to our methodology.” Looking back, we believe our value readings were a good guide. Now, very different from a year ago, our ICON market V/P is 1.00. In the short run, if stock prices drop, we will likely be buyers. If instead, prices move higher we will likely be sellers. As always, our decisions will be largely guided by our system’s valuation readings. |
While a V/P of 1.00 suggests stock prices are priced right at fair value, value is not stagnant. As our fiscal year ends, we are optimistic that fair value and prices can increase over the next twelve months as we bring 2014 earnings into our valuation equation and drop off old earnings.
| MANAGEMENT OVERVIEW | 23 |
Table of Contents
ICON Fund
Sector Composition
September 30, 2013
Consumer Discretionary | 31.1% | |||
Energy | 18.5% | |||
Industrials | 16.4% | |||
Information Technology | 11.4% | |||
Financial | 8.5% | |||
Health Care | 2.6% | |||
Materials | 2.6% | |||
|
| |||
| 91.1% | ||||
|
|
Percentages are based upon common stocks as a percentage of net assets.
ICON Fund
Industry Composition
September 30, 2013
Oil & Gas Equipment & Services | 17.5 | % | ||
Railroads | 8.7 | % | ||
Specialty Stores | 8.5 | % | ||
Movies & Entertainment | 8.1 | % | ||
IT Consulting & Other Services | 7.1 | % | ||
Footwear | 6.1 | % | ||
Asset Management & Custody Banks | 5.0 | % | ||
Computer Hardware | 4.3 | % | ||
Apparel, Accessories & Luxury Goods | 3.2 | % | ||
Construction & Farm Machinery & Heavy Trucks | 3.0 | % |
Cable & Satellite | 2.6 | % | ||
Pharmaceuticals | 2.6 | % | ||
Restaurants | 2.6 | % | ||
Steel | 2.6 | % | ||
Industrial Machinery | 2.5 | % | ||
Insurance Brokers | 2.5 | % | ||
Electrical Components & Equipment | 2.2 | % | ||
Diversified Banks | 1.0 | % | ||
Oil & Gas Drilling | 1.0 | % | ||
|
| |||
| 91.1 | % | |||
|
|
Percentages are based upon common stocks as a percentage of net assets.
| 24 | MANAGEMENT OVERVIEW |
Table of Contents
ICON Fund
Average Annual Total Return
as of September 30, 2013
| Inception Date | 1 Year | 5 Years | 10 Years | Since Inception | Gross Expense Ratio* | Net Expense Ratio* | ||||||||||||||||||||||
ICON Fund - Class S | 5/6/04 | 24.27% | 4.93% | N/A | 3.97% | 1.18% | 1.18% | |||||||||||||||||||||
ICON Fund - Class C | 11/28/00 | 23.03% | 4.35% | 3.89% | 3.39% | 2.35% | 2.28% | |||||||||||||||||||||
ICON Fund - Class A | 5/31/06 | 23.90% | 4.43% | N/A | 0.14% | 1.54% | 1.54% | |||||||||||||||||||||
ICON Fund - Class A (including maximum sales charge of 5.75%) | 5/31/06 | 16.79% | 3.20% | N/A | -0.66% | 1.54% | 1.54% | |||||||||||||||||||||
S&P Composite 1500 Index | 20.43% | 10.35% | 7.97% | 4.40% | N/A | N/A | ||||||||||||||||||||||
Past performance is not a guarantee of future results. Information about these performance results and the comparative indexes can be found in the About This Report section. The Since Inception performance results for Class C shares include returns for certain time periods that were restarted as of June 8, 2004.
| * | Please see the most recent prospectus for details. |
Class C total returns exclude applicable sales charges. If sales charges were included returns would be lower.
| MANAGEMENT OVERVIEW | 25 |
Table of Contents
ICON Fund
Value of a $10,000 Investment
through September 30, 2013
Past performance is not a guarantee of future results. The above graph compares a $10,000 investment made in the ICON Fund’s Class S shares on the Class’ inception date of 5/6/04 to a $10,000 investment made in an unmanaged securities index on that date. Performance for the ICON Fund’s other share classes will vary due to differences in charges and expenses. The ICON Fund’s performance in this chart and the performance table assumes the reinvestment of dividends and capital gain distributions but does not reflect the deduction of taxes that a shareholder would pay on Fund distributions or on the redemption of Fund shares.
| 26 | MANAGEMENT OVERVIEW |
Table of Contents
ICON FUND
SCHEDULEOF INVESTMENTS
SEPTEMBER 30, 2013
| Shares or Principal Amount | Value | |||||||
| Common Stocks (91.1%) | ||||||||
| 11,700 | Accenture PLC, Class A | $ | 861,588 | |||||
| 12,100 | Aon PLC | 900,724 | ||||||
| 3,200 | Apple, Inc. | 1,525,600 | ||||||
| 6,700 | Atwood Oceanics, Inc.† | 368,768 | ||||||
| 12,700 | Caterpillar, Inc. | 1,058,799 | ||||||
| 46,600 | CSX Corp. | 1,199,484 | ||||||
| 10,100 | Dover Corp. | 907,283 | ||||||
| 19,600 | Dril-Quip, Inc.† | 2,249,100 | ||||||
| 11,500 | Eaton Corp. PLC | 791,660 | ||||||
| 33,700 | FMC Technologies, Inc.† | 1,867,654 | ||||||
| 22,500 | Hibbett Sports, Inc.†(a) | 1,263,375 | ||||||
| 9,100 | International Business Machines Corp. | 1,685,138 | ||||||
| 15,700 | Lululemon Athletica, Inc.†(a) | 1,147,513 | ||||||
| 17,100 | Nike, Inc., Class B | 1,242,144 | ||||||
| 26,400 | Oceaneering International, Inc. | 2,144,736 | ||||||
| 6,000 | Panera Bread Co., Class A† | 951,180 | ||||||
| 16,000 | Questcor Pharmaceuticals, Inc. | 928,000 | ||||||
| 12,300 | State Street Corp. | 808,725 | ||||||
| 55,600 | Steel Dynamics, Inc. | 929,076 | ||||||
| 8,300 | Time Warner Cable, Inc. | 926,280 | ||||||
| 26,800 | Tractor Supply Co. | 1,800,156 | ||||||
| Shares or Principal Amount | Value | |||||||
| 12,500 | Union Pacific Corp. | $ | 1,941,750 | |||||
| 13,300 | Viacom, Inc., Class B | 1,111,614 | ||||||
| 18,900 | Waddell & Reed Financial, Inc., Class A | 972,972 | ||||||
| 27,700 | Walt Disney Co. | 1,786,373 | ||||||
| 8,400 | Wells Fargo & Co. | 347,088 | ||||||
| 15,900 | Wolverine World Wide, Inc. | 925,857 | ||||||
|
| |||||||
|
| Total Common Stocks (Cost $21,170,642) | 32,642,637 | ||||||
| | Collateral for Securities on Loan (6.4%) | |||||||
| 2,293,511 | State Street Navigator Prime Portfolio, 0.17% | 2,293,511 | ||||||
|
| |||||||
|
| Total Collateral for Securities on Loan (Cost $2,293,511) | 2,293,511 | ||||||
| Short-Term Investments (6.2%) | ||||||||
| $ | 2,221,417 | State Street Euro Dollar Time Deposit (USD), 0.01%, 10/01/13 | 2,221,417 | |||||
|
| |||||||
|
| Total Short-Term Investments (Cost $2,221,417) | 2,221,417 | ||||||
|
| Total Investments 103.7% (Cost $25,685,570) | 37,157,565 | ||||||
| | Liabilities Less Other Assets (3.7)% | (1,323,595 | ) | |||||
|
| |||||||
| Net Assets 100.0% | $ | 35,833,970 | ||||||
|
| |||||||
The accompanying notes are an integral part of the financial statements.
| † | Non-income producing security. |
| (a) | All or a portion of the security was on loan as of September 30, 2013. |
| SCHEDULEOF INVESTMENTS | 27 |
Table of Contents
MANAGEMENT OVERVIEW (UNAUDITED) ICON LONG/SHORT FUND | Class S Class C Class A | IOLZX IOLCX ISTAX |
| Q. | How did the Fund perform relative to its benchmark? |
| A. | The ICON Long/Short Fund Class S (“Long/Short Fund”) shares returned 20.05% for the fiscal year ended September 30, 2013, while its stated benchmark, the S&P Composite 1500 Index gained 20.43%. Total returns for other periods and additional Class shares as of September 30, 2013 appear in the subsequent pages of this Fund’s Management Overview. |
| Q. | What primary factors were behind the Fund’s relative performance? |
The S&P Composite 1500 Index gained 20.43% during the fiscal year. On September 30, 2012 we measured an overall market V/P of 1.39. With value as our guide, we were correctly bullish over this period. We generally reduced cash, retained only a minimal short position in the Long/Short Fund and, as noted below, tilted toward our industries and sectors where we saw the greatest value. As the ICON domestic market V/P dropped toward 1.00 in June 2013, we initiated a new short position followed by two more in July and two more in mid-September. Also based on value, we sold portions of two over-priced positions in mid-July. As more positions appeared over-priced, they were sold in August and September. As a result of shorting, selling and holding cash, the Long/Short Fund ended the fiscal year with 7.2% of assets short and 13.3% in cash.
Long/Short Fund’s largest sector weights on September 30, 2012 were Consumer Discretionary (31.6%), Information Technology (22.4%) and Industrials (21.2%); while there were no positions in the Consumer Staples, Utilities or Telecommunication Services sectors. These weightings did not change much until the sales mentioned above in July, August and September. Based on S&P 1500 sector indexes, Consumer Discretionary and Industrials were the best two performing sectors over the year while Telecommunication Services and Utilities were the worst two but the theme was not constant. From late February through mid-April there was a brief theme reversal when the defensive sectors led and the cyclical sectors lagged. We did not react to that reversal and instead rode through it with fairly constant sector tilts.
| Q. | How did the Fund’s composition affect performance? |
| A. | The largest contributors to the Long/Short Fund’s performance came from the Energy sector. In the oil & gas equipment & services industry, Dril-Quip, Inc. and Oceaneering International, Inc. were purchased |
| 28 | MANAGEMENT OVERVIEW |
Table of Contents
| December 18, 2012 and were up 58.4% and 52.9%, respectively, between that date and fiscal year end. Those December purchases made oil & gas services & equipment the largest industry holding of the Long/Short Fund. One Health Care stock in the pharmaceuticals industry contributed 1.76 percentage points of return as Questcorp Pharmaceuticals, Inc. gained 222.76% for the fiscal year. You may recall that Questcorp hurt performance the previous year, but was retained in the portfolio based on value. The Consumer Discretionary sector was one of the Long/Short Fund’s largest weighted sectors at almost triple its benchmark weight, as investors, concerned with the potential fiscal cliff and the sequester, were giving us many Consumer Discretionary stocks at significant discounts to our estimate of fair value. Two contributors to performance from that sector were Nike, Inc., held the entire period, gaining 55.35% and Tractor Supply Company, purchased November 12, 2012, which gained 48.39%, between that date and fiscal year end. |
Stocks that hurt performance came from the Information Technology sector. Apple, Inc.’s price fell 27% over the entire period concurrent with analysts revising forecasted earnings downward. International Business Machines Corp. also posted (9.09)% during the fiscal year and was a drag on performance. Similar to Apple, Inc., F5 Networks, Inc. had its price drop as analysts cut their earnings outlook in early 2013. F5 Networks, Inc. was sold from the Long/Short Fund on April 23, 2013.
| Q. | What is your investment outlook for the overall market? |
| A. | Last year we wrote, “going into the new fiscal year, ICON’s valuation system shows a market V/P of 1.39, suggesting there is still plenty of room for the market to appreciate towards fair value. Because of this valuation reading, we believe we are still in a bull market and we continue to position the Fund long in industries that show great value according to our methodology.” Looking back, we believe our value readings were a good guide. Now, very different from a year ago, our ICON market V/P is 1.00. In the short run, if stock prices drop, we will likely be buyers. If instead, prices move higher we will likely be sellers. As always, our decisions will be largely guided by our system’s valuation readings. |
While a V/P of 1.00 suggests stock prices are priced right at fair value, value is not stagnant. As our fiscal year ends, we are optimistic that fair value and prices can increase over the next twelve months as we bring 2014 earnings into our valuation equation and drop off old earnings.
| MANAGEMENT OVERVIEW | 29 |
Table of Contents
ICON Long/Short Fund
Sector Composition
September 30, 2013
Consumer Discretionary | 31.4% | |||
Information Technology | 17.6% | |||
Industrials | 12.3% | |||
Energy | 11.6% | |||
Health Care | 6.4% | |||
Financial | 5.8% | |||
Materials | 3.1% | |||
|
| |||
| 88.2% | ||||
|
|
Percentages are based upon long positions as a percentage of net assets.
ICON Long/Short Fund
Industry Composition
September 30, 2013
Oil & Gas Equipment & Services | 10.6% | |||
IT Consulting & Other Services | 10.3% | |||
Specialty Stores | 9.0% | |||
Footwear | 6.0% | |||
Railroads | 5.9% | |||
Computer Hardware | 4.6% | |||
Cable & Satellite | 3.5% | |||
Housewares & Specialties | 3.5% | |||
Restaurants | 3.5% | |||
Steel | 3.1% | |||
Homefurnishing Retail | 2.9% | |||
Health Care Services | 2.8% | |||
Data Processing & Outsourced Services | 2.7% | |||
Industrial Machinery | 2.4% | |||
Industrial Conglomerates | 2.2% |
Asset Management & Custody Banks | 2.1% | |||
Health Care Equipment | 2.0% | |||
Movies & Entertainment | 2.0% | |||
Diversified Banks | 1.9% | |||
Construction & Farm Machinery & Heavy Trucks | 1.8% | |||
Insurance Brokers | 1.8% | |||
Pharmaceuticals | 1.6% | |||
Apparel, Accessories & Luxury Goods | 1.0% | |||
Oil & Gas Drilling | 1.0% | |||
|
| |||
| 88.2% | ||||
|
|
Percentages are based upon long positions as a percentage of net assets.
| 30 | MANAGEMENT OVERVIEW |
Table of Contents
ICON Long/Short Fund
Average Annual Total Return
as of September 30, 2013
| Inception Date | 1 Year | 5 Years | 10 Years | Since Inception | Gross Expense Ratio* | Net Expense Ratio* | ||||||||||||||||||||||
ICON Long/Short Fund - Class S | 5/6/04 | 20.05% | 5.79% | N/A | 4.02% | 2.18% | 1.35% | |||||||||||||||||||||
ICON Long/Short Fund - Class C | 10/17/02 | 18.71% | 4.66% | 4.48% | 5.19% | 2.95% | 2.41% | |||||||||||||||||||||
ICON Long/Short Fund - Class A | 5/31/06 | 19.71% | 5.47% | N/A | 1.23% | 2.09% | 1.65% | |||||||||||||||||||||
ICON Long/Short Fund - Class A (including maximum sales charge of 5.75%) | 5/31/06 | 12.85% | 4.22% | N/A | 0.42% | 2.09% | 1.65% | |||||||||||||||||||||
S&P Composite 1500 Index | 20.43% | 10.35% | 7.97% | 8.72% | N/A | N/A | ||||||||||||||||||||||
Past performance is not a guarantee of future results. Information about these performance results and the comparative indexes can be found in the About This Report section. The Adviser has agreed to limit certain Fund expenses; without these limitations, returns would have been lower. The limitation provisions may be terminated in the future.
| * | Please see the most recent prospectus for details. |
Class C total returns exclude applicable sales charges. If sales charges were included returns would be lower.
| MANAGEMENT OVERVIEW | 31 |
Table of Contents
ICON Long/Short Fund
Value of a $10,000 Investment
through September 30, 2013
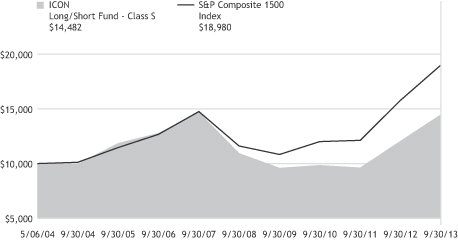
Past performance is not a guarantee of future results. The above graph compares a $10,000 investment made in the Long/Short Fund’s Class S shares on the Class’ inception date of 5/6/04 to a $10,000 investment made in an unmanaged securities index on that date. Performance for the Long/Short Fund’s other share classes will vary due to differences in charges and expenses. The Long/Short Fund’s performance in this chart and the performance table assumes the reinvestment of dividends and capital gain distributions but does not reflect the deduction of taxes that a shareholder would pay on Fund distributions or on the redemption of Fund shares.
| 32 | MANAGEMENT OVERVIEW |
Table of Contents
ICON LONG/SHORT FUND
SCHEDULEOF INVESTMENTS
SEPTEMBER 30, 2013
| Shares or Principal Amount | Value | |||||||
| Common Stocks (88.2%) | ||||||||
| 7,300 | Accenture PLC, Class A | $ | 537,572 | |||||
| 4,800 | Aon PLC | 357,312 | ||||||
| 1,900 | Apple, Inc.(x) | 905,825 | ||||||
| 3,500 | Atwood Oceanics, Inc.† | 192,640 | ||||||
| 7,300 | Bed Bath & Beyond, Inc.† | 564,728 | ||||||
| 18,200 | Bio-Reference Labs, Inc.†(a) | 543,816 | ||||||
| 4,200 | Caterpillar, Inc.(x) | 350,154 | ||||||
| 11,100 | Cognizant Technology Solutions Corp., Class A†(x) | 911,532 | ||||||
| 22,000 | CSX Corp. | 566,280 | ||||||
| 6,300 | Danaher Corp. | 436,716 | ||||||
| 5,200 | Dover Corp. | 467,116 | ||||||
| 5,600 | Dril-Quip, Inc.† | 642,600 | ||||||
| 12,100 | FMC Technologies, Inc.† | 670,582 | ||||||
| 13,400 | Hibbett Sports, Inc.†(a) | 752,410 | ||||||
| 3,200 | International Business Machines Corp.(x) | 592,576 | ||||||
| 14,400 | Jarden Corp.† | 696,960 | ||||||
| 800 | Mastercard, Inc., Class A | 538,224 | ||||||
| 16,200 | Nike, Inc., Class B | 1,176,768 | ||||||
| 7,700 | Norfolk Southern Corp. | 595,595 | ||||||
| 9,400 | Oceaneering International, Inc. | 763,656 | ||||||
| 4,300 | Panera Bread Co., Class A† | 681,679 | ||||||
| Shares or Principal Amount | Value | |||||||
| 5,600 | Questcor Pharmaceuticals, Inc. | $ | 324,800 | |||||
| 7,500 | ResMed, Inc.(a) | 396,150 | ||||||
| 36,700 | Steel Dynamics, Inc. | 613,257 | ||||||
| 6,100 | Time Warner Cable, Inc. | 680,760 | ||||||
| 15,400 | Tractor Supply Co. | 1,034,418 | ||||||
| 1,000 | V.F. Corp. | 199,050 | ||||||
| 8,100 | Waddell & Reed Financial, Inc., Class A | 416,988 | ||||||
| 6,000 | Walt Disney Co.(x) | 386,940 | ||||||
| 9,100 | Wells Fargo & Co. | 376,012 | ||||||
|
| |||||||
|
| Total Common Stocks (Cost $13,526,274) | 17,373,116 | ||||||
| Collateral for Securities on Loan (8.4%) | ||||||||
| 1,645,210 | State Street Navigator Prime Portfolio, 0.17% | 1,645,210 | ||||||
|
| |||||||
|
| Total Collateral for Securities on Loan (Cost $1,645,210) | 1,645,210 | ||||||
| Short-Term Investments (8.8%) | ||||||||
| $ | 1,743,476 | State Street Euro Dollar Time Deposit (USD), 0.01%, 10/01/13 | 1,743,476 | |||||
|
| |||||||
|
| Total Short-Term Investments (Cost $1,743,476) | 1,743,476 | ||||||
|
| Total Investments 105.4% (Cost $16,914,960) | 20,761,802 | ||||||
| | Liabilities Less Other Assets (5.4)% | (1,066,397 | ) | |||||
|
| |||||||
| Net Assets 100.0% | $ | 19,695,405 | ||||||
|
| |||||||
The accompanying notes are an integral part of the financial statements.
| † | Non-income producing security. |
| (x) | All or a portion of the security is pledged as collateral for securities sold short. |
| (a) | All or a portion of the security was on loan as of September 30, 2013. |
| SCHEDULEOF INVESTMENTS | 33 |
Table of Contents
ICON LONG/SHORT FUND
SCHEDULEOF SECURITIES SOLD SHORT
SEPTEMBER 30, 2013
| Shares | Short Security | Value | ||||||
| 11,600 | Amedisys, Inc.† | $ | 199,636 | |||||
| 11,700 | Arkansas Best Corp. | 300,339 | ||||||
| 17,000 | Gannett Co., Inc. | 455,430 | ||||||
| 38,400 | Global Cash Access Holdings, Inc.† | 299,904 | ||||||
| 5,400 | HealthStream, Inc.† | 204,552 | ||||||
|
| |||||||
|
| Total Securities Sold Short (Proceeds $1,349,020) | $ | 1,459,861 | |||||
|
| |||||||
The accompanying notes are an integral part of the financial statements.
| † | Non-income producing security. |
| 34 | SCHEDULEOF INVESTMENTS |
Table of Contents
MANAGEMENT OVERVIEW (UNAUDITED) ICON OPPORTUNITIES FUND | ICONX |
| Q. | How did the Fund perform relative to its benchmark? |
| A. | The ICON Opportunities Fund (“Opportunities Fund”) returned 30.20% for the 12-months ended September 30, 2013, slightly underperforming the 31.51% return for the Fund’s stated benchmark, the S&P SmallCap 600 Index. Total returns and other performance statistics as of September 30, 2013 appear in the subsequent pages of this Fund’s Management Overview. |
| Q. | What primary factors were behind the Fund’s relative performance? |
| A. | The S&P SmallCap 600 Index gained 31.49% during the fiscal year. On September 30, 2012 we measured an overall market V/P of 1.39. With value as our guide, we were appropriately bullish over this period. We generally reduced cash and tilted toward industries and sectors where we saw the greatest value. As the ICON V/P dropped toward 1.00 in July 2013, we sold one over-priced position in mid-July. As more positions became over-priced, one was sold in August and six more in September. As a result of selling, the Opportunities Fund ended the fiscal year with 19.3% in cash. |
Opportunities Fund’s largest sector weights on October 31, 2012 were Health Care (19.0%), Consumer Discretionary (18.3%) and Industrials (18.1%), and there were no positions in the Utilities or Telecommunication Services sectors. These weightings did not change much until the sales mentioned above in July, August, and September, which reduced the larger sector weightings. Based on S&P SmallCap 600 sector indexes, Industrials, Healthcare and Consumer Discretionary were the 1st, 3rd and 4th best performing sectors over the year, while Telecommunication Services and Utilities were the worst two. The fiscal year saw an inconsistent theme in sector leadership. From late February through mid-April, there was a brief theme reversal when the defensive sectors led and the cyclical sectors lagged. We did not react to that reversal and instead rode through it with fairly constant sector tilts.
| Q. | How did the Fund’s composition affect performance? |
| A. | The largest contributor to Fund performance came from the Health Care sector. In the pharmaceutical industry, Questcor Pharmaceuticals, Inc. was up 222.76% over the year. The Consumer Discretionary sector was one of the Opportunities Fund’s largest weighted sectors at almost double its benchmark |
| MANAGEMENT OVERVIEW | 35 |
Table of Contents
| weight, as investors, concerned with the potential fiscal cliff and the sequester, were giving us many Consumer Discretionary stocks at significant discounts to our estimate of fair value. Two contributors to performance from that sector were GameStop Corp. and Tupperware Brands Corporation, gaining 144.68% and 65.80%, respectively, for the year. From the Industrials sector Kforce, Inc. was a major contributor rising 61.82%. One stock from the Information Technology sector was among the top contributors, Tyler Technologies, Inc., gaining 98.71% for the year. |
Three stocks hurt performance during the first two months of the Opportunities Fund’s existence and were sold in December 2012; Qlogic Corporation, Barnes Group, Inc. and EZCORP, Inc. Two Consumer Discretionary stocks in the apparel retail industry put a drag on performance as analysts revised downward their earnings forecasts; Ascena Retail Group, Inc. and JOS A. Bank Clothiers, Inc.
| Q. | What is your investment outlook for the overall market? |
| A. | In relation to our Fund family’s market outlook, last year we wrote, “going into the new fiscal year, ICON’s valuation system shows a market V/P of 1.39, suggesting there is still plenty of room for the market to appreciate towards fair value. Because of this valuation reading, we believe we are still in a bull market and we continue to position the Opportunities Fund long in industries that show great value according to our methodology.” Looking back, we believe our value readings were a good guide. Now, very different from a year ago, our ICON market V/P is 1.00. In the short run, if stock prices drop, we will likely be buyers. If instead, prices move higher we will likely be sellers. As always, our decisions will be largely guided by our system’s valuation readings. |
While a V/P of 1.00 suggests stock prices will be right where they are now a year from now, value is not stagnant. We expect fair value to increase over the next year as we bring in 2014 earnings into our valuation equation and drop off old earnings. If fair value increases, as we believe it may, we expect prices to be modestly higher a year from now.
| 36 | MANAGEMENT OVERVIEW |
Table of Contents
ICON Opportunities Fund
Country Composition
September 30, 2013
United States | 80.2% | |||
Canada | 1.7% | |||
|
| |||
| 81.9% | ||||
|
|
Percentages are based upon common stocks as a percentage of net assets.
ICON Opportunities Fund
Sector Composition
September 30, 2013
Consumer Discretionary | 18.6% | |||
Materials | 12.4% | |||
Information Technology | 12.1% | |||
Industrials | 11.1% | |||
Financial | 10.5% | |||
Energy | 9.9% | |||
Health Care | 7.3% | |||
|
| |||
| 81.9% | ||||
|
|
Percentages are based upon common stocks as a percentage of net assets.
ICON Opportunities Fund
Industry Composition
September 30, 2013
Electronic Equipment & Instruments | 6.1% | |||
Restaurants | 4.9% | |||
Application Software | 4.5% | |||
Consumer Finance | 4.5% | |||
Oil & Gas Equipment & Services | 4.5% | |||
Oil & Gas Drilling | 4.1% | |||
Asset Management & Custody Banks | 3.9% | |||
Trucking | 3.7% | |||
Footwear | 3.5% | |||
Commodity Chemicals | 3.2% | |||
Pharmaceuticals | 3.0% | |||
Industrial Machinery | 2.9% | |||
Paper Products | 2.8% | |||
Apparel Retail | 2.7% | |||
Diversified Chemicals | 2.2% | |||
Steel | 2.2% |
Housewares & Specialties | 2.1% | |||
Specialized Finance | 2.1% | |||
Catalog Retail | 2.0% | |||
Specialty Chemicals | 2.0% | |||
Health Care Services | 1.8% | |||
Human Resource & Employment Services | 1.8% | |||
Computer & Electronics Retail | 1.7% | |||
Specialty Stores | 1.7% | |||
Construction & Farm Machinery & Heavy Trucks | 1.5% | |||
Internet Software & Services | 1.5% | |||
Biotechnology | 1.4% | |||
Oil & Gas Refining & Marketing | 1.3% | |||
Electrical Components & Equipment | 1.2% | |||
Life Sciences Tools & Services | 1.1% | |||
|
| |||
| 81.9% | ||||
|
|
Percentages are based upon common stocks as a percentage of net assets.
| MANAGEMENT OVERVIEW | 37 |
Table of Contents
ICON Opportunities Fund
Average Annual Total Return
as of September 30, 2013
| Inception Date | 1 Year | Since Inception | Gross Expense Ratio* | Net Expense Ratio* | ||||||||||||||||
ICON Opportunities Fund | 10/1/12 | 30.20% | 29.92% | 7.03% | 1.50% | |||||||||||||||
S&P Composite 1500 Index | 31.51% | 31.51% | N/A | N/A | ||||||||||||||||
Past performance is not a guarantee of future results. Information about these performance results and the comparative indexes can be found in the About This Report section. The Adviser has agreed to limit certain Fund expenses; without these limitations, returns would have been lower. The limitation provisions may be terminated in the future.
| * | Please see the most recent prospectus for details. |
ICON Opportunities Fund
Value of a $10,000 Investment
through September 30, 2013
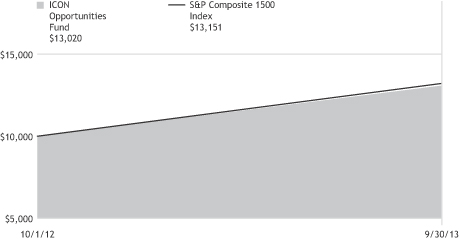
Past performance is not a guarantee of future results. The above graph compares a $10,000 investment made in the Opportunities Fund on the inception date of 10/1/12 to a $10,000 investment made in an unmanaged securities index on that date. The Opportunities Fund’s performance in this chart and the performance table assumes the reinvestment of dividends and capital gain distributions but does not reflect the deduction of taxes that a shareholder would pay on Fund distributions or on the redemption of Fund shares.
| 38 | MANAGEMENT OVERVIEW |
Table of Contents
ICON OPPORTUNITIES FUND
SCHEDULEOF INVESTMENTS
SEPTEMBER 30, 2013
| Shares or Principal Amount | Value | |||||||
| Common Stocks (81.9%) | ||||||||
| 200 | ACI Worldwide, Inc.† | $ | 10,812 | |||||
| 292 | Ascena Retail Group, Inc.† | 5,820 | ||||||
| 206 | Atwood Oceanics, Inc.† | 11,338 | ||||||
| 268 | Bio-Reference Labs, Inc.† | 8,008 | ||||||
| 124 | Buffalo Wild Wings, Inc.† | 13,791 | ||||||
| 225 | Cabot Corp. | 9,610 | ||||||
| 176 | Cheesecake Factory, Inc. | 7,735 | ||||||
| 160 | Coherent, Inc. | 9,832 | ||||||
| 100 | Crane Co. | 6,167 | ||||||
| 110 | Dril-Quip, Inc.† | 12,622 | ||||||
| 100 | Encore Capital Group, Inc.† | 4,586 | ||||||
| 169 | Fair Isaac Corp. | 9,342 | ||||||
| 85 | FEI Co. | 7,463 | ||||||
| 130 | First Cash Financial Services, Inc.† | 7,534 | ||||||
| 152 | GameStop Corp., Class A | 7,547 | ||||||
| 200 | HB Fuller Co. | 9,038 | ||||||
| 133 | Hibbett Sports, Inc.† | 7,468 | ||||||
| 165 | HSN, Inc. | 8,847 | ||||||
| 144 | JOS A. Bank Clothiers, Inc.† | 6,330 | ||||||
| 290 | KapStone Paper and Packaging Corp. | 12,412 | ||||||
| 438 | Kforce, Inc. | 7,748 | ||||||
| 351 | Knight Transportation, Inc. | 5,799 | ||||||
| 155 | Koppers Holdings, Inc. | 6,611 | ||||||
| 105 | Landstar System, Inc. | 5,878 | ||||||
| 145 | Methanex Corp. | 7,434 | ||||||
| 150 | MTS Systems Corp. | 9,652 | ||||||
| 100 | PAREXEL International Corp.† | 5,023 | ||||||
| 773 | PDL BioPharma, Inc. | 6,161 | ||||||
| 350 | Perficient, Inc.† | 6,426 | ||||||
| Shares or Principal Amount | Value | |||||||
| 153 | Portfolio Recovery Associates, Inc.† | $ | 9,171 | |||||
| 227 | Questcor Pharmaceuticals, Inc. | 13,166 | ||||||
| 79 | Regal-Beloit Corp. | 5,366 | ||||||
| 183 | Rowan Cos. PLC, Class A† | 6,720 | ||||||
| 80 | Ryder System, Inc. | 4,776 | ||||||
| 270 | SEI Investments Co. | 8,346 | ||||||
| 67 | Snap-on, Inc. | 6,667 | ||||||
| 575 | Steel Dynamics, Inc. | 9,608 | ||||||
| 139 | Steven Madden, Ltd.† | 7,482 | ||||||
| 116 | Tidewater, Inc. | 6,878 | ||||||
| 126 | Toro Co. | 6,848 | ||||||
| 106 | Tupperware Brands Corp. | 9,155 | ||||||
| 176 | Waddell & Reed Financial, Inc., Class A | 9,060 | ||||||
| 139 | Wolverine World Wide, Inc. | 8,094 | ||||||
| 89 | World Acceptance Corp.† | 8,003 | ||||||
| 150 | World Fuel Services Corp. | 5,597 | ||||||
|
| |||||||
|
| Total Common Stocks (Cost $287,010) | 361,971 | ||||||
| Short-Term Investments (17.9%) | ||||||||
| $ | 78,901 | State Street Euro Dollar Time Deposit (USD), 0.01%, 10/01/13 | 78,901 | |||||
|
| |||||||
|
| Total Short-Term Investments (Cost $78,901) | 78,901 | ||||||
|
| Total Investments 99.8% (Cost $365,911) | 440,872 | ||||||
| Other Assets Less Liabilities 0.2% | 1,083 | |||||||
|
| |||||||
| Net Assets 100.0% | $ | 441,955 | ||||||
|
| |||||||
The accompanying notes are an integral part of the financial statements.
| † | Non-income producing security. |
| SCHEDULEOF INVESTMENTS | 39 |
Table of Contents
MANAGEMENT OVERVIEW (UNAUDITED) ICON RISK-MANAGED BALANCED FUND (FORMERLY ICON RISK-MANAGED EQUITY FUND) | Class S Class A | IOCZX IOCAX |
| Q. | How did the Fund perform relative to its benchmark? |
| A. | The ICON Risk-Managed Balanced Fund Class S (“Risk-Managed Balanced Fund”) returned 10.51% for the fiscal year ended September 30, 2013, while the benchmark S&P Composite 1500 Index gained 20.43%. Total returns for other periods and additional Class shares as of September 30, 2013 appear in the subsequent pages of Risk-Managed Balanced Fund’s Management Overview. |
| Q. | What primary factors influenced the Fund’s relative performance during the period? |
| A. | Entering the fiscal year, our valuation model suggested significant upside potential in the U.S. equity market. Because of our valuation readings, the fund was aggressively allocated in an attempt to capture as much of the anticipated equity upside as possible. In addition, Risk-Managed Balanced Fund’s hedge – using S&P 500 Index options in an effort to dampen volatility and reduce downside capture – was minimal. While the minimal hedge left the equity position more subject to volatility and vulnerable to a downward move in the market, our valuation model gave us the confidence that such a position was warranted. However, the hedge still detracted from overall performance. |
From a macroeconomic standpoint, the economy was recovering, but the recovery was moderate. The unemployment rate held above the 7.0% level the entire fiscal year. While there was minor improvement in the Labor Department’s unemployment figure, there was also a decrease in the labor force participation rate during the fiscal year. This labor force participation rate dropped to its lowest level since the housing bubble burst in the fall of 2007. The rate of inflation, as measured by the Consumer Price Index, remained contained over the period.
With the economic recovery still fragile, the Federal Reserve continued its loose monetary policy via its quantitative easing program. This policy kept interest rates low and they continued to hover at historic lows. The housing market benefited significantly from the Federal Reserve’s policy as mortgage rates declined and borrowers stepped in to take advantage of record low home borrowing rates. As a result, home sales increased and housing prices rose significantly. Investor confidence gained over the period and the stock market reacted with rising prices.
| 40 | MANAGEMENT OVERVIEW |
Table of Contents
By mid-May, following a steady move higher in the market, prices began to catch our measure of intrinsic value. Consistent with ICON’s disciplined value based investment process, we began to gradually increase Risk-Managed Balanced Fund’s exposure to the fixed income markets. At the same time, we tightened the options hedge on the equities held in this Fund.
By the end of July 2013, the market was approaching new highs for the fiscal year; value continued to decline and the Risk-Managed Balanced Fund increased its bond exposure. On August 1, 2013, Risk-Managed Balanced Fund’s mandate changed, warranting a minimum 25% exposure to the fixed income market. Consistent with this change, Risk-Managed Balanced Fund’s bond exposure was increased to meet the minimum requirement. As we approached the end of the fiscal year, our model indicated that the market was moving towards fair value. Accordingly, we continued to increase our bond exposure and tighten the options hedge on the equity position of this Fund.
| Q. | How did the Fund’s composition affect performance? |
| A. | Although the hedge was minimal based on our valuation model, the hedge was still the primary reason for Risk-Managed Balanced Fund’s underperformance. While the underlying equities trailed the S&P Composite 1500 Index slightly, the option overlay detracted from performance. At the same time, however, the options hedge had the effect of dampening the impact of market volatility as well as providing some downside protection over the period. Risk-Managed Balanced Fund’s exposure to the fixed income market also had a negative impact on benchmark relative performance as fixed income returns were negative over the course of the fiscal year. |
Focusing on the equity portion of Risk-Managed Balanced Fund, we were significantly overweight the Consumer Discretionary and Industrials Sector. Both these sectors were among the best performing. In the Consumer Discretionary sector the Risk-Managed Balanced Fund held an average weight of about 17.4% versus approximately 12.0% in the benchmark. The strong tilt toward this sector contributed to positive benchmark relative performance. Risk-Managed Balanced Fund’s weight in the Industrials sector for the period averaged about 16.3% versus the benchmark weight of approximately 10.8%. This tilt also had a positive impact on benchmark relative performance. At the other end of the spectrum, underweight positions in the Financials and Health Care sectors detracted from benchmark relative performance. The Risk-Managed Balanced Fund had an average weight of about 9.2% in the Health Care sector over the period versus about 12.2% for the benchmark. This sector was one of the better performing sectors, and, as a result,
| MANAGEMENT OVERVIEW | 41 |
Table of Contents
detracted from benchmark relative performance. The Financials sector was also a leading performer and the Risk-Managed Balanced Fund’s underweight had a negative impact on benchmark relative performance.
At the industry level, three of the major contributors to positive benchmark relative performance were computer & electronics retail, oil & gas equipment & services, and railroads. All three industries were overweight versus the benchmark and outperformed the market. The railroads industry was among the most heavily weighted industries, averaging about 4.1% for the period versus an average weight of approximately 0.8% in the benchmark. Among the industry detractors to benchmark relative underperformance were positions in biotechnology, electric utilities and IT consulting & other services. IT consulting and other services was the most heavily weighted industry in the Risk-Managed Balanced Fund, averaging about 6.2% for the period; its benchmark industry weight was approximately 1.9%. This group was one of the biggest underperformers, resulting in a major negative impact on benchmark relative performance.
| Q. | What is your investment outlook for the overall market? |
| A. | Entering the new fiscal period, our valuation model indicates that the market is trading at about fair value. Accordingly, we have decreased equity exposure within the Risk-Managed Balanced Fund to about 55% and placed the remaining balance in the fixed income markets. We have also tightened the options hedge on Risk-Managed Balanced Fund’s equity holdings. We believe this could limit Risk-Managed Balanced Fund’s upside capture, but given the equity market valuation, we believe downside protection has become increasingly important. |
It is worth noting, however, that while the broad equity market is about fairly valued our model also indicates opportunity within it. In the current setting, we believe ICON’s tactical investment approach could allow us to exploit areas of the market where value still exists. One example is the Materials sector. Our model indicates that there is still value in this sector and we enter the new fiscal period with an overweight Materials position.
We believe that the fixed income market is in a transition that requires active management, including both the flexibility and willingness to be creative, in an attempt to find value going forward. More specifically, we believe our value-oriented, bottom-up bond selection ideology will help us navigate the changing fixed income environment. While interest rate forecasting is not a factor in our valuation system, we don’t anticipate a substantial upward movement in interest rates over the course of the next year.
| 42 | MANAGEMENT OVERVIEW |
Table of Contents
The fixed income holdings within the Risk-Managed Balanced Fund will focus on value based opportunities that have the characteristics of credit upgrades, special situations, or anticipated future bond tenders.
Over the course of this fiscal period, we will continue to follow our disciplined, value based investment process to actively manage all three segments of the Risk-Managed Balanced Fund; our equity/bond exposure, our active equity and bond positions, and the utilization of a volatility reducing hedge.
ICON Risk-Managed Balanced Fund
Sector Composition
September 30, 2013
Consumer Staples | 8.0% | |||
Utilities | 7.7% | |||
Industrials | 7.6% | |||
Energy | 7.2% | |||
Information Technology | 6.0% | |||
Materials | 5.9% | |||
Consumer Discretionary | 4.9% | |||
Financial | 3.5% | |||
Health Care | 1.9% | |||
|
| |||
| 52.7% | ||||
|
|
Percentages are based upon common stocks as a percentage of net assets.
ICON Risk-Managed Balanced Fund
Industry Composition
September 30, 2013
Integrated Oil & Gas | 4.7% | |||
Commodity Chemicals | 3.1% | |||
Tobacco | 3.1% | |||
IT Consulting & Other Services | 2.8% | |||
Oil & Gas Equipment & Services | 2.5% | |||
Electric Utilities | 2.2% | |||
Aerospace & Defense | 2.0% | |||
Multi-Utilities | 2.0% | |||
Soft Drinks | 2.0% | |||
Integrated Telecommunication Services | 1.8% | |||
Gas Utilities | 1.7% | |||
Railroads | 1.7% | |||
Specialized REIT’s | 1.6% | |||
Steel | 1.6% | |||
Biotechnology | 1.5% |
Computer Hardware | 1.4% | |||
Movies & Entertainment | 1.4% | |||
Diversified Chemicals | 1.2% | |||
Household Products | 1.2% | |||
Diversified Banks | 1.1% | |||
Diversified Support Services | 1.1% | |||
Electrical Components & Equipment | 1.0% | |||
Hypermarkets & Super Centers | 1.0% | |||
Other Industries (each less | 9.0% | |||
|
| |||
| 52.7% | ||||
|
|
Percentages are based upon common stocks as a percentage of net assets.
| MANAGEMENT OVERVIEW | 43 |
Table of Contents
ICON Risk-Managed Balanced Fund
Credit Diversification
September 30, 2013
Aaa | 7.4% | |||
Aa2 | 2.9% | |||
Aa3 | 0.4% | |||
A1 | 1.8% | |||
A2 | 2.4% | |||
A3 | 1.6% | |||
Baa1 | 8.9% | |||
Baa2 | 7.0% | |||
Baa3 | 3.4% | |||
Ba1 | 1.3% |
Ba2 | 0.1% | |||
B1 | 1.8% | |||
B2 | 2.7% | |||
|
| |||
| 41.7% | ||||
|
|
Percentages are based upon U.S. Treasury obligations, corporate and foreign corporate bond investments as a percentage of net assets. Ratings based on Moody’s Investors Service, Inc.
| 44 | MANAGEMENT OVERVIEW |
Table of Contents
ICON Risk-Managed Balanced Fund
Average Annual Total Return
as of September 30, 2013
| Inception Date | 1 Year | 5 Years | 10 Years | Since Inception | Gross Expense Ratio* | Net Expense Ratio* | ||||||||||||||||||||||
ICON Risk-Managed Equity Fund - Class S | 5/6/04 | 10.51% | 4.51% | N/A | 3.96% | 1.80% | 1.24% | |||||||||||||||||||||
ICON Risk-Managed Equity Fund - Class C | 11/21/02 | 9.45% | 3.45% | 3.38% | 4.41% | 3.25% | 2.23% | |||||||||||||||||||||
ICON Risk-Managed Equity Fund - Class A | 5/31/06 | 10.28% | 4.25% | N/A | 3.10% | 2.16% | 1.48% | |||||||||||||||||||||
ICON Risk-Managed Equity Fund - Class A (including maximum sales charge of 5.75%) | 5/31/06 | 3.90% | 3.02% | N/A | 2.27% | 2.16% | 1.48% | |||||||||||||||||||||
S&P Composite 1500 Index | 20.43% | 10.35% | 7.97% | 8.19% | N/A | N/A | ||||||||||||||||||||||
Past performance is not a guarantee of future results. Information about these performance results and the comparative indexes can be found in the About This Report section. The Adviser has agreed to limit certain Fund expenses; without these limitations, returns would have been lower. The limitation provisions may be terminated in the future.
| * | Please see the most recent prospectus for details. |
Class C total returns exclude applicable sales charges. If sales charges were included returns would be lower.
| MANAGEMENT OVERVIEW | 45 |
Table of Contents
ICON Risk-Managed Balanced Fund
Value of a $10,000 Investment
through September 30, 2013
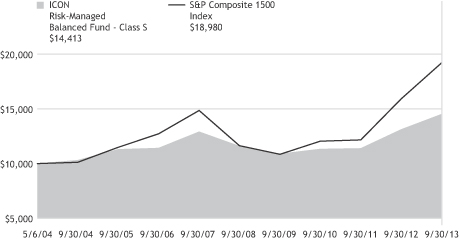
Past performance is not a guarantee of future results. The above graph compares a $10,000 investment made in the Risk-Managed Balanced Fund’s Class S shares on the Class’ inception date of 5/6/04 to a $10,000 investment made in an unmanaged securities index on that date. Performance for the Risk-Managed Balanced Fund’s other share classes will vary due to differences in charges and expenses. The Risk-Managed Balanced Fund’s performance in this chart and the performance table assumes the reinvestment of dividends and capital gain distributions but does not reflect the deduction of taxes that a shareholder would pay on Fund distributions or on the redemption of Fund shares.
| 46 | MANAGEMENT OVERVIEW |
Table of Contents
ICON RISK-MANAGED BALANCED FUND
SCHEDULEOF INVESTMENTS
(FORMERLY ICON RISK-MANAGED EQUITY FUND)
SEPTEMBER 30, 2013
| Shares or Principal Amount | Value | |||||||
| Common Stocks (52.7%) | ||||||||
| 2,500 | 3M Co. | $ | 298,525 | |||||
| 7,500 | Accenture PLC, Class A | 552,300 | ||||||
| 1,700 | Apple, Inc.(x) | 810,475 | ||||||
| 9,200 | Atmos Energy Corp. | 391,828 | ||||||
| 23,500 | BCE, Inc. | 1,003,450 | ||||||
| 14,600 | CA, Inc. | 433,182 | ||||||
| 6,700 | Chevron Corp. | 814,050 | ||||||
| 30,700 | Coca-Cola Co.(x) | 1,162,916 | ||||||
| 4,000 | Computer Programs & Systems, Inc. | 234,000 | ||||||
| 13,000 | ConAgra Foods, Inc. | 394,420 | ||||||
| 15,300 | ConocoPhillips(x) | 1,063,503 | ||||||
| 5,000 | Costco Wholesale Corp. | 575,600 | ||||||
| 8,600 | CSX Corp. | 221,364 | ||||||
| 2,560 | Dover Corp. | 229,965 | ||||||
| 4,700 | Dril-Quip, Inc.† | 539,325 | ||||||
| 2,500 | E.I. du Pont de Nemours & Co.(x) | 146,400 | ||||||
| 8,500 | Emerson Electric Co. | 549,950 | ||||||
| 6,500 | EPR Properties, REIT | 316,810 | ||||||
| 9,000 | Exxon Mobil Corp. | 774,360 | ||||||
| 6,500 | Fastenal Co. | 326,625 | ||||||
| 7,100 | FMC Corp. | 509,212 | ||||||
| 7,400 | GameStop Corp., Class A | 367,410 | ||||||
| 4,300 | General Dynamics Corp. | 376,336 | ||||||
| 23,200 | Healthcare Services Group, Inc. | 597,632 | ||||||
| 9,500 | Intel Corp. | 217,740 | ||||||
| 3,300 | International Business Machines Corp.(x) | 611,094 | ||||||
| 13,700 | Invesco, Ltd. | 437,030 | ||||||
| 7,400 | Kimberly-Clark Corp. | 697,228 | ||||||
| 10,100 | Koppers Holdings, Inc. | 430,765 | ||||||
| 6,700 | Laclede Group, Inc. | 301,500 | ||||||
| 11,100 | Lorillard, Inc. | 497,058 | ||||||
| 18,100 | LyondellBasell Industries, Class A | 1,325,463 | ||||||
| Shares or Principal Amount | Value | |||||||
| 8,500 | MAXIMUS, Inc.(x) | $ | 382,840 | |||||
| 2,500 | MDC Holdings, Inc. | 75,025 | ||||||
| 3,300 | Nike, Inc., Class B(x) | 239,712 | ||||||
| 2,900 | Norfolk Southern Corp. | 224,315 | ||||||
| 13,100 | Nucor Corp. | 642,162 | ||||||
| 11,000 | Oceaneering International, Inc.(x) | 893,640 | ||||||
| 1,700 | Parker Hannifin Corp. | 184,824 | ||||||
| 107,500 | PDL BioPharma, Inc.(a) | 856,775 | ||||||
| 6,100 | Philip Morris International, Inc. | 528,199 | ||||||
| 8,400 | Piedmont Natural Gas Co., Inc. | 276,192 | ||||||
| 4,600 | PulteGroup, Inc. | 75,900 | ||||||
| 5,800 | Rayonier, Inc., REIT | 322,770 | ||||||
| 15,400 | Reynolds American, Inc.(x) | 751,212 | ||||||
| 3,000 | Ryland Group, Inc.(x) | 121,620 | ||||||
| 12,100 | SCANA Corp. | 557,084 | ||||||
| 16,700 | Steel Dynamics, Inc. | 279,057 | ||||||
| 4,400 | Target Corp.(x) | 281,512 | ||||||
| 2,300 | Toll Brothers, Inc.† | 74,589 | ||||||
| 4,800 | Tractor Supply Co. | 322,416 | ||||||
| 6,000 | Tupperware Brands Corp. | 518,220 | ||||||
| 7,000 | U.S. Bancorp(x) | 256,060 | ||||||
| 11,300 | UIL Holdings Corp. | 420,134 | ||||||
| 3,400 | Union Pacific Corp.(x) | 528,156 | ||||||
| 6,700 | United Technologies Corp.(x) | 722,394 | ||||||
| 3,800 | Ventas, Inc., REIT | 233,700 | ||||||
| 1,900 | Visa, Inc., Class A | 363,090 | ||||||
| 12,200 | Walt Disney Co.(x) | 786,778 | ||||||
| 8,900 | Wells Fargo & Co.(x) | 367,748 | ||||||
| 28,100 | Westar Energy, Inc.(a) | 861,265 | ||||||
| 21,500 | Xcel Energy, Inc. | 593,615 | ||||||
|
| |||||||
| | Total Common Stocks (Cost $28,782,280) | 29,948,520 | ||||||
| SCHEDULEOF INVESTMENTS | 47 |
Table of Contents
| Shares or Principal Amount | Interest Rate | Maturity Date | Value | |||||||||||||
| Corporate Bonds (32.8%) | ||||||||||||||||
| $ | 500,000 | Altria Group, Inc. | 9.25 | % | 08/06/19 | $ | 660,301 | |||||||||
| 500,000 | American Express Credit Corp., MTN | 1.75 | % | 06/12/15 | 509,112 | |||||||||||
| 1,000,000 | AT&T, Inc.(a) | 2.63 | % | 12/01/22 | 896,283 | |||||||||||
| 700,000 | Berkshire Hathaway, Inc. | 3.40 | % | 01/31/22 | 702,642 | |||||||||||
| 1,000,000 | Celgene Corp. | 3.25 | % | 08/15/22 | 948,232 | |||||||||||
| 200,000 | Coca-Cola Co. | 3.30 | % | 09/01/21 | 204,659 | |||||||||||
| 1,000,000 | DaVita HealthCare Partners, Inc. | 5.75 | % | 08/15/22 | 988,750 | |||||||||||
| 50,000 | Denali Borrower LLC / Denali Finance Corp.(b) | 5.63 | % | 10/15/20 | 48,563 | |||||||||||
| 1,000,000 | DIRECTV Holdings LLC / DIRECTV Financing Co., Inc. | 3.80 | % | 03/15/22 | 933,349 | |||||||||||
| 500,000 | Dollar General Corp. | 1.88 | % | 04/15/18 | 485,226 | |||||||||||
| 1,000,000 | Dollar General Corp. | 3.25 | % | 04/15/23 | 910,699 | |||||||||||
| 700,000 | Ecolab, Inc. | 4.35 | % | 12/08/21 | 737,533 | |||||||||||
| 1,000,000 | Fiserv, Inc. | 3.50 | % | 10/01/22 | 946,771 | |||||||||||
| 500,000 | Freescale Semiconductor, Inc.(b) | 10.13 | % | 03/15/18 | 546,500 | |||||||||||
| 500,000 | Gap, Inc. | 5.95 | % | 04/12/21 | 554,002 | |||||||||||
| 500,000 | Google, Inc. | 3.63 | % | 05/19/21 | 523,683 | |||||||||||
| 500,000 | HCP, Inc. | 6.70 | % | 01/30/18 | 582,219 | |||||||||||
| 500,000 | HCP, Inc. | 2.63 | % | 02/01/20 | 474,406 | |||||||||||
| 500,000 | Health Care REIT, Inc. | 4.13 | % | 04/01/19 | 526,621 | |||||||||||
| 200,000 | Johnson & Johnson | 5.55 | % | 08/15/17 | 231,379 | |||||||||||
| 500,000 | Kellogg Co. | 4.00 | % | 12/15/20 | 529,244 | |||||||||||
| 700,000 | L Brands, Inc. | 6.63 | % | 04/01/21 | 756,875 | |||||||||||
| 500,000 | Lockheed Martin Corp. | 3.35 | % | 09/15/21 | 499,397 | |||||||||||
| 500,000 | PepsiCo, Inc. | 1.25 | % | 08/13/17 | 492,738 | |||||||||||
| 500,000 | Prudential Financial, Inc.(c) | 8.88 | % | 06/15/38 | 605,000 | |||||||||||
| 500,000 | Regency Energy Partners L.P. / Regency Energy Finance Corp. | 5.50 | % | 04/15/23 | 480,000 | |||||||||||
| 500,000 | Thermo Fisher Scientific, Inc. | 3.60 | % | 08/15/21 | 491,995 | |||||||||||
| 500,000 | U.S. Bancorp, MTN | 2.20 | % | 11/15/16 | 515,080 | |||||||||||
| 500,000 | United Refining Co. | 10.50 | % | 02/28/18 | 557,500 | |||||||||||
| 500,000 | Wal-Mart Stores, Inc. | 2.55 | % | 04/11/23 | 462,304 | |||||||||||
| 750,000 | Walt Disney Co., Series C | 6.00 | % | 07/17/17 | 869,640 | |||||||||||
|
| |||||||||||||||
| | Total Corporate Bonds (Cost $18,748,618) | 18,670,703 | ||||||||||||||
| U.S. Treasury Obligations (7.0%) | ||||||||||||||||
| 500,000 | U.S. Treasury Note | 1.25 | % | 01/31/19 | 493,672 | |||||||||||
| 500,000 | U.S. Treasury Note | 0.63 | % | 08/31/17 | 492,227 | |||||||||||
| 500,000 | U.S. Treasury Note | 1.38 | % | 05/31/20 | 482,461 | |||||||||||
| 500,000 | U.S. Treasury Note | 0.50 | % | 06/15/16 | 499,531 | |||||||||||
| 500,000 | U.S. Treasury Note | 0.25 | % | 07/31/15 | 499,629 | |||||||||||
| 48 | SCHEDULEOF INVESTMENTS |
Table of Contents
| Shares or Principal Amount | Interest Rate | Maturity Date | Value | |||||||||||||
| $ | 500,000 | U.S. Treasury Note | 1.38 | % | 07/31/18 | $ | 500,898 | |||||||||
| 500,000 | U.S. Treasury Note | 0.38 | % | 08/31/15 | 500,586 | |||||||||||
| 500,000 | U.S. Treasury Note | 2.50 | % | 08/15/23 | 494,922 | |||||||||||
|
| |||||||||||||||
|
| Total U.S. Treasury Obligations (Cost $3,964,259) |
| 3,963,926 | |||||||||||||
| Foreign Corporate Bonds (1.9%) | ||||||||||||||||
| 1,000,000 | LyondellBasell Industries | 5.00 | % | 04/15/19 | 1,100,746 | |||||||||||
|
| |||||||||||||||
|
| Total Foreign Corporate Bonds (Cost $1,097,851) |
| 1,100,746 | |||||||||||||
| Shares or Principal Amount | Value | |||||||||||||||
| Closed-End Mutual Funds (2.3%) | ||||||||||||||||
| 50,000 | American Strategic Income Portfolio, Inc. II | $ | 405,500 | |||||||||||||
| 67,727 | American Strategic Income Portfolio, Inc. III | 468,671 | ||||||||||||||
| 29,600 | BlackRock Enhanced Government Fund, Inc. | 420,320 | ||||||||||||||
|
| |||||||||||||||
|
| Total Closed-End Mutual Funds (Cost $1,295,204) |
| 1,294,491 | |||||||||||||
| Underlying Security/Expiration Date/Exercise Price | Contracts* | Value | ||||||||||||||
| Put Options Purchased (0.4%) | ||||||||||||||||
| S+P 500 Index, | 90 | $ | 168,300 | ||||||||||||
| S+P 500 Index, | 185 | 61,975 | |||||||||||||
|
| |||||||||||||||
| | Total Put Options Purchased (Cost $305,176) | | 230,275 | |||||||||||||
| Shares or Principal Amount | Value | |||||||||||||||
| Collateral for Securities on Loan (4.2%) | ||||||||||||||||
| 2,371,613 | State Street Navigator Prime Portfolio, 0.17% | $ | 2,371,613 | |||||||||||||
|
| |||||||||||||||
| | Total Collateral for Securities on Loan (Cost $2,371,613) | | 2,371,613 | |||||||||||||
| Short-Term Investments (2.4%) | ||||||||||||||||
| $ | 1,339,241 | State Street Euro Dollar Time Deposit (USD), 0.01%, 10/01/13 | 1,339,241 | |||||||||||||
|
| |||||||||||||||
|
| Total Short-Term Investments (Cost $1,339,241) |
| 1,339,241 | |||||||||||||
|
| Total Investments 103.7% (Cost $57,904,242) |
| 58,919,515 | |||||||||||||
| Liabilities Less Other Assets (3.7)% | (2,082,984 | ) | ||||||||||||||
|
| |||||||||||||||
| Net Assets 100.0% | $ | 56,836,531 | ||||||||||||||
|
| |||||||||||||||
| SCHEDULEOF INVESTMENTS | 49 |
Table of Contents
The accompanying notes are an integral part of the financial statements.
| * | All options have 100 shares per contract. |
| † | Non-income producing security. |
| (x) | All or a portion of the security is pledged as collateral for call options written. |
| (a) | All or a portion of the security was on loan as of September 30, 2013. |
| (b) | 144A - Exempt from registration under Rule 144A of the Securities Act of 1933. These securities may be resold in transactions exempt from registration, typically only to qualified institutional buyers. Unless otherwise indicated, these securities are not considered to be illiquid. |
| (c) | Floating Rate Security. Rate disclosed is as of September 30, 2013. |
| REIT | Real Estate Investment Trust |
| 50 | SCHEDULEOF INVESTMENTS |
Table of Contents
ICON RISK-MANAGED BALANCED FUND (FORMERLY ICON RISK-MANAGED EQUITY FUND)
SCHEDULEOF WRITTEN CALL OPTIONS
SEPTEMBER 30, 2013
| Underlying Security/ Expiration Date/ Exercise Price | Contracts* | Value | ||||||
S+P 500 Index, November 2013, 1,720.00 | 60 | $ | 89,700 | |||||
S+P 500 Index, October 2013, 1,710.00 | 15 | 12,975 | ||||||
|
| |||||||
Total Options Written (Premiums received $175,547) | $ | 102,675 | ||||||
|
| |||||||
The accompanying notes are an integral part of the financial statements.
| * | All options have 100 shares per contract. |
| SCHEDULEOF INVESTMENTS | 51 |
Table of Contents
STATEMENTSOF ASSETSAND LIABILITIES
SEPTEMBER 30, 2013
| ICON Bond Fund | ICON Equity Income Fund | ICON Fund | ||||||||||
Assets | ||||||||||||
Investments, at cost | $ | 106,465,712 | $ | 24,984,025 | $ | 25,685,570 | ||||||
|
|
|
|
|
| |||||||
Investments, at value† | 107,069,954 | 25,747,663 | 37,157,565 | |||||||||
Receivables: | ||||||||||||
Fund shares sold | 11,700 | 161,223 | 47,354 | |||||||||
Investments sold | 1,362,736 | 539,319 | 1,012,046 | |||||||||
Interest | 937,032 | 40,098 | – | |||||||||
Dividends | 8,052 | 90,309 | 39,394 | |||||||||
Expense reimbursements due from Adviser | 42,410 | 12,746 | 2,162 | |||||||||
Foreign tax reclaims | – | 11,646 | 476 | |||||||||
Other assets | 23,603 | 17,085 | 18,639 | |||||||||
|
|
|
|
|
| |||||||
Total Assets | 109,455,487 | 26,620,089 | 38,277,636 | |||||||||
|
|
|
|
|
| |||||||
Liabilities | ||||||||||||
Payables: | ||||||||||||
Due to custodian bank | – | 874 | – | |||||||||
Expense recoupment due to Adviser | – | 538 | 3,733 | |||||||||
Investments purchased | 3,891,947 | 662,698 | – | |||||||||
Payable for collateral received on securities loaned | 7,297,402 | 2,389,304 | 2,293,511 | |||||||||
Fund shares redeemed | 37,851 | 129,462 | 63,293 | |||||||||
Distributions due to shareholders | 10,129 | 39,059 | – | |||||||||
Advisory fees | 44,896 | 14,467 | 22,908 | |||||||||
Accrued distribution fees | 3,530 | 7,154 | 17,952 | |||||||||
Fund accounting fees | 2,343 | 590 | 923 | |||||||||
Transfer agent fees | 11,680 | 7,809 | 10,807 | |||||||||
Administration fees | 3,742 | 964 | 1,527 | |||||||||
Trustee fees | 2,859 | 714 | 1,364 | |||||||||
Accrued expenses | 36,258 | 29,240 | 27,648 | |||||||||
�� |
|
|
|
|
| |||||||
Total Liabilities | 11,342,637 | 3,282,873 | 2,443,666 | |||||||||
|
|
|
|
|
| |||||||
Net Assets - all share classes | $ | 98,112,850 | $ | 23,337,216 | $ | 35,833,970 | ||||||
|
|
|
|
|
| |||||||
Net Assets - Class S | $ | 88,312,860 | $ | 5,115,710 | $ | 6,985,772 | ||||||
|
|
|
|
|
| |||||||
Net Assets - Class C | $ | 3,007,825 | $ | 5,423,473 | $ | 18,847,738 | ||||||
|
|
|
|
|
| |||||||
Net Assets - Class A | $ | 6,792,165 | $ | 12,798,033 | $ | 10,000,460 | ||||||
|
|
|
|
|
| |||||||
| 52 | FINANCIAL STATEMENTS |
Table of Contents
| ICON Bond Fund | ICON Equity Income Fund | ICON Fund | ||||||||||
Net Assets Consist of | ||||||||||||
Paid-in capital | $ | 96,169,849 | $ | 46,621,452 | $ | 54,983,812 | ||||||
Accumulated undistributed net investment income/(loss) | – | 2,975 | (14,662 | ) | ||||||||
Accumulated undistributed net realized gain/(loss) | 1,338,759 | (24,050,862 | ) | (30,607,175 | ) | |||||||
Unrealized appreciation/(depreciation) | 604,242 | 763,651 | 11,471,995 | |||||||||
|
|
|
|
|
| |||||||
Net Assets | $ | 98,112,850 | $ | 23,337,216 | $ | 35,833,970 | ||||||
|
|
|
|
|
| |||||||
Shares outstanding (unlimited shares authorized, no par value) | ||||||||||||
Class S | 8,930,555 | 370,738 | 498,996 | |||||||||
Class C | 302,991 | 390,840 | 1,470,360 | |||||||||
Class A | 686,507 | 932,292 | 746,692 | |||||||||
Net asset value (offering and redemption price per share) | ||||||||||||
Class S | $ | 9.89 | $ | 13.80 | $ | 14.00 | ||||||
Class C | $ | 9.93 | $ | 13.88 | $ | 12.82 | ||||||
Class A | $ | 9.89 | $ | 13.73 | $ | 13.39 | ||||||
Class A maximum offering price (100%/(100%-maximum sales charge)) of net asset value adjusted to the nearest cent per share | $ | 10.38 | $ | 14.57 | $ | 14.21 | ||||||
† Includes securities on loan of | $ | 7,019,319 | $ | 2,316,113 | $ | 2,264,031 | ||||||
The accompanying notes are an integral part of the financial statements.
| FINANCIAL STATEMENTS | 53 |
Table of Contents
STATEMENTSOF ASSETSAND LIABILITIES
SEPTEMBER 30, 2013
| ICON Long/Short Fund | ICON Opportunities Fund | ICON Risk-Managed Balanced Fund | ||||||||||
Assets | ||||||||||||
Investments, at cost | $ | 16,914,960 | $ | 365,911 | $ | 57,904,242 | ||||||
|
|
|
|
|
| |||||||
Investments, at value† | 20,761,802 | 440,872 | 58,919,515 | |||||||||
Deposits for Short Sales | 1,601,064 | – | – | |||||||||
Receivables: | ||||||||||||
Fund shares sold | 62,349 | – | 370,571 | |||||||||
Investments sold | 675,199 | 7,940 | 125,589 | |||||||||
Interest | – | – | 238,658 | |||||||||
Dividends | 9,757 | 268 | 86,681 | |||||||||
Expense reimbursements due from Adviser | 14,524 | 12,279 | 10,060 | |||||||||
Other assets | 16,363 | 39 | 22,542 | |||||||||
|
|
|
|
|
| |||||||
Total Assets | 23,141,058 | 461,398 | 59,773,616 | |||||||||
|
|
|
|
|
| |||||||
Liabilities | ||||||||||||
Options written, at value (premiums received $175,547) | – | – | 102,675 | |||||||||
Securities sold short, at value (proceeds of $1,349,020) | 1,459,861 | – | – | |||||||||
Payables: | ||||||||||||
Due to prime broker | 213,567 | – | 154,308 | |||||||||
Expense recoupment due to Adviser | – | – | 5,175 | |||||||||
Investments purchased | – | – | 200,613 | |||||||||
Payable for collateral received on securities loaned | 1,645,210 | – | 2,371,613 | |||||||||
Fund shares redeemed | 68,851 | – | 22,130 | |||||||||
Distributions due to shareholders | – | – | 5,426 | |||||||||
Advisory fees | 13,858 | 264 | 28,965 | |||||||||
Accrued distribution fees | 6,876 | – | 5,318 | |||||||||
Fund accounting fees | 491 | 10 | 924 | |||||||||
Transfer agent fees | 7,870 | 52 | 6,340 | |||||||||
Administration fees | 816 | 18 | 1,930 | |||||||||
Trustee fees | 677 | 11 | 530 | |||||||||
Accrued expenses | 27,576 | 19,088 | 31,138 | |||||||||
|
|
|
|
|
| |||||||
Total Liabilities | 3,445,653 | 19,443 | 2,937,085 | |||||||||
|
|
|
|
|
| |||||||
Net Assets - all share classes | $ | 19,695,405 | $ | 441,955 | $ | 56,836,531 | ||||||
|
|
|
|
|
| |||||||
Net Assets - Class S | $ | 4,774,166 | $ | – | $ | 43,350,119 | ||||||
|
|
|
|
|
| |||||||
Net Assets - Class C | $ | 6,107,920 | $ | – | $ | 5,667,276 | ||||||
|
|
|
|
|
| |||||||
Net Assets - Class A | $ | 8,813,319 | $ | – | $ | 7,819,136 | ||||||
|
|
|
|
|
| |||||||
| 54 | FINANCIAL STATEMENTS |
Table of Contents
| ICON Long/Short Fund | �� | ICON Opportunities Fund | ICON Risk-Managed Balanced Fund | |||||||||
Net Assets Consist of | ||||||||||||
Paid-in capital | $ | 75,674,057 | $ | 346,141 | $ | 72,825,198 | ||||||
Accumulated undistributed net investment income/(loss) | (81,756 | ) | - | - | ||||||||
Accumulated undistributed net realized gain/(loss) | (59,632,897 | ) | 20,853 | (17,076,825 | ) | |||||||
Unrealized appreciation/(depreciation) | 3,736,001 | 74,961 | 1,088,158 | |||||||||
|
|
|
|
|
| |||||||
Net Assets | $ | 19,695,405 | $ | 441,955 | $ | 56,836,531 | ||||||
|
|
|
|
|
| |||||||
Shares outstanding (unlimited shares authorized, no par value) | - | 33,934 | - | |||||||||
Class S | 273,171 | - | 3,235,804 | |||||||||
Class C | 380,454 | - | 457,499 | |||||||||
Class A | 514,613 | - | 595,980 | |||||||||
Net asset value (offering and redemption price per share) | - | $ | 13.02 | - | ||||||||
Class S | $ | 17.48 | $ | - | $ | 13.40 | ||||||
Class C | $ | 16.05 | $ | - | $ | 12.39 | ||||||
Class A | $ | 17.13 | $ | - | $ | 13.12 | ||||||
Class A maximum offering price (100%/(100%-maximum sales charge)) of net asset value adjusted to the nearest cent per share | $ | 18.18 | $ | - | $ | 13.92 | ||||||
† Includes securities on loan of | $ | 1,607,757 | $ | - | $ | 2,280,609 | ||||||
The accompanying notes are an integral part of the financial statements.
| FINANCIAL STATEMENTS | 55 |
Table of Contents
STATEMENTSOF OPERATIONS
FORTHEYEARENDED SEPTEMBER 30, 2013
| ICON Bond Fund | ICON Equity Income Fund | ICON Fund | ||||||||||
Investment Income | ||||||||||||
Interest | $ | 2,639,514 | $ | 84,507 | $ | 25 | ||||||
Dividends | 82,621 | 995,501 | 680,348 | |||||||||
Income from securities lending, net | 18,186 | 12,646 | 39,423 | |||||||||
Foreign taxes withheld | – | (9,138 | ) | (37 | ) | |||||||
|
|
|
|
|
| |||||||
Total Investment Income | 2,740,321 | 1,083,516 | 719,759 | |||||||||
|
|
|
|
|
| |||||||
Expenses | ||||||||||||
Advisory fees | 534,721 | 166,253 | 312,526 | |||||||||
Distribution fees: | ||||||||||||
Class C | 30,180 | 53,281 | 182,793 | |||||||||
Class A | 19,960 | 29,668 | 29,498 | |||||||||
Fund accounting fees | 23,736 | 5,923 | 11,653 | |||||||||
Transfer agent fees | 85,005 | 51,499 | 85,213 | |||||||||
Administration fees | 44,560 | 11,084 | 20,835 | |||||||||
Custody fees | 4,672 | 3,886 | 2,097 | |||||||||
Registration fees: | ||||||||||||
Class S | 4,907 | 2,019 | 5,252 | |||||||||
Class C | 5,640 | 5,845 | 6,805 | |||||||||
Class A | 2,797 | 11,032 | 10,495 | |||||||||
Insurance expense | 14,967 | 4,523 | 10,093 | |||||||||
Trustee fees and expenses | 11,537 | 2,802 | 5,762 | |||||||||
Audit and tax service expense | 29,514 | 31,960 | 24,724 | |||||||||
Interest expense | 53 | 527 | 4,910 | |||||||||
Recoupment of previously reimbursed expenses | – | 538 | 7,304 | |||||||||
Dividends on Short positions | – | – | – | |||||||||
Prime broker expense | – | – | – | |||||||||
Other expenses | 54,829 | 22,839 | 33,741 | |||||||||
|
|
|
|
|
| |||||||
Total expenses before expense reimbursement | 867,078 | 403,679 | 753,701 | |||||||||
Expense reimbursement by Adviser due to expense limitation agreement | (148,484 | ) | (52,885 | ) | (19,298 | ) | ||||||
|
|
|
|
|
| |||||||
Net Expenses | 718,594 | 350,794 | 734,403 | |||||||||
|
|
|
|
|
| |||||||
Net Investment Income/(Loss) | 2,021,727 | 732,722 | (14,644 | ) | ||||||||
|
|
|
|
|
| |||||||
Net Realized and Unrealized Gain/(Loss) | ||||||||||||
Net realized gain/(loss) on: | ||||||||||||
Investments | 1,808,686 | 3,820,856 | 10,379,428 | |||||||||
Foreign currency | – | (121 | ) | – | ||||||||
Written options | – | – | – | |||||||||
Securities sold short | – | – | – | |||||||||
Change in unrealized net appreciation/(depreciation) on: | ||||||||||||
Investments and foreign currency | (4,582,127 | ) | (1,112,159 | ) | (2,025,607 | ) | ||||||
Written options | – | – | – | |||||||||
Securities sold short | – | – | – | |||||||||
|
|
|
|
|
| |||||||
Net realized and unrealized gain/(loss) | (2,773,441 | ) | 2,708,576 | 8,353,821 | ||||||||
|
|
|
|
|
| |||||||
Net Increase/(Decrease) in Net Assets Resulting From Operations | $ | (751,714 | ) | $ | 3,441,298 | $ | 8,339,177 | |||||
|
|
|
|
|
| |||||||
The accompanying notes are an integral part of the financial statements.
| 56 | FINANCIAL STATEMENTS |
Table of Contents
ICON Long/Short | ICON Opportunities Fund | ICON Risk-Managed Balanced Fund | ||||||||
| $ | 28 | $ | 2 | $ | 112,000 | |||||
| 283,392 | 4,810 | 440,862 | ||||||||
| 17,580 | – | 6,930 | ||||||||
| – | (13 | ) | (3,483 | ) | ||||||
|
|
|
|
|
| |||||
| 301,000 | 4,799 | 556,309 | ||||||||
|
|
|
|
|
| |||||
| 179,025 | 2,490 | 137,807 | ||||||||
| 58,104 | – | 26,649 | ||||||||
| 28,817 | – | 10,616 | ||||||||
| 5,446 | 74 | 4,748 | ||||||||
| 52,999 | 1,271 | 42,172 | ||||||||
| 10,531 | 166 | 9,187 | ||||||||
| 1,926 | 1,980 | 3,861 | ||||||||
| 1,853 | – | 2,593 | ||||||||
| 5,970 | – | 6,418 | ||||||||
| 11,431 | – | 11,403 | ||||||||
| 2,532 | 1 | 2,731 | ||||||||
| 3,026 | 37 | 1,747 | ||||||||
| 29,636 | 24,567 | 35,741 | ||||||||
| 3,475 | 1 | 2,636 | ||||||||
| – | – | 5,175 | ||||||||
| 5,071 | – | – | ||||||||
| 5,193 | – | 26 | ||||||||
| 23,728 | 10,806 | 23,072 | ||||||||
|
|
|
|
|
| |||||
| 428,763 | 41,393 | 326,582 | ||||||||
| (56,161 | ) | (36,360 | ) | (66,142 | ) | ||||
|
|
|
|
|
| |||||
| 372,602 | 5,033 | 260,440 | ||||||||
|
|
|
|
|
| |||||
| (71,602 | ) | (234 | ) | 295,869 | ||||||
|
|
|
|
|
| |||||
| 3,468,444 | 21,034 | 2,637,309 | ||||||||
| – | – | (26 | ) | |||||||
| – | – | (39,556 | ) | |||||||
| (171,192 | ) | – | – | |||||||
|
|
| ||||||||
| 443,878 | 74,961 | (1,602,389 | ) | |||||||
| – | – | 66,746 | ||||||||
| (50,572 | ) | – | – | |||||||
|
|
|
|
|
| |||||
| 3,690,558 | 95,995 | 1,062,084 | ||||||||
|
|
|
|
|
| |||||
$ | 3,618,956 |
| $ | 95,761 | $ | 1,357,953 | ||||
|
|
|
|
|
| |||||
| FINANCIAL STATEMENTS | 57 |
Table of Contents
STATEMENTSOF CHANGESIN NET ASSETS
| ICON Bond Fund | ICON Equity Income Fund | |||||||||||||||
| Year ended September 30, 2013 | Year ended September 30, 2012 | Year ended September 30, 2013 | Year ended September 30, 2012 | |||||||||||||
Operations | ||||||||||||||||
Net investment income/(loss) | $ | 2,021,727 | $ | 3,634,345 | $ | 732,722 | $ | 927,636 | ||||||||
Net realized gain/(loss) | 1,808,686 | 2,289,761 | 3,820,735 | 755,568 | ||||||||||||
Change in net unrealized appreciation/(depreciation) | (4,582,127 | ) | 3,238,077 | (1,112,159 | ) | 5,113,358 | ||||||||||
|
|
|
|
|
|
|
| |||||||||
Net increase/(decrease) in net assets resulting from operations | (751,714 | ) | 9,162,183 | 3,441,298 | 6,796,562 | |||||||||||
|
|
|
|
|
|
|
| |||||||||
Dividends and Distributions to Shareholders | ||||||||||||||||
Net investment income | ||||||||||||||||
Class I* | – | (1,197,245 | ) | – | (241,898 | ) | ||||||||||
Class S** | (1,805,047 | ) | (1,925,269 | ) | (178,301 | ) | (260,178 | ) | ||||||||
Class C | (52,646 | ) | (116,098 | ) | (149,518 | ) | (105,929 | ) | ||||||||
Class A | (164,226 | ) | (395,563 | ) | (432,403 | ) | (298,293 | ) | ||||||||
Net realized gains | ||||||||||||||||
Class I* | – | (1,600,813 | ) | – | – | |||||||||||
Class S** | (2,116,924 | ) | (15,117 | ) | – | – | ||||||||||
Class C | (105,020 | ) | (65,783 | ) | – | – | ||||||||||
Class A | (208,330 | ) | (4,480 | ) | – | – | ||||||||||
|
|
|
|
|
|
|
| |||||||||
Net decrease from dividends and distributions | (4,452,193 | ) | (5,320,368 | ) | (760,222 | ) | (906,298 | ) | ||||||||
|
|
|
|
|
|
|
| |||||||||
Fund Share Transactions | ||||||||||||||||
Shares sold | ||||||||||||||||
Class I* | – | 10,974,194 | – | 987,981 | ||||||||||||
Class S** | 31,999,432 | 95,206,207 | 3,798,256 | 20,843,039 | ||||||||||||
Class C | 632,592 | 836,656 | 927,685 | 1,306,627 | ||||||||||||
Class A*** | 4,177,547 | 29,040,913 | 2,858,550 | 12,715,353 | ||||||||||||
Reinvested dividends and distributions | ||||||||||||||||
Class I* | – | 2,526,419 | – | 231,892 | ||||||||||||
Class S** | 3,841,503 | 1,875,329 | 149,125 | 247,017 | ||||||||||||
Class C | 138,412 | 165,354 | 89,166 | 74,224 | ||||||||||||
Class A | 295,490 | 358,295 | 345,076 | 235,826 | ||||||||||||
Shares repurchased | ||||||||||||||||
Class I* | – | (104,334,901 | ) | – | (30,536,686 | ) | ||||||||||
Class S** | (24,400,107 | ) | (20,171,872 | ) | (6,510,218 | ) | (14,805,923 | ) | ||||||||
Class C | (1,313,187 | ) | (1,259,657 | ) | (1,400,893 | ) | (923,118 | ) | ||||||||
Class A*** | (4,723,102 | ) | (22,958,360 | ) | (2,627,276 | ) | (5,901,423 | ) | ||||||||
|
|
|
|
|
|
|
| |||||||||
Net increase/(decrease) from fund share transactions | 10,648,580 | (7,741,423 | ) | (2,370,529 | ) | (15,525,191 | ) | |||||||||
|
|
|
|
|
|
|
| |||||||||
Total net increase/(decrease) in net assets | 5,444,673 | (3,899,608 | ) | 310,547 | (9,634,927 | ) | ||||||||||
Net Assets | ||||||||||||||||
Beginning of year | 92,668,177 | 96,567,785 | 23,026,669 | 32,661,596 | ||||||||||||
|
|
|
|
|
|
|
| |||||||||
End of year | $ | 98,112,850 | $ | 92,668,177 | $ | 23,337,216 | $ | 23,026,669 | ||||||||
|
|
|
|
|
|
|
| |||||||||
| 58 | FINANCIAL STATEMENTS |
Table of Contents
| ICON Fund | ICON Long/Short Fund | |||||||||||||
Year ended | Year ended September 30, 2012 | Year ended September 30, 2013 | Year ended September 30, 2012 | |||||||||||
$ | (14,644 | ) | $ | 169,793 | $ | (71,602 | ) | $ | (63,788 | ) | ||||
| 10,379,428 | 2,561,945 | 3,297,252 | (277,745 | ) | ||||||||||
| (2,025,607 | ) | 14,244,971 | 393,306 | 3,722,984 | |||||||||
|
|
|
|
|
|
|
| |||||||
| 8,339,177 |
| 16,976,709 | 3,618,956 | 3,381,451 | |||||||||
|
|
|
|
|
|
|
| |||||||
|
|
| ||||||||||||
| – | (161,444 | ) | – | – | ||||||||||
| (125,155 | ) | – | – | – | ||||||||||
| – | – | – | – | |||||||||||
| (44,656 | ) | – | – | – | ||||||||||
| – | – | – | – | |||||||||||
| – | – | – | – | |||||||||||
| – | – | – | – | |||||||||||
| – | – | – | – | |||||||||||
|
|
|
|
|
|
|
| |||||||
| (169,811 | ) | (161,444 | ) | – | – | ||||||||
|
|
|
|
|
|
|
| |||||||
| – | 847,758 | – | 615,566 | |||||||||||
| 1,504,207 | 40,695,868 | 2,493,788 | 6,330,779 | |||||||||||
| 1,236,829 | 664,869 | 327,531 | 578,713 | |||||||||||
| 764,166 | 19,633,373 | 2,592,668 | 18,944,856 | |||||||||||
|
|
| ||||||||||||
| – | 155,712 | – | – | |||||||||||
| 120,377 | – | – | – | |||||||||||
| – | – | – | – | |||||||||||
| 44,027 | – | – | – | |||||||||||
| – | (56,622,985 | ) | – | (9,274,530 | ) | |||||||||
| (19,499,579 | ) | (20,097,004 | ) | (1,876,720 | ) | (2,970,746 | ) | |||||||
| (4,565,141 | ) | (4,806,640 | ) | (1,225,560 | ) | (1,381,252 | ) | |||||||
| (5,671,280 | ) | (9,909,449 | ) | (11,397,248 | ) | (5,286,978 | ) | |||||||
|
|
|
|
|
|
|
| |||||||
| (26,066,394 | ) | (29,438,498 | ) | (9,085,541 | ) | 7,556,408 | |||||||
|
|
|
|
|
|
|
| |||||||
| (17,897,028 | ) | (12,623,233 | ) | (5,466,585 | ) | 10,937,859 | |||||||
| 53,730,998 | 66,354,231 | 25,161,990 | 14,224,131 | |||||||||||
|
|
|
|
|
|
|
| |||||||
| $ | 35,833,970 | $ | 53,730,998 | $ | 19,695,405 | $ | 25,161,990 | |||||||
|
|
|
|
|
|
|
| |||||||
| FINANCIAL STATEMENTS | 59 |
Table of Contents
STATEMENTSOF CHANGESIN NET ASSETS (CONTINUED)
| ICON Bond Fund | ICON Equity Income Fund | |||||||||||||||
| Year ended September 30, 2013 | Year ended September 30, 2012 | Year ended September 30, 2013 | Year ended September 30, 2012 | |||||||||||||
Transactions in Fund Shares | ||||||||||||||||
Shares sold | ||||||||||||||||
Class I* | – | 1,086,363 | – | 89,438 | ||||||||||||
Class S** | 3,191,749 | 9,427,267 | 289,905 | 1,787,991 | ||||||||||||
Class C | 61,887 | 81,024 | 70,831 | 112,921 | ||||||||||||
Class A*** | 410,034 | 2,888,672 | 223,575 | 1,092,400 | ||||||||||||
Reinvested dividends and distributions | ||||||||||||||||
Class I* | – | 252,285 | – | 20,872 | ||||||||||||
Class S** | 377,817 | 181,099 | 11,531 | 20,738 | ||||||||||||
Class C | 13,538 | 16,263 | 6,865 | 6,330 | ||||||||||||
Class A | 28,997 | 34,790 | 26,724 | 20,034 | ||||||||||||
Shares repurchased | ||||||||||||||||
Class I* | – | (10,382,660 | ) | – | (2,620,173 | ) | ||||||||||
Class S** | (2,382,798 | ) | (1,951,771 | ) | (515,509 | ) | (1,237,820 | ) | ||||||||
Class C | (129,966 | ) | (122,077 | ) | (107,050 | ) | (80,150 | ) | ||||||||
Class A*** | (467,338 | ) | (2,233,329 | ) | (205,513 | ) | (507,849 | ) | ||||||||
|
|
|
|
|
|
|
| |||||||||
Net increase/(decrease) | 1,103,920 | (722,074 | ) | (198,641 | ) | (1,295,268 | ) | |||||||||
|
|
|
|
|
|
|
| |||||||||
Shares outstanding, beginning of year | 8,816,133 | 9,538,207 | 1,892,511 | 3,187,779 | ||||||||||||
|
|
|
|
|
|
|
| |||||||||
Shares outstanding, end of year | 9,920,053 | 8,816,133 | 1,693,870 | 1,892,511 | ||||||||||||
|
|
|
|
|
|
|
| |||||||||
Accumulated undistributed net investment income/(loss) | $ | – | $ | – | $ | 2,975 | $ | (652 | ) | |||||||
|
|
|
|
|
|
|
| |||||||||
| * | Class I shares merged into Class A on January 23, 2012. The information presented is that before the merger. |
| ** | Class S shares were formerly named Class Z shares prior to January 23, 2012. |
| *** | Class I shares merged into Class A on January 23, 2012. The information presented includes the merger activity. |
The accompanying notes are an integral part of the financial statements.
| 60 | FINANCIAL STATEMENTS |
Table of Contents
| ICON Fund | ICON Long/Short Fund | |||||||||||||
Year ended | Year ended September 30, 2012 | Year ended September 30, 2013 | Year ended September 30, 2012 | |||||||||||
| – | 85,117 | – | 49,085 | |||||||||||
| 121,654 | 3,846,616 | 155,240 | 447,166 | |||||||||||
| 109,668 | 67,437 | 21,806 | 43,992 | |||||||||||
| 64,470 | 1,943,986 | 167,924 | 1,368,234 | |||||||||||
| – | 16,136 | – | – | |||||||||||
| 10,835 | – | – | – | |||||||||||
| – | – | – | – | |||||||||||
| 4,134 | – | – | – | |||||||||||
| – | (5,367,692 | ) | – | (693,486 | ) | |||||||||
| (1,656,644 | ) | (1,838,509 | ) | (120,447 | ) | (212,423 | ) | |||||||
| (402,626 | ) | (492,305 | ) | (85,591 | ) | (109,071 | ) | |||||||
| (464,696 | ) | (948,363 | ) | (749,427 | ) | (378,149 | ) | |||||||
|
|
|
|
|
|
|
| |||||||
| (2,213,205 | ) | (2,687,577 | ) | (610,495 | ) | 515,348 | |||||||
|
|
|
|
|
|
|
| |||||||
| 4,929,253 |
| 7,616,830 | 1,778,733 | 1,263,385 | |||||||||
|
|
|
|
|
|
|
| |||||||
| 2,716,048 |
| 4,929,253 | 1,168,238 | 1,778,733 | |||||||||
|
|
|
|
|
|
|
| |||||||
$ | (14,662 | ) | $ | 169,811 | $ | (81,756 | ) | $ | (54,664 | ) | ||||
|
|
|
|
|
|
|
| |||||||
| FINANCIAL STATEMENTS | 61 |
Table of Contents
STATEMENTSOF CHANGESIN NET ASSETS
| ICON Opportunities Fund† | ICON Risk-Managed Balanced Fund | |||||||||||
| Year ended September 30, 2013 | Year ended September 30, 2013 | Year ended September 30, 2012 | ||||||||||
Operations | ||||||||||||
Net investment income/(loss) | $ | (234 | ) | $ | 295,869 | $ | 160,320 | |||||
Net realized gain/(loss) | 21,034 | 2,597,727 | 630,812 | |||||||||
Change in net unrealized appreciation/(depreciation) | 74,961 | (1,535,643 | ) | 1,630,022 | ||||||||
|
|
|
|
|
| |||||||
Net increase/(decrease) in net assets resulting from operations | 95,761 | 1,357,953 | 2,421,154 | |||||||||
|
|
|
|
|
| |||||||
Dividends and Distributions to Shareholders | ||||||||||||
Net investment income | ||||||||||||
Class I* | - | - | (41,651 | ) | ||||||||
Class S** | - | (204,302 | ) | (68,173 | ) | |||||||
Class C | - | (22,634 | ) | (7,633 | ) | |||||||
Class A | - | (62,534 | ) | (42,911 | ) | |||||||
|
|
|
|
|
| |||||||
Net decrease from dividends and distributions | - | (289,470 | ) | (160,368 | ) | |||||||
|
|
|
|
|
| |||||||
Fund Share Transactions | ||||||||||||
Shares sold | 261, 714 | - | - | |||||||||
Class I* | - | - | 960,926 | |||||||||
Class S** | - | 39,722,666 | 12,234,963 | |||||||||
Class C | - | 3,869,861 | 380,549 | |||||||||
Class A | - | 4,944,567 | 8,459,342 | |||||||||
Reinvested dividends and distributions | ||||||||||||
Class I* | - | - | 36,883 | |||||||||
Class S** | - | 197,831 | 63,891 | |||||||||
Class C | - | 20,831 | 7,272 | |||||||||
Class A | - | 50,930 | 34,051 | |||||||||
Shares repurchased | (15,520 | ) | - | - | ||||||||
Class I* | - | - | (18,292,414 | ) | ||||||||
Class S | - | (3,787,847 | ) | (5,996,598 | ) | |||||||
Class C | - | (660,084 | ) | (513,378 | ) | |||||||
Class A*** | - | (1,569,911 | ) | (6,794,830 | ) | |||||||
|
|
|
|
|
| |||||||
Net increase/(decrease) from fund share transactions | 246,194 | 42,788,844 | (9,419,343 | ) | ||||||||
|
|
|
|
|
| |||||||
Total net increase/(decrease) in net assets | 341,955 | 43,857,327 | (7,158,557 | ) | ||||||||
Net Assets | ||||||||||||
Beginning of year | 100,000 | 12,979,204 | 20,137,761 | |||||||||
|
|
|
|
|
| |||||||
End of year | $ | 441,955 | $ | 56,836,531 | $ | 12,979,204 | ||||||
|
|
|
|
|
| |||||||
| 62 | FINANCIAL STATEMENTS |
Table of Contents
| ICON Opportunities Fund† | ICON Risk-Managed Balanced Fund | |||||||||||
| Year ended September 30, 2013 | Year ended September 30, 2013 | Year ended September 30, 2012 | ||||||||||
Transactions in Fund Shares | ||||||||||||
Shares sold | 25,233 | |||||||||||
Class I* | - | - | 86,186 | |||||||||
Class S** | - | 2,970,024 | 1,038,013 | |||||||||
Class C | - | 315,370 | 34,974 | |||||||||
Class A*** | - | 382,141 | 732,607 | |||||||||
Reinvested dividends and distributions | ||||||||||||
Class I* | - | - | 3,305 | |||||||||
Class S** | - | 15,160 | 5,298 | |||||||||
Class C | - | 1,753 | 659 | |||||||||
Class A | - | 4,052 | 2,907 | |||||||||
Shares repurchased | (1,299 | ) | ||||||||||
Class I* | - | - | (1,585,532 | ) | ||||||||
Class S** | - | (292,509 | ) | (505,652 | ) | |||||||
Class C | - | (56,142 | ) | (47,179 | ) | |||||||
Class A*** | - | (125,458 | ) | (586,238 | ) | |||||||
|
|
|
|
|
| |||||||
Net increase/(decrease) | 23,934 | 3,214,391 | (820,652 | ) | ||||||||
|
|
|
|
|
| |||||||
Shares outstanding, beginning of year | 10,000 | 1,074,892 | 1,895,544 | |||||||||
|
|
|
|
|
| |||||||
Shares outstanding, end of year | 33,934 | 4,289,283 | 1,074,892 | |||||||||
|
|
|
|
|
| |||||||
Accumulated undistributed net investment income/(loss) | $ | - | $ | - | $ | 2,787 | ||||||
|
|
|
|
|
| |||||||
| † | The Fund commenced operations on October 1, 2012. |
| * | Class I shares merged into Class A on January 23, 2012. The information presented is that before the merger. |
| ** | Class S shares were formerly named Class Z shares prior to January 23, 2012. |
| *** | Class I shares merged into Class A on January 23, 2012. The information presented includes the merger activity. |
The accompanying notes are an integral part of the financial statements.
| FINANCIAL STATEMENTS | 63 |
Table of Contents
| Income/(loss) from investment operations | Less dividends and | |||||||||||||||||||||||
| Net asset value, beginning of period | Net investment income/ (loss)(x) | Net realized and unrealized gains/(losses) on investments | Total from investment operations | Dividends from net investment income | Distributions from net realized gains | |||||||||||||||||||
ICON Bond Fund | ||||||||||||||||||||||||
Class S** | ||||||||||||||||||||||||
Year ended September 30, 2013 | $ | 10.51 | $ | 0.24 | $ | (0.32 | ) | $ | (0.08 | ) | $ | (0.24 | ) | $ | (0.30 | ) | ||||||||
Year ended September 30, 2012 | 10.11 | 0.38 | 0.59 | 0.97 | (0.40 | ) | (0.17 | ) | ||||||||||||||||
Year ended September 30, 2011 | 10.79 | 0.47 | (0.46 | ) | 0.01 | (0.47 | ) | (0.22 | ) | |||||||||||||||
Year ended September 30, 2010 | 10.26 | 0.48 | 0.57 | 1.05 | (0.48 | ) | (0.04 | ) | ||||||||||||||||
Year ended September 30, 2009 | 9.42 | 0.45 | 0.81 | 1.26 | (0.42 | ) | – | |||||||||||||||||
Class C | ||||||||||||||||||||||||
Year ended September 30, 2013 | 10.55 | 0.15 | (0.32 | ) | (0.17 | ) | (0.15 | ) | (0.30 | ) | ||||||||||||||
Year ended September 30, 2012 | 10.15 | 0.31 | 0.57 | 0.88 | (0.31 | ) | (0.17 | ) | ||||||||||||||||
Year ended September 30, 2011 | 10.83 | 0.39 | (0.46 | ) | (0.07 | ) | (0.39 | ) | (0.22 | ) | ||||||||||||||
Year ended September 30, 2010 | 10.30 | 0.39 | 0.57 | 0.96 | (0.39 | ) | (0.04 | ) | ||||||||||||||||
Year ended September 30, 2009 | 9.46 | 0.34 | 0.84 | 1.18 | (0.34 | ) | – | |||||||||||||||||
Class A*** | ||||||||||||||||||||||||
Year ended September 30, 2013 | 10.51 | 0.21 | (0.32 | ) | (0.11 | ) | (0.21 | ) | (0.30 | ) | ||||||||||||||
Year ended September 30, 2012 | 10.11 | 0.36 | 0.58 | 0.94 | (0.37 | ) | (0.17 | ) | ||||||||||||||||
Year ended September 30, 2011 | 10.81 | 0.46 | (0.46 | ) | – | (0.48 | ) | (0.22 | ) | |||||||||||||||
ICON Equity Income Fund | ||||||||||||||||||||||||
Class S** | ||||||||||||||||||||||||
Year ended September 30, 2013 | 12.18 | 0.47 | 1.65 | 2.12 | (0.50 | ) | - | |||||||||||||||||
Year ended September 30, 2012 | 10.21 | 0.43 | 2.03 | 2.46 | (0.49 | ) | - | |||||||||||||||||
Year ended September 30, 2011 | 10.96 | 0.50 | (0.71 | ) | (0.21 | ) | (0.54 | ) | - | |||||||||||||||
Year ended September 30, 2010 | 10.26 | 0.47 | 0.64 | 1.11 | (0.41 | ) | - | |||||||||||||||||
Year ended September 30, 2009 | 11.84 | 0.41 | (1.57 | ) | (1.16 | ) | (0.42 | ) | - | |||||||||||||||
Class C | ||||||||||||||||||||||||
Year ended September 30, 2013 | 12.25 | 0.35 | 1.65 | 2.00 | (0.37 | ) | - | |||||||||||||||||
Year ended September 30, 2012 | 10.16 | 0.29 | 2.06 | 2.35 | (0.26 | ) | - | |||||||||||||||||
Year ended September 30, 2011 | 10.85 | 0.37 | (0.72 | ) | (0.35 | ) | (0.34 | ) | - | |||||||||||||||
Year ended September 30, 2010 | 10.16 | 0.36 | 0.64 | 1.00 | (0.31 | ) | - | |||||||||||||||||
Year ended September 30, 2009 | 11.73 | 0.32 | (1.56 | ) | (1.24 | ) | (0.33 | ) | - | |||||||||||||||
Class A*** | ||||||||||||||||||||||||
Year ended September 30, 2013 | 12.12 | 0.45 | 1.63 | 2.08 | (0.47 | ) | - | |||||||||||||||||
Year ended September 30, 2012 | 10.15 | 0.39 | 2.03 | 2.42 | (0.45 | ) | - | |||||||||||||||||
Year ended September 30, 2011 | 10.90 | 0.47 | (0.71 | ) | (0.24 | ) | (0.51 | ) | - | |||||||||||||||
Year ended September 30, 2010 | 10.21 | 0.46 | 0.63 | 1.09 | (0.40 | ) | - | |||||||||||||||||
Year ended September 30, 2009 | 11.80 | 0.38 | (1.57 | ) | (1.19 | ) | (0.40 | ) | - | |||||||||||||||
| 64 | FINANCIAL HIGHLIGHTS |
Table of Contents
| distributions | Ratio of expenses to average net assets | Ratio of net investment income/(loss) to average net assets | ||||||||||||||||||||||||||||||||
| Total dividends and distributions | Net asset value, end of period | Total return* | Net assets, end of period (in thousands) | Before expense limitation/ recoupment and transfer agent earnings credits | After expense limitation/ recoupment and transfer agent earnings credits(b) | Before expense limitation/ recoupment and transfer agent earnings credits | After expense limitation/ recoupment and transfer agent earnings credits | Portfolio turnover rate(a) | ||||||||||||||||||||||||||
| $ | (0.54 | ) | $ | 9.89 | (0.84 | )% | $ | 88,313 | 0.89 | % | 0.75 | % | 2.19 | % | 2.33 | % | 96.56 | % | ||||||||||||||||
| (0.57 | ) | 10.51 | 9.93 | % | 81,381 | 0.88 | % | 0.75 | % | 3.46 | % | 3.59 | % | 51.28 | % | |||||||||||||||||||
| (0.69 | ) | 10.11 | 0.15 | % | 881 | 1.18 | % | 0.75 | % | 4.08 | % | 4.51 | % | 32.13 | % | |||||||||||||||||||
| (0.52 | ) | 10.79 | 10.45 | % | 1,049 | 1.39 | % | 0.75 | % | 3.95 | % | 4.59 | % | 63.47 | % | |||||||||||||||||||
| (0.42 | ) | 10.26 | 13.79 | % | 1,087 | 1.91 | % | 0.75 | % | 3.34 | % | 4.50 | % | 73.71 | % | |||||||||||||||||||
| (0.45 | ) | 9.93 | (1.66 | )% | 3,008 | 2.06 | % | 1.60 | % | 1.02 | % | 1.48 | % | 96.56 | % | |||||||||||||||||||
| (0.48 | ) | 10.55 | 8.98 | % | 3,772 | 2.28 | % | 1.60 | % | 2.35 | % | 3.03 | % | 51.28 | % | |||||||||||||||||||
| (0.61 | ) | 10.15 | (0.68 | )% | 3,879 | 2.16 | % | 1.60 | % | 3.11 | % | 3.67 | % | 32.13 | % | |||||||||||||||||||
| (0.43 | ) | 10.83 | 9.52 | % | 4,544 | 2.46 | % | 1.60 | % | 2.88 | % | 3.74 | % | 63.47 | % | |||||||||||||||||||
| (0.34 | ) | 10.30 | 12.80 | % | 4,441 | 2.40 | % | 1.60 | % | 2.75 | % | 3.55 | % | 73.71 | % | |||||||||||||||||||
| (0.51 | ) | 9.89 | (1.08 | )% | 6,792 | 1.34 | % | 1.00 | % | 1.71 | % | 2.06 | % | 96.56 | % | |||||||||||||||||||
| (0.54 | ) | 10.51 | 9.66 | % | 7,515 | 1.31 | % | 1.00 | % | 3.13 | % | 3.44 | % | 51.28 | % | |||||||||||||||||||
| (0.70 | ) | 10.11 | (0.02 | )% | 249 | 5.83 | % | 1.01 | % | (0.38 | )% | 4.44 | % | 32.13 | % | |||||||||||||||||||
| (0.50 | ) | 13.80 | 17.76 | % | 5,116 | 1.53 | % | 1.21 | % | 3.28 | % | 3.60 | % | 162.82 | % | |||||||||||||||||||
| (0.49 | ) | 12.18 | 24.43 | % | 7,123 | 1.47 | % | 1.21 | % | 3.31 | % | 3.57 | % | 122.39 | % | |||||||||||||||||||
| (0.54 | ) | 10.21 | (2.40 | )% | 142 | 3.99 | % | 1.20 | % | 1.45 | % | 4.24 | % | 142.75 | % | |||||||||||||||||||
| (0.41 | ) | 10.96 | 11.04 | % | 88 | 7.66 | % | 1.20 | % | (2.01 | )% | 4.45 | % | 123.33 | % | |||||||||||||||||||
| (0.42 | ) | 10.26 | (9.20 | )% | 66 | 8.73 | % | 1.21 | % | (2.83 | )% | 4.69 | % | 148.56 | % | |||||||||||||||||||
| (0.37 | ) | 13.88 | 16.58 | % | 5,423 | 2.42 | % | 2.21 | % | 2.49 | % | 2.70 | % | 162.82 | % | |||||||||||||||||||
| (0.26 | ) | 12.25 | 23.31 | % | 5,146 | 2.62 | % | 2.20 | % | 2.09 | % | 2.51 | % | 122.39 | % | |||||||||||||||||||
| (0.34 | ) | 10.16 | (3.47 | )% | 3,874 | 2.53 | % | 2.20 | % | 2.85 | % | 3.18 | % | 142.75 | % | |||||||||||||||||||
| (0.31 | ) | 10.85 | 9.99 | % | 3,569 | 2.97 | % | 2.20 | % | 2.68 | % | 3.46 | % | 123.33 | % | |||||||||||||||||||
| (0.33 | ) | 10.16 | (10.12 | )% | 3,348 | 2.69 | % | 2.21 | % | 3.21 | % | 3.69 | % | 148.56 | % | |||||||||||||||||||
| (0.47 | ) | 13.73 | 17.49 | % | 12,798 | 1.68 | % | 1.46 | % | 3.24 | % | 3.45 | % | 162.82 | % | |||||||||||||||||||
| (0.45 | ) | 12.12 | 24.10 | % | 10,758 | 1.69 | % | 1.45 | % | 3.11 | % | 3.35 | % | 122.39 | % | |||||||||||||||||||
| (0.51 | ) | 10.15 | (2.66 | )% | 2,871 | 1.91 | % | 1.45 | % | 3.55 | % | 4.01 | % | 142.75 | % | |||||||||||||||||||
| (0.40 | ) | 10.90 | 10.84 | % | 1,521 | 4.59 | % | 1.45 | % | 1.19 | % | 4.32 | % | 123.33 | % | |||||||||||||||||||
| (0.40 | ) | 10.21 | (9.53 | )% | 237 | 5.68 | % | 1.46 | % | 0.26 | % | 4.48 | % | 148.56 | % | |||||||||||||||||||
| FINANCIAL HIGHLIGHTS | 65 |
Table of Contents
FINANCIAL HIGHLIGHTS (CONTINUED)
| Income/(loss) from investment operations | Less dividends and | |||||||||||||||||||||||
| Net asset value, beginning of period | Net investment income/ (loss)(x) | Net realized and unrealized gains/(losses) on investments | Total from investment operations | Dividends from net investment income | Distributions from net realized gains | |||||||||||||||||||
ICON Fund | ||||||||||||||||||||||||
Class S** | ||||||||||||||||||||||||
Year ended September 30, 2013 | $ | 11.34 | $ | 0.07 | $ | 2.66 | $ | 2.73 | $ | (0.07 | ) | $ | – | |||||||||||
Year ended September 30, 2012 | 8.82 | 0.07 | 2.45 | 2.52 | – | – | ||||||||||||||||||
Year ended September 30, 2011 | 9.04 | (0.07 | ) | (0.15 | ) | (0.22 | ) | – | – | |||||||||||||||
Year ended September 30, 2010 | 9.07 | (0.01 | ) | 0.11 | 0.10 | (0.13 | ) | – | ||||||||||||||||
Year ended September 30, 2009 | 11.24 | 0.10 | (2.27 | ) | (2.17 | ) | – | – | ||||||||||||||||
Class C | ||||||||||||||||||||||||
Year ended September 30, 2013 | 10.42 | (0.07 | ) | 2.47 | 2.40 | – | – | |||||||||||||||||
Year ended September 30, 2012 | 8.17 | (0.04 | ) | 2.29 | 2.25 | – | – | |||||||||||||||||
Year ended September 30, 2011 | 8.36 | (0.05 | ) | (0.14 | ) | (0.19 | ) | – | – | |||||||||||||||
Year ended September 30, 2010 | 8.37 | (0.04 | ) | 0.11 | 0.07 | (0.08 | ) | – | ||||||||||||||||
Year ended September 30, 2009 | 10.46 | 0.03 | (2.12 | ) | (2.09 | ) | – | – | ||||||||||||||||
Class A*** | ||||||||||||||||||||||||
Year ended September 30, 2013 | 10.85 | 0.02 | 2.56 | 2.58 | (0.04 | ) | – | |||||||||||||||||
Year ended September 30, 2012 | 8.46 | 0.03 | 2.36 | 2.39 | – | – | ||||||||||||||||||
Year ended September 30, 2011 | 8.67 | (0.07 | ) | (0.14 | ) | (0.21 | ) | – | – | |||||||||||||||
Year ended September 30, 2010 | 8.73 | (0.08 | ) | 0.10 | 0.02 | (0.08 | ) | – | ||||||||||||||||
Year ended September 30, 2009 | 10.92 | 0.01 | (2.20 | ) | (2.19 | ) | – | – | ||||||||||||||||
ICON Long/Short Fund(c) | ||||||||||||||||||||||||
Class S** | ||||||||||||||||||||||||
Year ended September 30, 2013 | 14.56 | 0.01 | 2.91 | 2.92 | – | – | ||||||||||||||||||
Year ended September 30, 2012 | 11.61 | 0.02 | 2.93 | 2.95 | – | – | ||||||||||||||||||
Year ended September 30, 2011 | 11.90 | 0.02 | (0.31 | ) | (0.29 | ) | – | – | ||||||||||||||||
Year ended September 30, 2010 | 11.80 | 0.03 | 0.29 | 0.32 | (0.22 | ) | – | |||||||||||||||||
Year ended September 30, 2009 | 13.81 | 0.17 | (1.89 | ) | (1.72 | ) | (0.29 | ) | – | |||||||||||||||
Class C | ||||||||||||||||||||||||
Year ended September 30, 2013 | 13.52 | (0.14 | ) | 2.67 | 2.53 | – | – | |||||||||||||||||
Year ended September 30, 2012 | 10.89 | (0.11 | ) | 2.74 | 2.63 | – | – | |||||||||||||||||
Year ended September 30, 2011 | 11.29 | (0.11 | ) | (0.29 | ) | (0.40 | ) | – | – | |||||||||||||||
Year ended September 30, 2010 | 11.19 | (0.08 | ) | 0.27 | 0.19 | (0.09 | ) | – | ||||||||||||||||
Year ended September 30, 2009 | 13.13 | 0.06 | (1.81 | ) | (1.75 | ) | (0.19 | ) | – | |||||||||||||||
Class A*** | ||||||||||||||||||||||||
Year ended September 30, 2013 | 14.31 | (0.02 | ) | 2.84 | 2.82 | – | – | |||||||||||||||||
Year ended September 30, 2012 | 11.44 | (0.02 | ) | 2.89 | 2.87 | – | – | |||||||||||||||||
Year ended September 30, 2011 | 11.77 | (0.02 | ) | (0.31 | ) | (0.33 | ) | – | – | |||||||||||||||
Year ended September 30, 2010 | 11.67 | – | 0.28 | 0.28 | (0.18 | ) | – | |||||||||||||||||
Year ended September 30, 2009 | 13.69 | 0.14 | (1.88 | ) | (1.74 | ) | (0.28 | ) | – | |||||||||||||||
| 66 | FINANCIAL HIGHLIGHTS |
Table of Contents
| distributions | Ratio of expenses to average net assets | Ratio of net investment income/(loss) to average net assets | ||||||||||||||||||||||||||||||||
| Total dividends and distributions | Net asset value, end of period | Total return* | Net assets, end of period (in thousands) | Before expense limitation/ recoupment and transfer agent earnings credits | After expense limitation/ recoupment and transfer agent earnings credits(b) | Before expense limitation/ recoupment and transfer agent earnings credits | After expense limitation/ recoupment and transfer agent earnings credits | Portfolio turnover rate(a) | ||||||||||||||||||||||||||
| $ | (0.07 | ) | $ | 14.00 | 24.27 | % | $ | 6,986 | 1.23 | % | 1.23 | % | 0.59 | % | 0.59 | % | 32.68 | % | ||||||||||||||||
| – | 11.34 | 28.57 | % | 22,952 | 1.18 | % | 1.18 | % | 0.61 | % | 0.61 | % | 23.73 | % | ||||||||||||||||||||
| – | 8.82 | (2.43 | )% | 133 | 2.52 | % | 2.52 | % | (0.72 | )% | (0.72 | )% | 57.93 | % | ||||||||||||||||||||
| (0.13 | ) | 9.04 | 1.10 | % | 406 | 1.90 | % | 1.90 | % | (0.06 | )% | (0.06 | )% | 123.12 | % | |||||||||||||||||||
| – | 9.07 | (19.31 | )% | 887 | 1.45 | % | 1.45 | % | 1.27 | % | 1.27 | % | 208.48 | % | ||||||||||||||||||||
| – | 12.82 | 23.03 | % | 18,848 | 2.32 | % | 2.26 | % | (0.64 | )% | (0.58 | )% | 32.68 | % | ||||||||||||||||||||
| – | 10.42 | 27.54 | % | 18,378 | 2.35 | % | 2.28 | % | (0.48 | )% | (0.41 | )% | 23.73 | % | ||||||||||||||||||||
| – | 8.17 | (2.27 | )% | 17,884 | 2.27 | % | 2.27 | % | (0.50 | )% | (0.50 | )% | 57.93 | % | ||||||||||||||||||||
| (0.08 | ) | 8.36 | 0.84 | % | 24,573 | 2.25 | % | 2.25 | % | (0.45 | )% | (0.45 | )% | 123.12 | % | |||||||||||||||||||
| – | 8.37 | (19.98 | )% | 33,089 | 2.25 | % | 2.25 | % | 0.44 | % | 0.44 | % | 208.48 | % | ||||||||||||||||||||
| (0.04 | ) | 13.39 | 23.90 | % | 10,000 | 1.58 | % | 1.51 | % | 0.12 | % | 0.19 | % | 32.68 | % | |||||||||||||||||||
| – | 10.85 | 28.25 | % | 12,401 | 1.54 | % | 1.54 | % | 0.27 | % | 0.27 | % | 23.73 | % | ||||||||||||||||||||
| – | 8.46 | (2.42 | )% | 1,245 | 2.52 | % | 2.52 | % | (0.75 | )% | (0.75 | )% | 57.93 | % | ||||||||||||||||||||
| (0.08 | ) | 8.67 | 0.22 | % | 1,362 | 2.68 | % | 2.68 | % | (0.88 | )% | (0.88 | )% | 123.12 | % | |||||||||||||||||||
| – | 8.73 | (20.05 | )% | 1,969 | 2.43 | % | 2.43 | % | 0.11 | % | 0.11 | % | 208.48 | % | ||||||||||||||||||||
| – | 17.48 | 20.05 | % | 4,774 | 1.53 | % | 1.32 | % | (0.14 | )% | 0.07 | % | 32.63 | % | ||||||||||||||||||||
| – | 14.56 | 25.41 | % | 3,471 | 2.18 | % | 1.35 | % | (0.70 | )% | 0.13 | % | 54.26 | % | ||||||||||||||||||||
| – | 11.61 | (2.44 | )% | 42 | 7.76 | % | 1.65 | % | (5.96 | )% | 0.15 | % | 67.28 | % | ||||||||||||||||||||
| (0.22 | ) | 11.90 | 2.63 | % | 132 | 5.80 | % | 2.15 | % | (3.39 | )% | 0.25 | % | 136.50 | % | |||||||||||||||||||
| (0.29 | ) | 11.80 | (12.10 | )% | 128 | 4.40 | % | 1.73 | % | (1.12 | )% | 1.55 | % | 131.79 | % | |||||||||||||||||||
| – | 16.05 | 18.71 | % | 6,108 | 2.62 | % | 2.37 | % | (1.21 | )% | (0.96 | )% | 32.63 | % | ||||||||||||||||||||
| – | 13.52 | 24.15 | % | 6,004 | 2.95 | % | 2.41 | % | (1.44 | )% | (0.90 | )% | 54.26 | % | ||||||||||||||||||||
| – | 10.89 | (3.54 | )% | 5,546 | 3.14 | % | 2.70 | % | (1.38 | )% | (0.94 | )% | 67.28 | % | ||||||||||||||||||||
| (0.09 | ) | 11.29 | 1.65 | % | 9,547 | 3.60 | % | 3.19 | % | (1.14 | )% | (0.73 | )% | 136.50 | % | |||||||||||||||||||
| (0.19 | ) | 11.19 | (13.10 | )% | 15,093 | 2.95 | % | 2.81 | % | 0.44 | % | 0.58 | % | 131.79 | % | |||||||||||||||||||
| – | 17.13 | 19.71 | % | 8,813 | 1.91 | % | 1.61 | % | (0.45 | )% | (0.16 | )% | 32.63 | % | ||||||||||||||||||||
| – | 14.31 | 25.09 | % | 15,687 | 2.09 | % | 1.65 | % | (0.58 | )% | (0.14 | )% | 54.26 | % | ||||||||||||||||||||
| – | 11.44 | (2.80 | )% | 1,213 | 3.23 | % | 1.91 | % | (1.46 | )% | (0.14 | )% | 67.28 | % | ||||||||||||||||||||
| (0.18 | ) | 11.77 | 2.34 | % | 1,855 | 3.65 | % | 2.45 | % | (1.21 | )% | (0.01 | )% | 136.50 | % | |||||||||||||||||||
| (0.28 | ) | 11.67 | (12.39 | )% | 2,390 | 2.64 | % | 2.06 | % | 0.76 | % | 1.34 | % | 131.79 | % | |||||||||||||||||||
| FINANCIAL HIGHLIGHTS | 67 |
Table of Contents
FINANCIAL HIGHLIGHTS (CONTINUED)
| Income/(loss) from investment operations | Less dividends and | |||||||||||||||||||||||
| Net asset value, beginning of period | Net investment income/ (loss)(x) | Net realized and unrealized gains/(losses) on investments | Total from investment operations | Dividends from net investment income | Distributions from net realized gains | |||||||||||||||||||
ICON Opportunities Fund | ||||||||||||||||||||||||
Year ended September 30, 2013 | $ | 10.00 | $ | (0.01 | ) | $ | 3.03 | $ | 3.02 | $ | – | $ | – | |||||||||||
ICON Risk-Managed Balanced Fund | ||||||||||||||||||||||||
Class S** | ||||||||||||||||||||||||
Year ended September 30, 2013 | 12.32 | 0.24 | 1.04 | 1.28 | (0.20 | ) | – | |||||||||||||||||
Year ended September 30, 2012 | 10.88 | 0.15 | 1.44 | 1.59 | (0.15 | ) | – | |||||||||||||||||
Year ended September 30, 2011 | 10.96 | 0.12 | (0.05 | ) | 0.07 | (0.15 | ) | – | ||||||||||||||||
Year ended September 30, 2010 | 10.61 | 0.08 | 0.33 | 0.41 | (0.06 | ) | – | |||||||||||||||||
Year ended September 30, 2009 | 11.46 | 0.22 | (0.91 | ) | (0.69 | ) | (0.16 | ) | – | |||||||||||||||
Class C | ||||||||||||||||||||||||
Year ended September 30, 2013 | 11.41 | 0.09 | 0.98 | 1.07 | (0.09 | ) | – | |||||||||||||||||
Year ended September 30, 2012 | 10.09 | 0.02 | 1.34 | 1.36 | (0.04 | ) | – | |||||||||||||||||
Year ended September 30, 2011 | 10.15 | 0.01 | (0.05 | ) | (0.04 | ) | (0.02 | ) | – | |||||||||||||||
Year ended September 30, 2010 | 9.88 | (0.02 | ) | 0.29 | 0.27 | – | – | |||||||||||||||||
Year ended September 30, 2009 | 10.72 | 0.05 | (0.79 | ) | (0.74 | ) | (0.10 | ) | – | |||||||||||||||
Class A*** | ||||||||||||||||||||||||
Year ended September 30, 2013 | 12.06 | 0.18 | 1.05 | 1.23 | (0.17 | ) | – | |||||||||||||||||
Year ended September 30, 2012 | 10.66 | 0.11 | 1.41 | 1.52 | (0.12 | ) | – | |||||||||||||||||
Year ended September 30, 2011 | 10.72 | 0.09 | (0.05 | ) | 0.04 | (0.10 | ) | – | ||||||||||||||||
Year ended September 30, 2010 | 10.39 | 0.05 | 0.33 | 0.38 | (0.05 | ) | – | |||||||||||||||||
Year ended September 30, 2009 | 11.25 | 0.09 | (0.80 | ) | (0.71 | ) | (0.15 | ) | – | |||||||||||||||
| (x) | Calculated using the average shares method. |
| * | The total return calculation is for the period indicated and excludes any sales charges. |
| ** | Class S shares were formerly named Class Z shares prior to January 23, 2012. |
| *** | Class I shares merged into Class A on January 23, 2012. The results of each class prior to the merger may have been different than what is presented. |
| (a) | Portfolio turnover is calculated at the Fund level and is not annualized for periods less than a year. |
| (b) | The Fund’s operating expenses, not including interest expense, are contractually limited to the amounts discussed in Note 3. The ratios in these financial highlights reflect the limitation, including the interest expense |
| (c) | The Fund’s operating expenses, not including dividends on short positions, are contractually limited to 1.25% for Class S, 2.30% for Class C and 1.55% for Class A. The ratios in these financial highlights reflect the limitation, including the dividends on short positions. |
The accompanying notes are an integral part of the financial statements.
| 68 | FINANCIAL HIGHLIGHTS |
Table of Contents
| distributions | Ratio of expenses to average net assets | Ratio of net investment income/(loss) to average net assets | ||||||||||||||||||||||||||||||||
| Total dividends and distributions | Net asset value, end of period | Total return* | Net assets, end of period (in thousands) | Before expense limitation/ recoupment and transfer agent earnings credits | After expense limitation/ recoupment and transfer agent earnings credits(b) | Before expense limitation/ recoupment and transfer agent earnings credits | After expense limitation/ recoupment and transfer agent earnings credits | Portfolio turnover rate(a) | ||||||||||||||||||||||||||
| $ | – | $ | 13.02 | 30.20 | % | $ | 442 | 12.47 | % | 1.52 | % | (11.02 | )% | (0.07 | )% | 52.22 | % | |||||||||||||||||
| (0.20 | ) | 13.40 | 10.51 | % | 43,350 | 1.43 | % | 1.21 | % | 1.65 | % | 1.87 | % | 98.30 | % | |||||||||||||||||||
| (0.15 | ) | 12.32 | 14.65 | % | 6,692 | 1.80 | % | 1.24 | % | 0.69 | % | 1.25 | % | 71.06 | % | |||||||||||||||||||
| (0.15 | ) | 10.88 | 0.51 | % | 60 | 7.22 | % | 1.23 | % | (4.94 | )% | 1.05 | % | 67.61 | % | |||||||||||||||||||
| (0.06 | ) | 10.96 | 3.90 | % | 62 | 10.41 | % | 1.31 | % | (8.34 | )% | 0.75 | % | 114.34 | % | |||||||||||||||||||
| (0.16 | ) | 10.61 | (5.79 | )% | 72 | 3.55 | % | 1.24 | % | (0.10 | )% | 2.21 | % | 194.31 | % | |||||||||||||||||||
| (0.09 | ) | 12.39 | 9.45 | % | 5,667 | 2.72 | % | 2.22 | % | 0.22 | % | 0.72 | % | 98.30 | % | |||||||||||||||||||
| (0.04 | ) | 11.41 | 13.47 | % | 2,243 | 3.25 | % | 2.23 | % | (0.79 | )% | 0.23 | % | 71.06 | % | |||||||||||||||||||
| (0.02 | ) | 10.09 | (0.45 | )% | 2,099 | 2.95 | % | 2.23 | % | (0.66 | )% | 0.06 | % | 67.61 | % | |||||||||||||||||||
| – | 10.15 | 2.73 | % | 2,609 | 3.36 | % | 2.30 | % | (1.27 | )% | (0.21 | )% | 114.34 | % | ||||||||||||||||||||
| (0.10 | ) | 9.88 | (6.69 | )% | 3,199 | 2.72 | % | 2.24 | % | 0.06 | % | 0.54 | % | 194.31 | % | |||||||||||||||||||
| (0.17 | ) | 13.12 | 10.28 | % | 7,819 | 2.12 | % | 1.47 | % | 0.81 | % | 1.46 | % | 98.30 | % | |||||||||||||||||||
| (0.12 | ) | 12.06 | 14.28 | % | 4,045 | 2.16 | % | 1.48 | % | 0.28 | % | 0.96 | % | 71.06 | % | |||||||||||||||||||
| (0.10 | ) | 10.66 | 0.32 | % | 1,982 | 2.08 | % | 1.48 | % | 0.20 | % | 0.80 | % | 67.61 | % | |||||||||||||||||||
| (0.05 | ) | 10.72 | 3.69 | % | 4,020 | 2.62 | % | 1.59 | % | (0.57 | )% | 0.46 | % | 114.34 | % | |||||||||||||||||||
| (0.15 | ) | 10.39 | (6.05 | )% | 1,501 | 2.87 | % | 1.49 | % | (0.43 | )% | 0.95 | % | 194.31 | % | |||||||||||||||||||
| FINANCIAL HIGHLIGHTS | 69 |
Table of Contents
SEPTEMBER 30, 2013
1. Organization
The ICON Bond Fund (“Bond Fund”), ICON Equity Income Fund (“Equity Income Fund”), ICON Fund (“ICON Fund”), ICON Long/Short Fund (“Long/Short Fund”), ICON Opportunities Fund (“Opportunities Fund”) and ICON Risk-Managed Balanced Fund (“Risk-Managed Balanced Fund”) (formerly, ICON Risk-Managed Equity Fund) are series funds (individually a “Fund” and collectively, the “Funds”). The Funds are part of the ICON Funds (the “Trust”), a Massachusetts business trust registered under the Investment Company Act of 1940, as amended (the “1940 Act”) as an open-end investment management company. Each Fund, with the exception of the Opportunities Fund, offers three classes of shares: Class S, Class C, and Class A. The Opportunities Fund is a single-class fund. All classes have equal rights as to earnings, assets and voting privileges except that each Class may bear different distribution fees, registration costs, legal costs, mailing and printing costs and shareholder servicing costs and each Class has exclusive voting rights with respect to its distribution plan. There are currently twelve other active Funds within the Trust. Those Funds are covered by separate prospectuses and shareholder reports.
Each Fund is authorized to issue an unlimited number of no par shares. The investment objective of the Bond Fund is maximum total return. The investment objective of the Equity Income Fund is modest capital appreciation and income. The investment objective of the ICON Fund is long-term capital appreciation with a secondary objective of capital preservation. The investment objective of the Opportunities Fund is to provide capital appreciation. The investment objective of the Long/Short Fund is capital appreciation. As of August 1, 2013, the investment objective of the Risk-Managed Balanced Fund is modest capital appreciation and income. Prior to August 1, 2013, the formerly Risk-Managed Equity Fund’s investment objective was modest capital appreciation and to maximize realized gains.
The Funds may have elements of risk, including the risk of loss of principal. There is no assurance that the investment process will consistently lead to successful results. An investment concentrated in sectors and industries may involve greater risk and volatility than a more diversified investment. Securities of small companies generally involve greater risks than investments in larger companies. Small company securities tend to be more volatile and less liquid than equity securities of larger companies. Investing in fixed income securities such as bonds involves interest rate risk. When interest rates rise, the value of fixed income securities generally decreases. Additionally, the
| 70 | NOTESTO FINANCIAL STATEMENTS |
Table of Contents
Bond Fund, Equity Income Fund and the Risk-Managed Balanced Fund may invest in medium-and lower-quality debt securities. High-yield bonds involve a greater risk of default and price volatility than U.S. government and other high-quality bonds. The Long/Short Fund engages in short selling; there are risks associated with selling short, including the risk that the Long/Short Fund may have to cover its short position at a higher price than the short sale, resulting in a loss. The Long/Short Fund’s loss on a short sale is potentially unlimited as a loss occurs when the value of a security sold short increases. The Risk-Managed Balanced Fund invests in call options; selling/writing call options involves certain risks, such as limited gains and lack of liquidity of the underlying securities, and is not suitable for all investors. Investments in foreign securities and currency transactions may involve certain considerations and risks not typically associated with those of U.S. dollar-denominated transactions as a result of, among other factors, the possibility of lower government supervision and regulation of foreign securities markets and the possibility of political or economic instability. Financial statements of foreign companies are governed by different accounting, auditing, and financial standards than U.S. companies and may be less transparent and uniform than in the United States. Many corporate governance standards, which help ensure the integrity of public information in the United States, may not exist in some foreign countries. In general, there may be less governmental supervision of foreign stock exchanges and securities brokers and issuers. There are also risks associated with small- and mid-cap investing, including limited product lines, less liquidity and small market share.
The ICON Fund and ICON Long/Short Fund have significant weights in the Industrials sector and the Consumer Discretionary sector which may cause the Fund’s performance to be susceptible to the economic, business and/or other developments that may affect those sectors.
The Opportunities Fund may have a significant concentration of risk as one Shareholder who is a related party to the Fund, owns 29.5% percent of the net assets of the Fund. Such concentration of Shareholders’ interests could have a material effect on the Fund in the event this Shareholder requests to redeem substantial amounts of capital at the same time.
In the normal course of business, the Funds may enter into various agreements that provide for general indemnifications. Each Fund’s maximum exposure under these arrangements is unknown as any potential exposure involving future claims that may be made against each Fund is unknown. However, based on experience, the Funds expect the risk of loss to be remote.
| NOTESTO FINANCIAL STATEMENTS | 71 |
Table of Contents
NOTESTO FINANCIAL STATEMENTS (CONTINUED)
2. Significant Accounting Policies
The following is a summary of significant accounting policies consistently followed by the Funds in the preparation of their financial statements. The preparation of financial statements in conformity with accounting principles generally accepted in the United States of America requires management to make certain estimates and assumptions that affect the reported amounts of assets and liabilities, disclosure of contingent assets and liabilities at the date of the financial statements, and the reported amounts of income and expenses during the reporting period. Actual results may differ from these estimates.
Investment Valuation
The Funds’ securities and other assets, excluding options on securities indexes, are valued at the closing price as of the close of regular trading on the New York Stock Exchange (the “NYSE”) (normally 4 p.m. Eastern Standard Time) each day the NYSE is open, except that securities traded primarily on the NASDAQ Stock Market (“NASDAQ”) are normally valued by the Funds at the NASDAQ Official Closing Price provided by NASDAQ each business day. Options on securities indexes are valued at the close of the Chicago Board Options Exchange (normally 4:15 p.m. Eastern Standard Time) on each day the New York Stock Exchange is open for trading.
The Funds use pricing services to obtain the market value of securities in their portfolios; if a pricing service is not able to provide a price, or the pricing service’s valuation is considered inaccurate or does not in the Funds’ judgment reflect the market value of the security, prices may be obtained through market quotations from independent broker/dealers. If market quotations from these sources are not readily available, the Funds’ securities or other assets are valued at fair value as determined in good faith by the Funds’ Board of Trustees (“Board”) or pursuant to procedures approved by the Board.
Lacking any sales that day, a security is valued at the current closing bid price (or yield equivalent thereof) or based on quotes obtained from dealers making a market for the security. Options are valued at their closing mid-price on the market with the most volume. Mid-price is the average of the closing bid and closing ask prices. Debt securities with a remaining maturity of greater than 60 days are valued using the evaluated bid price supplied by the pricing service. The evaluated bid price supplied by the pricing service is based upon a matrix valuation system which considers such factors as security prices, yields, maturities and ratings. Short-term debt securities
| 72 | NOTESTO FINANCIAL STATEMENTS |
Table of Contents
with remaining maturities of 60 days or less are generally valued at amortized cost or original cost plus accrued interest, which approximates market value. Currency rates as of the close of the NYSE are used to convert foreign security values into U.S. dollars.
Securities of investment companies that trade on an exchange are valued at the last sales price or official closing price as of the close of the customary trading session on the exchange where the security is principally traded. Investments in shares of funds that are not traded on an exchange are valued at the end of day net asset value per share of such fund. Securities in the underlying funds, including restricted securities, are valued in accordance with the valuation policy of such fund.
The Funds’ securities traded in countries outside of the Western Hemisphere are fair valued daily by utilizing the quotations of an independent pricing service, unless the Board determines that use of another valuation methodology is appropriate. The purposes of daily fair valuation are to avoid stale prices and to take into account, among other things, any significant events occurring after the close of foreign markets. The pricing service uses statistical analyses and quantitative models to adjust local market prices using factors such as subsequent movements and changes in the prices of indexes, securities and exchange rates in other markets to determine fair value as of the time a Fund calculates its net asset value (“NAV”). The valuation assigned to fair-value securities for purposes of calculating a Fund’s NAV may differ from the security’s most recent closing market price and from the prices used by other mutual funds to calculate their NAVs.
Various inputs are used to determine the value of the Funds’ investments. These inputs are summarized in the three broad levels listed below:
Level 1 — quoted prices in active markets for identical securities.
Level 2 — significant observable inputs other than Level 1 quoted prices (including, but not limited to, quoted prices for similar securities, interest rates, prepayment speeds, and credit risk).
Level 3 — significant unobservable inputs.
Observable inputs are those based on market data obtained from sources independent of the Funds, and unobservable inputs reflect the Funds’ own assumptions based on the best information available. The input levels are not necessarily an indication of the risk or liquidity associated with investments at that level. For example, non-U.S. equity securities actively
| NOTESTO FINANCIAL STATEMENTS | 73 |
Table of Contents
NOTESTO FINANCIAL STATEMENTS (CONTINUED)
traded in foreign markets may be reflected in Level 2 despite the availability of closing prices, because the Funds evaluate and determine whether those closing prices reflect fair value at the close of the NYSE or require adjustment, as described above. The following table summarizes the Funds’ investments, based on the inputs used to determine their values on September 30, 2013:
| Level 1 | Level 2 | Total | ||||||||||
ICON Bond Fund* | ||||||||||||
Assets | ||||||||||||
Corporate Bonds | $ | - | $ | 60,202,272 | $ | 60,202,272 | ||||||
U.S. Treasury Obligations | - | 16,073,204 | 16,073,204 | |||||||||
Foreign Corporate Bonds | - | 5,736,843 | 5,736,843 | |||||||||
Closed-End Mutual Funds | 9,213,779 | - | 9,213,779 | |||||||||
Preferred Stocks | 1,021,615 | - | 1,021,615 | |||||||||
Collateral for Securities on Loan | - | 7,297,402 | 7,297,402 | |||||||||
Short-Term Investments | - | 7,524,839 | 7,524,839 | |||||||||
|
|
|
|
|
| |||||||
Total | $ | 10,235,394 | $ | 96,834,560 | $ | 107,069,954 | ||||||
|
|
|
|
|
| |||||||
ICON Equity Income Fund* | ||||||||||||
Assets | ||||||||||||
Common Stocks | $ | 18,583,055 | $ | - | $ | 18,583,055 | ||||||
Preferred Stocks | 661,932 | - | 661,932 | |||||||||
Convertible Preferred Stocks | 1,068,839 | - | 1,068,839 | |||||||||
Corporate Bonds | - | 1,264,669 | 1,264,669 | |||||||||
Foreign Corporate Bonds | - | 265,625 | 265,625 | |||||||||
Exchange Traded Funds | 771,816 | - | 771,816 | |||||||||
Closed-End Mutual Fund | 231,480 | - | 231,480 | |||||||||
Collateral for Securities on Loan | - | 2,389,304 | 2,389,304 | |||||||||
Short-Term Investments | - | 510,943 | 510,943 | |||||||||
|
|
|
|
|
| |||||||
Total | $ | 21,317,122 | $ | 4,430,541 | $ | 25,747,663 | ||||||
|
|
|
|
|
| |||||||
ICON Fund* | ||||||||||||
Assets | ||||||||||||
Common Stocks | $ | 32,642,637 | $ | - | $ | 32,642,637 | ||||||
Collateral for Securities on Loan | - | 2,293,511 | 2,293,511 | |||||||||
Short-Term Investments | - | 2,221,417 | 2,221,417 | |||||||||
|
|
|
|
|
| |||||||
Total | $ | 32,642,637 | $ | 4,514,928 | $ | 37,157,565 | ||||||
|
|
|
|
|
| |||||||
| 74 | NOTESTO FINANCIAL STATEMENTS |
Table of Contents
| Level 1 | Level 2 | Total | ||||||||||
ICON Long/Short Fund* | ||||||||||||
Assets | ||||||||||||
Common Stocks | $ | 17,373,116 | $ | - | $ | 17,373,116 | ||||||
Collateral for Securities on Loan | - | 1,645,210 | 1,645,210 | |||||||||
Short-Term Investments | - | 1,743,476 | 1,743,476 | |||||||||
|
|
|
|
|
| |||||||
Total | $ | 17,373,116 | $ | 3,388,686 | $ | 20,761,802 | ||||||
|
|
|
|
|
| |||||||
Liabilities | ||||||||||||
Securities Sold Short | ||||||||||||
Common Stock | $ | (1,459,861 | ) | $ | - | $ | (1,459,861 | ) | ||||
|
|
|
|
|
| |||||||
Total | $ | (1,459,861 | ) | $ | - | $ | (1,459,861 | ) | ||||
|
|
|
|
|
| |||||||
ICON Opportunities Fund* | ||||||||||||
Assets | ||||||||||||
Common Stocks | $ | 361,971 | $ | - | $ | 361,971 | ||||||
Short-Term Investments | - | 78,901 | 78,901 | |||||||||
|
|
|
|
|
| |||||||
Total | $ | 361,971 | $ | 78,901 | $ | 440,872 | ||||||
|
|
|
|
|
| |||||||
ICON Risk-Managed Balanced Fund* |
| |||||||||||
Assets | ||||||||||||
Common Stocks | $ | 29,948,520 | $ | - | $ | 29,948,520 | ||||||
Corporate Bonds | - | 18,670,703 | 18,670,703 | |||||||||
U.S. Treasury Obligations | - | 3,963,926 | 3,963,926 | |||||||||
Foreign Corporate Bonds | - | 1,100,746 | 1,100,746 | |||||||||
Closed-End Mutual Funds | 1,294,491 | - | 1,294,491 | |||||||||
Put Options Purchased | 230,275 | - | 230,275 | |||||||||
Collateral for Securities on Loan | - | 2,371,613 | 2,371,613 | |||||||||
Short-Term Investments | - | 1,339,241 | 1,339,241 | |||||||||
|
|
|
|
|
| |||||||
Total | $ | 31,473,286 | $ | 27,446,229 | $ | 58,919,515 | ||||||
|
|
|
|
|
| |||||||
Liabilities | ||||||||||||
Written Call Options | $ | (102,675 | ) | $ | - | $ | (102,675 | ) | ||||
|
|
|
|
|
| |||||||
Total | $ | (102,675 | ) | $ | - | $ | (102,675 | ) | ||||
|
|
|
|
|
| |||||||
| * | Please refer to the Schedule of Investments and the Sector/Industry Classification and Credit Diversification tables for additional security details. |
No Level 3 securities were held in any of the Funds at September 30, 2013.
For the year ended September 30, 2013, there was no transfer activity between Level 1 and Level 2. The end of year timing recognition is used for transfers between levels of the Fund’s assets and liabilities.
| NOTESTO FINANCIAL STATEMENTS | 75 |
Table of Contents
NOTESTO FINANCIAL STATEMENTS (CONTINUED)
Fund Share Valuation
Fund shares are sold and redeemed on a daily basis at net asset value. Net asset value per share is determined daily as of the close of trading on the NYSE on each day the NYSE is open for trading by dividing the total value of the Fund’s investments and other assets, less liabilities, by the number of Fund shares outstanding.
Foreign Currency Translation
The accounting records of the Funds are maintained in U.S. dollars. Investment securities and other assets and liabilities denominated in a foreign currency are translated daily into U.S. dollars at the prevailing rates of exchange. Income and expenses are translated into U.S. dollars at the prevailing exchange rate on the respective dates of the transactions. Purchases and sales of securities are translated into U.S. dollars at the contractual currency exchange rates established at the time of each trade.
The Funds do not isolate that portion of the results of operations resulting from changes in foreign exchange rates on investments from the fluctuations arising from changes in market prices of securities held. Net unrealized appreciation or depreciation on investments and foreign currency translations arise from changes in the value of assets and liabilities, resulting from changes in the exchange rates and changes in market prices of securities held.
Options Transactions
The Funds’ use of derivatives for the year ended September 30, 2013 was limited to purchased and written options.
The Risk-Managed Balanced Fund’s primary investment strategy involves the use of options. Each of the other Funds may also purchase and/or write (sell) call and put options on any security in which it may invest. The Funds utilize options to hedge against changes in market conditions or to provide market exposure while trying to reduce transaction costs.
Option contracts involve market risk and liquidity risk and can be highly volatile. Should prices of securities or securities indexes move in an unexpected manner, the Funds may not achieve the desired benefits and may realize losses and thus be in a worse position than if such strategies had not been utilized.
When a Fund writes a put or call option, an amount equal to the premium received is included on the Statement of Assets and Liabilities as a liability.
| 76 | NOTESTO FINANCIAL STATEMENTS |
Table of Contents
The amount of the liability is subsequently marked-to-market to reflect the current market value of the option. If an option expires on its stipulated expiration date or if the Fund enters into a closing purchase transaction, a gain or loss is realized. If a written call option on an individual security is exercised, a gain or loss is realized for the sale of the underlying security, and the proceeds from the sale are increased by the premium originally received. If a written call option on a securities index is exercised, a gain or loss is realized as determined as determined by the premium originally received, the exercise price and the market value of the index. If a written put option on an individual security is exercised, the cost of the security acquired is decreased by the premium originally received. As a writer of an option, a Fund bears the market risk of an unfavorable change in the price of the individual security or securities index underlying the written option. Additionally, written call options may involve the risk of limited gains.
Each Fund may also purchase put and call options. When a Fund purchases a put or call option, an amount equal to the premium paid is included on the Fund’s Statement of Assets and Liabilities as an investment, and is subsequently marked-to-market to reflect the current market value of the option. If an option expires on the stipulated expiration date or if the Fund enters into a closing purchase or sale transaction, a gain or loss is realized. If the Fund exercises a call option on an individual security, the cost of the security acquired is increased by the premium paid for the call. If the Fund exercises a put option on an individual security, a gain or loss is realized from the sale of the underlying security, and the proceeds from such a sale are decreased by the premium originally paid. If the Fund exercises a put or a call option on a security index, a gain or loss is realized as determined by the premium originally paid, the exercise price and the market value of the index. Written and purchased options are non-income producing securities.
As of September 30, 2013, the Equity Income Fund had closed out of purchased call option transactions and the Risk-Managed Balanced Fund engaged in written call and purchased put options transactions. All open option contracts are included on each Fund’s Schedule of Investments.
The Risk-Managed Balanced Fund’s written options are collateralized by cash and/or securities held in a segregated account at the Fund’s custodian. The securities pledged as collateral are included on the Schedule of Investments. Such collateral is restricted from the Fund’s use. The cash collateral held for the prime broker and/or borrowings from the prime broker are included on the Statement of Assets and Liabilities.
| NOTESTO FINANCIAL STATEMENTS | 77 |
Table of Contents
NOTESTO FINANCIAL STATEMENTS (CONTINUED)
The number of options contracts written and the premiums received by the Risk-Managed Balanced Fund during the year ended September 30, 2013, were as follows:
| Risk-Managed Balanced Fund | ||||||||
| Number of Contracts | Premiums Received | |||||||
Options outstanding, beginning of period | 8 | $ | 13,806 | |||||
Options written during period | 289 | 629,287 | ||||||
Options closed during period | (222 | ) | (467,546 | ) | ||||
|
|
|
| |||||
Options outstanding, end of period | 75 | $ | 175,547 | |||||
|
|
|
| |||||
The following is a summary of how these derivatives are treated in the financial statements and their impact on the Funds:
Fair Values of Derivative Instruments as of September 30, 2013
Asset Derivatives | Liability Derivatives | |||||||||||
Derivatives not accounted for as hedging instruments | Statement of Assets and Liabilities Location | Fair Value | Statement of Assets and Liabilities Location | Fair Value | ||||||||
Purchased option contracts | ||||||||||||
Equity risk | ||||||||||||
ICON Risk-Managed Balanced Fund | Investments, at value | $ | 230,275 | . | ||||||||
Written option contracts | ||||||||||||
Equity risk | ||||||||||||
ICON Risk-Managed Balanced Fund | Options written, at value | $ | 102,675 | |||||||||
Amount of Realized Gain or (Loss) on Derivatives Recognized in Operations
| Derivatives not accounted for as hedging instruments | Location of Gain/(Loss) on Derivatives | Amount | ||||
Purchased option contracts | ||||||
Equity risk | ||||||
ICON Equity Income Fund | Net realized gain/(loss) from | $ | 31,797 | |||
ICON Risk-Managed Balanced Fund | Investment transactions | (309,533 | ) | |||
Written option contracts | ||||||
Equity risk | ||||||
ICON Risk-Managed Balanced Fund | Net realized gain/(loss) from written option transactions | $ | (39,556 | ) | ||
| 78 | NOTESTO FINANCIAL STATEMENTS |
Table of Contents
Change in Unrealized Appreciation/(Depreciation) on Derivatives Recognized in Operations
| Derivatives not accounted for as hedging instruments | Location of Gain/(Loss) on Derivatives | Amount | ||||
Purchased option contracts | ||||||
Equity risk | ||||||
ICON Equity Income Fund | Change in unrealized net | $ | (52,527 | ) | ||
ICON Risk-Managed Balanced Fund | appreciation/(depreciation) on investments | (82,731 | ) | |||
Written option contracts | ||||||
Equity risk | ||||||
ICON Risk-Managed Balanced Fund | Change in unrealized net appreciation/(depreciation) on written options | $ | 66,746 | |||
For the year ended September 30, 2013, the Fund’s quarterly holdings of options contracts were as follows:
| ICON Equity Income Fund | ICON Risk- Managed Balanced Fund | ICON Risk- Managed Balanced Fund | ||||||||||
| Quarter Ended | Number of Purchased Options Contracts Outstanding | Number of Written Options Contracts Outstanding | ||||||||||
December 31, 2012 | 332 | 25 | - | |||||||||
March 31, 2013 | 307 | 40 | 25 | |||||||||
June 30, 2013 | 107 | 28 | 15 | |||||||||
September 30, 2013 | - | 275 | 75 | |||||||||
The Funds value derivatives at fair value, as described above, and recognize changes in fair value currently in the results of operations. Accordingly, the Funds do not follow hedge accounting, even for derivatives employed as economic hedges.
Short Sales
The Long/Short Fund may engage in short sales (selling securities it does not own) as part of its normal investment activities. The Long/Short Fund enters into short positions in equity securities identified as being overvalued in management’s opinion.
Short sales involve market risk. If a security sold short increases in price, the Long/Short Fund may have to cover its short position at a higher price than
| NOTESTO FINANCIAL STATEMENTS | 79 |
Table of Contents
NOTESTO FINANCIAL STATEMENTS (CONTINUED)
the short sale price, resulting in a loss. These short sales are collateralized by cash and/or securities held with the Fund’s prime broker and in a segregated account at the Fund’s custodian. The collateral required is determined daily by reference to the market value of the short positions. Such collateral for the Fund is restricted from use. The cash collateral that is restricted from use is included on the Statement of Assets and Liabilities as “Deposits for short sales.” The securities pledged as collateral that are restricted from use are included on the Schedule of Investments. Dividends received on short sales are treated as an expense on the Statement of Operations. Liabilities for securities sold short are closed out by purchasing the applicable securities for delivery to the Fund’s prime broker. As of September 30, 2013, the Long/Short Fund engaged in short selling. The short positions are included in the Schedule of Securities Sold Short on the Schedule of Investments.
Securities Lending
Under procedures adopted by the Board, the Funds may lend securities to certain approved brokers, dealers and other financial institutions to earn additional income. The Funds retain certain benefits of owning the securities, including receipt of dividends or interest generated by the security, but give up other rights including the right to vote proxies. The Funds retain the ability to recall the loans at any time and could do so in order to vote proxies or to sell the loaned securities. Each loan is collateralized by cash that generally exceeds the value of the securities on loan. The market value of the loaned securities is determined daily at the close of business of the Funds and any additional required collateral is delivered to each Fund on the next business day.
Generally, in the event of borrower default, the Funds have the right to use the collateral to offset any losses incurred. In the event the Funds are delayed or prevented from exercising their rights to dispose of the collateral, there may be a potential loss to the Funds. Some of these losses may be indemnified by the lending agent.
The Funds have elected to invest the cash collateral in the State Street Navigator Prime Portfolio which is disclosed on the Schedule of Investments. The Funds bear the risk of loss with respect to the investment of collateral. The net securities lending income earned by the Funds for the year ended September 30, 2013, is included in the Statement of Operations.
| 80 | NOTESTO FINANCIAL STATEMENTS |
Table of Contents
For the year ended September 30, 2013, the following Funds had securities with the following values on loan:
| Fund | Loaned Securities | Collateral | ||||||
ICON Bond Fund | $ | 7,019,319 | $ | 7,297,402 | ||||
ICON Equity Income Fund | 2,316,113 | 2,389,304 | ||||||
ICON Fund | 2,264,031 | 2,293,511 | ||||||
ICON Long/Short Fund | 1,607,757 | 1,645,210 | ||||||
ICON Risk-Managed Balanced Fund | 2,280,609 | 2,371,613 | ||||||
The value of the collateral above could include collateral held for securities that were sold on or before September 30, 2013. It may also include collateral received from the pre-funding of security loans.
Income Taxes, Dividends, and Distributions
The Funds intend to continue to qualify as regulated investment companies under Subchapter M of the Internal Revenue Code and, accordingly, the Funds will generally not be subject to federal and state income taxes or federal excise taxes to the extent that they intend to make sufficient distributions of net investment income and net realized capital gains.
Dividends paid by the Funds from net investment income and distributions of net realized short-term gains are, for federal income tax purposes, taxable as ordinary income to shareholders.
Dividends and distributions to shareholders are recorded by the Funds on the ex-dividend/distribution date. The Bond Fund distributes net investment income, if any, to shareholders monthly. The Equity Income Fund and the Risk-Managed Balanced Fund intend to distribute net investment income, if any, to shareholders quarterly. The other Funds distribute income, if any, annually. The Funds distribute net realized capital gains, if any, to shareholders at least annually, if not offset by capital loss carryforwards. The Funds may utilize equalization accounting for tax purposes and designate earnings and profits, including net realized gains distributed to shareholders on redemption of shares, as part of the dividends paid deduction for income tax purposes. Income distributions and capital gain distributions are determined in accordance with income tax regulations, which may differ from accounting principles generally accepted in the United States of America.
Management has analyzed the Funds’ tax positions taken on federal income tax returns for all open tax periods and has concluded that no provision for federal income tax is required in the Funds’ financial statements.
| NOTESTO FINANCIAL STATEMENTS | 81 |
Table of Contents
NOTESTO FINANCIAL STATEMENTS (CONTINUED)
The Funds file U.S. tax returns. While the statute of limitations remains open to examine the Funds’ U.S. tax returns filed for the past three years, no examinations are in progress or anticipated at this time. The Funds are not aware of any tax positions for which it is reasonably possible that the total amounts of unrecognized tax benefits will significantly change in the next twelve months.
Certain foreign countries impose a capital gains tax which is accrued by the Funds based on the unrealized appreciation, if any, on affected securities. Any accrual would reduce a Fund’s NAV. The tax is paid when the gain is realized.
Investment Income
Dividend income is recorded on the ex-dividend date. Non-cash dividends included in dividend income, if any, are recorded at the fair value of the securities received. Interest income is accrued as earned. Certain dividends from foreign securities are recorded as soon as the Funds are informed of the dividend if such information is obtained subsequent to the ex-dividend date. Discounts and premiums on fixed income securities purchased are accreted or amortized to income over the life of the respective securities.
Investment Transactions
Security transactions are accounted for no later than one business day after the trade date. However, for financial reporting purposes, security transactions are accounted for on the trade date. Gains and losses on securities sold are determined on the basis of identified cost.
Allocation of Expenses
Each class of a Fund’s shares bears expenses incurred specifically on its behalf and, in addition, each class bears a portion of general expenses, based upon relative net assets of each class. Expenses which cannot be directly attributed to a specific Fund in the Trust are apportioned between all Funds in the Trust based upon relative net assets. In calculating the net asset value per share of each class, investment income, realized and unrealized gains and losses and expenses other than class-specific expenses are allocated daily to each class of shares based upon the proportion of net assets.
| 82 | NOTESTO FINANCIAL STATEMENTS |
Table of Contents
Below are the class level expenses that are included on the Statement of Operations:
| Fund | Legal Expense | Printing and Postage Expense | Transfer Agent Expense | |||||||||
ICON Bond Fund | ||||||||||||
Class S | $ | 5,874 | $ | 20,120 | $ | 57,264 | ||||||
Class C | 305 | 1,426 | 8,265 | |||||||||
Class A | 686 | 2,766 | 19,476 | |||||||||
ICON Equity Income Fund | ||||||||||||
Class S | 287 | 3,709 | 16,204 | |||||||||
Class C | 304 | 2,195 | 9,950 | |||||||||
Class A | 654 | 4,793 | 25,345 | |||||||||
ICON Fund | ||||||||||||
Class S | 1,024 | 7,203 | 16,923 | |||||||||
Class C | 958 | 7,046 | 42,203 | |||||||||
Class A | 688 | 4,477 | 26,087 | |||||||||
ICON Long/Short Fund | ||||||||||||
Class S | 377 | 1,369 | 8,479 | |||||||||
Class C | 654 | 2,649 | 14,397 | |||||||||
Class A | 1,410 | 9,301 | 30,123 | |||||||||
ICON Risk-Managed Balanced Fund | ||||||||||||
Class S | 1,542 | 8,193 | 21,127 | |||||||||
Class C | 454 | 1,441 | 6,360 | |||||||||
Class A | 706 | 2,350 | 14,685 | |||||||||
3. Fees and Other Transactions with Affiliates
Investment Advisory Fees
ICON Advisers, Inc. (“ICON Advisers”) serves as investment adviser to the Funds and is responsible for managing the Funds’ portfolios of securities. ICON Advisers receives a monthly management fee that is computed daily at an annual rate of 0.60% of average daily net assets of the Bond Fund, 0.75% of average daily net assets of the Equity Income Fund, ICON Fund, Opportunities Fund and Risk-Managed Balanced Fund, and 0.85% of average daily net assets of the Long/Short Fund.
| NOTESTO FINANCIAL STATEMENTS | 83 |
Table of Contents
NOTESTO FINANCIAL STATEMENTS (CONTINUED)
ICON Advisers has contractually agreed to limit the Funds’ expenses (exclusive of brokerage, interest, taxes, dividends on short sales and extraordinary expenses) to the extent necessary to ensure that the Funds’ expenses do not exceed the following amounts:
| Fund | Fund | Class S | Class C | Class A | ||||||||||||
ICON Bond Fund | - | 0.75% | 1.60% | 1.00% | ||||||||||||
ICON Equity Income Fund | - | 1.20% | 2.20% | 1.45% | ||||||||||||
ICON Fund | - | 1.25% | 2.25% | 1.50% | ||||||||||||
ICON Long/Short Fund | - | 1.25% | 2.30% | 1.55% | ||||||||||||
ICON Opportunities Fund | 1.50% | - | - | - | ||||||||||||
ICON Risk-Managed Balanced Fund | - | 1.20% | 2.20% | 1.45% | ||||||||||||
The Funds’ expense limitations, excluding the Bond Fund Class A, all classes of the ICON Fund and the Opportunities Fund, will continue in effect until at least January 31, 2021. Limitations for the Bond Fund Class A, all classes of the ICON Fund and the Opportunities Fund will continue in effect until at least January 31, 2014. To the extent ICON Advisers reimburses or absorbs fees and expenses, it may seek payment of such amounts for up to three years after the expenses were reimbursed or absorbed. A Fund will make no such payment, however, if the total Fund operating expenses exceed the expense limits in effect at the time the expenses were reimbursed or at the time these payments are proposed.
As of September 30, 2013 the following amounts were still available for recoupment by ICON Advisers based upon their potential expiration dates:
| Fund | 2014 | 2015 | 2016 | |||||||||
ICON Bond Fund | $ | 26,738 | $ | 132,550 | $ | 148,484 | ||||||
ICON Equity Income Fund | 17,561 | 58,289 | 52,885 | |||||||||
ICON Fund | - | 5,203 | 19,298 | |||||||||
ICON Long/Short Fund | 37,402 | 70,576 | 56,161 | |||||||||
ICON Opportunities Fund | - | - | 36,360 | |||||||||
ICON Risk-Managed Balanced Fund | 18,447 | 81,098 | 66,142 | |||||||||
Accounting, Custody and Transfer Agent Fees
State Street Bank and Trust Company (“State Street”) serves as the fund accounting agent for the Funds. For its services, the Trust pays State Street a fee that is calculated daily and paid monthly at an annual rate based on the aggregate average daily net assets of the Trust.
| 84 | NOTESTO FINANCIAL STATEMENTS |
Table of Contents
State Street is the custodian of the Trust’s investments. For its services, the Trust pays State Street asset-based fees that vary according to the number of positions and transactions, plus out-of-pocket expenses.
Boston Financial Data Services, Inc. (“BFDS”) is the Trust’s transfer agent. For these services, the Trust pays a per account fee, plus certain other transaction Cusip charges and out-of-pocket expenses. BFDS may pay each Fund transfer agent earnings credits. Transfer agent earnings credits are credits received for interest which results from overnight balances used by BFDS for clearing shareholder transactions.
Administrative Services
The Trust has entered into an administrative services agreement with ICON Advisers pursuant to which ICON Advisers oversees the administration of the Trust’s business and affairs. This agreement provides for an annual fee of 0.05% on the Trust’s first $1.5 billion of average daily net assets, 0.045% on the next $1.5 billion of average daily net assets, 0.040% on the next $2 billion of average daily net assets and 0.030% on average daily net assets over $5 billion. For the year ended September 30, 2013, each Fund’s payment for administrative services to ICON Advisers is included on the Statement of Operations. The administrative services agreement provides that ICON Advisers will not be liable for any error of judgment, mistake of law, or any loss suffered by the Trust in connection with matters to which the administrative services agreement relates, except for a loss resulting from willful misfeasance, bad faith or negligence by ICON Advisers in the performance of its duties.
ICON Advisers has a sub-administration agreement under which State Street assists ICON Advisers with the administration and business affairs of the Trust. For its services, ICON Advisers pays State Street a fee that is calculated daily and paid monthly at an annual rate based on the aggregate average daily net assets of the Trust.
Distribution Fees
The Funds have adopted a Distribution Plan pursuant to Rule 12b-1 under the 1940 Act (“12b-1 Plan”) under which the Funds are authorized to compensate the Funds’ distributor, ICON Distributors, Inc. (“IDI”) (an affiliate of the adviser) for the sale and distribution of shares and for other shareholder services. Under the 12b-1 Plan, Bond Fund Class C shareholders pay an annual distribution and service fee of 0.85% of average daily net
| NOTESTO FINANCIAL STATEMENTS | 85 |
Table of Contents
NOTESTO FINANCIAL STATEMENTS (CONTINUED)
assets and Class A shareholders pay an annual distribution and service fee of 0.25% of average daily net assets. The shareholders of the other Funds pay an annual distribution and service fee of 1.00% of average daily net assets for Class C shares and an annual distribution and service fee of 0.25% of average daily net assets for Class A shares. There is no annual distribution and service fee for Class S shares. The total amount paid under the 12b-1 plans by the Funds is shown on the Statement of Operations.
Other Related Parties
Certain Officers and Directors of ICON Advisers are also Officers and Trustees of the Funds; however, such Officers and Trustees (with the exception of the Chief Compliance Officer, “CCO”) receive no compensation from the Funds. The Trust paid $120,000 of the CCO’s salary and the remaining portion is paid by ICON Advisers. For the year ended September 30, 2013, the total related amounts paid by the Funds under this arrangement are included in Other Expenses on the Statement of Operations.
The Fund may reimburse ICON Advisers for legal work performed for the Fund by its attorneys outside of the advisory and administration contracts. The Board of Trustees reviews and approves such reimbursements. For the year ended September 30, 2013, the total related amounts paid by the Funds under this arrangement are included in Other Expenses on the Statement of Operations.
4. Borrowings
The Trust has entered into Lines of Credit agreements/arrangements with State Street to provide temporary funding for redemption requests. The maximum borrowing is limited to $150 million. Effective March 25, 2013, interest on domestic borrowings is charged at a rate quoted and determined by State Street. Prior to March 25, 2013, interest on domestic borrowings was charged at the higher of the Federal Funds Rate effective on that day and the Overnight LIBOR Rate effective on that day plus 1.25%. The Risk-Managed Balanced and Long/Short Funds may also have borrowings with the prime broker as a result of brokerage requirements. Interest on domestic borrowing with the prime broker is charged at the Federal Funds rate plus 0.50%.
| 86 | NOTESTO FINANCIAL STATEMENTS |
Table of Contents
For the year ended September 30, 2013 the average outstanding loan by Fund was as follows:
| Fund* | Average Borrowing (10/1/12-9/30/13) | Average Interest Rates (10/1/12-9/30/13) | ||||||
ICON Bond Fund | $ | 3,835 | 1.38 | % | ||||
ICON Equity Income Fund | 35,097 | 1.38 | ||||||
ICON Fund | 338,459 | 1.38 | ||||||
ICON Long/Short Fund | 216,419 | 2.02 | ||||||
ICON Risk-Managed Balanced Fund | 230,980 | 2.02 | ||||||
| * | There were no outstanding borrowings under these agreements/arrangements as of September 30, 2013. |
5. Purchases and Sales of Investment Securities
For the year ended September 30, 2013, the aggregate cost of purchases and proceeds from sales of investment securities (excluding securities sold short, short-term securities and written options contracts) was as follows:
| Fund | Purchases of Securities | Proceeds from Sales of | Purchases of Long Term U.S. Government Obligations | Proceeds from Sales of | ||||||||||||
ICON Bond Fund | $ | 71,451,526 | $ | 64,612,915 | $ | 19,517,301 | $ | 17,468,086 | ||||||||
ICON Equity Income Fund | 34,956,204 | 37,562,883 | 584,187 | 568,438 | ||||||||||||
ICON Fund | 13,488,827 | 42,884,727 | - | - | ||||||||||||
ICON Long/Short Fund | 6,771,634 | 18,132,434 | - | - | ||||||||||||
ICON Opportunities Fund | 435,506 | 169,530 | - | - | ||||||||||||
ICON Risk-Managed Balanced Fund | 54,750,242 | 18,627,954 | 5,067,883 | 1,055,281 | ||||||||||||
6. Federal Income Tax
Income and capital gain distributions are determined in accordance with income tax regulations that may differ from accounting principles that are generally accepted in the United States of America. These differences are due to differing treatments for items such as deferrals of wash sale losses, foreign currency transactions, and net investment losses.
Under the Regulated Investment Company Modernization Act of 2010 (the “Act”) capital losses generated by a fund may be carried over indefinitely, but these losses must be used prior to the utilization of any pre-enactment
| NOTESTO FINANCIAL STATEMENTS | 87 |
Table of Contents
NOTESTO FINANCIAL STATEMENTS (CONTINUED)
capital losses. Since pre-enactment capital losses may only be carried forward for eight years, there may be a greater likelihood that all or a portion of each fund’s pre-enactment capital losses will expire unused.
For the year ended September 30, 2013 the following Funds had capital loss carryforwards:
| Fund | Amounts | Expires | ||||||
ICON Equity Income Fund | $ | 4,956,525 | 2017 | |||||
| 19,089,764 | 2018 | |||||||
ICON Fund | 10,507,549 | 2017 | ||||||
| 19,833,424 | 2018 | |||||||
ICON Long/Short Fund | 40,303,357 | 2017 | ||||||
| 19,325,857 | 2018 | |||||||
ICON Risk-Managed Balanced Fund | 2,850,243 | 2017 | ||||||
| 14,212,596 | 2018 | |||||||
Future capital loss carryforward utilization in any given year may be limited if there are substantial shareholder redemptions or contributions. During the year ended September 30, 2013 the following Funds utilized capital loss carryforwards:
| Fund | Amount | |||
ICON Equity Income Fund | $ | 3,363,245 | ||
ICON Fund | 10,346,842 | |||
ICON Long/Short Fund | 2,879,691 | |||
ICON Risk-Managed Balanced Fund | 2,452,435 | |||
The tax characteristics of distributions paid to shareholders during the fiscal year ended September 30, 2013, were as follows:
| Distributions Paid from | ||||||||||||
| Fund | Ordinary Income | Net Long- Term Gains | Total Distributions | |||||||||
ICON Bond Fund | $ | 2,021,727 | $ | 2,430,466 | $ | 4,452,193 | ||||||
ICON Equity Income Fund | 760,222 | - | 760,222 | |||||||||
ICON Fund | 169,811 | - | 169,811 | |||||||||
ICON Risk-Managed Balanced Fund | 289,470 | - | 289,470 | |||||||||
| 88 | NOTESTO FINANCIAL STATEMENTS |
Table of Contents
The tax characteristics of distributions paid to shareholders during the fiscal year ended September 30, 2012, were as follows:
| Distributions Paid from | ||||||||||||
| Fund | Ordinary Income | Net Long- Term Gains | Total Distributions | |||||||||
ICON Bond Fund | $ | 3,733,785 | $ | 1,945,591 | $ | 5,679,376 | ||||||
ICON Equity Income Fund | 1,263,680 | - | 1,263,680 | |||||||||
ICON Fund | 161,444 | - | 161,444 | |||||||||
ICON Risk-Managed Balanced Fund | 160,368 | - | 160,368 | |||||||||
As of September 30, 2013, the components of accumulated earnings/(deficit) on a tax basis were as follows:
| Fund | Undistributed Ordinary Income | Undistributed Term-Gains | Late Year Loss | Capital Loss Carryover | Accumulated Capital and Other Losses | Unrealized Appreciation/ (Depreciation)* | Total Accumulated (Deficit) | |||||||||||||||||||||
ICON Bond Fund | $ | - | $ | 1,339,433 | $ | - | $ | - | $ | - | $ | 603,568 | $ | 1,943,001 | ||||||||||||||
ICON Equity Income Fund | - | - | - | (24,046,289 | ) | - | 762,053 | (23,284,236 | ) | |||||||||||||||||||
ICON Fund | - | - | (280,846 | ) | (30,340,973 | ) | - | 11,471,995 | (19,149,824 | ) | ||||||||||||||||||
ICON Long/Short Fund | - | - | (81,756 | ) | (59,629,214 | ) | - | 3,732,318 | (55,978,652 | ) | ||||||||||||||||||
ICON Opportunities Fund | 20,853 | - | - | - | - | 74,961 | 95,814 | |||||||||||||||||||||
ICON Risk-Managed Balanced Fund | - | - | - | (17,062,839 | ) | - | 1,074,172 | (15,988,667 | ) | |||||||||||||||||||
| * | Differences between the book-basis and tax-basis unrealized appreciation/(depreciation) are attributable primarily to tax deferral of losses on wash sales. |
| ** | The Funds have elected to defer certain qualified late-year losses in accordance with federal income tax rules. These losses are treated as having arisen on the first day of the following fiscal year. |
| NOTESTO FINANCIAL STATEMENTS | 89 |
Table of Contents
NOTESTO FINANCIAL STATEMENTS (CONTINUED)
As of September 30, 2013, cost of investments for federal income tax purposes and the amounts of gross and net unrealized appreciation/(depreciation) were as follows:
| Fund | Cost | Unrealized Appreciation | Unrealized (Depreciation) | Net Appreciation/ (Depreciation) | ||||||||||||
ICON Bond Fund | $ | 106,466,386 | $ | 1,284,977 | $ | (681,409 | ) | $ | 603,568 | |||||||
ICON Equity Income Fund | 24,985,623 | 1,307,868 | (545,828 | ) | 762,040 | |||||||||||
ICON Fund | 25,685,570 | 11,510,579 | (38,584 | ) | 11,471,995 | |||||||||||
ICON Long/Short Fund | 16,918,643 | 3,882,088 | (38,929 | ) | 3,843,159 | |||||||||||
ICON Opportunities Fund | 365,911 | 76,410 | (1,449 | ) | 74,961 | |||||||||||
ICON Risk-Managed Balanced Fund | 57,920,257 | 1,696,231 | (696,973 | ) | 999,258 | |||||||||||
7. Accounting Pronouncement
In December 2011, the FASB issued Accounting Standards Update No. 2011-11, “Disclosures about Offsetting Assets and Liabilities.” This update creates disclosure requirements requiring entities to disclose both gross and net information for derivatives and other financial instruments that are either offset in the Statements of Assets and Liabilities or subject to an enforceable master netting arrangement or similar agreement. In January 2013, the FASB issued Accounting Standards Update No. 2013-01, “Clarifying the Scope of Disclosures about Offsetting Assets and Liabilities.” This update limits the scope of the new Statements of Assets and Liabilities offsetting disclosures to derivatives, repurchase agreements, reverse repurchase agreements, securities borrowing and securities lending transactions that are either offset in the Statements of Assets and Liabilities or subject to an enforceable master netting arrangement or similar agreement. These disclosure requirements are effective for annual reporting periods beginning on or after January 1, 2013, and interim periods within those annual periods. Management is currently evaluating the impact these updates may have on the Funds’ financial statements.
8. Subsequent Events
Management has evaluated the possibility of subsequent events and determined that there are no material events that would require adjustment to or disclosure in the Funds’ financial statements.
| 90 | NOTESTO FINANCIAL STATEMENTS |
Table of Contents
REPORTOF INDEPENDENT REGISTERED PUBLIC
ACCOUNTING FIRM
To the Board of Trustees and Shareholders of the ICON Funds:
In our opinion, the accompanying statements of assets and liabilities, including the schedules of investments, and the related statements of operations and of changes in net assets and the financial highlights present fairly, in all material respects, the financial position of ICON Bond Fund, ICON Equity Income Fund, ICON Fund, ICON Long/Short Fund, ICON Opportunities Fund, and ICON Risk-Managed Balanced Fund (formerly the “ICON Risk-Managed Equity Fund”) (six of the portfolios constituting ICON Funds, hereafter referred to as the “Funds”) at September 30, 2013, the results of each of their operations for the year then ended, the changes in each of their net assets for each of the two years in the period then ended and the financial highlights for each of the periods presented, in conformity with accounting principles generally accepted in the United States of America. These financial statements and financial highlights (hereafter referred to as “financial statements”) are the responsibility of the Funds’ management; our responsibility is to express an opinion on these financial statements based on our audits. We conducted our audits of these financial statements in accordance with the standards of the Public Company Accounting Oversight Board (United States). Those standards require that we plan and perform the audit to obtain reasonable assurance about whether the financial statements are free of material misstatement. An audit includes examining, on a test basis, evidence supporting the amounts and disclosures in the financial statements, assessing the accounting principles used and significant estimates made by management, and evaluating the overall financial statement presentation. We believe that our audits, which included confirmation of securities at September 30, 2013 by correspondence with the custodian and brokers, provide a reasonable basis for our opinion.

Denver, Colorado
November 19, 2013
| REPORTOF ACCOUNTING FIRM | 91 |
Table of Contents
SIX MONTH HYPOTHETICAL EXPENSE EXAMPLE
SEPTEMBER 30, 2013 (UNAUDITED)
Example
As a shareholder of a Fund you may pay two types of fees: transaction fees and fund-related fees. Certain funds charge transaction fees, including sales charges (loads) on purchase payments, reinvested dividends, or other distributions; redemption fees; and exchange fees. Funds also incur various ongoing expenses, including management fees, distribution and/or service fees, and other fund expenses, which are indirectly paid by shareholders.
This Example is intended to help you understand your ongoing costs (in dollars) of investing in the various ICON Funds and to compare these costs with the ongoing costs of investing in other mutual funds. This Example is based on an investment of $1,000 invested at the beginning of the six-month period and held for the six-month period (4/1/13 – 9/30/13).
Actual Expenses
The first line in the table for each Fund provides information about actual account values and actual expenses. The Example includes, but is not limited to, management fees, 12b-1 fees, fund accounting, custody and transfer agent fees. However, the Example does not include client specific fees, such as the $15 fee charged to IRA accounts, or the $15 fee charged for wire redemptions. You may use this information, together with the amount you invested, to estimate the expenses that you paid over the period. Simply divide your account value by $1,000 (for example, an $8,600 account value divided by $1,000 = 8.6), then multiply the result by the number in the first line for each Fund under the heading entitled “Expenses Paid During Period” to estimate the expenses you paid on your account during this period.
Hypothetical Example for Comparison Purposes
The second line in the table for each Fund provides information about hypothetical account values and hypothetical expenses based on the Fund’s actual expense ratio and an assumed rate of return of 5% per year before expenses, which is not the Fund’s actual return. The hypothetical account values and expenses may not be used to estimate the actual ending account balance or expenses you paid for the period. You may use this information to compare the ongoing costs of investing in the Fund and other funds. To do so, compare this 5% hypothetical example with the 5% hypothetical examples that appear in the shareholder reports of the other funds. Please note that the expenses shown in the table are meant to highlight your ongoing costs only and do not reflect any transactional costs, such as sales charges (loads),
| 92 | EXPENSE EXAMPLE |
Table of Contents
redemption fees, or exchange fees that may be charged by other funds. Therefore, this information is useful in comparing ongoing costs only, and will not help you determine the relative total costs of owning different funds.
| Beginning Account Value 4/1/13 | Ending Account Value 9/30/13 | Expense Paid During Period 4/1/13 - 9/30/13* | Annualized Expense Ratio 4/1/13 - 9/30/13* | |||||||||||||
Actual Expenses | ||||||||||||||||
ICON Bond Fund | ||||||||||||||||
Class S | $ | 1,000 | $ | 985.80 | $ | 3.73 | 0.75% | |||||||||
Class C | 1,000 | 981.70 | 7.95 | 1.60% | ||||||||||||
Class A | 1,000 | 983.50 | 4.97 | 1.00% | ||||||||||||
ICON Equity Income Fund | ||||||||||||||||
Class S | 1,000 | 1,058.10 | 6.24 | 1.21% | ||||||||||||
Class C | 1,000 | 1,052.40 | 11.37 | 2.21% | ||||||||||||
Class A | 1,000 | 1,056.30 | 7.53 | 1.46% | ||||||||||||
ICON Fund | ||||||||||||||||
Class S | 1,000 | 1,132.70 | 6.63 | 1.24% | ||||||||||||
Class C | 1,000 | 1,126.50 | 11.99 | 2.25% | ||||||||||||
Class A | 1,000 | 1,130.90 | 8.01 | 1.50% | ||||||||||||
ICON Long/Short Fund | ||||||||||||||||
Class S | 1,000 | 1,105.60 | 7.02 | 1.33% | ||||||||||||
Class C | 1,000 | 1,099.30 | 12.53 | 2.38% | ||||||||||||
Class A | 1,000 | 1,104.40 | 8.60 | 1.63% | ||||||||||||
ICON Opportunities Fund | 1,000 | 1,176.20 | 8.18 | 1.50% | ||||||||||||
ICON Risk-Managed Balanced Fund | ||||||||||||||||
Class S | 1,000 | 1,043.10 | 6.15 | 1.20% | ||||||||||||
Class C | 1,000 | 1,037.60 | 11.24 | 2.20% | ||||||||||||
Class A | 1,000 | 1,041.30 | 7.42 | 1.45% | ||||||||||||
Hypothetical (assuming a 5% return before expenses) | ||||||||||||||||
ICON Bond Fund | ||||||||||||||||
Class S | 1,000 | 1,021.31 | 3.80 | |||||||||||||
Class C | 1,000 | 1,017.05 | 8.09 | |||||||||||||
Class A | 1,000 | 1,020.05 | 5.06 | |||||||||||||
ICON Equity Income Fund | ||||||||||||||||
Class S | 1,000 | 1,019.00 | 6.12 | |||||||||||||
Class C | 1,000 | 1,013.99 | 11.16 | |||||||||||||
Class A | 1,000 | 1,017.75 | 7.38 | |||||||||||||
ICON Fund | ||||||||||||||||
Class S | 1,000 | 1,018.85 | 6.28 | |||||||||||||
Class C | 1,000 | 1,013.79 | 11.36 | |||||||||||||
Class A | 1,000 | 1,017.55 | 7.59 | |||||||||||||
| EXPENSE EXAMPLE | 93 |
Table of Contents
| Beginning Account Value 4/1/13 | Ending Account Value 9/30/13 | Expense Paid During Period 4/1/13 - 9/30/13* | Annualized Expense Ratio 4/1/13 - 9/30/13* | |||||||||||
ICON Long/Short Fund | ||||||||||||||
Class S | $ | 1,000 | $ | 1,018.40 | $ | 6.73 | ||||||||
Class C | 1,000 | 1,013.14 | 12.01 | |||||||||||
Class A | 1,000 | 1,016.90 | 8.24 | |||||||||||
ICON Opportunities Fund | 1,000 | 1,017.55 | 7.59 | |||||||||||
ICON Risk-Managed Balanced Fund | ||||||||||||||
Class S | 1,000 | 1,019.05 | 6.07 | |||||||||||
Class C | 1,000 | 1,014.04 | 11.11 | |||||||||||
Class A | 1,000 | 1,017.80 | 7.33 | |||||||||||
| * | Expenses are equal to the Fund’s six month expense ratio annualized, multiplied by the average account value over the period, multiplied by 183/365 to reflect the one-half year period. |
Total returns exclude applicable sales charges. If sales charges were included (maximum 5.75%), returns would be lower.
| 94 | EXPENSE EXAMPLE |
Table of Contents
BOARDOF TRUSTEESAND FUND OFFICERS (UNAUDITED)
The ICON Funds Board of Trustees (“Board”) consists of four Trustees who oversee the 18 ICON Funds (the “Funds”). The Board is responsible for general oversight of the Funds’ business and for assuring that the Funds are managed in the best interest of the Funds’ shareholders. The Trustees, and their ages, and principal occupations are set forth below. The address of the Trustees is 5299 DTC Blvd., Suite 1200, Greenwood Village, CO 80111. Trustees have no official term of office and generally serve until they resign or are not re-elected.
Interested Trustee
Craig T. Callahan, 62, Chairman of the Board. Dr. Callahan has been a Trustee of the Funds since their inception. Dr. Callahan also serves as President (1998 to present) and Chairman of the Investment Committee (2005 to present) and served as the Chief Investment Officer (1991 to 2004) of ICON Advisers. Dr. Callahan is also Executive Vice President (2005 to present); Director (1991 to present); and was previously President (1998 to 2005) and Chief Compliance Officer (2005) of IDI. Dr. Callahan also serves as the President (1998 to present) and Chairman of the Board of Directors (1994 to present) of ICON Management & Research Corporation (“IM&R”), the parent company of ICON Advisers and IDI.
Independent Trustees
Glen F. Bergert, 63. Mr. Bergert has been a Trustee of the Funds since 1999. Mr. Bergert is President of Venture Capital Management LLC (1997 to present), General Partner of SOGNO Partners LP, a venture capital company (2001 to present), General Partner of Bergert Properties, LLP, a real estate holding company (1997 to present), General Partner of Pyramid Real Estate Partnership, a real estate development company (1998 to present), General Partner of Chamois Partners, LP, a venture capital company (2004 to present) and was previously a General Partner with KPMG Peat Marwick, LLP (1979 to 1997). Mr. Bergert is also a Director of Delta Dental of California, an insurance company (2013 to present and 2006 to 2012), Delta Dental of Pennsylvania, an insurance company (1998 to 2009 and 2010 to present), Dentegra Group, Inc, an insurance holding company (2010 to present) and Delta Reinsurance Corporation (2000 to 2009 and 2011 to present). Mr. Bergert was a Director of Herre Bros, Inc., a contracting company (1998 to 2011).
John C. Pomeroy, Jr., 66. Mr. Pomeroy has been a Trustee of the Funds since November 2002. Mr. Pomeroy is Chief Investment Officer and Director
| TRUSTEESAND OFFICERS | 95 |
Table of Contents
of Investments, Pennsylvania State University (2001 to present) and was Portfolio Manager and Product Manager, Trinity Investment Management Corporation (1989 to 2001).
R. Michael Sentel, 65. Mr. Sentel has been a Trustee of the Funds since their inception. Mr. Sentel is a Senior Attorney with the U.S. Department of Education (1996 to present). Mr. Sentel also provides legal representation as a sole practitioner with an emphasis on corporate and transactional law. He served as general counsel to numerous public companies and served on the board of directors of one of these clients. Mr. Sentel began his legal career with the U.S. Securities and Exchange Commission’s Division of Enforcement and served as a Branch Chief (1980 to 1981). Later he served as the Section Chief for the Professional Liability Section of the Federal Deposit Insurance Corp. with responsibility for the Rocky Mountain Region (1991 to 1994).
The Officers of the Funds are:
Craig T. Callahan, 62, Chairman of the Board. Dr. Callahan has been a Trustee of the Funds since their inception. Dr. Callahan also serves as President (1998 to present) and Chairman of the Investment Committee (2005 to present) and served as the Chief Investment Officer (1991 to 2004) of ICON Advisers. Dr. Callahan is also Executive Vice President (2005 to present); Director (1991 to present); and was previously President (1998 to 2005) and Chief Compliance Officer (2005) of IDI. Dr. Callahan also serves as the President (1998 to present) and Chairman of the Board of Directors (1994 to present) of IM&R, the parent company of ICON Advisers and IDI.
Donald Salcito, 60. Mr. Salcito serves as Vice President and Secretary of the Funds (November 15, 2006 to present). Mr. Salcito is also Executive Vice President and General Counsel (September 2005 to present) of ICON Advisers; Director of IM&R (2005 to present); Executive Vice President, Secretary, General Counsel of IDI (2005 to present). Previously, he was a Partner in various national law firms, practicing in the securities law area. (1980 to 2005).
Carrie M. Schoffman, 40. Ms. Schoffman has been a Vice President and Principal Financial Officer/Treasurer of the Funds since June 2013. Ms. Schoffman is also Chief Compliance Officer (2013 to present and 2004 to 2008) and Anti-Money Laundering Officer (2013 to present) of the ICON Funds. She is Senior Vice President (2011 to present) and Chief Compliance Officer (2013 to present and 2004 to 2011) of ICON Advisers. Previously, she was a Staff Accountant with the Securities and Exchange Commission (2003 to 2004) and also an Experienced Manager (2001 to 2003) and a Senior Associate/Associate (1996 to 2001) at PricewaterhouseCoopers LLP.
| 96 | TRUSTEESAND OFFICERS |
Table of Contents
Renewal of Investment Advisory Agreement
On August 19, 2013 the Board of Trustees, including all of the Trustees that are not “interested persons” of the Trust (the “Independent Trustees”), approved continuation of the Advisory Agreements with the Adviser for each Fund for an additional one-year term commencing October 1, 2013.
In determining to renew the investment advisory agreements between ICON Funds (the “Trust”) and ICON Advisers, Inc. (“ICON” or the “Adviser”) the Trustees requested, was provided with and reviewed data with respect to the Adviser, its personnel, and the services provided and to be provided to each Fund by the Adviser under the Trust’s Investment Advisory Agreement dated October 9, 1996, as amended (related to the Sector Funds, the International Funds and ICON Funds) and under the Trust’s Investment Advisory Agreement dated July 9, 2002 and effective October 1, 2002, as amended (related to the U.S. Diversified Funds - Bond, Risk-Managed Equity, Equity Income and Long/Short Funds) (collectively, the “Advisory Agreements”), for an additional one-year term commencing October 1, 2013. The Trustees agreed that consideration of the Advisory Agreements should also include consideration of other agreements between the Adviser and the Trust that impact provisions of the Advisory Agreements, including, in particular, expense limitation agreements dated January 22, 2013 and May 1, 2005 (for the International Equity Fund).
The Trustees were provided with and reviewed data with respect to the Adviser, its personnel, and the services provided and to be provided to each Fund by the Adviser under the Trust’s Advisory Agreements and Administrative Services Agreement and the Distribution Agreement with ICON Distributors, Inc. (“IDI”). The data included information concerning advisory, distribution and administrative services provided to the Funds by ICON and its related companies; information concerning other businesses of those companies; comparative data related to exchange traded funds versus the Sector Funds; and comparative data obtained from Strategic Insights related to Fund performance and Fund expenses (the “SI report”). The data also included an analysis of the management style to be applied and the style applied to the Funds’ ratings of the Funds’ performance in their management style on the AthenaInvest system (the “AthenaInvest data”) and a presentation on the Adviser’s investment model.
Management personnel discussed the data for and with the Board. Included in the 15(c) discussion was a briefing on factors affecting the ICON investment model; expenses and expense ratios of each Fund and other ICON managed products; relative performance of each Fund; status of expense
| OTHER INFORMATION | 97 |
Table of Contents
reimbursements to the Funds by the Adviser; sales and marketing initiatives; specific business factors affecting IDI; the work load on ICON as adviser and administrator to the Funds; current profitability of ICON; current quality control procedures in place to show consistency in the management of the investment model, modification to the investment model, and staffing levels and staff morale.
The Independent Trustees were represented by independent legal counsel in this process. Prior to acting on the proposed contract renewals, the Independent Trustees met separately as a group in private sessions with their independent legal counsel to review and discuss the foregoing information. Based on these discussions, independent legal counsel and/or the Lead Independent Trustee also contacted management to request additional information and to discuss responses to questions raised during the process. In addition, the Board received materials from legal counsel discussing the legal standards applicable to their consideration of the ICON-Trust agreements.
In considering the nature, extent and quality of the services provided by the Adviser, the Board reviewed information relating to ICON’s operations and personnel. Among other things, the Adviser provided biographical information on its professional staff and descriptions of its organizational and management structure. In the course of their deliberations the Board evaluated, among other things, information relating to the investment philosophy, strategies and techniques used in managing each Fund, the qualifications and experience of ICON’s investment personnel, ICON’s compliance programs, ICON’s brokerage practices, including the extent to which the Adviser obtains research through “soft dollar” arrangements with the Funds’ brokerage, compliance reports on the foregoing, and the financial and non-financial resources available to provide services required under the Advisory Agreement.
During the discussion, the SI report and the AthenaInvest data were discussed and management personnel showed performance for each fund and discussed the factors affecting performance. During the discussion on performance, management personnel noted that the markets continue to experience volatility and that when the markets are volatile, it affects ICON’s performance; during the last three – four years ICON’s style of management, intrinsic valuation, has not been in favor. The Trustees noted that Advisers’ performance relative to other valuation managers as judged by the AthenaInvest system is quite positive, but in relation to other strategy managers, valuation is underperforming. The Board believes this information supports the view that an active valuation manager is in a very difficult setting and indicates this setting has been particularly difficult for managers buying what they consider to be value stocks. Management noted that the
| 98 | OTHER INFORMATION |
Table of Contents
ICON system is designed to handle one to two year industry themes, not ones averaging 14 weeks; and that the Adviser has stuck to its system as specified in Fund disclosure documents, holding the stocks and industries that appear inexpensive in relation to ICON’s calculating of value and ridden through the volatility.
The Board addressed style consistency with the Adviser. Management advised that, based on the Adviser’s own analysis, and with the restructuring of the Adviser, the Adviser has added a new level of review on the Portfolio Managers (“PMs”) to make sure they are adhering to the ICON System; the Director of Fund Management has been systematically tracking the Funds’ performance; he evaluates each of the ICON Funds to help ensure all PMs are investing consistently and in accordance with the ICON System by evaluating the Funds from an attribution perspective in monthly meetings. Management also advised that part of his responsibilities require him to evaluate the ICON system and that this effort has resulted in improvements to the ICON methodology, when necessary.
In connection with reviewing data bearing upon the nature, quality, and extent of services furnished by ICON to each Fund, the Board assessed data concerning ICON’s staffing, systems and facilities. The Board also assessed ICON’s non-Trust business to see if there are any initiatives that would dilute service to the Trust. The Board concluded:
A. That the breadth and the quality of investment advisory and other services being provided to each Fund is satisfactory, as evidenced in part by efforts to address and improve the performance record of each Fund when compared with the performance records of a peer group of comparable funds and markets in general;
B. That the breadth and the quality of investment advisory and other services being provided to each Fund are satisfactory, as evidenced in part by the AthenaInvest data (ratings based on an assessment of fund strategy), the Adviser’s performance is competitive with other fund managers in the value style group, and the Adviser has applied a disciplined approach in the style specified in the Funds’ offering document;
C. That ICON has made significant expenditures in the past year and in prior years to ensure that it has the sophisticated systems and the highly trained personnel necessary for it to be able to continue to provide quality service to the Funds’ shareholders, including the dedication of substantial resources to ICON’s investment and methodology;
D. That the Board, after considering compliance reports and compliance initiatives undertaken during the year and conducting individual interviews with selected PMs, is satisfied with the research and portfolio management,
| OTHER INFORMATION | 99 |
Table of Contents
that research and portfolio management is being constantly evaluated and improved upon; and that the PMs are evaluating trading services constantly, the Board concluded that the Adviser is providing the Funds with professional management of the nature, quality and scope required by the Funds; and
E. The risks assumed by ICON in providing investment advisory services to each Fund, including the capital commitments which have been made in the past and which continue to be made by ICON to ensure the continuation of the highest quality of service to the Trust, is made with the recognition that shareholders may redeem their shares at any time without notice and the Trust’s advisory relationship with ICON may be terminated at any time and must be renewed on an annual basis.
In considering the reasonableness of the fees paid to the Adviser for managing each Fund, the Board reviewed, among other things, data concerning other funds from the SI report, financial statements of the Adviser and an analysis of the profitability of the Adviser, and its affiliates, and their relationship with each Fund over various time periods. Such analysis identified all revenues and other benefits received by the Adviser and its affiliates from managing each Fund, the costs associated with providing such services and the resulting profitability to the Adviser and its affiliates and a comparison of similar data from reports filed by publicly traded firms.
The Board assessed actual (net) fees for advisory services and Fund expense ratios under the contractual relationship (the Advisory agreements and the Expense Limitation Agreements) with the Adviser as opposed to the fees specified in the applicable Advisory Agreement and expense ratios without application of the expense limitations and concluded that the focus should be on actual expense ratios after application of the Expense Limitation Agreements.
The Board considered the current and anticipated asset levels of each Fund and the contractual commitments of the Adviser to waive fees and pay expenses of the Funds from time to time to limit the total expenses of the Funds. In this regard the Board discussed significantly reduced asset levels in each Fund covered by the Advisory Agreements due to the relative poor Fund performance, and the industry wide net-redemptions in equity and actively managed funds due to the uncertainty of the markets. ICON’s ability to provide the services called for under the Advisory Agreements was assessed in light of current and projected asset levels. Fund expenses and expense ratios were also assessed in light of current and projected asset levels. The Board concluded that the Adviser has the resources necessary to provide the services called for under the Advisory Agreements; that profitability to the Adviser and its affiliates from their relationship with the Funds, and services
| 100 | OTHER INFORMATION |
Table of Contents
provided to the Funds, is not excessive; and that the Adviser is not realizing material benefits from economies of scale that would warrant adjustments to the fees for any Fund at this time. The Board of Trustees concluded that, in light of the nature, extent and quality of the services provided by the Adviser and the levels of profitability associated with providing these services, the fees charged by the Adviser under the Advisory Agreements to each Fund are reasonable.
In connection with assessing data bearing on the fairness of fee arrangements, the Board considered the SI report. It was noted that SI was selected at the May Board meeting to prepare its report, an extensive analysis of the expense data of other comparable funds; and that Trustee input was solicited and provided in the process. Among other information discussed, it was noted that:
A. the advisory fee structures of the Funds were considered in comparison with advisory fees and expense ratios of other similarly managed funds as set forth in the comparative data;
B. expense ratios for 10 of the 18 Funds are above median, and 2 are below the median;
C. in 16 of the 18 Funds, the assets under management are significantly below either the average or the median. SI did not provide an analysis of fund expense on an asset weighted basis. Such an analysis is very subjective and uncertain because it would require the Adviser to make a number of assumptions, which the Adviser’s management was uncomfortable in making due to the unreliability of the assumptions. It was, however, noted that when the fund size approaches peer group averages the Funds expenses also approach peer group averages.;
D. ICON has contractually agreed to impose expense limitations on each and every Fund at a cost to ICON;
E. ICON has contractually committed to break points in its fees so that economies of scale could be realized as a Fund grows in assets, for the benefit of Fund shareholders.
The Board also considered the fees charged by the Adviser to other advisory clients as outlined in its Registration Application on Form ADV in connection with assessing data bearing on the fairness of fee arrangements. The Trustees noted that certain ICON institutional/sub-advised type accounts have lower fees than the fees paid by the Funds for a number of reasons, including but not limited to, those clients call for different commitments of time, institutional clients have low and predictable turnover of assets, in competition joint costs are apportioned among paying customers according
| OTHER INFORMATION | 101 |
Table of Contents
to elasticity of demand and the Adviser has a limited level of responsibility in sub-managed accounts, or accounts with an investor agent/advisor.
The Board noted that the Funds’ redemptions were similar to industry averages which showed two things: 1) that the Funds’ Performance was not adversely impacting fund redemptions, and 2) that the fees and costs were competitive when compared to size. The Board noted that there are thousands of mutual funds competing; that investors can search and trade funds on the internet or on platforms at very little or no cost; and that if the Adviser were overcharging for its services, with its performance being what it is, the Board would have expected redemptions in excess of industry norms.
The Board concluded that the Adviser is providing the Funds with professional management at a fair, reasonable and competitive price.
In connection with assessing the direct and indirect benefits to ICON from serving as the Funds’ adviser, the Board discussed services provided under the Distribution Agreement and the Administrative Services Agreement which are in addition to services under the Advisory Agreements. It was noted that IDI does not charge a fee to the Funds for its services and that ICON’s fee for administrative services appears to be consistent with such fees in other fund groups. The Board noted that ICON receives research assistance (primarily in the form of data) from the use of soft dollars generated from Fund portfolio transactions; that such research assists ICON in providing quality advisory services; that Trust and Adviser compliance personnel continuously evaluate and report on the soft-dollar arrangements and related costs; and the Board concluded that the arrangements are consistent with Fund brokerage practices and benefit the Funds and their shareholders.
Based on these considerations, the Board, including all of the Independent Trustees, concluded that: 1) the continuation of the Advisory Agreements was in the best interests of each Fund and its shareholders, 2) the services to be performed under the Advisory Agreements were required for the operation of the Funds, 3) the advisory services were satisfactory to the Funds in the past, and 4) the fees for the advisory services and other benefits from the relationship with the Trust received by ICON, and its affiliates, were consistent with fees paid by similar funds and other clients of ICON, and were reasonable in light of the comparative data, and within the range of what would have been negotiated at arm’s length in light of all the circumstances.
| 102 | OTHER INFORMATION |
Table of Contents
Supplemental Tax Information
For corporate shareholders, the following percentage of the total ordinary income dividends paid during the fiscal year ended September 30, 2013, qualifies for the corporate dividends received deduction for the following Funds:
| Fund | Dividends Received Deduction | |||
ICON Equity Income Fund | 97.7 | % | ||
ICON Fund | 100 | % | ||
ICON Risk-Managed Balanced Fund | 100 | % | ||
For the fiscal year ended September 30, 2013, the following funds paid qualified dividend income:
| Fund | Amount | |||
ICON Equity Income Fund | 100% | |||
ICON Fund | 100% | |||
ICON Risk-Managed Balanced Fund | 100% | |||
The Funds designate the following amounts, or the maximum amount needed, as long-term capital gain distributions qualifying for the maximum 15% income tax rate for individuals:
| Fund | Amount | |||
ICON Bond Fund | $ | 2,430,466 | ||
Portfolio Holdings
Information related to the 10 largest portfolio holdings of each Fund is made available at www.iconfunds.com within approximately 10 business days after month-end. Additionally, a complete list of each Fund’s holdings is made available approximately 30 days after month-end. Each ICON Fund also files a complete schedule of portfolio holdings for the first and third quarters of its fiscal year with the Securities and Exchange Commission (the “Commission”) on Form N-Q. The ICON Funds’ Forms N-Q are available at www.sec.gov or may be reviewed and copied at the Commission’s Public Reference Room in Washington, DC. Information about the Public Reference Room may be obtained by calling 1-800-SEC-0330.
Proxy Voting
A summarized description of the policies and procedures the ICON Funds use to vote proxies is available free of charge at www.iconfunds.com or by calling 1-800-764-0442.
| OTHER INFORMATION | 103 |
Table of Contents
Information about how the ICON Funds voted proxies related to each Fund’s portfolio securities during the 12-month period ended June 30 is available free of charge at www.iconfunds.com or on the Commission’s website at www.sec.gov.
Cost Basis Information
Effective January 1, 2012, federal law requires mutual fund companies to maintain and report a shareholder’s cost basis by tax lot, gain/loss information and holding period of covered shares to the Internal Revenue Service on Form 1099. Covered shares are mutual fund shares acquired on or after January 1, 2012. A fund is not required to maintain and report information for shares not deemed as covered.
The new law requires each fund to elect a default tax identification methodology in order to perform the required reporting. As a result, the Trust has chosen Average Cost as its default tax identification methodology. This is the method each Fund will use. However, at the time of purchase or upon the sale of covered shares, shareholders may choose a different tax identification method. Furthermore, if you purchase shares through a financial intermediary, please contact the intermediary to find out what default tax identification method they will use. We recommend that you consult your tax adviser to determine which tax identification methodology best suits your individual tax situation.
For More Information
This report is for the general information of the Funds’ shareholders and is not authorized for distribution to prospective investors unless preceded or accompanied by a current prospectus. You may obtain a copy of the prospectus, which contains information about the investment objectives, risks, charges, expenses, and share classes of each ICON Fund, by visiting www.iconfunds.com or by calling 1-800-764-0442. Please read the prospectus carefully before investing.
ICON Distributors, Inc., Distributor.
| 104 | OTHER INFORMATION |
Table of Contents
ICON FUNDS PRIVACY INFORMATION
| FACTS | WHAT DOES ICON DO WITH YOUR PERSONAL INFORMATION? | |
| Why? | Financial companies choose how they share your personal information. Federal law gives consumers the right to limit some but not all sharing. Federal law also requires us to tell you how we collect, share, and protect your personal information. Please read this notice carefully to understand what we do. | |
| What? | The types of personal information we collect and share depend on the product or service you have with us. This information can include:
n Social Security number and account balances
n income and transaction history
n checking account information and wire transfer instructions
When you are no longer our customer, we continue to share your information as described in this notice. | |
| How? | All financial companies need to share customers’ personal information to run their everyday business. In the section below, we list the reasons financial companies can share their customers’ personal information; the reasons ICON chooses to share; and whether you can limit this sharing. |
| Reasons we can share your personal information | Does ICON share? | Can you limit this sharing? | ||
For our everyday business purposes — such as to process your transactions, maintain your account(s), respond to court orders and legal investigations, or report to credit bureaus | Yes | No | ||
For our marketing purposes — to offer our products and services to you | No | We don’t share | ||
| For joint marketing with other financial companies | No | We don’t share | ||
For our affiliates’ everyday business purposes — information about your transactions and experiences | No | We don’t share | ||
For our affiliates’ everyday business purposes — information about your creditworthiness | No | We don’t share | ||
| For nonaffiliates to market to you | No | We don’t share |
| Questions? | Call 1-800-764-0442 for the ICON Funds and 1-800-828-4881 for ICON Advisers, Inc. and ICON Distributors, Inc. |
| FUNDS PRIVACY INFORMATION | 105 |
Table of Contents
| Page 2 |
| Who we are | ||
| Who is providing this notice? | ICON Funds, ICON Advisers, Inc., and ICON Distributors, Inc. (collectively “ICON”) | |
| What we do | ||
| How does ICON protect my personal information? | To protect your personal information from unauthorized access and use, we use security measures that comply with federal law. These measures include computer safeguards and secured files and buildings.
Contracts with our service providers require them to restrict access to your non-public personal information, and to maintain physical, electronic and procedural safeguards against unintended disclosure. | |
| How does ICON collect my personal information? | We collect your personal information, for example, when you
n open an account or enter into an investment advisory contract
n provide account information or give us your contact information
n make a wire transfer
We also collect your personal information from others, such as credit bureaus, affiliates, or other companies. | |
| Why can’t I limit all sharing? | Federal law gives you the right to limit only
n sharing for affiliates’ everyday business purposes — information about your creditworthiness
n affiliates from using your information to market to you
n sharing for nonaffiliates to market to you
State laws and individual companies may give you additional rights to limit sharing. | |
| Definitions | ||
| Affiliates | Companies related by common ownership or control. They can be financial and nonfinancial companies.
n Our affiliates include financial companies such as ICON Funds, ICON Advisers, Inc., and ICON Distributors, Inc. | |
| Nonaffiliates | Companies not related by common ownership or control. They can be financial and nonfinancial companies.
n Nonaffiliates we share with can include financial companies such as custodians, transfer agents, registered representatives, financial advisers and nonfinancial companies such as fulfillment, proxy voting, and class action service providers | |
| Joint marketing | A formal agreement between nonaffiliated financial companies that together market financial products or services to you.
n ICON doesn’t jointly market |
| 106 | FUNDS PRIVACY INFORMATION |
Table of Contents
(This page is intentionally left blank)
Table of Contents
(This page is intentionally left blank)
Table of Contents
(This page is intentionally left blank)
Table of Contents
For more information about the ICON Funds, contact us:
| By Telephone | 1-800-764-0442 | |
| By Mail | ICON Funds P.O. Box 55452 Boston, MA 02205-8165 | |
| In Person | ICON Funds 5299 DTC Boulevard, 12th Floor Greenwood Village, CO 80111 | |
| On the Internet | www.iconfunds.com | |
| By E-Mail | info@iconadvisers.com | |
Table of Contents

2013 ANNUAL REPORT
ICON INTERNATIONAL FUNDS
INVESTMENT UPDATE
ICON Asia-Pacific Region Fund
ICON Europe Fund
ICON International Equity Fund

1-800-764-0442 | www.iconfunds.com
AR-INTL-13-W37524
Table of Contents

You can now sign up for electronic delivery of ICON Fund shareholder reports, including prospectuses, annual reports, semiannual reports and proxy statements.
When these materials are available, you will receive an email from ICON with instructions on how to view the documents. Statements, transaction confirmations and other documents that are not available online will continue to be sent to you by U.S. mail.
Visit ICON’s website at www.iconfunds.com to learn more and sign up.
You may change or cancel your participation in eDelivery by visiting www.iconfunds.com, or you can request a hard copy of any of the materials free of charge by calling ICON Funds at 1-800-764-0442.
1-800-764-0442 • www.iconfunds.com
Table of Contents

| 2 | ||||
Management Overview (Unaudited) and Schedules of Investments | ||||
| 5 | ||||
| 14 | ||||
| 22 | ||||
| 32 | ||||
| 42 | ||||
| 46 | ||||
| 64 | ||||
| 65 | ||||
| 67 | ||||
| 69 | ||||
Table of Contents
Historical Returns
All total returns mentioned in this Report account for the change in a Fund’s per-share price and the reinvestment of any dividends, capital gain distributions and adjustments for financial statement purposes. If your account is set up to receive Fund distributions in cash rather than to reinvest them, your actual return may differ from these figures. The Funds’ performance results do not reflect the deduction of taxes that a shareholder would pay on Fund distributions or on the redemption of Fund shares. The Adviser may have reimbursed certain fees or expenses of some of the Funds. If not for these reimbursements, performance would have been lower. Fund results shown, unless otherwise indicated, are at net asset value. If a sales charge (maximum 5.75%) had been deducted, results would have been lower.
Past performance does not guarantee future results. Investment return and principal value will fluctuate so that an investor’s shares, when redeemed, may be worth more or less than their original cost. Performance results represent past performance, and current performance may be higher or lower. Please call 1-800-764-0442 or visit www.iconfunds.com for performance results current to the most recent month-end.
Portfolio Data
This Report reflects ICON’s views, opinions and portfolio holdings as of September 30, 2013, the end of the reporting period. The information is not a complete analysis of every aspect of any sector, industry, security or the Funds.
Opinions and forecasts regarding industries, companies and/or themes, and portfolio composition and holdings are subject to change at any time based on market and other conditions, and should not be construed as a recommendation of any specific security, industry or sector. Each Fund’s holdings as of September 30, 2013 are included in each Fund’s Schedule of Investments.
According to ICON, value investing is an analytical approach to investing that employs various factors, including projecting earnings growth estimates, in an effort to determine whether securities are over- or underpriced relative to ICON’s estimates of their intrinsic value. Value investing involves risks and uncertainties and does not guarantee better performance or lower costs than other investment methodologies. ICON’s value-to-price ratio (“V/P”) is a ratio of intrinsic value, as calculated using ICON’s proprietary valuation methodology, of a broad range of domestic and international securities within ICON’s system as compared to the current market price of those
| 2 | ABOUT THIS REPORT |
Table of Contents
securities. The ICON system relies on the integrity of the financial statements released to the market as part of our analysis.
This Report contains statements regarding industry or sector themes, new market themes, investment outlook, relative strength, value-to-price ratios, and investment team expectations, beliefs, goals and the like that are based on current expectations, recent individual stock performance relative to current market prices, estimates of company values and other information supplied to the market by the companies we follow. Words such as “expects,” “suggests,” “anticipates,” “targets,” “goals,” “value,” “intrinsic value,” “indicates,” “believes,” “considers,” “estimates,” variations of such words and similar expressions are intended to identify forward looking statements, which are not statements of historical fact. Forward looking statements are not guarantees of future performance and involve certain risks, uncertainties and assumptions that are difficult to assess. These risks and uncertainties are based on a number of important factors, including, among others: stock price fluctuations; the integrity and accuracy of historical and projected financial and other information supplied by companies to the public or assumptions based on such information supplied; interest rates; bond yields; future earnings growth rates; the risks noted in this report and other factors beyond the control of our investment team but used by the investment team to influence their assumptions. Therefore, actual outcomes may differ materially from what is expressed in such forward looking statements.
There are risks associated with mutual fund investing, including the loss of principal. The likelihood of loss may be greater if you invest for a shorter period of time. There is no assurance that the investment process will consistently lead to successful results.
An investment in a region fund may involve greater risk and volatility than a diversified fund. An investment concentrated in sectors and industries may involve greater risk and volatility than a more diversified investment.
Investments in foreign securities may entail unique risks, including political, market, and currency risks. Financial statements of foreign companies are governed by different accounting, auditing, and financial standards than U.S. companies and may be less transparent and uniform than in the United States. Many corporate governance standards, which help ensure the integrity of public information in the United States, do not exist in foreign countries. In general, there may be less governmental supervision of foreign stock exchanges and securities brokers and issuers. The ICON system relies on the integrity of financial statements released to the market as part of our analysis.
The prospectus and statement of additional information contain this and other information about the Funds and are available by visiting www.iconfunds.com or calling 1-800-764-0442. Please read the prospectus and statement of additional information carefully.
| ABOUT THIS REPORT | 3 |
Table of Contents
Comparative Indexes
The comparative indexes discussed in this Report are meant to provide a basis for judging a Fund’s performance against specific securities indexes. Each index shown accounts for both change in the security price and reinvestment of dividends and distributions (except as noted), but does not reflect the costs of managing a mutual fund. The total return figures for the Morgan Stanley Capital International (“MSCI”) indexes assume change in security prices and the deduction of local taxes. The Funds’ portfolios may significantly differ in holdings and composition from the indexes. Individuals cannot invest directly in an index.
| • | The unmanaged MSCI All Country Asia-Pacific Index is a free float-adjusted market capitalization weighted index that is designed to measure the equity market performance of the developed and emerging markets in the Pacific region (Australia, China, Hong Kong, India, Indonesia, Japan, Korea, Malaysia, New Zealand, Philippines, Singapore, Taiwan and Thailand). |
| • | The unmanaged MSCI Europe Index is a free float-adjusted market capitalization weighted index that is designed to measure the equity market performance of the developed markets in Europe (Austria, Belgium, Denmark, Finland, France, Germany, Greece, Ireland, Italy, the Netherlands, Norway, Portugal, Spain, Sweden, Switzerland and the United Kingdom). |
| • | The MSCI All Country World Index ex-United States (“ACWI ex-U.S.”) is a leading unmanaged benchmark of international stock performance. The capitalization-weighted index is representative of the performance of securities of companies located in developed and emerging markets outside of the United States. |
Index returns and statistical data included in this Report are provided by FactSet Research Systems.
Financial Intermediary
If you purchase the Fund through a broker-dealer or other financial intermediary (such as a bank), the Fund and its related companies may pay the intermediary for the sale of Fund shares and related services. These payments may influence the broker-dealer or other intermediary and your salesperson to recommend the Fund over another investment. Ask your salesperson or visit your financial intermediary’s website for more information.
| 4 | ABOUT THIS REPORT |
Table of Contents
MANAGEMENT OVERVIEW (UNAUDITED) | Class S Class C Class A | ICARX ICPCX IPCAX |
| Q. | How did the Fund perform relative to its benchmark? |
| A. | The ICON Asia-Pacific Region Fund Class S (“Asia-Pacific Region Fund”) returned 11.44% for the fiscal year ended September 30, 2013, underperforming its benchmark, the MSCI All Country Asia-Pacific Index, which returned 16.16%. Total returns for other periods and additional Class shares as of September 30, 2013, appear in the subsequent pages of this Fund’s Management Overview. |
| Q. | What primary factors were behind the Fund’s relative performance? |
| A. | Performance in the region during fiscal-year 2013 tended to revolve around events taking place in Japan and emerging market countries. |
Japanese equities were a significant part of benchmark performance during the period. Japanese equities had strong returns during the fiscal year partially in large part due to investor exuberance over the potential impact of so-called “Abenomics” – an aggressive combination of fiscal, monetary and structural proposals named after Japanese Prime Minister Shinzo Abe - designed to pull Japan out of the economic malaise it has experienced for many years. The Japanese market began to increase in mid-November 2012 as it became increasingly likely that Abe’s party, the Liberal Democratic Party, would win the December 2012 elections in a landslide.
Demonstrating good value according to our system in the months leading up to the start of the period, we had been adding exposure to Japan. However, shortly after Japanese performance began to rise, its relative value began to deteriorate. Following value, we began to trim down the Asia-Pacific Region Fund’s exposure. Given its large weighting in the benchmark, Japan traditionally has had a major influence on benchmark returns. Despite the Asia-Pacific Region Fund’s consistent underweight over the period, Japanese equities had a positive effect on relative performance, due primarily to stock selection and currency effect.
Most emerging market countries, on the other hand, lagged during the period. The Japanese Yen weakened significantly over the course of the fiscal year. While this helped Japanese exporters, it hurt their foreign competition, especially companies from emerging market countries in the region. In general, exports in emerging market countries comprise a much larger proportion of their respective economies than that of developed countries. Worries over slowing Chinese economic growth
| MANAGEMENT OVERVIEW | 5 |
Table of Contents
were also an issue, as China is the largest export market for most countries in the region.
Starting in May, fears that the Federal Reserve would begin scaling back their asset purchases began to take hold, dominating the headlines for the remainder of the period. These fears had a significant impact on emerging markets, reducing their relative attractiveness to investors.
For the most part, during the period emerging countries in the region tended to demonstrate the most value in our investment system, and as a result, we were overweight emerging markets. This positioning hurt performance relative to the benchmark, with higher value countries Korea, Indonesia and India detracting the most from relative performance.
| Q. | How did the Fund’s composition affect performance? |
| A. | From a country perspective, positioning in Singapore, Hong Kong, China and Australia along with no position in low-value Taiwan had positive effects on relative performance. Conversely, overweights in Korea, Indonesia and India detracted the most on a relative basis. |
In terms of sectors, Telecommunications, Energy and Information Technology contributed the most to relative performance. Specifically, wireless telecommunication services contributed the most of any industry to relative performance followed by internet software & services. From the Energy sector, the oil & gas equipment & services industry also helped performance.
Financials, Consumer Discretionary and Consumer Staples detracted the most from relative performance. The diversified banks industry was the leading detractor to relative performance followed by the automobile manufacturers. The packaged foods & meats industry was the leading detractor in the Consumer Staples sector.
As a multi-cap manager, we are not limited by restrictions on market capitalization. Contrary to the previous fiscal year, our valuation metrics this year led us away from mid- and small-cap companies towards large-cap companies. As of fiscal year end, however, the Asia-Pacific Region Fund remained significantly underweight large-cap stocks (the dominant market cap allocation of the benchmark), and overweight mid- and small-cap stocks relative to the benchmark. Large-cap stocks outperformed their small- and mid-cap peers detracting from the Asia-Pacific Region Fund’s relative performance.
| 6 | MANAGEMENT OVERVIEW |
Table of Contents
Currency movements within the region had a positive effect on relative returns. The Asia-Pacific Region Fund did not employ currency hedging during the period.
| Q. | What is your investment outlook for the Asia-Pacific equity market? |
| A. | Fiscal year 2013 ended with a regional V/P of 0.93, indicating that, on average, fair value for stocks in the Asia-Pacific region is about 7% lower than current pricing under our system. Having surpassed our estimates of fair value, this has led us to sell out of overpriced areas and build up a cash position that we intend to put toward what we perceive to be better bargains as they present themselves. |
Although the region is overvalued according to our investment system, certain areas of the region demonstrate good relative value. From a country perspective, we are seeing good relative value in emerging markets like Indonesia, Philippines and India along with the developed market Australia. Our system is showing the least levels of value in China and Taiwan.
From a sector perspective, several industries have high relative value according to our system. For instance, select industries where we see good opportunities include Energy sector’s oil & gas equipment & services, Financials sector’s real estate development, Industrial sector’s trading companies & distributors, Consumer Discretionary sector’s casinos & gaming, Health Care sector’s biotechnology and Telecommunication sector’s wireless telecommunication services.
At ICON, we continue to look for industries that our system identifies as trading at a discount to fair value and showing relative strength in the markets. Guided by our disciplined, systematic and non-emotional approach to investing, we see several opportunities in the current environment and remain watchful for prospective investments. We believe it is nearly impossible to accurately time market bottoms and, further, that rallies do not offer invitations. Given this philosophy and the valuations we see in the market at fiscal year-end, we remain ready to reallocate and adapt as our investment system dictates.
| MANAGEMENT OVERVIEW | 7 |
Table of Contents
ICON Asia-Pacific Region Fund
Country Composition
September 30, 2013
Japan | 19.0% | |||
Australia | 16.2% | |||
Thailand | 13.5% | |||
South Korea | 10.5% | |||
India | 6.5% | |||
Hong Kong | 6.3% | |||
Singapore | 5.9% | |||
Indonesia | 5.3% | |||
China | 5.0% | |||
Malaysia | 2.6% | |||
Philippines | 1.9% | |||
|
| |||
| 92.7% | ||||
|
|
Percentages are based upon common stocks as a percentage of net assets.
ICON Asia-Pacific Region Fund
Sector Composition
September 30, 2013
Financial | 21.2% | |||
Consumer Discretionary | 16.3% | |||
Information Technology | 11.4% | |||
Industrials | 10.4% | |||
Consumer Staples | 8.3% | |||
Health Care | 8.0% | |||
Utilities | 6.4% | |||
Energy | 6.3% | |||
Materials | 4.4% | |||
|
| |||
| 92.7% | ||||
|
|
Percentages are based upon common stocks as a percentage of net assets.
ICON Asia-Pacific Region Fund
Industry Composition
September 30, 2013
Diversified Banks | 10.9% | |||
Automobile Manufacturers | 5.2% | |||
Internet Software & Services | 4.3% | |||
Oil & Gas Equipment & Services | 4.1% | |||
Semiconductors | 4.0% | |||
Wireless Telecommunication Services | 3.8% | |||
Casinos & Gaming | 3.7% | |||
Real Estate Development | 2.7% | |||
Trading Companies & Distributors | 2.3% | |||
Integrated Oil & Gas | 2.2% | |||
Commodity Chemicals | 2.1% | |||
Hypermarkets & Super Centers | 2.1% | |||
Electrical Components & Equipment | 2.0% | |||
Pharmaceuticals | 2.0% | |||
Property & Casualty Insurance | 2.0% | |||
Health Care Facilities | 1.8% | |||
Integrated Telecommunication Services | 1.8% | |||
Home Improvement Retail | 1.7% | |||
Packaged Foods & Meats | 1.7% | |||
Real Estate Operating Companies | 1.4% |
Tobacco | 1.4% | |||
Electronic Equipment & Instruments | 1.3% | |||
Construction & Engineering | 1.2% | |||
Health Care Equipment | 1.2% | |||
Retail REIT’s | 1.2% | |||
Tires & Rubber | 1.2% | |||
Biotechnology | 1.1% | |||
Broadcasting | 1.1% | |||
Fertilizers & Agricultural Chemicals | 1.1% | |||
Food Retail | 1.1% | |||
Life Sciences Tools & Services | 1.1% | |||
Reinsurance | 1.1% | |||
Diversified Real Estate Activities | 1.0% | |||
Home Entertainment Software | 1.0% | |||
Research & Consulting Services | 1.0% | |||
Soft Drinks | 1.0% | |||
Other Industries (each less than 1%) | 12.8% | |||
|
| |||
| 92.7% | ||||
|
|
Percentages are based upon common stocks as a percentage of net assets.
| 8 | MANAGEMENT OVERVIEW |
Table of Contents
ICON Asia-Pacific Region Fund
Average Annual Total Return
as of September 30, 2013
| Inception Date | 1 Year | 5 Years | 10 Years | Since Inception | Gross Expense Ratio* | Net Expense Ratio* | ||||||||||||||||||||||
ICON Asia-Pacific Region Fund - Class S | 2/25/97 | 11.44% | 8.34% | 8.13% | 3.14% | 1.50% | 1.50% | |||||||||||||||||||||
ICON Asia-Pacific Region Fund - Class C | 1/25/08 | 10.44% | 7.30% | N/A | -0.45% | 3.91% | 2.55% | |||||||||||||||||||||
ICON Asia-Pacific Region Fund - Class A | 5/31/06 | 11.29% | 8.13% | N/A | 2.49% | �� | 2.88% | 1.80% | ||||||||||||||||||||
ICON Asia-Pacific Region Fund - Class A (including maximum sales charge of 5.75%) | 5/31/06 | 4.91% | 6.86% | N/A | 1.67% | 2.88% | 1.80% | |||||||||||||||||||||
MSCI All Country Asia-Pacific Index | 16.16% | 8.20% | 8.43% | 3.41% | N/A | N/A | ||||||||||||||||||||||
Past performance is not a guarantee of future results. Information about these performance results and the comparative indexes can be found in the About This Report section. The Adviser has agreed to limit certain expenses on Class C and Class A shares; without these limitations, returns would have been lower. The limitation provisions may be terminated in the future.
| * | Please see the most recent prospectus for details. |
Class C total returns exclude applicable sales charges. If sales charges were included returns would be lower.
| MANAGEMENT OVERVIEW | 9 |
Table of Contents
ICON Asia-Pacific Region Fund
Value of a $10,000 Investment
through September 30, 2013
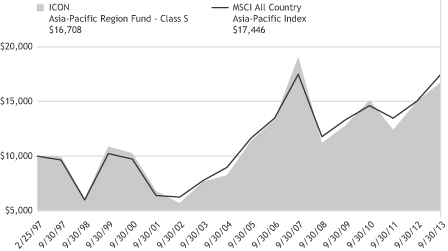
Past performance is not a guarantee of future results. The above graph compares a $10,000 investment made in the Asia-Pacific Region Fund’s Class S shares on the Class’ inception date of 2/25/97 to a $10,000 investment made in an unmanaged securities index on that date. The Asia-Pacific Region Fund’s performance in this chart and the performance table assumes the reinvestment of dividends, capital gain distributions and tax return of capital, but does not reflect the deduction of taxes that a shareholder would pay on Fund distributions or on the redemption of Fund shares.
| 10 | MANAGEMENT OVERVIEW |
Table of Contents
ICON ASIA-PACIFIC REGION FUND
SCHEDULEOF INVESTMENTS
SEPTEMBER 30, 2013
| Shares or Principal Amount | Value | |||||||
| Common Stocks (92.7%) | ||||||||
| 103,000 | Adani Ports and Special Economic Zone* | $ | 225,863 | |||||
| 17,000 | Advanced Info Service PCL* | 138,911 | ||||||
| 6,088,000 | Alam Sutera Realty Tbk PT* | 314,677 | ||||||
| 24,400 | Amcor, Ltd.* | 238,061 | ||||||
| 12,000 | Ansell, Ltd.*(a) | 233,843 | ||||||
| 161,000 | Apollo Tyres, Ltd.* | 172,525 | ||||||
| 41,000 | Aurizon Holdings, Ltd.* | 179,139 | ||||||
| 5,600 | Baidu, Inc., ADR†** | 869,008 | ||||||
| 102,500 | Bangkok Dusit Medical Services PCL* | 413,683 | ||||||
| 411,000 | Bank Negara Indonesia Persero Tbk PT* | 144,500 | ||||||
| 446,000 | Bank Rakyat Indonesia Persero Tbk PT* | 278,999 | ||||||
| 422,000 | Beijing Capital International Airport Co., Ltd.* | 278,848 | ||||||
| 56,000 | Bumrungrad Hospital PCL* | 146,955 | ||||||
| 7,700 | Canon, Inc.* | 246,549 | ||||||
| 14,287 | Celltrion, Inc.** | 621,506 | ||||||
| 303,000 | Central Pattana PCL* | 426,090 | ||||||
| 650,000 | Chaoda Modern Agriculture Holdings, Ltd.†***(b) | - | ||||||
| 154,000 | China Overseas Land & Investment Ltd.* | 456,458 | ||||||
| 102,000 | China Resources Power Holdings Co. Ltd.* | 243,518 | ||||||
| Shares or Principal Amount | Value | |||||||
| 110,000 | China State Construction International Holdings Ltd.* | $ | 176,218 | |||||
| 235,000 | CIMB Group Holdings Bhd* | 541,510 | ||||||
| 11,200 | Coca-Cola Amatil, Ltd.* | 128,265 | ||||||
| 8,500 | Coca-Cola West Co., Ltd.* | 169,874 | ||||||
| 180,000 | ComfortDelGro Corp., Ltd.*(a) | 283,245 | ||||||
| 9,400 | Commonwealth Bank of Australia* | 624,725 | ||||||
| 300,000 | CP ALL PCL* | 338,336 | ||||||
| 42,900 | Crown, Ltd.* | 622,869 | ||||||
| 5,600 | CSL, Ltd.* | 334,253 | ||||||
| 20,900 | Divi’s Laboratories, Ltd.* | 322,289 | ||||||
| 4,200 | Doosan Heavy Industries and Construction Co., Ltd.* | 180,231 | ||||||
| 724,000 | Ezion Holdings, Ltd.* | 1,271,023 | ||||||
| 75,000 | Galaxy Entertainment Group Ltd.†* | 527,027 | ||||||
| 24,500 | HDFC Bank Ltd.* | 232,860 | ||||||
| 16,000 | Hengan International Group Co., Ltd.* | 187,237 | ||||||
| 59,000 | Hitachi, Ltd.* | 390,948 | ||||||
| 1,370,800 | Home Product Center PCL*(a) | 536,199 | ||||||
| 8,100 | Honda Motor Co., Ltd.* | 309,604 | ||||||
| 53,900 | Hong Leong Bank Bhd* | 231,143 | ||||||
| 72,000 | Insurance Australia Group, Ltd.* | 394,693 | ||||||
| SCHEDULEOF INVESTMENTS | 11 |
Table of Contents
| Shares or Principal Amount | Value | |||||||
| 12,000 | Japan Tobacco, Inc.* | $ | 432,597 | |||||
| 20,000 | Kakaku.com, Inc.* | 467,554 | ||||||
| 35,000 | Kasikornbank PCL* | 195,915 | ||||||
| 8,000 | KDDI Corp.*(a) | 411,120 | ||||||
| 29,200 | Korean Reinsurance Co.* | 347,504 | ||||||
| 656,250 | Krung Thai Bank PCL* | 403,249 | ||||||
| 270 | LG Household & Health Care, Ltd.* | 137,040 | ||||||
| 40,000 | LIC Housing Finance Ltd.* | 120,433 | ||||||
| 3,762,000 | Lippo Karawaci Tbk PT†* | 353,813 | ||||||
| 90,000 | Luk Fook Holdings International Ltd.* | 283,089 | ||||||
| 70,000 | Marubeni Corp.*(a) | 553,588 | ||||||
| 21,100 | Maruti Suzuki India Ltd.* | 459,870 | ||||||
| 1,435,500 | Media Nusantara Citra Tbk PT* | 334,964 | ||||||
| 122,000 | Mirvac Group, REIT* | 198,334 | ||||||
| 353,000 | Mitra Adiperkasa Tbk PT* | 189,003 | ||||||
| 8,000 | Mitsubishi Corp.* | 162,431 | ||||||
| 1,700 | NCSoft Corp.* | 302,366 | ||||||
| 7,100 | Nidec Corp.*(a) | 598,197 | ||||||
| 2,700 | Philippine Long Distance Telephone Co.* | 184,124 | ||||||
| 265,572 | PTT Global Chemical PCL* | 633,849 | ||||||
| 66,400 | PTT PCL* | 671,622 | ||||||
| 428,300 | Puregold Price Club, Inc.* | 410,704 | ||||||
| 7,200 | REA Group Ltd.* | 254,241 | ||||||
| 63,000 | Robinson Department Store PCL* | 95,881 | ||||||
| 72,000 | SAI Global, Ltd.*(a) | 298,505 | ||||||
| 970 | Samsung Electronics Co., Ltd.* | 1,233,833 | ||||||
| 500,000 | Shenguan Holdings Group, Ltd.* | 212,458 | ||||||
| Shares or Principal Amount | Value | |||||||
| 1,800 | Shimamura Co., Ltd.* | $ | 179,217 | |||||
| 438,000 | Shun Tak Holdings Ltd.* | 246,409 | ||||||
| 11,500 | Siam City Cement PCL* | 148,951 | ||||||
| 90,000 | Singapore Telecommunications, Ltd.* | 269,378 | ||||||
| 2,100 | SK Telecom Co., Ltd.* | 429,428 | ||||||
| 12,000 | Sumitomo Rubber Industries, Ltd.* | 185,740 | ||||||
| 5,900 | Sysmex Corp.*(a) | 377,305 | ||||||
| 61,000 | Telstra Corp., Ltd.* | 283,052 | ||||||
| 6,100 | Tokio Marine Holdings, Inc.* | 199,989 | ||||||
| 10,000 | Toyo Suisan Kaisha, Ltd.*(a) | 293,609 | ||||||
| 13,100 | Toyota Motor Corp.* | 840,201 | ||||||
| 58,400 | Union Bank of India* | 102,382 | ||||||
| 143,000 | United Phosphorus, Ltd.* | 329,705 | ||||||
| 6,000 | Wesfarmers, Ltd.* | 230,499 | ||||||
| 37,000 | Westfield Group, REIT* | 380,225 | ||||||
| 18,700 | Westpac Banking Corp.* | 571,600 | ||||||
|
| |||||||
| | Total Common Stocks (Cost $26,207,877) | 28,445,656 | ||||||
| Collateral for Securities on Loan (9.9%) | ||||||||
| 3,033,965 | State Street Navigator Prime Portfolio, 0.17% | 3,033,965 | ||||||
|
| |||||||
| | Total Collateral for Securities on Loan (Cost $3,033,965) | 3,033,965 | ||||||
| 12 | SCHEDULEOF INVESTMENTS |
Table of Contents
| Shares or Principal Amount | Value | |||||||
| Short-Term Investments (5.6%) | ||||||||
| $ | 1,711,778 | State Street Euro Dollar Time Deposit (USD), 0.01%, 10/01/13 | $ | 1,711,778 | ||||
|
| |||||||
| | Total Short-Term Investments (Cost $1,711,778) | 1,711,778 | ||||||
| | Total Investments 108.2% (Cost $30,953,620) | 33,191,399 | ||||||
| | Liabilities Less Other Assets (8.2)% | (2,518,568 | ) | |||||
|
| |||||||
| Net Assets 100.0% | $ | 30,672,831 | ||||||
|
| |||||||
The accompanying notes are an integral part of the financial statements.
| † | Non-income producing security. |
| * | The value of foreign securities fair valued (Note 2) as of September 30, 2013 was 87.9% of net assets. |
| ** | This security is considered a Level 1 security. See Note 2 for further details. |
| *** | This security is considered a Level 3 security. See Note 2 for further details. |
| (a) | All or a portion of the security was on loan as of September 30, 2013. |
| (b) | This security is considered to be illiquid. The value of this security at September 30, 2013 was $0, which represents 0.0% of the Fund’s Net Assets. |
| ADR | American Depositary Receipt |
| REIT | Real Estate Investment Trust |
| SCHEDULEOF INVESTMENTS | 13 |
Table of Contents
MANAGEMENT OVERVIEW (UNAUDITED) | Class S Class C Class A | ICSEX ICUCX IERAX |
| Q. | How did the Fund perform relative to its benchmark? |
| A. | The ICON Europe Fund Class S (“Europe Fund”) returned 18.02% for the fiscal year ended September 30, 2013, underperforming the 24.95% return for the MSCI Europe Index. Total returns for other periods and additional Class shares as of September 30, 2013 appear in the subsequent pages of this Fund’s Management Overview. |
| Q. | What primary factors were behind the Fund’s relative performance? |
| A. | As another year has passed, Europe finds itself mired in a prolonged recession and an overall generally weak economic situation. Uncertainty still remains with the peripheral countries of Greece, Portugal, Italy, and Spain; yet the risk sentiment has generally improved from the elevated financial stresses of the past few years. Despite the troubling landscape, for yet another year we have seen rising equity prices in the European region as central bank intervention has continued to provide a form of stimulus to riskier assets. As this year comes to a close, many of the core concerns over the past few years remain and investors have ultimately benefited from the relative bargains that we have seen. Despite the economic uneasiness, European companies have remained resilient and equity prices have risen. Opportunities remain, but we see fewer opportunities under our system today than in past years. |
The period opened with the European region with a V/P of 1.27 according to our system. The region’s equity markets continued their advances from the prior year as improved risk taking led to gains in cyclical industries. However, the market advance paused in early spring as new concerns sparked up in the troubled island nation of Cyprus. As another victim of the ongoing Eurozone debt crisis, this was the fifth country to receive a bailout from the European Union and International Monetary Fund. Despite the attention and headlines, market reaction was notably muted as investors treated it as a non-event of sorts. As sentiment recovered, stocks worldwide were down in June as the U.S. Federal Reserve gave the first inclination of the possibility of tapering the bond purchasing under its quantitative easing operations. Fear of the potential effect of rising global interest rates led to market declines as investors pondered the possibility of decreased central bank intervention. Weakness in the emerging markets countries was also notable, proving especially problematic for commodity-based industries throughout Europe and the world as a whole. The market pullback ultimately turned into a short term buying opportunity and some
| 14 | MANAGEMENT OVERVIEW |
Table of Contents
improving economic data from Europe helped bolster further market advances into the end of the year.
As the period ended, European stocks continued their overall trend higher as cyclical stocks regained their leadership. However, many of the core problems in the region relating to economic growth and employment data signal continued signs of concern going forward. Corporate earnings have remained resilient and corporate credit spreads have not had an adverse effect on our view of intrinsic value, though higher prices have left us seeing a bit less upside than many times in the past three years. As such, we ended this period with stocks still trading at about a 9% discount to our estimate of intrinsic value. In other words, our system indicates bargains are still to be found in the region, despite the notable worries that still exist.
| Q. | How did the Fund’s composition affect performance? |
| A. | The Europe Fund’s composition over the year maintained a stance towards value, which ultimately maintained a tilt towards more of the defensive areas of the market, with Health Care and Consumer Staples making up some of the largest sector weights. These areas were able to generally keep pace with the broad market in terms of returns, and thus weren’t a source for material outperformance. The Europe Fund’s industry and security selection in the Materials sector contributed the most to relative performance as the Europe Fund was able to avoid metals & mining related industries which suffered losses over the period. Additionally, lower value readings kept the Europe Fund away from the Utilities sector, which lagged the benchmark and ultimately contributed to positive relative performance. |
Conversely, the two primary detractors were the Financials and Energy sectors. With all of the overhanging turmoil of the Eurozone banking crisis, financial stocks have continued to show difficulties, and earnings recovery and risk pressures have remained elevated. These factors have contributed to persistent lower valuations under our methodology, making the sector the least attractive to us in the European market for much of the year. Unfortunately, as the risk pressures gradually thawed, Financial sector stocks and industries benefited and were able to outperform the broad market; the Europe Fund was largely underweight and did not participate with these returns. On the other hand, the Energy sector showed great value according to our system entering the period and the Europe Fund maintained an overweight position relative to the benchmark. However, value didn’t translate to returns as the sector ended up being the worst performing group of the ten economic sectors we track and the Europe Fund performance was hindered.
| MANAGEMENT OVERVIEW | 15 |
Table of Contents
Regarding country composition, an overweight in France contributed positively to performance. Underweights in the United Kingdom also contributed positively as those stocks underperformed the benchmark. The Europe Fund’s primary detractor was an overweight in Norway as that country’s heavier natural resource-based exposure hindered returns in the Energy and Materials sectors.
Foreign currency exchange rates oscillated over the period. The Euro was generally higher, while the Pound erased mid-year losses to end the period essentially unchanged. Currency hedging was briefly used on the Pound and had a negligible positive effect on the Europe Fund returns.
| Q. | What is your investment outlook for the European equity market? |
| A. | Despite Europe’s prolonged recession and protracted economic malaise, the region’s stock markets have still been able to post healthy returns. We estimate that, on average, fair value for European equities is 10% higher than where prices are currently trading according to our system. While this is a bit lower than our readings in recent years, the region still shows the most upside compared to other regions worldwide according to our system. The Eurozone is in the midst of six consecutive quarters of economic contraction and the United Kingdom hasn’t fared much better with near zero growth itself. Continued loose monetary policy has helped shore up confidence and improved liquidity in the peripheral Eurozone countries remains another positive backdrop. Valuation is now a concern in some areas of the market as our readings show more areas that are now at fair value or even overvalued in both relative and absolute terms. As we come to our fiscal year-end, we believe the defensive, non-cyclical sectors within this region show the best opportunity to be the leaders over the foreseeable future; though lagging a bit of late, the two best bargains according to our system by sectors are Consumer Staples and Health Care. Additionally, Industrials and Consumer Discretionary sectors look attractive according to our valuation system. The Financials sector is still the lowest value sector, as prices have moved beyond our estimate of fair value. Similarly, Materials and Utilities remain low, signaling further caution in these areas of the market as a whole. |
We believe it is nearly impossible to accurately time market bottoms and we have long preached that rallies do not issue invitations. Using value as a guide in our disciplined, systematic and non-emotional approach to investing, we see opportunities amidst the turbulence and volatility. We continue to work methodically to identify the industries we believe are trading at a discount to fair value. Our valuations at the end of the fiscal year dictate that we remain nearly fully invested, but we will adjust accordingly as market conditions require.
| 16 | MANAGEMENT OVERVIEW |
Table of Contents
ICON Europe Fund
Country Composition
September 30, 2013
France | 28.1% | |||
Germany | 23.6% | |||
United Kingdom | 14.0% | |||
Denmark | 9.5% | |||
Switzerland | 5.1% | |||
Norway | 4.9% | |||
Netherlands | 4.8% | |||
Sweden | 1.7% | |||
Austria | 0.9% | |||
Luxembourg | 0.9% | |||
Finland | 0.8% | |||
Spain | 0.7% | |||
Hungary | 0.5% | |||
Ireland | 0.5% | |||
|
| |||
| 96.0% | ||||
|
|
Percentages are based upon common and preferred stocks as a percentage of net assets.
ICON Europe Fund
Sector Composition
September 30, 2013
Industrials | 23.3% | |||
Health Care | 23.1% | |||
Consumer Staples | 17.1% | |||
Information Technology | 12.6% | |||
Consumer Discretionary | 6.7% | |||
Materials | 5.7% | |||
Utilities | 3.6% | |||
Energy | 3.0% | |||
Financial | 0.9% | |||
|
| |||
| 96.0% | ||||
|
|
Percentages are based upon common and preferred stocks as a percentage of net assets.
ICON Europe Fund
Industry Composition
September 30, 2013
Pharmaceuticals | 8.8% | |||
Health Care Supplies | 7.6% | |||
Packaged Foods & Meats | 7.6% | |||
Apparel, Accessories & Luxury Goods | 5.9% | |||
Industrial Conglomerates | 5.3% | |||
IT Consulting & Other Services | 5.1% | |||
Aerospace & Defense | 5.0% | |||
Industrial Machinery | 4.9% | |||
Application Software | 3.4% | |||
Oil & Gas Equipment & Services | 3.0% | |||
Health Care Equipment | 2.9% | |||
Distillers & Vintners | 2.8% | |||
Semiconductors | 2.6% | |||
Research & Consulting Services | 2.5% | |||
Integrated Telecommunication Services | 2.4% | |||
Brewers | 2.3% | |||
Personal Products | 2.1% | |||
Health Care Services | 2.0% |
Electrical Components & Equipment | 1.8% | |||
Life Sciences Tools & Services | 1.6% | |||
Construction & Engineering | 1.5% | |||
Diversified Chemicals | 1.5% | |||
Metal & Glass Containers | 1.4% | |||
Tobacco | 1.3% | |||
Trucking | 1.3% | |||
Gas Utilities | 1.2% | |||
Household Products | 1.2% | |||
Industrial Gases | 1.0% | |||
Office Services & Supplies | 1.0% | |||
Systems Software | 1.0% | |||
Other Industries (each less than 1%) | 4.0% | |||
|
| |||
| 96.0% | ||||
|
|
Percentages are based upon common and preferred stocks as a percentage of net assets.
| MANAGEMENT OVERVIEW | 17 |
Table of Contents
ICON Europe Fund
Average Annual Total Return
as of September 30, 2013
| Inception Date | 1 Year | 5 Years | 10 Years | Since Inception | Gross Expense Ratio* | Net Expense Ratio* | ||||||||||||||||||||||
ICON Europe Fund - Class S | 2/20/97 | 18.02% | 3.92% | 7.23% | 6.00% | 1.56% | 1.56% | |||||||||||||||||||||
ICON Europe Fund - Class C | 1/25/08 | 16.89% | 2.90% | N/A | -2.92% | 21.20% | 2.55% | |||||||||||||||||||||
ICON Europe Fund - Class A | 5/31/06 | 17.82% | 3.69% | N/A | -0.09% | 13.30% | 1.80% | |||||||||||||||||||||
ICON Europe Fund - Class A (including maximum sales charge of 5.75%) | 5/31/06 | 11.01% | 2.47% | N/A | -0.89% | 13.30% | 1.80% | |||||||||||||||||||||
MSCI Europe Index | 24.95% | 6.71% | 9.08% | 6.49% | N/A | N/A | ||||||||||||||||||||||
Past performance is not a guarantee of future results. Information about these performance results and the comparative indexes can be found in the About This Report section. The Europe Fund’s name and investment strategy changed effective January 29, 2004. The Europe Fund’s past performance would have been different if the current strategy had been in effect. The Adviser has agreed to limit certain expenses on Class C and Class A shares; without these limitations, returns would have been lower. The limitation provisions may be terminated in the future.
| * | Please see the most recent prospectus for details. |
Class C total returns exclude applicable sales charges. If sales charges were included returns would be lower.
| 18 | MANAGEMENT OVERVIEW |
Table of Contents
ICON Europe Fund
Value of a $10,000 Investment
through September 30, 2013
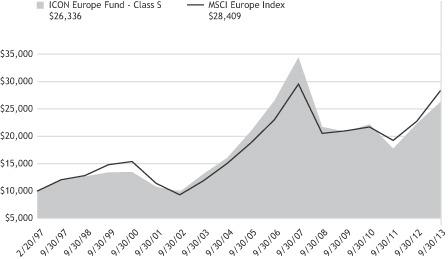
Past performance is not a guarantee of future results. The above graph compares a $10,000 investment made in the Fund’s Class S shares on the Class’ inception date of 2/20/97 to a $10,000 investment made in an unmanaged securities index on that date. The Fund’s performance in this chart and the performance table assumes the reinvestment of dividends, capital gain distributions and tax return of capital, but does not reflect the deduction of taxes that a shareholder would pay on Fund distributions or on the redemption of Fund shares.
| MANAGEMENT OVERVIEW | 19 |
Table of Contents
ICON EUROPE FUND
SCHEDULEOF INVESTMENTS
SEPTEMBER 30, 2013
| Shares or Principal Amount | Value | |||||||
| Common Stocks (93.2%) | ||||||||
| 2,100 | Adidas AG* | $ | 227,790 | |||||
| 1,900 | Allianz SE* | 298,924 | ||||||
| 53,700 | ARM Holdings PLC* | 859,522 | ||||||
| 1,426 | Aryzta AG†** | 95,494 | ||||||
| 9,300 | AtoS* | 726,158 | ||||||
| 5,200 | BASF SE* | 498,682 | ||||||
| 3,200 | BioMerieux** | 309,965 | ||||||
| 8,400 | British American Tobacco PLC* | 442,086 | ||||||
| 10,073 | Carl Zeiss Meditec AG* | 300,809 | ||||||
| 3,500 | Carlsberg A/S, Class B* | 360,720 | ||||||
| 10,500 | CGG†* | 242,047 | ||||||
| 1,400 | Christian Dior S.A.* | 274,769 | ||||||
| 12,300 | Cie Generale d’Optique Essilor International S.A.* | 1,322,868 | ||||||
| 22,000 | Coloplast A/S, Class B* | 1,253,049 | ||||||
| 21,900 | Diageo PLC* | 696,144 | ||||||
| 15,800 | DSV A/S* | 448,348 | ||||||
| 1,200 | Eurofins Scientific* | 302,406 | ||||||
| 9,200 | Experian PLC* | 175,166 | ||||||
| 5,400 | Fresenius SE & Co. KGaA* | 670,373 | ||||||
| 17,300 | Gerry Weber International AG* | 712,737 | ||||||
| 10,700 | Getinge AB, Class B* | 382,539 | ||||||
| 8,508 | GlaxoSmithKline PLC* | 213,915 | ||||||
| 55,800 | Groupe Steria SCA* | 958,463 | ||||||
| 5,800 | Heineken NV* | 410,912 | ||||||
| 2,000 | Hugo Boss AG* | 258,654 | ||||||
| 2,200 | Ingenico* | 158,541 | ||||||
| 6,000 | Koninklijke Boskalis Westminster NV* | 265,947 | ||||||
| 22,000 | Koninklijke Philips Electronics NV* | 709,743 | ||||||
| Shares or Principal Amount | Value | |||||||
| 5,100 | Krones AG* | $ | 433,699 | |||||
| 4,000 | L’Oreal S.A.* | 686,589 | ||||||
| 1,700 | Linde AG* | 336,886 | ||||||
| 2,570 | LVMH Moet Hennessy Louis Vuitton S.A.* | 506,458 | ||||||
| 1,296 | Mayr Melnhof Karton AG** | 139,913 | ||||||
| 20,000 | Nestle S.A.* | 1,394,682 | ||||||
| 2,600 | Novartis AG* | 199,987 | ||||||
| 5,600 | Novo Nordisk AS, Class B* | 948,440 | ||||||
| 5,000 | Novozymes AS, Class B* | 191,362 | ||||||
| 6,400 | Obrascon Huarte Lain S.A.* | 242,970 | ||||||
| 31,000 | Orkla ASA* | 225,835 | ||||||
| 889 | Osram Licht AG†** | 41,733 | ||||||
| 47,900 | Petroleum Geo-Services ASA* | 592,100 | ||||||
| 2,500 | Pfeiffer Vacuum Technology AG* | 306,244 | ||||||
| 11,000 | QIAGEN NV†* | 236,809 | ||||||
| 1,170 | Rational AG* | 348,839 | ||||||
| 2,100 | Remy Cointreau S.A.* | 223,732 | ||||||
| 59,090 | Rexam PLC* | 460,465 | ||||||
| 10,000 | Richter Gedeon Nyrt* | 174,141 | ||||||
| 66,500 | Rolls-Royce Holdings PLC†* | 1,196,459 | ||||||
| 6,600 | Rubis SCA* | 416,898 | ||||||
| 10,000 | Saab AB* | 199,692 | ||||||
| 14,300 | Sanofi* | 1,448,259 | ||||||
| 15,600 | SAP AG* | 1,153,698 | ||||||
| 6,800 | Schneider Electric S.A.* | 575,400 | ||||||
| 1,536 | Schoeller-Bleckmann Oilfield Equipment AG* | 181,624 | ||||||
| 20 | SCHEDULEOF INVESTMENTS |
Table of Contents
| Shares or Principal Amount | Value | |||||||
| 8,900 | Siemens AG* | $ | 1,073,324 | |||||
| 2,800 | Societe BIC S.A.* | 325,626 | ||||||
| 9,600 | Software AG* | 341,731 | ||||||
| 67,000 | Tate & Lyle PLC* | 798,391 | ||||||
| 34,400 | Telenor ASA* | 786,158 | ||||||
| 14,100 | Teleperformance* | 681,750 | ||||||
| 4,800 | Vallourec S.A.* | 287,617 | ||||||
| 5,900 | Wartsila Oyj Abp* | 266,896 | ||||||
| 1,700 | Zodiac Aerospace* | 270,617 | ||||||
|
| |||||||
| | Total Common Stocks (Cost $28,275,801) | 31,271,795 | ||||||
| Preferred Stocks (2.8%) | ||||||||
| 3,300 | Fuchs Petrolub SE* | 276,210 | ||||||
| 4,000 | Henkel AG & Co. KGaA* | 412,231 | ||||||
| 3,000 | Porsche Automobil Holding SE* | 261,881 | ||||||
|
| |||||||
| | Total Preferred Stocks (Cost $782,470) | 950,322 | ||||||
| Shares or Principal Amount | Value | |||||||
| Short-Term Investments (3.0%) | ||||||||
| $ | 1,014,308 | State Street Euro Dollar Time Deposit (USD), 0.01%, 10/01/13 | $ | 1,014,308 | ||||
|
| |||||||
| | Total Short-Term Investments (Cost $1,014,308) | 1,014,308 | ||||||
| | Total Investments 99.0% (Cost $30,072,579) | 33,236,425 | ||||||
| | Other Assets Less Liabilities 1.0% | 331,900 | ||||||
|
| |||||||
| Net Assets 100.0% | $ | 33,568,325 | ||||||
|
| |||||||
The accompanying notes are an integral part of the financial statements.
| † | Non-income producing security. |
| * | The value of foreign securities fair valued (Note 2) as of September 30, 2013 was 94.2% of net assets. |
| ** | This security is considered a Level 1 security. See Note 2 for further details. |
| SCHEDULEOF INVESTMENTS | 21 |
Table of Contents
MANAGEMENT OVERVIEW (UNAUDITED) | Class S Class C Class A | ICNEX IIQCX IIQAX |
| Q. | How did the Fund perform relative to its benchmark? |
| A. | The ICON International Equity Fund Class S (“International Equity Fund”) returned 7.33% for the fiscal year ended September 30, 2013, while the MSCI All World Country Index (ACWI ex-U.S.) returned 16.98%. Total returns for other periods and additional Class shares as of September 30, 2013 appear in the subsequent pages of this Fund’s Management Overview. |
| Q. | What primary factors were behind the Fund’s relative performance? |
| A. | While the global stock markets experienced another year of gains, the international markets experienced a new wave of both local and global factors that affected equity returns. Europe ended the period just as it entered it - in the middle of a recession and looking for hopes of any gradual economic improvement. In the Asia-Pacific region, Japan enacted an aggressive stimulation plan in hopes of spurring growth and inflation with fiscal and monetary stimulus. Japan’s stimulation plan had some profound local market reactions and a mix of differing side effects to other countries in the region. Additionally, China struggled with continued slow economic growth. For most parts of the world, generally weak data has kept central bank activity accommodative. Nevertheless, market interest rates have gradually risen, though they still remain low by historical standards, which in combination with rising equity prices, has started to sap some value according to our model from the equity markets as the period closed. |
While the global economy remained moderate, our valuation model pointed the International Equity Fund towards a consistent overweight position in the defensive themed sectors of Consumer Staples and Health Care for the period. However, gradual improvements in the United States had a beneficial effect on value in parts of other markets, which ultimately led to increases in some of the more economically sensitive areas, most notably Industrials. From a regional perspective, the most significant allocation change was an increase in European equities and a decrease in the Western Hemisphere. Despite the ongoing issues that overhang the world economy and rotations that may seem contrarian, our discipline and focus on value led us to sector and industry rotations in the International Equity Fund and ultimately benefited the International Equity Fund over the period.
As a multi-cap manager, we are not limited by restrictions on market capitalization. However, our valuation metrics resulted in a concentration
| 22 | MANAGEMENT OVERVIEW |
Table of Contents
in large-cap companies during the period. Despite the International Equity Fund’s concentration in large-cap stocks, the International Equity Fund remained underweight large-cap stocks relative to the benchmark. Large-cap stocks outperformed their small and mid-cap peers, which ultimately detracted from the International Equity Fund’s relative performance.
Currency movements worldwide throughout the fiscal year had a slightly negative effect on returns. The International Equity Fund benefited from a weaker U.S. dollar within Europe, while Asia-Pacific and Western Hemisphere currencies were detractors. Currency hedging was briefly used on the Pound and had a negligible positive effect on the International Equity Fund returns.
| Q. | How did the Fund’s composition affect performance? |
| A. | The International Equity Fund’s primary contributors to benchmark relative performance came from the Energy and Industrials sectors. Specifically, an overweight position combined with stock selection in the oil & gas equipment & services industry helped performance. Additionally, an overweight position relative to the benchmark to stocks in the industrial conglomerates and construction & engineering industries were notable bright spots within the Industrials sector. Conversely, the Consumer Discretionary sector was a detractor to benchmark relative performance, as country and industry selection with the automobile manufacturers and auto parts & equipment industries hindered the International Equity Fund’s returns. Financials was another notable source of relative underperformance as the sector outperformed the benchmark despite being one of the lowest value sectors; consequently, the International Equity Fund remained underweight this part of the market as better bargains were targeted elsewhere. Finally, the gold industry within the Materials sector suffered losses as commodity weakness over this period had an adverse effect on these companies’ stock prices. As the year ended, the gradual improvement in risk aversion and rising equity prices throughout the global markets indicated that prices have moved beyond our estimates of intrinsic value. As such, we see the market as a whole slightly over-valued; however, we believe there is still some upside evident in the defensive areas such as Consumer Staples and Health Care. |
There was a clear change in leadership from the prior year as emerging markets countries dramatically underperformed their developed counterparts. An example of this was Japan’s equities rise after years of lagging returns, combined with the underperformance of South Korea; the International Equity Fund was underweight the former and overweight the
| MANAGEMENT OVERVIEW | 23 |
Table of Contents
latter, which combined to be a large detractor from benchmark relative returns. Additionally, the heavy Energy exposure in the country of Norway detracted from performance as equities did not reach our estimate of fair value during the period. Singapore and France were two developed market standouts which contributed positively to returns, yet they were unable to make up for the losses in other country positions. As the period ended, the emerging markets as well as the Asia-Pacific region as a whole looked overvalued according to our system. Europe and developed countries in general showed the most upside globally.
| Q. | What is your investment outlook for the international equity market? |
| A. | After years of positive equity returns in the aftermath of the 2008-2009 recession, our system shows that stocks have finally caught up with, and even slightly surpassed, our estimate of their intrinsic value. At the end of the fiscal year, international markets had a V/P reading of 0.97, implying that, on average, fair value for stocks is about 3% lower than where they are currently trading. Risk aversion has improved and corporate earnings have been able to grow despite the ongoing economic struggles and fluctuations in global interest rates. While interest rates remain low, thanks in great part to loose monetary policy and central bank intervention, our valuation readings still signal near-term caution in the international markets. Europe represents the best opportunity from a regional perspective, with Asia-Pacific showing the least upside according to our valuation system. While certain emerging market countries have suffered recent equity market losses, collectively they are not yet showing attractive entry points; although, some select countries such as Indonesia, Philippines, and India are among those areas that are showing good opportunity from a value perspective. Developed market countries in Europe show attractive upside in countries like Austria, Denmark, Germany, and France. As of the end of the fiscal year 2013; we estimate that, on average, fair value for European equities is 10% higher than where prices are currently trading. |
We believe that we are in still in a recovery from the recession of 2008-09, although strength of the global economies has showed mixed signs of health and concern. Despite the ever-present global economic worries, stocks have moved higher and have even surpassed our estimate of fair value. The International Equity Fund ended the fiscal year with close to 5.2% in cash. From a sector perspective, we are still tilted towards the Consumer Staples and Health Care sectors as they are still showing some of the best bargains around the equity markets according to our system. Materials is now the most over-valued sector, followed by Financials which still struggles with the lingering effects of the financial
| 24 | MANAGEMENT OVERVIEW |
Table of Contents
crisis; both of these sectors are underweight their respective benchmark weightings as we see a potential for further downside movement.
Europe, with countries like Austria, Denmark, France, and Germany, remains the most attractive region according to our valuation metrics. Within the Western Hemisphere, Canada and Mexico look attractive to our system with Indonesia, the Philippines, and India currently showing the most value in the Asia-Pacific region.
At ICON we continue to seek out industries that our system identifies as trading at a discount to fair value. Guided by our disciplined, systematic and non-emotional approach to investing, we see numerous opportunities amidst the recent turbulence and volatility. We believe it is nearly impossible to accurately time market bottoms and we believe rallies do not offer invitations. Therefore, given our current valuations, we remain almost fully invested. As market conditions dictate, we will adjust accordingly.
ICON International Equity Fund
Country Composition
September 30, 2013
France | 16.1% | |||
Germany | 11.9% | |||
South Korea | 9.3% | |||
Japan | 7.5% | |||
United Kingdom | 6.9% | |||
Canada | 5.8% | |||
Denmark | 5.7% | |||
Thailand | 5.5% | |||
Singapore | 5.3% | |||
India | 4.0% | |||
Norway | 3.4% | |||
Switzerland | 2.3% | |||
Indonesia | 2.0% | |||
Philippines | 1.9% | |||
Hong Kong | �� | 1.3% | ||
Netherlands | 1.1% | |||
Luxembourg | 0.7% | |||
Brazil | 0.5% | |||
Finland | 0.5% | |||
Austria | 0.3% | |||
|
| |||
| 92.0% | ||||
|
|
Percentages are based upon common and preferred stocks as a percentage of net assets.
ICON International Equity Fund
Sector Composition
September 30, 2013
Industrials | 17.2% | |||
Health Care | 16.2% | |||
Information Technology | 14.4% | |||
Consumer Staples | 13.4% | |||
Consumer Discretionary | 8.7% | |||
Energy | 8.2% | |||
Financial | 7.2% | |||
Materials | 3.6% | |||
Utilities | 2.3% | |||
Telecommunication | 0.8% | |||
|
| |||
| 92.0% | ||||
|
|
Percentages are based upon common and preferred stocks as a percentage of net assets.
| MANAGEMENT OVERVIEW | 25 |
Table of Contents
ICON International Equity Fund
Industry Composition
September 30, 2013
Oil & Gas Equipment & Services | 7.1% | |||
Pharmaceuticals | 6.6% | |||
IT Consulting & Other Services | 5.4% | |||
Packaged Foods & Meats | 4.6% | |||
Health Care Supplies | 4.5% | |||
Semiconductors | 4.4% | |||
Industrial Conglomerates | 4.0% | |||
Industrial Machinery | 3.9% | |||
Apparel, Accessories & Luxury Goods | 3.2% | |||
Trading Companies & Distributors | 2.4% | |||
Application Software | 2.3% | |||
Electronic Equipment & Instruments | 2.3% | |||
Home Improvement Retail | 2.2% | |||
Life Sciences Tools & Services | 2.2% | |||
Aerospace & Defense | 2.1% | |||
Food Retail | 1.9% | |||
Household Products | 1.9% |
Hypermarkets & Super Centers | 1.9% | |||
Real Estate Development | 1.8% | |||
Real Estate Operating Companies | 1.8% | |||
Distillers & Vintners | 1.5% | |||
Health Care Services | 1.5% | |||
Integrated Telecommunication Services | 1.5% | |||
Property & Casualty Insurance | 1.3% | |||
Research & Consulting Services | 1.3% | |||
Automobile Manufacturers | 1.2% | |||
Commodity Chemicals | 1.0% | |||
Electrical Components & Equipment | 1.0% | |||
Metal & Glass Containers | 1.0% | |||
Other Industries (each less than 1%) | 14.2% | |||
|
| |||
| 92.0% | ||||
|
|
Percentages are based upon common and preferred stocks as a percentage of net assets.
| 26 | MANAGEMENT OVERVIEW |
Table of Contents
ICON International Equity Fund
Average Annual Total Return
as of September 30, 2013
| Inception Date | 1 Year | 5 Years | 10 Years | Since Inception | Gross Expense Ratio* | Net Expense Ratio* | ||||||||||||||||||||||
ICON International Equity Fund - Class S | 2/18/97 | 7.33% | 3.03% | 7.33% | 5.59% | 1.39% | 1.39% | |||||||||||||||||||||
ICON International Equity Fund - Class C | 2/19/04 | 6.14% | 1.86% | N/A | 2.92% | 2.72% | 2.55% | |||||||||||||||||||||
ICON International Equity Fund - Class A | 5/31/06 | 7.03% | 2.63% | N/A | -0.70% | 2.01% | 1.80% | |||||||||||||||||||||
ICON International Equity Fund - Class A (including maximum sales charge of 5.75%) | 5/31/06 | 0.88% | 1.42% | N/A | -1.50% | 2.01% | 1.80% | |||||||||||||||||||||
MSCI ACWI ex-U.S. | 16.98% | 6.74% | 9.24% | 5.56% | N/A | N/A | ||||||||||||||||||||||
Past performance is not a guarantee of future results. Information about these performance results and the comparative indexes can be found in the About This Report section. The International Equity Fund’s name and investment strategy changed effective January 29, 2004. The International Equity Fund’s past performance would have been different if the current strategy had been in effect. The Adviser has agreed to limit certain Fund expenses; without these limitations, returns would have been lower. The limitation provisions may be terminated in the future.
| * | Please see the most recent prospectus for details. |
Class C total returns exclude applicable sales charges. If sales charges were included returns would be lower.
| MANAGEMENT OVERVIEW | 27 |
Table of Contents
ICON International Equity Fund
Value of a $10,000 Investment
through September 30, 2013
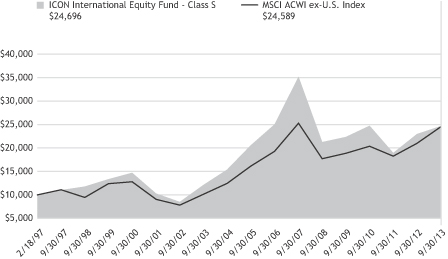
Past performance is not a guarantee of future results. The above graph compares a $10,000 investment made in the International Equity Fund’s Class S shares on the Class’ inception date of 2/18/97 to a $10,000 investment made in an unmanaged securities index on that date. Performance for the International Equity Fund’s other share classes will vary due to differences in charges and expenses. The International Equity Fund’s performance in this chart and the performance table assumes the reinvestment of dividends, capital gain distributions and tax return of capital, but does not reflect the deduction of taxes that a shareholder would pay on Fund distributions or on the redemption of Fund shares.
| 28 | MANAGEMENT OVERVIEW |
Table of Contents
ICON INTERNATIONAL EQUITY FUND
SCHEDULEOF INVESTMENTS
SEPTEMBER 30, 2013
| Shares or Principal Amount | Value | |||||||
| Common Stocks (91.5%) | ||||||||
| 254,000 | Adani Enterprises, Ltd.* | $ | 571,712 | |||||
| 5,400,000 | Alam Sutera Realty Tbk PT* | 279,115 | ||||||
| 16,200 | Alimentation Couche Tard, Inc., Class B** | 1,010,013 | ||||||
| 1,400 | Allianz SE* | 220,260 | ||||||
| 34,300 | ARM Holdings PLC* | 549,005 | ||||||
| 1,475 | Aryzta AG†** | 98,775 | ||||||
| 11,000 | AtoS* | 858,897 | ||||||
| 100,000 | Bangkok Dusit Medical Services PCL* | 403,593 | ||||||
| 4,400 | BASF SE* | 421,962 | ||||||
| 3,000 | Canadian Pacific Railway Ltd.** | 370,147 | ||||||
| 10,345 | Carl Zeiss Meditec AG* | 308,932 | ||||||
| 4,200 | Carlsberg A/S, Class B* | 432,864 | ||||||
| 34,000 | CCR S.A.** | 266,164 | ||||||
| 27,008 | Celltrion, Inc.** | 1,174,889 | ||||||
| 684,000 | Central Pattana PCL* | 961,867 | ||||||
| 9,900 | CGG†* | 228,216 | ||||||
| 24,800 | CGI Group, Inc., Class A†** | 870,366 | ||||||
| 1,702,000 | Chaoda Modern Agriculture Holdings, Ltd.†***(a) | - | ||||||
| 1,200 | Christian Dior S.A.* | 235,516 | ||||||
| 11,800 | Cie Generale d’Optique Essilor International S.A.* | 1,269,093 | ||||||
| 19,500 | Coloplast A/S, Class B* | 1,110,657 | ||||||
| 18,100 | Diageo PLC* | 575,352 | ||||||
| 50,000 | Divi’s Laboratories, Ltd.* | 771,027 | ||||||
| Shares or Principal Amount | Value | |||||||
| 3,200 | Dollarama, Inc.** | $ | 260,057 | |||||
| 12,900 | DSV A/S* | 366,056 | ||||||
| 7,000 | Enbridge, Inc.**(b) | 292,355 | ||||||
| 1,400 | Eurofins Scientific* | 352,807 | ||||||
| 1,590,000 | Ezion Holdings, Ltd.* | 2,791,334 | ||||||
| 6,500 | Fresenius SE & Co. KGaA* | 806,931 | ||||||
| 24,400 | Gerry Weber International AG* | 1,005,248 | ||||||
| 65,000 | Groupe Steria SCA* | 1,116,489 | ||||||
| 480,000 | Guangdong Investment, Ltd.* | 412,228 | ||||||
| 142,000 | Hitachi, Ltd.* | 940,926 | ||||||
| 3,000,000 | Home Product Center PCL*(b) | 1,173,473 | ||||||
| 10,000 | Husky Energy, Inc.**(b) | 287,559 | ||||||
| 15,000 | Hyundai Greenfood Co., Ltd.* | 239,954 | ||||||
| 3,700 | Ingenico* | 266,637 | ||||||
| 12,000 | Komatsu, Ltd.*(b) | 299,628 | ||||||
| 18,200 | Koninklijke Philips Electronics NV* | 587,151 | ||||||
| 4,700 | Krones AG* | 399,683 | ||||||
| 2,600 | L’Oreal S.A.* | 446,283 | ||||||
| 2,000 | LG Household & Health Care, Ltd.* | 1,015,113 | ||||||
| 165,000 | LIC Housing Finance Ltd.* | 496,786 | ||||||
| 31,000 | LIG Insurance Co., Ltd.* | 704,026 | ||||||
| 1,300 | Linde AG* | 257,619 | ||||||
| 6,000,000 | Lippo Karawaci Tbk PT* | 564,296 | ||||||
| 2,500 | LVMH Moet Hennessy Louis Vuitton S.A.* | 492,663 | ||||||
| 13,800 | Makita Corp.* | 804,033 | ||||||
| 1,490 | Mayr Melnhof Karton AG** | 160,857 | ||||||
| SCHEDULEOF INVESTMENTS | 29 |
Table of Contents
| Shares or Principal Amount | Value | |||||||
| 35,000 | Mitsubishi Corp.* | $ | 710,633 | |||||
| 16,300 | Nestle S.A.* | 1,136,666 | ||||||
| 14,000 | NGK Spark Plug Co., Ltd.* | 310,716 | ||||||
| 6,600 | Novo Nordisk AS, Class B* | 1,117,805 | ||||||
| 36,000 | Orkla ASA* | 262,259 | ||||||
| 1,060 | Osram Licht AG†** | 49,761 | ||||||
| 59,000 | Petroleum Geo-Services ASA* | 729,309 | ||||||
| 1,060,000 | Puregold Price Club, Inc.* | 1,016,451 | ||||||
| 2,000 | Remy Cointreau S.A.* | 213,078 | ||||||
| 68,000 | Rexam PLC* | 529,897 | ||||||
| 60,700 | Rolls-Royce Holdings PLC†* | 1,092,106 | ||||||
| 6,700 | Rubis SCA* | 423,215 | ||||||
| 1,400 | Samsung Electronics Co., Ltd.* | 1,780,791 | ||||||
| 12,030 | Sanofi* | 1,218,360 | ||||||
| 16,400 | SAP AG* | 1,212,862 | ||||||
| 5,600 | Schneider Electric S.A.* | 473,859 | ||||||
| 450,000 | Shun Tak Holdings Ltd.* | 253,160 | ||||||
| 10,600 | Siemens AG* | 1,278,341 | ||||||
| 750,000 | Supalai PCL* | 376,438 | ||||||
| 1,100,000 | Surya Citra Media Tbk PT* | 242,282 | ||||||
| 75,000 | Tate & Lyle PLC* | 893,722 | ||||||
| Shares or Principal Amount | Value | |||||||
| 35,000 | Telenor ASA* | $ | 799,870 | |||||
| 14,300 | Teleperformance* | 691,420 | ||||||
| 40,000 | Toray Industries, Inc.*(b) | 263,783 | ||||||
| 9,500 | Toyota Motor Corp.* | 609,306 | ||||||
| 9,700 | Vallourec S.A.* | 581,226 | ||||||
| 6,100 | Wartsila Oyj Abp* | 275,943 | ||||||
| 55,000 | Yes Bank Ltd.* | 252,510 | ||||||
|
| |||||||
| | Total Common Stocks (Cost $45,836,425) | 48,324,383 | ||||||
| Preferred Stock (0.5%) | ||||||||
| 3,600 | Fuchs Petrolub SE* | 301,320 | ||||||
|
| |||||||
| | Total Preferred Stocks (Cost $280,849) | 301,320 | ||||||
| Collateral for Securities on Loan (3.4%) | ||||||||
| 1,769,478 | State Street Navigator Prime Portfolio, 0.17% | 1,769,478 | ||||||
|
| |||||||
| | Total Collateral for Securities on Loan (Cost $1,769,478) | 1,769,478 | ||||||
| Short-Term Investments (5.2%) | ||||||||
| $ | 2,743,691 | State Street Euro Dollar Time Deposit (USD), 0.01%, 10/01/13 | 2,743,691 | |||||
|
| |||||||
| | Total Short-Term Investments (Cost $2,743,691) | 2,743,691 | ||||||
| | Total Investments 100.6% (Cost $50,630,443) | 53,138,872 | ||||||
| | Liabilities Less Other Assets (0.6)% | (334,396 | ) | |||||
|
| |||||||
| Net Assets 100.0% | $ | 52,804,476 | ||||||
|
| |||||||
The accompanying notes are an integral part of the financial statements.
| † | Non-income producing security. |
| * | The value of foreign securities fair valued (Note 2) as of September 30, 2013 was 82.9% of net assets. |
| ** | This security is considered a Level 1 security. See Note 2 for further details. |
| *** | This security is considered a Level 3 security. See Note 2 for further details. |
| (a) | This security is considered to be illiquid. The value of this security at September 30, 2013 was $0, which represents 0.0% of the Fund’s Net Assets. |
| (b) | All or a portion of the security was on loan as of September 30, 2013. |
| 30 | SCHEDULEOF INVESTMENTS |
Table of Contents
(This page is intentionally left blank)
Table of Contents
STATEMENTSOF ASSETSAND LIABILITIES
SEPTEMBER 30, 2013
| ICON Asia-Pacific Region Fund | ICON Europe Fund | ICON International Equity Fund | ||||||||||
Assets | ||||||||||||
Investments, at cost | $ | 30,953,620 | $ | 30,072,579 | $ | 50,630,443 | ||||||
|
|
|
|
|
| |||||||
Investments, at value† | 33,191,399 | 33,236,425 | 53,138,872 | |||||||||
Foreign currency, at value(a) | 11,729 | 7,114 | 946 | |||||||||
Receivables: | ||||||||||||
Fund shares sold | 71 | 36,475 | 719 | |||||||||
Investments sold | 545,445 | 282,850 | 1,663,605 | |||||||||
Dividends | 105,892 | 18,832 | 62,098 | |||||||||
Expense reimbursements due from Adviser | 19,801 | 16,395 | 7,817 | |||||||||
Foreign tax reclaims | 301 | 37,120 | 37,617 | |||||||||
Other assets | 13,839 | 13,917 | 19,059 | |||||||||
|
|
|
|
|
| |||||||
Total Assets | 33,888,477 | 33,649,128 | 54,930,733 | |||||||||
|
|
|
|
|
| |||||||
Liabilities | ||||||||||||
Payables: | ||||||||||||
Investments purchased | – | – | 149,841 | |||||||||
Payable for collateral received on securities loaned | 3,033,965 | – | 1,769,478 | |||||||||
Fund shares redeemed | 47,083 | 10,365 | 63,655 | |||||||||
Advisory fees | 27,735 | 27,801 | 44,754 | |||||||||
Accrued distribution fees | 810 | 95 | 5,698 | |||||||||
Fund accounting fees | 879 | 839 | 754 | |||||||||
Transfer agent fees | 8,880 | 5,946 | 12,043 | |||||||||
Administration fees | 1,387 | 1,390 | 2,237 | |||||||||
Trustee fees | 1,237 | 984 | 1,968 | |||||||||
Capital gains tax | 53,802 | – | 36,253 | |||||||||
Accrued expenses | 39,868 | 33,383 | 39,576 | |||||||||
|
|
|
|
|
| |||||||
Total Liabilities | 3,215,646 | 80,803 | 2,126,257 | |||||||||
|
|
|
|
|
| |||||||
Net Assets - all share classes | $ | 30,672,831 | $ | 33,568,325 | $ | 52,804,476 | ||||||
|
|
|
|
|
| |||||||
Net Assets - Class S | $ | 29,052,569 | $ | 33,328,074 | $ | 42,105,000 | ||||||
|
|
|
|
|
| |||||||
Net Assets - Class C | $ | 831,539 | $ | 77,303 | $ | 5,656,706 | ||||||
|
|
|
|
|
| |||||||
Net Assets - Class A | $ | 788,723 | $ | 162,948 | $ | 5,042,770 | ||||||
|
|
|
|
|
| |||||||
| 32 | FINANCIAL STATEMENTS |
Table of Contents
| ICON Asia-Pacific Region Fund | ICON Europe Fund | ICON International Equity Fund | ||||||||||
Net Assets Consist of | ||||||||||||
Paid-in capital | $ | 38,514,877 | $ | 80,514,396 | $ | 141,389,896 | ||||||
Accumulated undistributed net investment income/(loss) | 45,365 | 163,400 | 1,008 | |||||||||
Accumulated undistributed net realized gain/ (loss) | (10,070,349 | ) | (50,273,685 | ) | (91,054,571 | ) | ||||||
Unrealized appreciation/(depreciation) | 2,182,938 | 3,164,214 | 2,468,143 | |||||||||
|
|
|
|
|
| |||||||
Net Assets | $ | 30,672,831 | $ | 33,568,325 | $ | 52,804,476 | ||||||
|
|
|
|
|
| |||||||
Shares outstanding (unlimited shares authorized, no par value) | ||||||||||||
Class S | 2,150,260 | 2,251,703 | 3,565,768 | |||||||||
Class C | 63,668 | 5,332 | 519,359 | |||||||||
Class A | 58,368 | 11,006 | 429,197 | |||||||||
Net asset value (offering and redemption price per share) | ||||||||||||
Class S | $ | 13.51 | $ | 14.80 | $ | 11.81 | ||||||
Class C | $ | 13.06 | $ | 14.50 | $ | 10.89 | ||||||
Class A | $ | 13.51 | $ | 14.81 | $ | 11.75 | ||||||
Class A maximum offering price | $ | 14.33 | $ | 15.71 | $ | 12.47 | ||||||
† Includes securities on loan of | $ | 2,882,572 | $ | – | $ | 1,633,779 | ||||||
(a) Foreign currency, at cost | $ | 11,752 | $ | 7,116 | $ | 946 | ||||||
The accompanying notes are an integral part of the financial statements.
| FINANCIAL STATEMENTS | 33 |
Table of Contents
STATEMENTSOF OPERATIONS
FORTHEYEARENDED SEPTEMBER 30, 2013
| ICON Asia-Pacific Region Fund | ICON Europe Fund | ICON International Equity Fund | ||||||||||
Investment Income | ||||||||||||
Interest | $ | 128 | $ | 2,622 | $ | 3,896 | ||||||
Dividends | 840,219 | 842,404 | 1,368,251 | |||||||||
Income from securities lending, net | 12,445 | 36,103 | 82,141 | |||||||||
Foreign taxes withheld | (59,573 | ) | (110,658 | ) | (177,908 | ) | ||||||
|
|
|
|
|
| |||||||
Total Investment Income | 793,219 | 770,471 | 1,276,380 | |||||||||
|
|
|
|
|
| |||||||
Expenses | ||||||||||||
Advisory fees | 376,254 | 306,972 | 605,988 | |||||||||
Distribution fees: | ||||||||||||
Class C | 8,798 | 847 | 61,743 | |||||||||
Class A | 1,686 | 344 | 13,536 | |||||||||
Fund accounting fees | 10,087 | 7,976 | 16,366 | |||||||||
Transfer agent fees | 56,583 | 40,912 | 87,407 | |||||||||
Administration fees | 18,812 | 15,349 | 30,299 | |||||||||
Custody fees | 20,029 | 11,263 | 26,426 | |||||||||
Registration fees: | ||||||||||||
Class S | 14,312 | 15,146 | 8,400 | |||||||||
Class C | 8,648 | 7,149 | 8,816 | |||||||||
Class A | 5,998 | 5,914 | 8,051 | |||||||||
Insurance expense | 8,075 | 4,305 | 11,864 | |||||||||
Trustee fees and expenses | 4,935 | 3,867 | 8,287 | |||||||||
Audit and tax service expense | 35,680 | 35,594 | 32,022 | |||||||||
Interest expense | 787 | 27 | 2,318 | |||||||||
Other expenses | 74,707 | 46,948 | 80,346 | |||||||||
|
|
|
|
|
| |||||||
Total expenses before expense reimbursement | 645,391 | 502,613 | 1,001,869 | |||||||||
|
|
|
|
|
| |||||||
Expense reimbursement by Adviser due to expense limitation agreement | (18,421 | ) | (15,332 | ) | (33,867 | ) | ||||||
|
|
|
|
|
| |||||||
Net Expenses | 626,970 | 487,281 | 968,002 | |||||||||
|
|
|
|
|
| |||||||
Net Investment Income/(Loss) | 166,249 | 283,190 | 308,378 | |||||||||
|
|
|
|
|
| |||||||
Net Realized and Unrealized Gain/(Loss) | ||||||||||||
Net realized gain/(loss) on: | ||||||||||||
Investments | 1,463,941 | 3,720,650 | 2,688,672 | |||||||||
Foreign currency | (71,832 | ) | (171,711 | ) | (330,659 | ) | ||||||
Net realized capital gains tax | (7,727 | ) | - | (62,403 | ) | |||||||
Change in unrealized net appreciation/(depreciation) on: | ||||||||||||
Investments and foreign currency | 2,797,653 | 1,380,021 | 1,982,972 | |||||||||
Net unrealized capital gains tax | (53,802 | ) | - | (36,253 | ) | |||||||
|
|
|
|
|
| |||||||
Net realized and unrealized gain/(loss) | 4,128,233 | 4,928,960 | 4,242,329 | |||||||||
|
|
|
|
|
| |||||||
Net Increase/(Decrease) in Net Assets Resulting From Operations | $ | 4,294,482 | $ | 5,212,150 | $ | 4,550,707 | ||||||
|
|
|
|
|
| |||||||
The accompanying notes are an integral part of the financial statements.
| 34 | FINANCIAL STATEMENTS |
Table of Contents
(This page is intentionally left blank)
Table of Contents
STATEMENTSOF CHANGESIN NET ASSETS
| ICON Asia-Pacific Region Fund | ||||||||
| Year ended September 30, 2013 | Year ended September 30, 2012 | |||||||
Operations | ||||||||
Net investment income/(loss) | $ | 166,249 | $ | 495,617 | ||||
Net realized gain/(loss) | 1,463,941 | (821,355 | ) | |||||
Net realized gain/(loss) from foreign currency | (71,832 | ) | (131,423 | ) | ||||
Net realized capital gains tax | (7,727 | ) | (118,725 | ) | ||||
Change in net unrealized appreciation/(depreciation) | 2,743,851 | 11,219,183 | ||||||
|
|
|
| |||||
Net increase/(decrease) in net assets resulting from operations | 4,294,482 | 10,643,297 | ||||||
|
|
|
| |||||
Dividends and Distributions to Shareholders | ||||||||
Net investment income | ||||||||
Class S | (268,567 | ) | (215,357 | ) | ||||
Class C | (1,055 | ) | – | |||||
Class A | (1,610 | ) | (1,981 | ) | ||||
|
|
|
| |||||
Net decrease from dividends and distributions | (271,232 | ) | (217,338 | ) | ||||
|
|
|
| |||||
Fund Share Transactions | ||||||||
Shares sold | ||||||||
Class S | 7,722,364 | 9,967,625 | ||||||
Class C | 382,870 | 163,820 | ||||||
Class A | 657,009 | 579,330 | ||||||
Reinvested dividends and distributions | ||||||||
Class S | 261,722 | 209,005 | ||||||
Class C | 983 | – | ||||||
Class A | 1,367 | 1,823 | ||||||
Shares repurchased | ||||||||
Class S | (20,783,912 | ) | (38,006,696 | ) | ||||
Class C | (514,739 | ) | (237,980 | ) | ||||
Class A | (605,518 | ) | (773,178 | ) | ||||
|
|
|
| |||||
Net increase/(decrease) from fund share transactions | (12,877,854 | ) | (28,096,251 | ) | ||||
|
|
|
| |||||
Total net increase/(decrease) in net assets | (8,854,604 | ) | (17,670,292 | ) | ||||
Net Assets | ||||||||
Beginning of year | 39,527,435 | 57,197,727 | ||||||
|
|
|
| |||||
End of year | $ | 30,672,831 | $ | 39,527,435 | ||||
|
|
|
| |||||
| 36 | FINANCIAL STATEMENTS |
Table of Contents
| ICON Europe Fund | ||||||||||
Year ended | Year ended September 30, 2012 | |||||||||
| $ | 283,190 | $ | 452,355 | |||||||
| 3,720,650 | (3,288,964 | ) | ||||||||
| (171,711 | ) | (62,156 | ) | |||||||
| - | – | |||||||||
| 1,380,021 | 9,404,704 | |||||||||
|
|
|
| |||||||
| 5,212,150 |
| 6,505,939 | |||||||
|
|
|
| |||||||
| (334,776 | ) | (459,020 | ) | |||||||
| (453 | ) | (307 | ) | |||||||
| (1,730 | ) | (1,339 | ) | |||||||
|
|
|
| |||||||
| (336,959 | ) | (460,666 | ) | |||||||
|
|
|
| |||||||
| 11,536,691 | 4,094,825 | |||||||||
| 37,719 | 3,972 | |||||||||
| 97,066 | 11,420 | |||||||||
| 330,615 | 445,476 | |||||||||
| 359 | 307 | |||||||||
| 1,696 | 1,289 | |||||||||
| (11,523,558 | ) | (10,502,617 | ) | |||||||
| (38,499 | ) | (11,100 | ) | |||||||
| (58,262 | ) | (38,697 | ) | |||||||
|
|
|
| |||||||
| 383,827 | (5,995,125 | ) | ||||||||
|
|
|
| |||||||
| 5,259,018 | 50,148 | |||||||||
| 28,309,307 | 28,259,159 | |||||||||
|
|
|
| |||||||
| $ | 33,568,325 | $ | 28,309,307 | |||||||
|
|
|
| |||||||
| FINANCIAL STATEMENTS | 37 |
Table of Contents
STATEMENTSOF CHANGESIN NET ASSETS (CONTINUED)
| ICON Asia-Pacific Region Fund | ||||||||
| Year Ended September 30, 2013 | Year Ended September 30, 2012 | |||||||
Transactions in Fund Shares | ||||||||
Shares sold | ||||||||
Class S | 591,915 | 855,247 | ||||||
Class C | 31,082 | 14,331 | ||||||
Class A | 47,998 | 49,003 | ||||||
Reinvested dividends and distributions | ||||||||
Class S | 20,871 | 20,116 | ||||||
Class C | 81 | – | ||||||
Class A | 109 | 176 | ||||||
Shares repurchased | ||||||||
Class S | (1,573,311 | ) | (3,259,837 | ) | ||||
Class C | (40,887 | ) | (21,117 | ) | ||||
Class A | (46,439 | ) | (68,515 | ) | ||||
|
|
|
| |||||
Net increase/(decrease) | (968,581 | ) | (2,410,596 | ) | ||||
|
|
|
| |||||
Shares outstanding, beginning of year | 3,240,877 | 5,651,473 | ||||||
|
|
|
| |||||
Shares outstanding, end of year | 2,272,296 | 3,240,877 | ||||||
|
|
|
| |||||
Accumulated undistributed net investment income/(loss) | $ | 45,365 | $ | 271,230 | ||||
|
|
|
| |||||
The accompanying notes are an integral part of the financial statements.
| 38 | FINANCIAL STATEMENTS |
Table of Contents
| ICON Europe Fund | ||||||||||
Year Ended | Year Ended September 30, 2012 | |||||||||
| 845,385 | 349,507 | |||||||||
| 2,884 | 335 | |||||||||
| 7,146 | 993 | |||||||||
| 25,142 | 42,386 | |||||||||
| 27 | 29 | |||||||||
| 129 | 122 | |||||||||
| (837,167 | ) | (908,119 | ) | |||||||
| (2,824 | ) | (964 | ) | |||||||
| (4,235 | ) | (3,370 | ) | |||||||
|
|
|
| |||||||
| 36,487 | (519,081 | ) | ||||||||
|
|
|
| |||||||
| 2,231,554 | 2,750,635 | |||||||||
|
|
|
| |||||||
| 2,268,041 | 2,231,554 | |||||||||
|
|
|
| |||||||
| $ 163,400 |
| $ | 388,880 | ||||||
|
|
|
| |||||||
| FINANCIAL STATEMENTS | 39 |
Table of Contents
STATEMENTSOF CHANGESIN NET ASSETS
| ICON International Equity Fund | ||||||||
| Year Ended September 30, 2013 | Year Ended September 30, 2012 | |||||||
Operations | ||||||||
Net investment income/(loss) | $ | 308,378 | $ | 570,427 | ||||
Net realized gain/(loss) | 2,688,672 | (12,911,496 | ) | |||||
Net realized gain/(loss) from foreign currency | (330,659 | ) | (283,466 | ) | ||||
Net realized capital gains tax | (62,403 | ) | (84,388 | ) | ||||
Change in net unrealized appreciation/(depreciation) | 1,946,719 | 27,547,163 | ||||||
|
|
|
| |||||
Net increase/(decrease) in net assets resulting from operations | 4,550,707 | 14,838,240 | ||||||
|
|
|
| |||||
Dividends and Distributions to Shareholders | ||||||||
Net investment income | ||||||||
Class S (pre-merger)* | - | (446,175 | ) | |||||
Class S (formerly, Class Z) | (9,742 | ) | (74,205 | ) | ||||
Class I** | - | (153,050 | ) | |||||
Class A | (252 | ) | (13,281 | ) | ||||
Return of Capital | ||||||||
Class S (formerly, Class Z) | (223,901 | ) | - | |||||
Class A | (5,798 | ) | - | |||||
|
|
|
| |||||
Net decrease from dividends and distributions | (239,693 | ) | (686,711 | ) | ||||
|
|
|
| |||||
Fund Share Transactions | ||||||||
Shares sold | ||||||||
Class S (pre-merger)* | - | 1,305,260 | ||||||
Class S (formerly, Class Z)*** | 9,502,457 | 60,203,967 | ||||||
Class I** | - | 1,041,882 | ||||||
Class C | 98,284 | 130,023 | ||||||
Class A*** | 474,307 | 14,985,718 | ||||||
Reinvested dividends and distributions | ||||||||
Class S (pre-merger)* | - | 445,550 | ||||||
Class S (formerly, Class Z) | 228,381 | 69,998 | ||||||
Class I** | - | 134,039 | ||||||
Class A | 5,066 | 9,439 | ||||||
Shares repurchased | ||||||||
Class S (pre-merger)* | - | (42,941,189 | ) | |||||
Class S (formerly, Class Z) | (27,357,099 | ) | (15,236,665 | ) | ||||
Class I** | - | (29,247,969 | ) | |||||
Class C | (1,585,047 | ) | (2,837,159 | ) | ||||
Class A | (2,106,904 | ) | (11,907,130 | ) | ||||
|
|
|
| |||||
Net increase/(decrease) from fund share transactions | (20,740,555 | ) | (23,844,236 | ) | ||||
|
|
|
| |||||
Total net increase/(decrease) in net assets | (16,429,541 | ) | (9,692,707 | ) | ||||
Net Assets | ||||||||
Beginning of year | 69,234,017 | 78,926,724 | ||||||
|
|
|
| |||||
End of year | $ | 52,804,476 | $ | 69,234,017 | ||||
|
|
|
| |||||
| 40 | FINANCIAL STATEMENTS |
Table of Contents
| ICON International Equity Fund | ||||||||
| Year Ended September 30, 2013 | Year Ended September 30, 2012 | |||||||
Transactions in Fund Shares | ||||||||
Shares sold | ||||||||
Class S (pre-merger)* | - | 125,902 | ||||||
Class S (formerly, Class Z)*** | 846,277 | 5,783,166 | ||||||
Class I** | - | 102,639 | ||||||
Class C | 9,335 | 13,510 | ||||||
Class A*** | 41,741 | 1,436,432 | ||||||
Reinvested dividends and distributions | ||||||||
Class S (pre-merger)* | - | 45,933 | ||||||
Class S (formerly, Class Z) | 20,247 | 7,307 | ||||||
Class I** | - | 14,139 | ||||||
Class A | 450 | 986 | ||||||
Shares repurchased | ||||||||
Class S (pre-merger)* | - | (4,078,066 | ) | |||||
Class S (formerly, Class Z) | (2,383,691 | ) | (1,447,812 | ) | ||||
Class I** | - | (2,858,784 | ) | |||||
Class C | (150,212 | ) | (293,417 | ) | ||||
Class A | (186,779 | ) | (1,151,832 | ) | ||||
|
|
|
| |||||
Net increase/(decrease) | (1,802,632 | ) | (2,299,897 | ) | ||||
|
|
|
| |||||
Shares outstanding, beginning of year | 6,316,956 | 8,616,853 | ||||||
|
|
|
| |||||
Shares outstanding, end of year | 4,514,324 | 6,316,956 | ||||||
|
|
|
| |||||
Accumulated undistributed net investment income/(loss) | $ | 1,008 | $ | 180,659 | ||||
|
|
|
| |||||
| * | Class S shares of the International Equity Fund merged into Class Z shares and were renamed to Class S on January 23, 2012. The results of each class prior to the merger may have been different than what is presented. |
| ** | Class I shares of the International Equity Fund merged into Class A shares on January 23, 2012. The information presented is that before and including the merger. |
| *** | The information presented includes the January 23, 2012 merger activity. |
The accompanying notes are an integral part of the financial statements.
| FINANCIAL STATEMENTS | 41 |
Table of Contents
| Income/(loss) from investment operations | Less dividends and | |||||||||||||||||||||||
| Net asset value, beginning of period | Net investment income/ (loss)(x) | Net realized and unrealized gains/(losses) on investments | Total from investment operations | Dividends from net investment income | Distributions from net realized gains | |||||||||||||||||||
ICON Asia-Pacific Region Fund |
| |||||||||||||||||||||||
Class S | ||||||||||||||||||||||||
Year ended September 30, 2013 | $ | 12.21 | $ | 0.06 | $ | 1.33 | $ | 1.39 | $ | (0.09 | ) | $ | – | |||||||||||
Year ended September 30, 2012 | 10.12 | 0.11 | 2.02 | 2.13 | (0.04 | ) | – | |||||||||||||||||
Year ended September 30, 2011 | 12.35 | 0.07 | (2.30 | ) | (2.23 | ) | – | – | ||||||||||||||||
Year ended September 30, 2010 | 10.64 | 0.01 | 1.89 | 1.90 | (0.19 | ) | – | |||||||||||||||||
Year ended September 30, 2009 | 9.47 | 0.08 | 1.20 | 1.28 | (0.11 | ) | – | |||||||||||||||||
Class C | ||||||||||||||||||||||||
Year ended September 30, 2013 | 11.84 | (0.05 | ) | 1.28 | 1.23 | (0.01 | ) | – | ||||||||||||||||
Year ended September 30, 2012 | 9.88 | 0.01 | 1.95 | 1.96 | – | – | ||||||||||||||||||
Year ended September 30, 2011 | 12.17 | (0.02 | ) | (2.27 | ) | (2.29 | ) | – | – | |||||||||||||||
Year ended September 30, 2010 | 10.54 | (0.05 | ) | 1.82 | 1.77 | (0.14 | ) | – | ||||||||||||||||
Year ended September 30, 2009 | 9.41 | 0.02 | 1.18 | 1.20 | (0.07 | ) | – | |||||||||||||||||
Class A | ||||||||||||||||||||||||
Year ended September 30, 2013 | 12.17 | 0.04 | 1.33 | 1.37 | (0.03 | ) | – | |||||||||||||||||
Year ended September 30, 2012 | 10.10 | 0.09 | 2.00 | 2.09 | (0.02 | ) | – | |||||||||||||||||
Year ended September 30, 2011 | 12.35 | 0.04 | (2.29 | ) | (2.25 | ) | – | – | ||||||||||||||||
Year ended September 30, 2010 | 10.63 | 0.02 | 1.86 | 1.88 | (0.16 | ) | – | |||||||||||||||||
Year ended September 30, 2009 | 9.38 | 0.05 | 1.25 | 1.30 | (0.05 | ) | – | |||||||||||||||||
ICON Europe Fund | ||||||||||||||||||||||||
Class S | ||||||||||||||||||||||||
Year ended September 30, 2013 | 12.69 | 0.13 | 2.14 | 2.27 | (0.16 | ) | – | |||||||||||||||||
Year ended September 30, 2012 | 10.27 | 0.19 | 2.41 | 2.60 | (0.18 | ) | – | |||||||||||||||||
Year ended September 30, 2011 | 12.95 | 0.19 | (2.73 | ) | (2.54 | ) | (0.14 | ) | – | |||||||||||||||
Year ended September 30, 2010 | 12.28 | 0.18 | 0.60 | 0.78 | (0.11 | ) | – | |||||||||||||||||
Year ended September 30, 2009 | 13.23 | 0.15 | (0.79 | ) | (0.64 | ) | (0.31 | ) | – | |||||||||||||||
Class C | ||||||||||||||||||||||||
Year ended September 30, 2013 | 12.47 | – | (c) | 2.10 | 2.10 | (0.07 | ) | – | ||||||||||||||||
Year ended September 30, 2012 | 10.07 | 0.07 | 2.38 | 2.45 | (0.05 | ) | – | |||||||||||||||||
Year ended September 30, 2011 | 12.77 | 0.07 | (2.70 | ) | (2.63 | ) | (0.07 | ) | – | |||||||||||||||
Year ended September 30, 2010 | 12.15 | 0.09 | 0.56 | 0.65 | (0.03 | ) | – | |||||||||||||||||
Year ended September 30, 2009 | 13.12 | 0.07 | (0.80 | ) | (0.73 | ) | (0.24 | ) | – | |||||||||||||||
Class A | ||||||||||||||||||||||||
Year ended September 30, 2013 | 12.71 | 0.09 | 2.16 | 2.25 | (0.15 | ) | – | |||||||||||||||||
Year ended September 30, 2012 | 10.28 | 0.15 | 2.42 | 2.57 | (0.14 | ) | – | |||||||||||||||||
Year ended September 30, 2011 | 12.98 | 0.18 | (2.75 | ) | (2.57 | ) | (0.13 | ) | – | |||||||||||||||
Year ended September 30, 2010 | 12.30 | 0.15 | 0.60 | 0.75 | (0.07 | ) | – | |||||||||||||||||
Year ended September 30, 2009 | 13.14 | 0.12 | (0.75 | ) | (0.63 | ) | (0.21 | ) | – | |||||||||||||||
| 42 | FINANCIAL HIGHLIGHTS |
Table of Contents
| distributions | Ratio of expenses to average net assets | Ratio of net investment income/(loss) to average net assets | ||||||||||||||||||||||||||||||||
| Total dividends and distributions | Net asset value, end of period | Total return* | Net assets, end of period (in thousands) | Before expense limitation/ and transfer agent earnings credits | After expense limitation/ and transfer agent earnings credits | Before expense limitation/ and transfer agent earnings credits | After expense limitation/ and transfer agent earnings credits | Portfolio turnover rate(a) | ||||||||||||||||||||||||||
| $ | (0.09 | ) | $ | 13.51 | 11.44 | % | $ | 29,053 | 1.64 | % | 1.64 | % | 0.46 | % | 0.46 | % | 59.98 | % | ||||||||||||||||
| (0.04 | ) | 12.21 | 21.16 | % | 37,969 | 1.50 | % | 1.50 | % | 0.96 | % | 0.96 | % | 71.84 | % | |||||||||||||||||||
| – | 10.12 | (18.06 | )% | 55,637 | 1.59 | % | 1.59 | % | 0.55 | % | 0.55 | % | 71.03 | % | ||||||||||||||||||||
| (0.19 | ) | 12.35 | 18.02 | % | 70,854 | 1.63 | % | 1.63 | % | 0.13 | % | 0.13 | % | 100.41 | % | |||||||||||||||||||
| (0.11 | ) | 10.64 | 14.18 | % | 108,325 | 1.54 | % | 1.54 | % | 1.00 | % | 1.00 | % | 171.05 | % | |||||||||||||||||||
| (0.01 | ) | 13.06 | 10.44 | % | 832 | 3.76 | % | 2.56 | %(b) | (1.63 | )% | (0.43 | )% | 59.98 | % | |||||||||||||||||||
| – | 11.84 | 19.84 | % | 869 | 3.91 | % | 2.55 | %(b) | (1.28 | )% | 0.08 | % | 71.84 | % | ||||||||||||||||||||
| – | 9.88 | (18.82 | )% | 792 | 4.40 | % | 2.55 | %(b) | (2.02 | )% | (0.17 | )% | 71.03 | % | ||||||||||||||||||||
| (0.14 | ) | 12.17 | 17.02 | % | 441 | 9.04 | % | 2.57 | %(b) | (6.91 | )% | (0.44 | )% | 100.41 | % | |||||||||||||||||||
| (0.07 | ) | 10.54 | 13.10 | % | 260 | 19.80 | % | 2.55 | %(b) | (17.06 | )% | 0.19 | % | 171.05 | % | |||||||||||||||||||
| (0.03 | ) | 13.51 | 11.29 | % | 789 | 2.97 | % | 1.81 | %(b) | (0.82 | )% | 0.34 | % | 59.98 | % | |||||||||||||||||||
| (0.02 | ) | 12.17 | 20.73 | % | 690 | 2.88 | % | 1.80 | %(b) | (0.31 | )% | 0.77 | % | 71.84 | % | |||||||||||||||||||
| – | 10.10 | (18.22 | )% | 768 | 3.05 | % | 1.81 | %(b) | (0.97 | )% | 0.27 | % | 71.03 | % | ||||||||||||||||||||
| (0.16 | ) | 12.35 | 17.91 | % | 1,149 | 5.17 | % | 1.82 | %(b) | (3.13 | )% | 0.22 | % | 100.41 | % | |||||||||||||||||||
| (0.05 | ) | 10.63 | 14.11 | % | 543 | 5.89 | % | 1.82 | %(b) | (3.41 | )% | 0.66 | % | 171.05 | % | |||||||||||||||||||
| (0.16 | ) | 14.80 | 18.02 | % | 33,328 | 1.58 | % | 1.58 | % | 0.93 | % | 0.93 | % | 138.15 | % | |||||||||||||||||||
| (0.18 | ) | 12.69 | 25.69 | % | 28,143 | 1.56 | % | 1.56 | % | 1.61 | % | 1.61 | % | 89.78 | % | |||||||||||||||||||
| (0.14 | ) | 10.27 | (19.90 | )% | 28,095 | 1.54 | % | 1.54 | % | 1.40 | % | 1.40 | % | 51.94 | % | |||||||||||||||||||
| (0.11 | ) | 12.95 | 6.40 | % | 48,547 | 1.58 | % | 1.58 | % | 1.48 | % | 1.48 | % | 105.08 | % | |||||||||||||||||||
| (0.31 | ) | 12.28 | (4.13 | )% | 56,681 | 1.57 | % | 1.57 | % | 1.52 | % | 1.52 | % | 129.97 | % | |||||||||||||||||||
| (0.07 | ) | 14.50 | 16.89 | % | 77 | 12.20 | % | 2.55 | %(b) | (9.67 | )% | (0.02 | )% | 138.15 | % | |||||||||||||||||||
| (0.05 | ) | 12.47 | 24.46 | % | 65 | 21.20 | % | 2.55 | %(b) | (18.00 | )% | 0.65 | % | 89.78 | % | |||||||||||||||||||
| (0.07 | ) | 10.07 | (20.73 | )% | 59 | 19.88 | % | 2.52 | %(b) | (16.84 | )% | 0.52 | % | 51.94 | % | |||||||||||||||||||
| (0.03 | ) | 12.77 | 5.37 | % | 71 | 40.14 | % | 2.55 | %(b) | (36.86 | )% | 0.73 | % | 105.08 | % | |||||||||||||||||||
| (0.24 | ) | 12.15 | (5.04 | )% | 22 | 75.12 | % | 2.57 | %(b) | (71.83 | )% | 0.72 | % | 129.97 | % | |||||||||||||||||||
| (0.15 | ) | 14.81 | 17.82 | % | 163 | 7.00 | % | 1.80 | %(b) | (4.52 | )% | 0.68 | % | 138.15 | % | |||||||||||||||||||
| (0.14 | ) | 12.71 | 25.26 | % | 101 | 13.30 | % | 1.80 | %(b) | (10.23 | )% | 1.27 | % | 89.78 | % | |||||||||||||||||||
| (0.13 | ) | 10.28 | (20.04 | )% | 105 | 11.29 | % | 1.80 | %(b) | (8.20 | )% | 1.29 | % | 51.94 | % | |||||||||||||||||||
| (0.07 | ) | 12.98 | 6.16 | % | 150 | 17.22 | % | 1.80 | %(b) | (14.22 | )% | 1.21 | % | 105.08 | % | |||||||||||||||||||
| (0.21 | ) | 12.30 | (4.32 | )% | 159 | 11.15 | % | 1.82 | %(b) | (8.08 | )% | 1.25 | % | 129.97 | % | |||||||||||||||||||
| FINANCIAL HIGHLIGHTS | 43 |
Table of Contents
FINANCIAL HIGHLIGHTS (CONTINUED)
| Income/(loss) from investment operations | Less dividends and | |||||||||||||||||||||||
| Net asset value, beginning of period | Net investment income/ (loss)(x) | Net realized and unrealized gains/(losses) on investments | Total from investment operations | Dividends from net investment income | Distributions from Return of Capital | |||||||||||||||||||
ICON International Equity Fund | ||||||||||||||||||||||||
Class S** | ||||||||||||||||||||||||
Year ended September 30, 2013 | $ | 11.05 | $ | 0.07 | $ | 0.74 | $ | 0.81 | $ | – | (c) | $ | (0.05 | ) | ||||||||||
Year ended September 30, 2012 | 9.22 | 0.16 | 1.78 | 1.94 | (0.11 | ) | - | |||||||||||||||||
Year ended September 30, 2011 | 12.11 | 0.14 | (2.95 | ) | (2.81 | ) | (0.08 | ) | - | |||||||||||||||
Year ended September 30, 2010 | 11.13 | 0.13 | 1.06 | 1.19 | (0.21 | ) | - | |||||||||||||||||
Year ended September 30, 2009 | 10.87 | 0.11 | 0.35 | 0.46 | (0.20 | ) | - | |||||||||||||||||
Class C | ||||||||||||||||||||||||
Year ended September 30, 2013 | 10.26 | (0.04 | ) | 0.67 | 0.63 | - | - | |||||||||||||||||
Year ended September 30, 2012 | 8.56 | (0.02 | ) | 1.72 | 1.70 | - | - | |||||||||||||||||
Year ended September 30, 2011 | 11.30 | – | (c) | (2.74 | ) | (2.74 | ) | - | - | |||||||||||||||
Year ended September 30, 2010 | 10.40 | (0.01 | ) | 1.01 | 1.00 | (0.10 | ) | - | ||||||||||||||||
Year ended September 30, 2009 | 10.10 | – | (c) | 0.36 | 0.36 | (0.06 | ) | - | ||||||||||||||||
Class A*** | ||||||||||||||||||||||||
Year ended September 30, 2013 | 10.99 | 0.04 | 0.73 | 0.77 | – | (c) | (0.01 | ) | ||||||||||||||||
Year ended September 30, 2012 | 9.16 | 0.11 | 1.77 | 1.88 | (0.05 | ) | - | |||||||||||||||||
Year ended September 30, 2011 | 12.04 | 0.10 | (2.94 | ) | (2.84 | ) | (0.04 | ) | - | |||||||||||||||
Year ended September 30, 2010 | 11.07 | 0.08 | 1.06 | 1.14 | (0.17 | ) | - | |||||||||||||||||
Year ended September 30, 2009 | 10.78 | 0.06 | 0.37 | 0.43 | (0.14 | ) | - | |||||||||||||||||
| (x) | Calculated using the average shares method. |
| * | The total return calculation is for the period indicated and excludes any sales charges. |
| ** | Class S shares were formerly named Class Z shares prior to January 23, 2012. |
| *** | Class I shares merged into Class A on January 23, 2012. The results of each class prior to the merger may have been different than what is presented. |
| (a) | Portfolio turnover is calculated at the Fund level and is not annualized for periods less than a year. |
| (b) | The Fund’s operating expenses, not including interest expense, are contractually limited to the amounts discussed in Note 3. The ratios in these financial highlights reflect the limitation, including the interest expense. |
| (c) | Amount less than $0.005. |
| (d) | The ratio of expenses to average net assets after the contractual expense limitation and voluntary expense waiver and transfer agent earnings credit is 1.25%, 2.52% and 1.76% for Class S, C and A, respectively. |
| (e) | The ratio of net investment income/loss to average net assets after the contractual expense limitation and voluntary expense waiver and transfer agent earnings credit is 1.25%, (0.01%) and 0.74% for Class S, C, and A, respectively. |
The accompanying notes are an integral part of the financial statements.
| 44 | FINANCIAL HIGHLIGHTS |
Table of Contents
| distributions | Ratio of expenses to average net assets | Ratio of net investment income/(loss) to average net assets | ||||||||||||||||||||||||||||||||
| Total dividends and distributions | Net asset value, end of period | Total return* | Net assets, end of period (in thousands) | Before expense limitation/ and transfer agent earnings credits | After expense limitation/ and transfer agent earnings credits(b) | Before expense limitation/ and transfer agent earnings credits | After expense limitation/ and transfer agent earnings credits | Portfolio turnover rate(a) | ||||||||||||||||||||||||||
| $ | (0.05 | ) | $ | 11.81 | 7.33 | % | $ | 42,105 | 1.45 | % | 1.45 | % | 0.65 | % | 0.65 | % | 137.83 | % | ||||||||||||||||
| (0.11 | ) | 11.05 | 21.19 | % | 56,152 | 1.39 | % | 1.39 | % | 1.47 | % | 1.47 | % | 121.82 | % | |||||||||||||||||||
| (0.08 | ) | 9.22 | (23.38 | )% | 6,826 | 1.45 | % | 1.45 | % | 1.12 | % | 1.12 | % | 91.46 | % | |||||||||||||||||||
| (0.21 | ) | 12.11 | 10.87 | % | 12,806 | 1.43 | % | 1.36 | % | 1.06 | % | 1.12 | % | 111.29 | % | |||||||||||||||||||
| (0.20 | ) | 11.13 | 5.16 | % | 29,437 | 1.43 | % | 1.25 | %(d) | 1.07 | % | 1.25 | %(e) | 182.73 | % | |||||||||||||||||||
| - | 10.89 | 6.14 | % | 5,657 | 2.77 | % | 2.56 | % | (0.63 | )% | (0.42 | )% | 137.83 | % | ||||||||||||||||||||
| - | 10.26 | 19.86 | % | 6,773 | 2.72 | % | 2.55 | % | (0.41 | )% | (0.24 | )% | 121.82 | % | ||||||||||||||||||||
| - | 8.56 | (24.25 | )% | 8,050 | 2.64 | % | 2.55 | % | (0.11 | )% | (0.02 | )% | 91.46 | % | ||||||||||||||||||||
| (0.10 | ) | 11.30 | 9.65 | % | 13,990 | 2.69 | % | 2.55 | % | (0.21 | )% | (0.07 | )% | 111.29 | % | |||||||||||||||||||
| (0.06 | ) | 10.40 | 3.79 | % | 15,774 | 2.64 | % | 2.55 | %(d) | (0.13 | )% | (0.04 | )%(e) | 182.73 | % | |||||||||||||||||||
| (0.01 | ) | 11.75 | 7.03 | % | 5,043 | 2.19 | % | 1.81 | % | (0.06 | )% | 0.32 | % | 137.83 | % | |||||||||||||||||||
| (0.05 | ) | 10.99 | 20.61 | % | 6,309 | 2.01 | % | 1.80 | % | 0.85 | % | 1.06 | % | 121.82 | % | |||||||||||||||||||
| (0.04 | ) | 9.16 | (23.65 | )% | 2,640 | 2.03 | % | 1.80 | % | 0.56 | % | 0.79 | % | 91.46 | % | |||||||||||||||||||
| (0.17 | ) | 12.04 | 10.38 | % | 5,358 | 2.16 | % | 1.80 | % | 0.33 | % | 0.68 | % | 111.29 | % | |||||||||||||||||||
| (0.14 | ) | 11.07 | 4.65 | % | 5,214 | 2.08 | % | 1.80 | %(d) | 0.42 | % | 0.70 | %(e) | 182.73 | % | |||||||||||||||||||
| FINANCIAL HIGHLIGHTS | 45 |
Table of Contents
SEPTEMBER 30, 2013
1. Organization
The ICON Asia-Pacific Region Fund (“Asia-Pacific Region Fund”), ICON Europe Fund (“Europe Fund”) and ICON International Equity Fund (“International Equity Fund”) are series funds (individually a “Fund” and collectively, the “Funds”). The Funds are part of the ICON Funds (the “Trust”), a Massachusetts business trust registered under the Investment Company Act of 1940, as amended (the “1940 Act”) as an open-end investment management company. Each Fund offers three classes of shares: Class S, Class C and Class A. All classes have equal rights as to earnings, assets and voting privileges except that each Class may bear different distribution fees, registration costs, legal costs, mailing and printing costs and shareholder servicing costs and each Class has exclusive voting rights with respect to its distribution plan. There are currently fifteen other active Funds within the Trust. Those Funds are covered by separate prospectuses and shareholder reports.
Each Fund is authorized to issue an unlimited number of no par shares. The Funds primarily invest in foreign securities; the Asia-Pacific Region Fund and the Europe Fund primarily invest in companies whose principal business activities fall within specific regions. The investment objective of each Fund is to provide long-term capital appreciation.
The Funds may have elements of risk, including the risk of loss of principal. There is no assurance that the investment process will consistently lead to successful results. An investment concentrated in sectors and industries may involve greater risk and volatility than a more diversified investment. Investments in foreign securities and currency transactions may involve certain considerations and risks not typically associated with those of U.S. dollar-denominated transactions as a result of, among other factors, the possibility of lower government supervision and regulation of foreign securities markets and the possibility of political or economic instability. Financial statements of foreign companies are governed by different accounting, auditing, and financial standards than U.S. companies and may be less transparent and uniform than in the United States. Many corporate governance standards, which help ensure the integrity of public information in the United States, may not exist in some foreign countries. In general, there may be less governmental supervision of foreign stock exchanges and securities brokers and issuers. There are also risks associated with small-and mid-cap investing, including limited product lines, less liquidity, and small market share.
| 46 | NOTESTO FINANCIAL STATEMENTS |
Table of Contents
The Europe Fund has a significant weighting in France which may cause the Fund’s performance to be susceptible to economic, business and/or other developments that may affect that country.
In the normal course of business, the Funds may enter into various agreements that provide for general indemnifications. Each Fund’s maximum exposure under these arrangements is unknown as any potential exposure involving future claims that may be made against each Fund is unknown. However, based on experience, the Funds expect the risk of loss to be remote.
2. Significant Accounting Policies
The following is a summary of significant accounting policies consistently followed by the Funds in the preparation of their financial statements. The preparation of financial statements in conformity with accounting principles generally accepted in the United States of America requires management to make certain estimates and assumptions that affect the reported amounts of assets and liabilities, disclosure of contingent assets and liabilities at the date of the financial statements, and the reported amounts of income and expenses during the reporting period. Actual results may differ from these estimates.
Investment Valuation
The Funds’ securities and other assets, excluding options on securities indexes, are valued at the closing price as of the close of regular trading on the New York Stock Exchange (the “NYSE”) (normally 4 p.m. Eastern Standard Time) each day the NYSE is open, except that securities traded primarily on the NASDAQ Stock Market (“NASDAQ”) are normally valued by the Funds at the NASDAQ Official Closing Price provided by NASDAQ each business day. Options on securities indexes are valued at the close of the Chicago Board Options Exchange (normally 4:15 p.m. Eastern Standard Time) on each day the New York Stock Exchange is open for trading.
The Funds use pricing services to obtain the market value of securities in their portfolios; if a pricing service is not able to provide a price, or the pricing service’s valuation is considered inaccurate or does not in the Funds’ judgment reflect the market value of the security, prices may be obtained through market quotations from independent broker/dealers. If market quotations from these sources are not readily available, the Funds’ securities or other assets are valued at fair value as determined in good faith by the
| NOTESTO FINANCIAL STATEMENTS | 47 |
Table of Contents
NOTESTO FINANCIAL STATEMENTS (CONTINUED)
Funds’ Board of Trustees (“Board”) or pursuant to procedures approved by the Board.
Lacking any sales that day, a security is valued at the current closing bid price (or yield equivalent thereof) or based on quotes obtained from dealers making a market for the security. Options are valued at their closing mid-price on the market with the most volume. Mid-price is the average of the closing bid and closing ask prices. Debt securities with a remaining maturity of greater than 60 days are valued using the evaluated bid price supplied by the pricing service. The evaluated bid price supplied by the pricing service is based upon a matrix valuation system which considers such factors as security prices, yields, maturities and ratings. Short-term debt securities with remaining maturities of 60 days or less are generally valued at amortized cost or original cost plus accrued interest, which approximates market value. Currency rates as of the close of the NYSE are used to convert foreign security values into U.S. dollars.
Securities of investment companies that trade on an exchange are valued at the last sales price or official closing price as of the close of the customary trading session on the exchange where the security is principally traded. Investments in shares of funds that are not traded on an exchange are valued at the end of day net asset value per share of such fund. Securities in the underlying funds, including restricted securities, are valued in accordance with the valuation policy of such fund.
The Funds’ securities traded in countries outside of the Western Hemisphere are fair valued daily by utilizing the quotations of an independent pricing service, unless the Board determines that use of another valuation methodology is appropriate. The purposes of daily fair valuation are to avoid stale prices and to take into account, among other things, any significant events occurring after the close of foreign markets. The pricing service uses statistical analyses and quantitative models to adjust local market prices using factors such as subsequent movements and changes in the prices of indexes, securities and exchange rates in other markets to determine fair value as of the time a Fund calculates its net asset value (“NAV”). The valuation assigned to fair-value securities for purposes of calculating a Fund’s NAV may differ from the security’s most recent closing market price and from the prices used by other mutual funds to calculate their NAVs.
| 48 | NOTESTO FINANCIAL STATEMENTS |
Table of Contents
Various inputs are used to determine the value of the Funds’ investments. These inputs are summarized in the three broad levels listed below:
Level 1 — quoted prices in active markets for identical securities.
Level 2 — significant observable inputs other than Level 1 quoted prices (including, but not limited to, quoted prices for similar securities, interest rates, prepayment speeds, and credit risk).
Level 3 — significant unobservable inputs.
Observable inputs are those based on market data obtained from sources independent of the Funds, and unobservable inputs reflect the Funds’ own assumptions based on the best information available. The input levels are not necessarily an indication of the risk or liquidity associated with investments at that level. For example, non-U.S. equity securities actively traded in foreign markets may be reflected in Level 2 despite the availability of closing prices, because the Funds evaluate and determine whether those closing prices reflect fair value at the close of the NYSE or require adjustment, as described above. The following table summarizes the Funds’ investments, based on the inputs used to determine their values on September 30, 2013:
| Level 1 | Level 2 | Level 3 | Total | |||||||||||||
ICON Asia-Pacific Region Fund* | ||||||||||||||||
Assets | ||||||||||||||||
Common Stocks | ||||||||||||||||
Japan | $ | - | $ | 5,818,523 | $ | - | $ | 5,818,523 | ||||||||
Australia | - | 4,972,304 | - | 4,972,304 | ||||||||||||
Thailand | - | 4,149,641 | - | 4,149,641 | ||||||||||||
South Korea | 621,506 | 2,630,403 | - | 3,251,909 | ||||||||||||
India | - | 1,965,927 | - | 1,965,927 | ||||||||||||
Hong Kong | - | 1,932,719 | 0 | ** | 1,932,719 | |||||||||||
Singapore | - | 1,823,646 | - | 1,823,646 | ||||||||||||
Indonesia | - | 1,615,956 | - | 1,615,956 | ||||||||||||
China | 869,008 | 678,543 | - | 1,547,551 | ||||||||||||
Other Countries | - | 1,367,480 | - | 1,367,480 | ||||||||||||
Collateral for Securities on Loan | - | 3,033,965 | - | 3,033,965 | ||||||||||||
Short-Term Investments | - | 1,711,778 | - | 1,711,778 | ||||||||||||
|
|
|
|
|
|
|
| |||||||||
Total | $ | 1,490,514 | $ | 31,700,885 | $ | 0 | $ | 33,191,399 | ||||||||
|
|
|
|
|
|
|
| |||||||||
| NOTESTO FINANCIAL STATEMENTS | 49 |
Table of Contents
NOTESTO FINANCIAL STATEMENTS (CONTINUED)
| Level 1 | Level 2 | Level 3 | Total | |||||||||||||
ICON Europe Fund* | ||||||||||||||||
Assets | ||||||||||||||||
Common Stocks | ||||||||||||||||
France | $ | 309,965 | $ | 9,105,792 | $ | - | $ | 9,415,757 | ||||||||
Germany | 41,733 | 6,962,390 | - | 7,004,123 | ||||||||||||
United Kingdom | - | 4,666,982 | - | 4,666,982 | ||||||||||||
Denmark | - | 3,201,919 | - | 3,201,919 | ||||||||||||
Switzerland | 95,494 | 1,594,669 | - | 1,690,163 | ||||||||||||
Other Countries | 139,913 | 5,152,938 | - | 5,292,851 | ||||||||||||
Preferred Stocks | ||||||||||||||||
Germany | - | 950,322 | - | 950,322 | ||||||||||||
Short-Term Investments | - | 1,014,308 | - | 1,014,308 | ||||||||||||
|
|
|
|
|
|
|
| |||||||||
Total | $ | 587,105 | $ | 32,649,320 | $ | - | $ | 33,236,425 | ||||||||
|
|
|
|
|
|
|
| |||||||||
ICON International Equity Fund* | ||||||||||||||||
Assets | ||||||||||||||||
Common Stocks | ||||||||||||||||
France | $ | - | $ | 8,514,952 | $ | - | $ | 8,514,952 | ||||||||
Germany | 49,761 | 5,911,838 | - | 5,961,599 | ||||||||||||
South Korea | 1,174,889 | 3,739,884 | - | 4,914,773 | ||||||||||||
Japan | - | 3,939,025 | - | 3,939,025 | ||||||||||||
United Kingdom | - | 3,640,082 | - | 3,640,082 | ||||||||||||
Canada | 3,090,497 | - | - | 3,090,497 | ||||||||||||
Denmark | - | 3,027,382 | - | 3,027,382 | ||||||||||||
Thailand | - | 2,915,371 | - | 2,915,371 | ||||||||||||
Singapore | - | 2,791,334 | - | 2,791,334 | ||||||||||||
Hong Kong | - | 665,388 | 0 | ** | 665,388 | |||||||||||
Other Countries | 525,796 | 8,338,184 | - | 8,863,980 | ||||||||||||
Preferred Stocks | ||||||||||||||||
Germany | - | 301,320 | - | 301,320 | ||||||||||||
Collateral for Securities on Loan | - | 1,769,478 | - | 1,769,478 | ||||||||||||
Short-Term Investments | - | 2,743,691 | - | 2,743,691 | ||||||||||||
|
|
|
|
|
|
|
| |||||||||
Total | $ | 4,840,943 | $ | 48,297,929 | $ | 0 | $ | 53,138,872 | ||||||||
|
|
|
|
|
|
|
| |||||||||
| * | Please refer to the Schedule of Investments and the Sector/Industry Classification and Country Composition tables for additional security details. |
| ** | Chaoda Modern Agriculture Holdings, Ltd. is illiquid and valued with a zero market value for the year ended September 30, 2013. |
There were no significant Level 3 securities held in any of the Funds at September 30, 2013.
| 50 | NOTESTO FINANCIAL STATEMENTS |
Table of Contents
For the ICON Asia Pacific Region Fund, common stocks valued at $621,506 were transferred from Level 2 to Level 1 during the year ended September 30, 2013. At September 30, 2012, these securities were valued using quoted market prices in active markets with fair value adjustment factors; at September 30, 2013, these securities were valued using quoted market prices in active markets without using fair value adjustment factors.
For the ICON Europe Fund, there was no significant transfer activity between Level 1 and Level 2.
For the ICON International Equity Fund, common stocks valued at $1,174,889 were transferred from Level 2 to Level 1 during the year ended September 30, 2013. At September 30, 2012, these securities were valued using quoted market prices in active markets with fair value adjustment factors; at September 30, 2013, these securities were valued using quoted market prices in active markets without using fair value adjustment factors.
The end of year timing recognition is used for the transfers between levels of the Fund’s assets and liabilities.
A roll forward of fair value measurements using significant unobservable inputs (Level 3) for the year ended September 30, 2013 for the Asia-Pacific Region Fund and the International Equity Fund, is as follows:
| Common Stocks Hong Kong | ||||
ICON Asia-Pacific Region Fund | ||||
Beginning balance 9/30/12 | $ | 57,841 | ||
Purchases | - | |||
Sales | - | |||
Accrued discounts/(premiums) | - | |||
Total realized gains/(losses) | - | |||
Total change in unrealized appreciation/(depreciation) | (57,841 | ) | ||
Transfers in to Level 3 | - | |||
Transfers out of Level 3 | - | |||
|
| |||
Ending balance 9/30/13 | $ | - | ||
|
| |||
Net change in unrealized appreciation/(depreciation) on investments held at 9/30/13 | $ | (57,841 | ) | |
|
| |||
| NOTESTO FINANCIAL STATEMENTS | 51 |
Table of Contents
NOTESTO FINANCIAL STATEMENTS (CONTINUED)
| Common Stocks Hong Kong | ||||
ICON International Equity Fund | ||||
Beginning balance 9/30/12 | $ | 151,454 | ||
Purchases | - | |||
Sales | - | |||
Accrued discounts/(premiums) | - | |||
Total realized gains/(losses) | - | |||
Total change in unrealized appreciation/(depreciation) | (151,454 | ) | ||
Transfers in to Level 3 | - | |||
Transfers out of Level 3 | - | |||
|
| |||
Ending balance 9/30/13 | $ | - | ||
|
| |||
Net change in unrealized appreciation/(depreciation) on investments held at 9/30/13 | $ | (151,454 | ) | |
|
| |||
Net realized gain/(loss) and net change in unrealized appreciation/depreciation is reflected on the Statement of Operations.
Fund Share Valuation
Fund shares are sold and redeemed on a daily basis at net asset value. Net asset value per share is determined daily as of the close of trading on the NYSE on each day the NYSE is open for trading by dividing the total value of the Fund’s investments and other assets, less liabilities, by the number of Fund shares outstanding.
Foreign Currency Translation
The accounting records of the Funds are maintained in U.S. dollars. Investment securities and other assets and liabilities denominated in a foreign currency are translated daily into U.S. dollars at the prevailing rates of exchange. Income and expenses are translated into U.S. dollars at the prevailing exchange rate on the respective dates of the transactions. Purchases and sales of securities are translated into U.S. dollars at the contractual currency exchange rates established at the time of each trade.
The Funds do not isolate that portion of the results of operations resulting from changes in foreign exchange rates on investments from the fluctuations arising from changes in market prices of securities held. Net unrealized appreciation or depreciation on investments and foreign currency translations arise from changes in the value of assets and liabilities, resulting from changes in the exchange rates and changes in market prices of securities held.
| 52 | NOTESTO FINANCIAL STATEMENTS |
Table of Contents
Forward Foreign Currency Contracts
The Funds may enter into short-term forward foreign currency contracts. A forward foreign currency contract is an agreement between contracting parties to exchange an amount of currency at some future time at an agreed upon rate. The Funds may use forward foreign currency contracts to manage foreign currency exposure with respect to transactional hedging, positional hedging, cross hedging and proxy hedging.
These contracts involve market risk and do not eliminate fluctuations in the prices of portfolio securities or prevent losses if the prices of those securities decline. The Funds could be exposed to risk if the value of the currency changes unfavorably. Additionally, the Funds could be exposed to counterparty risk if the counterparties are unable to meet the terms of the contracts.
These contracts are marked-to-market daily. Net realized gains and losses on foreign currency transactions represent disposition of foreign currencies, and the difference between the amount recorded at the time of the transaction and the U.S. dollar amount actually received. Any realized gain or loss incurred by the Funds due to foreign currency translation is included on the Statement of Operations. At September 30, 2013, the Asia-Pacific Region Fund, Europe Fund and International Equity Fund had no outstanding forward foreign currency contracts.
The following is a summary of how these derivatives are treated in the financial statements and their impact on the Funds:
Amount of Realized Gain or (Loss) on Derivatives Recognized in Operations
| Derivatives not accounted for as hedging instruments | Location of Gain/(Loss) on Derivatives Recognized in Operations | Amount | ||||
Forward foreign exchange contracts | ||||||
Foreign exchange risk | ||||||
ICON Europe Fund | Net realized gain/(loss) from | $ | (86,922 | ) | ||
ICON International Equity Fund | foreign currency transactions | (103,166 | ) | |||
| NOTESTO FINANCIAL STATEMENTS | 53 |
Table of Contents
NOTESTO FINANCIAL STATEMENTS (CONTINUED)
Change in Unrealized Appreciation/(Depreciation) on Derivatives Recognized in Operations
| Derivatives not accounted for as hedging instruments | Location of Gain/(Loss) on Derivatives Recognized in Operations | Amount | ||||
Forward foreign exchange contracts | ||||||
Foreign exchange risk | Change in unrealized net | |||||
| appreciation/(depreciation) on | ||||||
ICON Europe Fund | foreign currency transactions | $ | 51,922 | |||
ICON International Equity Fund | 66,766 | |||||
The number of foreign currency contracts opened during the year ended September 30, 2013 for the Europe Fund and the International Equity Fund were 3 and 3, respectively.
The Funds value derivatives at fair value, as described above, and recognize changes in fair value currently in the results of operations. Accordingly, the Funds do not follow hedge accounting even for derivatives employed as economic hedges.
Securities Lending
Under procedures adopted by the Board, the Funds may lend securities to certain approved brokers, dealers and other financial institutions to earn additional income. The Funds retain certain benefits of owning the securities, including receipt of dividends or interest generated by the security, but give up other rights including the right to vote proxies. The Funds retain the ability to recall the loans at any time and could do so in order to vote proxies or to sell the loaned securities. Each loan is collateralized by cash that generally exceeds the value of the securities on loan. The market value of the loaned securities is determined daily at the close of business of the Funds and any additional required collateral is delivered to each Fund on the next business day.
Generally, in the event of borrower default, the Funds have the right to use the collateral to offset any losses incurred. In the event the Funds are delayed or prevented from exercising their rights to dispose of the collateral, there may be a potential loss to the Funds. Some of these losses may be indemnified by the lending agent.
The Funds have elected to invest the cash collateral in the State Street Navigator Prime Portfolio which is disclosed on the Schedule of Investments. The Funds bear the risk of loss with respect to the investment of collateral.
| 54 | NOTESTO FINANCIAL STATEMENTS |
Table of Contents
The net securities lending income earned by the Funds for the year ended September 30, 2013, is included in the Statement of Operations.
For the year ended September 30, 2013, the following Funds had securities with the following values on loan:
| Fund | Value of Loaned Securities | Value of Collateral | ||||||
ICON Asia-Pacific Region Fund | $ | 2,882,572 | $ | 3,033,965 | ||||
ICON International Equity Fund | 1,633,779 | 1,769,478 | ||||||
The value of the collateral above could include collateral held for securities that were sold on or before September 30, 2013. It may also include collateral received from the pre-funding of loans.
Income Taxes, Dividends, and Distributions
The Funds intend to continue to qualify as regulated investment companies under Subchapter M of the Internal Revenue Code and, accordingly, the Funds will generally not be subject to federal and state income taxes or federal excise taxes to the extent that they intend to make sufficient distributions of net investment income and net realized capital gains.
Dividends paid by the Funds from net investment income and distributions of net realized short-term gains are, for federal income tax purposes, taxable as ordinary income to shareholders.
Dividends and distributions to shareholders are recorded by the Funds on the ex-dividend/distribution date. The Funds distribute income and net realized capital gains, if any, to shareholders at least annually, if not offset by capital loss carryforward. The Funds may utilize equalization accounting for tax purposes and designate earnings and profits, including net realized gains distributed to shareholders on redemption of shares, as part of the dividends paid deduction for income tax purposes. Income distributions and capital gain distributions are determined in accordance with income tax regulations, which may differ from accounting principles generally accepted in the United States of America.
Management has analyzed the Funds’ tax positions taken on federal income tax returns for all open tax years and has concluded that no provision for federal income tax is required in the Funds’ financial statements.
The Funds file U.S. tax returns. While the statute of limitations remains open to examine the Funds’ U.S. tax returns filed for the past three years, no
| NOTESTO FINANCIAL STATEMENTS | 55 |
Table of Contents
NOTESTO FINANCIAL STATEMENTS (CONTINUED)
examinations are in progress or anticipated at this time. The Funds are not aware of any tax positions for which it is reasonably possible that the total amounts of unrecognized tax benefits will significantly change in the next twelve months.
Certain foreign countries impose a capital gains tax which is accrued by the Funds based on the unrealized appreciation, if any, on affected securities. Any accrual would reduce a Fund’s NAV. The tax is paid when the gain is realized.
Investment Income
Dividend income is recorded on the ex-dividend date. Non-cash dividends included in dividend income, if any, are recorded at the fair value of the securities received. Interest income is accrued as earned. Certain dividends from foreign securities are recorded as soon as the Funds are informed of the dividend if such information is obtained subsequent to the ex-dividend date. Discounts and premiums on fixed income securities purchased are accreted or amortized to income over the life of the respective securities.
Investment Transactions
Security transactions are accounted for no later than one business day after the trade date. However, for financial reporting purposes, security transactions are accounted for on the trade date. Gains and losses on securities sold are determined on the basis of identified cost.
Allocation of Expenses
Each class of a Fund’s shares bears expenses incurred specifically on its behalf and, in addition, each class bears a portion of general expenses, based upon relative net assets of each class. Expenses which cannot be directly attributed to a specific Fund in the Trust are apportioned between all Funds in the Trust based upon relative net assets. In calculating the net asset value per share of each class, investment income, realized and unrealized gains and losses and expenses other than class-specific expenses are allocated daily to each class of shares based upon the proportion of net assets.
| 56 | NOTESTO FINANCIAL STATEMENTS |
Table of Contents
Below are the class level expenses that are included on the Statement of Operations:
| Fund | Legal Expense | Printing and Postage Expense | Transfer Agent Expense | |||||||||
ICON Asia-Pacific Region Fund | ||||||||||||
Class S | $ | 2,063 | $ | 14,915 | $ | 51,828 | ||||||
Class C | 48 | 507 | 2,626 | |||||||||
Class A | 36 | 608 | 2,129 | |||||||||
ICON Europe Fund | ||||||||||||
Class S | 2,348 | 14,434 | 38,799 | |||||||||
Class C | 7 | 266 | 919 | |||||||||
Class A | 11 | 312 | 1,194 | |||||||||
ICON International Equity Fund | ||||||||||||
Class S | 3,677 | 16,767 | 47,692 | |||||||||
Class C | 455 | 2,942 | 16,732 | |||||||||
Class A | 397 | 3,096 | 22,983 | |||||||||
3. Fees and Other Transactions with Affiliates
Investment Advisory Fees
ICON Advisers, Inc. (“ICON Advisers”) serves as investment adviser to the Funds and is responsible for managing the Funds’ portfolios of securities. ICON Advisers receives a monthly management fee that is computed daily at an annual rate of 1.00% of each Fund’s average daily net assets.
ICON Advisers has contractually agreed to limit the Funds’ operating expenses (exclusive of brokerage, interest, taxes, and extraordinary expenses) to the extent necessary to ensure that the Funds’ expenses do not exceed the following amounts:
| Fund | Class S | Class C | Class A | |||||||||
ICON Asia-Pacific Region Fund | - | 2.55% | 1.80% | |||||||||
ICON Europe Fund | - | 2.55% | 1.80% | |||||||||
ICON International Equity Fund | 1.55 | % | 2.55% | 1.80% | ||||||||
The Funds’ expense limitations will continue in effect until at least January 31, 2021. To the extent ICON Advisers reimburses or absorbs fees and expenses, it may seek payment of such amounts for up to three years after the expenses were reimbursed or absorbed. A Fund will make no such payment, however, if the total Fund operating expenses exceed the expense limits in effect at the time the expenses were reimbursed or at the time these payments are proposed.
| NOTESTO FINANCIAL STATEMENTS | 57 |
Table of Contents
NOTESTO FINANCIAL STATEMENTS (CONTINUED)
As of September 30, 2013 the following amounts were still available for recoupment by ICON Advisers based upon their potential expiration dates:
| Fund | 2014 | 2015 | 2016 | |||||||||
ICON Asia-Pacific Region Fund | $ | 31,078 | $ | 22,319 | $ | 18,421 | ||||||
ICON Europe Fund | 29,163 | 23,519 | 15,332 | |||||||||
ICON International Equity Fund | 11,377 | 25,950 | 33,867 | |||||||||
Accounting, Custody and Transfer Agent Fees
State Street Bank and Trust Company (“State Street”) serves as the fund accounting agent for the Funds. For its services, the Trust pays State Street a fee that is calculated daily and paid monthly at an annual rate based on the aggregate average daily net assets of the Trust.
State Street is the custodian of the Trust’s investments. For its services, the Trust pays State Street asset-based fees that vary according to the number of positions and transactions, plus out-of-pocket expenses.
Boston Financial Data Services, Inc. (“BFDS”) is the Trust’s transfer agent. For these services, the Trust pays a per account fee, plus certain other transaction Cusip charges and out-of-pocket expenses. BFDS may pay each Fund transfer agent earnings credits. Transfer agent earnings credits are credits received for interest which results from overnight balances used by BFDS for clearing shareholder transactions.
Administrative Services
The Trust has entered into an administrative services agreement with ICON Advisers pursuant to which ICON Advisers oversees the administration of the Trust’s business and affairs. This agreement provides for an annual fee of 0.05% on the Trust’s first $1.5 billion of average daily net assets, 0.045% on the next $1.5 billion of average daily net assets, 0.040% on the next $2 billion of average daily net assets and 0.030% on average daily net assets over $5 billion. For the year ended September 30, 2013, each Fund’s payment for administrative services to ICON Advisers is included on the Statement of Operations. The administrative services agreement provides that ICON Advisers will not be liable for any error of judgment, mistake of law, or any loss suffered by the Trust in connection with matters to which the administrative services agreement relates, except for a loss resulting from willful misfeasance, bad faith or negligence by ICON Advisers in the performance of its duties.
| 58 | NOTESTO FINANCIAL STATEMENTS |
Table of Contents
ICON Advisers has a sub-administration agreement under which State Street assists ICON Advisers with the administration and business affairs of the Trust. For its services, ICON Advisers pays State Street a fee that is calculated daily and paid monthly at an annual rate based on the aggregate average daily net assets of the Trust.
Distribution Fees
The Funds have adopted a Distribution Plan pursuant to Rule 12b-1 under the 1940 Act (“12b-1 Plan”) under which the Funds are authorized to compensate the Funds’ distributor, ICON Distributors, Inc. (“IDI”) (an affiliate of the adviser) for the sale and distribution of shares and for other shareholder services. Under the 12b-1 Plan, Class A shareholders pay an annual distribution and service fee of 0.25% of average daily net assets. The Class C shareholders pay an annual distribution and service fee of 1.00% of average daily net assets. There is no annual distribution and service fee for Class S shares. The total amount paid under the 12b-1 plans by the Funds, if any, is shown on the Statement of Operations.
Other Related Parties
Certain Officers and Directors of ICON Advisers are also Officers and Trustees of the Funds; however, such Officers and Trustees (with the exception of the Chief Compliance Officer, “CCO”) receive no compensation from the Funds. The Trust paid $120,000 of the CCO’s salary and the remaining portion is paid by ICON Advisers. For the year ended September 30, 2013, the total related amounts paid by the Funds under this arrangement are included in Other Expenses on the Statement of Operations.
The Fund may reimburse ICON Advisers for legal work performed for the Fund by its attorneys outside of the advisory and administration contracts. The Board of Trustees reviews and approves such reimbursements. For the year ended September 30, 2013, the total related amounts paid by the Funds under this arrangement are included in Other Expenses on the Statement of Operations.
4. Borrowings
The Trust has entered into a Line of Credit agreement/arrangement with State Street to provide temporary funding for redemption requests. The maximum borrowing is limited to $150 million. Effective March 25, 2013, interest on domestic borrowings is charged at a rate quoted and determined
| NOTESTO FINANCIAL STATEMENTS | 59 |
Table of Contents
NOTESTO FINANCIAL STATEMENTS (CONTINUED)
by State Street. Prior to March 25, 2013, interest on domestic borrowings was charged at the higher of the Federal Funds Rate effective on that day and the Overnight LIBOR Rate effective on that day plus 1.25%. The average interest rate charged for the year ended September 30, 2013 was 1.38%.
For the year ended September 30, 2013 the average outstanding loan by Fund was as follows:
| Fund* | Average Borrowing (10/1/12-9/30/13) | |||
ICON Asia-Pacific Region Fund | $ | 56,313 | ||
ICON Europe Fund | 1,536 | |||
ICON International Equity Fund | 158,003 | |||
| * | There were no outstanding loans at September 30, 2013. |
5. Purchases and Sales of Investment Securities
For the year ended September 30, 2013, the aggregate cost of purchases and proceeds from sales of securities (excluding short-term securities) was as follows:
| Fund | Purchases of Securities | Proceeds from Sales of Securities | ||||||
ICON Asia-Pacific Region Fund | $ | 21,458,786 | $ | 36,300,064 | ||||
ICON Europe Fund | 40,473,921 | 40,716,546 | ||||||
ICON International Equity Fund | 81,148,319 | 106,113,153 | ||||||
6. Federal Income Tax
Income and capital gain distributions are determined in accordance with income tax regulations that may differ from accounting principles that are generally accepted in the United States of America. These differences are due to differing treatments for items such as deferrals of wash sale losses, foreign currency transactions, and net investment losses.
Under the Regulated Investment Company Modernization Act of 2010 (the “Act”) capital losses generated by a fund may be carried over indefinitely, but these losses must be used prior to the utilization of any pre-enactment capital losses. Since pre-enactment capital losses may only be carried forward for eight years, there may be a greater likelihood that all or a portion of each fund’s pre-enactment capital losses will expire unused.
| 60 | NOTESTO FINANCIAL STATEMENTS |
Table of Contents
For the year ended September 30, 2013 the following Funds had capital loss carryforwards:
| Fund | Amounts | Expires | ||||||
ICON Asia-Pacific Region Fund | $ | 9,482,596 | 2017 | |||||
| 619,899 | Unlimited | |||||||
ICON Europe Fund | 23,659,246 | 2017 | ||||||
| 26,614,409 | 2018 | |||||||
ICON International Equity Fund | 53,195,839 | 2017 | ||||||
| 27,012,993 | 2018 | |||||||
| 10,856,071 | Unlimited | |||||||
Future capital loss carryforward utilization in any given year may be limited if there are substantial shareholder redemptions or contributions. During the year ended September 30, 2013 the following Funds utilized capital loss carryforwards:
| Fund | Amount | |||
ICON Europe Fund | $ | 1,387,041 | ||
The tax characteristics of distributions paid to shareholders during the fiscal year ended September 30, 2013, were as follows:
| Fund | Distributions Paid from Ordinary Income | Distributions Paid from Return of Capital | Total Distributions Paid | |||||||||
ICON Asia-Pacific Region Fund | $ | 271,232 | $ | - | $ | 271,232 | ||||||
ICON Europe Fund | 336,959 | - | 336,959 | |||||||||
ICON International Equity Fund | 9,994 | 229,699 | 239,693 | |||||||||
The tax characteristics of distributions paid to shareholders during the fiscal year ended September 30, 2012, were as follows:
| Fund | Distributions Paid from Ordinary Income | Total Distributions Paid | ||||||
ICON Asia-Pacific Region Fund | $ | 217,338 | $ | 217,338 | ||||
ICON Europe Fund | 460,666 | 460,666 | ||||||
ICON International Equity Fund | 686,711 | 686,711 | ||||||
| NOTESTO FINANCIAL STATEMENTS | 61 |
Table of Contents
NOTESTO FINANCIAL STATEMENTS (CONTINUED)
As of September 30, 2013, the components of accumulated earnings/(deficit) on a tax basis were as follows:
| Fund | Undistributed Ordinary Income | Late Year Loss Deferral** | Capital Loss Carryover | Unrealized Appreciation/ (Depreciation)* | Total Accumulated Earnings/ (Deficit) | |||||||||||||||
ICON Asia-Pacific Region Fund | $ | 60,794 | $ | - | $ | (10,102,495 | ) | $ | 2,199,655 | $ | (7,842,046 | ) | ||||||||
ICON Europe Fund | 163,067 | - | (50,273,655 | ) | 3,164,517 | (46,946,071 | ) | |||||||||||||
ICON International Equity Fund | - | - | (91,064,903 | ) | 2,479,483 | (88,585,420 | ) | |||||||||||||
| * | Differences between the book-basis and tax-basis unrealized appreciation/(depreciation) are attributable primarily to tax deferral of losses on wash sales. |
| ** | The Funds have elected to defer certain qualified late-year losses in accordance with federal income tax rules. These losses are treated as having arisen on the first day of the following fiscal year. |
As of September 30, 2013, cost of investments for federal income tax purposes and the amounts of gross and net unrealized appreciation/(depreciation) were as follows:
| Fund | Cost | Unrealized Appreciation | Unrealized (Depreciation) | Net Appreciation/ (Depreciation) | ||||||||||||
ICON Asia-Pacific Region Fund | $ | 30,969,583 | $ | 4,466,980 | $ | (2,245,164 | ) | $ | 2,221,816 | |||||||
ICON Europe Fund | 30,072,609 | 3,595,285 | (431,469 | ) | 3,163,816 | |||||||||||
ICON International Equity Fund | 50,630,443 | 5,578,383 | (3,069,954 | ) | 2,508,429 | |||||||||||
7. Accounting Pronouncement
In December 2011, the FASB issued Accounting Standards Update No. 2011-11, “Disclosures about Offsetting Assets and Liabilities.” This update creates disclosure requirements requiring entities to disclose both gross and net information for derivatives and other financial instruments that are either offset in the Statements of Assets and Liabilities or subject to an enforceable master netting arrangement or similar agreement. In January 2013, the FASB issued Accounting Standards Update No. 2013-01, “Clarifying the Scope of Disclosures about Offsetting Assets and Liabilities.” This update limits the scope of the new Statements of Assets and Liabilities offsetting disclosures to derivatives, repurchase agreements, reverse repurchase agreements, securities borrowing and securities lending transactions that are either offset in the Statements of Assets and Liabilities or subject to an
| 62 | NOTESTO FINANCIAL STATEMENTS |
Table of Contents
enforceable master netting arrangement or similar agreement. These disclosure requirements are effective for annual reporting periods beginning on or after January 1, 2013, and interim periods within those annual periods. Management is currently evaluating the impact these updates may have on the Funds’ financial statements.
8. Subsequent Events
Management has evaluated the possibility of subsequent events and determined that there are no material events that would require adjustments to or disclosure in the Funds’ financial statements.
| NOTESTO FINANCIAL STATEMENTS | 63 |
Table of Contents
REPORTOF INDEPENDENT REGISTERED PUBLIC
ACCOUNTING FIRM
To the Board of Trustees and Shareholders of the ICON Funds:
In our opinion, the accompanying statements of assets and liabilities, including the schedules of investments, and the related statements of operations and of changes in net assets and the financial highlights present fairly, in all material respects, the financial position of ICON Asia-Pacific Region Fund, ICON Europe Fund, and ICON International Equity Fund (three of the portfolios constituting ICON Funds, hereafter referred to as the “Funds”) at September 30, 2013, the results of each of their operations for the year then ended, the changes in each of their net assets for each of the two years in the period then ended and the financial highlights for each of the five years in the periods then ended, in conformity with accounting principles generally accepted in the United States of America. These financial statements and financial highlights (hereafter referred to as “financial statements”) are the responsibility of the Funds’ management; our responsibility is to express an opinion on these financial statements based on our audits. We conducted our audits of these financial statements in accordance with the standards of the Public Company Accounting Oversight Board (United States). Those standards require that we plan and perform the audit to obtain reasonable assurance about whether the financial statements are free of material misstatement. An audit includes examining, on a test basis, evidence supporting the amounts and disclosures in the financial statements, assessing the accounting principles used and significant estimates made by management, and evaluating the overall financial statement presentation. We believe that our audits, which included confirmation of securities at September 30, 2013 by correspondence with the custodian and brokers, provide a reasonable basis for our opinion.

Denver, Colorado
November 19, 2013
| 64 | REPORTOF ACCOUNTING FIRM |
Table of Contents
SIX MONTH HYPOTHETICAL EXPENSE EXAMPLE
SEPTEMBER 30, 2013 (UNAUDITED)
Example
As a shareholder of a Fund you may pay two types of fees: transaction fees and fund-related fees. Certain funds charge transaction fees, including sales charges (loads) on purchase payments, reinvested dividends, or other distributions; redemption fees; and exchange fees. Funds also incur various ongoing expenses, including management fees, distribution and/or service fees, and other fund expenses, which are indirectly paid by shareholders.
This Example is intended to help you understand your ongoing costs (in dollars) of investing in the various ICON Funds and to compare these costs with the ongoing costs of investing in other mutual funds. This Example is based on an investment of $1,000 invested at the beginning of the six-month period and held for the six-month period (4/1/13 – 9/30/13).
Actual Expenses
The first line in the table for each Fund provides information about actual account values and actual expenses. The Example includes, but is not limited to, management fees, 12b-1 fees, fund accounting, custody and transfer agent fees. However, the Example does not include client specific fees, such as the $15 fee charged to IRA accounts, or the $15 fee charged for wire redemptions. You may use this information, together with the amount you invested, to estimate the expenses that you paid over the period. Simply divide your account value by $1,000 (for example, an $8,600 account value divided by $1,000 = 8.6), then multiply the result by the number in the first line for each Fund under the heading entitled “Expenses Paid During Period” to estimate the expenses you paid on your account during this period.
Hypothetical Example for Comparison Purposes
The second line in the table for each Fund provides information about hypothetical account values and hypothetical expenses based on the Fund’s actual expense ratio and an assumed rate of return of 5% per year before expenses, which is not the Fund’s actual return. The hypothetical account values and expenses may not be used to estimate the actual ending account balance or expenses you paid for the period. You may use this information to compare the ongoing costs of investing in the Fund and other funds. To do so, compare this 5% hypothetical example with the 5% hypothetical examples that appear in the shareholder reports of the other funds. Please note that the expenses shown in the table are meant to highlight your ongoing costs only and do not reflect any transactional costs, such as sales charges (loads),
| EXPENSE EXAMPLE | 65 |
Table of Contents
redemption fees, or exchange fees that may be charged by other funds. Therefore, this information is useful in comparing ongoing costs only, and will not help you determine the relative total costs of owning different funds.
| Beginning Account Value 4/1/13 | Ending Account Value 9/30/13 | Expense Paid During Period 4/1/13 - 9/30/13* | Annualized Expense Ratio 4/1/13 - 9/30/13* | |||||||||||||
Actual Expenses |
| |||||||||||||||
ICON Asia-Pacific Region Fund |
| |||||||||||||||
Class S | $ | 1,000 | $ | 1,001.50 | $ | 8.58 | 1.71% | |||||||||
Class C | 1,000 | 997.70 | 12.82 | 2.56% | ||||||||||||
Class A | 1,000 | 1,000.70 | 9.08 | 1.81% | ||||||||||||
ICON Europe Fund | ||||||||||||||||
Class S | 1,000 | 1,077.90 | 8.39 | 1.61% | ||||||||||||
Class C | 1,000 | 1,073.30 | 13.25 | 2.55% | ||||||||||||
Class A | 1,000 | 1,077.10 | 9.37 | 1.80% | ||||||||||||
ICON International Equity Fund |
| |||||||||||||||
Class S | 1,000 | 1,011.10 | 7.61 | 1.51% | ||||||||||||
Class C | 1,000 | 1,005.50 | 12.82 | 2.55% | ||||||||||||
Class A | 1,000 | 1,009.50 | 9.07 | 1.80% | ||||||||||||
Hypothetical (assuming a 5% return before expenses) | ||||||||||||||||
ICON Asia-Pacific Region Fund |
| |||||||||||||||
Class S | 1,000 | 1,016.50 | 8.64 | |||||||||||||
Class C | 1,000 | 1,012.23 | 12.91 | |||||||||||||
Class A | 1,000 | 1,015.99 | 9.15 | |||||||||||||
ICON Europe Fund |
| |||||||||||||||
Class S | 1,000 | 1,017.00 | 8.14 | |||||||||||||
Class C | 1,000 | 1,012.28 | 12.86 | |||||||||||||
Class A | 1,000 | 1,016.04 | 9.10 | |||||||||||||
ICON International Equity Fund |
| |||||||||||||||
Class S | 1,000 | 1,017.50 | 7.64 | |||||||||||||
Class C | 1,000 | 1,012.28 | 12.86 | |||||||||||||
Class A | 1,000 | 1,016.04 | 9.10 | |||||||||||||
| * | Expenses are equal to the Fund’s six month expense ratio annualized, multiplied by the average account value over the period, multiplied by 183/365 to reflect the one-half year period. |
Total returns exclude applicable sales charges. If sales charges were included (maximum 5.75%), returns would be lower.
| 66 | EXPENSE EXAMPLE |
Table of Contents
BOARDOF TRUSTEESAND FUND OFFICERS (UNAUDITED)
The ICON Funds Board of Trustees (“Board”) consists of four Trustees who oversee the 18 ICON Funds (the “Funds”). The Board is responsible for general oversight of the Funds’ business and for assuring that the Funds are managed in the best interest of the Funds’ shareholders. The Trustees, and their ages, and principal occupations are set forth below. The address of the Trustees is 5299 DTC Blvd., Suite 1200, Greenwood Village, CO 80111. Trustees have no official term of office and generally serve until they resign or are not re-elected.
Interested Trustee
Craig T. Callahan, 62, Chairman of the Board. Dr. Callahan has been a Trustee of the Funds since their inception. Dr. Callahan also serves as President (1998 to present) and Chairman of the Investment Committee (2005 to present) and served as the Chief Investment Officer (1991 to 2004) of ICON Advisers. Dr. Callahan is also Executive Vice President (2005 to present); Director (1991 to present); and was previously President (1998 to 2005) and Chief Compliance Officer (2005) of IDI. Dr. Callahan also serves as the President (1998 to present) and Chairman of the Board of Directors (1994 to present) of ICON Management & Research Corporation (“IM&R”), the parent company of ICON Advisers and IDI.
Independent Trustees
Glen F. Bergert, 63. Mr. Bergert has been a Trustee of the Funds since 1999. Mr. Bergert is President of Venture Capital Management LLC (1997 to present), General Partner of SOGNO Partners LP, a venture capital company (2001 to present), General Partner of Bergert Properties, LLP, a real estate holding company (1997 to present), General Partner of Pyramid Real Estate Partnership, a real estate development company (1998 to present), General Partner of Chamois Partners, LP, a venture capital company (2004 to present) and was previously a General Partner with KPMG Peat Marwick, LLP (1979 to 1997). Mr. Bergert is also a Director of Delta Dental of California, an insurance company (2013 to present and 2006 to 2012), Delta Dental of Pennsylvania, an insurance company (1998 to 2009 and 2010 to present), Dentegra Group, Inc, an insurance holding company (2010 to present) and Delta Reinsurance Corporation (2000 to 2009 and 2011 to present). Mr. Bergert was a Director of Herre Bros, Inc., a contracting company (1998 to 2011).
John C. Pomeroy, Jr., 66. Mr. Pomeroy has been a Trustee of the Funds since November 2002. Mr. Pomeroy is Chief Investment Officer and Director
| TRUSTEESAND OFFICERS | 67 |
Table of Contents
of Investments, Pennsylvania State University (2001 to present) and was Portfolio Manager and Product Manager, Trinity Investment Management Corporation (1989 to 2001).
R. Michael Sentel, 65. Mr. Sentel has been a Trustee of the Funds since their inception. Mr. Sentel is a Senior Attorney with the U.S. Department of Education (1996 to present). Mr. Sentel also provides legal representation as a sole practitioner with an emphasis on corporate and transactional law. He served as general counsel to numerous public companies and served on the board of directors of one of these clients. Mr. Sentel began his legal career with the U.S. Securities and Exchange Commission’s Division of Enforcement and served as a Branch Chief (1980 to 1981). Later he served as the Section Chief for the Professional Liability Section of the Federal Deposit Insurance Corp. with responsibility for the Rocky Mountain Region (1991 to 1994).
The Officers of the Funds are:
Craig T. Callahan, 62, Chairman of the Board. Dr. Callahan has been a Trustee of the Funds since their inception. Dr. Callahan also serves as President (1998 to present) and Chairman of the Investment Committee (2005 to present) and served as the Chief Investment Officer (1991 to 2004) of ICON Advisers. Dr. Callahan is also Executive Vice President (2005 to present); Director (1991 to present); and was previously President (1998 to 2005) and Chief Compliance Officer (2005) of IDI. Dr. Callahan also serves as the President (1998 to present) and Chairman of the Board of Directors (1994 to present) of IM&R, the parent company of ICON Advisers and IDI.
Donald Salcito, 60. Mr. Salcito serves as Vice President and Secretary of the Funds (November 15, 2006 to present). Mr. Salcito is also Executive Vice President and General Counsel (September 2005 to present) of ICON Advisers; Director of IM&R (2005 to present); Executive Vice President, Secretary, General Counsel of IDI (2005 to present). Previously, he was a Partner in various national law firms, practicing in the securities law area. (1980 to 2005).
Carrie M. Schoffman, 40. Ms. Schoffman has been a Vice President and Principal Financial Officer/Treasurer of the Funds since June 2013. Ms. Schoffman is also Chief Compliance Officer (2013 to present and 2004 to 2008) and Anti-Money Laundering Officer (2013 to present) of the ICON Funds. She is Senior Vice President (2011 to present) and Chief Compliance Officer (2013 to present and 2004 to 2011) of ICON Advisers. Previously, she was a Staff Accountant with the Securities and Exchange Commission (2003 to 2004) and also an Experienced Manager (2001 to 2003) and a Senior Associate/Associate (1996 to 2001) at PricewaterhouseCoopers LLP.
| 68 | TRUSTEESAND OFFICERS |
Table of Contents
Renewal of Investment Advisory Agreement
On August 19, 2013 the Board of Trustees, including all of the Trustees that are not “interested persons” of the Trust (the “Independent Trustees”), approved continuation of the Advisory Agreements with the Adviser for each Fund for an additional one-year term commencing October 1, 2013.
In determining to renew the investment advisory agreements between ICON Funds (the “Trust”) and ICON Advisers, Inc. (“ICON” or the “Adviser”) the Trustees requested, was provided with and reviewed data with respect to the Adviser, its personnel, and the services provided and to be provided to each Fund by the Adviser under the Trust’s Investment Advisory Agreement dated October 9, 1996, as amended (related to the Sector Funds, the International Funds and ICON Funds) and under the Trust’s Investment Advisory Agreement dated July 9, 2002 and effective October 1, 2002, as amended (related to the U.S. Diversified Funds - Bond, Risk-Managed Equity, Equity Income and Long/Short Funds) (collectively, the “Advisory Agreements”), for an additional one-year term commencing October 1, 2013. The Trustees agreed that consideration of the Advisory Agreements should also include consideration of other agreements between the Adviser and the Trust that impact provisions of the Advisory Agreements, including, in particular, expense limitation agreements dated January 22, 2013 and May 1, 2005 (for the International Equity Fund).
The Trustees were provided with and reviewed data with respect to the Adviser, its personnel, and the services provided and to be provided to each Fund by the Adviser under the Trust’s Advisory Agreements and Administrative Services Agreement and the Distribution Agreement with ICON Distributors, Inc. (“IDI”). The data included information concerning advisory, distribution and administrative services provided to the Funds by ICON and its related companies; information concerning other businesses of those companies; comparative data related to exchange traded funds versus the Sector Funds; and comparative data obtained from Strategic Insights related to Fund performance and Fund expenses (the “SI report”). The data also included an analysis of the management style to be applied and the style applied to the Funds’ ratings of the Funds’ performance in their management style on the AthenaInvest system (the “AthenaInvest data”) and a presentation on the Adviser’s investment model.
Management personnel discussed the data for and with the Board. Included in the 15(c) discussion was a briefing on factors affecting the ICON investment model; expenses and expense ratios of each Fund and other ICON managed products; relative performance of each Fund; status of expense
| OTHER INFORMATION | 69 |
Table of Contents
reimbursements to the Funds by the Adviser; sales and marketing initiatives; specific business factors affecting IDI; the work load on ICON as adviser and administrator to the Funds; current profitability of ICON; current quality control procedures in place to show consistency in the management of the investment model, modification to the investment model, and staffing levels and staff morale.
The Independent Trustees were represented by independent legal counsel in this process. Prior to acting on the proposed contract renewals, the Independent Trustees met separately as a group in private sessions with their independent legal counsel to review and discuss the foregoing information. Based on these discussions, independent legal counsel and/or the Lead Independent Trustee also contacted management to request additional information and to discuss responses to questions raised during the process. In addition, the Board received materials from legal counsel discussing the legal standards applicable to their consideration of the ICON-Trust agreements.
In considering the nature, extent and quality of the services provided by the Adviser, the Board reviewed information relating to ICON’s operations and personnel. Among other things, the Adviser provided biographical information on its professional staff and descriptions of its organizational and management structure. In the course of their deliberations the Board evaluated, among other things, information relating to the investment philosophy, strategies and techniques used in managing each Fund, the qualifications and experience of ICON’s investment personnel, ICON’s compliance programs, ICON’s brokerage practices, including the extent to which the Adviser obtains research through “soft dollar” arrangements with the Funds’ brokerage, compliance reports on the foregoing, and the financial and non-financial resources available to provide services required under the Advisory Agreement.
During the discussion, the SI report and the AthenaInvest data were discussed and management personnel showed performance for each fund and discussed the factors affecting performance. During the discussion on performance, management personnel noted that the markets continue to experience volatility and that when the markets are volatile, it affects ICON’s performance; during the last three – four years ICON’s style of management, intrinsic valuation, has not been in favor. The Trustees noted that Advisers’ performance relative to other valuation managers as judged by the AthenaInvest system is quite positive, but in relation to other strategy managers, valuation is underperforming. The Board believes this information supports the view that an active valuation manager is in a very difficult setting and indicates this setting has been particularly difficult for managers
| 70 | OTHER INFORMATION |
Table of Contents
buying what they consider to be value stocks. Management noted that the ICON system is designed to handle one to two year industry themes, not ones averaging 14 weeks; and that the Adviser has stuck to its system as specified in Fund disclosure documents, holding the stocks and industries that appear inexpensive in relation to ICON’s calculating of value and ridden through the volatility.
The Board addressed style consistency with the Adviser. Management advised that, based on the Adviser’s own analysis, and with the restructuring of the Adviser, the Adviser has added a new level of review on the Portfolio Managers (“PMs”) to make sure they are adhering to the ICON System; the Director of Fund Management has been systematically tracking the Funds’ performance; he evaluates each of the ICON Funds to help ensure all PMs are investing consistently and in accordance with the ICON System by evaluating the Funds from an attribution perspective in monthly meetings. Management also advised that part of his responsibilities require him to evaluate the ICON system and that this effort has resulted in improvements to the ICON methodology, when necessary.
In connection with reviewing data bearing upon the nature, quality, and extent of services furnished by ICON to each Fund, the Board assessed data concerning ICON’s staffing, systems and facilities. The Board also assessed ICON’s non-Trust business to see if there are any initiatives that would dilute service to the Trust. The Board concluded:
A. That the breadth and the quality of investment advisory and other services being provided to each Fund is satisfactory, as evidenced in part by efforts to address and improve the performance record of each Fund when compared with the performance records of a peer group of comparable funds and markets in general;
B. That the breadth and the quality of investment advisory and other services being provided to each Fund are satisfactory, as evidenced in part by the AthenaInvest data (ratings based on an assessment of fund strategy), the Adviser’s performance is competitive with other fund managers in the value style group, and the Adviser has applied a disciplined approach in the style specified in the Funds’ offering document;
C. That ICON has made significant expenditures in the past year and in prior years to ensure that it has the sophisticated systems and the highly trained personnel necessary for it to be able to continue to provide quality service to the Funds’ shareholders, including the dedication of substantial resources to ICON’s investment and methodology;
D. That the Board, after considering compliance reports and compliance initiatives undertaken during the year and conducting individual interviews
| OTHER INFORMATION | 71 |
Table of Contents
with selected PMs, is satisfied with the research and portfolio management, that research and portfolio management is being constantly evaluated and improved upon; and that the PMs are evaluating trading services constantly, the Board concluded that the Adviser is providing the Funds with professional management of the nature, quality and scope required by the Funds; and
E. The risks assumed by ICON in providing investment advisory services to each Fund, including the capital commitments which have been made in the past and which continue to be made by ICON to ensure the continuation of the highest quality of service to the Trust, is made with the recognition that shareholders may redeem their shares at any time without notice and the Trust’s advisory relationship with ICON may be terminated at any time and must be renewed on an annual basis.
In considering the reasonableness of the fees paid to the Adviser for managing each Fund, the Board reviewed, among other things, data concerning other funds from the SI report, financial statements of the Adviser and an analysis of the profitability of the Adviser, and its affiliates, and their relationship with each Fund over various time periods. Such analysis identified all revenues and other benefits received by the Adviser and its affiliates from managing each Fund, the costs associated with providing such services and the resulting profitability to the Adviser and its affiliates and a comparison of similar data from reports filed by publicly traded firms.
The Board assessed actual (net) fees for advisory services and Fund expense ratios under the contractual relationship (the Advisory agreements and the Expense Limitation Agreements) with the Adviser as opposed to the fees specified in the applicable Advisory Agreement and expense ratios without application of the expense limitations and concluded that the focus should be on actual expense ratios after application of the Expense Limitation Agreements.
The Board considered the current and anticipated asset levels of each Fund and the contractual commitments of the Adviser to waive fees and pay expenses of the Funds from time to time to limit the total expenses of the Funds. In this regard the Board discussed significantly reduced asset levels in each Fund covered by the Advisory Agreements due to the relative poor Fund performance, and the industry wide net-redemptions in equity and actively managed funds due to the uncertainty of the markets. ICON’s ability to provide the services called for under the Advisory Agreements was assessed in light of current and projected asset levels. Fund expenses and expense ratios were also assessed in light of current and projected asset levels. The Board concluded that the Adviser has the resources necessary to provide the services called for under the Advisory Agreements; that profitability to the
| 72 | OTHER INFORMATION |
Table of Contents
Adviser and its affiliates from their relationship with the Funds, and services provided to the Funds, is not excessive; and that the Adviser is not realizing material benefits from economies of scale that would warrant adjustments to the fees for any Fund at this time. The Board of Trustees concluded that, in light of the nature, extent and quality of the services provided by the Adviser and the levels of profitability associated with providing these services, the fees charged by the Adviser under the Advisory Agreements to each Fund are reasonable.
In connection with assessing data bearing on the fairness of fee arrangements, the Board considered the SI report. It was noted that SI was selected at the May Board meeting to prepare its report, an extensive analysis of the expense data of other comparable funds; and that Trustee input was solicited and provided in the process. Among other information discussed, it was noted that:
A. the advisory fee structures of the Funds were considered in comparison with advisory fees and expense ratios of other similarly managed funds as set forth in the comparative data;
B. expense ratios for 10 of the 18 Funds are above median, and 2 are below the median;
C. in 16 of the 18 Funds, the assets under management are significantly below either the average or the median. SI did not provide an analysis of fund expense on an asset weighted basis. Such an analysis is very subjective and uncertain because it would require the Adviser to make a number of assumptions, which the Adviser’s management was uncomfortable in making due to the unreliability of the assumptions. It was, however, noted that when the fund size approaches peer group averages the Funds expenses also approach peer group averages.;
D. ICON has contractually agreed to impose expense limitations on each and every Fund at a cost to ICON;
E. ICON has contractually committed to break points in its fees so that economies of scale could be realized as a Fund grows in assets, for the benefit of Fund shareholders.
The Board also considered the fees charged by the Adviser to other advisory clients as outlined in its Registration Application on Form ADV in connection with assessing data bearing on the fairness of fee arrangements. The Trustees noted that certain ICON institutional/sub-advised type accounts have lower fees than the fees paid by the Funds for a number of reasons, including but not limited to, those clients call for different commitments of time, institutional clients have low and predictable turnover of assets, in competition joint costs are apportioned among paying customers according
| OTHER INFORMATION | 73 |
Table of Contents
to elasticity of demand and the Adviser has a limited level of responsibility in sub-managed accounts, or accounts with an investor agent/advisor.
The Board noted that the Funds’ redemptions were similar to industry averages which showed two things: 1) that the Funds’ Performance was not adversely impacting fund redemptions, and 2) that the fees and costs were competitive when compared to size. The Board noted that there are thousands of mutual funds competing; that investors can search and trade funds on the internet or on platforms at very little or no cost; and that if the Adviser were overcharging for its services, with its performance being what it is, the Board would have expected redemptions in excess of industry norms.
The Board concluded that the Adviser is providing the Funds with professional management at a fair, reasonable and competitive price.
In connection with assessing the direct and indirect benefits to ICON from serving as the Funds’ adviser, the Board discussed services provided under the Distribution Agreement and the Administrative Services Agreement which are in addition to services under the Advisory Agreements. It was noted that IDI does not charge a fee to the Funds for its services and that ICON’s fee for administrative services appears to be consistent with such fees in other fund groups. The Board noted that ICON receives research assistance (primarily in the form of data) from the use of soft dollars generated from Fund portfolio transactions; that such research assists ICON in providing quality advisory services; that Trust and Adviser compliance personnel continuously evaluate and report on the soft-dollar arrangements and related costs; and the Board concluded that the arrangements are consistent with Fund brokerage practices and benefit the Funds and their shareholders.
Based on these considerations, the Board, including all of the Independent Trustees, concluded that: 1) the continuation of the Advisory Agreements was in the best interests of each Fund and its shareholders, 2) the services to be performed under the Advisory Agreements were required for the operation of the Funds, 3) the advisory services were satisfactory to the Funds in the past, and 4) the fees for the advisory services and other benefits from the relationship with the Trust received by ICON, and its affiliates, were consistent with fees paid by similar funds and other clients of ICON, and were reasonable in light of the comparative data, and within the range of what would have been negotiated at arm’s length in light of all the circumstances.
Supplemental Tax Information
For corporate shareholders, none of the total ordinary income dividends paid during the fiscal year ended September 30, 2013, qualified for the corporate
| 74 | OTHER INFORMATION |
Table of Contents
dividends received deduction. For the fiscal year ended September 30, 2013, the following funds paid qualified dividend income:
| Fund | Amount | |||
ICON Asia-Pacific Region Fund | 100 | % | ||
ICON Europe Fund | 100 | % | ||
ICON International Equity Fund | 4.17 | % | ||
The Funds had no long-term capital gain distributions qualifying for the maximum 20% income tax rate for individuals.
Portfolio Holdings
Information related to the 10 largest portfolio holdings of each Fund is made available at www.iconfunds.com within approximately 10 business days after month-end. Additionally, a complete list of each Fund’s holdings is made available approximately 30 days after month-end. Each ICON Fund also files a complete schedule of portfolio holdings for the first and third quarters of its fiscal year with the Securities and Exchange Commission (the “Commission”) on Form N-Q. The ICON Funds’ Forms N-Q are available at www.sec.gov or may be reviewed and copied at the Commission’s Public Reference Room in Washington, DC. Information about the Public Reference Room may be obtained by calling 1-800-SEC-0330.
Proxy Voting
A summarized description of the policies and procedures the ICON Funds use to vote proxies is available free of charge at www.iconfunds.com or by calling 1-800-764-0442.
Information about how the ICON Funds voted proxies related to each Fund’s portfolio securities during the 12-month period ended June 30 is available free of charge at www.iconfunds.com or on the Commission’s website at www.sec.gov.
Cost Basis Information
Effective January 1, 2012, federal law requires mutual fund companies to maintain and report a shareholder’s cost basis by tax lot, gain/loss information and holding period of covered shares to the Internal Revenue Service on Form 1099. Covered shares are mutual fund shares acquired on or after January 1, 2012. A fund is not required to maintain and report information for shares not deemed as covered.
The new law requires each fund to elect a default tax identification methodology in order to perform the required reporting. As a result, the Trust has chosen Average Cost as its default tax identification methodology.
| OTHER INFORMATION | 75 |
Table of Contents
This is the method each Fund will use. However, at the time of purchase or upon the sale of covered shares, shareholders may choose a different tax identification method. Furthermore, if you purchase shares through a financial intermediary, please contact the intermediary to find out what default tax identification method they will use. We recommend that you consult your tax adviser to determine which tax identification methodology best suits your individual tax situation.
For More Information
This report is for the general information of the Funds’ shareholders and is not authorized for distribution to prospective investors unless preceded or accompanied by a current prospectus. You may obtain a copy of the prospectus, which contains information about the investment objectives, risks, charges, expenses, and share classes of each ICON Fund, by visiting www.iconfunds.com or by calling 1-800-764-0442. Please read the prospectus carefully before investing.
ICON Distributors, Inc., Distributor.
| 76 | OTHER INFORMATION |
Table of Contents
ICON FUNDS PRIVACY INFORMATION
| FACTS | WHAT DOES ICON DO WITH YOUR PERSONAL INFORMATION? | |
| Why? | Financial companies choose how they share your personal information. Federal law gives consumers the right to limit some but not all sharing. Federal law also requires us to tell you how we collect, share, and protect your personal information. Please read this notice carefully to understand what we do. | |
| What? | The types of personal information we collect and share depend on the product or service you have with us. This information can include:
n Social Security number and account balances
n income and transaction history
n checking account information and wire transfer instructions
When you are no longer our customer, we continue to share your information as described in this notice. | |
| How? | All financial companies need to share customers’ personal information to run their everyday business. In the section below, we list the reasons financial companies can share their customers’ personal information; the reasons ICON chooses to share; and whether you can limit this sharing. |
| Reasons we can share your personal information | Does ICON share? | Can you limit this sharing? | ||
For our everyday business purposes — such as to process your transactions, maintain your account(s), respond to court orders and legal investigations, or report to credit bureaus | Yes | No | ||
For our marketing purposes — to offer our products and services to you | No | We don’t share | ||
| For joint marketing with other financial companies | No | We don’t share | ||
For our affiliates’ everyday business purposes — information about your transactions and experiences | No | We don’t share | ||
For our affiliates’ everyday business purposes — information about your creditworthiness | No | We don’t share | ||
| For nonaffiliates to market to you | No | We don’t share |
| Questions? | Call 1-800-764-0442 for the ICON Funds and 1-800-828-4881 for ICON Advisers, Inc. and ICON Distributors, Inc. |
| FUNDS PRIVACY INFORMATION | 77 |
Table of Contents
| Page 2 |
| Who we are | ||
| Who is providing this notice? | ICON Funds, ICON Advisers, Inc., and ICON Distributors, Inc. (collectively “ICON”) | |
| What we do | ||
| How does ICON protect my personal information? | To protect your personal information from unauthorized access and use, we use security measures that comply with federal law. These measures include computer safeguards and secured files and buildings.
Contracts with our service providers require them to restrict access to your non-public personal information, and to maintain physical, electronic and procedural safeguards against unintended disclosure. | |
| How does ICON collect my personal information? | We collect your personal information, for example, when you
n open an account or enter into an investment advisory contract
n provide account information or give us your contact information
n make a wire transfer
We also collect your personal information from others, such as credit bureaus, affiliates, or other companies. | |
| Why can’t I limit all sharing? | Federal law gives you the right to limit only
n sharing for affiliates’ everyday business purposes — information about your creditworthiness
n affiliates from using your information to market to you
n sharing for nonaffiliates to market to you
State laws and individual companies may give you additional rights to limit sharing. | |
| Definitions | ||
| Affiliates | Companies related by common ownership or control. They can be financial and nonfinancial companies.
n Our affiliates include financial companies such as ICON Funds, ICON Advisers, Inc., and ICON Distributors, Inc. | |
| Nonaffiliates | Companies not related by common ownership or control. They can be financial and nonfinancial companies.
n Nonaffiliates we share with can include financial companies such as custodians, transfer agents, registered representatives, financial advisers and nonfinancial companies such as fulfillment, proxy voting, and class action service providers | |
| Joint marketing | A formal agreement between nonaffiliated financial companies that together market financial products or services to you.
n ICON doesn’t jointly market |
| 78 | FUNDS PRIVACY INFORMATION |
Table of Contents
(This page is intentionally left blank)
Table of Contents
(This page is intentionally left blank)
Table of Contents
(This page is intentionally left blank)
Table of Contents
For more information about the ICON Funds, contact us:
| By Telephone | 1-800-764-0442 | |
| By Mail | ICON Funds P.O. Box 55452 Boston, MA 02205-8165 | |
| In Person | ICON Funds 5299 DTC Boulevard, 12th Floor Greenwood Village, CO 80111 | |
| On the Internet | www.iconfunds.com | |
| By E-Mail | info@iconadvisers.com | |
Table of Contents

2013 ANNUAL REPORT
ICON SECTOR FUNDS
INVESTMENT UPDATE
ICON Consumer Discretionary Fund
ICON Consumer Staples Fund
ICON Energy Fund
ICON Financial Fund
ICON Healthcare Fund
ICON Industrials Fund
ICON Information Technology Fund
ICON Materials Fund
ICON Utilities Fund

1-800-764-0442 | www.iconfunds.com
AR-SECT-13-W37523
Table of Contents

You can now sign up for electronic delivery of ICON Fund shareholder reports, including prospectuses, annual reports, semiannual reports and proxy statements.
When these materials are available, you will receive an email from ICON with instructions on how to view the documents. Statements, transaction confirmations and other documents that are not available online will continue to be sent to you by U.S. mail.
Visit ICON’s website at www.iconfunds.com to learn more and sign up.
You may change or cancel your participation in eDelivery by visiting www.iconfunds.com, or you can request a hard copy of any of the materials free of charge by calling ICON Funds at 1-800-764-0442.
1-800-764-0442 • www.iconfunds.com
Table of Contents

| 2 | ||||
Management Overview (Unaudited) and Schedules of Investments | ||||
| 5 | ||||
| 11 | ||||
| 17 | ||||
| 23 | ||||
| 28 | ||||
| 34 | ||||
| 39 | ||||
| 45 | ||||
| 51 | ||||
| 58 | ||||
| 74 | ||||
| 84 | ||||
| 102 | ||||
| 103 | ||||
| 106 | ||||
| 108 | ||||
Table of Contents
Historical Returns
All total returns mentioned in this Report account for the change in a Fund’s per-share price and the reinvestment of any dividends, capital gain distributions and adjustments for financial statement purposes. If your account is set up to receive Fund distributions in cash rather than to reinvest them, your actual return may differ from these figures. The Funds’ performance results do not reflect the deduction of taxes that a shareholder would pay on Fund distributions or on the redemption of Fund shares. The Adviser may have reimbursed certain fees or expenses of some of the Funds. If not for these reimbursements, performance would have been lower. Fund results shown, unless otherwise indicated, are at net asset value. If a sales charge (maximum 5.75%) had been deducted, results would have been lower.
Past performance does not guarantee future results. Investment return and principal value will fluctuate so that an investor’s shares, when redeemed, may be worth more or less than their original cost. Performance results represent past performance, and current performance may be higher or lower. Please call 1-800-764-0442 or visit www.iconfunds.com for performance results current to the most recent month-end.
Portfolio Data
This Report reflects ICON’s views, opinions and portfolio holdings as of September 30, 2013, the end of the reporting period. The information is not a complete analysis of every aspect of any sector, industry, security or the Funds.
Opinions and forecasts regarding industries, companies and/or themes, and portfolio composition and holdings are subject to change at any time based on market and other conditions, and should not be construed as a recommendation of any specific security, industry or sector. Each Fund’s holdings as of September 30, 2013 are included in each Fund’s Schedule of Investments.
According to ICON, value investing is an analytical approach to investing that employs various factors, including projecting earnings growth estimates, in an effort to determine whether securities are over- or underpriced relative to ICON’s estimates of their intrinsic value. Value investing involves risks and uncertainties and does not guarantee better performance or lower costs than other investment methodologies. ICON’s value-to-price ratio (“V/P”) is a ratio of intrinsic value, as calculated using ICON’s proprietary valuation
| 2 | ABOUT THIS REPORT |
Table of Contents
methodology, of a broad range of domestic and international securities within ICON’s system as compared to the current market price of those securities. The ICON system relies on the integrity of the financial statements released to the market as part of our analysis.
This Report contains statements regarding industry or sector themes, new market themes, investment outlook, relative strength, value-to-price ratios, and investment team expectations, beliefs, goals and the like that are based on current expectations, recent individual stock performance relative to current market prices, estimates of company values and other information supplied to the market by the companies we follow. Words such as “expects,” “suggests,” “anticipates,” “targets,” “goals,” “value,” “intrinsic value,” “indicates,” “believes,” “considers,” “estimates,” variations of such words and similar expressions are intended to identify forward looking statements, which are not statements of historical fact. Forward looking statements are not guarantees of future performance and involve certain risks, uncertainties and assumptions that are difficult to assess. These risks and uncertainties are based on a number of important factors, including, among others: stock price fluctuations; the integrity and accuracy of historical and projected financial and other information supplied by companies to the public or assumptions based on such information supplied; interest rates; bond yields; future earnings growth rates; the risks noted in this Report and other factors beyond the control of our investment team but used by the investment team to influence their assumptions. Therefore, actual outcomes may differ materially from what is expressed in such forward looking statements.
There are risks associated with mutual fund investing, including the loss of principal. The likelihood of loss may be greater if you invest for a shorter period of time. There is no assurance that the investment process will consistently lead to successful results.
An investment concentrated in sectors and industries may involve greater risk and volatility than a more diversified investment. Investments in foreign securities may entail unique risks, including political, market, and currency risks. Financial statements of foreign companies are governed by different accounting, auditing, and financial standards than U.S. companies and may be less transparent and uniform than in the United States. Many corporate governance standards, which help ensure the integrity of public information in the United States, do not exist in foreign countries. In general, there may be less governmental supervision of foreign stock exchanges and securities brokers and issuers. The ICON system relies on the integrity of financial statements released to the market as part of our analysis.
| ABOUT THIS REPORT | 3 |
Table of Contents
The prospectus and statement of additional information contain this and other information about the Funds and are available by visiting www.iconfunds.com or calling 1-800-764-0442. Please read the prospectus and statement of additional information carefully.
Comparative Indexes
The comparative indexes discussed in this Report are meant to provide a basis for judging the Funds’ performance against specific securities indexes. Each index shown accounts for both change in the security price and reinvestment of dividends and distributions (except as noted), but does not reflect the costs of managing a mutual fund. The Funds’ portfolios may significantly differ in holdings and composition from the indexes. Individuals cannot invest directly in an index.
| • | The unmanaged Standard & Poor’s (“S&P”) Composite 1500 Index (“S&P Composite 1500 Index”) is a broad-based capitalization-weighted index comprising 1,500 stocks of large-cap, mid-cap, and small-cap U.S. companies. |
| • | The capitalization-weighted S&P 1500 Sector and Industry Indexes are based on specific classifications determined by S&P. |
| • | The unmanaged NASDAQ Composite (“NASDAQ”) Index is a broad-based capitalization-weighted index of all NASDAQ National Market and Small-Cap stocks. |
| • | Total returns for the S&P 1500 Consumer Discretionary Index and the S&P 1500 Industrials Index include the reinvestment of dividends and capital gain distributions beginning January 1, 2002. Index returns with reinvested dividends and distributions are unavailable prior to that date. |
Index returns and statistical data included in this Report are provided by FactSet Research Systems.
Financial Intermediary
If you purchase the Fund through a broker-dealer or other financial intermediary (such as a bank), the Fund and its related companies may pay the intermediary for the sale of Fund shares and related services. These payments may influence the broker-dealer or other intermediary and your salesperson to recommend the Fund over another investment. Ask your salesperson or visit your financial intermediary’s website for more information.
| 4 | ABOUT THIS REPORT |
Table of Contents
Class S Class C Class A | ICCCX ICCEX ICCAX |
| Q. | How did the Fund perform relative to its benchmark? |
| A. | The ICON Consumer Discretionary Fund Class S returned 22.91% for the fiscal year ended September 30, 2013, while the benchmark S&P 1500 Consumer Discretionary Index rose 31.89%. The broad market S&P Composite 1500 Index gained 20.43%. Total returns for other periods and additional Class shares as of September 30, 2013, appear in the subsequent pages of this Fund’s Management Overview. |
| Q. | What primary factors influenced the Fund’s relative performance during the period? |
| A. | Although economic growth was relatively moderate, U.S. gross domestic product did rise and the Federal Reserve continued its loose monetary policy. The loose monetary policy kept interest rates low and helped create a relatively strong housing market during the period. In the early spring 2013, 30-year fixed rate mortgages were at about 3.5% down from 6.5% in the fall of 2008. Homebuyers took advantage of the low rates and U.S. existing home sales rose steadily to levels not seen since November of 2009. Housing prices also increased sharply. From a broader perspective, earnings in the sector were positive, also supportive of the move higher in this area of the market. |
The moderate economic growth, low interest rate environment and rising stock market appeared to help steady consumer confidence over the period. The Consumer Board Confidence Index, a measure of respondents’ attitude toward future economic conditions rose sharply over the period. The Index started the year at 68.4 and ended at a value of 79.7, more than a 16% increase. The Index was also well above its three year low of 40.9 reached on October of 2011 and its all-time low of 25.3 reached on February of 2009 just before the market began its turnaround.
At the start of this fiscal period, our valuation model indicated that there was significant value in the market and the Consumer Discretionary sector. Our model provides us with an estimate of the intrinsic value of a stock, which can then be compared to where it is trading in the market. As we entered the beginning of the fiscal year, the model provided us with a reasonable degree of confidence that Consumer Discretionary stocks were trading below our measure of intrinsic value. While macroeconomic conditions were showing signs of stability and the
| MANAGEMENT OVERVIEW | 5 |
Table of Contents
housing market was recovering sharply, it was our estimate of value that guided our investment decisions. We maintained low levels of cash over the fiscal year consistent with our model’s indication of value in the sector.
| Q. | How did the Fund’s composition affect performance? |
| A. | While this Fund did lag its benchmark for the period, we were able to participate in some of the gains in the sector. Our disciplined approach to constructing and managing this Fund is based on our valuation estimates. The model indicated industries within the sector where there may be the most upside potential and we tilted towards them. In breaking down this Fund’s performance, we will focus on those industries that had the most significant impact on benchmark relative performance. |
Two large overweight industries had a large positive impact on benchmark relative performance: footwear and housewares & specialties. The average weight of the footwear industry in this Fund was about 7.1% over the period. This compares to its average benchmark weight over the period of approximately 2.6%. This industry significantly outperformed the sector as a whole. In the housewares & specialties industry, this Fund held an average position of about 6.8% vs. about 0.9% for the benchmark. This industry also outperformed the Consumer Discretionary sector and was another major contributor to positive benchmark-relative performance. A large underweight position in the restaurant industry also provided positive performance relative to this Fund’s benchmark. This Fund held almost no position in this industry – about 1.3% for the period – while the benchmark weight was about 11.4% on average over the fiscal year. This industry significantly underperformed the benchmark leading to benchmark-relative gains.
On the flipside, a few of the industries that negatively impacted benchmark-relative performance were homebuilding, apparel accessories & luxury goods and internet retail. Despite the fact that the homebuilding industry was in a strong growth mode, stocks did not follow suit. The average return of a homebuilding stock in the sector index was about 4.0% for the fiscal year, well below the sector return of 31.9%. We held only a small position in this industry of about 3.6% for the period, slightly higher than the average benchmark weight of approximately 1.9%, but the dramatic underperformance of the group translated into significant negative benchmark relative performance for this Fund. This Fund held an overweight position in the apparel accessories & luxury goods industry of about 7.2% versus 4.0% for the benchmark, and this group underperformed the sector benchmark. This Fund’s position in the internet retail industry also detracted from benchmark relative
| 6 | MANAGEMENT OVERVIEW |
Table of Contents
performance. We held almost no position in this industry and it comprised approximately 8.3% of the benchmark and outperformed the sector benchmark index.
| Q. | What is your investment outlook for the Consumer Discretionary sector? |
| A. | At the close of the fiscal year, our model suggests the Consumer Discretionary sector is about fairly valued. However, at the industry level there are still opportunities according to our calculation of value. We believe, for example, that the specialty stores industry is among the most undervalued in the sector and we continue to maintain a significant overweight position there. Guided by our valuation methodology, we will attempt to capture additional opportunities as they may present themselves over the course of the next year. From ICON’s perspective, however, our belief that the sector does not have much upside potential is a function of our value based bottom-up investment process. |
ICON Consumer Discretionary Fund
Sector Composition
September 30, 2013
Consumer Discretionary | 82.0% | |||
|
| |||
| 82.0% | ||||
|
|
Percentages are based upon common stocks as a percentage of net assets.
ICON Consumer Discretionary Fund
Industry Composition
September 30, 2013
Specialty Stores | 19.6% | |||
Movies & Entertainment | 8.3% | |||
Apparel Retail | 8.2% | |||
Apparel, Accessories & Luxury Goods | 7.2% | |||
Housewares & Specialties | 7.0% | |||
Footwear | 5.6% | |||
Broadcasting | 5.4% | |||
Internet Retail | 3.8% | |||
Homebuilding | 3.5% | |||
Cable & Satellite | 3.3% | |||
Home Improvement Retail | 3.2% | |||
General Merchandise Stores | 2.1% | |||
Automotive Retail | 1.5% | |||
Restaurants | 1.3% | |||
Department Stores | 1.2% | |||
Leisure Products | 0.8% | |||
|
| |||
| 82.0% | ||||
|
|
Percentages are based upon common stocks as a percentage of net assets.
| MANAGEMENT OVERVIEW | 7 |
Table of Contents
ICON Consumer Discretionary Fund Average Annual Total Return
as of September 30, 2013
| Inception Date | 1 Year | 5 Years | 10 Years | Since Inception | Gross Expense Ratio* | Net Expense Ratio* | ||||||||||||||||||||||
ICON Consumer Discretionary | 7/9/97 | 22.91% | 16.01% | 7.51% | 5.78% | 1.40% | 1.40% | |||||||||||||||||||||
ICON Consumer Discretionary | 9/30/10 | 21.43% | N/A | N/A | 21.03% | 6.01% | 2.75% | |||||||||||||||||||||
ICON Consumer Discretionary | 9/30/10 | 22.42% | N/A | N/A | 21.61% | 1.78% | 1.78% | |||||||||||||||||||||
ICON Consumer Discretionary | 9/30/10 | 15.38% | N/A | N/A | 19.25% | 1.78% | 1.78% | |||||||||||||||||||||
S&P 1500 Consumer Discretionary Index | 31.89% | 18.74% | 9.76% | 8.24% | N/A | N/A | ||||||||||||||||||||||
S&P Composite 1500 Index | 20.43% | 10.35% | 7.97% | 6.26% | N/A | N/A | ||||||||||||||||||||||
Past performance is not a guarantee of future results. The performance of the S&P 1500 Consumer Discretionary Index includes the reinvestment of the dividends and capital gain distributions beginning on January 1, 2002. Additional information about these performance results and the comparative indexes can be found in the About This Report section. The Adviser has agreed to limit certain Fund expenses; without these limitations, returns would have been lower. The limitation provisions may be terminated in the future.
| * | Please see the most recent prospectus for details. |
Class C total returns exclude applicable sales charges. If sales charges were included returns would be lower.
| 8 | MANAGEMENT OVERVIEW |
Table of Contents
ICON Consumer Discretionary Fund
Value of a $10,000 Investment
through September 30, 2013
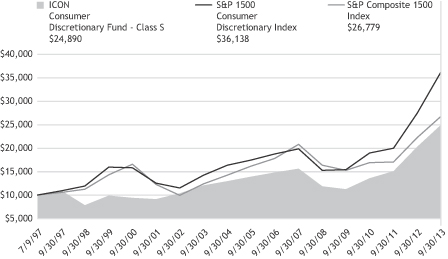
Past performance is not a guarantee of future results. The above graph compares a $10,000 investment made in the Fund’s Class S shares on the Class’ inception date of 7/9/97 to a $10,000 investment made in unmanaged securities indexes on that date. The Fund’s performance in this chart and the performance table assumes the reinvestment of dividends and capital gain distributions but does not reflect the deduction of taxes that a shareholder would pay on Fund distributions or on the redemption of Fund shares.
| MANAGEMENT OVERVIEW | 9 |
Table of Contents
ICON CONSUMER DISCRETIONARY FUND
SCHEDULEOF INVESTMENTS
SEPTEMBER 30, 2013
| Shares or Principal Amount | Value | |||||||
| Common Stocks (82.0%) | ||||||||
| 1,600 | AutoZone, Inc.† | $ | 676,368 | |||||
| 18,300 | Comcast Corp., Class A | 826,245 | ||||||
| 13,500 | Dick’s Sporting Goods, Inc. | 720,630 | ||||||
| 11,100 | DIRECTV† | 663,225 | ||||||
| 25,000 | Discovery Communications, Inc., Class A† | 2,110,500 | ||||||
| 16,700 | Dollar Tree, Inc.† | 954,572 | ||||||
| 6,400 | Expedia, Inc. | 331,456 | ||||||
| 20,400 | Genesco, Inc.† | 1,337,832 | ||||||
| 31,100 | Hibbett Sports, Inc.†(a) | 1,746,265 | ||||||
| 18,900 | Home Depot, Inc. | 1,433,565 | ||||||
| 34,950 | Jarden Corp.† | 1,691,580 | ||||||
| 8,800 | MDC Holdings, Inc. | 264,088 | ||||||
| 30,740 | Nike, Inc., Class B | 2,232,954 | ||||||
| 10,000 | Nordstrom, Inc. | 562,000 | ||||||
| 3,600 | Panera Bread Co., Class A† | 570,708 | ||||||
| 33,400 | PetSmart, Inc. | 2,547,084 | ||||||
| 2,800 | Polaris Industries, Inc. | 361,704 | ||||||
| 1,400 | priceline.com, Inc.† | 1,415,330 | ||||||
| 14,800 | PulteGroup, Inc. | 244,200 | ||||||
| 11,800 | PVH Corp. | 1,400,542 | ||||||
| 8,600 | Ralph Lauren Corp. | 1,416,678 | ||||||
| 32,400 | Ross Stores, Inc. | 2,358,720 | ||||||
| 15,000 | Ryland Group, Inc. | 608,100 | ||||||
| Shares or Principal Amount | Value | |||||||
| 4,100 | Scripps Networks Interactive, Inc., Class A | $ | 320,251 | |||||
| 14,900 | Tiffany & Co. | 1,141,638 | ||||||
| 14,100 | Toll Brothers, Inc.† | 457,263 | ||||||
| 39,400 | Tractor Supply Co. | 2,646,498 | ||||||
| 16,600 | Tupperware Brands Corp. | 1,433,742 | ||||||
| 2,200 | V.F. Corp. | 437,910 | ||||||
| 58,200 | Walt Disney Co. | 3,753,318 | ||||||
| 4,900 | Wolverine World Wide, Inc. | 285,327 | ||||||
|
| |||||||
| | Total Common Stocks (Cost $31,608,889) | 36,950,293 | ||||||
| Collateral for Securities on Loan (3.8%) | ||||||||
| 1,691,451 | State Street Navigator Prime Portfolio, 0.17% | 1,691,451 | ||||||
|
| |||||||
|
| Total Collateral for Securities on Loan (Cost $1,691,451) | 1,691,451 | ||||||
| Short-Term Investments (16.9%) | ||||||||
| $ | 7,639,702 | State Street Euro Dollar Time Deposit (USD), 0.01%, 10/01/13 | 7,639,702 | |||||
|
| |||||||
| | Total Short-Term Investments (Cost $7,639,702) | 7,639,702 | ||||||
| | Total Investments 102.7% (Cost $40,940,042) | 46,281,446 | ||||||
| | Liabilities Less Other Assets (2.7)% | (1,226,380 | ) | |||||
|
| |||||||
| Net Assets 100.0% | $ | 45,055,066 | �� | |||||
|
| |||||||
| 10 | SCHEDULEOF INVESTMENTS |
The accompanying notes are an integral part of the financial statements.
| † | Non-income producing security. |
| (a) | All or a portion of the security was on loan as of September 30, 2013. |
Table of Contents
MANAGEMENT OVERVIEW (UNAUDITED) | Class S Class C Class A | ICLEX ICLCX ICRAX |
| Q. | How did the Fund perform relative to its benchmark? |
| A. | The ICON Consumer Staples Fund Class S returned 11.75% for the fiscal year ended September 30, 2013, while its sector-specific benchmark, the S&P 1500 Consumer Staples Index rose 15.17%. Total returns for other periods and additional Class shares as of September 30, 2013 appear in the subsequent pages of this Fund’s Management Overview. |
| Q. | What primary factors were behind the Fund’s relative performance? |
| A. | The fiscal year was marked by tepid growth in the U.S. economy and a relatively high unemployment rate. The unemployment rate started the fiscal year at 7.8% and ended the period at about 7.3%. The Federal Reserve continued its quantitative easing program to hold interest rates down in an effort to sustain economic growth. The Federal Reserve’s efforts did appear to ignite growth in the housing market. With mortgage rates holding at historical lows, buyers took advantage of the opportunity spurring growth in home sales and prices. The stock market continued its strong rally that began back in March of 2009 as economic conditions improved, albeit at a slow pace. |
The market rally was broad with nine of the ten sectors in the S&P Composite 1500 Index posting gains. Two of the most economically sensitive sectors led the market higher: Consumer Discretionary and Industrials; while two of the least economically sensitive sectors, Utilities and Telecommunication Services finished ninth and tenth in fiscal year returns respectively. For some perspective, the Consumer Discretionary sector was up the most over the period posting a total return of 31.89%. At the other end of the spectrum, the Telecommunication Services sector was the worst performer posting a negative total return of 0.47%. The Consumer Staples sector was in the middle of the pack gaining 15.16% for the year. It appeared that with the economy slightly improving and low interest rates making housing more affordable; investors had more of an appetite for the economically sensitive sectors that generally carry more risk than a defensive one such as Consumer Staples. The beta (a measure of volatility, or systematic risk, in comparison to the S&P Composite 1500 Index) for the Consumer Discretionary sector was 1.13, while the beta for the Consumer Staples sector was 0.81.
As we entered fiscal year 2013, ICON’s valuation model indicated upside potential both in the market and in the Consumer Staples sector. As a
| MANAGEMENT OVERVIEW | 11 |
Table of Contents
result, we did not hold significant amounts of cash in this Fund. This decision was not based on a top down macroeconomic analysis, but rather based on our bottom-up value based investment methodology.
| Q. | How did the Fund’s composition affect performance? |
| A. | There were industry positions within this Fund that had a positive impact on benchmark relative performance during the fiscal year. Of the 12 industries we track in the sector, positions in household products and tobacco resulted in strong benchmark relative performance. This Fund maintained a significant underweight position in household products over the period. The average weight of the group in this Fund was about 14.0%. The benchmark weight was approximately 20.5%. This group lagged the benchmark. Holdings in tobacco stocks also had a positive impact on benchmark relative performance. The combined weight of these stocks was about 22.7% in this Fund versus approximately 16.1% in the benchmark. Select tobacco industry holdings contributed to positive benchmark relative performance. |
While active stock selection benefited this Fund’s performance relative to its benchmark and on a total return basis as well, they were not enough to overcome other industry holdings that negatively impacted benchmark relative performance. The industry position that hurt this Fund the most was packaged foods & meats. This Fund held an average weight of about 11.5% in the industry over the period. The group comprised about 16.6% of the benchmark. Because this industry outperformed the sector benchmark, our underweight position detracted from benchmark relative performance. An underweight position in the drug retail industry also detracted from benchmark relative performance. Over the period, this Fund had about a 2.6% position in this industry; the benchmark weight was significantly higher at approximately 6.7%. This too, was an outperforming industry within the sector hurting benchmark relative performance.
| Q. | What is your investment outlook for the Consumer Staples sector? |
| A. | Entering the new fiscal period, our valuation model indicates that there is still value in this sector, but not as much upside potential as was indicated going into last year. Our model also indicates that there are some industries with more upside opportunities than others. Two of those industries are tobacco and agricultural products. This Fund maintains overweight positions in each of them. |
We expect the Consumer Staples sector will continue to exhibit moderate returns compared to other more economically sensitive sectors and the
| 12 | MANAGEMENT OVERVIEW |
Table of Contents
broader market, as it has historically. Still, the so-called recession proof characteristics of the Consumer Staples sector have generally demonstrated less volatility than the broader market and our model suggests there is room for the sector to continue higher over the course of the next twelve months.
ICON Consumer Staples Fund
Sector Composition
September 30, 2013
Consumer Staples | 98.9% | |||
|
| |||
| 98.9% | ||||
|
|
Percentages are based upon common stocks as a percentage of net assets.
ICON Consumer Staples Fund
Industry Composition
September 30, 2013
Tobacco | 25.3% | |||
Hypermarkets & Super Centers | 16.0% | |||
Soft Drinks | 15.6% | |||
Packaged Foods & Meats | 14.9% | |||
Household Products | 13.1% | |||
Agricultural Products | 6.4% | |||
Distillers & Vintners | 5.8% | |||
Other Industries (each less than 1%) | 1.8% | |||
|
| |||
| 98.9% | ||||
|
|
Percentages are based upon common stocks as a percentage of net assets.
| MANAGEMENT OVERVIEW | 13 |
Table of Contents
ICON Consumer Staples Fund Average Annual Total Return
as of September 30, 2013
| Inception Date | 1 Year | 5 Years | 10 Years | Since Inception | Gross Expense Ratio* | Net Expense Ratio* | ||||||||||||||||||||||
ICON Consumer Staples Fund - Class S | 5/9/97 | 11.75% | 10.13% | 6.63% | 8.23% | 1.55% | 1.51% | |||||||||||||||||||||
ICON Consumer Staples Fund - Class C | 9/30/10 | 10.69% | N/A | N/A | 12.38% | 3.33% | 2.51% | |||||||||||||||||||||
ICON Consumer Staples Fund - Class A | 9/30/10 | 11.52% | N/A | N/A | 13.52% | 2.05% | 1.77% | |||||||||||||||||||||
ICON Consumer Staples Fund - Class A (including maximum sales charge of 5.75%) | 9/30/10 | 5.15% | N/A | N/A | 11.32% | 2.05% | 1.77% | |||||||||||||||||||||
S&P 1500 Consumer Staples Index | 15.17% | 11.20% | 10.16% | 7.53% | N/A | N/A | ||||||||||||||||||||||
S&P Composite 1500 Index | 20.43% | 10.35% | 7.97% | 6.84% | N/A | N/A | ||||||||||||||||||||||
Past performance is not a guarantee of future results. The performance of the S&P 1500 Consumer Staples Index includes the reinvestment of the dividends and capital gain distributions beginning on January 1, 2002. Additional information about these performance results and the comparative indexes can be found in the About This Report section. The Adviser has agreed to limit certain Fund expenses; without these limitations, returns would have been lower. The limitation provisions may be terminated in the future.
| * | Please see the most recent prospectus for details. |
Class C total returns exclude applicable sales charges. If sales charges were included returns would be lower.
| 14 | MANAGEMENT OVERVIEW |
Table of Contents
ICON Consumer Staples Fund
Value of a $10,000 Investment
through September 30, 2013
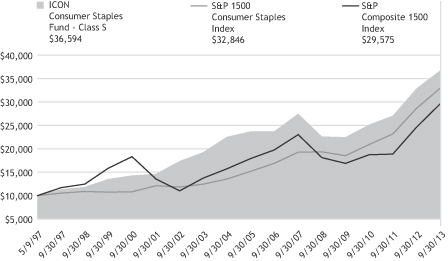
Past performance is not a guarantee of future results. The above graph compares a $10,000 investment made in the Fund’s Class S shares on the Class’ inception date of 5/9/97 to a $10,000 investment made in unmanaged securities indexes on that date. The Fund’s performance in this chart and the performance table assumes the reinvestment of dividends and capital gain distributions but does not reflect the deduction of taxes that a shareholder would pay on Fund distributions or on the redemption of Fund shares.
| MANAGEMENT OVERVIEW | 15 |
Table of Contents
ICON CONSUMER STAPLES FUND
SCHEDULEOF INVESTMENTS
SEPTEMBER 30, 2013
| Shares or Principal Amount | Value | |||||||
| Common Stocks (98.9%) | ||||||||
| 11,800 | Altria Group, Inc. | $ | 405,330 | |||||
| 3,900 | British American Tobacco PLC, ADR | 410,085 | ||||||
| 25,300 | Brown-Forman Corp., Class B | 1,723,689 | ||||||
| 13,100 | Bunge, Ltd. | 994,421 | ||||||
| 4,800 | Casey’s General Stores, Inc. | 352,800 | ||||||
| 19,900 | Church & Dwight Co., Inc. | 1,194,995 | ||||||
| 128,600 | Coca-Cola Co. | 4,871,368 | ||||||
| 23,200 | Colgate-Palmolive Co. | 1,375,760 | ||||||
| 42,000 | ConAgra Foods, Inc. | 1,274,280 | ||||||
| 30,400 | Costco Wholesale Corp. | 3,499,648 | ||||||
| 3,900 | Diageo PLC, ADR | 495,612 | ||||||
| 4,600 | Energizer Holdings, Inc. | 419,290 | ||||||
| 21,700 | Ingredion, Inc. | 1,435,889 | ||||||
| 15,800 | J.M. Smucker Co. | 1,659,632 | ||||||
| 4,700 | Kimberly-Clark Corp. | 442,834 | ||||||
| 37,600 | Lorillard, Inc. | 1,683,728 | ||||||
| 23,600 | McCormick & Co., Inc. | 1,526,920 | ||||||
| Shares or Principal Amount | Value | |||||||
| 13,800 | PepsiCo, Inc. | $ | 1,097,100 | |||||
| 58,400 | Philip Morris International, Inc. | 5,056,856 | ||||||
| 20,700 | Procter & Gamble Co. | 1,564,713 | ||||||
| 43,500 | Reynolds American, Inc. | 2,121,930 | ||||||
| 45,300 | Tyson Foods, Inc., Class A | 1,281,084 | ||||||
| 5,200 | United Natural Foods, Inc.† | 349,544 | ||||||
| 35,700 | Wal-Mart Stores, Inc. | 2,640,372 | ||||||
|
| |||||||
| | Total Common Stocks (Cost $35,716,720) | 37,877,880 | ||||||
| Short-Term Investments (0.9%) | ||||||||
| $ | 338,712 | State Street Euro Dollar Time Deposit (USD), 0.01%, 10/01/13 | 338,712 | |||||
|
| |||||||
| | Total Short-Term Investments (Cost $338,712) | 338,712 | ||||||
|
| Total Investments 99.8% (Cost $36,055,432) | 38,216,592 | ||||||
| | Other Assets Less Liabilities 0.2% | 78,544 | ||||||
|
| |||||||
| Net Assets 100.0% | $ | 38,295,136 | ||||||
|
| |||||||
The accompanying notes are an integral part of the financial statements.
| † | Non-income producing security. |
| ADR | American Depositary Receipt |
| 16 | SCHEDULEOF INVESTMENTS |
Table of Contents
MANAGEMENT OVERVIEW (UNAUDITED) | Class S Class C Class A | ICENX ICEEX ICEAX |
| Q. | How did the Fund perform relative to its benchmarks? |
| A. | The ICON Energy Fund Class S returned 19.55% for the fiscal year ended September 30, 2013, outperforming its sector-specific benchmark, the S&P 1500 Energy Index, which gained 13.25%. Relative to the broad benchmark, the S&P Composite 1500 Index, which rose 20.43%, the ICON Energy Fund lagged slightly. Total returns for other periods and additional Class shares as of September 30, 2013 appear in the subsequent pages of this Fund’s Management Overview. |
| Q. | What primary factors were behind the Fund’s relative performance? |
| A. | Despite high energy commodity pricing over the course of the fiscal year, the Energy sector struggled to keep pace with the broader market as the perception of improving economic conditions led to a broad market rally. During the past fiscal year the average per barrel price of West Texas Intermediate Crude held higher than $95, and yet with this price support the large integrated oil and gas companies’ gains were a meager 2.65% within the S&P 1500 Energy Index. Energy giant Exxon Mobil Corp. declined over 3% during the fiscal year. This lackluster performance is attributed to the lack of production increases at Exxon Mobil Corp. and its increased exposure to the lower profit margin production of natural gas. |
Outside of the integrated oil & gas industry, which comprises over 45% of the S&P 1500 Energy Index, there were some strong performing industries. Both oil & gas equipment & services and oil & gas exploration & production industries achieved weighted average returns higher than 20% over the year as efficiencies in oil & gas extraction had led to record U.S. production placing the U.S. as the world’s leading energy producer at the end of this fiscal year.
| Q. | How did the Fund’s composition affect performance? |
| A. | This Fund benefited from strong active bets resulting in performance which exceeded that of the benchmark. Oil & gas equipment & services comprised, on average, about 26% of this Fund during the fiscal year with a heavy tilt towards offshore service providers like Dril-Quip, Inc. and Oceaneering International, Inc. These two companies represent the two largest oil & gas equipment & services weightings in this Fund over the past year. Both positions returned over 50% in this Fund over the course of the fiscal year. The overweight of these two companies was |
| MANAGEMENT OVERVIEW | 17 |
Table of Contents
| instrumental in helping this Fund’s oil & gas equipment & services industry holdings outperform the S&P 1500 Energy Index oil & gas equipment & services holdings during this time period. |
Additional outperformance came from an overweight position in the oil & gas refining & marketing industry. While the stocks held in this Fund for this industry did not have as strong of returns as the industry specific benchmark, the return was still high enough versus the S&P 1500 Energy Index to lead to a positive contribution to this Fund’s performance. A large underweight position of the integrated oil & gas industry, about 23% in this Fund versus 45% in the benchmark, also contributed positively during the fiscal year as that industry was a notable drag on the energy sector with a weighted average return well below the broad based Energy index.
| Q. | What is your investment outlook for the Energy sector? |
| A. | At the end of the fiscal year the overall market V/P stands at 0.99. As a result we are not anticipating a broad market rally to help lift the energy sector. That being said, ICON’s V/P for the energy sector is at 1.11 and thus has some attractive upside. The oil & gas refining & marketing industry with an average V/P of 1.21 looks particularly attractive under our system from a valuation standpoint. While this industry is currently only slightly overweight in this Fund compared to the benchmark, ICON will monitor the industry valuations to potentially increase the oil & gas refining & marketing weight, assuming valuations remain attractive. |
ICON Energy Fund
Sector Composition
September 30, 2013
Energy | 92.3% | |||
Utilities | 3.2% | |||
|
| |||
| 95.5% | ||||
|
|
Percentages are based upon common stocks as a percentage of net assets.
ICON Energy Fund
Industry Composition
September 30, 2013
Integrated Oil & Gas | 28.7% | |||
Oil & Gas Equipment & Services | 25.9% | |||
Oil & Gas Exploration & Production | 21.5% | |||
Oil & Gas Refining & Marketing | 8.0% | |||
Oil & Gas Drilling | 6.9% | |||
Gas Utilities | 2.4% | |||
Coal & Consumable Fuels | 1.3% | |||
Multi-Utilities | 0.8% | |||
|
| |||
| 95.5% | ||||
|
|
Percentages are based upon common stocks as a percentage of net assets.
| 18 | MANAGEMENT OVERVIEW |
Table of Contents
ICON Energy Fund
Average Annual Total Return
as of September 30, 2013
| Inception Date | 1 Year | 5 Years | 10 Years | Since Inception | Gross Expense Ratio* | Net Expense Ratio* | ||||||||||||||||||||||
ICON Energy Fund - Class S | 11/5/97 | 19.55% | 7.04% | 15.23% | 12.23% | 1.23% | 1.23% | |||||||||||||||||||||
ICON Energy Fund - Class C | 9/30/10 | 18.30% | N/A | N/A | 11.50% | 2.36% | 2.36% | |||||||||||||||||||||
ICON Energy Fund - Class A | 9/30/10 | 19.21% | N/A | N/A | 12.37% | 1.55% | 1.55% | |||||||||||||||||||||
ICON Energy Fund - Class A (including maximum sales charge of 5.75%) | 9/30/10 | 12.34% | N/A | N/A | 10.17% | 1.55% | 1.55% | |||||||||||||||||||||
S&P 1500 Energy Index | 13.25% | 6.67% | 14.37% | 9.62% | N/A | N/A | ||||||||||||||||||||||
S&P Composite 1500 Index | 20.43% | 10.35% | 7.97% | 6.04% | N/A | N/A | ||||||||||||||||||||||
Past performance is not a guarantee of future results. Information about these performance results and the comparative indexes can be found in the About This Report section. The Adviser has agreed to limit certain Fund expenses; without these limitations, returns would have been lower. The limitation provisions may be terminated in the future.
| * | Please see the most recent prospectus for details. |
Class C total returns exclude applicable sales charges. If sales charges were included returns would be lower.
| MANAGEMENT OVERVIEW | 19 |
Table of Contents
ICON Energy Fund
Value of a $10,000 Investment
through September 30, 2013
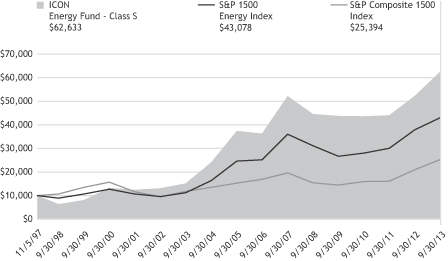
Past performance is not a guarantee of future results. The above graph compares a $10,000 investment made in the Fund’s Class S shares on the Class’ inception date of 11/5/97 to a $10,000 investment made in unmanaged securities indexes on that date. The Fund’s performance in this chart and the performance table assumes the reinvestment of dividends and capital gain distributions but does not reflect the deduction of taxes that a shareholder would pay on Fund distributions or on the redemption of Fund shares.
| 20 | MANAGEMENT OVERVIEW |
Table of Contents
ICON ENERGY FUND
SCHEDULEOF INVESTMENTS
SEPTEMBER 30, 2013
| Shares or Principal Amount | Value | |||||||
| Common Stocks (95.5%) | ||||||||
| 91,600 | Alliance Resource Partners L.P. | $ | 6,790,308 | |||||
| 93,600 | Anadarko Petroleum Corp. | 8,703,864 | ||||||
| 201,500 | Atmos Energy Corp. | 8,581,885 | ||||||
| 396,300 | Atwood Oceanics, Inc.† | 21,812,352 | ||||||
| 231,800 | Cameron International Corp.† | 13,530,166 | ||||||
| 501,900 | Chevron Corp. | 60,980,850 | ||||||
| 150,600 | Cimarex Energy Co. | 14,517,840 | ||||||
| 199,600 | CMS Energy Corp. | 5,253,472 | ||||||
| 72,700 | CNOOC, Ltd., ADR | 14,670,860 | ||||||
| 495,200 | ConocoPhillips | 34,421,352 | ||||||
| 111,400 | Core Laboratories NV | 18,849,994 | ||||||
| 394,600 | Denbury Resources, Inc.† | 7,264,586 | ||||||
| 102,100 | Dresser-Rand Group, Inc.† | 6,371,040 | ||||||
| 251,400 | Dril-Quip, Inc.† | 28,848,150 | ||||||
| 251,300 | Ensco PLC, Class A | 13,507,375 | ||||||
| 1,125,400 | Exxon Mobil Corp. | 96,829,416 | ||||||
| 477,500 | FMC Technologies, Inc.† | 26,463,050 | ||||||
| 410,300 | Halliburton Co. | 19,755,945 | ||||||
| 184,500 | Laclede Group, Inc. | 8,302,500 | ||||||
| 146,600 | LUKOIL OAO, ADR | 9,317,896 | ||||||
| 130,400 | Marathon Petroleum Corp. | 8,387,328 | ||||||
| 95,200 | National Oilwell Varco, Inc. | 7,436,072 | ||||||
| 351,100 | Noble Corp. | 13,261,047 | ||||||
| 306,800 | Noble Energy, Inc. | 20,558,668 | ||||||
| 458,700 | Oceaneering International, Inc. | 37,264,788 | ||||||
| 143,500 | Oil States International, Inc.† | 14,846,510 | ||||||
| Shares or Principal Amount | Value | |||||||
| 99,400 | Peabody Energy Corp. | $ | 1,714,650 | |||||
| 253,850 | Phillips 66 | 14,677,607 | ||||||
| 48,900 | Pioneer Natural Resources Co. | 9,232,320 | ||||||
| 493,100 | Rosetta Resources, Inc.† | 26,854,226 | ||||||
| 331,100 | RPC, Inc.(a) | 5,122,117 | ||||||
| 794,100 | Southwestern Energy Co.† | 28,889,358 | ||||||
| 321,800 | Tesoro Corp. | 14,152,764 | ||||||
| 271,800 | Tetra Technologies, Inc.† | 3,405,654 | ||||||
| 549,100 | Valero Energy Corp. | 18,751,765 | ||||||
| 325,700 | Whiting Petroleum Corp.† | 19,493,145 | ||||||
|
| |||||||
| | Total Common Stocks (Cost $562,123,117) | 668,820,920 | ||||||
| Collateral for Securities on Loan (0.7%) | ||||||||
| 5,032,720 | State Street Navigator Prime Portfolio, 0.17% | 5,032,720 | ||||||
|
| |||||||
| | Total Collateral for Securities on Loan (Cost $5,032,720) | 5,032,720 | ||||||
| Short-Term Investments (4.5%) | ||||||||
| $ | 31,735,280 | State Street Euro Dollar Time Deposit (USD), 0.01%, 10/01/13 | 31,735,280 | |||||
|
| |||||||
| | Total Short-Term Investments (Cost $31,735,280) | 31,735,280 | ||||||
| | Total Investments 100.7% (Cost $598,891,117) | 705,588,920 | ||||||
| | Liabilities Less Other Assets (0.7)% | (5,148,003 | ) | |||||
|
| |||||||
| Net Assets 100.0% | $ | 700,440,917 | ||||||
|
| |||||||
| SCHEDULEOF INVESTMENTS | 21 |
Table of Contents
The accompanying notes are an integral part of the financial statements.
| † | Non-income producing security. |
| (a) | All or a portion of the security was on loan as of September 30, 2013. |
| ADR | American Depositary Receipt |
| 22 | SCHEDULEOF INVESTMENTS |
Table of Contents
MANAGEMENT OVERVIEW (UNAUDITED) | Class S Class C Class A | ICFSX ICOCX ICFAX |
| Q. | How did the Fund perform relative to its benchmarks? |
| A. | The ICON Financial Fund Class S gained 24.68% for the fiscal year ending September 30, 2013, lagging the Fund’s sector-specific benchmark, the S&P 1500 Financials Index, which returned 28.70%. The ICON Financial Fund Class S however did outpace the broad benchmark the S&P Composite 1500 Index which rose 20.43% over the fiscal year. Total returns for other periods and additional Class shares as of September 30, 2013 appear in the subsequent pages of this Fund’s Management Overview. |
| Q. | What primary factors were behind the Fund’s relative performance? |
| A. | In the last annual report there was a lot of discussion around the volatility in the Financial sector. The European financial crisis was still a topic of discussion and the US Federal Reserve had recently initiated quantitative easing with Central Banks (QE3). As a result of this volatility, the 1-year weekly beta of the S&P Financial Index relative to the S&P Composite 1500 Index was slightly above 1.30 indicating substantial volatility. This past fiscal year was notably less volatile. The same beta measure was down below 1.15, due to a calming of the European financial crisis and improvements in financial sector earnings. The preceding factors helped the Financial sector outperform the broader market as measured by the S&P Composite 1500 Index. |
The majority of the Financial sector’s strong performance occurred in the first 3 quarters of the fiscal year. By the end of June 2013, the Financial sector V/P slipped below 1.00, indicating we saw the sector as basically fair valued.
| Q. | How did the Fund’s composition affect performance? |
| A. | Strong valuations in the consumer finance industry led this Fund to hold a notable overweight in that industry over the course of the fiscal year averaging about a 15% versus a 5% weighting in the S&P 1500 Financials Index. However, stock selection within this industry hurt relative performance as DFG Global fell 27% in one day after reporting below estimate earnings. |
Additional underperformance came from positions in the other diversified financial services and diversified banks industries. This Fund had a significant overweight in the diversified bank industry which lagged the broad based financial index. Conversely, this Fund’s low exposure to
| MANAGEMENT OVERVIEW | 23 |
Table of Contents
other diversified financial services, due to weak valuations according to our system, resulted in poor relative performance as this industry outperformed the sector specific benchmark over the fiscal year.
This Fund had a large position in asset management & custody banks over the course of the year, around 21% compared to a little over 7.5% for the benchmark. Asset management & custody banks was the top contributing industry in this Fund during the fiscal year, with returns of approximately 40%.
| Q. | What is your investment outlook for the Financials sector? |
| A. | As of September 30, 2013 the Financials sector V/P, as calculated by ICON’s proprietary methodology, was at 0.93. As a result of this weak valuation, this Fund finished off the year with a cash position of over 20%. Despite low overall valuations, there are some select industries that look attractive to us under our system. Both asset management & custody banks and consumer finance have valuations that exceed 1.20 and have heavy representation within this Fund. With both low market and sector valuations, this Fund was structured in a cautionary manner as of September 30, 2013 and will be monitored closely going forward. |
ICON Financial Fund
Sector Composition
September 30, 2013
Financial | 72.4% | |||
Information Technology | 5.9% | |||
|
| |||
| 78.3% | ||||
|
|
Percentages are based upon common stocks as a percentage of net assets.
ICON Financial Fund
Industry Composition
as of September 30, 2013
Asset Management & Custody Banks | 13.9% | |||
Diversified Banks | 10.2% | |||
Consumer Finance | 9.6% | |||
Other Diversified Financial Services | 9.2% | |||
Specialized REIT’s | 8.1% | |||
Property & Casualty Insurance | 6.4% | |||
Data Processing & Outsourced Services | 5.9% | |||
Specialized Finance | 4.2% | |||
Insurance Brokers | 4.0% | |||
Reinsurance | 3.7% | |||
Real Estate Services | 3.1% | |||
|
| |||
| 78.3% | ||||
|
|
Percentages are based upon common stocks as a percentage of net assets.
| 24 | MANAGEMENT OVERVIEW |
Table of Contents
ICON Financial Fund
Average Annual Total Return
as of September 30, 2013
| Inception Date | 1 Year | 5 Years | 10 Years | Since Inception | Gross Expense Ratio* | Net Expense Ratio* | ||||||||||||||||||||||
ICON Financial Fund - Class S | 7/1/97 | 24.68% | -0.99% | 0.47% | 3.58% | 1.39% | 1.39% | |||||||||||||||||||||
ICON Financial Fund - | 9/30/10 | 23.18% | N/A | N/A | 9.71% | 23.96% | 2.51% | |||||||||||||||||||||
ICON Financial Fund - | 9/30/10 | 24.20% | N/A | N/A | 10.63% | 1.80% | 1.77% | |||||||||||||||||||||
ICON Financial Fund - Class A (including maximum sales charge of 5.75%) | 9/30/10 | 16.97% | N/A | N/A | 8.46% | 1.80% | 1.77% | |||||||||||||||||||||
S&P 1500 Financials Index | 28.70% | 2.32% | 0.67% | 3.40% | N/A | N/A | ||||||||||||||||||||||
S&P Composite 1500 Index | 20.43% | 10.35% | 7.97% | 6.37% | N/A | N/A | ||||||||||||||||||||||
Past performance is not a guarantee of future results. Information about these performance results and the comparative indexes can be found in the About This Report section. The Adviser has agreed to limit certain Fund expenses; without these limitations, returns would have been lower. The limitation provisions may be terminated in the future.
| * | Please see the most recent prospectus for details. |
Class C total returns exclude applicable sales charges. If sales charges were included returns would be lower.
| MANAGEMENT OVERVIEW | 25 |
Table of Contents
ICON Financial Fund
Value of a $10,000 Investment
through September 30, 2013
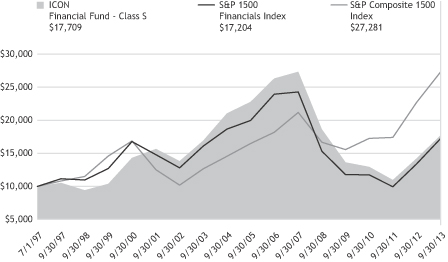
Past performance is not a guarantee of future results. The above graph compares a $10,000 investment made in the Fund’s Class S shares on the Class’ inception date of 7/1/97 to a $10,000 investment made in unmanaged securities indexes on that date. The Fund’s performance in this chart and the performance table assumes the reinvestment of dividends and capital gain distributions but does not reflect the deduction of taxes that a shareholder would pay on Fund distributions or on the redemption of Fund shares.
| 26 | MANAGEMENT OVERVIEW |
Table of Contents
ICON FINANCIAL FUND
SCHEDULEOF INVESTMENTS
SEPTEMBER 30, 2013
| Shares or Principal Amount | Value | |||||||
| Common Stocks (78.3%) | ||||||||
| 500 | Affiliated Managers Group, Inc.† | $ | 91,320 | |||||
| 4,900 | Allstate Corp. | 247,695 | ||||||
| 3,700 | Aon PLC | 275,428 | ||||||
| 7,900 | Brown & Brown, Inc. | 253,590 | ||||||
| 1,200 | Credicorp, Ltd. | 154,152 | ||||||
| 6,200 | Discover Financial Services | 313,348 | ||||||
| 4,800 | DST Systems, Inc. | 361,968 | ||||||
| 6,900 | Eaton Vance Corp. | 267,927 | ||||||
| 3,000 | Encore Capital Group, Inc.† | 137,580 | ||||||
| 4,500 | EPR Properties, REIT | 219,330 | ||||||
| 1,400 | Everest Re Group, Ltd. | 203,574 | ||||||
| 6,700 | First Cash Financial Services, Inc.† | 388,265 | ||||||
| 3,600 | Franklin Resources, Inc. | 181,980 | ||||||
| 7,400 | HCP, Inc., REIT | 303,030 | ||||||
| 10,100 | Invesco, Ltd. | 322,190 | ||||||
| 4,700 | Jones Lang LaSalle, Inc. | 410,310 | ||||||
| 23,300 | JPMorgan Chase & Co. | 1,204,377 | ||||||
| 5,700 | Moody’s Corp. | 400,881 | ||||||
| 4,300 | Northern Trust Corp. | 233,877 | ||||||
| 7,800 | Omega Healthcare Investors, Inc., REIT | 232,986 | ||||||
| Shares or Principal Amount | Value | |||||||
| 2,500 | Portfolio Recovery Associates, Inc.† | $ | 149,850 | |||||
| 3,100 | RenaissanceRe Holdings, Ltd. | 280,643 | ||||||
| 5,300 | SEI Investments Co. | 163,823 | ||||||
| 2,800 | State Street Corp. | 184,100 | ||||||
| 3,000 | T Rowe Price Group, Inc. | 215,790 | ||||||
| 3,600 | Travelers Cos., Inc. | 305,172 | ||||||
| 3,200 | U.S. Bancorp | 117,056 | ||||||
| 4,800 | Ventas, Inc., REIT | 295,200 | ||||||
| 2,100 | Visa, Inc., Class A | 401,310 | ||||||
| 3,100 | Waddell & Reed Financial, Inc., Class A | 159,588 | ||||||
| 25,700 | Wells Fargo & Co. | 1,061,924 | ||||||
| 4,700 | World Acceptance Corp.† | 422,624 | ||||||
| 6,800 | WR Berkley Corp. | 291,448 | ||||||
|
| |||||||
| | Total Common Stocks (Cost $9,224,450) | 10,252,336 | ||||||
| Short-Term Investments (20.2%) | ||||||||
| $ | 2,643,108 | State Street Euro Dollar Time Deposit (USD), 0.01%, 10/01/13 | 2,643,108 | |||||
|
| |||||||
| | Total Short-Term Investments (Cost $2,643,108) | 2,643,108 | ||||||
| | Total Investments 98.5% (Cost $11,867,558) | 12,895,444 | ||||||
| | Other Assets Less Liabilities 1.5% | 190,134 | ||||||
|
| |||||||
| Net Assets 100.0% | $ | 13,085,578 | ||||||
|
| |||||||
The accompanying notes are an integral part of the financial statements.
| † | Non-income producing security. |
| REIT | Real Estate Investment Trust |
| SCHEDULEOF INVESTMENTS | 27 |
Table of Contents
MANAGEMENT OVERVIEW (UNAUDITED) | Class S Class C Class A | ICHCX ICHEX ICHAX |
| Q. | How did the Fund perform relative to its benchmarks? |
| A. | The ICON Healthcare Fund Class S returned 27.48% for the fiscal year ended September 30, 2013, while the Fund’s sector-specific benchmark, the S&P 1500 Health Care Index, returned 28.91%, and its broad benchmark, the S&P Composite 1500 Index, returned 20.43%. Total returns for other periods and additional Class shares as of September 30, 2013 appear in the subsequent pages of this Fund’s Management Overview. |
| Q. | What primary factors were behind the Fund’s relative performance? |
| A. | The broad market performed well over the past year, and the Health Care sector was a notable standout. Despite many of the lingering concerns about worldwide growth and the pace of recovery from the 2008-2009 recession, the U.S. economy has remained fairly resilient, providing a boost to the local equity markets. As the recovery has followed a relatively slow pace, monetary policy has remained very accommodative as the U.S. Federal Reserve has kept its quantitative easing policies in place. Many of the sector specific factors still revolve around the rollout of the much publicized Affordable Care Act and its ultimate implications on the Health Care industries and companies. For most of the year, many of these concerns appeared to be immaterial or already priced-in by investors as stocks in this sector continued to grow their earnings and their returns outpaced the gains in the broad U.S. benchmarks. The latter half of the period brought gains, albeit not without periods of volatility. Concerns about the U.S. Federal Reserve tapering its asset purchase program, the effects of rising interest rates, as well as political volatility surrounding the funding and implementation of the Affordable Care Act all contributed to the oscillations in the equity markets. Additionally, declining value in the sector and equity market as a whole by year end, further added to worries about the investment climate. |
| Q. | How did the Fund’s composition affect performance? |
| A. | Pharmaceuticals was the greatest industry contributor to this Fund over the period. The industry as a whole actually lagged the Health Care benchmark, and this Fund was appropriately underweight. This Fund was able to outperform the industry with strong stock selection over the period. Companies like Actavis, Inc., Pfizer, Inc., and Questcor Pharmaceuticals, Inc. were strong contributors to relative performance. |
| 28 | MANAGEMENT OVERVIEW |
Table of Contents
| The biotechnology industry was another positive contributor, as the industry showed the best value coming into the year and was ultimately the top performer of the ten industries within the Health Care sector. This Fund was overweight this sector by approximately 12% over the period, with names like Biogen Idec, Inc., Gilead Sciences, Inc., and Amgen, Inc. providing positive returns. |
Health care technology was this Fund’s largest industry detractor to relative performance as overweight positions in names like HMS Holdings Corp. and Computer Programs & Systems, Inc. underperformed the benchmark. The managed health care industry was a positive returning group, yet this Fund held an underweight position for the period which also detracted from relative performance. Additionally, as the sector posted returns into the summer months, our value metrics indicated over-priced conditions for the Health Care stocks as whole, and cash was raised. During that period, the sector returns oscillated, yet ultimately grinded higher in the final quarter; this cash position ending up slightly hurting performance yet was prudent given our primary focus on value.
| Q. | What is your investment outlook for the Health Care sector? |
| A. | After this period’s positive returns, the ICON valuation methodology indicates that equities are now approximately fairly priced to slightly overvalued. Our calculations indicate that Health Care is one of the lower value sectors in the market with a V/P reading of 0.98; or in other words, we see fair value 2% lower on average than where Health Care stocks are currently trading. These over-priced conditions have been the case for most of the last quarter and this Fund’s cash position has been increased with the expectation for better bargains in the future. However, not all areas of the sector are over-priced and we continue to favor and appropriately overweight industries like biotechnology and pharmaceuticals which still show further upside. As always, we look to value as our primary guide and will adjust our positioning as market conditions dictate. |
| MANAGEMENT OVERVIEW | 29 |
Table of Contents
ICON Healthcare Fund
Sector Composition
September 30, 2013
Health Care | 95.4% | |||
|
| |||
| 95.4% | ||||
|
|
Percentages are based upon common stocks as a percentage of net assets.
ICON Healthcare Fund
Industry Composition
September 30, 2013
Pharmaceuticals | 48.7% | |||
Biotechnology | 23.6% | |||
Health Care Equipment | 9.8% | |||
Health Care Services | 5.5% | |||
Health Care Distributors | 4.3% | |||
Managed Health Care | 1.5% | |||
Health Care Supplies | 1.0% | |||
Life Sciences Tools & Services | 1.0% | |||
|
| |||
| 95.4% | ||||
|
|
Percentages are based upon common stocks as a percentage of net assets.
| 30 | MANAGEMENT OVERVIEW |
Table of Contents
ICON Healthcare Fund Average Annual Total Return
as of September 30, 2013
| Inception Date | 1 Year | 5 Years | 10 Years | Since Inception | Gross Expense Ratio* | Net Expense Ratio* | ||||||||||||||||||||||
ICON Healthcare Fund - Class S | 2/24/97 | 27.48% | 11.29% | 8.56% | 9.82% | 1.34% | 1.34% | |||||||||||||||||||||
ICON Healthcare Fund - Class C | 9/30/10 | 26.11% | N/A | N/A | 19.83% | 11.81% | 2.51% | |||||||||||||||||||||
ICON Healthcare Fund - Class A | 9/30/10 | 26.95% | N/A | N/A | 20.69% | 2.89% | 1.76% | |||||||||||||||||||||
ICON Healthcare Fund - Class A (including maximum sales charge of 5.75%) | 9/30/10 | 19.67% | N/A | N/A | 18.33% | 2.89% | 1.76% | |||||||||||||||||||||
S&P 1500 Health Care Index | 28.91% | 13.45% | 8.72% | 8.47% | N/A | N/A | ||||||||||||||||||||||
S&P Composite 1500 Index | 20.43% | 10.35% | 7.97% | 6.88% | N/A | N/A | ||||||||||||||||||||||
Past performance is not a guarantee of future results. Information about these performance results and the comparative indexes can be found in the About This Report section. The Adviser has agreed to limit certain Fund expenses; without these limitations, returns would have been lower. The limitation provisions may be terminated in the future.
| * | Please see the most recent prospectus for details. |
Class C total returns exclude applicable sales charges. If sales charges were included returns would be lower.
| MANAGEMENT OVERVIEW | 31 |
Table of Contents
ICON Healthcare Fund
Value of a $10,000 Investment
through September 30, 2013
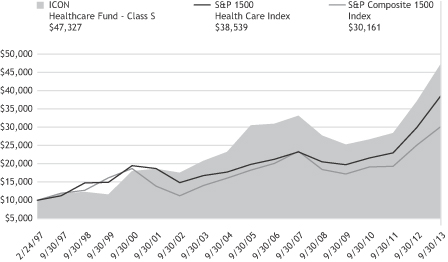
Past performance is not a guarantee of future results. The above graph compares a $10,000 investment made in the Fund’s Class S shares on the Class’ inception date of 2/24/97 to a $10,000 investment made in unmanaged securities indexes on that date. The Fund’s performance in this chart and the performance table assumes the reinvestment of dividends and capital gain distributions but does not reflect the deduction of taxes that a shareholder would pay on Fund distributions or on the redemption of Fund shares.
| 32 | MANAGEMENT OVERVIEW |
Table of Contents
ICON HEALTHCARE FUND
SCHEDULEOF INVESTMENTS
SEPTEMBER 30, 2013
| Shares or Principal Amount | Value | |||||||
| Common Stocks (95.4%) | ||||||||
| 97,700 | Abbott Laboratories | $ | 3,242,663 | |||||
| 84,000 | AbbVie, Inc. | 3,757,320 | ||||||
| 50,975 | Actavis, Inc.† | 7,340,400 | ||||||
| 44,085 | Alexion Pharmaceuticals, Inc.† | 5,120,914 | ||||||
| 8,600 | Allergan, Inc. | 777,870 | ||||||
| 25,690 | Amgen, Inc. | 2,875,739 | ||||||
| 20,000 | Baxter International, Inc. | 1,313,800 | ||||||
| 15,500 | Bayer AG, ADR | 1,828,070 | ||||||
| 25,100 | Biogen Idec, Inc.† | 6,043,076 | ||||||
| 18,800 | CIGNA Corp. | 1,444,968 | ||||||
| 19,000 | Cyberonics, Inc.† | 964,060 | ||||||
| 53,200 | DaVita HealthCare Partners, Inc.† | 3,027,080 | ||||||
| 90,382 | Gilead Sciences, Inc.† | 5,679,605 | ||||||
| 24,000 | Haemonetics Corp.† | 957,120 | ||||||
| 155,600 | Johnson & Johnson | 13,488,964 | ||||||
| 32,435 | McKesson Corp. | 4,161,410 | ||||||
| 87,000 | Medicines Co.† | 2,916,240 | ||||||
| 27,000 | Medtronic, Inc. | 1,437,750 | ||||||
| 22,600 | Novo Nordisk AS, ADR | 3,824,372 | ||||||
| 369,300 | PDL BioPharma, Inc.(a) | 2,943,321 | ||||||
| 26,000 | PerkinElmer, Inc. | 981,500 | ||||||
| Shares or Principal Amount | Value | |||||||
| 39,400 | Perrigo Co. | $ | 4,861,172 | |||||
| 151,000 | Pfizer, Inc. | 4,335,210 | ||||||
| 34,000 | Questcor Pharmaceuticals, Inc. | 1,972,000 | ||||||
| 35,000 | Sanofi, ADR | 1,772,050 | ||||||
| 36,000 | Sirona Dental Systems, Inc.† | 2,409,480 | ||||||
| 59,000 | Team Health Holdings, Inc.† | 2,238,460 | ||||||
|
| |||||||
| | Total Common Stocks (Cost $77,552,284) | 91,714,614 | ||||||
| Collateral for Securities on Loan (3.1%) | ||||||||
| 2,982,098 | State Street Navigator Prime Portfolio, 0.17% | 2,982,098 | ||||||
|
| |||||||
| | Total Collateral for Securities on Loan (Cost $2,982,098) | 2,982,098 | ||||||
| Short-Term Investments (6.8%) | ||||||||
| $ | 6,535,856 | State Street Euro Dollar Time Deposit (USD), 0.01%, 10/01/13 | 6,535,856 | |||||
|
| |||||||
| | Total Short-Term Investments (Cost $6,535,856) | 6,535,856 | ||||||
| | Total Investments 105.3% (Cost $87,070,238) | 101,232,568 | ||||||
| | Liabilities Less Other Assets (5.3)% | (5,054,850 | ) | |||||
|
| |||||||
| Net Assets 100.0% | $ | 96,177,718 | ||||||
|
| |||||||
The accompanying notes are an integral part of the financial statements.
| † | Non-income producing security. |
| (a) | All or a portion of the security was on loan as of September 30, 2013. |
| ADR | American Depositary Receipt |
| SCHEDULEOF INVESTMENTS | 33 |
Table of Contents
MANAGEMENT OVERVIEW (UNAUDITED) | Class S Class C | ICTRX ICICX ICIAX |
| Q. | How did the Fund perform relative to its benchmarks? |
| A. | The ICON Industrials Fund Class S returned 29.52% for the fiscal year ended September 30, 2013, while its sector-specific benchmark, the S&P 1500 Industrials Index, returned 30.73% and the S&P Composite 1500 Index gained 20.43%. Total returns for other periods and additional Class shares as of September 30, 2013 appear in the subsequent pages of this Fund’s Management Overview. |
| Q. | What primary factors were behind the Fund’s relative performance? |
| A. | Fiscal year 2013 was another solid year for equity investors as the combination of accommodative monetary policies coupled with improving domestic economic conditions produced a good environment for equity securities. The Industrials sector benefited during the period due, in part, to strong earnings growth. |
From a valuation standpoint, we began fiscal year 2013 with a V/P in the Industrials sector of 1.43, indicating we had high confidence that future returns would be strong. However, fiscal year 2013 saw the emergence of new and unique industry leadership within the Industrials sector. Over the past few years, the majority of gains within the Industrials sector came from industries and companies that derive a large portion of their revenues from emerging market growth and continued expansion within the mining industry. These industries include construction & farm machinery & heavy trucks and industrial machinery. Fiscal year 2013 saw a shift in the previous trend as industries more heavily tied to domestic economic growth like human resources & employment services, airlines, and commercial printing, led the way. Our system failed to capture a shift in leadership, thus missing opportunities in some of the best performing industries.
| Q. | How did the Fund’s composition affect performance? |
| A. | Industry returns in the S&P 1500 Industrials Index show how volatile this past fiscal year has been as the best performing industry, human resource & employment services, outperformed the worst performing industry, heavy electrical equipment, by almost 63%. This divergence highlights how correct industry allocation could be beneficial over the course of the fiscal year. |
| 34 | MANAGEMENT OVERVIEW |
Table of Contents
The top industry contributors to performance during fiscal year 2013 were; aerospace & defense, industrial machinery, trading companies & distributors, and construction & engineering.
Due to positive returns from all industries within the Industrials sector there were no industry based performance detractors on an absolute basis during fiscal year 2013. However, from a total effect standpoint, industries that hurt the fund relative to the benchmark include; railroads, electrical components & equipment, and construction & farm machinery & heavy trucks.
| Q. | What is your investment outlook for the Industrials sector? |
| A. | At the close of the fiscal year, the Industrials sector had a V/P of 1.11 indicating that we still see upside possibility in this sector. From an industry standpoint, areas tied to domestic economic growth continue to show the most attractive forward looking earnings growth estimates and valuations. Regardless of whether value rises or falls under our methodology, we believe our focus on bottom up, valuation based industry rotation will allow us to navigate the market environment ahead. |
ICON Industrials Fund
Sector Composition
September 30, 2013
Industrials | 91.3% | |||
|
| |||
| 91.3% | ||||
|
|
Percentages are based upon common stocks as a percentage of net assets.
ICON Industrials Fund
Industry Composition
September 30, 2013
Aerospace & Defense | 19.7 | % | ||
Railroads | 13.1 | % | ||
Trading Companies & Distributors | 10.8 | % | ||
Construction & Engineering | 9.6 | % | ||
Industrial Machinery | 9.4 | % | ||
Industrial Conglomerates | 7.5 | % | ||
Electrical Components & Equipment | 6.1 | % | ||
Airlines | 3.7 | % | ||
Diversified Support Services | 3.3 | % | ||
Security & Alarm Services | 3.2 | % | ||
Construction & Farm Machinery & Heavy Trucks | 3.1 | % | ||
Trucking | 1.8 | % | ||
|
| |||
| 91.3 | % | |||
|
|
Percentages are based upon common stocks as a percentage of net assets.
| MANAGEMENT OVERVIEW | 35 |
Table of Contents
ICON Industrials Fund
Average Annual Total Return
as of September 30, 2013
| Inception Date | 1 Year | 5 Years | 10 Years | Since Inception | Gross Expense Ratio* | Net Expense Ratio* | ||||||||||||||||||||||
ICON Industrials Fund - Class S | 5/9/97 | 29.52% | 6.57% | 7.95% | 5.09% | 1.40% | 1.40% | |||||||||||||||||||||
ICON Industrials Fund - Class C | 9/30/10 | 28.20% | N/A | N/A | 12.23% | 13.40% | 2.51% | |||||||||||||||||||||
ICON Industrials Fund - Class A | 9/30/10 | 29.20% | N/A | N/A | 12.62% | 2.50% | 1.75% | |||||||||||||||||||||
ICON Industrials Fund - Class A (including maximum sales charge of 5.75%) | 9/30/10 | 21.83% | N/A | N/A | 10.40% | 2.50% | 1.75% | |||||||||||||||||||||
S&P 1500 Industrials Index | 30.73% | 11.19% | 9.45% | 7.46% | N/A | N/A | ||||||||||||||||||||||
S&P Composite 1500 Index | 20.43% | 10.35% | 7.97% | 6.84% | N/A | N/A | ||||||||||||||||||||||
Past performance is not a guarantee of future results. Information about these performance results and the comparative indexes can be found in the About This Report section. The Adviser has agreed to limit certain Fund expenses; without these limitations, returns would have been lower. The limitation provisions may be terminated in the future.
| * | Please see the most recent prospectus for details. |
Class C total returns exclude applicable sales charges. If sales charges were included returns would be lower.
| 36 | MANAGEMENT OVERVIEW |
Table of Contents
ICON Industrials Fund
Value of a $10,000 Investment
through September 30, 2013
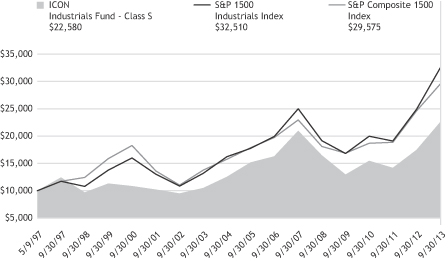
Past performance is not a guarantee of future results. The above graph compares a $10,000 investment made in the Fund’s Class S shares on the Class’ inception date of 5/9/97 to a $10,000 investment made in unmanaged securities indexes on that date. The Fund’s performance in this chart and the performance table assumes the reinvestment of dividends and capital gain distributions but does not reflect the deduction of taxes that a shareholder would pay on Fund distributions or on the redemption of Fund shares.
| MANAGEMENT OVERVIEW | 37 |
Table of Contents
ICON INDUSTRIALS FUND
SCHEDULEOF INVESTMENTS
SEPTEMBER 30, 2013
| Shares or Principal Amount | Value | |||||||
| Common Stocks (91.3%) | ||||||||
| 3,000 | 3M Co. | $ | 358,230 | |||||
| 10,000 | Alaska Air Group, Inc. | 626,200 | ||||||
| 5,000 | Boeing Co. | 587,500 | ||||||
| 3,000 | Canadian National Railway Co. | 304,110 | ||||||
| 10,000 | Caterpillar, Inc. | 833,700 | ||||||
| 5,000 | Crane Co. | 308,350 | ||||||
| 20,000 | CSX Corp. | 514,800 | ||||||
| 11,000 | Danaher Corp. | 762,520 | ||||||
| 5,000 | Deere & Co. | 406,950 | ||||||
| 35,000 | Delta Air Lines, Inc. | 825,650 | ||||||
| 15,000 | Dover Corp. | 1,347,450 | ||||||
| 10,000 | Eaton Corp. PLC | 688,400 | ||||||
| 10,000 | Fastenal Co. | 502,500 | ||||||
| 15,000 | Flowserve Corp. | 935,850 | ||||||
| 25,000 | Fluor Corp. | 1,774,000 | ||||||
| 15,000 | General Cable Corp. | 476,250 | ||||||
| 15,000 | General Dynamics Corp. | 1,312,800 | ||||||
| 75,000 | General Electric Co. | 1,791,750 | ||||||
| 15,000 | Genesee & Wyoming, Inc., Class A† | 1,394,550 | ||||||
| 50,000 | Healthcare Services Group, Inc. | 1,288,000 | ||||||
| 5,000 | Honeywell International, Inc. | 415,200 | ||||||
| 5,000 | Hubbell, Inc., Class B | 523,700 | ||||||
| 10,000 | IDEX Corp. | 652,500 | ||||||
| 6,400 | Jacobs Engineering Group, Inc.† | 372,352 | ||||||
| 5,000 | Landstar System, Inc. | 279,900 | ||||||
| Shares or Principal Amount | Value | |||||||
| 15,000 | MSC Industrial Direct Co., Class A | $ | 1,220,250 | |||||
| 11,000 | Norfolk Southern Corp. | 850,850 | ||||||
| 5,000 | Pall Corp. | 385,200 | ||||||
| 5,000 | Precision Castparts Corp. | 1,136,200 | ||||||
| 10,000 | Quanta Services, Inc.† | 275,100 | ||||||
| 8,000 | Raytheon Co. | 616,560 | ||||||
| 10,000 | Regal-Beloit Corp. | 679,300 | ||||||
| 7,000 | Ryder System, Inc. | 417,900 | ||||||
| 35,000 | Tyco International, Ltd. | 1,224,300 | ||||||
| 13,000 | Union Pacific Corp. | 2,019,420 | ||||||
| 33,000 | United Technologies Corp. | 3,558,060 | ||||||
| 24,000 | URS Corp. | 1,290,000 | ||||||
| 5,000 | WESCO International, Inc.† | 382,650 | ||||||
| 8,000 | WW Grainger, Inc. | 2,093,680 | ||||||
|
| |||||||
| | Total Common Stocks (Cost $26,806,118) | 35,432,682 | ||||||
| Short-Term Investments (11.0%) | ||||||||
| $ | 4,295,608 | State Street Euro Dollar Time Deposit (USD), 0.01%, 10/01/13 | 4,295,608 | |||||
|
| |||||||
| | Total Short-Term Investments (Cost $4,295,608) | 4,295,608 | ||||||
| | Total Investments 102.3% (Cost $31,101,726) | 39,728,290 | ||||||
| | Liabilities Less Other Assets (2.3)% | (909,704 | ) | |||||
|
| |||||||
| Net Assets 100.0% | $ | 38,818,586 | ||||||
|
| |||||||
The accompanying notes are an integral part of the financial statements.
| † | Non-income producing security. |
| 38 | SCHEDULEOF INVESTMENTS |
Table of Contents
MANAGEMENT OVERVIEW (UNAUDITED) | Class S Class C Class A | ICTEX ICTFX ICTTX |
| Q. | How did the Fund perform relative to its benchmark? |
| A. | The ICON Information Technology Fund Class S returned 6.72% for the fiscal year ended September 30, 2013, underperforming its benchmark, the S&P 1500 Information Technology Index, which returned 8.75%. The broad index, the S&P 1500 Composite Index, gained 20.43% during the period. Total returns for other periods and additional Class shares as of September 30, 2013 appear in the subsequent pages of this Fund’s Management Overview. |
| Q. | What primary factors were behind the Fund’s relative performance? |
| A. | While the broad market experienced a strong year, thanks in large part to a continuation of accommodative monetary policy along with improvement in economic conditions domestically, the Information Technology sector lagged. Despite a slowly improving economy, concerns over the potential of a fiscal drag on the economy served as an impediment to the sector. Whether it be worries of going over the “fiscal cliff” early in the fiscal year, the implementation of sequestration in March, or the more recent prospect of the US government defaulting on its obligations; investors were concerned that events in Washington, D.C., may lead many firms to pare back technology related spending. |
Further, although consumer confidence rose sharply over the period, growth slowed amongst smart phones and other personal devices, a result of increased competition and saturation in developed markets. Question marks over economic growth in foreign markets like China and Europe also had an impact on investor sentiment in the sector.
Against this backdrop, we began the fiscal year with a V/P reading of 1.38 for the sector, a relatively high level of value. However, by the end of the period sector V/P had dropped to 1.04. While still indicating upside potential in the sector, value readings at both the sector and industry level prompted us to pare back overweight positions in certain heavier weighted industries, like IT consulting & other services, data processing & outsourced service and application software, and reallocate to other industries as value dictated.
| Q. | How did the Fund’s composition affect performance? |
| A. | The application software industry had the largest positive effect on relative value, with Mentor Graphics Corp. providing the largest |
| MANAGEMENT OVERVIEW | 39 |
Table of Contents
| positive effect of any holding in this Fund. Other bright spots within this industry included positions in Fair Isaac Corp. and Tyler Technologies, Inc. |
Computer storage & peripherals also had a large positive effect on relative returns, driven primarily by our position in Western Digital Corp.
With respect to the heaviest benchmark weight in the sector, this Fund’s underweighting of Apple, Inc. added positively to relative performance. Computer hardware lagged the most of any industry in the sector due primarily to Apple, which fell 27% during the period. Computer hardware companies like Apple were especially prone to investor concerns over diminishing growth prospects in the personal device space, mentioned earlier.
Data processing & outsourced services had the largest negative effect on fund performance relative to the benchmark. This Fund’s overweights Visa, Inc. Class A and MasterCard, Inc. Class A enjoyed another strong year, up 44% and 50% respectively during the period, and contributed positively to relative performance. Earnings for both companies consistently beat estimates, and investor concerns over regulatory risk continued to diminish. However, a position in VeriFone Systems, Inc. was the largest individual detractor to relative performance in this Fund. The stock dropped 43% in a day after the company drastically reduced its earnings guidance.
Systems software also hurt relative performance primarily due to our underweighting in low V/P Microsoft Corp.
| Q. | What is your investment outlook for the Information Technology Sector? |
| A. | At the close of fiscal year 2013, the Information Technology sector had a V/P reading of 1.04. At this time our largest overweight positions were in application software, IT consulting & other services and data processing & outsourcing. In spite of the sector’s modest V/P, we still see upside potential in the sector and remain positioned to take advantage of opportunities as they present themselves. At ICON, we look to value as our primary guide and will adjust our positioning as market conditions dictate. |
| 40 | MANAGEMENT OVERVIEW |
Table of Contents
ICON Information Technology Fund
Sector Composition
September 30, 2013
Information Technology | 89.6% | |||
|
| |||
| 89.6% | ||||
|
|
Percentages are based upon common stocks as a percentage of net assets.
ICON Information Technology Fund
Industry Composition
September 30, 2013
IT Consulting & Other Services | 16.4% | |||
Internet Software & Services | 14.8% | |||
Data Processing & Outsourced Services | 13.1% | |||
Application Software | 12.3% | |||
Computer Hardware | 12.2% | |||
Semiconductors | 5.3% | |||
Systems Software | 5.0% | |||
Technology Distributors | 3.2% | |||
Electronic Equipment & Instruments | 2.0% | |||
Electronic Manufacturing Services | 2.0% | |||
Computer Storage & Peripherals | 1.7% | |||
Communications Equipment | 1.0% | |||
Semiconductor Equipment | 0.6% | |||
|
| |||
| 89.6% | ||||
|
|
Percentages are based upon common stocks as a percentage of net assets.
| MANAGEMENT OVERVIEW | 41 |
Table of Contents
ICON Information Technology Fund
Average Annual Total Return
as of September 30, 2013
| Inception Date | 1 Year | 5 Years | 10 Years | Since Inception | Gross Expense Ratio* | Net Expense Ratio* | ||||||||||||||||||||||
ICON Information Technology Fund - Class S | 2/19/97 | 6.72% | 7.91% | 3.35% | 7.47% | 1.34% | 1.34% | |||||||||||||||||||||
ICON Information Technology Fund - Class C | 9/30/10 | 5.53% | N/A | N/A | 11.19% | 4.46% | 2.50% | |||||||||||||||||||||
ICON Information Technology Fund - Class A | 9/30/10 | 6.10% | N/A | N/A | 11.96% | 2.87% | 1.75% | |||||||||||||||||||||
ICON Information Technology Fund - Class A (including maximum sales charge of 5.75%) | 9/30/10 | 0.00% | N/A | N/A | 9.77% | 2.87% | 1.75% | |||||||||||||||||||||
S&P 1500 Information Technology Index | 8.75% | 12.21% | 7.29% | 6.32% | N/A | N/A | ||||||||||||||||||||||
NASDAQ Composite Index | 21.03% | 12.51% | 7.75% | 6.31% | N/A | N/A | ||||||||||||||||||||||
S&P Composite 1500 Index | 20.43% | 10.35% | 7.97% | 6.85% | N/A | N/A | ||||||||||||||||||||||
Past performance is not a guarantee of future results. Information about these performance results and the comparative indexes can be found in the About This Report section. The Adviser has agreed to limit certain Fund expenses; without these
limitations, returns would have been lower. The limitation provisions may be terminated in the future.
| * | Please see the most recent prospectus for details. |
Class C total returns exclude applicable sales charges. If sales charges were included returns would be lower.
| 42 | MANAGEMENT OVERVIEW |
Table of Contents
ICON Information Technology Fund
Value of a $10,000 Investment
through September 30, 2013
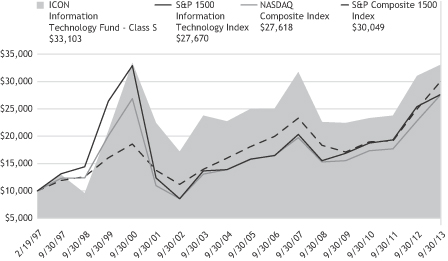
Past performance is not a guarantee of future results. The above graph compares a $10,000 investment made in the Fund’s Class S shares on the Class’ inception date of 2/19/97 to a $10,000 investment made in unmanaged securities indexes on that date. The Fund’s performance in this chart and the performance table assumes the reinvestment of dividends and capital gain distributions but does not reflect the deduction of taxes that a shareholder would pay on Fund distributions or on the redemption of Fund shares.
| MANAGEMENT OVERVIEW | 43 |
Table of Contents
ICON INFORMATION TECHNOLOGY FUND
SCHEDULEOF INVESTMENTS
SEPTEMBER 30, 2013
| Shares or Principal Amount | Value | |||||||
| Common Stocks (89.6%) | ||||||||
| 34,600 | Accenture PLC, Class A | $ | 2,547,944 | |||||
| 16,100 | ACI Worldwide, Inc.† | 870,366 | ||||||
| 20,000 | Amdocs, Ltd. | 732,800 | ||||||
| 19,600 | Apple, Inc. | 9,344,300 | ||||||
| 19,040 | Citrix Systems, Inc.† | 1,344,414 | ||||||
| 28,400 | Cognizant Technology Solutions Corp., Class A† | 2,332,208 | ||||||
| 12,100 | Coherent, Inc. | 743,545 | ||||||
| 55,100 | eBay, Inc.† | 3,074,029 | ||||||
| 30,225 | Fair Isaac Corp. | 1,670,838 | ||||||
| 17,900 | Fidelity National Information Services, Inc. | 831,276 | ||||||
| 13,000 | Gartner, Inc.† | 780,000 | ||||||
| 24,300 | Global Payments, Inc. | 1,241,244 | ||||||
| 6,625 | Google, Inc., Class A† | 5,802,904 | ||||||
| 21,200 | IAC/InterActiveCorp | 1,159,004 | ||||||
| 38,400 | Informatica Corp.† | 1,496,448 | ||||||
| 29,100 | International Business Machines Corp. | 5,388,738 | ||||||
| 24,300 | Intuit, Inc. | 1,611,333 | ||||||
| 3,380 | Mastercard, Inc., Class A | 2,273,996 | ||||||
| 18,000 | MAXIMUS, Inc. | 810,720 | ||||||
| Shares or Principal Amount | Value | |||||||
| 99,900 | Mentor Graphics Corp. | $ | 2,334,663 | |||||
| 29,500 | Microsoft Corp. | 982,645 | ||||||
| 11,900 | MTS Systems Corp. | 765,765 | ||||||
| 84,900 | Oracle Corp. | 2,816,133 | ||||||
| 71,000 | Perficient, Inc.† | 1,303,560 | ||||||
| 16,600 | Plantronics, Inc. | 764,430 | ||||||
| 70,277 | ScanSource, Inc.† | 2,431,584 | ||||||
| 85,100 | Semtech Corp.† | 2,552,149 | ||||||
| 62,000 | Skyworks Solutions, Inc.† | 1,540,080 | ||||||
| 36,300 | Total System Services, Inc. | 1,067,946 | ||||||
| 51,500 | Trimble Navigation Ltd.† | 1,530,065 | ||||||
| 15,000 | Ultratech, Inc.† | 454,500 | ||||||
| 24,045 | Visa, Inc., Class A | 4,595,000 | ||||||
| 21,100 | Western Digital Corp. | 1,337,740 | ||||||
|
| |||||||
| | Total Common Stocks (Cost $49,672,562) | 68,532,367 | ||||||
| Short-Term Investments (13.6%) | ||||||||
| $ | 10,415,437 | State Street Euro Dollar Time Deposit (USD), 0.01%, 10/01/13 | 10,415,437 | |||||
|
| |||||||
| | Total Short-Term Investments (Cost $10,415,437) | 10,415,437 | ||||||
| | Total Investments 103.2% (Cost $60,087,999) | 78,947,804 | ||||||
| | Liabilities Less Other Assets (3.2)% | (2,451,579 | ) | |||||
|
| |||||||
| Net Assets 100.0% | $ | 76,496,225 | ||||||
|
| |||||||
The accompanying notes are an integral part of the financial statements.
| † | Non-income producing security. |
| 44 | SCHEDULEOF INVESTMENTS |
Table of Contents
MANAGEMENT OVERVIEW (UNAUDITED) | Class S Class C Class A | ICBMX ICBCX ICBAX |
| Q. | How did the Fund perform relative to its benchmarks? |
| A. | The ICON Materials Fund Class S returned 22.73% for the fiscal year ended September 30, 2013, while its sector-specific benchmark, the S&P 1500 Materials Index, returned 18.02%, and the S&P Composite 1500 Index gained 20.43%. Total returns for other periods and additional Class shares as of September 30, 2013 appear in the subsequent pages of this Fund’s Management Overview. |
| Q. | What primary factors were behind the Fund’s relative performance? |
| A. | Fiscal year 2013 was another solid year for equity investors as the combination of accommodative monetary policies coupled with improving domestic economic conditions produced an environment favorable for equity securities. The Materials sector was no exception as investors bid up prices in this highly cyclical segment of the market to produce returns in excess of 18% for the sector as a whole. However, the S&P 1500 Materials Index returns were moderate compared to the other nine sector indices. Furthermore, a general slowdown in emerging market economies reduced global demand for basic materials related products and hurt the earnings growth of many domestic companies within the sector. |
From a valuation standpoint, we began fiscal year 2013 with a V/P in the Materials sector of 1.30, indicating we had high confidence that future returns would be strong. However, fiscal year 2013 saw the emergence of new and unique industry leadership within the Materials sector. Historically, Materials sector gains tended to coincide with gains in the commodity market and economic growth in emerging market economies. However, this year saw a significant leadership shift as industries tied to domestic based economic growth; such as paper products, steel, and chemical based areas, produced strong returns while mining and commodity based segments actually produced negative returns. We were able to capitalize on this leadership shift by utilizing our valuation methodology and the fund outperformed the S&P Materials 1500 Index for the fiscal year.
Many investors have shifted their focus towards the gold industry over the course of the last few years in anticipation of strong inflationary pressures due to global expansionary monetary policy. In spite of this, the gold industry was by far the worst performing industry within the S&P
| MANAGEMENT OVERVIEW | 45 |
Table of Contents
1500 Materials Index, falling by just over 48 percent. Our underweight position in this underperforming industry was another reason this Fund was able to outperform the benchmark.
| Q. | How did the Fund’s composition affect performance? |
| A. | Industry returns in the S&P 1500 Materials Index show how volatile this past fiscal year has been as the best performing industry, commodity chemicals, outperformed the worst performing industry, gold, by almost 97%. This divergence highlights how correct industry allocation could be helpful over the course of the fiscal year. |
The top industry contributors to performance during fiscal year 2013 were specialty chemicals, diversified chemicals, steel, paper products, and commodity chemicals.
The top industry detractors from performance during fiscal year 2013 were gold, diversified metals & mining, and precious metals & minerals. While both gold and diversified metals & mining detracted from absolute performance over the course of the fiscal year, this Fund had a strong underweight position relative to the benchmark in both industries resulting in positive total effect from an attribution standpoint.
| Q. | What is your investment outlook for the Materials sector? |
| A. | At the close of fiscal year 2013, the Materials sector had a V/P of 1.09 indicating that we still see upside possibility in this sector. At the industry level, both current valuations and forward looking growth estimates remain attractive in select chemical based equities. We remain cautious with mining and precious metals based industries as forward looking growth rates continue to show further weakness. Overall, in spite of macroeconomic headline noise, and regardless of whether value rises or falls under our system, we believe our bottom up, valuation based methodology will allow us to navigate the market environment ahead. |
| 46 | MANAGEMENT OVERVIEW |
Table of Contents
ICON Materials Fund
Sector Composition
September 30, 2013
Materials | 87.0% | |||
Industrials | 1.4% | |||
|
| |||
| 88.4% | ||||
|
|
Percentages are based upon common stocks as a percentage of net assets.
ICON Materials Fund
Industry Composition
September 30, 2013
Diversified Chemicals | 18.4% | |||
Commodity Chemicals | 15.1% | |||
Specialty Chemicals | 13.1% | |||
Steel | 11.5% | |||
Fertilizers & Agricultural Chemicals | 10.8% | |||
Metal & Glass Containers | 4.2% | |||
Industrial Gases | 3.4% | |||
Construction Materials | 3.2% | |||
Paper Products | 3.1% | |||
Diversified Metals & Mining | 2.9% | |||
Railroads | 1.4% | |||
Other Industries (each less than 1%) | 1.3% | |||
|
| |||
| 88.4% | ||||
|
|
Percentages are based upon common stocks as a percentage of net assets.
| MANAGEMENT OVERVIEW | 47 |
Table of Contents
ICON Materials Fund
Average Annual Total Return
as of September 30, 2013
| Inception Date | 1 Year | 5 Years | 10 Years | Since Inception | Gross Expense Ratio* | Net Expense Ratio* | ||||||||||||||||||||||
ICON Materials Fund - Class S | 5/5/97 | 22.73% | 7.66% | 12.81% | 4.91% | 1.39% | 1.39% | |||||||||||||||||||||
ICON Materials Fund - Class C | 9/30/10 | 21.43% | N/A | N/A | 10.10% | 4.29% | 2.51% | |||||||||||||||||||||
ICON Materials Fund - Class A | 9/30/10 | 22.24% | N/A | N/A | 10.87% | 2.12% | 1.76% | |||||||||||||||||||||
ICON Materials Fund - Class A (including maximum sales charge of 5.75%) | 9/30/10 | 15.17% | N/A | N/A | 8.72% | 2.12% | 1.76% | |||||||||||||||||||||
S&P 1500 Materials Index | 18.02% | 9.22% | 10.41% | 6.73% | N/A | N/A | ||||||||||||||||||||||
S&P Composite 1500 Index | 20.43% | 10.35% | 7.97% | 6.80% | N/A | N/A | ||||||||||||||||||||||
Past performance is not a guarantee of future results. Information about these performance results and the comparative indexes can be found in the About This Report section. The Adviser has agreed to limit certain Fund expenses; without these limitations, returns would have been lower. The limitation provisions may be terminated in the future.
| * | Please see the most recent prospectus for details. |
Class C total returns exclude applicable sales charges. If sales charges were included returns would be lower.
| 48 | MANAGEMENT OVERVIEW |
Table of Contents
ICON Materials Fund
Value of a $10,000 Investment
through September 30, 2013
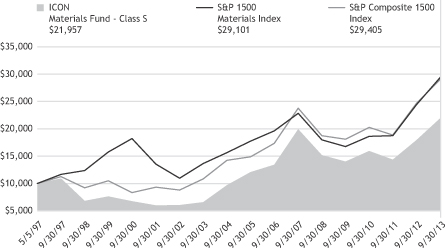
Past performance is not a guarantee of future results. The above graph compares a $10,000 investment made in the Fund’s Class S shares on the Class’ inception date of 5/5/97 to a $10,000 investment made in unmanaged securities indexes on that date. The Fund’s performance in this chart and the performance table assumes the reinvestment of dividends and capital gain distributions but does not reflect the deduction of taxes that a shareholder would pay on Fund distributions or on the redemption of Fund shares.
| MANAGEMENT OVERVIEW | 49 |
Table of Contents
ICON MATERIALS FUND
SCHEDULEOF INVESTMENTS
SEPTEMBER 30, 2013
| Shares or Principal Amount | Value | |||||||
| Common Stocks (88.4%) | ||||||||
| 10,000 | Airgas, Inc. | $ | 1,060,500 | |||||
| 5,000 | Albemarle Corp. | 314,700 | ||||||
| 20,000 | Aptargroup, Inc. | 1,202,600 | ||||||
| 7,000 | Ashland, Inc. | 647,360 | ||||||
| 15,000 | Bemis Co., Inc. | 585,150 | ||||||
| 10,000 | Cabot Corp. | 427,100 | ||||||
| 20,000 | Celanese Corp. | 1,055,800 | ||||||
| 2,500 | CF Industries Holdings, Inc. | 527,075 | ||||||
| 90,000 | Dow Chemical Co. | 3,456,000 | ||||||
| 65,000 | E.I. du Pont de Nemours & Co. | 3,806,400 | ||||||
| 30,000 | Eagle Materials, Inc. | 2,176,500 | ||||||
| 25,000 | Eastman Chemical Co. | 1,947,500 | ||||||
| 40,000 | Ecolab, Inc. | 3,950,400 | ||||||
| 40,000 | FMC Corp. | 2,868,800 | ||||||
| 60,000 | Freeport-McMoRan Copper & Gold, Inc. | 1,984,800 | ||||||
| 40,000 | HB Fuller Co. | 1,807,600 | ||||||
| 50,000 | KapStone Paper and Packaging Corp. | 2,140,000 | ||||||
| 55,000 | Koppers Holdings, Inc. | 2,345,750 | ||||||
| 70,000 | LyondellBasell Industries, Class A | 5,126,100 | ||||||
| 35,000 | Methanex Corp. | 1,794,450 | ||||||
| 65,000 | Monsanto Co. | 6,784,050 | ||||||
| Shares or Principal Amount | Value | |||||||
| 10,000 | Newmont Mining Corp. | $ | 281,000 | |||||
| 3,000 | Norfolk Southern Corp. | 232,050 | ||||||
| 80,000 | Nucor Corp. | 3,921,600 | ||||||
| 10,000 | Praxair, Inc. | 1,202,100 | ||||||
| 25,000 | Reliance Steel & Aluminum Co. | 1,831,750 | ||||||
| 5,000 | Sigma-Aldrich Corp. | 426,500 | ||||||
| 35,000 | Silgan Holdings, Inc. | 1,645,000 | ||||||
| 120,000 | Steel Dynamics, Inc. | 2,005,200 | ||||||
| 5,000 | Union Pacific Corp. | 776,700 | ||||||
| 10,000 | Valspar Corp. | 634,300 | ||||||
| 10,000 | Westlake Chemical Corp. | 1,046,600 | ||||||
|
| |||||||
| | Total Common Stocks (Cost $46,112,088) | 60,011,435 | ||||||
| Short-Term Investments (13.6%) | ||||||||
| $ | 9,242,982 | State Street Euro Dollar Time Deposit (USD), 0.01%, 10/01/13 | 9,242,982 | |||||
|
| |||||||
| | Total Short-Term Investments (Cost $9,242,982) | 9,242,982 | ||||||
| | Total Investments 102.0% (Cost $55,355,070) | 69,254,417 | ||||||
| | Liabilities Less Other Assets (2.0)% | (1,371,432 | ) | |||||
|
| |||||||
| Net Assets 100.0% | $ | 67,882,985 | ||||||
|
| |||||||
The accompanying notes are an integral part of the financial statements.
| 50 | SCHEDULEOF INVESTMENTS |
Table of Contents
MANAGEMENT OVERVIEW (UNAUDITED) | Class S Class C Class A | ICTUX ICTZX ICTVX |
| Q. | How did the Fund perform relative to its benchmark? |
| A. | The ICON Utilities Fund Class S returned 9.25% for the fiscal year ended September 30, 2013, while its sector-specific benchmark, the S&P 1500 Utilities Index, returned 8.73%, and the S&P Composite 1500 Index gained 20.43%. Total returns for other periods and additional Class shares as of September 30, 2013 appear in the subsequent pages of this Fund’s Management Overview. |
| Q. | What primary factors influenced the Fund’s relative performance during the period? |
| A. | The economic environment entering the fiscal period was one of sluggish growth, high unemployment and low inflation. The Federal Reserve maintained its quantitative easing program in an effort to keep interest rates low and support the fragile economy. Their loose monetary policy was particularly helpful to growth in the housing sector. The national average for a 30-year fixed mortgage began the period around the 3.4% level and never rose above 4.0% until May. Homebuyers took advantage of the historically low rates and demand for housing increased, spurring growth in sales and higher prices. The stock market also rose sharply as investors appeared to gain confidence in the domestic economy. |
The low interest rate environment created difficulty for investors looking to earn a safe, steady cash flow in their portfolios. With the 10-year Treasury note yielding about 1.6% at the beginning of the period, investors appeared willing to take some risk to obtain a higher yield. This benefited the Utilities sector. Viewed as a relatively safe sector in the stock market, Utilities stocks were yielding about 4.0% at the start of the fiscal year and rose to almost 4.4% by mid-November 2012. The relatively higher yields on these stocks, combined with their historically low betas, were likely the primary catalyst for the rise in this sector over the first seven months of the fiscal year. From the beginning of the fiscal year through April 2013, the S&P 1500 Utilities Index rose 16.95%, outpacing the S&P Composite 1500 Index which gained 12.83%.
By the end of April 2013, however, the sharp rise in the sector pushed its dividend yield lower. At the same time, the 10-year Treasury note yield turned higher. This reversal appeared to be the primary catalyst for a downturn in Utilities stocks. From the end of April 2013 to the end of the fiscal year, the 10-year Treasury rose from 1.67% to 2.61%. During this
| MANAGEMENT OVERVIEW | 51 |
Table of Contents
period, the S&P 1500 Utilities Index averaged approximately 4.0% dividend yield. This spread tightening between the 10-year Treasury and the yield on Utilities stocks appeared to be the primary cause for a price reversal in the sector; over the period, the S&P 1500 Utilities Index declined 7.01% while the S&P Composite 1500 Index rose 6.72%. From start (September 28, 2012) to finish (September 30, 2013), the sector gained 8.74%
| Q. | How did the Fund’s composition affect performance? |
| A. | This Fund was able to outperform the index as a result of tilting toward areas within the sector where our valuation model indicated upside potential. ICON’s valuation model is used to calculate the intrinsic value of a company. The value represents an estimate of what we believe the company is worth. We compare this value to the price the stock is trading in the market to get an indication of whether or not the stock is trading at a discount to our estimate of fair value. During this fiscal period, a few of the stocks that accounted for this Fund’s positive benchmark relative performance were: Exelon Corporation, FirstEnergy Corp., and Integrys Energy Group, Inc. Both Exelon and First Energy were stocks the model indicated were overvalued. As result, we did not hold them. Both were significant weights in the benchmark and significant underperformers. Integrys was a stock our model estimated did have value and, consistent with our investment process, it was a significant overweight position. Integrys rose more than the benchmark, resulting in positive relative performance. All three names were in the electric utilities industry which produced the highest benchmark relative performance of the five sector industries. |
A few stocks that hurt benchmark relative performance were Dominion Resources, Inc., NiSource, Inc., and SCANA Corporation. Because our model indicated that both Dominion Resources and NiSource Inc. were overvalued, we underweighted both. Both Dominion Resources and NiSource, Inc. rose more than the benchmark, detracting from this Fund’s relative performance. SCANA Corporation was a significant overweight position as our estimate of value indicated it was a bargain. The stock did not realize the value we believed was there, underperforming the sector index and detracting from benchmark relative performance. These three names were in the multi-utilities industry which was the largest detractor to benchmark relative performance.
| 52 | MANAGEMENT OVERVIEW |
Table of Contents
| Q. | What is your investment outlook for the Utilities sector? |
| A. | Entering the new fiscal period, the Utilities sector is trading at a discount to our model’s measure of fair value. The upside potential that exists is not as high as we saw at the start of the fiscal year, but we remain bullish on the sector and continue to look for attractive opportunities. |
ICON Utilities Fund
Sector Composition
September 30, 2013
Utilities | 87.1% | |||
Telecommunication | 12.1% | |||
|
| |||
| 99.2% | ||||
|
|
Percentages are based upon common stocks as a percentage of net assets.
ICON Utilities Fund
Industry Composition
September 30, 2013
Electric Utilities | 37.9% | |||
Multi-Utilities | 32.7% | |||
Gas Utilities | 16.0% | |||
Water Utilities | 7.0% | |||
Integrated Telecommunication Services | 4.1% | |||
Independent Power Producers & Energy Traders | 1.5% | |||
|
| |||
| 99.2% | ||||
|
|
Percentages are based upon common stocks as a percentage of net assets.
| MANAGEMENT OVERVIEW | 53 |
Table of Contents
ICON Utilities Fund
Average Annual Total Return
as of September 30, 2013
| Inception Date | 1 Year | 5 Years | 10 Years | Since Inception | Gross Expense Ratio* | Net Expense Ratio* | ||||||||||||||||||||||
ICON Utilities Fund - Class S | 7/9/97 | 9.25% | 7.26% | 8.71% | 7.66% | 1.53% | 1.51% | |||||||||||||||||||||
ICON Utilities Fund - Class C | 9/30/10 | 8.16% | N/A | N/A | 9.13% | 2.47% | 2.47% | |||||||||||||||||||||
ICON Utilities Fund - Class A | 9/30/10 | 8.96% | N/A | N/A | 9.76% | 1.70% | 1.70% | |||||||||||||||||||||
ICON Utilities Fund - Class A (including maximum sales charge of 5.75%) | 9/30/10 | 2.71% | N/A | N/A | 7.59% | 1.70% | 1.70% | |||||||||||||||||||||
S&P 1500 Utilities Index | 8.73% | 8.02% | 10.08% | 7.43% | N/A | N/A | ||||||||||||||||||||||
S&P Composite 1500 Index | 20.43% | 10.35% | 7.97% | 6.26% | N/A | N/A | ||||||||||||||||||||||
Past performance is not a guarantee of future results. Information about these performance results and the comparative indexes can be found in the About This Report section. The Adviser has agreed to limit certain Fund expenses; without these limitations, returns would have been lower. The limitation provisions may be terminated in the future.
| * | Please see the most recent prospectus for details. |
Class C total returns exclude applicable sales charges. If sales charges were included returns would be lower.
| 54 | MANAGEMENT OVERVIEW |
Table of Contents
ICON Utilities Fund
Value of a $10,000 Investment
through September 30, 2013
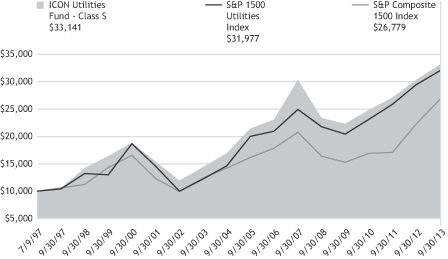
Past performance is not a guarantee of future results. The above graph compares a $10,000 investment made in the Fund’s Class S shares on the Class’ inception date of 7/9/97 to a $10,000 investment made in unmanaged securities indexes on that date. The Fund’s performance in this chart and the performance table assumes the reinvestment of dividends and capital gain distributions but does not reflect the deduction of taxes that a shareholder would pay on Fund distributions or on the redemption of Fund shares.
| MANAGEMENT OVERVIEW | 55 |
Table of Contents
ICON UTILITIES FUND
SCHEDULEOF INVESTMENTS
SEPTEMBER 30, 2013
| Shares or Principal Amount | Value | |||||||
| Common Stocks (99.2%) | ||||||||
| 37,800 | AES Corp. | $ | 502,362 | |||||
| 25,300 | American Water Works Co., Inc. | 1,044,384 | ||||||
| 56,125 | Aqua America, Inc. | 1,387,971 | ||||||
| 29,300 | Atmos Energy Corp. | 1,247,887 | ||||||
| 61,600 | Avista Corp. | 1,626,240 | ||||||
| 33,200 | BCE, Inc. | 1,417,640 | ||||||
| 15,300 | Cleco Corp. | 686,052 | ||||||
| 22,200 | CMS Energy Corp. | 584,304 | ||||||
| 13,100 | Duke Energy Corp. | 874,818 | ||||||
| 31,200 | Laclede Group, Inc. | 1,404,000 | ||||||
| 11,800 | NextEra Energy, Inc. | 945,888 | ||||||
| 17,500 | ONEOK, Inc. | 933,100 | ||||||
| 34,400 | PG&E Corp. | 1,407,648 | ||||||
| 36,200 | Piedmont Natural Gas Co., Inc. | 1,190,256 | ||||||
| 24,700 | Pinnacle West Capital Corp. | 1,352,078 | ||||||
| 49,900 | SCANA Corp. | 2,297,396 | ||||||
| Shares or Principal Amount | Value | |||||||
| 12,500 | South Jersey Industries, Inc. | $ | 732,250 | |||||
| 82,500 | Southern Co. | 3,397,350 | ||||||
| 68,400 | UIL Holdings Corp. | 2,543,112 | ||||||
| 104,300 | Westar Energy, Inc. | 3,196,795 | ||||||
| 55,300 | Wisconsin Energy Corp. | 2,233,014 | ||||||
| 111,400 | Xcel Energy, Inc. | 3,075,754 | ||||||
|
| |||||||
| | Total Common Stocks (Cost $34,115,671) | 34,080,299 | ||||||
| Short-Term Investments (0.3%) | ||||||||
| $ | 101,999 | State Street Euro Dollar Time Deposit (USD), 0.01%, 10/01/13 | 101,999 | |||||
|
| |||||||
| | Total Short-Term Investments (Cost $101,999) | 101,999 | ||||||
| | Total Investments 99.5% (Cost $34,217,670) | 34,182,298 | ||||||
| | Other Assets Less Liabilities 0.5% | 170,774 | ||||||
|
| |||||||
| Net Assets 100.0% | $ | 34,353,072 | ||||||
|
| |||||||
The accompanying notes are an integral part of the financial statements.
| 56 | SCHEDULEOF INVESTMENTS |
Table of Contents
(This page is intentionally left blank)
Table of Contents
STATEMENTSOF ASSETSAND LIABILITIES
SEPTEMBER 30, 2013
| ICON Consumer Discretionary Fund | ICON Consumer Staples Fund | ICON Energy Fund | ||||||||||
Assets | ||||||||||||
Investments, at cost | $ | 40,940,042 | $ | 36,055,432 | $ | 598,891,117 | ||||||
|
|
|
|
|
| |||||||
Investments, at value† | 46,281,446 | 38,216,592 | 705,588,920 | |||||||||
Receivables: | ||||||||||||
Fund shares sold | 56,901 | 5,215 | 1,230,975 | |||||||||
Investments sold | 546,680 | - | - | |||||||||
Dividends | 39,804 | 154,788 | 236,330 | |||||||||
Expense reimbursements due from Adviser | 74 | 1,933 | - | |||||||||
Foreign tax reclaims | - | - | 29,517 | |||||||||
Other assets | 14,621 | 11,070 | 87,590 | |||||||||
|
|
|
|
|
| |||||||
Total Assets | 46,939,526 | 38,389,598 | 707,173,332 | |||||||||
|
|
|
|
|
| |||||||
Liabilities | ||||||||||||
Payables: | ||||||||||||
Expense recoupment due to Adviser | 107 | 95 | - | |||||||||
Payable for collateral received on securities loaned | 1,691,451 | - | 5,032,720 | |||||||||
Fund shares redeemed | 98,739 | 11,630 | 765,154 | |||||||||
Distributions due to shareholders | - | 6,968 | - | |||||||||
Advisory fees | 43,785 | 32,260 | 564,414 | |||||||||
Accrued distribution fees | 1,372 | 2,002 | 16,952 | |||||||||
Fund accounting fees | 1,384 | 980 | 16,856 | |||||||||
Transfer agent fees | 15,575 | 11,670 | 207,106 | |||||||||
Administration fees | 2,189 | 1,613 | 28,625 | |||||||||
Trustee fees | 1,990 | 1,297 | 20,114 | |||||||||
Accrued expenses | 27,868 | 25,947 | 80,474 | |||||||||
|
|
|
|
|
| |||||||
Total Liabilities | 1,884,460 | 94,462 | 6,732,415 | |||||||||
|
|
|
|
|
| |||||||
Net Assets - all share classes | $ | 45,055,066 | $ | 38,295,136 | $ | 700,440,917 | ||||||
|
|
|
|
|
| |||||||
Net Assets - Class S | $ | 39,883,286 | $ | 33,813,347 | $ | 659,580,749 | ||||||
|
|
|
|
|
| |||||||
Net Assets - Class C | $ | 472,973 | $ | 1,738,254 | $ | 14,690,633 | ||||||
|
|
|
|
|
| |||||||
Net Assets - Class A | $ | 4,698,807 | $ | 2,743,535 | $ | 26,169,535 | ||||||
|
|
|
|
|
| |||||||
| 58 | FINANCIAL STATEMENTS |
Table of Contents
| ICON Consumer Discretionary Fund | ICON Consumer Staples Fund | ICON Energy Fund | ||||||||||
Net Assets Consist of | ||||||||||||
Paid-in capital | $ | 40,592,023 | $ | 33,235,105 | $ | 581,583,058 | ||||||
Accumulated undistributed net investment income/(loss) | (144,779 | ) | 327 | 1,301,971 | ||||||||
Accumulated undistributed net realized gain/(loss) | (733,582 | ) | 2,898,544 | 10,858,085 | ||||||||
Unrealized appreciation/(depreciation) | 5,341,404 | 2,161,160 | 106,697,803 | |||||||||
|
|
|
|
|
| |||||||
Net Assets | $ | 45,055,066 | $ | 38,295,136 | $ | 700,440,917 | ||||||
|
|
|
|
|
| |||||||
Shares outstanding (unlimited shares authorized, no par value) | ||||||||||||
Class S | 2,751,369 | 3,023,434 | 29,198,382 | |||||||||
Class C | 33,672 | 157,688 | 661,331 | |||||||||
Class A | 329,721 | 244,370 | 1,163,255 | |||||||||
Net asset value (offering and redemption price per share) | ||||||||||||
Class S | $ | 14.50 | $ | 11.18 | $ | 22.59 | ||||||
Class C | $ | 14.05 | $ | 11.02 | $ | 22.21 | ||||||
Class A | $ | 14.25 | $ | 11.23 | $ | 22.50 | ||||||
Class A maximum offering price (100%/(100%-maximum sales charge)) of net asset value adjusted to the nearest cent per share | $ | 15.12 | $ | 11.92 | $ | 23.87 | ||||||
† Includes securities on loan of | $ | 1,658,952 | $ | - | $ | 4,866,011 | ||||||
The accompanying notes are an integral part of the financial statements.
| FINANCIAL STATEMENTS | 59 |
Table of Contents
STATEMENTSOF ASSETSAND LIABILITIES
SEPTEMBER 30, 2013
| ICON Financial Fund | ICON Healthcare Fund | ICON Industrials Fund | ||||||||||
Assets | ||||||||||||
Investments, at cost | $ | 11,867,558 | $ | 87,070,238 | $ | 31,101,726 | ||||||
|
|
|
|
|
| |||||||
Investments, at value† | 12,895,444 | 101,232,568 | 39,728,290 | |||||||||
Foreign currency, at value(a) | - | - | 1,119 | |||||||||
Receivables: | ||||||||||||
Fund shares sold | 13,095 | 174,426 | 3,573 | |||||||||
Investments sold | 214,681 | - | 122 | |||||||||
Dividends | 13,097 | 7,786 | 44,832 | |||||||||
Expense reimbursements due from Adviser | 6,509 | 706 | 441 | |||||||||
Foreign tax reclaims | 4,616 | 5,884 | - | |||||||||
Other assets | 10,732 | 24,555 | 9,954 | |||||||||
|
|
|
|
|
| |||||||
Total Assets | 13,158,174 | 101,445,925 | 39,788,331 | |||||||||
|
|
|
|
|
| |||||||
Liabilities | ||||||||||||
Payables: | ||||||||||||
Due to custodian bank | - | - | 1,280 | |||||||||
Expense recoupment due to Adviser | - | - | 1,498 | |||||||||
Investments purchased | - | 2,086,579 | 825,186 | |||||||||
Payable for collateral received on securities loaned | - | 2,982,098 | - | |||||||||
Fund shares redeemed | 4,317 | 35,302 | 71,489 | |||||||||
Advisory fees | 22,453 | 79,834 | 31,908 | |||||||||
Accrued distribution fees | 444 | 1,251 | 980 | |||||||||
Fund accounting fees | 856 | 2,582 | 937 | |||||||||
Transfer agent fees | 14,037 | 40,454 | 8,517 | |||||||||
Administration fees | 1,123 | 3,992 | 1,595 | |||||||||
Trustee fees | 1,366 | 3,442 | 1,138 | |||||||||
Accrued expenses | 28,000 | 32,673 | 25,217 | |||||||||
|
|
|
|
|
| |||||||
Total Liabilities | 72,596 | 5,268,207 | 969,745 | |||||||||
|
|
|
|
|
| |||||||
Net Assets - all share classes | $ | 13,085,578 | $ | 96,177,718 | $ | 38,818,586 | ||||||
|
|
|
|
|
| |||||||
Net Assets - Class S | $ | 11,853,479 | $ | 92,170,538 | $ | 34,409,245 | ||||||
|
|
|
|
|
| |||||||
Net Assets - Class C | $ | 296,462 | $ | 258,808 | $ | 86,941 | ||||||
|
|
|
|
|
| |||||||
Net Assets - Class A | $ | 935,637 | $ | 3,748,372 | $ | 4,322,400 | ||||||
|
|
|
|
|
| |||||||
| 60 | FINANCIAL STATEMENTS |
Table of Contents
| ICON Financial Fund | ICON Healthcare Fund | ICON Industrials Fund | ||||||||||
Net Assets Consist of | ||||||||||||
Paid-in capital | $ | 101,906,188 | $ | 56,164,162 | $ | 60,735,045 | ||||||
Accumulated undistributed net investment income/(loss) | 278,277 | 130,520 | 198,892 | |||||||||
Accumulated undistributed net realized gain/(loss) | (90,126,773 | ) | 25,720,706 | (30,742,036 | ) | |||||||
Unrealized appreciation/(depreciation) | 1,027,886 | 14,162,330 | 8,626,685 | |||||||||
|
|
|
|
|
| |||||||
Net Assets | $ | 13,085,578 | $ | 96,177,718 | $ | 38,818,586 | ||||||
|
|
|
|
|
| |||||||
Shares outstanding (unlimited shares authorized, no par value) | ||||||||||||
Class S | 1,587,821 | 4,156,694 | 3,258,037 | |||||||||
Class C | 41,154 | 12,012 | 8,351 | |||||||||
Class A | 126,936 | 170,990 | 413,637 | |||||||||
Net asset value (offering and redemption price per share) | ||||||||||||
Class S | $ | 7.47 | $ | 22.17 | $ | 10.56 | ||||||
Class C | $ | 7.20 | $ | 21.55 | $ | 10.41 | ||||||
Class A | $ | 7.37 | $ | 21.92 | $ | 10.45 | ||||||
Class A maximum offering price (100%/(100%-maximum sales charge)) of net asset value adjusted to the nearest cent per share | $ | 7.82 | $ | 23.26 | $ | 11.09 | ||||||
† Includes securities on loan of | $ | - | $ | 2,796,155 | $ | - | ||||||
(a) Foreign currency, at cost | $ | - | $ | - | $ | 1,119 | ||||||
The accompanying notes are an integral part of the financial statements.
| FINANCIAL STATEMENTS | 61 |
Table of Contents
STATEMENTSOF ASSETSAND LIABILITIES
SEPTEMBER 30, 2013
| ICON Information Technology Fund | ICON Materials Fund | ICON Utilities Fund | ||||||||||
Assets | ||||||||||||
Investments, at cost | $ | 60,087,999 | $ | 55,355,070 | $ | 34,217,670 | ||||||
|
|
|
|
|
| |||||||
Investments, at value | 78,947,804 | 69,254,417 | 34,182,298 | |||||||||
Cash | - | 89 | - | |||||||||
Receivables: | ||||||||||||
Fund shares sold | 47,743 | 95,770 | 67,648 | |||||||||
Dividends | 15,078 | 146,817 | 183,151 | |||||||||
Expense reimbursements due from Adviser | 1,257 | 584 | 22,836 | |||||||||
Foreign tax reclaims | - | - | 4,916 | |||||||||
Other assets | 15,146 | 12,511 | 9,883 | |||||||||
|
|
|
|
|
| |||||||
Total Assets | 79,027,028 | 69,510,188 | 34,470,732 | |||||||||
|
|
|
|
|
| |||||||
Liabilities | ||||||||||||
Payables: | ||||||||||||
Due to custodian bank | - | 5,488 | - | |||||||||
Expense recoupment due to Adviser | - | 253 | - | |||||||||
Investments purchased | 2,399,022 | 1,419,373 | - | |||||||||
Fund shares redeemed | 11,972 | 94,090 | 20,663 | |||||||||
Distributions due to shareholders | - | - | 24,718 | |||||||||
Advisory fees | 61,087 | 54,968 | 28,229 | |||||||||
Accrued distribution fees | 363 | 539 | 2,868 | |||||||||
Fund accounting fees | 1,841 | 1,580 | 870 | |||||||||
Transfer agent fees | 22,055 | 20,670 | 12,139 | |||||||||
Administration fees | 3,054 | 2,748 | 1,411 | |||||||||
Trustee fees | 2,414 | 1,552 | 1,038 | |||||||||
Accrued expenses | 28,995 | 25,942 | 25,724 | |||||||||
|
|
|
|
|
| |||||||
Total Liabilities | 2,530,803 | 1,627,203 | 117,660 | |||||||||
|
|
|
|
|
| |||||||
Net Assets - all share classes | $ | 76,496,225 | $ | 67,882,985 | $ | 34,353,072 | ||||||
|
|
|
|
|
| |||||||
Net Assets - Class S | $ | 73,851,466 | $ | 65,781,786 | $ | 29,117,127 | ||||||
|
|
|
|
|
| |||||||
Net Assets - Class C | $ | 314,941 | $ | 217,781 | $ | 2,833,686 | ||||||
|
|
|
|
|
| |||||||
Net Assets - Class A | $ | 2,329,818 | $ | 1,883,418 | $ | 2,402,259 | ||||||
|
|
|
|
|
| |||||||
| 62 | FINANCIAL STATEMENTS |
Table of Contents
| ICON Information Technology Fund | ICON Materials Fund | ICON Utilities Fund | ||||||||||
Net Assets Consist of | ||||||||||||
Paid-in capital | $ | 82,536,944 | $ | 68,964,483 | $ | 38,985,693 | ||||||
Accumulated undistributed net investment income/(loss) | (290,634 | ) | 347,882 | 3,401 | ||||||||
Accumulated undistributed net realized (loss) | (24,609,890 | ) | (15,328,727 | ) | (4,600,675 | ) | ||||||
Unrealized appreciation/(depreciation) | 18,859,805 | 13,899,347 | (35,347 | ) | ||||||||
|
|
|
|
|
| |||||||
Net Assets | $ | 76,496,225 | $ | 67,882,985 | $ | 34,353,072 | ||||||
|
|
|
|
|
| |||||||
Shares outstanding (unlimited shares authorized, no par value) | ||||||||||||
Class S | 6,455,852 | 4,899,387 | 4,033,426 | |||||||||
Class C | 28,458 | 16,450 | 398,072 | |||||||||
Class A | 206,095 | 140,984 | 336,645 | |||||||||
Net asset value (offering and redemption price per share) | ||||||||||||
Class S | $ | 11.44 | $ | 13.43 | $ | 7.22 | ||||||
Class C | $ | 11.07 | $ | 13.24 | $ | 7.12 | ||||||
Class A | $ | 11.30 | $ | 13.36 | $ | 7.14 | ||||||
Class A maximum offering price (100%/(100%-maximum sales charge)) of net asset value adjusted to the nearest cent per share | $ | 11.99 | $ | 14.18 | $ | 7.58 | ||||||
The accompanying notes are an integral part of the financial statements.
| FINANCIAL STATEMENTS | 63 |
Table of Contents
STATEMENTSOF OPERATIONS
FORTHEYEARENDED SEPTEMBER 30, 2013
| ICON Consumer Discretionary Fund | ICON Consumer Staples Fund | ICON Energy Fund | ||||||||||
Investment Income | ||||||||||||
Interest | $ | 221 | $ | 47 | $ | 1,092 | ||||||
Dividends | 712,473 | 1,369,263 | 13,455,876 | |||||||||
Income from securities lending, net | 1,802 | 4,821 | 84,769 | |||||||||
Foreign taxes withheld | - | (191 | ) | (96,183 | ) | |||||||
|
|
|
|
|
| |||||||
Total Investment Income | 714,496 | 1,373,940 | 13,445,554 | |||||||||
|
|
|
|
|
| |||||||
Expenses | ||||||||||||
Advisory fees | 611,848 | 404,008 | 6,204,715 | |||||||||
Distribution fees: | ||||||||||||
Class C | 2,025 | 13,575 | 105,148 | |||||||||
Class A | 7,597 | 5,163 | 47,383 | |||||||||
Fund accounting fees | 14,779 | 10,084 | 156,986 | |||||||||
Transfer agent fees | 84,170 | 66,942 | 949,437 | |||||||||
Administration fees | 30,593 | 20,200 | 313,406 | |||||||||
Custody fees | 4,460 | 2,816 | 18,555 | |||||||||
Registration fees: | ||||||||||||
Class S | 20,366 | 17,479 | 42,116 | |||||||||
Class C | 1,450 | 1,951 | 4,141 | |||||||||
Class A | 2,919 | 1,575 | 4,603 | |||||||||
Insurance expense | 8,233 | 4,055 | 95,194 | |||||||||
Trustee fees and expenses | 8,121 | 5,555 | 78,349 | |||||||||
Audit and tax service expense | 25,334 | 25,330 | 27,330 | |||||||||
Interest expense | 6,317 | 2,550 | 1,979 | |||||||||
Recoupment of previously reimbursed expenses | 107 | 19,798 | - | |||||||||
Other expenses | 32,836 | 29,106 | 237,083 | |||||||||
|
|
|
|
|
| |||||||
Total expenses before expense reimbursement | 861,155 | 630,187 | 8,286,425 | |||||||||
Expense reimbursement by Adviser due to expense limitation agreement | (1,881 | ) | (3,344 | ) | - | |||||||
|
|
|
|
|
| |||||||
Net Expenses | 859,274 | 626,843 | 8,286,425 | |||||||||
|
|
|
|
|
| |||||||
Net Investment Income/(Loss) | (144,778 | ) | 747,097 | 5,159,129 | ||||||||
|
|
|
|
|
| |||||||
Net Realized and Unrealized Gain/(Loss) | ||||||||||||
Net realized gain/(loss) on: | ||||||||||||
Investments | 17,367,080 | 5,151,989 | 51,204,020 | |||||||||
Foreign currency | - | - | 102 | |||||||||
Change in unrealized net appreciation/(depreciation) on: | ||||||||||||
Investments and foreign currency | (5,298,877 | ) | (1,187,254 | ) | 51,972,292 | |||||||
|
|
|
|
|
| |||||||
Net realized and unrealized gain/(loss) | 12,068,203 | 3,964,735 | 103,176,414 | |||||||||
|
|
|
|
|
| |||||||
Net Increase/(Decrease) in Net Assets Resulting From Operations | $ | 11,923,425 | $ | 4,711,832 | $ | 108,335,543 | ||||||
|
|
|
|
|
| |||||||
The accompanying notes are an integral part of the financial statements.
| 64 | FINANCIAL STATEMENTS |
Table of Contents
| ICON Financial Fund | ICON Healthcare Fund | ICON Industrials Fund | ICON Information Technology Fund | ICON Materials Fund | ICON Utilities Fund | |||||||||||||||||
| $ | 126 | $ | 496 | $ | 98 | $ | 158 | $ | 241 | $ | 45 | |||||||||||
| 900,787 | 1,572,683 | 719,043 | 863,680 | 1,073,018 | 1,397,431 | |||||||||||||||||
| - | 82,369 | 1,212 | 4,424 | 2,600 | - | |||||||||||||||||
| - | (29,348 | ) | (738 | ) | - | (14,597 | ) | (2,812 | ) | |||||||||||||
|
|
|
|
|
|
|
|
|
|
|
| |||||||||||
| 900,913 | 1,626,200 | 719,615 | 868,262 | 1,061,262 | 1,394,664 | |||||||||||||||||
|
|
|
|
|
|
|
|
|
|
|
| |||||||||||
| 410,114 | 1,063,287 | 351,436 | 747,387 | 488,673 | 322,497 | |||||||||||||||||
| 2,631 | 1,664 | 303 | 2,721 | 1,862 | 31,486 | |||||||||||||||||
| 13,746 | 9,361 | 1,815 | 1,886 | 1,992 | 9,197 | |||||||||||||||||
| 10,669 | 27,528 | 9,337 | 19,153 | 12,701 | 8,105 | |||||||||||||||||
| 75,920 | 198,917 | 52,268 | 119,268 | 94,484 | 64,277 | |||||||||||||||||
| 20,506 | 53,165 | 17,572 | 37,369 | 24,433 | 16,125 | |||||||||||||||||
| 3,633 | 4,869 | 2,430 | 3,535 | 2,585 | 3,702 | |||||||||||||||||
| 14,224 | 20,195 | 16,489 | 18,599 | 15,838 | 16,571 | |||||||||||||||||
| 1,370 | 2,226 | 1,291 | 1,521 | 2,165 | 2,221 | |||||||||||||||||
| 3,901 | 1,896 | 1,304 | 2,801 | 1,930 | 3,886 | |||||||||||||||||
| 7,335 | 14,000 | 7,135 | 11,016 | 8,948 | 4,790 | |||||||||||||||||
| 5,118 | 13,985 | 4,549 | 10,166 | 5,460 | 4,168 | |||||||||||||||||
| 25,326 | 25,358 | 25,344 | 25,348 | 33,618 | 25,318 | |||||||||||||||||
| 3,558 | 3,905 | 1,721 | 2,252 | 1,285 | 4,406 | |||||||||||||||||
| 895 |
| 4,246 | 1,498 | 211 | 253 | 12,471 | |||||||||||||||
| 28,973 | 54,265 | 24,527 | 41,253 | 22,317 | 23,201 | |||||||||||||||||
|
|
|
|
|
|
|
|
|
|
|
| |||||||||||
| 627,919 |
| 1,498,867 | 519,019 | 1,044,486 | 718,544 | 552,421 | |||||||||||||||
| (8,359 | ) | (3,191 | ) | (4,711 | ) | (5,822 | ) | (5,169 | ) | (25,930 | ) | ||||||||||
|
|
|
|
|
|
|
|
|
|
|
| |||||||||||
| 619,560 | 1,495,676 | 514,308 | 1,038,664 | 713,375 | 526,491 | |||||||||||||||||
|
|
|
|
|
|
|
|
|
|
|
| |||||||||||
| 281,353 | 130,524 | 205,307 | (170,402 | ) | 347,887 | 868,173 | ||||||||||||||||
|
|
|
|
|
|
|
|
|
|
|
| |||||||||||
| 12,374,185 | 26,892,462 | 5,370,827 | 5,389,992 | 3,216,292 | 4,937,104 | |||||||||||||||||
| - | - | 3 | - | - | - | |||||||||||||||||
| (2,638,068 | ) | 68,512 | 3,471,242 | (1,444,372 | ) | 7,021,570 | (2,498,233 | ) | ||||||||||||||
|
|
|
|
|
|
|
|
|
|
|
| |||||||||||
| 9,736,117 | 26,960,974 | 8,842,072 | 3,945,620 | 10,237,862 | 2,438,871 | |||||||||||||||||
|
|
|
|
|
|
|
|
|
|
|
| |||||||||||
$ | 10,017,470 |
| $ | 27,091,498 | $ | 9,047,379 | $ | 3,775,218 | $ | 10,585,749 | $ | 3,307,044 | ||||||||||
|
|
|
|
|
|
|
|
|
|
|
| |||||||||||
| FINANCIAL STATEMENTS | 65 |
Table of Contents
STATEMENTSOF CHANGESIN NET ASSETS
| ICON Consumer Discretionary Fund | ICON Consumer Staples Fund | |||||||||||||||
| Year ended September 30, 2013 | Year ended September 30, 2012 | Year ended September 30, 2013 | Year ended September 30, 2012 | |||||||||||||
Operations | ||||||||||||||||
Net investment income/(loss) | $ | (144,778 | ) | $ | 107,080 | $ | 747,097 | $ | 377,838 | |||||||
Net realized gain/(loss) | 17,367,080 | 1,721,881 | 5,151,989 | 1,416,484 | ||||||||||||
Change in net unrealized appreciation/(depreciation) | (5,298,877 | ) | 11,806,915 | (1,187,254 | ) | 3,306,301 | ||||||||||
|
|
|
|
|
|
|
| |||||||||
Net increase/(decrease) in net assets resulting from operations | 11,923,425 | 13,635,876 | 4,711,832 | 5,100,623 | ||||||||||||
|
|
|
|
|
|
|
| |||||||||
Dividends and Distributions to Shareholders | ||||||||||||||||
Net investment income | ||||||||||||||||
Class S | (107,081 | ) | – | (705,385 | ) | (607,366 | ) | |||||||||
Class C | – | – | (14,925 | ) | (4,771 | ) | ||||||||||
Class A | – | – | (34,332 | ) | (37,597 | ) | ||||||||||
Net realized gains | ||||||||||||||||
Class S | – | – | – | – | ||||||||||||
Class C | – | – | – | – | ||||||||||||
Class A | – | – | – | – | ||||||||||||
|
|
|
|
|
|
|
| |||||||||
Net decrease from dividends and distributions | (107,081 | ) | – | (754,642 | ) | (649,734 | ) | |||||||||
|
|
|
|
|
|
|
| |||||||||
Fund Share Transactions | ||||||||||||||||
Shares sold | ||||||||||||||||
Class S | 43,652,744 | 41,313,577 | 21,836,090 | 38,108,999 | ||||||||||||
Class C | 401,289 | 41,835 | 813,655 | 858,192 | ||||||||||||
Class A | 4,395,182 | 12,555,595 | 3,932,331 | 3,237,040 | ||||||||||||
Reinvested dividends and distributions | ||||||||||||||||
Class S | 105,010 | – | 692,727 | 590,753 | ||||||||||||
Class C | – | – | 4,317 | 3,283 | ||||||||||||
Class A | – | – | 29,553 | 36,134 | ||||||||||||
Shares repurchased | ||||||||||||||||
Class S | (73,391,087 | ) | (29,433,208 | ) | (30,093,447 | ) | (26,025,739 | ) | ||||||||
Class C | (36,831 | ) | (19,367 | ) | (124,117 | ) | (20,676 | ) | ||||||||
Class A | (1,812,004 | ) | (12,336,129 | ) | (2,752,989 | ) | (1,931,826 | ) | ||||||||
|
|
|
|
|
|
|
| |||||||||
Net increase/(decrease) from fund share transactions | (26,685,697 | ) | 12,122,303 | (5,661,880 | ) | 14,856,160 | ||||||||||
|
|
|
|
|
|
|
| |||||||||
Total net increase/(decrease) in net assets | (14,869,353 | ) | 25,758,179 | (1,704,690 | ) | 19,307,049 | ||||||||||
Net Assets | ||||||||||||||||
Beginning of year | 59,924,419 | 34,166,240 | 39,999,826 | 20,692,777 | ||||||||||||
|
|
|
|
|
|
|
| |||||||||
End of year | $ | 45,055,066 | $ | 59,924,419 | $ | 38,295,136 | $ | 39,999,826 | ||||||||
|
|
|
|
|
|
|
| |||||||||
| 66 | FINANCIAL STATEMENTS |
Table of Contents
| ICON Energy Fund | ICON Financial Fund | ICON Healthcare Fund | ||||||||||||||||||||
Year ended | Year ended September 30, 2012 | Year ended September 30, 2013 | Year ended September 30, 2012 | Year ended September 30, 2013 | Year ended September 30, 2012 | |||||||||||||||||
| $ | 5,159,129 | $ | 5,254,624 | $ | 281,353 | $ | 307,391 | $ | 130,524 | $ | 965,962 | |||||||||||
| 51,204,122 | (14,957,676 | ) | 12,374,185 | 389,339 | 26,892,462 | 3,733,841 | ||||||||||||||||
| 51,972,292 | 111,974,219 | (2,638,068 | ) | 9,758,028 | 68,512 | 19,012,768 | ||||||||||||||||
|
|
|
|
|
|
|
|
|
|
|
| |||||||||||
| 108,335,543 | 102,271,167 | 10,017,470 | 10,454,758 | 27,091,498 | 23,712,571 | |||||||||||||||||
|
|
|
|
|
|
|
|
|
|
|
| |||||||||||
| (7,939,013 | ) | (4,918,808 | ) | (212,181 | ) | (210,303 | ) | (960,315 | ) | (661,181 | ) | |||||||||||
| (40,680 | ) | (14,407 | ) | (2,641 | ) | (30 | ) | (830 | ) | (198 | ) | |||||||||||
| (198,437 | ) | (36,255 | ) | (87,060 | ) | (365 | ) | (4,814 | ) | (1,982 | ) | |||||||||||
| – | (13,005,707 | ) | – | – | – | – | ||||||||||||||||
| – | (124,748 | ) | – | – | – | – | ||||||||||||||||
| – | (160,032 | ) | – | – | – | – | ||||||||||||||||
|
|
|
|
|
|
|
|
|
|
|
| |||||||||||
| (8,178,130 | ) | (18,259,957 | ) | (301,882 | ) | (210,698 | ) | (965,959 | ) | (663,361 | ) | |||||||||||
|
|
|
|
|
|
|
|
|
|
|
| |||||||||||
| 198,302,565 | 120,855,909 | 29,654,752 | 27,764,740 | 43,127,373 | 59,020,177 | |||||||||||||||||
| 6,783,056 | 3,912,708 | 243,546 | 1,000 | 146,690 | 78,893 | |||||||||||||||||
| 17,708,600 | 11,659,637 | 819,285 | 8,825,613 | 11,232,441 | 544,015 | |||||||||||||||||
| 7,493,213 | 16,918,343 | 206,388 | 205,516 | 908,195 | 617,310 | |||||||||||||||||
| 32,808 | 123,901 | 2,641 | 30 | 494 | 198 | |||||||||||||||||
| 156,316 | 166,811 | 71,977 | 127 | 3,781 | 1,781 | |||||||||||||||||
| (208,619,981 | ) | (209,071,623 | ) | (54,045,138 | ) | (42,061,174 | ) | (77,710,064 | ) | (56,788,889 | ) | |||||||||||
| (1,988,902 | ) | (1,176,364 | ) | (4,217 | ) | (9,535 | ) | (28,984 | ) | (7,628 | ) | |||||||||||
| (10,731,767 | ) | (3,368,788 | ) | (10,555,135 | ) | (459,328 | ) | (9,058,937 | ) | (346,970 | ) | |||||||||||
|
|
|
|
|
|
|
|
|
|
|
| |||||||||||
| 9,135,908 | (59,979,466 | ) | (33,605,901 | ) | (5,733,011 | ) | (31,379,011 | ) | 3,118,887 | |||||||||||||
|
|
|
|
|
|
|
|
|
|
|
| |||||||||||
| 109,293,321 | 24,031,744 | (23,890,313 | ) | 4,511,049 | (5,253,472 | ) | 26,168,097 | |||||||||||||||
| 591,147,596 | 567,115,852 | 36,975,891 | 32,464,842 | 101,431,190 | 75,263,093 | |||||||||||||||||
|
|
|
|
|
|
|
|
|
|
|
| |||||||||||
| $ | 700,440,917 | $ | 591,147,596 | $ | 13,085,578 | $ | 36,975,891 | $ | 96,177,718 | $ | 101,431,190 | |||||||||||
|
|
|
|
|
|
|
|
|
|
|
| |||||||||||
| FINANCIAL STATEMENTS | 67 |
Table of Contents
STATEMENTSOF CHANGESIN NET ASSETS (CONTINUED)
| ICON Consumer Discretionary Fund | ICON Consumer Staples Fund | |||||||||||||||
| Year ended September 30, 2013 | Year ended September 30, 2012 | Year ended September 30, 2013 | Year ended September 30, 2012 | |||||||||||||
Transactions in Fund Shares | ||||||||||||||||
Shares sold | ||||||||||||||||
Class S | 3,395,262 | 3,838,023 | 2,043,041 | 3,984,680 | ||||||||||||
Class C | 30,502 | 4,075 | 76,170 | 88,143 | ||||||||||||
Class A | 332,826 | 1,265,567 | 342,500 | 341,933 | ||||||||||||
Reinvested dividends and distributions | ||||||||||||||||
Class S | 9,147 | – | 64,320 | 62,161 | ||||||||||||
Class C | – | – | 403 | 346 | ||||||||||||
Class A | – | – | 2,678 | 3,860 | ||||||||||||
Shares repurchased | ||||||||||||||||
Class S | (5,587,832 | ) | (2,787,134 | ) | (2,766,875 | ) | (2,756,946 | ) | ||||||||
Class C | (2,785 | ) | (1,766 | ) | (11,686 | ) | (2,125 | ) | ||||||||
Class A | (135,510 | ) | (1,134,440 | ) | (247,161 | ) | (202,173 | ) | ||||||||
|
|
|
|
|
|
|
| |||||||||
Net increase/(decrease) | (1,958,390 | ) | 1,184,325 | (496,610 | ) | 1,519,879 | ||||||||||
|
|
|
|
|
|
|
| |||||||||
Shares outstanding, beginning of year | 5,073,152 | 3,888,827 | 3,922,102 | 2,402,223 | ||||||||||||
|
|
|
|
|
|
|
| |||||||||
Shares outstanding, end of year | 3,114,762 | 5,073,152 | 3,425,492 | 3,922,102 | ||||||||||||
|
|
|
|
|
|
|
| |||||||||
Accumulated undistributed net investment income/(loss) | $ | (144,779 | ) | $ | 107,080 | $ | 327 | $ | 7,872 | |||||||
|
|
|
|
|
|
|
| |||||||||
The accompanying notes are an integral part of the financial statements.
| 68 | FINANCIAL STATEMENTS |
Table of Contents
| ICON Energy Fund | ICON Financial Fund | ICON Healthcare Fund | ||||||||||||||||||||
Year ended | Year ended September 30, 2012 | Year ended September 30, 2013 | Year ended September 30, 2012 | Year ended September 30, 2013 | Year ended September 30, 2012 | |||||||||||||||||
| 9,319,960 | 6,426,038 | 4,375,423 | 5,007,873 | 2,183,690 | 3,772,473 | |||||||||||||||||
| 319,293 | 208,736 | 40,854 | 188 | 7,542 | 4,831 | |||||||||||||||||
| 838,402 | 640,406 | 124,095 | 1,623,709 | 584,040 | 33,895 | |||||||||||||||||
| 401,996 | 970,645 | 34,227 | 42,288 | 51,749 | 43,138 | |||||||||||||||||
| 1,776 | 7,162 | 450 | 6 | 29 | 14 | |||||||||||||||||
| 8,404 | 9,581 | 12,036 | 26 | 217 | 125 | |||||||||||||||||
| (10,092,638 | ) | (11,259,069 | ) | (7,408,147 | ) | (7,376,904 | ) | (3,826,521 | ) | (3,607,680 | ) | |||||||||||
| (97,341 | ) | (64,819 | ) | (582 | ) | (1,661 | ) | (1,548 | ) | (488 | ) | |||||||||||
| (511,867 | ) | (183,587 | ) | (1,557,301 | ) | (80,699 | ) | (435,642 | ) | (20,932 | ) | |||||||||||
|
|
|
|
|
|
|
|
|
|
|
| |||||||||||
| 187,985 | (3,244,907 | ) | (4,378,945 | ) | (785,174 | ) | (1,436,444 | ) | 225,376 | |||||||||||||
|
|
|
|
|
|
|
|
|
|
|
| |||||||||||
| 30,834,983 | 34,079,890 | 6,134,856 | 6,920,030 | 5,776,140 | 5,550,764 | |||||||||||||||||
|
|
|
|
|
|
|
|
|
|
|
| |||||||||||
| 31,022,968 | 30,834,983 | 1,755,911 | 6,134,856 | 4,339,696 | 5,776,140 | |||||||||||||||||
|
|
|
|
|
|
|
|
|
|
|
| |||||||||||
| $ | 1,301,971 | $ | 5,791,817 | $ | 278,277 | $ | 301,877 | $ | 130,520 | $ | 965,955 | |||||||||||
|
|
|
|
|
|
|
|
|
|
|
| |||||||||||
| FINANCIAL STATEMENTS | 69 |
Table of Contents
STATEMENTSOF CHANGESIN NET ASSETS (CONTINUED)
| ICON Industrials Fund | ICON Information Technology Fund | |||||||||||||||
| Year ended September 30, 2013 | Year ended September 30, 2012 | Year ended September 30, 2013 | Year ended September 30, 2012 | |||||||||||||
Operations | ||||||||||||||||
Net investment income/(loss) | $ | 205,307 | $ | 420,657 | $ | (170,402 | ) | $ | (143,424 | ) | ||||||
Net realized gain/(loss) | 5,370,830 | 3,544,086 | 5,389,992 | (316,676 | ) | |||||||||||
Change in net unrealized appreciation/(depreciation) | 3,471,242 | 7,192,118 | (1,444,372 | ) | 18,102,518 | |||||||||||
|
|
|
|
|
|
|
| |||||||||
Net increase/(decrease) in net assets resulting from operations | 9,047,379 | 11,156,861 | 3,775,218 | 17,642,418 | ||||||||||||
|
|
|
|
|
|
|
| |||||||||
Dividends and Distributions to Shareholders | ||||||||||||||||
Net investment income | ||||||||||||||||
Class S | (420,405 | ) | (533,894 | ) | – | – | ||||||||||
Class C | – | (101 | ) | – | – | |||||||||||
Class A | (217 | ) | (1,598 | ) | – | – | ||||||||||
|
|
|
|
|
|
|
| |||||||||
Net decrease from dividends and distributions | (420,622 | ) | (535,593 | ) | – | – | ||||||||||
|
|
|
|
|
|
|
| |||||||||
Fund Share Transactions | ||||||||||||||||
Shares sold | ||||||||||||||||
Class S | 7,173,504 | 9,116,007 | 17,162,900 | 31,212,015 | ||||||||||||
Class C | 74,596 | 15,368 | 181,126 | 290,459 | ||||||||||||
Class A | 4,283,513 | 2,866,767 | 2,303,876 | 1,490,272 | ||||||||||||
Reinvested dividends and distributions | ||||||||||||||||
Class S | 414,890 | 525,486 | – | – | ||||||||||||
Class C | – | 55 | – | – | ||||||||||||
Class A | 175 | 548 | – | – | ||||||||||||
Shares repurchased | ||||||||||||||||
Class S | (21,215,368 | ) | (31,170,444 | ) | (30,428,290 | ) | (26,579,338 | ) | ||||||||
Class C | (6,000 | ) | (21,576 | ) | (177,556 | ) | (8,609 | ) | ||||||||
Class A | (328,907 | ) | (2,948,167 | ) | (1,345,123 | ) | (106,906 | ) | ||||||||
|
|
|
|
|
|
|
| |||||||||
Net increase/(decrease) from fund share transactions | (9,603,597 | ) | (21,615,956 | ) | (12,303,067 | ) | 6,297,893 | |||||||||
|
|
|
|
|
|
|
| |||||||||
Total net increase/(decrease) in net assets | (976,840 | ) | (10,994,688 | ) | (8,527,849 | ) | 23,940,311 | |||||||||
Net Assets | ||||||||||||||||
Beginning of year | 39,795,426 | 50,790,114 | 85,024,074 | 61,083,763 | ||||||||||||
|
|
|
|
|
|
|
| |||||||||
End of year | $ | 38,818,586 | $ | 39,795,426 | $ | 76,496,225 | $ | 85,024,074 | ||||||||
|
|
|
|
|
|
|
| |||||||||
| 70 | FINANCIAL STATEMENTS |
Table of Contents
| ICON Materials Fund | ICON Utilities Fund | |||||||||||||
Year ended | Year ended September 30, 2012 | Year ended September 30, 2013 | Year ended September 30, 2012 | |||||||||||
| $ | 347,887 | $ | 569,890 | $ | 868,173 | $ | 912,208 | |||||||
| 3,216,292 | 1,938,852 | 4,937,104 | 361,079 | |||||||||||
| 7,021,570 | 11,086,211 | (2,498,233 | ) | 1,826,061 | ||||||||||
|
|
|
|
|
|
|
| |||||||
| 10,585,749 | 13,594,953 | 3,307,044 | 3,099,348 | |||||||||||
|
|
|
|
|
|
|
| |||||||
| (562,814 | ) | (645,281 | ) | (720,511 | ) | (787,907 | ) | |||||||
| (522 | ) | (1,002 | ) | (63,357 | ) | (80,281 | ) | |||||||
| (6,559 | ) | (4,720 | ) | (86,104 | ) | (187,259 | ) | |||||||
|
|
|
|
|
|
|
| |||||||
| (569,895 | ) | (651,003 | ) | (869,972 | ) | (1,055,447 | ) | |||||||
|
|
|
|
|
|
|
| |||||||
| 38,528,676 | 8,002,597 | 34,316,231 | 20,476,677 | |||||||||||
| 39,207 | 71,781 | 94,411 | 3,909,159 | |||||||||||
| 3,429,905 | 168,201 | 817,380 | 6,771,649 | |||||||||||
| 518,793 | 586,449 | 654,271 | 686,914 | |||||||||||
| 473 | 923 | 19,963 | 36,141 | |||||||||||
| 5,232 | 3,278 | 46,543 | 91,904 | |||||||||||
| (24,745,973 | ) | (38,839,092 | ) | (31,490,277 | ) | (20,585,025 | ) | |||||||
| (51,875 | ) | (25,844 | ) | (715,484 | ) | (809,410 | ) | |||||||
| (2,218,510 | ) | (225,421 | ) | (5,719,639 | ) | (514,585 | ) | |||||||
|
|
|
|
|
|
|
| |||||||
| 15,505,928 | (30,257,128 | ) | (1,976,601 | ) | 10,063,424 | |||||||||
|
|
|
|
|
|
|
| |||||||
| 25,521,782 | (17,313,178 | ) | 460,471 | 12,107,325 | ||||||||||
| 42,361,203 | 59,674,381 | 33,892,601 | 21,785,276 | |||||||||||
|
|
|
|
|
|
|
| |||||||
| $ | 67,882,985 | $ | 42,361,203 | $ | 34,353,072 | $ | 33,892,601 | |||||||
|
|
|
|
|
|
|
| |||||||
| FINANCIAL STATEMENTS | 71 |
Table of Contents
STATEMENTSOF CHANGESIN NET ASSETS (CONTINUED)
| ICON Industrials Fund | ICON Information Technology Fund | |||||||||||||||
| Year ended September 30, 2013 | Year ended September 30, 2012 | Year ended September 30, 2013 | Year ended September 30, 2012 | |||||||||||||
Transactions in Fund Shares | ||||||||||||||||
Shares sold | ||||||||||||||||
Class S | 770,135 | 1,103,070 | 1,627,939 | 3,027,960 | ||||||||||||
Class C | 7,472 | 1,849 | 17,981 | 28,703 | ||||||||||||
Class A | 426,449 | 344,128 | 204,149 | 142,036 | ||||||||||||
Reinvested dividends and distributions | ||||||||||||||||
Class S | 49,628 | 69,694 | – | – | ||||||||||||
Class C | – | 7 | – | – | ||||||||||||
Class A | 21 | 73 | – | – | ||||||||||||
Shares repurchased | ||||||||||||||||
Class S | (2,361,282 | ) | (3,827,215 | ) | (2,944,037 | ) | (2,685,759 | ) | ||||||||
Class C | (570 | ) | (2,595 | ) | (17,570 | ) | (816 | ) | ||||||||
Class A | (32,904 | ) | (342,247 | ) | (129,555 | ) | (10,696 | ) | ||||||||
|
|
|
|
|
|
|
| |||||||||
Net increase/(decrease) | (1,141,051 | ) | (2,653,236 | ) | (1,241,093 | ) | 501,428 | |||||||||
|
|
|
|
|
|
|
| |||||||||
Shares outstanding, beginning of year | 4,821,076 | 7,474,312 | 7,931,498 | 7,430,070 | ||||||||||||
|
|
|
|
|
|
|
| |||||||||
Shares outstanding, end of year | 3,680,025 | 4,821,076 | 6,690,405 | 7,931,498 | ||||||||||||
|
|
|
|
|
|
|
| |||||||||
Accumulated undistributed net investment income/(loss) | $ | 198,892 | $ | 420,620 | $ | (290,634 | ) | $ | (105,973 | ) | ||||||
|
|
|
|
|
|
|
| |||||||||
The accompanying notes are an integral part of the financial statements.
| 72 | FINANCIAL STATEMENTS |
Table of Contents
| ICON Materials Fund | ICON Utilities Fund | |||||||||||||
Year ended | Year ended September 30, 2012 | Year ended September 30, 2013 | Year ended September 30, 2012 | |||||||||||
| 3,213,924 | 722,271 | 4,739,990 | 3,079,659 | |||||||||||
| 3,256 | 6,709 | 13,503 | 600,513 | |||||||||||
| 268,253 | 15,763 | 111,218 | 1,048,723 | |||||||||||
| 47,903 | 58,940 | 91,047 | 101,750 | |||||||||||
| 44 | 94 | 2,846 | 5,426 | |||||||||||
| 484 | 330 | 6,655 | 13,780 | |||||||||||
| (2,106,268 | ) | (3,597,504 | ) | (4,252,491 | ) | (3,116,021 | ) | |||||||
| (4,677 | ) | (2,440 | ) | (103,007 | ) | (125,065 | ) | |||||||
| (176,505 | ) | (21,569 | ) | (838,700 | ) | (76,922 | ) | |||||||
|
|
|
|
|
|
|
| |||||||
| 1,246,414 | (2,817,406 | ) | (228,939 | ) | 1,531,843 | |||||||||
|
|
|
|
|
|
|
| |||||||
| 3,810,407 | 6,627,813 | 4,997,082 | 3,465,239 | |||||||||||
|
|
|
|
|
|
|
| |||||||
| 5,056,821 | 3,810,407 | 4,768,143 | 4,997,082 | |||||||||||
|
|
|
|
|
|
|
| |||||||
| $ | 347,882 | $ | 569,893 | $ | 3,401 | $ | 5,200 | |||||||
|
|
|
|
|
|
|
| |||||||
| FINANCIAL STATEMENTS | 73 |
Table of Contents
| Income/(loss) from investment operations | Less dividends and | |||||||||||||||||||||||
| Net asset value, beginning of period | Net investment income/ (loss)(x) | Net realized and unrealized gains/(losses) on investments | Total from investment operations | Dividends from net investment income | Distributions from net realized gains | |||||||||||||||||||
ICON Consumer Discretionary Fund | ||||||||||||||||||||||||
Class S | ||||||||||||||||||||||||
Year ended September 30, 2013 | $ | 11.82 | $ | (0.03 | ) | $ | 2.73 | $ | 2.70 | $ | (0.02 | ) | $ | – | ||||||||||
Year ended September 30, 2012 | 8.79 | 0.03 | 3.00 | 3.03 | – | – | ||||||||||||||||||
Year ended September 30, 2011 | 7.92 | (0.02 | ) | 0.89 | 0.87 | – | – | |||||||||||||||||
Year ended September 30, 2010 | 6.83 | (0.05 | ) | 1.42 | 1.37 | (0.28 | ) | – | ||||||||||||||||
Year ended September 30, 2009 | 7.19 | 0.01 | (0.37 | ) | (0.36 | ) | – | – | ||||||||||||||||
Class C | ||||||||||||||||||||||||
Year ended September 30, 2013 | 11.57 | (0.24 | ) | 2.72 | 2.48 | – | – | |||||||||||||||||
Year ended September 30, 2012 | 8.72 | (0.12 | ) | 2.97 | 2.85 | – | – | |||||||||||||||||
Year ended September 30, 2011 | 7.92 | (0.12 | ) | 0.92 | 0.80 | – | – | |||||||||||||||||
Class A | ||||||||||||||||||||||||
Year ended September 30, 2013 | 11.65 | (0.09 | ) | 2.69 | 2.60 | – | – | |||||||||||||||||
Year ended September 30, 2012 | 8.75 | (0.02 | ) | 2.92 | 2.90 | – | – | |||||||||||||||||
Year ended September 30, 2011 | 7.92 | (0.06 | ) | 0.89 | 0.83 | – | – | |||||||||||||||||
ICON Consumer Staples Fund | ||||||||||||||||||||||||
Class S | ||||||||||||||||||||||||
Year ended September 30, 2013 | 10.20 | 0.21 | 0.98 | 1.19 | (0.21 | ) | – | |||||||||||||||||
Year ended September 30, 2012 | 8.61 | 0.14 | 1.69 | 1.83 | (0.24 | ) | – | |||||||||||||||||
Year ended September 30, 2011 | 8.08 | 0.10 | 0.52 | 0.62 | (0.09 | ) | – | |||||||||||||||||
Year ended September 30, 2010 | 7.32 | 0.08 | 0.76 | 0.84 | (0.08 | ) | – | |||||||||||||||||
Year ended September 30, 2009 | 7.37 | 0.04 | (0.09 | ) | (0.05 | ) | – | – | (c) | |||||||||||||||
Class C | ||||||||||||||||||||||||
Year ended September 30, 2013 | 10.06 | 0.08 | 0.99 | 1.07 | (0.11 | ) | – | |||||||||||||||||
Year ended September 30, 2012 | 8.53 | 0.05 | 1.66 | 1.71 | (0.18 | ) | – | |||||||||||||||||
Year ended September 30, 2011 | 8.08 | 0.04 | 0.50 | 0.54 | (0.09 | ) | – | |||||||||||||||||
Class A | ||||||||||||||||||||||||
Year ended September 30, 2013 | 10.24 | 0.14 | 1.03 | 1.17 | (0.18 | ) | – | |||||||||||||||||
Year ended September 30, 2012 | 8.68 | 0.11 | 1.68 | 1.79 | (0.23 | ) | – | |||||||||||||||||
Year ended September 30, 2011 | 8.08 | 0.11 | 0.58 | 0.69 | (0.09 | ) | – | |||||||||||||||||
| 74 | FINANCIAL HIGHLIGHTS |
Table of Contents
| distributions | Ratio of expenses to average net assets | Ratio of net investment income/(loss) to average net assets | ||||||||||||||||||||||||||||||||
| Total dividends and distributions | Net asset value, end of period | Total return* | Net assets, end of period (in thousands) | Before expense limitation/ and transfer agent earnings credits | After expense limitation/ and transfer agent earnings credits | Before expense limitation/ and transfer agent earnings credits | After expense limitation/ and transfer agent earnings credits | Portfolio turnover rate(a) | ||||||||||||||||||||||||||
| $ | (0.02 | ) | $ | 14.50 | 22.91 | % | $ | 39,883 | 1.38 | % | 1.38 | %(b) | (0.21 | )% | (0.21 | )% | 87.00 | % | ||||||||||||||||
| – | 11.82 | 34.47 | % | 58,314 | 1.40 | % | 1.40 | %(b) | 0.26 | % | 0.26 | % | 91.24 | % | ||||||||||||||||||||
| – | 8.79 | 10.98 | % | 34,123 | 1.54 | % | 1.54 | %(b) | (0.23 | )% | (0.23 | )% | 107.57 | % | ||||||||||||||||||||
| (0.28 | ) | 7.92 | 20.61 | % | 17,750 | 2.02 | % | 2.02 | % | (0.62 | )% | (0.62 | )% | 194.84 | % | |||||||||||||||||||
| – | 6.83 | (5.01 | )% | 14,205 | 1.63 | % | 1.63 | % | 0.14 | % | 0.14 | % | 200.23 | % | ||||||||||||||||||||
| – | 14.05 | 21.43 | % | 473 | 3.68 | % | 2.75 | %(b) | (2.74 | )% | (1.81 | )% | 87.00 | % | ||||||||||||||||||||
| – | 11.57 | 32.68 | % | 69 | 6.01 | % | 2.75 | %(b) | (4.42 | )% | (1.16 | )% | 91.24 | % | ||||||||||||||||||||
| – | 8.72 | 10.10 | % | 32 | 13.14 | % | 2.75 | %(b) | (11.73 | )% | (1.34 | )% | 107.57 | % | ||||||||||||||||||||
| – | 14.25 | 22.42 | % | 4,699 | 1.78 | % | 1.78 | %(b) | (0.66 | )% | (0.66 | )% | 87.00 | % | ||||||||||||||||||||
| – | 11.65 | 33.03 | % | 1,542 | 1.78 | % | 1.78 | %(b) | (0.20 | )% | (0.20 | )% | 91.24 | % | ||||||||||||||||||||
| – | 8.75 | 10.48 | % | 11 | 18.49 | % | 1.98 | %(b) | (17.17 | )% | (0.66 | )% | 107.57 | % | ||||||||||||||||||||
| (0.21 | ) | 11.18 | 11.75 | % | 33,813 | 1.51 | % | 1.51 | %(b) | 1.92 | % | 1.92 | % | 90.51 | % | |||||||||||||||||||
| (0.24 | ) | 10.20 | 21.50 | % | 37,567 | 1.55 | % | 1.51 | %(b) | 1.40 | % | 1.44 | % | 81.81 | % | |||||||||||||||||||
| (0.09 | ) | 8.61 | 7.64 | % | 20,614 | 1.57 | % | 1.50 | %(b) | 1.03 | % | 1.10 | % | 109.56 | % | |||||||||||||||||||
| (0.08 | ) | 8.08 | 11.56 | % | 30,640 | 1.54 | % | 1.54 | % | 0.98 | % | 0.98 | % | 86.31 | % | |||||||||||||||||||
| – | (c) | 7.32 | (0.64 | )% | 26,074 | 1.58 | % | 1.58 | % | 0.72 | % | 0.72 | % | 134.29 | % | |||||||||||||||||||
| (0.11 | ) | 11.02 | 10.69 | % | 1,738 | 2.61 | % | 2.50 | %(b) | 0.61 | % | 0.72 | % | 90.51 | % | |||||||||||||||||||
| (0.18 | ) | 10.06 | 20.26 | % | 934 | 3.33 | % | 2.51 | %(b) | (0.35 | )% | 0.47 | % | 81.81 | % | |||||||||||||||||||
| (0.09 | ) | 8.53 | 6.65 | % | 55 | 7.00 | % | 2.50 | %(b) | (4.09 | )% | 0.41 | % | 109.56 | % | |||||||||||||||||||
| (0.18 | ) | 11.23 | 11.52 | % | 2,744 | 1.84 | % | 1.75 | %(b) | 1.20 | % | 1.29 | % | 90.51 | % | |||||||||||||||||||
| (0.23 | ) | 10.24 | 20.94 | % | 1,499 | 2.05 | % | 1.77 | %(b) | 0.82 | % | 1.10 | % | 81.81 | % | |||||||||||||||||||
| (0.09 | ) | 8.68 | 8.52 | % | 24 | 7.60 | % | 1.75 | %(b) | (4.60 | )% | 1.25 | % | 109.56 | % | |||||||||||||||||||
| FINANCIAL HIGHLIGHTS | 75 |
Table of Contents
FINANCIAL HIGHLIGHTS (CONTINUED)
| Income/(loss) from investment operations | Less dividends and | |||||||||||||||||||||||
| Net asset value, beginning of period | Net investment income/ (loss)(x) | Net realized and unrealized gains/(losses) on investments | Total from investment operations | Dividends from net investment income | Distributions from net realized gains | |||||||||||||||||||
ICON Energy Fund | ||||||||||||||||||||||||
Class S | ||||||||||||||||||||||||
Year ended September 30, 2013 | $ | 19.18 | $ | 0.18 | $ | 3.51 | �� | $ | 3.69 | $ | (0.28 | ) | $ | – | ||||||||||
Year ended September 30, 2012 | 16.64 | 0.16 | 2.93 | 3.09 | (0.15 | ) | (0.40 | ) | ||||||||||||||||
Year ended September 30, 2011 | 16.69 | 0.16 | – | 0.16 | (0.21 | ) | – | |||||||||||||||||
Year ended September 30, 2010 | 16.92 | 0.21 | (0.23 | ) | (0.02 | ) | (0.21 | ) | – | |||||||||||||||
Year ended September 30, 2009 | 27.06 | 0.21 | (2.41 | ) | (2.20 | ) | (0.12 | ) | (7.82 | ) | ||||||||||||||
Class C | ||||||||||||||||||||||||
Year ended September 30, 2013 | 18.87 | (0.05 | ) | 3.48 | 3.43 | (0.09 | ) | – | ||||||||||||||||
Year ended September 30, 2012 | 16.47 | (0.04 | ) | 2.88 | 2.84 | (0.04 | ) | (0.40 | ) | |||||||||||||||
Year ended September 30, 2011 | 16.69 | (0.10 | ) | 0.09 | (0.01 | ) | (0.21 | ) | – | |||||||||||||||
Class A | ||||||||||||||||||||||||
Year ended September 30, 2013 | 19.12 | 0.11 | 3.51 | 3.62 | (0.24 | ) | – | |||||||||||||||||
Year ended September 30, 2012 | 16.59 | 0.11 | 2.91 | 3.02 | (0.09 | ) | (0.40 | ) | ||||||||||||||||
Year ended September 30, 2011 | 16.69 | 0.08 | 0.03 | 0.11 | (0.21 | ) | – | |||||||||||||||||
ICON Financial Fund | ||||||||||||||||||||||||
Class S | ||||||||||||||||||||||||
Year ended September 30, 2013 | 6.04 | 0.04 | 1.44 | 1.48 | (0.05 | ) | – | |||||||||||||||||
Year ended September 30, 2012 | 4.69 | 0.04 | 1.34 | 1.38 | (0.03 | ) | – | |||||||||||||||||
Year ended September 30, 2011 | 5.55 | 0.03 | (0.87 | ) | (0.84 | ) | (0.02 | ) | – | |||||||||||||||
Year ended September 30, 2010 | 5.97 | 0.02 | (0.32 | ) | (0.30 | ) | (0.12 | ) | – | |||||||||||||||
Year ended September 30, 2009 | 8.55 | 0.09 | (2.43 | ) | (2.34 | ) | (0.24 | ) | – | |||||||||||||||
Class C | ||||||||||||||||||||||||
Year ended September 30, 2013 | 5.91 | (0.03 | ) | 1.39 | 1.36 | (0.07 | ) | – | ||||||||||||||||
Year ended September 30, 2012 | 4.64 | (0.02 | ) | 1.31 | 1.29 | (0.02 | ) | – | ||||||||||||||||
Year ended September 30, 2011 | 5.55 | (0.02 | ) | (0.87 | ) | (0.89 | ) | (0.02 | ) | – | ||||||||||||||
Class A | ||||||||||||||||||||||||
Year ended September 30, 2013 | 5.99 | 0.06 | 1.38 | 1.44 | (0.06 | ) | – | |||||||||||||||||
Year ended September 30, 2012 | 4.68 | 0.01 | 1.33 | 1.34 | (0.03 | ) | – | |||||||||||||||||
Year ended September 30, 2011 | 5.55 | 0.01 | (0.86 | ) | (0.85 | ) | (0.02 | ) | – | |||||||||||||||
| 76 | FINANCIAL HIGHLIGHTS |
Table of Contents
| distributions | Ratio of expenses to average net assets | Ratio of net investment income/(loss) to average net assets | ||||||||||||||||||||||||||||||||
| Total dividends and distributions | Net asset value, end of period | Total return* | Net assets, end of period (in thousands) | Before expense limitation/ and transfer agent earnings credits | After expense limitation/ and transfer agent earnings credits | Before expense limitation/ and transfer agent earnings credits | After expense limitation/ and transfer agent earnings credits | Portfolio turnover rate(a) | ||||||||||||||||||||||||||
| $ | (0.28 | ) | $ | 22.59 | 19.55 | % | $ | 659,581 | 1.29 | % | 1.29 | %(b) | 0.85 | % | 0.85 | % | 88.16 | % | ||||||||||||||||
| (0.55 | ) | 19.18 | 18.87 | % | 567,054 | 1.23 | % | 1.23 | %(b) | 0.87 | % | 0.87 | % | 74.41 | % | |||||||||||||||||||
| (0.21 | ) | 16.64 | 0.80 | % | 556,393 | 1.20 | % | 1.20 | %(b) | 0.77 | % | 0.77 | % | 88.31 | % | |||||||||||||||||||
| (0.21 | ) | 16.69 | (0.17 | )% | 510,181 | 1.24 | % | 1.24 | % | 1.26 | % | 1.26 | % | 169.86 | % | |||||||||||||||||||
| (7.94 | ) | 16.92 | (1.73 | )% | 560,555 | 1.24 | % | 1.24 | % | 1.39 | % | 1.39 | % | 186.47 | % | |||||||||||||||||||
| (0.09 | ) | 22.21 | 18.30 | % | 14,691 | 2.35 | % | 2.35 | %(b) | (0.25 | )% | (0.25 | )% | 88.16 | % | |||||||||||||||||||
| (0.44 | ) | 18.87 | 17.50 | % | 8,257 | 2.36 | % | 2.36 | %(b) | (0.20 | )% | (0.20 | )% | 74.41 | % | |||||||||||||||||||
| (0.21 | ) | 16.47 | (0.23 | )% | 4,718 | 2.47 | % | 2.47 | %(b) | (0.47 | )% | (0.47 | )% | 88.31 | % | |||||||||||||||||||
| (0.24 | ) | 22.50 | 19.21 | % | 26,170 | 1.61 | % | 1.61 | %(b) | 0.51 | % | 0.51 | % | 88.16 | % | |||||||||||||||||||
| (0.49 | ) | 19.12 | 18.47 | % | 15,836 | 1.55 | % | 1.55 | %(b) | 0.61 | % | 0.61 | % | 74.41 | % | |||||||||||||||||||
| (0.21 | ) | 16.59 | 0.49 | % | 6,005 | 1.70 | % | 1.70 | %(b) | 0.38 | % | 0.38 | % | 88.31 | % | |||||||||||||||||||
| (0.05 | ) | 7.47 | 24.68 | % | 11,853 | 1.47 | % | 1.47 | %(b) | 0.65 | % | 0.65 | % | 95.21 | % | |||||||||||||||||||
| (0.03 | ) | 6.04 | 29.54 | % | 27,696 | 1.39 | % | 1.39 | %(b) | 0.70 | % | 0.70 | % | 95.47 | % | |||||||||||||||||||
| (0.02 | ) | 4.69 | (15.18 | )% | 32,432 | 1.40 | % | 1.40 | %(b) | 0.44 | % | 0.44 | % | 100.23 | % | |||||||||||||||||||
| (0.12 | ) | 5.55 | (5.11 | )% | 58,750 | 1.43 | % | 1.43 | % | 0.36 | % | 0.36 | % | 143.36 | % | |||||||||||||||||||
| (0.24 | ) | 5.97 | (26.80 | )% | 82,067 | 1.42 | % | 1.42 | % | 1.70 | % | 1.70 | % | 194.00 | % | |||||||||||||||||||
| (0.07 | ) | 7.20 | 23.18 | % | 296 | 3.19 | % | 2.51 | %(b) | (1.07 | )% | (0.40 | )% | 95.21 | % | |||||||||||||||||||
| (0.02 | ) | 5.91 | 27.79 | % | 3 | 23.96 | % | 2.51 | %(b) | (21.84 | )% | (0.39 | )% | 95.47 | % | |||||||||||||||||||
| (0.02 | ) | 4.64 | (16.08 | )% | 9 | 35.28 | % | 2.50 | %(b) | (33.22 | )% | (0.44 | )% | 100.23 | % | |||||||||||||||||||
| (0.06 | ) | 7.37 | 24.20 | % | 936 | 1.88 | % | 1.76 | %(b) | 0.82 | % | 0.94 | % | 95.21 | % | |||||||||||||||||||
| (0.03 | ) | 5.99 | 28.83 | % | 9,278 | 1.80 | % | 1.77 | %(b) | 0.09 | % | 0.12 | % | 95.47 | % | |||||||||||||||||||
| (0.02 | ) | 4.68 | (15.36 | )% | 24 | 7.37 | % | 1.75 | %(b) | (5.50 | )% | 0.12 | % | 100.23 | % | |||||||||||||||||||
| FINANCIAL HIGHLIGHTS | 77 |
Table of Contents
FINANCIAL HIGHLIGHTS (CONTINUED)
| Income/(loss) from investment operations | Less dividends and | |||||||||||||||||||||||
| Net asset value, beginning of period | Net investment income/ (loss)(x) | Net realized and unrealized gains/(losses) on investments | Total from investment operations | Dividends from net investment income | Distributions from net realized gains | |||||||||||||||||||
ICON Healthcare Fund | ||||||||||||||||||||||||
Class S | ||||||||||||||||||||||||
Year ended September 30, 2013 | $ | 17.56 | $ | 0.03 | $ | 4.75 | $ | 4.78 | $ | (0.17 | ) | $ | – | |||||||||||
Year ended September 30, 2012 | 13.56 | 0.17 | 3.97 | 4.14 | (0.14 | ) | – | |||||||||||||||||
Year ended September 30, 2011 | 12.78 | 0.12 | 0.73 | 0.85 | (0.07 | ) | – | |||||||||||||||||
Year ended September 30, 2010 | 12.29 | 0.04 | 0.63 | 0.67 | (0.18 | ) | – | |||||||||||||||||
Year ended September 30, 2009 | 13.49 | 0.08 | (1.28 | ) | (1.20 | ) | – | – | ||||||||||||||||
Class C | ||||||||||||||||||||||||
Year ended September 30, 2013 | 17.21 | (0.21 | ) | 4.67 | 4.46 | (0.12 | ) | – | ||||||||||||||||
Year ended September 30, 2012 | 13.43 | (0.01 | ) | 3.91 | 3.90 | (0.12 | ) | – | ||||||||||||||||
Year ended September 30, 2011 | 12.78 | (0.01 | ) | 0.73 | 0.72 | (0.07 | ) | – | ||||||||||||||||
Class A | ||||||||||||||||||||||||
Year ended September 30, 2013 | 17.42 | (0.03 | ) | 4.69 | 4.66 | (0.16 | ) | – | ||||||||||||||||
Year ended September 30, 2012 | 13.53 | 0.11 | 3.94 | 4.05 | (0.16 | ) | – | |||||||||||||||||
Year ended September 30, 2011 | 12.78 | 0.12 | 0.70 | 0.82 | (0.07 | ) | – | |||||||||||||||||
ICON Industrials Fund | ||||||||||||||||||||||||
Class S | ||||||||||||||||||||||||
Year ended September 30, 2013 | 8.26 | 0.06 | 2.35 | 2.41 | (0.11 | ) | – | |||||||||||||||||
Year ended September 30, 2012 | 6.80 | 0.07 | 1.48 | 1.55 | (0.09 | ) | – | |||||||||||||||||
Year ended September 30, 2011 | 7.47 | 0.07 | (0.67 | ) | (0.60 | ) | (0.07 | ) | – | |||||||||||||||
Year ended September 30, 2010 | 6.38 | 0.05 | 1.17 | 1.22 | (0.13 | ) | – | |||||||||||||||||
Year ended September 30, 2009 | 8.16 | 0.08 | (1.82 | ) | (1.74 | ) | (0.04 | ) | – | |||||||||||||||
Class C | ||||||||||||||||||||||||
Year ended September 30, 2013 | 8.12 | (0.06 | ) | 2.35 | 2.29 | – | – | |||||||||||||||||
Year ended September 30, 2012 | 6.72 | (0.01 | ) | 1.46 | 1.45 | (0.05 | ) | – | ||||||||||||||||
Year ended September 30, 2011 | 7.47 | (0.02 | ) | (0.66 | ) | (0.68 | ) | (0.07 | ) | – | ||||||||||||||
Class A | ||||||||||||||||||||||||
Year ended September 30, 2013 | 8.10 | – | (c) | 2.36 | 2.36 | (0.01 | ) | – | ||||||||||||||||
Year ended September 30, 2012 | 6.76 | 0.08 | 1.35 | 1.43 | (0.09 | ) | – | |||||||||||||||||
Year ended September 30, 2011 | 7.47 | 0.05 | (0.69 | ) | (0.64 | ) | (0.07 | ) | – | |||||||||||||||
| 78 | FINANCIAL HIGHLIGHTS |
Table of Contents
| distributions | Ratio of expenses to average net assets | Ratio of net investment income/(loss) to average net assets | ||||||||||||||||||||||||||||||||
| Total dividends and distributions | Net asset value, end of period | Total return* | Net assets, end of period (in thousands) | Before expense limitation/ and transfer agent earnings credits | After expense limitation/ and transfer agent earnings credits | Before expense limitation/ and transfer agent earnings credits | After expense limitation/ and transfer agent earnings credits | Portfolio turnover rate(a) | ||||||||||||||||||||||||||
| $ | (0.17 | ) | $ | 22.17 | 27.48 | % | $ | 92,171 | 1.39 | % | 1.39 | %(b) | 0.13 | % | 0.13 | % | 111.86 | % | ||||||||||||||||
| (0.14 | ) | 17.56 | 30.76 | % | 100,938 | 1.34 | % | 1.34 | %(b) | 1.08 | % | 1.08 | % | 47.59 | % | |||||||||||||||||||
| (0.07 | ) | 13.56 | 6.66 | % | 75,116 | 1.36 | % | 1.36 | %(b) | 0.85 | % | 0.85 | % | 83.63 | % | |||||||||||||||||||
| (0.18 | ) | 12.78 | 5.39 | % | 72,554 | 1.36 | % | 1.36 | % | 0.31 | % | 0.31 | % | 102.42 | % | |||||||||||||||||||
| – | 12.29 | (8.90 | )% | 110,605 | 1.37 | % | 1.37 | % | 0.74 | % | 0.74 | % | 105.75 | % | ||||||||||||||||||||
| (0.12 | ) | 21.55 | 26.11 | % | 259 | 4.42 | % | 2.50 | %(b) | (2.98 | )% | (1.06 | )% | 111.86 | % | |||||||||||||||||||
| (0.12 | ) | 17.21 | 29.24 | % | 103 | 11.81 | % | 2.51 | %(b) | (9.38 | )% | (0.08 | )% | 47.59 | % | |||||||||||||||||||
| (0.07 | ) | 13.43 | 5.64 | % | 22 | 31.38 | % | 2.50 | %(b) | (28.98 | )% | (0.10 | )% | 83.63 | % | |||||||||||||||||||
| (0.16 | ) | 21.92 | 26.95 | % | 3,748 | 1.69 | % | 1.69 | %(b) | (0.15 | )% | (0.15 | )% | 111.86 | % | |||||||||||||||||||
| (0.16 | ) | 17.42 | 30.19 | % | 390 | 2.89 | % | 1.76 | %(b) | (0.46 | )% | 0.67 | % | 47.59 | % | |||||||||||||||||||
| (0.07 | ) | 13.53 | 6.42 | % | 126 | 7.15 | % | 1.75 | %(b) | (4.58 | )% | 0.82 | % | 83.63 | % | |||||||||||||||||||
| (0.11 | ) | 10.56 | 29.52 | % | 34,409 | 1.46 | % | 1.46 | %(b) | 0.60 | % | 0.60 | % | 45.66 | % | |||||||||||||||||||
| (0.09 | ) | 8.26 | 22.99 | % | 39,621 | 1.40 | % | 1.40 | %(b) | 0.91 | % | 0.91 | % | 33.73 | % | |||||||||||||||||||
| (0.07 | ) | 6.80 | (8.21 | )% | 50,653 | 1.36 | % | 1.36 | %(b) | 0.80 | % | 0.80 | % | 55.87 | % | |||||||||||||||||||
| (0.13 | ) | 7.47 | 19.40 | % | 71,607 | 1.40 | % | 1.40 | % | 0.73 | % | 0.73 | % | 54.34 | % | |||||||||||||||||||
| (0.04 | ) | 6.38 | (21.25 | )% | 70,535 | 1.37 | % | 1.37 | % | 1.39 | % | 1.39 | % | 96.24 | % | |||||||||||||||||||
| – | 10.41 | 28.20 | % | 87 | 9.86 | % | 2.50 | %(b) | (8.02 | )% | (0.66 | )% | 45.66 | % | ||||||||||||||||||||
| (0.05 | ) | 8.12 | 21.58 | % | 12 | 13.40 | % | 2.51 | %(b) | (11.07 | )% | (0.18 | )% | 33.73 | % | |||||||||||||||||||
| (0.07 | ) | 6.72 | (9.29 | )% | 15 | 13.56 | % | 2.50 | %(b) | (11.29 | )% | (0.23 | )% | 55.87 | % | |||||||||||||||||||
| (0.01 | ) | 10.45 | 29.20 | % | 4,322 | 2.09 | % | 1.75 | %(b) | (0.32 | )% | 0.02 | % | 45.66 | % | |||||||||||||||||||
| (0.09 | ) | 8.10 | 21.21 | % | 163 | 2.50 | % | 1.75 | %(b) | 0.18 | % | 0.93 | % | 33.73 | % | |||||||||||||||||||
| (0.07 | ) | 6.76 | (8.75 | )% | 122 | 3.46 | % | 1.75 | %(b) | (1.12 | )% | 0.59 | % | 55.87 | % | |||||||||||||||||||
| FINANCIAL HIGHLIGHTS | 79 |
Table of Contents
FINANCIAL HIGHLIGHTS (CONTINUED)
| Income/(loss) from investment operations | Less dividends and | |||||||||||||||||||||||
| Net asset value, beginning of period | Net investment income/ (loss)(x) | Net realized and unrealized gains/(losses) on investments | Total from investment operations | Dividends from net investment income | Distributions from net realized gains | |||||||||||||||||||
ICON Information Technology Fund | ||||||||||||||||||||||||
Class S | ||||||||||||||||||||||||
Year ended September 30, 2013 | $ | 10.72 | $ | (0.02 | ) | $ | 0.74 | $ | 0.72 | $ | – | $ | – | |||||||||||
Year ended September 30, 2012 | 8.22 | (0.02 | ) | 2.52 | 2.50 | – | – | |||||||||||||||||
Year ended September 30, 2011 | 8.05 | (0.04 | ) | 0.21 | 0.17 | – | – | |||||||||||||||||
Year ended September 30, 2010 | 7.79 | (0.05 | ) | 0.35 | 0.30 | (0.04 | ) | – | ||||||||||||||||
Year ended September 30, 2009 | 7.86 | (0.01 | ) | (0.06 | ) | (0.07 | ) | – | – | |||||||||||||||
Class C | ||||||||||||||||||||||||
Year ended September 30, 2013 | 10.49 | (0.14 | ) | 0.72 | 0.58 | – | – | |||||||||||||||||
Year ended September 30, 2012 | 8.13 | (0.13 | ) | 2.49 | 2.36 | – | – | |||||||||||||||||
Year ended September 30, 2011 | 8.05 | (0.13 | ) | 0.21 | 0.08 | – | – | |||||||||||||||||
Class A | ||||||||||||||||||||||||
Year ended September 30, 2013 | 10.65 | (0.05 | ) | 0.70 | 0.65 | – | – | |||||||||||||||||
Year ended September 30, 2012 | 8.20 | (0.06 | ) | 2.51 | 2.45 | – | – | |||||||||||||||||
Year ended September 30, 2011 | 8.05 | (0.05 | ) | 0.20 | 0.15 | – | – | |||||||||||||||||
ICON Materials Fund | ||||||||||||||||||||||||
Class S | ||||||||||||||||||||||||
Year ended September 30, 2013 | 11.12 | 0.09 | 2.40 | 2.49 | (0.18 | ) | – | |||||||||||||||||
Year ended September 30, 2012 | 9.00 | 0.11 | 2.11 | 2.22 | (0.10 | ) | – | |||||||||||||||||
Year ended September 30, 2011 | 10.06 | 0.08 | (1.08 | ) | (1.00 | ) | (0.06 | ) | – | |||||||||||||||
Year ended September 30, 2010 | 8.93 | 0.05 | 1.18 | 1.23 | (0.10 | ) | – | |||||||||||||||||
Year ended September 30, 2009 | 9.81 | 0.11 | (0.91 | ) | (0.80 | ) | (0.08 | ) | – | |||||||||||||||
Class C | ||||||||||||||||||||||||
Year ended September 30, 2013 | 10.94 | (0.04 | ) | 2.38 | 2.34 | (0.04 | ) | – | ||||||||||||||||
Year ended September 30, 2012 | 8.92 | – | (c) | 2.08 | 2.08 | (0.06 | ) | – | ||||||||||||||||
Year ended September 30, 2011 | 10.06 | (0.03 | ) | (1.05 | ) | (1.08 | ) | (0.06 | ) | – | ||||||||||||||
Class A | ||||||||||||||||||||||||
Year ended September 30, 2013 | 11.07 | 0.05 | 2.38 | 2.43 | (0.14 | ) | – | |||||||||||||||||
Year ended September 30, 2012 | 8.97 | 0.08 | 2.10 | 2.18 | (0.08 | ) | – | |||||||||||||||||
Year ended September 30, 2011 | 10.06 | 0.05 | (1.08 | ) | (1.03 | ) | (0.06 | ) | – | |||||||||||||||
| 80 | FINANCIAL HIGHLIGHTS |
Table of Contents
| distributions | Ratio of expenses to average net assets | Ratio of net investment income/(loss) to average net assets | ||||||||||||||||||||||||||||||||
| Total dividends and distributions | Net asset value, end of period | Total return* | Net assets, end of period (in thousands) | Before expense limitation/ and transfer agent earnings credits | After expense limitation/ and transfer agent earnings credits | Before expense limitation/ and transfer agent earnings credits | After expense limitation/ and transfer agent earnings credits | Portfolio turnover rate(a) | ||||||||||||||||||||||||||
| $ | – | $ | 11.44 | 6.72 | % | $ | 73,851 | 1.38 | % | 1.38 | %(b) | (0.22 | )% | (0.22 | )% | 51.71 | % | |||||||||||||||||
| – | 10.72 | 30.41 | % | 83,330 | 1.34 | % | 1.34 | %(b) | (0.20 | )% | (0.20 | )% | 35.22 | % | ||||||||||||||||||||
| – | 8.22 | 2.11 | % | 61,081 | 1.34 | % | 1.34 | %(b) | (0.40 | )% | (0.40 | )% | 44.84 | % | ||||||||||||||||||||
| (0.04 | ) | 8.05 | 3.91 | % | 77,269 | 1.37 | % | 1.37 | % | (0.58 | )% | (0.58 | )% | 68.32 | % | |||||||||||||||||||
| – | 7.79 | (0.89 | )% | 119,250 | 1.38 | % | 1.38 | % | (0.09 | )% | (0.09 | )% | 89.87 | % | ||||||||||||||||||||
| – | 11.07 | 5.53 | % | 315 | 3.31 | % | 2.50 | %(b) | (2.16 | )% | (1.36 | )% | 51.71 | % | ||||||||||||||||||||
| – | 10.49 | 29.03 | % | 294 | 4.46 | % | 2.50 | %(b) | (3.22 | )% | (1.26 | )% | 35.22 | % | ||||||||||||||||||||
| – | 8.13 | 0.99 | % | 1 | 115.00 | % | 2.51 | %(b) | (113.96 | )% | (1.47 | )% | 44.84 | % | ||||||||||||||||||||
| – | 11.30 | 6.10 | % | 2,330 | 2.23 | % | 1.75 | %(b) | (0.94 | )% | (0.45 | )% | 51.71 | % | ||||||||||||||||||||
| – | 10.65 | 29.88 | % | 1,400 | 2.87 | % | 1.75 | %(b) | (1.71 | )% | (0.59 | )% | 35.22 | % | ||||||||||||||||||||
| – | 8.20 | 1.86 | % | 1 | 215.56 | % | 1.75 | %(b) | (214.36 | )% | (0.55 | )% | 44.84 | % | ||||||||||||||||||||
| (0.18 | ) | 13.43 | 22.73 | % | 65,782 | 1.45 | % | 1.45 | %(b) | 0.72 | % | 0.72 | % | 55.66 | % | |||||||||||||||||||
| (0.10 | ) | 11.12 | 24.85 | % | 41,627 | 1.39 | % | 1.39 | %(b) | 1.00 | % | 1.00 | % | 40.89 | % | |||||||||||||||||||
| (0.06 | ) | 9.00 | (10.07 | )% | 59,068 | 1.33 | % | 1.33 | %(b) | 0.73 | % | 0.73 | % | 62.97 | % | |||||||||||||||||||
| (0.10 | ) | 10.06 | 13.92 | % | 87,856 | 1.38 | % | 1.38 | % | 0.54 | % | 0.54 | % | 70.80 | % | |||||||||||||||||||
| (0.08 | ) | 8.93 | (7.87 | )% | 95,028 | 1.40 | % | 1.40 | % | 1.50 | % | 1.50 | % | 134.88 | % | |||||||||||||||||||
| (0.04 | ) | 13.24 | 21.43 | % | 218 | 4.12 | % | 2.50 | %(b) | (1.95 | )% | (0.33 | )% | 55.66 | % | |||||||||||||||||||
| (0.06 | ) | 10.94 | 23.36 | % | 195 | 4.29 | % | 2.51 | %(b) | (1.82 | )% | (0.04 | )% | 40.89 | % | |||||||||||||||||||
| (0.06 | ) | 8.92 | (10.87 | )% | 120 | 4.11 | % | 2.50 | %(b) | (1.91 | )% | (0.30 | )% | 62.97 | % | |||||||||||||||||||
| (0.14 | ) | 13.36 | 22.24 | % | 1,883 | 2.02 | % | 1.75 | %(b) | 0.17 | % | 0.44 | % | 55.66 | % | |||||||||||||||||||
| (0.08 | ) | 11.07 | 24.44 | % | 539 | 2.12 | % | 1.76 | %(b) | 0.34 | % | 0.70 | % | 40.89 | % | |||||||||||||||||||
| (0.06 | ) | 8.97 | (10.37 | )% | 487 | 2.26 | % | 1.74 | %(b) | (0.07 | )% | 0.45 | % | 62.97 | % | |||||||||||||||||||
| FINANCIAL HIGHLIGHTS | 81 |
Table of Contents
FINANCIAL HIGHLIGHTS (CONTINUED)
| Income/(loss) from investment operations | Less dividends and | |||||||||||||||||||||||
| Net asset value, beginning of period | Net investment income/ (loss)(x) | Net realized and unrealized gains/(losses) on investments | Total from investment operations | Dividends from net investment income | Distributions from net realized gains | |||||||||||||||||||
ICON Utilities Fund | ||||||||||||||||||||||||
Class S | ||||||||||||||||||||||||
Year ended September 30, 2013 | $ | 6.81 | $ | 0.20 | $ | 0.43 | $ | 0.63 | $ | (0.22 | ) | $ | – | |||||||||||
Year ended September 30, 2012 | 6.29 | 0.20 | 0.55 | 0.75 | (0.23 | ) | – | |||||||||||||||||
Year ended September 30, 2011 | 6.15 | 0.24 | 0.31 | 0.55 | (0.41 | ) | – | |||||||||||||||||
Year ended September 30, 2010 | 5.66 | 0.19 | 0.44 | 0.63 | (0.14 | ) | – | |||||||||||||||||
Year ended September 30, 2009 | 6.34 | 0.14 | (0.44 | ) | (0.30 | ) | (0.38 | ) | – | |||||||||||||||
Class C | ||||||||||||||||||||||||
Year ended September 30, 2013 | 6.72 | 0.13 | 0.42 | 0.55 | (0.15 | ) | – | |||||||||||||||||
Year ended September 30, 2012 | 6.21 | 0.14 | 0.57 | 0.71 | (0.20 | ) | – | |||||||||||||||||
Year ended September 30, 2011 | 6.15 | 0.25 | 0.22 | 0.47 | (0.41 | ) | – | |||||||||||||||||
Class A | ||||||||||||||||||||||||
Year ended September 30, 2013 | 6.73 | 0.18 | 0.42 | 0.60 | (0.19 | ) | – | |||||||||||||||||
Year ended September 30, 2012 | 6.24 | 0.20 | 0.53 | 0.73 | (0.24 | ) | – | |||||||||||||||||
Year ended September 30, 2011 | 6.15 | 0.34 | 0.17 | 0.51 | (0.42 | ) | – | |||||||||||||||||
| (x) | Calculated using the average shares method. |
| * | The total return calculation is for the period indicated and excludes any sales charges. |
| (a) | Portfolio turnover is calculated at the Fund level and is not annualized for periods less than a year. |
| (b) | The Fund’s operating expenses, not including interest expense, are contractually limited to the amounts discussed in Note 3. The ratios in these financial highlights reflect the limitation, including the interest expense. |
| (c) | Amount less than $0.005. |
The accompanying notes are an integral part of the financial statements.
| 82 | FINANCIAL HIGHLIGHTS |
Table of Contents
| distributions | Ratio of expenses to average net assets | Ratio of net investment income/(loss) to average net assets | ||||||||||||||||||||||||||||||||
| Total dividends and distributions | Net asset value, end of period | Total return* | Net assets, end of period (in thousands) | Before expense limitation/ and transfer agent earnings credits | After expense limitation/ and transfer agent earnings credits | Before expense limitation/ and transfer agent earnings credits | After expense limitation/ and transfer agent earnings credits | Portfolio turnover rate(a) | ||||||||||||||||||||||||||
| $ | (0.22 | ) | $ | 7.22 | 9.25 | % | $ | 29,117 | 1.62 | % | 1.51 | %(b) | 2.71 | % | 2.81 | % | 121.14 | % | ||||||||||||||||
| (0.23 | ) | 6.81 | 12.01 | % | 23,524 | 1.53 | % | 1.51 | %(b) | 3.00 | % | 3.02 | % | 50.92 | % | |||||||||||||||||||
| (0.41 | ) | 6.29 | 9.16 | % | 21,313 | 1.61 | % | 1.51 | %(b) | 3.75 | % | 3.85 | % | 114.73 | % | |||||||||||||||||||
| (0.14 | ) | 6.15 | 11.16 | % | 32,036 | 1.67 | % | 1.67 | % | 3.28 | % | 3.28 | % | 84.45 | % | |||||||||||||||||||
| (0.38 | ) | 5.66 | (4.39 | )% | 22,547 | 1.70 | % | 1.70 | % | 2.70 | % | 2.70 | % | 90.27 | % | |||||||||||||||||||
| (0.15 | ) | 7.12 | 8.16 | % | 2,834 | 2.47 | % | 2.47 | %(b) | 1.89 | % | 1.89 | % | 121.14 | % | |||||||||||||||||||
| (0.20 | ) | 6.72 | 11.53 | % | 3,256 | 2.47 | % | 2.47 | %(b) | 2.17 | % | 2.17 | % | 50.92 | % | |||||||||||||||||||
| (0.41 | ) | 6.21 | 7.77 | % | 24 | 122.08 | % | 2.50 | %(b) | (115.58 | )% | 4.00 | % | 114.73 | % | |||||||||||||||||||
| (0.19 | ) | 7.14 | 8.96 | % | 2,402 | 1.74 | % | 1.74 | %(b) | 2.55 | % | 2.55 | % | 121.14 | % | |||||||||||||||||||
| (0.24 | ) | 6.73 | 11.81 | % | 7,113 | 1.70 | % | 1.70 | %(b) | 3.03 | % | 3.03 | % | 50.92 | % | |||||||||||||||||||
| (0.42 | ) | 6.24 | 8.56 | % | 449 | 185.34 | % | 1.75 | %(b) | (178.27 | )% | 5.32 | % | 114.73 | % | |||||||||||||||||||
| FINANCIAL HIGHLIGHTS | 83 |
Table of Contents
SEPTEMBER 30, 2013
1. Organization
The ICON Consumer Discretionary Fund, ICON Consumer Staples Fund, ICON Energy Fund, ICON Financial Fund, ICON Healthcare Fund, ICON Industrials Fund, ICON Information Technology Fund, ICON Materials Fund, and ICON Utilities Fund are series funds (individually a “Fund” and collectively, the “Funds”). The Funds are part of the ICON Funds (the “Trust”), a Massachusetts business trust registered under the Investment Company Act of 1940, as amended (the “1940 Act”) as an open-end non-diversified investment management company. Each Fund offers three classes of shares: Class S, Class C and Class A. All classes have equal rights as to earnings, assets, and voting privileges except that each Class may bear different distribution fees, registration costs, legal costs, mailing and printing costs and shareholder servicing costs and each Class has exclusive voting rights with respect to its distribution plan. There are currently nine other active Funds within the Trust. Those Funds are covered by separate prospectuses and shareholder reports.
Each Fund is authorized to issue an unlimited number of no par shares. The Funds invest primarily in securities of companies whose principal business activities fall within specific sectors and industries. The investment objective of each Fund is to provide long-term capital appreciation.
The Funds may have elements of risk, including the risk of loss of principal. There is no assurance that the investment process will consistently lead to successful results. An investment in a non-diversified sector fund may involve greater risk and volatility than a more diversified fund. Investments in foreign securities and currency transactions may involve certain considerations and risks not typically associated with those of U.S. dollar-denominated transactions as a result of, among other factors, the possibility of lower government supervision and regulation of foreign securities markets and the possibility of political or economic instability. Financial statements of foreign companies are governed by different accounting, auditing, and financial standards than U.S. companies and may be less transparent and uniform than in the United States. Many corporate governance standards, which help ensure the integrity of public information in the United States, may not exist in some foreign countries. In general, there may be less governmental supervision of foreign stock exchanges and securities brokers and issuers. There are also risks associated with small-and mid-cap investing, including limited product lines, less liquidity and small market share.
| 84 | NOTESTO FINANCIAL STATEMENTS |
Table of Contents
The ICON Consumer Staples Fund has a significant weighting in the Tobacco industry, the ICON Energy Fund has a significant weighting in the Integrated Oil & Gas industry and the Oil & Gas Equipment & Services industry, the ICON Healthcare Fund has a significant weighting in the Pharmaceuticals industry, and the ICON Utilities Fund has a significant weighting in the Electric Utilities industry and the Multi-Utilities industry which may cause the Funds’ performance to be susceptible to the economic, business and/or other developments that may affect those industries.
In the normal course of business, the Funds may enter into various agreements that provide for general indemnifications. Each Fund’s maximum exposure under these arrangements is unknown as any potential exposure involving future claims that may be made against each Fund is unknown. However, based on experience, the Funds expect the risk of loss to be remote.
2. Significant Accounting Policies
The following is a summary of significant accounting policies consistently followed by the Funds in the preparation of their financial statements. The preparation of financial statements in conformity with accounting principles generally accepted in the United States of America requires management to make certain estimates and assumptions that affect the reported amounts of assets and liabilities, disclosure of contingent assets and liabilities at the date of the financial statements, and the reported amounts of income and expenses during the reporting period. Actual results may differ from these estimates.
Investment Valuation
The Funds’ securities and other assets, excluding options on securities indexes, are valued at the closing price as of the close of regular trading on the New York Stock Exchange (the “NYSE”) (normally 4 p.m. Eastern Standard Time) each day the NYSE is open, except that securities traded primarily on the NASDAQ Stock Market (“NASDAQ”) are normally valued by the Funds at the NASDAQ Official Closing Price provided by NASDAQ each business day. Options on securities indexes are valued at the close of the Chicago Board Options Exchange (normally 4:15 p.m. Eastern Standard Time) on each day the New York Stock Exchange is open for trading.
The Funds use pricing services to obtain the market value of securities in their portfolios; if a pricing service is not able to provide a price, or the
| NOTESTO FINANCIAL STATEMENTS | 85 |
Table of Contents
NOTESTO FINANCIAL STATEMENTS (CONTINUED)
pricing service’s valuation is considered inaccurate or does not in the Funds’ judgment reflect the market value of the security, prices may be obtained through market quotations from independent broker/dealers. If market quotations from these sources are not readily available, the Funds’ securities or other assets are valued at fair value as determined in good faith by the Funds’ Board of Trustees (“Board”) or pursuant to procedures approved by the Board.
Lacking any sales that day, a security is valued at the current closing bid price (or yield equivalent thereof) or based on quotes obtained from dealers making a market for the security. Options are valued at their closing mid-price on the market with the most volume. Mid-price is the average of the closing bid and closing ask prices. Debt securities with a remaining maturity of greater than 60 days are valued using the evaluated bid price supplied by the pricing service. The evaluated bid price supplied by the pricing service is based upon a matrix valuation system which considers such factors as security prices, yields, maturities and ratings. Short-term debt securities with remaining maturities of 60 days or less are generally valued at amortized cost or original cost plus accrued interest, which approximates market value. Currency rates as of the close of the NYSE are used to convert foreign security values into U.S. dollars.
Securities of investment companies that trade on an exchange are valued at the last sales price or official closing price as of the close of the customary trading session on the exchange where the security is principally traded. Investments in shares of funds that are not traded on an exchange are valued at the end of day net asset value per share of such fund. Securities in the underlying funds, including restricted securities, are valued in accordance with the valuation policy of such fund.
The Funds’ securities traded in countries outside of the Western Hemisphere are fair valued daily by utilizing the quotations of an independent pricing service, unless the Board determines that use of another valuation methodology is appropriate. The purposes of daily fair valuation are to avoid stale prices and to take into account, among other things, any significant events occurring after the close of foreign markets. The pricing service uses statistical analyses and quantitative models to adjust local market prices using factors such as subsequent movements and changes in the prices of indexes, securities and exchange rates in other markets to determine fair value as of the time a Fund calculates its net asset value (“NAV”). The valuation assigned to fair-value securities for purposes of calculating a
| 86 | NOTESTO FINANCIAL STATEMENTS |
Table of Contents
Fund’s NAV may differ from the security’s most recent closing market price and from the prices used by other mutual funds to calculate their NAVs.
Various inputs are used to determine the value of the Funds’ investments. These inputs are summarized in the three broad levels listed below:
Level 1 — quoted prices in active markets for identical securities.
Level 2 — significant observable inputs other than Level 1 quoted prices (including, but not limited to, quoted prices for similar securities, interest rates, prepayment speeds, and credit risk).
Level 3 — significant unobservable inputs.
Observable inputs are those based on market data obtained from sources independent of the Funds, and unobservable inputs reflect the Funds’ own assumptions based on the best information available. The input levels are not necessarily an indication of the risk or liquidity associated with investments at that level. For example, non-U.S. equity securities actively traded in foreign markets may be reflected in Level 2 despite the availability of closing prices, because the Funds evaluate and determine whether those closing prices reflect fair value at the close of the NYSE or require adjustment, as described above. The following table summarizes the Funds’ investments, based on the inputs used to determine their values on September 30, 2013:
| Level 1 | Level 2 | Total | ||||||||||
ICON Consumer Discretionary Fund* | ||||||||||||
Assets | ||||||||||||
Common Stocks | $ | 36,950,293 | $ | - | $ | 36,950,293 | ||||||
Collateral for Securities on Loan | - | 1,691,451 | 1,691,451 | |||||||||
Short-Term Investments | - | 7,639,702 | 7,639,702 | |||||||||
|
|
|
|
|
| |||||||
Total | $ | 36,950,293 | $ | 9,331,153 | $ | 46,281,446 | ||||||
|
|
|
|
|
| |||||||
ICON Consumer Staples Fund* | ||||||||||||
Assets | ||||||||||||
Common Stocks | $ | 37,877,880 | $ | - | $ | 37,877,880 | ||||||
Short-Term Investments | - | 338,712 | 338,712 | |||||||||
|
|
|
|
|
| |||||||
Total | $ | 37,877,880 | $ | 338,712 | $ | 38,216,592 | ||||||
|
|
|
|
|
| |||||||
| NOTESTO FINANCIAL STATEMENTS | 87 |
Table of Contents
NOTESTO FINANCIAL STATEMENTS (CONTINUED)
| Level 1 | Level 2 | Total | ||||||||||
ICON Energy Fund* | ||||||||||||
Assets | ||||||||||||
Common Stocks | $ | 668,820,920 | $ | - | $ | 668,820,920 | ||||||
Collateral for Securities on Loan | - | 5,032,720 | 5,032,720 | |||||||||
Short-Term Investments | - | 31,735,280 | 31,735,280 | |||||||||
|
|
|
|
|
| |||||||
Total | $ | 668,820,920 | $ | 36,768,000 | $ | 705,588,920 | ||||||
|
|
|
|
|
| |||||||
ICON Financial Fund* | ||||||||||||
Assets | ||||||||||||
Common Stocks | $ | 10,252,336 | $ | - | $ | 10,252,336 | ||||||
Short-Term Investments | - | 2,643,108 | 2,643,108 | |||||||||
|
|
|
|
|
| |||||||
Total | $ | 10,252,336 | $ | 2,643,108 | $ | 12,895,444 | ||||||
|
|
|
|
|
| |||||||
ICON Healthcare Fund* | ||||||||||||
Assets | ||||||||||||
Common Stocks | $ | 91,714,614 | $ | - | $ | 91,714,614 | ||||||
Collateral for Securities on Loan | - | 2,982,098 | 2,982,098 | |||||||||
Short-Term Investments | - | 6,535,856 | 6,535,856 | |||||||||
|
|
|
|
|
| |||||||
Total | $ | 91,714,614 | $ | 9,517,954 | $ | 101,232,568 | ||||||
|
|
|
|
|
| |||||||
ICON Industrials Fund* | ||||||||||||
Assets | ||||||||||||
Common Stocks | $ | 35,432,682 | $ | - | $ | 35,432,682 | ||||||
Short-Term Investments | - | 4,295,608 | 4,295,608 | |||||||||
|
|
|
|
|
| |||||||
Total | $ | 35,432,682 | $ | 4,295,608 | $ | 39,728,290 | ||||||
|
|
|
|
|
| |||||||
ICON Information Technology Fund* | ||||||||||||
Assets | ||||||||||||
Common Stocks | $ | 68,532,367 | $ | - | $ | 68,532,367 | ||||||
Short-Term Investments | - | 10,415,437 | 10,415,437 | |||||||||
|
|
|
|
|
| |||||||
Total | $ | 68,532,367 | $ | 10,415,437 | $ | 78,947,804 | ||||||
|
|
|
|
|
| |||||||
ICON Materials Fund* | ||||||||||||
Assets | ||||||||||||
Common Stocks | $ | 60,011,435 | $ | - | $ | 60,011,435 | ||||||
Short-Term Investments | - | 9,242,982 | 9,242,982 | |||||||||
|
|
|
|
|
| |||||||
Total | $ | 60,011,435 | $ | 9,242,982 | $ | 69,254,417 | ||||||
|
|
|
|
|
| |||||||
ICON Utilities Fund* | ||||||||||||
Assets | ||||||||||||
Common Stocks | $ | 34,080,299 | $ | - | $ | 34,080,299 | ||||||
Short-Term Investments | - | 101,999 | 101,999 | |||||||||
|
|
|
|
|
| |||||||
Total | $ | 34,080,299 | $ | 101,999 | $ | 34,182,298 | ||||||
|
|
|
|
|
| |||||||
| 88 | NOTESTO FINANCIAL STATEMENTS |
Table of Contents
| * | Please refer to the Schedule of Investments and the Sector/Industry Classification tables for additional security details. |
No Level 3 securities were held in any of the Funds at September 30, 2013.
For the year ended September 30, 2013, there was no transfer activity between Level 1, Level 2 or Level 3. The end of year timing recognition is used for transfers between levels of the Fund’s assets and liabilities.
Fund Share Valuation
Fund shares are sold and redeemed on a daily basis at net asset value. Net asset value per share is determined daily as of the close of trading on the NYSE on each day the NYSE is open for trading by dividing the total value of the Fund’s investments and other assets, less liabilities, by the number of Fund shares outstanding.
Foreign Currency Translation
The accounting records of the Funds are maintained in U.S. dollars. Investment securities and other assets and liabilities denominated in a foreign currency are translated daily into U.S. dollars at the prevailing rates of exchange. Income and expenses are translated into U.S. dollars at the prevailing exchange rate on the respective dates of the transactions. Purchases and sales of securities are translated into U.S. dollars at the contractual currency exchange rates established at the time of each trade.
The Funds do not isolate that portion of the results of operations resulting from changes in foreign exchange rates on investments from the fluctuations arising from changes in market prices of securities held. Net unrealized appreciation or depreciation on investments and foreign currency translations arise from changes in the value of assets and liabilities, resulting from changes in the exchange rates and changes in market prices of securities held.
Securities Lending
Under procedures adopted by the Board, the Funds may lend securities to certain approved brokers, dealers and other financial institutions to earn additional income. The Funds retain certain benefits of owning the securities, including receipt of dividends or interest generated by the security, but give up other rights including the right to vote proxies. The Funds retain the ability to recall the loans at any time and could do so in
| NOTESTO FINANCIAL STATEMENTS | 89 |
Table of Contents
NOTESTO FINANCIAL STATEMENTS (CONTINUED)
order to vote proxies or to sell the loaned securities. Each loan is collateralized by cash that generally exceeds the value of the securities on loan. The market value of the loaned securities is determined daily at the close of business of the Funds and any additional required collateral is delivered to each Fund on the next business day.
Generally, in the event of borrower default, the Funds have the right to use the collateral to offset any losses incurred. In the event the Funds are delayed or prevented from exercising their rights to dispose of the collateral, there may be a potential loss to the Funds. Some of these losses may be indemnified by the lending agent.
The Funds have elected to invest the cash collateral in the State Street Navigator Prime Portfolio which is disclosed on the Schedule of Investments. The Funds bear the risk of loss with respect to the investment of collateral. The net securities lending income earned by the Funds for the year ended September 30, 2013, is included in the Statement of Operations.
For the year ended September 30, 2013, the following Funds had securities with the following values on loan:
| Fund | Value of Loaned Securities | Value of Collateral | ||||||
ICON Consumer Discretionary Fund | $ | 1,658,952 | $ | 1,691,451 | ||||
ICON Energy Fund | 4,866,011 | 5,032,720 | ||||||
ICON Healthcare Fund | 2,796,155 | 2,982,098 | ||||||
The value of the collateral above could include collateral held for securities that were sold on or before September 30, 2013. It may also include collateral received from the pre-funding of security loans.
Income Taxes, Dividends, and Distributions
The Funds intend to continue to qualify as regulated investment companies under Subchapter M of the Internal Revenue Code and, accordingly, the Funds will generally not be subject to federal and state income taxes or federal excise taxes to the extent that they intend to make sufficient distributions of net investment income and net realized capital gains.
Dividends paid by the Funds from net investment income and distributions of net realized short-term gains are, for federal income tax purposes, taxable as ordinary income to shareholders.
| 90 | NOTESTO FINANCIAL STATEMENTS |
Table of Contents
Dividends and distributions to shareholders are recorded by the Funds on the ex-dividend/distribution date. The Funds distribute income and net realized capital gains, if any, to shareholders at least annually, if not offset by capital loss carryforward. The Funds may utilize equalization accounting for tax purposes and designate earnings and profits, including net realized gains distributed to shareholders on redemption of shares, as part of the dividends paid deduction for income tax purposes. Income distributions and capital gain distributions are determined in accordance with income tax regulations, which may differ from accounting principles generally accepted in the United States of America.
Management has analyzed the Funds’ tax positions taken on federal income tax returns for all open tax periods and has concluded that no provision for federal income tax is required in the Funds’ financial statements.
The Funds file U.S. tax returns. While the statute of limitations remains open to examine the Funds’ U.S. tax returns filed for the past three years, no examinations are in progress or anticipated at this time. The Funds are not aware of any tax positions for which it is reasonably possible that the total amounts of unrecognized tax benefits will significantly change in the next twelve months.
Certain foreign countries impose a capital gains tax which is accrued by the Funds based on the unrealized appreciation, if any, on affected securities. Any accrual would reduce a Fund’s NAV. The tax is paid when the gain is realized.
Investment Income
Dividend income is recorded on the ex-dividend date. Non-cash dividends included in dividend income, if any, are recorded at the fair value of the securities received. Interest income is accrued as earned. Certain dividends from foreign securities are recorded as soon as the Funds are informed of the dividend if such information is obtained subsequent to the ex-dividend date. Discounts and premiums on fixed income securities purchased are accreted or amortized to income over the life of the respective securities.
Investment Transactions
Security transactions are accounted for no later than one business day after the trade date. However, for financial reporting purposes, security transactions are accounted for on the trade date. Gains and losses on securities sold are determined on the basis of identified cost.
| NOTESTO FINANCIAL STATEMENTS | 91 |
Table of Contents
NOTESTO FINANCIAL STATEMENTS (CONTINUED)
Allocation of Expenses
Each class of a Fund’s shares bears expenses incurred specifically on its behalf and, in addition, each class bears a portion of general expenses, based upon relative net assets of each class. Expenses which cannot be directly attributed to a specific Fund in the Trust are apportioned between all Funds in the Trust based upon relative net assets. In calculating the net asset value per share of each class, investment income, realized and unrealized gains and losses and expenses other than class-specific expenses are allocated daily to each class of shares based upon the proportion of net assets.
Below are the class level expenses that are included on the Statement of Operations:
| Fund | Legal Expense | Printing And Postage Expense | Transfer Agent Expense | |||||||||
ICON Consumer Discretionary Fund | ||||||||||||
Class S | $ | 5,354 | $ | 13,672 | $ | 75,752 | ||||||
Class C | - | 259 | 1,175 | |||||||||
Class A | 130 | (53 | ) | 7,243 | ||||||||
ICON Consumer Staples Fund | ||||||||||||
Class S | 4,004 | 13,765 | 58,775 | |||||||||
Class C | 125 | 510 | 2,922 | |||||||||
Class A | 176 | 391 | 5,245 | |||||||||
ICON Energy Fund | ||||||||||||
Class S | 44,128 | 89,837 | 896,086 | |||||||||
Class C | 637 | 1,856 | 17,975 | |||||||||
Class A | 1,165 | 4,638 | 35,376 | |||||||||
ICON Financial Fund | ||||||||||||
Class S | 1,877 | 12,081 | 60,784 | |||||||||
Class C | 3 | 242 | 872 | |||||||||
Class A | 579 | 3,415 | 14,264 | |||||||||
ICON Healthcare Fund | ||||||||||||
Class S | 9,178 | 24,276 | 193,945 | |||||||||
Class C | 9 | 261 | 1,267 | |||||||||
Class A | 205 | 529 | 3,705 | |||||||||
ICON Industrials Fund | ||||||||||||
Class S | 2,455 | 11,101 | 49,995 | |||||||||
Class C | (1 | ) | 221 | 800 | ||||||||
Class A | (152 | ) | 337 | 1,473 | ||||||||
| 92 | NOTESTO FINANCIAL STATEMENTS |
Table of Contents
| Fund | Legal Expense | Printing And Postage Expense | Transfer Agent Expense | |||||||||
ICON Information Technology Fund | ||||||||||||
Class S | $ | 6,836 | $ | 17,193 | $ | 115,625 | ||||||
Class C | 24 | 283 | 1,280 | |||||||||
Class A | 81 | 799 | 2,363 | |||||||||
ICON Materials Fund | ||||||||||||
Class S | 1,945 | 7,975 | 91,578 | |||||||||
Class C | 9 | 262 | 1,133 | |||||||||
Class A | - | 410 | 1,773 | |||||||||
ICON Utilities Fund | ||||||||||||
Class S | 1,998 | 9,392 | 56,231 | |||||||||
Class C | 302 | 840 | 3,815 | |||||||||
Class A | 416 | 1,184 | 4,231 | |||||||||
3. Fees and Other Transactions with Affiliates
Investment Advisory Fees
ICON Advisers, Inc. (“ICON Advisers”) serves as investment adviser to the Funds and is responsible for managing the Funds’ portfolios of securities. ICON Advisers receives a monthly management fee that is computed daily at an annual rate of 1.00% on the first $500 million of average daily net assets, 0.95% on the next $250 million, 0.925% on the next $750 million, 0.90% on the next $3.5 billion, and 0.875% on average daily net assets over $5 billion.
ICON Advisers has contractually agreed to limit its Funds’ expenses (exclusive of brokerage, interest, taxes, dividends on short sales and extraordinary expenses) to the extent necessary to ensure that the Funds’ operating expenses do not exceed the following amounts:
| Fund | Class S | Class C | Class A | |||||||||
ICON Consumer Discretionary Fund | 1.74% | 2.74% | 1.99% | |||||||||
ICON Consumer Staples Fund | 1.50% | 2.50% | 1.75% | |||||||||
ICON Energy Fund | 1.50% | 2.50% | 1.75% | |||||||||
ICON Financial Fund | 1.50% | 2.50% | 1.75% | |||||||||
ICON Healthcare Fund | 1.50% | 2.50% | 1.75% | |||||||||
ICON Industrials Fund | 1.50% | 2.50% | 1.75% | |||||||||
ICON Information Technology Fund | 1.50% | 2.50% | 1.75% | |||||||||
ICON Materials Fund | 1.50% | 2.50% | 1.75% | |||||||||
ICON Utilities Fund | 1.50% | 2.50% | 1.75% | |||||||||
| NOTESTO FINANCIAL STATEMENTS | 93 |
Table of Contents
NOTESTO FINANCIAL STATEMENTS (CONTINUED)
The Funds’ expense limitations will continue in effect until at least January 31, 2014. To the extent ICON Advisers reimburses or absorbs fees and expenses, it may seek payment of such amounts for up to three years after the expenses were reimbursed or absorbed. A Fund will make no such payment, however, if the total Fund operating expenses exceed the expense limits in effect at the time the expenses were reimbursed or at the time these payments are proposed.
As of September 30, 2013 the following amounts were still available for recoupment by ICON Advisers based upon their potential expiration dates:
| Fund | 2014 | 2015 | 2016 | |||||||||
ICON Consumer Discretionary Fund | $ | 765 | $ | 1,981 | $ | 1,881 | ||||||
ICON Consumer Staples Fund | 1,583 | 6,526 | 3,344 | |||||||||
ICON Financial Fund | 1,033 | 2,094 | 8,359 | |||||||||
ICON Healthcare Fund | 1,752 | 3,689 | 3,191 | |||||||||
ICON Industrials Fund | 869 | 4,091 | 4,711 | |||||||||
ICON Information Technology Fund | 1,826 | 4,544 | 5,822 | |||||||||
ICON Materials Fund | 3,154 | 5,628 | 5,169 | |||||||||
ICON Utilities Fund | 2,715 | 5,758 | 25,930 | |||||||||
Accounting, Custody and Transfer Agent Fees
State Street Bank and Trust Company (“State Street”) serves as the fund accounting agent for the Funds. For its services, the Trust pays State Street a fee that is calculated daily and paid monthly at an annual rate based on the aggregate average daily net assets of the Trust.
State Street is the custodian of the Trust’s investments. For its services, the Trust pays State Street asset-based fees that vary according to the number of positions and transactions, plus out-of-pocket expenses.
Boston Financial Data Services, Inc. (“BFDS”) is the Trust’s transfer agent. For these services, the Trust pays a per account fee, plus certain other transaction Cusip charges and out-of-pocket expenses. BFDS may pay each Fund transfer agent earnings credits. Transfer agent earnings credits are credits received for interest which results from overnight balances used by BFDS for clearing shareholder transactions.
Administrative Services
The Trust has entered into an administrative services agreement with ICON Advisers pursuant to which ICON Advisers oversees the administration of the
| 94 | NOTESTO FINANCIAL STATEMENTS |
Table of Contents
Trust’s business and affairs. This agreement provides for an annual fee of 0.05% on the Trust’s first $1.5 billion of average daily net assets, 0.045% on the next $1.5 billion of average daily net assets, 0.040% on the next $2 billion of average daily net assets and 0.030% on average daily net assets over $5 billion. For the year ended September 30, 2013, each Fund’s payment for administrative services to ICON Advisers is included on the Statement of Operations. The administrative services agreement provides that ICON Advisers will not be liable for any error of judgment, mistake of law, or any loss suffered by the Trust in connection with matters to which the administrative services agreement relates, except for a loss resulting from willful misfeasance, bad faith or negligence by ICON Advisers in the performance of its duties.
ICON Advisers has a sub-administration agreement under which State Street assists ICON Advisers with the administration and business affairs of the Trust. For its services, ICON Advisers pays State Street a fee that is calculated daily and paid monthly at an annual rate based on the aggregate average daily net assets of the Trust.
Distribution Fees
The Funds have adopted a Distribution Plan pursuant to Rule 12b-1 under the 1940 Act (“12b-1 Plan”) under which the Funds are authorized to compensate the Funds’ distributor, ICON Distributors, Inc. (“IDI”) (an affiliate of the adviser) for the sale and distribution of shares and for other shareholder services. Under the 12b-1 Plan, Class A shareholders pay an annual distribution and service fee of 0.25% of average daily net assets. The Class C shareholders pay an annual distribution and service fee of 1.00% of average daily net assets. There is no annual distribution and service fee for Class S shares. The total amount paid under the 12b-1 plans, if any, by the Funds is shown on the Statement of Operations.
Other Related Parties
Certain Officers and Directors of ICON Advisers are also Officers and Trustees of the Funds; however, such Officers and Trustees (with the exception of the Chief Compliance Officer, “CCO”) receive no compensation from the Funds. The Trust paid $120,000 of the CCO’s salary and the remaining portion is paid by ICON Advisers. For the year ended September 30, 2013, the total related amounts paid by the Funds under this arrangement are included in Other Expenses on the Statement of Operations.
| NOTESTO FINANCIAL STATEMENTS | 95 |
Table of Contents
NOTESTO FINANCIAL STATEMENTS (CONTINUED)
The Fund may reimburse ICON Advisers for legal work performed for the Fund by its attorneys outside of the advisory and administration contracts. The Board of Trustees reviews and approves such reimbursements. For the year ended September 30, 2013, the total related amounts paid by the Funds under this arrangement are included in Other Expenses on the Statement of Operations.
4. Borrowings
The Trust has entered into a Line of Credit agreement/arrangement with State Street to provide temporary funding for redemption requests. The maximum borrowing is limited to $150 million. Effective March 25, 2013, interest on domestic borrowings is charged at a rate quoted by State Street. Prior to March 25, 2013, interest on domestic borrowings is charged at the higher of the Federal Funds Rate effective on that day and the Overnight LIBOR Rate effective on that day plus 1.25%. The average interest rate charged for the year ended September 30, 2013 was 1.38%.
For the year ended September 30, 2013 the average outstanding loan by Fund was as follows:
| Fund* | Average Borrowing (10/1/12-9/30/13) | |||
ICON Consumer Discretionary Fund | $ | 439,223 | ||
ICON Consumer Staples Fund | | 175,464 | | |
ICON Energy Fund | 138,273 | |||
ICON Financial Fund | 251,434 | |||
ICON Healthcare Fund | 276,502 | |||
ICON Industrials Fund | 118,720 | |||
ICON Information Technology Fund | 155,125 | |||
ICON Materials Fund | 84,396 | |||
ICON Utilities Fund | 306,700 | |||
| * | There were no outstanding loans as of September 30, 2013. |
| 96 | NOTESTO FINANCIAL STATEMENTS |
Table of Contents
5. Purchases and Sales of Investment Securities
For the year ended September 30, 2013, the aggregate cost of purchases and proceeds from sales of investment securities (excluding short-term securities) was as follows:
| Fund | Purchases of Securities | Proceeds from Sales of Securities | ||||||
ICON Consumer Discretionary Fund | $ | 50,541,239 | $ | 85,178,151 | ||||
ICON Consumer Staples Fund | 36,036,784 | 41,857,409 | ||||||
ICON Energy Fund | 542,364,854 | 562,528,934 | ||||||
ICON Financial Fund | 36,230,850 | 72,213,423 | ||||||
ICON Healthcare Fund | 112,475,992 | 148,805,711 | ||||||
ICON Industrials Fund | 15,702,076 | 28,836,672 | ||||||
ICON Information Technology Fund | 37,854,139 | 57,925,978 | ||||||
ICON Materials Fund | 33,761,888 | 26,020,294 | ||||||
ICON Utilities Fund | 38,716,570 | 40,817,275 | ||||||
6. Federal Income Tax
Income and capital gain distributions are determined in accordance with income tax regulations that may differ from accounting principles that are generally accepted in the United States of America. These differences are due to differing treatments for items such as deferrals of wash sale losses, foreign currency transactions, and net investment losses.
Under the Regulated Investment Company Modernization Act of 2010 (the “Act”) capital losses generated by a fund may be carried over indefinitely, but these losses must be used prior to the utilization of any pre-enactment capital losses. Since pre-enactment capital losses may only be carried forward for eight years, there may be a greater likelihood that all or a portion of each fund’s pre-enactment capital losses will expire unused.
| NOTESTO FINANCIAL STATEMENTS | 97 |
Table of Contents
NOTESTO FINANCIAL STATEMENTS (CONTINUED)
For the year ended September 30, 2013 the following Funds had capital loss carryforwards:
| Fund | Amounts | Expires | ||||||
ICON Consumer Discretionary Fund | $ | 724,922 | 2017 | |||||
ICON Financial Fund | 46,411,353 | 2017 | ||||||
| 43,715,782 | 2018 | |||||||
ICON Industrials Fund | 2,696,930 | 2016 | ||||||
| 28,045,106 | 2017 | |||||||
ICON Information Technology Fund | 17,922,126 | 2017 | ||||||
| 6,573,259 | 2018 | |||||||
ICON Materials Fund | 7,882,389 | 2017 | ||||||
| 7,349,690 | 2018 | |||||||
ICON Utilities Fund | 755,843 | 2017 | ||||||
| 3,844,832 | 2018 | |||||||
Future capital loss carryforward utilization in any given year may be limited if there are substantial shareholder redemptions or contributions. During the year ended September 30, 2013 the following Funds utilized capital loss carryforwards:
| Fund | Amount | |||
ICON Consumer Discretionary Fund | $ | 16,583,749 | ||
ICON Consumer Staples Fund | 2,185,922 | |||
ICON Financial Fund | 11,320,296 | |||
ICON Healthcare Fund | 862,678 | |||
ICON Industrials Fund | 4,479,569 | |||
ICON Information Technology Fund | 3,971,552 | |||
ICON Materials Fund | 2,674,405 | |||
ICON Utilities Fund | 4,903,430 | |||
The tax characteristics of distributions paid to shareholders during the fiscal year ended September 30, 2013, were as follows:
| Distributions Paid from | ||||||||||||
| Fund | Ordinary Income | Net | Total Distributions Paid | |||||||||
ICON Consumer Discretionary Fund | $ | 107,081 | $ | - | $ | 107,081 | ||||||
ICON Consumer Staples Fund | 754,642 | - | 754,642 | |||||||||
ICON Energy Fund | 8,178,130 | - | 8,178,130 | |||||||||
ICON Financial Fund | 301,882 | - | 301,882 | |||||||||
ICON Healthcare Fund | 965,959 | - | 965,959 | |||||||||
ICON Industrials Fund | 420,622 | - | 420,622 | |||||||||
ICON Materials Fund | 569,895 | - | 569,895 | |||||||||
ICON Utilities Fund | 869,972 | - | 869,972 | |||||||||
| 98 | NOTESTO FINANCIAL STATEMENTS |
Table of Contents
The tax characteristics of distributions paid to shareholders during the fiscal year ended September 30, 2012, were as follows:
| Distributions Paid from | ||||||||||||
| Fund | Ordinary Income | Net | Total Distributions Paid | |||||||||
ICON Consumer Staples Fund | $ | 649,734 | $ | - | $ | 649,734 | ||||||
ICON Energy Fund | 4,969,470 | 13,290,487 | 18,259,957 | |||||||||
ICON Financial Fund | 210,698 | - | 210,698 | |||||||||
ICON Healthcare Fund | 663,361 | - | 663,361 | |||||||||
ICON Industrials Fund | 535,593 | - | 535,593 | |||||||||
ICON Materials Fund | 651,003 | - | 651,003 | |||||||||
ICON Utilities Fund | 1,055,447 | - | 1,055,447 | |||||||||
As of September 30, 2013, the components of accumulated earnings/(deficit) on a tax basis were as follows:
| Fund | Undistributed Ordinary Income | Undistributed Capital Gains | Late Year Loss Deferral** | Capital Loss Carryover | Unrealized Appreciation/ (Depreciation)* | Total Accumulated Earnings/ (Deficit) | ||||||||||||||||||
ICON Consumer Discretionary Fund | $ | - | $ | - | $ | (144,779 | ) | $ | (724,922 | ) | $ | 5,332,744 | $ | 4,463,043 | ||||||||||
ICON Consumer Staples Fund | 93,743 | 2,814,535 | - | - | 2,151,753 | 5,060,031 | ||||||||||||||||||
ICON Energy Fund | 1,301,971 | 11,645,709 | - | - | 105,910,179 | 118,857,859 | ||||||||||||||||||
ICON Financial Fund | 278,277 | - | - | (90,127,135 | ) | 1,028,248 | (88,820,610 | ) | ||||||||||||||||
ICON Healthcare Fund | 5,937,539 | 20,004,875 | - | - | 14,071,142 | 40,013,556 | ||||||||||||||||||
ICON Industrials Fund | 198,892 | - | - | (30,742,036 | ) | 8,626,685 | (21,916,459 | ) | ||||||||||||||||
ICON Information Technology Fund | - | - | (333,536 | ) | (24,495,385 | ) | 18,788,202 | (6,040,719 | ) | |||||||||||||||
ICON Materials Fund | 347,882 | - | - | (15,232,079 | ) | 13,802,699 | (1,081,498 | ) | ||||||||||||||||
ICON Utilities Fund | 3,401 | - | - | (4,600,675 | ) | (35,347 | ) | (4,632,621 | ) | |||||||||||||||
| * | Differences between the book-basis and tax-basis unrealized appreciation/(depreciation) are attributable primarily to tax deferral of losses on wash sales. |
| ** | The Funds have elected to defer certain qualified late-year losses in accordance with federal income tax rules. These losses are treated as having arisen on the first day of the following fiscal year. |
| NOTESTO FINANCIAL STATEMENTS | 99 |
Table of Contents
NOTESTO FINANCIAL STATEMENTS (CONTINUED)
As of September 30, 2013, cost of investments for federal income tax purposes and the amounts of gross and net unrealized appreciation/(depreciation) were as follows:
| Fund | Cost | Unrealized Appreciation | Unrealized (Depreciation) | Net Appreciation/ (Depreciation) | ||||||||||||
ICON Consumer Discretionary Fund | $ | 40,948,702 | $ | 5,895,940 | $ | (563,196 | ) | $ | 5,332,744 | |||||||
ICON Consumer Staples Fund | 36,064,839 | 2,477,570 | (325,817 | ) | 2,151,753 | |||||||||||
ICON Energy Fund | 599,678,741 | 107,053,968 | (1,143,789 | ) | 105,910,179 | |||||||||||
ICON Financial Fund | 11,867,196 | 1,129,117 | (100,869 | ) | 1,028,248 | |||||||||||
ICON Healthcare Fund | 87,161,425 | 14,672,719 | (601,576 | ) | 14,071,143 | |||||||||||
ICON Industrials Fund | 31,101,726 | 8,931,878 | (305,314 | ) | 8,626,564 | |||||||||||
ICON Information Technology Fund | 60,159,602 | 18,860,361 | (72,159 | ) | 18,788,202 | |||||||||||
ICON Materials Fund | 55,451,718 | 14,183,622 | (380,923 | ) | 13,802,699 | |||||||||||
ICON Utilities Fund | 34,217,670 | 832,046 | (867,418 | ) | (35,372 | ) | ||||||||||
7. Accounting Pronouncement
In December 2011, the FASB issued Accounting Standards Update No. 2011-11, “Disclosures about Offsetting Assets and Liabilities.” This update creates disclosure requirements requiring entities to disclose both gross and net information for derivatives and other financial instruments that are either offset in the Statements of Assets and Liabilities or subject to an enforceable master netting arrangement or similar agreement. In January 2013, the FASB issued Accounting Standards Update No. 2013-01, “Clarifying the Scope of Disclosures about Offsetting Assets and Liabilities.” This update limits the scope of the new Statements of Assets and Liabilities offsetting disclosures to derivatives, repurchase agreements, reverse repurchase agreements, securities borrowing and securities lending transactions that are either offset in the Statements of Assets and Liabilities or subject to an enforceable master netting arrangement or similar agreement. These disclosure requirements are effective for annual reporting periods beginning on or after January 1, 2013, and interim periods within those annual periods. Management is currently evaluating the impact these updates may have on the Funds’ financial statements.
| 100 | NOTESTO FINANCIAL STATEMENTS |
Table of Contents
8. Subsequent Events
Management has evaluated the possibility of subsequent events and determined that there are no material events that would require adjustments to or disclosure in the Funds’ financial statements.
| NOTESTO FINANCIAL STATEMENTS | 101 |
Table of Contents
REPORTOF INDEPENDENT REGISTERED PUBLIC
ACCOUNTING FIRM
To the Board of Trustees and Shareholders of the ICON Funds:
In our opinion, the accompanying statements of assets and liabilities, including the schedules of investments, and the related statements of operations and of changes in net assets and the financial highlights present fairly, in all material respects, the financial position of ICON Consumer Discretionary Fund, ICON Consumer Staples Fund, ICON Energy Fund, ICON Financial Fund, ICON Healthcare Fund, ICON Industrials Fund, ICON Information Technology Fund, ICON Materials Fund, and ICON Utilities Fund (nine of the portfolios constituting ICON Funds, hereafter referred to as the “Funds”) at September 30, 2013, the results of each of their operations for the year then ended, the changes in each of their net assets for each of the two years in the period then ended and the financial highlights for each of the periods presented, in conformity with accounting principles generally accepted in the United States of America. These financial statements and financial highlights (hereafter referred to as “financial statements”) are the responsibility of the Funds’ management; our responsibility is to express an opinion on these financial statements based on our audits. We conducted our audits of these financial statements in accordance with the standards of the Public Company Accounting Oversight Board (United States). Those standards require that we plan and perform the audit to obtain reasonable assurance about whether the financial statements are free of material misstatement. An audit includes examining, on a test basis, evidence supporting the amounts and disclosures in the financial statements, assessing the accounting principles used and significant estimates made by management, and evaluating the overall financial statement presentation. We believe that our audits, which included confirmation of securities at September 30, 2013 by correspondence with the custodian and brokers, provide a reasonable basis for our opinion.

Denver, Colorado
November 19, 2013
| 102 | REPORTOF ACCOUNTING FIRM |
Table of Contents
SIX MONTH HYPOTHETICAL EXPENSE EXAMPLE
SEPTEMBER 30, 2013 (UNAUDITED)
Example
As a shareholder of a Fund you may pay two types of fees: transaction fees and fund-related fees. Certain funds charge transaction fees, including sales charges (loads) on purchase payments, reinvested dividends, or other distributions; redemption fees; and exchange fees. Funds also incur various ongoing expenses, including management fees, distribution and/or service fees, and other fund expenses, which are indirectly paid by shareholders.
This Example is intended to help you understand your ongoing costs (in dollars) of investing in the various ICON Funds and to compare these costs with the ongoing costs of investing in other mutual funds. This Example is based on an investment of $1,000 invested at the beginning of the six-month period and held for the six-month period (4/1/13 – 9/30/13).
Actual Expenses
The first line in the table for each Fund provides information about actual account values and actual expenses. The Example includes, but is not limited to, management fees, 12b-1 fees, fund accounting, custody and transfer agent fees. However, the Example does not include client specific fees, such as the $15 fee charged to IRA accounts, or the $15 fee charged for wire redemptions. You may use this information, together with the amount you invested, to estimate the expenses that you paid over the period. Simply divide your account value by $1,000 (for example, an $8,600 account value divided by $1,000 = 8.6), then multiply the result by the number in the first line for each Fund under the heading entitled “Expenses Paid During Period” to estimate the expenses you paid on your account during this period.
Hypothetical Example for Comparison Purposes
The second line in the table for each Fund provides information about hypothetical account values and hypothetical expenses based on the Fund’s actual expense ratio and an assumed rate of return of 5% per year before expenses, which is not the Fund’s actual return. The hypothetical account values and expenses may not be used to estimate the actual ending account balance or expenses you paid for the period. You may use this information to compare the ongoing costs of investing in the Fund and other funds. To do so, compare this 5% hypothetical example with the 5% hypothetical examples that appear in the shareholder reports of the other funds. Please note that the expenses shown in the table are meant to highlight your ongoing costs
| EXPENSE EXAMPLE | 103 |
Table of Contents
only and do not reflect any transactional costs, such as sales charges (loads), redemption fees, or exchange fees that may be charged by other funds. Therefore, this information is useful in comparing ongoing costs only, and will not help you determine the relative total costs of owning different funds.
| Beginning Account Value 4/1/13 | Ending Account Value 9/30/13 | Expense Paid During Period 4/1/13 - 9/30/13* | Annualized Expense Ratio 4/1/13 - 9/30/13* | |||||||||||||
Actual Expenses | ||||||||||||||||
ICON Consumer Discretionary Fund | ||||||||||||||||
Class S | $ | 1,000 | $ | 1,129.30 | $ | 7.58 | 1.42% | |||||||||
Class C | 1,000 | 1,123.10 | 14.64 | 2.75% | ||||||||||||
Class A | 1,000 | 1,127.40 | 9.01 | 1.69% | ||||||||||||
ICON Consumer Staples Fund | ||||||||||||||||
Class S | 1,000 | 1,014.70 | 7.78 | 1.54% | ||||||||||||
Class C | 1,000 | 1,009.40 | 12.64 | 2.51% | ||||||||||||
Class A | 1,000 | 1,013.50 | 8.83 | 1.75% | ||||||||||||
ICON Energy Fund | ||||||||||||||||
Class S | 1,000 | 1,032.90 | 6.83 | 1.34% | ||||||||||||
Class C | 1,000 | 1,027.80 | 12.15 | 2.39% | ||||||||||||
Class A | 1,000 | 1,031.60 | 8.40 | 1.65% | ||||||||||||
ICON Financial Fund | ||||||||||||||||
Class S | 1,000 | 1,081.00 | 7.72 | 1.48% | ||||||||||||
Class C | 1,000 | 1,074.60 | 13.11 | 2.52% | ||||||||||||
Class A | 1,000 | 1,077.50 | 10.26 | 1.97% | ||||||||||||
ICON Healthcare Fund | ||||||||||||||||
Class S | 1,000 | 1,120.80 | 7.82 | 1.47% | ||||||||||||
Class C | 1,000 | 1,115.40 | 13.31 | 2.51% | ||||||||||||
Class A | 1,000 | 1,118.40 | 8.82 | 1.66% | ||||||||||||
ICON Industrials Fund | ||||||||||||||||
Class S | 1,000 | 1,104.60 | 7.81 | 1.48% | ||||||||||||
Class C | 1,000 | 1,098.10 | 13.15 | 2.50% | ||||||||||||
Class A | 1,000 | 1,102.30 | 9.22 | 1.75% | ||||||||||||
ICON Information Technology Fund | ||||||||||||||||
Class S | 1,000 | 1,084.40 | 7.58 | 1.45% | ||||||||||||
Class C | 1,000 | 1,080.00 | 13.04 | 2.50% | ||||||||||||
Class A | 1,000 | 1,082.40 | 9.14 | 1.75% | ||||||||||||
ICON Materials Fund | ||||||||||||||||
Class S | 1,000 | 1,135.20 | 7.87 | 1.47% | ||||||||||||
Class C | 1,000 | 1,128.70 | 13.34 | 2.50% | ||||||||||||
Class A | 1,000 | 1,133.20 | 9.36 | 1.75% | ||||||||||||
ICON Utilities Fund | ||||||||||||||||
Class S | 1,000 | 968.00 | 7.45 | 1.51% | ||||||||||||
Class C | 1,000 | 962.80 | 12.35 | 2.51% | ||||||||||||
Class A | 1,000 | 966.30 | 9.17 | 1.86% | ||||||||||||
| 104 | EXPENSE EXAMPLE |
Table of Contents
| Beginning Account Value 4/1/13 | Ending Account Value 9/30/13 | Expense Paid During Period 4/1/13 - 9/30/13* | Annualized Expense Ratio 4/1/13 - 9/30/13* | |||||||||||
Hypothetical (assuming a 5% return before expenses) | ||||||||||||||
ICON Consumer Discretionary Fund | ||||||||||||||
Class S | $ | 1,000 | $ | 1,017.95 | $ | 7.18 | ||||||||
Class C | 1,000 | 1,011.28 | 13.87 | |||||||||||
Class A | 1,000 | 1,016.60 | 8.54 | |||||||||||
ICON Consumer Staples Fund | ||||||||||||||
Class S | 1,000 | 1,017.35 | 7.79 | |||||||||||
Class C | 1,000 | 1,012.48 | 12.66 | |||||||||||
Class A | 1,000 | 1,016.29 | 8.85 | |||||||||||
ICON Energy Fund | ||||||||||||||
Class S | 1,000 | 1,018.35 | 6.78 | |||||||||||
Class C | 1,000 | 1,013.09 | 12.06 | |||||||||||
Class A | 1,000 | 1,016.80 | 8.34 | |||||||||||
ICON Financial Fund | ||||||||||||||
Class S | 1,000 | 1,017.65 | 7.49 | |||||||||||
Class C | 1,000 | 1,012.43 | 12.71 | |||||||||||
Class A | 1,000 | 1,015.19 | 9.95 | |||||||||||
ICON Healthcare Fund | ||||||||||||||
Class S | 1,000 | 1,017.70 | 7.44 | |||||||||||
Class C | 1,000 | 1,012.48 | 12.66 | |||||||||||
Class A | 1,000 | 1,016.75 | 8.39 | |||||||||||
ICON Industrials Fund | ||||||||||||||
Class S | 1,000 | 1,017.65 | 7.49 | |||||||||||
Class C | 1,000 | 1,012.53 | 12.61 | |||||||||||
Class A | 1,000 | 1,016.29 | 8.85 | |||||||||||
ICON Information Technology Fund | ||||||||||||||
Class S | 1,000 | 1,017.80 | 7.33 | |||||||||||
Class C | 1,000 | 1,012.53 | 12.61 | |||||||||||
Class A | 1,000 | 1,016.29 | 8.85 | |||||||||||
ICON Materials Fund | ||||||||||||||
Class S | 1,000 | 1,017.70 | 7.44 | |||||||||||
Class C | 1,000 | 1,012.53 | 12.61 | |||||||||||
Class A | 1,000 | 1,016.29 | 8.85 | |||||||||||
ICON Utilities Fund | ||||||||||||||
Class S | 1,000 | 1,017.50 | 7.64 | |||||||||||
Class C | 1,000 | 1,012.48 | 12.66 | |||||||||||
Class A | 1,000 | 1,015.74 | 9.40 | |||||||||||
| * | Expenses are equal to the Fund’s six month expense ratio annualized, multiplied by the average account value over the period, multiplied by 183/365 to reflect the one-half year period. |
Total returns exclude applicable sales charges. If sales charges were included (maximum 5.75%), returns would be lower.
| EXPENSE EXAMPLE | 105 |
Table of Contents
BOARDOF TRUSTEESAND FUND OFFICERS (UNAUDITED)
The ICON Funds Board of Trustees (“Board”) consists of four Trustees who oversee the 18 ICON Funds (the “Funds”). The Board is responsible for general oversight of the Funds’ business and for assuring that the Funds are managed in the best interest of the Funds’ shareholders. The Trustees, and their ages, and principal occupations are set forth below. The address of the Trustees is 5299 DTC Blvd., Suite 1200, Greenwood Village, CO 80111. Trustees have no official term of office and generally serve until they resign or are not re-elected.
Interested Trustee
Craig T. Callahan, 62, Chairman of the Board. Dr. Callahan has been a Trustee of the Funds since their inception. Dr. Callahan also serves as President (1998 to present) and Chairman of the Investment Committee (2005 to present) and served as the Chief Investment Officer (1991 to 2004) of ICON Advisers. Dr. Callahan is also Executive Vice President (2005 to present); Director (1991 to present); and was previously President (1998 to 2005) and Chief Compliance Officer (2005) of IDI. Dr. Callahan also serves as the President (1998 to present) and Chairman of the Board of Directors (1994 to present) of ICON Management & Research Corporation (“IM&R”), the parent company of ICON Advisers and IDI.
Independent Trustees
Glen F. Bergert, 63. Mr. Bergert has been a Trustee of the Funds since 1999. Mr. Bergert is President of Venture Capital Management LLC (1997 to present), General Partner of SOGNO Partners LP, a venture capital company (2001 to present), General Partner of Bergert Properties, LLP, a real estate holding company (1997 to present), General Partner of Pyramid Real Estate Partnership, a real estate development company (1998 to present), General Partner of Chamois Partners, LP, a venture capital company (2004 to present) and was previously a General Partner with KPMG Peat Marwick, LLP (1979 to 1997). Mr. Bergert is also a Director of Delta Dental of California, an insurance company (2013 to present and 2006 to 2012), Delta Dental of Pennsylvania, an insurance company (1998 to 2009 and 2010 to present), Dentegra Group, Inc, an insurance holding company (2010 to present) and Delta Reinsurance Corporation (2000 to 2009 and 2011 to present). Mr. Bergert was a Director of Herre Bros, Inc., a contracting company (1998 to 2011).
John C. Pomeroy, Jr., 66. Mr. Pomeroy has been a Trustee of the Funds since November 2002. Mr. Pomeroy is Chief Investment Officer and Director
| 106 | TRUSTEESAND OFFICERS |
Table of Contents
of Investments, Pennsylvania State University (2001 to present) and was Portfolio Manager and Product Manager, Trinity Investment Management Corporation (1989 to 2001).
R. Michael Sentel, 65. Mr. Sentel has been a Trustee of the Funds since their inception. Mr. Sentel is a Senior Attorney with the U.S. Department of Education (1996 to present). Mr. Sentel also provides legal representation as a sole practitioner with an emphasis on corporate and transactional law. He served as general counsel to numerous public companies and served on the board of directors of one of these clients. Mr. Sentel began his legal career with the U.S. Securities and Exchange Commission’s Division of Enforcement and served as a Branch Chief (1980 to 1981). Later he served as the Section Chief for the Professional Liability Section of the Federal Deposit Insurance Corp. with responsibility for the Rocky Mountain Region (1991 to 1994).
The Officers of the Funds are:
Craig T. Callahan, 62, Chairman of the Board. Dr. Callahan has been a Trustee of the Funds since their inception. Dr. Callahan also serves as President (1998 to present) and Chairman of the Investment Committee (2005 to present) and served as the Chief Investment Officer (1991 to 2004) of ICON Advisers. Dr. Callahan is also Executive Vice President (2005 to present); Director (1991 to present); and was previously President (1998 to 2005) and Chief Compliance Officer (2005) of IDI. Dr. Callahan also serves as the President (1998 to present) and Chairman of the Board of Directors (1994 to present) of IM&R, the parent company of ICON Advisers and IDI.
Donald Salcito, 60. Mr. Salcito serves as Vice President and Secretary of the Funds (November 15, 2006 to present). Mr. Salcito is also Executive Vice President and General Counsel (September 2005 to present) of ICON Advisers; Director of IM&R (2005 to present); Executive Vice President, Secretary, General Counsel of IDI (2005 to present). Previously, he was a Partner in various national law firms, practicing in the securities law area. (1980 to 2005).
Carrie M. Schoffman, 40. Ms. Schoffman has been a Vice President and Principal Financial Officer/Treasurer of the Funds since June 2013. Ms. Schoffman is also Chief Compliance Officer (2013 to present and 2004 to 2008) and Anti-Money Laundering Officer (2013 to present) of the ICON Funds. She is Senior Vice President (2011 to present) and Chief Compliance Officer (2013 to present and 2004 to 2011) of ICON Advisers. Previously, she was a Staff Accountant with the Securities and Exchange Commission (2003 to 2004) and also an Experienced Manager (2001 to 2003) and a Senior Associate/Associate (1996 to 2001) at PricewaterhouseCoopers LLP.
| TRUSTEESAND OFFICERS | 107 |
Table of Contents
Renewal of Investment Advisory Agreement
On August 19, 2013 the Board of Trustees, including all of the Trustees that are not “interested persons” of the Trust (the “Independent Trustees”), approved continuation of the Advisory Agreements with the Adviser for each Fund for an additional one-year term commencing October 1, 2013.
In determining to renew the investment advisory agreements between ICON Funds (the “Trust”) and ICON Advisers, Inc. (“ICON” or the “Adviser”) the Trustees requested, was provided with and reviewed data with respect to the Adviser, its personnel, and the services provided and to be provided to each Fund by the Adviser under the Trust’s Investment Advisory Agreement dated October 9, 1996, as amended (related to the Sector Funds, the International Funds and ICON Funds) and under the Trust’s Investment Advisory Agreement dated July 9, 2002 and effective October 1, 2002, as amended (related to the U.S. Diversified Funds - Bond, Risk-Managed Equity, Equity Income and Long/Short Funds) (collectively, the “Advisory Agreements”), for an additional one-year term commencing October 1, 2013. The Trustees agreed that consideration of the Advisory Agreements should also include consideration of other agreements between the Adviser and the Trust that impact provisions of the Advisory Agreements, including, in particular, expense limitation agreements dated January 22, 2013 and May 1, 2005 (for the International Equity Fund).
The Trustees were provided with and reviewed data with respect to the Adviser, its personnel, and the services provided and to be provided to each Fund by the Adviser under the Trust’s Advisory Agreements and Administrative Services Agreement and the Distribution Agreement with ICON Distributors, Inc. (“IDI”). The data included information concerning advisory, distribution and administrative services provided to the Funds by ICON and its related companies; information concerning other businesses of those companies; comparative data related to exchange traded funds versus the Sector Funds; and comparative data obtained from Strategic Insights related to Fund performance and Fund expenses (the “SI report”). The data also included an analysis of the management style to be applied and the style applied to the Funds’ ratings of the Funds’ performance in their management style on the AthenaInvest system (the “AthenaInvest data”) and a presentation on the Adviser’s investment model.
Management personnel discussed the data for and with the Board. Included in the 15(c) discussion was a briefing on factors affecting the ICON investment model; expenses and expense ratios of each Fund and other ICON managed products; relative performance of each Fund; status of expense
| 108 | OTHER INFORMATION |
Table of Contents
reimbursements to the Funds by the Adviser; sales and marketing initiatives; specific business factors affecting IDI; the work load on ICON as adviser and administrator to the Funds; current profitability of ICON; current quality control procedures in place to show consistency in the management of the investment model, modification to the investment model, and staffing levels and staff morale.
The Independent Trustees were represented by independent legal counsel in this process. Prior to acting on the proposed contract renewals, the Independent Trustees met separately as a group in private sessions with their independent legal counsel to review and discuss the foregoing information. Based on these discussions, independent legal counsel and/or the Lead Independent Trustee also contacted management to request additional information and to discuss responses to questions raised during the process. In addition, the Board received materials from legal counsel discussing the legal standards applicable to their consideration of the ICON-Trust agreements.
In considering the nature, extent and quality of the services provided by the Adviser, the Board reviewed information relating to ICON’s operations and personnel. Among other things, the Adviser provided biographical information on its professional staff and descriptions of its organizational and management structure. In the course of their deliberations the Board evaluated, among other things, information relating to the investment philosophy, strategies and techniques used in managing each Fund, the qualifications and experience of ICON’s investment personnel, ICON’s compliance programs, ICON’s brokerage practices, including the extent to which the Adviser obtains research through “soft dollar” arrangements with the Funds’ brokerage, compliance reports on the foregoing, and the financial and non-financial resources available to provide services required under the Advisory Agreement.
During the discussion, the SI report and the AthenaInvest data were discussed and management personnel showed performance for each fund and discussed the factors affecting performance. During the discussion on performance, management personnel noted that the markets continue to experience volatility and that when the markets are volatile, it affects ICON’s performance; during the last three – four years ICON’s style of management, intrinsic valuation, has not been in favor. The Trustees noted that Advisers’ performance relative to other valuation managers as judged by the AthenaInvest system is quite positive, but in relation to other strategy managers, valuation is underperforming. The Board believes this information supports the view that an active valuation manager is in a very difficult setting and indicates this setting has been particularly difficult for managers buying what they consider to be value stocks. Management noted that the
| OTHER INFORMATION | 109 |
Table of Contents
ICON system is designed to handle one to two year industry themes, not ones averaging 14 weeks; and that the Adviser has stuck to its system as specified in Fund disclosure documents, holding the stocks and industries that appear inexpensive in relation to ICON’s calculating of value and ridden through the volatility.
The Board addressed style consistency with the Adviser. Management advised that, based on the Adviser’s own analysis, and with the restructuring of the Adviser, the Adviser has added a new level of review on the Portfolio Managers (“PMs”) to make sure they are adhering to the ICON System; the Director of Fund Management has been systematically tracking the Funds’ performance; he evaluates each of the ICON Funds to help ensure all PMs are investing consistently and in accordance with the ICON System by evaluating the Funds from an attribution perspective in monthly meetings. Management also advised that part of his responsibilities require him to evaluate the ICON system and that this effort has resulted in improvements to the ICON methodology, when necessary.
In connection with reviewing data bearing upon the nature, quality, and extent of services furnished by ICON to each Fund, the Board assessed data concerning ICON’s staffing, systems and facilities. The Board also assessed ICON’s non-Trust business to see if there are any initiatives that would dilute service to the Trust. The Board concluded:
A. That the breadth and the quality of investment advisory and other services being provided to each Fund is satisfactory, as evidenced in part by efforts to address and improve the performance record of each Fund when compared with the performance records of a peer group of comparable funds and markets in general;
B. That the breadth and the quality of investment advisory and other services being provided to each Fund are satisfactory, as evidenced in part by the AthenaInvest data (ratings based on an assessment of fund strategy), the Adviser’s performance is competitive with other fund managers in the value style group, and the Adviser has applied a disciplined approach in the style specified in the Funds’ offering document;
C. That ICON has made significant expenditures in the past year and in prior years to ensure that it has the sophisticated systems and the highly trained personnel necessary for it to be able to continue to provide quality service to the Funds’ shareholders, including the dedication of substantial resources to ICON’s investment and methodology;
D. That the Board, after considering compliance reports and compliance initiatives undertaken during the year and conducting individual interviews with selected PMs, is satisfied with the research and portfolio management,
| 110 | OTHER INFORMATION |
Table of Contents
that research and portfolio management is being constantly evaluated and improved upon; and that the PMs are evaluating trading services constantly, the Board concluded that the Adviser is providing the Funds with professional management of the nature, quality and scope required by the Funds; and
E. The risks assumed by ICON in providing investment advisory services to each Fund, including the capital commitments which have been made in the past and which continue to be made by ICON to ensure the continuation of the highest quality of service to the Trust, is made with the recognition that shareholders may redeem their shares at any time without notice and the Trust’s advisory relationship with ICON may be terminated at any time and must be renewed on an annual basis.
In considering the reasonableness of the fees paid to the Adviser for managing each Fund, the Board reviewed, among other things, data concerning other funds from the SI report, financial statements of the Adviser and an analysis of the profitability of the Adviser, and its affiliates, and their relationship with each Fund over various time periods. Such analysis identified all revenues and other benefits received by the Adviser and its affiliates from managing each Fund, the costs associated with providing such services and the resulting profitability to the Adviser and its affiliates and a comparison of similar data from reports filed by publicly traded firms.
The Board assessed actual (net) fees for advisory services and Fund expense ratios under the contractual relationship (the Advisory agreements and the Expense Limitation Agreements) with the Adviser as opposed to the fees specified in the applicable Advisory Agreement and expense ratios without application of the expense limitations and concluded that the focus should be on actual expense ratios after application of the Expense Limitation Agreements.
The Board considered the current and anticipated asset levels of each Fund and the contractual commitments of the Adviser to waive fees and pay expenses of the Funds from time to time to limit the total expenses of the Funds. In this regard the Board discussed significantly reduced asset levels in each Fund covered by the Advisory Agreements due to the relative poor Fund performance, and the industry wide net-redemptions in equity and actively managed funds due to the uncertainty of the markets. ICON’s ability to provide the services called for under the Advisory Agreements was assessed in light of current and projected asset levels. Fund expenses and expense ratios were also assessed in light of current and projected asset levels. The Board concluded that the Adviser has the resources necessary to provide the services called for under the Advisory Agreements; that profitability to the Adviser and its affiliates from their relationship with the Funds, and services
| OTHER INFORMATION | 111 |
Table of Contents
provided to the Funds, is not excessive; and that the Adviser is not realizing material benefits from economies of scale that would warrant adjustments to the fees for any Fund at this time. The Board of Trustees concluded that, in light of the nature, extent and quality of the services provided by the Adviser and the levels of profitability associated with providing these services, the fees charged by the Adviser under the Advisory Agreements to each Fund are reasonable.
In connection with assessing data bearing on the fairness of fee arrangements, the Board considered the SI report. It was noted that SI was selected at the May Board meeting to prepare its report, an extensive analysis of the expense data of other comparable funds; and that Trustee input was solicited and provided in the process. Among other information discussed, it was noted that:
A. the advisory fee structures of the Funds were considered in comparison with advisory fees and expense ratios of other similarly managed funds as set forth in the comparative data;
B. expense ratios for 10 of the 18 Funds are above median, and 2 are below the median;
C. in 16 of the 18 Funds, the assets under management are significantly below either the average or the median. SI did not provide an analysis of fund expense on an asset weighted basis. Such an analysis is very subjective and uncertain because it would require the Adviser to make a number of assumptions, which the Adviser’s management was uncomfortable in making due to the unreliability of the assumptions. It was, however, noted that when the fund size approaches peer group averages the Funds expenses also approach peer group averages.;
D. ICON has contractually agreed to impose expense limitations on each and every Fund at a cost to ICON;
E. ICON has contractually committed to break points in its fees so that economies of scale could be realized as a Fund grows in assets, for the benefit of Fund shareholders.
The Board also considered the fees charged by the Adviser to other advisory clients as outlined in its Registration Application on Form ADV in connection with assessing data bearing on the fairness of fee arrangements. The Trustees noted that certain ICON institutional/sub-advised type accounts have lower fees than the fees paid by the Funds for a number of reasons, including but not limited to, those clients call for different commitments of time, institutional clients have low and predictable turnover of assets, in competition joint costs are apportioned among paying customers according
| 112 | OTHER INFORMATION |
Table of Contents
to elasticity of demand and the Adviser has a limited level of responsibility in sub-managed accounts, or accounts with an investor agent/advisor.
The Board noted that the Funds’ redemptions were similar to industry averages which showed two things: 1) that the Funds’ Performance was not adversely impacting fund redemptions, and 2) that the fees and costs were competitive when compared to size. The Board noted that there are thousands of mutual funds competing; that investors can search and trade funds on the internet or on platforms at very little or no cost; and that if the Adviser were overcharging for its services, with its performance being what it is, the Board would have expected redemptions in excess of industry norms.
The Board concluded that the Adviser is providing the Funds with professional management at a fair, reasonable and competitive price.
In connection with assessing the direct and indirect benefits to ICON from serving as the Funds’ adviser, the Board discussed services provided under the Distribution Agreement and the Administrative Services Agreement which are in addition to services under the Advisory Agreements. It was noted that IDI does not charge a fee to the Funds for its services and that ICON’s fee for administrative services appears to be consistent with such fees in other fund groups. The Board noted that ICON receives research assistance (primarily in the form of data) from the use of soft dollars generated from Fund portfolio transactions; that such research assists ICON in providing quality advisory services; that Trust and Adviser compliance personnel continuously evaluate and report on the soft-dollar arrangements and related costs; and the Board concluded that the arrangements are consistent with Fund brokerage practices and benefit the Funds and their shareholders.
Based on these considerations, the Board, including all of the Independent Trustees, concluded that: 1) the continuation of the Advisory Agreements was in the best interests of each Fund and its shareholders, 2) the services to be performed under the Advisory Agreements were required for the operation of the Funds, 3) the advisory services were satisfactory to the Funds in the past, and 4) the fees for the advisory services and other benefits from the relationship with the Trust received by ICON, and its affiliates, were consistent with fees paid by similar funds and other clients of ICON, and were reasonable in light of the comparative data, and within the range of what would have been negotiated at arm’s length in light of all the circumstances.
| OTHER INFORMATION | 113 |
Table of Contents
Supplemental Tax Information
For corporate shareholders, the following percentage of the total ordinary income dividends paid during the fiscal year ended September 30, 2013, qualifies for the corporate dividends received deduction for the following Funds:
| Fund | Dividends Received Deduction | |||
ICON Consumer Discretionary Fund | 100 | % | ||
ICON Consumer Staples Fund | 100 | % | ||
ICON Energy Fund | 100 | % | ||
ICON Financial Fund | 100 | % | ||
ICON Healthcare Fund | 100 | % | ||
ICON Industrials Fund | 100 | % | ||
ICON Materials Fund | 100 | % | ||
ICON Utilities Fund | 100 | % | ||
For the fiscal year ended September 30, 2013, the following funds paid qualified dividend income:
| Fund | Amount | |||
ICON Consumer Discretionary Fund | 100 | % | ||
ICON Consumer Staples Fund | 100 | % | ||
ICON Energy Fund | 100 | % | ||
ICON Financial Fund | 100 | % | ||
ICON Healthcare Fund | 100 | % | ||
ICON Industrials Fund | 100 | % | ||
ICON Materials Fund | 100 | % | ||
ICON Utilities Fund | 100 | % | ||
The Funds had no long-term capital gain distributions qualifying for the maximum 20% income tax rate for individuals.
Portfolio Holdings
Information related to the 10 largest portfolio holdings of each Fund is made available at www.iconfunds.com within approximately 10 business days after month-end. Additionally, a complete list of each Fund’s holdings is made available approximately 30 days after month-end. Each ICON Fund also files a complete schedule of portfolio holdings for the first and third quarters of its fiscal year with the Securities and Exchange Commission (the “Commission”) on Form N-Q. The ICON Funds’ Forms N-Q are available at www.sec.gov or may be reviewed and copied at the Commission’s Public Reference Room in Washington, DC. Information about the Public Reference Room may be obtained by calling 1-800-SEC-0330.
| 114 | OTHER INFORMATION |
Table of Contents
Proxy Voting
A summarized description of the policies and procedures the ICON Funds use to vote proxies is available free of charge at www.iconfunds.com or by calling 1-800-764-0442.
Information about how the ICON Funds voted proxies related to each Fund’s portfolio securities during the 12-month period ended June 30 is available free of charge at www.iconfunds.com or on the Commission’s website at www.sec.gov.
Cost Basis Information
Effective January 1, 2012, federal law requires mutual fund companies to maintain and report a shareholder’s cost basis by tax lot, gain/loss information and holding period of covered shares to the Internal Revenue Service on Form 1099. Covered shares are mutual fund shares acquired on or after January 1, 2012. A fund is not required to maintain and report information for shares not deemed as covered.
The new law requires each fund to elect a default tax identification methodology in order to perform the required reporting. As a result, the Trust has chosen Average Cost as its default tax identification methodology. This is the method each Fund will use. However, at the time of purchase or upon the sale of covered shares, shareholders may choose a different tax identification method. Furthermore, if you purchase shares through a financial intermediary, please contact the intermediary to find out what default tax identification method they will use. We recommend that you consult your tax adviser to determine which tax identification methodology best suits your individual tax situation.
For More Information
This report is for the general information of the Funds’ shareholders and is not authorized for distribution to prospective investors unless preceded or accompanied by a current prospectus. You may obtain a copy of the prospectus, which contains information about the investment objectives, risks, charges, expenses, and share classes of each ICON Fund, by visiting www.iconfunds.com or by calling 1-800-764-0442. Please read the prospectus carefully before investing.
ICON Distributors, Inc., Distributor.
| OTHER INFORMATION | 115 |
Table of Contents
ICON FUNDS PRIVACY INFORMATION
| FACTS | WHAT DOES ICON DO WITH YOUR PERSONAL INFORMATION? | |
| Why? | Financial companies choose how they share your personal information. Federal law gives consumers the right to limit some but not all sharing. Federal law also requires us to tell you how we collect, share, and protect your personal information. Please read this notice carefully to understand what we do. | |
| What? | The types of personal information we collect and share depend on the product or service you have with us. This information can include:
n Social Security number and account balances
n income and transaction history
n checking account information and wire transfer instructions
When you are no longer our customer, we continue to share your information as described in this notice. | |
| How? | All financial companies need to share customers’ personal information to run their everyday business. In the section below, we list the reasons financial companies can share their customers’ personal information; the reasons ICON chooses to share; and whether you can limit this sharing. |
| Reasons we can share your personal information | Does ICON share? | Can you limit this sharing? | ||
For our everyday business purposes — such as to process your transactions, maintain your account(s), respond to court orders and legal investigations, or report to credit bureaus | Yes | No | ||
For our marketing purposes — to offer our products and services to you | No | We don’t share | ||
| For joint marketing with other financial companies | No | We don’t share | ||
For our affiliates’ everyday business purposes — information about your transactions and experiences | No | We don’t share | ||
For our affiliates’ everyday business purposes — information about your creditworthiness | No | We don’t share | ||
| For nonaffiliates to market to you | No | We don’t share |
| Questions? | Call 1-800-764-0442 for the ICON Funds and 1-800-828-4881 for ICON Advisers, Inc. and ICON Distributors, Inc. |
| 116 | FUNDS PRIVACY INFORMATION |
Table of Contents
| Page 2 |
| Who we are | ||
| Who is providing this notice? | ICON Funds, ICON Advisers, Inc., and ICON Distributors, Inc. (collectively “ICON”) | |
| What we do | ||
| How does ICON protect my personal information? | To protect your personal information from unauthorized access and use, we use security measures that comply with federal law. These measures include computer safeguards and secured files and buildings.
Contracts with our service providers require them to restrict access to your non-public personal information, and to maintain physical, electronic and procedural safeguards against unintended disclosure. | |
| How does ICON collect my personal information? | We collect your personal information, for example, when you
n open an account or enter into an investment advisory contract
n provide account information or give us your contact information
n make a wire transfer
We also collect your personal information from others, such as credit bureaus, affiliates, or other companies. | |
| Why can’t I limit all sharing? | Federal law gives you the right to limit only
n sharing for affiliates’ everyday business purposes — information about your creditworthiness
n affiliates from using your information to market to you
n sharing for nonaffiliates to market to you
State laws and individual companies may give you additional rights to limit sharing. | |
| Definitions | ||
| Affiliates | Companies related by common ownership or control. They can be financial and nonfinancial companies.
n Our affiliates include financial companies such as ICON Funds, ICON Advisers, Inc., and ICON Distributors, Inc. | |
| Nonaffiliates | Companies not related by common ownership or control. They can be financial and nonfinancial companies.
n Nonaffiliates we share with can include financial companies such as custodians, transfer agents, registered representatives, financial advisers and nonfinancial companies such as fulfillment, proxy voting, and class action service providers | |
| Joint marketing | A formal agreement between nonaffiliated financial companies that together market financial products or services to you.
n ICON doesn’t jointly market |
| FUNDS PRIVACY INFORMATION | 117 |
Table of Contents
For more information about the ICON Funds, contact us:
| By Telephone | 1-800-764-0442 | |
| By Mail | ICON Funds P.O. Box 55452 Boston, MA 02205-8165 | |
| In Person | ICON Funds 5299 DTC Boulevard, 12th Floor Greenwood Village, CO 80111 | |
| On the Internet | www.iconfunds.com | |
| By E-Mail | info@iconadvisers.com | |
Table of Contents
Item 2. Code of Ethics.
(a) The registrant has adopted a code of ethics that applies to the registrant’s principal executive officer, principal financial officer, principal accounting officer or controller, or persons performing similar functions. This code of ethics is included as an Exhibit.
(b) Not used.
(c) There were no amendments, during the period covered by this report, to a provision of the code of ethics that applies to the Registrant’s principal executive officer, principal financial officer, principal accounting officer or controller, or persons performing similar functions, regardless of whether these individuals are employed by the Registrant or a third party, and that relates to any element of the code of ethics description.
(d) The registrant has not granted any waivers, including an implicit waiver, from a provision of the code of ethics that applies to the Registrant’s principal executive officer, principal financial officer, principal accounting officer or controller, or persons performing similar functions, regardless of whether these individuals are employed by the Registrant or a third party, that relates to one or more of the items set forth in paragraph (b) of this item’s instructions.
(e) Not applicable.
(f) See the attached Exhibit.
Item 3. Audit Committee Financial Expert.
3(a)(1) The Registrant’s Board of Trustees has determined that the registrant has at least one audit committee financial expert serving on its audit committee.
3(a)(2) The audit committee financial experts are Glen F. Bergert and R. Michael Sentel, who are “independent” for purposes of this Item 3 of Form N-CSR.
3(a)(3) Not applicable.
Table of Contents
Item 4. Principal Accountant Fees and Services.
(a) Audit Fees
In each of the fiscal years ended September 30, 2013 and September 30, 2012, the aggregate Audit Fees billed (or to be billed) by PricewaterhouseCoopers LLP (“PwC”) for professional services rendered for the audits of the financial statements, or services that are normally provided in connection with statutory and regulatory filings or engagements as well as reimbursable expenses are listed below. All of the below fees were paid by the Registrant.
| 2013 | 2012 | |||
$362,100 | $ | 353,548 | ||
(b) Audit-Related Fees
In each of the fiscal years ended September 30, 2013 and September 30, 2012, the aggregate Audit-Related Fees billed (or to be billed) by PwC for services rendered for assurance and related services to each fund that are reasonably related to the performance of the audit or review of the fund’s financial statements, but not reported as Audit Fees, are shown in the table below.
| 2013 | 2012 | |||
$0 | $ | 0 | ||
(c) Tax Fees
In each of the fiscal years ended September 30, 2013 and September 30, 2012 the aggregate Tax Fees billed (or to be billed) by PwC for professional services rendered for tax return preparation, tax compliance, tax advice and tax planning are shown in the table below. All of the below fees were paid by the Registrant.
| 2013 | 2012 | |||
$136,850 | $ | 128,000 | ||
(d) All Other Fees
In each of the fiscal years ended September 30, 2013 and September 30, 2012 the aggregate Other Fees billed (or to be billed) by PwC for all other non-audit services rendered are shown in the table below. All of the below fees were paid by the Registrant.
| 2013 | 2012 | |||
$0 | $ | 0 | ||
(e)(1) The audit committee of the Registrant’s Board of Trustees is required to pre-approve all services to be provided by the independent accountants to the Registrant or the Registrant’s investment adviser and to any entity controlling, controlled by or under common control with the investment adviser that provides on-going services to the Registrant to determine whether the services performed by the independent accountants impair their independence from the Registrant. The audit committee has delegated authority to the Chairman of the audit committee, subject to review and ratification by the full audit committee.
(e)(2) 100% of the fees were approved by the Registrant’s audit committee pursuant to paragraph (c)(7)(i)(C) if Rule 2-01 of Regulation S-X.
(f) For the fiscal year ended September 30, 2013, the percentage of hours spent on the audit of the Registrant’s financial statements that were attributed to work performed by persons who are not full-time, permanent employees of PwC was 0%.
(g) See Item 4(d) above.
Table of Contents
(h) There were no non-audit fees provided by PwC in the fiscal year ending September 30, 2013 or September 30, 2012 to the investment adviser or to any entity controlling, controlled by, or under common control with the investment adviser that provides on-going services to the Registrant.
Item 5. Audit Committee of Listed Registrants.
Not applicable.
Item 6. Investments.
(a) The schedule of investments in securities of unaffiliated issuers is included in Item 1.
(b) Not applicable.
Item 7. Disclosure of Proxy Voting Policies and Procedures for Closed-End Management Investment Companies.
Not applicable.
Item 8. Portfolio Managers of Closed-End Management Investment Companies.
Not applicable.
Item 9. Purchases of Equity Securities by Closed-End Management Investment Company and Affiliated Purchasers.
Not applicable.
Item 10. Submission of Matters to a Vote of Security Holders.
Not applicable.
Item 11. Controls and Procedures.
(a) The registrant’s principal executive officer and principal financial officer have concluded, based on their evaluation of the Registrant’s disclosure controls and procedures as conducted within 90 days of the filing date of this report, that these disclosure controls and procedures are adequately designed and are operating effectively to ensure that information required to be disclosed by the registrant on Form N-CSR is recorded, processed, summarized and reported within the time periods specified in the Securities and Exchange Commission’s rules and forms.
(b)There were no changes in the registrant’s internal control over financial reporting that occurred during the second fiscal quarter of the period covered by this report that have materially affected or are reasonably likely to materially affect, the registrant’s internal control over financial reporting.
Item 12. Exhibits.
(a)(1) The code of ethics is attached.
(a)(2) Certifications pursuant to Rule 30a-2(a) are attached.
(a)(3) Not applicable.
(b) Certifications pursuant to Rule 30a-2(b) are furnished herewith.
Table of Contents
SIGNATURES
Pursuant to the requirements of the Securities Exchange Act of 1934 and the Investment Company Act of 1940, the registrant has duly caused this report to be signed on its behalf by the undersigned, thereunto duly authorized.
| (Registrant) | ICON Funds |
| By (Signature and Title)* | /s/ Craig T. Callahan | |
| Craig T. Callahan, President and Chief Executive Officer (Principal Executive Officer) |
| Date | December 5, 2013 |
Pursuant to the requirements of the Securities Exchange Act of 1934 and the Investment Company Act of 1940, this report has been signed below by the following persons on behalf of the registrant and in the capacities and on the dates indicated.
| By (Signature and Title)* | /s/ Craig T. Callahan | |
| Craig T. Callahan, President and Chief Executive Officer (Principal Executive Officer) |
| Date | December 5, 2013 |
| By (Signature and Title)* | /s/ Carrie M. Schoffman | |
| Carrie M. Schoffman, Vice President, Chief Compliance Officer and Treasurer | ||
| (Principal Financial Officer and Principal Accounting Officer) |
| Date | December 5, 2013 |
| * | Print the name and title of each signing officer under his or her signature. |