UNITED STATES
SECURITIES AND EXCHANGE COMMISSION
Washington, D.C. 20549
FORM N-CSR
CERTIFIED SHAREHOLDER REPORT OF REGISTERED
MANAGEMENT INVESTMENT COMPANIES
Investment Company Act file number 811-07883
ICON Funds
(Exact name of registrant as specified in charter)
5299 DTC Blvd. Suite 1200 Greenwood Village, CO 80111
(Address of principal executive offices) (Zip code)
Erik L. Jonson 5299 DTC Blvd. Suite 1200 Greenwood Village, CO 80111
(Name and address of agent for service)
Registrant’s telephone number, including area code: 303-790-1600
Date of fiscal year end: September 30, 2012
Date of reporting period: September 30, 2012
Item 1. Reports to Stockholders.

2012 ANNUAL REPORT
ICON DIVERSIFIED FUNDS
INVESTMENT UPDATE
ICON Bond Fund
ICON Equity Income Fund
ICON Fund (formerly ICON Core Equity Fund)
ICON Long/Short Fund
ICON Risk-Managed Equity Fund

1-800-764-0442 | www.iconfunds.com
AR-DIV-12-K31247

You can now sign up for electronic delivery of ICON Fund shareholder reports, including prospectuses, annual reports, semiannual reports and proxy statements.
When these materials are available, you will receive an email from ICON with instructions on how to view the documents. Statements, transaction confirmations and other documents that are not available online will continue to be sent to you by U.S. mail.
Visit ICON’s website at www.iconfunds.com to learn more and sign up.
You may change or cancel your participation in eDelivery by visiting www.iconfunds.com, or you can request a hard copy of any of the materials free of charge by calling ICON Funds at 1-800-764-0442.
1-800-764-0442 • www.iconfunds.com
TABLEOF CONTENTS
ABOUT THIS REPORT (UNAUDITED)
Historical Returns
All total returns mentioned in this Report account for the change in a Fund’s per-share price and the reinvestment of any dividends, capital gain distributions and adjustments for financial statement purposes. If your account is set up to receive Fund distributions in cash rather than to reinvest them, your actual return may differ from these figures. The Funds’ performance results do not reflect the deduction of taxes that a shareholder would pay on Fund distributions or on the redemption of Fund shares. The Adviser may have reimbursed certain fees or expenses of some of the Funds. If not for these reimbursements, performance would have been lower. Fund results shown, unless otherwise indicated, are at net asset value. If a sales charge (maximum 5.75%) had been deducted, results would have been lower.
Past performance does not guarantee future results. Investment return and principal value will fluctuate so that an investor’s shares, when redeemed, may be worth more or less than their original cost. Performance results represent past performance, and current performance may be higher or lower. Please call 1-800-764-0442 or visit www.iconfunds.com for performance results current to the most recent month-end.
Portfolio Data
This Report reflects ICON’s views, opinions and portfolio holdings as of September 30, 2012, the end of the reporting period. The information is not a complete analysis of every aspect of any sector, industry, security or the Funds.
Opinions and forecasts regarding industries, companies and/or themes, and portfolio composition and holdings are subject to change at any time based on market and other conditions, and should not be construed as a recommendation of any specific security, industry or sector. Each Fund’s holdings as of September 30, 2012 are included in each Fund’s Schedule of Investments.
According to ICON, value investing is an analytical approach to investing that employs various factors, including projecting earnings growth estimates, in an effort to determine whether securities are over- or underpriced relative to ICON’s estimates of their intrinsic value. Value investing involves risks and uncertainties and does not guarantee better performance or lower costs than other investment methodologies. ICON’s value-to-price ratio (“V/P”) is a ratio of intrinsic value, as calculated using ICON’s proprietary valuation methodology, of a broad range of domestic and international securities
within ICON’s system as compared to the current market price of those securities. The ICON system relies on the integrity of the financial statements released to the market as part of our analysis.
This Report contains statements regarding industry or sector themes, new market themes, investment outlook, relative strength, value-to-price ratios, and investment team expectations, beliefs, goals and the like that are based on current expectations, recent individual stock performance relative to current market prices, estimates of company values and other information supplied to the market by the companies we follow. Words such as “expects,” “suggests,” “anticipates,” “targets,” “goals,” “value,” “intrinsic value,” “indicates,” “believes,” “considers,” “estimates,” variations of such words and similar expressions are intended to identify forward looking statements, which are not statements of historical fact. Forward looking statements are not guarantees of future performance and involve certain risks, uncertainties and assumptions that are difficult to assess. These risks and uncertainties are based on a number of important factors, including, among others: stock price fluctuations; the integrity and accuracy of historical and projected financial and other information supplied by companies to the public or assumptions based on such information supplied; interest rates; bond yields; future earnings growth rates; the risks noted in this Report and other factors beyond the control of our investment team but used by the investment team to influence their assumptions. Therefore, actual outcome may differ materially from what is expressed in such forward looking statements.
There are risks associated with mutual fund investing, including the loss of principal. The likelihood of loss may be greater if you invest for a shorter period of time. There is no assurance that the investment process will consistently lead to successful results.
There are risks associated with selling short, including the risk that the ICON Long/Short Fund may have to cover its short position at a higher price than the short price, resulting in a loss. The ICON Long/Short Fund’s loss on a short sale is potentially unlimited as a loss occurs when the value of a security sold short increases. Call options involve certain risks, such as limited gains and lack of liquidity in the underlying securities, and are not suitable for all investors.
Investing in fixed income securities such as bonds involves interest rate risk. When interest rates rise, the value of fixed income securities generally decreases. The ICON Bond Fund may invest up to 25% of its assets in high-yield bonds that are below investment grade. High-yield bonds involve a greater risk of default and price volatility than U.S. Government and other higher-quality bonds.
An investment concentrated in sectors and industries may involve greater risk and volatility than a more diversified investment.
Investments in foreign securities may entail unique risks, including political, market, and currency risks. Financial statements of foreign companies are governed by different accounting, auditing, and financial standards than U.S. companies and may be less transparent and uniform than in the United States. Many corporate governance standards, which help ensure the integrity of public information in the United States, do not exist in foreign countries. In general, there may be less governmental supervision of foreign stock exchanges and securities brokers and issuers. The ICON system relies on the integrity of financial statements released to the market as part of our analysis.
The prospectus and statement of additional information contain this and other information about the Funds and are available by visiting www.iconfunds.com or calling 1-800-764-0442. Please read the prospectus and statement of additional information carefully.
Comparative Indexes
The comparative indexes discussed in this Report are meant to provide a basis for judging a Fund’s performance against specific securities indexes. Each index shown accounts for both change in the security price and reinvestment of dividends and distributions (except as noted), but does not reflect the costs of managing a mutual fund. The Funds’ portfolios may significantly differ in holdings and composition from the index. Individuals cannot invest directly in an index.
| • | | The unmanaged Standard & Poor’s (“S&P”) Composite 1500 Index (“S&P Composite 1500 Index”) is a broad-based capitalization-weighted index comprising 1,500 stocks of large-cap, mid-cap, and small-cap U.S. companies. |
| • | | The unmanaged Barclays Capital U.S. Universal Index (ex-MBS) represents the union of the U.S. Aggregate Index, the U.S. High-Yield Corporate Index, the 144A Index, the Eurodollar Index and the Emerging Markets Index. All securities in this market-value weighted index have at least one year remaining to maturity and meet certain minimum issue size criteria. |
Index returns and statistical data included in this Report are provided by FactSet Research Systems.
Financial Intermediary
If you purchase the Fund through a broker-dealer or other financial intermediary (such as a bank), the Fund and its related companies may pay the intermediary for the sale of Fund shares and related services. These payments may influence the broker-dealer or other intermediary and your salesperson to recommend the Fund over another investment. Ask your salesperson or visit your financial intermediary’s website for more information.
| | | | |
MANAGEMENT OVERVIEW ICON BOND FUND | | Class C Class S Class A | | IOBCX IOBZX IOBAX |
| Q. | How did the Fund perform relative to its benchmark? |
| A. | For the Fund’s fiscal year ended September 30, 2012, the ICON Bond Fund outperformed its benchmark, the Barclays Capital US Universal Index ex MBS. The Fund’s Class S shares returned 9.93%, while the Barclays Capital US Universal ex MBS Index returned 7.48%. Class C shares returned 8.98% (8.13% with contingent deferred sales charge applied) while the Fund’s Class A shares returned 9.66% (4.49% with maximum sales charge). Total returns for other periods as of September 30, 2012 appear in the subsequent pages of this Fund’s Management Overview. |
| Q. | What primary factors were behind the Fund’s relative performance? |
| A. | Mirroring a trend seen in the equity markets, the fixed income market stabilized somewhat during fiscal year 2012 as investors shifted their focus towards solid fundamentals and away from European macro-economic concerns. Virtually all segments of the fixed income market produced positive returns during the fiscal year, with the largest returns coming from the corporate segment. Historically low default rates coupled with higher than normal credit spreads appealed to investors looking for more attractive yield opportunities than those presented by the US treasury market. The ICON Bond Fund’s focus on the corporate segment of the fixed income market was one of the main reasons the Fund outperformed its benchmark over the 12-month period. |
During the first six months of the fiscal year, the U.S. Generic Government 10-year Treasury security maintained a relatively tight yield range, trading right around 2%. Throughout this six-month period, corporate bonds led the fixed income segment of the market with especially strong returns coming from junk rated securities. The ICON Bond Fund performed well during this time period, as we had a significant underweight in the treasury segment of the market relative to the benchmark and a large overweight in the corporate segment with an emphasis on high yield. The second six months of the fiscal year began with a rather aggressive treasury rally, as yields on the U.S. Generic Government 10-year Treasury security fell from around 2% to approximately 1.6%. While corporate bonds still fared well during the second half of the fiscal year, the returns declined significantly as investor focus shifted more towards the relative safety of US treasuries and instruments with higher credit ratings. The ICON Bond Fund continued to outperform its benchmark in the second half of the fiscal
year. ICON model valuations pointed us towards a general increase in our treasury exposure and improvement in overall fund credit quality.
| Q. | How did the Fund’s composition affect performance? |
| A. | The Fund’s overweight position in corporate bonds contributed positively to Fund performance. Additionally, appropriately timed treasury exposure and improvement of fund credit quality resulted in the Fund’s outperforming its benchmark when investor sentiment shifted in the middle of the fiscal year. The Fund’s corporate bond allocation also resulted in relative outperformance as ICON’s valuation metrics guided us towards an overweight position in the investment grade and high yield segment of the market. Both of these areas outperformed the broad fixed income benchmark during the fiscal year. Finally, a small allocation to floating rate securities (that is, securities with variable interest rates) within the Fund contributed positively to overall performance. |
| Q. | What is your investment outlook for the bond market? |
| A. | ICON’s valuation system, which is quantitatively based on comparing historical relationships across the credit curve to current relationships, continues to see the most value within the corporate segment of the fixed income market. More specifically, we see a unique distribution of attractive valuations with opportunity in mid- to long-term high quality corporates and also in shorter term high yield bonds. Historically low default rates and wider than normal credit spreads provide investors with attractive yield opportunities for the risk they are taking. In the Treasury segment of the fixed income market, the yield curve has flattened out over the course of the last few months, with short-term interest rates nearing long-term interest rates, as the Federal Reserve continues to remain active in the market by implementing their most recent quantitative easing program. While we continue to see value in corporates, we remain cautious on treasury bonds. Although yields remain historically low, Fed intervention seems to be providing a general ceiling above rates for the time being and we don’t foresee a substantial upward movement in yields at this time. |
ICON Bond Fund
Credit Diversification
September 30, 2012
| | | | |
Aaa | | | 18.8% | |
Aa2 | | | 4.9% | |
Aa3 | | | 1.7% | |
A1 | | | 3.6% | |
A2 | | | 2.7% | |
A3 | | | 4.2% | |
Baa1 | | | 17.3% | |
Baa2 | | | 13.7% | |
Baa3 | | | 12.2% | |
Ba1 | | | 2.6% | |
Ba2 | | | 3.4% | |
| | | | |
Ba3 | | | 4.3% | |
B1 | | | 1.2% | |
B2 | | | 1.4% | |
B3 | | | 1.1% | |
| | | | |
| | | 93.1% | |
| | | | |
Percentages are based upon U.S. Treasury obligations, corporate and foreign corporate bond investments as a percentage of net assets.
Ratings based on Moody’s Investors Service, Inc.
ICON Bond Fund
Average Annual Total Return
as of September 30, 2012
| | | | | | | | | | | | | | | | | | | | | | | | |
| | | Inception
Date | | | 1 Year | | | 5 Years | | | Since
Inception | | | Gross
Expense
Ratio* | | | Net
Expense
Ratio* | |
ICON Bond Fund - Class C | | | 10/21/02 | | | | 8.98% | | | | 5.52% | | | | 4.93% | | | | 2.16% | | | | 1.60% | |
Barclays Capital U.S. Universal Index (ex-MBS) | | | | | | | 7.48% | | | | 6.61% | | | | 6.20% | | | | N/A | | | | N/A | |
ICON Bond Fund - Class S | | | 5/6/04 | | | | 9.93% | | | | 6.42% | | | | 5.43% | | | | 1.18% | | | | 0.75% | |
Barclays Capital U.S. Universal Index (ex-MBS) | | | | | | | 7.48% | | | | 6.61% | | | | 5.98% | | | | N/A | | | | N/A | |
ICON Bond Fund - Class A | | | 9/30/10 | | | | 9.66% | | | | N/A | | | | 4.70% | | | | 5.83% | | | | 1.01% | |
ICON Bond Fund - Class A (including maximum sales charge of 4.75%) | | | 9/30/10 | | | | 4.49% | | | | N/A | | | | 2.18% | | | | 5.83% | | | | 1.01% | |
Barclays Capital U.S. Universal Index (ex-MBS) | | | | | | | 7.48% | | | | 6.61% | | | | 5.96% | | | | N/A | | | | N/A | |
Past performance is not a guarantee of future results. Information about these performance results and the comparative indexes can be found in the About This Report section. The Advisor has agreed to limit certain Fund expenses; without these limitations, returns would have been lower. The limitation provisions may be terminated in the future.
| * | Please see the most recent prospectus for details. |
Class C total returns exclude applicable sales charges. If sales charges were included returns would be lower.
ICON Bond Fund
Value of a $10,000 Investment
through September 30, 2012
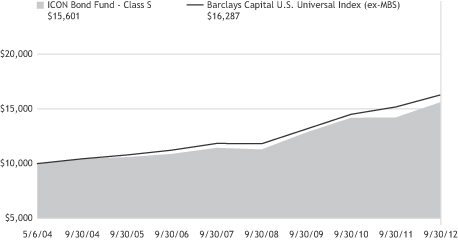
Past performance is not a guarantee of future results. The above graph compares a $10,000 investment made in the Fund’s Class S shares on the Class’ inception date of 5/6/04 to a $10,000 investment made in an unmanaged securities index on that date. Performance for the Fund’s other share classes will vary due to differences in charges and expenses. The Fund’s performance in this chart and the performance table assumes the reinvestment of dividends and capital gain distributions but does not reflect the deduction of taxes that a shareholder would pay on Fund distributions or on the redemption of Fund shares.
ICON BOND FUND
SCHEDULEOF INVESTMENTS
SEPTEMBER 30, 2012
| | | | | | | | | | | | | | | | |
| Shares or Principal Amount | | Interest
Rate | | | Maturity
Date | | | Value | |
| | | | | | | | | | | | | | | | |
| | Corporate Bonds (73.6%) | | | | | | | | | | | | |
| $ | 220,000 | | | ACE INA Holdings, Inc. | | | 8.88 | % | | | 08/15/29 | | | $ | 335,095 | |
| | 500,000 | | | Ally Financial, Inc. | | | 6.75 | % | | | 12/01/14 | | | | 533,880 | |
| | 152,000 | | | Altria Group, Inc. | | | 9.25 | % | | | 08/06/19 | | | | 215,826 | |
| | 450,000 | | | Altria Group, Inc. | | | 9.95 | % | | | 11/10/38 | | | | 756,612 | |
| | 1,000,000 | | | Ameren Energy Generating Co.(a) | | | 7.00 | % | | | 04/15/18 | | | | 970,000 | |
| | 1,440,000 | | | American Express Bank FSB(b) | | | 0.53 | % | | | 06/12/17 | | | | 1,390,195 | |
| | 1,000,000 | | | American Express Co. | | | 7.00 | % | | | 03/19/18 | | | | 1,265,613 | |
| | 900,000 | | | American International Group, Inc. | | | 4.25 | % | | | 05/15/13 | | | | 918,207 | |
| | 500,000 | | | AmeriGas Finance LLC/AmeriGas Finance Corp. | | | 7.00 | % | | | 05/20/22 | | | | 538,750 | |
| | 500,000 | | | Amgen, Inc. | | | 3.88 | % | | | 11/15/21 | | | | 537,261 | |
| | 900,000 | | | AT&T, Inc. | | | 5.80 | % | | | 02/15/19 | | | | 1,119,477 | |
| | 300,000 | | | AutoNation, Inc. | | | 5.50 | % | | | 02/01/20 | | | | 320,250 | |
| | 800,000 | | | Avnet, Inc. | | | 6.00 | % | | | 09/01/15 | | | | 875,575 | |
| | 500,000 | | | B&G Foods, Inc. | | | 7.63 | % | | | 01/15/18 | | | | 540,000 | |
| | 1,000,000 | | | Ball Corp. | | | 5.00 | % | | | 03/15/22 | | | | 1,047,500 | |
| | 950,000 | | | Bank of America NA(b) | | | 0.69 | % | | | 06/15/17 | | | | 873,580 | |
| | 1,000,000 | | | BB&T Corp. | | | 5.25 | % | | | 11/01/19 | | | | 1,157,196 | |
| | 950,000 | | | Berkshire Hathaway Finance Corp. | | | 4.25 | % | | | 01/15/21 | | | | 1,082,277 | |
| | 700,000 | �� | | Berkshire Hathaway Finance Corp.(a) | | | 3.00 | % | | | 05/15/22 | | | | 725,672 | |
| | 500,000 | | | CA, Inc. | | | 5.38 | % | | | 12/01/19 | | | | 572,976 | |
| | 450,000 | | | Central Garden and Pet Co. | | | 8.25 | % | | | 03/01/18 | | | | 477,000 | |
| | 400,000 | | | Chesapeake Energy Corp.(a) | | | 9.50 | % | | | 02/15/15 | | | | 440,500 | |
| | 550,000 | | | CIT Group, Inc. | | | 5.00 | % | | | 08/15/22 | | | | 572,223 | |
| | 9,000 | | | Citigroup, Inc. | | | 6.00 | % | | | 08/15/17 | | | | 10,483 | |
| | 450,000 | | | Coca-Cola Co. | | | 4.88 | % | | | 03/15/19 | | | | 536,413 | |
| | 450,000 | | | Comcast Cable Holdings, LLC | | | 9.46 | % | | | 11/15/22 | | | | 671,866 | |
| | 1,000,000 | | | Commercial Metals Co. | | | 7.35 | % | | | 08/15/18 | | | | 1,052,500 | |
| | 400,000 | | | Constellation Brands, Inc. | | | 7.25 | % | | | 09/01/16 | | | | 458,000 | |
| | 114,000 | | | Cox Communications, Inc. | | | 7.63 | % | | | 06/15/25 | | | | 143,512 | |
| | 450,000 | | | Dean Foods Co. | | | 6.90 | % | | | 10/15/17 | | | | 479,250 | |
| | 400,000 | | | DISH DBS Corp. | | | 7.13 | % | | | 02/01/16 | | | | 442,000 | |
| | 800,000 | | | Dollar General Corp. | | | 4.13 | % | | | 07/15/17 | | | | 836,000 | |
| | 500,000 | | | Ecolab, Inc. | | | 4.35 | % | | | 12/08/21 | | | | 567,236 | |
| | 300,000 | | | Endo Health Solutions, Inc. | | | 7.00 | % | | | 07/15/19 | | | | 323,250 | |
| | | | |
| SCHEDULEOF INVESTMENTS | | | 11 | |
| | | | | | | | | | | | | | | | |
| Shares or Principal Amount | | Interest
Rate | | | Maturity
Date | | | Value | |
| | | | | | | | | | | | | | | | |
| $ | 450,000 | | | Entergy Corp. | | | 3.63 | % | | | 09/15/15 | | | $ | 473,382 | |
| | 500,000 | | | ERP Operating L.P. | | | 5.38 | % | | | 08/01/16 | | | | 573,528 | |
| | 750,000 | | | Exelon Generation Co., LLC | | | 6.20 | % | | | 10/01/17 | | | | 892,646 | |
| | 900,000 | | | Exelon Generation Co., LLC | | | 4.00 | % | | | 10/01/20 | | | | 954,542 | |
| | 500,000 | | | Fiserv, Inc. | | | 4.75 | % | | | 06/15/21 | | | | 547,015 | |
| | 400,000 | | | Ford Motor Credit Co., LLC | | | 8.00 | % | | | 06/01/14 | | | | 441,742 | |
| | 1,000,000 | | | Ford Motor Credit Co., LLC | | | 5.63 | % | | | 09/15/15 | | | | 1,093,068 | |
| | 900,000 | | | Gap, Inc. | | | 5.95 | % | | | 04/12/21 | | | | 1,002,527 | |
| | 500,000 | | | General Electric Capital Corp. | | | 4.75 | % | | | 09/15/14 | | | | 537,731 | |
| | 1,000,000 | | | General Electric Capital Corp.(b) | | | 0.64 | % | | | 05/11/16 | | | | 973,094 | |
| | 500,000 | | | Google, Inc. | | | 3.63 | % | | | 05/19/21 | | | | 562,523 | |
| | 1,000,000 | | | HCP, Inc. | | | 5.65 | % | | | 12/15/13 | | | | 1,055,436 | |
| | 1,500,000 | | | HCP, Inc. | | | 6.30 | % | | | 09/15/16 | | | | 1,718,452 | |
| | 500,000 | | | HCP, Inc. | | | 6.70 | % | | | 01/30/18 | | | | 599,598 | |
| | 450,000 | | | Hospira, Inc. | | | 6.05 | % | | | 03/30/17 | | | | 520,331 | |
| | 500,000 | | | Hospira, Inc. | | | 5.60 | % | | | 09/15/40 | | | | 528,066 | |
| | 500,000 | | | International Lease Finance Corp. | | | 4.88 | % | | | 04/01/15 | | | | 519,706 | |
| | 300,000 | | | Jarden Corp. | | | 7.50 | % | | | 01/15/20 | | | | 331,500 | |
| | 474,700 | | | JC Penney Corp., Inc. | | | 7.95 | % | | | 04/01/17 | | | | 490,128 | |
| | 800,000 | | | JC Penney Corp., Inc.(a) | | | 5.75 | % | | | 02/15/18 | | | | 760,000 | |
| | 450,000 | | | John Hancock Life Insurance Co.(c)(d) | | | 7.38 | % | | | 02/15/24 | | | | 564,696 | |
| | 1,200,000 | | | Johnson & Johnson | | | 2.95 | % | | | 09/01/20 | | | | 1,302,521 | |
| | 1,000,000 | | | JPMorgan Chase Bank NA(b) | | | 0.73 | % | | | 06/13/16 | | | | 963,778 | |
| | 450,000 | | | Juniper Networks, Inc. | | | 3.10 | % | | | 03/15/16 | | | | 470,835 | |
| | 900,000 | | | Kellogg Co. | | | 4.00 | % | | | 12/15/20 | | | | 1,008,932 | |
| | 500,000 | | | Life Technologies Corp. | | | 3.50 | % | | | 01/15/16 | | | | 526,285 | |
| | 400,000 | | | Limited Brands, Inc. | | | 5.63 | % | | | 02/15/22 | | | | 431,000 | |
| | 900,000 | | | Lockheed Martin Corp. | | | 4.25 | % | | | 11/15/19 | | | | 1,018,563 | |
| | 1,400,000 | | | Lorillard Tobacco Co.(a) | | | 6.88 | % | | | 05/01/20 | | | | 1,718,660 | |
| | 500,000 | | | Mead Johnson Nutrition Co. | | | 4.90 | % | | | 11/01/19 | | | | 570,531 | |
| | 450,000 | | | Medco Health Solutions, Inc. | | | 2.75 | % | | | 09/15/15 | | | | 470,716 | |
| | 350,000 | | | Merrill Lynch & Co., Inc. | | | 5.45 | % | | | 02/05/13 | | | | 355,348 | |
| | 900,000 | | | Microsoft Corp. | | | 5.30 | % | | | 02/08/41 | | | | 1,184,647 | |
| | 900,000 | | | Morgan Stanley(b) | | | 0.94 | % | | | 10/15/15 | | | | 857,542 | |
| | 950,000 | | | Morgan Stanley(e) | | | 3.50 | % | | | 10/15/20 | | | | 941,388 | |
| | 1,000,000 | | | National City Corp. | | | 6.88 | % | | | 05/15/19 | | | | 1,234,526 | |
| | 900,000 | | | Novartis Capital Corp. | | | 4.40 | % | | | 04/24/20 | | | | 1,061,424 | |
| | 900,000 | | | PepsiCo, Inc. | | | 5.00 | % | | | 06/01/18 | | | | 1,069,688 | |
| | 600,000 | | | Pitney Bowes, Inc.(a) | | | 4.75 | % | | | 05/15/18 | | | | 629,739 | |
| | 750,000 | | | PPL Energy Supply LLC(a) | | | 6.50 | % | | | 05/01/18 | | | | 887,599 | |
| | 900,000 | | | Reynolds American, Inc. | | | 7.25 | % | | | 06/01/13 | | | | 937,324 | |
| | |
| 12 | | SCHEDULEOF INVESTMENTS |
| | | | | | | | | | | | | | | | |
| Shares or Principal Amount | | Interest
Rate | | | Maturity
Date | | | Value | |
| | | | | | | | | | | | | | | | |
| $ | 1,000,000 | | | Rowan Cos., Inc. | | | 7.88 | % | | | 08/01/19 | | | $ | 1,239,773 | |
| | 1,350,000 | | | Southern Copper Corp. | | | 5.38 | % | | | 04/16/20 | | | | 1,517,620 | |
| | 1,000,000 | | | Suntrust Banks, Inc.(b) | | | 0.76 | % | | | 04/01/15 | | | | 973,212 | |
| | 500,000 | | | Tennessee Gas Pipeline Co. | | | 7.00 | % | | | 10/15/28 | | | | 668,026 | |
| | 400,000 | | | Toll Brothers Finance Corp. | | | 6.75 | % | | | 11/01/19 | | | | 456,276 | |
| | 1,000,000 | | | Torchmark Corp. | | | 6.38 | % | | | 06/15/16 | | | | 1,139,811 | |
| | 450,000 | | | TransDigm, Inc. | | | 7.75 | % | | | 12/15/18 | | | | 497,250 | |
| | 850,000 | | | Valmont Industries, Inc. | | | 6.63 | % | | | 04/20/20 | | | | 1,011,968 | |
| | 500,000 | | | Ventas Realty L.P./Ventas Capital Corp. | | | 4.75 | % | | | 06/01/21 | | | | 549,516 | |
| | 450,000 | | | Vornado Realty L.P. | | | 4.25 | % | | | 04/01/15 | | | | 475,554 | |
| | 500,000 | | | Wachovia Corp. | | | 5.25 | % | | | 08/01/14 | | | | 537,438 | |
| | 450,000 | | | Wal-Mart Stores, Inc. | | | 4.13 | % | | | 02/01/19 | | | | 513,253 | |
| | 500,000 | | | Wal-Mart Stores, Inc. | | | 4.25 | % | | | 04/15/21 | | | | 587,978 | |
| | 900,000 | | | Wells Fargo Bank NA(b) | | | 0.65 | % | | | 05/16/16 | | | | 875,043 | |
| | 1,000,000 | | | Willis North America, Inc. | | | 6.20 | % | | | 03/28/17 | | | | 1,139,592 | |
| | 450,000 | | | Windstream Corp. | | | 8.13 | % | | | 08/01/13 | | | | 472,500 | |
| | | | | | | | | | | | | | | | |
| Total Corporate Bonds
(Cost $64,014,746) | | | | | | | | | | | 68,221,742 | |
| | U.S. Treasury Obligations (16.1%) | | | | | | | | | | | | |
| | 2,500,000 | | | U.S. Treasury Note | | | 2.13 | % | | | 08/15/21 | | | | 2,644,530 | |
| | 2,500,000 | | | U.S. Treasury Note | | | 1.25 | % | | | 01/31/19 | | | | 2,553,320 | |
| | 1,500,000 | | | U.S. Treasury Note | | | 2.00 | % | | | 02/15/22 | | | | 1,560,117 | |
| | 1,500,000 | | | U.S. Treasury Note | | | 0.63 | % | | | 08/31/17 | | | | 1,500,937 | |
| | 2,000,000 | | | U.S. Treasury Note | | | 3.63 | % | | | 02/15/20 | | | | 2,356,876 | |
| | 2,000,000 | | | U.S. Treasury Note | | | 2.38 | % | | | 07/31/17 | | | | 2,169,376 | |
| | 2,000,000 | | | U.S. Treasury Note | | | 1.88 | % | | | 08/31/17 | | | | 2,122,968 | |
| | | | | | | | | | | | | | | | |
| Total U.S. Treasury Obligations
(Cost $14,042,078) | | | | | | | | | | | 14,908,124 | |
| | Foreign Corporate Bonds (3.4%) | | | | | | | | | | | | |
| | 900,000 | | | AngloGold Ashanti Holdings PLC | | | 5.38 | % | | | 04/15/20 | | | | 945,000 | |
| | 1,000,000 | | | Gold Fields Orogen Holding BVI, Ltd.(c)(d) | | | 4.88 | % | | | 10/07/20 | | | | 1,017,108 | |
| | 900,000 | | | Vale Overseas, Ltd. | | | 8.25 | % | | | 01/17/34 | | | | 1,165,378 | |
| | | | | | | | | | | | | | | | |
| Total Foreign Corporate Bonds
(Cost $3,014,159) | | | | | | | | | | | 3,127,486 | |
| | Collateral for Securities on Loan (5.6%) | | | | | | | | | | | | |
| | 5,182,350 | | | State Street Navigator Prime Portfolio | | | | | | | | | | | 5,182,350 | |
| | | | | | | | | | | | | | | | |
| Total Collateral for Securities on Loan
(Cost $5,182,350) | | | | | | | | | | | 5,182,350 | |
| | | | |
| SCHEDULEOF INVESTMENTS | | | 13 | |
| | | | | | | | | | | | |
| Shares or Principal Amount | | | | | | Value | |
| | | | | | | | | | | | |
| | Short-Term Investment (7.3%) | | | | | | | | |
| $ | 6,815,975 | | | State Street Euro Dollar Time Deposit (USD),
0.01%, 10/01/12 | | | | | | $ | 6,815,975 | |
| | | | | | | | | | | | |
| Total Short-Term Investments
(Cost $6,815,975) | | | | | | | 6,815,975 | |
| Total Investments 106.0%
(Cost $93,069,308) | | | | | | | 98,255,677 | |
| | Liabilities Less Other Assets (6.0)% | | | | | | | (5,587,500 | ) |
| | | | | | | | | | | | |
| | Net Assets 100.0% | | | | | | $ | 92,668,177 | |
| | | | | | | | | | | | |
The accompanying notes are an integral part of the financial statements.
| (a) | All or a portion of the security was on loan as of September 30, 2012. |
| (b) | Floating Rate Security. Rate disclosed is as of September 30, 2012. |
| (c) | Security was acquired pursuant to Rule 144A of the Securities Act of 1933 and may be deemed to be restricted for resale. |
| (d) | These securities are considered to be illiquid. The aggregate value of the these securities at September 30, 2012 was $1,581,804, which represent 1.7% of the Fund’s Net Assets. |
| (e) | Step Bond – the coupon is at a fixed rate and resets at a specific date and rate. The rate disclosed is as of September 30, 2012. |
| | |
| 14 | | SCHEDULEOF INVESTMENTS |
| | | | |
MANAGEMENT OVERVIEW ICON EQUITY INCOME FUND | | Class S Class C Class A | | IOEZX IOECX IEQAX |
| Q. | How did the Fund perform relative to its benchmarks? |
| A. | For the fiscal year ending September 30, 2012, the ICON Equity Income Fund, Class S shares, returned 24.43%, lagging its S&P Composite 1500 Index benchmark, which rose 30.18%. The Fund’s Class A shares returned 24.10% (and 16.95% with maximum sales charge) and the Fund’s Class C shares returned 23.31% (22.31% with contingent deferred sales charge) during the same period. Total returns for other periods as of September 30, 2012 appear in the subsequent pages of this Fund’s Management Overview. |
| Q. | What primary factors were behind the Fund’s relative performance? |
| A. | Concerns regarding Europe’s economic woes spreading to the US were validated by sub-2% year-over-year GDP growth reported for the first two quarters of 2011. Over the course of the 12-month fiscal year, these concerns have abated somewhat. GDP year-over-year growth rates have held above 2% since the last quarter of 2011, moderating the anticipated adverse effect for the European crises. Action by the Federal Reserve, and, in particular, the Fed’s continued quantitative easing, has also proven generally positive for the equity markets. Still, as the broad market rose, dividend paying stocks, including those in the Fund, had a difficult time keeping pace. Stocks in the Fund’s benchmark with reported dividend yields 2% or higher had a weighted average return of 28% versus a 32% return for stocks with dividend yields below 2%. This underperformance created a head wind for the Equity Income Fund and the Fund’s dividend paying holdings proved detrimental to the Fund’s relative performance. |
| Q. | How did the Fund’s composition affect performance? |
| A. | The ICON Equity Income Fund’s composition can be analyzed by both asset class and the individual securities that reflect each asset class. The Fund held fixed income securities over the course of the fiscal year, including both corporate bonds and preferred equities. Yields, on average, fell over the course of the year and there was a general tightening of corporate spreads relative to treasuries, which was beneficial to the Fund’s fixed-income holdings. Financial bonds in particular benefitted from these corporate spreads. For example, the Fund held a position in 2020 Goldman Sachs bonds priced at 99.31 on September 30, 2011 and by the end of the fiscal year the bond had |
| | appreciated to 111.60. While this 12% gain is impressive for a fixed-income security, it is not enough, even with the interest paid over the year, to compete with the 30.18% returns for the broad equity market over the same 12-month period. As a result, the 6% weighted average in fixed income securities held by the Fund during the fiscal year was a net detractor from the Fund’s relative performance. |
The fixed-income positions alone do not fully explain the Fund’s underperformance, however. The Fund’s equity holdings likewise lagged the Fund’s S&P 1500 benchmark. This underperformance is due primarily to the Fund’s exposure in the Financials and Energy sectors. In the Financials sector, for example, the Fund’s asset management industry holdings had a weighted average return of about 12% compared to a 34% return for the industry’s benchmark’s position. In contrast, the Fund’s overweight of the Consumer Discretionary sector was a positive factor and helped offset some of the underperformance from the Fund’s Energy and Financials sector holdings.
Derivative products also played a role in Fund performance. In light of the liquidity and general lack of availability of convertible bonds, the Fund occasionally held a combination of fixed-income securities paired with long equity call options to approximate a convertible bond. Over the past year, these positions were a net positive for the Fund. For example, the Fund held a blended position of Delphi Financial Group Bonds and corresponding positions of long Delphi Financial Group calls. On December 21, 2011 Delphi was bought out at $43.875 per share. This buy out price put the call options in the money and the price of the option rose substantially, contributing to Fund performance.
| Q. | What is your investment outlook for the overall market? |
| A. | In light of the most recent round of quantitative easing initiated by the Federal Reserve in September 2012 and an overall average value-to-price ratio for the domestic market of 1.39 as we head into fiscal year 2013, we are optimistic regarding the opportunities for the ICON Equity Income Fund. Additionally, we have seen a number of companies increase the size of their dividends or paying dividends for the first time. This, in turn, may create more opportunities for the Fund and our investors. |
ICON Equity Income Fund
Sector Composition
September 30, 2012
| | | | |
Industrials | | | 17.8% | |
Financial | | | 15.9% | |
Consumer Discretionary | | | 15.8% | |
Energy | | | 11.3% | |
Health Care | | | 9.5% | |
Consumer Staples | | | 8.1% | |
Information Technology | | | 7.9% | |
Utilities | | | 5.9% | |
Materials | | | 2.8% | |
| | | | |
| | | 95.0% | |
| | | | |
Percentages are based upon common and preferred stocks as a percentage of net assets.
ICON Equity Income Fund
Industry Composition
September 30, 2012
| | | | |
Integrated Oil & Gas | | | 8.2% | |
Pharmaceuticals | | | 5.0% | |
Integrated Telecommunication Services | | | 4.8% | |
Systems Software | | | 4.2% | |
Industrial Conglomerates | | | 4.1% | |
Asset Management & Custody Banks | | | 2.9% | |
Aerospace & Defense | | | 2.7% | |
Leisure Products | | | 2.7% | |
Diversified Banks | | | 2.6% | |
Industrial Machinery | | | 2.6% | |
Cable & Satellite | | | 2.4% | |
Health Care Equipment | | | 2.4% | |
Movies & Entertainment | | | 2.4% | |
Tobacco | | | 2.4% | |
Other Diversified Financial Services | | | 2.2% | |
Packaged Foods & Meats | | | 2.1% | |
Biotechnology | | | 2.1% | |
Consumer Finance | | | 2.1% | |
Mortgage REIT’s | | | 2.1% | |
Specialized REIT’s | | | 2.0% | |
Environmental & Facilities Services | | | 1.8% | |
Oil & Gas Drilling | | | 1.8% | |
Electrical Components & Equipment | | | 1.8% | |
Internet Software & Services | | | 1.6% | |
| | | | |
Advertising | | | 1.6% | |
Restaurants | | | 1.6% | |
Steel | | | 1.6% | |
General Merchandise Stores | | | 1.4% | |
Brewers | | | 1.4% | |
Computer & Electronics Retail | | | 1.4% | |
Thrifts & Mortgage Finance | | | 1.3% | |
Construction & Farm Machinery & Heavy Trucks | | | 1.3% | |
Oil & Gas Refining & Marketing | | | 1.3% | |
Soft Drinks | | | 1.3% | |
Publishing | | | 1.2% | |
Industrial Gases | | | 1.2% | |
Air Freight & Logistics | | | 1.2% | |
Office Electronics | | | 1.2% | |
Railroads | | | 1.2% | |
Diversified Support Services | | | 1.1% | |
Wireless Telecommunication Services | | | 1.0% | |
Computer Storage & Peripherals | | | 1.0% | |
Home Improvement Retail | | | 1.0% | |
Other Industries (each less than 1%) | | | 1.7% | |
| | | | |
| | | 95.0% | |
| | | | |
Percentages are based upon common and preferred stocks as a percentage of net assets.
ICON Equity Income Fund
Average Annual Total Return
as of September 30, 2012
| | | | | | | | | | | | | | | | | | | | | | | | |
| | | Inception
Date | | | 1 Year | | | 5 Years | | | Since
Inception | | | Gross
Expense
Ratio* | | | Net
Expense
Ratio* | |
ICON Equity Income Fund - Class C | | | 11/8/02 | | | | 23.31% | | | | -0.86% | | | | 5.97% | | | | 2.53% | | | | 2.20% | |
S&P Composite 1500 Index | | | | | | | 30.18% | | | | 1.36% | | | | 7.47% | | | | N/A | | | | N/A | |
ICON Equity Income Fund - Class S | | | 5/10/04 | | | | 24.43% | | | | 0.14% | | | | 4.98% | | | | 3.99% | | | | 1.20% | |
S&P Composite 1500 Index | | | | | | | 30.18% | | | | 1.36% | | | | 5.90% | | | | N/A | | | | N/A | |
ICON Equity Income Fund - Class A | | | 5/31/06 | | | | 24.10% | | | | -0.13% | | | | 2.52% | | | | 1.91% | | | | 1.45% | |
ICON Equity Income Fund - Class A (including maximum sales charge of 5.75%) | | | 5/31/06 | | | | 16.95% | | | | -1.31% | | | | 1.56% | | | | 1.91% | | | | 1.45% | |
S&P Composite 1500 Index | | | | | | | 30.18% | | | | 1.36% | | | | 4.34% | | | | N/A | | | | N/A | |
Past performance is not a guarantee of future results. Information about these performance results and the comparative indexes can be found in the About This Report section. The Adviser has agreed to limit certain Fund expenses; without these limitations, returns would have been lower. The limitation provisions may be terminated in the future.
| * | Please see the most recent prospectus for details. |
Class C total returns exclude applicable sales charges. If sales charges were included returns would be lower.
ICON Equity Income Fund
Value of a $10,000 Investment
through September 30, 2012
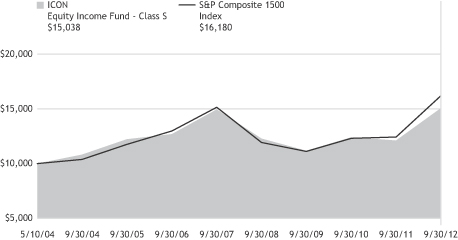
Past performance is not a guarantee of future results. The above graph compares a $10,000 investment made in the Fund’s Class S shares on the Class’ inception date of 5/10/04 to a $10,000 investment made in an unmanaged securities index on that date. Performance for the Fund’s other share classes will vary due to differences in charges and expenses. The Fund’s performance in this chart and the performance table assumes the reinvestment of dividends and capital gain distributions but does not reflect the deduction of taxes that a shareholder would pay on Fund distributions or on the redemption of Fund shares.
ICON EQUITY INCOME FUND
SCHEDULEOF INVESTMENTS
SEPTEMBER 30, 2012
| | | | | | | | |
| Shares or Principal Amount | | Value | |
| | | | | | | | |
| | Common Stocks (92.9%) | |
| | 3,800 | | | 3M Co. | | $ | 351,196 | |
| | 3,400 | | | Air Products & Chemicals, Inc. | | | 281,180 | |
| | 8,000 | | | Altria Group, Inc. | | | 267,120 | |
| | 28,100 | | | Annaly Capital Management, Inc., REIT(a) | | | 473,204 | |
| | 5,200 | | | AstraZeneca PLC, ADR | | | 248,872 | |
| | 6,400 | | | AT&T, Inc. | | | 241,280 | |
| | 4,100 | | | Baxter International, Inc. | | | 247,066 | |
| | 5,400 | | | BCE, Inc. | | | 237,276 | |
| | 4,500 | | | BP PLC, ADR | | | 190,620 | |
| | 8,400 | | | CA, Inc. | | | 216,426 | |
| | 3,500 | | | Caterpillar, Inc. | | | 301,140 | |
| | 3,400 | | | Chevron Corp. | | | 396,304 | |
| | 12,800 | | | CSX Corp. | | | 265,600 | |
| | 6,500 | | | Darden Restaurants, Inc. | | | 362,375 | |
| | 6,600 | | | Dr. Pepper Snapple Group, Inc. | | | 293,898 | |
| | 5,600 | | | Eaton Corp.(a) | | | 264,656 | |
| | 8,400 | | | Emerson Electric Co. | | | 405,468 | |
| | 15,600 | | | ENI SpA, ADR | | | 683,904 | |
| | 7,700 | | | Ensco PLC, Class A | | | 420,112 | |
| | 10,400 | | | Entertainment Properties Trust, REIT | | | 462,072 | |
| | 6,700 | | | Exxon Mobil Corp. | | | 612,715 | |
| | 13,500 | | | Federated Investors, Inc., Class B(a) | | | 279,315 | |
| | 15,000 | | | GameStop Corp., Class A(a) | | | 315,000 | |
| | 26,000 | | | General Electric Co. | | | 590,460 | |
| | 7,000 | | | Hasbro, Inc. | | | 267,190 | |
| | 11,300 | | | Healthcare Services Group, Inc. | | | 258,431 | |
| | 4,500 | | | HJ Heinz Co. | | | 251,775 | |
| | 5,600 | | | Illinois Tool Works, Inc. | | | 333,032 | |
| | | | | | | | |
| Shares or Principal Amount | | Value | |
| | | | | | | | |
| | 11,200 | | | j2 Global, Inc.(a) | | $ | 367,584 | |
| | 5,900 | | | Johnson & Johnson | | | 406,569 | |
| | 12,300 | | | JPMorgan Chase & Co. | | | 497,904 | |
| | 4,400 | | | Lockheed Martin Corp. | | | 410,872 | |
| | 7,300 | | | Lowe’s Cos., Inc. | | | 220,752 | |
| | 1,900 | | | M&T Bank Corp. | | | 180,804 | |
| | 10,100 | | | Mattel, Inc. | | | 358,348 | |
| | 7,200 | | | Medtronic, Inc. | | | 310,464 | |
| | 25,100 | | | Microsoft Corp. | | | 747,478 | |
| | 7,100 | | | Molson Coors Brewing Co., Class B | | | 319,855 | |
| | 8,300 | | | Nippon Telegraph & Telephone Corp., ADR | | | 196,793 | |
| | 9,400 | | | Nucor Corp. | | | 359,644 | |
| | 7,100 | | | Omnicom Group, Inc. | | | 366,076 | |
| | 61,900 | | | PDL BioPharma, Inc.(a) | | | 476,011 | |
| | 25,500 | | | People’s United Financial, Inc. | | | 309,570 | |
| | 20,200 | | | Pfizer, Inc. | | | 501,970 | |
| | 15,500 | | | Republic Services, Inc. | | | 426,405 | |
| | 6,500 | | | Reynolds American, Inc. | | | 281,710 | |
| | 6,000 | | | Rogers Communications, Inc., Class B | | | 242,400 | |
| | 5,200 | | | Target Corp. | | | 330,044 | |
| | 10,000 | | | Thomson Reuters Corp. | | | 288,600 | |
| | 5,900 | | | Time Warner Cable, Inc. | | | 560,854 | |
| | 6,100 | | | Time Warner, Inc. | | | 276,513 | |
| | 6,300 | | | Unilever PLC, ADR | | | 230,076 | |
| | 3,900 | | | United Parcel Service, Inc., Class B | | | 279,123 | |
| | 2,800 | | | United Technologies Corp. | | | 219,212 | |
| | 9,500 | | | Valero Energy Corp. | | | 300,960 | |
| | 9,300 | | | Verizon Communications, Inc. | | | 423,801 | |
| | 5,200 | | | Viacom, Inc., Class B | | | 278,668 | |
| | |
| 20 | | SCHEDULEOF INVESTMENTS |
| | | | | | | | |
| Shares or Principal Amount | | Value | |
| | | | | | | | |
| | 11,800 | | | Waddell & Reed Financial, Inc., Class A | | $ | 386,686 | |
| | 5,900 | | | Walgreen Co. | | | 214,996 | |
| | 17,500 | | | Wells Fargo & Co. | | | 604,275 | |
| | 5,900 | | | Western Digital Corp. | | | 228,507 | |
| | 36,500 | | | Xerox Corp. | | | 267,910 | |
| | | | | | | | |
| Total Common Stocks
(Cost $19,509,798)
| | | 21,389,121 | |
| | | | | | | | |
| Shares or Principal Amount | | Value | |
| | | | | | | | |
| | Preferred Stock (2.1%) | |
| | 18,400 | | | Capital One Capital II(a) | | $ | 474,904 | |
| | | | | | | | |
| Total Preferred Stocks
(Cost $472,753) | | | 474,904 | |
| | | | | | | | | | | | | | | | |
| Shares or Principal Amount | | Interest
Rate | | | Maturity
Date | | | Value | |
| | Corporate Bonds (4.0%) | |
| $ | 350,000 | | | Commercial Metals Co. | | | 7.35% | | | | 08/15/18 | | | $ | 368,375 | |
| | 500,000 | | | Goldman Sachs Group, Inc. | | | 5.38% | | | | 03/15/20 | | | | 557,983 | |
| | | | | | | | | | | | | | | | |
| Total Corporate Bonds
(Cost $879,430) |
| | | 926,358 | |
| | | | | | | | |
| Underlying Security/Expiration Date/Exercise Price | | Contracts* | | | Value | |
| Call Options Purchased (0.2%) | | | | | |
Archer-Daniels-Midland Co., January 2013, $35.00 | | | 69 | | | $ | 276 | |
Commercial Metals Co., December 2012, $13.00 | | | 200 | | | | 19,000 | |
Goldman Sachs Group, Inc., January 2013, $120.00 | | | 42 | | | | 16,485 | |
| | | | | | | | |
Total Call Options Purchased
(Cost $88,318) | | | | 35,761 | |
| | | | | | |
| |
| Shares or Principal Amount | | Value | |
| Collateral for Securities on Loan (7.2%) | |
| 1,657,072 | | State Street Navigator Prime Portfolio | | $ | 1,657,072 | |
| | | | | | |
| | Total Collateral for Securities on Loan
(Cost $1,657,072) | | | 1,657,072 | |
| Short-Term Investment (0.5%) | |
| $121,480 | | State Street Euro Dollar Time Deposit (USD), 0.01%, 10/01/12 | | | 121,480 | |
| | | | | | |
Total Short-Term Investments
(Cost $121,480) | | | 121,480 | |
Total Investments 106.9%
(Cost $22,728,851) | | | 24,604,696 | |
| Liabilities Less Other Assets (6.9)% | | | (1,578,027 | ) |
| | | | | | |
Net Assets 100.0%
| | $ | 23,026,669 | |
| | | | | | |
The accompanying notes are an integral part of the financial statements.
| * | All options have 100 units per contract. |
| (a) | All or a portion of the security was on loan as of September 30, 2012. |
| ADR | American Depositary Receipt |
| REIT | Real Estate Investment Trust |
| | | | |
| SCHEDULEOF INVESTMENTS | | | 21 | |
| | | | |
MANAGEMENT OVERVIEW ICON FUND | | Class C Class S Class A | | ICNCX ICNZX ICNAX |
| Q. | How did the Fund perform relative to its benchmark? |
| A. | The ICON Fund, Class S, returned 28.57% for the fiscal year ended September 30, 2012, underperforming the 30.18% return for the S&P 1500 Composite Index. Class A shares of the Fund returned 28.25% (and 20.82% with maximum sales charge) over the same period. Class C shares of the Fund returned 27.54% for the time period. Total returns for other periods as of September 30, 2012 appear in the subsequent pages of this Fund’s Management Overview. |
| Q. | What primary factors were behind the Fund’s relative performance? |
| | The S&P 1500 Index gained 30.18% during the fiscal year. On September 30, 2011 we measured an overall domestic market value-to-price (V/P) ratio of 1.52 and never got close to a neutral reading of 1.00 (that is, fair value under ICON’s methodology), over the course of the next 12 months. With value as our guide, we were correctly bullish over this period. We generally minimized cash and, as noted below, tilted toward industries and sectors where we saw the greatest value. |
To take advantage of a 30% gain in the market, investors had to work through two drops of nearly 10%: one in November 2011 and the other in April through May of 2012. ICON did not attempt short term “market timing” and instead rode through these declines, focused on the longer-term value objective. The top three performing sector indexes for the year were Consumer Discretionary, Telecommunication Services and Financials; while the bottom three performing sector indexes were Utilities, Consumer Staples and Energy. Industry and sector leadership was far from steady throughout the year, with a severe theme reversal during the April-May downturn. Cyclical and economically sensitive issues, and in particular issues within the Industrials, Consumer Discretionary and Information Technology sectors, led through the April 2 high, but suffered the worst during the April-May decline. While Energy was the third worst performing sector index over the entire year, it was the best during the June 4 through September 30 advance. We attribute the inconsistent industry and sector behavior to investors frequently changing their outlook for the economy. As their views changed, their sector preferences changed quite a few times over the last year.
| Q. | How did the Fund’s composition affect performance? |
| A. | The largest contributors to Fund performance came from the Consumer Discretionary sector. Cable & satellite providers, Comcast Corp. and Time Warner Cable Inc., as well as movies & entertainment company Walt Disney Co., were among the top 5 largest holdings of the Fund. Combined, these three companies provided just over 7% in total returns to the Fund. Apparel retail companies also contributed to the Fund’s performance, as retailer TJX Cos. returned just over 63% for the year. The Consumer Discretionary sector was the Fund’s largest weighted sector at more than double its benchmark weight. Apple Inc., one of the Fund’s largest holdings, performed well in 2012, growing over 75% with the success of several new product launches and increased sales revenue. |
The Fund was underweight the Health Care sector, positioned at less than one third of the benchmark, yet this sector produced the two largest detractors to Fund performance. Questcor Pharmaceuticals Inc. dropped over 60% in a week after insurer Aetna Inc. said it would limit coverage of the company’s top-selling drug, H.P. Acthar, used to treat multiple sclerosis and infant seizures. Also, Health Care services company Bio-Reference Laboratories Inc. experienced a sharp decline after reports surfaced accusing the company of fraud and poor business practices. These two stocks caused Health Care to be the only sector that produced a negative return to the Fund’s overall performance.
| Q. | What is your investment outlook for the overall market? |
| A. | Going into the new fiscal year, ICON’s valuation system shows a market value-to-price (V/P) ratio of 1.39, suggesting there is still plenty of room for the market to appreciate towards fair value. Because of this valuation reading, we believe we are still in a bull market and we continue to position the Fund in industries that show great value according to our methodology. As fiscal year 2012 ends and fiscal year 2013 begins, the Fund is heavily tilted towards the Consumer Discretionary, Industrials, and Information Technology sectors. |
ICON Fund
Sector Composition
September 30, 2012
| | | | |
Consumer Discretionary | | | 29.6% | |
Industrials | | | 24.9% | |
Information Technology | | | 16.5% | |
Financial | | | 9.9% | |
Materials | | | 8.1% | |
Energy | | | 7.7% | |
Health Care | | | 3.3% | |
| | | | |
| | | 100.0% | |
| | | | |
Percentages are based upon common stock as a percentage of net assets.
ICON Fund
Industry Composition
September 30, 2012
| | | | |
Cable & Satellite | | | 13.6% | |
Industrial Machinery | | | 6.6% | |
IT Consulting & Other Services | | | 6.4% | |
Computer Hardware | | | 6.2% | |
Movies & Entertainment | | | 5.7% | |
Oil & Gas Equipment & Services | | | 5.7% | |
Railroads | | | 5.6% | |
Industrial Gases | | | 5.4% | |
Construction & Farm Machinery & Heavy Trucks | | | 4.4% | |
Electrical Components & Equipment | | | 4.3% | |
Apparel Retail | | | 4.1% | |
Home Improvement Retail | | | 3.5% | |
Other Diversified Financial Services | | | 2.9% | |
| | | | |
Diversified Banks | | | 2.8% | |
Consumer Finance | | | 2.8% | |
Steel | | | 2.8% | |
Footwear | | | 2.7% | |
Industrial Conglomerates | | | 2.5% | |
Communications Equipment | | | 2.3% | |
Biotechnology | | | 2.2% | |
Oil & Gas Drilling | | | 1.9% | |
Computer Storage & Peripherals | | | 1.6% | |
Air Freight & Logistics | | | 1.5% | |
Regional Banks | | | 1.4% | |
Pharmaceuticals | | | 1.1% | |
| | | | |
| | | 100.0% | |
| | | | |
Percentages are based upon common stock as a percentage of net assets.
ICON Fund
Average Annual Total Return
as of September 30, 2012
| | | | | | | | | | | | | | | | | | | | | | | | | | | | |
| | | Inception
Date | | | 1 Year | | | 5 Years | | | 10 Years | | | Since
Inception | | | Gross
Expense
Ratio* | | | Net
Expense
Ratio* | |
ICON Fund - Class C | | | 11/28/00 | | | | 27.54% | | | | -5.89% | | | | 3.30% | | | | 1.89% | | | | 2.27% | | | | 2.25% | |
S&P Composite 1500 Index | | | | | | | 30.18% | | | | 1.36% | | | | 8.34% | | | | 3.15% | | | | N/A | | | | N/A | |
ICON Fund - Class S | | | 5/6/04 | | | | 28.57% | | | | -5.44% | | | | N/A | | | | 1.79% | | | | 2.52% | | | | 1.25% | |
S&P Composite 1500 Index | | | | | | | 30.18% | | | | 1.36% | | | | 8.34% | | | | 5.56% | | | | N/A | | | | N/A | |
ICON Fund - Class A | | | 5/31/06 | | | | 28.25% | | | | -5.99% | | | | N/A | | | | -3.17% | | | | 2.52% | | | | 1.50% | |
ICON Fund - Class A (including maximum sales charge of 5.75%) | | | 5/31/06 | | | | 20.82% | | | | -7.10% | | | | N/A | | | | -4.07% | | | | 2.52% | | | | 1.50% | |
S&P Composite 1500 Index | | | | | | | 30.18% | | | | 1.36% | | | | N/A | | | | 4.34% | | | | N/A | | | | N/A | |
Past performance is not a guarantee of future results. Information about these performance results and the comparative indexes can be found in the About This Report section. The Since Inception performance results for Class C shares include returns for certain time periods that were restarted as of June 8, 2004.
| * | Please see the most recent prospectus for details. |
Class C total returns exclude applicable sales charges. If sales charges were included returns would be lower.
ICON Fund
Value of a $10,000 Investment
through September 30, 2012
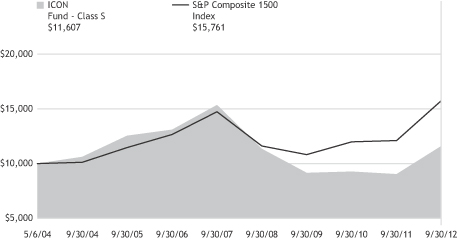
Past performance is not a guarantee of future results. The above graph compares a $10,000 investment made in the Fund’s Class S shares on the Class’ inception date of 5/6/04 to a $10,000 investment made in an unmanaged securities index on that date. Performance for the Fund’s other share classes will vary due to differences in charges and expenses. The Fund’s performance in this chart and the performance table assumes the reinvestment of dividends and capital gain distributions but does not reflect the deduction of taxes that a shareholder would pay on Fund distributions or on the redemption of Fund shares.
ICON FUND (FORMERLY, ICON CORE EQUITY FUND)
SCHEDULEOF INVESTMENTS
SEPTEMBER 30, 2012
| | | | | | | | |
| Shares or Principal Amount | | Value | |
| | | | | | | | |
| | Common Stocks (100.0%) | |
| | 22,100 | | | Accenture PLC, Class A | | $ | 1,547,663 | |
| | 5,000 | | | Apple, Inc. | | | 3,336,300 | |
| | 22,100 | | | BB&T Corp. | | | 732,836 | |
| | 15,800 | | | Cash America International, Inc. | | | 609,406 | |
| | 27,800 | | | Caterpillar, Inc. | | | 2,391,912 | |
| | 15,600 | | | Celgene Corp.† | | | 1,191,840 | |
| | 105,500 | | | Comcast Corp., Class A | | | 3,773,735 | |
| | 61,800 | | | CSX Corp. | | | 1,282,350 | |
| | 18,400 | | | Dover Corp. | | | 1,094,616 | |
| | 21,600 | | | Eaton Corp.(a) | | | 1,020,816 | |
| | 32,100 | | | EMC Corp.† | | | 875,367 | |
| | 48,100 | | | Emerson Electric Co. | | | 2,321,787 | |
| | 38,700 | | | Ezcorp, Inc., Class A† | | | 887,391 | |
| | 11,600 | | | F5 Networks, Inc.† | | | 1,214,520 | |
| | 9,600 | | | FedEx Corp. | | | 812,352 | |
| | 58,200 | | | General Electric Co. | | | 1,321,722 | |
| | 16,400 | | | Halliburton Co. | | | 552,516 | |
| | 24,100 | | | Illinois Tool Works, Inc. | | | 1,433,227 | |
| | 9,100 | | | International Business Machines Corp. | | | 1,887,795 | |
| | 39,000 | | | JPMorgan Chase & Co. | | | 1,578,720 | |
| | 62,300 | | | Lowe’s Cos., Inc. | | | 1,883,952 | |
| | 17,000 | | | National Oilwell Varco, Inc. | | | 1,361,870 | |
| | 6,400 | | | Nike, Inc., Class B | | | 607,424 | |
| | | | | | | | |
| Shares or Principal Amount | | Value | |
| | 29,300 | | | Noble Corp. | | $ | 1,048,354 | |
| | 26,400 | | | Nucor Corp. | | | 1,010,064 | |
| | 27,700 | | | Praxair, Inc. | | | 2,877,476 | |
| | 30,700 | | | Questcor Pharmaceuticals, Inc.†(a) | | | 567,950 | |
| | 15,900 | | | Schlumberger, Ltd. | | | 1,150,047 | |
| | 42,300 | | | Steel Dynamics, Inc. | | | 475,029 | |
| | 37,300 | | | Time Warner Cable, Inc. | | | 3,545,738 | |
| | 49,100 | | | TJX Cos., Inc. | | | 2,199,189 | |
| | 14,500 | | | Union Pacific Corp. | | | 1,721,150 | |
| | 30,200 | | | Viacom, Inc., Class B | | | 1,618,418 | |
| | 27,700 | | | Walt Disney Co. | | | 1,448,156 | |
| | 43,600 | | | Wells Fargo & Co. | | | 1,505,508 | |
| | 18,500 | | | Wolverine World Wide, Inc. | | | 820,845 | |
| | | | | | | | |
| Total Common Stocks
(Cost $40,210,439) | | | 53,708,041 | |
| | Collateral for Securities on Loan (2.7%) | |
| | 1,490,742 | | | State Street Navigator Prime Portfolio | | | 1,490,742 | |
| | | | | | | | |
| Total Collateral for Securities
on Loan
(Cost $1,490,742) | | | 1,490,742 | |
| Total Investments 102.7%
(Cost $41,701,181) | | | 55,198,783 | |
| Liabilities Less Other Assets
(2.7)% | | | (1,467,785 | ) |
| | | | | | | | |
| | Net Assets 100.0% | | $ | 53,730,998 | |
| | | | | | | | |
The accompanying notes are an integral part of the financial statements.
| † | Non-income producing security. |
| (a) | All or a portion of the security was on loan as of September 30, 2012. |
| | | | |
| SCHEDULEOF INVESTMENTS | | | 27 | |
| | | | |
MANAGEMENT OVERVIEW ICON LONG/SHORT FUND | | Class C Class S Class A | | IOLCX IOLZX ISTAX |
| Q. | How did the Fund perform relative to its benchmark? |
| A. | For the 12-months ended September 30, 2012, the ICON Long/Short Fund returned 25.41% for Class S shares, 24.15% for Class C shares (23.15% with contingent deferred sales charge) and 25.09% for Class A shares (17.87% with maximum sales charge), underperforming the 30.18% return for the Fund’s stated benchmark, the S&P 1500 Composite Index. Total returns and performance statistics for other periods as of September 30, 2012 appear in the subsequent pages of this Fund’s Management Overview. |
| Q. | What primary factors were behind the Fund’s relative performance? |
| | The S&P Composite 1500 Index gained 30.18% during the fiscal year. On September 30, 2011 we measured an overall market value-to-price (V/P) ratio of 1.52 and never got close to a neutral reading of 1.00, or fair value under ICON’s methodology, over the course of the last 12 months. With value as our guide, we were correctly bullish over this period. We generally reduced cash, retained only a minimal short position in the Fund and, as noted below, tilted toward the industries and sectors where we saw the greatest value. |
To take advantage of a 30% gain in the market, investors had to work through two drops of approximately 10%: one in November 2011 and the other in April through May of 2012. ICON did not attempt short term “market timing” and instead rode through these declines, focused on the longer-term value objective. The top three performing sector indexes for the year were Consumer Discretionary, Telecommunications Services and Financials; while the bottom three performing sector indexes were Utilities, Consumer Staples and Energy. Industry and sector leadership was far from steady throughout the year, with a severe theme reversal during the April-May downturn. Cyclical and economically sensitive issues, including those in the Industrials, Consumer Discretionary and Information Technology sectors, led through the April 2 high, but suffered the worst during the April-May decline. While Energy was the third worst performing sector index over the entire year, it was the best performer during the June 4 through September 30 advance. We attribute the inconsistent industry and sector behavior to investors frequently changing their outlook for the economy. As their views changed, their sector preferences changed quite a few times over the last year.
| Q. | How did the Fund’s composition affect performance? |
| A. | The largest contributors to Fund performance came from the Consumer Discretionary sector. Cable & satellite providers, Comcast Corp. and Time Warner Cable Inc., were among the top 5 largest holdings of the Fund. Combined, these two companies provided just under 4% in total return to the Fund. Apparel retail companies also contributed strongly to the Fund’s performance, as retailer TJX Cos. returned just over 63% for the year. The Consumer Discretionary sector was one of the Fund’s largest weighted sectors at almost twice its benchmark weight. Apple Inc., the Fund’s largest holding, performed well in 2012, growing over 75% with the success of several new product launches and increased sales revenue. |
The Fund was underweight the Health Care sector, positioned at less than one half of the benchmark. This sector nonetheless proved to be a significant detractor to Fund performance when Questcor Pharmaceuticals Inc. dropped over 60% in a week after insurer Aetna Inc. said it would limit coverage of the company’s top-selling drug, H.P. Acthar, which is used to treat multiple sclerosis and infant seizures. The Fund’s position in EZCorp Inc., the largest U.S. pawn-shop broker and pay day lender chain, likewise detracted from performance. EZCorp Inc. shares declined sharply after missing analysts��� earnings expectations and perceived legislative threats.
The Fund had minimal short positions over the past year. The Fund uses shorts as a strategy to increase returns, and in 2012’s rising market, we saw few opportunities to short.
| Q. | What is your investment outlook for the overall market? |
| A. | Going into the new fiscal year, ICON’s valuation system shows an overall market V/P ratio of 1.39, suggesting there is still plenty of room for the market to appreciate towards fair value. Because of this valuation reading, we believe we are still in a bull market and we continue to position the Fund long in industries that show great value according to our methodology. As fiscal year 2012 ends and fiscal year 2013 begins, the Fund is heavily tilted towards the Consumer Discretionary, Industrials, and Information Technology sectors. Still, we remain vigilant and will look for opportunities to add to the Fund’s short positions as they arise. |
ICON Long/Short Fund
Sector Composition
September 30, 2012
| | | | |
Consumer Discretionary | | | 31.6% | |
Information Technology | | | 22.4% | |
Industrials | | | 21.2% | |
Health Care | | | 8.9% | |
Financial | | | 6.6% | |
Energy | | | 4.6% | |
Materials | | | 3.3% | |
| | | | |
| | | 98.6% | |
| | | | |
Percentages are based upon long positions as a percentage of net assets.
ICON Long/Short Fund
Industry Composition
September 30, 2012
| | | | |
Cable & Satellite | | | 10.5% | |
IT Consulting & Other Services | | | 9.5% | |
Industrial Conglomerates | | | 6.6% | |
Computer Hardware | | | 6.4% | |
Home Improvement Retail | | | 4.8% | |
Railroads | | | 4.4% | |
Homefurnishing Retail | | | 4.0% | |
Oil & Gas Equipment & Services | | | 3.2% | |
Communications Equipment | | | 3.1% | |
Health Care Services | | | 3.1% | |
Construction & Farm Machinery & Heavy Trucks | | | 3.0% | |
Apparel Retail | | | 2.9% | |
Industrial Machinery | | | 2.7% | |
Biotechnology | | | 2.5% | |
Air Freight & Logistics | | | 2.5% | |
General Merchandise Stores | | | 2.5% | |
Health Care Equipment | | | 2.4% | |
Apparel, Accessories & Luxury Goods | | | 2.1% | |
| | | | |
Diversified Banks | | | 2.1% | |
Housewares & Specialties | | | 2.0% | |
Electrical Components & Equipment | | | 2.0% | |
Computer Storage & Peripherals | | | 1.9% | |
Industrial Gases | | | 1.9% | |
Other Diversified Financial Services | | | 1.9% | |
Footwear | | | 1.5% | |
Data Processing & Outsourced Services | | | 1.4% | |
Regional Banks | | | 1.4% | |
Consumer Finance | | | 1.3% | |
Movies & Entertainment | | | 1.2% | |
Other Industries (each less than 1%) | | | 3.8% | |
| | | | |
| | | 98.6% | |
| | | | |
Percentages are based upon long positions as a percentage of net assets.
ICON Long/Short Fund
Average Annual Total Return
as of September 30, 2012
| | | | | | | | | | | | | | | | | | | | | | | | |
| | | Inception
Date | | | 1 Year | | | 5 Years | | | Since
Inception | | | Gross
Expense
Ratio* | | | Net
Expense
Ratio* | |
ICON Long/Short Fund - Class C | | | 10/17/02 | | | | 24.15% | | | | -4.81% | | | | 3.92% | | | | 3.14% | | | | 2.70% | |
S&P Composite 1500 Index | | | | | | | 30.18% | | | | 1.36% | | | | 7.61% | | | | N/A | | | | N/A | |
ICON Long/Short Fund - Class S | | | 5/6/04 | | | | 25.41% | | | | -3.83% | | | | 2.26% | | | | 7.76% | | | | 1.65% | |
S&P Composite 1500 Index | | | | | | | 30.18% | | | | 1.36% | | | | 5.56% | | | | N/A | | | | N/A | |
ICON Long/Short Fund - Class A | | | 5/31/06 | | | | 25.09% | | | | -4.11% | | | | -1.41% | | | | 3.23% | | | | 1.91% | |
ICON Long/Short Fund - Class A (including maximum sales charge of 5.75%) | | | 5/31/06 | | | | 17.87% | | | | -5.23% | | | | -2.33% | | | | 3.23% | | | | 1.91% | |
S&P Composite 1500 Index | | | | | | | 30.18% | | | | 1.36% | | | | 4.34% | | | | N/A | | | | N/A | |
Past performance is not a guarantee of future results. Information about these performance results and the comparative indexes can be found in the About This Report section. The Adviser has agreed to limit certain Fund expenses; without these limitations, returns would have been lower. The limitation provisions may be terminated in the future.
| * | Please see the most recent prospectus for details. |
Class C total returns exclude applicable sales charges. If sales charges were included returns would be lower.
ICON Long/Short Fund
Value of a $10,000 Investment
through September 30, 2012
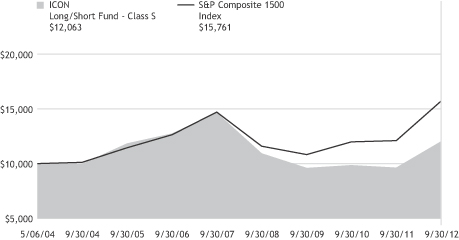
Past performance is not a guarantee of future results. The above graph compares a $10,000 investment made in the Fund’s Class S shares on the Class’ inception date of 5/6/04 to a $10,000 investment made in an unmanaged securities index on that date. Performance for the Fund’s other share classes will vary due to differences in charges and expenses. The Fund’s performance in this chart and the performance table assumes the reinvestment of dividends and capital gain distributions but does not reflect the deduction of taxes that a shareholder would pay on Fund distributions or on the redemption of Fund shares.
ICON LONG/SHORT FUND
SCHEDULEOF INVESTMENTS
SEPTEMBER 30, 2012
| | | | | | | | |
| Shares or Principal Amount | | Value | |
| | Common Stocks (98.6%) | | | | |
| | 9,500 | | | Accenture PLC, Class A(x) | | $ | 665,285 | |
| | 2,400 | | | Apple, Inc.(x) | | | 1,601,424 | |
| | 10,800 | | | BB&T Corp. | | | 358,128 | |
| | 16,200 | | | Bed Bath & Beyond, Inc.† | | | 1,020,600 | |
| | 26,900 | | | Bio-Reference Labs, Inc.†(a) | | | 768,802 | |
| | 8,700 | | | Caterpillar, Inc.(x) | | | 748,548 | |
| | 8,200 | | | Celgene Corp.†(x) | | | 626,480 | |
| | 11,100 | | | Cognizant Technology Solutions Corp., Class A†(x) | | | 776,112 | |
| | 38,500 | | | Comcast Corp., Class A(x) | | | 1,377,145 | |
| | 29,700 | | | CSX Corp.(x) | | | 616,275 | |
| | 15,000 | | | Danaher Corp.(x) | | | 827,250 | |
| | 8,600 | | | Dover Corp. | | | 511,614 | |
| | 2,000 | | | Ecolab, Inc. | | | 129,620 | |
| | 10,400 | | | Emerson Electric Co. | | | 502,008 | |
| | 14,300 | | | Ezcorp, Inc., Class A† | | | 327,899 | |
| | 7,500 | | | F5 Networks, Inc.† | | | 785,250 | |
| | 7,400 | | | FedEx Corp. | | | 626,188 | |
| | 36,600 | | | General Electric Co.(x) | | | 831,186 | |
| | 8,200 | | | Halliburton Co. | | | 276,258 | |
| | 16,800 | | | Home Depot, Inc. | | | 1,014,216 | |
| | 2,900 | | | Illinois Tool Works, Inc. | | | 172,463 | |
| | 4,600 | | | International Business Machines Corp.(x) | | | 954,270 | |
| | 9,600 | | | Jarden Corp. | | | 507,264 | |
| | 11,600 | | | JPMorgan Chase & Co. | | | 469,568 | |
| | 6,300 | | | Lowe’s Cos., Inc. | | | 190,512 | |
| | 800 | | | Mastercard, Inc., Class A | | | 361,184 | |
| | 3,600 | | | National Oilwell Varco, Inc. | | | 288,396 | |
| | 3,900 | | | Nike, Inc., Class B | | | 370,149 | |
| | 4,400 | | | Noble Corp.†(x) | | | 157,432 | |
| | | | | | | | |
| Shares or Principal Amount | | Value | |
| | 7,700 | | | Norfolk Southern Corp. | | $ | 489,951 | |
| | 4,600 | | | Praxair, Inc. | | | 477,848 | |
| | 12,900 | | | Questcor Pharmaceuticals, Inc.†(a) | | | 238,650 | |
| | 4,500 | | | Reliance Steel & Aluminum Co. | | | 235,575 | |
| | 15,100 | | | ResMed, Inc. | | | 611,097 | |
| | 3,400 | | | Schlumberger, Ltd.(x) | | | 245,922 | |
| | 9,800 | | | Target Corp. | | | 622,006 | |
| | 13,300 | | | Time Warner Cable, Inc.(x) | | | 1,264,298 | |
| | 16,600 | | | TJX Cos., Inc.(x) | | | 743,514 | |
| | 3,300 | | | V.F. Corp. | | | 525,888 | |
| | 5,900 | | | Valero Energy Corp. | | | 186,912 | |
| | 6,000 | | | Walt Disney Co.(x) | | | 313,680 | |
| | 15,000 | | | Wells Fargo & Co. | | | 517,950 | |
| | 12,600 | | | Western Digital Corp. | | | 487,998 | |
| | | | | | | | |
| Total Common Stocks
(Cost $21,419,851) | | | 24,822,815 | |
| | Collateral for Securities on Loan (2.3%) | |
| | 568,361 | | | State Street Navigator Prime Portfolio | | | 568,361 | |
| | | | | | | | |
| Total Collateral for Securities
on Loan
(Cost $568,361) | | | 568,361 | |
| | Short-Term Investment (30.6%) | |
| $ | 7,709,409 | | | State Street Euro Dollar Time Deposit (USD), 0.01%, 10/01/12 | | | 7,709,409 | |
| | | | | | | | |
| Total Short-Term Investments
(Cost $7,709,409) | | | 7,709,409 | |
| Total Investments 131.5%
(Cost $29,697,621) | | | 33,100,585 | |
| Liabilities Less Other Assets
(31.5)% | | | (7,938,595 | ) |
| | | | | | | | |
| | Net Assets 100.0% | | $ | 25,161,990 | |
| | | | | | | | |
| | | | |
| SCHEDULEOF INVESTMENTS | | | 33 | |
The accompanying notes are an integral part of the financial statements.
| † | Non-income producing security. |
| (x) | All or a portion of the security is pledged as collateral for securities sold short. |
| (a) | All or a portion of the security was on loan as of September 30, 2012. |
| | |
| 34 | | SCHEDULEOF INVESTMENTS |
ICON LONG/SHORT FUND
SCHEDULEOF SECURITIES SOLD SHORT
SEPTEMBER 30, 2012
| | | | | | | | |
| Shares | | | Short Security | | Value | |
| | 2,000 | | | SL Green Realty Corp., REIT | | $ | 160,140 | |
| | 3,300 | | | Texas Industries, Inc. | | | 134,145 | |
| | | | | | | | |
| Total Securities Sold Short
(Proceeds $234,016) | | $ | 294,285 | |
| | | | | | | | |
The accompanying notes are an integral part of the financial statements.
| REIT | Real Estate Investment Trust |
| | | | |
| SCHEDULEOF INVESTMENTS | | | 35 | |
| | | | |
MANAGEMENT OVERVIEW ICON RISK-MANAGED EQUITY FUND | | Class C Class S Class A | | IOCCX IOCZX IOCAX |
| Q. | How did the Fund perform relative to its benchmark? |
| A. | The ICON Risk-Managed Equity Fund, Class S, returned 14.65% for the fiscal year ended September 30, 2012, underperforming the 30.18% return for the S&P 1500 Composite Index. Class A shares of the Fund returned 14.28% (and 7.71% with maximum sales charge) and Class C shares returned 13.47% for the time period (12.47% with maximum contingent deferred sales charge). Total returns for other periods as of September 30, 2012 appear in the subsequent pages of this Fund’s Management Overview. |
| Q. | What primary factors were behind the Fund’s relative performance? |
The S&P 1500 Index gained 30.18% during the fiscal year. On September 30, 2011 we measured an overall market value-to-price (V/P) ratio of 1.52 and never got close to a neutral reading of 1.00, or fair value under ICON’s methodology, over the course of the next 12 months. With value as our guide, we were correctly bullish over this period. We generally minimized cash and, as noted below, tilted toward our industries and sectors where we saw the greatest value.
To take advantage of a 30% gain in the market, investors had to work through two drops of approximately 10%: one in November 2011 and the other in April through May of 2012. ICON did not attempt short term “market timing” and instead rode through these declines, focused on the longer-term value objective. The top three performing sector indexes for the year were Consumer Discretionary, Telecommunication Services and Financials; while the bottom three performing sector indexes were Utilities, Consumer Staples and Energy. Industry and sector leadership was far from steady throughout the year, however, with a severe theme reversal during the April-May downturn. Cyclical and economically sensitive issues, including Industrials, Consumer Discretionary and Information Technology, led through the April 2 high, but suffered during the April-May decline. While Energy was the third worst performing sector index over the entire year, it was the best during the June 4 through September 30 advance. We attribute the inconsistent industry and sector behavior to investors frequently changing their outlook for the economy. As their views changed, their sector preferences changed quite a few times over the last year.
We believe we were able to reduce both the Fund’s downside capture and volatility this fiscal year through our disciplined implementation of the Fund’s core hedging strategy: writing S&P 500 Index call options and using some of the proceeds to buy S&P 500 Index out-of-the-money put options. This hedging strategy provided a downside cushion throughout the period, but most notably during two sharp declines. In a roughly two-week period, from November 8 to November 25, 2011, the S&P 1500 Index fell 9.24%. Over that same period, the Class S shares of the Fund fell 6.64%. Then, after a sharp rally, the Index dropped 8.96% between May 1 and June 4, 2012 while the Class S shares of the Fund declined 5.98% over the same period. The hedge also helped reduce the Fund’s volatility. Over the full fiscal year the Fund’s beta was 0.57 for the Class S shares. There is generally a trade-off for reducing downside capture and dampening volatility: while the hedge did what it was intended to do by helping reduce losses and creating a more stable ride, it also reduced the Fund’s upside capture.
| Q. | How did the Fund’s composition affect performance? |
| A. | Throughout the year the Fund held its largest positions in the Information Technology, Industrials, and Consumer Discretionary sectors. The largest contributor to performance came from the computer hardware industry. Apple, the Fund’s largest holding, had a strong year in 2012, growing over 75%. Also producing positive gains to the Fund were holdings in the apparel retail, IT consulting & other services, and railroads industries. |
The Fund’s Energy sector allocations produced the largest detractors to Fund performance. In particular, the Fund was negatively impacted by holdings in the oil & gas drilling and coal & consumable fuels industries. Although the Fund’s weighted average position in the Energy sector was only 0.30% less than the S&P 1500 Composite Index position in the Energy sector for the fiscal year, the Fund’s industry tilts returned approximately only half that of the benchmark’s Energy exposure.
| Q. | What is your investment outlook for the overall market? |
| A. | Going into the new fiscal year, ICON’s valuation system shows an overall market V/P of 1.39, suggesting there is still plenty of room for the market to appreciate towards fair value. Because of this valuation reading, we believe we are still in a bull market and we continue to position the Fund in industries that show great value according to our methodology. As fiscal year 2012 ends and fiscal year 2013 begins, the Fund is heavily tilted towards the Consumer Discretionary, Industrials, and Information Technology sectors. |
ICON Risk-Managed Equity Fund
Sector Composition
September 30, 2012
| | | | |
Information Technology | | | 23.8% | |
Consumer Discretionary | | | 23.3% | |
Industrials | | | 21.2% | |
Health Care | | | 12.0% | |
Energy | | | 10.2% | |
Financial | | | 10.1% | |
Materials | | | 4.0% | |
Consumer Staples | | | 1.6% | |
| | | | |
| | | 106.2% | |
| | | | |
Percentages are based upon common stock as a percentage of net assets.
ICON Risk-Managed Equity Fund
Industry Composition
September 30, 2012
| | | | |
IT Consulting & Other Services | | | 8.6% | |
Cable & Satellite | | | 6.5% | |
Integrated Oil & Gas | | | 6.1% | |
Railroads | | | 5.9% | |
Computer Hardware | | | 5.6% | |
Industrial Conglomerates | | | 5.5% | |
Pharmaceuticals | | | 5.4% | |
Diversified Banks | | | 4.9% | |
Apparel Retail | | | 4.6% | |
Biotechnology | | | 4.5% | |
Industrial Machinery | | | 4.0% | |
Industrial Gases | | | 3.6% | |
Other Diversified Financial Services | | | 3.2% | |
Oil & Gas Equipment & Services | | | 3.2% | |
Systems Software | | | 3.2% | |
Movies & Entertainment | | | 3.0% | |
Electrical Components & Equipment | | | 2.7% | |
Home Improvement Retail | | | 2.6% | |
| | | | |
Semiconductor Equipment | | | 2.5% | |
Computer & Electronics Retail | | | 2.3% | |
General Merchandise Stores | | | 2.2% | |
Semiconductors | | | 2.2% | |
Health Care Equipment | | | 2.0% | |
Regional Banks | | | 2.0% | |
Construction & Farm Machinery & Heavy Trucks | | | 1.7% | |
Data Processing & Outsourced Services | | | 1.7% | |
Drug Retail | | | 1.6% | |
Distributors | | | 1.3% | |
Aerospace & Defense | | | 1.3% | |
Oil & Gas Drilling | | | 1.0% | |
Other Industries (each less than 1%) | | | 1.3% | |
| | | | |
| | | 106.2% | |
| | | | |
Percentages are based upon common stock as a percentage of net assets.
ICON Risk-Managed Equity Fund
Fund Average Annual Total Return
as of September 30, 2012
| | | | | | | | | | | | | | | | | | | | | | | | |
| | | Inception
Date | | | 1 Year | | | 5 Years | | | Since
Inception | | | Gross
Expense
Ratio* | | | Net
Expense
Ratio* | |
ICON Risk-Managed Equity Fund - Class C | | | 11/21/02 | | | | 13.47% | | | | -0.72% | | | | 3.92% | | | | 2.95% | | | | 2.23% | |
S&P Composite 1500 Index | | | | | | | 30.18% | | | | 1.36% | | | | 7.02% | | | | N/A | | | | N/A | |
ICON Risk-Managed Equity Fund -
Class S | | | 5/6/04 | | | | 14.65% | | | | 0.31% | | | | 3.21% | | | | 7.22% | | | | 1.23% | |
S&P Composite 1500 Index | | | | | | | 30.18% | | | | 1.36% | | | | 5.56% | | | | N/A | | | | N/A | |
ICON Risk-Managed Equity Fund - Class A | | | 5/31/06 | | | | 14.28% | | | | 0.06% | | | | 2.01% | | | | 2.08% | | | | 1.48% | |
ICON Risk-Managed Equity Fund - Class A (including maximum sales charge of 5.75%) | | | 5/31/06 | | | | 7.71% | | | | -1.11% | | | | 1.06% | | | | 2.08% | | | | 1.48% | |
S&P Composite 1500 Index | | | | | | | 30.18% | | | | 1.36% | | | | 4.34% | | | | N/A | | | | N/A | |
Past performance is not a guarantee of future results. Information about these performance results and the comparative indexes can be found in the About This Report section. The Adviser has agreed to limit certain Fund expenses; without these limitations, returns would have been lower. The limitation provisions may be terminated in the future.
| * | Please see the most recent prospectus for details. |
Class C total returns exclude applicable sales charges. If sales charges were included returns would be lower.
ICON Risk-Managed Equity Fund
Value of a $10,000 Investment
through September 30, 2012
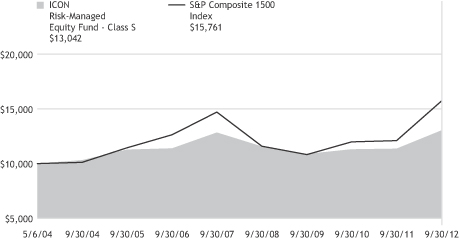
Past performance is not a guarantee of future results. The above graph compares a $10,000 investment made in the Fund’s Class S shares on the Class’ inception date of 5/6/04 to a $10,000 investment made in an unmanaged securities index on that date. Performance for the Fund’s other share classes will vary due to differences in charges and expenses. The Fund’s performance in this chart and the performance table assumes the reinvestment of dividends and capital gain distributions but does not reflect the deduction of taxes that a shareholder would pay on Fund distributions or on the redemption of Fund shares.
ICON RISK-MANAGED EQUITY FUND
SCHEDULEOF INVESTMENTS
SEPTEMBER 30, 2012
| | | | | | | | |
| Shares or Principal Amount | | Value | |
| | | | | | | | |
| | Common Stocks (106.2%) | |
| | 3,000 | | | 3M Co.x | | $ | 277,260 | |
| | 4,200 | | | Abbott Laboratories | | | 287,952 | |
| | 5,300 | | | Accenture PLC, Class Ax | | | 371,159 | |
| | 2,700 | | | Air Products & Chemicals, Inc.x | | | 223,290 | |
| | 1,100 | | | Apple, Inc.x | | | 733,986 | |
| | 29,100 | | | Applied Materials, Inc. | | | 324,902 | |
| | 3,800 | | | Automatic Data Processing, Inc.x | | | 222,908 | |
| | 4,800 | | | BB&T Corp.x | | | 159,168 | |
| | 2,600 | | | Caterpillar, Inc.x | | | 223,704 | |
| | 2,300 | | | Chevron Corp.x | | | 268,088 | |
| | 11,800 | | | Comcast Corp., Class A | | | 422,086 | |
| | 2,700 | | | ConocoPhillipsx | | | 154,386 | |
| | 17,800 | | | CSX Corp.x | | | 369,350 | |
| | 4,900 | | | Dover Corp.x | | | 291,501 | |
| | 1,200 | | | E.I. du Pont de Nemours & Co.x | | | 60,324 | |
| | 7,200 | | | Emerson Electric Co. | | | 347,544 | |
| | 2,500 | | | Exxon Mobil Corp.x | | | 228,625 | |
| | 14,200 | | | GameStop Corp., Class A(a) | | | 298,200 | |
| | 19,100 | | | General Electric Co. | | | 433,761 | |
| | 2,700 | | | Genuine Parts Co.x | | | 164,781 | |
| | 12,500 | | | Intel Corp.x | | | 283,500 | |
| | 3,600 | | | International Business Machines Corp.x | | | 746,820 | |
| | | | | | | | |
| Shares or Principal Amount | | Value | |
| | | | | | | | |
| | 6,100 | | | Johnson & Johnson | | $ | 420,351 | |
| | 10,200 | | | JPMorgan Chase & Co.x | | | 412,896 | |
| | 11,100 | | | Lowe’s Cos., Inc.x | | | 335,664 | |
| | 1,100 | | | M&T Bank Corp.x | | | 104,676 | |
| | 6,200 | | | Medtronic, Inc.x | | | 267,344 | |
| | 13,800 | | | Microsoft Corp.x | | | 410,964 | |
| | 1,200 | | | Nike, Inc., Class Bx | | | 113,892 | |
| | 3,600 | | | Noble Corp. | | | 128,808 | |
| | 1,600 | | | Occidental Petroleum Corp.x | | | 137,696 | |
| | 2,800 | | | Parker Hannifin Corp.x | | | 234,024 | |
| | 75,800 | | | PDL BioPharma, Inc.(a) | | | 582,902 | |
| | 2,300 | | | Praxair, Inc.x | | | 238,924 | |
| | 5,700 | | | Schlumberger, Ltd. | | | 412,281 | |
| | 4,500 | | | Target Corp.x | | | 285,615 | |
| | 4,400 | | | Time Warner Cable, Inc. | | | 418,264 | |
| | 13,400 | | | TJX Cos., Inc.x | | | 600,186 | |
| | 5,400 | | | U.S. Bancorpx | | | 185,220 | |
| | 3,400 | | | Union Pacific Corp.x | | | 403,580 | |
| | 2,100 | | | United Technologies Corp.x | | | 164,409 | |
| | 5,600 | | | Walgreen Co. | | | 204,064 | |
| | 7,400 | | | Walt Disney Co.x | | | 386,872 | |
| | 12,900 | | | Wells Fargo & Co.x | | | 445,437 | |
| | | | | | | | |
| Total Common Stocks
(Cost $11,177,519) | | | 13,787,364 | |
| | | | | | |
| Underlying Security/Expiration Date/Exercise Price | | Contracts* | | Value | |
| | | | | | |
| Put Options Purchased (0.4%) | |
S+P 500 Index, November 2012, $1,420.00 | | 20 | | $ | 46,100 | |
| | | | | | |
Total Put Options Purchased
(Cost $38,270) | | | 46,100 | |
| | | | |
| SCHEDULEOF INVESTMENTS | | | 41 | |
| | | | | | | | |
Shares or Principal Amount | | Value | |
| | | | | | | | |
| | Collateral for Securities on Loan (4.7%) | |
| | 611,515 | | | State Street Navigator Prime Portfolio | | $ | 611,515 | |
| | | | | | | | |
| Total Collateral for Securities on Loan
(Cost $611,515) | | | 611,515 | |
| Total Investments 111.3%
(Cost $11,827,304) | | | 14,444,979 | |
| | Liabilities Less Other Assets (11.3)% | | | (1,465,775 | ) |
| | | | | | | | |
| | Net Assets 100.0% | | $ | 12,979,204 | |
| | | | | | | | |
The accompanying notes are an integral part of the financial statements.
| * | All options have 100 units per contract. |
| x | All or a portion of the security is pledged as collateral for call options written. |
| (a) | All or a portion of the security was on loan as of September 30, 2012. |
| | |
| 42 | | SCHEDULEOF INVESTMENTS |
ICON RISK-MANAGED EQUITY FUND
SCHEDULEOF WRITTEN CALL OPTIONS
SEPTEMBER 30, 2012
| | | | | | | | |
| Underlying Security/Expiration Date/Exercise Price | | Contracts* | | | Value | |
S+P 500 Index, November 2012, $1,480.00 | | | 8 | | | $ | 7,680 | |
| | | | | | | | |
Total Options Written
(Premiums received $13,806) | | | | | | $ | 7,680 | |
| | | | | | | | |
The accompanying notes are an integral part of the financial statements.
| * | All options have 100 units per contract. |
| | | | |
| SCHEDULEOF INVESTMENTS | | | 43 | |
STATEMENTSOF ASSETSAND LIABILITIES
SEPTEMBER 30, 2012
| | | | | | | | | | | | | | | | | | | | |
| | | ICON
Bond Fund | | | ICON Equity
Income
Fund | | | ICON Fund | | | ICON
Long/Short
Fund | | | ICON Risk-
Managed
Equity
Fund | |
Assets | | | | | | | | | | | | | | | | | | | | |
Investments, at cost | | $ | 93,069,308 | | | $ | 22,728,851 | | | $ | 41,701,181 | | | $ | 29,697,621 | | | $ | 11,827,304 | |
| | | | | | | | | | | | | | | | | | | | |
Investments, at value† | | | 98,255,677 | | | | 24,604,696 | | | | 55,198,783 | | | | 33,100,585 | | | | 14,444,979 | |
Deposits for Short Sales | | | – | | | | – | | | | – | | | | 730,898 | | | | – | |
Cash | | | – | | | | – | | | | – | | | | 10,374 | | | | – | |
Receivables: | | | | | | | | | | | | | | | | | | | | |
Fund shares sold | | | 99,675 | | | | 81,553 | | | | 1,554 | | | | 18,231 | | | | 131,534 | |
Investments sold | | | – | | | | – | | | | 1,316,425 | | | | 242,696 | | | | 123,335 | |
Interest | | | 939,414 | | | | 4,482 | | | | – | | | | 6 | | | | – | |
Dividends | | | – | | | | 89,515 | | | | 60,163 | | | | 12,199 | | | | 13,769 | |
Expense reimbursements due from Adviser | | | 55,652 | | | | 27,220 | | | | 7,882 | | | | 27,707 | | | | 36,477 | |
Foreign tax reclaims | | | – | | | | 14,239 | | | | 10,546 | | | | – | | | | – | |
Other assets | | | 22,191 | | | | 15,941 | | | | 24,003 | | | | 13,293 | | | | 11,889 | |
| | | | | | | | | | | | | | | | | | | | |
Total Assets | | | 99,372,609 | | | | 24,837,646 | | | | 56,619,356 | | | | 34,155,989 | | | | 14,761,983 | |
| | | | | | | | | | | | | | | | | | | | |
Liabilities | | | | | | | | | | | | | | | | | | | | |
Options written, at value (premiums received $13,806) | | | – | | | | – | | | | – | | | | – | | | | 7,680 | |
Securities sold short, at value (proceeds of $234,016) | | | – | | | | – | | | | – | | | | 294,285 | | | | – | |
Payables: | | | | | | | | | | | | | | | | | | | | |
Due to custodian bank | | | 8,232 | | | | 39,745 | | | | 1,242,377 | | | | – | | | | 59,844 | |
Due to prime broker | | | – | | | | – | | | | – | | | | 9,821 | | | | 855,561 | |
Expense recoupment due to adviser | | | – | | | | – | | | | 4,439 | | | | – | | | | – | |
Investments purchased | | | 1,312,150 | | | | – | | | | – | | | | 8,039,956 | | | | – | |
Payable for collateral received on securities loaned | | | 5,182,350 | | | | 1,657,072 | | | | 1,490,742 | | | | 568,361 | | | | 611,515 | |
Fund shares redeemed | | | 81,250 | | | | 40,973 | | | | 30,570 | | | | 9,925 | | | | 185,674 | |
Dividends from short positions | | | – | | | | – | | | | – | | | | 2,838 | | | | – | |
Advisory fees | | | 45,848 | | | | 15,033 | | | | 34,308 | | | | 13,034 | | | | 8,112 | |
Accrued distribution fees | | | 4,247 | | | | 6,391 | | | | 17,996 | | | | 7,066 | | | | 2,693 | |
Fund accounting fees | | | 3,166 | | | | 813 | | | | 1,837 | | | | 603 | | | | 446 | |
Transfer agent fees | | | 15,000 | | | | 8,222 | | | | 15,846 | | | | 6,262 | | | | 6,995 | |
Administration fees | | | 3,821 | | | | 1,002 | | | | 2,287 | | | | 767 | | | | 541 | |
Trustee fees | | | 2,533 | | | | 776 | | | | 1,722 | | | | 420 | | | | 461 | |
Accrued expenses | | | 45,835 | | | | 40,950 | | | | 46,234 | | | | 40,661 | | | | 43,257 | |
| | | | | | | | | | | | | | | | | | | | |
Total Liabilities | | | 6,704,432 | | | | 1,810,977 | | | | 2,888,358 | | | | 8,993,999 | | | | 1,782,779 | |
| | | | | | | | | | | | | | | | | | | | |
Net Assets - all share classes | | $ | 92,668,177 | | | $ | 23,026,669 | | | $ | 53,730,998 | | | $ | 25,161,990 | | | $ | 12,979,204 | |
| | | | | | | | | | | | | | | | | | | | |
Net Assets - Class C | | $ | 3,771,597 | | | $ | 5,145,870 | | | $ | 18,378,282 | | | $ | 6,004,365 | | | $ | 2,242,740 | |
| | | | | | | | | | | | | | | | | | | | |
Net Assets - Class S* | | $ | 81,381,276 | | | $ | 7,122,803 | | | $ | 22,952,064 | | | $ | 3,470,803 | | | $ | 6,691,757 | |
| | | | | | | | | | | | | | | | | | | | |
Net Assets - Class A | | $ | 7,515,304 | | | $ | 10,757,996 | | | $ | 12,400,652 | | | $ | 15,686,822 | | | $ | 4,044,707 | |
| | | | | | | | | | | | | | | | | | | | |
| | | | | | | | | | | | | | | | | | | | |
| | | ICON
Bond Fund | | | ICON Equity
Income
Fund | | | ICON Fund | | | ICON
Long/Short
Fund | | | ICON Risk-
Managed
Equity Fund | |
Net Assets Consist of | | | | | | | | | | | | | | | | | | | | |
Paid-in capital | | $ | 85,521,269 | | | $ | 49,011,305 | | | $ | 81,050,188 | | | $ | 84,804,108 | | | $ | 30,040,045 | |
Accumulated undistributed net investment income/(loss) | | | - | | | | (652 | ) | | | 169,811 | | | | (54,664 | ) | | | 2,787 | |
Accumulated undistributed net realized gain/(loss) from investments, written options, securities sold short and foreign currency transactions | | | 1,960,539 | | | | (27,859,794 | ) | | | (40,986,603 | ) | | | (62,930,149 | ) | | | (19,687,429 | ) |
Unrealized appreciation/(depreciation) on investments, written options, securities sold short and foreign currency transactions | | | 5,186,369 | | | | 1,875,810 | | | | 13,497,602 | | | | 3,342,695 | | | | 2,623,801 | |
| | | | | | | | | | | | | | | | | | | | |
Net Assets | | $ | 92,668,177 | | | $ | 23,026,669 | | | $ | 53,730,998 | | | $ | 25,161,990 | | | $ | 12,979,204 | |
| | | | | | | | | | | | | | | | | | | | |
Shares outstanding (unlimited shares authorized, no par value) | | | | | | | | | | | | | | | | | | | | |
Class C | | | 357,532 | | | | 420,194 | | | | 1,763,318 | | | | 444,239 | | | | 196,518 | |
Class S* | | | 7,743,787 | | | | 584,811 | | | | 2,023,151 | | | | 238,378 | | | | 543,129 | |
Class A | | | 714,814 | | | | 887,506 | | | | 1,142,784 | | | | 1,096,116 | | | | 335,245 | |
Net asset value (offering and redemption price per share) | | | | | | | | | | | | | | | | | | | | |
Class C | | $ | 10.55 | | | $ | 12.25 | | | $ | 10.42 | | | $ | 13.52 | | | $ | 11.41 | |
Class S* | | $ | 10.51 | | | $ | 12.18 | | | $ | 11.34 | | | $ | 14.56 | | | $ | 12.32 | |
Class A | | $ | 10.51 | | | $ | 12.12 | | | $ | 10.85 | | | $ | 14.31 | | | $ | 12.06 | |
Class A maximum offering price (100%/(100%-maximum sales charge)) of net asset value adjusted to the nearest cent per share | | $ | 11.03 | | | $ | 12.86 | | | $ | 11.51 | | | $ | 15.18 | | | $ | 12.80 | |
| | | | | |
† Includes securities on loan of | | $ | 4,980,518 | | | $ | 1,616,680 | | | $ | 1,477,286 | | | $ | 560,675 | | | $ | 592,313 | |
| * | Class S shares were formerly named Class Z shares prior to January 23, 2012. |
The accompanying notes are an integral part of the financial statements.
STATEMENTSOF OPERATIONS
FORTHEYEARENDED SEPTEMBER 30, 2012
| | | | | | | | | | | | | | | | | | | | |
| | | ICON
Bond
Fund | | | ICON Equity
Income Fund | | | ICON Fund | | | ICON
Long/Short
Fund | | | ICON
Risk-Managed
Equity Fund | |
Investment Income | | | | | | | | | | | | | | | | | | | | |
Interest | | $ | 4,468,943 | | | $ | 94,855 | | | $ | 4 | | | $ | 29 | | | $ | 20 | |
Dividends | | | - | | | | 1,275,439 | | | | 1,220,410 | | | | 241,625 | | | | 420,624 | |
Income from securities lending, net | | | 28,490 | | | | 18,907 | | | | 16,840 | | | | 6,216 | | | | 593 | |
Foreign taxes withheld | | | - | | | | (18,299 | ) | | | (13,278 | ) | | | - | | | | (346 | ) |
| | | | | | | | | | | | | | | | | | | | |
Total Investment Income | | | 4,497,433 | | | | 1,370,902 | | | | 1,223,976 | | | | 247,870 | | | | 420,891 | |
| | | | | | | | | | | | | | | | | | | | |
Expenses | | | | | | | | | | | | | | | | | | | | |
Advisory fees | | | 584,155 | | | | 221,282 | | | | 492,028 | | | | 139,524 | | | | 130,711 | |
Distribution fees: | | | | | | | | | | | | | | | | | | | | |
Class I* | | | 71,228 | | | | 20,101 | | | | 38,544 | | | | 6,180 | | | | 12,466 | |
Class C | | | 32,512 | | | | 45,985 | | | | 192,146 | | | | 59,727 | | | | 22,379 | |
Class A | | | 28,752 | | | | 20,987 | | | | 26,891 | | | | 15,377 | | | | 11,550 | |
Fund accounting fees | | | 19,472 | | | | 5,901 | | | | 13,082 | | | | 3,278 | | | | 3,486 | |
Transfer agent fees | | | 92,432 | | | | 52,526 | | | | 113,013 | | | | 40,975 | | | | 42,352 | |
Administration fees | | | 48,671 | | | | 14,749 | | | | 32,795 | | | | 8,206 | | | | 8,713 | |
Custody fees | | | 4,198 | | | | 4,376 | | | | 2,937 | | | | 2,079 | | | | 9,091 | |
Prime broker expense | | | - | | | | - | | | | - | | | | 5,647 | | | | - | |
Registration fees: | | | | | | | | | | | | | | | | | | | | |
Class I* | | | 6,348 | | | | 4,418 | | | | 4,916 | | | | 3,428 | | | | 3,996 | |
Class C | | | 14,258 | | | | 15,257 | | | | 21,197 | | | | 17,081 | | | | 14,985 | |
Class S** | | | 16,479 | | | | 10,446 | | | | 17,131 | | | | 6,245 | | | | 9,552 | |
Class A | | | 11,486 | | | | 13,508 | | | | 12,103 | | | | 15,248 | | | | 14,628 | |
Insurance expense | | | 17,502 | | | | 6,261 | | | | 12,161 | | | | 2,432 | | | | 3,075 | |
Trustee fees and expenses | | | 9,677 | | | | 3,197 | | | | 6,937 | | | | 1,584 | | | | 1,948 | |
Audit and tax service expense | | | 31,577 | | | | 33,322 | | | | 32,337 | | | | 36,322 | | | | 37,037 | |
Interest expense | | | 403 | | | | 2,143 | | | | 7,418 | | | | 814 | | | | 5,039 | |
Recoupment of previously reimbursed expenses | | | - | | | | 3,519 | | | | - | | | | - | | | | 102 | |
Other expenses | | | 51,610 | | | | 32,249 | | | | 41,053 | | | | 20,734 | | | | 26,516 | |
Dividends on short positions | | | - | | | | - | | | | - | | | | 11,432 | | | | - | |
| | | | | | | | | | | | | | | | | | | | |
Total expenses before expense reimbursement | | | 1,040,760 | | | | 510,227 | | | | 1,066,689 | | | | 396,313 | | | | 357,626 | |
Expense reimbursement by Adviser due to expense limitation agreement | | | (177,672 | ) | | | (66,961 | ) | | | (12,506 | ) | | | (84,655 | ) | | | (97,055 | ) |
| | | | | | | | | | | | | | | | | | | | |
Net Expenses | | | 863,088 | | | | 443,266 | | | | 1,054,183 | | | | 311,658 | | | | 260,571 | |
| | | | | | | | | | | | | | | | | | | | |
Net Investment Income/(Loss) | | | 3,634,345 | | | | 927,636 | | | | 169,793 | | | | (63,788 | ) | | | 160,320 | |
| | | | | | | | | | | | | | | | | | | | |
| | | | | | | | | | | | | | | | | | | | |
| | | ICON
Bond
Fund | | | ICON Equity
Income Fund | | | ICON Fund | | | ICON
Long/Short
Fund | | | ICON
Risk-Managed
Equity Fund | |
Net Realized and Unrealized Gain/(Loss) on Investments, Written Options, Securities Sold Short and Foreign Currency Transactions | | | | | | | | | | | | | | | | | | | | |
Net realized gain/(loss) from investment transactions | | | 2,289,761 | | | | 755,371 | | | | 2,561,945 | | | | (196,645 | ) | | | 1,422,289 | |
Net realized gain/(loss) from foreign currency transactions | | | - | | | | 197 | | | | - | | | | - | | | | - | |
Net realized gain/(loss) from written option transactions | | | - | | | | - | | | | - | | | | - | | | | (791,477 | ) |
Net realized gain/(loss) from securities sold short | | | - | | | | - | | | | - | | | | (81,100 | ) | | | - | |
Change in unrealized net appreciation/ (depreciation) on investments and foreign currency transactions | | | 3,238,077 | | | | 5,113,358 | | | | 14,244,971 | | | | 3,825,611 | | | | 1,687,884 | |
Change in unrealized net appreciation/(depreciation) on written options | | | - | | | | - | | | | - | | | | - | | | | (57,862 | ) |
Change in unrealized net appreciation/(depreciation) on securities sold short | | | - | | | | - | | | | - | | | | (102,627 | ) | | | - | |
| | | | | | | | | | | | | | | | | | | | |
Net Realized and Unrealized gain/(loss) on investments, written options, securities sold short and foreign currency transactions | | | 5,527,838 | | | | 5,868,926 | | | | 16,806,916 | | | | 3,445,239 | | | | 2,260,834 | |
| | | | | | | | | | | | | | | | | | | | |
Net Increase/(Decrease) in Net Assets Resulting From Operations | | $ | 9,162,183 | | | $ | 6,796,562 | | | $ | 16,976,709 | | | $ | 3,381,451 | | | $ | 2,421,154 | |
| | | | | | | | | | | | | | | | | | | | |
| * | Class I shares merged into Class A on January 23, 2012. The information presented is that before the merger. |
| ** | Class S shares were formerly named Class Z shares prior to January 23, 2012. |
The accompanying notes are an integral part of the financial statements.
STATEMENTSOF CHANGESIN NET ASSETS
| | | | | | | | | | | | | | | | |
| | | ICON Bond Fund | | | ICON Equity Income Fund | |
| | | Year Ended
September 30,
2012 | | | Year Ended
September 30,
2011 | | | Year Ended
September 30,
2012 | | | Year Ended
September 30,
2011 | |
Operations | | | | | | | | | | | | | | | | |
Net investment income/(loss) | | $ | 3,634,345 | | | $ | 5,651,322 | | | $ | 927,636 | | | $ | 1,783,165 | |
Net realized gain/(loss) on investment transactions, written options, securities sold short and foreign currency transactions | | | 2,289,761 | | | | 3,288,516 | | | | 755,568 | | | | 5,490,002 | |
Change in net unrealized appreciation/(depreciation) on investments, written options, securities sold short and foreign currency transactions | | | 3,238,077 | | | | (8,196,071 | ) | | | 5,113,358 | | | | (7,090,202 | ) |
| | | | | | | | | | | | | | | | |
Net increase/(decrease) in net assets resulting from operations | | | 9,162,183 | | | | 743,767 | | | | 6,796,562 | | | | 182,965 | |
| | | | | | | | | | | | | | | | |
Dividends and Distributions to Shareholders | | | | | | | | | | | | | | | | |
Net investment income | | | | | | | | | | | | | | | | |
Class I* | | | (1,197,245 | ) | | | (5,454,987 | ) | | | (241,898 | ) | | | (1,549,373 | ) |
Class C | | | (116,098 | ) | | | (148,880 | ) | | | (105,929 | ) | | | (125,340 | ) |
Class S** | | | (1,925,269 | ) | | | (44,454 | ) | | | (260,178 | ) | | | (6,010 | ) |
Class A | | | (395,563 | ) | | | (2,400 | ) | | | (298,293 | ) | | | (124,650 | ) |
Net realized gains | | | | | | | | | | | | | | | | |
Class I* | | | (1,600,813 | ) | | | (2,996,875 | ) | | | - | | | | - | |
Class C | | | (65,783 | ) | | | (86,038 | ) | | | - | | | | - | |
Class S** | | | (15,117 | ) | | | (21,226 | ) | | | - | | | | - | |
Class A | | | (4,480 | ) | | | (723 | ) | | | - | | | | - | |
| | | | | | | | | | | | | | | | |
Net decrease from dividends and distributions | | | (5,320,368 | ) | | | (8,755,583 | ) | | | (906,298 | ) | | | (1,805,373 | ) |
| | | | | | | | | | | | | | | | |
Fund Share Transactions | | | | | | | | | | | | | | | | |
Shares sold | | | | | | | | | | | | | | | | |
Class I* | | | 10,974,194 | | | | 32,580,297 | | | | 987,981 | | | | 12,707,420 | |
Class C | | | 836,656 | | | | 750,410 | | | | 1,306,627 | | | | 1,345,156 | |
Class S** | | | 95,206,207 | | | | 19,196 | | | | 20,843,039 | | | | 80,077 | |
Class A*** | | | 29,040,913 | | | | 267,330 | | | | 12,715,353 | | | | 2,446,198 | |
Reinvested dividends and distributions | | | | | | | | | | | | | | | | |
Class I* | | | 2,526,419 | | | | 8,265,981 | | | | 231,892 | | | | 1,486,514 | |
Class C | | | 165,354 | | | | 213,732 | | | | 74,224 | | | | 101,343 | |
Class S** | | | 1,875,329 | | | | 1,620 | | | | 247,017 | | | | 5,779 | |
Class A | | | 358,295 | | | | 2,562 | | | | 235,826 | | | | 88,433 | |
Shares repurchased | | | | | | | | | | | | | | | | |
Class I* | | | (104,334,901 | ) | | | (87,891,304 | ) | | | (30,536,686 | ) | | | (25,184,721 | ) |
Class C | | | (1,259,657 | ) | | | (1,362,160 | ) | | | (923,118 | ) | | | (843,467 | ) |
Class S** | | | (20,171,872 | ) | | | (126,205 | ) | | | (14,805,923 | ) | | | (16,701 | ) |
Class A*** | | | (22,958,360 | ) | | | (12,669 | ) | | | (5,901,423 | ) | | | (840,365 | ) |
| | | | | | | | | | | | | | | | |
Net increase/(decrease) from fund share transactions | | | (7,741,423 | ) | | | (47,291,210 | ) | | | (15,525,191 | ) | | | (8,624,334 | ) |
| | | | | | | | | | | | | | | | |
Total net increase/(decrease) in net assets | | | (3,899,608 | ) | | | (55,303,026 | ) | | | (9,634,927 | ) | | | (10,246,742 | ) |
Net Assets | | | | | | | | | | | | | | | | |
Beginning of year | | | 96,567,785 | | | | 151,870,811 | | | | 32,661,596 | | | | 42,908,338 | |
| | | | | | | | | | | | | | | | |
End of year | | $ | 92,668,177 | | | $ | 96,567,785 | | | $ | 23,026,669 | | | $ | 32,661,596 | |
| | | | | | | | | | | | | | | | |
| | | | | | | | | | | | | | | | | | | | | | |
| ICON Fund | | | ICON Long/Short Fund | | | ICON Risk-Managed Equity Fund | |
Year Ended
September 30,
2012 | | | Year Ended
September 30,
2011 | | | Year Ended
September 30,
2012 | | | Year Ended
September 30,
2011 | | | Year Ended
September 30,
2012 | | | Year Ended
September 30,
2011 | |
| | | | | | | | | | | | | | | | | | | | | | |
| $ | 169,793 | | | $ | 161,465 | | | $ | (63,788 | ) | | $ | (91,742 | ) | | $ | 160,320 | | | $ | 173,708 | |
| 2,561,945 | | | | 10,265,342 | | | | (277,745 | ) | | | 1,531,016 | | | | 630,812 | | | | 2,108,423 | |
| 14,244,971 | | | | (5,953,813 | ) | | | 3,722,984 | | | | (1,378,386 | ) | | | 1,630,022 | | | | (1,739,486 | ) |
| | | | | | | | | | | | | | | | | | | | | | |
| 16,976,709 | | | | 4,472,994 | | | | 3,381,451 | | | | 60,888 | | | | 2,421,154 | | | | 542,645 | |
| | | | | | | | | | | | | | | | | | | | | | |
| | | | | | | | | | | | | | | | | | | | | | |
| | | | | | | | | | | | | | | | | | | | | | |
| | (161,444 | ) | | | (168,477 | ) | | | - | | | | - | | | | (41,651 | ) | | | (171,775 | ) |
| | - | | | | - | | | | - | | | | - | | | | (7,633 | ) | | | (3,673 | ) |
| | - | | | | - | | | | - | | | | - | | | | (68,173 | ) | | | (807 | ) |
| | - | | | | - | | | | - | | | | - | | | | (42,911 | ) | | | (27,376 | ) |
| | | | | | | | | | | | | | | | | | | | | | |
| | - | | | | - | | | | - | | | | - | | | | - | | | | - | |
| | - | | | | - | | | | - | | | | - | | | | - | | | | - | |
| | - | | | | - | | | | - | | | | - | | | | - | | | | - | |
| | - | | | | - | | | | - | | | | - | | | | - | | | | - | |
| | | | | | | | | | | | | | | | | | | | | | |
| (161,444 | ) | | | (168,477 | ) | | | - | | | | - | | | | (160,368 | ) | | | (203,631 | ) |
| | | | | | | | | | | | | | | | | | | | | | |
| | | | | | | | | | | | | | | | | | | | | | |
| | | | | | | | | | | | | | | | | | | | | | |
| | 847,758 | | | | 12,906,410 | | | | 615,566 | | | | 2,207,397 | | | | 960,926 | | | | 4,921,371 | |
| | 664,869 | | | | 1,201,294 | | | | 578,713 | | | | 172,641 | | | | 380,549 | | | | 495,568 | |
| | 40,695,868 | | | | 39,438 | | | | 6,330,779 | | | | 5,994 | | | | 12,234,963 | | | | 9,665 | |
| | 19,633,373 | | | | 572,831 | | | | 18,944,856 | | | | 378,445 | | | | 8,459,342 | | | | 454,303 | |
| | | | | | | | | | | | | | | | | | | | | | |
| | 155,712 | | | | 164,558 | | | | - | | | | - | | | | 36,883 | | | | 162,601 | |
| | - | | | | - | | | | - | | | | - | | | | 7,272 | | | | 3,600 | |
| | - | | | | - | | | | - | | | | - | | | | 63,891 | | | | 807 | |
| | - | | | | - | | | | - | | | | - | | | | 34,051 | | | | 24,439 | |
| | | | | | | | | | | | | | | | | | | | | | |
| | (56,622,985 | ) | | | (43,843,823 | ) | | | (9,274,530 | ) | | | (6,096,500 | ) | | | (18,292,414 | ) | | | (7,970,159 | ) |
| | (4,806,640 | ) | | | (8,294,982 | ) | | | (1,381,252 | ) | | | (4,226,492 | ) | | | (513,378 | ) | | | (1,039,898 | ) |
| | (20,097,004 | ) | | | (345,913 | ) | | | (2,970,746 | ) | | | (99,121 | ) | | | (5,996,598 | ) | | | (12,896 | ) |
| | (9,909,449 | ) | | | (660,978 | ) | | | (5,286,978 | ) | | | (1,018,297 | ) | | | (6,794,830 | ) | | | (2,709,760 | ) |
| | | | | | | | | | | | | | | | | | | | | | |
| (29,438,498 | ) | | | (38,261,165 | ) | | | 7,556,408 | | | | (8,675,933 | ) | | | (9,419,343 | ) | | | (5,660,359 | ) |
| | | | | | | | | | | | | | | | | | | | | | |
| (12,623,233 | ) | | | (33,956,648 | ) | | | 10,937,859 | | | | (8,615,045 | ) | | | (7,158,557 | ) | | | (5,321,345 | ) |
| | | | | | | | | | | | | | | | | | | | | | |
| | 66,354,231 | | | | 100,310,879 | | | | 14,224,131 | | | | 22,839,176 | | | | 20,137,761 | | | | 25,459,106 | |
| | | | | | | | | | | | | | | | | | | | | | |
| $ | 53,730,998 | | | $ | 66,354,231 | | | $ | 25,161,990 | | | $ | 14,224,131 | | | $ | 12,979,204 | | | $ | 20,137,761 | |
| | | | | | | | | | | | | | | | | | | | | | |
STATEMENTSOF CHANGESIN NET ASSETS (CONTINUED)
| | | | | | | | | | | | | | | | |
| | | ICON Bond
Fund | | | ICON
Equity Income Fund | |
| | | Year Ended
September 30,
2012 | | | Year Ended
September 30,
2011 | | | Year Ended
September 30,
2012 | | | Year Ended
September 30,
2011 | |
Transactions in Fund Shares | | | | | | | | | | | | | | | | |
Shares sold | | | | | | | | | | | | | | | | |
Class I* | | | 1,086,363 | | | | 3,096,208 | | | | 89,438 | | | | 1,070,619 | |
Class C | | | 81,024 | | | | 71,019 | | | | 112,921 | | | | 116,234 | |
Class S** | | | 9,427,267 | | | | 1,835 | | | | 1,787,991 | | | | 6,846 | |
Class A*** | | | 2,888,672 | | | | 25,660 | | | | 1,092,400 | | | | 209,444 | |
Reinvested dividends and distributions | | | | | | | | | | | | | | | | |
Class I* | | | 252,285 | | | | 795,208 | | | | 20,872 | | | | 128,303 | |
Class C | | | 16,263 | | | | 20,535 | | | | 6,330 | | | | 8,989 | |
Class S** | | | 181,099 | | | | 156 | | | | 20,738 | | | | 508 | |
Class A | | | 34,790 | | | | 249 | | | | 20,034 | | | | 7,833 | |
Shares repurchased | | | | | | | | | | | | | | | | |
Class I* | | | (10,382,660 | ) | | | (8,382,077 | ) | | | (2,620,173 | ) | | | (2,120,602 | ) |
Class C | | | (122,077 | ) | | | (128,801 | ) | | | (80,150 | ) | | | (73,121 | ) |
Class S** | | | (1,951,771 | ) | | | (12,029 | ) | | | (1,237,820 | ) | | | (1,444 | ) |
Class A*** | | | (2,233,329 | ) | | | (1,229 | ) | | | (507,849 | ) | | | (73,851 | ) |
| | | | | | | | | | | | | | | | |
Net increase/(decrease) | | | (722,074 | ) | | | (4,513,266 | ) | | | (1,295,268 | ) | | | (720,242 | ) |
| | | | | | | | | | | | | | | | |
Shares outstanding, beginning of year | | | 9,538,207 | | | | 14,051,473 | | | | 3,187,779 | | | | 3,908,021 | |
| | | | | | | | | | | | | | | | |
Shares outstanding, end of year | | | 8,816,133 | | | | 9,538,207 | | | | 1,892,511 | | | | 3,187,779 | |
| | | | | | | | | | | | | | | | |
Accumulated undistributed net investment income/(loss) | | $ | - | | | $ | (329,386 | ) | | $ | (652 | ) | | $ | (42,834 | ) |
| | | | | | | | | | | | | | | | |
| * | Class I shares merged into Class A on January 23, 2012. The information presented is that before the merger. |
| ** | Class S shares were formerly named Class Z shares prior to January 23, 2012. |
| *** | Class I shares merged into Class A on January 23, 2012. The information presented includes the merger activity. |
The accompanying notes are an integral part of the financial statements.
| | | | | | | | | | | | | | | | | | | | |
ICON Fund | | | ICON
Long/Short Fund | | | ICON
Risk-Managed Equity Fund | |
Year Ended
September 30,
2012 | | Year Ended
September 30,
2011 | | | Year Ended
September 30,
2012 | | | Year Ended
September 30,
2011 | | | Year Ended
September 30,
2012 | | | Year Ended
September 30,
2011 | |
| | | | | | | | | | | | | | | | | | | | |
| | | | | | | | | | | | | | | | | | | | |
| 85,117 | | | 1,260,372 | | | | 49,085 | | | | 168,947 | | | | 86,186 | | | | 431,144 | |
| 67,437 | | | 125,482 | | | | 43,992 | | | | 14,038 | | | | 34,974 | | | | 47,099 | |
| 3,846,616 | | | 3,786 | | | | 447,166 | | | | 480 | | | | 1,038,013 | | | | 834 | |
| 1,943,986 | | | 56,844 | | | | 1,368,234 | | | | 31,066 | | | | 732,607 | | | | 40,810 | |
| | | | | | | | | | | | | | | | | | | | |
| 16,136 | | | 16,133 | | | | - | | | | - | | | | 3,305 | | | | 14,135 | |
| - | | | - | | | | - | | | | - | | | | 659 | | | | 330 | |
| - | | | - | | | | - | | | | - | | | | 5,298 | | | | 69 | |
| - | | | - | | | | - | | | | - | | | | 2,907 | | | | 2,138 | |
| | | | | | | | | | | | | | | | | | | | |
| (5,367,692) | | | (4,156,795 | ) | | | (693,486 | ) | | | (478,602 | ) | | | (1,585,532 | ) | | | (693,438 | ) |
| (492,305) | | | (877,121 | ) | | | (109,071 | ) | | | (350,539 | ) | | | (47,179 | ) | | | (96,498 | ) |
| (1,838,509) | | | (33,715 | ) | | | (212,423 | ) | | | (7,938 | ) | | | (505,652 | ) | | | (1,092 | ) |
| (948,363) | | | (66,713 | ) | | | (378,149 | ) | | | (82,587 | ) | | | (586,238 | ) | | | (232,103 | ) |
| | | | | | | | | | | | | | | | | | | | |
| (2,687,577) | | | (3,671,727 | ) | | | 515,348 | | | | (705,135 | ) | | | (820,652 | ) | | | (486,572 | ) |
| | | | | | | | | | | | | | | | | | | | |
7,616,830 | | | 11,288,557 | | | | 1,263,385 | | | | 1,968,520 | | | | 1,895,544 | | | | 2,382,116 | |
| | | | | | | | | | | | | | | | | | | | |
4,929,253 | | | 7,616,830 | | | | 1,778,733 | | | | 1,263,385 | | | | 1,074,892 | | | | 1,895,544 | |
| | | | | | | | | | | | | | | | | | | | |
$169,811 | | $ | 161,462 | | | $ | (54,664 | ) | | $ | - | | | $ | 2,787 | | | $ | - | |
| | | | | | | | | | | | | | | | | | | | |
FINANCIAL HIGHLIGHTS
| | | | | | | | | | | | | | | | | | | | | | | | |
| | | | | | Income/(loss) from investment operations | | | Less dividends and | |
| | | Net asset
value,
beginning
of period | | | Net
investment
income/
(loss)(x) | | | Net realized
and unrealized
gains/(losses)
on investments | | | Total from
investment
operations | | | Dividends
from net
investment
income | | | Distributions
from net
realized
gains | |
ICON Bond Fund | | | | | | | | | | | | | | | | | | | | | | | | |
Class C | | | | | | | | | | | | | | | | | | | | | | | | |
Year ended September 30, 2012 | | $ | 10.15 | | | $ | 0.31 | | | $ | 0.57 | | | $ | 0.88 | | | $ | (0.31 | ) | | $ | (0.17 | ) |
Year ended September 30, 2011 | | | 10.83 | | | | 0.39 | | | | (0.46 | ) | | | (0.07 | ) | | | (0.39 | ) | | | (0.22 | ) |
Year ended September 30, 2010 | | | 10.30 | | | | 0.39 | | | | 0.57 | | | | 0.96 | | | | (0.39 | ) | | | (0.04 | ) |
Year ended September 30, 2009 | | | 9.46 | | | | 0.34 | | | | 0.84 | | | | 1.18 | | | | (0.34 | ) | | | – | |
Year ended September 30, 2008 | | | 10.05 | | | | 0.35 | | | | (0.55 | ) | | | (0.20 | ) | | | (0.39 | ) | | | – | |
Class S** | | | | | | | | | | | | | | | | | | | | | | | | |
Year ended September 30, 2012 | | | 10.11 | | | | 0.38 | | | | 0.59 | | | | 0.97 | | | | (0.40 | ) | | | (0.17 | ) |
Year ended September 30, 2011 | | | 10.79 | | | | 0.47 | | | | (0.46 | ) | | | 0.01 | | | | (0.47 | ) | | | (0.22 | ) |
Year ended September 30, 2010 | | | 10.26 | | | | 0.48 | | | | 0.57 | | | | 1.05 | | | | (0.48 | ) | | | (0.04 | ) |
Year ended September 30, 2009 | | | 9.42 | | | | 0.45 | | | | 0.81 | | | | 1.26 | | | | (0.42 | ) | | | – | |
Year ended September 30, 2008 | | | 10.02 | | | | 0.44 | | | | (0.57 | ) | | | (0.13 | ) | | | (0.47 | ) | | | – | |
Class A*** | | | | | | | | | | | | | | | | | | | | | | | | |
Year ended September 30, 2012 | | | 10.11 | | | | 0.36 | | | | 0.58 | | | | 0.94 | | | | (0.37 | ) | | | (0.17 | ) |
Year ended September 30, 2011 | | | 10.81 | | | | 0.46 | | | | (0.46 | ) | | | – | | | | (0.48 | ) | | | (0.22 | ) |
| | | | | | | | | | | | | | | | | | | | | | | | | | | | | | | | | | |
| distributions | | | | | | | | | | | | Ratio of expenses
to average net assets | | | Ratio of net investment
income/(loss)
to average net assets | | | | |
Total
dividends
and
distributions | | | Net asset
value, end
of period | | | Total
return* | | | Net assets,
end of
period (in
thousands) | | | Before
expense
limitation
and transfer
agent
earnings
credits | | | After
expense
limitation
and transfer
agent
earnings
credits(b) | | | Before
expense
limitation
and transfer
agent
earnings
credits | | | After
expense
limitation
and transfer
agent
earnings
credits | | | Portfolio
turnover
rate(a) | |
| | | | | | | | | | | | | | | | | | | | | | | | | | | | | | | | | | |
| | | | | | | | | | | | | | | | | | | | | | | | | | | | | | | | | | |
| $ | (0.48 | ) | | $ | 10.55 | | | | 8.98 | % | | $ | 3,772 | | | | 2.28 | % | | | 1.60 | % | | | 2.35 | % | | | 3.03 | % | | | 51.28 | % |
| | (0.61 | ) | | | 10.15 | | | | (0.68 | )% | | | 3,879 | | | | 2.16 | % | | | 1.60 | % | | | 3.11 | % | | | 3.67 | % | | | 32.13 | % |
| | (0.43 | ) | | | 10.83 | | | | 9.52 | % | | | 4,544 | | | | 2.46 | % | | | 1.60 | % | | | 2.88 | % | | | 3.74 | % | | | 63.47 | % |
| | (0.34 | ) | | | 10.30 | | | | 12.80 | % | | | 4,441 | | | | 2.40 | % | | | 1.60 | % | | | 2.75 | % | | | 3.55 | % | | | 73.71 | % |
| | (0.39 | ) | | | 9.46 | | | | (2.16 | )% | | | 2,725 | | | | 2.42 | % | | | 1.60 | % | | | 2.71 | % | | | 3.53 | % | | | 73.47 | % |
| | | | | | | | | | | | | | | | | | | | | | | | | | | | | | | | | | |
| | (0.57 | ) | | | 10.51 | | | | 9.93 | % | | | 81,381 | | | | 0.88 | % | | | 0.75 | % | | | 3.46 | % | | | 3.59 | % | | | 51.28 | % |
| | (0.69 | ) | | | 10.11 | | | | 0.15 | % | | | 881 | | | | 1.18 | % | | | 0.75 | % | | | 4.08 | % | | | 4.51 | % | | | 32.13 | % |
| | (0.52 | ) | | | 10.79 | | | | 10.45 | % | | | 1,049 | | | | 1.39 | % | | | 0.75 | % | | | 3.95 | % | | | 4.59 | % | | | 63.47 | % |
| | (0.42 | ) | | | 10.26 | | | | 13.79 | % | | | 1,087 | | | | 1.91 | % | | | 0.75 | % | | | 3.34 | % | | | 4.50 | % | | | 73.71 | % |
| | (0.47 | ) | | | 9.42 | | | | (1.43 | )% | | | 8 | | | | 186.00 | % | | | 0.75 | % | | | (180.79 | )% | | | 4.46 | % | | | 73.47 | % |
| | | | | | | | | | | | | | | | | | | | | | | | | | | | | | | | | | |
| | (0.54 | ) | | | 10.51 | | | | 9.66 | % | | | 7,515 | | | | 1.31 | % | | | 1.00 | % | | | 3.13 | % | | | 3.44 | % | | | 51.28 | % |
| | (0.70 | ) | | | 10.11 | | | | (0.02 | )% | | | 249 | | | | 5.83 | % | | | 1.01 | % | | | (0.38 | )% | | | 4.44 | % | | | 32.13 | % |
FINANCIAL HIGHLIGHTS (CONTINUED)
| | | | | | | | | | | | | | | | | | | | | | | | |
| | | | | | Income/(loss) from investment operations | | | Less dividends and | |
| | | Net asset
value,
beginning
of period | | | Net
investment
income/
(loss)(x) | | | Net realized
and unrealized
gains/(losses)
on investments | | | Total from
investment
operations | | | Dividends
from net
investment
income | | | Distributions
from net
realized
gains | |
ICON Equity Income Fund | | | | | | | | | | | | | | | | | | | | | | | | |
Class C | | | | | | | | | | | | | | | | | | | | | | | | |
Year ended September 30, 2012 | | $ | 10.16 | | | $ | 0.29 | | | $ | 2.06 | | | $ | 2.35 | | | $ | (0.26 | ) | | $ | - | |
Year ended September 30, 2011 | | | 10.85 | | | | 0.37 | | | | (0.72 | ) | | | (0.35 | ) | | | (0.34 | ) | | | - | |
Year ended September 30, 2010 | | | 10.16 | | | | 0.36 | | | | 0.64 | | | | 1.00 | | | | (0.31 | ) | | | - | |
Year ended September 30, 2009 | | | 11.73 | | | | 0.32 | | | | (1.56 | ) | | | (1.24 | ) | | | (0.33 | ) | | | - | |
Year ended September 30, 2008 | | | 16.33 | | | | 0.21 | | | | (2.97 | ) | | | (2.76 | ) | | | (0.20 | ) | | | (1.64 | ) |
Class S** | | | | | | | | | | | | | | | | | | | | | | | | |
Year ended September 30, 2012 | | | 10.21 | | | | 0.43 | | | | 2.03 | | | | 2.46 | | | | (0.49 | ) | | | - | |
Year ended September 30, 2011 | | | 10.96 | | | | 0.50 | | | | (0.71 | ) | | | (0.21 | ) | | | (0.54 | ) | | | - | |
Year ended September 30, 2010 | | | 10.26 | | | | 0.47 | | | | 0.64 | | | | 1.11 | | | | (0.41 | ) | | | - | |
Year ended September 30, 2009 | | | 11.84 | | | | 0.41 | | | | (1.57 | ) | | | (1.16 | ) | | | (0.42 | ) | | | - | |
Year ended September 30, 2008 | | | 16.46 | | | | 0.38 | | | | (3.04 | ) | | | (2.66 | ) | | | (0.32 | ) | | | (1.64 | ) |
Class A*** | | | | | | | | | | | | | | | | | | | | | | | | |
Year ended September 30, 2012 | | | 10.15 | | | | 0.39 | | | | 2.03 | | | | 2.42 | | | | (0.45 | ) | | | - | |
Year ended September 30, 2011 | | | 10.90 | | | | 0.47 | | | | (0.71 | ) | | | (0.24 | ) | | | (0.51 | ) | | | - | |
Year ended September 30, 2010 | | | 10.21 | | | | 0.46 | | | | 0.63 | | | | 1.09 | | | | (0.40 | ) | | | - | |
Year ended September 30, 2009 | | | 11.80 | | | | 0.38 | | | | (1.57 | ) | | | (1.19 | ) | | | (0.40 | ) | | | - | |
Year ended September 30, 2008 | | | 16.40 | | | | 0.31 | | | | (2.99 | ) | | | (2.68 | ) | | | (0.28 | ) | | | (1.64 | ) |
| | | | | | | | | | | | | | | | | | | | | | | | | | | | | | | | | | |
| distributions | | | | | | | | | | | | Ratio of expenses
to average net assets | | | Ratio of net investment
income/(loss)
to average net assets | | | | |
Total
dividends
and
distributions | | | Net asset
value, end
of period | | | Total
return* | | | Net assets,
end of
period (in
thousands) | | | Before
expense
limitation/
and transfer
agent
earnings
credits | | | After
expense
limitation/
and transfer
agent
earnings
Credits(b) | | | Before
expense
limitation/
and transfer
agent
earnings
credits | | | After
expense
limitation/
and transfer
agent
earnings
credits | | | Portfolio
turnover
rate(a) | |
| | | | | | | | | | | | | | | | | | | | | | | | | | | | | | | | | | |
| | | | | | | | | | | | | | | | | | | | | | | | | | | | | | | | | | |
| $ | (0.26 | ) | | $ | 12.25 | | | | 23.31 | % | | $ | 5,146 | | | | 2.62 | % | | | 2.20 | % | | | 2.09 | % | | | 2.51 | % | | | 122.39 | % |
| | (0.34 | ) | | | 10.16 | | | | (3.47 | )% | | | 3,874 | | | | 2.53 | % | | | 2.20 | % | | | 2.85 | % | | | 3.18 | % | | | 142.75 | % |
| | (0.31 | ) | | | 10.85 | | | | 9.99 | % | | | 3,569 | | | | 2.97 | % | | | 2.20 | % | | | 2.68 | % | | | 3.46 | % | | | 123.33 | % |
| | (0.33 | ) | | | 10.16 | | | | (10.12 | )% | | | 3,348 | | | | 2.69 | % | | | 2.21 | % | | | 3.21 | % | | | 3.69 | % | | | 148.56 | % |
| | (1.84 | ) | | | 11.73 | | | | (18.60 | )% | | | 4,461 | | | | 2.34 | %(d) | | | 2.20 | % | | | 1.40 | % | | | 1.54 | % | | | 132.93 | % |
| | | | | | | | | | | | | | | | | | | | | | | | | | | | | | | | | | |
| | (0.49 | ) | | | 12.18 | | | | 24.43 | % | | | 7,123 | | | | 1.47 | % | | | 1.21 | % | | | 3.31 | % | | | 3.57 | % | | | 122.39 | % |
| | (0.54 | ) | | | 10.21 | | | | (2.40 | )% | | | 142 | | | | 3.99 | % | | | 1.20 | % | | | 1.45 | % | | | 4.24 | % | | | 142.75 | % |
| | (0.41 | ) | | | 10.96 | | | | 11.04 | % | | | 88 | | | | 7.66 | % | | | 1.20 | % | | | (2.01 | )% | | | 4.45 | % | | | 123.33 | % |
| | (0.42 | ) | | | 10.26 | | | | (9.20 | )% | | | 66 | | | | 8.73 | % | | | 1.21 | % | | | (2.83 | )% | | | 4.69 | % | | | 148.56 | % |
| | (1.96 | ) | | | 11.84 | | | | (17.81 | )% | | | 81 | | | | 11.18 | %(d) | | | 1.20 | % | | | (7.14 | )% | | | 2.84 | % | | | 132.93 | % |
| | | | | | | | | | | | | | | | | | | | | | | | | | | | | | | | | | |
| | (0.45 | ) | | | 12.12 | | | | 24.10 | % | | | 10,758 | | | | 1.69 | % | | | 1.45 | % | | | 3.11 | % | | | 3.35 | % | | | 122.39 | % |
| | (0.51 | ) | | | 10.15 | | | | (2.66 | )% | | | 2,871 | | | | 1.91 | % | | | 1.45 | % | | | 3.55 | % | | | 4.01 | % | | | 142.75 | % |
| | (0.40 | ) | | | 10.90 | | | | 10.84 | % | | | 1,521 | | | | 4.59 | % | | | 1.45 | % | | | 1.19 | % | | | 4.32 | % | | | 123.33 | % |
| | (0.40 | ) | | | 10.21 | | | | (9.53 | )% | | | 237 | | | | 5.68 | % | | | 1.46 | % | | | 0.26 | % | | | 4.48 | % | | | 148.56 | % |
| | (1.92 | ) | | | 11.80 | | | | (17.98 | )% | | | 281 | | | | 5.40 | %(d) | | | 1.44 | % | | | (1.67 | )% | | | 2.29 | % | | | 132.93 | % |
FINANCIAL HIGHLIGHTS (CONTINUED)
| | | | | | | | | | | | | | | | | | | | | | | | |
| | | | | | Income/(loss) from investment operations | | | Less dividends and | |
| | | Net asset
value,
beginning
of period | | | Net
investment
income/
(loss)(x) | | | Net realized
and unrealized
gains/(losses)
on investments | | | Total from
investment
operations | | | Dividends
from net
investment
income | | | Distributions
from net
realized
gains | |
ICON Fund | | | | | | | | | | | | | | | | | | | | | | | | |
Class C | | | | | | | | | | | | | | | | | | | | | | | | |
Year ended September 30, 2012 | | $ | 8.17 | | | $ | (0.04 | ) | | $ | 2.29 | | | $ | 2.25 | | | $ | - | | | $ | - | |
Year ended September 30, 2011 | | | 8.36 | | | | (0.05 | ) | | | (0.14 | ) | | | (0.19 | ) | | | - | | | | - | |
Year ended September 30, 2010 | | | 8.37 | | | | (0.04 | ) | | | 0.11 | | | | 0.07 | | | | (0.08 | ) | | | - | |
Year ended September 30, 2009 | | | 10.46 | | | | 0.03 | | | | (2.12 | ) | | | (2.09 | ) | | | - | | | | - | |
Year ended September 30, 2008 | | | 15.66 | | | | (0.01 | ) | | | (3.82 | ) | | | (3.83 | ) | | | - | | | | (1.37 | ) |
Class S** | | | | | | | | | | | | | | | | | | | | | | | | |
Year ended September 30, 2012 | | | 8.82 | | | | 0.07 | | | | 2.45 | | | | 2.52 | | | | - | | | | - | |
Year ended September 30, 2011 | | | 9.04 | | | | (0.07 | ) | | | (0.15 | ) | | | (0.22 | ) | | | - | | | | - | |
Year ended September 30, 2010 | | | 9.07 | | | | (0.01 | ) | | | 0.11 | | | | 0.10 | | | | (0.13 | ) | | | - | |
Year ended September 30, 2009 | | | 11.24 | | | | 0.10 | | | | (2.27 | ) | | | (2.17 | ) | | | - | | | | - | |
Year ended September 30, 2008 | | | 16.62 | | | | 0.09 | | | | (4.10 | ) | | | (4.01 | ) | | | - | | | | (1.37 | ) |
Class A*** | | | | | | | | | | | | | | | | | | | | | | | | |
Year ended September 30, 2012 | | | 8.46 | | | | 0.03 | | | | 2.36 | | | | 2.39 | | | | - | | | | - | |
Year ended September 30, 2011 | | | 8.67 | | | | (0.07 | ) | | | (0.14 | ) | | | (0.21 | ) | | | - | | | | - | |
Year ended September 30, 2010 | | | 8.73 | | | | (0.08 | ) | | | 0.10 | | | | 0.02 | | | | (0.08 | ) | | | - | |
Year ended September 30, 2009 | | | 10.92 | | | | 0.01 | | | | (2.20 | ) | | | (2.19 | ) | | | - | | | | - | |
Year ended September 30, 2008 | | | 16.32 | | | | (0.01 | ) | | | (4.02 | ) | | | (4.03 | ) | | | - | | | | (1.37 | ) |
| | | | | | | | | | | | | | | | | | | | | | | | | | | | | | | | | | |
| distributions | | | | | | | | | | | | Ratio of expenses
to average net assets | | | Ratio of net investment
income/(loss)
to average net assets | | | | |
Total
dividends
and
distributions | | | Net asset
value, end
of period | | | Total
return* | | | Net assets,
end of
period (in
thousands) | | | Before
expense
limitation/
and transfer
agent
earnings
credits | | | After
expense
limitation/
and transfer
agent
earnings
Credits(b) | | | Before
expense
limitation/
and transfer
agent
earnings
credits | | | After
expense
limitation/
and transfer
agent
earnings
credits | | | Portfolio
turnover
rate(a) | |
| | | | | | | | | | | | | | | | | | | | | | | | | | | | | | | | | | |
| | | | | | | | | | | | | | | | | | | | | | | | | | | | | | | | | | |
| $ | - | | | $ | 10.42 | | | | 27.54 | % | | $ | 18,378 | | | | 2.35 | % | | | 2.28 | % | | | (0.48 | )% | | | (0.41 | )% | | | 23.73 | % |
| | - | | | | 8.17 | | | | (2.27 | )% | | | 17,884 | | | | 2.27 | % | | | 2.27 | % | | | (0.50 | )% | | | (0.50 | )% | | | 57.93 | % |
| | (0.08 | ) | | | 8.36 | | | | 0.84 | % | | | 24,573 | | | | 2.25 | % | | | 2.25 | % | | | (0.45 | )% | | | (0.45 | )% | | | 123.12 | % |
| | - | | | | 8.37 | | | | (19.98 | )% | | | 33,089 | | | | 2.25 | % | | | 2.25 | % | | | 0.44 | % | | | 0.44 | % | | | 208.48 | % |
| | (1.37 | ) | | | 10.46 | | | | (26.61 | )% | | | 55,364 | | | | 2.05 | % | | | 2.05 | % | | | (0.09 | )% | | | (0.09 | )% | | | 173.81 | % |
| | | | | | | | | | | | | | | | | | | | | | | | | | | | | | | | | | |
| | - | | | | 11.34 | | | | 28.57 | % | | | 22,952 | | | | 1.18 | % | | | 1.18 | % | | | 0.61 | % | | | 0.61 | % | | | 23.73 | % |
| | - | | | | 8.82 | | | | (2.43 | )% | | | 133 | | | | 2.52 | % | | | 2.52 | % | | | (0.72 | )% | | | (0.72 | )% | | | 57.93 | % |
| | (0.13 | ) | | | 9.04 | | | | 1.10 | % | | | 406 | | | | 1.90 | % | | | 1.90 | % | | | (0.06 | )% | | | (0.06 | )% | | | 123.12 | % |
| | - | | | | 9.07 | | | | (19.31 | )% | | | 887 | | | | 1.45 | % | | | 1.45 | % | | | 1.27 | % | | | 1.27 | % | | | 208.48 | % |
| | (1.37 | ) | | | 11.24 | | | | (26.11 | )% | | | 1,222 | | | | 1.34 | % | | | 1.34 | % | | | 0.65 | % | | | 0.65 | % | | | 173.81 | % |
| | | | | | | | | | | | | | | | | | | | | | | | | | | | | | | | | | |
| | - | | | | 10.85 | | | | 28.25 | % | | | 12,401 | | | | 1.54 | % | | | 1.54 | % | | | 0.27 | % | | | 0.27 | % | | | 23.73 | % |
| | - | | | | 8.46 | | | | (2.42 | )% | | | 1,245 | | | | 2.52 | % | | | 2.52 | % | | | (0.75 | )% | | | (0.75 | )% | | | 57.93 | % |
| | (0.08 | ) | | | 8.67 | | | | 0.22 | % | | | 1,362 | | | | 2.68 | % | | | 2.68 | % | | | (0.88 | )% | | | (0.88 | )% | | | 123.12 | % |
| | - | | | | 8.73 | | | | (20.05 | )% | | | 1,969 | | | | 2.43 | % | | | 2.43 | % | | | 0.11 | % | | | 0.11 | % | | | 208.48 | % |
| | (1.37 | ) | | | 10.92 | | | | (26.76 | )% | | | 1,878 | | | | 2.09 | % | | | 2.09 | % | | | (0.08 | )% | | | (0.08 | )% | | | 173.81 | % |
FINANCIAL HIGHLIGHTS (CONTINUED)
| | | | | | | | | | | | | | | | | | | | | | | | |
| | | | | | Income/(loss) from investment operations | | | Less dividends and | |
| | | Net asset
value,
beginning
of period | | | Net
investment
income/
(loss)(x) | | | Net realized
and unrealized
gains/(losses)
on investments | | | Total from
investment
operations | | | Dividends
from net
investment
income | | | Distributions
from net
realized
gains | |
ICON Long/Short Fund(c) | | | | | | | | | | | | | | | | | | | | | | | | |
Class C | | | | | | | | | | | | | | | | | | | | | | | | |
Year ended September 30, 2012 | | $ | 10.89 | | | $ | (0.11 | ) | | $ | 2.74 | | | $ | 2.63 | | | $ | – | | | $ | – | |
Year ended September 30, 2011 | | | 11.29 | | | | (0.11 | ) | | | (0.29 | ) | | | (0.40 | ) | | | – | | | | – | |
Year ended September 30, 2010 | | | 11.19 | | | | (0.08 | ) | | | 0.27 | | | | 0.19 | | | | (0.09 | ) | | | – | |
Year ended September 30, 2009 | | | 13.13 | | | | 0.06 | | | | (1.81 | ) | | | (1.75 | ) | | | (0.19 | ) | | | – | |
Year ended September 30, 2008 | | | 18.54 | | | | – | | | | (4.67 | ) | | | (4.67 | ) | | | – | | | | (0.74 | ) |
Class S** | | | | | | | | | | | | | | | | | | | | | | | | |
Year ended September 30, 2012 | | | 11.61 | | | | 0.02 | | | | 2.93 | | | | 2.95 | | | | – | | | | – | |
Year ended September 30, 2011 | | | 11.90 | | | | 0.02 | | | | (0.31 | ) | | | (0.29 | ) | | | – | | | | – | |
Year ended September 30, 2010 | | | 11.80 | | | | 0.03 | | | | 0.29 | | | | 0.32 | | | | (0.22 | ) | | | – | |
Year ended September 30, 2009 | | | 13.81 | | | | 0.17 | | | | (1.89 | ) | | | (1.72 | ) | | | (0.29 | ) | | | – | |
Year ended September 30, 2008 | | | 19.30 | | | | 0.18 | | | | (4.93 | ) | | | (4.75 | ) | | | – | | | | (0.74 | ) |
Class A*** | | | | | | | | | | | | | | | | | | | | | | | | |
Year ended September 30, 2012 | | | 11.44 | | | | (0.02 | ) | | | 2.89 | | | | 2.87 | | | | – | | | | – | |
Year ended September 30, 2011 | | | 11.77 | | | | (0.02 | ) | | | (0.31 | ) | | | (0.33 | ) | | | – | | | | – | |
Year ended September 30, 2010 | | | 11.67 | | | | – | | | | 0.28 | | | | 0.28 | | | | (0.18 | ) | | | – | |
Year ended September 30, 2009 | | | 13.69 | | | | 0.14 | | | | (1.88 | ) | | | (1.74 | ) | | | (0.28 | ) | | | – | |
Year ended September 30, 2008 | | | 19.20 | | | | 0.10 | | | | (4.85 | ) | | | (4.75 | ) | | | (0.02 | ) | | | (0.74 | ) |
| | | | | | | | | | | | | | | | | | | | | | | | | | | | | | | | | | |
| distributions | | | | | | | | | | | | Ratio of expenses
to average net assets | | | Ratio of net investment
income/(loss)
to average net assets | | | | |
Total
dividends
and
distributions | | | Net asset
value, end
of period | | | Total
return* | | | Net assets,
end of
period (in
thousands) | | | Before
expense
limitation/
and transfer
agent
earnings
credits | | | After
expense
limitation/
and transfer
agent
earnings
Credits(b) | | | Before
expense
limitation/
and transfer
agent
earnings
credits | | | After
expense
limitation/
and transfer
agent
earnings
credits | | | Portfolio
turnover
rate(a) | |
| | | | | | | | | | | | | | | | | | | | | | | | | | | | | | | | | | |
| | | | | | | | | | | | | | | | | | | | | | | | | | | | | | | | | | |
| $ | – | | | $ | 13.52 | | | | 24.15 | % | | $ | 6,004 | | | | 2.95 | % | | | 2.41 | % | | | (1.44 | )% | | | (0.90 | )% | | | 54.26 | % |
| | – | | | | 10.89 | | | | (3.54 | )% | | | 5,546 | | | | 3.14 | % | | | 2.70 | % | | | (1.38 | )% | | | (0.94 | )% | | | 67.28 | % |
| | (0.09 | ) | | | 11.29 | | | | 1.65 | % | | | 9,547 | | | | 3.60 | % | | | 3.19 | % | | | (1.14 | )% | | | (0.73 | )% | | | 136.50 | % |
| | (0.19 | ) | | | 11.19 | | | | (13.10 | )% | | | 15,093 | | | | 2.95 | % | | | 2.81 | % | | | 0.44 | % | | | 0.58 | % | | | 131.79 | % |
| | (0.74 | ) | | | 13.13 | | | | (26.09 | )% | | | 27,148 | | | | 2.31 | % | | | 2.31 | % | | | (0.01 | )% | | | (0.01 | )% | | | 174.59 | % |
| | | | | | | | | | | | | | | | | | | | | | | | | | | | | | | | | | |
| | – | | | | 14.56 | | | | 25.41 | % | | | 3,471 | | | | 2.18 | % | | | 1.35 | % | | | (0.70 | )% | | | 0.13 | % | | | 54.26 | % |
| | – | | | | 11.61 | | | | (2.44 | )% | | | 42 | | | | 7.76 | % | | | 1.65 | % | | | (5.96 | )% | | | 0.15 | % | | | 67.28 | % |
| | (0.22 | ) | | | 11.90 | | | | 2.63 | % | | | 132 | | | | 5.80 | % | | | 2.15 | % | | | (3.39 | )% | | | 0.25 | % | | | 136.50 | % |
| | (0.29 | ) | | | 11.80 | | | | (12.10 | )% | | | 128 | | | | 4.40 | % | | | 1.73 | % | | | (1.12 | )% | | | 1.55 | % | | | 131.79 | % |
| | (0.74 | ) | | | 13.81 | | | | (25.45 | )% | | | 540 | | | | 2.37 | % | | | 1.44 | % | | | 0.16 | % | | | 1.09 | % | | | 174.59 | % |
| | | | | | | | | | | | | | | | | | | | | | | | | | | | | | | | | | |
| | – | | | | 14.31 | | | | 25.09 | % | | | 15,687 | | | | 2.09 | % | | | 1.65 | % | | | (0.58 | )% | | | (0.14 | )% | | | 54.26 | % |
| | – | | | | 11.44 | | | | (2.80 | )% | | | 1,213 | | | | 3.23 | % | | | 1.91 | % | | | (1.46 | )% | | | (0.14 | )% | | | 67.28 | % |
| | (0.18 | ) | | | 11.77 | | | | 2.34 | % | | | 1,855 | | | | 3.65 | % | | | 2.45 | % | | | (1.21 | )% | | | (0.01 | )% | | | 136.50 | % |
| | (0.28 | ) | | | 11.67 | | | | (12.39 | )% | | | 2,390 | | | | 2.64 | % | | | 2.06 | % | | | 0.76 | % | | | 1.34 | % | | | 131.79 | % |
| | (0.76 | ) | | | 13.69 | | | | (25.61 | )% | | | 4,859 | | | | 1.72 | % | | | 1.72 | % | | | 0.63 | % | | | 0.63 | % | | | 174.59 | % |
FINANCIAL HIGHLIGHTS (CONTINUED)
| | | | | | | | | | | | | | | | | | | | | | | | |
| | | | | | Income(loss) from investment operations | | | Less dividends and | |
| | | Net asset
value,
beginning
of period | | | Net
investment
income/
(loss)(x) | | | Net realized
and unrealized
gains/(losses)
on investments | | | Total from
investment
operations | | | Dividends
from net
investment
income | | | Distributions
from net
realized
gains | |
ICON Risk-Managed Equity Fund | | | | | | | | | | | | | | | | | | | | | | | | |
Class C | | | | | | | | | | | | | | | | | | | | | | | | |
Year ended September 30, 2012 | | $ | 10.09 | | | $ | 0.02 | | | $ | 1.34 | | | $ | 1.36 | | | $ | (0.04 | ) | | $ | – | |
Year ended September 30, 2011 | | | 10.15 | | | | 0.01 | | | | (0.05 | ) | | | (0.04 | ) | | | (0.02 | ) | | | – | |
Year ended September 30, 2010 | | | 9.88 | | | | (0.02 | ) | | | 0.29 | | | | 0.27 | | | | – | | | | – | |
Year ended September 30, 2009 | | | 10.72 | | | | 0.05 | | | | (0.79 | ) | | | (0.74 | ) | | | (0.10 | ) | | | – | |
Year ended September 30, 2008 | | | 12.61 | | | | 0.01 | | | | (1.32 | ) | | | (1.31 | ) | | | (0.05 | ) | | | (0.53 | ) |
Class S** | | | | | | | | | | | | | | | | | | | | | | | | |
Year ended September 30, 2012 | | | 10.88 | | | | 0.15 | | | | 1.44 | | | | 1.59 | | | | (0.15 | ) | | | – | |
Year ended September 30, 2011 | | | 10.96 | | | | 0.12 | | | | (0.05 | ) | | | 0.07 | | | | (0.15 | ) | | | – | |
Year ended September 30, 2010 | | | 10.61 | | | | 0.08 | | | | 0.33 | | | | 0.41 | | | | (0.06 | ) | | | – | |
Year ended September 30, 2009 | | | 11.46 | | | | 0.22 | | | | (0.91 | ) | | | (0.69 | ) | | | (0.16 | ) | | | – | |
Year ended September 30, 2008 | | | 13.37 | | | | 0.15 | | | | (1.43 | ) | | | (1.28 | ) | | | (0.10 | ) | | | (0.53 | ) |
Class A*** | | | | | | | | | | | | | | | | | | | | | | | | |
Year ended September 30, 2012 | | | 10.66 | | | | 0.11 | | | | 1.41 | | | | 1.52 | | | | (0.12 | ) | | | – | |
Year ended September 30, 2011 | | | 10.72 | | | | 0.09 | | | | (0.05 | ) | | | 0.04 | | | | (0.10 | ) | | | – | |
Year ended September 30, 2010 | | | 10.39 | | | | 0.05 | | | | 0.33 | | | | 0.38 | | | | (0.05 | ) | | | – | |
Year ended September 30, 2009 | | | 11.25 | | | | 0.09 | | | | (0.80 | ) | | | (0.71 | ) | | | (0.15 | ) | | | – | |
Year ended September 30, 2008 | | | 13.15 | | | | 0.10 | | | | (1.38 | ) | | | (1.28 | ) | | | (0.09 | ) | | | (0.53 | ) |
| (x) | Calculated using the average shares method. | |
| * | The total return calculation is for the period indicated and excludes any sales charges. | |
| ** | Class S shares were formerly named Class Z shares prior to January 23, 2012. | |
| *** | Class I shares merged into Class A on January 23, 2012. The results of each class prior to the merger may have been different than what is presented. | |
| (a) | Portfolio turnover is calculated at the Fund level and is not annualized for periods less than a year. | |
| (b) | The Fund’s operating expenses, not including interest expense, are contractually limited to the amounts discussed in Note 3. The ratios in these financial highlights reflect the limitation, including the interest expense. | |
| (c) | The Fund’s operating expenses, not including dividends on short positions, are contractually limited to 2.30% for Class C, 1.25% for Class S and 1.55% for Class A. The ratios in these financial highlights reflect the limitation, including the dividends on short positions. | |
| (d) | The ratio of expenses to average net assets before expense limitation and transfer agent earnings credit including expenses that were paid on behalf of the Fund by a third party related to a tax matter were 2.54%, 11.38% and 5.60% for Class C, S and A, respectively. | |
The accompanying notes are an integral part of the financial statements.
| | | | | | | | | | | | | | | | | | | | | | | | | | | | | | | | | | |
| distributions | | | | | | | | | | | | Ratio of expenses
to average net assets | | | Ratio of net investment
income/(loss) to average
net assets | | | | |
Total
dividends
and
distributions | | | Net asset
value, end
of period | | | Total
return* | | | Net assets,
end of
period (in
thousands) | | | Before
expense
limitation/
and transfer
agent
earnings
credits | | | After
expense
limitation/
and transfer
agent
earnings
Credits(b) | | | Before
expense
limitation/
and transfer
agent
earnings
credits | | | After
expense
limitation/
and transfer
agent
earnings
credits | | | Portfolio
turnover
rate(a) | |
| | | | | | | | | | | | | | | | | | | | | | | | | | | | | | | | | | |
| | | | | | | | | | | | | | | | | | | | | | | | | | | | | | | | | | |
| $ | (0.04 | ) | | $ | 11.41 | | | | 13.47 | % | | $ | 2,243 | | | | 3.25 | % | | | 2.23 | % | | | (0.79 | )% | | | 0.23 | % | | | 71.06 | % |
| | (0.02 | ) | | | 10.09 | | | | (0.45 | )% | | | 2,099 | | | | 2.95 | % | | | 2.23 | % | | | (0.66 | )% | | | 0.06 | % | | | 67.61 | % |
| | – | | | | 10.15 | | | | 2.73 | % | | | 2,609 | | | | 3.36 | % | | | 2.30 | % | | | (1.27 | )% | | | (0.21 | )% | | | 114.34 | % |
| | (0.10 | ) | | | 9.88 | | | | (6.69 | )% | | | 3,199 | | | | 2.72 | % | | | 2.24 | % | | | 0.06 | % | | | 0.54 | % | | | 194.31 | % |
| | (0.58 | ) | | | 10.72 | | | | (10.85 | )% | | | 4,207 | | | | 2.52 | % | | | 2.21 | % | | | (0.24 | )% | | | 0.07 | % | | | 184.47 | % |
| | | | | | | | | | | | | | | | | | | | | | | | | | | | | | | | | | |
| | (0.15 | ) | | | 12.32 | | | | 14.65 | % | | | 6,692 | | | | 1.80 | % | | | 1.24 | % | | | 0.69 | % | | | 1.25 | % | | | 71.06 | % |
| | (0.15 | ) | | | 10.88 | | | | 0.51 | % | | | 60 | | | | 7.22 | % | | | 1.23 | % | | | (4.94 | )% | | | 1.05 | % | | | 67.61 | % |
| | (0.06 | ) | | | 10.96 | | | | 3.90 | % | | | 62 | | | | 10.41 | % | | | 1.31 | % | | | (8.34 | )% | | | 0.75 | % | | | 114.34 | % |
| | (0.16 | ) | | | 10.61 | | | | (5.79 | )% | | | 72 | | | | 3.55 | % | | | 1.24 | % | | | (0.10 | )% | | | 2.21 | % | | | 194.31 | % |
| | (0.63 | ) | | | 11.46 | | | | (9.99 | )% | | | 422 | | | | 4.39 | % | | | 1.21 | % | | | (1.98 | )% | | | 1.20 | % | | | 184.47 | % |
| | | | | | | | | | | | | | | | | | | | | | | | | | | | | | | | | | |
| | (0.12 | ) | | | 12.06 | | | | 14.28 | % | | | 4,045 | | | | 2.16 | % | | | 1.48 | % | | | 0.28 | % | | | 0.96 | % | | | 71.06 | % |
| | (0.10 | ) | | | 10.66 | | | | 0.32 | % | | | 1,982 | | | | 2.08 | % | | | 1.48 | % | | | 0.20 | % | | | 0.80 | % | | | 67.61 | % |
| | (0.05 | ) | | | 10.72 | | | | 3.69 | % | | | 4,020 | | | | 2.62 | % | | | 1.59 | % | | | (0.57 | )% | | | 0.46 | % | | | 114.34 | % |
| | (0.15 | ) | | | 10.39 | | | | (6.05 | )% | | | 1,501 | | | | 2.87 | % | | | 1.49 | % | | | (0.43 | )% | | | 0.95 | % | | | 194.31 | % |
| | (0.62 | ) | | | 11.25 | | | | (10.18 | )% | | | 863 | | | | 3.75 | % | | | 1.46 | % | | | (1.44 | )% | | | 0.85 | % | | | 184.47 | % |
NOTESTO FINANCIAL STATEMENTS
SEPTEMBER 30, 2012
1. Organization
The ICON Bond Fund (“Bond Fund”), ICON Equity Income Fund (“Equity Income Fund”), ICON Fund (“ICON Fund”)(formerly, ICON Core Equity Fund), ICON Long/Short Fund (“Long/Short Fund”) and ICON Risk-Managed Equity Fund (“Risk-Managed Equity Fund”) are series funds (individually a “Fund” and collectively, the “Funds”). The Funds are part of the ICON Funds (the “Trust”), a Massachusetts business trust registered under the Investment Company Act of 1940, as amended (the “1940 Act”) as an open-end investment management company. Each Fund has three classes of shares: Class C, Class S and Class A. Prior to January 23, 2012, each Fund had four share classes: Class I, Class C, Class Z and Class A. On January 23, 2012, Class I merged into Class A and Class Z was renamed Class S. All classes have equal rights as to earnings, assets and voting privileges except that each Class may bear different distribution fees, registration costs, legal costs, mailing and printing costs and shareholder servicing costs and each Class has exclusive voting rights with respect to its distribution plan. There are currently thirteen other active Funds within the Trust. Those Funds are covered by separate prospectuses and shareholder reports.
Each Fund is authorized to issue an unlimited number of no par shares. The investment objective of the Bond Fund is maximum total return. The investment objective of the Equity Income Fund is modest capital appreciation and income. The investment objective of the ICON Fund is long-term capital appreciation with a secondary objective of capital preservation. The investment objective of the Long/Short Fund is capital appreciation. The investment objective of the Risk-Managed Equity Fund is modest capital appreciation and to maximize realized gains.
The Funds may have elements of risk, including the risk of loss of principal. There is no assurance that the investment process will consistently lead to successful results. An investment concentrated in sectors and industries may involve greater risk and volatility than a more diversified investment. Investing in fixed income securities such as bonds involves interest rate risk. When interest rates rise, the value of fixed income securities generally decreases. Additionally, the Bond Fund may invest in medium-and lower-quality debt securities. High-yield bonds involve a greater risk of default and price volatility than U.S. government and other high-quality bonds. The Long/Short Fund engages in short selling; there are risks associated with selling short, including the risk that the Long/Short Fund may have to cover its short position at a higher price than the short sale, resulting in a loss. The
| | |
| 62 | | NOTESTO FINANCIAL STATEMENTS |
Long/Short Fund’s loss on a short sale is potentially unlimited as a loss occurs when the value of a security sold short increases. The Risk-Managed Equity Fund invests in call options; call options involve certain risks, such as limited gains and lack of liquidity of the underlying securities, and are not suitable for all investors. Investments in foreign securities and currency transactions may involve certain considerations and risks not typically associated with those of U.S. dollar-denominated transactions as a result of, among other factors, the possibility of lower government supervision and regulation of foreign securities markets and the possibility of political or economic instability. Financial statements of foreign companies are governed by different accounting, auditing, and financial standards than U.S. companies and may be less transparent and uniform than in the United States. Many corporate governance standards, which help ensure the integrity of public information in the United States, may not exist in some foreign countries. In general, there may be less governmental supervision of foreign stock exchanges and securities brokers and issuers. There are also risks associated with small- and mid-cap investing, including limited product lines, less liquidity and small market share.
The ICON Fund and ICON Long/Short Fund have significant weightings in the Consumer Discretionary sector which may cause each Fund’s performance to be susceptible to the economic, business and/or other developments that may affect that sector.
In the normal course of business, the Funds may enter into various agreements that provide for general indemnifications. Each Fund’s maximum exposure under these arrangements is unknown as any potential exposure involving future claims that may be made against each Fund is unknown. However, based on experience, the Funds expect the risk of loss to be minimal.
2. Significant Accounting Policies
The following is a summary of significant accounting policies consistently followed by the Funds in the preparation of their financial statements. The preparation of financial statements in conformity with accounting principles generally accepted in the United States of America requires management to make certain estimates and assumptions that affect the reported amounts of assets and liabilities, disclosure of contingent assets and liabilities at the date of the financial statements, and the reported amounts of income and expenses during the reporting period. Actual results may differ from these estimates.
| | | | |
| NOTESTO FINANCIAL STATEMENTS | | | 63 | |
NOTESTO FINANCIAL STATEMENTS (CONTINUED)
Investment Valuation
The Funds’ securities and other assets, excluding options on securities indexes, are valued as of the closing price at the close of regular trading on the New York Stock Exchange (the “NYSE”) (normally 4 p.m. Eastern Standard Time) each day the NYSE is open, except that securities traded primarily on the NASDAQ Stock Market (“NASDAQ”) are normally valued by the Funds at the NASDAQ Official Closing Price provided by NASDAQ each business day. Options on securities indexes are valued at the close of the Chicago Board Options Exchange (normally 4:15 p.m. Eastern Standard Time) on each day the New York Stock Exchange is open for trading.
The Funds use pricing services to obtain the market value of securities in their portfolios; if a pricing service is not able to provide a price, or the pricing service’s valuation quote is considered inaccurate or does not reflect the market value of the security, prices may be obtained through market quotations from independent broker/dealers. If market quotations from these sources are not readily available, the Funds’ securities or other assets are valued at fair value as determined in good faith by the Funds’ Board of Trustees (“Board”) or pursuant to procedures approved by the Board.
Lacking any sales that day, a security is valued at the current closing bid price (or yield equivalent thereof) or based on quotes obtained from dealers making a market for the security. Options are valued at their closing mid-price on the market with the most volume. Mid-price is the average of the closing bid and closing ask prices. Debt securities with a remaining maturity of greater than 60 days are valued in accordance with the evaluated bid price supplied by the pricing service. The evaluated bid price supplied by the pricing service is based upon a matrix valuation system which considers such factors as security prices, yields, maturities and ratings. Short-term debt securities with remaining maturities of 60 days or less are generally valued at amortized cost or original cost plus accrued interest, which approximates market value. Currency rates as of the close of the NYSE are used to convert foreign security values into U.S. dollars.
The Funds’ securities traded in countries outside of the Western Hemisphere are fair valued daily by utilizing the quotations of an independent pricing service, unless the Board determines that use of another valuation methodology is appropriate. The purposes of daily fair valuation are to avoid stale prices and to take into account, among other things, any significant events occurring after the close of foreign markets. The pricing service uses statistical analyses and quantitative models to adjust local market prices
| | |
| 64 | | NOTESTO FINANCIAL STATEMENTS |
using factors such as subsequent movements and changes in the prices of indexes, securities and exchange rates in other markets to determine fair value as of the time a Fund calculates its net asset value (“NAV”). The valuation assigned to fair-value securities for purposes of calculating a Fund’s NAV may differ from the security’s most recent closing market price and from the prices used by other mutual funds to calculate their NAVs.
Investments in other open-end investment companies are valued at net asset value.
Various inputs are used to determine the value of the Funds’ investments. These inputs are summarized in the three broad levels listed below:
Level 1 — quoted prices in active markets for identical securities.
Level 2 — significant observable inputs other than Level 1 quoted prices (including, but not limited to, quoted prices for similar securities, interest rates, prepayment speeds, and credit risk).
Level 3 — significant unobservable inputs.
Observable inputs are those based on market data obtained from sources independent of the Funds, and unobservable inputs reflect the Funds’ own assumptions based on the best information available. The input levels are not necessarily an indication of the risk or liquidity associated with investments at that level. For example, non-U.S. equity securities actively traded in foreign markets generally are reflected in Level 2 despite the availability of closing prices, because the Funds evaluate and determine whether those closing prices reflect fair value at the close of the NYSE or require adjustment, as described above. The following table summarizes the Funds’ investments, based on the inputs used to determine their values on September 30, 2012:
| | | | | | | | |
| | | Level 2 | | | Total | |
ICON Bond Fund* | | | | | | | | |
Assets | | | | | | | | |
Corporate Bonds | | $ | 68,221,742 | | | $ | 68,221,742 | |
U.S. Treasury Obligations | | | 14,908,124 | | | | 14,908,124 | |
Foreign Corporate Bonds | | | 3,127,486 | | | | 3,127,486 | |
Collateral for Securities on Loan | | | 5,182,350 | | | | 5,182,350 | |
Short-Term Investment | | | 6,815,975 | | | | 6,815,975 | |
| | | | | | | | |
Total | | $ | 98,255,677 | | | $ | 98,255,677 | |
| | | | | | | | |
| | | | |
| NOTESTO FINANCIAL STATEMENTS | | | 65 | |
NOTESTO FINANCIAL STATEMENTS (CONTINUED)
| | | | | | | | | | | | |
| | | Level 1 | | | Level 2 | | | Total | |
ICON Equity Income Fund* | | | | | | | | | | | | |
Assets | | | | | | | | | | | | |
Common Stocks | | $ | 21,389,121 | | | $ | - | | | $ | 21,389,121 | |
Preferred Stocks | | | 474,904 | | | | - | | | | 474,904 | |
Corporate Bonds | | | - | | | | 926,358 | | | | 926,358 | |
Call Options Purchased | | | 35,761 | | | | - | | | | 35,761 | |
Collateral for Securities on Loan | | | - | | | | 1,657,072 | | | | 1,657,072 | |
Short-Term Investment | | | - | | | | 121,480 | | | | 121,480 | |
| | | | | | | | | | | | |
Total | | $ | 21,899,786 | | | $ | 2,704,910 | | | $ | 24,604,696 | |
| | | | | | | | | | | | |
ICON Fund* | | | | | | | | | | | | |
Assets | | | | | | | | | | | | |
Common Stocks | | $ | 53,708,041 | | | $ | | | | $ | 53,708,041 | |
Collateral for Securities on Loan | | | - | | | | 1,490,742 | | | | 1,490,742 | |
| | | | | | | | | | | | |
Total | | $ | 53,708,041 | | | $ | 1,490,742 | | | $ | 55,198,783 | |
| | | | | | | | | | | | |
ICON Long/Short Fund* | | | | | | | | | | | | |
Assets | | | | | | | | | | | | |
Common Stocks | | $ | 24,822,815 | | | $ | - | | | $ | 24,822,815 | |
Collateral for Securities on Loan | | | - | | | | 568,361 | | | | 568,361 | |
Short-Term Investment | | | - | | | | 7,709,409 | | | | 7,709,409 | |
| | | | | | | | | | | | |
Total | | $ | 24,822,815 | | | $ | 8,277,770 | | | $ | 33,100,585 | |
| | | | | | | | | | | | |
Liabilities | | | | | | | | | | | | |
Securities Sold Short | | | | | | | | | | | | |
Common Stock | | $ | (294,285 | ) | | $ | - | | | $ | (294,285 | ) |
| | | | | | | | | | | | |
Total | | $ | (294,285 | ) | | $ | - | | | $ | (294,285 | ) |
| | | | | | | | | | | | |
ICON Risk-Managed Equity Fund* | | | | | | | | | | | | |
Assets | | | | | | | | | | | | |
Common Stocks | | $ | 13,787,364 | | | $ | - | | | $ | 13,787,364 | |
Put Options Purchased | | | 46,100 | | | | - | | | | 46,100 | |
Collateral for Securities on Loan | | | - | | | | 611,515 | | | | 611,515 | |
| | | | | | | | | | | | |
Total | | $ | 13,833,464 | | | $ | 611,515 | | | $ | 14,444,979 | |
| | | | | | | | | | | | |
Liabilities | | | | | | | | | | | | |
Written Call Options | | $ | (7,680 | ) | | $ | - | | | $ | (7,680 | ) |
| | | | | | | | | | | | |
Total | | $ | (7,680 | ) | | $ | - | | | $ | (7,680 | ) |
| | | | | | | | | | | | |
| * | Please refer to the Schedule of Investments and the Sector/Industry Classification and Credit Diversification tables for additional security details. |
There were no Level 3 securities held in any of the Funds at September 30, 2012.
| | |
| 66 | | NOTESTO FINANCIAL STATEMENTS |
For the year ended September 30, 2012, there was no transfer activity between Level 1 and Level 2. The end of period timing recognition is used for the transfers between levels of the Fund’s assets and liabilities.
Foreign Currency Translation
The accounting records of the Funds are maintained in U.S. dollars. Investment securities and other assets and liabilities denominated in a foreign currency are translated daily into U.S. dollars at the prevailing rates of exchange. Income and expenses are translated into U.S. dollars at the prevailing exchange rate on the respective dates of the transactions. Purchases and sales of securities are translated into U.S. dollars at the contractual currency exchange rates established at the time of each trade.
The Funds do not isolate that portion of the results of operations resulting from changes in foreign exchange rates on investments from the fluctuations arising from changes in market prices of securities held. Net unrealized appreciation or depreciation on investments and foreign currency translations arise from changes in the value of assets and liabilities, resulting from changes in the exchange rates and changes in market prices of securities held.
Options Transactions
The Funds’ use of derivatives for the year ended September 30, 2012 was limited to purchased and written options.
The Risk-Managed Equity Fund’s primary investment strategy involves the use of options. Each of the other Funds may also purchase and/or write (sell) call and put options on any security in which it may invest. The Funds utilize options to hedge against changes in market conditions or to provide market exposure while trying to reduce transaction costs.
Option contracts involve market risk and liquidity risk and can be highly volatile. Should prices of securities or securities indexes move in an unexpected manner, the Funds may not achieve the desired benefits and may realize losses and thus be in a worse position than if such strategies had not been utilized.
When a Fund writes a put or call option, an amount equal to the premium received is included on the Statement of Assets and Liabilities as a liability. The amount of the liability is subsequently marked-to-market to reflect the current market value of the option. If an option expires on its stipulated
| | | | |
| NOTESTO FINANCIAL STATEMENTS | | | 67 | |
NOTESTO FINANCIAL STATEMENTS (CONTINUED)
expiration date or if the Fund enters into a closing purchase transaction, a gain or loss is realized. If a written call option on an individual security is exercised, a gain or loss is realized for the sale of the underlying security, and the proceeds from the sale are increased by the premium originally received. If a written call option on a securities index is exercised, a gain or loss is realized as determined by the premium originally received, the exercise price and the market value of the index. If a written put option on an individual security is exercised, the cost of the security acquired is decreased by the premium originally received. As a writer of an option, a Fund bears the market risk of an unfavorable change in the price of the individual security or securities index underlying the written option. Additionally, written call options may involve the risk of limited gains.
Each Fund may also purchase put and call options. When a Fund purchases a put or call option, an amount equal to the premium paid is included on the Fund’s Statement of Assets and Liabilities as an investment, and is subsequently marked-to-market to reflect the current market value of the option. If an option expires on the stipulated expiration date or if the Fund enters into a closing sale transaction, a gain or loss is realized. If the Fund exercises a call option on an individual security, the cost of the security acquired is increased by the premium paid for the call. If the Fund exercises a put option on an individual security, a gain or loss is realized from the sale of the underlying security, and the proceeds from such a sale are decreased by the premium originally paid. If the Fund exercises a put or a call option on a security index, a gain or loss is realized as determined by the premium originally paid, the exercise price and the market value of the index. Written and purchased options are non-income producing securities.
As of September 30, 2012, the Equity Income Fund engaged in purchased call option transactions and the Risk-Managed Equity Fund engaged in written call and purchased put options transactions. All open option contracts are included on each Fund’s Schedule of Investments.
The Risk-Managed Equity Fund’s written options are collateralized by cash and/or securities held in a segregated account at the Fund’s custodian. The securities pledged as collateral are included on the Schedule of Investments. Such collateral is restricted from the Fund’s use. The cash collateral held for the prime broker and/or borrowings from the prime broker are included on the Statement of Assets and Liabilities.
| | |
| 68 | | NOTESTO FINANCIAL STATEMENTS |
The number of options contracts written and the premiums received by the Risk-Managed Equity Fund during the year ended September 30, 2012, were as follows:
| | | | | | |
| | | Risk-Managed Equity
Fund | |
| | | Number of
Contracts | | Premiums
Received | |
Options outstanding, beginning of period | | 75 | | $ | 250,738 | |
Options written during period | | 1,165 | | | 2,435,235 | |
Options closed during period | | (1,232) | | | (2,672,167 | ) |
| | | | | | |
Options outstanding, end of period | | 8 | | $ | 13,806 | |
| | | | | | |
The following is a summary of how these derivatives are treated in the financial statements and their impact on the Funds:
Fair Values of Derivative Instruments as of September 30, 2012
| | | | | | | | | | | | |
| | | Asset Derivatives | | | Liability Derivatives | |
Derivatives not accounted for
as hedging instruments | | Statement of
Assets and
Liabilities
Location | | Fair
Value | | | Statement of
Assets and
Liabilities
Location | | Fair
Value | |
Purchased option contracts | | | | | | | | | | | | |
Equity risk | | | | | | | | | | | | |
ICON Equity Income Fund | | Investments, | | $ | 35,761 | | | Investments, | | $ | - | |
ICON Risk-Managed Equity Fund | | at value | | | 46,100 | | | at value | | | - | |
Written option contracts | | | | | | | | | | | | |
Equity risk | | | | | | | | | | | | |
ICON Risk-Managed Equity Fund | | Options written, at value | | $ | - | | | Options written, at value | | $ | 7,680 | |
Amount of Realized Gain or (Loss) on Derivatives Recognized in Operations
| | | | | | |
Derivatives not accounted for as hedging instruments | | Location of Gain/(Loss) on
Derivatives
Recognized in Operations | | Amount | |
Purchased option contracts | | | | | | |
Equity risk | | | | | | |
ICON Equity Income Fund | | Net realized gain/(loss) from | | $ | 43,371 | |
ICON Risk-Managed Equity Fund | | Investment transactions | | | (1,361,656 | ) |
Written option contracts | | | | | | |
Equity risk | | | | | | |
ICON Risk-Managed Equity Fund | | Net realized gain/(loss) from written option transactions | | $ | (791,477 | ) |
| | | | |
| NOTESTO FINANCIAL STATEMENTS | | | 69 | |
NOTESTO FINANCIAL STATEMENTS (CONTINUED)
Change in Unrealized Appreciation/(Depreciation) on Derivatives Recognized in Operations
| | | | | | |
Derivatives not accounted for as hedging instruments | | Location of Gain/(Loss) on
Derivatives
Recognized in Operations | | Amount | |
Purchased option contracts | | | | | | |
Equity risk | | | | | | |
ICON Equity Income Fund | | Change in unrealized net | | $ | 142,411 | |
ICON Risk-Managed Equity Fund | | appreciation/(depreciation) on investments | | | (29,144 | ) |
Written option contracts | | | | | | |
Equity risk | | | | | | |
ICON Risk-Managed Equity Fund | | Change in unrealized net appreciation/(depreciation) on written options | | $ | 57,862 | |
For the year ended September 30, 2012, the Fund’s quarterly holdings of options contracts were as follows:
| | | | | | | | | | | | |
| | | ICON Equity
Income Fund | | | ICON Risk-
Managed
Equity Fund | | | ICON Risk-
Managed
Equity Fund | |
| Quarter Ended | | Number of Purchased Options
Contracts Outstanding | | | Number of
Written Options
Contracts
Outstanding | |
December 31, 2011 | | | 1,446 | | | | 75 | | | | 105 | |
March 31, 2012 | | | 611 | | | | 100 | | | | 80 | |
June 30, 2012 | | | 1,180 | | | | 30 | | | | 40 | |
September 30, 2012 | | | 311 | | | | 20 | | | | 8 | |
The Funds value derivatives at fair value, as described above, and recognize changes in fair value currently in the results of operations. Accordingly, the Funds do not follow hedge accounting, even for derivatives employed as economic hedges.
Short Sales
The Long/Short Fund may engage in short sales (selling securities it does not own) as part of its normal investment activities. The Long/Short Fund enters into short positions in equity securities identified as being overvalued in management’s opinion.
Short sales involve market risk. If a security sold short increases in price, the Long/Short Fund may have to cover its short position at a higher price than
| | |
| 70 | | NOTESTO FINANCIAL STATEMENTS |
the short sale price, resulting in a loss. These short sales are collateralized by cash and/or securities held with the Fund’s prime broker and in a segregated account at the Fund’s custodian. The collateral required is determined daily by reference to the market value of the short positions. Such collateral for the Fund is restricted from use. The cash collateral that is restricted from use is included on the Statement of Assets and Liabilities as “Deposits for short sales.” The securities pledged as collateral that are restricted from use are included on the Schedule of Investments. Dividends paid on short sales are treated as an expense on the Statement of Operations. Liabilities for securities sold short are closed out by purchasing the applicable securities for delivery to the Fund’s prime broker. As of September 30, 2012, the Long/Short Fund engaged in short selling. The short positions are included in the Schedule of Securities Sold Short on the Schedule of Investments.
Securities Lending
Under procedures adopted by the Board, the Funds may lend securities to non-affiliated qualified parties. The Funds seek to earn additional income through securities lending. There is the risk of delay in recovering a loaned security. The Funds do not have the right to vote on securities while they are on loan; however, the Funds may attempt to call back the loan and vote the proxy.
All loans will be continuously secured by collateral which consists of cash. The cash collateral is invested in the State Street Navigator Prime Portfolio and is disclosed on the Schedule of Investments. The lending fees received and the Funds’ portion of the interest income earned on cash collateral are included on the Statement of Operations, if applicable.
As of September 30, 2012, the following Funds had securities with the following values on loan:
| | | | | | | | |
| Fund | | Value of
Loaned Securities | | | Value of
Collateral | |
ICON Bond Fund | | $ | 4,980,518 | | | $ | 5,182,350 | |
ICON Equity Income Fund | | | 1,616,680 | | | | 1,657,072 | |
ICON Fund | | | 1,477,286 | | | | 1,490,742 | |
ICON Long/Short Fund | | | 560,675 | | | | 568,361 | |
ICON Risk-Managed Equity Fund | | | 592,313 | | | | 611,515 | |
| | | | |
| NOTESTO FINANCIAL STATEMENTS | | | 71 | |
NOTESTO FINANCIAL STATEMENTS (CONTINUED)
The value of the collateral above could include collateral held for securities that were sold on or before September 30, 2012. It may also include collateral received from the pre-funding of loans.
Income Taxes
The Funds intend to qualify as regulated investment companies under Subchapter M of the Internal Revenue Code and, accordingly, the Funds will generally not be subject to federal and state income taxes or federal excise taxes to the extent that they intend to make sufficient distributions of net investment income and net realized capital gains.
Dividends paid by the Funds from net investment income and distributions of net realized short-term gains are, for federal income tax purposes, taxable as ordinary income to shareholders.
Dividends and distributions to shareholders are recorded by the Funds on the ex-dividend/distribution date. The Bond Fund distributes net investment income, if any, to shareholders monthly. The Equity Income Fund and the Risk-Managed Equity Fund intend to distribute net investment income, if any, to shareholders quarterly. The other Funds distribute income, if any, annually. The Funds distribute net realized capital gains, if any, to shareholders at least annually, if not offset by capital loss carryforwards. The Funds may utilize equalization accounting for tax purposes and designate earnings and profits, including net realized gains distributed to shareholders on redemption of shares, as part of the dividends paid deduction for income tax purposes. Income distributions and capital gain distributions are determined in accordance with income tax regulations, which may differ from accounting principles generally accepted in the United States of America.
Management has analyzed the Funds’ tax positions taken on federal income tax returns for all open tax periods and has concluded that no provision for federal income tax is required in the Funds’ financial statements.
The Funds file U.S. tax returns. While the statute of limitations remains open to examine the Funds’ U.S. tax returns filed for the past four years, no examinations are in progress or anticipated at this time. The Funds are not aware of any tax positions for which it is reasonably possible that the total amounts of unrecognized tax benefits will significantly change in the next twelve months.
| | |
| 72 | | NOTESTO FINANCIAL STATEMENTS |
Investment Income
Dividend income is recorded on the ex-dividend date. Non-cash dividends included in dividend income, if any, are recorded at the fair value of the securities received. Interest income is accrued as earned. Certain dividends from foreign securities are recorded as soon as the Funds are informed of the dividend if such information is obtained subsequent to the ex-dividend date. Discounts and premiums on securities purchased are amortized over the life of the respective securities.
Investment Transactions
Security transactions are accounted for no later than one business day after the trade date. However, for financial reporting purposes, security transactions are accounted for on the trade date. Gains and losses on securities sold are determined on the basis of identified cost.
Allocation of Expenses
Each class of a Fund’s shares bears expenses incurred specifically on its behalf and, in addition, each class bears a portion of general expenses, based upon relative net assets of each class. Expenses which cannot be directly attributed to a specific Fund in the Trust are apportioned between all Funds in the Trust based upon relative net assets. In calculating the net asset value per share of each class, investment income, realized and unrealized gains and losses and expenses other than class-specific expenses are allocated daily to each class of shares based upon the proportion of net assets.
Below are the class level expenses that are included on the Statement of Operations:
| | | | | | | | | | | | |
| Fund | | Legal
Expense | | | Printing
and Postage
Expense | | | Transfer
Agent
Expense | |
ICON Bond Fund | | | | | | | | | | | | |
Class I* | | $ | 5,364 | | | $ | 6,229 | | | $ | 22,511 | |
Class C | | | 412 | | | | 1,106 | | | | 9,761 | |
Class S** | | | 3,560 | | | | 6,807 | | | | 39,814 | |
Class A | | | 1,028 | | | | 2,560 | | | | 20,346 | |
ICON Equity Income Fund | | | | | | | | | | | | |
Class I* | | | 1,612 | | | | 4,231 | | | | 11,285 | |
Class C | | | 560 | | | | 1,372 | | | | 9,869 | |
Class S** | | | 883 | | | | 7,069 | | | | 14,881 | |
Class A | | | 925 | | | | 3,505 | | | | 16,491 | |
| | | | |
| NOTESTO FINANCIAL STATEMENTS | | | 73 | |
NOTESTO FINANCIAL STATEMENTS (CONTINUED)
| | | | | | | | | | | | |
| Fund | | Legal
Expense | | | Printing
and Postage
Expense | | | Transfer
Agent
Expense | |
ICON Fund | | | | | | | | | | | | |
Class I* | | $ | 2,846 | | | $ | 7,915 | | | $ | 13,931 | |
Class C | | | 2,146 | | | | 7,214 | | | | 48,124 | |
Class S** | | | 1,683 | | | | 2,972 | | | | 26,641 | |
Class A | | | 963 | | | | (162 | ) | | | 24,317 | |
ICON Long/Short Fund | | | | | | | | | | | | |
Class I* | | | 483 | | | | 2,135 | | | | 5,154 | |
Class C | | | 968 | | | | 2,553 | | | | 16,156 | |
Class S** | | | 273 | | | | 2,151 | | | | 6,985 | |
Class A | | | 897 | | | | 3,410 | | | | 12,680 | |
ICON Risk-Managed Equity Fund | | | | | | | | | | | | |
Class I* | | | 912 | | | | 3,556 | | | | 7,909 | |
Class C | | | 353 | | | | 1,137 | | | | 6,705 | |
Class S** | | | 847 | | | | 6,660 | | | | 13,886 | |
Class A | | | 742 | | | | 2,741 | | | | 13,852 | |
| * | Class I shares merged into Class A shares on January 23, 2012. The information presented is that before the merger. |
| ** | Class Z shares were formerly named Class S shares prior to January 23, 2012. |
3. Fees and Other Transactions with Affiliates
Investment Advisory Fees
ICON Advisers, Inc. (“ICON Advisers”) serves as investment adviser to the Funds and is responsible for managing the Funds’ portfolios of securities. ICON Advisers receives a monthly management fee that is computed daily at an annual rate of 0.60% of average daily net assets of the Bond Fund, 0.75% of average daily net assets of the Equity Income Fund, ICON Fund and Risk-Managed Equity Fund, and 0.85% of average daily net assets of the Long/Short Fund.
ICON Advisers has contractually agreed to limit the Funds’ expenses (exclusive of brokerage, interest, taxes, dividends on short sales and
| | |
| 74 | | NOTESTO FINANCIAL STATEMENTS |
extraordinary expenses) to the extent necessary to ensure that the Funds’ expenses do not exceed the following amounts:
| | | | | | | | | | | | |
| Fund | | Class A | | | Class C | | | Class S | |
ICON Bond Fund | | | 1.00% | | | | 1.60% | | | | 0.75% | |
ICON Equity Income Fund | | | 1.45% | | | | 2.20% | | | | 1.20% | |
ICON Fund | | | 1.50% | | | | 2.25% | | | | 1.25% | |
ICON Long/Short Fund | | | 1.55% | | | | 2.30% | | | | 1.25% | |
ICON Risk-Managed Equity Fund | | | 1.45% | | | | 2.20% | | | | 1.20% | |
Effective January 23, 2012, expense limitations of 1.50%, 2.25% and 1.25% were implemented for Class A, Class C and Class S, respectively, of the ICON Fund.
The Funds’ expense limitations, excluding the Bond Fund Class A, and all classes of the ICON Fund will continue in effect until at least January 31, 2021. Limitations for the Bond Fund Class A, and all classes of the ICON Fund will continue in effect until at least January 31, 2013. To the extent ICON Advisers reimburses or absorbs fees and expenses, it may seek payment of such amounts for up to three years after the expenses were reimbursed or absorbed. A Fund will make no such payment, however, if the total Fund operating expenses exceed the expense limits in effect at the time the expenses were reimbursed or at the time these payments are proposed.
As of September 30, 2012 the following amounts were still available for recoupment by ICON Advisers based upon their potential expiration dates:
| | | | | | | | | | | | |
| Fund | | 2013 | | | 2014 | | | 2015 | |
ICON Bond Fund | | $ | 45,987 | | | $ | 26,738 | | | $ | 132,550 | |
ICON Equity Income Fund | | | 30,881 | | | | 17,561 | | | | 58,289 | |
ICON Fund | | | - | | | | - | | | | 12,506 | |
ICON Long/Short Fund | | | 56,787 | | | | 37,402 | | | | 70,576 | |
ICON Risk-Managed Equity Fund | | | 35,577 | | | | 22,218 | | | | 81,240 | |
Accounting, Custody and Transfer Agent Fees
State Street Bank and Trust Company (“State Street”) serves as the fund accounting agent for the Funds. For its services, the Trust pays State Street a fee that is calculated daily and paid monthly at an annual rate based on the aggregate average daily net assets of the Trust.
State Street is the custodian of the Trust’s investments. For its services, the Trust pays State Street asset-based fees that vary according to the number of positions and transactions, plus out-of-pocket expenses.
| | | | |
| NOTESTO FINANCIAL STATEMENTS | | | 75 | |
NOTESTO FINANCIAL STATEMENTS (CONTINUED)
Boston Financial Data Services, Inc. (“BFDS”) is the Trust’s transfer agent. For these services, the Trust pays a per account fee, plus certain other transaction cusip charges and out-of-pocket expenses. BFDS may pay each Fund transfer agent earnings credits. Transfer agent earnings credits are credits received for interest which results from overnight balances used by BFDS for clearing shareholder transactions.
Administrative Services
The Trust has entered into an administrative services agreement with ICON Advisers pursuant to which ICON Advisers oversees the administration of the Trust’s business and affairs. This agreement provides for an annual fee of 0.05% on the Trusts’ first $1.5 billion of average daily net assets, 0.045% on the next $1.5 billion of average daily net assets, 0.040% on the next $2 billion of average daily net assets and 0.030% on average daily net assets over $5 billion. For the year ended September 30, 2012, each Fund’s payment for administrative services to ICON Advisers is included on the Statement of Operations. The administrative services agreement provides that ICON Advisers will not be liable for any error of judgment, mistake of law, or any loss suffered by the Trust in connection with matters to which the administrative services agreement relates, except for a loss resulting from willful misfeasance, bad faith or negligence by ICON Advisers in the performance of its duties.
ICON Advisers has a sub-administration agreement with State Street to which State Street assists ICON Advisers with the administration and business affairs of the Trust. For its services, ICON Advisers pays State Street a fee that is calculated daily and paid monthly at an annual rate based on the aggregate average daily net assets of the Trust.
Distribution Fees
The Funds have adopted a Distribution Plan pursuant to Rule 12b-1 under the 1940 Act (“12b-1 Plan”) under which the Funds are authorized to compensate the Funds’ distributor, ICON Distributors, Inc. (“IDI”) (an affiliate of the adviser) for the sale and distribution of shares and for other shareholder services. Under the 12b-1 Plan, Bond Fund Class C shareholders pay an annual distribution and service fee of 0.85% of average daily net assets and Class A shareholders pay an annual distribution and service fee of 0.25% of average daily net assets. The shareholders of the other Funds pay an annual distribution and service fee of 1.00% of average daily net assets
| | |
| 76 | | NOTESTO FINANCIAL STATEMENTS |
for Class C shares and an annual distribution and service fee of 0.25% of average daily net assets for Class A shares. Prior to Class I shares merging into Class A shares on January 23, 2012, Class I shareholders paid an annual distribution and service fee of 0.25% of average daily net assets for Class I shares. The total amount paid under the 12b-1 plans by the Funds is shown on the Statement of Operations.
Other Related Parties
Certain Officers and Directors of ICON Advisers are also Officers and Trustees of the Funds; however, such Officers and Trustees (with the exception of the Chief Compliance Officer, “CCO”) receive no compensation from the Funds. The CCO’s salary is paid 86% by the Trust and 14% by ICON Advisers. For the year ended September 30, 2012, the total related amounts paid by the Funds under this arrangement are included in Other Expenses on the Statement of Operations.
4. Borrowings
The Trust has entered into Lines of Credit agreements/arrangements to provide temporary funding for redemption requests. The maximum borrowing is limited to $150 million. Interest on domestic borrowings is charged at the higher of the Federal Funds Rate effective on that day and the Overnight LIBOR Rate effective on that day plus 1.25%. The Funds may have borrowings with the prime broker as a result of brokerage requirements. Interest on domestic borrowing with the prime broker is charged at the Fed Funds rate plus 0.50%. The average interest rate charged for ICON Bond Fund, ICON Equity Income Fund and ICON Fund for the year ended September 30, 2012 was 1.40%. The average interest rate charged for ICON Long/Short Fund for the year ended September 30, 2012 was 1.96%. The average interest rate charged for ICON Risk-Managed Equity Fund for the year ended September 30, 2012 was 2.01%.
| | | | |
| Fund | | Average Borrowing
(10/1/11-9/30/12) | |
ICON Bond Fund | | $ | 28,227 | |
ICON Equity Income Fund | | | 150,204 | |
ICON Fund* | | | 520,450 | |
ICON Long/Short Fund* | | | 83,677 | |
ICON Risk-Managed Equity Fund* | | | 751,197 | |
| * | Fund had outstanding borrowings under these agreements/arrangements as of September 30, 2012. |
| | | | |
| NOTESTO FINANCIAL STATEMENTS | | | 77 | |
NOTESTO FINANCIAL STATEMENTS (CONTINUED)
5. Purchases and Sales of Investment Securities
For the year ended September 30, 2012, the aggregate cost of purchases and proceeds from sales of investment securities (excluding securities sold short, short-term securities and written options contracts) was as follows:
| | | | | | | | | | | | | | | | |
Fund | | Purchases of
Securities | | | Proceeds
from Sales of
Securities | | | Purchases of
Long Term U.S.
Government
Obligations | | | Proceeds
from Sales of
Long-Term U.S.
Government
Obligations | |
ICON Bond Fund | | $ | 32,621,759 | | | $ | 49,482,871 | | | $ | 14,972,881 | | | $ | 5,961,016 | |
ICON Equity Income Fund | | | 35,369,681 | | | | 50,414,264 | | | | - | | | | - | |
ICON Fund | | | 15,517,577 | | | | 45,001,359 | | | | - | | | | - | |
ICON Long/Short Fund | | | 16,379,700 | | | | 8,698,175 | | | | - | | | | - | |
ICON Risk-Managed Equity Fund | | | 12,727,296 | | | | 23,636,414 | | | | - | | | | - | |
6. Federal Income Tax
Income and capital gain distributions are determined in accordance with income tax regulations that may differ from accounting principles that are generally accepted in the United States of America. These differences are due to differing treatments for items such as net short-term gains, deferrals of wash sale losses, foreign currency transactions, net investment losses, and capital loss carryforwards.
For the year ended September 30, 2012 the following Funds had capital loss carryforwards:
| | | | | | | | |
| Fund | | Amounts | | | Expires | |
ICON Equity Income Fund | | $ | 8,322,631 | | | | 2017 | |
| | | 19,089,764 | | | | 2018 | |
ICON Fund | | | 20,854,391 | | | | 2017 | |
| | | 19,833,424 | | | | 2018 | |
ICON Long/Short Fund | | | 43,183,048 | | | | 2017 | |
| | | 19,325,857 | | | | 2018 | |
ICON Risk-Managed Equity Fund | | | 5,302,678 | | | | 2017 | |
| | | 14,212,596 | | | | 2018 | |
| | |
| 78 | | NOTESTO FINANCIAL STATEMENTS |
Future capital loss carryforward utilization in any given year may be limited if there are substantial shareholder redemptions or contributions. During the year ended September 30, 2012 the Funds utilized capital loss carryforwards:
| | | | |
| Fund | | Amount | |
ICON Equity Income Fund | | $ | 1,094,148 | |
ICON Fund | | | 2,860,733 | |
ICON Long/Short Fund | | | 123,132 | |
ICON Risk-Managed Equity Fund | | | 693,086 | |
The Regulated Investment Company Modernization Act of 2010 (the “Act”) was signed into law on December 22, 2010. The Act makes changes to a number of tax rules impacting the Funds. Under the Act, future capital losses generated by a fund may be carried over indefinitely, but these losses must be used prior to the utilization of any pre-enactment capital losses. Since pre-enactment capital losses may only be carried forward for eight years, there may be a greater likelihood that all or a portion of each fund’s pre-enactment capital losses will expire unused.
The tax characteristics of distributions paid to shareholders during the fiscal year ended September 30, 2012, were as follows:
| | | | | | | | | | | | |
| | | Distributions Paid from | | | Total Distributions
Paid | |
| Fund | | Ordinary
Income | | | Net Long-
Term Gains | | |
ICON Bond Fund | | $ | 3,733,785 | | | $ | 1,945,591 | | | $ | 5,679,376 | |
ICON Equity Income Fund | | | 1,263,680 | | | | - | | | | 1,263,680 | |
ICON Fund | | | 161,444 | | | | - | | | | 161,444 | |
ICON Long/Short Fund | | | - | | | | - | | | | - | |
ICON Risk-Managed Equity Fund | | | 160,368 | | | | - | | | | 160,368 | |
The tax characteristics of distributions paid to shareholders during the fiscal year ended September 30, 2011, were as follows:
| | | | | | | | | | | | |
| | | Distributions Paid from | | | Total Distributions
Paid | |
| Fund | | Ordinary
Income | | | Net Long-
Term Gains | | |
ICON Bond Fund | | $ | 7,853,451 | | | $ | 1,064,414 | | | $ | 8,917,865 | |
ICON Equity Income Fund | | | 1,710,940 | | | | - | | | | 1,710,940 | |
ICON Fund | | | 168,477 | | | | - | | | | 168,477 | |
ICON Long/Short Fund | | | - | | | | - | | | | - | |
ICON Risk-Managed Equity Fund | | | 203,631 | | | | - | | | | 203,631 | |
| | | | |
| NOTESTO FINANCIAL STATEMENTS | | | 79 | |
NOTESTO FINANCIAL STATEMENTS (CONTINUED)
As of September 30, 2012, the components of accumulated earnings/(deficit) on a tax basis were as follows:
| | | | | | | | | | | | | | | | | | | | | | | | |
| Fund | | Undistributed
Ordinary
Income | | | Undistributed
Net Long-
Term-Gains | | | Late Year
Loss
Deferral** | | | Capital Loss
Carryover | | | Unrealized
Appreciation/
(Depreciation)* | | | Total
Accumulated
Earnings/
(Deficit) | |
ICON Bond Fund | | $ | - | | | $ | 1,960,539 | | | $ | - | | | $ | - | | | $ | 5,186,369 | | | $ | 7,146,908 | |
ICON Equity Income Fund | | | - | | | | - | | | | (391,187 | ) | | | (27,412,395 | ) | | | 1,818,946 | | | | (25,984,636 | ) |
ICON Fund | | | 169,811 | | | | - | | | | (298,788 | ) | | | (40,687,815 | ) | | | 13,497,602 | | | | (27,319,190 | ) |
ICON Long/Short Fund | | | - | | | | - | | | | (404,239 | ) | | | (62,508,905 | ) | | | 3,271,025 | | | | (59,642,119 | ) |
ICON Risk-Managed Equity Fund | | | 2,787 | | | | - | | | | (158,200 | ) | | | (19,515,274 | ) | | | 2,609,845 | | | | (17,060,842 | ) |
| * | Differences between the book-basis and tax-basis unrealized appreciation/(depreciation) are attributable primarily to tax deferral of losses on wash sales. |
| ** | The Funds have elected to defer certain qualified late-year losses in accordance with federal income tax rules. These losses are treated as having arisen on the first day of the following fiscal year. |
As of September 30, 2012, cost on investments for federal income tax purposes and the amount of net unrealized appreciation/(depreciation) were as follows:
| | | | | | | | | | | | | | | | |
| Fund | | Cost | | | Unrealized
Appreciation | | | Unrealized
(Depreciation) | | | Net
Appreciation/
(Depreciation) | |
ICON Bond Fund | | $ | 93,069,308 | | | $ | 5,373,415 | | | $ | (187,046 | ) | | $ | 5,186,369 | |
ICON Equity Income Fund | | | 22,785,715 | | | | 2,097,242 | | | | (278,261 | ) | | | 1,818,981 | |
ICON Fund | | | 41,701,181 | | | | 15,304,927 | | | | (1,807,325 | ) | | | 13,497,602 | �� |
ICON Long/Short Fund | | | 29,701,304 | | | | 3,966,204 | | | | (566,923 | ) | | | 3,399,281 | |
ICON Risk-Managed Equity Fund | | | 11,827,304 | | | | 2,690,348 | | | | (72,673 | ) | | | 2,617,675 | |
7. Subsequent Events
Management has evaluated the possibility of subsequent events and determined that there are no material events that would require disclosure in the Funds’ financial statements.
| | |
| 80 | | NOTESTO FINANCIAL STATEMENTS |
REPORTOF INDEPENDENT REGISTERED PUBLIC
ACCOUNTING FIRM
To the Board of Trustees and Shareholders of the ICON Funds:
In our opinion, the accompanying statements of assets and liabilities, including the schedules of investments, and the related statements of operations and of changes in net assets and the financial highlights present fairly, in all material respects, the financial position of ICON Bond Fund, ICON Fund (formerly the ICON Core Equity Fund), ICON Risk-Managed Equity Fund, ICON Equity Income Fund, and ICON Long/Short Fund (five of the portfolios constituting ICON Funds, hereafter referred to as the “Funds”) at September 30, 2012, the results of each of their operations for the year then ended, the changes in each of their net assets for each of the two years in the period then ended and the financial highlights for each of the periods presented, in conformity with accounting principles generally accepted in the United States of America. These financial statements and financial highlights (hereafter referred to as “financial statements”) are the responsibility of the Funds’ management; our responsibility is to express an opinion on these financial statements based on our audits. We conducted our audits of these financial statements in accordance with the standards of the Public Company Accounting Oversight Board (United States). Those standards require that we plan and perform the audit to obtain reasonable assurance about whether the financial statements are free of material misstatement. An audit includes examining, on a test basis, evidence supporting the amounts and disclosures in the financial statements, assessing the accounting principles used and significant estimates made by management, and evaluating the overall financial statement presentation. We believe that our audits, which included confirmation of securities at September 30, 2012 by correspondence with the custodian and brokers, provide a reasonable basis for our opinion.

Denver, Colorado
November 19, 2012
| | | | |
| REPORTOF ACCOUNTING FIRM | | | 81 | |
SIX MONTH HYPOTHETICAL EXPENSE EXAMPLE
SEPTEMBER 30, 2012 (UNAUDITED)
Example
As a shareholder of a Fund you may pay two types of fees: transaction fees and fund-related fees. Certain funds charge transaction fees, including sales charges (loads) on purchase payments, reinvested dividends, or other distributions; redemption fees; and exchange fees. Funds also incur various ongoing expenses, including management fees, distribution and/or service fees, and other fund expenses, which are indirectly paid by shareholders.
This Example is intended to help you understand your ongoing costs (in dollars) of investing in the various ICON Funds and to compare these costs with the ongoing costs of investing in other mutual funds. This Example is based on an investment of $1,000 invested at the beginning of the six-month period and held for the six-month period (4/1/12 – 9/30/12).
Actual Expenses
The first line in the table for each Fund provides information about actual account values and actual expenses. The Example includes, but is not limited to, management fees, 12b-1 fees, fund accounting, custody and transfer agent fees. However, the Example does not include client specific fees, such as the $15 fee charged to IRA accounts, or the $15 fee charged for wire redemptions. You may use this information, together with the amount you invested, to estimate the expenses that you paid over the period. Simply divide your account value by $1,000 (for example, an $8,600 account value divided by $1,000 = 8.6), then multiply the result by the number in the first line for each Fund under the heading entitled “Expenses Paid During Period” to estimate the expenses you paid on your account during this period.
Hypothetical Example for Comparison Purposes
The second line in the table for each Fund provides information about hypothetical account values and hypothetical expenses based on the Fund’s actual expense ratio and an assumed rate of return of 5% per year before expenses, which is not the Fund’s actual return. The hypothetical account values and expenses may not be used to estimate the actual ending account balance or expenses you paid for the period. You may use this information to compare the ongoing costs of investing in the Fund and other funds. To do so, compare this 5% hypothetical example with the 5% hypothetical examples that appear in the shareholder reports of the other funds. Please note that the expenses shown in the table are meant to highlight your ongoing costs only and do not reflect any transactional costs, such as sales charges (loads),
redemption fees, or exchange fees that may be charged by other funds. Therefore, this information is useful in comparing ongoing costs only, and will not help you determine the relative total costs of owning different funds.
| | | | | | | | | | | | | | | | |
| | | Beginning
Account
Value
4/1/12 | | | Ending
Account
Value
9/30/12 | | | Expenses Paid
During Period
4/1/12 - 9/30/12* | | | Annualized
Expense Ratio
4/1/12 - 9/30/12 | |
Actual Expenses | | | | | | | | | | | | | | | | |
ICON Bond Fund | | | | | | | | | | | | | | | | |
Class C | | $ | 1,000.00 | | | $ | 1,043.70 | | | $ | 8.18 | | | | 1.60% | |
Class S | | | 1,000.00 | | | | 1,048.30 | | | | 3.84 | | | | 0.75% | |
Class A | | | 1,000.00 | | | | 1,046.90 | | | | 5.12 | | | | 1.00% | |
ICON Equity Income Fund | | | | | | | | | | | | | | | | |
Class C | | | 1,000.00 | | | | 1,019.80 | | | | 11.16 | | | | 2.21% | |
Class S | | | 1,000.00 | | | | 1,024.70 | | | | 6.12 | | | | 1.21% | |
Class A | | | 1,000.00 | | | | 1,022.90 | | | | 7.38 | | | | 1.46% | |
ICON Fund | | | | | | | | | | | | | | | | |
Class C | | | 1,000.00 | | | | 989.60 | | | | 11.26 | | | | 2.26% | |
Class S | | | 1,000.00 | | | | 996.50 | | | | 6.30 | | | | 1.26% | |
Class A | | | 1,000.00 | | | | 993.60 | | | | 7.52 | | | | 1.51% | |
ICON Long/Short Fund | | | | | | | | | | | | | | | | |
Class C | | | 1,000.00 | | | | 980.40 | | | | 11.81 | | | | 2.39% | |
Class S | | | 1,000.00 | | | | 985.10 | | | | 6.65 | | | | 1.34% | |
Class A | | | 1,000.00 | | | | 983.50 | | | | 8.13 | | | | 1.64% | |
ICON Risk-Managed Equity Fund | | | | | | | | | | | | | | | | |
Class C | | | 1,000.00 | | | | 1,019.30 | | | | 11.31 | | | | 2.24% | |
Class S | | | 1,000.00 | | | | 1,024.30 | | | | 6.27 | | | | 1.24% | |
Class A | | | 1,000.00 | | | | 1,022.50 | | | | 7.53 | | | | 1.49% | |
Hypothetical (assuming a 5% return before expenses) | | | | | | | | | | | | | | | | |
ICON Bond Fund | | | | | | | | | | | | | | | | |
Class C | | | 1,000.00 | | | | 1,017.00 | | | | 8.07 | | | | | |
Class S | | | 1,000.00 | | | | 1,021.25 | | | | 3.79 | | | | | |
Class A | | | 1,000.00 | | | | 1,020.00 | | | | 5.05 | | | | | |
ICON Equity Income Fund | | | | | | | | | | | | | | | | |
Class C | | | 1,000.00 | | | | 1,013.95 | | | | 11.12 | | | | | |
Class S | | | 1,000.00 | | | | 1,018.96 | | | | 6.10 | | | | | |
Class A | | | 1,000.00 | | | | 1,017.70 | | | | 7.36 | | | | | |
ICON Fund | | | | | | | | | | | | | | | | |
Class C | | | 1,000.00 | | | | 1,013.68 | | | | 11.40 | | | | | |
Class S | | | 1,000.00 | | | | 1,018.69 | | | | 6.37 | | | | | |
Class A | | | 1,000.00 | | | | 1,017.46 | | | | 7.61 | | | | | |
| | | | | | | | | | | | | | |
| | | Beginning
Account
Value
4/1/12 | | | Ending
Account
Value
9/30/12 | | | Expenses Paid
During Period
4/1/12 - 9/30/12* | | | Annualized
Expense Ratio
4/1/12 - 9/30/12 |
ICON Long/Short Fund | | | | | | | | | | | | | | |
Class C | | | 1,000.00 | | | | 1,013.07 | | | | 12.01 | | | |
Class S | | | 1,000.00 | | | | 1,018.30 | | | | 6.77 | | | |
Class A | | | 1,000.00 | | | | 1,016.80 | | | | 8.27 | | | |
ICON Risk-Managed Equity Fund | | | | | | | | | | | | | | |
Class C | | | 1,000.00 | | | | 1,013.80 | | | | 11.28 | | | |
Class S | | | 1,000.00 | | | | 1,018.80 | | | | 6.26 | | | |
Class A | | | 1,000.00 | | | | 1,017.55 | | | | 7.51 | | | |
| * | Expenses are equal to the Fund’s six month expense ratio and annualized, multiplied by the average account value over the period, multiplied by 183/366 to reflect the one-half year period. |
Total returns exclude applicable sales charges. If sales charges were included (maximum 5.75%), returns would be lower.
BOARDOF TRUSTEESAND FUND OFFICERS (UNAUDITED)
The ICON Funds Board of Trustees (“Board”) consists of four Trustees who oversee the 18 ICON Funds (the “Funds”). The Board is responsible for general oversight of the Funds’ business and for assuring that the Funds are managed in the best interest of the Funds’ shareholders. The Trustees, and their ages, and principal occupations are set forth below. The address of the Trustees is 5299 DTC Blvd., Suite 1200, Greenwood Village, CO 80111. Trustees have no official term of office and generally serve until they resign or are not re-elected.
Interested Trustee
Craig T. Callahan, 61, Chairman of the Board. Dr. Callahan has been a Trustee of the Funds since their inception. Dr. Callahan also serves as President (1998 to present) and Chairman of the Investment Committee (2005 to present) and served as the Chief Investment Officer (1991 to 2004) of ICON Advisers. Dr. Callahan is also Executive Vice President (2005 to present); Director (1991 to present); and was previously President (1998 to 2005) and Chief Compliance Officer (2005) of IDI. Dr. Callahan also serves as the President (1998 to present) and Chairman of the Board of Directors (1994 to present) of ICON Management & Research Corporation (“IM&R”), the parent company of ICON Advisers and IDI.
Independent Trustees
Glen F. Bergert, 62. Mr. Bergert has been a Trustee of the Funds since 1999. Mr. Bergert is President of Venture Capital Management LLC (1997 to present), General Partner of SOGNO Partners LP, a venture capital company (2001 to present), General Partner of Bergert Properties, LLP, a real estate holding company (1997 to present), General Partner of Pyramid Real Estate Partnership, a real estate development company (1998 to present), General Partner of Chamois Partners, LP, a venture capital company (2004 to present) and was previously a General Partner with KPMG Peat Marwick, LLP (1979 to 1997). Mr. Bergert is also a Director of Delta Dental of Pennsylvania, an insurance company (1998 to 2009 and 2010 to present), Dentegra Group, Inc, an insurance holding company (2010 to present) and Delta Reinsurance Corporation (2000 to 2009 and 2011 to present). He was a Director of Delta Dental of California, an insurance company (2006 to 2012).
John C. Pomeroy, Jr., 65. Mr. Pomeroy has been a Trustee of the Funds since November 2002. Mr. Pomeroy is Chief Investment Officer and Director of Investments, Pennsylvania State University (2001 to present) and was
Portfolio Manager and Product Manager, Trinity Investment Management Corporation (1989 to 2001).
R. Michael Sentel, 64. Mr. Sentel has been a Trustee of the Funds since their inception. Mr. Sentel is a Senior Attorney with the U.S. Department of Education (1996 to present). Mr. Sentel also provides legal representation as a sole practitioner with an emphasis on corporate and transactional law. He served as general counsel to numerous public companies and served on the board of directors of one of these clients. Mr. Sentel began his legal career with the U.S. Securities and Exchange Commission’s Division of Enforcement and served as a Branch Chief (1980 to 1981). Later he served as the Section Chief for the Professional Liability Section of the Federal Deposit Insurance Corp. with responsibility for the Rocky Mountain Region (1991 to 1994).
The Officers of the Funds are:
Craig T. Callahan, 61, Chairman of the Board. Dr. Callahan has been a Trustee of the Funds since their inception. Dr. Callahan also serves as President (1998 to present) and Chairman of the Investment Committee (2005 to present) and served as the Chief Investment Officer (1991 to 2004) of ICON Advisers. Dr. Callahan is also Executive Vice President (2005 to present); Director (1991 to present); and was previously President (1998 to 2005) and Chief Compliance Officer (2005) of IDI. Dr. Callahan also serves as the President (1998 to present) and Chairman of the Board of Directors (1994 to present) of IM&R, the parent company of ICON Advisers and IDI.
Erik L. Jonson, 63. Mr. Jonson has been a Vice President and Principal Financial Officer/Treasurer of the Funds since their inception in 1996. Mr. Jonson is also Chief Financial Officer (1996 to present) and Executive Vice President (2004 to present) and was previously Vice President (1998 to 2004) and Secretary (2005 and 1998 to 2002) of ICON Advisers; Chief Financial Officer, Secretary and Director (1998 to present) of IM&R; and Executive Vice President and Treasurer/Financial Principal (1996 to present) of IDI. Mr. Jonson will be retiring on January 22, 2013.
Jessica Seidlitz, 34. Ms. Seidlitz serves as the Assistant Treasurer of the Funds (2007 to present) and Vice President of the Funds (2012 to present). She also serves as the Mutual Fund Controller of ICON Advisers (2005 to present). Previously, she was a Senior Associate/Associate at PricewaterhouseCoopers LLP (2001 to 2004). Effective January 22, 2013, Ms. Seidlitz will become the Principal Financial Officer/Treasurer of the Funds.
Donald Salcito, 59. Mr. Salcito serves as Vice President and Secretary of the Funds (November 15, 2006 to present). Mr. Salcito is also Executive Vice President and General Counsel (September 2005 to present) of ICON Advisers; Director of IM&R (2005 to present); Executive Vice President,
Secretary, General Counsel of IDI (2005 to present). Previously, he was a Partner in various national law firms, practicing in the securities law area. (1980 to 2005).
Brian Harding, 33. Mr. Harding serves as Chief Compliance Officer and Anti-Money Laundering Officer of the Funds (2008 to present). Mr. Harding also serves as Chief Compliance Officer of ICON Advisers (2011 to present). Previously, he was a Manager (2007 to 2008) and a Senior Associate/Associate (2001 to 2007) at PricewaterhouseCoopers LLP.
OTHER INFORMATION
Renewal of Investment Advisory Agreements
On August 6, 2012 the Board of Trustees, including all of the Trustees that are not “interested persons” of the Trust (the “Independent Trustees”), approved continuation of the Advisory Agreements with the Adviser for each Fund for an additional one-year term commencing October 1, 2012.
In determining to renew the investment advisory agreements between ICON Funds (the “Trust”) and ICON Advisers, Inc. (“ICON” or the “Adviser”) the Board requested, was provided with and reviewed data with respect to ICON, its personnel, and the services provided and to be provided to each Fund by ICON under the Trust’s Investment Advisory Agreement dated October 9, 1996, as amended (related to the Sector, International and ICON Funds) and under the Trust’s Investment Advisory Agreement dated July 9, 2002 and effective October 1, 2002, as amended (related to the U.S. Diversified Funds - Bond, Risk-Managed Equity, Equity Income and Long/Short Funds) (collectively, the “Advisory Agreements”), for an additional one-year term commencing October 1, 2012. The Board agreed that consideration of the Advisory Agreements should also include consideration of Trust-ICON agreements that impact provisions of the Advisory Agreements – including, in particular, expense limitation agreements dated January 23, 2012 and May 1, 2005 (for the International Equity Fund).
The Board was provided with and reviewed data with respect to ICON, its personnel, and the services provided and to be provided to each Fund by ICON under the Trust’s Advisory Agreements and Administrative Services Agreement with ICON and the Distribution Agreement with ICON Distributors, Inc. (“IDI”). The data included information concerning advisory, distribution and administrative services provided to the Funds by ICON and its related companies; information concerning other businesses of those companies; comparative data related to exchange traded funds versus the Sector Funds; and comparative data obtained from Strategic Insights related to Fund performance and Fund expenses (the “SI report”). The data also included an analysis of the Funds’ ratings on the AthenaInvest system (the “AthenaInvest data”) and a presentation on ICON’s investment model.
Management personnel discussed the data for and with the Board. Included in the 15(c) discussion was a briefing on factors affecting the ICON model; expenses and expense ratios of each Fund and other ICON managed products; relative performance of each Fund; status of expense reimbursements to the Funds by ICON Advisers; sales and marketing initiatives; specific business factors affecting IDI; the work load on ICON as
adviser and administrator to the Funds; current profitability of ICON; current staffing levels and staff morale; and changes to ICON’s trading desk.
The Independent Trustees were represented by independent legal counsel throughout the process. Prior to acting on the proposed contract renewals, the Independent Trustees met separately as a group in private sessions with their independent legal counsel to review and discuss the foregoing information. Based on these discussions, independent legal counsel and/or the Lead Independent Trustee also contacted management to request additional information and to discuss responses to questions raised during the process. In addition, the Board received materials from legal counsel discussing the legal standards applicable to their consideration of the ICON-Trust agreements.
In considering the nature, extent and quality of the services provided by the Adviser, the Board reviewed information relating to ICON’s operations and personnel. Among other things, the Adviser provided biographical information on its professional staff and descriptions of its organizational and management structure. In the course of their deliberations the Board evaluated, among other things, information relating to the investment philosophy, strategies and techniques used in managing each Fund, the qualifications and experience of ICON’s investment personnel, ICON’s compliance programs, ICON’s brokerage practices, including the extent to which the Adviser obtains research through “soft dollar” arrangements with the Funds’ brokerage, compliance reports on the foregoing, and the financial and non-financial resources available to provide services required under the Advisory Agreement.
During the discussion, the SI report and the AthenaInvest data were discussed and management personnel showed performance for each fund and discussed the factors affecting performance. During the discussion on performance, management personnel noted that the markets continue to experience volatility and that when the markets are volatile, it affects ICON’s performance; during the last three – four years ICON’s style of management, intrinsic valuation, has not been in favor. It was noted that Advisers’ performance relative to other valuation managers as judged by the AthenaInvest system is quite positive, but in relation to other strategy managers, valuation is underperforming; that the period from March 2009, near the market bottom, through June 2012, is an example of how difficult it has been for active management as the average performance of all ten strategies identified by AthenaInvest have lagged the S&P 500; that the best two performing strategies have been Future Profitability and Future Growth, which appear to have benefitted from rebounding, rapidly growing and improving earnings; that Valuation ranks fourth – just above middle of the pack, only slightly better than the average performance of all managers;
and that, performance over the twelve months ending June, 2012 shows all ten strategies lagged the S&P 500 Index. The Board believes this information supports the view that we are in a very difficult setting for active management and indicates this setting has been particularly difficult for managers buying what they consider to be value bargains. It was noted that the ICON system is designed to handle one to two year industry themes, not themes averaging 14 weeks; and that the Adviser has stuck to its system as specified in Fund disclosure documents, holding the stocks and industries that appear undervalued and held those stocks and industries through the volatility. Management advised that, in hindsight, the only way to handle such a rapidly reversing environment is “market timing;” that the Adviser is not a market timer and doesn’t believe such a system is possible; and that the Adviser uses one valuation system across all mutual funds which has been problematic for all of the ICON Funds in this setting. The Adviser noted that AthenaInvest has data on strategies back to 1980 and there is a clear pattern of strategies coming and going from favor as economic and financial environments change; and that the Adviser remains committed to its style of management and believes that the shareholders will be rewarded over time.
The Board then questioned style consistency with the Adviser. Management advised that, based on the Adviser’s own analysis, and with the restructuring of the Adviser, ICON has added a new level of review on the Portfolio Managers (“PMs”) to make sure they are adhering to the ICON System; that procedures have been put in place to evaluate each of the Funds to ensure all PMs are investing consistently and in accordance with the ICON System by evaluating the Funds from an attribution perspective in monthly meetings with the PM’s and to, on an ongoing basis, evaluate the ICON system and seek to improve the Model, when necessary. The Board of Trustees noted that the Funds offer investors an opportunity to invest in funds where the Valuation style is used to manage fund assets; that the Adviser provides that style of management; that the Adviser continues to believe the adjustments to its system have been functioning as intended; and that, notwithstanding that belief, the Adviser is constantly evaluating the system and will modify it as needed.
In connection with reviewing data bearing upon the nature, quality, and extent of services furnished by ICON to each Fund, the Board assessed data concerning ICON’s staffing, systems and facilities. The Board also assessed ICON’s non-Trust business to see if there are any initiatives that would dilute service to the Trust. The Board noted:
A. That the breadth and the quality of investment advisory and other services being provided to each Fund is satisfactory, as evidenced in part by efforts to address and improve the performance record of each Fund when
compared with the performance records of a peer group of comparable funds and markets in general;
B. That the breadth and the quality of investment advisory and other services being provided to each Fund is satisfactory, as evidenced in part by the AthenaInvest data (ratings based on an assessment of fund strategy) which also reflects that all but one of the Funds are rated 3 or higher and that, unlike many other fund groups, ICON Funds has no fund rated 1 and only one rated 2 (where 1 is the lowest and 5 is the highest).
C. That ICON has made significant expenditures in the past year and in prior years to ensure that it has the sophisticated systems and the highly trained personnel necessary for it to be able to continue to provide quality service to the Funds’ shareholders, including the dedication of substantial resources to ICON’s investment and methodology;
D. That the Board, after considering compliance reports and compliance initiatives undertaken during the year and conducting individual interviews with selected portfolio managers, is satisfied with the research and portfolio management, that research and portfolio management is being constantly evaluated and improved upon; and that the PM’s are evaluating trading services constantly, the Board concluded that the Adviser is providing the Funds with professional management of the nature, quality and scope required by the Funds; and
E. The risks assumed by ICON in providing investment advisory services to each Fund, including the capital commitments which have been made in the past and which continue to be made by ICON to ensure the continuation of the highest quality of service to the Trust, is made with the recognition that shareholders may redeem their shares at any time without notice and the Trust’s advisory relationship with ICON may be terminated at any time and must be renewed on an annual basis.
In considering the reasonableness of the fees paid to the Adviser for managing each Fund, the Board reviewed, among other things, data concerning other funds from the SI report, financial statements of the Adviser and an analysis of the profitability of the Adviser, and its affiliates, and their relationship with each Fund over various time periods. Such analysis identified all revenues and other benefits received by the Adviser and its affiliates from managing each Fund, the costs associated with providing such services and the resulting profitability to the Adviser and its affiliates and a comparison of similar data from reports filed by publicly traded firms.
The Board noted actual (net) fees for advisory services and Fund expense ratios under the contractual relationship (the Advisory agreements and the
Expense Limitation Agreements) with ICON as opposed to the fees specified in the applicable Advisory Agreement and expense ratios without application of the expense limitations and concluded that the focus should be on actual expense ratios after application of the Expense Limitation Agreements
The Board considered the current and anticipated asset levels of each Fund and the contractual commitments of the Adviser to waive fees and pay expenses of the Funds from time to time to limit the total expenses of the Funds. In this regard the Board discussed significantly reduced asset levels in each Fund covered by the Advisory Agreements due to the tumultuous markets during the past four and a half years, the relative poor Fund performance, and the industry wide net-redemptions in equity and actively managed funds due to the uncertainty of the markets. ICON’s ability to provide the services called for under the Advisory Agreements was assessed in light of current and projected asset levels. Fund expenses and expense ratios were also assessed in light of current and projected asset levels. The Board concluded that the Adviser has the resources necessary to provide the services called for under the Advisory Agreements; that profitability to the Adviser and its affiliates from their relationship with the Funds, and services provided to the Funds, is not excessive; and that the Adviser is not realizing material benefits from economies of scale that would warrant adjustments to the fees for any Fund at this time. The Board of Trustees concluded that, in light of the nature, extent and quality of the services provided by the Adviser and the levels of profitability associated with providing these services, the fees charged by the Adviser under the Advisory Agreements to each Fund are reasonable.
In connection with assessing data bearing on the fairness of fee arrangements, the Board considered the SI report. It was noted that SI was selected at the May Board meeting to prepare its report, an extensive analysis of the expense data of other comparable funds; and that Trustee input was solicited and provided in the process. Among other information discussed, it was noted that:
A. the advisory fee structures of the Funds were considered in comparison with advisory fees and expense ratios of other similarly managed funds as set forth in the comparative data;
B. expense ratios for 14 of the 17 Funds are above median, one is equal to the median, and 2 are below the median;
C. in 15 of the 17 Funds, the assets under management are significantly below either the average or the median [SI did not provide an analysis of fund expense on an asset weighted basis. Such an analysis is very subjective and uncertain because it would require the Adviser to make a number of assumptions, which the Adviser’s management was uncomfortable in making
due to the unreliability of the assumptions. It was, however, noted that when the fund size approaches peer group averages the Funds expenses also approach peer group averages.];
D. ICON has contractually agreed to impose expense limitations on each and every Fund at a cost to ICON;
E. the advisory and other fees payable by the Funds to ICON under the contractual arrangements (the Advisory agreements and the Expense Limitation Agreements) are essentially fees which would be similar to those which would have resulted solely from “arm’s-length” bargaining, and may well be lower than fees arrived at solely from such arm’s-length negotiation;
F. ICON has contractually committed to break points in its fees so that economies of scale could be realized as a Fund grows in assets, for the benefit of Fund shareholders.
The Board also considered the fees charged by the Adviser to other advisory clients as outlined in its Registration application on form ADV in connection with assessing data bearing on the fairness of fee arrangements. It was noted that certain institutional type accounts have lower fees than the fees paid by the Funds; and that the fees differed for a number of reasons, including but not limited to, those clients call for different commitments of time, have low and predictable turnover of assets, in competition joint costs are apportioned among paying customers according to elasticity of demand, and the Adviser has reduced levels of responsibility in sub-managed accounts, or accounts with an investor agent/advisor especially in comparison to mutual funds which are highly regulated and restricted which increases costs of operations and decreases returns. The Board evaluated the Funds redemptions and compared those redemptions to similar funds in the industry, specifically, actively managed domestic equity funds in connection with assessing data bearing on the fairness of fee arrangements. The Board noted that the Funds redemptions were similar to industry averages which showed two things: 1) that the Funds’ Performance was not adversely impacting fund sales and redemptions, and 2) that the fees and costs were competitive. The Board noted that there are thousands of mutual funds competing; that investors can search and trade funds on the internet at very little or no cost; and that if the Adviser were overcharging for its services, with its performance being what it is, the Board would have expected redemptions in excess of industry norms.
The Board concluded that the Adviser is providing the Funds with professional management at a fair, reasonable and competitive price.
In connection with assessing the direct and indirect benefits to ICON from serving as the Funds’ adviser, the Board discussed services provided under
the Distribution Agreement and the Administrative Services Agreement which are in addition to services under the Advisory Agreements. It was noted that IDI does not charge a fee to the Funds for its services and that ICON’s fee for administrative services appears to be consistent with such fees in other fund groups. The Board noted that:
A. ICON benefits from serving directly or through affiliates as the principal underwriter and administrative agent for the Funds; that services provided by ICON and its affiliates to the Funds are satisfactory, and that fees derived from providing the services are competitive and reasonable; and
B. ICON receives research assistance (primarily in the form of data) from the use of soft dollars generated from Fund portfolio transactions; that such research assists ICON in providing quality advisory services; that Trust and Adviser compliance personnel continuously evaluate and report on the soft-dollar arrangements and related costs; and that the Board concluded that the arrangements are consistent with Fund brokerage practices and benefit the Funds and their shareholders.
Based on these considerations, the Board, including all of the Independent Trustees, concluded that: 1) the continuation of the Advisory Agreements was in the best interests of each Fund and its shareholders, 2) the services to be performed under the Advisory Agreements were required for the operation of the Funds, 3) the advisory services were satisfactory to the Funds in the past, and 4) the fees for the advisory services and other benefits from the relationship with the Trust received by ICON, and its affiliates, were consistent with fees paid by similar funds and other clients of ICON, and were reasonable in light of the comparative data, and within the range of what would have been negotiated at arm’s length in light of all the circumstances.
OTHER INFORMATION (UNAUDITED)
Supplemental Tax Information
For corporate shareholders, the following percentage of the total ordinary income dividends paid during the fiscal year ended September 30, 2012, qualifies for the corporate dividends received deduction for the following Funds:
| | | | |
| Fund | | Dividends
Received
Deduction | |
ICON Equity Income Fund | | | 82 | % |
ICON Fund | | | 100 | % |
ICON Risk-Managed Equity Fund | | | 100 | % |
For the fiscal year ended September 30, 2012, the following funds paid qualified dividend income:
| | | | |
| Fund | | Amount | |
ICON Equity Income Fund | | | 86% | |
ICON Fund | | | 100% | |
ICON Risk-Managed Equity Fund | | | 100% | |
The Funds designate the following amounts, or the maximum amount needed, as long-term capital gain distributions qualifying for the maximum 15% income tax rate for individuals:
| | | | |
| Fund | | Amount | |
ICON Bond Fund | | $ | 1,945,591 | |
Portfolio Holdings
Information related to the 10 largest portfolio holdings of each Fund is made available at www.iconfunds.com within approximately 10 business days after month-end. Additionally, a complete list of each Fund’s holdings is made available approximately 30 days after month-end. Each ICON Fund also files a complete schedule of portfolio holdings for the first and third quarters of its fiscal year with the Securities and Exchange Commission (the “Commission”) on Form N-Q. The ICON Funds’ Forms N-Q are available at www.sec.gov or may be reviewed and copied at the Commission’s Public Reference Room in Washington, DC. Information about the Public Reference Room may be obtained by calling 1-800-SEC-0330.
Proxy Voting
A summarized description of the policies and procedures the ICON Funds use to vote proxies is available free of charge at www.iconfunds.com or by calling 1-800-764-0442.
Information about how the ICON Funds voted proxies related to each Fund’s portfolio securities during the 12-month period ended June 30 is available free of charge at www.iconfunds.com or on the Commission’s website at www.sec.gov.
Cost Basis Information
Effective January 1, 2012, federal law requires mutual fund companies to maintain and report a shareholder’s cost basis by tax lot, gain/loss information and holding period of covered shares to the Internal Revenue Service on Form 1099. Covered shares are mutual fund shares acquired on or after January 1, 2012. A fund is not required to maintain and report information for shares not deemed as covered.
The new law requires each fund to elect a default tax identification methodology in order to perform the required reporting. As a result, the Trust has chosen Average Cost as its default tax identification methodology. This is the method each Fund will use. However, at the time of purchase or upon the sale of covered shares, shareholders may choose a different tax identification method. Furthermore, if you purchase shares through a financial intermediary, please contact the intermediary to find out what default tax identification method they will use. We recommend that you consult your tax adviser to determine which tax identification methodology best suits your individual tax situation.
For More Information
This report is for the general information of the Funds’ shareholders and is not authorized for distribution to prospective investors unless preceded or accompanied by a current prospectus. You may obtain a copy of the prospectus, which contains information about the investment objectives, risks, charges, expenses, and share classes of each ICON Fund, by visiting www.iconfunds.com or by calling 1-800-764-0442. Please read the prospectus carefully before investing.
ICON Distributors, Inc., Distributor.
ICON FUNDS PRIVACY INFORMATION
| | |
| FACTS | | WHAT DOES ICON DO
WITH YOUR PERSONAL INFORMATION? |
| | |
| Why? | | Financial companies choose how they share your personal information. Federal law gives consumers the right to limit some but not all sharing. Federal law also requires us to tell you how we collect, share, and protect your personal information. Please read this notice carefully to understand what we do. |
| | |
| What? | | The types of personal information we collect and share depend on the product or service you have with us. This information can include: n Social Security number and account balances n income and transaction history n checking account information and wire transfer instructions When you are no longer our customer, we continue to share your information as described in this notice. |
| | |
| How? | | All financial companies need to share customers’ personal information to run their everyday business. In the section below, we list the reasons financial companies can share their customers’ personal information; the reasons ICON chooses to share; and whether you can limit this sharing. |
| | | | |
| Reasons we can share your personal information | | Does ICON share? | | Can you limit this sharing? |
For our everyday business purposes — such as to process your transactions, maintain your account(s), respond to court orders and legal investigations, or report to credit bureaus | | Yes | | No |
For our marketing purposes — to offer our products and services to you | | No | | We don’t share |
| For joint marketing with other financial companies | | No | | We don’t share |
For our affiliates’ everyday business purposes — information about your transactions and experiences | | No | | We don’t share |
For our affiliates’ everyday business purposes — information about your creditworthiness | | No | | We don’t share |
| For nonaffiliates to market to you | | No | | We don’t share |
| | |
| Questions? | | Call 1-800-764-0442 for the ICON Funds and 1-800-828-4881 for ICON Advisers, Inc. and ICON Distributors, Inc. |
| | | | |
| ICON FUNDS PRIVACY INFORMATION | | | 97 | |
| | |
| Who we are | | |
| Who is providing this notice? | | ICON Funds, ICON Advisers, Inc., and ICON Distributors, Inc. (collectively “ICON”) |
| What we do | | |
| How does ICON protect my personal information? | | To protect your personal information from unauthorized access and use, we use security measures that comply with federal law. These measures include computer safeguards and secured files and buildings. Contracts with our service providers require them to restrict access to your non-public personal information, and to maintain physical, electronic and procedural safeguards against unintended disclosure. |
| How does ICON collect my personal information? | | We collect your personal information, for example, when you n open an account or enter into an investment advisory contract n provide account information or give us your contact information n make a wire transfer We also collect your personal information from others, such as credit bureaus, affiliates, or other companies. |
| Why can’t I limit all sharing? | | Federal law gives you the right to limit only n sharing for affiliates’ everyday business purposes — information about your creditworthiness n affiliates from using your information to market to you n sharing for nonaffiliates to market to you State laws and individual companies may give you additional rights to limit sharing. |
| Definitions | | |
| Affiliates | | Companies related by common ownership or control. They can be financial and nonfinancial companies. n Our affiliates include financial companies such as ICON Funds, ICON Advisers, Inc., and ICON Distributors, Inc. |
| Nonaffiliates | | Companies not related by common ownership or control. They can be financial and nonfinancial companies. n Nonaffiliates we share with can include financial companies such as custodians, transfer agents, registered representatives, financial advisers and nonfinancial companies such as fulfillment, proxy voting, and class action service providers |
| Joint marketing | | A formal agreement between nonaffiliated financial companies that together market financial products or services to you. n ICON doesn’t jointly market |
| | |
| 98 | | ICON FUNDS PRIVACY INFORMATION |
(This page is intentionally left blank)
(This page is intentionally left blank)
(This page is intentionally left blank)
For more information about the ICON Funds, contact us:
| | |
| |
| By Telephone | | 1-800-764-0442 |
| |
| By Mail | | ICON Funds P.O. Box 55452 Boston, MA 02205-8165 |
| |
| In Person | | ICON Funds 5299 DTC Boulevard, 12th Floor Greenwood Village, CO 80111 |
| |
| On the Internet | | www.iconfunds.com |
| |
| By E-Mail | | info@iconadvisers.com |

2012 ANNUAL REPORT
ICON INTERNATIONAL FUNDS
INVESTMENT UPDATE
ICON Asia-Pacific Region Fund
ICON Europe Fund
ICON International Equity Fund

1-800-764-0442 | www.iconfunds.com
AR-INTL-12-K31246

You can now sign up for electronic delivery of ICON Fund shareholder reports, including prospectuses, annual reports, semiannual reports and proxy statements.
When these materials are available, you will receive an email from ICON with instructions on how to view the documents. Statements, transaction confirmations and other documents that are not available online will continue to be sent to you by U.S. mail.
Visit ICON’s website at www.iconfunds.com to learn more and sign up.
You may change or cancel your participation in eDelivery by visiting www.iconfunds.com, or you can request a hard copy of any of the materials free of charge by calling ICON Funds at 1-800-764-0442.
1-800-764-0442 • www.iconfunds.com

TABLEOF CONTENTS
ABOUT THIS REPORT (UNAUDITED)
Historical Returns
All total returns mentioned in this Report account for the change in a Fund’s per-share price and the reinvestment of any dividends, capital gain distributions and adjustments for financial statement purposes. If your account is set up to receive Fund distributions in cash rather than to reinvest them, your actual return may differ from these figures. The Funds’ performance results do not reflect the deduction of taxes that a shareholder would pay on Fund distributions or on the redemption of Fund shares. The Adviser may have reimbursed certain fees or expenses of some of the Funds. If not for these reimbursements, performance would have been lower. Fund results shown, unless otherwise indicated, are at net asset value. If a sales charge (maximum 5.75%) had been deducted, results would have been lower.
Past performance does not guarantee future results. Investment return and principal value will fluctuate so that an investor’s shares, when redeemed, may be worth more or less than their original cost. Performance results represent past performance, and current performance may be higher or lower. Please call 1-800-764-0442 or visit www.iconfunds.com for performance results current to the most recent month-end.
Portfolio Data
This Report reflects ICON’s views, opinions and portfolio holdings as of September 30, 2012, the end of the reporting period. The information is not a complete analysis of every aspect of any sector, industry, security or the Funds.
Opinions and forecasts regarding industries, companies and/or themes, and portfolio composition and holdings are subject to change at any time based on market and other conditions, and should not be construed as a recommendation of any specific security, industry or sector. Each Fund’s holdings as of September 30, 2012 are included in each Fund’s Schedule of Investments.
According to ICON, value investing is an analytical approach to investing that employs various factors, including projecting earnings growth estimates, in an effort to determine whether securities are over- or underpriced relative to ICON’s estimates of their intrinsic value. Value investing involves risks and uncertainties and does not guarantee better performance or lower costs than other investment methodologies. ICON’s value-to-price ratio (“V/P”) is a ratio of intrinsic value, as calculated using ICON’s proprietary valuation methodology, of a broad range of domestic and international securities
within ICON’s system as compared to the current market price of those securities. The ICON system relies on the integrity of financial statements released to the market as part of our analysis.
This Report contains statements regarding industry or sector themes, new market themes, investment outlook, relative strength, value-to-price ratios, and investment team expectations, beliefs, goals and the like that are based on current expectations, recent individual stock performance relative to current market prices, estimates of company values and other information supplied to the market by the companies we follow. Words such as “expects,” “suggests,” “anticipates,” “targets,” “goals,” “value,” “intrinsic value,” “indicates,” “believes,” “considers,” “estimates,” variations of such words and similar expressions are intended to identify forward looking statements, which are not statements of historical fact. Forward looking statements are not guarantees of future performance and involve certain risks, uncertainties and assumptions that are difficult to assess. These risks and uncertainties are based on a number of important factors, including, among others: stock price fluctuations; the integrity and accuracy of historical and projected financial and other information supplied by companies to the public or assumptions based on such information supplied; interest rates; bond yields; future earnings growth rates; the risks noted in this report and other factors beyond the control of our investment team but used by the investment team to influence their assumptions. Therefore, actual outcome may differ materially from what is expressed in such forward looking statements.
There are risks associated with mutual fund investing, including the loss of principal. The likelihood of loss may be greater if you invest for a shorter period of time. There is no assurance that the investment process will consistently lead to successful results.
An investment in a region fund may involve greater risk and volatility than a diversified fund. An investment concentrated in sectors and industries may involve greater risk and volatility than a more diversified investment.
Investments in foreign securities may entail unique risks, including political, market, and currency risks. Financial statements of foreign companies are governed by different accounting, auditing, and financial standards than U.S. companies and may be less transparent and uniform than in the United States. Many corporate governance standards, which help ensure the integrity of public information in the United States, do not exist in foreign countries. In general, there may be less governmental supervision of foreign stock exchanges and securities brokers and issuers. The ICON system relies on the integrity of financial statements released to the market as part of our analysis.
The prospectus and statement of additional information contain this and other information about the Funds and are available by visiting
www.iconfunds.com or calling 1-800-764-0442. Please read the prospectus and statement of additional information carefully.
Comparative Indexes
The comparative indexes discussed in this Report are meant to provide a basis for judging a Fund’s performance against specific securities indexes. Each index shown accounts for both change in the security price and reinvestment of dividends and distributions (except as noted), but does not reflect the costs of managing a mutual fund. The total return figures for the Morgan Stanley Capital International (“MSCI”) indexes assume change in security prices and the deduction of local taxes. The Funds’ portfolios may significantly differ in holdings and composition from the indexes. Individuals cannot invest directly in an index.
| • | | The unmanaged MSCI All Country Asia-Pacific Index is a free float-adjusted market capitalization weighted index that is designed to measure the equity market performance of the developed and emerging markets in the Pacific region (Australia, China, Hong Kong, India, Indonesia, Japan, Korea, Malaysia, New Zealand, Philippines, Singapore, Taiwan and Thailand). |
| • | | The unmanaged MSCI Europe Index is a free float-adjusted market capitalization weighted index that is designed to measure the equity market performance of the developed markets in Europe (Austria, Belgium, Denmark, Finland, France, Germany, Greece, Ireland, Italy, the Netherlands, Norway, Portugal, Spain, Sweden, Switzerland and the United Kingdom). |
| • | | The MSCI All Country World Index ex-United States (“ACWI ex-U.S.”) is a leading unmanaged benchmark of international stock performance. The capitalization-weighted index is representative of the performance of securities of companies located in developed and emerging markets outside of the United States. |
Index returns and statistical data included in this Report are provided by FactSet Research Systems.
Financial Intermediary
If you purchase the Fund through a broker-dealer or other financial intermediary (such as a bank), the Fund and its related companies may pay the intermediary for the sale of Fund shares and related services. These payments may influence the broker-dealer or other intermediary and your salesperson to recommend the Fund over another investment. Ask your salesperson or visit your financial intermediary’s website for more information.
| | | | |
MANAGEMENT OVERVIEW ICON ASIA-PACIFIC REGION FUND | | Class S Class C Class A | | ICARX ICPCX IPCAX |
| Q. | How did the Fund perform relative to its benchmark? |
| A. | The ICON Asia-Pacific Region Fund returned 21.16% for Class S shares for the fiscal year ended September 30, 2012, outperforming its benchmark, the MSCI All Country Asia-Pacific Index, which returned 11.59%. Class A shares of the Fund returned 20.73% (and 13.75% with maximum sales charge) during the same period while Class C shares returned 19.84% (and 18.84% with contingent deferred sales charge). Total returns for other periods as of September 30, 2012, appear in the subsequent pages of this Fund’s Management Overview. |
| Q. | What primary factors were behind the Fund’s relative performance? |
| A. | Most global markets experienced net gains during fiscal-year 2012; however, the ride was rocky at times, driven primarily by extreme shifts in sentiment as investors reacted to macroeconomic-related events. |
In the first quarter of the fiscal year, or final calendar quarter of 2011, the Asia-Pacific region experienced pronounced ups and downs as global markets sought to find their footing following the significant fear-based sell-off of late summer 2011. In the months preceding Q4, 2011, investors were greeted with a steady barrage of negative headlines, like the US debt ceiling crisis, renewed fears over European debt and reduced global growth prospects. Value for the region was dominated by cyclical sectors, including Information Technology, Financials and Industrials, during this period, and the Fund was tilted accordingly.
By the start of 2012, markets seemed to have found their footing, and the Asia-Pacific region experienced a solid first calendar quarter rally led still by cyclical sectors, including the ones identified above. As the rally continued, however, value shifted decidedly in favor of historically defensive sectors – specifically, Consumer Staples, Health Care and Telecommunications, although the cyclical Consumer Discretionary sector also maintained a high level of value. In response, we pared back select cyclical sector overweights during the rally and added to both our defensive sector positions and our Consumer Discretionary holdings, locking in significant gains relative to the benchmark.
Asia-Pacific markets peaked in late February and were essentially range-bound until early May at which time European sovereign debt fears came roaring back into the headlines. Though Fund performance was hurt
during this period, thanks to the earlier shift in sector weightings, the Fund outperformed its benchmark.
The Asia-Pacific region found its low in early June, but the benchmark climbed higher to close at levels near its 2012 peak by fiscal year-end. Up until early September, much of the recovery off the June low was led by defensives, and the Fund outperformed thanks to its overweights in this space. With markets beginning to bet more and more on central bank action, however, performance leadership shifted to that of lower value cyclicals. While the Fund outperformed significantly in fiscal-year 2012, performance lagged the benchmark in the final weeks of the period, as anticipated central bank easing came to fruition. According to our valuation framework, however, Health Care, Consumer Staples, Telecommunications Services and Consumer Discretionary still dominate in terms of value, giving us a high level of conviction that we are weighted appropriately.
| Q. | How did the Fund’s composition affect performance? |
| A. | As value shifted towards defensives over the course of the first calendar quarter, so too did the Fund’s sector weights. The primary beneficiaries of this move were Consumer Staples, Health Care and Telecommunications Services. To accommodate these moves, we pared our positions in the Financials, Industrials and Materials sectors. While the general theme in the first months of 2012 was a shift in value to defensive sectors, the cyclical Consumer Discretionary sector likewise maintained good value under our system, warranting a higher weighting. |
All but one sector contributed positively to the Fund’s relative performance. Overweights in Telecommunications Services and Energy along with the shift away from Financials and Industrials contributed the most to Fund performance. Information Technology had a slightly negative relative contribution to performance, primarily due to stock selection within the sector.
Top contributors to performance at the industry level included oil & gas equipment & services, property & casualty insurance, household appliances, diversified banks and pharmaceuticals. Industries that detracted from performance included overweights in internet software & services, auto parts & equipment and coal & consumable fuels along with underweights in semiconductors and diversified real estate activities.
There was also a notable shift in the Fund as it related to country weightings. The largest trims included China and India, where the Fund moved from an overweight position to underweight as value deteriorated in both countries. Following value, we added to our positions in Australia
and Japan. Japan had the largest absolute weighting in the Fund at fiscal year-end, although it is still underweight the benchmark’s largest country weighting.
While there was a reduction in the overall emerging market weighting (a result of the changes in country weights), the Fund remained overweight emerging and underweight developed markets at fiscal year-end. Japan, South Korea, Thailand and Singapore – contributed the most to performance. India and China, by contrast, detracted somewhat from the Fund’s relative performance.
As a multi-cap manager, we are not limited by restrictions on market capitalization. Contrary to the previous two fiscal years, our valuation metrics this year led us away from large-cap companies towards mid- and small-cap companies. As of fiscal year end, the Fund remains significantly underweight large-cap stocks (the dominant market cap allocation of the benchmark), and significantly overweight mid- and small-cap stocks relative to the benchmark.
| Q. | What is your investment outlook for the Asia-Pacific equity market? |
| A. | The investment environment today continues to be dogged by pessimism over global growth. The Asia-Pacific region echoes the anxiety expressed elsewhere in the world regarding the impact Europe’s sovereign debt issues and a potential fiscal cliff in the United States will have on global demand, especially as demand relates to China’s economic growth. With exports serving as a major component of the economies in the Asia-Pacific region and China the largest export market of almost every country, concerns over a potential domino effect are understandable. Valuations at the company level reflect these worries, particularly relative to forward growth expectations. |
Our investment system, however, is predicated on the idea that investors overreact to both good and bad news. Therefore, we tend to see a pessimistic environment, such as the one we are in now, as an opportunity. Interest rates are hovering around all-time lows, monetary policy is loose and expected to remain so for several years and company balance sheets are in a strong position – all of which are positive signs for stocks going forward.
At fiscal year-end, we estimate that, on average, fair value for Asia-Pacific equities is 14% higher than where prices are currently trading.
Defensive sectors, including Health Care and Consumer Staples, and the Consumer Discretionary sector continue to dominate in terms of value. Among defensives, our investment system is showing the most value in
Health Care, Consumer Staples and Telecommunication Services. As of fiscal year end, we estimate fair value, on average, for each of these four sectors is 29% higher than where prices are currently trading. Accordingly, we continue to maintain an overweight position in these sectors.
Within the region we favor holdings in Australia, Indonesia and Singapore. We estimate that, on average, fair value for stocks in these three countries is 24% higher than where prices are currently trading. Therefore, we continue to be overweight these countries.
At ICON, we look for industries that our system identifies as trading at a discount to fair value and showing relative strength in the markets. Guided by our disciplined, systematic and non-emotional approach to investing, we see numerous opportunities in the current environment. We believe it is nearly impossible to accurately time market bottoms and, further, that rallies do not offer invitations. Given this philosophy and the valuations we see in the market at fiscal year-end, we remain almost fully invested, ready to reallocate and adapt as our investment system dictates.
ICON Asia-Pacific Region Fund
Country Composition
September 30, 2012
| | | | |
Japan | | | 29.3% | |
South Korea | | | 22.1% | |
Australia | | | 16.3% | |
China | | | 8.1% | |
Thailand | | | 6.0% | |
Singapore | | | 5.8% | |
India | | | 4.0% | |
Malaysia | | | 3.4% | |
Indonesia | | | 2.3% | |
Hong Kong | | | 0.6% | |
New Zealand | | | 0.5% | |
| | | | |
| | | 98.4% | |
| | | | |
Percentages are based upon common stocks as a percentage of net assets.
ICON Asia-Pacific Region Fund
Sector Composition
September 30, 2012
| | | | |
Consumer Discretionary | | | 21.6% | |
Materials | | | 15.8% | |
Consumer Staples | | | 13.9% | |
Information Technology | | | 10.9% | |
Financial | | | 9.4% | |
Health Care | | | 7.7% | |
Industrials | | | 6.7% | |
Energy | | | 6.4% | |
Utilities | | | 6.0% | |
| | | | |
| | | 98.4% | |
| | | | |
Percentages are based upon common stocks as a percentage of net assets.
ICON Asia-Pacific Region Fund
Industry Composition
September 30, 2012
| | | | |
Automobile Manufacturers | | | 9.4% | |
Diversified Metals & Mining | | | 6.6% | |
Pharmaceuticals | | | 5.1% | |
Diversified Banks | | | 4.8% | |
Wireless Telecommunication Services | | | 4.2% | |
Property & Casualty Insurance | | | 3.9% | |
Auto Parts & Equipment | | | 3.8% | |
Oil & Gas Equipment & Services | | | 3.7% | |
Packaged Foods & Meats | | | 3.3% | |
Semiconductors | | | 3.0% | |
Specialty Chemicals | | | 2.9% | |
Tobacco | | | 2.7% | |
IT Consulting & Other Services | | | 2.6% | |
Electrical Components & Equipment | | | 2.4% | |
Commodity Chemicals | | | 2.3% | |
Internet Software & Services | | | 2.3% | |
Integrated Oil & Gas | | | 2.2% | |
Food Retail | | | 1.9% | |
Integrated Telecommunication Services | | | 1.8% | |
| | | | |
Diversified Chemicals | | | 1.7% | |
Casinos & Gaming | | | 1.5% | |
Personal Products | | | 1.5% | |
Apparel, Accessories & Luxury Goods | | | 1.4% | |
Trading Companies & Distributors | | | 1.3% | |
Tires & Rubber | | | 1.2% | |
Health Care Services | | | 1.2% | |
Electronic Equipment & Instruments | | | 1.2% | |
Hypermarkets & Super Centers | | | 1.1% | |
Aerospace & Defense | | | 1.1% | |
Health Care Equipment | | | 1.0% | |
Other Industries (each less than 1%) | | | 15.3% | |
| | | | |
| | | 98.4% | |
| | | | |
Percentages are based upon common stocks as a percentage of net assets.
ICON Asia-Pacific Region Fund
Average Annual Total Return
as of September 30, 2012
| | | | | | | | | | | | | | | | | | | | | | | | | | | | |
| | | Inception
Date | | | 1 Year | | | 5 Years | | | 10 Years | | | Since
Inception | | | Gross
Expense
Ratio* | | | Net
Expense
Ratio* | |
ICON Asia-Pacific Region Fund - Class S | | | 2/25/97 | | | | 21.16% | | | | -4.69% | | | | 10.15% | | | | 2.63% | | | | 1.59% | | | | 1.59% | |
MSCI All Country Asia-Pacific Index | | | | | | | 11.59% | | | | -2.98% | | | | 9.19% | | | | 2.64% | | | | N/A | | | | N/A | |
ICON Asia-Pacific Region Fund -Class C | | | 1/25/08 | | | | 19.84% | | | | N/A | | | | N/A | | | | -2.63% | | | | 4.40% | | | | 2.55% | |
MSCI All Country Asia-Pacific Index | | | | | | | 11.59% | | | | N/A | | | | N/A | | | | -0.89% | | | | N/A | | | | N/A | |
ICON Asia-Pacific Region Fund -Class A | | | 5/31/06 | | | | 20.73% | | | | -4.94% | | | | N/A | | | | 1.17% | | | | 3.05% | | | | 1.81% | |
ICON Asia-Pacific Region Fund -Class A (including maximum sales charge of 5.75%) | | | 5/31/06 | | | | 13.75% | | | | -6.05% | | | | N/A | | | | 0.22% | | | | 3.05% | | | | 1.81% | |
MSCI All Country Asia-Pacific Index | | | | | | | 11.59% | | | | -2.98% | | | | N/A | | | | 1.95% | | | | N/A | | | | N/A | |
Past performance is not a guarantee of future results. Information about these performance results and the comparative indexes can be found in the About This Report section. The Adviser has agreed to limit certain expenses on Class C and Class A shares; without these limitations, returns would have been lower. The limitation provisions may be terminated in the future.
| * | Please see the most recent prospectus for details. |
Class C total returns exclude applicable sales charges. If sales charges were included returns would be lower.
ICON Asia-Pacific Region Fund
Value of a $10,000 Investment
through September 30, 2012
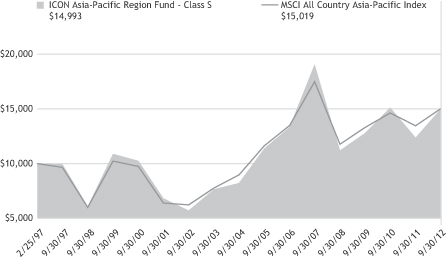
Past performance is not a guarantee of future results. The above graph compares a $10,000 investment made in the Fund’s Class S shares on the Class’ inception date of 2/25/97 to a $10,000 investment made in an unmanaged securities index on that date. The Fund’s performance in this chart and the performance table assumes the reinvestment of dividends, capital gain distributions and tax return of capital, but does not reflect the deduction of taxes that a shareholder would pay on Fund distributions or on the redemption of Fund shares.
ICON ASIA-PACIFIC REGION FUND
SCHEDULEOF INVESTMENTS
SEPTEMBER 30, 2012
| | | | | | | | |
| Shares or Principal Amount | | Value | |
| | | | | | | | |
| | Common Stocks (98.4%) | |
| | 1,196,000 | | | Agricultural Bank of China, Ltd., Class H | | $ | 464,265 | |
| | 20,200 | | | Aisin Seiki Co., Ltd.(a) | | | 575,283 | |
| | 510,000 | | | AKR Corporindo Tbk PT | | | 225,445 | |
| | 24,400 | | | Amcor, Ltd. | | | 195,780 | |
| | 12,000 | | | Ansell, Ltd. | | | 199,027 | |
| | 5,600 | | | Baidu, Inc., ADR†** | | | 654,192 | |
| | 387,000 | | | Bank Rakyat Indonesia Persero Tbk PT | | | 299,952 | |
| | 47,500 | | | Bharti Airtel, Ltd. | | | 238,996 | |
| | 42,700 | | | BHP Billiton, Ltd. | | | 1,459,009 | |
| | 381,000 | | | Bumi Armada Bhd† | | | 459,237 | |
| | 1,500,000 | | | BW Plantation Tbk PT | | | 234,744 | |
| | 40,500 | | | Celltrion, Inc. | | | 1,014,976 | |
| | 650,000 | | | Chaoda Modern Agriculture Holdings, Ltd.†***(b) | | | 57,841 | |
| | 3,000 | | | Cheil Industries, Inc. | | | 272,496 | |
| | 474,000 | | | China Lilang, Ltd. | | | 248,067 | |
| | 120,000 | | | China Shineway Pharmaceutical Group, Ltd. | | | 171,931 | |
| | 217,000 | | | China ZhengTong Auto Services Holdings, Ltd.† | | | 134,942 | |
| | 85,000 | | | CIMB Group Holdings Bhd | | | 208,191 | |
| | 42,000 | | | Citizen Holdings Co., Ltd. | | | 212,318 | |
| | 16,000 | | | Coca-Cola Amatil, Ltd. | | | 224,630 | |
| | 8,500 | | | Coca-Cola West Co., Ltd.(a) | | | 140,954 | |
| | 42,000 | | | Computershare, Ltd. | | | 360,352 | |
| | | | | | | | |
| Shares or Principal Amount | | Value | |
| | | | | | | | |
| | 230,000 | | | CP ALL PCL | | $ | 264,522 | |
| | 65,400 | | | Crown, Ltd.(a) | | | 615,029 | |
| | 195,000 | | | Dah Chong Hong Holdings, Ltd. | | | 176,511 | |
| | 5,200 | | | Don Quijote Co., Ltd.(a) | | | 200,279 | |
| | 3,300 | | | East Japan Railway Co.(a) | | | 218,345 | |
| | 929,000 | | | Ezion Holdings, Ltd. | | | 1,013,886 | |
| | 100,000 | | | Fisher & Paykel Healthcare Corp., Ltd. | | | 190,613 | |
| | 356,000 | | | Guangzhou Automobile Group Co., Ltd., Class H | | | 232,891 | |
| | 19,200 | | | HCL Technologies, Ltd. | | | 209,100 | |
| | 37,000 | | | Hengan International Group Co., Ltd. | | | 347,625 | |
| | 23,800 | | | Hitachi Chemical Co., Ltd.(a) | | | 320,996 | |
| | 26,100 | | | Honda Motor Co., Ltd.(a) | | | 806,629 | |
| | 53,900 | | | Hong Leong Bank Bhd | | | 235,869 | |
| | 8,300 | | | Horiba, Ltd. | | | 244,679 | |
| | 2,790 | | | Hyundai Mobis | | | 775,634 | |
| | 7,500 | | | Hyundai Motor Co. | | | 1,691,677 | |
| | 250,000 | | | Indomobil Sukses Internasional Tbk PT | | | 148,295 | |
| | 174,000 | | | Insurance Australia Group, Ltd. | | | 784,770 | |
| | 25,000 | | | Japan Tobacco, Inc.(a) | | | 748,343 | |
| | 14,000 | | | JSR Corp.(a) | | | 229,114 | |
| | 300 | | | Jupiter Telecommunications Co., Ltd.** | | | 304,459 | |
| | 35,000 | | | Kasikornbank PCL | | | 207,022 | |
| | |
| 12 | | SCHEDULEOF INVESTMENTS |
| | | | | | | | |
| Shares or Principal Amount | | Value | |
| | | | | | | | |
| | 4,000 | | | KDDI Corp.(a) | | $ | 310,250 | |
| | 14,000 | | | Koito Manufacturing Co., Ltd.(a) | | | 161,624 | |
| | 15,300 | | | Konami Corp.(a) | | | 347,402 | |
| | 17,100 | | | Korea Aerospace Industries, Ltd. | | | 427,627 | |
| | 29,200 | | | Korean Reinsurance Co. | | | 309,803 | |
| | 11,000 | | | Kose Corp.(a) | | | 256,247 | |
| | 419,000 | | | Krung Thai Bank PCL | | | 248,482 | |
| | 4,000 | | | KT&G Corp.** | | | 304,834 | |
| | 22,500 | | | Kuraray Co., Ltd.(a) | | | 255,518 | |
| | 11,100 | | | LG Fashion Corp. | | | 308,931 | |
| | 7,730 | | | LS Corp. | | | 669,587 | |
| | 368,000 | | | M1, Ltd. | | | 824,330 | |
| | 45,000 | | | Marubeni Corp.(a) | | | 286,088 | |
| | 65,407 | | | Meritz Fire & Marine Insurance Co., Ltd. | | | 741,022 | |
| | 4,300 | | | Miraca Holdings, Inc.(a) | | | 193,105 | |
| | 80,000 | | | Mitsubishi Gas Chemical Co., Inc.(a) | | | 401,258 | |
| | 17,000 | | | Mitsubishi Tanabe Pharma Corp.(a) | | | 257,998 | |
| | 4,000 | | | Nidec Corp.(a) | | | 292,192 | |
| | 4,600 | | | Nippon Telegraph & Telephone Corp. | | | 218,868 | |
| | 1,950 | | | Nitori Holdings Co., Ltd.(a) | | | 180,987 | |
| | 12,300 | | | Nitto Denko Corp.(a) | | | 585,478 | |
| | 1,000 | | | NongShim Co., Ltd. | | | 238,502 | |
| | 123,000 | | | Olam International, Ltd.(a) | | | 204,039 | |
| | 11,000 | | | Orica, Ltd. | | | 282,876 | |
| | 15,200 | | | Origin Energy, Ltd. | | | 178,099 | |
| | 4,800 | | | Otsuka Corp. | | | 429,256 | |
| | 194,000 | | | Parkson Holdings Bhd | | | 305,411 | |
| | 38,000 | | | PPB Group Bhd | | | 149,770 | |
| | 71,000 | | | Primary Health Care, Ltd.(a) | | | 265,294 | |
| | 192,072 | | | PTT Global Chemical PCL | | | 392,595 | |
| | | | | | | | |
| Shares or Principal Amount | | Value | |
| | | | | | | | |
| | 66,400 | | | PTT PCL | | $ | 708,230 | |
| | 10,600 | | | Rio Tinto, Ltd. | | | 582,228 | |
| | 2,050 | | | S1 Corp. | | | 125,740 | |
| | 42,000 | | | SAI Global, Ltd.(a) | | | 184,116 | |
| | 970 | | | Samsung Electronics Co., Ltd. | | | 1,168,945 | |
| | 32,500 | | | Seek, Ltd. | | | 229,253 | |
| | 10,400 | | | Sega Sammy Holdings, Inc.(a) | | | 196,243 | |
| | 15,600 | | | Seven & I Holdings Co., Ltd. | | | 478,035 | |
| | 400,000 | | | Shenguan Holdings Group, Ltd. | | | 219,601 | |
| | 17,000 | | | Shionogi & Co., Ltd.(a) | | | 259,062 | |
| | 32,000 | | | Siam Cement PLC | | | 361,869 | |
| | 877,000 | | | Sihuan Pharmaceutical Holdings Group, Ltd. | | | 317,183 | |
| | 90,000 | | | Singapore Telecommunications, Ltd. | | | 234,312 | |
| | 4,500 | | | SK C&C Co., Ltd. | | | 402,380 | |
| | 2,100 | | | SK Telecom Co., Ltd. | | | 275,849 | |
| | 6,300 | | | Sohu.com, Inc.†**(a) | | | 265,167 | |
| | 293,000 | | | Sterlite Industries India, Ltd. | | | 551,768 | |
| | 40,000 | | | Sumitomo Rubber Industries, Ltd. | | | 475,701 | |
| | 9,200 | | | Sundrug Co., Ltd.(a) | | | 334,176 | |
| | 61,000 | | | Telstra Corp., Ltd. | | | 247,294 | |
| | 4,400 | | | Terumo Corp.(a) | | | 189,180 | |
| | 85,000 | | | Thai Union Frozen Products PCL | | | 201,969 | |
| | 20,000 | | | Toyo Suisan Kaisha, Ltd.(a) | | | 500,461 | |
| | 25,000 | | | Toyota Motor Corp.(a) | | | 980,232 | |
| | 58,400 | | | Union Bank of India | | | 230,176 | |
| | 143,000 | | | United Phosphorus, Ltd. | | | 354,640 | |
| | 12,400 | | | Wesfarmers, Ltd. | | | 438,864 | |
| | 5,400 | | | Woodside Petroleum, Ltd. | | | 184,726 | |
| | | | |
| SCHEDULEOF INVESTMENTS | | | 13 | |
| | | | | | | | |
| Shares or Principal Amount | | Value | |
| | | | | | | | |
| | 28,600 | | | Yantai Changyu Pioneer Wine Co., Ltd., Class B | | $ | 140,898 | |
| | | | | | | | |
| Total Common Stocks
(Cost $39,487,716) | | | 38,884,687 | |
| | Collateral for Securities on Loan (25.4%) | |
| | 10,027,429 | | | State Street Navigator Prime Portfolio | | | 10,027,429 | |
| | | | | | | | |
| Total Collateral for Securities
on Loan
(Cost $10,027,429) | | | 10,027,429 | |
| | | | | | | | |
| Shares or Principal Amount | | Value | |
| | | | | | | | |
| | Right (0.1%) | |
| | 237,250 | | | Krung Thai Bank PCL, 10/11/12† | | $ | 43,935 | |
| | | | | | | | |
| Total Rights
(Cost $0) | | | 43,935 | |
| Total Investments 123.9%*
(Cost $49,515,145) | | | 48,956,051 | |
| Liabilities Less Other Assets
(23.9)% | | | (9,428,616 | ) |
| | | | | | | | |
| | Net Assets 100.0% | | $ | 39,527,435 | |
| | | | | | | | |
The accompanying notes are an integral part of the financial statements.
| † | Non-income producing security. |
| * | The value of foreign securities fair valued (Note 2) as of September 30, 2012 was 94.50% of net assets. |
| ** | This security is considered a Level 1 security. See Note 2 for further details. |
| *** | This security is considered a Level 3 security. See Note 2 for further details. |
| (a) | All or a portion of the security was on loan as of September 30, 2012. |
| (b) | This security is considered to be illiquid. The value of this security at September 30, 2012 was $57,841, which represents 0.1% of the Fund’s Net Assets. |
| ADR | American Depositary Receipt |
| | |
| 14 | | SCHEDULEOF INVESTMENTS |
| | | | |
MANAGEMENT OVERVIEW ICON EUROPE FUND | | Class S Class C Class A | | ICSEX ICUCX IERAX |
| Q. | How did the Fund perform relative to its benchmark? |
| A. | The ICON Europe Fund, Class S, returned 25.69% for the fiscal year ended September 30, 2012, outperforming the 18.13% return for the MSCI Europe Index. Class A shares of the Fund returned 25.26% (and 18.03% with maximum sales charge) while Class C shares returned 24.46% (and 23.46% with contingent deferred sales charge) for the time period. Total returns for other periods as of September 30, 2012 appear in the subsequent pages of this Fund’s Management Overview. |
| Q. | What primary factors were behind the Fund’s relative performance? |
| A. | As another year has passed, Europe continues to struggle with the challenges of its peripheral member countries. Uncertainty with the future of Greece, Portugal, Italy, and Spain has left market participants hungry for a long term solution, yet policy makers struggle to find common ground on many of the issues at hand. While economic data has deteriorated and growth has slowed and even contracted, equities in the region have been buoyant over the period as central bank intervention provided a stimulus to riskier assets. As fiscal year 2012 comes to a close, tail risks for the region have diminished, yet many of the core concerns over the past two years loom ever present. Although growth has stalled, European companies have remained resilient in the face of macroeconomic adversity. Thus, we see investment opportunities in the region. |
The fiscal year opened with the European region priced at 32% below our calculation of intrinsic value. The region’s equity markets rebounded after coming off strong selling pressure from the prior year as the European Central Bank long-term refinancing operation provided loans to private banks in need of capital injections. These unprecedented actions helped overcome the numerous credit agency downgrades of sovereign debt while pushing equity prices to a peak in March, 2012. In addition, Greece forced a bondholder swap in March to reduce its debt burden, officially causing the event to be classified as a true loan default. Greece’s actions reignited the discussion and possibility of Greece exiting the Eurozone.
By the summer of 2012, most of the European markets had relinquished their gains. Spain saw its bond yields increase and joined the chaos by requesting bailout funds, while traditionally safer regional havens like
Germany actually saw negative interest rates on some of its debt issues. Although the market remained choppy, Mario Draghi, the head of the European Central Bank, declared he would do whatever it took to stabilize the Euro currency in July, setting off a more sustainable rally in equities and risk appetite in general.
As the period ended, a permanent bailout in Europe looked promising after key legal hurdles were passed in Germany. With manufacturing and employment data signaling continued signs of contraction, however, there seemed to be no end to Europe’s economic malaise. In spite of the actions taken by European leaders and in spite of the promises made by the European Central Bank, Europe’s future is still uncertain. Nonetheless, corporate earnings have proven resilient and corporate credit spreads have not had an adverse effect on our view of intrinsic value. We thus ended the fiscal year with stocks still trading at a 21% discount to our estimate of intrinsic value. This valuation suggests bargains can still be found in Europe, despite the worries that exist.
| Q. | How did the Fund’s composition affect performance? |
| A. | Under ICON’s value investing approach, the Fund tilted away from past cyclical leaders and towards the more defensive areas of the market. The Fund’s overweight position in the Health Care sector contributed the most to relative performance as pharmaceuticals and other related industries led the year’s gains. While other defensive areas such as the packaged foods & meats industry benefitted the Fund, tactical moves in cyclical areas such as industrial machinery and diversified chemicals also provided notable relative performance. |
Conversely, the Consumer Staples sector detracted slightly from relative performance, as retail related industries hypermarkets & food centers and food retail struggled against the economic headwinds. Further, the Fund’s position in the oil & gas refining & marketing industry within the Energy sector also hindered returns as stocks within this group failed to participate with the broader benchmark’s advance. As the fiscal year ended, the European markets grew less risk averse and the Fund’s underweight positions in cyclically oriented sectors as well as the often troubled Financials sector have weighed on performance.
Regarding country composition, an overweight in Germany contributed positively to performance. Similarly, the fact that the Fund had no exposure to securities in the embattled countries of Portugal, Ireland, Italy, Greece, and Spain during the period also helped Fund performance. Conversely, the Fund’s underweight holdings in the United Kingdom detracted from relative performance.
Foreign currency exchange rates oscillated over the period. The Euro was generally weaker, while the Pound maintained a somewhat sideways pattern for the year. The Fund was able to mitigate some of the currency risk with hedging activities in the Euro, though these gains were offset with losses from the British Pound. These currency fluctuations had a negligible negative effect on Fund performance for the period.
| Q. | What is your investment outlook for the European equity market? |
| A. | In spite of Europe’s ongoing struggles, our analysis suggests the region could have considerable upside potential in the months ahead. We estimate that, on average, fair value for European equities is 27% higher than where prices are currently trading. While the economic recovery of the past two years is still in place, the pace of global growth has slowed and Europe remains at risk. Still, we believe the region’s defensive, non-cyclical sectors will maintain their leadership over the foreseeable future. This view is supported by our valuation metrics as the Consumer Staples, Health Care, and Telecommunication Services sectors are showing some of the best bargains. These sectors also demonstrate favorable relative strength readings, suggesting they will be part of the leadership going forward. At this point in time, we do not believe the Financials sector offers sufficient upside potential to warrant an increased position in the Fund. Under the ICON methodology, the Financials sector has the least value among all other sectors within the region. |
We believe it is nearly impossible to accurately time market bottoms and we have long preached that rallies do not issue invitations. Using value as a guide in our disciplined, systematic and non-emotional approach to investing, we see opportunities amidst the turbulence and volatility. We continue to work methodically to identify the industries we believe are trading at a discount to fair value and show relative strength in the markets. Our valuations at the end of the fiscal year dictate that we remain nearly fully invested, but we will adjust accordingly as market conditions require.
ICON Europe Fund
Country Composition
September 30, 2012
| | | | |
United Kingdom | | | 28.2% | |
France | | | 17.4% | |
Germany | | | 14.1% | |
Switzerland | | | 13.0% | |
Norway | | | 8.3% | |
Netherlands | | | 5.0% | |
Denmark | | | 2.8% | |
Sweden | | | 2.7% | |
Russia | | | 2.2% | |
Austria | | | 2.1% | |
Finland | | | 1.1% | |
| | | | |
| | | 96.9% | |
| | | | |
Percentages are based upon common and preferred stocks as a percentage of net assets.
ICON Europe Fund
Sector Composition
September 30, 2012
| | | | |
Consumer Staples | | | 21.7% | |
Energy | | | 17.0% | |
Health Care | | | 16.4% | |
Utilities | | | 11.6% | |
Consumer Discretionary | | | 9.8% | |
Materials | | | 8.4% | |
Industrials | | | 7.1% | |
Information Technology | | | 2.8% | |
Financial | | | 2.1% | |
| | | | |
| | | 96.9% | |
| | | | |
Percentages are based upon common and preferred stocks as a percentage of net assets.
ICON Europe Fund
Industry Composition
September 30, 2012
| | | | |
Integrated Oil & Gas | | | 14.4% | |
Pharmaceuticals | | | 12.8% | |
Packaged Foods & Meats | | | 8.7% | |
Integrated Telecommunication Services | | | 7.6% | |
Industrial Gases | | | 4.3% | |
Wireless Telecommunication Services | | | 3.9% | |
Apparel, Accessories & Luxury Goods | | | 3.7% | |
Tires & Rubber | | | 3.6% | |
Brewers | | | 3.5% | |
Household Products | | | 2.9% | |
Application Software | | | 2.8% | |
Aerospace & Defense | | | 2.8% | |
| | | | |
Industrial Conglomerates | | | 2.6% | |
Oil & Gas Equipment & Services | | | 2.6% | |
Personal Products | | | 2.5% | |
Food Retail | | | 2.2% | |
Tobacco | | | 2.0% | |
Diversified Chemicals | | | 1.9% | |
Health Care Equipment | | | 1.9% | |
Life Sciences Tools & Services | | | 1.8% | |
Industrial Machinery | | | 1.7% | |
Multi-line Insurance | | | 1.5% | |
Cable & Satellite | | | 1.1% | |
Other Industries (each less than 1%) | | | 4.1% | |
| | | | |
| | | 96.9% | |
| | | | |
Percentages are based upon common and preferred stocks as a percentage of net assets.
ICON Europe Fund
Average Annual Total Return
as of September 30, 2012
| | | | | | | | | | | | | | | | | | | | | | | | | | | | |
| | | Inception
Date | | | 1 Year | | | 5 Years | | | 10 Years | | | Since
Inception | | | Gross
Expense
Ratio* | | | Net
Expense
Ratio* | |
ICON Europe Fund - Class S | | | 2/20/97 | | | | 25.69% | | | | -8.29% | | | | 8.52% | | | | 5.28% | | | | 1.54% | | | | 1.54% | |
MSCI Europe Index | | | | | | | 18.13% | | | | -5.10% | | | | 9.35% | | | | 5.40% | | | | N/A | | | | N/A | |
ICON Europe Fund - Class C | | | 1/25/08 | | | | 24.46% | | | | N/A | | | | N/A | | | | -6.69% | | | | 19.88% | | | | 2.52% | |
MSCI Europe Index | | | | | | | 18.13% | | | | N/A | | | | N/A | | | | -2.97% | | | | N/A | | | | N/A | |
ICON Europe Fund - Class A | | | 5/31/06 | | | | 25.26% | | | | -8.57% | | | | N/A | | | | -2.66% | | | | 11.29% | | | | 1.80% | |
ICON Europe Fund - Class A (including maximum sales charge of 5.75%) | | | 5/31/06 | | | | 18.03% | | | | -9.65% | | | | N/A | | | | -3.56% | | | | 11.29% | | | | 1.80% | |
MSCI Europe Index | | | | | | | 18.13% | | | | -5.10% | | | | N/A | | | | 0.71% | | | | N/A | | | | N/A | |
Past performance is not a guarantee of future results. Information about these performance results and the comparative indexes can be found in the About This Report section. The Fund’s name and investment strategy changed effective January 29, 2004. The Fund’s past performance would have been different if the current strategy had been in effect. The Adviser has agreed to limit certain expenses on Class C and Class A shares; without these limitations, returns would have been lower. The limitation provisions may be terminated in the future.
| * | Please see the most recent prospectus for details. |
Class C total returns exclude applicable sales charges. If sales charges were included returns would be lower.
ICON Europe Fund
Value of a $10,000 Investment
through September 30, 2012

Past performance is not a guarantee of future results. The above graph compares a $10,000 investment made in the Fund’s Class S shares on the Class’ inception date of 2/20/97 to a $10,000 investment made in an unmanaged securities index on that date. The Fund’s performance in this chart and the performance table assumes the reinvestment of dividends, capital gain distributions and tax return of capital, but does not reflect the deduction of taxes that a shareholder would pay on Fund distributions or on the redemption of Fund shares.
ICON EUROPE FUND
SCHEDULEOF INVESTMENTS
SEPTEMBER 30, 2012
| | | | | | | | |
| Shares or Principal Amount | | Value | |
| | | | | | | | |
| | Common Stocks (95.5%) | |
| | 2,100 | | | Adidas AG | | $ | 172,329 | |
| | 4,840 | | | Air Liquide S.A. | | | 599,923 | |
| | 9,500 | | | Amer Sports OYJ | | | 123,834 | |
| | 28,400 | | | AXA S.A. | | | 422,810 | |
| | 6,500 | | | BASF SE | | | 549,224 | |
| | 3,200 | | | BioMerieux | | | 296,952 | |
| | 94,100 | | | BP PLC | | | 663,393 | |
| | 10,800 | | | British American Tobacco PLC | | | 554,940 | |
| | 25,700 | | | British Sky Broadcasting Group PLC | | | 308,465 | |
| | 7,000 | | | Burberry Group PLC | | | 113,344 | |
| | 3,500 | | | Carlsberg A/S, Class B | | | 310,067 | |
| | 10,834 | | | Cie Generale des Etablissements Michelin, Class B | | | 848,321 | |
| | 3,000 | | | Fugro NV | | | 203,896 | |
| | 7,600 | | | Getinge AB | | | 229,433 | |
| | 31,200 | | | GlaxoSmithKline PLC | | | 720,177 | |
| | 5,800 | | | Heineken NV(a) | | | 345,739 | |
| | 2,000 | | | Hugo Boss AG | | | 176,153 | |
| | 5,700 | | | L’Oreal S.A. | | | 704,754 | |
| | 3,600 | | | Linde AG | | | 620,495 | |
| | 2,800 | | | Lonza Group AG | | | 146,557 | |
| | 10,000 | | | LUKOIL OAO, ADR** | | | 615,400 | |
| | 3,970 | | | LVMH Moet Hennessy Louis Vuitton S.A. | | | 595,969 | |
| | 1,150 | | | Muenchener Rueckversicherungs Gesellschaft AG | | | 179,817 | |
| | 18,200 | | | Nestle S.A. | | | 1,148,372 | |
| | 4,500 | | | Nokian Renkaat OYJ | | | 183,691 | |
| | 18,000 | | | Novartis AG | | | 1,101,662 | |
| | 10,900 | | | OMV AG | | | 381,828 | |
| | 12,200 | | | QIAGEN NV† | | | 224,941 | |
| | 9,800 | | | Reckitt Benckiser Group PLC | | | 564,622 | |
| | | | | | | | |
| Shares or Principal Amount | | Value | |
| | | | | | | | |
| | 12,700 | | | Reed Elsevier PLC | | $ | 121,580 | |
| | 35,100 | | | Rexam PLC | | | 246,967 | |
| | 3,300 | | | Rheinmetall AG | | | 154,133 | |
| | 6,130 | | | Roche Holding AG | | | 1,146,596 | |
| | 38,000 | | | Rolls-Royce Holdings PLC | | | 518,384 | |
| | 9,500 | | | Royal Dutch Shell PLC, Class B | | | 338,065 | |
| | 7,500 | | | SABMiller PLC | | | 330,000 | |
| | 3,300 | | | Sanofi | | | 282,402 | |
| | 11,200 | | | SAP AG | | | 797,029 | |
| | 21,600 | | | SBM Offshore NV† | | | 307,754 | |
| | 2,100 | | | Schoeller-Bleckmann Oilfield Equipment AG | | | 218,206 | |
| | 5,900 | | | Siemens AG | | | 590,121 | |
| | 12,400 | | | Stada Arzneimittel AG | | | 361,229 | |
| | 40,300 | | | Statoil ASA | | | 1,040,005 | |
| | 68,000 | | | TDC AS | | | 496,143 | |
| | 1,800 | | | Tecan Group AG | | | 130,779 | |
| | 21,400 | | | Tele2 AB | | | 388,666 | |
| | 57,400 | | | Telenor ASA | | | 1,120,315 | |
| | 19,300 | | | TeliaSonera AB | | | 138,876 | |
| | 115,100 | | | Tesco PLC | | | 618,088 | |
| | 20,900 | | | Total S.A. | | | 1,039,773 | |
| | 5,200 | | | Ultra Electronics Holdings PLC | | | 129,595 | |
| | 36,400 | | | Unilever PLC | | | 1,329,033 | |
| | 6,800 | | | Victrex PLC | | | 145,513 | |
| | 394,000 | | | Vodafone Group PLC | | | 1,119,602 | |
| | 17,100 | | | Weir Group PLC | | | 489,522 | |
| | 4,000 | | | Yara International ASA | | | 200,854 | |
| | 1,400 | | | Zodiac Aerospace | | | 136,685 | |
| | | | | | | | |
| Total Common Stocks
(Cost $25,236,885) | | | 27,043,023 | |
| | | | |
| SCHEDULEOF INVESTMENTS | | | 21 | |
| | | | | | | | |
| Shares or Principal Amount | | Value | |
| | | | | | | | |
| | Preferred Stocks (1.4%) | |
| | 3,100 | | | Henkel AG & Co. KGaA | | $ | 246,942 | |
| | 2,400 | | | Porsche Automobil Holding SE | | | 143,818 | |
| | | | | | | | |
| Total Preferred Stocks
(Cost $359,433) | | | 390,760 | |
| | Collateral for Securities on Loan (1.2%) | |
| | 343,824 | | | State Street Navigator Prime Portfolio | | | 343,824 | |
| | | | | | | | |
| Total Collateral for Securities
on Loan
(Cost $343,824) | | | 343,824 | |
| | | | | | | | |
| Shares or Principal Amount | | Value | |
| | | | | | | | |
| | Short-Term Investments (3.3%) | |
| $ | 932,551 | | | State Street Euro Dollar Time Deposit (USD), 0.01%, 10/01/12 | | $ | 932,551 | |
| Total Short-Term Investments
(Cost $932,551) | | | 932,551 | |
| | | | | | | | |
| Total Investments 101.4%*
(Cost $26,872,693) | | | 28,710,158 | |
| Liabilities Less Other Assets
(1.4)% | | | (400,851 | ) |
| | | | | | | | |
| | Net Assets 100.0% | | $ | 28,309,307 | |
| | | | | | | | |
The accompanying notes are an integral part of the financial statements.
| † | Non-income producing security. |
| * | The value of foreign securities fair valued (Note 2) as of September 30, 2012 was 94.7% of net assets. |
| ** | This security is considered a Level 1 security. See Note 2 for further details. |
| (a) | All or a portion of the security was on loan as of September 30, 2012. |
| ADR | American Depositary Receipt |
As of September 30, 2012, the Fund had the following forward currency contracts outstanding:
| | | | | | | | | | | | | | | | | | |
| Contracts* | | Currency | | Delivery
Date | | | Original
Contract
Value | | | Market Value | | | Unrealized
Appreciation/
(Depreciation) | |
Contracts to Buy: | | | | | | | | | | | | | | | | | | |
4,200,000 | | Euro | | | 01/02/13 | | | $ | 5,111,064 | | | $ | 5,402,711 | | | $ | 291,647 | |
| | | | | | | | | | | | | | | | | | |
| | | | | | | | $ | 5,111,064 | | | $ | 5,402,711 | | | $ | 291,647 | |
| | | | | | | | | | | | | | | | | | |
| | | | | |
Contracts to Sell: | | | | | | | | | | | | | | | | | | |
(2,500,000) | | British Pound | | | 01/02/13 | | | $ | (3,869,500 | ) | | $ | (4,035,998 | ) | | $ | (166,498 | ) |
(4,200,000) | | Euro | | | 01/02/13 | | | | (5,225,640 | ) | | | (5,402,711 | ) | | | (177,071 | ) |
| | | | | | | | | | | | | | | | | | |
| | | | | | | | $ | (9,095,140 | ) | | $ | (9,438,709 | ) | | $ | (343,569 | ) |
| | | | | | | | | | | | | | | | | | |
The accompanying notes are an integral part of the financial statements.
* Counterparty for all forward foreign currency contracts is State Street Bank.
| | |
| 22 | | SCHEDULEOF INVESTMENTS |
| | | | |
MANAGEMENT OVERVIEW ICON INTERNATIONAL EQUITY FUND | | Class S Class C Class A | | ICNEX IIQCX IIQAX |
| Q. | How did the Fund perform relative to its benchmark? |
| A. | For the fiscal year ended September 30, 2012, the ICON International Equity Fund returned 21.19% for Class S shares, outperforming the 15.04% return of the MSCI All Country World Index (ACWI) ex-U.S., the Fund’s benchmark. Class A shares of the Fund returned 20.61% (and 13.66% with maximum sales charge) during the same period while Class C shares of the Fund returned 19.86% (and 18.86% with contingent deferred sales charge). Total returns for other periods as of September 30, 2012 appear in the subsequent pages of this Fund’s Management Overview. |
| Q. | What primary factors were behind the Fund’s relative performance? |
| A. | While the global stock markets experienced gains, the global economy was fraught with numerous concerns that garnered plenty of media attention. As the European debt crisis continued into fiscal year 2012, the international community found itself in the midst of slower economic growth. Sovereign debt issues took their toll on the economy as a whole. In the Asia-Pacific region, a similar slowdown was best represented by China as economic growth contracted. In response to the weaker data and deteriorating sentiment worldwide, we have witnessed extraordinary central bank action across much of the world in hopes of stimulating economic growth and averting a global recession. The European Central Bank continued its operations to support its struggling peripheral country members, while the Bank of England followed similar steps involving asset purchases and central bank rate reductions. We saw comparable activity in the Asia-Pacific region and in the United States, as the global version of the popular saying “Don’t Fight the Fed” has helped bring forth higher equity prices and lower bond yields over the past year. |
The most significant reallocation in the Fund during the period was a decrease in the economically-sensitive Materials and Industrials sectors and into the more defensive themed Health Care and Consumer Staples sectors. While this rotation was congruent with the events that have transpired from a news headline perspective, it was driven by our discipline and focus on value and ultimately benefitted the Fund over the period.
As a multi-cap manager, the ICON International Equity Fund is not limited by restrictions on market capitalization. However, our valuation metrics resulted in a large-cap company concentration during the period. This
concentration notwithstanding, the Fund remained underweight large-cap stocks relative to the benchmark. The Fund’s large and mid-cap stocks outperformed the Fund’s benchmark while the Fund’s small cap stock selections likewise benefited performance relative to the benchmark.
Currency movements worldwide throughout the fiscal year had a slightly positive effect on returns. The Fund benefitted from a weaker U.S. dollar within the Asia-Pacific and Western Hemisphere regions, while European currencies were a slight detractor. Currency hedging was used in the later part of the period and resulted in a minimal detraction in returns as unrealized losses in the British Pound offset the gains in the Euro.
| Q. | How did the Fund’s composition affect performance? |
| A. | The Fund’s overweight position in the Health Care sector proved to be a beneficial contributor to performance relative to the benchmark. Additionally, the Fund’s overweight position in the oil & gas equipment & services industry within the Energy sector, as well as the pharmaceutical industry, contributed positively to Fund performance throughout the year. |
Conversely, the Materials sector was a detractor to relative performance, as the gold and fertilizers & agricultural chemicals industries saw losses during the fiscal year. Further, the Fund’s position in the apparel accessories & luxury goods industry within the Consumer Discretionary sector also hindered returns as stocks within this group failed to participate with the broader benchmark’s advance. As the fiscal year ended, risk aversion abated slightly throughout the global markets. Consequently, the Fund’s underweight position in the Financials sector and cyclical sectors generally weighed on performance as we saw a leadership shift away from traditionally defensive market areas toward the end of the period.
Emerging markets outperformed over the entire period, though the Fund’s positions in the developed markets proved to be more beneficial to overall performance. As such, countries like Singapore, Germany, and France contributed positively to performance. Additionally, Japan emerged as another developed market laggard, and the Fund’s underweight position in Japan has paid off. Meanwhile, Canada and China were negative contributors, as weakness in the Materials sector weighed on the Fund’s positioning within these countries.
| Q. | What is your investment outlook for the international equity market? |
| A. | We still see opportunity in the worldwide equity markets in spite of the volatility witnessed during the last 12 months. International markets have experienced periods of both turmoil and jubilation over the past three years and the representative companies have adjusted to ever-changing worldwide economic conditions. Interest rates remain low, monetary policy is loose and has become even more accommodative, and corporate earnings and balance sheets have remained resilient despite occasional headwinds. We believe these are all positive signs for stocks going forward, yet risks remain and investor sentiment is fragile. We see bargains in the international equity market and, as of the end of fiscal year 2012, we estimate that fair value for international equities is 20% higher on average than where prices are currently trading. The Western Hemisphere region, where equities are trading with a 28% upside to fair value by our estimate, is showing the best bargains outside of the United States. |
We believe we are still in a recovery from the recession of 2008-2009, although the pace of global growth has slowed. Despite the ever-present worries, stocks have grinded higher and we remain fully invested as stocks show more upside towards our estimation of value. We continue our tilt towards the Consumer Staples, Consumer Discretionary, and Health Care sectors as they show some of the best bargains around the equity markets according to our system. While certain cyclical sectors, including Financials, Industrials, and Materials, have led during the most recent market advances, we feel they aren’t offering adequate upside to allow their leadership to persist. Thus, our preferred positioning focuses more on the Health Care, Consumer Discretionary and Consumer Staples sectors which we feel have potential to outperform the broad market over a longer one to two year time horizon.
In the Asia-Pacific region, countries like Indonesia, Singapore, and Australia remain the most attractive according to our valuation metrics. Within the Western Hemisphere, Canada and Mexico look attractive to our system with the Netherlands and Switzerland currently showing the most value in the European region.
At ICON we continue to seek out industries that our system identifies as trading at a discount to fair value and showing relative strength in the markets. Guided by our disciplined, systematic and non-emotional approach to investing, we see numerous opportunities amidst the recent turbulence and volatility. We believe it is nearly impossible to accurately time market bottoms and we believe rallies do not offer invitations.
Therefore, given our current valuations, we remain almost fully invested. As market conditions dictate, we will adjust accordingly.
ICON International Equity Fund
Country Composition
September 30, 2012
| | | | |
South Korea | | | 19.9% | |
United Kingdom | | | 12.5% | |
France | | | 9.1% | |
Japan | | | 8.9% | |
Switzerland | | | 6.8% | |
Canada | | | 6.1% | |
Germany | | | 4.9% | |
Norway | | | 4.7% | |
Singapore | | | 3.7% | |
China | | | 3.7% | |
South Africa | | | 3.5% | |
Brazil | | | 3.1% | |
Thailand | | | 2.5% | |
Netherlands | | | 2.1% | |
Mexico | | | 1.7% | |
Israel | | | 1.5% | |
Australia | | | 1.2% | |
Indonesia | | | 1.2% | |
Denmark | | | 0.9% | |
Finland | | | 0.5% | |
Sweden | | | 0.5% | |
Taiwan | | | 0.4% | |
Hong Kong | | | 0.2% | |
| | | | |
| | | 99.6% | |
| | | | |
Percentages are based upon common stocks as a percentage of net assets.
ICON International Equity Fund
Sector Composition
September 30, 2012
| | | | |
Consumer Staples | | | 23.8% | |
Consumer Discretionary | | | 21.2% | |
Health Care | | | 14.2% | |
Energy | | | 11.5% | |
Utilities | | | 10.0% | |
Materials | | | 8.5% | |
Information Technology | | | 5.3% | |
Industrials | | | 3.2% | |
Financial | | | 1.9% | |
| | | | |
| | | 99.6% | |
| | | | |
Percentages are based upon common stocks as a percentage of net assets.
ICON International Equity Fund
Industry Composition
September 30, 2012
| | | | |
Pharmaceuticals | | | 12.2% | |
Packaged Foods & Meats | | | 10.8% | |
Integrated Oil & Gas | | | 6.7% | |
Automobile Manufacturers | | | 6.0% | |
Wireless Telecommunication Services | | | 5.4% | |
Apparel, Accessories & Luxury Goods | | | 4.8% | |
Oil & Gas Equipment & Services | | | 4.7% | |
Integrated Telecommunication Services | | | 3.9% | |
Personal Products | | | 3.5% | |
Auto Parts & Equipment | | | 3.2% | |
Tobacco | | | 2.8% | |
Specialty Chemicals | | | 2.5% | |
Industrial Gases | | | 2.3% | |
Food Retail | | | 2.3% | |
Gold | | | 2.1% | |
| | | | |
Tires & Rubber | | | 2.0% | |
Aerospace & Defense | | | 2.0% | |
Semiconductors | | | 1.8% | |
Drug Retail | | | 1.7% | |
Application Software | | | 1.7% | |
Agricultural Products | | | 1.4% | |
Homefurnishing Retail | | | 1.3% | |
Multi-line Insurance | | | 1.3% | |
Industrial Conglomerates | | | 1.2% | |
Electronic Equipment & Instruments | | | 1.2% | |
Department Stores | | | 1.2% | |
Apparel Retail | | | 1.1% | |
Other Industries (each less than 1%) | | | 8.5% | |
| | | | |
| | | 99.6% | |
| | | | |
Percentages are based upon common stocks as a percentage of net assets.
ICON International Equity Fund
Average Annual Total Return
as of September 30, 2012
| | | | | | | | | | | | | | | | | | | | | | | | | | | | |
| | | Inception
Date | | | 1 Year | | | 5 Years | | | 10 Years | | | Since
Inception | | | Gross
Expense
Ratio* | | | Net
Expense
Ratio* | |
ICON International Equity Fund - Class C | | | 2/19/04 | | | | 19.86% | | | | -9.24% | | | | N/A | | | | 2.55% | | | | 2.64% | | | | 2.55% | |
MSCI ACWI ex-U.S. | | | | | | | 15.04% | | | | -3.67% | | | | N/A | | | | 6.10% | | | | N/A | | | | N/A | |
ICON International Equity Fund - Class S | | | 2/18/97 | | | | 21.19% | | | | -8.16% | | | | 10.42% | | | | 5.48% | | | | 1.45% | | | | 1.45% | |
MSCI ACWI ex-U.S. | | | | | | | 15.04% | | | | -3.67% | | | | 10.32% | | | | 4.87% | | | | N/A | | | | N/A | |
ICON International Equity Fund - Class A | | | 5/31/06 | | | | 20.61% | | | | -8.57% | | | | N/A | | | | -1.86% | | | | 2.03% | | | | 1.80% | |
ICON International Equity Fund - Class A (including maximum sales charge of 5.75%) | | | 5/31/06 | | | | 13.66% | | | | -9.65% | | | | N/A | | | | -2.78% | | | | 2.03% | | | | 1.80% | |
MSCI ACWI ex-U.S. | | | | | | | 15.04% | | | | -3.67% | | | | N/A | | | | 1.93% | | | | N/A | | | | N/A | |
Past performance is not a guarantee of future results. Information about these performance results and the comparative indexes can be found in the About This Report section. The Fund’s name and investment strategy changed effective January 29, 2004. The Fund’s past performance would have been different if the current strategy had been in effect. The Adviser has agreed to limit certain Fund expenses; without these limitations, returns would have been lower. The limitation provisions may be terminated in the future.
| * | Please see the most recent prospectus for details. |
Class C total returns exclude applicable sales charges. If sales charges were included returns would be lower.
ICON International Equity Fund
Value of a $10,000 Investment
through September 30, 2012
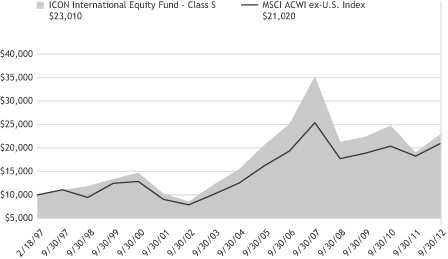
Past performance is not a guarantee of future results. The above graph compares a $10,000 investment made in the Fund’s Class S shares on the Class’ inception date of 2/18/97 to a $10,000 investment made in an unmanaged securities index on that date. Performance for the Fund’s other share classes will vary due to differences in charges and expenses. The Fund’s performance in this chart and the performance table assumes the reinvestment of dividends, capital gain distributions and tax return of capital, but does not reflect the deduction of taxes that a shareholder would pay on Fund distributions or on the redemption of Fund shares.
ICON INTERNATIONAL EQUITY FUND
SCHEDULEOF INVESTMENTS
SEPTEMBER 30, 2012
| | | | | | | | |
| Shares or Principal Amount | | Value | |
| | | | | | | | |
| | Common Stocks (99.6%) | |
| | 6,600 | | | Air Liquide S.A. | | $ | 818,076 | |
| | 931,000 | | | America Movil S.A.B. de C.V., Series L** | | | 1,186,195 | |
| | 81,100 | | | Atrium Innovations, Inc.†** | | | 885,987 | |
| | 59,000 | | | AXA S.A. | | | 878,372 | |
| | 3,400 | | | Baidu, Inc., ADR†** | | | 397,188 | |
| | 23,500 | | | Barrick Gold Corp.**(a) | | | 981,975 | |
| | 6,900 | | | BASF SE | | | 583,023 | |
| | 110,710 | | | BP PLC | | | 780,492 | |
| | 14,500 | | | British American Tobacco PLC | | | 745,059 | |
| | 5,100,000 | | | BW Plantation Tbk PT | | | 798,128 | |
| | 122,450 | | | Celltrion, Inc. | | | 3,068,735 | |
| | 1,702,000 | | | Chaoda Modern Agriculture Holdings, Ltd.†***(b) | | | 151,454 | |
| | 790,000 | | | China Lilang, Ltd. | | | 413,445 | |
| | 13,000 | | | Cia de Saneamento Basico do Estado de Sao Paulo** | | | 532,184 | |
| | 21,000 | | | Cia Hering** | | | 474,747 | |
| | 13,400 | | | Cie Generale des Etablissements Michelin, Class B | | | 1,049,243 | |
| | 76,000 | | | Citizen Holdings Co., Ltd. | | | 384,195 | |
| | 485,000 | | | CP ALL PCL | | | 557,797 | |
| | 380,000 | | | Daphne International Holdings, Ltd. | | | 378,290 | |
| | 72,000 | | | Diagnosticos da America S.A.** | | | 433,296 | |
| | 2,360,000 | | | Ezion Holdings, Ltd.(a) | | | 2,575,642 | |
| | 5,600 | | | Fugro NV | | | 380,605 | |
| | 11,300 | | | Getinge AB | | | 341,131 | |
| | | | | | | | |
| Shares or Principal Amount | | Value | |
| | | | | | | | |
| | 52,800 | | | GlaxoSmithKline PLC | | $ | 1,218,762 | |
| | 34,000 | | | Gourmet Master Co., Ltd. | | | 256,540 | |
| | 59,000 | | | Hengan International Group Co., Ltd. | | | 554,321 | |
| | 45,700 | | | Hitachi Chemical Co., Ltd.(a) | | | 616,367 | |
| | 33,000 | | | Honda Motor Co., Ltd.(a) | | | 1,019,876 | |
| | 15,000 | | | Horiba, Ltd.(a) | | | 442,191 | |
| | 5,800 | | | Hyundai Department Store Co., Ltd. | | | 793,764 | |
| | 4,400 | | | Hyundai Home Shopping Network Corp. | | | 473,557 | |
| | 4,500 | | | Hyundai Mobis | | | 1,251,022 | |
| | 14,000 | | | Hyundai Motor Co. | | | 3,157,797 | |
| | 18,000 | | | Japan Tobacco, Inc.(a) | | | 538,807 | |
| | 48,100 | | | Kinross Gold Corp.** | | | 492,204 | |
| | 10,500 | | | Korea Aerospace Industries, Ltd. | | | 262,578 | |
| | 13,000 | | | Kose Corp.(a) | | | 302,837 | |
| | 8,100 | | | KT&G Corp.** | | | 617,289 | |
| | 5,700 | | | L’Oreal S.A. | | | 704,754 | |
| | 104,000 | | | Lewis Group, Ltd.(a) | | | 893,130 | |
| | 68,000 | | | LG Fashion Corp. | | | 1,892,550 | |
| | 4,600 | | | Linde AG | | | 792,855 | |
| | 6,600 | | | LVMH Moet Hennessy Louis Vuitton S.A. | | | 990,779 | |
| | 7,200 | | | Mando Corp. | | | 993,009 | |
| | 58,000 | | | MTN Group, Ltd. | | | 1,119,697 | |
| | 19,900 | | | Nestle S.A. | | | 1,255,637 | |
| | 8,500 | | | Nokian Renkaat OYJ | | | 346,971 | |
| | 24,700 | | | Novartis AG | | | 1,511,726 | |
| | 8,200 | | | Point, Inc.(a) | | | 295,089 | |
| | 11,000 | | | Potash Corp. of Saskatchewan, Inc.** | | | 478,110 | |
| | 17,000 | | | QIAGEN NV† | | | 313,443 | |
| | 60,000 | | | Raia Drogasil S.A.** | | | 689,308 | |
| | |
| 30 | | SCHEDULEOF INVESTMENTS |
| | | | | | | | |
| Shares or Principal Amount | | Value | |
| | | | | | | | |
| | 8,700 | | | Roche Holding AG | | $ | 1,627,306 | |
| | 55,500 | | | Rolls-Royce Holdings PLC | | | 757,113 | |
| | 21,210 | | | Royal Dutch Shell PLC, Class B | | | 754,774 | |
| | 9,200 | | | SABMiller PLC | | | 404,800 | |
| | 1,050 | | | Samsung Electronics Co., Ltd. | | | 1,265,353 | |
| | 16,400 | | | SAP AG | | | 1,167,079 | |
| | 24,100 | | | Saputo, Inc.**(a) | | | 1,035,729 | |
| | 580,000 | | | Shenguan Holdings Group, Ltd. | | | 318,421 | |
| | 8,300 | | | Siemens AG | | | 830,170 | |
| | 61,300 | | | Statoil ASA | | | 1,581,944 | |
| | 47,700 | | | Suncorp Group, Ltd. | | | 454,984 | |
| | 14,000 | | | Sundrug Co., Ltd.(a) | | | 508,529 | |
| | 86,000 | | | TDC AS | | | 627,475 | |
| | 4,000 | | | Tecan Group AG | | | 290,620 | |
| | 87,500 | | | Telenor ASA | | | 1,707,797 | |
| | 88,000 | | | Telstra Corp., Ltd. | | | 356,751 | |
| | 191,000 | | | Tesco PLC | | | 1,025,672 | |
| | 25,000 | | | Teva Pharmaceutical Industries, Ltd., ADR** | | | 1,035,250 | |
| | 505,000 | | | Thai Union Frozen Products PCL | | | 1,199,936 | |
| | 13,000 | | | Tiger Brands, Ltd. | | | 426,429 | |
| | 39,000 | | | Tokyo Ohka Kogyo Co., Ltd. | | | 835,603 | |
| | 31,155 | | | Total S.A. | | | 1,549,958 | |
| | | | | | | | |
| Shares or Principal Amount | | Value | |
| | | | | | | | |
| | 50,000 | | | Toyo Suisan Kaisha, Ltd.(a) | | $ | 1,251,153 | |
| | 24,400 | | | Trican Well Service, Ltd.** | | | 317,441 | |
| | 54,200 | | | Unilever PLC | | | 1,978,945 | |
| | 13,600 | | | Victrex PLC | | | 291,025 | |
| | 513,000 | | | Vodafone Group PLC | | | 1,457,756 | |
| | 104,000 | | | Yantai Changyu Pioneer Wine Co., Ltd., Class B | | | 512,356 | |
| | 3,500 | | | Zodiac Aerospace | | | 341,712 | |
| | | | | | | | |
| Total Common Stocks
(Cost $68,384,593) | | | 68,982,310 | |
| | Collateral for Securities on Loan (10.6%) | |
| | 7,318,570 | | | State Street Navigator Prime Portfolio | | | 7,318,570 | |
| | | | | | | | |
| Total Collateral for Securities
on Loan
(Cost $7,318,570) | | | 7,318,570 | |
| | Short-Term Investments (0.4%) | |
| $ | 288,036 | | | State Street Euro Dollar Time Deposit (USD), 0.01%, 10/01/12 | | | 288,036 | |
| | | | | | | | |
| Total Short-Term Investments
(Cost $288,036) | | | 288,036 | |
| | | | | | | | |
| Total Investments 110.6%*
(Cost $75,991,199) | | | 76,588,916 | |
| Liabilities Less Other Assets
(10.6)% | | | (7,354,899 | ) |
| | | | | | | | |
| | Net Assets 100.0% | | $ | 69,234,017 | |
| | | | | | | | |
The accompanying notes are an integral part of the financial statements.
| † | Non-income producing security. |
| * | The value of foreign securities fair valued (Note 2) as of September 30, 2012 was 85.83% of net assets. |
| ** | This security is considered a Level 1 security. See Note 2 for further details. |
| *** | This security is considered a Level 3 security. See Note 2 for further details. |
| (a) | All or a portion of the security was on loan as of September 30, 2012. |
| (b) | This security is considered to be illiquid. The value of this security at September 30, 2012 was $151,454, which represents 0.22% of the Fund’s Net Assets. |
| ADR | American Depositary Receipt |
| | | | |
| SCHEDULEOF INVESTMENTS | | | 31 | |
As of September 30, 2012, the Fund had the following forward currency contracts outstanding:
| | | | | | | | | | | | | | | | | | |
| | | Currency | | Delivery
Date | | | Original
Contract
Value | | | Market Value | | | Unrealized
Appreciation/
(Depreciation) | |
Contracts to Buy:
3,900,000 | | Euro | | | 01/02/13 | | | $ | 4,745,988 | | | $ | 5,016,803 | | | $ | 270,815 | |
| | | | | | | | | | | | | | | | | | |
| | | | | | | | $ | 4,745,988 | | | $ | 5,016,803 | | | $ | 270,815 | |
| | | | | | | | | | | | | | | | | | |
Contracts to Sell:
(2,600,000) | | British Pound | | | 01/02/13 | | | $ | (4,024,280 | ) | | $ | (4,197,438 | ) | | $ | (173,158 | ) |
(3,900,000) | | Euro | | | 01/02/13 | | | | (4,852,380 | ) | | | (5,016,803 | ) | | | (164,423 | ) |
| | | | | | | | | | | | | | | | | | |
| | | | | | | | $ | (8,876,660 | ) | | $ | (9,214,241 | ) | | $ | (337,581 | ) |
| | | | | | | | | | | | | | | | | | |
The accompanying notes are an integral part of the financial statements.
* Counterparty for all forward foreign currency contracts is State Street Bank.
| | |
| 32 | | SCHEDULEOF INVESTMENTS |
(This page is intentionally left blank)
STATEMENTSOF ASSETSAND LIABILITIES
SEPTEMBER 30, 2012
| | | | | | | | | | | | |
| | | ICON
Asia-Pacific
Region
Fund | | | ICON
Europe
Fund | | | ICON
International
Equity Fund | |
Assets | | | | | | | | | | | | |
Investments, at cost | | $ | 49,515,145 | | | $ | 26,872,693 | | | $ | 75,991,199 | |
| | | | | | | | | | | | |
Investments, at value† | | | 48,956,051 | | | | 28,710,158 | | | | 76,588,916 | |
Foreign currency, at value(a) | | | 21,446 | | | | 45 | | | | 23,045 | |
Unrealized appreciation on forward foreign currency exchange contracts | | | - | | | | 291,647 | | | | 270,815 | |
Cash | | | 24,340 | | | | - | | | | - | |
Receivables: | | | | | | | | | | | | |
Fund shares sold | | | 18,709 | | | | 16,160 | | | | 13,797 | |
Investments sold | | | 583,149 | | | | – | | | | – | |
Dividends | | | 195,344 | | | | 8,566 | | | | 100,621 | |
Expense reimbursements due from Adviser | | | 22,731 | | | | 20,830 | | | | 8,335 | |
Foreign tax reclaims | | | 365 | | | | 51,718 | | | | 92,996 | |
Other assets | | | 15,053 | | | | 10,719 | | | | 25,544 | |
| | | | | | | | | | | | |
Total Assets | | | 49,837,188 | | | | 29,109,843 | | | | 77,124,069 | |
| | | | | | | | | | | | |
Liabilities | | | | | | | | | | | | |
Unrealized depreciation on forward foreign currency contracts | | | - | | | | 343,569 | | | | 337,581 | |
Payables: | | | | | | | | | | | | |
Due to custodian bank | | | 78,668 | | | | - | | | | - | |
Expense recoupment due to adviser | | | - | | | | - | | | | 675 | |
Payable for collateral received on securities loaned | | | 10,027,429 | | | | 343,824 | | | | 7,318,570 | |
Fund shares redeemed | | | 58,572 | | | | 40,145 | | | | 82,548 | |
Advisory fees | | | 37,669 | | | | 23,418 | | | | 57,218 | |
Accrued distribution fees | | | 878 | | | | 74 | | | | 6,990 | |
Fund accounting fees | | | 1,552 | | | | 941 | | | | 1,672 | |
Transfer agent fees | | | 9,944 | | | | 5,764 | | | | 17,041 | |
Administration fees | | | 1,883 | | | | 1,171 | | | | 2,861 | |
Trustee fees | | | 1,372 | | | | 731 | | | | 2,011 | |
Capital gains tax | | | 42,232 | | | | - | | | | 10,332 | |
Accrued expenses | | | 49,554 | | | | 40,899 | | | | 52,553 | |
| | | | | | | | | | | | |
Total Liabilities | | | 10,309,753 | | | | 800,536 | | | | 7,890,052 | |
| | | | | | | | | | | | |
Net Assets - all share classes | | $ | 39,527,435 | | | $ | 28,309,307 | | | $ | 69,234,017 | |
| | | | | | | | | | | | |
Net Assets - Class S* | | $ | 37,968,714 | | | $ | 28,142,679 | | | $ | 56,152,241 | |
| | | | | | | | | | | | |
Net Assets - Class C | | $ | 868,667 | | | $ | 65,385 | | | $ | 6,773,051 | |
| | | | | | | | | | | | |
Net Assets - Class A | | $ | 690,054 | | | $ | 101,243 | | | $ | 6,308,725 | |
| | | | | | | | | | | | |
| | | | | | | | | | | | |
| | | ICON
Asia-Pacific
Region
Fund | | | ICON
Europe
Fund | | | ICON
International
Equity Fund | |
Net Assets Consist of | | | | | | | | | | | | |
Paid-in capital | | $ | 51,383,554 | | | $ | 80,130,569 | | | $ | 162,284,596 | |
Accumulated undistributed net investment income/(loss) | | | 271,230 | | | | 388,880 | | | | 180,659 | |
Accumulated undistributed net realized gain/(loss) from investments and foreign currency transactions | | | (11,566,436 | ) | | | (53,994,335 | ) | | | (93,752,662 | ) |
Unrealized appreciation/(depreciation) on investments and foreign currency transactions | | | (560,913 | ) | | | 1,784,193 | | | | 521,424 | |
| | | | | | | | | | | | |
Net Assets | | $ | 39,527,435 | | | $ | 28,309,307 | | | $ | 69,234,017 | |
| | | | | | | | | | | | |
Shares outstanding (unlimited shares authorized, no par value) | | | | | | | | | | | | |
Class S* | | | 3,110,785 | | | | 2,218,343 | | | | 5,082,935 | |
Class C | | | 73,392 | | | | 5,245 | | | | 660,236 | |
Class A | | | 56,700 | | | | 7,966 | | | | 573,785 | |
Net asset value (offering and redemption price per share) | | | | | | | | | | | | |
Class S* | | $ | 12.21 | | | $ | 12.69 | | | $ | 11.05 | |
Class C | | $ | 11.84 | | | $ | 12.47 | | | $ | 10.26 | |
Class A | | $ | 12.17 | | | $ | 12.71 | | | $ | 10.99 | |
Class A maximum offering price (100%/(100%-maximum sales charge)) of net asset value adjusted to the nearest cent per share | | $ | 12.91 | | | $ | 13.49 | | | $ | 11.66 | |
| | | |
† Includes securities on loan of | | $ | 9,197,646 | | | $ | 328,452 | | | $ | 6,861,155 | |
| | | |
(a) Foreign currency, at cost | | $ | 21,477 | | | $ | 45 | | | $ | 22,634 | |
| * | Class S shares of the International Equity Fund merged into Class Z shares and were renamed to Class S on January 23, 2012. |
The accompanying notes are an integral part of the financial statements.
STATEMENTSOF OPERATIONS
FORTHEYEARENDED SEPTEMBER 30, 2012
| | | | | | | | | | | | |
| | | ICON
Asia-Pacific
Region Fund | | | ICON
Europe Fund | | | ICON
International
Equity Fund | |
Investment Income | | | | | | | | | | | | |
Interest | | $ | 171 | | | $ | 56 | | | $ | 122 | |
Dividends | | | 1,352,511 | | | | 956,140 | | | | 1,922,994 | |
Income from securities lending, net | | | 10,512 | | | | 38,389 | | | | 67,386 | |
Foreign taxes withheld | | | (71,559 | ) | | | (101,762 | ) | | | (191,747 | ) |
| | | | | | | | | | | | |
Total Investment Income | | | 1,291,635 | | | | 892,823 | | | | 1,798,755 | |
| | | | | | | | | | | | |
Expenses | | | | | | | | | | | | |
Advisory fees | | | 523,714 | | | | 282,160 | | | | 769,608 | |
Distribution fees: | | | | | | | | | | | | |
Class I* | | | – | | | | – | | | | 19,176 | |
Class C | | | 8,916 | | | | 643 | | | | 76,070 | |
Class A | | | 2,357 | | | | 251 | | | | 20,176 | |
Fund accounting fees | | | 10,443 | | | | 5,634 | | | | 15,392 | |
Transfer agent fees | | | 62,735 | | | | 37,462 | | | | 102,673 | |
Administration fees | | | 26,180 | | | | 14,105 | | | | 38,473 | |
Custody fees | | | 48,663 | | | | 12,771 | | | | 53,465 | |
Registration fees: | | | | | | | | | | | | |
Class S (pre-merger)** | | | 21,607 | | | | 18,681 | | | | 3,731 | |
Class I* | | | – | | | | – | | | | 4,304 | |
Class C | | | 10,464 | | | | 10,091 | | | | 10,968 | |
Class S (formerly, Class Z)** | | | – | | | | – | | | | 19,195 | |
Class A | | | 9,180 | | | | 9,865 | | | | 13,786 | |
Insurance expense | | | 9,324 | | | | 5,694 | | | | 13,529 | |
Trustee fees and expenses | | | 5,575 | | | | 2,866 | | | | 8,109 | |
Audit and tax service expense | | | 30,037 | | | | 30,037 | | | | 33,337 | |
Interest expense | | | 1,073 | | | | 567 | | | | 1,171 | |
Recoupment of previously reimbursed expenses | | | – | | | | – | | | | 2,072 | |
Other expenses | | | 48,069 | | | | 33,160 | | | | 52,948 | |
| | | | | | | | | | | | |
Total expenses before expense reimbursement | | | 818,337 | | | | 463,987 | | | | 1,258,183 | |
| | | | | | | | | | | | |
Expense reimbursement by Adviser due to expense limitation agreement | | | (22,319 | ) | | | (23,519 | ) | | | (29,855 | ) |
| | | | | | | | | | | | |
Net Expenses | | | 796,018 | | | | 440,468 | | | | 1,228,328 | |
| | | | | | | | | | | | |
Net Investment Income/(Loss) | | | 495,617 | | | | 452,355 | | | | 570,427 | |
| | | | | | | | | | | | |
Net Realized and Unrealized Gain/(Loss) on Investments, Foreign Currency Transactions and Capital Gains Tax | | | | | | | | | | | | |
Net realized gain/(loss) from investment transactions | | | (821,355 | ) | | | (3,288,964 | ) | | | (12,911,496 | ) |
Net realized gain/(loss) from foreign currency transactions | | | (131,423 | ) | | | (62,156 | ) | | | (283,466 | ) |
Net realized capital gains tax | | | (118,725 | ) | | | – | | | | (84,388 | ) |
Change in unrealized net appreciation/ (depreciation) on investments and foreign currency transactions and capital gains tax | | | 11,219,183 | | | | 9,404,704 | | | | 27,547,163 | |
| | | | | | | | | | | | |
Net realized and unrealized gain/(loss) on investments, foreign currency transactions and capital gains tax | | | 10,147,680 | | | | 6,053,584 | | | | 14,267,813 | |
| | | | | | | | | | | | |
Net Increase/(Decrease) in Net Assets Resulting From Operations | | $ | 10,643,297 | | | $ | 6,505,939 | | | $ | 14,838,240 | |
| | | | | | | | | | | | |
| * | Class I shares of the International Equity Fund merged into Class A shares on January 23, 2012. |
| ** | Class S shares of the International Equity Fund merged into Class Z shares and were renamed to Class S on January 23, 2012. |
The accompanying notes are an integral part of the financial statements.
(This page is intentionally left blank)
STATEMENTSOF CHANGESIN NET ASSETS
| | | | | | | | |
| | | ICON Asia-Pacific Region Fund | |
| | | Year Ended
September 30,
2012 | | | Year Ended
September 30,
2011 | |
Operations | | | | | | | | |
Net investment income/(loss) | | $ | 495,617 | | | $ | 388,046 | |
Net realized gain/(loss) on investment transactions | | | (821,355 | ) | | | 9,874,630 | |
Net realized gain/(loss) from foreign currency transactions | | | (131,423 | ) | | | 287,624 | |
Net realized capital gains tax | | | (118,725 | ) | | | (28,063 | ) |
Change in net unrealized appreciation/(depreciation) on investments and foreign currency transactions | | | 11,219,183 | | | | (23,378,425 | ) |
| | | | | | | | |
Net increase/(decrease) in net assets | | | 10,643,297 | | | | (12,856,188 | ) |
| | | | | | | | |
Dividends to Shareholders | | | | | | | | |
Net investment income | | | | | | | | |
Class S | | | (215,357 | ) | | | - | |
Class C | | | - | | | | - | |
Class A | | | (1,981 | ) | | | - | |
| | | | | | | | |
Net decrease from dividends | | | (217,338 | ) | | | - | |
| | | | | | | | |
Fund Share Transactions | | | | | | | | |
Shares sold | | | | | | | | |
Class S | | | 9,967,625 | | | | 24,830,854 | |
Class C | | | 163,820 | | | | 858,994 | |
Class A | | | 579,330 | | | | 832,245 | |
Reinvested dividends and distributions | | | | | | | | |
Class S | | | 209,005 | | | | - | |
Class C | | | - | | | | - | |
Class A | | | 1,823 | | | | - | |
Shares repurchased | | | | | | | | |
Class S | | | (38,006,696 | ) | | | (27,570,610 | ) |
Class C | | | (237,980 | ) | | | (286,152 | ) |
Class A | | | (773,178 | ) | | | (1,054,975 | ) |
| | | | | | | | |
Net increase/(decrease) from fund share transactions | | | (28,096,251 | ) | | | (2,389,644 | ) |
| | | | | | | | |
Total net increase/(decrease) in net assets | | | (17,670,292 | ) | | | (15,245,832 | ) |
Net Assets | | | | | | | | |
Beginning of year | | | 57,197,727 | | | | 72,443,559 | |
| | | | | | | | |
End of year | | $ | 39,527,435 | | | $ | 57,197,727 | |
| | | | | | | | |
| | | | | | |
| ICON Europe Fund | |
Year Ended
September 30,
2012 | | | Year Ended
September 30,
2011 | |
| | | | | | |
| $ | 452,355 | | | $ | 606,191 | |
| | (3,288,964 | ) | | | 4,703,346 | |
| (62,156 | ) | | | (367,632 | ) |
| | - | | | | - | |
|
9,404,704 |
| | | (11,104,476 | ) |
| | | | | | |
| | 6,505,939 | | | | (6,162,571 | ) |
| | | | | | |
| | | | | | |
| | | | | | |
| | (459,020 | ) | | | (453,210 | ) |
| | (307 | ) | | | (410 | ) |
| | (1,339 | ) | | | (1,567 | ) |
| | | | | | |
| | (460,666 | ) | | | (455,187 | ) |
| | | | | | |
| | | | | | |
| | | | | | |
| | 4,094,825 | | | | 7,568,313 | |
| | 3,972 | | | | 5,475 | |
| | 11,420 | | | | 10,420 | |
| | | | | | |
| | 445,476 | | | | 440,889 | |
| | 307 | | | | 410 | |
| | 1,289 | | | | 1,511 | |
| | | | | | |
| | (10,502,617 | ) | | | (21,885,777 | ) |
| | (11,100 | ) | | | (2,563 | ) |
| | (38,697 | ) | | | (30,619 | ) |
| | | | | | |
| | (5,995,125 | ) | | | (13,891,941 | ) |
| | | | | | |
| | 50,148 | | | | (20,509,699 | ) |
| | | | | | |
| | 28,259,159 | | | | 48,768,858 | |
| | | | | | |
| $ | 28,309,307 | | | $ | 28,259,159 | |
| | | | | | |
STATEMENTSOF CHANGESIN NET ASSETS (CONTINUED)
| | | | | | | | |
| | | ICON Asia-Pacific Region Fund | |
| | | Year Ended
September 30,
2012 | | | Year Ended
September 30,
2011 | |
Transactions in Fund Shares | | | | | | | | |
Shares sold | | | | | | | | |
Class S | | | 855,247 | | | | 1,912,320 | |
Class C | | | 14,331 | | | | 66,475 | |
Class A | | | 49,003 | | | | 64,370 | |
Reinvested dividends and distributions | | | | | | | | |
Class S | | | 20,116 | | | | - | |
Class C | | | - | | | | - | |
Class A | | | 176 | | | | - | |
Shares repurchased | | | | | | | | |
Class S | | | (3,259,837 | ) | | | (2,154,565 | ) |
Class C | | | (21,117 | ) | | | (22,566 | ) |
Class A | | | (68,515 | ) | | | (81,339 | ) |
| | | | | | | | |
Net increase/(decrease) | | | (2,410,596 | ) | | | (215,305 | ) |
| | | | | | | | |
Shares outstanding, beginning of year | | | 5,651,473 | | | | 5,866,778 | |
| | | | | | | | |
Shares outstanding, end of year | | | 3,240,877 | | | | 5,651,473 | |
| | | | | | | | |
Accumulated undistributed net investment income/(loss) | | $ | 271,230 | | | $ | 217,349 | |
| | | | | | | | |
The accompanying notes are an integral part of the financial statements.
| | | | | | |
| ICON Europe Fund | |
Year Ended
September 30,
2012 | | | Year Ended
September 30,
2011 | |
| | | | | | |
| | | | | | |
| | 349,507 | | | | 540,432 | |
| | 335 | | | | 402 | |
| | 993 | | | | 765 | |
| | | | | | |
| | 42,386 | | | | 32,418 | |
| | 29 | | | | 31 | |
| | 122 | | | | 111 | |
| | | | | | |
| | (908,119 | ) | | | (1,585,829 | ) |
| | (964 | ) | | | (183 | ) |
| | (3,370 | ) | | | (2,203 | ) |
| | | | | | |
| | (519,081 | ) | | | (1,014,056 | ) |
| | | | | | |
| | 2,750,635 | | | | 3,764,691 | |
| | | | | | |
| | 2,231,554 | | | | 2,750,635 | |
| | | | | | |
$ |
388,880 |
| | $ | 459,347 | |
| | | | | | |
STATEMENTSOF CHANGESIN NET ASSETS
| | | | | | | | |
| | | ICON International Equity Fund | |
| | | Year Ended
September 30,
2012 | | | Year Ended
September 30,
2011 | |
Operations | | | | | | | | |
Net investment income/(loss) | | $ | 570,427 | | | $ | 932,766 | |
Net realized gain/(loss) on investment transactions | | | (12,911,496 | ) | | | 11,896,021 | |
Net realized gain/(loss) from foreign currency transactions | | | (283,466 | ) | | | 58,537 | |
Net realized capital gains tax | | | (84,388 | ) | | | (33,954 | ) |
Change in net unrealized appreciation/(depreciation) on investments and foreign currency transactions | | | 27,547,163 | | | | (37,453,624 | ) |
| | | | | | | | |
Net increase/(decrease) in net assets | | | 14,838,240 | | | | (24,600,254 | ) |
| | | | | | | | |
Dividends to Shareholders | | | | | | | | |
Net investment income | | | | | | | | |
Class S (pre-merger)* | | | (446,175 | ) | | | (209,215 | ) |
Class I** | | | (153,050 | ) | | | (118,029 | ) |
Class S (formerly, Class Z) | | | (74,205 | ) | | | (82,032 | ) |
Class A | | | (13,281 | ) | | | (20,141 | ) |
Class Q*** | | | - | | | | (52,806 | ) |
| | | | | | | | |
Net decrease from dividends | | | (686,711 | ) | | | (482,223 | ) |
| | | | | | | | |
Fund Share Transactions | | | | | | | | |
Shares sold | | | | | | | | |
Class S (pre-merger)* | | | 1,305,260 | | | | 28,322,716 | |
Class I** | | | 1,041,882 | | | | 13,088,283 | |
Class C | | | 130,023 | | | | 918,923 | |
Class S (formerly, Class Z)**** | | | 60,203,967 | | | | 2,581,160 | |
Class A**** | | | 14,985,718 | | | | 1,383,795 | |
Class Q*** | | | - | | | | 23,892 | |
Reinvested dividends and distributions | | | | | | | | |
Class S (pre-merger)* | | | 445,550 | | | | 204,055 | |
Class I** | | | 134,039 | | | | 101,764 | |
Class S (formerly, Class Z) | | | 69,998 | | | | 79,707 | |
Class A | | | 9,439 | | | | 17,213 | |
Class Q*** | | | - | | | | 52,676 | |
Shares repurchased | | | | | | | | |
Class S (pre-merger)* | | | (42,941,189 | ) | | | (11,610,081 | ) |
Class I** | | | (29,247,969 | ) | | | (17,474,596 | ) |
Class C | | | (2,837,159 | ) | | | (4,428,987 | ) |
Class S (formerly, Class Z) | | | (15,236,665 | ) | | | (6,802,428 | ) |
Class A | | | (11,907,130 | ) | | | (3,354,216 | ) |
Class Q*** | | | - | | | | (9,287,654 | ) |
| | | | | | | | |
Net increase/(decrease) from fund share transactions | | | (23,844,236 | ) | | | (6,183,778 | ) |
| | | | | | | | |
Total net increase/(decrease) in net assets | | | (9,692,707 | ) | | | (31,266,255 | ) |
Net Assets | | | | | | | | |
Beginning of year | | | 78,926,724 | | | | 110,192,979 | |
| | | | | | | | |
End of year | | $ | 69,234,017 | | | $ | 78,926,724 | |
| | | | | | | | |
| | | | | | | | |
| | | ICON International Equity Fund | |
| | | Year Ended
September 30,
2012 | | | Year Ended
September 30,
2011 | |
Transactions in Fund Shares | | | | | | | | |
Shares sold | | | | | | | | |
Class S (pre-merger)* | | | 125,902 | | | | 2,179,451 | |
Class I** | | | 102,639 | | | | 1,070,213 | |
Class C | | | 13,510 | | | | 77,449 | |
Class S (formerly, Class Z)**** | | | 5,783,166 | | | | 206,375 | |
Class A**** | | | 1,436,432 | | | | 109,312 | |
Class Q*** | | | - | | | | 1,884 | |
Reinvested dividends and distributions | | | | | | | | |
Class S (pre-merger)* | | | 45,933 | | | | 16,118 | |
Class I** | | | 14,139 | | | | 8,240 | |
Class S (formerly, Class Z) | | | 7,307 | | | | 6,377 | |
Class A | | | 986 | | | | 1,382 | |
Class Q*** | | | - | | | | 4,218 | |
Shares repurchased | | | | | | | | |
Class S (pre-merger)* | | | (4,078,066 | ) | | | (933,083 | ) |
Class I** | | | (2,858,784 | ) | | | (1,434,870 | ) |
Class C | | | (293,417 | ) | | | (375,566 | ) |
Class S (formerly, Class Z) | | | (1,447,812 | ) | | | (529,937 | ) |
Class A | | | (1,151,832 | ) | | | (267,603 | ) |
Class Q*** | | | - | | | | (718,870 | ) |
| | | | | | | | |
Net increase/(decrease) | | | (2,299,897 | ) | | | (578,910 | ) |
| | | | | | | | |
Shares outstanding, beginning of year | | | 8,616,853 | | | | 9,195,763 | |
| | | | | | | | |
Shares outstanding, end of year | | | 6,316,956 | | | | 8,616,853 | |
| | | | | | | | |
Accumulated undistributed net investment income/(loss) | | $ | 180,659 | | | $ | 560,902 | |
| | | | | | | | |
| * | Class S shares of the International Equity Fund merged into Class Z shares and were renamed to Class S on January 23, 2012. The information presented is that before and including the merger. |
| ** | Class I shares of the International Equity Fund merged into Class A shares on January 23, 2012. The information presented is that before and including the merger. |
| *** | Class Q shares of the International Equity Fund closed on April 12, 2011. |
| **** | The information presented includes the January 23, 2012 merger activity. |
The accompanying notes are an integral part of the financial statements.
FINANCIAL HIGHLIGHTS
| | | | | | | | | | | | | | | | | | | | | | | | |
| | | | | | Income/(loss) from investment operations | | | Less dividends and | |
| | | Net asset
value,
beginning
of period | | | Net
investment
income/
(loss)(x) | | | Net realized
and unrealized
gains/(losses)
on investments | | | Total from
investment
operations | | | Dividends
from net
investment
income | | | Distributions
from net
realized
gains | |
ICON Asia-Pacific Region Fund | | | | | | | | | | | | | | | | | | | | | | | | |
Class S | | | | | | | | | | | | | | | | | | | | | | | | |
Year ended September 30, 2012 | | $ | 10.12 | | | $ | 0.11 | | | $ | 2.02 | | | $ | 2.13 | | | $ | (0.04 | ) | | $ | – | |
Year ended September 30, 2011 | | | 12.35 | | | | 0.07 | | | | (2.30 | ) | | | (2.23 | ) | | | – | | | | – | |
Year ended September 30, 2010 | | | 10.64 | | | | 0.01 | | | | 1.89 | | | | 1.90 | | | | (0.19 | ) | | | – | |
Year ended September 30, 2009 | | | 9.47 | | | | 0.08 | | | | 1.20 | | | | 1.28 | | | | (0.11 | ) | | | – | |
Year ended September 30, 2008 | | | 18.82 | | | | 0.10 | | | | (6.99 | ) | | | (6.89 | ) | | | (0.12 | ) | | | (2.34 | ) |
Class C | | | | | | | | | | | | | | | | | | | | | | | | |
Year ended September 30, 2012 | | | 9.88 | | | | 0.01 | | | | 1.95 | | | | 1.96 | | | | – | | | | – | |
Year ended September 30, 2011 | | | 12.17 | | | | (0.02 | ) | | | (2.27 | ) | | | (2.29 | ) | | | – | | | | – | |
Year ended September 30, 2010 | | | 10.54 | | | | (0.05 | ) | | | 1.82 | | | | 1.77 | | | | (0.14 | ) | | | – | |
Year ended September 30, 2009 | | | 9.41 | | | | 0.02 | | | | 1.18 | | | | 1.20 | | | | (0.07 | ) | | | – | |
January 25, 2008 (inception) to September 30, 2008 | | | 13.73 | | | | 0.05 | | | | (4.37 | ) | | | (4.32 | ) | | | – | | | | – | |
Class A | | | | | | | | | | | | | | | | | | | | | | | | |
Year ended September 30, 2012 | | | 10.10 | | | | 0.09 | | | | 2.00 | | | | 2.09 | | | | (0.02 | ) | | | – | |
Year ended September 30, 2011 | | | 12.35 | | | | 0.04 | | | | (2.29 | ) | | | (2.25 | ) | | | – | | | | – | |
Year ended September 30, 2010 | | | 10.63 | | | | 0.02 | | | | 1.86 | | | | 1.88 | | | | (0.16 | ) | | | – | |
Year ended September 30, 2009 | | | 9.38 | | | | 0.05 | | | | 1.25 | | | | 1.30 | | | | (0.05 | ) | | | – | |
Year ended September 30, 2008 | | | 18.72 | | | | 0.03 | | | | (6.93 | ) | | | (6.90 | ) | | | (0.10 | ) | | | (2.34 | ) |
ICON Europe Fund | | | | | | | | | | | | | | | | | | | | | | | | |
Class S | | | | | | | | | | | | | | | | | | | | | | | | |
Year ended September 30, 2012 | | | 10.27 | | | | 0.19 | | | | 2.41 | | | | 2.60 | | | | (0.18 | ) | | | – | |
Year ended September 30, 2011 | | | 12.95 | | | | 0.19 | | | | (2.73 | ) | | | (2.54 | ) | | | (0.14 | ) | | | – | |
Year ended September 30, 2010 | | | 12.28 | | | | 0.18 | | | | 0.60 | | | | 0.78 | | | | (0.11 | ) | | | – | |
Year ended September 30, 2009 | | | 13.23 | | | | 0.15 | | | | (0.79 | ) | | | (0.64 | ) | | | (0.31 | ) | | | – | |
Year ended September 30, 2008 | | | 24.04 | | | | 0.36 | | | | (8.21 | ) | | | (7.85 | ) | | | (0.21 | ) | | | (2.75 | ) |
Class C | | | | | | | | | | | | | | | | | | | | | | | | |
Year ended September 30, 2012 | | | 10.07 | | | | 0.07 | | | | 2.38 | | | | 2.45 | | | | (0.05 | ) | | | – | |
Year ended September 30, 2011 | | | 12.77 | | | | 0.07 | | | | (2.70 | ) | | | (2.63 | ) | | | (0.07 | ) | | | – | |
Year ended September 30, 2010 | | | 12.15 | | | | 0.09 | | | | 0.56 | | | | 0.65 | | | | (0.03 | ) | | | – | |
Year ended September 30, 2009 | | | 13.12 | | | | 0.07 | | | | (0.80 | ) | | | (0.73 | ) | | | (0.24 | ) | | | – | |
January 25, 2008 (inception) to September 30, 2008 | | | 17.91 | | | | 0.07 | | | | (4.86 | ) | | | (4.79 | ) | | | – | | | | – | |
Class A | | | | | | | | | | | | | | | | | | | | | | | | |
Year ended September 30, 2012 | | | 10.28 | | | | 0.15 | | | | 2.42 | | | | 2.57 | | | | (0.14 | ) | | | – | |
Year ended September 30, 2011 | | | 12.98 | | | | 0.18 | | | | (2.75 | ) | | | (2.57 | ) | | | (0.13 | ) | | | – | |
Year ended September 30, 2010 | | | 12.30 | | | | 0.15 | | | | 0.60 | | | | 0.75 | | | | (0.07 | ) | | | – | |
Year ended September 30, 2009 | | | 13.14 | | | | 0.12 | | | | (0.75 | ) | | | (0.63 | ) | | | (0.21 | ) | | | – | |
Year ended September 30, 2008 | | | 23.91 | | | | 0.26 | | | | (8.17 | ) | | | (7.91 | ) | | | (0.11 | ) | | | (2.75 | ) |
| | | | | | | | | | | | | | | | | | | | | | | | | | | | | | | | | | |
| distributions | | | | | | | | | | | | Ratio of expenses
to average net assets(a) | | | Ratio of net investment
income/(loss)
to average net assets(a) | | | | |
Total
dividends
and
distributions | | | Net asset
value, end
of period | | | Total
return* | | | Net assets,
end of
period (in
thousands) | | | Before
expense
limitation/
and transfer
agent
earnings
credit | | | After
expense
limitation/
and transfer
agent
earnings
credit | | | Before
expense
limitation/
and transfer
agent
earnings
credit | | | After
expense
limitation/
and transfer
agent
earnings
credit | | | Portfolio
turnover
rate(b) | |
| | | | | | | | | | | | | | | | | | | | | | | | | | | | | | | | | | |
| | | | | | | | | | | | | | | | | | | | | | | | | | | | | | | | | | |
| $ | (0.04 | ) | | $ | 12.21 | | | | 21.16 | % | | $ | 37,969 | | | | 1.50 | % | | | 1.50 | % | | | 0.96 | % | | | 0.96 | % | | | 71.84 | % |
| | – | | | | 10.12 | | | | (18.06 | )% | | | 55,637 | | | | 1.59 | % | | | 1.59 | % | | | 0.55 | % | | | 0.55 | % | | | 71.03 | % |
| | (0.19 | ) | | | 12.35 | | | | 18.02 | % | | | 70,854 | | | | 1.63 | % | | | 1.63 | % | | | 0.13 | % | | | 0.13 | % | | | 100.41 | % |
| | (0.11 | ) | | | 10.64 | | | | 14.18 | % | | | 108,325 | | | | 1.54 | % | | | 1.54 | % | | | 1.00 | % | | | 1.00 | % | | | 171.05 | % |
| | (2.46 | ) | | | 9.47 | | | | (41.26 | )% | | | 69,519 | | | | 1.42 | % | | | 1.42 | % | | | 0.70 | % | | | 0.70 | % | | | 168.42 | % |
| | | | | | | | | | | | | | | | | | | | | | | | | | | | | | | | | | |
| | – | | | | 11.84 | | | | 19.84 | % | | | 869 | | | | 3.91 | % | | | 2.55 | %(c) | | | (1.28 | )% | | | 0.08 | % | | | 71.84 | % |
| | – | | | | 9.88 | | | | (18.82 | )% | | | 792 | | | | 4.40 | % | | | 2.55 | %(c) | | | (2.02 | )% | | | (0.17 | )% | | | 71.03 | % |
| | (0.14 | ) | | | 12.17 | | | | 17.02 | % | | | 441 | | | | 9.04 | % | | | 2.57 | %(c) | | | (6.91 | )% | | | (0.44 | )% | | | 100.41 | % |
| | (0.07 | ) | | | 10.54 | | | | 13.10 | % | | | 260 | | | | 19.80 | % | | | 2.55 | %(c) | | | (17.06 | )% | | | 0.19 | % | | | 171.05 | % |
|
– |
| | | 9.41 | | | | (31.46 | )% | | | 33 | | | | 23.58 | % | | | 2.64 | %(c) | | | (20.28 | )% | | | 0.66 | % | | | 168.42 | % |
| | | | | | | | | | | | | | | | | | | | | | | | | | | | | | | | | | |
| | (0.02 | ) | | | 12.17 | | | | 20.73 | % | | | 690 | | | | 2.88 | % | | | 1.80 | %(c) | | | (0.31 | )% | | | 0.77 | % | | | 71.84 | % |
| | – | | | | 10.10 | | | | (18.22 | )% | | | 768 | | | | 3.05 | % | | | 1.81 | %(c) | | | (0.97 | )% | | | 0.27 | % | | | 71.03 | % |
| | (0.16 | ) | | | 12.35 | | | | 17.91 | % | | | 1,149 | | | | 5.17 | % | | | 1.82 | %(c) | | | (3.13 | )% | | | 0.22 | % | | | 100.41 | % |
| | (0.05 | ) | | | 10.63 | | | | 14.11 | % | | | 543 | | | | 5.89 | % | | | 1.82 | %(c) | | | (3.41 | )% | | | 0.66 | % | | | 171.05 | % |
| | (2.44 | ) | | | 9.38 | | | | (41.53 | )% | | | 412 | | | | 2.94 | % | | | 1.88 | %(c) | | | (0.82 | )% | | | 0.24 | % | | | 168.42 | % |
| | | | | | | | | | | | | | | | | | | | | | | | | | | | | | | | | | |
| | | | | | | | | | | | | | | | | | | | | | | | | | | | | | | | | | |
| | (0.18 | ) | | | 12.69 | | | | 25.69 | % | | | 28,143 | | | | 1.56 | % | | | 1.56 | % | | | 1.61 | % | | | 1.61 | % | | | 89.78 | % |
| | (0.14 | ) | | | 10.27 | | | | (19.90 | )% | | | 28,095 | | | | 1.54 | % | | | 1.54 | % | | | 1.40 | % | | | 1.40 | % | | | 51.94 | % |
| | (0.11 | ) | | | 12.95 | | | | 6.40 | % | | | 48,547 | | | | 1.58 | % | | | 1.58 | % | | | 1.48 | % | | | 1.48 | % | | | 105.08 | % |
| | (0.31 | ) | | | 12.28 | | | | (4.13 | )% | | | 56,681 | | | | 1.57 | % | | | 1.57 | % | | | 1.52 | % | | | 1.52 | % | | | 129.97 | % |
| | (2.96 | ) | | | 13.23 | | | | (36.83 | )% | | | 84,320 | | | | 1.35 | % | | | 1.35 | % | | | 1.89 | % | | | 1.89 | % | | | 181.83 | % |
| | | | | | | | | | | | | | | | | | | | | | | | | | | | | | | | | | |
| | (0.05 | ) | | | 12.47 | | | | 24.46 | % | | | 65 | | | | 21.20 | % | | | 2.55 | %(c) | | | (18.00 | )% | | | 0.65 | % | | | 89.78 | % |
| | (0.07 | ) | | | 10.07 | | | | (20.73 | )% | | | 59 | | | | 19.88 | % | | | 2.52 | %(c) | | | (16.84 | )% | | | 0.52 | % | | | 51.94 | % |
| | (0.03 | ) | | | 12.77 | | | | 5.37 | % | | | 71 | | | | 40.14 | % | | | 2.55 | %(c) | | | (36.86 | )% | | | 0.73 | % | | | 105.08 | % |
| | (0.24 | ) | | | 12.15 | | | | (5.04 | )% | | | 22 | | | | 75.12 | % | | | 2.57 | %(c) | | | (71.83 | )% | | | 0.72 | % | | | 129.97 | % |
|
– |
| | | 13.12 | | | | (26.74 | )% | | | 16 | | | | 51.24 | % | | | 2.58 | %(c) | | | (48.03 | )% | | | 0.63 | % | | | 181.83 | % |
| | | | | | | | | | | | | | | | | | | | | | | | | | | | | | | | | | |
| | (0.14 | ) | | | 12.71 | | | | 25.26 | % | | | 101 | | | | 13.30 | % | | | 1.80 | %(c) | | | (10.23 | )% | | | 1.27 | % | | | 89.78 | % |
| | (0.13 | ) | | | 10.28 | | | | (20.04 | )% | | | 105 | | | | 11.29 | % | | | 1.80 | %(c) | | | (8.20 | )% | | | 1.29 | % | | | 51.94 | % |
| | (0.07 | ) | | | 12.98 | | | | 6.16 | % | | | 150 | | | | 17.22 | % | | | 1.80 | %(c) | | | (14.22 | )% | | | 1.21 | % | | | 105.08 | % |
| | (0.21 | ) | | | 12.30 | | | | (4.32 | )% | | | 159 | | | | 11.15 | % | | | 1.82 | %(c) | | | (8.08 | )% | | | 1.25 | % | | | 129.97 | % |
| | (2.86 | ) | | | 13.14 | | | | (37.17 | )% | | | 370 | | | | 4.36 | % | | | 1.83 | %(c) | | | (1.18 | )% | | | 1.35 | % | | | 181.83 | % |
FINANCIAL HIGHLIGHTS (CONTINUED)
| | | | | | | | | | | | | | | | | | | | | | | | |
| | | | | | Income (loss) from investment operations | | | Less dividends and | |
| | | Net asset
value,
beginning
of period | | | Net
investment
income/
(loss)(x) | | | Net realized
and unrealized
gains/(losses)
on investments | | | Total from
investment
operations | | | Dividends
from net
investment
income | | | Distributions
from net
realized
gains | |
ICON International Equity Fund | | | | | | | | | | | | | | | | | | | | | | | | |
Class S** | | | | | | | | | | | | | | | | | | | | | | | | |
Year ended September 30, 2012 | | $ | 9.22 | | | $ | 0.16 | | | $ | 1.78 | | | $ | 1.94 | | | $ | (0.11 | ) | | $ | – | |
Year ended September 30, 2011 | | | 12.11 | | | | 0.14 | | | | (2.95 | ) | | | (2.81 | ) | | | (0.08 | ) | | | – | |
Year ended September 30, 2010 | | | 11.13 | | | | 0.13 | | | | 1.06 | | | | 1.19 | | | | (0.21 | ) | | | – | |
Year ended September 30, 2009 | | | 10.87 | | | | 0.11 | | | | 0.35 | | | | 0.46 | | | | (0.20 | ) | | | – | |
Year ended September 30, 2008 | | | 20.34 | | | | 0.22 | | | | (7.53 | ) | | | (7.31 | ) | | | (0.17 | ) | | | (1.99 | ) |
Class C | | | | | | | | | | | | | | | | | | | | | | | | |
Year ended September 30, 2012 | | | 8.56 | | | | (0.02 | ) | | | 1.72 | | | | 1.70 | | | | – | | | | – | |
Year ended September 30, 2011 | | | 11.30 | | | | – | (d) | | | (2.74 | ) | | | (2.74 | ) | | | – | | | | – | |
Year ended September 30, 2010 | | | 10.40 | | | | (0.01 | ) | | | 1.01 | | | | 1.00 | | | | (0.10 | ) | | | – | |
Year ended September 30, 2009 | | | 10.10 | | | | – | (d) | | | 0.36 | | | | 0.36 | | | | (0.06 | ) | | | – | |
Year ended September 30, 2008 | | | 19.09 | | | | 0.07 | | | | (7.07 | ) | | | (7.00 | ) | | | – | (d) | | | (1.99 | ) |
Class A*** | | | | | | | | | | | | | | | | | | | | | | | | |
Year ended September 30, 2012 | | | 9.16 | | | | 0.11 | | | | 1.77 | | | | 1.88 | | | | (0.05 | ) | | | – | |
Year ended September 30, 2011 | | | 12.04 | | | | 0.10 | | | | (2.94 | ) | | | (2.84 | ) | | | (0.04 | ) | | | – | |
Year ended September 30, 2010 | | | 11.07 | | | | 0.08 | | | | 1.06 | | | | 1.14 | | | | (0.17 | ) | | | – | |
Year ended September 30, 2009 | | | 10.78 | | | | 0.06 | | | | 0.37 | | | | 0.43 | | | | (0.14 | ) | | | – | |
Year ended September 30, 2008 | | | 20.24 | | | | 0.18 | | | | (7.52 | ) | | | (7.34 | ) | | | (0.13 | ) | | | (1.99 | ) |
| (x) | Calculated using the average shares method. | |
| * | The total return calculation is for the period indicated and excludes any sales charges. | |
| ** | Class S shares of the International Equity Fund merged into Class Z shares and were renamed to Class S on January 23, 2012. The results of each class prior to the merger may have been different than what is presented. | |
| *** | Class I shares merged into Class A on January 23, 2012. The results of Class I prior to the merger may have been different than what is presented. | |
| (a) | Annualized for periods less than a year. | |
| (b) | Portfolio turnover is calculated at the Fund level and is not annualized for periods less than a year. | |
| (c) | The Fund’s operating expenses, not including interest expense, are contractually limited to the amounts discussed in Note 3. The ratios in these financial highlights reflect the limitation, including interest expense. | |
| (d) | Amount less than $0.005. | |
| (e) | The ratio of expenses to average net assets after the contractual expense limitation and voluntary expense waiver and transfer agent earnings credit is 1.25%, 2.52% and 1.76% for Class S, Class C and Class A, respectively. | |
| (f) | The ratio of net investment income/(loss) to average net assets after the contractual expense limitation and voluntary expense waiver and transfer agent earnings credit is 1.25%, (0.01%) and 0.74% for Class S, Class C and Class A, respectively. | |
The accompanying notes are an integral part of the financial statements.
| | | | | | | | | | | | | | | | | | | | | | | | | | | | | | | | | | |
| distributions | | | | | | | | | | | | Ratio of expenses
to average net assets(a) | | | Ratio of net investment
income/(loss)
to average net assets(a) | | | | |
Total
dividends
and
distributions | | | Net asset
value, end
of period | | | Total
return* | | | Net assets,
end of
period (in
thousands) | | | Before
expense
limitation/
and transfer
agent
earnings
credit | | | After
expense
limitation/
and transfer
agent
earnings
credit | | | Before
expense
limitation/
and transfer
agent
earnings
credit | | | After
expense
limitation/
and transfer
agent
earnings
credit | | | Portfolio
turnover
rate(b) | |
| | | | | | | | | | | | | | | | | | | | | | | | | | | | | | | | | | |
| | | | | | | | | | | | | | | | | | | | | | | | | | | | | | | | | | |
| $ | (0.11 | ) | | $ | 11.05 | | | | 21.19 | % | | $ | 56,152 | | | | 1.39 | % | | | 1.39 | % | | | 1.47 | % | | | 1.47 | % | | | 121.82 | % |
| | (0.08 | ) | | | 9.22 | | | | (23.38 | )% | | | 6,826 | | | | 1.45 | % | | | 1.45 | % | | | 1.12 | % | | | 1.12 | % | | | 91.46 | % |
| | (0.21 | ) | | | 12.11 | | | | 10.87 | % | | | 12,806 | | | | 1.43 | % | | | 1.36 | % | | | 1.06 | % | | | 1.12 | % | | | 111.29 | % |
| | (0.20 | ) | | | 11.13 | | | | 5.16 | % | | | 29,437 | | | | 1.43 | % | | | 1.25 | %(e) | | | 1.07 | % | | | 1.25 | %(f) | | | 182.73 | % |
| | (2.16 | ) | | | 10.87 | | | | (39.66 | )% | | | 13,580 | | | | 1.27 | % | | | 1.27 | % | | | 1.31 | % | | | 1.31 | % | | | 188.73 | % |
| | | | | | | | | | | | | | | | | | | | | | | | | | | | | | | | | | |
| | – | | | | 10.26 | | | | 19.86 | % | | | 6,773 | | | | 2.72 | % | | | 2.55 | % | | | (0.41 | )% | | | (0.24 | )% | | | 121.82 | % |
| | – | | | | 8.56 | | | | (24.25 | )% | | | 8,050 | | | | 2.64 | % | | | 2.55 | % | | | (0.11 | )% | | | (0.02 | )% | | | 91.46 | % |
| | (0.10 | ) | | | 11.30 | | | | 9.65 | % | | | 13,990 | | | | 2.69 | % | | | 2.55 | % | | | (0.21 | )% | | | (0.07 | )% | | | 111.29 | % |
| | (0.06 | ) | | | 10.40 | | | | 3.79 | % | | | 15,774 | | | | 2.64 | % | | | 2.55 | %(e) | | | (0.13 | )% | | | (0.04 | )%(f) | | | 182.73 | % |
| | (1.99 | ) | | | 10.10 | | | | (40.38 | )% | | | 22,194 | | | | 2.44 | % | | | 2.44 | % | | | 0.47 | % | | | 0.47 | % | | | 188.73 | % |
| | | | | | | | | | | | | | | | | | | | | | | | | | | | | | | | | | |
| | (0.05 | ) | | | 10.99 | | | | 20.61 | % | | | 6,309 | | | | 2.01 | % | | | 1.80 | % | | | 0.85 | % | | | 1.06 | % | | | 121.82 | % |
| | (0.04 | ) | | | 9.16 | | | | (23.65 | )% | | | 2,640 | | | | 2.03 | % | | | 1.80 | % | | | 0.56 | % | | | 0.79 | % | | | 91.46 | % |
| | (0.17 | ) | | | 12.04 | | | | 10.38 | % | | | 5,358 | | | | 2.16 | % | | | 1.80 | % | | | 0.33 | % | | | 0.68 | % | | | 111.29 | % |
| | (0.14 | ) | | | 11.07 | | | | 4.65 | % | | | 5,214 | | | | 2.08 | % | | | 1.80 | %(e) | | | 0.42 | % | | | 0.70 | %(f) | | | 182.73 | % |
| | (2.12 | ) | | | 10.78 | | | | (39.95 | )% | | | 7,001 | | | | 1.73 | % | | | 1.73 | % | | | 1.17 | % | | | 1.17 | % | | | 188.73 | % |
NOTESTO FINANCIAL STATEMENTS
SEPTEMBER 30, 2012
1. Organization
The ICON Asia-Pacific Region Fund (“Asia-Pacific Region Fund”), ICON Europe Fund (“Europe Fund”) and ICON International Equity Fund (“International Equity Fund”) are series funds (individually a “Fund” and collectively, the “Funds”). The Funds are part of the ICON Funds (the “Trust”), a Massachusetts business trust registered under the Investment Company Act of 1940, as amended (the “1940 Act”) as an open-end investment management company. Each fund has three classes of shares: Class S, Class C and Class A. Prior to January 23, 2012, the International Equity Fund had five share classes: Class S, Class I, Class C, Class Z and Class A. On January 23, 2012, the following changes took place in the International Equity Fund: Class I merged into Class A, Class S merged into Class Z and Class Z was renamed to Class S. All classes have equal rights as to earnings, assets and voting privileges except that each Class may bear different distribution fees, registration costs, legal costs, mailing and printing costs and shareholder servicing costs and each Class has exclusive voting rights with respect to its distribution plan. There are currently fifteen other active Funds within the Trust. Those Funds are covered by separate prospectuses and shareholder reports.
Each Fund is authorized to issue an unlimited number of no par shares. The Funds primarily invest in foreign securities; the Asia-Pacific Region Fund and the Europe Fund primarily invest in companies whose principal business activities fall within specific regions. The investment objective of each Fund is to provide long-term capital appreciation.
The Funds may have elements of risk, including the risk of loss of principal. There is no assurance that the investment process will consistently lead to successful results. An investment concentrated in sectors and industries may involve greater risk and volatility than a more diversified investment. Investments in foreign securities and currency transactions may involve certain considerations and risks not typically associated with those of U.S. dollar-denominated transactions as a result of, among other factors, the possibility of lower government supervision and regulation of foreign securities markets and the possibility of political or economic instability. Financial statements of foreign companies are governed by different accounting, auditing, and financial standards than U.S. companies and may be less transparent and uniform than in the United States. Many corporate governance standards, which help ensure the integrity of public information in the United States, may not exist in some foreign countries. In general,
| | |
| 48 | | NOTESTO FINANCIAL STATEMENTS |
there may be less governmental supervision of foreign stock exchanges and securities brokers and issuers. There are also risks associated with small-and mid-cap investing, including limited product lines, less liquidity, and small market share.
The Asia-Pacific Region Fund has a significant weighting in Japan and the Europe Fund has a significant weighting in the United Kingdom which may cause each Fund’s performance to be susceptible to the economic, business and/or other developments that may affect that country.
In the normal course of business, the Funds may enter into various agreements that provide for general indemnifications. Each Fund’s maximum exposure under these arrangements is unknown as any potential exposure involving future claims that may be made against each Fund is unknown. However, based on experience, the Funds expect the risk of loss to be minimal.
2. Significant Accounting Policies
The following is a summary of significant accounting policies consistently followed by the Funds in the preparation of their financial statements. The preparation of financial statements in conformity with accounting principles generally accepted in the United States of America requires management to make certain estimates and assumptions that affect the reported amounts of assets and liabilities, disclosure of contingent assets and liabilities at the date of the financial statements, and the reported amounts of income and expenses during the reporting period. Actual results may differ from these estimates.
Investment Valuation
The Funds’ securities and other assets, excluding options on securities indexes, are valued as of the closing price at the close of regular trading on the New York Stock Exchange (the “NYSE”) (normally 4 p.m. Eastern Standard Time) each day the NYSE is open, except that securities traded primarily on the NASDAQ Stock Market (“NASDAQ”) are normally valued by the Funds at the NASDAQ Official Closing Price provided by NASDAQ each business day. Options on securities indexes are valued at the close of the Chicago Board Options Exchange (normally 4:15 p.m. Eastern Standard Time) on each day the New York Stock Exchange is open for trading.
The Funds use pricing services to obtain the market value of securities in their portfolios; if a pricing service is not able to provide a price, or the
| | | | |
| NOTESTO FINANCIAL STATEMENTS | | | 49 | |
NOTESTO FINANCIAL STATEMENTS (CONTINUED)
pricing service’s valuation quote is considered inaccurate or does not reflect the market value of the security, prices may be obtained through market quotations from independent broker/dealers. If market quotations from these sources are not readily available, the Funds’ securities or other assets are valued at fair value as determined in good faith by the Funds’ Board of Trustees (“Board”) or pursuant to procedures approved by the Board.
Lacking any sales that day, a security is valued at the current closing bid price (or yield equivalent thereof) or based on quotes obtained from dealers making a market for the security. Options are valued at their closing mid-price on the market with the most volume. Mid-price is the average of the closing bid and closing ask prices. Debt securities with a remaining maturity of greater than 60 days are valued in accordance with the evaluated bid price supplied by the pricing service. The evaluated bid price supplied by the pricing service is based upon a matrix valuation system which considers such factors as security prices, yields, maturities and ratings. Short-term debt securities with remaining maturities of 60 days or less are generally valued at amortized cost or original cost plus accrued interest, which approximates market value. Currency rates as of the close of the NYSE are used to convert foreign security values into U.S. dollars.
The Funds’ securities traded in countries outside of the Western Hemisphere are fair valued daily by utilizing the quotations of an independent pricing service, unless the Board determines that use of another valuation methodology is appropriate. The purposes of daily fair valuation are to avoid stale prices and to take into account, among other things, any significant events occurring after the close of foreign markets. The pricing service uses statistical analyses and quantitative models to adjust local market prices using factors such as subsequent movements and changes in the prices of indexes, securities and exchange rates in other markets to determine fair value as of the time a Fund calculates its net asset value (“NAV”). The valuation assigned to fair-value securities for purposes of calculating a Fund’s NAV may differ from the security’s most recent closing market price and from the prices used by other mutual funds to calculate their NAVs.
Investments in other open-end investment companies are valued at net asset value.
Various inputs are used to determine the value of the Funds’ investments. These inputs are summarized in the three broad levels listed below:
Level 1 — quoted prices in active markets for identical securities.
| | |
| 50 | | NOTESTO FINANCIAL STATEMENTS |
Level 2 — significant observable inputs other than Level 1 quoted prices (including, but not limited to, quoted prices for similar securities, interest rates, prepayment speeds, and credit risk).
Level 3 — significant unobservable inputs.
Observable inputs are those based on market data obtained from sources independent of the Funds, and unobservable inputs reflect the Funds’ own assumptions based on the best information available. The input levels are not necessarily an indication of the risk or liquidity associated with investments at that level. For example, non-U.S. equity securities actively traded in foreign markets generally are reflected in Level 2 despite the availability of closing prices, because the Funds evaluate and determine whether those closing prices reflect fair value at the close of the NYSE or require adjustment, as described above. The following table summarizes the Funds’ investments, based on the inputs used to determine their values on September 30, 2012:
| | | | | | | | | | | | | | | | |
| | | Level 1 | | | Level 2 | | | Level 3 | | | Total | |
ICON Asia-Pacific Region Fund* | | | | | | | | | | | | | | | | |
Assets | | | | | | | | | | | | | | | | |
Common Stocks | | | | | | | | | | | | | | | | |
Japan | | $ | 304,459 | | | $ | 11,286,301 | | | $ | - | | | $ | 11,590,760 | |
South Korea | | | 304,834 | | | | 8,423,169 | | | | - | | | | 8,728,003 | |
Australia | | | - | | | | 6,431,347 | | | | - | | | | 6,431,347 | |
China | | | 919,359 | | | | 2,277,403 | | | | - | | | | 3,196,762 | |
Thailand | | | - | | | | 2,384,689 | | | | - | | | | 2,384,689 | |
Singapore | | | - | | | | 2,276,567 | | | | - | | | | 2,276,567 | |
Other Countries | | | - | | | | 4,218,718 | | | | 57,841 | | | | 4,276,559 | |
Collateral for Securities on Loan | | | - | | | | 10,027,429 | | | | - | | | | 10,027,429 | |
Rights | | | - | | | | 43,935 | | | | - | | | | 43,935 | |
| | | | | | | | | | | | | | | | |
Total | | $ | 1,528,652 | | | $ | 47,369,558 | | | $ | 57,841 | | | $ | 48,956,051 | |
| | | | | | | | | | | | | | | | |
| | | | |
| NOTESTO FINANCIAL STATEMENTS | | | 51 | |
NOTESTO FINANCIAL STATEMENTS (CONTINUED)
| | | | | | | | | | | | | | | | |
| | | Level 1 | | | Level 2 | | | Level 3 | | | Total | |
ICON Europe Fund* | | | | | | | | | | | | | | | | |
Assets | | | | | | | | | | | | | | | | |
Common Stocks | | | | | | | | | | | | | | | | |
United Kingdom | | $ | - | | | $ | 7,973,225 | | | $ | - | | | $ | 7,973,225 | |
France | | | - | | | | 4,927,589 | | | | - | | | | 4,927,589 | |
Switzerland | | | - | | | | 3,673,966 | | | | - | | | | 3,673,966 | |
Germany | | | - | | | | 3,600,530 | | | | - | | | | 3,600,530 | |
Norway | | | - | | | | 2,361,174 | | | | - | | | | 2,361,174 | |
Netherlands | | | - | | | | 1,420,395 | | | | - | | | | 1,420,395 | |
Other Countries | | | 615,400 | | | | 2,470,744 | | | | - | | | | 3,086,144 | |
Preferred Stock | | | | | | | | | | | | | | | | |
Germany | | | - | | | | 390,760 | | | | - | | | | 390,760 | |
Collateral for Securities on Loan | | | - | | | | 343,824 | | | | - | | | | 343,824 | |
Short-Term Investments | | | - | | | | 932,551 | | | | - | | | | 932,551 | |
Forward Foreign Currency Contract | | | - | | | | 291,647 | | | | - | | | | 291,647 | |
| | | | | | | | | | | | | | | | |
Total | | $ | 615,400 | | | $ | 28,386,405 | | | $ | - | | | $ | 29,001,805 | |
| | | | | | | | | | | | | | | | |
Liabilities | | | | | | | | | | | | | | | | |
Forward Foreign Currency Contracts | | $ | - | | | $ | (343,569 | ) | | $ | - | | | $ | (343,569 | ) |
| | | | | | | | | | | | | | | | |
Total | | $ | - | | | $ | (343,569 | ) | | $ | - | | | $ | (343,569 | ) |
| | | | | | | | | | | | | | | | |
ICON International Equity Fund* | | | | | | | | | | | | | | | | |
Assets | | | | | | | | | | | | | | | | |
Common Stocks | | | | | | | | | | | | | | | | |
South Korea | | $ | 617,289 | | | $ | 13,158,365 | | | $ | - | | | $ | 13,775,654 | |
United Kingdom | | | - | | | | 8,659,624 | | | | - | | | | 8,659,624 | |
France | | | - | | | | 6,332,894 | | | | - | | | | 6,332,894 | |
Japan | | | | | | | 6,194,647 | | | | - | | | | 6,194,647 | |
Switzerland | | | - | | | | 4,685,289 | | | | - | | | | 4,685,289 | |
Canada | | | 4,191,446 | | | | - | | | | - | | | | 4,191,446 | |
Other Countries | | | 4,748,168 | | | | 20,243,134 | | | | 151,454 | | | | 25,142,756 | |
Collateral for Securities on Loan | | | - | | | | 7,318,570 | | | | - | | | | 7,318,570 | |
Short-Term Investments | | | - | | | | 288,036 | | | | - | | | | 288,036 | |
Forward Foreign Currency Contracts | | | - | | | | 270,815 | | | | - | | | | 270,815 | |
| | | | | | | | | | | | | | | | |
Total | | $ | 9,556,903 | | | $ | 67,151,374 | | | $ | 151,454 | | | $ | 76,859,731 | |
| | | | | | | | | | | | | | | | |
Liabilities | | | | | | | | | | | | | | | | |
Forward Foreign Currency Contracts | | $ | - | | | $ | (337,581 | ) | | $ | - | | | $ | (337,581 | ) |
| | | | | | | | | | | | | | | | |
Total | | $ | - | | | $ | (337,581 | ) | | $ | - | | | $ | (337,581 | ) |
| | | | | | | | | | | | | | | | |
| * | Please refer to the Schedule of Investments and the Sector/Industry Classification and Country Composition tables for additional security details. |
| | |
| 52 | | NOTESTO FINANCIAL STATEMENTS |
For the year ended September 30, 2012, there was no transfer activity between Level 1 and Level 2. The end of period timing recognition is used for the transfers between levels of the Fund’s assets and liabilities.
A roll forward of fair value measurements using significant unobservable inputs (Level 3) for the year ended September 30, 2012 for the Asia-Pacific Region Fund and the International Equity Fund, was as follows:
| | | | |
| | | Common Stocks
Hong Kong | |
ICON Asia-Pacific Region Fund | | | | |
Beginning balance 9/30/11 | | $ | 91,815 | |
Purchases | | | - | |
Sales | | | - | |
Accrued discounts/(premiums) | | | - | |
Total realized gains/(losses) | | | - | |
Total change in unrealized appreciation/(depreciation) | | | (33,974 | ) |
Transfers in to Level 3 | | | - | |
Transfers out of Level 3 | | | - | |
| | | | |
Ending balance 9/30/12 | | $ | 57,841 | |
| | | | |
Net change in unrealized appreciation/(depreciation) on investments held at 9/30/12 | | $ | (33,974 | ) |
| | | | |
ICON International Equity Fund | | | | |
Beginning balance 9/30/11 | | $ | 240,414 | |
Purchases | | | - | |
Sales | | | - | |
Accrued discounts/(premiums) | | | - | |
Total realized gains/(losses) | | | - | |
Total change in unrealized appreciation/(depreciation) | | | (88,960 | ) |
Transfers in to Level 3 | | | - | |
Transfers out of Level 3 | | | - | |
| | | | |
Ending balance 9/30/12 | | $ | 151,454 | |
| | | | |
Net change in unrealized appreciation/(depreciation) on investments held at 9/30/12 | | $ | (88,960 | ) |
| | | | |
Net realized gain/(loss) and net change in unrealized appreciation/depreciation is reflected on the Statement of Operations.
Foreign Currency Translation
The accounting records of the Funds are maintained in U.S. dollars. Investment securities and other assets and liabilities denominated in a
| | | | |
| NOTESTO FINANCIAL STATEMENTS | | | 53 | |
NOTESTO FINANCIAL STATEMENTS (CONTINUED)
foreign currency are translated daily into U.S. dollars at the prevailing rates of exchange. Income and expenses are translated into U.S. dollars at the prevailing exchange rate on the respective dates of the transactions. Purchases and sales of securities are translated into U.S. dollars at the contractual currency exchange rates established at the time of each trade.
The Funds do not isolate that portion of the results of operations resulting from changes in foreign exchange rates on investments from the fluctuations arising from changes in market prices of securities held. Net unrealized appreciation or depreciation on investments and foreign currency translations arise from changes in the value of assets and liabilities, resulting from changes in the exchange rates and changes in market prices of securities held.
Forward Foreign Currency Contracts
The Funds may enter into short-term forward foreign currency contracts. A forward foreign currency contract is an agreement between contracting parties to exchange an amount of currency at some future time at an agreed upon rate. The Funds may use forward foreign currency contracts to manage foreign currency exposure with respect to transactional hedging, positional hedging, cross hedging and proxy hedging.
These contracts involve market risk and do not eliminate fluctuations in the prices of portfolio securities or prevent losses if the prices of those securities decline. The Funds could be exposed to risk if the value of the currency changes unfavorably. Additionally, the Funds could be exposed to counterparty risk if the counterparties are unable to meet the terms of the contracts.
These contracts are marked-to-market daily. Net realized gains and losses on foreign currency transactions represent disposition of foreign currencies, and the difference between the amount recorded at the time of the transaction and the U.S. dollar amount actually received. Any realized gain or loss incurred by the Funds due to foreign currency translation is included on the Statement of Operations. At September 30, 2012, the Europe Fund and International Equity Fund had outstanding forward foreign currency contracts and are included on each Fund’s Schedule of Investments.
| | |
| 54 | | NOTESTO FINANCIAL STATEMENTS |
The following is a summary of how these derivatives are treated in the financial statements and their impact on the Funds:
Amount of Realized Gain or (Loss) on Derivatives Recognized in Operations
| | | | | | |
Derivatives not accounted for as hedging
instruments | | Location of Gain/(loss)
on Derivatives
Recognized in Operations | | Amount | |
Forward foreign currency contracts | | | | | | |
Foreign exchange risk | | | | | | |
ICON Europe Fund | | Net realized gain/(loss) from | | $ | - | |
ICON International Equity Fund | | foreign currency transactions | | | (2,405 | ) |
Change in Unrealized Appreciation/(Depreciation) on Derivatives Recognized in Operations
| | | | | | |
Derivatives not accounted for as hedging
instruments | | Location of Gain/(loss)
on Derivatives
Recognized in Operations | | Amount | |
Forward foreign currency contracts | | | | | | |
Foreign exchange risk | | | | | | |
ICON Europe Fund | | Change in unrealized net | | $ | (51,922 | ) |
ICON International Equity Fund | | appreciation/(depreciation) on | | | (66,766 | ) |
| | foreign currency transactions | | | | |
The number of forward foreign currency contracts open during the year ended September 30, 2012 for the Europe Fund and International Equity Fund were 3 and 5, respectively.
The Funds value derivatives at fair value, as described above, and recognize changes in fair value currently in the results of operations. Accordingly, the Funds do not follow hedge accounting even for derivatives employed as economic hedges.
Securities Lending
Under procedures adopted by the Board, the Funds may lend securities to non-affiliated qualified parties. The Funds seek to earn additional income through securities lending. There is the risk of delay in recovering a loaned security. The Funds do not have the right to vote on securities while they are on loan; however, the Funds may attempt to call back the loan and vote the proxy.
| | | | |
| NOTESTO FINANCIAL STATEMENTS | | | 55 | |
NOTESTO FINANCIAL STATEMENTS (CONTINUED)
All loans will be continuously secured by collateral which consists of cash. The cash collateral is invested in the State Street Navigator Prime Portfolio and is disclosed on the Schedule of Investments. The lending fees received and the Funds’ portion of the interest income earned on cash collateral are included on the Statement of Operations, if applicable.
As of September 30, 2012, the following Funds had securities with the following values on loan:
| | | | | | | | |
| Fund | | Value of
Loaned Securities | | | Value of
Collateral | |
ICON Asia-Pacific Region Fund | | $ | 9,197,646 | | | $ | 10,027,429 | |
ICON Europe Fund | | | 328,452 | | | | 343,824 | |
ICON International Equity Fund | | | 6,861,155 | | | | 7,318,570 | |
The value of the collateral above could include collateral held for securities that were sold on or before September 30, 2012. It may also include collateral received from the pre-funding of loans.
Income Taxes
The Funds intend to qualify as regulated investment companies under Subchapter M of the Internal Revenue Code and, accordingly, the Funds will generally not be subject to federal and state income taxes or federal excise taxes to the extent that they intend to make sufficient distributions of net investment income and net realized capital gains.
Dividends paid by the Funds from net investment income and distributions of net realized short-term gains are, for federal income tax purposes, taxable as ordinary income to shareholders.
Dividends and distributions to shareholders are recorded by the Funds on the ex-dividend/distribution date. The Funds distribute income and net realized capital gains, if any, to shareholders at least annually, if not offset by capital loss carryforward. The Funds may utilize equalization accounting for tax purposes and designate earnings and profits, including net realized gains distributed to shareholders on redemption of shares, as part of the dividends paid deduction for income tax purposes. Income distributions and capital gain distributions are determined in accordance with income tax regulations, which may differ from accounting principles generally accepted in the United States of America.
Management has analyzed the Funds’ tax positions taken on federal income tax returns for all open tax years and has concluded that no provision for federal income tax is required in the Funds’ financial statements.
| | |
| 56 | | NOTESTO FINANCIAL STATEMENTS |
The Funds file U.S. tax returns. While the statute of limitations remains open to examine the Funds’ U.S. tax returns filed for the past four years, no examinations are in progress or anticipated at this time. The Funds are not aware of any tax positions for which it is reasonably possible that the total amounts of unrecognized tax benefits will significantly change in the next twelve months.
Certain foreign countries impose a capital gains tax which is accrued by the Funds based on the unrealized appreciation, if any, on affected securities. Any accrual would reduce a Fund’s NAV. The tax is paid when the gain is realized.
Investment Income
Dividend income is recorded on the ex-dividend date. Non-cash dividends included in dividend income, if any, are recorded at the fair value of the securities received. Interest income is accrued as earned. Certain dividends from foreign securities are recorded as soon as the Funds are informed of the dividend if such information is obtained subsequent to the ex-dividend date. Discounts and premiums on securities purchased are amortized over the life of the respective securities.
Investment Transactions
Security transactions are accounted for no later than one business day after the trade date. However, for financial reporting purposes, security transactions are accounted for on the trade date. Gains and losses on securities sold are determined on the basis of identified cost.
Allocation of Expenses
Each class of a Fund’s shares bears expenses incurred specifically on its behalf and, in addition, each class bears a portion of general expenses, based upon relative net assets of each class. Expenses which cannot be directly attributed to a specific Fund in the Trust are apportioned between all Funds in the Trust based upon relative net assets. In calculating the net asset value per share of each class, investment income, realized and unrealized gains and losses and expenses other than class-specific expenses are allocated daily to each class of shares based upon the proportion of net assets.
| | | | |
| NOTESTO FINANCIAL STATEMENTS | | | 57 | |
NOTESTO FINANCIAL STATEMENTS (CONTINUED)
Below are the class level expenses that are included on the Statement of Operations:
| | | | | | | | | | | | |
| Fund | | Legal
Expense | | | Printing
and Postage
Expense | | | Transfer
Agent
Expense | |
ICON Asia-Pacific Region Fund | | | | | | | | | | | | |
Class S | | $ | 6,092 | | | $ | 18,250 | | | $ | 56,668 | |
Class C | | | 102 | | | | 534 | | | | 3,386 | |
Class A | | | 115 | | | | 606 | | | | 2,681 | |
ICON Europe Fund | | | | | | | | | | | | |
Class S | | | 3,661 | | | | 13,846 | | | | 34,115 | |
Class C | | | 9 | | | | 374 | | | | 1,676 | |
Class A | | | 12 | | | | 225 | | | | 1,671 | |
ICON International Equity Fund | | | | | | | | | | | | |
Class S (pre-merger) | | | 2,178 | | | | 3,130 | | | | 7,778 | |
Class I** | | | 1,375 | | | | 2,781 | | | | 11,970 | |
Class C | | | 874 | | | | 3,115 | | | | 20,696 | |
Class S (formerly, Class Z)* | | | 3,467 | | | | 7,476 | | | | 38,493 | |
Class A | | | 867 | | | | 3,333 | | | | 23,736 | |
| * | Class S shares of the International Equity Fund merged into Class Z shares and were renamed Class S on January 23, 2012. The information presented is that of Class S (pre-merger) before the merger. |
| ** | Class I shares of the International Equity Fund were merged into Class A shares on January 23, 2012. The information presented is that before the merger. |
3. Fees and Other Transactions with Affiliates
Investment Advisory Fees
ICON Advisers, Inc. (“ICON Advisers”) serves as investment adviser to the Funds and is responsible for managing the Funds’ portfolios of securities. ICON Advisers receives a monthly management fee that is computed daily at an annual rate of 1.00% of each Fund’s average daily net assets.
ICON Advisers has contractually agreed to limit the Funds’ operating expenses (exclusive of brokerage, interest, taxes, and extraordinary expenses) to the extent necessary to ensure that the Funds’ expenses do not exceed the following amounts:
| | | | | | | | | | | | |
| Fund | | Class S | | | Class C | | | Class A | |
ICON Asia-Pacific Region Fund | | | - | | | | 2.55% | | | | 1.80% | |
ICON Europe Fund | | | - | | | | 2.55% | | | | 1.80% | |
ICON International Equity Fund | | | 1.55% | | | | 2.55% | | | | 1.80% | |
| | |
| 58 | | NOTESTO FINANCIAL STATEMENTS |
The Funds’ expense limitations will continue in effect until at least January 31, 2021. To the extent ICON Advisers reimburses or absorbs fees and expenses, it may seek payment of such amounts for up to three years after the expenses were reimbursed or absorbed. A Fund will make no such payment, however, if the total Fund operating expenses exceed the expense limits in effect at the time the expenses were reimbursed or at the time these payments are proposed.
As of September 30, 2012 the following amounts were still available for recoupment by ICON Advisers based upon their potential expiration dates:
| | | | | | | | | | | | |
| Fund | | 2013 | | | 2014 | | | 2015 | |
ICON Asia-Pacific Region Fund | | $ | 47,207 | | | $ | 31,078 | | | $ | 22,319 | |
ICON Europe Fund | | | 42,776 | | | | 29,163 | | | | 23,519 | |
ICON International Equity Fund | | | 20,212 | | | | 11,377 | | | | 25,950 | |
Accounting, Custody and Transfer Agent Fees
State Street Bank and Trust Company (“State Street”) serves as the fund accounting agent for the Funds. For its services, the Trust pays State Street a fee that is calculated daily and paid monthly at an annual rate based on the aggregate average daily net assets of the Trust.
State Street is the custodian of the Trust’s investments. For its services, the Trust pays State Street asset-based fees that vary according to the number of positions and transactions, plus out-of-pocket expenses.
Boston Financial Data Services, Inc. (“BFDS”) is the Trust’s transfer agent. For these services, the Trust pays a per account fee, plus certain other transaction cusip charges and out-of-pocket expenses. BFDS may pay each Fund transfer agent earnings credits. Transfer agent earnings credits are credits received for interest which results from overnight balances used by BFDS for clearing shareholder transactions.
Administrative Services
The Trust has entered into an administrative services agreement with ICON Advisers pursuant to which ICON Advisers oversees the administration of the Trust’s business and affairs. This agreement provides for an annual fee of 0.05% on the Trusts’ first $1.5 billion of average daily net assets, 0.045% on the next $1.5 billion of average daily net assets, 0.040% on the next $2 billion of average daily net assets and 0.030% on average daily net assets over $5 billion. For the year ended September 30, 2012, each Fund’s
| | | | |
| NOTESTO FINANCIAL STATEMENTS | | | 59 | |
NOTESTO FINANCIAL STATEMENTS (CONTINUED)
payment for administrative services to ICON Advisers is included on the Statement of Operations. The administrative services agreement provides that ICON Advisers will not be liable for any error of judgment, mistake of law, or any loss suffered by the Trust in connection with matters to which the administrative services agreement relates, except for a loss resulting from willful misfeasance, bad faith or negligence by ICON Advisers in the performance of its duties.
ICON Advisers has a sub-administration agreement with State Street to which State Street assists ICON Advisers with the administration and business affairs of the Trust. For its services, ICON Advisers pays State Street a fee that is calculated daily and paid monthly at an annual rate based on the aggregate average daily net assets of the Trust.
Distribution Fees
The Funds have adopted a Distribution Plan pursuant to Rule 12b-1 under the 1940 Act (“12b-1 Plan”) under which the Funds are authorized to compensate the Funds’ distributor, ICON Distributors, Inc. (“IDI”) (an affiliate of the adviser) for the sale and distribution of shares. Under the 12b-1 Plan, Class A shareholders pay an annual distribution and service fee of 0.25% of average daily net assets. The Class C shareholders pay an annual distribution and service fee of 1.00% of average daily net assets. Prior to Class I shares merging into Class A shares of the International Equity Fund on January 23, 2012, Class I shareholders paid an annual distribution and service fee of 0.25% of average daily net assets. The total amount paid under the 12b-1 plans by the Funds is shown on the Statement of Operations.
Other Related Parties
Certain Officers and Directors of ICON Advisers are also Officers and Trustees of the Funds; however, such Officers and Trustees (with the exception of the Chief Compliance Officer, “CCO”) receive no compensation from the Funds. The CCO’s salary is paid 86% by the Trust and 14% by ICON Advisers. For the year ended September 30, 2012, the total related amounts paid by the Funds under this arrangement are included in Other Expenses on the Statement of Operations.
4. Borrowings
The Trust has entered into Lines of Credit agreements with State Street to provide temporary funding for redemption requests. The maximum
| | |
| 60 | | NOTESTO FINANCIAL STATEMENTS |
borrowing is limited to $150 million. Interest on domestic borrowings is charged at the higher of the Federal Funds Rate effective on that day and the Overnight LIBOR Rate effective on that day plus 1.25%. The average interest rate charged for the year ended September 30, 2012 was 1.40%.
| | | | |
| Fund | | Average Borrowing
(10/1/11-9/30/12) | |
ICON Asia-Pacific Region Fund* | | $ | 75,531 | |
ICON Europe Fund | | | 39,732 | |
ICON International Equity | | | 82,238 | |
| * | Fund had outstanding borrowings under these agreements as of September 30, 2012. |
5. Purchases and Sales of Investment Securities
For the year ended September 30, 2012, the aggregate cost of purchases and proceeds from sales of investment securities (excluding short-term securities) was as follows:
| | | | | | | | |
| Fund | | Purchases of
Securities | | | Proceeds
from Sales of
Securities | |
ICON Asia-Pacific Region Fund | | $ | 35,752,768 | | | $ | 62,967,824 | |
ICON Europe Fund | | | 24,688,009 | | | | 30,905,535 | |
ICON International Equity Fund | | | 91,493,066 | | | | 114,246,886 | |
6. Federal Income Tax
Income and capital gain distributions are determined in accordance with income tax regulations that may differ from accounting principles that are generally accepted in the United States of America. These differences are due to differing treatments for items such as net short-term gains, deferrals of wash sale losses, foreign currency transactions, net investment losses, and capital loss carryforwards.
| | | | |
| NOTESTO FINANCIAL STATEMENTS | | | 61 | |
NOTESTO FINANCIAL STATEMENTS (CONTINUED)
For the year ended September 30, 2012 the following Funds had capital loss carryforwards:
| | | | | | | | |
| Fund | | Amounts | | | Expires | |
ICON Asia-Pacific Region Fund | | $ | 9,482,596 | | | | 2017 | |
ICON Europe Fund | | | 24,032,405 | | | | 2017 | |
| | | 26,614,409 | | | | 2018 | |
| | | 1,013,882 | | | | Unlimited | |
ICON International Equity Fund | | | 53,195,839 | | | | 2017 | |
| | | 27,012,993 | | | | 2018 | |
| | | 5,904,569 | | | | Unlimited | |
Future capital loss carryforward utilization in any given year may be limited if there are substantial shareholder redemptions or contributions. During the year ended September 30, 2012 the Funds utilized capital loss carryforwards:
| | | | |
| Fund | | Amount | |
ICON Asia-Pacific Region Fund | | $ | 1,236,735 | |
ICON Europe Fund | | | - | |
ICON International Equity Fund | | | - | |
The Regulated Investment Company Modernization Act of 2010 (the “Act”) was signed into law on December 22, 2010. The Act makes changes to a number of tax rules impacting the Funds. Under the Act, future capital losses generated by a fund may be carried over indefinitely, but these losses must be used prior to the utilization of any pre-enactment capital losses. Since pre-enactment capital losses may only be carried forward for eight years, there may be a greater likelihood that all or a portion of each fund’s pre-enactment capital losses will expire unused.
The tax characteristics of distributions paid to shareholders during the fiscal year ended September 30, 2012, were as follows:
| | | | | | | | |
| Fund | | Distributions
Paid from
Ordinary Income | | | Total
Distributions
Paid | |
ICON Asia-Pacific Region Fund | | $ | 217,338 | | | $ | 217,338 | |
ICON Europe Fund | �� | | 460,666 | | | | 460,666 | |
ICON International Equity Fund | | | 686,711 | | | | 686,711 | |
| | |
| 62 | | NOTESTO FINANCIAL STATEMENTS |
The tax characteristics of distributions paid to shareholders during the fiscal year ended September 30, 2011, were as follows:
| | | | | | | | |
| Fund | | Distributions
Paid from
Ordinary Income | | | Total
Distributions
Paid | |
ICON Asia-Pacific Region Fund | | $ | - | | | $ | - | |
ICON Europe Fund | | | 455,187 | | | | 455,187 | |
ICON International Equity Fund | | | 482,223 | | | | 482,223 | |
As of September 30, 2012, the components of accumulated earnings/(deficit) on a tax basis were as follows:
| | | | | | | | | | | | | | | | | | | | |
| Fund | | Undistributed
Ordinary
Income | | | Late Year
Loss
Deferral** | | | Capital Loss
Carryover | | | Unrealized
Appreciation/
(Depreciation)* | | | Total
Accumulated
Earnings/
(Deficit) | |
ICON Asia-Pacific Region Fund | | $ | 271,230 | | | $ | (2,083,840 | ) | | $ | (9,482,596 | ) | | $ | (560,913 | ) | | $ | (11,856,119 | ) |
ICON Europe Fund | | | 336,958 | | | | (2,309,656 | ) | | | (51,660,696 | ) | | | 1,812,133 | | | | (51,821,261 | ) |
ICON International Equity Fund | | | 113,893 | | | | (7,639,260 | ) | | | (86,113,401 | ) | | | 588,189 | | | | (93,050,579 | ) |
| * | Differences between the book-basis and tax-basis unrealized appreciation/(depreciation) are attributable primarily to tax deferral of losses on wash sales. |
| ** | The Funds have elected to defer certain qualified late-year losses in accordance with federal income tax rules. These losses are treated as having arisen on the first day of the following fiscal year. |
As of September 30, 2012, cost on investments for federal income tax purposes and the amount of net unrealized appreciation/(depreciation) were as follows:
| | | | | | | | | | | | | | | | |
| Fund | | Cost | | | Unrealized
Appreciation | | | Unrealized
(Depreciation) | | | Net
Appreciation/
(Depreciation) | |
ICON Asia-Pacific Region Fund | | $ | 49,515,145 | | | $ | 3,327,722 | | | $ | (3,886,816 | ) | | $ | (559,094 | ) |
ICON Europe Fund | | | 26,896,675 | | | | 2,814,869 | | | | (1,001,386 | ) | | | 1,813,483 | |
ICON International Equity Fund | | | 75,991,199 | | | | 6,017,685 | | | | (5,419,968 | ) | | | 597,717 | |
7. Subsequent Events
Management has evaluated the possibility of subsequent events and determined that there are no material events that would require disclosure in the Funds’ financial statements.
| | | | |
| NOTESTO FINANCIAL STATEMENTS | | | 63 | |
REPORTOF INDEPENDENT REGISTERED PUBLIC
ACCOUNTING FIRM
To the Board of Trustees and Shareholders of the ICON Funds:
In our opinion, the accompanying statements of assets and liabilities, including the schedules of investments, and the related statements of operations and of changes in net assets and the financial highlights present fairly, in all material respects, the financial position of ICON Asia-Pacific Region Fund, ICON Europe Fund, and ICON International Equity Fund (three of the portfolios constituting ICON Funds, hereafter referred to as the “Funds”) at September 30, 2012, the results of each of their operations for the year then ended, the changes in each of their net assets for each of the two years in the period then ended and the financial highlights for each of the periods presented, in conformity with accounting principles generally accepted in the United States of America. These financial statements and financial highlights (hereafter referred to as “financial statements”) are the responsibility of the Funds’ management; our responsibility is to express an opinion on these financial statements based on our audits. We conducted our audits of these financial statements in accordance with the standards of the Public Company Accounting Oversight Board (United States). Those standards require that we plan and perform the audit to obtain reasonable assurance about whether the financial statements are free of material misstatement. An audit includes examining, on a test basis, evidence supporting the amounts and disclosures in the financial statements, assessing the accounting principles used and significant estimates made by management, and evaluating the overall financial statement presentation. We believe that our audits, which included confirmation of securities at September 30, 2012 by correspondence with the custodian and brokers, provide a reasonable basis for our opinion.

Denver, Colorado
November 19, 2012
| | |
| 64 | | REPORTOF ACCOUNTING FIRM |
SIX MONTH HYPOTHETICAL EXPENSE EXAMPLE
SEPTEMBER 30, 2012 (UNAUDITED)
Example
As a shareholder of a Fund you may pay two types of fees: transaction fees and fund-related fees. Certain funds charge transaction fees, including sales charges (loads) on purchase payments, reinvested dividends, or other distributions; redemption fees; and exchange fees. Funds also incur various ongoing expenses, including management fees, distribution and/or service fees, and other fund expenses, which are indirectly paid by shareholders.
This Example is intended to help you understand your ongoing costs (in dollars) of investing in the various ICON Funds and to compare these costs with the ongoing costs of investing in other mutual funds. This Example is based on an investment of $1,000 invested at the beginning of the six-month period and held for the six-month period (4/1/12 – 9/30/12).
Actual Expenses
The first line in the table for each Fund provides information about actual account values and actual expenses. The Example includes, but is not limited to, management fees, 12b-1 fees, fund accounting, custody and transfer agent fees. However, the Example does not include client specific fees, such as the $15 fee charged to IRA accounts, or the $15 fee charged for wire redemptions. You may use this information, together with the amount you invested, to estimate the expenses that you paid over the period. Simply divide your account value by $1,000 (for example, an $8,600 account value divided by $1,000 = 8.6), then multiply the result by the number in the first line for each Fund under the heading entitled “Expenses Paid During Period” to estimate the expenses you paid on your account during this period.
Hypothetical Example for Comparison Purposes
The second line in the table for each Fund provides information about hypothetical account values and hypothetical expenses based on the Fund’s actual expense ratio and an assumed rate of return of 5% per year before expenses, which is not the Fund’s actual return. The hypothetical account values and expenses may not be used to estimate the actual ending account balance or expenses you paid for the period. You may use this information to compare the ongoing costs of investing in the Fund and other funds. To do so, compare this 5% hypothetical example with the 5% hypothetical examples that appear in the shareholder reports of the other funds. Please note that the expenses shown in the table are meant to highlight your ongoing costs only and do not reflect any transactional costs, such as sales charges (loads),
redemption fees, or exchange fees that may be charged by other funds. Therefore, this information is useful in comparing ongoing costs only, and will not help you determine the relative total costs of owning different funds.
| | | | | | | | | | | | | | | | |
| | | Beginning
Account
Value
4/1/12 | | | Ending
Account
Value
9/30/12 | | | Expenses Paid
During Period
4/1/12 - 9/30/12* | | | Annualized
Expense Ratio
4/1/12 - 9/30/12 | |
Actual Expenses | | | | | | | | | | | | | | | | |
ICON Asia-Pacific Region Fund | | | | | | | | | | | | | | | | |
Class S | | $ | 1,000.00 | | | $ | 991.10 | | | $ | 7.17 | | | | 1.44% | |
Class C | | | 1,000.00 | | | | 985.80 | | | | 12.67 | | | | 2.55% | |
Class A | | | 1,000.00 | | | | 989.40 | | | | 8.96 | | | | 1.80% | |
ICON Europe Fund | | | | | | | | | | | | | | | | |
Class S | | | 1,000.00 | | | | 1,032.50 | | | | 7.89 | | | | 1.55% | |
Class C | | | 1,000.00 | | | | 1,028.00 | | | | 12.93 | | | | 2.55% | |
Class A | | | 1,000.00 | | | | 1,031.70 | | | | 9.15 | | | | 1.80% | |
ICON International Equity Fund | | | | | | | | | | | | | | | | |
Class S | | | 1,000.00 | | | | 1,011.00 | | | | 7.01 | | | | 1.39% | |
Class C | | | 1,000.00 | | | | 1,005.90 | | | | 12.80 | | | | 2.55% | |
Class A | | | 1,000.00 | | | | 1,008.30 | | | | 9.05 | | | | 1.80% | |
Hypothetical (assuming a 5% return before expenses) | | | | | | | | | | | | | | | | |
ICON Asia-Pacific Region Fund | | | | | | | | | | | | | | | | |
Class S | | | 1,000.00 | | | | 1,017.80 | | | | 7.26 | | | | | |
Class C | | | 1,000.00 | | | | 1,012.24 | | | | 12.84 | | | | | |
Class A | | | 1,000.00 | | | | 1,015.99 | | | | 9.08 | | | | | |
ICON Europe Fund | | | | | | | | | | | | | | | | |
Class S | | | 1,000.00 | | | | 1,017.24 | | | | 7.83 | | | | | |
Class C | | | 1,000.00 | | | | 1,012.25 | | | | 12.83 | | | | | |
Class A | | | 1,000.00 | | | | 1,016.00 | | | | 9.07 | | | | | |
ICON International Equity Fund | | | | | | | | | | | | | | | | |
Class S | | | 1,000.00 | | | | 1,018.03 | | | | 7.04 | | | | | |
Class C | | | 1,000.00 | | | | 1,012.24 | | | | 12.84 | | | | | |
Class A | | | 1,000.00 | | | | 1,015.99 | | | | 9.08 | | | | | |
| * | Expenses are equal to the Fund’s six month expense ratio annualized, multiplied by the average account value over the period, multiplied by 183/366 to reflect the one-half year period. |
Total returns exclude applicable sales charges. If sales charges were included (maximum 5.75%), returns would be lower.
BOARDOF TRUSTEESAND FUND OFFICERS (UNAUDITED)
The ICON Funds Board of Trustees (“Board”) consists of four Trustees who oversee the 18 ICON Funds (the “Funds”). The Board is responsible for general oversight of the Funds’ business and for assuring that the Funds are managed in the best interest of the Funds’ shareholders. The Trustees, and their ages, and principal occupations are set forth below. The address of the Trustees is 5299 DTC Blvd., Suite 1200, Greenwood Village, CO 80111. Trustees have no official term of office and generally serve until they resign or are not re-elected.
Interested Trustee
Craig T. Callahan, 61, Chairman of the Board. Dr. Callahan has been a Trustee of the Funds since their inception. Dr. Callahan also serves as President (1998 to present) and Chairman of the Investment Committee (2005 to present) and served as the Chief Investment Officer (1991 to 2004) of ICON Advisers. Dr. Callahan is also Executive Vice President (2005 to present); Director (1991 to present); and was previously President (1998 to 2005) and Chief Compliance Officer (2005) of IDI. Dr. Callahan also serves as the President (1998 to present) and Chairman of the Board of Directors (1994 to present) of ICON Management & Research Corporation (“IM&R”), the parent company of ICON Advisers and IDI.
Independent Trustees
Glen F. Bergert, 62. Mr. Bergert has been a Trustee of the Funds since 1999. Mr. Bergert is President of Venture Capital Management LLC (1997 to present), General Partner of SOGNO Partners LP, a venture capital company (2001 to present), General Partner of Bergert Properties, LLP, a real estate holding company (1997 to present), General Partner of Pyramid Real Estate Partnership, a real estate development company (1998 to present), General Partner of Chamois Partners, LP, a venture capital company (2004 to present) and was previously a General Partner with KPMG Peat Marwick, LLP (1979 to 1997). Mr. Bergert is also a Director of Delta Dental of Pennsylvania, an insurance company (1998 to 2009 and 2010 to present), Dentegra Group, Inc, an insurance holding company (2010 to present) and Delta Reinsurance Corporation (2000 to 2009 and 2011 to present). He was a Director of Delta Dental of California, an insurance company (2006 to 2012).
John C. Pomeroy, Jr., 65. Mr. Pomeroy has been a Trustee of the Funds since November 2002. Mr. Pomeroy is Chief Investment Officer and Director of Investments, Pennsylvania State University (2001 to present) and was
Portfolio Manager and Product Manager, Trinity Investment Management Corporation (1989 to 2001).
R. Michael Sentel, 64. Mr. Sentel has been a Trustee of the Funds since their inception. Mr. Sentel is a Senior Attorney with the U.S. Department of Education (1996 to present). Mr. Sentel also provides legal representation as a sole practitioner with an emphasis on corporate and transactional law. He served as general counsel to numerous public companies and served on the board of directors of one of these clients. Mr. Sentel began his legal career with the U.S. Securities and Exchange Commission’s Division of Enforcement and served as a Branch Chief (1980 to 1981). Later he served as the Section Chief for the Professional Liability Section of the Federal Deposit Insurance Corp. with responsibility for the Rocky Mountain Region (1991 to 1994).
The Officers of the Funds are:
Craig T. Callahan, 61, Chairman of the Board. Dr. Callahan has been a Trustee of the Funds since their inception. Dr. Callahan also serves as President (1998 to present) and Chairman of the Investment Committee (2005 to present) and served as the Chief Investment Officer (1991 to 2004) of ICON Advisers. Dr. Callahan is also Executive Vice President (2005 to present); Director (1991 to present); and was previously President (1998 to 2005) and Chief Compliance Officer (2005) of IDI. Dr. Callahan also serves as the President (1998 to present) and Chairman of the Board of Directors (1994 to present) of IM&R, the parent company of ICON Advisers and IDI.
Erik L. Jonson, 63. Mr. Jonson has been a Vice President and Principal Financial Officer/Treasurer of the Funds since their inception in 1996. Mr. Jonson is also Chief Financial Officer (1996 to present) and Executive Vice President (2004 to present) and was previously Vice President (1998 to 2004) and Secretary (2005 and 1998 to 2002) of ICON Advisers; Chief Financial Officer, Secretary and Director (1998 to present) of IM&R; and Executive Vice President and Treasurer/Financial Principal (1996 to present) of IDI. Mr. Jonson will be retiring on January 22, 2013.
Jessica Seidlitz, 34. Ms. Seidlitz serves as the Assistant Treasurer of the Funds (2007 to present) and Vice President of the Funds (2012 to present). She also serves as the Mutual Fund Controller of ICON Advisers (2005 to present). Previously, she was a Senior Associate/Associate at PricewaterhouseCoopers LLP (2001 to 2004). Effective January 22, 2013, Ms. Seidlitz will become the Principal Financial Officer/Treasurer of the Funds.
Donald Salcito, 59. Mr. Salcito serves as Vice President and Secretary of the Funds (November 15, 2006 to present). Mr. Salcito is also Executive Vice President and General Counsel (September 2005 to present) of ICON Advisers; Director of IM&R (2005 to present); Executive Vice President,
Secretary, General Counsel of IDI (2005 to present). Previously, he was a Partner in various national law firms, practicing in the securities law area. (1980 to 2005).
Brian Harding, 33. Mr. Harding serves as Chief Compliance Officer and Anti-Money Laundering Officer of the Funds (2008 to present). Mr. Harding also serves as Chief Compliance Officer of ICON Advisers (2011 to present). Previously, he was a Manager (2007 to 2008) and a Senior Associate/Associate (2001 to 2007) at PricewaterhouseCoopers LLP.
OTHER INFORMATION
Renewal of Investment Advisory Agreements
On August 6, 2012 the Board of Trustees, including all of the Trustees that are not “interested persons” of the Trust (the “Independent Trustees”), approved continuation of the Advisory Agreements with the Adviser for each Fund for an additional one-year term commencing October 1, 2012.
In determining to renew the investment advisory agreements between ICON Funds (the “Trust”) and ICON Advisers, Inc. (“ICON” or the “Adviser”) the Board requested, was provided with and reviewed data with respect to ICON, its personnel, and the services provided and to be provided to each Fund by ICON under the Trust’s Investment Advisory Agreement dated October 9, 1996, as amended (related to the Sector, International and ICON Funds) and under the Trust’s Investment Advisory Agreement dated July 9, 2002 and effective October 1, 2002, as amended (related to the U.S. Diversified Funds - Bond, Risk-Managed Equity, Equity Income and Long/Short Funds) (collectively, the “Advisory Agreements”), for an additional one-year term commencing October 1, 2012. The Board agreed that consideration of the Advisory Agreements should also include consideration of Trust-ICON agreements that impact provisions of the Advisory Agreements – including, in particular, expense limitation agreements dated January 23, 2012 and May 1, 2005 (for the International Equity Fund).
The Board was provided with and reviewed data with respect to ICON, its personnel, and the services provided and to be provided to each Fund by ICON under the Trust’s Advisory Agreements and Administrative Services Agreement with ICON and the Distribution Agreement with ICON Distributors, Inc. (“IDI”). The data included information concerning advisory, distribution and administrative services provided to the Funds by ICON and its related companies; information concerning other businesses of those companies; comparative data related to exchange traded funds versus the Sector Funds; and comparative data obtained from Strategic Insights related to Fund performance and Fund expenses (the “SI report”). The data also included an analysis of the Funds’ ratings on the AthenaInvest system (the “AthenaInvest data”) and a presentation on ICON’s investment model.
Management personnel discussed the data for and with the Board. Included in the 15(c) discussion was a briefing on factors affecting the ICON model; expenses and expense ratios of each Fund and other ICON managed products; relative performance of each Fund; status of expense reimbursements to the Funds by ICON Advisers; sales and marketing initiatives; specific business factors affecting IDI; the work load on ICON as
adviser and administrator to the Funds; current profitability of ICON; current staffing levels and staff morale; and changes to ICON’s trading desk.
The Independent Trustees were represented by independent legal counsel throughout the process. Prior to acting on the proposed contract renewals, the Independent Trustees met separately as a group in private sessions with their independent legal counsel to review and discuss the foregoing information. Based on these discussions, independent legal counsel and/or the Lead Independent Trustee also contacted management to request additional information and to discuss responses to questions raised during the process. In addition, the Board received materials from legal counsel discussing the legal standards applicable to their consideration of the ICON-Trust agreements.
In considering the nature, extent and quality of the services provided by the Adviser, the Board reviewed information relating to ICON’s operations and personnel. Among other things, the Adviser provided biographical information on its professional staff and descriptions of its organizational and management structure. In the course of their deliberations the Board evaluated, among other things, information relating to the investment philosophy, strategies and techniques used in managing each Fund, the qualifications and experience of ICON’s investment personnel, ICON’s compliance programs, ICON’s brokerage practices, including the extent to which the Adviser obtains research through “soft dollar” arrangements with the Funds’ brokerage, compliance reports on the foregoing, and the financial and non-financial resources available to provide services required under the Advisory Agreement.
During the discussion, the SI report and the AthenaInvest data were discussed and management personnel showed performance for each fund and discussed the factors affecting performance. During the discussion on performance, management personnel noted that the markets continue to experience volatility and that when the markets are volatile, it affects ICON’s performance; during the last three – four years ICON’s style of management, intrinsic valuation, has not been in favor. It was noted that Advisers’ performance relative to other valuation managers as judged by the AthenaInvest system is quite positive, but in relation to other strategy managers, valuation is underperforming; that the period from March 2009, near the market bottom, through June 2012, is an example of how difficult it has been for active management as the average performance of all ten strategies identified by AthenaInvest have lagged the S & P 500; that the best two performing strategies have been Future Profitability and Future Growth, which appear to have benefitted from rebounding, rapidly growing and improving earnings; that Valuation ranks fourth – just above middle of the pack, only slightly better than the average performance of all managers;
and that, performance over the twelve months ending June, 2012 shows all ten strategies lagged the S & P 500 Index. The Board believes this information supports the view that we are in a very difficult setting for active management and indicates this setting has been particularly difficult for managers buying what they consider to be value bargains. It was noted that the ICON system is designed to handle one to two year industry themes, not themes averaging 14 weeks; and that the Adviser has stuck to its system as specified in Fund disclosure documents, holding the stocks and industries that appear undervalued and held those stocks and industries through the volatility. Management advised that, in hindsight, the only way to handle such a rapidly reversing environment is “market timing;” that the Adviser is not a market timer and doesn’t believe such a system is possible; and that the Adviser uses one valuation system across all mutual funds which has been problematic for all of the ICON Funds in this setting. The Adviser noted that AthenaInvest has data on strategies back to 1980 and there is a clear pattern of strategies coming and going from favor as economic and financial environments change; and that the Adviser remains committed to its style of management and believes that the shareholders will be rewarded over time.
The Board then questioned style consistency with the Adviser. Management advised that, based on the Adviser’s own analysis, and with the restructuring of the Adviser, ICON has added a new level of review on the Portfolio Managers (“PMs”) to make sure they are adhering to the ICON System; that procedures have been put in place to evaluate each of the Funds to ensure all PMs are investing consistently and in accordance with the ICON System by evaluating the Funds from an attribution perspective in monthly meetings with the PM’s and to, on an ongoing basis, evaluate the ICON system and seek to improve the Model, when necessary. The Board of Trustees noted that the Funds offer investors an opportunity to invest in funds where the Valuation style is used to manage fund assets; that the Adviser provides that style of management; that the Adviser continues to believe the adjustments to its system have been functioning as intended; and that, notwithstanding that belief, the Adviser is constantly evaluating the system and will modify it as needed.
In connection with reviewing data bearing upon the nature, quality, and extent of services furnished by ICON to each Fund, the Board assessed data concerning ICON’s staffing, systems and facilities. The Board also assessed ICON’s non-Trust business to see if there are any initiatives that would dilute service to the Trust. The Board noted:
A. That the breadth and the quality of investment advisory and other services being provided to each Fund is satisfactory, as evidenced in part by efforts to address and improve the performance record of each Fund when
compared with the performance records of a peer group of comparable funds and markets in general;
B. That the breadth and the quality of investment advisory and other services being provided to each Fund is satisfactory, as evidenced in part by the AthenaInvest data (ratings based on an assessment of fund strategy) which also reflects that all but one of the Funds are rated 3 or higher and that, unlike many other fund groups, ICON Funds has no fund rated 1 and only one rated 2 (where 1 is the lowest and 5 is the highest).
C. That ICON has made significant expenditures in the past year and in prior years to ensure that it has the sophisticated systems and the highly trained personnel necessary for it to be able to continue to provide quality service to the Funds’ shareholders, including the dedication of substantial resources to ICON’s investment and methodology;
D. That the Board, after considering compliance reports and compliance initiatives undertaken during the year and conducting individual interviews with selected portfolio managers, is satisfied with the research and portfolio management, that research and portfolio management is being constantly evaluated and improved upon; and that the PM’s are evaluating trading services constantly, the Board concluded that the Adviser is providing the Funds with professional management of the nature, quality and scope required by the Funds; and
E. The risks assumed by ICON in providing investment advisory services to each Fund, including the capital commitments which have been made in the past and which continue to be made by ICON to ensure the continuation of the highest quality of service to the Trust, is made with the recognition that shareholders may redeem their shares at any time without notice and the Trust’s advisory relationship with ICON may be terminated at any time and must be renewed on an annual basis.
In considering the reasonableness of the fees paid to the Adviser for managing each Fund, the Board reviewed, among other things, data concerning other funds from the SI report, financial statements of the Adviser and an analysis of the profitability of the Adviser, and its affiliates, and their relationship with each Fund over various time periods. Such analysis identified all revenues and other benefits received by the Adviser and its affiliates from managing each Fund, the costs associated with providing such services and the resulting profitability to the Adviser and its affiliates and a comparison of similar data from reports filed by publicly traded firms.
The Board noted actual (net) fees for advisory services and Fund expense ratios under the contractual relationship (the Advisory agreements and the
Expense Limitation Agreements) with ICON as opposed to the fees specified in the applicable Advisory Agreement and expense ratios without application of the expense limitations and concluded that the focus should be on actual expense ratios after application of the Expense Limitation Agreements.
The Board considered the current and anticipated asset levels of each Fund and the contractual commitments of the Adviser to waive fees and pay expenses of the Funds from time to time to limit the total expenses of the Funds. In this regard the Board discussed significantly reduced asset levels in each Fund covered by the Advisory Agreements due to the tumultuous markets during the past four and a half years, the relative poor Fund performance, and the industry wide net-redemptions in equity and actively managed funds due to the uncertainty of the markets. ICON’s ability to provide the services called for under the Advisory Agreements was assessed in light of current and projected asset levels. Fund expenses and expense ratios were also assessed in light of current and projected asset levels. The Board concluded that the Adviser has the resources necessary to provide the services called for under the Advisory Agreements; that profitability to the Adviser and its affiliates from their relationship with the Funds, and services provided to the Funds, is not excessive; and that the Adviser is not realizing material benefits from economies of scale that would warrant adjustments to the fees for any Fund at this time. The Board of Trustees concluded that, in light of the nature, extent and quality of the services provided by the Adviser and the levels of profitability associated with providing these services, the fees charged by the Adviser under the Advisory Agreements to each Fund are reasonable.
In connection with assessing data bearing on the fairness of fee arrangements, the Board considered the SI report. It was noted that SI was selected at the May Board meeting to prepare its report, an extensive analysis of the expense data of other comparable funds; and that Trustee input was solicited and provided in the process. Among other information discussed, it was noted that:
A. the advisory fee structures of the Funds were considered in comparison with advisory fees and expense ratios of other similarly managed funds as set forth in the comparative data;
B. expense ratios for 14 of the 17 Funds are above median, one is equal to the median, and 2 are below the median;
C. in 15 of the 17 Funds, the assets under management are significantly below either the average or the median [SI did not provide an analysis of fund expense on an asset weighted basis. Such an analysis is very subjective and uncertain because it would require the Adviser to make a number of assumptions, which the Adviser’s management was uncomfortable in making
due to the unreliability of the assumptions. It was, however, noted that when the fund size approaches peer group averages the Funds expenses also approach peer group averages.];
D. ICON has contractually agreed to impose expense limitations on each and every Fund at a cost to ICON;
E. the advisory and other fees payable by the Funds to ICON under the contractual arrangements (the Advisory agreements and the Expense Limitation Agreements) are essentially fees which would be similar to those which would have resulted solely from “arm’s-length” bargaining, and may well be lower than fees arrived at solely from such arm’s-length negotiation;
F. ICON has contractually committed to break points in its fees so that economies of scale could be realized as a Fund grows in assets, for the benefit of Fund shareholders.
The Board also considered the fees charged by the Adviser to other advisory clients as outlined in its Registration application on form ADV in connection with assessing data bearing on the fairness of fee arrangements. It was noted that certain institutional type accounts have lower fees than the fees paid by the Funds; and that the fees differed for a number of reasons, including but not limited to, those clients call for different commitments of time, have low and predictable turnover of assets, in competition joint costs are apportioned among paying customers according to elasticity of demand, and the Adviser has reduced levels of responsibility in sub-managed accounts, or accounts with an investor agent/advisor especially in comparison to mutual funds which are highly regulated and restricted which increases costs of operations and decreases returns. The Board evaluated the Funds redemptions and compared those redemptions to similar funds in the industry, specifically, actively managed domestic equity funds in connection with assessing data bearing on the fairness of fee arrangements. The Board noted that the Funds redemptions were similar to industry averages which showed two things: 1) that the Funds’ Performance was not adversely impacting fund sales and redemptions, and 2) that the fees and costs were competitive. The Board noted that there are thousands of mutual funds competing; that investors can search and trade funds on the internet at very little or no cost; and that if the Adviser were overcharging for its services, with its performance being what it is, the Board would have expected redemptions in excess of industry norms.
The Board concluded that the Adviser is providing the Funds with professional management at a fair, reasonable and competitive price.
In connection with assessing the direct and indirect benefits to ICON from serving as the Funds’ adviser, the Board discussed services provided under
the Distribution Agreement and the Administrative Services Agreement which are in addition to services under the Advisory Agreements. It was noted that IDI does not charge a fee to the Funds for its services and that ICON’s fee for administrative services appears to be consistent with such fees in other fund groups. The Board noted that:
A. ICON benefits from serving directly or through affiliates as the principal underwriter and administrative agent for the Funds; that services provided by ICON and its affiliates to the Funds are satisfactory, and that fees derived from providing the services are competitive and reasonable; and
B. ICON receives research assistance (primarily in the form of data) from the use of soft dollars generated from Fund portfolio transactions; that such research assists ICON in providing quality advisory services; that Trust and Adviser compliance personnel continuously evaluate and report on the soft-dollar arrangements and related costs; and that the Board concluded that the arrangements are consistent with Fund brokerage practices and benefit the Funds and their shareholders.
Based on these considerations, the Board, including all of the Independent Trustees, concluded that: 1) the continuation of the Advisory Agreements was in the best interests of each Fund and its shareholders, 2) the services to be performed under the Advisory Agreements were required for the operation of the Funds, 3) the advisory services were satisfactory to the Funds in the past, and 4) the fees for the advisory services and other benefits from the relationship with the Trust received by ICON, and its affiliates, were consistent with fees paid by similar funds and other clients of ICON, and were reasonable in light of the comparative data, and within the range of what would have been negotiated at arm’s length in light of all the circumstances.
OTHER INFORMATION (UNAUDITED)
Supplemental Tax Information
For corporate shareholders, none of the total ordinary income dividends paid during the fiscal year ended September 30, 2012, qualified for the corporate dividends received deduction.
For the fiscal year ended September 30, 2012, the following funds paid qualified dividend income:
| | | | |
| Fund | | Amount | |
ICON Asia-Pacific Region Fund | | | 100 | % |
ICON Europe Fund | | | 100 | % |
ICON International Equity Fund | | | 100 | % |
The Funds had no long-term capital gain distributions qualifying for the maximum 15% income tax rate for individuals.
Portfolio Holdings
Information related to the 10 largest portfolio holdings of each Fund is made available at www.iconfunds.com within approximately 10 business days after month-end. Additionally, a complete list of each Fund’s holdings is made available approximately 30 days after month-end. Each ICON Fund also files a complete schedule of portfolio holdings for the first and third quarters of its fiscal year with the Securities and Exchange Commission (the “Commission”) on Form N-Q. The ICON Funds’ Forms N-Q are available at www.sec.gov or may be reviewed and copied at the Commission’s Public Reference Room in Washington, DC. Information about the Public Reference Room may be obtained by calling 1-800-SEC-0330.
Proxy Voting
A summarized description of the policies and procedures the ICON Funds use to vote proxies is available free of charge at www.iconfunds.com or by calling 1-800-764-0442.
Information about how the ICON Funds voted proxies related to each Fund’s portfolio securities during the 12-month period ended June 30 is available free of charge at www.iconfunds.com or on the Commission’s website at www.sec.gov.
Cost Basis Information
Effective January 1, 2012, federal law requires mutual fund companies to maintain and report a shareholder’s cost basis by tax lot, gain/loss
information and holding period of covered shares to the Internal Revenue Service on Form 1099. Covered shares are mutual fund shares acquired on or after January 1, 2012. A fund is not required to maintain and report information for shares not deemed as covered.
The new law requires each fund to elect a default tax identification methodology in order to perform the required reporting. As a result, the Trust has chosen Average Cost as its default tax identification methodology. This is the method each Fund will use. However, at the time of purchase or upon the sale of covered shares, shareholders may choose a different tax identification method. Furthermore, if you purchase shares through a financial intermediary, please contact the intermediary to find out what default tax identification method they will use. We recommend that you consult your tax adviser to determine which tax identification methodology best suits your individual tax situation.
For More Information
This report is for the general information of the Funds’ shareholders and is not authorized for distribution to prospective investors unless preceded or accompanied by a current prospectus. You may obtain a copy of the prospectus, which contains information about the investment objectives, risks, charges, expenses, and share classes of each ICON Fund, by visiting www.iconfunds.com or by calling 1-800-764-0442. Please read the prospectus carefully before investing.
ICON Distributors, Inc., Distributor.
ICON FUNDS PRIVACY INFORMATION
| | |
| FACTS | | WHAT DOES ICON DO WITH YOUR PERSONAL INFORMATION? |
| | |
| Why? | | Financial companies choose how they share your personal information. Federal law gives consumers the right to limit some but not all sharing. Federal law also requires us to tell you how we collect, share, and protect your personal information. Please read this notice carefully to understand what we do. |
| | |
| What? | | The types of personal information we collect and share depend on the product or service you have with us. This information can include: n Social Security number and account balances n income and transaction history n checking account information and wire transfer instructions When you are no longer our customer, we continue to share your information as described in this notice. |
| | |
| How? | | All financial companies need to share customers’ personal information to run their everyday business. In the section below, we list the reasons financial companies can share their customers’ personal information; the reasons ICON chooses to share; and whether you can limit this sharing. |
| | | | |
| Reasons we can share your personal information | | Does ICON share? | | Can you limit this sharing? |
For our everyday business purposes — such as to process your transactions, maintain your account(s), respond to court orders and legal investigations, or report to credit bureaus | | Yes | | No |
For our marketing purposes — to offer our products and services to you | | No | | We don’t share |
| For joint marketing with other financial companies | | No | | We don’t share |
For our affiliates’ everyday business purposes — information about your transactions and experiences | | No | | We don’t share |
For our affiliates’ everyday business purposes — information about your creditworthiness | | No | | We don’t share |
| For nonaffiliates to market to you | | No | | We don’t share |
| | |
| Questions? | | Call 1-800-764-0442 for the ICON Funds and 1-800-828-4881 for ICON Advisers, Inc. and ICON Distributors, Inc. |
| | | | |
| FUNDS PRIVACY INFORMATION | | | 79 | |
| | |
| Who we are | | |
| Who is providing this notice? | | ICON Funds, ICON Advisers, Inc., and ICON Distributors, Inc. (collectively “ICON”) |
| What we do | | |
| How does ICON protect my personal information? | | To protect your personal information from unauthorized access and use, we use security measures that comply with federal law. These measures include computer safeguards and secured files and buildings. Contracts with our service providers require them to restrict access to your non-public personal information, and to maintain physical, electronic and procedural safeguards against unintended disclosure. |
| How does ICON collect my personal information? | | We collect your personal information, for example, when you n open an account or enter into an investment advisory contract n provide account information or give us your contact information n make a wire transfer We also collect your personal information from others, such as credit bureaus, affiliates, or other companies. |
| Why can’t I limit all sharing? | | Federal law gives you the right to limit only n sharing for affiliates’ everyday business purposes — information about your creditworthiness n affiliates from using your information to market to you n sharing for nonaffiliates to market to you State laws and individual companies may give you additional rights to limit sharing. |
| Definitions | | |
| Affiliates | | Companies related by common ownership or control. They can be financial and nonfinancial companies. n Our affiliates include financial companies such as ICON Funds, ICON Advisers, Inc., and ICON Distributors, Inc. |
| Nonaffiliates | | Companies not related by common ownership or control. They can be financial and nonfinancial companies. n Nonaffiliates we share with can include financial companies such as custodians, transfer agents, registered representatives, financial advisers and nonfinancial companies such as fulfillment, proxy voting, and class action service providers |
| Joint marketing | | A formal agreement between nonaffiliated financial companies that together market financial products or services to you. n ICON doesn’t jointly market |
| | |
| 80 | | FUNDS PRIVACY INFORMATION |
(This page is intentionally left blank)
(This page is intentionally left blank)
(This page is intentionally left blank)
(This page is intentionally left blank)
(This page is intentionally left blank)
For more information about the ICON Funds, contact us:
| | |
| |
| By Telephone | | 1-800-764-0442 |
| |
| By Mail | | ICON Funds
P.O. Box 55452
Boston, MA 02205-8165 |
| |
| In Person | | ICON Funds
5299 DTC Boulevard, 12th Floor
Greenwood Village, CO 80111 |
| |
| On the Internet | | www.iconfunds.com |
| |
| By E-Mail | | info@iconadvisers.com |

2012 ANNUAL REPORT
ICON SECTOR FUNDS
INVESTMENT UPDATE
ICON Consumer Discretionary Fund
ICON Consumer Staples Fund
ICON Energy Fund
ICON Financial Fund
ICON Healthcare Fund
ICON Industrials Fund
ICON Information Technology Fund
ICON Materials Fund
ICON Utilities Fund (formerly, ICON Telecommunications & Utilities Fund)

1-800-764-0442 | www.iconfunds.com
AR-SECT-12 K31245

You can now sign up for electronic delivery of ICON Fund shareholder reports, including prospectuses, annual reports, semiannual reports and proxy statements.
When these materials are available, you will receive an email from ICON with instructions on how to view the documents. Statements, transaction confirmations and other documents that are not available online will continue to be sent to you by U.S. mail.
Visit ICON’s website at www.iconfunds.com to learn more and sign up.
You may change or cancel your participation in eDelivery by visiting www.iconfunds.com, or you can request a hard copy of any of the materials free of charge by calling ICON Funds at 1-800-764-0442.
1-800-764-0442 • www.iconfunds.com

TABLEOF CONTENTS
ABOUT THIS REPORT (UNAUDITED)
Historical Returns
All total returns mentioned in this Report account for the change in a Fund’s per-share price and the reinvestment of any dividends, capital gain distributions and adjustments for financial statement purposes. If your account is set up to receive Fund distributions in cash rather than to reinvest them, your actual return may differ from these figures. The Funds’ performance results do not reflect the deduction of taxes that a shareholder would pay on Fund distributions or on the redemption of Fund shares. The Adviser may have reimbursed certain fees or expenses of some of the Funds. If not for these reimbursements, performance would have been lower. Fund results shown, unless otherwise indicated, are at net asset value. If a sales charge (maximum 5.75%) had been deducted, results would have been lower.
Past performance does not guarantee future results. Investment return and principal value will fluctuate so that an investor’s shares, when redeemed, may be worth more or less than their original cost. Performance results represent past performance, and current performance may be higher or lower. Please call 1-800-764-0442 or visit www.iconfunds.com for performance results current to the most recent month-end.
Portfolio Data
This Report reflects ICON’s views, opinions and portfolio holdings as of September 30, 2012, the end of the reporting period. The information is not a complete analysis of every aspect of any sector, industry, security or the Funds.
Opinions and forecasts regarding industries, companies and/or themes, and portfolio composition and holdings are subject to change at any time based on market and other conditions, and should not be construed as a recommendation of any specific security, industry or sector. Each Fund’s holdings as of September 30, 2012 are included in each Fund’s Schedule of Investments.
According to ICON, value investing is an analytical approach to investing that employs various factors, including projecting earnings growth estimates, in an effort to determine whether securities are over- or underpriced relative to ICON’s estimates of their intrinsic value. Value investing involves risks and uncertainties and does not guarantee better performance or lower costs than other investment methodologies. ICON’s value-to-price ratio (“V/P”) is a ratio of intrinsic value, as calculated using ICON’s proprietary valuation
methodology, of a broad range of domestic and international securities within ICON’s system as compared to the current market price of those securities. The ICON system relies on the integrity of financial statements released to the market as part of our analysis.
This Report contains statements regarding industry or sector themes, new market themes, investment outlook, relative strength, value-to-price ratios, and investment team expectations, beliefs, goals and the like that are based on current expectations, recent individual stock performance relative to current market prices, estimates of company values and other information supplied to the market by the companies we follow. Words such as “expects,” “suggests,” “anticipates,” “targets,” “goals,” “value,” “intrinsic value,” “indicates,” “believes,” “considers,” “estimates,” variations of such words and similar expressions are intended to identify forward looking statements, which are not statements of historical fact. Forward looking statements are not guarantees of future performance and involve certain risks, uncertainties and assumptions that are difficult to assess. These risks and uncertainties are based on a number of important factors, including, among others: stock price fluctuations; the integrity and accuracy of historical and projected financial and other information supplied by companies to the public or assumptions based on such information supplied; interest rates; bond yields; future earnings growth rates; the risks noted in this Report and other factors beyond the control of our investment team but used by the investment team to influence their assumptions. Therefore, actual outcome may differ materially from what is expressed in such forward looking statements.
There are risks associated with mutual fund investing, including the loss of principal. The likelihood of loss may be greater if you invest for a shorter period of time. There is no assurance that the investment process will consistently lead to successful results.
An investment concentrated in sectors and industries may involve greater risk and volatility than a more diversified investment. Investments in foreign securities may entail unique risks, including political, market, and currency risks. Financial statements of foreign companies are governed by different accounting, auditing, and financial standards than U.S. companies and may be less transparent and uniform than in the United States. Many corporate governance standards, which help ensure the integrity of public information in the United States, do not exist in foreign countries. In general, there may be less governmental supervision of foreign stock exchanges and securities brokers and issuers.
The prospectus and statement of additional information contain this and other information about the Funds and are available by visiting
www.iconfunds.com or calling 1-800-764-0442. Please read the prospectus and statement of additional information carefully.
Comparative Indexes
The comparative indexes discussed in this Report are meant to provide a basis for judging the Funds’ performance against specific securities indexes. Each index shown accounts for both change in security price and reinvestment of dividends and distributions (except as noted), but does not reflect the costs of managing a mutual fund. The Funds’ portfolios may significantly differ in holdings and composition from the indexes. Individuals cannot invest directly in an index.
| • | | The unmanaged Standard & Poor’s (“S&P”) Composite 1500 Index (“S&P Composite 1500 Index”) is a broad-based capitalization-weighted index comprising 1,500 stocks of large-cap, mid-cap, and small-cap U.S. companies. |
| • | | The capitalization-weighted S&P 1500 Sector and Industry Indexes are based on specific classifications determined by S&P. |
| • | | The unmanaged NASDAQ Composite (“NASDAQ”) Index is a broad-based capitalization-weighted index of all NASDAQ National Market and Small-Cap stocks. |
| • | | Total returns for the S&P 1500 Consumer Discretionary Index and the S&P 1500 Industrials Index include the reinvestment of dividends and capital gain distributions beginning on January 1, 2002. Index returns with reinvested dividends and distributions are unavailable prior to that date. |
Index returns and statistical data included in this Report are provided by FactSet Research Systems.
Financial Intermediary
If you purchase the Fund through a broker-dealer or other financial intermediary (such as a bank), the Fund and its related companies may pay the intermediary for the sale of Fund shares and related services. These payments may influence the broker-dealer or other intermediary and your salesperson to recommend the Fund over another investment. Ask your salesperson or visit your financial intermediary’s website for more information.
| | | | |
MANAGEMENT OVERVIEW ICON CONSUMER DISCRETIONARY FUND | | Class S Class C Class A | | ICCCX ICCEX ICCAX |
| Q. | How did the Fund Perform relative to its benchmark? |
| A. | The ICON Consumer Discretionary Fund underperformed its sector-specific benchmark but outperformed its broad-based benchmark for the fiscal year ended September 30, 2012. The Fund’s Class S shares rose 34.47%, while the S&P 1500 Consumer Discretionary Index rose 36.98% and the broad S&P Composite 1500 Index returned 30.18% during the fiscal year. The Fund’s Class A shares returned 33.03% (and 25.43% with maximum sales charge) during the same period and the Fund’s Class C shares returned 32.68% for the fiscal year (31.68% with contingent deferred sales charge applied). Total returns for other periods as of September 30, 2012 appear in the subsequent pages of this Fund’s Management Overview. |
| Q. | What primary factors influenced the Fund’s relative performance during the period? |
| A. | While the economy continued to struggle over the past year, consumer sentiment rose and retail stocks posted impressive returns. In fact, the Consumer Discretionary sector was the best performing sector of the 10 sectors tracked by Standard & Poor’s. Even as the Eurozone struggled with its debt crisis and unemployment in the U.S. remained stubbornly above 8.0%, investors were undeterred, aggressively purchasing stocks within the sector. The Federal Reserve continued to flood the financial system with money via its quantitative easing program, holding interest rates at historically low levels. Mortgage rates hit their lowest level in 40 years, encouraging refinancing and helping to stabilize the housing market. These factors were supportive of consumer spending. |
To get a clearer picture of the rising confidence of the consumer over the period, one can look at the Conference Board Consumer Confidence Index. This Index surveys individuals about their confidence in the economy six months forward and has been conducted since 1968. The value of this index, which is posted on a monthly basis, has averaged about 93 since inception. It started this fiscal period with a value just above 46 and rose to just over 70 by period end. While the Index remained below its historical average, it ended the period well above its February 2009 all-time low of 25.3 – a time when the stock market was in a free fall and there was concern about a complete collapse of the global economy. While the world economy remains fragile, it does appear to be slowly on the mend and consumer confidence has stabilized and risen since early 2009.
At the start of this fiscal period, our valuation model was also supportive of significant potential gains in the Consumer Discretionary sector. The sector’s value-to-price ratio (V/P) was 1.47 at the start of the period. In general, a value-to-price ratio above 1.00 implies that stocks are selling for less than what we believe they’re intrinsically worth. The greater the V/P of a stock, or an average of stocks in any particular industry or sector, the better the bargain. Our model focuses on company values relative to their price in the market irrespective of macro economic sentiment. Because we believe the ICON valuation model provides an indication of whether or not stocks are trading at a discount to their intrinsic worth, a ratio of 1.47 suggested Consumer Discretionary stocks were bargains at the beginning of the period. Indeed, while the sector’s V/P eventually declined to less than 1.17 on March 19, 2012, Consumer Discretionary stocks remained bargains throughout the fiscal year. ICON’s focus on company valuations, rather than broader economic conditions, proved to be a reasonably good guide to forecasting gains for Consumer Discretionary stocks for the fiscal period.
| Q. | How did the Fund’s Composition affect performance? |
| A. | We track 34 industries within the Consumer Discretionary sector. The average V/P we calculate for each industry drives our industry selection. While the sector posted impressive gains for the period, the Fund underperformed its benchmark because our overall industry over- and underweight positions were slightly off the mark. |
On the positive side, two of the industries that benefitted the Fund’s benchmark relative performance were internet retail and apparel retail. The Fund’s significant underweight position in the internet retail industry helped performance. Over the period, the Fund had a small position in this industry and it comprised almost 8% of the benchmark. While the internet retail group was positive for the period, its rise was less than that of the benchmark. The Fund’s large overweight position in the apparel retail industry was also a major positive to its benchmark relative performance. The Fund’s 15% position was more than double that of the benchmark’s, which was just over 6%. This group was among the best performing in the sector.
On the flipside, two of the industry positions that detracted from the Fund’s benchmark relative performance were homebuilding and general merchandise stores. The Fund did not have a position in the homebuilding industry, which was the top performer in the sector. While the industry comprised less than 2% of the benchmark, it nonetheless had a significant negative impact on relative performance. We did not hold this industry in the Fund due to the erratic and huge differences in
analysts’ estimates for this industry, a major component of our valuation model. With value widespread in the sector, we saw no need to concentrate in a group with such disparate earnings estimates. The Fund’s large overweight position in the general merchandise stores industry was also a major detractor to its benchmark relative performance. The Fund’s 9% position was more than double that of the benchmark’s, which was just under 4%. Because the industry underperformed the benchmark, our significant overweight detracted from the Fund’s relative performance.
| Q. | What is your investment outlook for the Consumer Discretionary sector? |
| A. | Entering the new fiscal period, we continue to see additional upside potential in the Consumer Discretionary sector. The sector’s value-to-price ratio on September 30, 2012 was 1.39, indicating the rally in Consumer Discretionary stocks could well continue. While global economic conditions remain sluggish and gas prices in the U.S. are high, consumer sentiment has nonetheless been improving slowly. Still, a tepid economic recovery may be causing investors to underestimate the value we see in the sector and we hope to be able to capitalize on Consumer Discretionary bargains going forward. |
ICON Consumer Discretionary Fund
Industry Composition
September 30, 2012
| | | | |
Home Improvement Retail | | | 15.6% | |
Cable & Satellite | | | 14.2% | |
Movies & Entertainment | | | 12.2% | |
Apparel Retail | | | 12.0% | |
General Merchandise Stores | | | 11.5% | |
Homefurnishing Retail | | | 5.4% | |
Apparel, Accessories & Luxury Goods | | | 5.1% | |
Footwear | | | 4.6% | |
Distributors | | | 3.7% | |
Broadcasting | | | 3.2% | |
Housewares & Specialties | | | 2.7% | |
Specialty Stores | | | 2.1% | |
Advertising | | | 1.7% | |
Department Stores | | | 1.5% | |
Restaurants | | | 1.3% | |
Automotive Retail | | | 1.1% | |
Other Industries (each less than 1%) | | | 1.4% | |
| | | | |
| | | 99.3% | |
| | | | |
Percentages are based upon common stocks as a percentage of net assets.
ICON Consumer Discretionary Fund
Sector Composition
September 30, 2012
| | | | |
Consumer Discretionary | | | 99.3% | |
| | | | |
| | | 99.3% | |
| | | | |
Percentages are based upon common stocks as a percentage of net assets.
ICON Consumer Discretionary Fund Average Annual Total Return
as of September 30, 2012
| | | | | | | | | | | | | | | | | | | | | | | | | | | | |
| | | Inception
Date | | | 1 Year | | | 5 Years | | | 10 Years | | | Since
Inception | | | Gross
Expense
Ratio* | | | Net
Expense
Ratio* | |
ICON Consumer Discretionary
Fund - Class S | | | 7/9/97 | | | | 34.47% | | | | 5.32% | | | | 6.93% | | | | 4.74% | | | | 1.54% | | | | 1.54% | |
S&P 1500 Consumer Discretionary Index | | | | | | | 36.98% | | | | 6.63% | | | | 9.03% | | | | 6.84% | | | | N/A | | | | N/A | |
S&P Composite 1500 Index | | | | | | | 30.18% | | | | 1.36% | | | | 8.34% | | | | 5.39% | | | | N/A | | | | N/A | |
ICON Consumer Discretionary
Fund - Class C | | | 9/30/10 | | | | 32.68% | | | | N/A | | | | N/A | | | | 20.83% | | | | 13.14% | | | | 2.75% | |
S&P 1500 Consumer Discretionary Index | | | | | | | 36.98% | | | | N/A | | | | N/A | | | | 20.14% | | | | N/A | | | | N/A | |
S&P Composite 1500 Index | | | | | | | 30.18% | | | | N/A | | | | N/A | | | | 14.61% | | | | N/A | | | | N/A | |
ICON Consumer Discretionary
Fund - Class A | | | 9/30/10 | | | | 33.03% | | | | N/A | | | | N/A | | | | 21.20% | | | | 18.49% | | | | 1.98% | |
ICON Consumer Discretionary
Fund - Class A (including maximum sales charge of 5.75%) | | | 9/30/10 | | | | 25.43% | | | | N/A | | | | N/A | | | | 17.69% | | | | 18.49% | | | | 1.98% | |
S&P 1500 Consumer Discretionary Index | | | | | | | 36.98% | | | | N/A | | | | N/A | | | | 20.14% | | | | N/A | | | | N/A | |
S&P Composite 1500 Index | | | | | | | 30.18% | | | | N/A | | | | N/A | | | | 14.61% | | | | N/A | | | | N/A | |
Past performance is not a guarantee of future results. The performance of the S&P 1500 Consumer Discretionary Index includes the reinvestment of the dividends and capital gain distributions beginning on January 1, 2002. Additional information about these performance results and the comparative indexes can be found in the About This Report section. The Adviser has agreed to limit certain Fund expenses; without these limitations, returns would have been lower. The limitation provisions may be terminated in the future.
| * | Please see the most recent prospectus for details. |
Class C total returns exclude applicable sales charges. If sales charges were included returns would be lower.
ICON Consumer Discretionary Fund
Value of a $10,000 Investment
through September 30, 2012
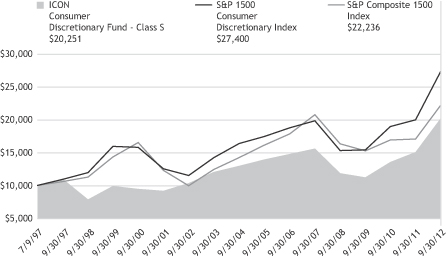
Past performance is not a guarantee of future results. The above graph compares a $10,000 investment made in the Fund’s Class S shares on the Class’ inception date of 7/9/97 to a $10,000 investment made in unmanaged securities indexes on that date. The Fund’s performance in this chart and the performance table assumes the reinvestment of dividends and capital gain distributions but does not reflect the deduction of taxes that a shareholder would pay on Fund distributions or on the redemption of Fund shares.
ICON CONSUMER DISCRETIONARY FUND
SCHEDULEOF INVESTMENTS
SEPTEMBER 30, 2012
| | | | | | | | |
| Shares or Principal Amount | | Value | |
| | | | | | | | |
| | Common Stocks (99.3%) | | | | |
| | 37,600 | | | Aaron’s, Inc. | | $ | 1,045,656 | |
| | 1,800 | | | AutoZone, Inc.† | | | 665,406 | |
| | 35,100 | | | Bed Bath & Beyond, Inc.† | | | 2,211,300 | |
| | 11,500 | | | Coach, Inc. | | | 644,230 | |
| | 161,000 | | | Comcast Corp., Class A | | | 5,758,970 | |
| | 13,400 | | | Darden Restaurants, Inc. | | | 747,050 | |
| | 51,800 | | | DIRECTV† | | | 2,717,428 | |
| | 32,500 | | | Discovery Communications, Inc., Class A† | | | 1,937,975 | |
| | 47,400 | | | Dollar Tree, Inc.† | | | 2,288,235 | |
| | 22,700 | | | Family Dollar Stores, Inc. | | | 1,505,010 | |
| | 10,300 | | | Genuine Parts Co. | | | 628,609 | |
| | 10,500 | | | Hasbro, Inc. | | | 400,785 | |
| | 91,800 | | | Home Depot, Inc. | | | 5,541,966 | |
| | 8,500 | | | Jarden Corp. | | | 449,140 | |
| | 23,849 | | | JOS A. Bank Clothiers, Inc.† | | | 1,156,200 | |
| | 17,300 | | | Kohl’s Corp. | | | 886,106 | |
| | 84,400 | | | LKQ Corp.† | | | 1,561,400 | |
| | | | | | | | |
| Shares or Principal Amount | | Value | |
| | 126,400 | | | Lowe’s Cos., Inc. | | $ | 3,822,336 | |
| | 8,000 | | | McGraw-Hill Cos., Inc. | | | 436,720 | |
| | 20,820 | | | Nike, Inc., Class B | | | 1,976,026 | |
| | 19,900 | | | Omnicom Group, Inc. | | | 1,026,044 | |
| | 22,800 | | | Ross Stores, Inc. | | | 1,472,880 | |
| | 48,600 | | | Target Corp. | | | 3,084,642 | |
| | 92,200 | | | TJX Cos., Inc. | | | 4,129,638 | |
| | 12,900 | | | Tractor Supply Co. | | | 1,275,681 | |
| | 22,100 | | | Tupperware Brands Corp. | | | 1,184,339 | |
| | 12,200 | | | Urban Outfitters, Inc.† | | | 458,232 | |
| | 15,300 | | | V.F. Corp. | | | 2,438,208 | |
| | 44,700 | | | Viacom, Inc., Class B | | | 2,395,473 | |
| | 94,000 | | | Walt Disney Co. | | | 4,914,320 | |
| | 17,300 | | | Wolverine World Wide, Inc. | | | 767,601 | |
| | | | | | | | |
| Total Common Stocks
(Cost $48,887,325) | | | 59,527,606 | |
| Total Investments 99.3%
(Cost $48,887,325) | | | 59,527,606 | |
| Other Assets Less
Liabilities 0.7% | | | 396,813 | |
| | | | | | | | |
| | Net Assets 100.0% | | $ | 59,924,419 | |
| | | | | | | | |
The accompanying notes are an integral part of the financial statements.
| † | Non-income producing security. |
| | | | |
| SCHEDULEOF INVESTMENTS | | | 11 | |
| | | | |
MANAGEMENT OVERVIEW ICON CONSUMER STAPLES FUND | | Class S Class C Class A | | ICLEX ICLCX ICRAX |
| Q. | How did the Fund perform relative to its benchmark? |
| A. | The ICON Consumer Staples Fund underperformed both its sector-specific benchmark and its broad-based benchmark for the period. The Fund’s Class S shares rose 21.50%, while the benchmark S&P 1500 Consumer Staples Index rose 23.37% and the S&P Composite 1500 Index returned 30.18% over the course of the fiscal year. The Fund’s Class A shares returned 20.94% (and 13.98% with maximum sales charge) during the same period and the Fund’s Class C shares returned 20.26% for the fiscal year (19.26% with maximum sales charge). Total returns for other periods as of September 30, 2012 appear in the subsequent pages of this Fund’s Management Overview. |
| Q. | What primary factors influenced the Fund’s relative performance during the period? |
| A. | The fiscal year was marked by concerns over macroeconomic and geopolitical conditions, including worries over the debt crisis in the EuroZone, sluggish growth both in the U.S. and abroad and turmoil in the Middle East and North Africa. In the United States, GDP growth held below 2.0% for the third straight year and the unemployment rate held above 8.0%. Global investor tension surrounding these events appeared to be the catalyst for extreme periods of volatility in the U.S. equity market. |
For investors willing to ride through the tumultuous market, the S&P 1500 Index posted a total return of 30.18%. While the Consumer Staples sector did not keep pace with the broader market, it nevertheless rose significantly and with less volatility. For example, the S&P 1500 Composite Financial Index was the third best performing of ten sector indexes, gaining 34.65% during the fiscal year. However, it had a beta of 1.37 versus the S&P 1500 Index. By contrast, the S&P 1500 Composite Consumer Staples Index, while not fully participating in the total return of the Financials Index, had a beta of about 0.52 versus the S&P 1500 Index over the period.
The reduced volatility of the Consumer Staples sector has served risk adverse investors well since the extremely volatile bull market began in March 2009. The S&P 1500 Index was up 113.98% between February 2009 and the end of the fiscal year. Over the same period, the S&P 1500 Consumer Staples Index returned 97.26%. The lower return, however,
came with a relatively smoother ride. The beta on the S&P 1500 Consumer Staples Index relative to the S&P 1500 Index was about 0.53 during those three and a half years.
The Consumer Staples Fund slightly underperformed its benchmark during the fiscal period, but with a beta of just over 0.50, the Fund performed with significantly less volatility than the S&P 1500 Index. Thus, for investors who look to the relative stability of this sector during these volatile times, the Fund was able to capture much of its benchmark’s return with relatively less volatility.
| Q. | How did the Fund’s composition affect performance? |
| A. | An overweight position in the hypermarkets & supercenters contributed positively to the Fund’s performance. Similarly, being underweight in the packaged foods & meat industry benefitted Fund performance, as the industry underperformed relative to the benchmark. Conversely, the Fund’s positions in the personal products and agricultural products industries were among the groups that detracted from the Fund’s relative performance. |
| Q. | What is your investment outlook for the Consumer Staples sector? |
| A. | As we begin the new fiscal period, our valuation model indicates significant upside potential in the sector. Indeed, at this time we view the entire market as attractive from a valuation standpoint. We therefore believe the Consumer Staples sector should continue to rally over the next fiscal year along with the broader market. |
Closing out fiscal year 2012, we continue to see value in the hypermarkets & supercenters industry in general and Wal-Mart Stores in particular. Our model indicates the largest retailer in the world is trading well below our calculation of the company’s intrinsic value. We also maintain a large position in the tobacco industry. We expect the Consumer Staples sector will continue to be a stable haven relative to the broader market. In short, our model suggests the sector may continue higher over the next fiscal year and could do so with less volatility than the market.
ICON Consumer Staples Fund
Industry Composition
September 30, 2012
| | | | |
Tobacco | | | 21.7% | |
Household Products | | | 16.2% | |
Hypermarkets & Super Centers | | | 15.7% | |
Packaged Foods & Meats | | | 10.5% | |
Drug Retail | | | 9.7% | |
Soft Drinks | | | 7.5% | |
Agricultural Products | | | 5.7% | |
General Merchandise Stores | | | 5.7% | |
Food Retail | | | 4.9% | |
Brewers | | | 1.7% | |
| | | | |
| | | 99.3% | |
| | | | |
Percentages are based upon common stocks as a percentage of net assets.
ICON Consumer Staples Fund
Sector Composition
September 30, 2012
| | | | |
Consumer Staples | | | 93.6% | |
Consumer Discretionary | | | 5.7% | |
| | | | |
| | | 99.3% | |
| | | | |
Percentages are based upon common stocks as a percentage of net assets.
ICON Consumer Staples Fund Average Annual Total Return
as of September 30, 2012
| | | | | | | | | | | | | | | | | | | | | | | | | | | | |
| | | Inception
Date | | | 1 Year | | | 5 Years | | | 10 Years | | | Since
Inception | | | Gross
Expense
Ratio* | | | Net
Expense
Ratio* | |
ICON Consumer Staples
Fund - Class S | | | 5/9/97 | | | | 21.50% | | | | 3.67% | | | | 6.55% | | | | 8.01% | | | | 1.57% | | | | 1.50% | |
S&P 1500 Consumer Staples Index | | | | | | | 23.37% | | | | 8.18% | | | | 9.16% | | | | 7.05% | | | | N/A | | | | N/A | |
S&P Composite 1500 Index | | | | | | | 30.18% | | | | 1.36% | | | | 8.34% | | | | 6.01% | | | | N/A | | | | N/A | |
ICON Consumer Staples
Fund - Class C | | | 9/30/10 | | | | 20.26% | | | | N/A | | | | N/A | | | | 13.23% | | | | 7.00% | | | | 2.50% | |
S&P 1500 Consumer Staples Index | | | | | | | 23.37% | | | | N/A | | | | N/A | | | | 16.83% | | | | N/A | | | | N/A | |
S&P Composite 1500 Index | | | | | | | 30.18% | | | | N/A | | | | N/A | | | | 14.61% | | | | N/A | | | | N/A | |
ICON Consumer Staples
Fund - Class A | | | 9/30/10 | | | | 20.94% | | | | N/A | | | | N/A | | | | 14.54% | | | | 7.60% | | | | 1.75% | |
ICON Consumer Staples Fund Average Annual Total Return (continued)
as of September 30, 2012
| | | | | | | | | | | | | | | | | | | | | | | | | | | | |
| | | Inception
Date | | | 1 Year | | | 5 Years | | | 10 Years | | | Since
Inception | | | Gross
Expense
Ratio* | | | Net
Expense
Ratio* | |
ICON Consumer Staples
Fund - Class A (including maximum sales charge of 5.75%) | | | 9/30/10 | | | | 13.98% | | | | N/A | | | | N/A | | | | 11.22% | | | | 7.60% | | | | 1.75% | |
S&P 1500 Consumer Staples Index | | | | | | | 23.37% | | | | N/A | | | | N/A | | | | 16.83% | | | | N/A | | | | N/A | |
S&P Composite 1500 Index | | | | | | | 30.18% | | | | N/A | | | | N/A | | | | 14.61% | | | | N/A | | | | N/A | |
Past performance is not a guarantee of future results. The performance of the S&P 1500 Consumer Discretionary Index includes the reinvestment of the dividends and capital gain distributions beginning on January 1, 2002. Additional information about these performance results and the comparative indexes can be found in the About This Report section. The Adviser has agreed to limit certain Fund expenses; without these limitations, returns would have been lower. The limitation provisions may be terminated in the future.
| * | Please see the most recent prospectus for details. |
Class C total returns exclude applicable sales charges. If sales charges were included returns would be lower.
ICON Consumer Staples Fund
Value of a $10,000 Investment
through September 30, 2012
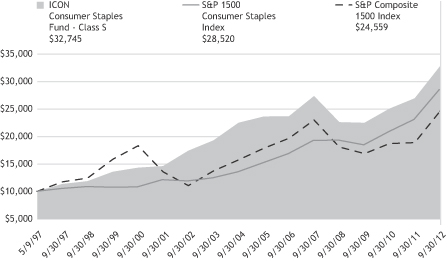
Past performance is not a guarantee of future results. The above graph compares a $10,000 investment made in the Fund’s Class S shares on the Class’ inception date of 5/9/97 to a $10,000 investment made in unmanaged securities indexes on that date. The Fund’s performance in this chart and the performance table assumes the reinvestment of dividends and capital gain distributions but does not reflect the deduction of taxes that a shareholder would pay on Fund distributions or on the redemption of Fund shares.
ICON CONSUMER STAPLES FUND
SCHEDULEOF INVESTMENTS
SEPTEMBER 30, 2012
| | | | | | | | |
| Shares or Principal Amount | | Value | |
| | Common Stocks (99.3%) | |
| | 56,300 | | | Altria Group, Inc. | | $ | 1,879,857 | |
| | 48,300 | | | Archer-Daniels-Midland Co. | | | 1,312,794 | |
| | 6,200 | | | Bunge, Ltd. | | | 415,710 | |
| | 15,200 | | | Casey’s General Stores, Inc. | | | 868,528 | |
| | 52,200 | | | Coca-Cola Co. | | | 1,979,946 | |
| | 4,700 | | | Colgate-Palmolive Co. | | | 503,934 | |
| | 18,900 | | | Costco Wholesale Corp. | | | 1,892,363 | |
| | 44,100 | | | CVS Caremark Corp. | | | 2,135,322 | |
| | 16,000 | | | Dollar Tree, Inc.† | | | 772,400 | |
| | 10,600 | | | Energizer Holdings, Inc. | | | 790,866 | |
| | 6,000 | | | Family Dollar Stores, Inc. | | | 397,800 | |
| | 20,000 | | | General Mills, Inc. | | | 797,000 | |
| | 6,900 | | | HJ Heinz Co. | | | 386,055 | |
| | 23,600 | | | Hormel Foods Corp. | | | 690,064 | |
| | 9,900 | | | Ingredion, Inc. | | | 546,084 | |
| | 24,700 | | | Kimberly-Clark Corp. | | | 2,118,766 | |
| | 46,300 | | | Kroger Co. | | | 1,089,902 | |
| | | | | | | | |
| Shares or Principal Amount | | Value | |
| | 16,900 | | | Lorillard, Inc. | | $ | 1,968,005 | |
| | 7,900 | | | McCormick & Co., Inc. | | | 490,116 | |
| | 15,400 | | | Molson Coors Brewing Co., Class B | | | 693,770 | |
| | 21,700 | | | Nestle S.A., ADR | | | 1,371,657 | |
| | 14,200 | | | PepsiCo, Inc. | | | 1,004,934 | |
| | 32,800 | | | Philip Morris International, Inc. | | | 2,950,032 | |
| | 44,500 | | | Procter & Gamble Co. | | | 3,086,520 | |
| | 43,200 | | | Reynolds American, Inc. | | | 1,872,288 | |
| | 17,400 | | | Target Corp. | | | 1,104,378 | |
| | 13,200 | | | Unilever PLC, ADR | | | 482,064 | |
| | 59,200 | | | Wal-Mart Stores, Inc. | | | 4,368,960 | |
| | 48,400 | | | Walgreen Co. | | | 1,763,696 | |
| | | | | | | | |
| Total Common Stocks
(Cost $36,385,397) | | | 39,733,811 | |
| Total Investments 99.3%
(Cost $36,385,397) | | | 39,733,811 | |
| Other Assets Less
Liabilities 0.7% | | | 266,015 | |
| | | | | | | | |
| | Net Assets 100.0% | | $ | 39,999,826 | |
| | | | | | | | |
The accompanying notes are an integral part of the financial statements.
| † | Non-income producing security. |
| ADR | American Depositary Receipt |
| | | | |
| SCHEDULEOF INVESTMENTS | | | 17 | |
| | | | |
MANAGEMENT OVERVIEW ICON ENERGY FUND | | Class S Class C Class A | | ICENX ICEEX ICEAX |
| Q. | How did the Fund perform relative to its benchmarks? |
| A. | For the fiscal year ending September 30, 2012, the ICON Energy Fund, Class S shares, returned 18.87%, lagging its sector-specific benchmark, the S&P 1500 Energy Index, which gained 26.41%, and its broad benchmark, the S&P Composite 1500 Index, which rose 30.18%. The Fund’s Class A shares returned 18.47% (and 11.67% with maximum sales charge) during the same period and the Fund’s Class C shares returned 17.50% for the fiscal year (16.50% with maximum contingent deferred sales charge). Total returns for other periods as of September 30, 2012 appear in the subsequent pages of this Fund’s Management Overview. |
| Q. | What primary factors were behind the Fund’s relative performance? |
| A. | Concerns regarding the impact of the Arab Spring and Europe’s economic woes spreading to the US were validated by sub-2% year-over-year GDP growth reported for the first two quarters of 2011. Over the course of the 12-month fiscal year, these concerns abated somewhat. GDP year-over-year growth rates have held above 2% since the last quarter of 2011, moderating the anticipated adverse effect of the European crises. Action by the Federal Reserve, and, in particular, the Fed’s continued quantitative easing, has also proven generally positive for the equity markets. |
During the fiscal year ending September, 30, 2012, the price of oil, as measured by West Texas Intermediate Crude, climbed over 16% as it went from $78.93 per barrel to close at $92.18. The crack spread, which reflects the difference between the price of crude oil and the petroleum products extracted from crude, also improved by about 21% over the fiscal year. Although the increases in the price of crude and the crack spread are impressive, they nonetheless fell short of the 30.18% gain by the S&P Composite 1500 Index over the fiscal year. Additionally, both the natural gas and coal indexes closed lower over the last year, making it difficult for Energy stocks to keep pace with the broader market. Natural gas futures fell almost 10%. The NYMEX spot price on coal lost over 50% during the fiscal year. Thus, a number of energy-related indexes proved to be less robust than the equity market as a whole.
| Q. | How did the Fund’s composition affect performance? |
| A. | The ICON Energy Fund began the fiscal year with exposure to the coal & consumable fuels industry. By mid-April, however, we liquidated the Fund’s coal & consumable fuels holdings when we saw value deteriorate because of lower earnings per share and a downward revision in long term growth. While we were able to mitigate some of the Fund’s losses by paring our position in this industry, net, coal & consumable fuels nonetheless had a negative impact on Fund performance relative to the S&P 1500 Energy Index. Exxon Mobil was the biggest single detractor to Fund performance relative to the benchmark, leading to contribution variance of about 2.5% of underperformance. Exxon Mobil had a weighted average position of nearly 27% of the S&P 1500 Energy Index for the fiscal year with a total return of 29.06%. By contrast, the Fund’s weighted average position in Exxon Mobil over the year was just over 17%, approximately 10% lower than the benchmark. |
The Fund’s failure to capitalize on opportunities within the oil & gas storage and transportation industry also adversely impacted the Fund. We saw little value in this industry relative to other industries within the Energy sector. Unfortunately, while the Fund held no oil & gas storage and transportation securities, the industry returned approximately 53% to the benchmark, well above the S&P 1500 Energy Index returns at 26.41%. The Fund’s lack of exposure to this industry detracted from Fund performance relative to the benchmark. On the plus side, oil & gas refining and marketing had a positive effect on the Fund, adding almost 1% to the Fund’s relative performance to help offset some of the above detractors.
| Q. | What is your investment outlook for the Energy sector? |
| A. | In light of the most recent round of quantitative easing initiated by the Federal Reserve in September 2012 and an overall average value-to-price ratio for the domestic market of 1.41 as we head into fiscal year 2013, we remain optimistic about opportunities within the Energy sector. Both the oil & gas drilling and oil & gas equipment & services industries look particularly attractive based on our valuation methodology. |
ICON Energy Fund
Industry Composition
September 30, 2012
| | | | |
Integrated Oil & Gas | | | 45.8% | |
Oil & Gas Equipment & Services | | | 23.8% | |
Oil & Gas Drilling | | | 14.3% | |
Oil & Gas Refining & Marketing | | | 12.0% | |
Oil & Gas Exploration & Production | | | 3.2% | |
| | | | |
| | | 99.1% | |
| | | | |
Percentages are based upon common stocks as a percentage of net assets.
ICON Energy Fund
Sector Composition
September 30, 2012
Percentages are based upon common stocks as a percentage of net assets.
ICON Energy Fund
Average Annual Total Return
as of September 30, 2012
| | | | | | | | | | | | | | | | | | | | | | | | | | | | |
| | | Inception
Date | | | 1 Year | | | 5 Years | | | 10 Years | | | Since
Inception | | | Gross
Expense
Ratio* | | | Net
Expense
Ratio* | |
ICON Energy Fund - Class S | | | 11/5/97 | | | | 18.87% | | | | 0.07% | | | | 14.86% | | | | 11.75% | | | | 1.20% | | | | 1.20% | |
S&P 1500 Energy Index | | | | | | | 26.41% | | �� | | 1.08% | | | | 14.68% | | | | 9.38% | | | | N/A | | | | N/A | |
S&P Composite 1500 Index | | | | | | | 30.18% | | | | 1.36% | | | | 8.34% | | | | 5.13% | | | | N/A | | | | N/A | |
ICON Energy Fund - Class C | | | 9/30/10 | | | | 17.50% | | | | N/A | | | | N/A | | | | 8.26% | | | | 2.47% | | | | 2.47% | |
S&P 1500 Energy Index | | | | | | | 26.41% | | | | N/A | | | | N/A | | | | 16.36% | | | | N/A | | | | N/A | |
S&P Composite 1500 Index | | | | | | | 30.18% | | | | N/A | | | | N/A | | | | 14.61% | | | | N/A | | | | N/A | |
ICON Energy Fund - Class A | | | 9/30/10 | | | | 18.47% | | | | N/A | | | | N/A | | | | 9.10% | | | | 1.70% | | | | 1.70% | |
ICON Energy Fund - Class A (including maximum sales charge of 5.75%) | | | 9/30/10 | | | | 11.67% | | | | N/A | | | | N/A | | | | 5.91% | | | | 1.70% | | | | 1.70% | |
S&P 1500 Energy Index | | | | | | | 26.41% | | | | N/A | | | | N/A | | | | 16.36% | | | | N/A | | | | N/A | |
S&P Composite 1500 Index | | | | | | | 30.18% | | | | N/A | | | | N/A | | | | 14.61% | | | | N/A | | | | N/A | |
Past performance is not a guarantee of future results. Information about these performance results and the comparative indexes can be found in the About This Report section. The Adviser has agreed to limit certain Fund expenses; without these limitations, returns would have been lower. The limitation provisions may be terminated in the future.
| * | Please see the most recent prospectus for details. |
Class C total returns exclude applicable sales charges. If sales charges were included returns would be lower.
ICON Energy Fund
Value of a $10,000 Investment
through September 30, 2012
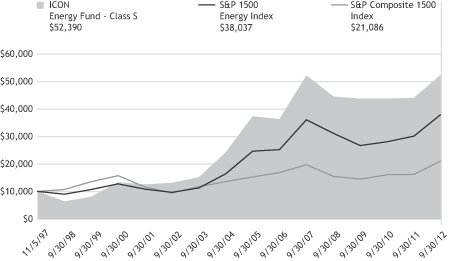
Past performance is not a guarantee of future results. The above graph compares a $10,000 investment made in the Fund’s Class S shares on the Class’ inception date of 11/5/97 to a $10,000 investment made in unmanaged securities indexes on that date. The Fund’s performance in this chart and the performance table assumes the reinvestment of dividends and capital gain distributions but does not reflect the deduction of taxes that a shareholder would pay on Fund distributions or on the redemption of Fund shares.
ICON ENERGY FUND
SCHEDULEOF INVESTMENTS
SEPTEMBER 30, 2012
| | | | | | | | |
| Shares or Principal Amount | | Value | |
| | Common Stocks (99.1%) | | | | |
| | 145,100 | | | Apache Corp. | | $ | 12,546,797 | |
| | 349,100 | | | Atwood Oceanics, Inc.† | | | 15,866,595 | |
| | 137,100 | | | BP PLC, ADR | | | 5,807,556 | |
| | 231,800 | | | Cameron International Corp.† | | | 12,997,026 | |
| | 631,000 | | | Chevron Corp. | | | 73,549,360 | |
| | 464,500 | | | ConocoPhillips | | | 26,560,110 | |
| | 107,100 | | | Core Laboratories NV | | | 13,010,508 | |
| | 244,200 | | | Diamond Offshore Drilling, Inc. | | | 16,070,802 | |
| | 169,400 | | | Dril-Quip, Inc.† | | | 12,176,472 | |
| | 296,200 | | | ENI SpA, ADR(a) | | | 12,985,408 | |
| | 221,000 | | | Ensco PLC, Class A | | | 12,057,760 | |
| | 58,700 | | | EOG Resources, Inc. | | | 6,577,335 | |
| | 950,900 | | | Exxon Mobil Corp. | | | 86,959,805 | |
| | 155,900 | | | FMC Technologies, Inc.† | | | 7,218,170 | |
| | 303,900 | | | Halliburton Co. | | | 10,238,391 | |
| | 255,200 | | | Helmerich & Payne, Inc. | | | 12,150,072 | |
| | 372,300 | | | HollyFrontier Corp. | | | 15,364,821 | |
| | 210,000 | | | Marathon Petroleum Corp. | | | 11,463,900 | |
| | 358,300 | | | Murphy Oil Corp. | | | 19,237,127 | |
| | 818,600 | | | Nabors Industries, Ltd.† | | | 11,484,958 | |
| | | | | | | | |
| Shares or Principal Amount | | Value | |
| | 358,600 | | | National Oilwell Varco, Inc. | | $ | 28,727,446 | |
| | 470,900 | | | Noble Corp. | | | 16,848,802 | |
| | 392,500 | | | Occidental Petroleum Corp. | | | 33,778,550 | |
| | 106,400 | | | Oceaneering International, Inc. | | | 5,878,600 | |
| | 277,250 | | | Phillips 66 | | | 12,856,082 | |
| | 171,300 | | | Royal Dutch Shell PLC, ADR | | | 11,889,933 | |
| | 568,300 | | | Schlumberger, Ltd. | | | 41,105,139 | |
| | 226,500 | | | Tenaris S.A., ADR | | | 9,234,405 | |
| | 983,800 | | | Valero Energy Corp. | | | 31,166,784 | |
| | | | | | | | |
| Total Common Stocks
(Cost $531,083,203) | | | 585,808,714 | |
| Collateral for Securities on
Loan (1.3%) | | | | |
| | 7,793,958 | | | State Street Navigator Prime Portfolio | | | 7,793,958 | |
| | | | | | | | |
| Total Collateral for
Securities on Loan
(Cost $7,793,958) | | | 7,793,958 | |
| Total Investments 100.4%
(Cost $538,877,161) | | | 593,602,672 | |
| Liabilities Less
Other Assets (0.4)% | | | (2,455,076 | ) |
| | | | | | | | |
| | Net Assets 100.0% | | $ | 591,147,596 | |
| | | | | | | | |
The accompanying notes are an integral part of the financial statements.
| † | Non-income producing security. |
| (a) | All or a portion of the security was on loan as of September 30, 2012. |
| ADR | American Depositary Receipt |
| | | | |
| SCHEDULEOF INVESTMENTS | | | 23 | |
| | | | |
MANAGEMENT OVERVIEW ICON FINANCIAL FUND | | Class S Class C Class A | | ICFSX ICOCX ICFAX |
| Q. | How did the Fund perform relative to its benchmarks? |
| A. | The ICON Financial Fund, Class S, gained 29.54% for the fiscal year ending September 30, 2012, lagging the Fund’s sector-specific benchmark, the S&P 1500 Financials Index, which returned 34.65%. The ICON Financial Fund Class S also lagged its broad benchmark, the S&P Composite 1500 Index, which rose 30.18%. Class A shares of the Fund returned 28.83% (and 21.32% with maximum sales charge) during the same period while the Fund’s Class C shares returned 27.79% (26.79% with the contingent deferred sales charge applied). Total returns for other periods as of September 30, 2012 appear in the subsequent pages of this Fund’s Management Overview. |
| Q. | What primary factors were behind the Fund’s relative performance? |
| A. | The Financials sector was the third highest performing sector over the course of the fiscal year. While the Financials sector landscape still holds a lot of uncertainty, the news improved over the past 12 months. |
The S&P 1500 Financial Index lost approximately 22% in the third quarter of 2011 as fears of the European financial crisis were at their peak. European banks were down even more. ING and Deutsche Bank were both trading more than 40% lower during this time period. Conditions began improving as the French and Germans structured a three part plan to stabilize the sovereign debt crisis. In addition, action by the Federal Reserve, and, in particular, the Fed’s continued quantitative easing, has also proven generally positive for equity markets. Earnings growth in the Financials sector grew approximately 8% over the last year and the reported number of bank failures declined.
Financials experienced significant volatility during the fiscal year as concerns about the financial stability of the European Union ebbed and flowed. In fiscal year 2012, the S&P Financial Index had a beta of 1.37, reflecting a material increase in the sector’s volatility from fiscal year 2011, when the index had a beta of 1.27. ICON struggled to identify themes in the Financials sector during this volatile period and these difficulties played a role in the Fund’s underperformance.
| Q. | How did the Fund’s composition affect performance? |
| A. | At the beginning of fiscal year 2012, ICON calculated a value-to-price (V/P) ratio of 1.62 for the Financials sector. We saw what we believed were opportunities within the consumer finance industry and took an overweight position. While this industry returned about 37% in the S&P1500 index, the Fund’s consumer finance holdings significantly underperformed, returning just over 6% during the fiscal year. Cash America International was the single biggest detractor to Fund performance, losing 18.7% of its value on July 26, 2012 on poor earnings reports. Ezcorp Inc, another publicly traded pawn shop operation, struggled over the fiscal year as well. The Fund’s overweight in the investment banking & brokerage industry likewise adversely impacted the Fund. In contrast, the Fund benefitted from its holdings in the life & health insurance industry, but these gains could not otherwise offset Fund underperformance. |
| Q. | What is your investment outlook for the Financials sector? |
| A. | As of September 30, 2012, we calculate a V/P of 1.30 for the Financials sector. Although the sector’s V/P falls short of the overall market V/P of 1.39, we nonetheless hope to capitalize on specific industry opportunities we see within the sector. For example the asset management & custody banks industry has a V/P of 1.45 as we finish fiscal year 2012. The potential we see in this and other select industries within the Financials sector gives us reason to be optimistic going into fiscal year 2013. |
ICON Financial Fund
Industry Composition
September 30, 2012
| | | | |
Diversified Banks | | | 22.4% | |
Asset Management & Custody Banks | | | 22.1% | |
Consumer Finance | | | 18.2% | |
Other Diversified Financial Services | | | 8.8% | |
Regional Banks | | | 8.1% | |
Property & Casualty Insurance | | | 6.6% | |
Specialized Finance | | | 6.2% | |
Investment Banking & Brokerage | | | 4.0% | |
Insurance Brokers | | | 2.4% | |
| | | | |
| | | 98.8% | |
| | | | |
Percentages are based upon common stocks as a percentage of net assets.
ICON Financial Fund
Sector Composition
September 30, 2012
Percentages are based upon common stocks as a percentage of net assets.
ICON Financial Fund
Average Annual Total Return
as of September 30, 2012
| | | | | | | | | | | | | | | | | | | | | | | | | | | | |
| | | Inception
Date | | | 1 Year | | | 5 Years | | | 10 Years | | | Since
Inception | | | Gross
Expense
Ratio* | | | Net
Expense
Ratio* | |
ICON Financial Fund - Class S | | | 7/1/97 | | | | 29.54% | | | | -12.28% | | | | 0.28% | | | | 2.33% | | | | 1.40% | | | | 1.40% | |
S&P 1500 Financials Index | | | | | | | 34.65% | | | | -11.25% | | | | 0.42% | | | | 1.92% | | | | N/A | | | | N/A | |
S&P Composite 1500 Index | | | | | | | 30.18% | | | | 1.36% | | | | 8.34% | | | | 5.51% | | | | N/A | | | | N/A | |
ICON Financial Fund - Class C | | | 9/30/10 | | | | 27.79% | | | | N/A | | | | N/A | | | | 3.55% | | | | 35.28% | | | | 2.50% | |
S&P 1500 Financials Index | | | | | | | 34.65% | | | | N/A | | | | N/A | | | | 6.82% | | | | N/A | | | | N/A | |
S&P Composite 1500 Index | | | | | | | 30.18% | | | | N/A | | | | N/A | | | | 14.61% | | | | N/A | | | | N/A | |
ICON Financial Fund - Class A | | | 9/30/10 | | | | 28.83% | | | | N/A | | | | N/A | | | | 4.42% | | | | 7.37% | | | | 1.75% | |
ICON Financial Fund - Class A (including maximum sales charge of 5.75%) | | | 9/30/10 | | | | 21.32% | | | | N/A | | | | N/A | | | | 1.36% | | | | 7.37% | | | | 1.75% | |
S&P 1500 Financials Index | | | | | | | 34.65% | | | | N/A | | | | N/A | | | | 6.82% | | | | N/A | | | | N/A | |
S&P Composite 1500 Index | | | | | | | 30.18% | | | | N/A | | | | N/A | | | | 14.61% | | | | N/A | | | | N/A | |
Past performance is not a guarantee of future results. Information about these performance results and the comparative indexes can be found in the About This Report section. The Adviser has agreed to limit certain Fund expenses; without these limitations, returns would have been lower. The limitation provisions may be terminated in the future.
| * | Please see the most recent prospectus for details. |
Class C total returns exclude applicable sales charges. If sales charges were included returns would be lower.
ICON Financial Fund
Value of a $10,000 Investment
through September 30, 2012
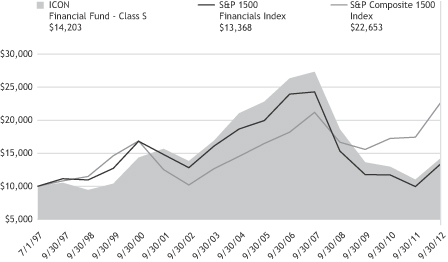
Past performance is not a guarantee of future results. The above graph compares a $10,000 investment made in the Fund’s Class S shares on the Class’ inception date of 7/1/97 to a $10,000 investment made in unmanaged securities indexes on that date. The Fund’s performance in this chart and the performance table assumes the reinvestment of dividends and capital gain distributions but does not reflect the deduction of taxes that a shareholder would pay on Fund distributions or on the redemption of Fund shares.
ICON FINANCIAL FUND
SCHEDULEOF INVESTMENTS
SEPTEMBER 30, 2012
| | | | | | | | |
| Shares or Principal Amount | | Value | |
| | Common Stocks (98.8%) | | | | |
| | 11,100 | | | ACE, Ltd. | | $ | 839,160 | |
| | 7,900 | | | Affiliated Managers Group, Inc.† | | | 971,700 | |
| | 16,900 | | | Aon PLC | | | 883,701 | |
| | 35,800 | | | BB&T Corp. | | | 1,187,128 | |
| | 22,200 | | | Capital One Financial Corp. | | | 1,265,622 | |
| | 27,600 | | | Cash America International, Inc. | | | 1,064,532 | |
| | 7,400 | | | Chubb Corp. | | | 564,472 | |
| | 7,900 | | | Cullen/Frost Bankers, Inc. | | | 453,697 | |
| | 65,700 | | | DFC Global Corp.† | | | 1,126,755 | |
| | 36,000 | | | Ezcorp, Inc., Class A† | | | 825,480 | |
| | 44,900 | | | Federated Investors, Inc., Class B | | | 928,981 | |
| | 26,700 | | | First Cash Financial Services, Inc.† | | | 1,228,467 | |
| | 10,800 | | | Franklin Resources, Inc. | | | 1,350,756 | |
| | 13,000 | | | Goldman Sachs Group, Inc. | | | 1,477,840 | |
| | 79,900 | | | JPMorgan Chase & Co. | | | 3,234,352 | |
| | 6,000 | | | M&T Bank Corp. | | | 570,960 | |
| | | | | | | | |
| Shares or Principal Amount | | Value | |
| | 26,100 | | | Moody’s Corp. | | $ | 1,152,837 | |
| | 49,000 | | | NASDAQ OMX Group, Inc. | | | 1,141,455 | |
| | 34,200 | | | Northern Trust Corp. | | | 1,587,393 | |
| | 12,500 | | | PNC Financial Services Group, Inc. | | | 788,750 | |
| | 82,800 | | | SEI Investments Co. | | | 1,776,060 | |
| | 9,800 | | | T Rowe Price Group, Inc. | | | 620,340 | |
| | 15,300 | | | Travelers Cos., Inc. | | | 1,044,378 | |
| | 77,700 | | | U.S. Bancorp | | | 2,665,110 | |
| | 28,200 | | | Waddell & Reed Financial, Inc., Class A | | | 924,114 | |
| | 162,600 | | | Wells Fargo & Co. | | | 5,614,578 | |
| | 18,300 | | | World Acceptance Corp.† | | | 1,234,335 | |
| | | | | | | | |
| Total Common Stocks
(Cost $32,856,999) | | | 36,522,953 | |
| Total Investments 98.8%
(Cost $32,856,999) | | | 36,522,953 | |
| Other Assets Less
Liabilities 1.2% | | | 452,938 | |
| | | | | | | | |
| | Net Assets 100.0% | | $ | 36,975,891 | |
| | | | | | | | |
The accompanying notes are an integral part of the financial statements.
| † | Non-income producing security. |
| | |
| 28 | | SCHEDULEOF INVESTMENTS |
| | | | |
MANAGEMENT OVERVIEW ICON HEALTHCARE FUND | | Class S Class C Class A | | ICHCX ICHEX ICHAX |
| Q. | How did the Fund perform relative to its benchmarks? |
| A. | For the fiscal year ended September 30, 2012, the Fund’s sector-specific benchmark, the S&P 1500 Health Care Index, returned 30.19%, and its broad benchmark, the S&P Composite 1500 Index, returned 30.18%. The ICON Healthcare Fund, Class S, outperformed both benchmarks, gaining 30.76% during the same period. The Fund’s Class A shares returned 30.19% (and 22.66% with maximum sales charge) during the same period and the Fund’s Class C shares returned 29.24% for the fiscal year (28.24% with contingent deferred sales charge applied). Total returns for other periods as of September 30, 2012 appear in the subsequent pages of this Fund’s Management Overview. |
| Q. | What primary factors were behind the Fund’s relative performance? |
| A. | The broad market performed strongly over the past year, and despite a brief pullback in late Spring over renewed fears of a European debt crisis, equities returned over 30%. Health Care stocks kept pace with the index, providing slightly less volatility. After the past few years of uncertainty and debate over the future of the national health care system, 2012 provided a much tamer investing environment for the sector. Even with the much publicized Supreme Court ruling to uphold the Affordable Care Act, there was little reaction apparent within the equity markets. |
Biotechnology companies provided the largest gains within the Health Care sector, with the benchmark averaging 54% in positive returns compared to the sector average of 30%. The ICON Healthcare Fund was nearly double the index in its exposure to biotech securities, and benefitted greatly from its overweight position.
Pharmaceutical companies, which make up 47% of the health care index, also contributed significantly to overall Fund performance. New drug approvals, favorable quarterly earnings reports, and M&A activity have boosted some of the small-cap holdings in the Fund.
| Q. | How did the Fund’s Composition affect performance? |
| A. | Strong company performance in the biotech industry was the greatest contributor to Fund performance. Companies like Gilead Sciences Inc. and Amgen grew steadily throughout the year, as profits came in above expectations and analysts’ earnings forecasts were revised upwards. |
| | Almost one-third of the Fund’s total returns came from this industry, which ended the year at just over 25% of all holdings (compared with an almost 14% weight in the benchmark). |
Pharmaceutical giant Merck & Co. was up almost 44% for the year on news of promising new drug approvals and favorable litigation results and Par Pharmaceuticals jumped over 36% upon announcing its acquisition by TPG Capital. The Fund’s holdings in the pharmaceuticals industry accounted for over 13% in the portfolio’s total return.
The pharmaceuticals industry, however, did not come without its share of volatility. Questcor Pharmaceuticals Inc. was the largest detractor to Fund performance, dropping over 60% in a week after insurer Aetna Inc. said it would limit coverage of Questcor’s top-selling drug, H.P. Acthar, a medicine used to treat multiple sclerosis and infant seizures.
| Q. | What is your investment outlook for the Health Care sector? |
| A. | The ICON valuation methodology indicates that equities are still significantly underpriced. Our calculations suggest the Health Care sector continues to have significant upside, trading at a 48% discount to our measurement of intrinsic value. We are optimistic the economy will continue to expand and the market will continue on its recovery from the March 2009 low. The Fund goes into 2013 with heavy overweights in the biotechnology and pharmaceuticals industries and remains bearish in the health care supplies and life science tools & services industries. |
ICON Healthcare Fund
Industry Composition
September 30, 2012
| | | | |
Pharmaceuticals | | | 46.6% | |
Biotechnology | | | 25.1% | |
Health Care Equipment | | | 13.1% | |
Managed Health Care | | | 6.5% | |
Health Care Services | | | 4.4% | |
Health Care Distributors | | | 4.3% | |
| | | | |
| | | 100.0% | |
| | | | |
Percentages are based upon common stocks as a percentage of net assets.
ICON Healthcare Fund
Sector Composition
September 30, 2012
| | | | |
Health Care | | | 100.0% | |
| | | | |
| | | 100.0% | |
| | | | |
Percentages are based upon common stocks as a percentage of net assets.
ICON Healthcare Fund Average Annual Total Return
as of September 30, 2012
| | | | | | | | | | | | | | | | | | | | | | | | | | | | |
| | | Inception
Date | | | 1 Year | | | 5 Years | | | 10 Years | | | Since
Inception | | | Gross
Expense
Ratio* | | | Net
Expense
Ratio* | |
ICON Healthcare Fund - Class S | | | 2/24/97 | | | | 30.76% | | | | 2.28% | | | | 7.79% | | | | 8.77% | | | | 1.36% | | | | 1.36% | |
S&P 1500 Health Care Index | | | | | | | 30.19% | | | | 5.16% | | | | 7.30% | | | | 7.27% | | | | N/A | | | | N/A | |
S&P Composite 1500 Index | | | | | | | 30.18% | | | | 1.36% | | | | 8.34% | | | | 6.06% | | | | N/A | | | | N/A | |
ICON Healthcare Fund - Class C | | | 9/30/10 | | | | 29.24% | | | | N/A | | | | N/A | | | | 16.82% | | | | 31.38% | | | | 2.50% | |
S&P 1500 Health Care Index | | | | | | | 30.19% | | | | N/A | | | | N/A | | | | 17.71% | | | | N/A | | | | N/A | |
S&P Composite 1500 Index | | | | | | | 30.18% | | | | N/A | | | | N/A | | | | 14.61% | | | | N/A | | | | N/A | |
ICON Healthcare Fund - Class A | | | 9/30/10 | | | | 30.19% | | | | N/A | | | | N/A | | | | 17.68% | | | | 7.15% | | | | 1.75% | |
ICON Healthcare Fund - Class A (including maximum sales charge of 5.75%) | | | 9/30/10 | | | | 22.66% | | | | N/A | | | | N/A | | | | 14.25% | | | | 7.15% | | | | 1.75% | |
S&P 1500 Health Care Index | | | | | | | 30.19% | | | | N/A | | | | N/A | | | | 17.71% | | | | N/A | | | | N/A | |
S&P Composite 1500 Index | | | | | | | 30.18% | | | | N/A | | | | N/A | | | | 14.61% | | | | N/A | | | | N/A | |
Past performance is not a guarantee of future results. Information about these performance results and the comparative indexes can be found in the About This Report section. The Adviser has agreed to limit certain Fund expenses; without these limitations, returns would have been lower. The limitation provisions may be terminated in the future.
| * | Please see the most recent prospectus for details. |
Class C total returns exclude applicable sales charges. If sales charges were included returns would be lower.
ICON Healthcare Fund
Value of a $10,000 Investment
through September 30, 2012
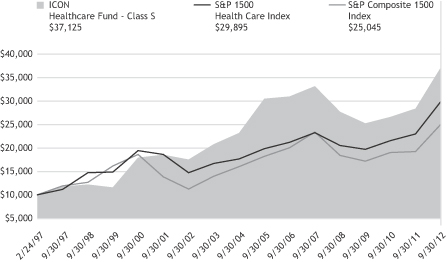
Past performance is not a guarantee of future results. The above graph compares a $10,000 investment made in the Fund’s Class S shares on the Class’ inception date of 2/24/97 to a $10,000 investment made in unmanaged securities indexes on that date. The Fund’s performance in this chart and the performance table assumes the reinvestment of dividends and capital gain distributions but does not reflect the deduction of taxes that a shareholder would pay on Fund distributions or on the redemption of Fund shares.
ICON HEALTHCARE FUND
SCHEDULEOF INVESTMENTS
SEPTEMBER 30, 2012
| | | | | | | | |
| Shares or Principal Amount | | Value | |
| | Common Stocks (100.0%) | |
| | 97,700 | | | Abbott Laboratories | | $ | 6,698,312 | |
| | 27,200 | | | Aetna, Inc. | | | 1,077,120 | |
| | 19,100 | | | Alexion Pharmaceuticals, Inc.† | | | 2,185,040 | |
| | 8,600 | | | Allergan, Inc. | | | 787,588 | |
| | 23,200 | | | Amerisource-Bergen Corp. | | | 898,072 | |
| | 62,300 | | | Amgen, Inc. | | | 5,253,136 | |
| | 22,900 | | | AstraZeneca PLC, ADR | | | 1,095,994 | |
| | 27,300 | | | Baxter International, Inc. | | | 1,645,098 | |
| | 9,200 | | | Becton, Dickinson & Co. | | | 722,752 | |
| | 35,000 | | | Bio-Reference Labs, Inc.†(a) | | | 1,000,300 | |
| | 34,300 | | | Cardinal Health, Inc. | | | 1,336,671 | |
| | 55,900 | | | Celgene Corp.† | | | 4,270,760 | |
| | 13,500 | | | CIGNA Corp. | | | 636,795 | |
| | 36,000 | | | Covidien PLC | | | 2,139,120 | |
| | 64,000 | | | Cubist Pharmaceuticals, Inc.† | | | 3,051,520 | |
| | 42,800 | | | Eli Lilly & Co. | | | 2,029,148 | |
| | 37,735 | | | Express Scripts, Inc.† | | | 2,364,852 | |
| | 78,100 | | | Gilead Sciences, Inc.† | | | 5,180,373 | |
| | 20,100 | | | GlaxoSmithKline PLC, ADR | | | 929,424 | |
| | 73,400 | | | Hospira, Inc.† | | | 2,408,988 | |
| | 51,300 | | | Johnson & Johnson | | | 3,535,083 | |
| | 12,400 | | | Laboratory Corp. of America Holdings† | | | 1,146,628 | |
| | 20,800 | | | Magellan Health Services, Inc.† | | | 1,073,488 | |
| | 14,300 | | | McKesson Corp. | | | 1,230,229 | |
| | 63,200 | | | Medtronic, Inc. | | | 2,725,184 | |
| | 191,800 | | | Merck & Co., Inc. | | | 8,650,180 | |
| | 46,000 | | | Mylan, Inc.† | | | 1,122,400 | |
| | 22,200 | | | Novartis AG, ADR | | | 1,359,972 | |
| | 25,600 | | | Patterson Cos., Inc. | | | 876,544 | |
| | | | | | | | |
| Shares or Principal Amount | | Value | |
| | 369,300 | | | PDL BioPharma, Inc.(a) | | $ | 2,839,917 | |
| | 482,300 | | | Pfizer, Inc. | | | 11,985,155 | |
| | 53,300 | | | Questcor Pharmaceuticals, Inc.†(a) | | | 986,050 | |
| | 40,000 | | | ResMed, Inc. | | | 1,618,800 | |
| | 15,500 | | | Salix Pharmaceuticals, Ltd.† | | | 656,270 | |
| | 24,800 | | | Sanofi-Aventis S.A., ADR | | | 1,067,888 | |
| | 43,700 | | | St Jude Medical, Inc. | | | 1,841,081 | |
| | 34,600 | | | Stryker Corp. | | | 1,925,836 | |
| | 60,900 | | | Teva Pharmaceutical Industries, Ltd., ADR | | | 2,521,869 | |
| | 48,300 | | | United Therapeutics Corp.† | | | 2,699,004 | |
| | 48,800 | | | UnitedHealth Group, Inc. | | | 2,704,008 | |
| | 10,500 | | | Varian Medical Systems, Inc.† | | | 633,360 | |
| | 17,000 | | | Watson Pharmaceuticals, Inc.† | | | 1,447,720 | |
| | 18,200 | | | WellPoint, Inc. | | | 1,055,782 | |
| | | | | | | | |
| Total Common Stocks
(Cost $87,319,693) | | | 101,413,511 | |
| Collateral for Securities on
Loan (1.9%) |
|
| | 1,993,044 | | | State Street Navigator Prime Portfolio | | | 1,993,044 | |
| | | | | | | | |
| Total Collateral for Securities
on Loan
(Cost $1,993,044) | | | 1,993,044 | |
| Total Investments 101.9%
(Cost $89,312,737) | | | 103,406,555 | |
| Liabilities Less Other
Assets (1.9)% | | | (1,975,365 | ) |
| | | | | | | | |
| | Net Assets 100.0% | | $ | 101,431,190 | |
| | | | | | | | |
| | | | |
| SCHEDULEOF INVESTMENTS | | | 33 | |
The accompanying notes are an integral part of the financial statements.
| † | Non-income producing security. |
| (a) | All or a portion of the security was on loan as of September 30, 2012. |
| ADR | American Depositary Receipt |
| | |
| 34 | | SCHEDULEOF INVESTMENTS |
| | | | |
MANAGEMENT OVERVIEW ICON INDUSTRIALS FUND | | Class S Class C
Class A | | ICTRX ICICX ICIAX |
| Q. | How did the Fund perform relative to its benchmarks? |
| A. | The ICON Industrials Fund, Class S, returned 22.99% for the fiscal year ended September 30, 2012, while its sector-specific benchmark, the S&P 1500 Industrials Index, returned 30.35% and the S&P Composite 1500 Index gained 30.18%. Class A shares returned 21.21% (14.28% with maximum sales charge), while Class C shares returned 21.58% (20.58% with contingent deferred sales charge applied). Total returns for other periods as of September 30, 2012 appear in the subsequent pages of this Fund’s Management Overview. |
| Q. | What primary factors were behind the Fund’s relative performance? |
| A. | Fiscal year 2012 produced positive returns across broad market indexes as equity investors climbed the proverbial “wall of worry,” bidding prices up to multi-year highs. Favorable returns were also seen within the Industrials sector as this economically sensitive segment of the economy benefitted from strong domestic earnings and a general calming of the European debt situation. While the Industrials sector has led many rallies over the course of the last two years, however, the sector’s fiscal year 2012 returns were middle of the pack, doing better than some sectors and worse than others. |
Fiscal year 2012 can be broken down into two six-month periods that produced drastically different results from a returns standpoint. The first six months saw continued growth in the manufacturing segment of the economy as the ISM Manufacturing Purchasing Managers Index increased from a value of 52.5 on 09/30/11 to a value of 53.4 on 03/31/12. Additionally, the Industrials sector produced one of the highest levels of earnings growth over the course of this time period. The combination of these factors resulted in a return of 31.07% for the sector for the first half of the fiscal year. The ICON Industrials Fund was able to participate in this initial move as we were bullish on the sector going into the fiscal year. We did, however, lag the sector-specific index slightly as the transportation segment of Industrials, an area in which we saw substantial value and took an overweight position, produced returns that lagged the broad sector average.
The second six months of the fiscal year were a completely different story. The ISM Manufacturing Purchasing Managers Index declined from 53.4 on 03/31/12 to below 50.0 in June, July and August 2012, indicating
contraction in the manufacturing segment of the economy. While earnings still remained relatively stable, equity returns took a breather and the Industrials sector fell by 0.55% during the second half of the fiscal year. The majority of underperformance for the ICON Industrials Fund took place in the second half of the fiscal year as the Fund fell by 4.29%. Again, the transportation segment of the Industrials sector was the main culprit for this decline as many companies reported demand values that were less than anticipated.
| Q. | How did the Fund’s composition affect performance? |
| A. | The top industry contributors to performance during fiscal year 2012 were industrial conglomerates, railroads, industrial machinery, construction & farm machinery & heavy trucks, and aerospace & defense. |
Only two industries detracted from Fund performance during fiscal year 2012: trading companies & distributors and airlines. An overweight position in the airlines industry adversely impacted the Fund.
| Q. | What is your investment outlook for the Industrials sector? |
| A. | At the close of the fiscal year, the Industrials sector had a value to price ratio of 1.43 which gives us confidence about the sector going into fiscal year 2013. In spite of a strong run-up in the first half of fiscal year 2012, a continuation of strong earnings growth, solid balance sheet quality, and historically low discount rates all lead us to believe that equity valuations remain attractive. While markets might trade on headline news over short time periods, we will continue to follow our systematic approach to investing which focuses on opportunities that are trading below our calculation of intrinsic value. |
ICON Industrials Fund
Industry Composition
September 30, 2012
| | | | |
Railroads | | | 21.6% | |
Aerospace & Defense | | | 16.1% | |
Industrial Conglomerates | | | 15.8% | |
Industrial Machinery | | | 12.9% | |
Construction & Farm Machinery & Heavy Trucks | | | 10.7% | |
Electrical Components & Equipment | | | 8.4% | |
Air Freight & Logistics | | | 5.7% | |
Trading Companies & Distributors | | | 3.2% | |
Airlines | | | 3.0% | |
Trucking | | | 2.4% | |
| | | | |
| | | 99.8% | |
| | | | |
Percentages are based upon common stocks as a percentage of net assets.
ICON Industrials Fund
Sector Composition
September 30, 2012
Percentages are based upon common stocks as a percentage of net assets.
ICON Industrials Fund
Average Annual Total Return
as of September 30, 2012
| | | | | | | | | | | | | | | | | | | | | | | | | | | | |
| | | Inception
Date | | | 1 Year | | | 5 Years | | | 10 Years | | | Since
Inception | | | Gross
Expense
Ratio* | | | Net
Expense
Ratio* | |
ICON Industrials Fund - Class S | | | 5/9/97 | | | | 22.99% | | | | -3.63% | | | | 6.26% | | | | 3.68% | | | | 1.36% | | | | 1.36% | |
S&P 1500 Industrials Index | | | | | | | 30.35% | | | | -0.07% | | | | 8.63% | | | | 6.10% | | | | N/A | | | | N/A | |
S&P Composite 1500 Index | | | | | | | 30.18% | | | | 1.36% | | | | 8.34% | | | | 6.01% | | | | N/A | | | | N/A | |
ICON Industrials Fund - Class C | | | 9/30/10 | | | | 21.58% | | | | N/A | | | | N/A | | | | 5.01% | | | | 13.56% | | | | 2.50% | |
S&P 1500 Industrials Index | | | | | | | 30.35% | | | | N/A | | | | N/A | | | | 11.56% | | | | N/A | | | | N/A | |
S&P Composite 1500 Index | | | | | | | 30.18% | | | | N/A | | | | N/A | | | | 14.61% | | | | N/A | | | | N/A | |
ICON Industrials Fund - Class A | | | 9/30/10 | | | | 21.21% | | | | N/A | | | | N/A | | | | 5.16% | | | | 3.46% | | | | 1.75% | |
ICON Industrials Fund - Class A (including maximum sales charge of 5.75%) | | | 9/30/10 | | | | 14.28% | | | | N/A | | | | N/A | | | | 2.07% | | | | 3.46% | | | | 1.75% | |
S&P 1500 Industrials Index | | | | | | | 30.35% | | | | N/A | | | | N/A | | | | 11.56% | | | | N/A | | | | N/A | |
S&P Composite 1500 Index | | | | | | | 30.18% | | | | N/A | | | | N/A | | | | 14.61% | | | | N/A | | | | N/A | |
Past performance is not a guarantee of future results. Information about these performance results and the comparative indexes can be found in the About This Report section. The Adviser has agreed to limit certain Fund expenses; without these limitations, returns would have been lower. The limitation provisions may be terminated in the future.
| * | Please see the most recent prospectus for details. |
Class C total returns exclude applicable sales charges. If sales charges were included returns would be lower.
ICON Industrials Fund
Value of a $10,000 Investment
through September 30, 2012
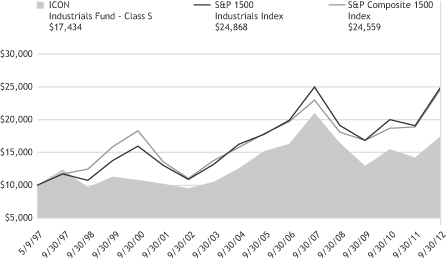
Past performance is not a guarantee of future results. The above graph compares a $10,000 investment made in the Fund’s Class S shares on the Class’ inception date of 5/9/97 to a $10,000 investment made in unmanaged securities indexes on that date. The Fund’s performance in this chart and the performance table assumes the reinvestment of dividends and capital gain distributions but does not reflect the deduction of taxes that a shareholder would pay on Fund distributions or on the redemption of Fund shares.
ICON INDUSTRIALS FUND
SCHEDULEOF INVESTMENTS
SEPTEMBER 30, 2012
| | | | | | | | |
| Shares or Principal Amount | | Value | |
| | Common Stocks (99.8%) | | | | |
| | 20,000 | | | 3M Co. | | $ | 1,848,400 | |
| | 25,000 | | | AMETEK, Inc. | | | 886,250 | |
| | 15,000 | | | Boeing Co. | | | 1,044,300 | |
| | 3,000 | | | Canadian National Railway Co. | | | 264,690 | |
| | 40,000 | | | Caterpillar, Inc. | | | 3,441,600 | |
| | 15,000 | | | Crane Co. | | | 598,950 | |
| | 120,000 | | | CSX Corp. | | | 2,490,000 | |
| | 15,000 | | | Danaher Corp. | | | 827,250 | |
| | 5,000 | | | Deere & Co. | | | 412,450 | |
| | 65,000 | | | Delta Air Lines, Inc.† | | | 595,400 | |
| | 25,000 | | | Dover Corp. | | | 1,487,250 | |
| | 20,000 | | | Eaton Corp.(a) | | | 945,200 | |
| | 25,000 | | | Emerson Electric Co. | | | 1,206,750 | |
| | 10,000 | | | FedEx Corp. | | | 846,200 | |
| | 6,000 | | | Gardner Denver, Inc. | | | 362,460 | |
| | 15,000 | | | General Dynamics Corp. | | | 991,800 | |
| | 160,000 | | | General Electric Co. | | | 3,633,600 | |
| | 15,000 | | | Honeywell International, Inc. | | | 896,250 | |
| | 7,000 | | | Hubbell, Inc., Class B | | | 565,180 | |
| | 10,000 | | | IDEX Corp. | | | 417,700 | |
| | 15,000 | | | Illinois Tool Works, Inc. | | | 892,050 | |
| | 7,000 | | | Joy Global, Inc. | | | 392,420 | |
| | 10,000 | | | Landstar System, Inc. | | | 472,800 | |
| | 10,000 | | | MSC Industrial Direct Co., Inc., Class A | | | 674,600 | |
| | 45,000 | | | Norfolk Southern Corp. | | | 2,863,350 | |
| | 5,000 | | | Parker Hannifin Corp. | | | 417,900 | |
| | 8,000 | | | Raytheon Co. | | | 457,280 | |
| | | | | | | | |
| Shares or Principal Amount | | Value | |
| | 10,000 | | | Regal-Beloit Corp. | | $ | 704,800 | |
| | 5,000 | | | Rockwell Collins, Inc. | | | 268,200 | |
| | 7,000 | | | Ryder System, Inc. | | | 273,420 | |
| | 25,000 | | | Union Pacific Corp. | | | 2,967,500 | |
| | 30,000 | | | United Continental Holdings† | | | 585,000 | |
| | 20,000 | | | United Parcel Service, Inc., Class B | | | 1,431,400 | |
| | 35,000 | | | United Technologies Corp. | | | 2,740,150 | |
| | 10,000 | | | Werner Enterprises, Inc. | | | 213,700 | |
| | 3,000 | | | WW Grainger, Inc. | | | 625,110 | |
| | | | | | | | |
| Total Common Stocks
(Cost $34,585,917) | | | 39,741,360 | |
| Collateral for Securities on
Loan (2.3%) | | | | |
| | 916,750 | | | State Street Navigator Prime Portfolio | | | 916,750 | |
| | | | | | | | |
| Total Collateral for
Securities on Loan
(Cost $916,750) | | | 916,750 | |
| | Short-Term Investment (0.2%) | | | | |
| $ | 66,885 | | | State Street Euro Dollar Time Deposit (USD), 0.01%, 10/01/12 | | | 66,885 | |
| | | | | | | | |
| Total Short-Term
Investments
(Cost $66,885) | | | 66,885 | |
| Total Investments 102.3%
(Cost $35,569,552) | | | 40,724,995 | |
| Liabilities Less
Other Assets (2.3)% | | | (929,569 | ) |
| | | | | | | | |
| | Net Assets 100.0% | | $ | 39,795,426 | |
| | | | | | | | |
| | |
| 40 | | SCHEDULEOF INVESTMENTS |
The accompanying notes are an integral part of the financial statements.
| † | Non-income producing security. |
| (a) | All or a portion of the security was on loan as of September 30, 2012. |
| | | | |
MANAGEMENT OVERVIEW ICON INFORMATION TECHNOLOGY FUND | | Class S Class C Class A | | ICTEX ICTFX ICTTX |
| Q. | How did the Fund perform relative to its benchmark? |
| A. | The ICON Information Technology Fund slightly underperformed its benchmark for the fiscal year ended September 30, 2012 by 1.20%. The Fund’s Class S shares returned 30.41%, while its benchmark, the S&P 1500 Information Technology Composite Index, rose 31.61%. Still, the Fund outperformed the broad index, the S&P Composite 1500, which gained 30.18% for the fiscal year. Class A shares of the Fund returned 29.88% (and 22.41% with maximum sales charge) during the same period, while the Fund’s Class C shares returned 29.03% for the fiscal year (28.03% with the maximum contingent deferred sales charge). Total returns for other periods as of September 30, 2012 appear in the subsequent pages of this Fund’s Management Overview. |
| Q. | What primary factors influenced the Fund’s relative performance during the period? |
| A. | Fiscal year 2012 was an excellent year for equity securities as the market recovery from the lows in 2009 continued its course, and the Information Technology sector fully participated with the rest of the market. Technology services and software related industries, including IT consulting & other services, application software and data processing & outsourced services, led the sector in returns, while the technology distributors, semiconductor, and office electronics industries lagged in performance. One of the most significant driving forces of the Information Technology sector continued to be Apple, Inc. Ending fiscal year 2012 as almost 22% of the S&P 1500 Information Technology Index, Apple became the most valuable company of all time in terms of market capitalization. Its share price rose over 75% in 2012 due to a highly profitable holiday sales season and successful product launches including the new iPhone 5. Apple was the largest position held in the Fund and contributed significantly to performance. |
The data processing industry was another sector leader during this period. Companies like Visa and MasterCard fared well over the year, as usage rates increased overseas and lawsuits and regulation were settled favorably for the industry. The Fund was overweight the data processing industry throughout fiscal year 2012 and was able to capture positive returns that exceeded the sector index.
The Fund also benefited from its lack of exposure to the home entertainment software industry and its significant underweight in semiconductor companies. Both industries performed poorly relative to the rest of the Information Technology sector, and the ICON Information Technology Fund was able to keep pace with the index based in part on its limited exposure to these laggards. Intel was one of only three semiconductor holdings in the Fund, and it ended the year contributing just over 1.2% to the Fund’s overall performance.
| Q. | How did the Fund’s composition affect performance? |
| A. | As the Fund’s largest position, and one of the sector’s greatest performers, Apple contributed over 10% in positive gains to the portfolio’s total return for the year. Little success was found elsewhere in the computer hardware industry, however, as an overweight position in Hewlett-Packard had a negative impact to total returns after a disappointing 3Q earnings loss and poor sales growth. |
Visa, MasterCard, CoreLogic, and Global Cash Access Holdings all made positive contributions in the data processing & outsourced services industry. The Fund was positioned at almost double the benchmark weight in this industry, and its holdings contributed over 5% to the portfolio’s total returns.
The largest detractors to Fund performance came from the computer storage & peripherals industry. NetApp Inc., Synaptics Inc., and QLogic Corp. all brought negative returns to the Fund, and the industry holdings collectively detracted from the total return of the portfolio by -0.65%.
| Q. | What is your investment outlook for the Information Technology Sector. |
| A. | Going into the new year, ICON’s valuation system suggests there are a number of opportunities in both the Information Technology sector and the market as a whole. Technology stocks, on average, are trading at around 39% below our calculation of fair value. The ICON Information Technology Fund is currently positioned with heavy weights in the IT consulting & other services, data processing & outsourced services, and internet software & services industries. |
ICON Information Technology Fund
Industry Composition
September 30, 2012
| | | | |
Computer Hardware | | | 20.6% | |
IT Consulting & Other Services | | | 18.7% | |
Data Processing & Outsourced Services | | | 12.9% | |
Internet Software & Services | | | 9.4% | |
Communications Equipment | | | 8.8% | |
Systems Software | | | 8.0% | |
Computer Storage & Peripherals | | | 7.9% | |
Semiconductor Equipment | | | 4.1% | |
Application Software | | | 4.0% | |
Office Electronics | | | 2.9% | |
Semiconductors | | | 2.3% | |
| | | | |
| | | 99.6% | |
| | | | |
Percentages are based upon common stocks as a percentage of net assets.
ICON Information Technology Fund
Sector Composition
September 30, 2012
| | | | |
Information Technology | | | 99.6% | |
| | | | |
| | | 99.6% | |
| | | | |
Percentages are based upon common stocks as a percentage of net assets.
ICON Information Technology Fund
Average Annual Total Return
as of September 30, 2012
| | | | | | | | | | | | | | | | | | | | | | | | | | | | |
| | | Inception
Date | | | 1 Year | | | 5 Years | | | 10 Years | | | Since
Inception | | | Gross
Expense
Ratio* | | | Net
Expense
Ratio* | |
ICON Information Technology
Fund - Class S | | | 2/19/97 | | | | 30.41% | | | | -0.44% | | | | 6.07% | | | | 7.52% | | | | 1.34% | | | | 1.34% | |
S&P 1500 Information Technology Index | | | | | | | 31.61% | | | | 4.57% | | | | 11.49% | | | | 6.16% | | | | N/A | | | | N/A | |
NASDAQ Composite Index | | | | | | | 29.02% | | | | 2.90% | | | | 10.27% | | | | 5.43% | | | | N/A | | | | N/A | |
S&P Composite 1500 Index | | | | | | | 30.18% | | | | 1.36% | | | | 8.34% | | | | 6.03% | | | | N/A | | | | N/A | |
ICON Information Technology
Fund - Class C | | | 9/30/10 | | | | 29.03% | | | | N/A | | | | N/A | | | | 14.13% | | | | 115.00% | | | | 2.51% | |
ICON Information Technology Fund
Average Annual Total Return (continued)
as of September 30, 2012
| | | | | | | | | | | | | | | | | | | | | | | | | | | | |
| | | Inception
Date | | | 1 Year | | | 5 Years | | | 10 Years | | | Since
Inception | | | Gross
Expense
Ratio* | | | Net
Expense
Ratio* | |
S&P 1500 Information Technology Index | | | | | | | 31.61% | | | | N/A | | | | N/A | | | | 16.37% | | | | N/A | | | | N/A | |
NASDAQ Composite Index | | | | | | | 29.02% | | | | N/A | | | | N/A | | | | 14.69% | | | | N/A | | | | N/A | |
S&P Composite 1500 Index | | | | | | | 30.18% | | | | N/A | | | | N/A | | | | 14.61% | | | | N/A | | | | N/A | |
ICON Information Technology Fund - Class A | | | 9/30/10 | | | | 29.88% | | | | N/A | | | | N/A | | | | 15.00% | | | | 215.56% | | | | 1.75% | |
ICON Information Technology Fund - Class A (including maximum sales charge of 5.75%) | | | 9/30/10 | | | | 22.41% | | | | N/A | | | | N/A | | | | 11.66% | | | | 215.56% | | | | 1.75% | |
S&P 1500 Information Technology Index | | | | | | | 31.61% | | | | N/A | | | | N/A | | | | 16.37% | | | | N/A | | | | N/A | |
NASDAQ Composite Index | | | | | | | 29.02% | | | | N/A | | | | N/A | | | | 14.69% | | | | N/A | | | | N/A | |
S&P Composite 1500 Index | | | | | | | 30.18% | | | | N/A | | | | N/A | | | | 14.61% | | | | N/A | | | | N/A | |
Past performance is not a guarantee of future results. Information about these performance results and the comparative indexes can be found in the About This Report section. The Adviser has agreed to limit certain Fund expenses; without these limitations, returns would have been lower. The limitation provisions may be terminated in the future.
| * | Please see the most recent prospectus for details. |
Class C total returns exclude applicable sales charges. If sales charges were included returns would be lower.
ICON Information Technology Fund
Value of a $10,000 Investment
through September 30, 2012
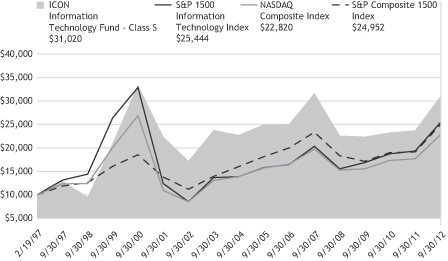
Past performance is not a guarantee of future results. The above graph compares a $10,000 investment made in the Fund’s Class S shares on the Class’ inception date of 2/19/97 to a $10,000 investment made in unmanaged securities indexes on that date. The Fund’s performance in this chart and the performance table assumes the reinvestment of dividends and capital gain distributions but does not reflect the deduction of taxes that a shareholder would pay on Fund distributions or on the redemption of Fund shares.
ICON INFORMATION TECHNOLOGY FUND
SCHEDULEOF INVESTMENTS
SEPTEMBER 30, 2012
| | | | | | | | |
| Shares or Principal Amount | | Value | |
| | Common Stocks (99.6%) | | | | |
| | 34,600 | | | Accenture PLC, Class A | | $ | 2,423,038 | |
| | 51,300 | | | Amdocs, Ltd. | | | 1,692,387 | |
| | 24,500 | | | Apple, Inc. | | | 16,347,870 | |
| | 62,700 | | | Applied Materials, Inc. | | | 700,046 | |
| | 57,500 | | | ATMI, Inc.† | | | 1,067,775 | |
| | 41,400 | | | Automatic Data Processing, Inc. | | | 2,428,524 | |
| | 4,700 | | | Baidu, Inc., ADR† | | | 549,054 | |
| | 31,300 | | | CACI International, Inc., Class A† | | | 1,621,027 | |
| | 130,100 | | | Cisco Systems, Inc. | | | 2,483,609 | |
| | 28,400 | | | Cognizant Technology Solutions Corp., Class A† | | | 1,985,728 | |
| | 49,400 | | | CoreLogic, Inc.† | | | 1,310,582 | |
| | 23,100 | | | eBay, Inc.† | | | 1,118,271 | |
| | 92,300 | | | EMC Corp.† | | | 2,517,021 | |
| | 15,700 | | | F5 Networks, Inc.† | | | 1,643,790 | |
| | 26,600 | | | Fidelity National Information Services, Inc. | | | 830,452 | |
| | 24,300 | | | Global Payments, Inc. | | | 1,016,469 | |
| | 7,200 | | | Google, Inc., Class A† | | | 5,432,400 | |
| | 66,000 | | | Hewlett-Packard Co. | | | 1,125,960 | |
| | 38,400 | | | Informatica Corp.† | | | 1,336,704 | |
| | 26,400 | | | Infosys Technologies, Ltd., ADR(a) | | | 1,281,456 | |
| | 88,000 | | | Intel Corp. | | | 1,995,840 | |
| | 33,300 | | | International Business Machines Corp. | | | 6,908,085 | |
| | 24,300 | | | Intuit, Inc. | | | 1,430,784 | |
| | 52,700 | | | Lam Research Corp.† | | | 1,675,069 | |
| | 3,900 | | | Mastercard, Inc., Class A | | | 1,760,772 | |
| | | | | | | | |
| Shares or Principal Amount | | Value | |
| | 155,600 | | | Microsoft Corp. | | $ | 4,633,768 | |
| | 69,400 | | | Oracle Corp. | | | 2,185,406 | |
| | 71,000 | | | Perficient, Inc.† | | | 856,970 | |
| | 123,600 | | | QLogic Corp.† | | | 1,411,512 | |
| | 53,600 | | | QUALCOMM, Inc. | | | 3,349,464 | |
| | 43,600 | | | Synaptics, Inc.†(a) | | | 1,047,272 | |
| | 14,300 | | | Syntel, Inc. | | | 892,463 | |
| | 15,000 | | | Tyler Technologies, Inc.† | | | 660,300 | |
| | 14,100 | | | Visa, Inc., Class A | | | 1,893,348 | |
| | 45,200 | | | Western Digital Corp. | | | 1,750,596 | |
| | 46,300 | | | Western Union Co. | | | 843,586 | |
| | 249,900 | | | Xerox Corp. | | | 1,834,266 | |
| | 16,500 | | | Zebra Technologies Corp., Class A† | | | 619,410 | |
| | | | | | | | |
| Total Common Stocks
(Cost $64,356,897) | | | 84,661,074 | |
| Collateral for Securities on
Loan (2.5%) | | | | |
| | 2,154,166 | | | State Street Navigator Prime Portfolio | | | 2,154,166 | |
| | | | | | | | |
| Total Collateral for
Securities on Loan
(Cost $2,154,166) | | | 2,154,166 | |
| | Short-Term Investment (0.6%) | | | | |
| $ | 470,159 | | | State Street Euro Dollar Time Deposit (USD), 0.01%, 10/01/12 | | | 470,159 | |
| | | | | | | | |
| Total Short-Term Investments
(Cost $470,159) | | | 470,159 | |
| Total Investments 102.7%
(Cost $66,981,222) | | | 87,285,399 | |
| Liabilities Less
Other Assets (2.7)% | | | (2,261,325 | ) |
| | | | | | | | |
| | Net Assets 100.0% | | $ | 85,024,074 | |
| | | | | | | | |
| | |
| 46 | | SCHEDULEOF INVESTMENTS |
The accompanying notes are an integral part of the financial statements.
| † | Non-income producing security. |
| (a) | All or a portion of the security was on loan as of September 30, 2012. |
| ADR | American Depositary Receipt |
| | | | |
| SCHEDULEOF INVESTMENTS | | | 47 | |
| | | | |
MANAGEMENT OVERVIEW ICON MATERIALS FUND | | Class S Class C Class A | | ICBMX ICBCX ICBAX |
| Q. | How did the Fund perform relative to its benchmarks? |
| A. | The ICON Materials Fund Class S returned 24.85% for the fiscal year ended September 30, 2012, while its sector-specific benchmark, the S&P 1500 Materials Index, returned 30.74%, and the S&P Composite 1500 Index gained 30.18%. Class C shares returned 23.36% (22.36% with contingent deferred sales charge applied) while the Fund’s Class A shares returned 24.44% (17.25% with maximum sales charge). Total returns for other periods as of September 30, 2012 appear in the subsequent pages of this Fund’s Management Overview. |
| Q. | What primary factors were behind the Fund’s relative performance? |
| A. | In spite of global macro-economic concerns, fiscal year 2012 produced some of the strongest equity returns we have seen in years. The Materials sector was no exception, rising in excess of 30% for the 12-month period as investors climbed the proverbial “wall of worry.” Although impressive, the sector’s returns were merely average relative to the returns posted by the other S&P sector indexes. A general slowdown in earnings and global demand for basic material related products hampered returns in the second half of the fiscal year. |
Fiscal year 2012 can be broken down into two six-month periods that produced drastically different results. The first six months saw strong sales growth from Materials sector companies that resulted in a 29.43% return for the sector as a whole. The ICON Materials Fund participated in this initial rally, as we were bullish on the sector going into the fiscal year. The second half of the fiscal year began with an abrupt 10% sell-off, as investors saw declines in Basic Materials company sales growth rates. While this initial decline was reversed early in 2012, the Materials sector was able to produce only a 1.01% return over the course of the six-month timeframe. The majority of underperformance for the ICON Materials Fund took place during this second six-month period, as the Fund fell 2.97% because of its overweight positions in underperforming industries.
One last point: many investors have shifted their focus towards the gold industry over the last few years in anticipation of strong inflationary pressures due to global expansionary monetary policy. In spite of this trend, the gold industry was the worst performing industry within the
S&P 1500 Materials Index, falling by over 6 percent. Although we had only a small overweight position in this industry, it nonetheless proved to be a significant detractor from overall performance.
| Q. | How did the Fund’s composition affect performance? |
| A. | Industry returns in the S&P 1500 Materials Index reflect the volatility of this past fiscal year. For example, the sector’s best performing industry, forest products, outperformed its worst industry, gold, by over 80%. This divergence highlights the importance of correct industry allocation during the last 12 months. |
The top industry contributors to Fund performance during fiscal year 2012 were diversified chemicals, fertilizers & agricultural chemicals, specialty chemicals, diversified metals & mining, and steel.
While most industries produced positive returns over the course of the fiscal year, only one industry detracted from overall performance: gold.
| Q. | What is your investment outlook for the Materials sector? |
| A. | At the close of the fiscal year, the Materials sector had a value-to-price ratio of 1.31, giving us confidence about future opportunities within the sector. While there has been a general slowdown in earnings growth rates, we believe investors remain skeptical about equities as a whole. As a result, ICON enters fiscal year 2013 optimistic about bargains within the Materials sector and beyond. Additionally, company specific fundamentals remain solid, as firms continue to maintain healthy balance sheets and cash stockpiles. Healthy fundamentals, coupled with low discount rates, allow the cyclically oriented companies within the Materials sector to not only withstand near term economic uncertainty, but also invest in future growth opportunities. While markets might trade on headline news over short time periods, we will continue to follow our systematic, value based approach to investing. |
ICON Materials Fund
Industry Composition
September 30, 2012
| | | | |
Diversified Chemicals | | | 21.6% | |
Industrial Gases | | | 20.5% | |
Specialty Chemicals | | | 11.7% | |
Steel | | | 9.7% | |
Fertilizers & Agricultural Chemicals | | | 8.7% | |
Gold | | | 7.9% | |
Diversified Metals & Mining | | | 5.6% | |
Railroads | | | 5.0% | |
Metal & Glass Containers | | | 3.4% | |
Paper Products | | | 1.9% | |
Paper Packaging | | | 1.1% | |
Other Industries (each less than 1%) | | | 2.1% | |
| | | | |
| | | 99.2% | |
| | | | |
Percentages are based upon common stocks as a percentage of net assets.
ICON Materials Fund
Sector Composition
September 30, 2012
| | | | |
Materials | | | 93.6% | |
Industrials | | | 5.0% | |
Consumer Staples | | | 0.6% | |
| | | | |
| | | 99.2% | |
| | | | |
Percentages are based upon common stocks as a percentage of net assets.
ICON Materials Fund
Average Annual Total Return
as of September 30, 2012
| | | | | | | | | | | | | | | | | | | | | | | | | | | | |
| | | Inception
Date | | | 1 Year | | | 5 Years | | | 10 Years | | | Since
Inception | | | Gross
Expense
Ratio* | | | Net
Expense
Ratio* | |
ICON Materials Fund - Class S | | | 5/5/97 | | | | 24.85% | | | | -2.13% | | | | 11.52% | | | | 3.85% | | | | 1.33% | | | | 1.33% | |
S&P 1500 Materials Index | | | | | | | 30.74% | | | | 0.75% | | | | 10.88% | | | | 6.03% | | | | N/A | | | | N/A | |
S&P Composite 1500 Index | | | | | | | 30.18% | | | | 1.36% | | | | 8.34% | | | | 5.97% | | | | N/A | | | | N/A | |
ICON Materials Fund - Class C | | | 9/30/10 | | | | 23.36% | | | | N/A | | | | N/A | | | | 4.85% | | | | 4.11% | | | | 2.50% | |
S&P 1500 Materials Index | | | | | | | 30.74% | | | | N/A | | | | N/A | | | | 10.34% | | | | N/A | | | | N/A | |
S&P Composite 1500 Index | | | | | | | 30.18% | | | | N/A | | | | N/A | | | | 14.61% | | | | N/A | | | | N/A | |
ICON Materials Fund - Class A | | | 9/30/10 | | | | 24.44% | | | | N/A | | | | N/A | | | | 5.60% | | | | 2.26% | | | | 1.74% | |
ICON Materials Fund - Class A (including maximum sales charge of 5.75%) | | | 9/30/10 | | | | 17.25% | | | | N/A | | | | N/A | | | | 2.54% | | | | 2.26% | | | | 1.74% | |
S&P 1500 Materials Index | | | | | | | 30.74% | | | | N/A | | | | N/A | | | | 10.34% | | | | N/A | | | | N/A | |
S&P Composite 1500 Index | | | | | | | 30.18% | | | | N/A | | | | N/A | | | | 14.61% | | | | N/A | | | | N/A | |
Past performance is not a guarantee of future results. Information about these performance results and the comparative indexes can be found in the About This Report section. The Adviser has agreed to limit certain Fund expenses; without these limitations, returns would have been lower. The limitation provisions may be terminated in the future.
| * | Please see the most recent prospectus for details. |
Class C total returns exclude applicable sales charges. If sales charges were included returns would be lower.
ICON Materials Fund
Value of a $10,000 Investment
through September 30, 2012
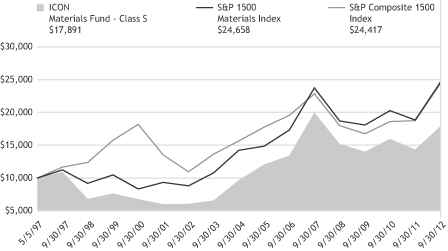
Past performance is not a guarantee of future results. The above graph compares a $10,000 investment made in the Fund’s Class S shares on the Class’ inception date of 5/5/97 to a $10,000 investment made in unmanaged securities indexes on that date. The Fund’s performance in this chart and the performance table assumes the reinvestment of dividends and capital gain distributions but does not reflect the deduction of taxes that a shareholder would pay on Fund distributions or on the redemption of Fund shares.
ICON MATERIALS FUND
SCHEDULEOF INVESTMENTS
SEPTEMBER 30, 2012
| | | | | | | | |
| Shares or Principal Amount | | Value | |
| | Common Stocks (99.2%) | |
| | 40,000 | | | Air Products & Chemicals, Inc. | | $ | 3,308,000 | |
| | 15,000 | | | Airgas, Inc. | | | 1,234,500 | |
| | 10,000 | | | Albemarle Corp. | | | 526,800 | |
| | 8,000 | | | Aptargroup, Inc. | | | 413,680 | |
| | 30,000 | | | ArcelorMittal(a) | | | 433,200 | |
| | 10,000 | | | Archer-Daniels-Midland Co. | | | 271,800 | |
| | 12,000 | | | Ashland, Inc. | | | 859,200 | |
| | 5,000 | | | Barrick Gold Corp. | | | 208,800 | |
| | 15,000 | | | Bemis Co., Inc. | | | 472,050 | |
| | 25,000 | | | Buckeye Technologies, Inc. | | | 801,500 | |
| | 25,000 | | | Calgon Carbon Corp.† | | | 357,750 | |
| | 5,000 | | | Celanese Corp. | | | 189,550 | |
| | 2,500 | | | CF Industries Holdings, Inc. | | | 555,600 | |
| | 10,000 | | | Crown Holdings, Inc.† | | | 367,500 | |
| | 95,000 | | | Dow Chemical Co. | | | 2,751,200 | |
| | 70,000 | | | E.I. du Pont de Nemours & Co. | | | 3,518,900 | |
| | 45,000 | | | Ecolab, Inc. | | | 2,916,450 | |
| | 15,000 | | | FMC Corp. | | | 830,700 | |
| | 60,000 | | | Freeport-McMoRan Copper & Gold, Inc. | | | 2,374,800 | |
| | 20,000 | | | Goldcorp, Inc. | | | 917,000 | |
| | 15,000 | | | HB Fuller Co. | | | 460,200 | |
| | 30,000 | | | Monsanto Co. | | | 2,730,600 | |
| | 7,000 | | | Mosaic Co. | | | 403,270 | |
| | 40,000 | | | Newmont Mining Corp. | | | 2,240,400 | |
| | | | | | | | |
| Shares or Principal Amount | | Value | |
| | 20,000 | | | Norfolk Southern Corp. | | $ | 1,272,600 | |
| | 50,000 | | | Nucor Corp. | | | 1,913,000 | |
| | 18,000 | | | PPG Industries, Inc. | | | 2,067,120 | |
| | 40,000 | | | Praxair, Inc. | | | 4,155,200 | |
| | 10,000 | | | Reliance Steel & Aluminum Co. | | | 523,500 | |
| | 15,000 | | | Silgan Holdings, Inc. | | | 652,650 | |
| | 6,000 | | | Silver Wheaton Corp. | | | 238,260 | |
| | 110,000 | | | Steel Dynamics, Inc. | | | 1,235,300 | |
| | 7,000 | | | Union Pacific Corp. | | | 830,900 | |
| | | | | | | | |
| Total Common Stocks
(Cost $35,154,203) | | | 42,031,980 | |
| Collateral for Securities on
Loan (0.9%) |
|
| | 367,536 | | | State Street Navigator Prime Portfolio | | | 367,536 | |
| | | | | | | | |
| Total Collateral for
Securities on Loan
(Cost $367,536) | | | 367,536 | |
| | Short-Term Investment (0.3%) | |
| $ | 139,943 | | | State Street Euro Dollar Time Deposit (USD), 0.01%, 10/01/12 | | | 139,943 | |
| | | | | | | | |
| Total Short-Term Investments
(Cost $139,943) | | | 139,943 | |
| Total Investments 100.4%
(Cost $35,661,682) | | | 42,539,459 | |
| Liabilities Less Other
Assets (0.4)% | | | (178,256 | ) |
| | | | | | | | |
| | Net Assets 100.0% | | $ | 42,361,203 | |
| | | | | | | | |
The accompanying notes are an integral part of the financial statements.
| † | Non-income producing security. |
| (a) | All or a portion of the security was on loan as of September 30, 2012. |
| | | | |
| SCHEDULEOF INVESTMENTS | | | 53 | |
| | | | |
MANAGEMENT OVERVIEW ICON UTILITIES FUND | | Class S Class C Class A | | ICTUX ICTZX ICTVX |
| Q. | How did the Fund perform relative to its benchmark? |
| A. | The Fund’s Class S shares gained 12.01% for the fiscal year ended September 30, 2012. The Fund underperformed both its broad based benchmark, the S&P 1500 Composite Index, which returned 30.18% for the same time period, and its sector specific benchmark, the S&P 1500 Utilities Index, which returned 13.67%. Class A shares of the Fund returned 11.81% (and 5.39% with maximum sales charge) during the same period while Class C shares returned 11.53% for the fiscal year (10.53% with maximum contingent deferred sales charge). Total returns for other periods as of September 30, 2012 appear in the subsequent pages of this Fund’s Management Overview. |
| Q. | What primary factors influenced the Fund’s relative performance during the period? |
| A. | The fiscal year was marked by ongoing concerns over the debt crisis in the Eurozone and weak economic conditions both in the U.S. and abroad. The debt crisis in Europe also created extreme volatility in the equity markets, sparking waves of investor anxiety even as the U.S. stock market posted significant gains. Between November 8 and November 25, 2011, for example, the S&P 1500 Index fell 9.24%. Then, after a sharp rally, the Index plummeted another 8.96% between May 1 and June 4, 2012. |
Meanwhile, in an effort to thwart a double dip recession in the U.S., the Federal Reserve maintained historically low interest rates via its quantitative easing program. The Fed’s loose monetary policy caused worries of hyper-inflation over the period, but those concerns never materialized. By the end of the period, the yield on the 10-year U.S. Treasury bond was slightly above 1.6% and the Consumer Price Index had risen just under 2.0%.
The low interest rate environment was helpful to consumers in that it kept borrowing rates down, but problematic for investors searching for government guaranteed interest income. A 1.6% rate on a 10-year treasury was a likely catalyst for investors taking on additional risk in search of higher yields. Yields of around 4% were not difficult to find in the Utilities sector during fiscal year 2012.
Perhaps buoyed by a positive interest environment, the Utilities sector showed upside potential under our valuation system throughout the period. The value-to-price ratio (V/P) for the Utilities sector was 1.24 at the start of the fiscal year and 1.27 as the fiscal year drew to a close. In general, the greater the V/P, the more attractive the stock, industry or sector is under the ICON system. Our model focuses on company values relative to their price in the market irrespective of macroeconomic conditions. Because we believe the model provides an indication of whether or not stocks are trading at a discount to what they are intrinsically worth, our V/P of 1.24 suggests stocks in the Utilities sector were bargains. As a result, we were fully invested over the period and managed to participate in most of the sector’s gains.
| Q. | How did the Fund’s composition affect performance? |
| A. | Among the major positive contributors to the Fund’s performance were the multi-utilities and electric utilities industries. These two groups accounted for most of the gains in the Fund both on an absolute and benchmark relative basis. To a lesser extent, the gas and water utilities industries also contributed to the Fund’s positive performance, although the Fund’s gas utilities holdings underperformed the benchmark’s gas utilities holdings, detracting from the Fund’s benchmark relative return. While the Fund held a slight overweight position in the gas utilities industry, individual stock selection in this and, frankly, certain other industries within this sector was less than optimal at times, detracting from performance. |
| Q. | What is your investment outlook for the Utilities sector? |
| A. | As we close out fiscal year 2012, the Utilities sector is trading at a deep discount to fair value under our system, with a V/P of 1.27. Of the five industries within the sector, we believe only independent power producers is overvalued. In addition to the sector’s generally attractive valuations we see a number of undervalued companies paying relatively high dividends. Accordingly, as the fiscal year ends we hope to capitalize on select Utilities stocks that had high dividend yields and were undervalued under ICON’s methodology. |
ICON Utilities Fund
Industry Composition
September 30, 2012
| | | | |
Multi-Utilities | | | 43.8% | |
Electric Utilities | | | 43.7% | |
Gas Utilities | | | 10.1% | |
Water Utilities | | | 2.0% | |
| | | | |
| | | 99.6% | |
| | | | |
Percentages are based upon common stocks as a percentage of net assets.
ICON Utilities Fund
Sector Composition
September 30, 2012
Percentages are based upon common stocks as a percentage of net assets.
ICON Utilities Fund
Average Annual Total Return
as of September 30, 2012
| | | | | | | | | | | | | | | | | | | | | | | | | | | | |
| | | Inception
Date | | | 1 Year | | | 5 Years | | | 10 Years | | | Since
Inception | | | Gross
Expense
Ratio* | | | Net
Expense
Ratio* | |
ICON Utilities Fund - Class S | | | 7/9/97 | | | | 12.01% | | | | 0.01% | | | | 9.77% | | | | 7.56% | | | | 1.61% | | | | 1.51% | |
S&P 1500 Telecommunications Services Index | | | | | | | 35.91% | | | | 2.43% | | | | 11.71% | | | | 3.97% | | | | N/A | | | | N/A | |
S&P 1500 Utilities Index | | | | | | | 13.67% | | | | 3.37% | | | | 11.38% | | | | 7.34% | | | | N/A | | | | N/A | |
S&P Composite 1500 Index | | | | | | | 30.18% | | | | 1.36% | | | | 8.34% | | | | 5.39% | | | | N/A | | | | N/A | |
ICON Utilities Fund - Class C | | | 9/30/10 | | | | 11.53% | | | | N/A | | | | N/A | | | | 9.62% | | | | 122.08% | | | | 2.50% | |
S&P 1500 Telecommunications Services Index | | | | | | | 35.91% | | | | N/A | | | | N/A | | | | 19.56% | | | | N/A | | | | N/A | |
S&P 1500 Utilities Index | | | | | | | 13.67% | | | | N/A | | | | N/A | | | | 12.84% | | | | N/A | | | | N/A | |
S&P Composite 1500 Index | | | | | | | 30.18% | | | | N/A | | | | N/A | | | | 14.61% | | | | N/A | | | | N/A | |
ICON Utilities Fund - Class A | | | 9/30/10 | | | | 11.81% | | | | N/A | | | | N/A | | | | 10.16% | | | | 185.34% | | | | 1.75% | |
ICON Utilities Fund - Class A (including maximum sales charge of 5.75%) | | | 9/30/10 | | | | 5.39% | | | | N/A | | | | N/A | | | | 6.91% | | | | 185.34% | | | | 1.75% | |
S&P 1500 Telecommunications Services Index | | | | | | | 35.91% | | | | N/A | | | | N/A | | | | 19.56% | | | | N/A | | | | N/A | |
S&P 1500 Utilities Index | | | | | | | 13.67% | | | | N/A | | | | N/A | | | | 12.84% | | | | N/A | | | | N/A | |
S&P Composite 1500 Index | | | | | | | 30.18% | | | | N/A | | | | N/A | | | | 14.61% | | | | N/A | | | | N/A | |
Past performance is not a guarantee of future results. Information about these performance results and the comparative indexes can be found in the About This Report section. The Adviser has agreed to limit certain Fund expenses; without these limitations, returns would have been lower. The limitation provisions may be terminated in the future.
| * | Please see the most recent prospectus for details. |
Class C total returns exclude applicable sales charges. If sales charges were included returns would be lower.
ICON Utilities Fund
Value of a $10,000 Investment
through September 30, 2012
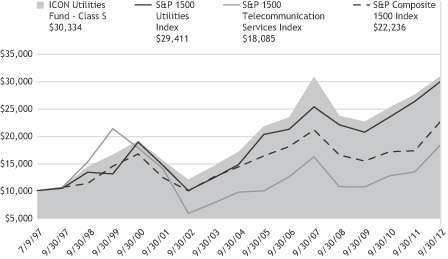
Past performance is not a guarantee of future results. The above graph compares a $10,000 investment made in the Fund’s Class S shares on the Class’ inception date of 7/9/97 to a $10,000 investment made in unmanaged securities indexes on that date. The Fund’s performance in this chart and the performance table assumes the reinvestment of dividends and capital gain distributions but does not reflect the deduction of taxes that a shareholder would pay on Fund distributions or on the redemption of Fund shares.
ICON UTILITIES FUND
SCHEDULEOF INVESTMENTS (FORMERLY, ICON TELECOMMUNICATION & UTILITIES FUND)
SEPTEMBER 30, 2012
| | | | | | | | |
| Shares or Principal Amount | | Value | |
| | Common Stocks (99.6%) | | | | |
| | 28,700 | | | AGL Resources, Inc. | | $ | 1,174,117 | |
| | 25,600 | | | Allete, Inc. | | | 1,068,544 | |
| | 68,000 | | | American Electric Power Co., Inc. | | | 2,987,920 | |
| | 18,400 | | | American Water Works Co., Inc. | | | 681,904 | |
| | 7,300 | | | Atmos Energy Corp. | | | 261,267 | |
| | 31,900 | | | Dominion Resources, Inc. of Virginia | | | 1,688,786 | |
| | 38,700 | | | Duke Energy Corp. | | | 2,507,760 | |
| | 31,100 | | | Integrys Energy Group, Inc. | | | 1,623,420 | |
| | 8,200 | | | Laclede Group, Inc. | | | 352,600 | |
| | 22,700 | | | MDU Resources Group, Inc. | | | 500,308 | |
| | 25,500 | | | NextEra Energy, Inc. | | | 1,793,415 | |
| | 74,700 | | | Pepco Holdings, Inc. | | | 1,411,830 | |
| | 40,700 | | | PPL Corp. | | | 1,182,335 | |
| | | | | | | | |
| Shares or Principal Amount | | Value | |
| | 52,500 | | | Public Service Enterprise Group, Inc. | | $ | 1,689,450 | |
| | 35,700 | | | SCANA Corp. | | | 1,723,239 | |
| | 27,600 | | | Sempra Energy | | | 1,779,924 | |
| | 16,600 | | | South Jersey Industries, Inc. | | | 878,638 | |
| | 84,000 | | | Southern Co. | | | 3,871,560 | |
| | 47,800 | | | TECO Energy, Inc. | | | 847,972 | |
| | 23,500 | | | UGI Corp. | | | 746,125 | |
| | 56,600 | | | Vectren Corp. | | | 1,618,760 | |
| | 33,900 | | | Wisconsin Energy Corp. | | | 1,277,013 | |
| | 74,900 | | | Xcel Energy, Inc. | | | 2,075,479 | |
| | | | | | | | |
| Total Common Stocks
(Cost $31,279,480) | | | 33,742,366 | |
| Total Investments 99.6%
(Cost $31,279,480) | | | 33,742,366 | |
| Other Assets Less
Liabilities 0.4% | | | 150,235 | |
| | | | | | | | |
| | Net Assets 100.0% | | $ | 33,892,601 | |
| | | | | | | | |
The accompanying notes are an integral part of the financial statements.
| | | | |
| SCHEDULEOF INVESTMENTS | | | 59 | |
STATEMENTSOF ASSETSAND LIABILITIES
SEPTEMBER 30, 2012
| | | | | | | | | | | | |
| | | ICON
Consumer
Discretionary
Fund | | | ICON
Consumer
Staples
Fund | | | ICON
Energy
Fund | |
Assets | | | | | | | | | | | | |
Investments, at cost | | $ | 48,887,325 | | | $ | 36,385,397 | | | $ | 538,877,161 | |
| | | | | | | | | | | | |
Investments, at value† | | | 59,527,606 | | | | 39,733,811 | | | | 593,602,672 | |
Receivables: | | | | | | | | | | | | |
Fund shares sold | | | 222,408 | | | | 56,119 | | | | 1,037,016 | |
Investments sold | | | 286,779 | | | | 342,921 | | | | 6,266,274 | |
Dividends | | | 48,610 | | | | 114,543 | | | | 892,830 | |
Expense reimbursements due from Adviser | | | 822 | | | | 3,751 | | | | - | |
Foreign tax reclaims | | | - | | | | 3,207 | | | | 71,638 | |
Other assets | | | 15,955 | | | | 9,840 | | | | 120,558 | |
| | | | | | | | | | | | |
Total Assets | | | 60,102,180 | | | | 40,264,192 | | | | 601,990,988 | |
| | | | | | | | | | | | |
Liabilities | | | | | | | | | | | | |
Payables: | | | | | | | | | | | | |
Due to custodian bank | | | 19,916 | | | | 156,780 | | | | 1,511,492 | |
Expense recoupment due to adviser | | | 600 | | | | 6,948 | | | | - | |
Payable for collateral received on securities loaned | | | - | | | | - | | | | 7,793,958 | |
Fund shares redeemed | | | 54,605 | | | | 25,220 | | | | 772,970 | |
Advisory fees | | | 49,361 | | | | 33,120 | | | | 486,812 | |
Accrued distribution fees | | | 379 | | | | 944 | | | | 9,994 | |
Fund accounting fees | | | 1,902 | | | | 1,317 | | | | 19,630 | |
Transfer agent fees | | | 11,029 | | | | 6,917 | | | | 82,088 | |
Administration fees | | | 2,468 | | | | 1,656 | | | | 24,543 | |
Trustee fees | | | 1,340 | | | | 666 | | | | 15,905 | |
Accrued expenses | | | 36,161 | | | | 30,798 | | | | 126,000 | |
| | | | | | | | | | | | |
Total Liabilities | | | 177,761 | | | | 264,366 | | | | 10,843,392 | |
| | | | | | | | | | | | |
Net Assets - all share classes | | $ | 59,924,419 | | | $ | 39,999,826 | | | $ | 591,147,596 | |
| | | | | | | | | | | | |
Net Assets - Class S | | $ | 58,313,638 | | | $ | 37,566,769 | | | $ | 567,054,257 | |
| | | | | | | | | | | | |
Net Assets - Class C | | $ | 68,927 | | | $ | 933,888 | | | $ | 8,256,947 | |
| | | | | | | | | | | | |
Net Assets - Class A | | $ | 1,541,854 | | | $ | 1,499,169 | | | $ | 15,836,392 | |
| | | | | | | | | | | | |
| | | | | | | | | | | | |
| | | ICON
Consumer
Discretionary
Fund | | | ICON
Consumer
Staples
Fund | | | ICON
Energy
Fund | |
Net Assets Consist of | | | | | | | | | | | | |
Paid-in capital | | $ | 67,277,720 | | | $ | 38,896,985 | | | $ | 571,733,857 | |
Accumulated undistributed net investment income/(loss) | | | 107,080 | | | | 7,872 | | | | 5,791,817 | |
Accumulated undistributed net realized gain/(loss) from investments and foreign currency transactions | | | (18,100,662 | ) | | | (2,253,445 | ) | | | (41,103,589 | ) |
Unrealized appreciation/(depreciation) on investments and foreign currency transactions | | | 10,640,281 | | | | 3,348,414 | | | | 54,725,511 | |
| | | | | | | | | | | | |
Net Assets | | $ | 59,924,419 | | | $ | 39,999,826 | | | $ | 591,147,596 | |
| | | | | | | | | | | | |
Shares outstanding (unlimited shares authorized, no par value) | | | | | | | | | | | | |
Class S | | | 4,934,792 | | | | 3,682,948 | | | | 29,569,064 | |
Class C | | | 5,955 | | | | 92,801 | | | | 437,603 | |
Class A | | | 132,405 | | | | 146,353 | | | | 828,316 | |
Net asset value (offering and redemption price per share) | | | | | | | | | | | | |
Class S | | $ | 11.82 | | | $ | 10.20 | | | $ | 19.18 | |
Class C | | $ | 11.57 | | | $ | 10.06 | | | $ | 18.87 | |
Class A | | $ | 11.65 | | | $ | 10.24 | | | $ | 19.12 | |
Class A maximum offering price (100%/(100%-maximum sales charge)) of net asset value adjusted to the nearest cent per share | | $ | 12.36 | | | $ | 10.86 | | | $ | 20.29 | |
| | | |
† Includes securities on loan of | | $ | - | | | $ | - | | | $ | 7,387,829 | |
The accompanying notes are an integral part of the financial statements.
STATEMENTSOF ASSETSAND LIABILITIES
SEPTEMBER 30, 2012
| | | | | | | | | | | | |
| | | ICON
Financial
Fund | | | ICON
Healthcare
Fund | | | ICON
Industrials
Fund | |
Assets | | | | | | | | | | | | |
Investments, at cost | | $ | 32,856,999 | | | $ | 89,312,737 | | | $ | 35,569,552 | |
| | | | | | | | | | | | |
Investments, at value† | | | 36,522,953 | | | | 103,406,555 | | | | 40,724,995 | |
Receivables: | | | | | | | | | | | | |
Fund shares sold | | | 48,065 | | | | 40,736 | | | | 3,169 | |
Investments sold | | | 584,419 | | | | 557,006 | | | | - | |
Dividends | | | 40,137 | | | | 132,918 | | | | 58,085 | |
Expense reimbursements due from Adviser | | | 1,708 | | | | 2,196 | | | | 1,843 | |
Foreign tax reclaims | | | 4,616 | | | | 4,286 | | | | 2,199 | |
Other assets | | | 11,698 | | | | 25,134 | | | | 12,331 | |
| | | | | | | | | | | | |
Total Assets | | | 37,213,596 | | | | 104,168,831 | | | | 40,802,622 | |
| | | | | | | | | | | | |
Liabilities | | | | | | | | | | | | |
Payables: | | | | | | | | | | | | |
Due to custodian bank | | | 134,811 | | | | 497,654 | | | | 96 | |
Expense recoupment due to adviser | | | 237 | | | | 63 | | | | 743 | |
Payable for collateral received on securities loaned | | | - | | | | 1,993,044 | | | | 916,750 | |
Fund shares redeemed | | | 14,978 | | | | 88,527 | | | | 9,578 | |
Advisory fees | | | 35,778 | | | | 83,981 | | | | 33,330 | |
Accrued distribution fees | | | 1,921 | | | | 180 | | | | 40 | |
Fund accounting fees | | | 1,478 | | | | 3,546 | | | | 1,363 | |
Transfer agent fees | | | 10,235 | | | | 19,890 | | | | 8,875 | |
Administration fees | | | 1,789 | | | | 4,199 | | | | 1,666 | |
Trustee fees | | | 1,227 | | | | 2,305 | | | | 1,216 | |
Accrued expenses | | | 35,251 | | | | 44,252 | | | | 33,539 | |
| | | | | | | | | | | | |
Total Liabilities | | | 237,705 | | | | 2,737,641 | | | | 1,007,196 | |
| | | | | | | | | | | | |
Net Assets - all share classes | | $ | 36,975,891 | | | $ | 101,431,190 | | | $ | 39,795,426 | |
| | | | | | | | | | | | |
Net Assets - Class S | | $ | 27,695,782 | | | $ | 100,938,277 | | | $ | 39,621,101 | |
| | | | | | | | | | | | |
Net Assets - Class C | | $ | 2,551 | | | $ | 103,067 | | | $ | 11,774 | |
| | | | | | | | | | | | |
Net Assets - Class A | | $ | 9,277,558 | | | $ | 389,846 | | | $ | 162,551 | |
| | | | | | | | | | | | |
| | | | | | | | | | | | |
| | | ICON
Financial
Fund | | | ICON
Healthcare
Fund | | | ICON
Industrials
Fund | |
Net Assets Consist of | | | | | | | | | | | | |
Paid-in capital | | $ | 135,512,089 | | | $ | 87,543,173 | | | $ | 70,338,626 | |
Accumulated undistributed net investment income/(loss) | | | 301,877 | | | | 965,955 | | | | 420,620 | |
Accumulated undistributed net realized gain/(loss) from investments and foreign currency transactions | | | (102,504,029 | ) | | | (1,171,756 | ) | | | (36,119,263 | ) |
Unrealized appreciation/(depreciation) on investments and foreign currency transactions | | | 3,665,954 | | | | 14,093,818 | | | | 5,155,443 | |
| | | | | | | | | | | | |
Net Assets | | $ | 36,975,891 | | | $ | 101,431,190 | | | $ | 39,795,426 | |
| | | | | | | | | | | | |
Shares outstanding (unlimited shares authorized, no par value) | | | | | | | | | | | | |
Class S | | | 4,586,318 | | | | 5,747,776 | | | | 4,799,556 | |
Class C | | | 432 | | | | 5,989 | | | | 1,449 | |
Class A | | | 1,548,106 | | | | 22,375 | | | | 20,071 | |
Net asset value (offering and redemption price per share) | | | | | | | | | | | | |
Class S | | $ | 6.04 | | | $ | 17.56 | | | $ | 8.26 | |
Class C | | $ | 5.91 | | | $ | 17.21 | | | $ | 8.12 | |
Class A | | $ | 5.99 | | | $ | 17.42 | | | $ | 8.10 | |
Class A maximum offering price (100%/(100%-maximum sales charge)) of net asset value adjusted to the nearest cent per share | | $ | 6.36 | | | $ | 18.48 | | | $ | 8.59 | |
| | | |
† Includes securities on loan of | | $ | - | | | $ | 1,971,699 | | | $ | 897,940 | |
The accompanying notes are an integral part of the financial statements.
STATEMENTSOF ASSETSAND LIABILITIES
SEPTEMBER 30, 2012
| | | | | | | | | | | | |
| | | ICON
Information
Technology
Fund | | | ICON
Materials
Fund | | | ICON
Utilities
Fund | |
Assets | | | | | | | | | | | | |
Investments, at cost | | $ | 66,981,222 | | | $ | 35,661,682 | | | $ | 31,279,480 | |
| | | | | | | | | | | | |
Investments, at value† | | | 87,285,399 | | | | 42,539,459 | | | | 33,742,366 | |
Cash | | | - | | | | 89 | | | | - | |
Receivables: | | | | | | | | | | | | |
Fund shares sold | | | 21,881 | | | | 3,049 | | | | 42,883 | |
Investments sold | | | - | | | | 196,666 | | | | 370,411 | |
Dividends | | | 54,513 | | | | 100,600 | | | | 105,285 | |
Expense reimbursements due from Adviser | | | 1,827 | | | | 1,969 | | | | 416 | |
Foreign tax reclaims | | | - | | | | - | | | | 4,916 | |
Other assets | | | 16,742 | | | | 13,882 | | | | 9,603 | |
| | | | | | | | | | | | |
Total Assets | | | 87,380,362 | | | | 42,855,714 | | | | 34,275,880 | |
| | | | | | | | | | | | |
Liabilities | | | | | | | | | | | | |
Payables: | | | | | | | | | | | | |
Due to custodian bank | | | - | | | | - | | | | 281,734 | |
Expense recoupment due to adviser | | | 568 | | | | 527 | | | | 3,796 | |
Payable for collateral received on securities loaned | | | 2,154,166 | | | | 367,536 | | | | - | |
Fund shares redeemed | | | 78,289 | | | | 39,008 | | | | 25,111 | |
Advisory fees | | | 63,734 | | | | 34,208 | | | | 28,475 | |
Accrued distribution fees | | | 444 | | | | 275 | | | | 4,079 | |
Fund accounting fees | | | 2,504 | | | | 1,407 | | | | 1,144 | |
Transfer agent fees | | | 13,572 | | | | 10,776 | | | | 6,473 | |
Administration fees | | | 3,187 | | | | 1,710 | | | | 1,424 | |
Trustee fees | | | 1,838 | | | | 1,527 | | | | 791 | |
Accrued expenses | | | 37,986 | | | | 37,537 | | | | 30,252 | |
| | | | | | | | | | | | |
Total Liabilities | | | 2,356,288 | | | | 494,511 | | | | 383,279 | |
| | | | | | | | | | | | |
Net Assets - all share classes | | $ | 85,024,074 | | | $ | 42,361,203 | | | $ | 33,892,601 | |
| | | | | | | | | | | | |
Net Assets - Class S | | $ | 83,329,843 | | | $ | 41,626,721 | | | $ | 23,524,340 | |
| | | | | | | | | | | | |
Net Assets - Class C | | $ | 294,173 | | | $ | 195,033 | | | $ | 3,255,711 | |
| | | | | | | | | | | | |
Net Assets - Class A | | $ | 1,400,058 | | | $ | 539,449 | | | $ | 7,112,550 | |
| | | | | | | | | | | | |
| | | | | | | | | | | | |
| | | ICON
Information
Technology
Fund | | | ICON
Materials
Fund | | | ICON
Utilities
Fund | |
Net Assets Consist of | | | | | | | | | | | | |
Paid-in capital | | $ | 94,854,805 | | | $ | 53,458,552 | | | $ | 40,962,294 | |
Accumulated undistributed net investment income/(loss) | | | (105,973 | ) | | | 569,893 | | | | 5,200 | |
Accumulated undistributed net realized gain/(loss) from investments and foreign currency transactions | | | (30,028,935 | ) | | | (18,545,019 | ) | | | (9,537,779 | ) |
Unrealized appreciation/(depreciation) on investments and foreign currency transactions | | | 20,304,177 | | | | 6,877,777 | | | | 2,462,886 | |
| | | | | | | | | | | | |
Net Assets | | $ | 85,024,074 | | | $ | 42,361,203 | | | $ | 33,892,601 | |
| | | | | | | | | | | | |
Shares outstanding (unlimited shares authorized, no par value) | | | | | | | | | | | | |
Class S | | | 7,771,950 | | | | 3,743,828 | | | | 3,454,880 | |
Class C | | | 28,047 | | | | 17,827 | | | | 484,730 | |
Class A | | | 131,501 | | | | 48,752 | | | | 1,057,472 | |
Net asset value (offering and redemption price per share) | | | | | | | | | | | | |
Class S | | $ | 10.72 | | | $ | 11.12 | | | $ | 6.81 | |
Class C | | $ | 10.49 | | | $ | 10.94 | | | $ | 6.72 | |
Class A | | $ | 10.65 | | | $ | 11.07 | | | $ | 6.73 | |
Class A maximum offering price (100%/(100%-maximum sales charge)) of net asset value adjusted to the nearest cent per share | | $ | 11.30 | | | $ | 11.75 | | | $ | 7.14 | |
| | | |
† Includes securities on loan of | | $ | 2,108,756 | | | $ | 342,401 | | | $ | - | |
The accompanying notes are an integral part of the financial statements.
STATEMENTSOF OPERATIONS
FORTHEYEARENDED SEPTEMBER 30, 2012
| | | | | | | | | | | | |
| | | ICON
Consumer
Discretionary
Fund | | | ICON
Consumer
Staples
Fund | | | ICON
Energy
Fund | |
Investment Income | | | | | | | | | | | | |
Interest | | $ | 53 | | | $ | 38 | | | $ | 313 | |
Dividends | | | 863,776 | | | | 788,779 | | | | 12,998,653 | |
Income from securities lending, net | | | 2,163 | | | | 678 | | | | 101,625 | |
Foreign taxes withheld | | | (326 | ) | | | - | | | | (184,386 | ) |
| | | | | | | | | | | | |
Total Investment Income | | | 865,666 | | | | 789,495 | | | | 12,916,205 | |
| | | | | | | | | | | | |
Expenses | | | | | | | | | | | | |
Advisory fees | | | 523,830 | | | | 268,340 | | | | 6,067,976 | |
Distribution fees: | | | | | | | | | | | | |
Class C | | | 608 | | | | 3,073 | | | | 68,807 | |
Class A | | | 15,692 | | | | 3,466 | | | | 26,455 | |
Fund accounting fees | | | 10,476 | | | | 5,367 | | | | 122,484 | |
Transfer agent fees | | | 69,066 | | | | 38,852 | | | | 519,246 | |
Administration fees | | | 26,187 | | | | 13,415 | | | | 306,141 | |
Custody fees | | | 5,766 | | | | 4,789 | | | | 17,248 | |
Registration fees: | | | | | | | | | | | | |
Class S | | | 23,555 | | | | 17,447 | | | | 68,499 | |
Class C | | | 59 | | | | 1,328 | | | | 6,454 | |
Class A | | | 3,551 | | | | 2,071 | | | | 3,515 | |
Insurance expense | | | 4,010 | | | | 3,339 | | | | 90,225 | |
Trustee fees and expenses | | | 4,905 | | | | 2,306 | | | | 64,100 | |
Audit and tax service expense | | | 28,837 | | | | 28,837 | | | | 28,837 | |
Interest expense | | | 3,869 | | | | 2,607 | | | | 3,668 | |
Recoupment of previously reimbursed expenses | | | 1,840 | | | | 10,224 | | | | - | |
Other expenses | | | 38,316 | | | | 23,157 | | | | 267,926 | |
| | | | | | | | | | | | |
Total expenses before expense reimbursement | | | 760,567 | | | | 428,618 | | | | 7,661,581 | |
Expense reimbursement by Adviser due to expense limitation agreement | | | (1,981 | ) | | | (16,961 | ) | | | - | |
| | | | | | | | | | | | |
Net Expenses | | | 758,586 | | | | 411,657 | | | | 7,661,581 | |
| | | | | | | | | | | | |
Net Investment Income/(Loss) | | | 107,080 | | | | 377,838 | | | | 5,254,624 | |
| | | | | | | | | | | | |
Net Realized and Unrealized Gain/(Loss) on Investments and Foreign Currency Transactions | | | | | | | | | | | | |
Net realized gain/(loss) from investment transactions | | | 1,721,881 | | | | 1,416,484 | | | | (14,957,677 | ) |
Net realized gain/(loss) from foreign currency transactions | | | - | | | | - | | | | 1 | |
Change in unrealized net appreciation/ (depreciation) on investments and foreign currency transactions | | | 11,806,915 | | | | 3,306,301 | | | | 111,974,219 | |
| | | | | | | | | | | | |
Net realized and unrealized gain/(loss) on investments and foreign currency transactions | | | 13,528,796 | | | | 4,722,785 | | | | 97,016,543 | |
| | | | | | | | | | | | |
Net Increase/(Decrease) in Net Assets Resulting From Operations | | $ | 13,635,876 | | | $ | 5,100,623 | | | $ | 102,271,167 | |
| | | | | | | | | | | | |
The accompanying notes are an integral part of the financial statements.
| | | | | | | | | | | | | | | | | | | | | | |
ICON
Financial
Fund | | | ICON
Healthcare
Fund | | | ICON
Industrials
Fund | | | ICON
Information
Technology
Fund | | | ICON
Materials
Fund | | | ICON
Utilities
Fund | |
| | | | | | | | | | | | | | | | | | | | | | |
| $ | 61 | | | $ | 69 | | | $ | 39 | | | $ | 46 | | | $ | 72 | | | $ | 37 | |
| | 977,555 | | | | 2,158,709 | | | | 1,074,695 | | | | 809,754 | | | | 1,385,020 | | | | 1,411,055 | |
| | - | | | | 36,279 | | | | 1,631 | | | | 4,725 | | | | 2,498 | | | | - | |
| | (5,548 | ) | | | (23,449 | ) | | | (3,885 | ) | | | - | | | | (12,231 | ) | | | (467 | ) |
| | | | | | | | | | | | | | | | | | | | | | |
| | 972,068 | | | | 2,171,608 | | | | 1,072,480 | | | | 814,525 | | | | 1,375,359 | | | | 1,410,625 | |
| | | | | | | | | | | | | | | | | | | | | | |
| | | | | | | | | | | | | | | | | | | | | | |
| | 470,259 | | | | 899,055 | | | | 464,158 | | | | 714,449 | | | | 575,871 | | | | 308,258 | |
| | | | | | | | | | | | | | | | | | | | | | |
| | 98 | | | | 397 | | | | 204 | | | | 1,108 | | | | 1,941 | | | | 24,418 | |
| | 8,516 | | | | 583 | | | | 960 | | | | 532 | | | | 1,500 | | | | 13,749 | |
| | 9,394 | | | | 17,982 | | | | 9,269 | | | | 14,289 | | | | 11,517 | | | | 6,165 | |
| | 53,700 | | | | 113,351 | | | | 56,459 | | | | 82,066 | | | | 71,563 | | | | 41,052 | |
| | 23,508 | | | | 44,945 | | | | 23,203 | | | | 35,716 | | | | 28,787 | | | | 15,410 | |
| | 3,642 | | | | 3,301 | | | | 2,535 | | | | 2,997 | | | | 3,417 | | | | 3,157 | |
| | | | | | | | | | | | | | | | | | | | | | |
| | 20,072 | | | | 21,862 | | | | 18,306 | | | | 19,625 | | | | 20,921 | | | | 17,436 | |
| | 207 | | | | 2,065 | | | | 308 | | | | 407 | | | | 2,021 | | | | 484 | |
| | 2,940 | | | | 1,355 | | | | 485 | | | | 408 | | | | 1,078 | | | | 3,077 | |
| | 6,631 | | | | 9,875 | | | | 8,811 | | | | 10,267 | | | | 11,826 | | | | 3,298 | |
| | 4,352 | | | | 8,497 | | | | 5,027 | | | | 7,016 | | | | 6,363 | | | | 2,929 | |
| | 28,837 | | | | 28,837 | | | | 28,837 | | | | 28,837 | | | | 28,837 | | | | 28,837 | |
| | 3,728 | | | | 6,277 | | | | 4,784 | | | | 1,651 | | | | 3,673 | | | | 2,017 | |
| | | | | |
| | 1,479 | | | | 63 | | | | 1,468 | | | | 569 | | | | 527 | | | | 10,699 | |
| | 30,303 | | | | 53,537 | | | | 32,088 | | | | 42,556 | | | | 41,255 | | | | 23,189 | |
| | | | | | | | | | | | | | | | | | | | | | |
| 667,666 | | | | 1,211,982 | | | | 656,902 | | | | 962,493 | | | | 811,097 | | | | 504,175 | |
| (2,989 | ) | | | (6,336 | ) | | | (5,079 | ) | | | (4,544 | ) | | | (5,628 | ) | | | (5,758 | ) |
| | | | | | | | | | | | | | | | | | | | | | |
| | 664,677 | | | | 1,205,646 | | | | 651,823 | | | | 957,949 | | | | 805,469 | | | | 498,417 | |
| | | | | | | | | | | | | | | | | | | | | | |
| | 307,391 | | | | 965,962 | | | | 420,657 | | | | (143,424 | ) | | | 569,890 | | | | 912,208 | |
| | | | | | | | | | | | | | | | | | | | | | |
| | | | | | | | | | | | | | | | | | | | | | |
| 389,401 | | | | 3,733,841 | | | | 3,544,139 | | | | (316,676 | ) | | | 1,938,852 | | | | 361,079 | |
| (62 | ) | | | - | | | | (53 | ) | | | - | | | | - | | | | - | |
| 9,758,028 | | | | 19,012,768 | | | | 7,192,118 | | | | 18,102,518 | | | | 11,086,211 | | | | 1,826,061 | |
| | | | | | | | | | | | | | | | | | | | | | |
| 10,147,367 | | | | 22,746,609 | | | | 10,736,204 | | | | 17,785,842 | | | | 13,025,063 | | | | 2,187,140 | |
| | | | | | | | | | | | | | | | | | | | | | |
$ | 10,454,758 | | | $ | 23,712,571 | | | $ | 11,156,861 | | | $ | 17,642,418 | | | $ | 13,594,953 | | | $ | 3,099,348 | |
| | | | | | | | | | | | | | | | | | | | | | |
STATEMENTSOF CHANGESIN NET ASSETS
| | | | | | | | |
| | | ICON Consumer Discretionary Fund | |
| | | Year Ended
September 30,
2012 | | | Year Ended
September 30,
2011 | |
Operations | | | | | | | | |
Net investment income/(loss) | | $ | 107,080 | | | $ | (66,187 | ) |
Net realized gain/(loss) on investment transactions and foreign currency transactions | | | 1,721,881 | | | | 3,958,013 | |
Change in net unrealized appreciation/(depreciation) on investments and foreign currency transactions | | | 11,806,915 | | | | (2,613,003 | ) |
| | | | | | | | |
Net increase/(decrease) in net assets resulting from operations | | | 13,635,876 | | | | 1,278,823 | |
| | | | | | | | |
Dividends and Distributions to Shareholders | | | | | | | | |
Net investment income | | | | | | | | |
Class S | | | - | | | | - | |
Class C | | | - | | | | - | |
Class A | | | - | | | | - | |
Net realized gains | | | | | | | | |
Class S | | | - | | | | - | |
Class C | | | - | | | | - | |
Class A | | | - | | | | - | |
| | | | | | | | |
Net decrease from dividends and distributions | | | - | | | | - | |
| | | | | | | | |
Fund Share Transactions | | | | | | | | |
Shares sold | | | | | | | | |
Class S | | | 41,313,577 | | | | 35,997,921 | |
Class C | | | 41,835 | | | | 34,449 | |
Class A | | | 12,555,595 | | | | 13,977 | |
Reinvested dividends and distributions | | | | | | | | |
Class S | | | - | | | | - | |
Class C | | | - | | | | - | |
Class A | | | - | | | | - | |
Shares repurchased | | | | | | | | |
Class S | | | (29,433,208 | ) | | | (20,906,184 | ) |
Class C | | | (19,367 | ) | | | - | |
Class A | | | (12,336,129 | ) | | | (2,421 | ) |
| | | | | | | | |
Net increase/(decrease) from fund share transactions | | | 12,122,303 | | | | 15,137,742 | |
| | | | | | | | |
Total net increase/(decrease) in net assets | | | 25,758,179 | | | | 16,416,565 | |
Net Assets | | | | | | | | |
Beginning of year | | | 34,166,240 | | | | 17,749,675 | |
| | | | | | | | |
End of year | | $ | 59,924,419 | | | $ | 34,166,240 | |
| | | | | | | | |
| | | | | | | | | | | | | | | | | | | | | | |
| ICON Consumer Staples Fund | | | ICON Energy Fund | | | ICON Financial Fund | |
Year Ended
September 30,
2012 | | | Year Ended
September 30,
2011 | | | Year Ended
September 30,
2012 | | | Year Ended
September 30,
2011 | | | Year Ended
September 30,
2012 | | | Year Ended
September 30,
2011 | |
| | | | | | | | | | | | | | | | | | | | | | |
| $ | 377,838 | | | $ | 279,768 | | | $ | 5,254,624 | | | $ | 5,196,764 | | | $ | 307,391 | | | $ | 219,707 | |
|
1,416,484 |
| | | 6,056,213 | | | | (14,957,676 | ) | | | 56,907,131 | | | | 389,339 | | | | 4,264,953 | |
|
3,306,301 |
| | | (3,689,577 | ) | | | 111,974,219 | | | | (79,499,501 | ) | | | 9,758,028 | | | | (8,169,704 | ) |
| | | | | | | | | | | | | | | | | | | | | | |
|
5,100,623 |
| | | 2,646,404 | | | | 102,271,167 | | | | (17,395,606 | ) | | | 10,454,758 | | | | (3,685,044 | ) |
| | | | | | | | | | | | | | | | | | | | | | |
| | | | | | | | | | | | | | | | | | | | | | |
| | | | | | | | | | | | | | | | | | | | | | |
| | (607,366 | ) | | | (315,201 | ) | | | (4,918,808 | ) | | | (6,512,391 | ) | | | (210,303 | ) | | | (214,079 | ) |
| | (4,771 | ) | | | – | * | | | (14,407 | ) | | | (2,299 | ) | | | (30 | ) | | | – | * |
| | (37,597 | ) | | | – | * | | | (36,255 | ) | | | (2,050 | ) | | | (365 | ) | | | – | * |
| | | | | | | | | | | | | | | | | | | | | | |
| | - | | | | - | | | | (13,005,707 | ) | | | - | | | | - | | | | - | |
| | - | | | | - | | | | (124,748 | ) | | | - | | | | - | | | | - | |
| | - | | | | - | | | | (160,032 | ) | | | - | | | | - | | | | - | |
| | | | | | | | | | | | | | | | | | | | | | |
| | (649,734 | ) | | | (315,201 | ) | | | (18,259,957 | ) | | | (6,516,740 | ) | | | (210,698 | ) | | | (214,079 | ) |
| | | | | | | | | | | | | | | | | | | | | | |
| | | | | | | | | | | | | | | | | | | | | | |
| | | | | | | | | | | | | | | | | | | | | | |
| | 38,108,999 | | | | 4,430,851 | | | | 120,855,909 | | | | 292,023,538 | | | | 27,764,740 | | | | 5,449,823 | |
| | 858,192 | | | | 64,933 | | | | 3,912,708 | | | | 6,473,169 | | | | 1,000 | | | | 11,500 | |
| | 3,237,040 | | | | 58,829 | | | | 11,659,637 | | | | 13,691,961 | | | | 8,825,613 | | | | 43,528 | |
| | | | | | | | | | | | | | | | | | | | | | |
| | 590,753 | | | | 307,247 | | | | 16,918,343 | | | | 6,151,455 | | | | 205,516 | | | | 205,345 | |
| | 3,283 | | | | - | | | | 123,901 | | | | 2,134 | | | | 30 | | | | - | |
| | 36,134 | | | | - | | | | 166,811 | | | | 1,303 | | | | 127 | | | | - | |
| | | | | | | | | | | | | | | | | | | | | | |
| | (26,025,739 | ) | | | (17,099,046 | ) | | | (209,071,623 | ) | | | (231,307,972 | ) | | | (42,061,174 | ) | | | (28,086,279 | ) |
| | (20,676 | ) | | | (8,325 | ) | | | (1,176,364 | ) | | | (481,687 | ) | | | (9,535 | ) | | | - | |
| | (1,931,826 | ) | | | (33,053 | ) | | | (3,368,788 | ) | | | (5,707,105 | ) | | | (459,328 | ) | | | (10,223 | ) |
| | | | | | | | | | | | | | | | | | | | | | |
|
14,856,160 |
| | | (12,278,564 | ) | | | (59,979,466 | ) | | | 80,846,796 | | | | (5,733,011 | ) | | | (22,386,306 | ) |
| | | | | | | | | | | | | | | | | | | | | | |
| | 19,307,049 | | | | (9,947,361 | ) | | | 24,031,744 | | | | 56,934,450 | | | | 4,511,049 | | | | (26,285,429 | ) |
| | | | | | | | | | | | | | | | | | | | | | |
| | 20,692,777 | | | | 30,640,138 | | | | 567,115,852 | | | | 510,181,402 | | | | 32,464,842 | | | | 58,750,271 | |
| | | | | | | | | | | | | | | | | | | | | | |
| $ | 39,999,826 | | | $ | 20,692,777 | | | $ | 591,147,596 | | | $ | 567,115,852 | | | $ | 36,975,891 | | | $ | 32,464,842 | |
| | | | | | | | | | | | | | | | | | | | | | |
STATEMENTSOF CHANGESIN NET ASSETS (CONTINUED)
| | | | | | | | |
| | | ICON Consumer Discretionary Fund | |
| | | Year Ended
September 30,
2012 | | | Year Ended
September 30,
2011 | |
Transactions in Fund Shares | | | | | | | | |
Shares sold | | | | | | | | |
Class S | | | 3,838,023 | | | | 3,902,028 | |
Class C | | | 4,075 | | | | 3,645 | |
Class A | | | 1,265,567 | | | | 1,549 | |
Reinvested dividends and distributions | | | | | | | | |
Class S | | | - | | | | - | |
Class C | | | - | | | | - | |
Class A | | | - | | | | - | |
Shares repurchased | | | | | | | | |
Class S | | | (2,787,134 | ) | | | (2,259,195 | ) |
Class C | | | (1,766 | ) | | | - | |
Class A | | | (1,134,440 | ) | | | (272 | ) |
| | | | | | | | |
Net increase/(decrease) | | | 1,184,325 | | | | 1,647,755 | |
Shares outstanding, beginning of year | | | 3,888,827 | | | | 2,241,072 | |
| | | | | | | | |
Shares outstanding, end of year | | | 5,073,152 | | | | 3,888,827 | |
| | | | | | | | |
Accumulated undistributed net investment income/(loss) | | $ | 107,080 | | | $ | - | |
| | | | | | | | |
The accompanying notes are an integral part of the financial statements.
| | | | | | | | | | | | | | | | | | | | | | |
| ICON Consumer Staples Fund | | | ICON Energy Fund | | | ICON Financial Fund | |
Year Ended
September 30,
2012 | | | Year Ended
September 30,
2011 | | | Year Ended
September 30,
2012 | | | Year Ended
September 30,
2011 | | | Year Ended
September 30,
2012 | | | Year Ended
September 30,
2011 | |
| | | | | | | | | | | | | | | | | | | | | | |
| | | | | | | | | | | | | | | | | | | | | | |
| | 3,984,680 | | | | 502,481 | | | | 6,426,038 | | | | 13,946,024 | | | | 5,007,873 | | | | 964,735 | |
| | 88,143 | | | | 7,402 | | | | 208,736 | | | | 310,026 | | | | 188 | | | | 1,897 | |
| | 341,933 | | | | 6,526 | | | | 640,406 | | | | 634,607 | | | | 1,623,709 | | | | 7,154 | |
| | | | | | | | | | | | | | | | | | | | | | |
| | 62,161 | | | | 35,644 | | | | 970,645 | | | | 315,298 | | | | 42,288 | | | | 34,396 | |
| | 346 | | | | - | | | | 7,162 | | | | 109 | | | | 6 | | | | - | |
| | 3,860 | | | | - | | | | 9,581 | | | | 66 | | | | 26 | | | | - | |
| | | | | | | | | | | | | | | | | | | | | | |
| | (2,756,946 | ) | | | (1,937,424 | ) | | | (11,259,069 | ) | | | (11,397,070 | ) | | | (7,376,904 | ) | | | (4,672,640 | ) |
| | (2,125 | ) | | | (966 | ) | | | (64,819 | ) | | | (23,612 | ) | | | (1,661 | ) | | | - | |
| | (202,173 | ) | | | (3,794 | ) | | | (183,587 | ) | | | (272,758 | ) | | | (80,699 | ) | | | (2,086 | ) |
| | | | | | | | | | | | | | | | | | | | | | |
| | 1,519,879 | | | | (1,390,131 | ) | | | (3,244,907 | ) | | | 3,512,690 | | | | (785,174 | ) | | | (3,666,544 | ) |
| | 2,402,223 | | | | 3,792,354 | | | | 34,079,890 | | | | 30,567,200 | | | | 6,920,030 | | | | 10,586,574 | |
| | | | | | | | | | | | | | | | | | | | | | |
| | 3,922,102 | | | | 2,402,223 | | | | 30,834,983 | | | | 34,079,890 | | | | 6,134,856 | | | | 6,920,030 | |
| | | | | | | | | | | | | | | | | | | | | | |
$ |
7,872 |
| | $ | 279,768 | | | $ | 5,791,817 | | | $ | 5,562,115 | | | $ | 301,877 | | | $ | 210,720 | |
| | | | | | | | | | | | | | | | | | | | | | |
STATEMENTSOF CHANGESIN NET ASSETS (CONTINUED)
| | | | | | | | |
| | | ICON Healthcare Fund | |
| | | Year Ended
September 30,
2012 | | | Year Ended
September 30,
2011 | |
Operations | | | | | | | | |
Net investment income/(loss) | | $ | 965,962 | | | $ | 663,361 | |
Net realized gain/(loss) on investment transactions and foreign currency transactions | | | 3,733,841 | | | | 16,832,522 | |
Change in net unrealized appreciation/(depreciation) on investments and foreign currency transactions | | | 19,012,768 | | | | (14,799,677 | ) |
| | | | | | | | |
Net increase/(decrease) in net assets resulting from operations | | | 23,712,571 | | | | 2,696,206 | |
| | | | | | | | |
Dividends and Distributions to Shareholders | | | | | | | | |
Net investment income | | | | | | | | |
Class S | | | (661,181 | ) | | | (368,446 | ) |
Class C | | | (198 | ) | | | - | * |
Class A | | | (1,982 | ) | | | - | * |
Net realized gains | | | | | | | | |
Class S | | | - | | | | - | |
Class C | | | - | | | | - | |
Class A | | | - | | | | - | |
| | | | | | | | |
Net decrease from dividends and distributions | | | (663,361 | ) | | | (368,446 | ) |
| | | | | | | | |
Fund Share Transactions | | | | | | | | |
Shares sold | | | | | | | | |
Class S | | | 59,020,177 | | | | 34,364,122 | |
Class C | | | 78,893 | | | | 24,350 | |
Class A | | | 544,015 | | | | 139,248 | |
Reinvested dividends and distributions | | | | | | | | |
Class S | | | 617,310 | | | | 339,364 | |
Class C | | | 198 | | | | - | |
Class A | | | 1,781 | | | | - | |
Shares repurchased | | | | | | | | |
Class S | | | (56,788,889 | ) | | | (34,486,108 | ) |
Class C | | | (7,628 | ) | | | - | |
Class A | | | (346,970 | ) | | | - | |
| | | | | | | | |
Net increase/(decrease) from fund share transactions | | | 3,118,887 | | | | 380,976 | |
| | | | | | | | |
Total net increase/(decrease) in net assets | | | 26,168,097 | | | | 2,708,736 | |
Net Assets | | | | | | | | |
Beginning of year | | | 75,263,093 | | | | 72,554,357 | |
| | | | | | | | |
End of year | | $ | 101,431,190 | | | $ | 75,263,093 | |
| | | | | | | | |
| | | | | | | | | | | | | | | | | | | | | | |
| ICON Industrials Fund | | | ICON Information
Technology Fund | | | ICON Materials Fund | |
Year Ended
September 30,
2012 | | | Year Ended
September 30,
2011 | | | Year Ended
September 30,
2012 | | | Year Ended
September 30,
2011 | | | Year Ended
September 30,
2012 | | | Year Ended
September 30,
2011 | |
| | | | | | | | | | | | | | | | | | | | | | |
| $ | 420,657 | | | $ | 535,389 | | | $ | (143,424 | ) | | $ | (310,407 | ) | | $ | 569,890 | | | $ | 651,166 | |
|
3,544,086 |
| | | 4,947,567 | | | | (316,676 | ) | | | 10,930,880 | | | | 1,938,852 | | | | 14,037,247 | |
|
7,192,118 |
| | | (9,247,082 | ) | | | 18,102,518 | | | | (7,722,736 | ) | | | 11,086,211 | | | | (18,663,236 | ) |
| | | | | | | | | | | | | | | | | | | | | | |
| 11,156,861 | | | | (3,764,126 | ) | | | 17,642,418 | | | | 2,897,737 | | | | 13,594,953 | | | | (3,974,823 | ) |
| | | | | | | | | | | | | | | | | | | | | | |
| | | | | | | | | | | | | | | | | | | | | | |
| | | | | | | | | | | | | | | | | | | | | | |
| | (533,894 | ) | | | (478,530 | ) | | | - | | | | - | | | | (645,281 | ) | | | (477,527 | ) |
| | (101 | ) | | | - | * | | | - | | | | - | | | | (1,002 | ) | | | – | * |
| | (1,598 | ) | | | (24 | ) | | | - | | | | - | | | | (4,720 | ) | | | (659 | ) |
| | | | | | | | | | | | | | | | | | | | | | |
| | - | | | | - | | | | - | | | | - | | | | - | | | | - | |
| | - | | | | - | | | | - | | | | - | | | | - | | | | - | |
| | - | | | | - | | | | - | | | | - | | | | - | | | | - | |
| | | | | | | | | | | | | | | | | | | | | | |
| | (535,593 | ) | | | (478,554 | ) | | | - | | | | - | | | | (651,003 | ) | | | (478,186 | ) |
| | | | | | | | | | | | | | | | | | | | | | |
| | | | | | | | | | | | | | | | | | | | | | |
| | | | | | | | | | | | | | | | | | | | | | |
| | 9,116,007 | | | | 25,861,382 | | | | 31,212,015 | | | | 21,159,024 | | | | 8,002,597 | | | | 23,865,539 | |
| | 15,368 | | | | 28,866 | | | | 290,459 | | | | 2,731 | | | | 71,781 | | | | 191,926 | |
| | 2,866,767 | | | | 583,511 | | | | 1,490,272 | | | | 1,500 | | | | 168,201 | | | | 1,071,934 | |
| | | | | | | | | | | | | | | | | | | | | | |
| | 525,486 | | | | 466,250 | | | | - | | | | - | | | | 586,449 | | | | 429,088 | |
| | 55 | | | | - | | | | - | | | | - | | | | 923 | | | | - | |
| | 548 | | | | 24 | | | | - | | | | - | | | | 3,278 | | | | 518 | |
| | | | | | | | | | | | | | | | | | | | | | |
| | (31,170,444 | ) | | | (43,113,233 | ) | | | (26,579,338 | ) | | | (40,245,229 | ) | | | (38,839,092 | ) | | | (48,822,526 | ) |
| | (21,576 | ) | | | (8,746 | ) | | | (8,609 | ) | | | (1,175 | ) | | | (25,844 | ) | | | (35,925 | ) |
| | (2,948,167 | ) | | | (392,087 | ) | | | (106,906 | ) | | | - | | | | (225,421 | ) | | | (428,748 | ) |
| | | | | | | | | | | | | | | | | | | | | | |
| | (21,615,956 | ) | | | (16,574,033 | ) | | | 6,297,893 | | | | (19,083,149 | ) | | | (30,257,128 | ) | | | (23,728,194 | ) |
| | | | | | | | | | | | | | | | | | | | | | |
| | (10,994,688 | ) | | | (20,816,713 | ) | | | 23,940,311 | | | | (16,185,412 | ) | | | (17,313,178 | ) | | | (28,181,203 | ) |
| | | | | | | | | | | | | | | | | | | | | | |
| | 50,790,114 | | | | 71,606,827 | | | | 61,083,763 | | | | 77,269,175 | | | | 59,674,381 | | | | 87,855,584 | |
| | | | | | | | | | | | | | | | | | | | | | |
| $ | 39,795,426 | | | $ | 50,790,114 | | | $ | 85,024,074 | | | $ | 61,083,763 | | | $ | 42,361,203 | | | $ | 59,674,381 | |
| | | | | | | | | | | | | | | | | | | | | | |
STATEMENTSOF CHANGESIN NET ASSETS (CONTINUED)
| | | | | | | | |
| | | ICON Healthcare Fund | |
| | | Year Ended
September 30,
2012 | | | Year Ended
September 30,
2011 | |
Transactions in Fund Shares | | | | | | | | |
Shares sold | | | | | | | | |
Class S | | | 3,772,473 | | | | 2,280,950 | |
Class C | | | 4,831 | | | | 1,631 | |
Class A | | | 33,895 | | | | 9,286 | |
Reinvested dividends and distributions | | | | | | | | |
Class S | | | 43,138 | | | | 25,045 | |
Class C | | | 14 | | | | - | |
Class A | | | 125 | | | | - | |
Shares repurchased | | | | | | | | |
Class S | | | (3,607,680 | ) | | | (2,443,847 | ) |
Class C | | | (488 | ) | | | - | |
Class A | | | (20,932 | ) | | | - | |
| | | | | | | | |
Net increase/(decrease) | | | 225,376 | | | | (126,935 | ) |
Shares outstanding, beginning of year | | | 5,550,764 | | | | 5,677,699 | |
| | | | | | | | |
Shares outstanding, end of year | | | 5,776,140 | | | | 5,550,764 | |
| | | | | | | | |
Accumulated undistributed net investment income/(loss) | | $ | 965,955 | | | $ | 663,354 | |
| | | | | | | | |
The accompanying notes are an integral part of the financial statements.
| | | | | | | | | | | | | | | | | | | | | | |
| ICON Industrials Fund | | | ICON Information
Technology Fund | | | ICON Materials Fund | |
Year Ended
September 30,
2012 | | | Year Ended
September 30,
2011 | | | Year Ended
September 30,
2012 | | | Year Ended
September 30,
2011 | | | Year Ended
September 30,
2012 | | | Year Ended
September 30,
2011 | |
| | | | | | | | | | | | | | | | | | | | | | |
| | | | | | | | | | | | | | | | | | | | | | |
| | 1,103,070 | | | | 3,033,834 | | | | 3,027,960 | | | | 2,272,423 | | | | 722,271 | | | | 2,072,102 | |
| | 1,849 | | | | 3,349 | | | | 28,703 | | | | 289 | | | | 6,709 | | | | 16,427 | |
| | 344,128 | | | | 67,174 | | | | 142,036 | | | | 160 | | | | 15,763 | | | | 92,217 | |
| | | | | | | | | | | | | | | | | | | | | | |
| | 69,694 | | | | 56,790 | | | | - | | | | - | | | | 58,940 | | | | 37,972 | |
| | 7 | | | | - | | | | - | | | | - | | | | 94 | | | | - | |
| | 73 | | | | 3 | | | | - | | | | - | | | | 330 | | | | 46 | |
| | | | | | | | | | | | | | | | | | | | | | |
| | (3,827,215 | ) | | | (5,217,067 | ) | | | (2,685,759 | ) | | | (4,436,744 | ) | | | (3,597,504 | ) | | | (4,284,985 | ) |
| | (2,595 | ) | | | (1,162 | ) | | | (816 | ) | | | (130 | ) | | | (2,440 | ) | | | (2,964 | ) |
| | (342,247 | ) | | | (49,061 | ) | | | (10,696 | ) | | | - | | | | (21,569 | ) | | | (38,036 | ) |
| | | | | | | | | | | | | | | | | | | | | | |
| | (2,653,236 | ) | | | (2,106,140 | ) | | | 501,428 | | | | (2,164,002 | ) | | | (2,817,406 | ) | | | (2,107,221 | ) |
| | 7,474,312 | | | | 9,580,452 | | | | 7,430,070 | | | | 9,594,072 | | | | 6,627,813 | | | | 8,735,034 | |
| | | | | | | | | | | | | | | | | | | | | | |
| | 4,821,076 | | | | 7,474,312 | | | | 7,931,498 | | | | 7,430,070 | | | | 3,810,407 | | | | 6,627,813 | |
| | | | | | | | | | | | | | | | | | | | | | |
$ | 420,620 | | | $ | 535,609 | | | $ | (105,973 | ) | | $ | - | | | $ | 569,893 | | | $ | 651,006 | |
| | | | | | | | | | | | | | | | | | | | | | |
STATEMENTSOF CHANGESIN NET ASSETS (CONTINUED)
| | | | | | | | |
| | | ICON Utilities Fund | |
| | | Year Ended
September 30,
2012 | | | Year Ended
September 30,
2011 | |
Operations | | | | | | | | |
Net investment income/(loss) | | $ | 912,208 | | | $ | 938,924 | |
Net realized gain/(loss) on investment transactions and foreign currency transactions | | | 361,079 | | | | 3,030,424 | |
Change in net unrealized appreciation/(depreciation) on investments and foreign currency transactions | | | 1,826,061 | | | | (1,633,228 | ) |
| | | | | | | | |
Net increase/(decrease) in net assets resulting from operations | | | 3,099,348 | | | | 2,336,120 | |
| | | | | | | | |
Dividends and Distributions to Shareholders | | | | | | | | |
Net investment income | | | | | | | | |
Class S | | | (787,907 | ) | | | (1,565,042 | ) |
Class C | | | (80,281 | ) | | | (445 | ) |
Class A | | | (187,259 | ) | | | (4,387 | ) |
Net realized gains | | | | | | | | |
Class S | | | - | | | | - | |
Class C | | | - | | | | - | |
Class A | | | - | | | | - | |
| | | | | | | | |
Net decrease from dividends and distributions | | | (1,055,447 | ) | | | (1,569,874 | ) |
| | | | | | | | |
Fund Share Transactions | | | | | | | | |
Shares sold | | | | | | | | |
Class S | | | 20,476,677 | | | | 8,448,631 | |
Class C | | | 3,909,159 | | | | 24,131 | |
Class A | | | 6,771,649 | | | | 450,760 | |
Reinvested dividends and distributions | | | | | | | | |
Class S | | | 686,914 | | | | 1,508,702 | |
Class C | | | 36,141 | | | | 320 | |
Class A | | | 91,904 | | | | 4,387 | |
Shares repurchased | | | | | | | | |
Class S | | | (20,585,025 | ) | | | (21,453,429 | ) |
Class C | | | (809,410 | ) | | | - | |
Class A | | | (514,585 | ) | | | - | |
| | | | | | | | |
Net increase/(decrease) from fund share transactions | | | 10,063,424 | | | | (11,016,498 | ) |
| | | | | | | | |
Total net increase/(decrease) in net assets | | | 12,107,325 | | | | (10,250,252 | ) |
Net Assets | | | | | | | | |
Beginning of year | | | 21,785,276 | | | | 32,035,528 | |
| | | | | | | | |
End of year | | $ | 33,892,601 | | | $ | 21,785,276 | |
| | | | | | | | |
| | | | | | | | |
| | | ICON Utilities Fund | |
| | | Year Ended
September 30,
2012 | | | Year Ended
September 30,
2011 | |
Transactions in Fund Shares | | | | | | | | |
Shares sold | | | | | | | | |
Class S | | | 3,079,659 | | | | 1,349,348 | |
Class C | | | 600,513 | | | | 3,803 | |
Class A | | | 1,048,723 | | | | 71,186 | |
Reinvested dividends and distributions | | | | | | | | |
Class S | | | 101,750 | | | | 244,079 | |
Class C | | | 5,426 | | | | 51 | |
Class A | | | 13,780 | | | | 703 | |
Shares repurchased | | | | | | | | |
Class S | | | (3,116,021 | ) | | | (3,416,187 | ) |
Class C | | | (125,065 | ) | | | - | |
Class A | | | (76,922 | ) | | | - | |
| | | | | | | | |
Net increase/(decrease) | | | 1,531,843 | | | | (1,747,017 | ) |
Shares outstanding, beginning of year | | | 3,465,239 | | | | 5,212,256 | |
| | | | | | | | |
Shares outstanding, end of year | | | 4,997,082 | | | | 3,465,239 | |
| | | | | | | | |
Accumulated undistributed net investment income/(loss) | | $ | 5,200 | | | $ | 148,439 | |
| | | | | | | | |
The accompanying notes are an integral part of the financial statements.
FINANCIAL HIGHLIGHTS
| | | | | | | | | | | | | | | | | | | | | | | | |
| | | | | | Income/(loss) from investment operations | | | Less dividends and | |
| | | Net asset
value,
beginning
of period | | | Net
investment
income/
(loss)(x) | | | Net realized
and unrealized
gains/(losses)
on investments | | | Total from
investment
operations | | | Dividends
from net
investment
income | | | Distributions
from net
realized
gains | |
ICON Consumer Discretionary Fund | | | | | | | | | | | | | | | | | | | | | | | | |
Class S | | | | | | | | | | | | | | | | | | | | | | | | |
Year ended September 30, 2012 | | $ | 8.79 | | | $ | 0.03 | | | $ | 3.00 | | | $ | 3.03 | | | $ | - | | | $ | - | |
Year ended September 30, 2011 | | | 7.92 | | | | (0.02 | ) | | | 0.89 | | | | 0.87 | | | | - | | | | - | |
Year ended September 30, 2010 | | | 6.83 | | | | (0.05 | ) | | | 1.42 | | | | 1.37 | | | | (0.28 | ) | | | - | |
Year ended September 30, 2009 | | | 7.19 | | | | 0.01 | | | | (0.37 | ) | | | (0.36 | ) | | | - | | | | - | |
Year ended September 30, 2008 | | | 12.79 | | | | – | (c) | | | (2.61 | ) | | | (2.61 | ) | | | - | | | | (2.99 | ) |
Class C | | | | | | | | | | | | | | | | | | | | | | | | |
Year ended September 30, 2012 | | | 8.72 | | | | (0.12 | ) | | | 2.97 | | | | 2.85 | | | | - | | | | - | |
Year ended September 30, 2011 | | | 7.92 | | | | (0.12 | ) | | | 0.92 | | | | 0.80 | | | | - | | | | - | |
Class A | | | | | | | | | | | | | | | | | | | | | | | | |
Year ended September 30, 2012 | | | 8.75 | | | | (0.02 | ) | | | 2.92 | | | | 2.90 | | | | - | | | | - | |
Year ended September 30, 2011 | | | 7.92 | | | | (0.06 | ) | | | 0.89 | | | | 0.83 | | | | - | | | | - | |
ICON Consumer Staples Fund | | | | | | | | | | | | | | | | | | | | | | | | |
Class S | | | | | | | | | | | | | | | | | | | | | | | | |
Year ended September 30, 2012 | | | 8.61 | | | | 0.14 | | | | 1.69 | | | | 1.83 | | | | (0.24 | ) | | | - | |
Year ended September 30, 2011 | | | 8.08 | | | | 0.10 | | | | 0.52 | | | | 0.62 | | | | (0.09 | ) | | | - | |
Year ended September 30, 2010 | | | 7.32 | | | | 0.08 | | | | 0.76 | | | | 0.84 | | | | (0.08 | ) | | | - | |
Year ended September 30, 2009 | | | 7.37 | | | | 0.04 | | | | (0.09 | ) | | | (0.05 | ) | | | - | | | | - | (c) |
Year ended September 30, 2008 | | | 10.62 | | | | 0.03 | | | | (1.60 | ) | | | (1.57 | ) | | | (0.13 | ) | | | (1.55 | ) |
Class C | | | | | | | | | | | | | | | | | | | | | | | | |
Year ended September 30, 2012 | | | 8.53 | | | | 0.05 | | | | 1.66 | | | | 1.71 | | | | (0.18 | ) | | | - | |
Year ended September 30, 2011 | | | 8.08 | | | | 0.04 | | | | 0.50 | | | | 0.54 | | | | (0.09 | ) | | | - | |
Class A | | | | | | | | | | | | | | | | | | | | | | | | |
Year ended September 30, 2012 | | | 8.68 | | | | 0.11 | | | | 1.68 | | | | 1.79 | | | | (0.23 | ) | | | - | |
Year ended September 30, 2011 | | | 8.08 | | | | 0.11 | | | | 0.58 | | | | 0.69 | | | | (0.09 | ) | | | - | |
ICON Energy Fund | | | | | | | | | | | | | | | | | | | | | | | | |
Class S | | | | | | | | | | | | | | | | | | | | | | | | |
Year ended September 30, 2012 | | | 16.64 | | | | 0.16 | | | | 2.93 | | | | 3.09 | | | | (0.15 | ) | | | (0.40 | ) |
Year ended September 30, 2011 | | | 16.69 | | | | 0.16 | | | | - | | | | 0.16 | | | | (0.21 | ) | | | - | |
Year ended September 30, 2010 | | | 16.92 | | | | 0.21 | | | | (0.23 | ) | | | (0.02 | ) | | | (0.21 | ) | | | - | |
Year ended September 30, 2009 | | | 27.06 | | | | 0.21 | | | | (2.41 | ) | | | (2.20 | ) | | | (0.12 | ) | | | (7.82 | ) |
Year ended September 30, 2008 | | | 41.46 | | | | 0.20 | | | | (4.82 | ) | | | (4.62 | ) | | | (0.11 | ) | | | (9.67 | ) |
Class C | | | | | | | | | | | | | | | | | | | | | | | | |
Year ended September 30, 2012 | | | 16.47 | | | | (0.04 | ) | | | 2.88 | | | | 2.84 | | | | (0.04 | ) | | | (0.40 | ) |
Year ended September 30, 2011 | | | 16.69 | | | | (0.10 | ) | | | 0.09 | | | | (0.01 | ) | | | (0.21 | ) | | | - | |
Class A | | | | | | | | | | | | | | | | | | | | | | | | |
Year ended September 30, 2012 | | | 16.59 | | | | 0.11 | | | | 2.91 | | | | 3.02 | | | | (0.09 | ) | | | (0.40 | ) |
Year ended September 30, 2011 | | | 16.69 | | | | 0.08 | | | | 0.03 | | | | 0.11 | | | | (0.21 | ) | | | - | |
| | | | | | | | | | | | | | | | | | | | | | | | | | | | | | | | | | |
| distributions | | | | | | | | | | | | Ratio of expenses
to average net assets | | | Ratio of net investment
income/(loss)
to average net assets | | | | |
Total
dividends
and
distributions | | | Net asset
value, end
of period | | | Total
return* | | | Net assets,
end of
period (in
thousands) | | | Before
expense
limitation
and transfer
agent
earnings
credit | | | After
expense
limitation
and transfer
agent
earnings
credit | | | Before
expense
limitation
and transfer
agent
earnings
credit | | | After
expense
limitation
and transfer
agent
earnings
credit | | | Portfolio
turnover
rate(a) | |
| | | | | | | | | | | | | | | | | | | | | | | | | | | | | | | | | | |
| | | | | | | | | | | | | | | | | | | | | | | | | | | | | | | | | | |
| $ | – | | | $ | 11.82 | | | | 34.47 | % | | $ | 58,314 | | | | 1.40 | % | | | 1.40 | %(b) | | | 0.26 | % | | | 0.26 | % | | | 91.24 | % |
| | – | | | | 8.79 | | | | 10.98 | % | | | 34,123 | | | | 1.54 | % | | | 1.54 | %(b) | | | (0.23 | )% | | | (0.23 | )% | | | 107.57 | % |
| | (0.28 | ) | | | 7.92 | | | | 20.61 | % | | | 17,750 | | | | 2.02 | % | | | 2.02 | % | | | (0.62 | )% | | | (0.62 | )% | | | 194.84 | % |
| | – | | | | 6.83 | | | | (5.01 | )% | | | 14,205 | | | | 1.63 | % | | | 1.63 | % | | | 0.14 | % | | | 0.14 | % | | | 200.23 | % |
| | (2.99 | ) | | | 7.19 | | | | (24.21 | )% | | | 72,242 | | | | 1.38 | % | | | 1.38 | % | | | (0.04 | )% | | | (0.04 | )% | | | 218.32 | % |
| | | | | | | | | | | | | | | | | | | | | | | | | | | | | | | | | | |
| | – | | | | 11.57 | | | | 32.68 | % | | | 69 | | | | 6.01 | % | | | 2.75 | %(b) | | | (4.42 | )% | | | (1.16 | )% | | | 91.24 | % |
| | – | | | | 8.72 | | | | 10.10 | % | | | 32 | | | | 13.14 | % | | | 2.75 | %(b) | | | (11.73 | )% | | | (1.34 | )% | | | 107.57 | % |
| | | | | | | | | | | | | | | | | | | | | | | | | | | | | | | | | | |
| | – | | | | 11.65 | | | | 33.03 | % | | | 1,542 | | | | 1.78 | % | | | 1.78 | %(b) | | | (0.20 | )% | | | (0.20 | )% | | | 91.24 | % |
| | – | | | | 8.75 | | | | 10.48 | % | | | 11 | | | | 18.49 | % | | | 1.98 | %(b) | | | (17.17 | )% | | | (0.66 | )% | | | 107.57 | % |
| | | | | | | | | | | | | | | | | | | | | | | | | | | | | | | | | | |
| | | | | | | | | | | | | | | | | | | | | | | | | | | | | | | | | | |
| | (0.24 | ) | | | 10.20 | | | | 21.50 | % | | | 37,567 | | | | 1.55 | % | | | 1.51 | %(b) | | | 1.40 | % | | | 1.44 | % | | | 81.81 | % |
| | (0.09 | ) | | | 8.61 | | | | 7.64 | % | | | 20,614 | | | | 1.57 | % | | | 1.50 | %(b) | | | 1.03 | % | | | 1.10 | % | | | 109.56 | % |
| | (0.08 | ) | | | 8.08 | | | | 11.56 | % | | | 30,640 | | | | 1.54 | % | | | 1.54 | % | | | 0.98 | % | | | 0.98 | % | | | 86.31 | % |
| | – | (c) | | | 7.32 | | | | (0.64 | )% | | | 26,074 | | | | 1.58 | % | | | 1.58 | % | | | 0.72 | % | | | 0.72 | % | | | 134.29 | % |
| | (1.68 | ) | | | 7.37 | | | | (17.40 | )% | | | 42,139 | | | | 1.46 | % | | | 1.46 | % | | | 0.31 | % | | | 0.31 | % | | | 132.40 | % |
| | | | | | | | | | | | | | | | | | | | | | | | | | | | | | | | | | |
| | (0.18 | ) | | | 10.06 | | | | 20.26 | % | | | 934 | | | | 3.33 | % | | | 2.51 | %(b) | | | (0.35 | )% | | | 0.47 | % | | | 81.81 | % |
| | (0.09 | ) | | | 8.53 | | | | 6.65 | % | | | 55 | | | | 7.00 | % | | | 2.50 | %(b) | | | (4.09 | )% | | | 0.41 | % | | | 109.56 | % |
| | | | | | | | | | | | | | | | | | | | | | | | | | | | | | | | | | |
| | (0.23 | ) | | | 10.24 | | | | 20.94 | % | | | 1,499 | | | | 2.05 | % | | | 1.77 | %(b) | | | 0.82 | % | | | 1.10 | % | | | 81.81 | % |
| | (0.09 | ) | | | 8.68 | | | | 8.52 | % | | | 24 | | | | 7.60 | % | | | 1.75 | %(b) | | | (4.60 | )% | | | 1.25 | % | | | 109.56 | % |
| | | | | | | | | | | | | | | | | | | | | | | | | | | | | | | | | | |
| | | | | | | | | | | | | | | | | | | | | | | | | | | | | | | | | | |
| | (0.55 | ) | | | 19.18 | | | | 18.87 | % | | | 567,054 | | | | 1.23 | % | | | 1.23 | %(b) | | | 0.87 | % | | | 0.87 | % | | | 74.41 | % |
| | (0.21 | ) | | | 16.64 | | | | 0.80 | % | | | 556,393 | | | | 1.20 | % | | | 1.20 | %(b) | | | 0.77 | % | | | 0.77 | % | | | 88.31 | % |
| | (0.21 | ) | | | 16.69 | | | | (0.17 | )% | | | 510,181 | | | | 1.24 | % | | | 1.24 | % | | | 1.26 | % | | | 1.26 | % | | | 169.86 | % |
| | (7.94 | ) | | | 16.92 | | | | (1.73 | )% | | | 560,555 | | | | 1.24 | % | | | 1.24 | % | | | 1.39 | % | | | 1.39 | % | | | 186.47 | % |
| | (9.78 | ) | | | 27.06 | | | | (14.62 | )% | | | 492,637 | | | | 1.16 | % | | | 1.16 | % | | | 0.59 | % | | | 0.59 | % | | | 119.87 | % |
| | | | | | | | | | | | | | | | | | | | | | | | | | | | | | | | | | |
| | (0.44 | ) | | | 18.87 | | | | 17.50 | % | | | 8,257 | | | | 2.36 | % | | | 2.36 | %(b) | | | (0.20 | )% | | | (0.20 | )% | | | 74.41 | % |
| | (0.21 | ) | | | 16.47 | | | | (0.23 | )% | | | 4,718 | | | | 2.47 | % | | | 2.47 | %(b) | | | (0.47 | )% | | | (0.47 | )% | | | 88.31 | % |
| | | | | | | | | | | | | | | | | | | | | | | | | | | | | | | | | | |
| | (0.49 | ) | | | 19.12 | | | | 18.47 | % | | | 15,836 | | | | 1.55 | % | | | 1.55 | %(b) | | | 0.61 | % | | | 0.61 | % | | | 74.41 | % |
| | (0.21 | ) | | | 16.59 | | | | 0.49 | % | | | 6,005 | | | | 1.70 | % | | | 1.70 | %(b) | | | 0.38 | % | | | 0.38 | % | | | 88.31 | % |
FINANCIAL HIGHLIGHTS (CONTINUED)
| | | | | | | | | | | | | | | | | | | | | | | | |
| | | | | | Income/(loss) from investment operations | | | Less dividends and | |
| | | Net asset
value,
beginning
of period | | | Net
investment
income/
(loss)(x) | | | Net realized
and unrealized
gains/(losses)
on investments | | | Total from
investment
operations | | | Dividends
from net
investment
income | | | Distributions
from net
realized
gains | |
ICON Financial Fund | | | | | | | | | | | | | | | | | | | | | | | | |
Class S | | | | | | | | | | | | | | | | | | | | | | | | |
Year ended September 30, 2012 | | $ | 4.69 | | | $ | 0.04 | | | $ | 1.34 | | | $ | 1.38 | | | $ | (0.03 | ) | | $ | - | |
Year ended September 30, 2011 | | | 5.55 | | | | 0.03 | | | | (0.87 | ) | | | (0.84 | ) | | | (0.02 | ) | | | - | |
Year ended September 30, 2010 | | | 5.97 | | | | 0.02 | | | | (0.32 | ) | | | (0.30 | ) | | | (0.12 | ) | | | - | |
Year ended September 30, 2009 | | | 8.55 | | | | 0.09 | | | | (2.43 | ) | | | (2.34 | ) | | | (0.24 | ) | | | - | |
Year ended September 30, 2008 | | | 14.30 | | | | 0.21 | | | | (4.29 | ) | | | (4.08 | ) | | | (0.14 | ) | | | (1.53 | ) |
Class C | | | | | | | | | | | | | | | | | | | | | | | | |
Year ended September 30, 2012 | | | 4.64 | | | | (0.02 | ) | | | 1.31 | | | | 1.29 | | | | (0.02 | ) | | | - | |
Year ended September 30, 2011 | | | 5.55 | | | | (0.02 | ) | | | (0.87 | ) | | | (0.89 | ) | | | (0.02 | ) | | | - | |
Class A | | | | | | | | | | | | | | | | | | | | | | | | |
Year ended September 30, 2012 | | | 4.68 | | | | 0.01 | | | | 1.33 | | | | 1.34 | | | | (0.03 | ) | | | - | |
Year ended September 30, 2011 | | | 5.55 | | | | 0.01 | | | | (0.86 | ) | | | (0.85 | ) | | | (0.02 | ) | | | - | |
ICON Healthcare Fund | | | | | | | | | | | | | | | | | | | | | | | | |
Class S | | | | | | | | | | | | | | | | | | | | | | | | |
Year ended September 30, 2012 | | | 13.56 | | | | 0.17 | | | | 3.97 | | | | 4.14 | | | | (0.14 | ) | | | - | |
Year ended September 30, 2011 | | | 12.78 | | | | 0.12 | | | | 0.73 | | | | 0.85 | | | | (0.07 | ) | | | - | |
Year ended September 30, 2010 | | | 12.29 | | | | 0.04 | | | | 0.63 | | | | 0.67 | | | | (0.18 | ) | | | - | |
Year ended September 30, 2009 | | | 13.49 | | | | 0.08 | | | | (1.28 | ) | | | (1.20 | ) | | | - | | | | - | |
Year ended September 30, 2008 | | | 17.68 | | | | (0.02 | ) | | | (2.65 | ) | | | (2.67 | ) | | | - | | | | (1.52 | ) |
Class C | | | | | | | | | | | | | | | | | | | | | | | | |
Year ended September 30, 2012 | | | 13.43 | | | | (0.01 | ) | | | 3.91 | | | | 3.90 | | | | (0.12 | ) | | | - | |
Year ended September 30, 2011 | | | 12.78 | | | | (0.01 | ) | | | 0.73 | | | | 0.72 | | | | (0.07 | ) | | | - | |
Class A | | | | | | | | | | | | | | | | | | | | | | | | |
Year ended September 30, 2012 | | | 13.53 | | | | 0.11 | | | | 3.94 | | | | 4.05 | | | | (0.16 | ) | | | - | |
Year ended September 30, 2011 | | | 12.78 | | | | 0.12 | | | | 0.70 | | | | 0.82 | | | | (0.07 | ) | | | - | |
ICON Industrials Fund | | | | | | | | | | | | | | | | | | | | | | | | |
Class S | | | | | | | | | | | | | | | | | | | | | | | | |
Year ended September 30, 2012 | | | 6.80 | | | | 0.07 | | | | 1.48 | | | | 1.55 | | | | (0.09 | ) | | | - | |
Year ended September 30, 2011 | | | 7.47 | | | | 0.07 | | | | (0.67 | ) | | | (0.60 | ) | | | (0.07 | ) | | | - | |
Year ended September 30, 2010 | | | 6.38 | | | | 0.05 | | | | 1.17 | | | | 1.22 | | | | (0.13 | ) | | | - | |
Year ended September 30, 2009 | | | 8.16 | | | | 0.08 | | | | (1.82 | ) | | | (1.74 | ) | | | (0.04 | ) | | | - | |
Year ended September 30, 2008 | | | 10.77 | | | | 0.05 | | | | (2.32 | ) | | | (2.27 | ) | | | (0.01 | ) | | | (0.33 | ) |
Class C | | | | | | | | | | | | | | | | | | | | | | | | |
Year ended September 30, 2012 | | | 6.72 | | | | (0.01 | ) | | | 1.46 | | | | 1.45 | | | | (0.05 | ) | | | - | |
Year ended September 30, 2011 | | | 7.47 | | | | (0.02 | ) | | | (0.66 | ) | | | (0.68 | ) | | | (0.07 | ) | | | - | |
Class A | | | | | | | | | | | | | | | | | | | | | | | | |
Year ended September 30, 2012 | | | 6.76 | | | | 0.08 | | | | 1.35 | | | | 1.43 | | | | (0.09 | ) | | | - | |
Year ended September 30, 2011 | | | 7.47 | | | | 0.05 | | | | (0.69 | ) | | | (0.64 | ) | | | (0.07 | ) | | | - | |
| | | | | | | | | | | | | | | | | | | | | | | | | | | | | | | | | | |
| distributions | | | | | | | | | | | | Ratio of expenses
to average net assets | | | Ratio of net investment
income/(loss)
to average net assets | | | | |
Total
dividends
and
distributions | | | Net asset
value, end
of period | | | Total
return* | | | Net assets,
end of
period (in
thousands) | | | Before
expense
limitation
and transfer
agent
earnings
credits | | | After
expense
limitation
and transfer
agent
earnings
credits | | | Before
expense
limitation
and transfer
agent
earnings
credits | | | After
expense
limitation
and transfer
agent
earnings
credits | | | Portfolio
turnover
rate(a) | |
| | | | | | | | | | | | | | | | | | | | | | | | | | | | | | | | | | |
| | | | | | | | | | | | | | | | | | | | | | | | | | | | | | | | | | |
| $ | (0.03 | ) | | $ | 6.04 | | | | 29.54 | % | | $ | 27,696 | | | | 1.39 | % | | | 1.39 | %(b) | | | 0.70 | % | | | 0.70 | % | | | 95.47 | % |
| | (0.02 | ) | | | 4.69 | | | | (15.18 | )% | | | 32,432 | | | | 1.40 | % | | | 1.40 | %(b) | | | 0.44 | % | | | 0.44 | % | | | 100.23 | % |
| | (0.12 | ) | | | 5.55 | | | | (5.11 | )% | | | 58,750 | | | | 1.43 | % | | | 1.43 | % | | | 0.36 | % | | | 0.36 | % | | | 143.36 | % |
| | (0.24 | ) | | | 5.97 | | | | (26.80 | )% | | | 82,067 | | | | 1.42 | % | | | 1.42 | % | | | 1.70 | % | | | 1.70 | % | | | 194.00 | % |
| | (1.67 | ) | | | 8.55 | | | | (31.93 | )% | | | 128,175 | | | | 1.22 | % | | | 1.22 | % | | | 1.94 | % | | | 1.94 | % | | | 220.83 | % |
| | | | | | | | | | | | | | | | | | | | | | | | | | | | | | | | | | |
| | (0.02 | ) | | | 5.91 | | | | 27.79 | % | | | 3 | | | | 23.96 | % | | | 2.51 | %(b) | | | (21.84 | )% | | | (0.39 | )% | | | 95.47 | % |
| | (0.02 | ) | | | 4.64 | | | | (16.08 | )% | | | 9 | | | | 35.28 | % | | | 2.50 | %(b) | | | (33.22 | )% | | | (0.44 | )% | | | 100.23 | % |
| | | | | | | | | | | | | | | | | | | | | | | | | | | | | | | | | | |
| | (0.03 | ) | | | 5.99 | | | | 28.83 | % | | | 9,278 | | | | 1.80 | % | | | 1.77 | %(b) | | | 0.09 | % | | | 0.12 | % | | | 95.47 | % |
| | (0.02 | ) | | | 4.68 | | | | (15.36 | )% | | | 24 | | | | 7.37 | % | | | 1.75 | %(b) | | | (5.50 | )% | | | 0.12 | % | | | 100.23 | % |
| | | | | | | | | | | | | | | | | | | | | | | | | | | | | | | | | | |
| | | | | | | | | | | | | | | | | | | | | | | | | | | | | | | | | | |
| | (0.14 | ) | | | 17.56 | | | | 30.76 | % | | | 100,938 | | | | 1.34 | % | | | 1.34 | %(b) | | | 1.08 | % | | | 1.08 | % | | | 47.59 | % |
| | (0.07 | ) | | | 13.56 | | | | 6.66 | % | | | 75,116 | | | | 1.36 | % | | | 1.36 | %(b) | | | 0.85 | % | | | 0.85 | % | | | 83.63 | % |
| | (0.18 | ) | | | 12.78 | | | | 5.39 | % | | | 72,554 | | | | 1.36 | % | | | 1.36 | % | | | 0.31 | % | | | 0.31 | % | | | 102.42 | % |
| | - | | | | 12.29 | | | | (8.90 | )% | | | 110,605 | | | | 1.37 | % | | | 1.37 | % | | | 0.74 | % | | | 0.74 | % | | | 105.75 | % |
| | (1.52 | ) | | | 13.49 | | | | (16.43 | )% | | | 160,083 | | | | 1.25 | % | | | 1.25 | % | | | (0.12 | )% | | | (0.12 | )% | | | 61.44 | % |
| | | | | | | | | | | | | | | | | | | | | | | | | | | | | | | | | | |
| | (0.12 | ) | | | 17.21 | | | | 29.24 | % | | | 103 | | | | 11.81 | % | | | 2.51 | %(b) | | | (9.38 | )% | | | (0.08 | )% | | | 47.59 | % |
| | (0.07 | ) | | | 13.43 | | | | 5.64 | % | | | 22 | | | | 31.38 | % | | | 2.50 | %(b) | | | (28.98 | )% | | | (0.10 | )% | | | 83.63 | % |
| | | | | | | | | | | | | | | | | | | | | | | | | | | | | | | | | | |
| | (0.16 | ) | | | 17.42 | | | | 30.19 | % | | | 390 | | | | 2.89 | % | | | 1.76 | %(b) | | | (0.46 | )% | | | 0.67 | % | | | 47.59 | % |
| | (0.07 | ) | | | 13.53 | | | | 6.42 | % | | | 126 | | | | 7.15 | % | | | 1.75 | %(b) | | | (4.58 | )% | | | 0.82 | % | | | 83.63 | % |
| | | | | | | | | | | | | | | | | | | | | | | | | | | | | | | | | | |
| | | | | | | | | | | | | | | | | | | | | | | | | | | | | | | | | | |
| | (0.09 | ) | | | 8.26 | | | | 22.99 | % | | | 39,621 | | | | 1.40 | % | | | 1.40 | %(b) | | | 0.91 | % | | | 0.91 | % | | | 33.73 | % |
| | (0.07 | ) | | | 6.80 | | | | (8.21 | )% | | | 50,653 | | | | 1.36 | % | | | 1.36 | %(b) | | | 0.80 | % | | | 0.80 | % | | | 55.87 | % |
| | (0.13 | ) | | | 7.47 | | | | 19.40 | % | | | 71,607 | | | | 1.40 | % | | | 1.40 | % | | | 0.73 | % | | | 0.73 | % | | | 54.34 | % |
| | (0.04 | ) | | | 6.38 | | | | (21.25 | )% | | | 70,535 | | | | 1.37 | % | | | 1.37 | % | | | 1.39 | % | | | 1.39 | % | | | 96.24 | % |
| | (0.34 | ) | | | 8.16 | | | | (21.72 | )% | | | 125,286 | | | | 1.25 | % | | | 1.25 | % | | | 0.55 | % | | | 0.55 | % | | | 143.40 | % |
| | | | | | | | | | | | | | | | | | | | | | | | | | | | | | | | | | |
| | (0.05 | ) | | | 8.12 | | | | 21.58 | % | | | 12 | | | | 13.40 | % | | | 2.51 | %(b) | | | (11.07 | )% | | | (0.18 | )% | | | 33.73 | % |
| | (0.07 | ) | | | 6.72 | | | | (9.29 | )% | | | 15 | | | | 13.56 | % | | | 2.50 | %(b) | | | (11.29 | )% | | | (0.23 | )% | | | 55.87 | % |
| | | | | | | | | | | | | | | | | | | | | | | | | | | | | | | | | | |
| | (0.09 | ) | | | 8.10 | | | | 21.21 | % | | | 163 | | | | 2.50 | % | | | 1.75 | %(b) | | | 0.18 | % | | | 0.93 | % | | | 33.73 | % |
| | (0.07 | ) | | | 6.76 | | | | (8.75 | )% | | | 122 | | | | 3.46 | % | | | 1.75 | %(b) | | | (1.12 | )% | | | 0.59 | % | | | 55.87 | % |
FINANCIAL HIGHLIGHTS (CONTINUED)
| | | | | | | | | | | | | | | | | | | | | | | | |
| | | | | | Income/(loss) from investment operations | | | Less dividends and | |
| | | Net asset
value,
beginning
of period | | | Net
investment
income/
(loss)(x) | | | Net realized
and unrealized
gains/(losses)
on investments | | | Total from
investment
operations | | | Dividends
from net
investment
income | | | Distributions
from net
realized
gains | |
ICON Information Technology Fund | | | | | | | | | | | | | | | | | | | | | | | | |
Class S | | | | | | | | | | | | | | | | | | | | | | | | |
Year ended September 30, 2012 | | $ | 8.22 | | | $ | (0.02 | ) | | $ | 2.52 | | | $ | 2.50 | | | $ | - | | | $ | - | |
Year ended September 30, 2011 | | | 8.05 | | | | (0.04 | ) | | | 0.21 | | | | 0.17 | | | | - | | | | - | |
Year ended September 30, 2010 | | | 7.79 | | | | (0.05 | ) | | | 0.35 | | | | 0.30 | | | | (0.04 | ) | | | - | |
Year ended September 30, 2009 | | | 7.86 | | | | (0.01 | ) | | | (0.06 | ) | | | (0.07 | ) | | | - | | | | - | |
Year ended September 30, 2008 | | | 11.02 | | | | (0.04 | ) | | | (3.12 | ) | | | (3.16 | ) | | | - | | | | - | |
Class C | | | | | | | | | | | | | | | | | | | | | | | | |
Year ended September 30, 2012 | | | 8.13 | | | | (0.13 | ) | | | 2.49 | | | | 2.36 | | | | - | | | | - | |
Year ended September 30, 2011 | | | 8.05 | | | | (0.13 | ) | | | 0.21 | | | | 0.08 | | | | - | | | | - | |
Class A | | | | | | | | | | | | | | | | | | | | | | | | |
Year ended September 30, 2012 | | | 8.20 | | | | (0.06 | ) | | | 2.51 | | | | 2.45 | | | | - | | | | - | |
Year ended September 30, 2011 | | | 8.05 | | | | (0.05 | ) | | | 0.20 | | | | 0.15 | | | | - | | | | - | |
ICON Materials Fund | | | | | | | | | | | | | | | | | | | | | | | | |
Class S | | | | | | | | | | | | | | | | | | | | | | | | |
Year ended September 30, 2012 | | | 9.00 | | | | 0.11 | | | | 2.11 | | | | 2.22 | | | | (0.10 | ) | | | - | |
Year ended September 30, 2011 | | | 10.06 | | | | 0.08 | | | | (1.08 | ) | | | (1.00 | ) | | | (0.06 | ) | | | - | |
Year ended September 30, 2010 | | | 8.93 | | | | 0.05 | | | | 1.18 | | | | 1.23 | | | | (0.10 | ) | | | - | |
Year ended September 30, 2009 | | | 9.81 | | | | 0.11 | | | | (0.91 | ) | | | (0.80 | ) | | | (0.08 | ) | | | - | |
Year ended September 30, 2008 | | | 15.39 | | | | 0.08 | | | | (3.23 | ) | | | (3.15 | ) | | | (0.06 | ) | | | (2.37 | ) |
Class C | | | | | | | | | | | | | | | | | | | | | | | | |
Year ended September 30, 2012 | | | 8.92 | | | | – | (c) | | | 2.08 | | | | 2.08 | | | | (0.06 | ) | | | - | |
Year ended September 30, 2011 | | | 10.06 | | | | (0.03 | ) | | | (1.05 | ) | | | (1.08 | ) | | | (0.06 | ) | | | - | |
Class A | | | | | | | | | | | | | | | | | | | | | | | | |
Year ended September 30, 2012 | | | 8.97 | | | | 0.08 | | | | 2.10 | | | | 2.18 | | | | (0.08 | ) | | | - | |
Year ended September 30, 2011 | | | 10.06 | | | | 0.05 | | | | (1.08 | ) | | | (1.03 | ) | | | (0.06 | ) | | | - | |
ICON Utilities Fund | | | | | | | | | | | | | | | | | | | | | | | | |
Class S | | | | | | | | | | | | | | | | | | | | | | | | |
Year ended September 30, 2012 | | | 6.29 | | | | 0.20 | | | | 0.55 | | | | 0.75 | | | | (0.23 | ) | | | - | |
Year ended September 30, 2011 | | | 6.15 | | | | 0.24 | | | | 0.31 | | | | 0.55 | | | | (0.41 | ) | | | - | |
Year ended September 30, 2010 | | | 5.66 | | | | 0.19 | | | | 0.44 | | | | 0.63 | | | | (0.14 | ) | | | - | |
Year ended September 30, 2009 | | | 6.34 | | | | 0.14 | | | | (0.44 | ) | | | (0.30 | ) | | | (0.38 | ) | | | - | |
Year ended September 30, 2008 | | | 9.20 | | | | 0.14 | | | | (2.03 | ) | | | (1.89 | ) | | | (0.06 | ) | | | (0.91 | ) |
Class C | | | | | | | | | | | | | | | | | | | | | | | | |
Year ended September 30, 2012 | | | 6.21 | | | | 0.14 | | | | 0.57 | | | | 0.71 | | | | (0.20 | ) | | | - | |
Year ended September 30, 2011 | | | 6.15 | | | | 0.25 | | | | 0.22 | | | | 0.47 | | | | (0.41 | ) | | | - | |
Class A | | | | | | | | | | | | | | | | | | | | | | | | |
Year ended September 30, 2012 | | | 6.24 | | | | 0.20 | | | | 0.53 | | | | 0.73 | | | | (0.24 | ) | | | - | |
Year ended September 30, 2011 | | | 6.15 | | | | 0.34 | | | | 0.17 | | | | 0.51 | | | | (0.42 | ) | | | - | |
| (x) | Calculated using the average shares method. | |
| * | The total return calculation is for the period indicated and excludes any sales charges. | |
| (a) | Portfolio turnover is calculated at the Fund level. | |
| (b) | Effective January 1, 2011, the Fund’s operating expenses, not including interest expense, are contractually limited to the amounts discussed in Note 3. The ratios in these financial highlights reflect the limitation, including interest expense. | |
| (c) | Amount less than $0.005. | |
The accompanying notes are an integral part of the financial statements.
| | | | | | | | | | | | | | | | | | | | | | | | | | | | | | | | | | |
| distributions | | | | | | | | | | | | Ratio of expenses
to average net assets | | | Ratio of net investment
income/(loss)
to average net assets | | | | |
Total
dividends
and
distributions | | | Net asset
value, end
of period | | | Total
return* | | | Net assets,
end of
period (in
thousands) | | | Before
expense
limitation
and transfer
agent
earnings
credit | | | After
expense
limitation
and transfer
agent
earnings
credit | | | Before
expense
limitation
and transfer
agent
earnings
credit | | | After
expense
limitation
and transfer
agent
earnings
credit | | | Portfolio
turnover
rate(a) | |
| | | | | | | | | | | | | | | | | | | | | | | | | | | | | | | | | | |
| | | | | | | | | | | | | | | | | | | | | | | | | | | | | | | | | | |
| $ | - | | | $ | 10.72 | | | | 30.41 | % | | $ | 83,330 | | | | 1.34 | % | | | 1.34 | %(b) | | | (0.20 | )% | | | (0.20 | )% | | | 35.22 | % |
| | - | | | | 8.22 | | | | 2.11 | % | | | 61,081 | | | | 1.34 | % | | | 1.34 | %(b) | | | (0.40 | )% | | | (0.40 | )% | | | 44.84 | % |
| | (0.04 | ) | | | 8.05 | | | | 3.91 | % | | | 77,269 | | | | 1.37 | % | | | 1.37 | % | | | (0.58 | )% | | | (0.58 | )% | | | 68.32 | % |
| | - | | | | 7.79 | | | | (0.89 | )% | | | 119,250 | | | | 1.38 | % | | | 1.38 | % | | | (0.09 | )% | | | (0.09 | )% | | | 89.87 | % |
| | - | | | | 7.86 | | | | (28.68 | )% | | | 178,450 | | | | 1.24 | % | | | 1.24 | % | | | (0.41 | )% | | | (0.41 | )% | | | 171.22 | % |
| | | | | | | | | | | | | | | | | | | | | | | | | | | | | | | | | | |
| | - | | | | 10.49 | | | | 29.03 | % | | | 294 | | | | 4.46 | % | | | 2.50 | %(b) | | | (3.22 | )% | | | (1.26 | )% | | | 35.22 | % |
| | - | | | | 8.13 | | | | 0.99 | % | | | 1 | | | | 115.00 | % | | | 2.51 | %(b) | | | (113.96 | )% | | | (1.47 | )% | | | 44.84 | % |
| | | | | | | | | | | | | | | | | | | | | | | | | | | | | | | | | | |
| | - | | | | 10.65 | | | | 29.88 | % | | | 1,400 | | | | 2.87 | % | | | 1.75 | %(b) | | | (1.71 | )% | | | (0.59 | )% | | | 35.22 | % |
| | - | | | | 8.20 | | | | 1.86 | % | | | 1 | | | | 215.56 | % | | | 1.75 | %(b) | | | (214.36 | )% | | | (0.55 | )% | | | 44.84 | % |
| | | | | | | | | | | | | | | | | | | | | | | | | | | | | | | | | | |
| | | | | | | | | | | | | | | | | | | | | | | | | | | | | | | | | | |
| | (0.10 | ) | | | 11.12 | | | | 24.85 | % | | | 41,627 | | | | 1.39 | % | | | 1.39 | %(b) | | | 1.00 | % | | | 1.00 | % | | | 40.89 | % |
| | (0.06 | ) | | | 9.00 | | | | (10.07 | )% | | | 59,068 | | | | 1.33 | % | | | 1.33 | %(b) | | | 0.73 | % | | | 0.73 | % | | | 62.97 | % |
| | (0.10 | ) | | | 10.06 | | | | 13.92 | % | | | 87,856 | | | | 1.38 | % | | | 1.38 | % | | | 0.54 | % | | | 0.54 | % | | | 70.80 | % |
| | (0.08 | ) | | | 8.93 | | | | (7.87 | )% | | | 95,028 | | | | 1.40 | % | | | 1.40 | % | | | 1.50 | % | | | 1.50 | % | | | 134.88 | % |
| | (2.43 | ) | | | 9.81 | | | | (23.79 | )% | | | 118,522 | | | | 1.26 | % | | | 1.26 | % | | | 0.60 | % | | | 0.60 | % | | | 111.26 | % |
| | | | | | | | | | | | | | | | | | | | | | | | | | | | | | | | | | |
| | (0.06 | ) | | | 10.94 | | | | 23.36 | % | | | 195 | | | | 4.29 | % | | | 2.51 | %(b) | | | (1.82 | )% | | | (0.04 | )% | | | 40.89 | % |
| | (0.06 | ) | | | 8.92 | | | | (10.87 | )% | | | 120 | | | | 4.11 | % | | | 2.50 | %(b) | | | (1.91 | )% | | | (0.30 | )% | | | 62.97 | % |
| | | | | | | | | | | | | | | | | | | | | | | | | | | | | | | | | | |
| | (0.08 | ) | | | 11.07 | | | | 24.44 | % | | | 539 | | | | 2.12 | % | | | 1.76 | %(b) | | | 0.34 | % | | | 0.70 | % | | | 40.89 | % |
| | (0.06 | ) | | | 8.97 | | | | (10.37 | )% | | | 487 | | | | 2.26 | % | | | 1.74 | %(b) | | | (0.07 | )% | | | 0.45 | % | | | 62.97 | % |
| | | | | | | | | | | | | | | | | | | | | | | | | | | | | | | | | | |
| | | | | | | | | | | | | | | | | | | | | | | | | | | | | | | | | | |
| | (0.23 | ) | | | 6.81 | | | | 12.01 | % | | | 23,524 | | | | 1.53 | % | | | 1.51 | %(b) | | | 3.00 | % | | | 3.02 | % | | | 50.92 | % |
| | (0.41 | ) | | | 6.29 | | | | 9.16 | % | | | 21,313 | | | | 1.61 | % | | | 1.51 | %(b) | | | 3.75 | % | | | 3.85 | % | | | 114.73 | % |
| | (0.14 | ) | | | 6.15 | | | | 11.16 | % | | | 32,036 | | | | 1.67 | % | | | 1.67 | % | | | 3.28 | % | | | 3.28 | % | | | 84.45 | % |
| | (0.38 | ) | | | 5.66 | | | | (4.39 | )% | | | 22,547 | | | | 1.70 | % | | | 1.70 | % | | | 2.70 | % | | | 2.70 | % | | | 90.27 | % |
| | (0.97 | ) | | | 6.34 | | | | (23.01 | )% | | | 30,335 | | | | 1.35 | % | | | 1.35 | % | | | 1.74 | % | | | 1.74 | % | | | 102.65 | % |
| | | | | | | | | | | | | | | | | | | | | | | | | | | | | | | | | | |
| | (0.20 | ) | | | 6.72 | | | | 11.53 | % | | | 3,256 | | | | 2.47 | % | | | 2.47 | %(b) | | | 2.17 | % | | | 2.17 | % | | | 50.92 | % |
| | (0.41 | ) | | | 6.21 | | | | 7.77 | % | | | 24 | | | | 122.08 | % | | | 2.50 | %(b) | | | (115.58 | )% | | | 4.00 | % | | | 114.73 | % |
| | | | | | | | | | | | | | | | | | | | | | | | | | | | | | | | | | |
| | (0.24 | ) | | | 6.73 | | | | 11.81 | % | | | 7,113 | | | | 1.70 | % | | | 1.70 | %(b) | | | 3.03 | % | | | 3.03 | % | | | 50.92 | % |
| | (0.42 | ) | | | 6.24 | | | | 8.56 | % | | | 449 | | | | 185.34 | % | | | 1.75 | %(b) | | | (178.27 | )% | | | 5.32 | % | | | 114.73 | % |
NOTESTO FINANCIAL STATEMENTS
SEPTEMBER 30, 2012
1. Organization
The ICON Consumer Discretionary Fund, ICON Consumer Staples Fund, ICON Energy Fund, ICON Financial Fund, ICON Healthcare Fund, ICON Industrials Fund, ICON Information Technology Fund, ICON Materials Fund, and ICON Utilities Fund (formerly, ICON Telecommunications & Utilities Fund) are series funds (individually a “Fund” and collectively, the “Funds”). The Funds are part of the ICON Funds (the “Trust”), a Massachusetts business trust registered under the Investment Company Act of 1940, as amended (the “1940 Act”) as an open-end non-diversified investment management company. Each Fund has three classes of shares: Class S, Class C and Class A. All classes have equal rights as to earnings, assets, and voting privileges except that each Class may bear different distribution fees, registration costs, legal costs, mailing and printing costs and shareholder servicing costs and each Class has exclusive voting rights with respect to its distribution plan. There are currently nine other active Funds within the Trust. Those Funds are covered by separate prospectuses and shareholder reports.
Each Fund is authorized to issue an unlimited number of no par shares. The Funds invest primarily in securities of companies whose principal business activities fall within specific sectors and industries. The investment objective of each Fund is to provide long-term capital appreciation.
The Funds may have elements of risk, including the risk of loss of principal. There is no assurance that the investment process will consistently lead to successful results. An investment in a non-diversified sector fund may involve greater risk and volatility than a more diversified fund. Investments in foreign securities and currency transactions may involve certain considerations and risks not typically associated with those of U.S. dollar-denominated transactions as a result of, among other factors, the possibility of lower government supervision and regulation of foreign securities markets and the possibility of political or economic instability. Financial statements of foreign companies are governed by different accounting, auditing, and financial standards than U.S. companies and may be less transparent and uniform than in the United States. Many corporate governance standards, which help ensure the integrity of public information in the United States, may not exist in some foreign countries. In general, there may be less governmental supervision of foreign stock exchanges and securities brokers and issuers. There are also risks associated with small-and mid-cap investing, including limited product lines, less liquidity and small market share.
| | |
| 84 | | NOTESTO FINANCIAL STATEMENTS |
The ICON Energy Fund has a significant weighting in the Integrated Oil & Gas industry, the ICON Healthcare Fund has a significant weighting in the Pharmaceuticals industry and the Biotechnology industry, and the ICON Utilities Fund has a significant weighting in the Multi-Utilities industry and the Electric Utilities industry which may cause the Funds’ performance to be susceptible to the economic, business and/or other developments that may affect those industries.
In the normal course of business, the Funds may enter into various agreements that provide for general indemnifications. Each Fund’s maximum exposure under these arrangements is unknown as any potential exposure involving future claims that may be made against each Fund is unknown. However, based on experience, the Funds expect the risk of loss to be minimal.
2. Significant Accounting Policies
The following is a summary of significant accounting policies consistently followed by the Funds in the preparation of their financial statements. The preparation of financial statements in conformity with accounting principles generally accepted in the United States of America requires management to make certain estimates and assumptions that affect the reported amounts of assets and liabilities, disclosure of contingent assets and liabilities at the date of the financial statements, and the reported amounts of income and expenses during the reporting period. Actual results may differ from these estimates.
Investment Valuation
The Funds’ securities and other assets, excluding options on securities indexes, are valued as of the closing price at the close of regular trading on the New York Stock Exchange (the “NYSE”) (normally 4 p.m. Eastern Standard Time) each day the NYSE is open, except that securities traded primarily on the NASDAQ Stock Market (“NASDAQ”) are normally valued by the Funds at the NASDAQ Official Closing Price provided by NASDAQ each business day. Options on securities indexes are valued at the close of the Chicago Board Options Exchange (normally 4:15 p.m. Eastern Standard Time) on each day the New York Stock Exchange is open for trading.
The Funds use pricing services to obtain the market value of securities in their portfolios; if a pricing service is not able to provide a price, or the pricing service’s valuation quote is considered inaccurate or does not reflect
| | | | |
| NOTESTO FINANCIAL STATEMENTS | | | 85 | |
NOTESTO FINANCIAL STATEMENTS (CONTINUED)
the market value of the security, prices may be obtained through market quotations from independent broker/dealers. If market quotations from these sources are not readily available, the Funds’ securities or other assets are valued at fair value as determined in good faith by the Funds’ Board of Trustees (“Board”) or pursuant to procedures approved by the Board.
Lacking any sales that day, a security is valued at the current closing bid price (or yield equivalent thereof) or based on quotes obtained from dealers making a market for the security. Options are valued at their closing mid-price on the market with the most volume. Mid-price is the average of the closing bid and closing ask prices. Debt securities with a remaining maturity of greater than 60 days are valued in accordance with the evaluated bid price supplied by the pricing service. The evaluated bid price supplied by the pricing service is based upon a matrix valuation system which considers such factors as security prices, yields, maturities and ratings. Short-term debt securities with remaining maturities of 60 days or less are generally valued at amortized cost or original cost plus accrued interest, which approximates market value. Currency rates as of the close of the NYSE are used to convert foreign security values into U.S. dollars.
The Funds’ securities traded in countries outside of the Western Hemisphere are fair valued daily by utilizing the quotations of an independent pricing service, unless the Board determines that use of another valuation methodology is appropriate. The purposes of daily fair valuation are to avoid stale prices and to take into account, among other things, any significant events occurring after the close of foreign markets. The pricing service uses statistical analyses and quantitative models to adjust local market prices using factors such as subsequent movements and changes in the prices of indexes, securities and exchange rates in other markets to determine fair value as of the time a Fund calculates its net asset value (“NAV”). The valuation assigned to fair-value securities for purposes of calculating a Fund’s NAV may differ from the security’s most recent closing market price and from the prices used by other mutual funds to calculate their NAVs.
Investments in other open-end investment companies are valued at net asset value.
Various inputs are used to determine the value of the Funds’ investments. These inputs are summarized in the three broad levels listed below:
Level 1 — quoted prices in active markets for identical securities.
| | |
| 86 | | NOTESTO FINANCIAL STATEMENTS |
Level 2 — significant observable inputs other than Level 1 quoted prices (including, but not limited to, quoted prices for similar securities, interest rates, prepayment speeds, and credit risk).
Level 3 — significant unobservable inputs.
Observable inputs are those based on market data obtained from sources independent of the Funds, and unobservable inputs reflect the Funds’ own assumptions based on the best information available. The input levels are not necessarily an indication of the risk or liquidity associated with investments at that level. For example, non-U.S. equity securities actively traded in foreign markets generally are reflected in Level 2 despite the availability of closing prices, because the Funds evaluate and determine whether those closing prices reflect fair value at the close of the NYSE or require adjustment, as described above. The following table summarizes the Funds’ investments, based on the inputs used to determine their values on September 30, 2012:
| | | | | | | | | | | | |
| | | Level 1 | | | Level 2 | | | Total | |
ICON Consumer Discretionary Fund* | | | | | | | | | | | | |
Assets | | | | | | | | | | | | |
Common Stocks | | $ | 59,527,606 | | | $ | - | | | $ | 59,527,606 | |
| | | | | | | | | | | | |
Total | | $ | 59,527,606 | | | $ | - | | | $ | 59,527,606 | |
| | | | | | | | | | | | |
ICON Consumer Staples Fund* | | | | | | | | | | | | |
Assets | | | | | | | | | | | | |
Common Stocks | | $ | 39,733,811 | | | $ | - | | | $ | 39,733,811 | |
| | | | | | | | | | | | |
Total | | $ | 39,733,811 | | | $ | - | | | $ | 39,733,811 | |
| | | | | | | | | | | | |
ICON Energy Fund* | | | | | | | | | | | | |
Assets | | | | | | | | | | | | |
Common Stocks | | $ | 585,808,714 | | | $ | - | | | $ | 585,808,714 | |
Collateral for Securities on Loan | | | - | | | | 7,793,958 | | | | 7,793,958 | |
| | | | | | | | | | | | |
Total | | $ | 585,808,714 | | | $ | 7,793,958 | | | $ | 593,602,672 | |
| | | | | | | | | | | | |
ICON Financial Fund* | | | | | | | | | | | | |
Assets | | | | | | | | | | | | |
Common Stocks | | $ | 36,522,953 | | | $ | - | | | $ | 36,522,953 | |
| | | | | | | | | | | | |
Total | | $ | 36,522,953 | | | $ | - | | | $ | 36,522,953 | |
| | | | | | | | | | | | |
ICON Healthcare Fund* | | | | | | | | | | | | |
Assets | | | | | | | | | | | | |
Common Stocks | | $ | 101,413,511 | | | $ | - | | | $ | 101,413,511 | |
Collateral for Securities on Loan | | | - | | | | 1,993,044 | | | | 1,993,044 | |
| | | | | | | | | | | | |
Total | | $ | 101,413,511 | | | $ | 1,993,044 | | | $ | 103,406,555 | |
| | | | | | | | | | | | |
| | | | |
| NOTESTO FINANCIAL STATEMENTS | | | 87 | |
NOTESTO FINANCIAL STATEMENTS (CONTINUED)
| | | | | | | | | | | | |
| | | Level 1 | | | Level 2 | | | Total | |
ICON Industrials Fund* | | | | | | | | | | | | |
Assets | | | | | | | | | | | | |
Common Stocks | | $ | 39,741,360 | | | $ | - | | | $ | 39,741,360 | |
Collateral for Securities on Loan | | | - | | | | 916,750 | | | | 916,750 | |
Short-Term Investment | | | - | | | | 66,885 | | | | 66,885 | |
| | | | | | | | | | | | |
Total | | $ | 39,741,360 | | | $ | 983,635 | | | $ | 40,724,995 | |
| | | | | | | | | | | | |
ICON Information Technology Fund* | | | | | | | | | | | | |
Assets | | | | | | | | | | | | |
Common Stocks | | $ | 84,661,074 | | | $ | - | | | $ | 84,661,074 | |
Collateral for Securities on Loan | | | - | | | | 2,154,166 | | | | 2,154,166 | |
Short-Term Investment | | | - | | | | 470,159 | | | | 470,159 | |
| | | | | | | | | | | | |
Total | | $ | 84,661,074 | | | $ | 2,624,325 | | | $ | 87,285,399 | |
| | | | | | | | | | | | |
ICON Materials Fund* | | | | | | | | | | | | |
Assets | | | | | | | | | | | | |
Common Stocks | | $ | 42,031,980 | | | $ | - | | | $ | 42,031,980 | |
Collateral for Securities on Loan | | | - | | | | 367,536 | | | | 367,536 | |
Short-Term Investment | | | - | | | | 139,943 | | | | 139,943 | |
| | | | | | | | | | | | |
Total | | $ | 42,031,980 | | | $ | 507,479 | | | $ | 42,539,459 | |
| | | | | | | | | | | | |
ICON Utilities Fund* | | | | | | | | | | | | |
Assets | | | | | | | | | | | | |
Common Stocks | | $ | 33,742,366 | | | $ | - | | | $ | 33,742,366 | |
| | | | | | | | | | | | |
Total | | $ | 33,742,366 | | | $ | - | | | $ | 33,742,366 | |
| | | | | | | | | | | | |
* Please refer to the Schedule of Investments and the Sector/Industry Classification tables for additional security details.
There were no Level 3 securities held in any of the Funds at September 30, 2012.
For the year ended September 30, 2012, there was no transfer activity between Level 1 and Level 2. The end of period timing recognition is used for the transfers between levels of the Fund’s assets and liabilities.
Foreign Currency Translation
The accounting records of the Funds are maintained in U.S. dollars. Investment securities and other assets and liabilities denominated in a foreign currency are translated daily into U.S. dollars at the prevailing rates of exchange. Income and expenses are translated into U.S. dollars at the prevailing exchange rate on the respective dates of the transactions.
| | |
| 88 | | NOTESTO FINANCIAL STATEMENTS |
Purchases and sales of securities are translated into U.S. dollars at the contractual currency exchange rates established at the time of each trade.
The Funds do not isolate that portion of the results of operations resulting from changes in foreign exchange rates on investments from the fluctuations arising from changes in market prices of securities held. Net unrealized appreciation or depreciation on investments and foreign currency translations arise from changes in the value of assets and liabilities, resulting from changes in the exchange rates and changes in market prices of securities held.
Securities Lending
Under procedures adopted by the Board, the Funds may lend securities to non-affiliated qualified parties. The Funds seek to earn additional income through securities lending. There is the risk of delay in recovering a loaned security. The Funds do not have the right to vote on securities while they are on loan; however, the Funds may attempt to call back the loan and vote the proxy.
All loans will be continuously secured by collateral which consists of cash. The cash collateral is invested in the State Street Navigator Prime Portfolio and is disclosed on the Schedule of Investments. The lending fees received and the Funds’ portion of the interest income earned on cash collateral are included on the Statement of Operations, if applicable.
As of September 30, 2012, the following Funds had securities with the following values on loan:
| | | | | | | | |
| Fund | | Value of
Loaned Securities | | | Value of
Collateral | |
ICON Energy Fund | | $ | 7,387,829 | | | $ | 7,793,958 | |
ICON Healthcare Fund | | | 1,971,699 | | | | 1,993,044 | |
ICON Industrials Fund | | | 897,940 | | | | 916,750 | |
ICON Information Technology Fund | | | 2,108,756 | | | | 2,154,166 | |
ICON Material Fund | | | 342,401 | | | | 367,536 | |
The value of the collateral above could include collateral held for securities that were sold on or before September 30, 2012. It may also include collateral received from the pre-funding of loans.
| | | | |
| NOTESTO FINANCIAL STATEMENTS | | | 89 | |
NOTESTO FINANCIAL STATEMENTS (CONTINUED)
Income Taxes
The Funds intend to qualify as regulated investment companies under Subchapter M of the Internal Revenue Code and, accordingly, the Funds will generally not be subject to federal and state income taxes or federal excise taxes to the extent that they intend to make sufficient distributions of net investment income and net realized capital gains.
Dividends paid by the Funds from net investment income and distributions of net realized short-term gains are, for federal income tax purposes, taxable as ordinary income to shareholders.
Dividends and distributions to shareholders are recorded by the Funds on the ex-dividend/distribution date. The Funds distribute income and net realized capital gains, if any, to shareholders at least annually, if not offset by capital loss carryforward. The Funds may utilize equalization accounting for tax purposes and designate earnings and profits, including net realized gains distributed to shareholders on redemption of shares, as part of the dividends paid deduction for income tax purposes. Income distributions and capital gain distributions are determined in accordance with income tax regulations, which may differ from accounting principles generally accepted in the United States of America.
Management has analyzed the Funds’ tax positions taken on federal income tax returns for all open tax periods and has concluded that no provision for federal income tax is required in the Funds’ financial statements.
The Funds file U.S. tax returns. While the statute of limitations remains open to examine the Funds’ U.S. tax returns filed for the past four years, no examinations are in progress or anticipated at this time. The Funds are not aware of any tax positions for which it is reasonably possible that the total amounts of unrecognized tax benefits will significantly change in the next twelve months.
Investment Income
Dividend income is recorded on the ex-dividend date. Non-cash dividends included in dividend income, if any, are recorded at the fair value of the securities received. Interest income is accrued as earned. Certain dividends from foreign securities are recorded as soon as the Funds are informed of the dividend if such information is obtained subsequent to the ex-dividend date. Discounts and premiums on securities purchased are amortized over the life of the respective securities.
| | |
| 90 | | NOTESTO FINANCIAL STATEMENTS |
Investment Transactions
Security transactions are accounted for no later than one business day after the trade date. However, for financial reporting purposes, security transactions are accounted for on the trade date. Gains and losses on securities sold are determined on the basis of identified cost.
Allocation of Expenses
Each class of a Fund’s shares bears expenses incurred specifically on its behalf and, in addition, each class bears a portion of general expenses, based upon relative net assets of each class. Expenses which cannot be directly attributed to a specific Fund in the Trust are apportioned between all Funds in the Trust based upon relative net assets. In calculating the net asset value per share of each class, investment income, realized and unrealized gains and losses and expenses other than class-specific expenses are allocated daily to each class of shares based upon the proportion of net assets.
Below are the class level expenses that are included on the Statement of Operations:
| | | | | | | | | | | | |
| Fund | | Legal
Expense | | | Printing
and Postage
Expense | | | Transfer
Agent
Expense | |
ICON Consumer Discretionary Fund | | | | | | | | | | | | |
Class S | | $ | 5,708 | | | $ | 16,299 | | | $ | 54,821 | |
Class C | | | 8 | | | | 175 | | | | 1,485 | |
Class A | | | 828 | | | | 3,824 | | | | 12,760 | |
ICON Consumer Staples Fund | | | | | | | | | | | | |
Class S | | | 3,296 | | | | 10,068 | | | | 33,497 | |
Class C | | | 38 | | | | 208 | | | | 1,750 | |
Class A | | | 216 | | | | 1,059 | | | | 3,605 | |
ICON Energy Fund | | | | | | | | | | | | |
Class S | | | 66,745 | | | | 113,559 | | | | 497,818 | |
Class C | | | 717 | | | | 1,865 | | | | 8,480 | |
Class A | | | 1,006 | | | | 2,348 | | | | 12,948 | |
ICON Financial Fund | | | | | | | | | | | | |
Class S | | | 5,310 | | | | 12,189 | | | | 46,100 | |
Class C | | | 1 | | | | 156 | | | | 1,524 | |
Class A | | | 303 | | | | 429 | | | | 6,076 | |
ICON Healthcare Fund | | | | | | | | | | | | |
Class S | | | 10,092 | | | | 26,431 | | | | 110,135 | |
Class C | | | 4 | | | | 167 | | | | 1,527 | |
Class A | | | 24 | | | | 404 | | | | 1,689 | |
| | | | |
| NOTESTO FINANCIAL STATEMENTS | | | 91 | |
NOTESTO FINANCIAL STATEMENTS (CONTINUED)
| | | | | | | | | | | | |
| Fund | | Legal
Expense | | | Printing
and Postage
Expense | | | Transfer
Agent
Expense | |
ICON Industrials Fund | | | | | | | | | | | | |
Class S | | $ | 5,742 | | | $ | 13,163 | | | $ | 53,154 | |
Class C | | | 2 | | | | 159 | | | | 1,424 | |
Class A | | | 61 | | | | 554 | | | | 1,881 | |
ICON Information Technology Fund | | | | | | | | | | | | |
Class S | | | 8,075 | | | | 18,697 | | | | 78,665 | |
Class C | | | 8 | | | | 292 | | | | 1,797 | |
Class A | | | 17 | | | | 508 | | | | 1,604 | |
ICON Materials Fund | | | | | | | | | | | | |
Class S | | | 7,326 | | | | 18,278 | | | | 68,155 | |
Class C | | | 22 | | | | 246 | | | | 1,681 | |
Class A | | | 71 | | | | 726 | | | | 1,727 | |
ICON Utilities Fund | | | | | | | | | | | | |
Class S | | | 3,126 | | | | 8,676 | | | | 31,889 | |
Class C | | | 325 | | | | 473 | | | | 3,182 | |
Class A | | | 721 | | | | 983 | | | | 5,981 | |
3. Fees and Other Transactions with Affiliates
Investment Advisory Fees
ICON Advisers, Inc. (“ICON Advisers”) serves as investment adviser to the Funds and is responsible for managing the Funds’ portfolios of securities. ICON Advisers receives a monthly management fee that is computed daily at an annual rate of 1.00% on the first $500 million of average daily net assets, 0.95% on the next $250 million, 0.925% on the next $750 million, 0.90% on the next $3.5 billion, and 0.875% on average daily net assets over $5 billion.
Effective January 1, 2011, ICON Advisers has contractually agreed to limit its Funds’ expenses (exclusive of brokerage, interest, taxes, dividends on short sales and extraordinary expenses) to the extent necessary to ensure that the Funds’ operating expenses do not exceed the following amounts:
| | | | | | | | | | | | |
| Fund | | Class S | | | Class C | | | Class A | |
ICON Consumer Discretionary Fund | | | 1.74% | | | | 2.74% | | | | 1.99% | |
ICON Consumer Staples Fund | | | 1.50% | | | | 2.50% | | | | 1.75% | |
ICON Energy Fund | | | 1.50% | | | | 2.50% | | | | 1.75% | |
ICON Financial Fund | | | 1.50% | | | | 2.50% | | | | 1.75% | |
ICON Healthcare Fund | | | 1.50% | | | | 2.50% | | | | 1.75% | |
ICON Industrials Fund | | | 1.50% | | | | 2.50% | | | | 1.75% | |
ICON Information Technology Fund | | | 1.50% | | | | 2.50% | | | | 1.75% | |
ICON Materials Fund | | | 1.50% | | | | 2.50% | | | | 1.75% | |
ICON Utilities Fund | | | 1.50% | | | | 2.50% | | | | 1.75% | |
| | |
| 92 | | NOTESTO FINANCIAL STATEMENTS |
The Funds’ expense limitations will continue in effect until at least January 31, 2013. To the extent ICON Advisers reimburses or absorbs fees and expenses, it may seek payment of such amounts for up to three years after the expenses were reimbursed or absorbed. A Fund will make no such payment, however, if the total Fund operating expenses exceed the expense limits in effect at the time the expenses were reimbursed or at the time these payments are proposed.
As of September 30, 2012 the following amounts were still available for recoupment by ICON Advisers based upon their potential expiration dates:
| | | | | | | | |
| Fund | | 2014 | | | 2015 | |
ICON Consumer Discretionary Fund | | $ | 872 | | | $ | 1,981 | |
ICON Consumer Staples Fund | | | 10,946 | | | | 16,961 | |
ICON Financial Fund | | | 1,033 | | | | 2,989 | |
ICON Healthcare Fund | | | 3,351 | | | | 6,336 | |
ICON Industrials Fund | | | 1,381 | | | | 5,079 | |
ICON Information Technology Fund | | | 2,037 | | | | 4,544 | |
ICON Materials Fund | | | 3,407 | | | | 5,628 | |
ICON Utilities Fund | | | 15,186 | | | | 5,758 | |
Accounting, Custody and Transfer Agent Fees
State Street Bank and Trust Company (“State Street”) serves as the Fund accounting agent for the funds. For its services, the Trust pays State Street a fee that is calculated daily and paid monthly at an annual rate based on the aggregate average daily net assets of the Trust.
State Street is the custodian of the Trust’s investments. For its services, the Trust pays State Street asset-based fees that vary according to the number of positions and transactions, plus out-of-pocket expenses.
Boston Financial Data Services, Inc. (“BFDS”) is the Trust’s transfer agent. For these services, the Trust pays a per account fee, plus certain other transaction cusip charges and out-of-pocket expenses. BFDS may pay each Fund transfer agent earnings credits. Transfer agent earnings credits are credits received for interest which results from overnight balances used by BFDS for clearing shareholder transactions.
Administrative Services
The Trust has entered into an administrative services agreement with ICON Advisers pursuant to which ICON Advisers oversees the administration of the
| | | | |
| NOTESTO FINANCIAL STATEMENTS | | | 93 | |
NOTESTO FINANCIAL STATEMENTS (CONTINUED)
Trust’s business and affairs. This agreement provides for an annual fee of 0.05% on the Trusts’ first $1.5 billion of average daily net assets, 0.045% on the next $1.5 billion of average daily net assets, 0.040% on the next $2 billion of average daily net assets and 0.030% on average daily net assets over $5 billion. For the year ended September 30, 2012, each Fund’s payment for administrative services to ICON Advisers is included on the Statement of Operations. The administrative services agreement provides that ICON Advisers will not be liable for any error of judgment, mistake of law, or any loss suffered by the Trust in connection with matters to which the administrative services agreement relates, except for a loss resulting from willful misfeasance, bad faith or negligence by ICON Advisers in the performance of its duties.
ICON Advisers has a sub-administration agreement with State Street to which State Street assists ICON Advisers with the administration and business affairs of the Trust. For its services, ICON Advisers pays State Street a fee that is calculated daily and paid monthly at an annual rate based on the aggregate average daily net assets of the Trust.
Distribution Fees
The Funds have adopted a Distribution Plan pursuant to Rule 12b-1 under the 1940 Act (“12b-1 Plan”) under which the Funds are authorized to compensate the Funds’ distributor, ICON Distributors, Inc. (“IDI”) (an affiliate of the adviser) for the sale and distribution of shares. Under the 12b-1 Plan, Class A shareholders pay an annual distribution and service fee of 0.25% of average daily net assets. The Class C shareholders pay an annual distribution and service fee of 1.00% of average daily net assets. The total amount paid under the 12b-1 plans, if any, by the Funds is shown on the Statement of Operations.
Other Related Parties
Certain Officers and Directors of ICON Advisers are also Officers and Trustees of the Funds; however, such Officers and Trustees (with the exception of the Chief Compliance Officer, “CCO”) receive no compensation from the Funds. The CCO’s salary is paid 86% by the Trust and 14% by ICON Advisers. For the year ended September 30, 2012, the total related amounts paid by the Funds under this arrangement are included in Other Expenses on the Statement of Operations.
| | |
| 94 | | NOTESTO FINANCIAL STATEMENTS |
4. Borrowings
The Trust has entered into Lines of Credit agreements with State Street to provide temporary funding for redemption requests. The maximum borrowing is limited to $150 million. Interest on domestic borrowings is charged at the higher of the Federal Funds Rate effective on that day and the Overnight LIBOR Rate effective on that day plus 1.25%. The average interest rate charged for the year ended September 30, 2012 was 1.40%.
| | | | |
| Fund | | Average Borrowing
(10/1/11-9/30/12) | |
ICON Consumer Discretionary Fund* | | $ | 271,012 | |
ICON Consumer Staples Fund* | | | 183,582 | |
ICON Energy Fund* | | | 264,099 | |
ICON Financial Fund* | | | 260,984 | |
ICON Healthcare Fund* | | | 440,901 | |
ICON Industrials Fund | | | 337,066 | |
ICON Information Technology Fund | | | 116,064 | |
ICON Materials Fund | | | 258,171 | |
ICON Utilities Fund* | | | 142,337 | |
| * | Fund had outstanding borrowings under these agreements as of September 30, 2012. |
5. Purchases and Sales of Investment Securities
For the year ended September 30, 2012, the aggregate cost of purchases and proceeds from sales of investment securities (excluding short-term securities) was as follows:
| | | | | | | | |
| Fund | | Purchases of
Securities | | | Proceeds
From Sales of
Securities | |
ICON Consumer Discretionary Fund | | $ | 59,904,347 | | | $ | 46,612,756 | |
ICON Consumer Staples Fund | | | 36,049,446 | | | | 21,654,808 | |
ICON Energy Fund | | | 450,809,029 | | | | 522,571,239 | |
ICON Financial Fund | | | 43,827,530 | | | | 49,654,572 | |
ICON Healthcare Fund | | | 46,749,927 | | | | 42,600,920 | |
ICON Industrials Fund | | | 15,555,217 | | | | 37,270,261 | |
ICON Information Technology Fund | | | 31,042,033 | | | | 25,160,609 | |
ICON Materials Fund | | | 23,056,877 | | | | 53,083,617 | |
ICON Utilities Fund | | | 26,571,390 | | | | 15,619,168 | |
| | | | |
| NOTESTO FINANCIAL STATEMENTS | | | 95 | |
NOTESTO FINANCIAL STATEMENTS (CONTINUED)
6. Federal Income Tax
Income and capital gain distributions are determined in accordance with income tax regulations that may differ from accounting principles that are generally accepted in the United States of America. These differences are due to differing treatments for items such as net short-term gains, deferrals of wash sale losses, foreign currency transactions, net investment losses, and capital loss carryforwards.
For the year ended September 30, 2012 the following Funds had capital loss carryforwards:
| | | | | | | | |
| Fund | | Amounts | | | Expires | |
ICON Consumer Discretionary Fund | | $ | 8,953,482 | | | | 2016 | |
| | | 8,355,189 | | | | 2017 | |
ICON Consumer Staples Fund | | | 297,581 | | | | 2017 | |
| | | 1,888,341 | | | | 2018 | |
ICON Financial Fund | | | 57,731,649 | | | | 2017 | |
| | | 43,715,782 | | | | 2018 | |
ICON Healthcare Fund | | | 862,678 | | | | 2018 | |
ICON Industrials Fund | | | 7,176,499 | | | | 2016 | |
| | | 28,045,106 | | | | 2017 | |
ICON Information Technology Fund | | | 21,893,678 | | | | 2017 | |
| | | 6,573,259 | | | | 2018 | |
ICON Materials Fund | | | 10,556,794 | | | | 2017 | |
| | | 7,349,690 | | | | 2018 | |
ICON Utilities Fund | | | 5,659,273 | | | | 2017 | |
| | | 3,844,832 | | | | 2018 | |
Future capital loss carryforward utilization in any given year may be limited if there are substantial shareholder redemptions or contributions. During the year ended September 30, 2012 the Funds utilized capital loss carryforwards:
| | | | |
| Fund | | Amount | |
ICON Consumer Discretionary Fund | | $ | 2,354,630 | |
ICON Consumer Staples Fund | | | 1,466,617 | |
ICON Energy Fund | | | 633,236 | |
ICON Financial Fund | | | 963,999 | |
ICON Healthcare Fund | | | 3,695,317 | |
ICON Industrials Fund | | | 4,441,797 | |
ICON Information Technology Fund | | | 924,174 | |
ICON Materials Fund | | | 2,225,845 | |
ICON Utilities Fund | | | 368,404 | |
| | |
| 96 | | NOTESTO FINANCIAL STATEMENTS |
The Regulated Investment Company Modernization Act of 2010 (the “Act”) was signed into law on December 22, 2010. The Act makes changes to a number of tax rules impacting the Funds. Under the Act, future capital losses generated by a fund may be carried over indefinitely, but these losses must be used prior to the utilization of any pre-enactment capital losses. Since pre-enactment capital losses may only be carried forward for eight years, there may be a greater likelihood that all or a portion of each fund’s pre-enactment capital losses will expire unused.
The tax characteristics of distributions paid to shareholders during the fiscal year ended September 30, 2012, were as follows:
| | | | | | | | | | | | |
| | | Distributions Paid from | | | Total
Distributions
Paid | |
| Fund | | Ordinary
Income | | | Realized
Gain/Loss | | |
ICON Consumer Staples Fund | | $ | 649,734 | | | $ | - | | | $ | 649,734 | |
ICON Energy Fund | | | 4,969,470 | | | | 13,290,487 | | | | 18,259,957 | |
ICON Financial Fund | | | 210,698 | | | | - | | | | 210,698 | |
ICON Healthcare Fund | | | 663,361 | | | | - | | | | 663,361 | |
ICON Industrials Fund | | | 535,593 | | | | - | | | | 535,593 | |
ICON Materials Fund | | | 651,003 | | | | - | | | | 651,003 | |
ICON Utilities Fund | | | 1,055,447 | | | | - | | | | 1,055,447 | |
The tax characteristics of distributions paid to shareholders during the fiscal year ended September 30, 2011, were as follows:
| | | | | | | | |
| Fund | | Distributions
Paid from
Ordinary Income | | | Total
Distributions
Paid | |
ICON Consumer Staples Fund | | $ | 315,201 | | | $ | 315,201 | |
ICON Energy Fund | | | 6,516,740 | | | | 6,516,740 | |
ICON Financial Fund | | | 214,079 | | | | 214,079 | |
ICON Healthcare Fund | | | 368,446 | | | | 368,446 | |
ICON Industrials Fund | | | 478,554 | | | | 478,554 | |
ICON Materials Fund | | | 478,186 | | | | 478,186 | |
ICON Utilities Fund | | | 1,194,876 | | | | 1,194,876 | |
As of September 30, 2012, the components of accumulated earnings/(deficit) on a tax basis were as follows:
| | | | | | | | | | | | | | | | | | | | |
| Fund | | Undistributed
Ordinary
Income | | | Late Year
Loss
Deferral** | | | Capital Loss
Carryover | | | Unrealized
Appreciation/
(Depreciation)* | | | Total
Accumulated
Earnings/
(Deficit) | |
ICON Consumer Discretionary Fund | | $ | 107,080 | | | $ | (659,061 | ) | | $ | (17,308,671 | ) | | $ | 10,507,350 | | | $ | (7,353,302 | ) |
ICON Consumer Staples Fund | | | 7,872 | | | | - | | | | (2,185,922 | ) | | | 3,280,891 | | | | 1,102,841 | |
| | | | |
| NOTESTO FINANCIAL STATEMENTS | | | 97 | |
NOTESTO FINANCIAL STATEMENTS (CONTINUED)
| | | | | | | | | | | | | | | | | | | | |
| Fund | | Undistributed
Ordinary
Income | | | Late Year
Loss
Deferral** | | | Capital Loss
Carryover | | | Unrealized
Appreciation/
(Depreciation)* | | | Total
Accumulated
Earnings/
(Deficit) | |
ICON Energy Fund | | $ | 5,791,817 | | | $ | (34,213,220 | ) | | $ | - | | | $ | 47,835,141 | | | $ | 19,413,738 | |
ICON Financial Fund | | | 301,877 | | | | (914,723 | ) | | | (101,447,431 | ) | | | 3,524,077 | | | | (98,536,200 | ) |
ICON Healthcare Fund | | | 965,955 | | | | - | | | | (862,678 | ) | | | 13,784,741 | | | | 13,888,018 | |
ICON Industrials Fund | | | 420,620 | | | | (897,658 | ) | | | (35,221,605 | ) | | | 5,155,443 | | | | (30,543,200 | ) |
ICON Information Technology Fund | | | - | | | | (1,346,823 | ) | | | (28,466,937 | ) | | | 19,983,029 | | | | (9,830,731 | ) |
ICON Materials Fund | | | 569,893 | | | | (524,928 | ) | | | (17,906,484 | ) | | | 6,764,170 | | | | (11,097,349 | ) |
ICON Utilities Fund | | | 5,200 | | | | - | | | | (9,504,105 | ) | | | 2,429,212 | | | | (7,069,693 | ) |
| * | Differences between the book-basis and tax-basis unrealized appreciation/(depreciation) are attributable primarily to tax deferral of losses on wash sales. |
| ** | The Funds have elected to defer certain qualified late-year losses in accordance with federal income tax rules. These losses are treated as having arisen on the first day of the following fiscal year. |
As of September 30, 2012, cost on investments for federal income tax purposes and the amount of net unrealized appreciation/(depreciation) were as follows:
| | | | | | | | | | | | | | | | |
| Fund | | Cost | | | Unrealized
Appreciation | | | Unrealized
(Depreciation) | | | Net
Appreciation/
(Depreciation) | |
ICON Consumer Discretionary Fund | | $ | 49,020,256 | | | $ | 10,780,567 | | | $ | (273,217 | ) | | $ | 10,507,350 | |
ICON Consumer Staples Fund | | | 36,452,920 | | | | 3,559,979 | | | | (279,088 | ) | | | 3,280,891 | |
ICON Energy Fund | | | 545,767,531 | | | | 57,946,597 | | | | (10,111,456 | ) | | | 47,835,141 | |
ICON Financial Fund | | | 32,998,876 | | | | 4,013,789 | | | | (489,712 | ) | | | 3,524,077 | |
ICON Healthcare Fund | | | 89,621,814 | | | | 15,580,706 | | | | (1,795,965 | ) | | | 13,784,741 | |
ICON Industrials Fund | | | 35,569,552 | | | | 5,891,955 | | | | (736,512 | ) | | | 5,155,443 | |
ICON Information Technology Fund | | | 67,302,370 | | | | 23,486,110 | | | | (3,503,081 | ) | | | 19,983,029 | |
ICON Materials Fund | | | 35,775,289 | | | | 8,577,366 | | | | (1,813,196 | ) | | | 6,764,170 | |
ICON Utilities Fund | | | 31,313,154 | | | | 2,537,657 | | | | (108,445 | ) | | | 2,429,212 | |
7. Subsequent Events
Management has evaluated the possibility of subsequent events and determined that there are no material events that would require disclosure in the Funds’ financial statements.
| | |
| 98 | | NOTESTO FINANCIAL STATEMENTS |
REPORTOF INDEPENDENT REGISTERED PUBLIC
ACCOUNTING FIRM
To the Board of Trustees and Shareholders of the ICON Funds:
In our opinion, the accompanying statements of assets and liabilities, including the schedules of investments, and the related statements of operations and of changes in net assets and the financial highlights present fairly, in all material respects, the financial position of ICON Consumer Discretionary Fund, ICON Energy Fund, ICON Financial Fund, ICON Healthcare Fund, ICON Industrials Fund, ICON Information Technology Fund, ICON Consumer Staples Fund, ICON Materials Fund, and ICON Utilities Fund (formerly the “ICON Telecommunications & Utilities Fund) (nine of the portfolios constituting ICON Funds, hereafter referred to as the “Funds”) at September 30, 2012, the results of each of their operations for the year then ended, the changes in each of their net assets for each of the two years in the period then ended and the financial highlights for each of the periods presented, in conformity with accounting principles generally accepted in the United States of America. These financial statements and financial highlights (hereafter referred to as “financial statements”) are the responsibility of the Funds’ management; our responsibility is to express an opinion on these financial statements based on our audits. We conducted our audits of these financial statements in accordance with the standards of the Public Company Accounting Oversight Board (United States). Those standards require that we plan and perform the audit to obtain reasonable assurance about whether the financial statements are free of material misstatement. An audit includes examining, on a test basis, evidence supporting the amounts and disclosures in the financial statements, assessing the accounting principles used and significant estimates made by management, and evaluating the overall financial statement presentation. We believe that our audits, which included confirmation of securities at September 30, 2012 by correspondence with the custodian and brokers, provide a reasonable basis for our opinion.

Denver, Colorado
November 19, 2012
| | | | |
| REPORTOF ACCOUNTING FIRM | | | 99 | |
SIX MONTH HYPOTHETICAL EXPENSE EXAMPLE
SEPTEMBER 30, 2012 (UNAUDITED)
Example
As a shareholder of a Fund you may pay two types of fees: transaction fees and fund-related fees. Certain funds charge transaction fees, including sales charges (loads) on purchase payments, reinvested dividends, or other distributions; redemption fees; and exchange fees. Funds also incur various ongoing expenses, including management fees, distribution and/or service fees, and other fund expenses, which are indirectly paid by shareholders.
This Example is intended to help you understand your ongoing costs (in dollars) of investing in the various ICON Funds and to compare these costs with the ongoing costs of investing in other mutual funds. This Example is based on an investment of $1,000 invested at the beginning of the six-month period and held for the six-month period (4/1/12 – 9/30/12).
Actual Expenses
The first line in the table for each Fund provides information about actual account values and actual expenses. The Example includes, but is not limited to, management fees, 12b-1 fees, fund accounting, custody and transfer agent fees. However, the Example does not include client specific fees, such as the $15 fee charged to IRA accounts, or the $15 fee charged for wire redemptions. You may use this information, together with the amount you invested, to estimate the expenses that you paid over the period. Simply divide your account value by $1,000 (for example, an $8,600 account value divided by $1,000 = 8.6), then multiply the result by the number in the first line for each Fund under the heading entitled “Expenses Paid During Period” to estimate the expenses you paid on your account during this period.
Hypothetical Example for Comparison Purposes
The second line in the table for each Fund provides information about hypothetical account values and hypothetical expenses based on the Fund’s actual expense ratio and an assumed rate of return of 5% per year before expenses, which is not the Fund’s actual return. The hypothetical account values and expenses may not be used to estimate the actual ending account balance or expenses you paid for the period. You may use this information to compare the ongoing costs of investing in the Fund and other funds. To do so, compare this 5% hypothetical example with the 5% hypothetical examples that appear in the shareholder reports of the other funds. Please note that the expenses shown in the table are meant to highlight your ongoing costs only and do not reflect any transactional costs, such as sales charges (loads),
redemption fees, or exchange fees that may be charged by other funds. Therefore, this information is useful in comparing ongoing costs only, and will not help you determine the relative total costs of owning different funds.
| | | | | | | | | | | | | | | | |
| | | Beginning
Account
Value
4/1/12 | | | Ending
Account
Value
9/30/12 | | | Expenses Paid
During Period
04/1/12 - 9/30/12* | | | Annualized
Expense Ratio
04/1/12 - 9/30/12 | |
Actual Expenses | | | | | | | | | | | | | | | | |
ICON Consumer Discretionary Fund | | | | | | | | | | | | | | | | |
Class S | | $ | 1,000.00 | | | $ | 1,047.90 | | | $ | 7.12 | | | | 1.39% | |
Class C | | | 1,000.00 | | | | 1,040.50 | | | | 14.03 | | | | 2.75% | |
Class A | | | 1,000.00 | | | | 1,037.40 | | | | 10.76 | | | | 2.11% | |
ICON Consumer Staples Fund | | | | | | | | | | | | | | | | |
Class S | | | 1,000.00 | | | | 1,058.30 | | | | 7.73 | | | | 1.50% | |
Class C | | | 1,000.00 | | | | 1,053.30 | | | | 12.84 | | | | 2.50% | |
Class A | | | 1,000.00 | | | | 1,054.50 | | | | 9.00 | | | | 1.75% | |
ICON Energy Fund | | | | | | | | | | | | | | | | |
Class S | | | 1,000.00 | | | | 1,009.50 | | | | 6.25 | | | | 1.24% | |
Class C | | | 1,000.00 | | | | 1,003.70 | | | | 11.90 | | | | 2.37% | |
Class A | | | 1,000.00 | | | | 1,008.40 | | | | 7.52 | | | | 1.50% | |
ICON Financial Fund | | | | | | | | | | | | | | | | |
Class S | | | 1,000.00 | | | | 967.90 | | | | 6.93 | | | | 1.41% | |
Class C | | | 1,000.00 | | | | 959.40 | | | | 12.31 | | | | 2.51% | |
Class A | | | 1,000.00 | | | | 966.10 | | | | 8.71 | | | | 1.77% | |
ICON Healthcare Fund | | | | | | | | | | | | | | | | |
Class S | | | 1,000.00 | | | | 1,083.30 | | | | 6.94 | | | | 1.33% | |
Class C | | | 1,000.00 | | | | 1,077.60 | | | | 13.05 | | | | 2.51% | |
Class A | | | 1,000.00 | | | | 1,081.30 | | | | 9.16 | | | | 1.76% | |
ICON Industrials Fund | | | | | | | | | | | | | | | | |
Class S | | | 1,000.00 | | | | 957.10 | | | | 6.88 | | | | 1.41% | |
Class C | | | 1,000.00 | | | | 950.80 | | | | 12.21 | | | | 2.50% | |
Class A | | | 1,000.00 | | | | 955.20 | | | | 8.57 | | | | 1.75% | |
ICON Information Technology Fund | | | | | | | | | | | | | | | | |
Class S | | | 1,000.00 | | | | 984.40 | | | | 6.66 | | | | 1.34% | |
Class C | | | 1,000.00 | | | | 978.50 | | | | 12.38 | | | | 2.50% | |
Class A | | | 1,000.00 | | | | 982.50 | | | | 8.68 | | | | 1.75% | |
ICON Materials Fund | | | | | | | | | | | | | | | | |
Class S | | | 1,000.00 | | | | 970.30 | | | | 7.08 | | | | 1.44% | |
Class C | | | 1,000.00 | | | | 964.70 | | | | 12.34 | | | | 2.51% | |
Class A | | | 1,000.00 | | | | 969.40 | | | | 8.68 | | | | 1.76% | |
| | | | | | | | | | | | | | | | |
| | | Beginning
Account
Value
4/1/12 | | | Ending
Account
Value
9/30/12 | | | Expenses Paid
During Period
04/1/12 - 9/30/12* | | | Annualized
Expense Ratio
04/1/12 - 9/30/12 | |
ICON Utilities Fund | | | | | | | | | | | | | | | | |
Class S | | $ | 1,000.00 | | | $ | 1,060.30 | | | $ | 7.75 | | | | 1.50% | |
Class C | | | 1,000.00 | | | | 1,056.10 | | | | 12.59 | | | | 2.45% | |
Class A | | | 1,000.00 | | | | 1,060.00 | | | | 8.80 | | | | 1.71% | |
Hypothetical (assuming a 5% return before expenses) | | | | | | | | | | | | | | | | |
ICON Consumer Discretionary Fund | | | | | | | | | | | | | | | | |
Class S | | | 1,000.00 | | | | 1,018.05 | | | | 7.02 | | | | | |
Class C | | | 1,000.00 | | | | 1,011.25 | | | | 13.83 | | | | | |
Class A | | | 1,000.00 | | | | 1,014.44 | | | | 10.64 | | | | | |
ICON Consumer Staples Fund | | | | | | | | | | | | | | | | |
Class S | | | 1,000.00 | | | | 1,017.49 | | | | 7.57 | | | | | |
Class C | | | 1,000.00 | | | | 1,012.49 | | | | 12.59 | | | | | |
Class A | | | 1,000.00 | | | | 1,016.24 | | | | 8.83 | | | | | |
ICON Energy Fund | | | | | | | | | | | | | | | | |
Class S | | | 1,000.00 | | | | 1,018.78 | | | | 6.27 | | | | | |
Class C | | | 1,000.00 | | | | 1,013.13 | | | | 11.95 | | | | | |
Class A | | | 1,000.00 | | | | 1,017.51 | | | | 7.55 | | | | | |
ICON Financial Fund | | | | | | | | | | | | | | | | |
Class S | | | 1,000.00 | | | | 1,017.96 | | | | 7.10 | | | | | |
Class C | | | 1,000.00 | | | | 1,012.44 | | | | 12.64 | | | | | |
Class A | | | 1,000.00 | | | | 1,016.14 | | | | 8.93 | | | | | |
ICON Healthcare Fund | | | | | | | | | | | | | | | | |
Class S | | | 1,000.00 | | | | 1,018.34 | | | | 6.72 | | | | | |
Class C | | | 1,000.00 | | | | 1,012.44 | | | | 12.64 | | | | | |
Class A | | | 1,000.00 | | | | 1,016.20 | | | | 8.87 | | | | | |
ICON Industrials Fund | | | | | | | | | | | | | | | | |
Class S | | | 1,000.00 | | | | 1,017.97 | | | | 7.09 | | | | | |
Class C | | | 1,000.00 | | | | 1,012.48 | | | | 12.60 | | | | | |
Class A | | | 1,000.00 | | | | 1,016.23 | | | | 8.84 | | | | | |
ICON Information Technology Fund | | | | | | | | | | | | | | | | |
Class S | | | 1,000.00 | | | | 1,018.29 | | | | 6.77 | | | | | |
Class C | | | 1,000.00 | | | | 1,012.49 | | | | 12.59 | | | | | |
Class A | | | 1,000.00 | | | | 1,016.24 | | | | 8.83 | | | | | |
ICON Materials Fund | | | | | | | | | | | | | | | | |
Class S | | | 1,000.00 | | | | 1,017.81 | | | | 7.25 | | | | | |
Class C | | | 1,000.00 | | | | 1,012.44 | | | | 12.64 | | | | | |
Class A | | | 1,000.00 | | | | 1,016.19 | | | | 8.88 | | | | | |
| | | | | | | | | | | | | | |
| | | Beginning
Account
Value
4/1/12 | | | Ending
Account
Value
9/30/12 | | | Expenses Paid
During Period
04/1/12 - 9/30/12* | | | Annualized
Expense Ratio
04/1/12 - 9/30/12 |
ICON Utilities Fund | | | | | | | | | | | | | | |
Class S | | $ | 1,000.00 | | | $ | 1,017.48 | | | $ | 7.59 | | | |
Class C | | | 1,000.00 | | | | 1,012.75 | | | | 12.33 | | | |
Class A | | | 1,000.00 | | | | 1,016.46 | | | | 8.61 | | | |
| * | Expenses are equal to the Fund’s six month expense ratio and annualized, multiplied by the average account value over the period, multiplied by 183/366 to reflect the one-half year period. |
Total returns exclude applicable sales charges. If sales charges were included (maximum 5.75%), returns would be lower.
BOARDOF TRUSTEESAND FUND OFFICERS (UNAUDITED)
The ICON Funds Board of Trustees (“Board”) consists of four Trustees who oversee the 18 ICON Funds (the “Funds”). The Board is responsible for general oversight of the Funds’ business and for assuring that the Funds are managed in the best interest of the Funds’ shareholders. The Trustees, and their ages, and principal occupations are set forth below. The address of the Trustees is 5299 DTC Blvd., Suite 1200, Greenwood Village, CO 80111. Trustees have no official term of office and generally serve until they resign or are not re-elected.
Interested Trustee
Craig T. Callahan, 61, Chairman of the Board. Dr. Callahan has been a Trustee of the Funds since their inception. Dr. Callahan also serves as President (1998 to present) and Chairman of the Investment Committee (2005 to present) and served as the Chief Investment Officer (1991 to 2004) of ICON Advisers. Dr. Callahan is also Executive Vice President (2005 to present); Director (1991 to present); and was previously President (1998 to 2005) and Chief Compliance Officer (2005) of IDI. Dr. Callahan also serves as the President (1998 to present) and Chairman of the Board of Directors (1994 to present) of ICON Management & Research Corporation (“IM&R”), the parent company of ICON Advisers and IDI.
Independent Trustees
Glen F. Bergert, 62. Mr. Bergert has been a Trustee of the Funds since 1999. Mr. Bergert is President of Venture Capital Management LLC (1997 to present), General Partner of SOGNO Partners LP, a venture capital company (2001 to present), General Partner of Bergert Properties, LLP, a real estate holding company (1997 to present), General Partner of Pyramid Real Estate Partnership, a real estate development company (1998 to present), General Partner of Chamois Partners, LP, a venture capital company (2004 to present) and was previously a General Partner with KPMG Peat Marwick, LLP (1979 to 1997). Mr. Bergert is also a Director of Delta Dental of Pennsylvania, an insurance company (1998 to 2009 and 2010 to present), Dentegra Group, Inc, an insurance holding company (2010 to present) and Delta Reinsurance Corporation (2000 to 2009 and 2011 to present). He was a Director of Delta Dental of California, an insurance company (2006 to 2012).
John C. Pomeroy, Jr., 65. Mr. Pomeroy has been a Trustee of the Funds since November 2002. Mr. Pomeroy is Chief Investment Officer and Director
of Investments, Pennsylvania State University (2001 to present) and was Portfolio Manager and Product Manager, Trinity Investment Management Corporation (1989 to 2001).
R. Michael Sentel, 64. Mr. Sentel has been a Trustee of the Funds since their inception. Mr. Sentel is a Senior Attorney with the U.S. Department of Education (1996 to present). Mr. Sentel also provides legal representation as a sole practitioner with an emphasis on corporate and transactional law. He served as general counsel to numerous public companies and served on the board of directors of one of these clients. Mr. Sentel began his legal career with the U.S. Securities and Exchange Commission’s Division of Enforcement and served as a Branch Chief (1980 to 1981). Later he served as the Section Chief for the Professional Liability Section of the Federal Deposit Insurance Corp. with responsibility for the Rocky Mountain Region (1991 to 1994).
The Officers of the Funds are:
Craig T. Callahan, 61, Chairman of the Board. Dr. Callahan has been a Trustee of the Funds since their inception. Dr. Callahan also serves as President (1998 to present) and Chairman of the Investment Committee (2005 to present) and served as the Chief Investment Officer (1991 to 2004) of ICON Advisers. Dr. Callahan is also Executive Vice President (2005 to present); Director (1991 to present); and was previously President (1998 to 2005) and Chief Compliance Officer (2005) of IDI. Dr. Callahan also serves as the President (1998 to present) and Chairman of the Board of Directors (1994 to present) of IM&R, the parent company of ICON Advisers and IDI.
Erik L. Jonson, 63. Mr. Jonson has been a Vice President and Principal Financial Officer/Treasurer of the Funds since their inception in 1996. Mr. Jonson is also Chief Financial Officer (1996 to present) and Executive Vice President (2004 to present) and was previously Vice President (1998 to 2004) and Secretary (2005 and 1998 to 2002) of ICON Advisers; Chief Financial Officer, Secretary and Director (1998 to present) of IM&R; and Executive Vice President and Treasurer/Financial Principal (1996 to present) of IDI. Mr. Jonson will be retiring on January 22, 2013.
Jessica Seidlitz, 34. Ms. Seidlitz serves as the Assistant Treasurer of the Funds (2007 to present) and Vice President of the Funds (2012 to present). She also serves as the Mutual Fund Controller of ICON Advisers (2005 to present). Previously, she was a Senior Associate/Associate at PricewaterhouseCoopers LLP (2001 to 2004). Effective January 22, 2013, Ms. Seidlitz will become the Principal Financial Officer/Treasurer of the Funds.
Donald Salcito, 59. Mr. Salcito serves as Vice President and Secretary of the Funds (November 15, 2006 to present). Mr. Salcito is also Executive Vice President and General Counsel (September 2005 to present) of ICON
Advisers; Director of IM&R (2005 to present); Executive Vice President, Secretary, General Counsel of IDI (2005 to present). Previously, he was a Partner in various national law firms, practicing in the securities law area. (1980 to 2005).
Brian Harding, 33. Mr. Harding serves as Chief Compliance Officer and Anti-Money Laundering Officer of the Funds (2008 to present). Mr. Harding also serves as Chief Compliance Officer of ICON Advisers (2011 to present). Previously, he was a Manager (2007 to 2008) and a Senior Associate/Associate (2001 to 2007) at PricewaterhouseCoopers LLP.
OTHER INFORMATION
Renewal of Investment Advisory Agreement
On August 6, 2012 the Board of Trustees, including all of the Trustees that are not “interested persons” of the Trust (the “Independent Trustees”), approved continuation of the Advisory Agreements with the Adviser for each Fund for an additional one-year term commencing October 1, 2012.
In determining to renew the investment advisory agreements between ICON Funds (the “Trust”) and ICON Advisers, Inc. (“ICON” or the “Adviser”) the Board requested, was provided with and reviewed data with respect to ICON, its personnel, and the services provided and to be provided to each Fund by ICON under the Trust’s Investment Advisory Agreement dated October 9, 1996, as amended (related to the Sector, International and ICON Funds) and under the Trust’s Investment Advisory Agreement dated July 9, 2002 and effective October 1, 2002, as amended (related to the U.S. Diversified Funds - Bond, Risk-Managed Equity, Equity Income and Long/Short Funds) (collectively, the “Advisory Agreements”), for an additional one-year term commencing October 1, 2012. The Board agreed that consideration of the Advisory Agreements should also include consideration of Trust-ICON agreements that impact provisions of the Advisory Agreements – including, in particular, expense limitation agreements dated January 23, 2012 and May 1, 2005 (for the International Equity Fund).
The Board was provided with and reviewed data with respect to ICON, its personnel, and the services provided and to be provided to each Fund by ICON under the Trust’s Advisory Agreements and Administrative Services Agreement with ICON and the Distribution Agreement with ICON Distributors, Inc. (“IDI”). The data included information concerning advisory, distribution and administrative services provided to the Funds by ICON and its related companies; information concerning other businesses of those companies; comparative data related to exchange traded funds versus the Sector Funds; and comparative data obtained from Strategic Insights related to Fund performance and Fund expenses (the “SI report”). The data also included an analysis of the Funds’ ratings on the AthenaInvest system (the “AthenaInvest data”) and a presentation on ICON’s investment model.
Management personnel discussed the data for and with the Board. Included in the 15(c) discussion was a briefing on factors affecting the ICON model; expenses and expense ratios of each Fund and other ICON managed products; relative performance of each Fund; status of expense reimbursements to the Funds by ICON Advisers; sales and marketing initiatives; specific business factors affecting IDI; the work load on ICON as
adviser and administrator to the Funds; current profitability of ICON; current staffing levels and staff morale; and changes to ICON’s trading desk.
The Independent Trustees were represented by independent legal counsel throughout the process. Prior to acting on the proposed contract renewals, the Independent Trustees met separately as a group in private sessions with their independent legal counsel to review and discuss the foregoing information. Based on these discussions, independent legal counsel and/or the Lead Independent Trustee also contacted management to request additional information and to discuss responses to questions raised during the process. In addition, the Board received materials from legal counsel discussing the legal standards applicable to their consideration of the ICON-Trust agreements.
In considering the nature, extent and quality of the services provided by the Adviser, the Board reviewed information relating to ICON’s operations and personnel. Among other things, the Adviser provided biographical information on its professional staff and descriptions of its organizational and management structure. In the course of their deliberations the Board evaluated, among other things, information relating to the investment philosophy, strategies and techniques used in managing each Fund, the qualifications and experience of ICON’s investment personnel, ICON’s compliance programs, ICON’s brokerage practices, including the extent to which the Adviser obtains research through “soft dollar” arrangements with the Funds’ brokerage, compliance reports on the foregoing, and the financial and non-financial resources available to provide services required under the Advisory Agreement.
During the discussion, the SI report and the AthenaInvest data were discussed and management personnel showed performance for each fund and discussed the factors affecting performance. During the discussion on performance, management personnel noted that the markets continue to experience volatility and that when the markets are volatile, it affects ICON’s performance; during the last three – four years ICON’s style of management, intrinsic valuation, has not been in favor. It was noted that Advisers’ performance relative to other valuation managers as judged by the AthenaInvest system is quite positive, but in relation to other strategy managers, valuation is underperforming; that the period from March 2009, near the market bottom, through June 2012, is an example of how difficult it has been for active management as the average performance of all ten strategies identified by AthenaInvest have lagged the S & P 500; that the best two performing strategies have been Future Profitability and Future Growth, which appear to have benefitted from rebounding, rapidly growing and improving earnings; that Valuation ranks fourth – just above middle of the pack, only slightly better than the average performance of all managers;
and that, performance over the twelve months ending June, 2012 shows all ten strategies lagged the S & P 500 Index. The Board believes this information supports the view that we are in a very difficult setting for active management and indicates this setting has been particularly difficult for managers buying what they consider to be value bargains. It was noted that the ICON system is designed to handle one to two year industry themes, not themes averaging 14 weeks; and that the Adviser has stuck to its system as specified in Fund disclosure documents, holding the stocks and industries that appear undervalued and held those stocks and industries through the volatility. Management advised that, in hindsight, the only way to handle such a rapidly reversing environment is “market timing;” that the Adviser is not a market timer and doesn’t believe such a system is possible; and that the Adviser uses one valuation system across all mutual funds which has been problematic for all of the ICON Funds in this setting. The Adviser noted that AthenaInvest has data on strategies back to 1980 and there is a clear pattern of strategies coming and going from favor as economic and financial environments change; and that the Adviser remains committed to its style of management and believes that the shareholders will be rewarded over time.
The Board then questioned style consistency with the Adviser. Management advised that, based on the Adviser’s own analysis, and with the restructuring of the Adviser, ICON has added a new level of review on the Portfolio Managers (“PMs”) to make sure they are adhering to the ICON System; that procedures have been put in place to evaluate each of the Funds to ensure all PMs are investing consistently and in accordance with the ICON System by evaluating the Funds from an attribution perspective in monthly meetings with the PM’s and to, on an ongoing basis, evaluate the ICON system and seek to improve the Model, when necessary. The Board of Trustees noted that the Funds offer investors an opportunity to invest in funds where the Valuation style is used to manage fund assets; that the Adviser provides that style of management; that the Adviser continues to believe the adjustments to its system have been functioning as intended; and that, notwithstanding that belief, the Adviser is constantly evaluating the system and will modify it as needed.
In connection with reviewing data bearing upon the nature, quality, and extent of services furnished by ICON to each Fund, the Board assessed data concerning ICON’s staffing, systems and facilities. The Board also assessed ICON’s non-Trust business to see if there are any initiatives that would dilute service to the Trust. The Board noted:
A. That the breadth and the quality of investment advisory and other services being provided to each Fund is satisfactory, as evidenced in part by efforts to address and improve the performance record of each Fund when
compared with the performance records of a peer group of comparable funds and markets in general;
B. That the breadth and the quality of investment advisory and other services being provided to each Fund is satisfactory, as evidenced in part by the AthenaInvest data (ratings based on an assessment of fund strategy) which also reflects that all but one of the Funds are rated 3 or higher and that, unlike many other fund groups, ICON Funds has no fund rated 1 and only one rated 2 (where 1 is the lowest and 5 is the highest).
C. That ICON has made significant expenditures in the past year and in prior years to ensure that it has the sophisticated systems and the highly trained personnel necessary for it to be able to continue to provide quality service to the Funds’ shareholders, including the dedication of substantial resources to ICON’s investment and methodology;
D. That the Board, after considering compliance reports and compliance initiatives undertaken during the year and conducting individual interviews with selected portfolio managers, is satisfied with the research and portfolio management, that research and portfolio management is being constantly evaluated and improved upon; and that the PM’s are evaluating trading services constantly, the Board concluded that the Adviser is providing the Funds with professional management of the nature, quality and scope required by the Funds; and
E. The risks assumed by ICON in providing investment advisory services to each Fund, including the capital commitments which have been made in the past and which continue to be made by ICON to ensure the continuation of the highest quality of service to the Trust, is made with the recognition that shareholders may redeem their shares at any time without notice and the Trust’s advisory relationship with ICON may be terminated at any time and must be renewed on an annual basis.
In considering the reasonableness of the fees paid to the Adviser for managing each Fund, the Board reviewed, among other things, data concerning other funds from the SI report, financial statements of the Adviser and an analysis of the profitability of the Adviser, and its affiliates, and their relationship with each Fund over various time periods. Such analysis identified all revenues and other benefits received by the Adviser and its affiliates from managing each Fund, the costs associated with providing such services and the resulting profitability to the Adviser and its affiliates and a comparison of similar data from reports filed by publicly traded firms.
The Board noted actual (net) fees for advisory services and Fund expense ratios under the contractual relationship (the Advisory agreements and the
Expense Limitation Agreements) with ICON as opposed to the fees specified in the applicable Advisory Agreement and expense ratios without application of the expense limitations and concluded that the focus should be on actual expense ratios after application of the Expense Limitation Agreements.
The Board considered the current and anticipated asset levels of each Fund and the contractual commitments of the Adviser to waive fees and pay expenses of the Funds from time to time to limit the total expenses of the Funds. In this regard the Board discussed significantly reduced asset levels in each Fund covered by the Advisory Agreements due to the tumultuous markets during the past four and a half years, the relative poor Fund performance, and the industry wide net-redemptions in equity and actively managed funds due to the uncertainty of the markets. ICON’s ability to provide the services called for under the Advisory Agreements was assessed in light of current and projected asset levels. Fund expenses and expense ratios were also assessed in light of current and projected asset levels. The Board concluded that the Adviser has the resources necessary to provide the services called for under the Advisory Agreements; that profitability to the Adviser and its affiliates from their relationship with the Funds, and services provided to the Funds, is not excessive; and that the Adviser is not realizing material benefits from economies of scale that would warrant adjustments to the fees for any Fund at this time. The Board of Trustees concluded that, in light of the nature, extent and quality of the services provided by the Adviser and the levels of profitability associated with providing these services, the fees charged by the Adviser under the Advisory Agreements to each Fund are reasonable.
In connection with assessing data bearing on the fairness of fee arrangements, the Board considered the SI report. It was noted that SI was selected at the May Board meeting to prepare its report, an extensive analysis of the expense data of other comparable funds; and that Trustee input was solicited and provided in the process. Among other information discussed, it was noted that:
A. the advisory fee structures of the Funds were considered in comparison with advisory fees and expense ratios of other similarly managed funds as set forth in the comparative data;
B. expense ratios for 14 of the 17 Funds are above median, one is equal to the median, and 2 are below the median;
C. in 15 of the 17 Funds, the assets under management are significantly below either the average or the median [SI did not provide an analysis of fund expense on an asset weighted basis. Such an analysis is very subjective and uncertain because it would require the Adviser to make a number of assumptions, which the Adviser’s management was uncomfortable in making
due to the unreliability of the assumptions. It was, however, noted that when the fund size approaches peer group averages the Funds expenses also approach peer group averages.];
D. ICON has contractually agreed to impose expense limitations on each and every Fund at a cost to ICON;
E. the advisory and other fees payable by the Funds to ICON under the contractual arrangements (the Advisory agreements and the Expense Limitation Agreements) are essentially fees which would be similar to those which would have resulted solely from “arm’s-length” bargaining, and may well be lower than fees arrived at solely from such arm’s-length negotiation;
F. ICON has contractually committed to break points in its fees so that economies of scale could be realized as a Fund grows in assets, for the benefit of Fund shareholders.
The Board also considered the fees charged by the Adviser to other advisory clients as outlined in its Registration application on form ADV in connection with assessing data bearing on the fairness of fee arrangements. It was noted that certain institutional type accounts have lower fees than the fees paid by the Funds; and that the fees differed for a number of reasons, including but not limited to, those clients call for different commitments of time, have low and predictable turnover of assets, in competition joint costs are apportioned among paying customers according to elasticity of demand, and the Adviser has reduced levels of responsibility in sub-managed accounts, or accounts with an investor agent/advisor especially in comparison to mutual funds which are highly regulated and restricted which increases costs of operations and decreases returns. The Board evaluated the Funds redemptions and compared those redemptions to similar funds in the industry, specifically, actively managed domestic equity funds in connection with assessing data bearing on the fairness of fee arrangements. The Board noted that the Funds redemptions were similar to industry averages which showed two things: 1) that the Funds’ Performance was not adversely impacting fund sales and redemptions, and 2) that the fees and costs were competitive. The Board noted that there are thousands of mutual funds competing; that investors can search and trade funds on the internet at very little or no cost; and that if the Adviser were overcharging for its services, with its performance being what it is, the Board would have expected redemptions in excess of industry norms.
The Board concluded that the Adviser is providing the Funds with professional management at a fair, reasonable and competitive price.
In connection with assessing the direct and indirect benefits to ICON from serving as the Funds’ adviser, the Board discussed services provided under
the Distribution Agreement and the Administrative Services Agreement which are in addition to services under the Advisory Agreements. It was noted that IDI does not charge a fee to the Funds for its services and that ICON’s fee for administrative services appears to be consistent with such fees in other fund groups. The Board noted that:
A. ICON benefits from serving directly or through affiliates as the principal underwriter and administrative agent for the Funds; that services provided by ICON and its affiliates to the Funds are satisfactory, and that fees derived from providing the services are competitive and reasonable; and
B. ICON receives research assistance (primarily in the form of data) from the use of soft dollars generated from Fund portfolio transactions; that such research assists ICON in providing quality advisory services; that Trust and Adviser compliance personnel continuously evaluate and report on the soft-dollar arrangements and related costs; and that the Board concluded that the arrangements are consistent with Fund brokerage practices and benefit the Funds and their shareholders.
Based on these considerations, the Board, including all of the Independent Trustees, concluded that: 1) the continuation of the Advisory Agreements was in the best interests of each Fund and its shareholders, 2) the services to be performed under the Advisory Agreements were required for the operation of the Funds, 3) the advisory services were satisfactory to the Funds in the past, and 4) the fees for the advisory services and other benefits from the relationship with the Trust received by ICON, and its affiliates, were consistent with fees paid by similar funds and other clients of ICON, and were reasonable in light of the comparative data, and within the range of what would have been negotiated at arm’s length in light of all the circumstances.
OTHER INFORMATION (UNAUDITED)
Supplemental Tax Information
For corporate shareholders, the following percentage of the total ordinary income dividends paid during the fiscal year ended September 30, 2012, qualifies for the corporate dividends received deduction for the following Funds:
| | | | |
| Fund | | Dividends
Received
Deduction | |
ICON Consumer Staples Fund | | | 100 | % |
ICON Energy Fund | | | 100 | % |
ICON Financial Fund | | | 100 | % |
ICON Industrials Fund | | | 100 | % |
ICON Materials Fund | | | 100 | % |
ICON Utilities Fund | | | 100 | % |
For the fiscal year ended September 30, 2012, the following funds paid qualified dividend income:
| | | | |
| Fund | | Amount | |
ICON Consumer Staples Fund | | | 100% | |
ICON Energy Fund | | | 100% | |
ICON Financial Fund | | | 100% | |
ICON Healthcare Fund | | | 100% | |
ICON Industrials Fund | | | 100% | |
ICON Materials Fund | | | 100% | |
ICON Utilities Fund | | | 100% | |
The Funds had no long-term capital gain distributions qualifying for the maximum 15% income tax rate for individuals.
Portfolio Holdings
Information related to the 10 largest portfolio holdings of each Fund is made available at www.iconfunds.com within approximately 10 business days after month-end. Additionally, a complete list of each Fund’s holdings is made available approximately 30 days after month-end. Each ICON Fund also files a complete schedule of portfolio holdings for the first and third quarters of its fiscal year with the Securities and Exchange Commission (the “Commission”) on Form N-Q. The ICON Funds’ Forms N-Q are available at www.sec.gov or may be reviewed and copied at the Commission’s Public Reference Room in Washington, DC. Information about the Public Reference Room may be obtained by calling 1-800-SEC-0330.
Proxy Voting
A summarized description of the policies and procedures the ICON Funds use to vote proxies is available free of charge at www.iconfunds.com or by calling 1-800-764-0442.
Information about how the ICON Funds voted proxies related to each Fund’s portfolio securities during the 12-month period ended June 30 is available free of charge at www.iconfunds.com or on the Commission’s website at www.sec.gov.
Cost Basis Information
Effective January 1, 2012, federal law requires mutual fund companies to maintain and report a shareholder’s cost basis by tax lot, gain/loss information and holding period of covered shares to the Internal Revenue Service on Form 1099. Covered shares are mutual fund shares acquired on or after January 1, 2012. A fund is not required to maintain and report information for shares not deemed as covered.
The new law requires each fund to elect a default tax identification methodology in order to perform the required reporting. As a result, the Trust has chosen Average Cost as its default tax identification methodology. This is the method each Fund will use. However, at the time of purchase or upon the sale of covered shares, shareholders may choose a different tax identification method. Furthermore, if you purchase shares through a financial intermediary, please contact the intermediary to find out what default tax identification method they will use. We recommend that you consult your tax adviser to determine which tax identification methodology best suits your individual tax situation.
For More Information
This report is for the general information of the Funds’ shareholders and is not authorized for distribution to prospective investors unless preceded or accompanied by a current prospectus. You may obtain a copy of the prospectus, which contains information about the investment objectives, risks, charges, expenses, and share classes of each ICON Fund, by visiting www.iconfunds.com or by calling 1-800-764-0442. Please read the prospectus carefully before investing.
ICON Distributors, Inc., Distributor.
ICON FUNDS PRIVACY INFORMATION
| | |
| FACTS | | WHAT DOES ICON DO WITH YOUR PERSONAL INFORMATION? |
| | |
| Why? | | Financial companies choose how they share your personal information. Federal law gives consumers the right to limit some but not all sharing. Federal law also requires us to tell you how we collect, share, and protect your personal information. Please read this notice carefully to understand what we do. |
| | |
| What? | | The types of personal information we collect and share depend on the product or service you have with us. This information can include: n Social Security number and account balances n income and transaction history n checking account information and wire transfer instructions When you are no longer our customer, we continue to share your information as described in this notice. |
| | |
| How? | | All financial companies need to share customers’ personal information to run their everyday business. In the section below, we list the reasons financial companies can share their customers’ personal information; the reasons ICON chooses to share; and whether you can limit this sharing. |
| | | | |
| Reasons we can share your personal information | | Does ICON share? | | Can you limit this sharing? |
For our everyday business purposes — such as to process your transactions, maintain your account(s), respond to court orders and legal investigations, or report to credit bureaus | | Yes | | No |
For our marketing purposes — to offer our products and services to you | | No | | We don’t share |
| For joint marketing with other financial companies | | No | | We don’t share |
For our affiliates’ everyday business purposes — information about your transactions and experiences | | No | | We don’t share |
For our affiliates’ everyday business purposes — information about your creditworthiness | | No | | We don’t share |
| For nonaffiliates to market to you | | No | | We don’t share |
| | |
| Questions? | | Call 1-800-764-0442 for the ICON Funds and 1-800-828-4881 for ICON Advisers, Inc. and ICON Distributors, Inc. |
| | |
| 116 | | FUNDS PRIVACY INFORMATION |
| | |
| Who we are | | |
| Who is providing this notice? | | ICON Funds, ICON Advisers, Inc., and ICON Distributors, Inc. (collectively “ICON”) |
| What we do | | |
| How does ICON protect my personal information? | | To protect your personal information from unauthorized access and use, we use security measures that comply with federal law. These measures include computer safeguards and secured files and buildings. Contracts with our service providers require them to restrict access to your non-public personal information, and to maintain physical, electronic and procedural safeguards against unintended disclosure. |
| How does ICON collect my personal information? | | We collect your personal information, for example, when you n open an account or enter into an investment advisory contract n provide account information or give us your contact information n make a wire transfer We also collect your personal information from others, such as credit bureaus, affiliates, or other companies. |
| Why can’t I limit all sharing? | | Federal law gives you the right to limit only n sharing for affiliates’ everyday business purposes — information about your creditworthiness n affiliates from using your information to market to you n sharing for nonaffiliates to market to you State laws and individual companies may give you additional rights to limit sharing. |
| Definitions | | |
| Affiliates | | Companies related by common ownership or control. They can be financial and nonfinancial companies. n Our affiliates include financial companies such as ICON Funds, ICON Advisers, Inc., and ICON Distributors, Inc. |
| Nonaffiliates | | Companies not related by common ownership or control. They can be financial and nonfinancial companies. n Nonaffiliates we share with can include financial companies such as custodians, transfer agents, registered representatives, financial advisers and nonfinancial companies such as fulfillment, proxy voting, and class action service providers |
| Joint marketing | | A formal agreement between nonaffiliated financial companies that together market financial products or services to you. n ICON doesn’t jointly market |
| | | | |
| FUNDS PRIVACY INFORMATION | | | 117 | |
(This page is intentionally left blank)
(This page is intentionally left blank)
(This page is intentionally left blank)
(This page is intentionally left blank)
(This page is intentionally left blank)
(This page is intentionally left blank)
(This page is intentionally left blank)
(This page is intentionally left blank)
For more information about the ICON Funds, contact us:
| | |
| |
| By Telephone | | 1-800-764-0442 |
| |
| By Mail | | ICON Funds P.O. Box 55452 Boston, MA 02205-8165 |
| |
| In Person | | ICON Funds 5299 DTC Boulevard, 12th Floor Greenwood Village, CO 80111 |
| |
| On the Internet | | www.iconfunds.com |
| |
| By E-Mail | | info@iconadvisers.com |
Item 2. Code of Ethics.
(a) The registrant has adopted a code of ethics that applies to the registrant’s principal executive officer, principal financial officer, principal accounting officer or controller, or persons performing similar functions. This code of ethics is included as an Exhibit.
(b) Not used.
(c) There were no amendments, during the period covered by this report, to a provision of the code of ethics that applies to the Registrant’s principal executive officer, principal financial officer, principal accounting officer or controller, or persons performing similar functions, regardless of whether these individuals are employed by the Registrant or a third party, and that relates to any element of the code of ethics description.
(d) The registrant has not granted any waivers, including an implicit waiver, from a provision of the code of ethics that applies to the Registrant’s principal executive officer, principal financial officer, principal accounting officer or controller, or persons performing similar functions, regardless of whether these individuals are employed by the Registrant or a third party, that relates to one or more of the items set forth in paragraph (b) of this item’s instructions.
(e) Not applicable.
(f) See the attached Exhibit.
Item 3. Audit Committee Financial Expert.
3(a)(1) The Registrant’s Board of Trustees has determined that the registrant has at least one audit committee financial expert serving on its audit committee.
3(a)(2) The audit committee financial experts are Glen F. Bergert and R. Michael Sentel, who are “independent” for purposes of this Item 3 of Form N-CSR.
3(a)(3) Not applicable.
Item 4. Principal Accountant Fees and Services.
(a) Audit Fees
In each of the fiscal years ended September 30, 2012 and September 30, 2011, the aggregate Audit Fees billed (or to be billed) by PricewaterhouseCoopers LLP (“PwC”) for professional services rendered for the audits of the financial statements, or services that are normally provided in connection with statutory and regulatory filings or engagements as well as reimbursable expenses are listed below. All of the below fees were paid by the Registrant.
| | |
| 2012 | | 2011 |
| $353,548 | | $352,200 |
(b) Audit-Related Fees
In each of the fiscal years ended September 30, 2012 and September 30, 2011, the aggregate Audit-Related Fees billed (or to be billed) by PwC for services rendered for assurance and related services to each fund that are reasonably related to the performance of the audit or review of the fund’s financial statements, but not reported as Audit Fees, are shown in the table below.
| * | This fee was related to procedures performed during a reprocessing event. |
(c) Tax Fees
In each of the fiscal years ended September 30, 2012 and September 30, 2011 the aggregate Tax Fees billed (or to be billed) by PwC for professional services rendered for tax return preparation, tax compliance, tax advice and tax planning are shown in the table below. All of the below fees were paid by the Registrant.
| | |
| 2012 | | 2011 |
| $128,000 | | $118,425 |
(d) All Other Fees
In each of the fiscal years ended September 30, 2012 and September 30, 2011 the aggregate Other Fees billed (or to be billed) by PwC for all other non-audit services rendered are shown in the table below. All of the below fees were paid by the Registrant.
(e)(1) The audit committee of the Registrant’s Board of Trustees is required to pre-approve all services to be provided by the independent accountants to the Registrant or the Registrant’s investment adviser and to any entity controlling, controlled by or under common control with the investment adviser that provides on-going services to the Registrant to determine whether the services performed by the independent accountants impair their independence from the Registrant. The audit committee has delegated authority to the Chairman of the audit committee, subject to review and ratification by the full audit committee.
(e)(2) 100% of the fees were approved by the Registrant’s audit committee pursuant to paragraph (c)(7)(i)(C) if Rule 2-01 of Regulation S-X.
(f) For the fiscal year ended September 30, 2012, the percentage of hours spent on the audit of the Registrant’s financial statements that were attributed to work performed by persons who are not full-time, permanent employees of PwC was 0%.
(g) See Item 4(d) above.
(h) There were no non-audit fees provided by PwC in the fiscal year ending September 30, 2012 or September 30, 2011 to the investment adviser or to any entity controlling, controlled by, or under common control with the investment adviser that provides on-going services to the Registrant.
Item 5. Audit Committee of Listed Registrants.
Not applicable.
Item 6. Investments.
(a) The schedule of investments in securities of unaffiliated issuers is included in Item 1.
(b) Not applicable.
Item 7. Disclosure of Proxy Voting Policies and Procedures for Closed-End Management Investment Companies.
Not applicable.
Item 8. Portfolio Managers of Closed-End Management Investment Companies.
Not applicable.
Item 9. Purchases of Equity Securities by Closed-End Management Investment Company and Affiliated Purchasers.
Not applicable.
Item 10. Submission of Matters to a Vote of Security Holders.
Not applicable.
Item 11. Controls and Procedures.
(a) The registrant’s principal executive officer and principal financial officer have concluded, based on their evaluation of the Registrant’s disclosure controls and procedures as conducted within 90 days of the filing date of this report, that these disclosure controls and procedures are adequately designed and are operating effectively to ensure that information required to be disclosed by the registrant on Form N-CSR is recorded, processed, summarized and reported within the time periods specified in the Securities and Exchange Commission’s rules and forms.
(b)There were no changes in the registrant’s internal control over financial reporting that occurred during the second fiscal quarter of the period covered by this report that have materially affected or are reasonably likely to materially affect, the registrant’s internal control over financial reporting.
Item 12. Exhibits.
(a)(1) The code of ethics is attached.
(a)(2) Certifications pursuant to Rule 30a-2(a) are attached.
(a)(3) Not applicable.
(b) Certifications pursuant to Rule 30a-2(b) are furnished herewith.
SIGNATURES
Pursuant to the requirements of the Securities Exchange Act of 1934 and the Investment Company Act of 1940, the registrant has duly caused this report to be signed on its behalf by the undersigned, thereunto duly authorized.
| | | | | | | | |
By (Signature and Title)* | | /s/ Craig T. Callahan | | | | | | |
| | Craig T. Callahan, President and Chief Executive Officer (Principal Executive Officer) |
Pursuant to the requirements of the Securities Exchange Act of 1934 and the Investment Company Act of 1940, this report has been signed below by the following persons on behalf of the registrant and in the capacities and on the dates indicated.
| | | | | | | | |
By (Signature and Title)* | | /s/ Craig T. Callahan | | | | | | |
| | Craig T. Callahan, President and Chief Executive Officer (Principal Executive Officer) |
| | | | | | | | |
By (Signature and Title)* | | /s/ Erik L. Jonson | | | | | | |
| | Erik L. Jonson, Vice President, Chief Financial Officer and Treasurer | | |
| | (Principal Financial Officer and Principal Accounting Officer) | | |
| * | Print the name and title of each signing officer under his or her signature. |