Table of Contents
UNITED STATES
SECURITIES AND EXCHANGE COMMISSION
Washington, D.C. 20549
FORM N-CSR
CERTIFIED SHAREHOLDER REPORT OF REGISTERED
MANAGEMENT INVESTMENT COMPANIES
Investment Company Act file number 811-07883
ICON Funds
(Exact name of registrant as specified in charter)
5299 DTC Blvd. Suite 1200 Greenwood Village, CO 80111
(Address of principal executive offices) (Zip code)
Brian Harding
5299 DTC Blvd. Suite 1200 Greenwood Village, CO 80111
(Name and address of agent for service)
Registrant’s telephone number, including area code: 303-790-1600
Date of fiscal year end: September 30, 2017
Date of reporting period: September 30, 2017
Table of Contents
Item 1. Reports to Stockholders.
Table of Contents

ICON Bond Fund
ICON Equity Income Fund
ICON Fund
ICON Long/Short Fund
ICON Opportunities Fund
ICON Risk-Managed Balanced Fund
Table of Contents

You can now sign up for electronic delivery of ICON Fund shareholder reports, including prospectuses, annual reports, semiannual reports and proxy statements.
When these materials are available, you will receive an email from ICON with instructions on how to view the documents. Statements, transaction confirmations and other documents that are not available online will continue to be sent to you by U.S. mail.
Visit ICON’s website at www.iconfunds.com to learn more and sign up.
You may change or cancel your participation in eDelivery by visiting www.iconfunds.com, or you can request a hard copy of any of the materials free of charge by calling ICON Funds at 1-800-764-0442.
1-800-764-0442
| ●
| www.iconfunds.com
| ||||||
Table of Contents
| 2 | ||||
Management Overview (Unaudited) and Schedules of Investments | ||||
| 3 | ||||
| 8 | ||||
| 14 | ||||
| 18 | ||||
| 22 | ||||
| 26 | ||||
| 34 | ||||
| 42 | ||||
| 58 | ||||
| 73 | ||||
| 74 | ||||
| 76 | ||||
| 78 | ||||
| 82 | ||||
Table of Contents
| ICON Diversified Funds | About This Report | |
| September 30, 2017 (Unaudited) |
Historical Returns
All total returns mentioned in this Report account for the change in a Fund’s per-share price and the reinvestment of any dividends, capital gain distributions and adjustments for financial statement purposes. If your account is set up to receive Fund distributions in cash rather than to reinvest them, your actual return may differ from these figures. The Funds’ performance results do not reflect the deduction of taxes that a shareholder would pay on Fund distributions or on the redemption of Fund shares. The Adviser may have reimbursed certain fees or expenses of some of the Funds. If not for these reimbursements, performance would have been lower. Fund results shown, unless otherwise indicated, are at net asset value. If a sales charge (maximum 5.75%) had been deducted, results would have been lower.
Past performance does not guarantee future results. Investment return and principal value will fluctuate so that an investor’s shares, when redeemed, may be worth more or less than their original cost. Performance results represent past performance, and current performance may be higher or lower. Please call 1-800-764-0442 or visit www.iconfunds.com for performance results current to the most recent month-end.
Portfolio Data
This Report reflects ICON’s portfolio holdings as of September 30, 2017, the end of the reporting period. The information is not a complete analysis of every aspect of any sector, industry, security or the Funds.
There are risks associated with mutual fund investing, including the loss of principal. The likelihood of loss may be greater if you invest for a shorter period of time. There is no assurance that the investment process will consistently lead to successful results.
There are risks associated with selling short, including the risk that the ICON Long/Short Fund may have to cover its short position at a higher price than the short price, resulting in a loss. The ICON Long/Short Fund’s loss on a short sale is potentially unlimited as a loss occurs when the value of a security sold short increases. Call options involve certain risks, such as limited gains and lack of liquidity in the underlying securities, and are not suitable for all investors.
Investing in fixed income securities such as bonds involves interest rate risk. When interest rates rise, the value of fixed income securities generally decreases. The ICON Bond Fund and ICON Equity Income Fund may invest up to 35% and 25% of its assets in high-yield bonds that are below investment grade, respectively. ICON Risk-Managed Balanced Fund may invest up to 10% of its assets in high-yield bonds that are below investment grade. High-yield bonds involve a greater risk of default and price volatility than U.S. Government and other higher-quality bonds.
An investment concentrated in sectors and industries may involve greater risk and volatility than a more diversified investment.
Investments in foreign securities may entail unique risks, including political, market, and currency risks. Financial statements of foreign companies are governed by different accounting, auditing, and financial standards than U.S. companies and may be less transparent and uniform than in the United States. Many corporate governance standards, which help ensure the integrity of public information in the United States, do not exist in foreign countries. In general, there may be less governmental supervision of foreign stock exchanges and securities brokers and issuers. The ICON system relies on the integrity of the financial statements released to the market as part of our analysis.
Investments in other mutual fund companies may entail certain risks. For example, the Fund’s performance depends on the underlying funds in which it invests, and it is subject to the risks of the underlying funds. Additionally, an investment by the Fund or underlying fund in exchange-traded funds generally presents the same primary risks as an investment in a mutual fund.
The prospectus and statement of additional information contain this and other information about the Funds and are available by visiting www.iconfunds.com or calling 1-800-764-0442. Please read the prospectus and statement of additional information carefully.
Financial Intermediary
If you purchase the Fund through a broker-dealer or other financial intermediary (such as a bank), the Fund and its related companies may pay the intermediary for the sale of Fund shares and related services. These payments may influence the broker-dealer or other intermediary and your salesperson to recommend the Fund over another investment. Ask your salesperson or visit your financial intermediary’s website for more information.
| ||
| 2 | www.iconfunds.com | |
Table of Contents
| ICON Bond Fund | Management Overview | |
| September 30, 2017 (Unaudited) |
| Q. | How did the Fund perform relative to its benchmark? |
| A. | For the fiscal year ended September 30, 2017, the ICON Bond Fund (the Fund) Class S shares outperformed its benchmark, the Barclays Capital U.S. Universal Index (ex-MBS). The Fund returned 2.82% while the Barclays Capital U.S. Universal Index (ex-MBS) returned 1.17%. Total returns for other periods and additional Class shares as of September 30, 2017, appear in the subsequent pages of this Fund’s Management Overview. |
| Q. | What primary factors were behind the Fund’s relative performance? |
| A. | Fiscal year 2017 proved to be a rather volatile year for fixed income investors as both rate and spread movements produced large relative return differences in varying segments of the bond market. The majority of rate volatility took place during the fourth quarter of 2016 with investors aggressively selling treasury bonds at the close of the presidential election. This so-called “Trump Trade” took place as investors anticipated future inflationary pressures due to a more pro-growth political platform resulting in the yield on the 10-year U.S. Treasury moving from 1.60% on September 30, 2016 to 2.45% on December 31, 2106. The ICON Bond Fund held up well during this sell-off due to its shorter overall duration and credit-heavy focus, as corporate credit spread tightening offset a portion of the rate move. |
During the remainder of the fiscal year, rate volatility decreased while the yield on the 10-year U.S. Treasury traded within an approximate 50 basis point range. However, credit spreads continued to tighten across the board as default risk remained constrained and yield-hungry investors bid up corporate bonds in both the investment grade and high yield space. The ICON Bond Fund was again able to outperform during this move due to strong corporate bond selections and allocations to both closed-end funds and preferred shares that produced strong returns. |
| Q. | How did the Fund’s composition affect performance? |
| A. | As stated above, the Fund outperformed its benchmark during the fiscal year. The outperformance largely stemmed from the Fund’s positions in corporate credit and the preferred share segment of the market, both of which produced strong relative returns over the course of the fiscal year. From a sector standpoint, corporate bond selections within the Industrials, Financials, and Consumer Discretionary sectors of the market experienced larger spread tightening movement than the broad market. Closed-end fund positions also produced strong returns relative to the benchmark, contributing positively to the Fund’s performance. |
Over the course of the fiscal year, the Fund had an increased allocation to cash due to tight corporate credit spreads and stretched valuations. While this cash balance did help insulate the Fund from the rate move in the 4th quarter of 2016, it also reduced participation in the credit spread tightening move that took place over the course of the fiscal year. |
| Q. | What is your investment outlook for the bond market? |
| A. | At the end of fiscal year 2017, both investment-grade and high yield corporate bond spreads were trading at levels that we regard as excessively tight and overvalued. With spreads at these levels, we have been focused on more defensive structure oriented positions and are utilizing our bottom up approach to find these issue-specific opportunities. While we don’t anticipate a substantial upward movement in interest rates over the course of the next 12 months, the Fund is positioned in the lower portion of its duration range as we move into fiscal year 2018. Closed-end fund opportunities remain abundant and we have structured this segment of the Fund to benefit from net asset value tightening events. While future bond market volatility might be substantial, we believe our bottom up investment methodology will help the Fund navigate the changing market. |
| Annual Report | September 30, 2017 | 3 | |
Table of Contents
| ICON Bond Fund | Management Overview | |
| September 30, 2017 (Unaudited) |
Average Annual Total Return (as of September 30, 2017)
| Inception Date | 1 Year | 5 Years | 10 Years | Since Inception | Gross Expense Ratio* | Net Expense Ratio* | ||||||||
ICON Bond Fund - Class S | 5/6/04 | 2.82% | 3.00% | 4.70% | 4.52% | 1.03% | 0.85% | |||||||
ICON Bond Fund - Class C | 10/21/02 | 2.05% | 2.14% | 3.82% | 3.99% | 2.20% | 1.70% | |||||||
ICON Bond Fund - Class A | 9/30/10 | 2.48% | 2.74% | N/A | 3.30% | 1.48% | 1.10% | |||||||
ICON Bond Fund - Class A | 9/30/10 | -2.35% | 1.75% | N/A | 2.58% | 1.48% | 1.10% | |||||||
Barclays Capital U.S. Universal Index | 0.96% | 2.53% | 4.56% | 4.68% | N/A | N/A | ||||||||
Barclays Capital U.S. Universal Index (ex-MBS) | 1.17% | 2.71% | 4.65% | 4.75% | N/A | N/A |
Past performance is not a guarantee of future results. Information about these performance results and the comparative indexes can be found in the About This Report section. The Adviser has agreed to limit certain Fund expenses; without these limitations, returns would have been lower. The limitation provisions may be terminated in the future.
| * | Please see the most recent prospectus for details. |
Class C total returns exclude applicable sales charges. If sales charges were included returns would be lower.
Value of a $10,000 Investment (through September 30, 2017)
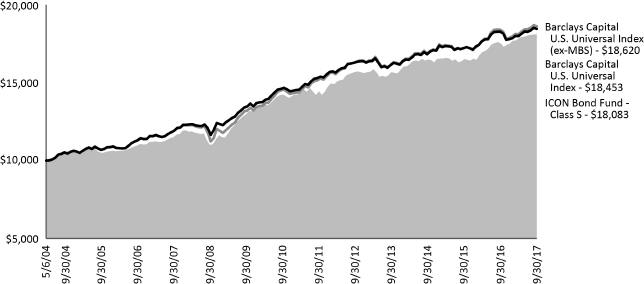
Past performance is not a guarantee of future results. The above graph compares a $10,000 investment made in the Bond Fund’s Class S shares on the Class’ inception date of 5/6/04 to a $10,000 investment made in an unmanaged securities index on that date. Performance for the Bond Fund’s other share classes will vary due to differences in charges and expenses. The Bond Fund’s performance in this chart and the performance table assumes the reinvestment of dividends and capital gain distributions but does not reflect the deduction of taxes that a shareholder would pay on Fund distributions or on the redemption of Fund shares.
| 4 | www.iconfunds.com | |
Table of Contents
| ICON Bond Fund | Schedule of Investments | |
| September 30, 2017 |
| Shares or Principal Amount | Value | |||||
Corporate Bonds (74.80%) | ||||||
Consumer Discretionary (5.54%) | ||||||
Dollar Tree, Inc. | $ | 250,000 | $ 263,650 | |||
Lee Enterprises, Inc. | 1,150,000 | 1,194,562 | ||||
M/I Homes, Inc. | 345,000 | 360,094 | ||||
Mattamy Group Corp. | 500,000 | 510,000 | ||||
Reliance Intermediate Holdings LP | 2,400,000 | 2,550,000 | ||||
| ||||||
| 4,878,306 | ||||||
| ||||||
Consumer Staples (6.01%) | ||||||
Darling Ingredients, Inc. | 844,000 | 875,650 | ||||
HRG Group, Inc. | 1,325,000 | 1,351,500 | ||||
Kraft Heinz Foods Co. | 2,871,000 | 3,068,046 | ||||
| ||||||
| 5,295,196 | ||||||
| ||||||
Energy (11.40%) | ||||||
Andeavor | 2,500,000 | 2,639,771 | ||||
Concho Resources, Inc. | 600,000 | 616,980 | ||||
Energy Transfer LP / Regency Energy Finance Corp. | 2,850,000 | 2,932,650 | ||||
MPLX LP | 2,500,000 | 2,572,500 | ||||
Overseas Shipholding Group, Inc. | 1,250,000 | 1,278,125 | ||||
| ||||||
| 10,040,026 | ||||||
| ||||||
Financial (19.11%) | ||||||
Berkshire Hathaway, Inc. | 1,000,000 | 1,014,818 | ||||
CBRE Services, Inc. | 2,990,000 | 3,098,079 | ||||
Credit Acceptance Corp. | 1,000,000 | 1,015,000 | ||||
GFI Group, Inc. | 2,000,000 | 2,095,000 | ||||
Greystar Real Estate Partners LLC | 550,000 | 587,125 | ||||
Infinity Property & Casualty Corp. | 640,000 | 679,581 | ||||
International Lease Finance Corp. | 1,500,000 | 1,679,106 | ||||
8.25%, 12/15/20 | 1,113,000 | 1,300,301 | ||||
Prudential Financial, Inc. | 3,200,000 | 3,352,000 | ||||
Radian Group, Inc. | 293,000 | 307,650 | ||||
| Shares or Principal Amount | Value | |||||
Financial (continued) | ||||||
Raymond James Financial, Inc. | $ | 1,500,000 | $ 1,700,042 | |||
| ||||||
| 16,828,702 | ||||||
| ||||||
Health Care (4.57%) | ||||||
Acadia Healthcare Co., Inc. | 940,000 | 973,276 | ||||
Hill-Rom Holdings, Inc. | 1,200,000 | 1,266,000 | ||||
Molina Healthcare, Inc. | 1,000,000 | 1,030,600 | ||||
Universal Health Services, Inc. | 730,000 | 755,550 | ||||
| ||||||
| 4,025,426 | ||||||
| ||||||
Industrials (15.77%) | ||||||
AECOM | 1,110,000 | 1,156,620 | ||||
Aircastle, Ltd. | 1,895,000 | 2,027,650 | ||||
Allegion PLC | 4,595,000 | 4,962,485 | ||||
Covanta Holding Corp. | 1,423,000 | 1,462,132 | ||||
EnPro Industries, Inc. | 722,000 | 753,588 | ||||
Spirit AeroSystems, Inc. | 3,392,000 | 3,524,175 | ||||
| ||||||
| 13,886,650 | ||||||
| ||||||
Information Technology (8.15%) | ||||||
Amkor Technology, Inc. | 1,000,000 | 1,033,050 | ||||
Dell International LLC / EMC Corp. | 852,000 | 941,230 | ||||
Micron Technology, Inc. | 500,000 | 555,625 | ||||
NXP BV / NXP Funding LLC | 3,050,000 | 3,278,750 | ||||
Western Digital Corp. | 1,250,000 | 1,369,375 | ||||
| ||||||
| 7,178,030 | ||||||
| ||||||
Materials (2.53%) | ||||||
FMG Resources (August 2006) Pty., Ltd. | 1,000,000 | 1,124,500 | ||||
Westlake Chemical Corp. | 1,060,000 | 1,102,400 | ||||
| ||||||
| 2,226,900 | ||||||
| ||||||
Telecommunication Services (0.24%) | ||||||
Level 3 Communications, Inc. | 200,000 | 206,500 | ||||
| ||||||
The accompanying notes are an integral part of the financial statements.
| ||
| Annual Report | September 30, 2017 | 5 | |
Table of Contents
| ICON Bond Fund | Schedule of Investments | |
| September 30, 2017 |
| Shares or Principal Amount | Value | |||||
| ||||||
Utilities (1.48%) | ||||||
DPL, Inc. | $ | 1,250,000 | $ 1,306,250 | |||
| ||||||
Total Corporate Bonds (Cost $66,051,446) | 65,871,986 | |||||
| ||||||
Convertible Corporate Bonds (4.30%) |
| |||||
Telecommunication Services (4.30%) |
| |||||
Clearwire Communications LLC / Clearwire Finance, Inc. | 3,750,000 | 3,787,500 | ||||
| ||||||
Total Convertible Corporate Bonds (Cost $3,867,927) |
| 3,787,500 | ||||
| ||||||
U.S. Treasury Obligations (3.40%) |
| |||||
U.S. Treasury Bond | 1,000,000 | 993,516 | ||||
U.S. Treasury Note | 2,000,000 | 2,000,312 | ||||
| ||||||
Total U.S. Treasury Obligations (Cost $2,977,911) | 2,993,828 | |||||
| ||||||
Preferred Stocks (6.20%) | ||||||
Diversified REITs (3.01%) | ||||||
Gramercy Property Trust, Series A | 99,897 | 2,650,267 | ||||
| ||||||
Property & Casualty Insurance (1.82%) |
| |||||
Argo Group U.S., Inc. | 63,290 | 1,596,807 | ||||
| ||||||
Reinsurance (1.37%) | ||||||
Maiden Holdings North America, Ltd. | 46,154 | 1,207,850 | ||||
| ||||||
Total Preferred Stocks (Cost $5,419,346) | 5,454,924 | |||||
| ||||||
Closed-End Mutual Funds (9.23%) |
| |||||
BlackRock Enhanced Government Fund, Inc. | 2,524 | 34,402 | ||||
Blackstone / GSO Senior Floating Rate Term Fund | 39,259 | 690,173 | ||||
Deutsche High Income Opportunities Fund, Inc. | 18,474 | 279,512 | ||||
Deutsche Multi-Market Income Trust | 13,461 | 120,611 | ||||
| Shares or Principal Amount | Value | |||||
| ||||||
Closed-End Mutual Funds (continued) |
| |||||
Deutsche Strategic Income Trust | 14,600 | $ 181,916 | ||||
Federated Premier Intermediate Municipal Income Fund(c) | 148,723 | 2,024,120 | ||||
First Trust Senior Floating Rate 2022 Target Term Fund | 55,387 | 536,700 | ||||
MFS Investment Grade Municipal Trust | 20,215 | 201,948 | ||||
Morgan Stanley Income Securities, Inc.(c) | 137,528 | 2,516,762 | ||||
Nuveen High Income December 2018 Target Term Fund | 113,861 | 1,143,165 | ||||
Nuveen High Income December 2019 Target Term Fund | 28,433 | 287,742 | ||||
Nuveen Preferred and Income 2022 Term Fund | 4,409 | 112,385 | ||||
| ||||||
Total Closed-End Mutual Funds (Cost $8,097,448) | 8,129,436 | |||||
| ||||||
Collateral for Securities on Loan (1.29%) |
| |||||
State Street Navigator Securities Lending Government Money Market Portfolio, | 1,134,685 | 1,134,685 | ||||
| ||||||
Total Collateral for Securities on Loan (Cost $1,134,685) |
| 1,134,685 | ||||
| ||||||
Total Investments (99.22%) (Cost $87,548,763) | $87,372,359 | |||||
Other Assets Less Liabilities (0.78%) |
| 692,470 | ||||
| ||||||
Net Assets (100.00%) | $88,064,829 | |||||
| ||||||
Investment Abbreviations:
LIBOR - London Interbank Offered Rate
REIT - Real Estate Investment Trust
Libor Rates:
3M US L - 3 Month LIBOR as of September 30, 2017 was 1.33%
| (a) | Security was purchased pursuant to Rule 144A under the Securities Act of 1933 and may be resold in transactions exempt from registration only to qualified institutional buyers. As of September 30, 2017, these securities had a total aggregate market value of $20,432,638. |
| (b) | All or a portion of the security was on loan as of September 30, 2017. |
The accompanying notes are an integral part of the financial statements.
| ||
| 6 | www.iconfunds.com | |
Table of Contents
| ICON Bond Fund | Schedule of Investments | |
| September 30, 2017 |
| (c) | These securities are considered, by management, to be illiquid. The aggregate value of these securities at September 30, 2017 was $8,469,274, which represent 9.62% of the Fund’s net assets. |
| (d) | Floating or variable rate security. The reference rate is described above. The Rate in effect as of September 30, 2017 is based on the reference rate plus the displayed spread as of the security’s last reset date. |
| (e) | This security has no contractual maturity date, is not redeemable and contractually pays an indefinite stream of interest. |
Credit Diversification (September 30, 2017) | ||
Baa3 | 28.32% | |
Ba1 | 9.14% | |
Baa2 | 8.69% | |
B1 | 7.27% | |
Ba2 | 6.64% | |
Ba3 | 5.67% | |
B3 | 5.41% | |
B2 | 3.43% | |
Aaa | 3.40% | |
Baa1 | 1.93% | |
Caa1 | 1.45% | |
Aa2 | 1.15% | |
| ||
Total: | 82.50% | |
| ||
Percentages are based upon U.S. Treasury obligations, corporate and convertible corporate bond investments as a percentage of net assets. Ratings based on Moody’s Investors Service, Inc.
The accompanying notes are an integral part of the financial statements.
| ||
| Annual Report | September 30, 2017 | 7 | |
Table of Contents
| ICON Equity Income Fund | Management Overview | |
| September 30, 2016 (Unaudited) |
| Q. | How did the Fund perform relative to its benchmarks? |
| A. | The ICON Equity Income Fund (the Fund) Class S shares returned 16.53% for the fiscal year ending September 30, 2017, lagging its benchmark, the S&P Composite 1500 Index, which returned 18.61% during the fiscal year. Total returns for other periods and additional Class shares as of September 30, 2017, appear in the subsequent pages of this Fund’s Management Overview. |
| Q. | What primary factors were behind the Fund’s relative performance? |
| A. | As the fiscal year began, our valuation methodology calculated an overall average value-to-price (V/P) ratio for the equity market of 1.09, meaning we believed fair value for the equity market as a whole was approximately 9% higher than where stocks were trading. While we were anticipating positive returns, the market exceeded our expectations. However, stocks with higher dividend yields (e.g. greater than 3%), did not do particularly well over the course of the fiscal year. During fiscal year 2017, S&P 1500 stocks with dividend yields between 0% and 3% returned approximately 21%, while stocks with a dividend yield greater than 3% returned only about 11%. This performance difference is, in part, a reflection of the improvement in treasury yield over the course of the year. For example, the yield on the 10-year U.S. Treasury Note increased throughout the year -- from 1.60% on September 30, 2016 to 2.33% on September 30, 2017. As fixed income yields improved, the demand for high dividend stocks as a yield alternative to fixed income investments decreased. With the Equity Income Fund tilted toward higher dividend yield, the Fund far outpaced the 11% return for stocks with dividend yields exceeding 3%, but lagged the broader market since its exposure to lower dividend yield equities was limited. Furthermore, the Fund had a fixed income position during the fiscal year. As interest rates increased, the value of these fixed income positions decreased, hindering the Fund’s performance. |
| Q. | How did the Fund’s composition affect performance? |
| A. | The Fund’s stock selection within the Financials sector was the largest detractor to the Fund’s performance relative to the benchmark. The Fund’s Financials holdings returned around 21% while the Financials Sector benchmark enjoyed a 35.2% return during fiscal year 2017. The Fund’s performance in this sector was adversely impacted by its exposure to the property & casualty insurance industry and, specifically, AmTrust Financial Services Inc. (AFSI). On February 27, 2017, AmTrust’s stock price fell over 19% when it reported it had identified “material weaknesses in [its] internal control over financial reporting”. The Fund’s AmTrust position explains much of the Fund’s Financials sector underperformance. |
The Fund faced additional headwinds with its fixed income allocation. During fiscal year 2017, we watched the overall market V/P fall below 1.00. Because this suggested to us the market was overvalued, we increased our fixed income holdings and defensive index put options. As interest rates increased, however, the value of our fixed income positions decreased. Furthermore, as the market moved higher during the year, the defensive put options lost value and negatively impacted the Fund. |
| Q. | What is the outlook for the ICON Equity Income Fund? |
| A. | As of September 30, 2017, we believe the market has an overall average V/P of 1.00, meaning stocks are generally priced at fair value under our system. Accordingly, we do not anticipate the same strong returns in the equity market in fiscal year 2018 as we saw in fiscal year 2017. We have thus decreased the Fund’s equity exposure, which now comprises approximately 85% of the Fund, with the remaining 15% allocated to fixed income, preferreds and convertible preferreds. We nonetheless still see sector opportunities based on our valuation readings. The Financials sector has a V/P of 1.13, for example, and we have increased the Fund’s Financials holdings. We will continue to monitor the equity market to find the best combination of value and dividend for our investors. |
| 8 | www.iconfunds.com | |
Table of Contents
| ICON Equity Income Fund | Management Overview | |
| September 30, 2017 (Unaudited) |
Average Annual Total Return (as of September 30, 2017)
| Inception Date | 1 Year | 5 Years | 10 Years | Since Inception | Gross Expense Ratio* | Net Expense Ratio* | ||||||||
ICON Equity Income Fund - Class S | 5/10/04 | 16.53% | 11.57% | 5.70% | 7.39% | 1.44% | 1.19% | |||||||
ICON Equity Income Fund - Class C | 11/8/02 | 15.34% | 10.45% | 4.64% | 7.45% | 2.54% | 2.19% | |||||||
ICON Equity Income Fund - Class A | 5/31/06 | 16.20% | 11.28% | 5.42% | 6.30% | 1.74% | 1.44% | |||||||
ICON Equity Income Fund - Class A | 5/31/06 | 9.52% | 9.97% | 4.80% | 5.74% | 1.74% | 1.44% | |||||||
S&P Composite 1500 Index | 18.61% | 14.29% | 7.63% | 8.96% | N/A | N/A |
Past performance is not a guarantee of future results. Information about these performance results and the comparative indexes can be found in the About This Report section. The Adviser has agreed to limit certain Fund expenses; without these limitations, returns would have been lower. The limitation provisions may be terminated in the future.
| * | Please see the most recent prospectus for details. |
Class C total returns exclude applicable sales charges. If sales charges were included returns would be lower.
Value of a $10,000 Investment (through September 30, 2017)
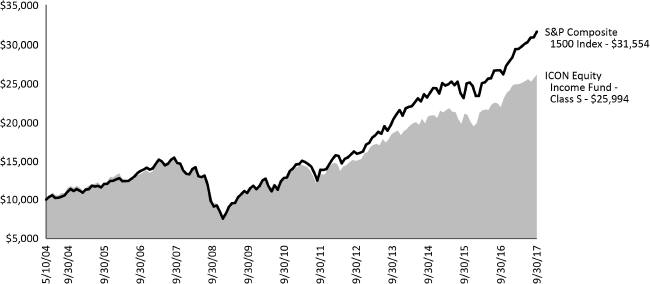
Past performance is not a guarantee of future results. The above graph compares a $10,000 investment made in the Equity Income Fund’s Class S shares on the Class’ inception date of 5/10/04 to a $10,000 investment made in an unmanaged securities index on that date. Performance for the Equity Income Fund’s other share classes will vary due to differences in charges and expenses. The Equity Income Fund’s performance in this chart and the performance table assumes the reinvestment of dividends and capital gain distributions but does not reflect the deduction of taxes that a shareholder would pay on Fund distributions or on the redemption of Fund shares.
| Annual Report | September 30, 2017 | 9 | |
Table of Contents
| ICON Equity Income Fund | Schedule of Investments | |
| September 30, 2017 |
| Shares or Principal Amount | Value | |||||
Corporate Bonds (5.38%) | ||||||
Consumer Discretionary (0.30%) | ||||||
Lee Enterprises, Inc. | $ | 250,000 | $ 259,688 | |||
| ||||||
Consumer Staples (0.32%) | ||||||
HRG Group, Inc. | 278,000 | 283,560 | ||||
| ||||||
Energy (0.94%) | ||||||
Energy Transfer LP / Regency Energy Finance Corp. | 300,000 | 308,700 | ||||
MPLX LP | 500,000 | 514,500 | ||||
| ||||||
| 823,200 | ||||||
| ||||||
Financial (0.60%) | ||||||
Prudential Financial, Inc. | 500,000 | 523,750 | ||||
| ||||||
Health Care (0.24%) | ||||||
Molina Healthcare, Inc. | 200,000 | 206,120 | ||||
| ||||||
Industrials (1.51%) | ||||||
AECOM | 200,000 | 208,400 | ||||
Spirit AeroSystems, Inc. | 1,066,000 | 1,107,538 | ||||
| ||||||
| 1,315,938 | ||||||
| ||||||
Information Technology (0.31%) | ||||||
NXP BV / NXP Funding LLC | 250,000 | 268,750 | ||||
| ||||||
Materials (0.62%) | ||||||
FMG Resources (August 2006) Pty., Ltd. | 250,000 | 281,125 | ||||
Westlake Chemical Corp. | 250,000 | 260,000 | ||||
| ||||||
| 541,125 | ||||||
| ||||||
Telecommunication Services (0.24%) | ||||||
Level 3 Communications, Inc. | 200,000 | 206,500 | ||||
| ||||||
Utilities (0.30%) | ||||||
DPL, Inc. | 250,000 | 261,250 | ||||
| ||||||
Total Corporate Bonds (Cost $4,721,537) | 4,689,881 | |||||
| ||||||
| Shares or Principal Amount | Value | |||||
Convertible Corporate Bonds (0.40%) | ||||||
Telecommunication Services (0.40%) | ||||||
Clearwire Communications LLC / Clearwire Finance, Inc. | $ | 350,000 | $ 353,500 | |||
| ||||||
Total Convertible Corporate Bonds (Cost $359,480) |
| 353,500 | ||||
| ||||||
Common Stocks (85.58%) | ||||||
Application Software (0.90%) | ||||||
Open Text Corp. | 24,200 | 781,418 | ||||
| ||||||
Auto Parts & Equipment (2.24%) | ||||||
Magna International, Inc. | 36,500 | 1,948,370 | ||||
| ||||||
Automobile Manufacturers (0.93%) | ||||||
Nissan Motor Co., Ltd., Sponsored ADR | 41,500 | 808,835 | ||||
| ||||||
Building Products (1.63%) | ||||||
Johnson Controls International PLC | 35,300 | 1,422,237 | ||||
| ||||||
Communications Equipment (1.78%) | ||||||
Motorola Solutions, Inc. | 18,300 | 1,553,121 | ||||
| ||||||
Data Processing & Outsourced Services (1.95%) | ||||||
Broadridge Financial Solutions, Inc. | 21,000 | 1,697,220 | ||||
| ||||||
Diversified Banks (4.63%) | ||||||
Bank of America Corp. | 79,200 | 2,006,928 | ||||
JPMorgan Chase & Co. | 21,300 | 2,034,363 | ||||
| ||||||
| 4,041,291 | ||||||
| ||||||
Diversified Chemicals (1.83%) | ||||||
Eastman Chemical Co. | 17,600 | 1,592,624 | ||||
| ||||||
Electric Utilities (2.80%) | ||||||
Eversource Energy | 9,900 | 598,356 | ||||
Westar Energy, Inc. | 37,100 | 1,840,160 | ||||
| ||||||
| 2,438,516 | ||||||
| ||||||
Fertilizers & Agricultural Chemicals (1.46%) | ||||||
Agrium, Inc. | 11,900 | 1,275,799 | ||||
| ||||||
Gas Utilities (1.33%) | ||||||
National Fuel Gas Co. | 20,500 | 1,160,505 | ||||
| ||||||
Homebuilding (1.25%) | ||||||
PulteGroup, Inc. | 40,000 | 1,093,200 | ||||
| ||||||
The accompanying notes are an integral part of the financial statements.
| ||
| 10 | www.iconfunds.com | |
Table of Contents
| ICON Equity Income Fund | Schedule of Investments | |
| September 30, 2017 |
| Shares or Principal Amount | Value | |||||
Hotel & Resort REITs (1.23%) | ||||||
Hospitality Properties Trust, REIT | 37,700 | $ 1,074,073 | ||||
| ||||||
Hotels, Resorts & Cruise Lines (0.73%) | ||||||
Wyndham Worldwide Corp. | 6,000 | 632,460 | ||||
| ||||||
Household Appliances (1.40%) | ||||||
Whirlpool Corp. | 6,600 | 1,217,304 | ||||
| ||||||
Housewares & Specialties (1.87%) | ||||||
Tupperware Brands Corp. | 26,300 | 1,625,866 | ||||
| ||||||
Industrial Conglomerates (1.22%) | ||||||
General Electric Co. | 43,900 | 1,061,502 | ||||
| ||||||
Integrated Oil & Gas (2.00%) | ||||||
TOTAL SA, Sponsored ADR | 32,500 | 1,739,400 | ||||
| ||||||
Integrated Telecommunication Services (1.55%) | ||||||
AT&T, Inc. | 34,400 | 1,347,448 | ||||
| ||||||
Internet Software & Services (1.59%) | ||||||
LogMeIn, Inc. | 12,600 | 1,386,630 | ||||
| ||||||
Investment Banking & Brokerage (3.11%) | ||||||
BGC Partners, Inc., Class A | 66,300 | 959,361 | ||||
Morgan Stanley | 36,400 | 1,753,388 | ||||
| ||||||
| 2,712,749 | ||||||
| ||||||
IT Consulting & Other Services (2.88%) | ||||||
DXC Technology Co. | 10,900 | 936,092 | ||||
Leidos Holdings, Inc. | 26,700 | 1,581,174 | ||||
| ||||||
| 2,517,266 | ||||||
| ||||||
Life & Health Insurance (1.55%) | ||||||
Sun Life Financial, Inc. | 33,900 | 1,349,898 | ||||
| ||||||
Managed Health Care (1.33%) | ||||||
UnitedHealth Group, Inc. | 5,900 | 1,155,515 | ||||
| ||||||
Multi-Utilities (1.20%) | ||||||
CenterPoint Energy, Inc. | 35,700 | 1,042,797 | ||||
| ||||||
Oil & Gas Equipment & Services (3.49%) | ||||||
RPC, Inc.(c) | 71,600 | 1,774,964 | ||||
U.S. Silica Holdings, Inc. | 40,600 | 1,261,442 | ||||
| ||||||
| 3,036,406 | ||||||
| ||||||
Oil & Gas Exploration & Production (6.10%) | ||||||
Diamondback Energy, Inc.(d) | 19,600 | 1,920,016 | ||||
Gulfport Energy Corp.(d) | 129,800 | 1,861,332 | ||||
SRC Energy, Inc.(d) | 158,900 | 1,536,563 | ||||
| ||||||
| 5,317,911 | ||||||
| ||||||
Oil & Gas Refining & Marketing (0.97%) | ||||||
Andeavor | 8,200 | 845,830 | ||||
| ||||||
| Shares or Principal Amount | Value | |||||
Pharmaceuticals (5.06%) | ||||||
Eli Lilly & Co. | 15,400 | $ 1,317,316 | ||||
Merck & Co., Inc. | 19,400 | 1,242,182 | ||||
Pfizer, Inc. | 51,700 | 1,845,690 | ||||
| ||||||
| 4,405,188 | ||||||
| ||||||
Property & Casualty Insurance (1.17%) | ||||||
XL Group, Ltd. | 25,800 | 1,017,810 | ||||
| ||||||
Regional Banks (5.19%) | ||||||
Fifth Third Bancorp | 58,400 | 1,634,032 | ||||
First Commonwealth Financial Corp. | 83,100 | 1,174,203 | ||||
Valley National Bancorp | 142,800 | 1,720,740 | ||||
| ||||||
| 4,528,975 | ||||||
| ||||||
Restaurants (1.22%) | ||||||
Darden Restaurants, Inc. | 13,500 | 1,063,530 | ||||
| ||||||
Semiconductor Equipment (1.96%) | ||||||
Brooks Automation, Inc. | 56,400 | 1,712,304 | ||||
| ||||||
Semiconductors (5.38%) | ||||||
Broadcom, Ltd. | 5,100 | 1,236,954 | ||||
Cypress Semiconductor Corp. | 126,200 | 1,895,524 | ||||
Intel Corp. | 41,000 | 1,561,280 | ||||
| ||||||
| 4,693,758 | ||||||
| ||||||
Soft Drinks (1.33%) | ||||||
Dr. Pepper Snapple Group, Inc. | 13,100 | 1,158,957 | ||||
| ||||||
Technology Hardware, Storage & Peripherals (4.81%) | ||||||
Apple, Inc. | 11,400 | 1,756,968 | ||||
HP, Inc. | 80,200 | 1,600,792 | ||||
Logitech International SA(c) | 22,800 | 831,288 | ||||
| ||||||
| 4,189,048 | ||||||
| ||||||
Thrifts & Mortgage Finance (1.08%) | ||||||
Dime Community Bancshares, Inc. | 43,600 | 937,400 | ||||
| ||||||
Tobacco (1.22%) | ||||||
Philip Morris International, Inc. | 9,600 | 1,065,696 | ||||
| ||||||
Water Utilities (1.24%) | ||||||
Consolidated Water Co., Ltd. | 84,496 | 1,081,549 | ||||
| ||||||
Wireless Telecommunication Services (0.97%) | ||||||
NTT DOCOMO, Inc., Sponsored ADR(c) | 37,200 | 847,788 | ||||
| ||||||
Total Common Stocks (Cost $69,160,640) |
| 74,578,194 | ||||
| ||||||
The accompanying notes are an integral part of the financial statements.
| ||
| Annual Report | September 30, 2017 | 11 | |
Table of Contents
| ICON Equity Income Fund | Schedule of Investments | |
| September 30, 2017 |
| Shares or Principal Amount | Value | |||||||
Preferred Stocks (2.14%) | ||||||||
Diversified REITs (0.79%) | ||||||||
Gramercy Property Trust, Inc., Series A | $ | 26,105 | $ | 692,566 | ||||
|
| |||||||
Property & Casualty Insurance (0.94%) |
| |||||||
Argo Group U.S., Inc. | 32,335 | 815,812 | ||||||
|
| |||||||
Reinsurance (0.41%) | ||||||||
Maiden Holdings North America, Ltd. | 13,529 | 354,054 | ||||||
|
| |||||||
Total Preferred Stocks (Cost $1,860,261) | 1,862,432 | |||||||
|
| |||||||
Convertible Preferred Stocks (0.60%) |
| |||||||
Diversified Banks (0.60%) | ||||||||
Wells Fargo & Co., Series L 7.50%(e) | 400 | 526,000 | ||||||
|
| |||||||
Total Convertible Preferred Stocks (Cost $490,412) |
| 526,000 | ||||||
|
| |||||||
Closed-End Mutual Funds (4.67%) |
| |||||||
Blackstone / GSO Senior Floating Rate Term Fund | 10,000 | 175,800 | ||||||
Deutsche High Income Opportunities Fund, Inc. | 15,582 | 235,755 | ||||||
Deutsche Multi-Market Income Trust | 67,583 | 605,544 | ||||||
Eaton Vance High Income 2021 Target Term Trust | 57,174 | 580,888 | ||||||
Federated Premier Intermediate Municipal Income Fund(f) | 37,432 | 509,449 | ||||||
Morgan Stanley Income Securities, Inc.(f) | 75,069 | 1,373,763 | ||||||
Nuveen High Income December 2018 Target Term Fund | 58,349 | 585,824 | ||||||
|
| |||||||
Total Closed-End Mutual Funds (Cost $3,983,169) |
| 4,067,023 | ||||||
|
| |||||||
Underlying Security/ Expiration Date/ Exercise Price/ Notional Amount | Contracts | Value | ||||||
Put Options | ||||||||
S&P 500 Index | 80 | $ | 7,200 | |||||
|
| |||||||
Total Put Options Purchased (Cost $149,416) | 7,200 | |||||||
|
| |||||||
| Shares or Principal Amount | Value | |||||||
Collateral for Securities on Loan (3.21%) |
| |||||||
State Street Navigator Securities | 2,793,426 | 2,793,426 | ||||||
|
| |||||||
Total Collateral for Securities on Loan (Cost $2,793,426) |
| 2,793,426 | ||||||
|
| |||||||
Total Investments (101.99%) (Cost $83,518,341) | $ | 88,877,656 | ||||||
Liabilities Less Other Assets (-1.99%) |
| (1,732,103) | ||||||
|
| |||||||
Net Assets (100.00%) | $ | 87,145,554 | ||||||
|
| |||||||
Investment Abbreviations:
ADR - American Depositary Receipt
LIBOR - London Interbank Offered Rate
REIT - Real Estate Investment Trust
Libor Rates:
3M US L - 3 Month LIBOR as of September 30, 2017 was 1.33%
| (a) | Security was purchased pursuant to Rule 144A under the Securities Act of 1933 and may be resold in transactions exempt from registration only to qualified institutional buyers. As of September 30, 2017, these securities had a total aggregate market value of $1,163,063. |
| (b) | Floating or variable rate security. The reference rate is described above. The Rate in effect as of September 30, 2017 is based on the reference rate plus the displayed spread as of the security’s last reset date. |
| (c) | All or a portion of the security was on loan as of September 30, 2017. |
| (d) | Non-income producing security. |
| (e) | This security has no contractual maturity date, is not redeemable and contractually pays an indefinite stream of interest. |
| (f) | These securities are considered, by management, to be illiquid. The aggregate value of these securities at September 30, 2017 was $2,575,777, which represent 2.96% of the Fund’s net assets. |
The accompanying notes are an integral part of the financial statements.
| ||
| 12 | www.iconfunds.com | |
Table of Contents
| ICON Equity Income Fund | Schedule of Investments | |
| September 30, 2017 |
Sector Composition (September 30, 2017) | ||||
Information Technology | 21.56% | |||
Financial | 19.28% | |||
Energy | 13.50% | |||
Consumer Discretionary | 9.94% | |||
Utilities | 6.87% | |||
Health Care | 6.63% | |||
Industrials | 4.36% | |||
Materials | 3.91% | |||
Telecommunication Services | 3.16% | |||
Consumer Staples | 2.87% | |||
Real Estate | 2.02% | |||
|
| |||
| 94.10% | ||||
|
| |||
Percentages are based upon common stocks, preferred stocks, convertible preferred stocks, corporate bonds, and convertible corporate bonds as a percentage of net assets.
Industry Composition (September 30, 2017) | ||||
Oil & Gas Exploration & Production | 6.10% | |||
Semiconductors | 5.69% | |||
Diversified Banks | 5.23% | |||
Regional Banks | 5.19% | |||
Pharmaceuticals | 5.06% | |||
Technology Hardware, Storage & Peripherals | 4.81% | |||
Oil & Gas Equipment & Services | 3.49% | |||
Investment Banking & Brokerage | 3.11% | |||
IT Consulting & Other Services | 2.88% | |||
Electric Utilities | 2.80% | |||
Auto Parts & Equipment | 2.24% | |||
Life & Health Insurance | 2.15% | |||
Property & Casualty Insurance | 2.11% | |||
Integrated Oil & Gas | 2.00% | |||
Semiconductor Equipment | 1.96% | |||
Data Processing & Outsourced Services | 1.95% | |||
Housewares & Specialties | 1.87% | |||
Diversified Chemicals | 1.83% | |||
Communications Equipment | 1.78% | |||
Building Products | 1.63% | |||
Internet Software & Services | 1.59% | |||
Managed Health Care | 1.57% | |||
Integrated Telecommunication Services | 1.55% | |||
Fertilizers & Agricultural Chemicals | 1.46% | |||
Household Appliances | 1.40% | |||
Gas Utilities | 1.33% | |||
Soft Drinks | 1.33% | |||
Aerospace & Defense | 1.27% | |||
Homebuilding | 1.25% | |||
Water Utilities | 1.24% | |||
Hotel & Resort REITs | 1.23% | |||
Tobacco | 1.22% | |||
Restaurants | 1.22% | |||
Industrial Conglomerates | 1.22% | |||
Multi-Utilities | 1.20% | |||
Thrifts & Mortgage Finance | 1.08% | |||
Other Industries (each less than 1%) | 9.06% | |||
|
| |||
| 94.10% | ||||
|
| |||
Percentages are based upon common stocks, preferred stocks, convertible preferred stocks, corporate bonds, and convertible corporate bonds as a percentage of net assets.
The accompanying notes are an integral part of the financial statements.
| ||
| Annual Report | September 30, 2017 | 13 | |
Table of Contents
| ICON Fund | Management Overview | |
| September 30, 2017 (Unaudited) |
| Q. | How did the Fund perform relative to its benchmark? |
| A. | The ICON Fund (the Fund) Class S returned 32.67% for the fiscal year ending September 30, 2017, while its benchmark, the S&P Composite 1500 Index, returned 18.61%. Total returns for other periods and additional Class shares as of September 30, 2017, appear in the subsequent pages of this Fund’s Management Overview. |
| Q. | What primary factors were behind the Fund’s relative performance? |
| A. | A year ago in this Overview, we noted our optimism regarding the continuation of the now 8 1⁄2 year old bull market. Expecting the market to advance during fiscal year 2017, the Fund held minimal cash to participate in the potential upside. Sector weights were also a primary factor contributing to the Fund’s outperformance of its benchmark. The largest sector weights were Financials, Information Technology, Consumer Discretionary, Health Care, Materials and Industrials. With Financials, Information Technology, Industrials, Materials and Health Care ranking as the top five S&P sector performers over the 12-month period, these overweight positions contributed positively to the Fund’s relative performance. The Fund held just a 2.11% weight in Real Estate and did not hold any stocks in four of the 11 S&P sectors, avoiding Energy altogether, which was particularly rewarding. |
| Q. | How did the Fund’s composition affect performance? |
| A. | The five biggest contributors to Fund performance were Bank of America Corp., SVB Financial Group, Celgene Corp., Fifth Third Bancorp and Skyworks Solutions, Inc. Bank of America Corp., SVB Financial Group and Fifth Third Bancorp are in the Financials sector. Celgene Corp. is in the Health Care sector while Skyworks Solutions, Inc. is in the Information Technology sector. |
Only three stocks posted negative returns while held in the Fund and detracted from performance: Ulta Beauty, Inc., Ashland Global Holdings Inc., and Cavium, Inc. Ulta Beauty, Inc. is in the Consumer Discretionary sector. Ashland Global Holdings Inc. is in the Materials sector while Cavium, Inc. is in the Information Technology sector. Ashland Global Holdings Inc. has been sold. The other two securities remain in the portfolio.
| Q. | What is your investment outlook for the overall market? |
| A. | As of September 30, 2017, ICON’s valuation model shows a value-to-price (V/P) ratio of 1.00 for the overall market. In other words, we believe stock prices, on average, are equal to our estimate of fair value. We are not seeing over-pricing and other indications or behaviors typical of market peaks. In terms of upside potential we do not expect the excess returns available when the broad market is priced at a discount to fair value. |
| ||
| 14 | www.iconfunds.com | |
Table of Contents
| ICON Fund | Management Overview | |
| September 30, 2017 (Unaudited) |
Average Annual Total Return (as of September 30, 2017)
| Inception Date | 1 Year | 5 Years | 10 Years | Since Inception | Gross Expense Ratio* | Net Expense Ratio* | ||||||||
ICON Fund - Class S | 5/6/04 | 32.67% | 10.64% | 2.29% | 5.01% | 1.12% | 1.12% | |||||||
ICON Fund - Class C | 11/28/00 | 31.14% | 9.42% | 1.47% | 4.07% | 2.41% | 2.26% | |||||||
ICON Fund - Class A | 5/31/06 | 32.23% | 10.24% | 1.81% | 2.53% | 1.67% | 1.51% | |||||||
ICON Fund - Class A (including | 5/31/06 | 24.65% | 8.95% | 1.20% | 2.00% | 1.67% | 1.51% | |||||||
S&P Composite 1500 Index | 18.61% | 14.29% | 7.63% | 8.74% | N/A | N/A |
Past performance is not a guarantee of future results. Information about these performance results and the comparative indexes can be found in the About This Report section. The Since Inception performance results for Class C shares include returns for certain time periods that were restarted as of June 8, 2004.
* Please see the most recent prospectus for details.
Class C total returns exclude applicable sales charges. If sales charges were included returns would be lower.
Value of a $10,000 Investment (through September 30, 2017)
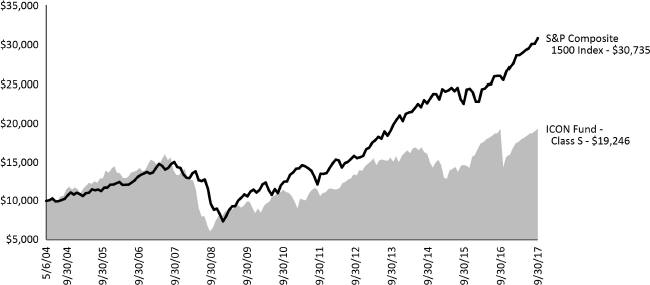
Past performance is not a guarantee of future results. The above graph compares a $10,000 investment made in the ICON Fund’s Class S shares on the Class’ inception date of 5/6/04 to a $10,000 investment made in an unmanaged securities index on that date. Performance for the ICON Fund’s other share classes will vary due to differences in charges and expenses. The ICON Fund’s performance in this chart and the performance table assumes the reinvestment of dividends and capital gain distributions but does not reflect the deduction of taxes that a shareholder would pay on Fund distributions or on the redemption of Fund shares.
| ||
| Annual Report | September 30, 2017 | 15 | |
Table of Contents
| ICON Fund | Schedule of Investments | |
| September 30, 2017 |
| Shares or Principal Amount | Value | |||||||
Common Stocks (99.58%) | ||||||||
Application Software (4.12%) |
| |||||||
Adobe Systems, Inc.(a) | 14,000 | $ | 2,088,520 | |||||
|
| |||||||
Auto Parts & Equipment (2.50%) |
| |||||||
Magna International, Inc. | 23,800 | 1,270,444 | ||||||
|
| |||||||
Biotechnology (8.45%) |
| |||||||
Celgene Corp.(a) | 20,400 | 2,974,728 | ||||||
Vertex Pharmaceuticals, Inc.(a) | 8,600 | 1,307,544 | ||||||
|
| |||||||
| 4,282,272 | ||||||||
|
| |||||||
Building Products (3.58%) |
| |||||||
Masco Corp. | 46,600 | 1,817,866 | ||||||
|
| |||||||
Construction Materials (5.97%) |
| |||||||
Eagle Materials, Inc. | 7,700 | 821,590 | ||||||
Martin Marietta Materials, Inc. | 10,700 | 2,206,661 | ||||||
|
| |||||||
| 3,028,251 | ||||||||
|
| |||||||
Data Processing & Outsourced Services (2.12%) |
| |||||||
Total System Services, Inc. | 16,400 | 1,074,200 | ||||||
|
| |||||||
Diversified Banks (9.10%) |
| |||||||
Bank of America Corp. | 182,000 | 4,611,880 | ||||||
|
| |||||||
Home Improvement Retail (6.10%) |
| |||||||
Home Depot, Inc. | 18,900 | 3,091,284 | ||||||
|
| |||||||
Homebuilding (4.18%) |
| |||||||
PulteGroup, Inc. | 77,500 | 2,118,075 | ||||||
|
| |||||||
Hotels, Resorts & Cruise Lines (5.29%) |
| |||||||
Royal Caribbean Cruises, Ltd. | 11,500 | 1,363,210 | ||||||
Wyndham Worldwide Corp. | 12,500 | 1,317,625 | ||||||
|
| |||||||
| 2,680,835 | ||||||||
|
| |||||||
Household Appliances (3.13%) |
| |||||||
Whirlpool Corp. | 8,600 | 1,586,184 | ||||||
|
| |||||||
Internet Software & Services (3.49%) |
| |||||||
CoStar Group, Inc.(a) | 2,700 | 724,275 | ||||||
Facebook, Inc., Class A(a) | 6,100 | 1,042,307 | ||||||
|
| |||||||
| 1,766,582 | ||||||||
|
| |||||||
Multi-line Insurance (1.97%) |
| |||||||
American International Group, Inc. | 16,300 | 1,000,657 | ||||||
|
| |||||||
Paper Packaging (2.93%) |
| |||||||
Avery Dennison Corp. | 15,100 | 1,484,934 | ||||||
|
| |||||||
Pharmaceuticals (4.41%) |
| |||||||
Jazz Pharmaceuticals PLC(a) | 15,300 | 2,237,625 | ||||||
|
| |||||||
| Shares or Principal Amount | Value | |||||||
Real Estate Services (2.29%) |
| |||||||
CBRE Group, Inc., Class A(a) | 30,700 | $ | 1,162,916 | |||||
|
| |||||||
Regional Banks (12.34%) |
| |||||||
Fifth Third Bancorp | 92,300 | 2,582,554 | ||||||
Signature Bank(a) | 16,600 | 2,125,464 | ||||||
SVB Financial Group(a) | 8,300 | 1,552,847 | ||||||
|
| |||||||
| 6,260,865 | ||||||||
|
| |||||||
Semiconductor Equipment (2.29%) |
| |||||||
Applied Materials, Inc. | 22,300 | 1,161,607 | ||||||
|
| |||||||
Semiconductors (14.38%) |
| |||||||
Broadcom, Ltd. | 2,400 | 582,096 | ||||||
Cavium, Inc.(a) | 15,500 | 1,022,070 | ||||||
Micron Technology, | 31,600 | 1,242,828 | ||||||
Qorvo, Inc.(a) | 20,300 | 1,434,804 | ||||||
Skyworks Solutions, Inc. | 29,500 | 3,006,050 | ||||||
|
| |||||||
| 7,287,848 | ||||||||
|
| |||||||
Specialty Stores (0.94%) |
| |||||||
Ulta Beauty, Inc.(a) | 2,100 | 474,726 | ||||||
|
| |||||||
Total Common Stocks (Cost $ 37,337,901) | 50,487,571 | |||||||
|
| |||||||
Total Investments (99.58%) (Cost $ 37,337,901) | $ | 50,487,571 | ||||||
Other Assets Less Liabilities (0.42%) |
| 215,104 | ||||||
|
| |||||||
Net Assets (100.00%) | $ | 50,702,675 | ||||||
|
| |||||||
| (a) | Non-income producing security. |
The accompanying notes are an integral part of the financial statements.
| ||
| 16 | www.iconfunds.com | |
Table of Contents
| ICON Fund | Schedule of Investments | |
| September 30, 2017 |
Sector Composition (September 30, 2017) | ||||
Information Technology | 26.40% | |||
Financial | 23.41% | |||
Consumer Discretionary | 22.14% | |||
Health Care | 12.86% | |||
Materials | 8.90% | |||
Industrials | 3.58% | |||
Real Estate | 2.29% | |||
|
| |||
| 99.58% | ||||
|
| |||
Percentages are based upon common stocks as a percentage of net assets.
Industry Composition (September 30, 2017) | ||||
Semiconductors | 14.38% | |||
Regional Banks | 12.34% | |||
Diversified Banks | 9.10% | |||
Biotechnology | 8.45% | |||
Home Improvement Retail | 6.10% | |||
Construction Materials | 5.97% | |||
Hotels, Resorts & Cruise Lines | 5.29% | |||
Pharmaceuticals | 4.41% | |||
Homebuilding | 4.18% | |||
Application Software | 4.12% | |||
Building Products | 3.58% | |||
Internet Software & Services | 3.49% | |||
Household Appliances | 3.13% | |||
Paper Packaging | 2.93% | |||
Auto Parts & Equipment | 2.50% | |||
Real Estate Services | 2.29% | |||
Semiconductor Equipment | 2.29% | |||
Data Processing & Outsourced Services | 2.12% | |||
Multi-line Insurance | 1.97% | |||
Other Industries (each less than 1%) | 0.94% | |||
|
| |||
| 99.58% | ||||
|
| |||
Percentages are based upon common stocks as a percentage of net assets.
The accompanying notes are an integral part of the financial statements.
| ||
| Annual Report | September 30, 2017 | 17 | |
Table of Contents
| ICON Long/Short Fund | Management Overview | |
| September 30, 2017 (Unaudited) |
| Q. | How did the Fund perform relative to its benchmark? |
| A. | The ICON Long/Short Fund (the Fund) Class S returned 34.39% for the fiscal year ending September 30, 2017, while its benchmark, the S&P Composite 1500 Index, returned 18.61%. Total returns for other periods and additional Class shares as of September 30, 2017, appear in the subsequent pages of this Fund’s Management Overview. |
| Q. | What primary factors were behind the Fund’s relative performance? |
| A. | A year ago in this Overview, we noted our optimism regarding the continuation of the now 8 1⁄2 year old bull market. Expecting the market to advance during fiscal year 2017, the Fund held minimal cash to participate in the potential upside. There was a significant inflow of cash into the Fund in late March 2017 that was gradually invested over the next four months. Sector weights also contributed to the Fund’s outperformance of its benchmark. The largest sector weights were Financials, Information Technology, Consumer Discretionary, Health Care, Materials and Industrials. With Financials, Information Technology, Industrials, Materials and Health Care ranking as the top five S&P sector performers over the 12-month period, these overweight positions contributed positively to the Fund’s relative performance. The Fund held just a 0.33% weight in Real Estate and did not own stocks in four of the 11 S&P sectors, avoiding Energy altogether, which was particularly rewarding. |
| Q. | How did the Fund’s composition affect performance? |
| A. | Because we saw considerable upside market potential during fiscal year 2017, the Fund held no short positions. We believe our long positions served the Fund well this year. The five biggest contributors to Fund performance were Bank of America Corp., SVB Financial Group, Wyndham Worldwide Corp., Skyworks Solutions, Inc. and Celgene Corp. Bank of America Corp. and SVB Financial Group are in the Financials sector. Wyndham Worldwide Corp. is in the Consumer Discretionary sector, Skyworks Solutions, Inc. is in the Information Technology sector and Celgene Corp. is in the Health Care sector. |
Only five stocks posted negative returns while held in the Fund and detracted from performance: Ulta Beauty, Inc., Amazon.com Inc., Ashland Global Holdings Inc., Universal Health Services, Inc. and Cavium, Inc. Ulta Beauty, Inc. and Amazon.com Inc. are in the Consumer Discretionary sector, while the other three are in Materials, Financials and Information Technology, respectively. Amazon.com Inc. and Ashland Global Holdings Inc. have been sold. The other three remain in the portfolio. |
| Q. | What is your investment outlook for the overall market? |
| A. | As of September 30, 2017, ICON’s valuation model shows a value-to-price (V/P) ratio of 1.00 for the overall market. In other words, we believe stock prices, on average, are equal to our estimate of fair value. We are not seeing over-pricing and other indications or behaviors typical of market peaks. In terms of upside potential we do not expect the excess returns available when the broad market is priced at a discount to fair value. |
| 18 | www.iconfunds.com | |
Table of Contents
| ICON Long/Short Fund | Management Overview | |
| September 30, 2017 (Unaudited) |
Average Annual Total Return (as of September 30, 2017)
| �� | Inception Date | 1 Year | 5 Years | 10 Years | Since Inception | Gross Expense Ratio* | Net Expense Ratio* | |||||||
ICON Long/Short Fund - Class S | 5/6/04 | 34.39% | 11.53% | 3.57% | 5.62% | 1.63% | 1.28% | |||||||
ICON Long/Short Fund - Class C | 10/17/02 | 32.91% | 10.36% | 2.49% | 6.03% | 2.76% | 2.33% | |||||||
ICON Long/Short Fund - Class A | 5/31/06 | 33.98% | 11.20% | 3.26% | 3.96% | 1.95% | 1.58% | |||||||
ICON Long/Short Fund - Class A | 5/31/06 | 26.26% | 9.89% | 2.65% | 3.42% | 1.95% | 1.58% | |||||||
S&P Composite 1500 Index | 18.61% | 14.29% | 7.63% | 8.74% | N/A | N/A |
Past performance is not a guarantee of future results. Information about these performance results and the comparative indexes can be found in the About This Report section. The Adviser has agreed to limit certain Fund expenses; without these limitations, returns would have been lower. The limitation provisions may be terminated in the future.
| * | Please see the most recent prospectus for details. |
Class C total returns exclude applicable sales charges. If sales charges were included returns would be lower.
Value of a $10,000 Investment (through September 30, 2017)
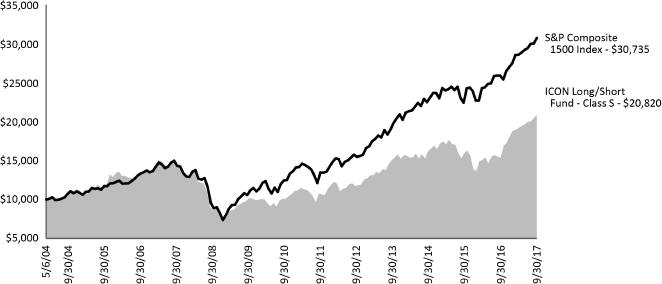
Past performance is not a guarantee of future results. The above graph compares a $10,000 investment made in the Long/Short Fund’s Class S shares on the Class’ inception date of 5/6/04 to a $10,000 investment made in an unmanaged securities index on that date. Performance for the Long/Short Fund’s other share classes will vary due to differences in charges and expenses. The Long/Short Fund’s performance in this chart and the performance table assumes the reinvestment of dividends and capital gain distributions but does not reflect the deduction of taxes that a shareholder would pay on Fund distributions or on the redemption of Fund shares.
| Annual Report | September 30, 2017 | 19 | |
Table of Contents
| ICON Long/Short Fund | Schedule of Investments | |
| September 30, 2017 |
| Shares or Principal Amount | Value | |||||
Common Stocks (99.29%) | ||||||
Application Software (2.73%) |
| |||||
Adobe Systems, Inc.(a) | 4,200 | $ 626,556 | ||||
| ||||||
Auto Parts & Equipment (1.37%) |
| |||||
Magna International, Inc. | 5,900 | 314,942 | ||||
| ||||||
Biotechnology (7.89%) |
| |||||
Celgene Corp.(a) | 7,300 | 1,064,486 | ||||
Vertex Pharmaceuticals, | 4,900 | 744,996 | ||||
| ||||||
| 1,809,482 | ||||||
| ||||||
Building Products (3.08%) |
| |||||
Masco Corp. | 18,100 | 706,081 | ||||
| ||||||
Construction Materials (6.17%) |
| |||||
Eagle Materials, Inc. | 6,100 | 650,870 | ||||
Martin Marietta Materials, Inc. | 3,700 | 763,051 | ||||
| ||||||
| 1,413,921 | ||||||
| ||||||
Data Processing & Outsourced Services (7.16%) | ||||||
Mastercard, Inc., Class A | 8,000 | 1,129,600 | ||||
Total System Services, Inc. | 7,800 | 510,900 | ||||
| ||||||
| 1,640,500 | ||||||
| ||||||
Diversified Banks (8.81%) |
| |||||
Bank of America Corp. | 70,700 | 1,791,538 | ||||
JPMorgan Chase & Co. | 2,400 | 229,224 | ||||
| ||||||
| 2,020,762 | ||||||
| ||||||
Health Care Facilities (1.21%) |
| |||||
Universal Health Services, Inc., Class B | 2,500 | 277,350 | ||||
| ||||||
Home Improvement Retail (2.35%) |
| |||||
Home Depot, Inc. | 3,300 | 539,748 | ||||
| ||||||
Homebuilding (4.21%) |
| |||||
PulteGroup, Inc. | 35,300 | 964,749 | ||||
| ||||||
Hotels, Resorts & Cruise Lines (6.72%) | ||||||
Royal Caribbean Cruises, Ltd. | 6,600 | 782,364 | ||||
Wyndham Worldwide Corp. | 7,200 | 758,952 | ||||
| ||||||
| 1,541,316 | ||||||
| ||||||
Household Appliances (3.06%) |
| |||||
Whirlpool Corp. | 3,800 | 700,872 | ||||
| ||||||
Insurance Brokers (2.68%) |
| |||||
Arthur J Gallagher & Co. | 10,000 | 615,500 | ||||
| ||||||
Internet Software & Services (1.70%) |
| |||||
SINA Corp.(a) | 3,400 | 389,810 | ||||
| ||||||
Multi-line Insurance (1.45%) |
| |||||
American International Group, Inc. | 5,400 | 331,506 | ||||
| ||||||
| Shares or Principal Amount | Value | |||||
Pharmaceuticals (4.14%) | ||||||
Jazz Pharmaceuticals | 6,500 | $ 950,625 | ||||
| ||||||
Regional Banks (14.59%) |
| |||||
Fifth Third Bancorp | 29,400 | 822,612 | ||||
First Commonwealth Financial Corp. | 35,500 | 501,615 | ||||
Signature Bank(a) | 9,200 | 1,177,968 | ||||
SVB Financial Group(a) | 4,500 | 841,905 | ||||
| ||||||
| 3,344,100 | ||||||
| ||||||
Semiconductor Equipment (1.70%) |
| |||||
Applied Materials, Inc. | 7,500 | 390,675 | ||||
| ||||||
Semiconductors (16.99%) |
| |||||
Broadcom, Ltd. | 900 | 218,286 | ||||
Cavium, Inc.(a) | 9,500 | 626,430 | ||||
Cypress Semiconductor Corp. | 48,800 | 732,976 | ||||
Micron Technology, Inc.(a) | 18,900 | 743,337 | ||||
Qorvo, Inc.(a) | 6,300 | 445,284 | ||||
Skyworks Solutions, Inc. | 11,100 | 1,131,090 | ||||
| ||||||
| 3,897,403 | ||||||
| ||||||
Specialty Stores (1.28%) |
| |||||
Ulta Beauty, Inc.(a) | 1,300 | 293,878 | ||||
| ||||||
Total Common Stocks (Cost $17,195,213) | 22,769,776 | |||||
| ||||||
Total Investments (99.29%) (Cost $17,195,213) | $22,769,776 | |||||
Other Assets Less Liabilities (0.71%) |
| 163,498 | ||||
| ||||||
Net Assets (100.00%) | $22,933,274 | |||||
| ||||||
| (a) | Non-income producing security. |
The accompanying notes are an integral part of the financial statements.
| ||
| 20 | www.iconfunds.com | |
Table of Contents
| ICON Long/Short Fund | Schedule of Investments | |
| September 30, 2017 |
Sector Composition (September 30, 2017) | ||||
Information Technology | 30.28% | |||
Financial | 27.53% | |||
Consumer Discretionary | 18.99% | |||
Health Care | 13.24% | |||
Materials | 6.17% | |||
Industrials | 3.08% | |||
|
| |||
| 99.29% | ||||
|
| |||
Percentages are based upon common stocks as a percentage of net assets.
Industry Composition (September 30, 2017) | ||||
Semiconductors | 16.99% | |||
Regional Banks | 14.59% | |||
Diversified Banks | 8.81% | |||
Biotechnology | 7.89% | |||
Data Processing & Outsourced Services | 7.16% | |||
Hotels, Resorts & Cruise Lines | 6.72% | |||
Construction Materials | 6.17% | |||
Homebuilding | 4.21% | |||
Pharmaceuticals | 4.14% | |||
Building Products | 3.08% | |||
Household Appliances | 3.06% | |||
Application Software | 2.73% | |||
Insurance Brokers | 2.68% | |||
Home Improvement Retail | 2.35% | |||
Internet Software & Services | 1.70% | |||
Semiconductor Equipment | 1.70% | |||
Multi-line Insurance | 1.45% | |||
Auto Parts & Equipment | 1.37% | |||
Specialty Stores | 1.28% | |||
Health Care Facilities | 1.21% | |||
|
| |||
| 99.29% | ||||
|
| |||
Percentages are based upon common stocks as a percentage of net assets.
The accompanying notes are an integral part of the financial statements.
| ||
| Annual Report | September 30, 2017 | 21 | |
Table of Contents
| ICON Opportunities Fund | Management Overview | |
| September 30, 2017 (Unaudited) |
| Q. | How did the Fund perform relative to its benchmark? |
| A. | The ICON Opportunities Fund (the Fund) returned 29.75% for the fiscal year ending September 30, 2017, while its benchmark, the S&P Small-Cap 600 Total Return Index, returned 21.05%. Total returns for other periods as of September 2017, appear in the subsequent pages of this Fund’s Management Overview. |
| Q. | What primary factors were behind the Fund’s relative performance? |
| A. | A year ago in this Overview, we noted our optimism regarding the continuation of the now 8 1⁄2 year old bull market. Expecting the market to advance during fiscal year 2017, the Fund held minimal cash to participate in the potential upside. Sector weights were also a primary factor contributing to the Fund’s outperformance of its benchmark. The largest sector weights were Information Technology, Consumer Discretionary, Financials, Health Care, Industrials and Materials. With Financials, Information Technology, Industrials, Materials and Health Care ranking as the top five S&P sector performers over the 12-month period, these overweight positions contributed positively to the Fund’s relative performance. The Fund did not own stocks in five of the 11 S&P sectors: Energy, Consumer Staples, Telecommunication Services, Real Estate or Utilities. Avoiding Energy and Consumer Staples, the two lowest performing S&P sectors (indeed, Energy showed negative returns for fiscal year 2017), was particularly rewarding. |
| Q. | How did the Fund’s composition affect performance? |
| A. | The five stocks contributing the most to returns were IPG Photonics Corp., Coherent, Inc., Teradyne, Inc., Modine Manufacturing Co. and Nutrisystems, Inc. The first three are in the Information Technology sector while the last two are in Consumer Discretionary. |
Five stocks with negative returns while held in the Fund detracted the most from performance: Finisar Corp, Acadia Healthcare Co., Inc., Impax Laboratories, Inc., Fabrinet and CPI Card Group Inc. Finisar Corp, Fabrinet and CPI Card Group Inc. are in the Information Technology sector while Acadia Healthcare Co., Inc. and Impax Laboratories, Inc. are in Healthcare. Acadia Healthcare Co., Inc. and CPI Card Group Inc. have been sold. As this Annual Report goes to press, the other three remain in the portfolio. |
| Q. | What is your investment outlook for the overall market? |
| A. | As of September 30, 2017, ICON’s valuation model shows a value-to-price (V/P) ratio of 1.00 for the overall market. In other words, we believe stock prices, on average, are equal to our estimate of fair value. We are not seeing over-pricing and other indications or behaviors typical of market peaks. In terms of upside potential, we do not expect the excess returns available when the broad market is priced at a discount to fair value. |
| 22 | www.iconfunds.com | |
Table of Contents
| ICON Opportunities Fund | Management Overview | |
| September 30, 2017 (Unaudited) |
Average Annual Total Return (as of September 30, 2017)
| Inception Date | 1 Year | 5 Year | Since Inception | Gross Expense Ratio* | Net Expense Ratio* | |||||||
ICON Opportunities Fund | 9/28/12 | 29.75% | 14.68% | 14.67% | 1.53% | 1.51% | ||||||
S&P Small Cap Total Return Index | 21.05% | 15.60% | 15.58% | N/A | N/A |
Past performance is not a guarantee of future results. Information about these performance results and the comparative indexes can be found in the About This Report section. The Adviser has agreed to limit certain Fund expenses; without these limitations, returns would have been lower. The limitation provisions may be terminated in the future.
| * | Please see the most recent prospectus for details. |
Value of a $10,000 Investment (through September 30, 2017)
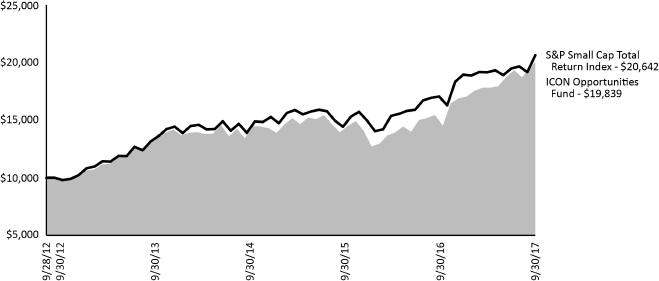
Past performance is not a guarantee of future results. The above graph compares a $10,000 investment made in the Opportunities Fund on the inception date of 9/28/12 to a $10,000 investment made in an unmanaged securities index on that date. The Opportunities Fund’s performance in this chart and the performance table assumes the reinvestment of dividends and capital gain distributions but does not reflect the deduction of taxes that a shareholder would pay on Fund distributions or on the redemption of Fund shares.
| Annual Report | September 30, 2017 | 23 | |
Table of Contents
| ICON Opportunities Fund | Schedule of Investments | |
| September 30, 2017 |
| Shares or Principal Amount | Value | |||||
Common Stocks (99.63%) | ||||||
Aerospace & Defense (1.85%) | ||||||
Hexcel Corp. | 6,255 | $ 359,162 | ||||
| ||||||
Auto Parts & Equipment (8.37%) | ||||||
Modine Manufacturing | 53,148 | 1,023,099 | ||||
Tower International, Inc. | 22,000 | 598,400 | ||||
| ||||||
| 1,621,499 | ||||||
| ||||||
Automobile Manufacturers (1.77%) | ||||||
Winnebago Industries, Inc. | 7,648 | 342,248 | ||||
| ||||||
Biotechnology (2.51%) | ||||||
Ligand Pharmaceuticals, Inc.(a) | 3,575 | 486,736 | ||||
| ||||||
Building Products (8.92%) | ||||||
Armstrong World Industries, Inc.(a) | 3,900 | 199,875 | ||||
Builders FirstSource, | 43,500 | 782,565 | ||||
PGT Innovations, Inc.(a) | 49,900 | 746,005 | ||||
| ||||||
| 1,728,445 | ||||||
| ||||||
Communications Equipment (5.75%) | ||||||
ARRIS International PLC(a) | 5,700 | 162,393 | ||||
CalAmp Corp.(a) | 19,000 | 441,750 | ||||
Finisar Corp.(a) | 23,000 | 509,910 | ||||
| ||||||
| 1,114,053 | ||||||
| ||||||
Electronic Equipment & Instruments (4.71%) | ||||||
Coherent, Inc.(a) | 2,984 | 701,747 | ||||
OSI Systems, Inc.(a) | 2,300 | 210,151 | ||||
| ||||||
| 911,898 | ||||||
| ||||||
Electronic Manufacturing Services (7.24%) | ||||||
Fabrinet(a) | 13,400 | 496,604 | ||||
IPG Photonics Corp.(a) | 4,900 | 906,794 | ||||
| ||||||
| 1,403,398 | ||||||
| ||||||
Health Care Equipment (2.46%) | ||||||
LivaNova PLC(a) | 6,800 | 476,408 | ||||
| ||||||
Health Care Services (1.98%) | ||||||
BioTelemetry, Inc.(a) | 11,600 | 382,800 | ||||
| ||||||
Homebuilding (7.18%) | ||||||
KB Home | 35,000 | 844,200 | ||||
M/I Homes, Inc.(a) | 20,400 | 545,292 | ||||
| ||||||
| 1,389,492 | ||||||
| ||||||
Internet & Direct Marketing Retail (3.67%) | ||||||
Nutrisystem, Inc. | 12,700 | 709,930 | ||||
| ||||||
Internet Software & Services (2.33%) | ||||||
j2 Global, Inc. | 6,114 | 451,702 | ||||
| ||||||
Leisure Products (3.32%) | ||||||
Brunswick Corp. | 11,500 | 643,655 | ||||
| ||||||
Shares or Principal Amount | Value | |||||
Life & Health Insurance (1.25%) | ||||||
CNO Financial Group, Inc. | 10,400 | $ 242,736 | ||||
| ||||||
Life Sciences Tools & Services (1.67%) | ||||||
Charles River Laboratories International, Inc.(a) | 3,000 | 324,060 | ||||
| ||||||
Paper Packaging (1.88%) | ||||||
Avery Dennison Corp. | 3,700 | 363,858 | ||||
| ||||||
Pharmaceuticals (3.33%) | ||||||
Impax Laboratories, Inc.(a) | 16,255 | 329,977 | ||||
Innoviva, Inc.(a) | 22,329 | 315,286 | ||||
| ||||||
| 645,263 | ||||||
| ||||||
Property & Casualty Insurance (1.41%) | ||||||
United Insurance Holdings Corp. | 16,700 | 272,210 | ||||
| ||||||
Regional Banks (8.33%) | ||||||
Bank of the Ozarks, Inc. | 6,700 | 321,935 | ||||
First Commonwealth Financial Corp. | 40,000 | 565,200 | ||||
First Midwest Bancorp, Inc. | 6,800 | 159,256 | ||||
Webster Financial Corp. | 10,800 | 567,540 | ||||
| ||||||
| 1,613,931 | ||||||
| ||||||
Semiconductor Equipment (5.81%) | ||||||
Photronics, Inc.(a) | 30,700 | 271,695 | ||||
Teradyne, Inc. | 22,909 | 854,277 | ||||
| ||||||
| 1,125,972 | ||||||
| ||||||
Semiconductors (9.11%) | ||||||
CEVA, Inc.(a) | 6,800 | 291,040 | ||||
Cypress Semiconductor Corp. | 19,400 | 291,388 | ||||
Inphi Corp.(a)(b) | 5,100 | 202,419 | ||||
MACOM Technology Solutions Holdings, | 10,594 | 472,598 | ||||
Microsemi Corp.(a) | 9,800 | 504,504 | ||||
| ||||||
| 1,761,949 | ||||||
| ||||||
Thrifts & Mortgage Finance (4.78%) | ||||||
BofI Holding, Inc.(a)(b) | 18,000 | 512,460 | ||||
Essent Group, Ltd.(a) | 10,200 | 413,100 | ||||
| ||||||
| 925,560 | ||||||
| ||||||
Total Common Stocks (Cost $13,949,171) |
| 19,296,965 | ||||
| ||||||
Collateral for Securities on Loan (6.27%) | ||||||
State Street Navigator Securities Lending Government Money Market Portfolio, 7-Day Yield 1.01% | 1,213,802 | 1,213,802 | ||||
| ||||||
Total Collateral for Securities on Loan (Cost $1,213,802) |
| 1,213,802 | ||||
| ||||||
The accompanying notes are an integral part of the financial statements.
| ||
| 24 | www.iconfunds.com | |
Table of Contents
| ICON Opportunities Fund | Schedule of Investments | |
| September 30, 2017 |
| Value | ||
Total Investments (105.90%) (Cost $15,162,973) | $20,510,767 | |
Liabilities Less Other Assets (-5.90%) | (1,141,365) | |
| ||
Net Assets (100.00%) | $19,369,402 | |
| ||
| (a) | Non-income producing security. |
| (b) | All or a portion of the security was on loan as of September 30, 2017. |
| Sector Composition (September 30, 2017) | ||||
Information Technology | 34.95% | |||
Consumer Discretionary | 24.31% | |||
Financial | 15.77% | |||
Health Care | 11.95% | |||
Industrials | 10.77% | |||
Materials | 1.88% | |||
|
| |||
| 99.63% | ||||
|
| |||
Percentages are based upon common stocks as a percentage of net assets.
| Industry Composition (September 30, 2017) | ||||
Semiconductors | 9.11% | |||
Building Products | 8.92% | |||
Auto Parts & Equipment | 8.37% | |||
Regional Banks | 8.33% | |||
Electronic Manufacturing Services | 7.24% | |||
Homebuilding | 7.18% | |||
Semiconductor Equipment | 5.81% | |||
Communications Equipment | 5.75% | |||
Thrifts & Mortgage Finance | 4.78% | |||
Electronic Equipment & Instruments | 4.71% | |||
Internet & Direct Marketing Retail | 3.67% | |||
Pharmaceuticals | 3.33% | |||
Leisure Products | 3.32% | |||
Biotechnology | 2.51% | |||
Health Care Equipment | 2.46% | |||
Internet Software & Services | 2.33% | |||
Health Care Services | 1.98% | |||
Paper Packaging | 1.88% | |||
Aerospace & Defense | 1.85% | |||
Automobile Manufacturers | 1.77% | |||
Life Sciences Tools & Services | 1.67% | |||
Property & Casualty Insurance | 1.41% | |||
Life & Health Insurance | 1.25% | |||
|
| |||
| 99.63% | ||||
|
| |||
Percentages are based upon common stocks as a percentage of net assets.
The accompanying notes are an integral part of the financial statements.
| ||
| Annual Report | September 30, 2017 | 25 | |
Table of Contents
| ICON Risk-Managed Balanced Fund | Management Overview | |
| September 30, 2017 (Unaudited) |
| Q. | How did the Fund perform relative to its benchmarks? |
| A. | The Risk-Managed Balanced Fund (the Fund) Class S shares returned 10.53% for the fiscal year ended September 30, 2017. The S&P Composite 1500 Index returned 18.61% and the Balanced Blended Benchmark returned 11.30%. The Balanced Blended Benchmark is based on a weighting of 60% S&P 1500 Index and 40% Barclays Capital U.S. Universal Index, rebalanced monthly. Total returns for other periods and additional Class shares as of September 30, 2017, appear in the subsequent pages of this Fund’s Management Overview. |
| Q. | What primary factors influenced the Fund’s relative performance during the period? |
| A. | According to our valuation methodology, we began fiscal year 2017 with an overall average value-to-price (V/P) ratio for the domestic market of 1.09, indicating we saw the domestic market priced roughly 9% below our estimate of fair value. Based on this outlook, we positioned the Fund with an approximate 55% equities / 45% fixed income allocation. Additionally, we implemented a hedge strategy by buying out-of-the-money S&P 500 put options in an attempt to reduce the effects of market volatility on the Fund. From the beginning of the fiscal year through the end of December 2016, the equity market produced a return of approximately 4% and the bond market fell by approximately 3%. Much of this movement was tied to the so-called “Trump Trade”, in which economically sensitive segments of the market were bought aggressively at the conclusion of the presidential election – the result of investors anticipating a more pro-growth and infrastructure oriented platform. While the Fund was able to mitigate losses in the bond market and participate in this rally, equity under-allocation and hedging losses resulted in underperformance relative to the benchmark in the last quarter of 2016. |
Entering calendar year 2017, our equity valuation model viewed the overall broad domestic market as trading approximately 4% above our estimate of fair value. With low to negative return expectations, the Fund maintained an underweight position in equities over the course of the 9-month time frame. Furthermore, the Fund’s cash position likewise dragged on performance due to solid market returns in 2017. |
The Fund’s fixed income holdings performed well with the bond market trading in a relatively narrow range. We continued our focus on credit spread risk with a particular focus on shorter duration. Our fixed income volatility remains relatively low and this contributed favorably to the Fund’s risk adjusted returns. Our use of closed-end fund arbitrage continued to be rewarded, as a number of these positions converted to open-end funds or liquidated, capturing the original discount to net asset value at which they had been acquired. This strategy has been a consistent contributor to alpha generation. Given our positioning, we tend to expect underperformance when rates fall aggressively and relative outperformance when rates rise. |
Ultimately, over fiscal year 2017, while the Fund was able to produce positive risk adjusted returns, the Fund’s limited exposure to the equity market coupled with losses from its options positions resulted in underperformance relative to the benchmark. |
| Q. | How did the Fund’s composition affect performance? |
| A. | Focusing on the equity portion of the Fund, the largest sector relative contributors to performance over fiscal year 2017 were the Industrials, Energy, and Real Estate sectors. Sectors that relatively detracted from Fund performance include the Health Care, Consumer Discretionary, and Financials sectors. Of these three, the Health Care sector produced the largest negative total effect due to the Fund’s combination of both overweight positions and underperforming equity selections. |
Moving to individual stock performance within the Fund, the largest positive contributors to performance were Orbital ATK, Inc., IPG Photonics Corp., SVB Financial Group, Broadcom, Ltd., and Mastercard, Inc. The five largest detractors from performance were Hertz Global Holdings, Inc., McKesson Corp., Hanesbrands, Inc., Allergan PLC, and O’Reilly Automotive, Inc. |
Focusing on the fixed income portion of the Fund, we maintained a lower overall duration relative to the fixed income benchmark which helped over the course of the fiscal year as rates on the US 10-year Treasury increased from 1.60% to 2.33%. Additionally, the Fund produced strong bottom up bond selections and allocations towards both the preferred and closed-end fund segments of the market also helping relative performance. |
The hedge structure of the Fund detracted from relative performance over the course of the fiscal year as an overall lack of volatility led to put option contracts losing value due to time decay. However, we did make an investment decision to reduce the Fund’s option-based hedge profile and utilized an increased cash balance which slightly reduced losses from this segment of the Fund. |
| Q. | What is your investment outlook? |
| A. | At the conclusion of fiscal year 2017, we believe the equity market has an overall average V/P ratio of 1.00, suggesting the market is trading in line with our estimate of fair value. With relatively muted return expectations, the Fund begins the new fiscal year with an underweight exposure to the equity market and increased cash position. Additionally, the Fund has a few out-of-the-money S&P 500 put options to provide additional protection should a volatility event occur. In the fixed income portion of the Fund, we continue to be selective in our individual bond holdings as credit spreads in numerous segments of the bond market are at levels we believe are excessively tight. We continue to see opportunities in the closed-end fund and preferred segments of the market and are continually looking for new ideas in both spaces. As always, we look to value as our primary guide and will adjust our positioning as market conditions dictate. |
| 26 | www.iconfunds.com | |
Table of Contents
| ICON Risk-Managed Balanced Fund | Management Overview | |
| September 30, 2017 (Unaudited) |
Average Annual Total Return (as of September 30, 2017)
| Inception Date | 1 Year | 5 Years | 10 Years | Since Inception | Gross Expense Ratio* | Net Expense Ratio* | ||||||||||||||||||||
ICON Risk-Managed Balanced Fund - Class S | 5/6/04 | 10.53% | 6.50% | 3.36% | 4.43% | 1.36% | 1.29% | |||||||||||||||||||
ICON Risk-Managed Balanced Fund - Class C | 11/21/02 | 9.44% | 5.46% | 2.32% | 4.44% | 2.38% | 2.29% | |||||||||||||||||||
ICON Risk-Managed Balanced Fund - Class A | 5/31/06 | 10.29% | 6.26% | 3.12% | 3.87% | 1.69% | 1.54% | |||||||||||||||||||
ICON Risk-Managed Balanced Fund - Class A | 5/31/06 | 3.96% | 5.01% | 2.51% | 3.32% | 1.69% | 1.54% | |||||||||||||||||||
S&P Composite 1500 Index | 18.61% | 14.29% | 7.63% | 8.74% | N/A | N/A | ||||||||||||||||||||
Past performance is not a guarantee of future results. Information about these performance results and the comparative indexes can be found in the About This Report section. The Adviser has agreed to limit certain Fund expenses; without these limitations, returns would have been lower. The limitation provisions may be terminated in the future.
| * | Please see the most recent prospectus for details. |
Class C total returns exclude applicable sales charges. If sales charges were included returns would be lower.
Value of a $10,000 Investment (through September 30, 2017)
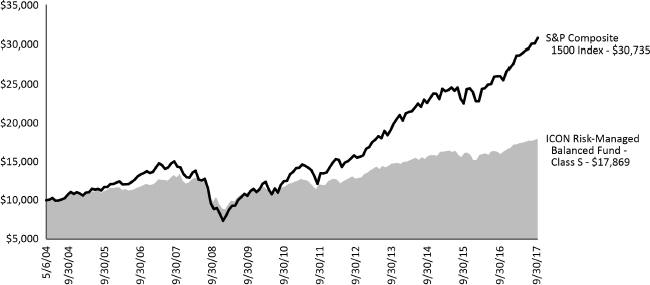
Past performance is not a guarantee of future results. The above graph compares a $10,000 investment made in the Risk-Managed Balanced Fund’s Class S shares on the Class’ inception date of 5/6/04 to a $10,000 investment made in an unmanaged securities index on that date. Performance for the Risk-Managed Balanced Fund’s other share classes will vary due to differences in charges and expenses. The Risk-Managed Balanced Fund’s performance in this chart and the performance table assumes the reinvestment of dividends and capital gain distributions but does not reflect the deduction of taxes that a shareholder would pay on Fund distributions or on the redemption of Fund shares.
| Annual Report | September 30, 2017 | 27 | |
Table of Contents
| ICON Risk-Managed Balanced Fund | Schedule of Investments | |
| September 30, 2017 |
| Shares or Principal Amount | Value | |||||
Corporate Bonds (24.09%) | ||||||
Consumer Discretionary (2.02%) | ||||||
Dollar Tree, Inc. | $ | 250,000 | $ 263,650 | |||
Lee Enterprises, Inc. | 200,000 | 207,750 | ||||
Mattamy Group Corp. | 100,000 | 102,000 | ||||
Reliance Intermediate Holdings LP | 200,000 | 212,500 | ||||
| ||||||
| 785,900 | ||||||
| ||||||
Consumer Staples (1.09%) | ||||||
Darling Ingredients, Inc. | 100,000 | 103,750 | ||||
Kraft Heinz Foods Co. | 300,000 | 320,590 | ||||
| ||||||
| 424,340 | ||||||
| ||||||
Energy (2.99%) | ||||||
Andeavor | 250,000 | 263,977 | ||||
Concho Resources, Inc. | 100,000 | 102,830 | ||||
Energy Transfer LP / Regency Energy Finance Corp. | 250,000 | 257,250 | ||||
MPLX LP | 400,000 | 411,600 | ||||
Overseas Shipholding Group, Inc. | 125,000 | 127,813 | ||||
| ||||||
| 1,163,470 | ||||||
| ||||||
Financial (8.55%) | ||||||
Berkshire Hathaway, Inc. | 450,000 | 456,668 | ||||
CBRE Services, Inc. | 385,000 | 398,916 | ||||
Citigroup, Inc. | 250,000 | 303,581 | ||||
GFI Group, Inc. | 150,000 | 157,125 | ||||
International Lease Finance Corp. | 300,000 | 335,821 | ||||
Prudential Financial, Inc. | 500,000 | 523,750 | ||||
Raymond James Financial, Inc. | 300,000 | 340,008 | ||||
RBC U.S.A. Holdco Corp. | 378,000 | 409,807 | ||||
SAFG Retirement Services, Inc. | 326,000 | 402,290 | ||||
| ||||||
| 3,327,966 | ||||||
| ||||||
Health Care (0.53%) | ||||||
Hill-Rom Holdings, Inc. | 100,000 | 105,500 | ||||
| Shares or Principal Amount | Value | |||||
Health Care (continued) | ||||||
Molina Healthcare, Inc. | $ | 100,000 | $ 103,060 | |||
| ||||||
| 208,560 | ||||||
| ||||||
Industrials (4.28%) | ||||||
AECOM | 250,000 | 260,500 | ||||
Aircastle, Ltd. | 200,000 | 214,000 | ||||
Allegion PLC | 540,000 | 583,187 | ||||
Covanta Holding Corp. | 89,000 | 91,448 | ||||
Spirit AeroSystems, Inc. | 500,000 | 519,483 | ||||
| ||||||
| 1,668,618 | ||||||
| ||||||
Information Technology (2.85%) | ||||||
Amkor Technology, Inc. | 100,000 | 103,305 | ||||
Corning, Inc. | 150,000 | 187,590 | ||||
Micron Technology, Inc. | 200,000 | 222,250 | ||||
NXP BV / NXP Funding LLC | 300,000 | 322,500 | ||||
Western Digital Corp. | 250,000 | 273,875 | ||||
| ||||||
| 1,109,520 | ||||||
| ||||||
Materials (0.72%) | ||||||
FMG Resources (August 2006) Pty., Ltd. | 250,000 | 281,125 | ||||
| ||||||
Real Estate (0.39%) | ||||||
Select Income REIT | 150,000 | 151,514 | ||||
| ||||||
Utilities (0.67%) | ||||||
DPL, Inc. | 250,000 | 261,250 | ||||
| ||||||
Total Corporate Bonds (Cost $9,418,783) | 9,382,263 | |||||
| ||||||
Convertible Corporate Bonds (1.30%) | ||||||
Telecommunication Services (1.30%) | ||||||
Clearwire Communications LLC / Clearwire Finance, Inc. | 500,000 | 505,000 | ||||
| ||||||
Total Convertible Corporate Bonds (Cost $511,684) |
| 505,000 | ||||
| ||||||
The accompanying notes are an integral part of the financial statements.
| ||
| 28 | www.iconfunds.com | |
Table of Contents
| ICON Risk-Managed Balanced Fund | Schedule of Investments | |
| September 30, 2017 |
| Shares or Principal Amount | Value | |||||||
U.S. Treasury Obligations (15.61%) | ||||||||
U.S. Treasury Bill | $ | 1,151,300 | $ | 1,151,231 | ||||
U.S. Treasury Bond | 800,000 | 794,812 | ||||||
U.S. Treasury Bond | 1,000,000 | 935,977 | ||||||
U.S. Treasury Note | 1,800,000 | 1,797,891 | ||||||
U.S. Treasury Note | 400,000 | 398,250 | ||||||
U.S. Treasury Note | 1,000,000 | 1,000,156 | ||||||
|
| |||||||
Total U.S. Treasury Obligations (Cost $6,091,624) |
| 6,078,317 | ||||||
|
| |||||||
Common Stocks (45.26%) | ||||||||
Aerospace & Defense (0.69%) | ||||||||
Orbital ATK, Inc. | 695 | 92,546 | ||||||
Rockwell Collins, Inc. | 620 | 81,040 | ||||||
Spirit AeroSystems Holdings, Inc., Class A | 1,200 | 93,264 | ||||||
|
| |||||||
| 266,850 | ||||||||
|
| |||||||
Application Software (0.41%) | ||||||||
CDK Global, Inc. | 2,500 | 157,725 | ||||||
|
| |||||||
Asset Management & Custody Banks (0.28%) | ||||||||
Invesco, Ltd. | 3,100 | 108,624 | ||||||
|
| |||||||
Auto Parts & Equipment (0.69%) | ||||||||
Magna International, Inc. | 5,000 | 266,900 | ||||||
|
| |||||||
Automotive Retail (0.57%) | ||||||||
AutoZone, Inc.(f) | 120 | 71,413 | ||||||
O’Reilly Automotive, Inc.(f) | 700 | 150,759 | ||||||
|
| |||||||
| 222,172 | ||||||||
|
| |||||||
Biotechnology (1.23%) | ||||||||
AbbVie, Inc. | 500 | 44,430 | ||||||
Celgene Corp.(f) | 1,500 | 218,730 | ||||||
Ligand Pharmaceuticals, Inc.(f) | 500 | 68,075 | ||||||
Shire PLC, ADR | 1,000 | 153,140 | ||||||
|
| |||||||
| 484,375 | ||||||||
|
| |||||||
Brewers (0.10%) | ||||||||
Molson Coors Brewing Co., Class B | 500 | 40,820 | ||||||
|
| |||||||
Broadcasting (0.18%) | ||||||||
CBS Corp., Class B | 1,200 | 69,600 | ||||||
|
| |||||||
Building Products (1.20%) | ||||||||
Johnson Controls International PLC | 6,800 | 273,972 | ||||||
| Shares or Principal Amount | Value | |||||||
Building Products (continued) | ||||||||
Masco Corp. | 5,000 | $ | 195,050 | |||||
|
| |||||||
| 469,022 | ||||||||
|
| |||||||
Cable & Satellite (0.26%) | ||||||||
Comcast Corp., Class A | 2,600 | 100,048 | ||||||
|
| |||||||
Commercial Printing (0.51%) | ||||||||
Deluxe Corp. | 2,700 | 196,992 | ||||||
|
| |||||||
Commodity Chemicals (0.25%) | ||||||||
LyondellBasell Industries NV, Class A | 1,000 | 99,050 | ||||||
|
| |||||||
Construction & Engineering (0.77%) |
| |||||||
MasTec, Inc.(f) | 6,500 | 301,600 | ||||||
|
| |||||||
Construction Machinery & Heavy Trucks (0.24%) | ||||||||
Allison Transmission Holdings, Inc. | 2,500 | 93,825 | ||||||
|
| |||||||
Consumer Finance (1.39%) | ||||||||
Discover Financial Services | 8,400 | 541,632 | ||||||
|
| |||||||
Data Processing & Outsourced Services (2.34%) | ||||||||
Mastercard, Inc., Class A | 3,300 | 465,960 | ||||||
Visa, Inc., Class A | 4,200 | 442,008 | ||||||
|
| |||||||
| 907,968 | ||||||||
|
| |||||||
Distillers & Vintners (0.26%) | ||||||||
Constellation Brands, Inc., Class A | 500 | 99,725 | ||||||
|
| |||||||
Diversified Banks (0.46%) | ||||||||
Bank of America Corp. | 7,000 | 177,380 | ||||||
|
| |||||||
Drug Retail (1.18%) | ||||||||
CVS Health Corp. | 4,200 | 341,544 | ||||||
Walgreens Boots Alliance, Inc. | 1,500 | 115,830 | ||||||
|
| |||||||
| 457,374 | ||||||||
|
| |||||||
Electric Utilities (0.38%) | ||||||||
NextEra Energy, Inc. | 1,000 | 146,550 | ||||||
|
| |||||||
Electronic Manufacturing Services (1.47%) | ||||||||
Fabrinet(f) | 6,200 | 229,772 | ||||||
IPG Photonics Corp.(f) | 593 | 109,741 | ||||||
TE Connectivity, Ltd. | 2,800 | 232,568 | ||||||
|
| |||||||
| 572,081 | ||||||||
|
| |||||||
Gold (0.56%) | ||||||||
Cia de Minas Buenaventura SAA, ADR | 17,000 | 217,430 | ||||||
|
| |||||||
Health Care Equipment (0.78%) | ||||||||
Boston Scientific Corp.(f) | 4,500 | 131,265 | ||||||
Edwards Lifesciences Corp.(f) | 500 | 54,655 | ||||||
Zimmer Biomet Holdings, Inc. | 1,000 | 117,090 | ||||||
|
| |||||||
| 303,010 | ||||||||
|
| |||||||
The accompanying notes are an integral part of the financial statements.
| ||
| Annual Report | September 30, 2017 | 29 | |
Table of Contents
| ICON Risk-Managed Balanced Fund | Schedule of Investments | |
| September 30, 2017 |
| Shares or Principal Amount | Value | |||
Health Care Facilities (0.99%) | ||||
HCA Healthcare, Inc.(f) | 2,500 | $ 198,975 | ||
Universal Health Services, Inc., Class B | 1,700 | 188,598 | ||
| ||||
| 387,573 | ||||
| ||||
Home Entertainment Software (0.27%) | ||||
Activision Blizzard, Inc. | 700 | 45,157 | ||
Electronic Arts, Inc.(f) | 500 | 59,030 | ||
| ||||
| 104,187 | ||||
| ||||
Home Improvement Retail (0.45%) | ||||
Lowe’s Cos., Inc. | 2,200 | 175,868 | ||
| ||||
Hotels, Resorts & Cruise Lines (0.42%) | ||||
Royal Caribbean Cruises, Ltd. | 500 | 59,270 | ||
Wyndham Worldwide Corp. | 1,000 | 105,410 | ||
| ||||
| 164,680 | ||||
| ||||
Household Appliances (0.24%) | ||||
Whirlpool Corp. | 500 | 92,220 | ||
| ||||
Housewares & Specialties (0.60%) | ||||
Newell Brands, Inc. | 5,500 | 234,685 | ||
| ||||
Industrial Machinery (0.23%) | ||||
Snap-on, Inc. | 600 | 89,406 | ||
| ||||
Internet Software & Services (1.96%) | ||||
Alphabet, Inc., Class C(f) | 201 | 192,781 | ||
Facebook, Inc., Class A(f) | 2,300 | 393,001 | ||
LogMeIn, Inc. | 1,600 | 176,080 | ||
| ||||
| 761,862 | ||||
| ||||
Investment Banking & Brokerage (0.73%) | ||||
Goldman Sachs Group, Inc. | 1,200 | 284,628 | ||
| ||||
IT Consulting & Other Services (0.37%) | ||||
Cognizant Technology Solutions Corp., Class A | 2,000 | 145,080 | ||
| ||||
Leisure Products (0.72%) | ||||
Brunswick Corp. | 5,000 | 279,850 | ||
| ||||
Life & Health Insurance (0.47%) | ||||
Lincoln National Corp. | 2,500 | 183,700 | ||
| ||||
Life Sciences Tools & Services (0.58%) | ||||
Thermo Fisher Scientific, Inc. | 1,200 | 227,040 | ||
| ||||
Managed Health Care (0.65%) | ||||
Aetna, Inc. | 1,000 | 159,010 | ||
Cigna Corp. | 500 | 93,470 | ||
| ||||
| 252,480 | ||||
| ||||
Movies & Entertainment (1.46%) | ||||
Time Warner, Inc. | 1,500 | 153,675 | ||
Twenty-First Century Fox, Inc., Class A | 9,000 | 237,420 | ||
| Shares or Principal Amount | Value | |||
Movies & Entertainment (continued) | ||||
Walt Disney Co. | 1,800 | $177,426 | ||
| ||||
| 568,521 | ||||
| ||||
Multi-line Insurance (0.55%) | ||||
American International Group, Inc. | 3,500 | 214,865 | ||
| ||||
Multi-Sector Holdings (1.13%) | ||||
Berkshire Hathaway, Inc., Class B(f) | 2,400 | 439,968 | ||
| ||||
Multi-Utilities (0.97%) | ||||
CMS Energy Corp. | 3,200 | 148,224 | ||
Sempra Energy | 2,000 | 228,260 | ||
| ||||
| 376,484 | ||||
| ||||
Oil & Gas Equipment & Services (1.22%) | ||||
Schlumberger, Ltd. | 2,800 | 195,328 | ||
U.S. Silica Holdings, Inc.(b) | 9,000 | 279,630 | ||
| ||||
| 474,958 | ||||
| ||||
Oil & Gas Exploration & Production (2.83%) | ||||
Cimarex Energy Co. | 3,100 | 352,377 | ||
Diamondback Energy, Inc.(f) | 3,500 | 342,860 | ||
Range Resources Corp. | 2,500 | 48,925 | ||
SRC Energy, Inc.(f) | 37,000 | 357,790 | ||
| ||||
| 1,101,952 | ||||
| ||||
Oil & Gas Refining & Marketing (0.72%) | ||||
Marathon Petroleum Corp. | 5,000 | 280,400 | ||
| ||||
Packaged Foods & Meats (0.81%) | ||||
Tyson Foods, Inc., Class A | 4,500 | 317,025 | ||
| ||||
Paper Packaging (0.72%) | ||||
Graphic Packaging Holding Co. | 20,000 | 279,000 | ||
| ||||
Pharmaceuticals (2.71%) | ||||
Allergan PLC | 2,100 | 430,395 | ||
Eli Lilly & Co. | 1,200 | 102,648 | ||
Jazz Pharmaceuticals PLC(f) | 2,000 | 292,500 | ||
Pfizer, Inc. | 2,800 | 99,960 | ||
Roche Holding AG, Sponsored ADR | 4,000 | 128,000 | ||
| ||||
| 1,053,503 | ||||
| ||||
Property & Casualty Insurance (0.51%) | ||||
XL Group, Ltd. | 5,000 | 197,250 | ||
| ||||
Railroads (0.86%) | ||||
Canadian Pacific Railway, Ltd. | 2,000 | 336,060 | ||
| ||||
Real Estate Services (0.29%) | ||||
CBRE Group, Inc., Class A(f) | 3,000 | 113,640 | ||
| ||||
Regional Banks (1.52%) | ||||
KeyCorp | 9,000 | 169,380 | ||
Signature Bank(f) | 2,600 | 332,904 | ||
The accompanying notes are an integral part of the financial statements.
| ||
| 30 | www.iconfunds.com | |
Table of Contents
| ICON Risk-Managed Balanced Fund | Schedule of Investments | |
| September 30, 2017 |
| Shares or Principal Amount | Value | |||||
Regional Banks (continued) | ||||||
SVB Financial Group(f) | 500 | $ 93,545 | ||||
| ||||||
| 595,829 | ||||||
| ||||||
Restaurants (0.12%) | ||||||
McDonald’s Corp. | 300 | 47,004 | ||||
| ||||||
Semiconductors (2.02%) | ||||||
Broadcom, Ltd. | 2,000 | 485,080 | ||||
Cavium, Inc.(f) | 3,000 | 197,820 | ||||
Skyworks Solutions, Inc. | 1,000 | 101,900 | ||||
| ||||||
| 784,800 | ||||||
| ||||||
Soft Drinks (0.21%) | ||||||
Monster Beverage Corp.(f) | 1,500 | 82,875 | ||||
| ||||||
Technology Hardware, Storage & Peripherals (0.67%) | ||||||
Apple, Inc. | 1,700 | 262,004 | ||||
| ||||||
Tires & Rubber (0.51%) | ||||||
Goodyear Tire & Rubber Co. | 6,000 | 199,500 | ||||
| ||||||
Trading Companies & Distributors (0.26%) | ||||||
Air Lease Corp. | 2,401 | 102,331 | ||||
| ||||||
Wireless Telecommunication Services (0.29%) | ||||||
T-Mobile U.S., Inc.(f) | 1,800 | 110,988 | ||||
| ||||||
| Total Common Stocks (Cost $15,255,881) | 17,622,969 | |||||
| ||||||
Preferred Stocks (2.10%) | ||||||
Diversified Banks (0.33%) | ||||||
Wells Fargo & Co., Series V 6.00%(g) | 4,952 | 130,980 | ||||
| ||||||
Diversified REITs (0.69%) | ||||||
Gramercy Property Trust, Series A 7.13%(c)(g) | 10,081 | 267,449 | ||||
| ||||||
Property & Casualty Insurance (0.62%) | ||||||
Argo Group U.S., Inc. 6.50%, 09/15/42 | 9,523 | 240,265 | ||||
| ||||||
Reinsurance (0.46%) | ||||||
Maiden Holdings North America, Ltd. | 6,794 | 177,799 | ||||
| ||||||
| Total Preferred Stocks (Cost $822,336) | 816,493 | |||||
| ||||||
| Shares or Principal Amount | Value | |||||
Closed-End Mutual Funds (6.82%) | ||||||
Alpine Total Dynamic Dividend Fund | 12,021 | $ 108,189 | ||||
Asia Pacific Fund, Inc. | 4,353 | 60,420 | ||||
Blackstone / GSO Senior Floating Rate Term Fund | 7,221 | 126,945 | ||||
Clough Global Opportunities Fund | 1,500 | 16,740 | ||||
Deutsche High Income Opportunities Fund, Inc. | 4,661 | 70,521 | ||||
Deutsche Multi-Market Income Trust | 45,019 | 403,370 | ||||
Eaton Vance High Income 2021 Target Term Trust | 14,057 | 142,819 | ||||
Federated Premier Intermediate Municipal Income Fund(c) | 23,077 | 314,078 | ||||
First Trust Senior Floating Rate 2022 Target Term Fund | 4,073 | 39,467 | ||||
Lazard Global Total Return and Income Fund, Inc. | 2,872 | 48,135 | ||||
Lazard World Dividend & Income Fund, Inc. | 1,584 | 17,947 | ||||
Madison Covered Call & Equity Strategy Fund | 41,590 | 326,481 | ||||
Madison Strategic Sector Premium Fund | 13,858 | 166,573 | ||||
MFS Investment Grade Municipal Trust | 5,675 | 56,693 | ||||
Morgan Stanley Emerging Markets Fund, Inc. | 300 | 5,232 | ||||
Morgan Stanley Income Securities, Inc.(c) | 27,489 | 503,049 | ||||
Nuveen High Income December 2018 Target Term Fund | 17,721 | 177,919 | ||||
Nuveen High Income December 2019 Target Term Fund | 7,122 | 72,075 | ||||
| ||||||
| Total Closed-End Mutual Funds (Cost $2,599,304) | 2,656,653 | |||||
| ||||||
Exchange Traded Funds (1.00%) | ||||||
iShares Currency Hedged MSCI Eurozone ETF(b) | 6,500 | 195,715 | ||||
iShares Europe ETF | 4,100 | 192,167 | ||||
| ||||||
| Total Exchange Traded Funds (Cost $354,053) | 387,882 | |||||
| ||||||
The accompanying notes are an integral part of the financial statements.
| ||
| Annual Report | September 30, 2017 | 31 | |
Table of Contents
| ICON Risk-Managed Balanced Fund | Schedule of Investments | |
| September 30, 2017 |
| Underlying Security/Expiration Date/Exercise Price/ Notional Amount | Contracts | Value | ||||
Put Options Purchased | ||||||
S&P 500 Index | 15 | $ 1,350 | ||||
| ||||||
Total Put Options Purchased (Cost $41,526) | 1,350 | |||||
| ||||||
| Shares or Principal Amount | Value | |||||
Collateral for Securities on Loan (1.40%) |
| |||||
State Street Navigator Securities Lending Government Money Market Portfolio, | 546,525 | 546,525 | ||||
| ||||||
Total Collateral for Securities on Loan (Cost $546,525) |
| 546,525 | ||||
| ||||||
Total Investments (97.58%) (Cost $35,641,716) | $37,997,452 | |||||
Other Assets Less Liabilities (2.42%) |
| 942,107 | ||||
| ||||||
Net Assets (100.00%) | $38,939,559 | |||||
| ||||||
Investment Abbreviations:
ADR - American Depositary Receipt
LIBOR - London Interbank Offered Rate
REIT - Real Estate Investment Trust
Libor Rates:
3M US L - 3 Month LIBOR as of September 30, 2017 was 1.33%
| (a) | Security was purchased pursuant to Rule 144A under the Securities Act of 1933 and may be resold in transactions exempt from registration only to qualified institutional buyers. As of September 30, 2017, these securities had a total aggregate market value of $2,330,840. |
| (b) | All or a portion of the security was on loan as of September 30, 2017. |
| (c) | These securities are considered, by management, to be illiquid. The aggregate value of these securities at September 30, 2017 was $1,212,389, which represent 3.11% of the Fund’s net assets. |
| (d) | Floating or variable rate security. The reference rate is described above. The Rate in effect as of September 30, 2017 is based on the reference rate plus the displayed spread as of the security’s last reset date. |
| (e) | Rate shown represents the bond equivalent yield to maturity at date of purchase. |
| (f) | Non-income producing security. |
| (g) | This security has no contractual maturity date, is not redeemable and contractually pays an indefinite stream of interest. |
| Sector Composition (September 30, 2017) | ||||
Financials | 17.00% | |||
Government | 15.61% | |||
Information Technology | 12.36% | |||
Industrials | 9.04% | |||
Consumer Discretionary | 8.24% | |||
Energy | 7.76% | |||
Health Care | 7.47% | |||
Consumer Staples | 3.65% | |||
Materials | 2.25% | |||
Utilities | 2.02% | |||
Telecommunication Services | 1.59% | |||
Real Estate | 1.37% | |||
| 88.36% | ||||
Percentages are based upon common stocks, preferred stocks, corporate bonds, convertible corporate bonds, and U.S. Treasury obligations as a percentage of net assets.
The accompanying notes are an integral part of the financial statements.
| ||
| 32 | www.iconfunds.com | |
Table of Contents
| ICON Risk-Managed Balanced Fund | Schedule of Investments | |
| September 30, 2017 |
| Industry Composition (September 30, 2017) | ||||
Sovereigns | 15.61 | % | ||
Semiconductors | 3.42 | % | ||
Oil & Gas Exploration & Production | 3.09 | % | ||
Pharmaceuticals | 2.71 | % | ||
Building Products | 2.70 | % | ||
Regional Banks | 2.57 | % | ||
Data Processing & Outsourced Services | 2.34 | % | ||
Multi-Sector Holdings | 2.30 | % | ||
Aerospace & Defense | 2.02 | % | ||
Investment Banking & Brokerage | 2.01 | % | ||
Internet Software & Services | 1.96 | % | ||
Life & Health Insurance | 1.82 | % | ||
Diversified Banks | 1.57 | % | ||
Electronic Manufacturing Services | 1.47 | % | ||
Movies & Entertainment | 1.46 | % | ||
Construction & Engineering | 1.44 | % | ||
Oil & Gas Refining & Marketing | 1.40 | % | ||
Oil & Gas Storage & Transportation | 1.39 | % | ||
Consumer Finance | 1.39 | % | ||
Technology Hardware, Storage & Peripherals | 1.37 | % | ||
Wireless Telecommunications Services | 1.30 | % | ||
Biotechnology | 1.23 | % | ||
Oil & Gas Equipment & Services | 1.22 | % | ||
Drug Retail | 1.18 | % | ||
Property & Casualty Insurance | 1.13 | % | ||
Diversified REITs | 1.08 | % | ||
Health Care Equipment | 1.05 | % | ||
Financial Services | 1.03 | % | ||
Real Estate | 1.03 | % | ||
Other Industries (each less than 1%) | 24.07 | % | ||
| 88.36 | % | |||
Percentages are based upon common stocks, preferred stocks, corporate bonds, convertible corporate bonds, and U.S. Treasury obligations as a percentage of net assets.
| Credit Diversification (September 30, 2017) | ||||
Aaa | 15.60 | % | ||
Baa3 | 7.83 | % | ||
Baa1 | 3.17 | % | ||
Baa2 | 3.13 | % | ||
Ba1 | 2.35 | % | ||
Ba2 | 1.63 | % | ||
Ba3 | 1.61 | % | ||
B3 | 1.30 | % | ||
Aa2 | 1.17 | % | ||
A3 | 1.05 | % | ||
B1 | 1.03 | % | ||
B2 | 0.80 | % | ||
Caa1 | 0.33 | % | ||
Total: | 41.00 | % | ||
Percentages are based upon U.S. Treasury obligations, corporate and convertible corporate bond investments as a percentage of net assets. Ratings based on Moody’s Investors Service, Inc.
The accompanying notes are an integral part of the financial statements.
| ||
| Annual Report | September 30, 2017 | 33 | |
Table of Contents
| ICON Diversified Funds | Statements of Assets and Liabilities | |
| September 30, 2017 |
| ICON Bond Fund | ICON Equity Income Fund | ICON Fund | ||||||||||
Assets | ||||||||||||
Investments, at cost | $ | 87,548,763 | $ | 83,518,341 | $ | 37,337,901 | ||||||
|
| |||||||||||
Investments, at value(a) | 87,372,359 | 88,877,656 | 50,487,571 | |||||||||
Cash and cash equivalents | 1,276,458 | 649,878 | – | |||||||||
Foreign currency, at value (Cost $–, $10,036 and $–, respectively) | – | 10,046 | – | |||||||||
Receivables: | ||||||||||||
Investments sold | 587,966 | 1,032,355 | 383,892 | |||||||||
Fund shares sold | 129,865 | 158,393 | 32,927 | |||||||||
Expense reimbursements due from Adviser | 36,784 | 44,497 | 1,665 | |||||||||
Interest | 1,056,763 | 71,254 | – | |||||||||
Dividends | 55,316 | 446,724 | 30,775 | |||||||||
Foreign tax reclaims | – | 7,311 | – | |||||||||
Other assets | 14,810 | 18,199 | 13,102 | |||||||||
|
| |||||||||||
Total assets | 90,530,321 | 91,316,313 | 50,949,932 | |||||||||
|
| |||||||||||
Liabilities | ||||||||||||
Payables: | ||||||||||||
Payable for collateral received on securities loaned | 1,134,685 | 2,793,426 | – | |||||||||
Loan payable, at value (Cost $–, $– and $108,660) | – | – | 108,660 | |||||||||
Investments purchased | 1,147,085 | 1,063,824 | – | |||||||||
Fund shares redeemed | 39,643 | 115,962 | 44,721 | |||||||||
Distributions due to shareholders | 25,564 | 41,830 | – | |||||||||
Advisory fees | 43,275 | 52,638 | 30,793 | |||||||||
Transfer agent fees | 14,353 | 33,729 | 14,489 | |||||||||
Fund accounting fees | 12,279 | 9,591 | 4,529 | |||||||||
Accrued distribution fees | 3,421 | 15,535 | 11,340 | |||||||||
Trustee fees and expenses | 4,821 | 5,007 | 2,901 | |||||||||
Administration fees | 3,607 | 3,510 | 2,052 | |||||||||
Accrued expenses | 36,759 | 35,707 | 27,772 | |||||||||
|
| |||||||||||
Total liabilities | 2,465,492 | 4,170,759 | 247,257 | |||||||||
|
| |||||||||||
Net Assets - all share classes | $ | 88,064,829 | $ | 87,145,554 | $ | 50,702,675 | ||||||
|
| |||||||||||
Net Assets - Class S | $ | 80,467,130 | $ | 57,061,609 | $ | 32,883,093 | ||||||
|
| |||||||||||
Net Assets - Class C | $ | 3,739,052 | $ | 15,877,501 | $ | 12,663,477 | ||||||
|
| |||||||||||
Net Assets - Class A | $ | 3,858,647 | $ | 14,206,444 | $ | 5,156,105 | ||||||
|
| |||||||||||
Net Assets Consists of | ||||||||||||
Paid-in capital | $ | 90,387,284 | $ | 97,130,671 | $ | 56,455,649 | ||||||
Accumulated undistributed net investment income/(loss) | 59,375 | 212,745 | (155,596 | ) | ||||||||
Accumulated undistributed net realized gain/(loss) | (2,205,426 | ) | (15,557,187 | ) | (18,747,048 | ) | ||||||
Unrealized appreciation/(depreciation) | (176,404 | ) | 5,359,325 | 13,149,670 | ||||||||
|
| |||||||||||
Net Assets | $ | 88,064,829 | $ | 87,145,554 | $ | 50,702,675 | ||||||
|
| |||||||||||
Shares outstanding (unlimited shares authorized, no par value) | ||||||||||||
Class S | 8,528,837 | 3,240,988 | 1,760,401 | |||||||||
Class C | 394,559 | 893,915 | 774,861 | |||||||||
Class A | 410,849 | 808,873 | 293,007 | |||||||||
Net asset value (offering and redemption price per share) | ||||||||||||
Class S | $ | 9.43 | $ | 17.61 | $ | 18.68 | ||||||
Class C | $ | 9.48 | $ | 17.76 | $ | 16.34 | ||||||
Class A | $ | 9.39 | $ | 17.56 | $ | 17.60 | ||||||
Class A maximum offering price (100%/ (100%-maximum sales charge)) of net asset value adjusted to the nearest cent per share | $ | 9.86 | $ | 18.63 | $ | 18.67 | ||||||
(a) Includes securities on loan of | $ | 1,097,497 | $ | 2,739,447 | $ | – | ||||||
The accompanying notes are an integral part of the financial statements.
| ||
| 34 | www.iconfunds.com | |
Table of Contents
| ICON Diversified Funds | Statements of Assets and Liabilities | |
| September 30, 2017 |
| ICON Long/Short Fund | ICON Opportunities Fund | ICON Risk-Managed Balanced Fund | ||||||||||
| ||||||||||||
Assets | ||||||||||||
Investments, at cost | $ | 17,195,213 | $ | 15,162,973 | $ | 35,641,716 | ||||||
|
| |||||||||||
Investments, at value(a) | 22,769,776 | 20,510,767 | 37,997,452 | |||||||||
Cash and cash equivalents | 126,322 | 98,008 | 1,578,575 | |||||||||
Receivables: | ||||||||||||
Investments sold | – | – | 73,383 | |||||||||
Fund shares sold | 103,612 | 9,320 | 53,831 | |||||||||
Expense reimbursements due from Adviser | 13,433 | 3,407 | 10,077 | |||||||||
Interest | – | – | 157,215 | |||||||||
Dividends | 18,223 | 2,814 | 17,765 | |||||||||
Foreign tax reclaims | – | – | – | |||||||||
Other assets | 10,138 | 8,415 | 11,252 | |||||||||
|
| |||||||||||
Total assets | 23,041,504 | 20,632,731 | 39,899,550 | |||||||||
|
| |||||||||||
Liabilities | ||||||||||||
Payables: | ||||||||||||
Payable for collateral received on securities loaned | – | 1,213,802 | 546,525 | |||||||||
Investments purchased | – | – | 279,633 | |||||||||
Fund shares redeemed | 43,452 | 2,088 | 23,091 | |||||||||
Distributions due to shareholders | – | – | 5,124 | |||||||||
Advisory fees | 15,607 | 11,335 | 23,663 | |||||||||
Transfer agent fees | 13,706 | 6,156 | 19,575 | |||||||||
Fund accounting fees | 2,752 | 3,169 | 11,504 | |||||||||
Accrued distribution fees | 5,141 | – | 14,777 | |||||||||
Trustee fees and expenses | 1,308 | 1,063 | 2,213 | |||||||||
Administration fees | 918 | 755 | 1,577 | |||||||||
Accrued expenses | 25,346 | 24,961 | 32,309 | |||||||||
|
| |||||||||||
Total liabilities | 108,230 | 1,263,329 | 959,991 | |||||||||
|
| |||||||||||
Net Assets - all share classes | $ | 22,933,274 | $ | 19,369,402 | $ | 38,939,559 | ||||||
|
| |||||||||||
Net Assets - Class S | $ | 11,259,337 | $ | – | $ | 15,272,339 | ||||||
|
| |||||||||||
Net Assets - Class C | $ | 4,670,919 | $ | – | $ | 16,583,185 | ||||||
|
| |||||||||||
Net Assets - Class A | $ | 7,003,018 | $ | – | $ | 7,084,035 | ||||||
|
| |||||||||||
Net Assets Consists of | ||||||||||||
Paid-in capital | $ | 38,341,885 | $ | 13,970,800 | $ | 48,402,351 | ||||||
Accumulated undistributed net investment income/(loss) | (109,773) | (103,428) | 11,935 | |||||||||
Accumulated undistributed net realized gain/(loss) | (20,873,401) | 154,236 | (11,830,463) | |||||||||
Unrealized appreciation/(depreciation) | 5,574,563 | 5,347,794 | 2,355,736 | |||||||||
|
| |||||||||||
Net Assets | $ | 22,933,274 | $ | 19,369,402 | $ | 38,939,559 | ||||||
|
| |||||||||||
Shares outstanding (unlimited shares authorized, no par value) | 1,025,694 | |||||||||||
Class S | 448,051 | – | 970,100 | |||||||||
Class C | 211,025 | – | 1,149,964 | |||||||||
Class A | 287,862 | – | 461,274 | |||||||||
Net asset value (offering and redemption price per share) | $ | 18.88 | ||||||||||
Class S | $ | 25.13 | $ | – | $ | 15.74 | ||||||
Class C | $ | 22.13 | $ | – | $ | 14.42 | ||||||
Class A | $ | 24.33 | $ | – | $ | 15.36 | ||||||
Class A maximum offering price (100%/ (100%-maximum sales charge)) of net asset value adjusted to the nearest cent per share | $ | 25.81 | $ | – | $ | 16.30 | ||||||
(a) Includes securities on loan of | $ | – | $ | 1,187,477 | $ | 538,567 | ||||||
The accompanying notes are an integral part of the financial statements.
| ||
| Annual Report | September 30, 2017 | 35 | |
Table of Contents
| ICON Diversified Funds | Statements of Operations | |
| Year Ended September 30, 2017 |
| ICON Bond Fund | ICON Equity Income Fund | ICON Fund | ||||||||||
| ||||||||||||
Investment Income | ||||||||||||
Interest | $ | 2,926,277 | $ | 228,407 | $ | 859 | ||||||
Dividends | 819,644 | 3,361,398 | 519,179 | |||||||||
Foreign taxes withheld | – | (105,329) | (3,553) | |||||||||
Income from securities lending, net | 4,222 | 186,251 | – | |||||||||
Other income | 125,557 | 18,000 | – | |||||||||
|
| |||||||||||
Total investment income | 3,875,700 | 3,688,727 | 516,485 | |||||||||
|
| |||||||||||
Expenses | ||||||||||||
Advisory fees | 494,966 | 597,129 | 364,161 | |||||||||
Administration fees | 41,127 | 39,719 | 24,213 | |||||||||
Transfer agent fees | 50,154 | 93,518 | 52,436 | |||||||||
Distribution fees: | ||||||||||||
Class C | 35,054 | 134,434 | 122,410 | |||||||||
Class A | 12,842 | 36,540 | 13,194 | |||||||||
Registration fees | 42,614 | 46,371 | 41,976 | |||||||||
Audit and tax service expense | 20,189 | 20,433 | 17,753 | |||||||||
Fund accounting fees | 41,313 | 36,068 | 19,328 | |||||||||
Trustee fees and expenses | 18,122 | 17,962 | 10,838 | |||||||||
Insurance expense | 7,237 | 5,710 | 3,583 | |||||||||
Custody fees | 9,435 | 8,073 | 3,656 | |||||||||
Printing fees | 13,561 | 16,790 | 10,784 | |||||||||
Interest expense | 71 | 12 | 1,513 | |||||||||
Recoupment of previously reimbursed expenses | – | 11,228 | 2,452 | |||||||||
Other expenses | 42,584 | 35,305 | 25,365 | |||||||||
|
| |||||||||||
Total expenses before expense reimbursement | 829,269 | 1,099,292 | 713,662 | |||||||||
Expense reimbursement by Adviser due to expense limitation agreement | (162,616) | (92,199) | (16,031) | |||||||||
|
| |||||||||||
Net Expenses | 666,653 | 1,007,093 | 697,631 | |||||||||
|
| |||||||||||
Net Investment Income/(Loss) | 3,209,047 | 2,681,634 | (181,146) | |||||||||
|
| |||||||||||
Realized and Unrealized Gain/(Loss) | ||||||||||||
Net realized gain/(loss) on: | ||||||||||||
Investments and foreign currency translations | (397,218) | 4,311,704 | 1,912,935 | |||||||||
Long-term capital gain distributions from other investment companies | 701,891 | 880,899 | – | |||||||||
|
| |||||||||||
| 304,673 | 5,192,603 | 1,912,935 | ||||||||||
|
| |||||||||||
Change in unrealized net appreciation/(depreciation) on: | ||||||||||||
Investments and foreign currency | (1,372,818) | 3,717,072 | 11,527,848 | |||||||||
|
| |||||||||||
| (1,372,818) | 3,717,072 | 11,527,848 | ||||||||||
|
| |||||||||||
Net realized and unrealized gain/(loss) | (1,068,145) | 8,909,675 | 13,440,783 | |||||||||
|
| |||||||||||
Net Increase/(Decrease) in Net Assets Resulting From Operations | $ | 2,140,902 | $ | 11,591,309 | $ | 13,259,637 | ||||||
|
| |||||||||||
The accompanying notes are an integral part of the financial statements.
| ||
| 36 | www.iconfunds.com | |
Table of Contents
| ICON Diversified Funds | Statements of Operations | |
| Year Ended September 30, 2017 |
| ICON Long/Short Fund | ICON Opportunities Fund | ICON Risk-Managed Balanced Fund | ||||||||||
| ||||||||||||
Investment Income | ||||||||||||
Interest | $ | 1,006 | $ | 113 | $ | 528,082 | ||||||
Dividends | 211,340 | 111,190 | 466,866 | |||||||||
Foreign taxes withheld | (608) | – | (1,660) | |||||||||
Income from securities lending, net | 68 | 5,065 | 5,846 | |||||||||
Other income | – | – | 10,925 | |||||||||
|
| |||||||||||
Total investment income | 211,806 | 116,368 | 1,010,059 | |||||||||
|
| |||||||||||
Expenses | ||||||||||||
Advisory fees | 168,681 | 129,328 | 287,763 | |||||||||
Administration fees | 9,898 | 8,601 | 19,122 | |||||||||
Transfer agent fees | 45,387 | 24,133 | 62,169 | |||||||||
Distribution fees: | ||||||||||||
Class C | 44,619 | – | 153,277 | |||||||||
Class A | 15,540 | – | 19,316 | |||||||||
Registration fees | 38,238 | 17,464 | 41,033 | |||||||||
Audit and tax service expense | 19,703 | 17,437 | 22,288 | |||||||||
Fund accounting fees | 8,915 | 9,070 | 28,334 | |||||||||
Trustee fees and expenses | 4,478 | 3,930 | 8,383 | |||||||||
Insurance expense | 1,140 | 1,403 | 3,834 | |||||||||
Custody fees | 2,847 | 3,485 | 7,930 | |||||||||
Printing fees | 5,700 | 7,818 | 8,628 | |||||||||
Interest expense | 558 | 431 | 488 | |||||||||
Recoupment of previously reimbursed expenses | 590 | 18,916 | 344 | |||||||||
Other expenses | 14,385 | 11,669 | 24,360 | |||||||||
|
| |||||||||||
Total expenses before expense reimbursement | 380,679 | 253,685 | 687,269 | |||||||||
Expense reimbursement by Adviser due to expense limitation agreement | (66,063) | (3,673) | (53,919) | |||||||||
|
| |||||||||||
Net Expenses | 314,616 | 250,012 | 633,350 | |||||||||
|
| |||||||||||
Net Investment Income/(Loss) | (102,810) | (133,644) | 376,709 | |||||||||
|
| |||||||||||
Realized and Unrealized Gain/(Loss) | ||||||||||||
Net realized gain/(loss) on: | ||||||||||||
Investments and foreign currency translations | 558,053 | 255,312 | 1,020,863 | |||||||||
Written options | – | – | 26,394 | |||||||||
Long-term capital gain distributions from other investment companies | – | – | 192,193 | |||||||||
|
| |||||||||||
| 558,053 | 255,312 | 1,239,450 | ||||||||||
|
| |||||||||||
Change in unrealized net appreciation/(depreciation) on: | ||||||||||||
Investments and foreign currency | 5,059,321 | 4,385,735 | 1,967,456 | |||||||||
|
| |||||||||||
| 5,059,321 | 4,385,735 | 1,967,456 | ||||||||||
|
| |||||||||||
Net realized and unrealized gain/(loss) | 5,617,374 | 4,641,047 | 3,206,906 | |||||||||
|
| |||||||||||
Net Increase/(Decrease) in Net Assets Resulting From Operations | $ | 5,514,564 | $ | 4,507,403 | $ | 3,583,615 | ||||||
|
| |||||||||||
The accompanying notes are an integral part of the financial statements.
| ||
| Annual Report | September 30, 2017 | 37 | |
Table of Contents
| ICON Diversified Funds | Statements of Changes in Net Assets | |
| ICON Bond Fund | ICON Equity Income Fund | |||||||||||||
| ||||||||||||||
| Year Ended September 30, 2017 | Year Ended September 30, 2016 | Year Ended September 30, 2017 | Year Ended September 30, 2016 | |||||||||||
| ||||||||||||||
Operations | ||||||||||||||
Net investment income/(loss) | $ | 3,209,047 | $ | 3,020,741 | $ | 2,681,634 | $ 1,889,298 | |||||||
Net realized gain/(loss) | (397,218) | 240,106 | 4,311,704 | (994,699) | ||||||||||
Net realized gain/(loss) on long-term capital gain distributions from other investment companies | 701,891 | 7,949 | 880,899 | 987 | ||||||||||
Change in net unrealized appreciation/(depreciation) | (1,372,818) | 2,838,297 | 3,717,072 | 5,024,516 | ||||||||||
|
| |||||||||||||
Net increase/(decrease) in net assets resulting from operations | 2,140,902 | 6,107,093 | 11,591,309 | 5,920,102 | ||||||||||
|
| |||||||||||||
Dividends and Distributions to Shareholders | ||||||||||||||
Net investment income | ||||||||||||||
Class S | (2,969,591) | (2,609,859) | (1,775,156) | (1,164,475) | ||||||||||
Class C | (127,097) | (127,022) | (329,600) | (220,158) | ||||||||||
Class A | (194,557) | (213,454) | (437,435) | (536,706) | ||||||||||
|
| |||||||||||||
Net decrease from dividends and distributions | (3,291,245) | (2,950,335) | (2,542,191) | (1,921,339) | ||||||||||
|
| |||||||||||||
Fund Share Transactions | ||||||||||||||
Shares sold | ||||||||||||||
Class S | 30,021,531 | 23,652,490 | 29,442,641 | 22,323,535 | ||||||||||
Class C | 852,689 | 2,037,494 | 6,193,719 | 4,965,537 | ||||||||||
Class A | 1,653,201 | 3,634,359 | 3,883,597 | 5,435,514 | ||||||||||
Reinvested dividends and distributions | ||||||||||||||
Class S | 2,665,363 | 2,285,962 | 1,707,580 | 1,105,137 | ||||||||||
Class C | 106,129 | 92,020 | 284,548 | 167,115 | ||||||||||
Class A | 125,313 | 108,802 | 372,453 | 459,085 | ||||||||||
Shares repurchased | ||||||||||||||
Class S | (27,853,530) | (25,213,749) | (17,771,448) | (10,457,028) | ||||||||||
Class C | (1,757,578) | (1,852,274) | (2,642,506) | (2,082,558) | ||||||||||
Class A | (3,943,785) | (5,687,994) | (8,549,319) | (3,382,907) | ||||||||||
|
| |||||||||||||
Net increase/(decrease) from fund share transactions | 1,869,333 | (942,890) | 12,921,265 | 18,533,430 | ||||||||||
|
| |||||||||||||
Total net increase in net assets | 718,990 | 2,213,868 | 21,970,383 | 22,532,193 | ||||||||||
Net Assets | ||||||||||||||
Beginning of year | 87,345,839 | 85,131,971 | 65,175,171 | 42,642,978 | ||||||||||
|
| |||||||||||||
End of year | $ | 88,064,829 | $ | 87,345,839 | $ | 87,145,554 | $ 65,175,171 | |||||||
|
| |||||||||||||
Accumulated undistributed net investment income/(loss) | $ | 59,375 | $ | 123,417 | $ | 212,745 | $ 31,918 | |||||||
|
| |||||||||||||
Transactions in Fund Shares | ||||||||||||||
Shares sold | ||||||||||||||
Class S | 3,177,562 | 2,542,262 | 1,767,858 | 1,471,811 | ||||||||||
Class C | 90,115 | 218,630 | 366,818 | 323,130 | ||||||||||
Class A | 176,894 | 394,911 | 232,232 | 358,450 | ||||||||||
Issued to shareholders in reinvestment of distributions | ||||||||||||||
Class S | 282,927 | 245,654 | 100,137 | 73,747 | ||||||||||
Class C | 11,215 | 9,850 | 16,505 | 11,022 | ||||||||||
Class A | 13,352 | 11,757 | 21,926 | 30,748 | ||||||||||
Shares repurchased | ||||||||||||||
Class S | (2,956,814) | (2,710,665) | (1,052,089) | (706,603) | ||||||||||
Class C | (185,691) | (197,764) | (157,844) | (138,110) | ||||||||||
Class A | (420,853) | (619,858) | (522,274) | (224,896) | ||||||||||
|
| |||||||||||||
Net increase/(decrease) | 188,707 | (105,223) | 773,269 | 1,199,299 | ||||||||||
|
| |||||||||||||
Shares outstanding, beginning of year | 9,145,538 | 9,250,761 | 4,170,507 | 2,971,208 | ||||||||||
|
| |||||||||||||
Shares outstanding, end of year | 9,334,245 | 9,145,538 | 4,943,776 | 4,170,507 | ||||||||||
|
| |||||||||||||
The accompanying notes are an integral part of the financial statements.
| ||
| 38 | www.iconfunds.com | |
Table of Contents
| ICON Diversified Funds | Statements of Changes in Net Assets | |
| ICON Fund | ICON Long/Short Fund | |||||||||||||
| ||||||||||||||
| Year Ended September 30, 2017 | Year Ended September 30, 2016 | Year Ended September 30, 2017 | Year Ended September 30, 2016 | |||||||||||
| ||||||||||||||
Operations | ||||||||||||||
Net investment income/(loss) | $ | (181,146) | $ | 28,353 | $ | (102,810) | $ (19,017) | |||||||
Net realized gain/(loss) | 1,912,935 | (1,328,436) | 558,053 | 67,924 | ||||||||||
Change in net unrealized appreciation/(depreciation) | 11,527,848 | 1,797,942 | 5,059,321 | 8,849 | ||||||||||
|
| |||||||||||||
Net increase/(decrease) in net assets resulting from operations | 13,259,637 | 497,859 | 5,514,564 | 57,756 | ||||||||||
|
| |||||||||||||
Fund Share Transactions | ||||||||||||||
Shares sold | ||||||||||||||
Class S | 8,371,228 | 1,519,056 | 4,418,722 | 1,759,878 | ||||||||||
Class C | 737,337 | 455,017 | 231,078 | 196,083 | ||||||||||
Class A | 726,755 | 356,458 | 2,993,488 | 635,346 | ||||||||||
Shares repurchased | ||||||||||||||
Class S | (12,871,498) | (6,734,706) | (2,770,776) | (11,978,015) | ||||||||||
Class C | (2,880,211) | (2,714,880) | (1,023,107) | (2,239,810) | ||||||||||
Class A | (2,547,491) | (1,906,267) | (3,071,503) | (4,472,867) | ||||||||||
|
| |||||||||||||
Net increase/(decrease) from fund share transactions | (8,463,880) | (9,025,322) | 777,902 | (16,099,385) | ||||||||||
|
| |||||||||||||
Total net increase/(decrease) in net assets | 4,795,757 | (8,527,463) | 6,292,466 | (16,041,629) | ||||||||||
Net Assets | ||||||||||||||
Beginning of year | 45,906,918 | 54,434,381 | 16,640,808 | 32,682,437 | ||||||||||
|
| |||||||||||||
End of year | $ | 50,702,675 | $ | 45,906,918 | $ | 22,933,274 | $ 16,640,808 | |||||||
|
| |||||||||||||
Accumulated undistributed net investment income/(loss) | $ | (155,596) | $ | – | $ | (109,773) | $ (6,963) | |||||||
|
| |||||||||||||
Transactions in Fund Shares | ||||||||||||||
Shares sold | ||||||||||||||
Class S | 507,732 | 108,905 | 192,376 | 98,051 | ||||||||||
Class C | 48,906 | 37,939 | 11,293 | 11,912 | ||||||||||
Class A | 45,694 | 27,328 | 138,114 | 36,303 | ||||||||||
Shares repurchased | ||||||||||||||
Class S | (800,369) | (492,502) | (124,649) | (652,902) | ||||||||||
Class C | (198,758) | (223,446) | (53,192) | (139,906) | ||||||||||
Class A | (165,063) | (147,621) | (142,928) | (256,603) | ||||||||||
|
| |||||||||||||
Net increase/(decrease) | (561,858) | (689,397) | 21,014 | (903,145) | ||||||||||
|
| |||||||||||||
Shares outstanding, beginning of year | 3,390,127 | 4,079,524 | 925,924 | 1,829,069 | ||||||||||
|
| |||||||||||||
Shares outstanding, end of year | 2,828,269 | 3,390,127 | 946,938 | 925,924 | ||||||||||
|
| |||||||||||||
The accompanying notes are an integral part of the financial statements.
| ||
| Annual Report | September 30, 2017 | 39 | |
Table of Contents
| ICON Diversified Funds | Statements of Changes in Net Assets | |
| ICON Opportunities Fund | ICON Risk-Managed Balanced Fund | |||||||||||||
| ||||||||||||||
| Year Ended September 30, 2017 | Year Ended September 30, 2016 | Year Ended September 30, 2017 | Year Ended September 30, 2016 | |||||||||||
| ||||||||||||||
Operations | ||||||||||||||
Net investment income/(loss) | $ | (133,644) | $ | (27,160) | $ | 376,709 | $ 503,738 | |||||||
Net realized gain/(loss) | 255,312 | 143,820 | 1,047,257 | 121,100 | ||||||||||
Net realized gain/(loss) on long-term capital gain distributions from other investment companies | – | – | 192,193 | 11,386 | ||||||||||
Change in net unrealized appreciation/(depreciation) | 4,385,735 | 1,036,666 | 1,967,456 | 1,179,154 | ||||||||||
|
| |||||||||||||
Net increase/(decrease) in net assets resulting from operations | 4,507,403 | 1,153,326 | 3,583,615 | 1,815,378 | ||||||||||
|
| |||||||||||||
Dividends and Distributions to Shareholders | ||||||||||||||
Net investment income | – | – | ||||||||||||
Class S | – | – | (228,027) | (301,369) | ||||||||||
Class C | – | – | (107,326) | (60,049) | ||||||||||
Class A | – | – | (98,195) | (92,328) | ||||||||||
Net realized gains | (221,532) | (10,170) | ||||||||||||
|
| |||||||||||||
Net decrease from dividends and distributions | (221,532) | (10,170) | (433,548) | (453,746) | ||||||||||
|
| |||||||||||||
Fund Share Transactions | ||||||||||||||
Shares sold | 2,342,771 | 6,108,876 | ||||||||||||
Class S | – | – | 5,789,710 | 15,411,061 | ||||||||||
Class C | – | – | 4,874,335 | 7,253,783 | ||||||||||
Class A | – | – | 742,396 | 4,152,730 | ||||||||||
Reinvested dividends and distributions | 221,332 | 10,162 | ||||||||||||
Class S | – | – | 209,620 | 259,419 | ||||||||||
Class C | – | – | 94,575 | 46,376 | ||||||||||
Class A | – | – | 90,299 | 79,762 | ||||||||||
Shares repurchased | (3,539,469) | (2,250,264) | ||||||||||||
Class S | – | – | (12,045,261) | (22,982,522) | ||||||||||
Class C | – | – | (4,806,459) | (5,595,969) | ||||||||||
Class A | – | – | (3,493,476) | (3,836,027) | ||||||||||
|
| |||||||||||||
Net increase/(decrease) from fund share transactions | (975,366) | 3,868,774 | (8,544,261) | (5,211,387) | ||||||||||
|
| |||||||||||||
Total net increase/(decrease) in net assets | 3,310,505 | 5,011,930 | (5,394,194) | (3,849,755) | ||||||||||
Net Assets | ||||||||||||||
Beginning of year | 16,058,897 | 11,046,967 | 44,333,753 | 48,183,508 | ||||||||||
|
| |||||||||||||
End of year | $ | 19,369,402 | $ | 16,058,897 | $ | 38,939,559 | $ 44,333,753 | |||||||
|
| |||||||||||||
Accumulated undistributed net investment income/(loss) | $ | (103,428) | $ | (30,697) | $ | 11,935 | $ 68,236 | |||||||
|
| |||||||||||||
The accompanying notes are an integral part of the financial statements.
| ||
| 40 | www.iconfunds.com | |
Table of Contents
| ICON Diversified Funds | Statements of Changes in Net Assets | |
| ICON Opportunities Fund | ICON Risk-Managed Balanced Fund | |||||||||||||
| ||||||||||||||
| Year Ended September 30, 2017 | Year Ended September 30, 2016 | Year Ended September 30, 2017 | Year Ended September 30, 2016 | |||||||||||
| ||||||||||||||
Transactions in Fund Shares | ||||||||||||||
Shares sold | 139,548 | 426,361 | ||||||||||||
Class S | – | – | 386,228 | 1,094,151 | ||||||||||
Class C | – | – | 350,409 | 554,021 | ||||||||||
Class A | – | – | 50,434 | 298,768 | ||||||||||
Issued to shareholders in reinvestment of distributions | 13,488 | 753 | ||||||||||||
Class S | – | – | 13,840 | 18,182 | ||||||||||
Class C | – | – | 6,868 | 3,547 | ||||||||||
Class A | – | – | 6,124 | 5,727 | ||||||||||
Shares repurchased | (216,490) | (167,271) | ||||||||||||
Class S | – | – | (819,237) | (1,625,982) | ||||||||||
Class C | – | – | (349,264) | (429,201) | ||||||||||
Class A | – | – | (239,935) | (277,104) | ||||||||||
|
| |||||||||||||
Net increase/(decrease) | (63,454) | 259,843 | (594,533) | (357,891) | ||||||||||
|
| |||||||||||||
Shares outstanding, beginning of year | 1,089,148 | 829,305 | 3,175,871 | 3,533,762 | ||||||||||
|
| |||||||||||||
Shares outstanding, end of year | 1,025,694 | 1,089,148 | 2,581,338 | 3,175,871 | ||||||||||
|
| |||||||||||||
The accompanying notes are an integral part of the financial statements.
| ||
| Annual Report | September 30, 2017 | 41 | |
Table of Contents
| ICON Bond Fund | Financial Highlights | |
| For a Share Outstanding Throughout the Years Presented |
| Class S | Year Ended 2017 | Year Ended 2016 | Year Ended 2015 | Year Ended 2014 | Year Ended 2013 | |||||||||||||||||||||||
Net asset value, beginning of period | $ | 9.55 | $ | 9.20 | $ | 9.90 | $ | 9.89 | $ | 10.51 | ||||||||||||||||||
Income/(loss) from investment operations: | ||||||||||||||||||||||||||||
Net investment income/(loss)(a)(b) | 0.37 | 0.34 | 0.41 | 0.43 | (c) | 0.24 | ||||||||||||||||||||||
Net realized and unrealized gains/(losses) on investments | (0.11) | 0.34 | (0.44) | 0.15 | (0.32) | |||||||||||||||||||||||
Total from investment operations | 0.26 | 0.68 | (0.03) | 0.58 | (0.08) | |||||||||||||||||||||||
Less dividends and distributions: | ||||||||||||||||||||||||||||
Dividends from net investment income | (0.38) | (0.33) | (0.51) | (0.44) | (0.24) | |||||||||||||||||||||||
Distributions from net realized gains | – | – | (0.13) | (0.13) | (0.30) | |||||||||||||||||||||||
Return of capital | – | – | (0.03) | – | – | |||||||||||||||||||||||
Total dividends and distributions | (0.38) | (0.33) | (0.67) | (0.57) | (0.54) | |||||||||||||||||||||||
Net asset value, end of period | $ | 9.43 | $ | 9.55 | $ | 9.20 | $ | 9.90 | $ | 9.89 | ||||||||||||||||||
Total Return | 2.82 | % | 7.54 | % | (0.28) | % | 6.01 | % | (0.84) | % | ||||||||||||||||||
Ratios and Supplemental Data | ||||||||||||||||||||||||||||
Net assets, end of period (in 000s) | $ | 80,467 | $ | 76,656 | $ | 73,152 | $ | 87,675 | $ | 88,313 | ||||||||||||||||||
Ratio of expenses to average net assets | ||||||||||||||||||||||||||||
Before expense limitation | 0.91 | % | 0.93 | % | 0.91 | % | 0.86 | % | 0.89 | % | ||||||||||||||||||
After expense limitation(d) | 0.75 | % | 0.75 | % | 0.75 | % | 0.75 | % | 0.75 | % | ||||||||||||||||||
Ratio of net investment income/(loss) to average net assets | ||||||||||||||||||||||||||||
Before expense limitation | 3.80 | % | 3.43 | % | 4.10 | % | 4.22 | % | 2.19 | % | ||||||||||||||||||
After expense limitation(d) | 3.96 | % | 3.61 | % | 4.26 | % | 4.33% | (c) | 2.33 | % | ||||||||||||||||||
Portfolio turnover rate | 169 | % | 141 | % | 153 | % | 176 | % | 97 | % | ||||||||||||||||||
| (a) | Calculated using the average shares method. |
| (b) | The per share amount does not correspond to activity reflected in the Statement of Operations due to class specific expenses during the period. |
| (c) | Investment income per share of Class S reflects a large, non-recurring dividend which amounted to $0.07 per share. Excluding this non-recurring dividend, the ratio of net investment income/(loss) to average net assets would have been 3.59% for Class S. |
| (d) | The Fund’s operating expenses, not including interest expense, are contractually limited to the amounts discussed in Note 3. The ratios in these financial highlights reflect the limitation, including the interest expense, when applicable. |
The accompanying notes are an integral part of the financial statements.
| ||
| 42 | www.iconfunds.com | |
Table of Contents
| ICON Bond Fund | Financial Highlights | |
| For a Share Outstanding Throughout the Years Presented |
| Class C | Year Ended September 30, 2017 | Year Ended September 30, 2016 | Year Ended September 30, 2015 | Year Ended September 30, 2014 | Year Ended September 30, 2013 | |||||||||||||||||||||||
Net asset value, beginning of period | $ | 9.58 | $ | 9.24 | $ | 9.94 | $ | 9.93 | $ | 10.55 | ||||||||||||||||||
Income/(loss) from investment operations: | ||||||||||||||||||||||||||||
Net investment income/(loss)(a)(b) | 0.29 | 0.26 | 0.32 | 0.34 | (c) | 0.15 | ||||||||||||||||||||||
Net realized and unrealized gains/(losses) on investments | (0.10) | 0.34 | (0.43) | 0.15 | (0.32) | |||||||||||||||||||||||
Total from investment operations | 0.19 | 0.60 | (0.11) | 0.49 | (0.17) | |||||||||||||||||||||||
Less dividends and distributions: | ||||||||||||||||||||||||||||
Dividends from net investment income | (0.29) | (0.26) | (0.43) | (0.35) | (0.15) | |||||||||||||||||||||||
Distributions from net realized gains | – | – | (0.13) | (0.13) | (0.30) | |||||||||||||||||||||||
Return of capital | – | – | (0.03) | – | – | |||||||||||||||||||||||
Total dividends and distributions | (0.29) | (0.26) | (0.59) | (0.48) | (0.45) | |||||||||||||||||||||||
Net asset value, end of period | $ | 9.48 | $ | 9.58 | $ | 9.24 | $ | 9.94 | $ | 9.93 | ||||||||||||||||||
Total Return(d) | 2.05 | % | 6.59 | % | (1.10) | % | 5.10 | % | (1.66) | % | ||||||||||||||||||
Ratios and Supplemental Data | ||||||||||||||||||||||||||||
Net assets, end of period (in 000s) | $ | 3,739 | $ | 4,590 | $ | 4,142 | $ | 2,879 | $ | 3,008 | ||||||||||||||||||
Ratio of expenses to average net assets | ||||||||||||||||||||||||||||
Before expense limitation | 2.13 | % | 2.10 | % | 2.19 | % | 2.27 | % | 2.06 | % | ||||||||||||||||||
After expense limitation(e) | 1.60 | % | 1.60 | % | 1.60 | % | 1.60 | % | 1.60 | % | ||||||||||||||||||
Ratio of net investment income/(loss) to average net assets | ||||||||||||||||||||||||||||
Before expense limitation | 2.58 | % | 2.28 | % | 2.76 | % | 2.75 | % | 1.02 | % | ||||||||||||||||||
After expense limitation(e) | 3.11 | % | 2.78 | % | 3.35 | % | 3.42% | (c) | 1.48 | % | ||||||||||||||||||
Portfolio turnover rate | 169 | % | 141 | % | 153 | % | 176 | % | 97 | % | ||||||||||||||||||
| (a) | Calculated using the average shares method. |
| (b) | The per share amount does not correspond to activity reflected in the Statement of Operations due to class specific expenses during the period. |
| (c) | Investment income per share of Class C reflects a large, non-recurring dividend which amounted to $0.06 per share. Excluding this non-recurring dividend, the ratio of net investment income (loss) to average net assets would have been 2.84% for Class C. |
| (d) | The total return calculation excludes any sales charges. |
| (e) | The Fund’s operating expenses, not including interest expense, are contractually limited to the amounts discussed in Note 3. The ratios in these financial highlights reflect the limitation, including the interest expense, when applicable. |
The accompanying notes are an integral part of the financial statements.
| ||
| Annual Report | September 30, 2017 | 43 | |
Table of Contents
| ICON Bond Fund | Financial Highlights | |
| For a Share Outstanding Throughout the Years Presented |
| Class A | Year Ended September 30, 2017 | Year Ended September 30, 2016 | Year Ended September 30, 2015 | Year Ended September 30, 2014 | Year Ended September 30, 2013 | |||||||||||||||||||||||
Net asset value, beginning of period | $ | 9.51 | $ | 9.17 | $ | 9.86 | $ | 9.89 | $ | 10.51 | ||||||||||||||||||
Income/(loss) from investment operations: | ||||||||||||||||||||||||||||
Net investment income/(loss)(a)(b) | 0.33 | 0.31 | 0.36 | 0.43 | (c) | 0.21 | ||||||||||||||||||||||
Net realized and unrealized gains/(losses) on investments | (0.10) | 0.34 | (0.41) | 0.12 | (0.32) | |||||||||||||||||||||||
Total from investment operations | 0.23 | 0.65 | (0.05) | 0.55 | (0.11) | |||||||||||||||||||||||
Less dividends and distributions: | ||||||||||||||||||||||||||||
Dividends from net investment income | (0.35) | (0.31) | (0.48) | (0.45) | (0.21) | |||||||||||||||||||||||
Distributions from net realized gains | – | – | (0.13) | (0.13) | (0.30) | |||||||||||||||||||||||
Return of capital | – | – | (0.03) | – | – | |||||||||||||||||||||||
Total dividends and distributions | (0.35) | (0.31) | (0.64) | (0.58) | (0.51) | |||||||||||||||||||||||
Net asset value, end of period | $ | 9.39 | $ | 9.51 | $ | 9.17 | $ | 9.86 | $ | 9.89 | ||||||||||||||||||
Total Return(d) | 2.48 | % | 7.25 | % | (0.44) | % | 5.77 | % | (1.08) | % | ||||||||||||||||||
Ratios and Supplemental Data | ||||||||||||||||||||||||||||
Net assets, end of period (in 000s) | $ | 3,859 | $ | 6,100 | $ | 7,838 | $ | 4,278 | $ | 6,792 | ||||||||||||||||||
Ratio of expenses to average net assets | ||||||||||||||||||||||||||||
Before expense limitation | 1.41 | % | 1.38 | % | 1.36 | % | 1.44 | % | 1.34 | % | ||||||||||||||||||
After expense limitation(e) | 1.00 | % | 1.00 | % | 1.00 | % | 1.00 | % | 1.00 | % | ||||||||||||||||||
Ratio of net investment income/(loss) to average net assets | ||||||||||||||||||||||||||||
Before expense limitation | 3.13 | % | 2.98 | % | 3.50 | % | 3.84 | % | 1.71 | % | ||||||||||||||||||
After expense limitation(e) | 3.54 | % | 3.36 | % | 3.86 | % | 4.28% | (c) | 2.06 | % | ||||||||||||||||||
Portfolio turnover rate | 169 | % | 141 | % | 153 | % | 176 | % | 97 | % | ||||||||||||||||||
| (a) | Calculated using the average shares method. |
| (b) | The per share amount does not correspond to activity reflected in the Statement of Operations due to class specific expenses during the period. |
| (c) | Investment income per share of Class A reflects a large, non-recurring dividend which amounted to $0.08 per share. Excluding this non-recurring dividend, the ratio of net investment income (loss) to average net assets would have been 3.55% for Class A. |
| (d) | The total return calculation excludes any sales charges. |
| (e) | The Fund’s operating expenses, not including interest expense, are contractually limited to the amounts discussed in Note 3. The ratios in these financial highlights reflect the limitation, including the interest expense, when applicable. |
The accompanying notes are an integral part of the financial statements.
| ||
| 44 | www.iconfunds.com | |
Table of Contents
| ICON Equity Income Fund | Financial Highlights | |
| For a Share Outstanding Throughout the Years Presented |
| Class S | Year Ended September 30, 2017 | Year Ended September 30, 2016 | Year Ended September 30, 2015 | Year Ended September 30, 2014 | Year Ended September 30, 2013 | |||||||||||||||||||||||
Net asset value, beginning of period | $ | 15.62 | $ | 14.36 | $ | 14.87 | $ | 13.80 | $ | 12.18 | ||||||||||||||||||
Income/(loss) from investment operations: | ||||||||||||||||||||||||||||
Net investment income/(loss)(a)(b) | 0.61 | 0.60 | 0.56 | 0.52 | 0.47 | |||||||||||||||||||||||
Net realized and unrealized gains/(losses) on investments | 1.95 | 1.27 | (0.56) | 1.04 | 1.65 | |||||||||||||||||||||||
Total from investment operations | 2.56 | 1.87 | (0.00) | (c) | 1.56 | 2.12 | ||||||||||||||||||||||
Less dividends and distributions: | ||||||||||||||||||||||||||||
Dividends from net investment income | (0.57) | (0.61) | (0.51) | (0.49) | (0.50) | |||||||||||||||||||||||
Total dividends and distributions | (0.57) | (0.61) | (0.51) | (0.49) | (0.50) | |||||||||||||||||||||||
Net asset value, end of period | $ | 17.61 | $ | 15.62 | $ | 14.36 | $ | 14.87 | $ | 13.80 | ||||||||||||||||||
Total Return | 16.53 | % | 13.30 | % | (0.17) | % | 11.36 | % | 17.76 | % | ||||||||||||||||||
Ratios and Supplemental Data | ||||||||||||||||||||||||||||
Net assets, end of period (in 000s) | $ | 57,062 | $ | 37,868 | $ | 22,779 | $ | 8,022 | $ | 5,116 | ||||||||||||||||||
Ratio of expenses to average net assets | ||||||||||||||||||||||||||||
Before expense limitation | 1.15 | % | 1.24 | % | 1.25 | % | 1.38 | % | 1.53 | % | ||||||||||||||||||
After expense limitation(d) | 1.05% | (e) | 1.20 | % | 1.20 | % | 1.20 | % | 1.21 | % | ||||||||||||||||||
Ratio of net investment income/(loss) to average net assets | ||||||||||||||||||||||||||||
Before expense limitation | 3.50 | % | 3.91 | % | 3.52 | % | 3.36 | % | 3.28 | % | ||||||||||||||||||
After expense limitation(d) | 3.60 | % | 3.95 | % | 3.57 | % | 3.54 | % | 3.60 | % | ||||||||||||||||||
Portfolio turnover rate | 206 | % | 145 | % | 174 | % | 148 | % | 163 | % | ||||||||||||||||||
| (a) | Calculated using the average shares method. |
| (b) | The per share amount does not correspond to activity reflected in the Statement of Operations due to class specific expenses during the period. |
| (c) | Amount less than $(0.005). |
| (d) | The Fund’s operating expenses, not including interest expense, are contractually limited to the amounts discussed in Note 3. The ratios in these financial highlights reflect the limitation, including the interest expense, when applicable. |
| (e) | Effective January 26, 2017, the annual expense limitation rate changed from 1.20% to 0.99%. |
The accompanying notes are an integral part of the financial statements.
| ||
| Annual Report | September 30, 2017 | 45 | |
Table of Contents
| ICON Equity Income Fund | Financial Highlights | |
| For a Share Outstanding Throughout the Years Presented |
| Class C | Year Ended September 30, 2017 | Year Ended September 30, 2016 | Year Ended September 30, 2015 | Year Ended September 30, 2014 | Year Ended September 30, 2013 | |||||||||||||||||||||||
Net asset value, beginning of period | $ | 15.76 | $ | 14.45 | $ | 14.96 | $ | 13.88 | $ | 12.25 | ||||||||||||||||||
Income/(loss) from investment operations: | ||||||||||||||||||||||||||||
Net investment | 0.45 | 0.45 | 0.40 | 0.36 | 0.35 | |||||||||||||||||||||||
Net realized and unrealized gains/(losses) on investments | 1.95 | 1.28 | (0.56) | 1.06 | 1.65 | |||||||||||||||||||||||
Total from investment operations | 2.40 | 1.73 | (0.16) | 1.42 | 2.00 | |||||||||||||||||||||||
Less dividends and distributions: | ||||||||||||||||||||||||||||
Dividends from net investment income | (0.40) | (0.42) | (0.35) | (0.34) | (0.37) | |||||||||||||||||||||||
Total dividends and distributions | (0.40) | (0.42) | (0.35) | (0.34) | (0.37) | |||||||||||||||||||||||
Net asset value, end of period | $ | 17.76 | $ | 15.76 | $ | 14.45 | $ | 14.96 | $ | 13.88 | ||||||||||||||||||
Total Return(c) | 15.34 | % | 12.15 | % | (1.16) | % | 10.26 | % | 16.58 | % | ||||||||||||||||||
Ratios and Supplemental Data | ||||||||||||||||||||||||||||
Net assets, end of period (in 000s) | $ | 15,878 | $ | 10,532 | $ | 6,825 | $ | 5,481 | $ | 5,423 | ||||||||||||||||||
Ratio of expenses to average net assets | ||||||||||||||||||||||||||||
Before expense limitation | 2.20 | % | 2.34 | % | 2.34 | % | 2.45 | % | 2.42 | % | ||||||||||||||||||
After expense limitation(d) | 2.05% | (e) | 2.20 | % | 2.20 | % | 2.20 | % | 2.21 | % | ||||||||||||||||||
Ratio of net investment income/(loss) to average net assets | ||||||||||||||||||||||||||||
Before expense limitation | 2.49 | % | 2.80 | % | 2.40 | % | 2.21 | % | 2.49 | % | ||||||||||||||||||
After expense limitation(d) | 2.64 | % | 2.94 | % | 2.54 | % | 2.46 | % | 2.70 | % | ||||||||||||||||||
Portfolio turnover rate | 206 | % | 145 | % | 174 | % | 148 | % | 163 | % | ||||||||||||||||||
| (a) | Calculated using the average shares method. |
| (b) | The per share amount does not correspond to activity reflected in the Statement of Operations due to class specific expenses during the period. |
| (c) | The total return calculation excludes any sales charges. |
| (d) | The Fund’s operating expenses, not including interest expense, are contractually limited to the amounts discussed in Note 3. The ratios in these financial highlights reflect the limitation, including the interest expense, when applicable. |
| (e) | Effective January 26, 2017, the annual expense limitation rate changed from 2.20% to 1.99%. |
The accompanying notes are an integral part of the financial statements.
| ||
| 46 | www.iconfunds.com | |
Table of Contents
| ICON Equity Income Fund | Financial Highlights | |
| For a Share Outstanding Throughout the Years Presented |
| Class A | Year Ended September 30, 2017 | Year Ended September 30, 2016 | Year Ended September 30, 2015 | Year Ended September 30, 2014 | Year Ended September 30, 2013 | |||||||||||||||||||||||
Net asset value, beginning of period | $ | 15.58 | $ | 14.29 | $ | 14.79 | $ | 13.73 | $ | 12.12 | ||||||||||||||||||
Income/(loss) from investment operations: | ||||||||||||||||||||||||||||
Net investment income/(loss)(a)(b) | 0.54 | 0.56 | 0.50 | 0.47 | 0.45 | |||||||||||||||||||||||
Net realized and unrealized gains/(losses) on investments | 1.96 | 1.26 | (0.53) | 1.04 | 1.63 | |||||||||||||||||||||||
Total from investment operations | 2.50 | 1.82 | (0.03) | 1.51 | 2.08 | |||||||||||||||||||||||
Less dividends and distributions: | ||||||||||||||||||||||||||||
Dividends from net investment income | (0.52) | (0.53) | (0.47) | (0.45) | (0.47) | |||||||||||||||||||||||
Total dividends and distributions | (0.52) | (0.53) | (0.47) | (0.45) | (0.47) | |||||||||||||||||||||||
Net asset value, end of period | $ | 17.56 | $ | 15.58 | $ | 14.29 | $ | 14.79 | $ | 13.73 | ||||||||||||||||||
Total Return(c) | 16.20 | % | 12.97 | % | (0.38) | % | 11.07 | % | 17.49 | % | ||||||||||||||||||
Ratios and Supplemental Data | ||||||||||||||||||||||||||||
Net assets, end of period (in 000s) | $ | 14,206 | $ | 16,775 | $ | 13,039 | $ | 13,847 | $ | 12,798 | ||||||||||||||||||
Ratio of expenses to average net assets | ||||||||||||||||||||||||||||
Before expense limitation | 1.45 | % | 1.54 | % | 1.52 | % | 1.59 | % | 1.68 | % | ||||||||||||||||||
After expense limitation(d) | 1.31% | (e) | 1.45 | % | 1.45 | % | 1.45 | % | 1.46 | % | ||||||||||||||||||
Ratio of net investment income/(loss) to average net assets | ||||||||||||||||||||||||||||
Before expense limitation | 3.06 | % | 3.64 | % | 3.14 | % | 3.08 | % | 3.24 | % | ||||||||||||||||||
After expense limitation(d) | 3.20 | % | 3.73 | % | 3.21 | % | 3.22 | % | 3.45 | % | ||||||||||||||||||
Portfolio turnover rate | 206 | % | 145 | % | 174 | % | 148 | % | 163 | % | ||||||||||||||||||
| (a) | Calculated using the average shares method. |
| (b) | The per share amount does not correspond to activity reflected in the Statement of Operations due to class specific expenses during the period. |
| (c) | The total return calculation excludes any sales charges. |
| (d) | The Fund’s operating expenses, not including interest expense, are contractually limited to the amounts discussed in Note 3. The ratios in these financial highlights reflect the limitation, including the interest expense, when applicable. |
| (e) | Effective January 26, 2017, the annual expense limitation rate changed from 1.45% to 1.24%. |
The accompanying notes are an integral part of the financial statements.
| ||
| Annual Report | September 30, 2017 | 47 | |
Table of Contents
| ICON Fund | Financial Highlights | |
| For a Share Outstanding Throughout the Years Presented |
| Class S | Year Ended September 30, 2017 | Year Ended September 30, 2016 | Year Ended September 30, 2015 | Year Ended September 30, 2014 | Year Ended September 30, 2013 | |||||||||||||||||||||||
Net asset value, beginning of period | $ | 14.08 | $ | 13.83 | $ | 14.52 | $ | 14.00 | $ | 11.34 | ||||||||||||||||||
Income/(loss) from investment operations: | ||||||||||||||||||||||||||||
Net investment income/(loss)(a)(b) | (0.01) | 0.05 | (0.02) | 0.00 | (c) | 0.07 | ||||||||||||||||||||||
Net realized and unrealized gains/(losses) on investments | 4.61 | 0.20 | (0.67) | 0.52 | 2.66 | |||||||||||||||||||||||
Total from investment operations | 4.60 | 0.25 | (0.69) | 0.52 | 2.73 | |||||||||||||||||||||||
Less dividends and distributions: | ||||||||||||||||||||||||||||
Dividends from net investment income | – | – | – | – | (0.07) | |||||||||||||||||||||||
Total dividends and distributions | – | – | – | – | (0.07) | |||||||||||||||||||||||
Net asset value, end of period | $ | 18.68 | $ | 14.08 | $ | 13.83 | $ | 14.52 | $ | 14.00 | ||||||||||||||||||
Total Return | 32.67 | % | 1.81 | % | (4.75) | % | 3.71 | % | 24.27 | % | ||||||||||||||||||
Ratios and Supplemental Data | ||||||||||||||||||||||||||||
Net assets, end of period (in 000s) | $ | 32,883 | $ | 28,897 | $ | 33,695 | $ | 41,577 | $ | 6,986 | ||||||||||||||||||
Ratio of expenses to average net assets | ||||||||||||||||||||||||||||
Before expense limitation | 1.10 | % | 1.12 | % | 1.09 | % | 1.10 | % | 1.23 | % | ||||||||||||||||||
After expense limitation(d) | 1.10 | % | 1.12 | % | 1.09 | % | 1.10 | % | 1.23 | % | ||||||||||||||||||
Ratio of net investment income/(loss) to average net assets | ||||||||||||||||||||||||||||
Before expense limitation | (0.04) | % | 0.39 | % | (0.11) | % | 0.02 | % | 0.59 | % | ||||||||||||||||||
After expense limitation(d) | (0.04) | % | 0.39 | % | (0.11) | % | 0.02 | % | 0.59 | % | ||||||||||||||||||
Portfolio turnover rate | 15 | % | 31 | % | 54 | % | 65 | % | 33 | % | ||||||||||||||||||
| (a) | Calculated using the average shares method. |
| (b) | The per share amount does not correspond to activity reflected in the Statement of Operations due to class specific expenses during the period. |
| (c) | Amount less than $0.005. |
| (d) | The Fund’s operating expenses, not including interest expense, are contractually limited to the amounts discussed in Note 3. The ratios in these financial highlights reflect the limitation, including the interest expense, when applicable. |
The accompanying notes are an integral part of the financial statements.
| ||
| 48 | www.iconfunds.com | |
Table of Contents
| ICON Fund | Financial Highlights | |
| For a Share Outstanding Throughout the Years Presented |
| Class C | Year Ended September 30, 2017 | Year Ended September 30, 2016 | Year Ended September 30, 2015 | Year Ended September 30, 2014 | Year Ended September 30, 2013 | |||||||||||||||||||||||
Net asset value, beginning of period | $ | 12.46 | $ | 12.38 | $ | 13.15 | $ | 12.82 | $ | 10.42 | ||||||||||||||||||
Income/(loss) from investment operations: | ||||||||||||||||||||||||||||
Net investment income/ | (0.17) | (0.09) | (0.18) | (0.14) | (0.07) | |||||||||||||||||||||||
Net realized and unrealized gains/(losses) on investments | 4.05 | 0.17 | (0.59) | 0.47 | 2.47 | |||||||||||||||||||||||
Total from investment operations | 3.88 | 0.08 | (0.77) | 0.33 | 2.40 | |||||||||||||||||||||||
Net asset value, end of period | $ | 16.34 | $ | 12.46 | $ | 12.38 | $ | 13.15 | $ | 12.82 | ||||||||||||||||||
Total Return(c) | 31.14 | % | 0.65 | % | (5.86) | % | 2.57 | % | 23.03 | % | ||||||||||||||||||
Ratios and Supplemental Data | ||||||||||||||||||||||||||||
Net assets, end of period (in 000s) | $ | 12,663 | $ | 11,520 | $ | 13,745 | $ | 17,050 | $ | 18,848 | ||||||||||||||||||
Ratio of expenses to average net assets | ||||||||||||||||||||||||||||
Before expense limitation | 2.31 | % | 2.41 | % | 2.27 | % | 2.26 | % | 2.32 | % | ||||||||||||||||||
After expense limitation(d) | 2.25 | % | 2.26 | % | 2.25 | % | 2.25 | % | 2.26 | % | ||||||||||||||||||
Ratio of net investment income/(loss) to average net assets | ||||||||||||||||||||||||||||
Before expense limitation | (1.25) | % | (0.90) | % | (1.29) | % | (1.09) | % | (0.64) | % | ||||||||||||||||||
After expense limitation(d) | (1.19) | % | (0.75) | % | (1.27) | % | (1.08) | % | (0.58) | % | ||||||||||||||||||
Portfolio turnover rate | 15 | % | 31 | % | 54 | % | 65 | % | 33 | % | ||||||||||||||||||
| (a) | Calculated using the average shares method. |
| (b) | The per share amount does not correspond to activity reflected in the Statement of Operations due to class specific expenses during the period. |
| (c) | The total return calculation excludes any sales charges. |
| (d) | The Fund’s operating expenses, not including interest expense, are contractually limited to the amounts discussed in Note 3. The ratios in these financial highlights reflect the limitation, including the interest expense, when applicable. |
The accompanying notes are an integral part of the financial statements.
| ||
| Annual Report | September 30, 2017 | 49 | |
Table of Contents
| ICON Fund | Financial Highlights | |
| For a Share Outstanding Throughout the Years Presented |
| Class A | Year Ended September 30, 2017 | Year Ended September 30, 2016 | Year Ended September 30, 2015 | Year Ended September 30, 2014 | Year Ended September 30, 2013 | |||||||||||||||||||||||
Net asset value, beginning of period | $ | 13.31 | $ | 13.13 | $ | 13.84 | $ | 13.39 | $ | 10.85 | ||||||||||||||||||
Income/(loss) from investment operations: | ||||||||||||||||||||||||||||
Net investment income/ | (0.07) | 0.00 | (c) | (0.08) | (0.05) | 0.02 | ||||||||||||||||||||||
Net realized and unrealized gains/(losses) on investments | 4.36 | 0.18 | (0.63) | 0.50 | 2.56 | |||||||||||||||||||||||
Total from investment operations | 4.29 | 0.18 | (0.71) | 0.45 | 2.58 | |||||||||||||||||||||||
Less dividends and distributions: | ||||||||||||||||||||||||||||
Dividends from net investment income | – | – | – | – | (0.04) | |||||||||||||||||||||||
Total dividends and distributions | – | – | – | – | (0.04) | |||||||||||||||||||||||
Net asset value, end of period | $ | 17.60 | $ | 13.31 | $ | 13.13 | $ | 13.84 | $ | 13.39 | ||||||||||||||||||
Total Return(d) | 32.23 | % | 1.37 | % | (5.13) | % | 3.36 | % | 23.90 | % | ||||||||||||||||||
Ratios and Supplemental Data | ||||||||||||||||||||||||||||
Net assets, end of period (in 000s) | $ | 5,156 | $ | 5,490 | $ | 6,994 | $ | 8,076 | $ | 10,000 | ||||||||||||||||||
Ratio of expenses to average net assets | ||||||||||||||||||||||||||||
Before expense limitation | 1.66 | % | 1.67 | % | 1.55 | % | 1.56 | % | 1.58 | % | ||||||||||||||||||
After expense limitation(e) | 1.50 | % | 1.51 | % | 1.50 | % | 1.50 | % | 1.51 | % | ||||||||||||||||||
Ratio of net investment income/(loss) to average net assets | ||||||||||||||||||||||||||||
Before expense limitation | (0.60) | % | (0.16) | % | (0.57) | % | (0.38) | % | 0.12 | % | ||||||||||||||||||
After expense limitation(e) | (0.44) | % | 0.00% | (f) | (0.52) | % | (0.32) | % | 0.19 | % | ||||||||||||||||||
Portfolio turnover rate | 15 | % | 31 | % | 54 | % | 65 | % | 33 | % | ||||||||||||||||||
| (a) | Calculated using the average shares method. |
| (b) | The per share amount does not correspond to activity reflected in the Statement of Operations due to class specific expenses during the period. |
| (c) | Amount less than $0.005. |
| (d) | The total return calculation excludes any sales charges. |
| (e) | The Fund’s operating expenses, not including interest expense, are contractually limited to the amounts discussed in Note 3. The ratios in these financial highlights reflect the limitation, including the interest expense, when applicable. |
| (f) | Less than 0.005% of average net assets. |
The accompanying notes are an integral part of the financial statements.
| ||
| 50 | www.iconfunds.com | |
Table of Contents
| ICON Long/Short Fund | Financial Highlights | |
| For a Share Outstanding Throughout the Years Presented |
| Class S | Year Ended September 30, 2017 | Year Ended September 30, 2016 | Year Ended September 30, 2015 | Year Ended September 30, 2014 | Year Ended September 30, 2013 | |||||||||||||||||||||||
Net asset value, beginning of period | $ | 18.70 | $ | 18.39 | $ | 18.41 | $ | 17.48 | $ | 14.56 | ||||||||||||||||||
Income/(loss) from investment operations: | ||||||||||||||||||||||||||||
Net investment income/(loss)(a)(b) | (0.04) | 0.04 | (0.09) | (0.06) | 0.01 | |||||||||||||||||||||||
Net realized and unrealized gains/(losses) on investments | 6.47 | 0.27 | 0.07 | 0.99 | 2.91 | |||||||||||||||||||||||
Total from investment operations | 6.43 | 0.31 | (0.02) | 0.93 | 2.92 | |||||||||||||||||||||||
Net asset value, end of period | $ | 25.13 | $ | 18.70 | $ | 18.39 | $ | 18.41 | $ | 17.48 | ||||||||||||||||||
Total Return | 34.39 | % | 1.69 | % | (0.11) | % | 5.32 | % | 20.05 | % | ||||||||||||||||||
Ratios and Supplemental Data | ||||||||||||||||||||||||||||
Net assets, end of period (in 000s) | $ | 11,259 | $ | 7,114 | $ | 17,196 | $ | 16,465 | $ | 4,774 | ||||||||||||||||||
Ratio of expenses to average net assets | ||||||||||||||||||||||||||||
Before expense limitation | 1.50 | % | 1.63 | % | 1.37 | % | 1.45 | % | 1.53 | % | ||||||||||||||||||
After expense limitation(c) | 1.25 | % | 1.28 | % | 1.28 | % | 1.32 | % | 1.32 | % | ||||||||||||||||||
Ratio of net investment income/(loss) to average net assets | ||||||||||||||||||||||||||||
Before expense limitation | (0.43) | % | (0.11) | % | (0.52) | % | (0.47) | % | (0.14) | % | ||||||||||||||||||
After expense limitation(c) | (0.18) | % | 0.24 | % | (0.43) | % | (0.34) | % | 0.07 | % | ||||||||||||||||||
Portfolio turnover rate | 24 | % | 20 | % | 74 | % | 65 | % | 33 | % | ||||||||||||||||||
| (a) | Calculated using the average shares method. |
| (b) | The per share amount does not correspond to activity reflected in the Statement of Operations due to class specific expenses during the period. |
| (c) | The Fund’s operating expenses, not including interest expense or dividends on short positions, are contractually limited to the amounts discussed in Note 3. The ratios in these financial highlights reflect the limitation, including the interest expense and dividends on short positions, when applicable. |
The accompanying notes are an integral part of the financial statements.
| ||
| Annual Report | September 30, 2017 | 51 | |
Table of Contents
| ICON Long/Short Fund | Financial Highlights | |
| For a Share Outstanding Throughout the Years Presented |
| Class C | Year Ended 2017 | Year Ended 2016 | Year Ended 2015 | Year Ended 2014 | Year Ended 2013 | ||||||||||||||||||||
Net asset value, beginning of period | $ | 16.65 | $ | 16.54 | $ | 16.74 | $ | 16.05 | $ | 13.52 | |||||||||||||||
Income/(loss) from investment operations: | |||||||||||||||||||||||||
Net investment income/(loss)(a)(b) | (0.25) | (0.13) | (0.27) | (0.24) | (0.14) | ||||||||||||||||||||
Net realized and unrealized gains/(losses) on investments | 5.73 | 0.24 | 0.07 | 0.93 | 2.67 | ||||||||||||||||||||
Total from investment operations | 5.48 | 0.11 | (0.20) | 0.69 | 2.53 | ||||||||||||||||||||
Net asset value, end of period | $ | 22.13 | $ | 16.65 | $ | 16.54 | $ | 16.74 | $ | 16.05 | |||||||||||||||
Total Return(c) | 32.91 | % | 0.67 | % | (1.19) | % | 4.30 | % | 18.71 | % | |||||||||||||||
Ratios and Supplemental Data | |||||||||||||||||||||||||
Net assets, end of period (in 000s) | $ | 4,671 | $ | 4,211 | $ | 6,300 | $ | 6,932 | $ | 6,108 | |||||||||||||||
Ratio of expenses to average net assets | |||||||||||||||||||||||||
Before expense limitation | 2.75 | % | 2.76 | % | 2.53 | % | 2.57 | % | 2.62 | % | |||||||||||||||
After expense limitation(d) | 2.30 | % | 2.33 | % | 2.33 | % | 2.38 | % | 2.37 | % | |||||||||||||||
Ratio of net investment income/(loss) to average net assets | |||||||||||||||||||||||||
Before expense limitation | (1.69) | % | (1.21) | % | (1.68) | % | (1.58) | % | (1.21) | % | |||||||||||||||
After expense limitation(d) | (1.24) | % | (0.78) | % | (1.48) | % | (1.39) | % | (0.96) | % | |||||||||||||||
Portfolio turnover rate | 24 | % | 20 | % | 74 | % | 65 | % | 33 | % | |||||||||||||||
| (a) | Calculated using the average shares method. |
| (b) | The per share amount does not correspond to activity reflected in the Statement of Operations due to class specific expenses during the period. |
| (c) | The total return calculation excludes any sales charges. |
| (d) | The Fund’s operating expenses, not including interest expense or dividends on short positions, are contractually limited to the amounts discussed in Note 3. The ratios in these financial highlights reflect the limitation, including the interest expense and dividends on short positions, when applicable. |
The accompanying notes are an integral part of the financial statements.
| ||
| 52 | www.iconfunds.com | |
Table of Contents
| ICON Long/Short Fund | Financial Highlights | |
| For a Share Outstanding Throughout the Years Presented |
| Class A | Year Ended September 30, 2017 | Year Ended September 30, 2016 | Year Ended September 30, 2015 | Year Ended September 30, 2014 | Year Ended September 30, 2013 | ||||||||||||||||||||
Net asset value, beginning of period | $ | 18.16 | $ | 17.91 | $ | 17.99 | $ | 17.13 | $ | 14.31 | |||||||||||||||
Income/(loss) from investment operations: | |||||||||||||||||||||||||
Net investment income/(loss)(a)(b) | (0.11) | (0.01) | (0.15) | (0.12) | (0.02) | ||||||||||||||||||||
Net realized and unrealized gains/(losses) on investments | 6.28 | 0.26 | 0.07 | 0.98 | 2.84 | ||||||||||||||||||||
Total from investment operations | 6.17 | 0.25 | (0.08) | 0.86 | 2.82 | ||||||||||||||||||||
Net asset value, end of period | $ | 24.33 | $ | 18.16 | $ | 17.91 | $ | 17.99 | $ | 17.13 | |||||||||||||||
Total Return(c) | 33.98 | % | 1.40 | % | (0.44) | % | 5.02 | % | 19.71 | % | |||||||||||||||
Ratios and Supplemental Data | |||||||||||||||||||||||||
Net assets, end of period (in 000s) | $ | 7,003 | $ | 5,316 | $ | 9,186 | $ | 11,160 | $ | 8,813 | |||||||||||||||
Ratio of expenses to average net assets | |||||||||||||||||||||||||
Before expense limitation | 1.93 | % | 1.95 | % | 1.73 | % | 1.81 | % | 1.91 | % | |||||||||||||||
After expense limitation(d) | 1.55 | % | 1.58 | % | 1.58 | % | 1.63 | % | 1.61 | % | |||||||||||||||
Ratio of net investment income/(loss) to average net assets | |||||||||||||||||||||||||
Before expense limitation | (0.87) | % | (0.40) | % | (0.89) | % | (0.82) | % | (0.45) | % | |||||||||||||||
After expense limitation(d) | (0.49) | % | (0.03) | % | (0.74) | % | (0.64) | % | (0.16) | % | |||||||||||||||
Portfolio turnover rate | 24 | % | 20 | % | 74 | % | 65 | % | 33 | % | |||||||||||||||
| (a) | Calculated using the average shares method. |
| (b) | The per share amount does not correspond to activity reflected in the Statement of Operations due to class specific expenses during the period. |
| (c) | The total return calculation excludes any sales charges. |
| (d) | The Fund’s operating expenses, not including interest expense or dividends on short positions, are contractually limited to the amounts discussed in Note 3. The ratios in these financial highlights reflect the limitation, including the interest expense and dividends on short positions, when applicable. |
The accompanying notes are an integral part of the financial statements.
| ||
| Annual Report | September 30, 2017 | 53 | |
Table of Contents
| ICON Opportunities Fund | Financial Highlights | |
| For a Share Outstanding Throughout the Years Presented |
| Year Ended September 30, 2017 | Year Ended September 30, 2016 | Year Ended September 30, 2015 | Year Ended September 30, 2014 | Year Ended September 30, 2013(a) | |||||||||||||||||||||
Net asset value, beginning of period | $ | 14.74 | $ | 13.32 | $ | 13.04 | $ | 13.02 | $ | 10.00 | |||||||||||||||
Income/(loss) from investment operations: | |||||||||||||||||||||||||
Net investment income/(loss)(b) | (0.13) | (0.03) | (0.09) | (0.12) | (0.01) | ||||||||||||||||||||
Net realized and unrealized gains/(losses) on investments | 4.48 | 1.46 | 0.58 | 0.41 | (c) | 3.03 | |||||||||||||||||||
Total from investment operations | 4.35 | 1.43 | 0.49 | 0.29 | 3.02 | ||||||||||||||||||||
Less dividends and distributions: | |||||||||||||||||||||||||
Distributions from net realized gains | (0.21) | (0.01) | (0.21) | (0.27) | – | ||||||||||||||||||||
Total dividends and distributions | (0.21) | (0.01) | (0.21) | (0.27) | – | ||||||||||||||||||||
Net asset value, end of period | $ | 18.88 | $ | 14.74 | $ | 13.32 | $ | 13.04 | $ | 13.02 | |||||||||||||||
Total Return | 29.75 | % | 10.76 | % | 3.75 | % | 2.19 | % | 30.20 | % | |||||||||||||||
Ratios and Supplemental Data | |||||||||||||||||||||||||
Net assets, end of period (in 000s) | $ | 19,369 | $ | 16,059 | $ | 11,047 | $ | 12,133 | $ | 442 | |||||||||||||||
Ratio of expenses to average net assets | |||||||||||||||||||||||||
Before expense limitation | 1.47 | % | 1.53 | % | 1.58 | % | 2.44 | % | 12.47 | % | |||||||||||||||
After expense | 1.45% | (e) | 1.51 | % | 1.50 | % | 1.50 | % | 1.52 | % | |||||||||||||||
Ratio of net investment income/(loss) to average net assets | |||||||||||||||||||||||||
Before expense limitation | (0.80) | % | (0.27) | % | (0.72) | % | (1.81) | % | (11.02) | % | |||||||||||||||
After expense | (0.78) | % | (0.25) | % | (0.65) | % | (0.87) | % | (0.07) | % | |||||||||||||||
Portfolio turnover rate | 26 | % | 95 | % | 76 | % | 46 | % | 52 | % | |||||||||||||||
| (a) | Commenced operations on October 1, 2012. |
| (b) | Calculated using the average shares method. |
| (c) | The per share amount does not correspond to activity reflected in the Statement of Operations due to capital transactions. |
| (d) | The Fund’s operating expenses, not including interest expense, are contractually limited to the amounts discussed in Note 3. The ratios in these financial highlights reflect the limitation, including the interest expense, when applicable. |
| (e) | Effective June 30, 2017, the annual expense limitation rate changed from 1.50% to 1.30%. |
The accompanying notes are an integral part of the financial statements.
| ||
| 54 | www.iconfunds.com | |
Table of Contents
| ICON Risk-Managed Balanced Fund | Financial Highlights | |
| For a Share Outstanding Throughout the Years Presented |
| Class S | Year Ended September 30, 2017 | Year Ended September 30, 2016 | Year Ended September 30, 2015 | Year Ended September 30, 2014 | Year Ended September 30, 2013 | ||||||||||||||||||||
Net asset value, beginning of period | $ | 14.46 | $ | 14.02 | $ | 13.98 | $ | 13.40 | $ | 12.32 | |||||||||||||||
Income/(loss) from investment operations: | |||||||||||||||||||||||||
Net investment income/(loss)(a)(b) | 0.21 | 0.19 | 0.18 | 0.24 | 0.24 | ||||||||||||||||||||
Net realized and unrealized gains/(losses) on investments | 1.30 | 0.42 | 0.01 | 0.56 | 1.04 | ||||||||||||||||||||
Total from investment operations | 1.51 | 0.61 | 0.19 | 0.80 | 1.28 | ||||||||||||||||||||
Less dividends and distributions: | |||||||||||||||||||||||||
Dividends from net investment income | (0.23) | (0.17) | (0.15) | (0.22) | (0.20) | ||||||||||||||||||||
Total dividends and distributions | (0.23) | (0.17) | (0.15) | (0.22) | (0.20) | ||||||||||||||||||||
Net asset value, end of period | $ | 15.74 | $ | 14.46 | $ | 14.02 | $ | 13.98 | $ | 13.40 | |||||||||||||||
Total Return | 10.53 | % | 4.39 | % | 1.35 | % | 6.02 | % | 10.51 | % | |||||||||||||||
Ratios and Supplemental Data | |||||||||||||||||||||||||
Net assets, end of period (in 000s) | $ | 15,272 | $ | 20,087 | $ | 26,677 | $ | 20,071 | $ | 43,350 | |||||||||||||||
Ratio of expenses to average net assets | |||||||||||||||||||||||||
Before expense limitation | 1.36 | % | 1.27 | % | 1.34 | % | 1.22 | % | 1.43 | % | |||||||||||||||
After expense | 1.20 | % | 1.20 | % | 1.20 | % | 1.20 | % | 1.21 | % | |||||||||||||||
Ratio of net investment income/(loss) to average net assets | |||||||||||||||||||||||||
Before expense limitation | 1.26 | % | 1.27 | % | 1.09 | % | 1.72 | % | 1.65 | % | |||||||||||||||
After expense | 1.42 | % | 1.34 | % | 1.23 | % | 1.74 | % | 1.87 | % | |||||||||||||||
Portfolio turnover rate | 83 | % | 109 | % | 119 | % | 137 | % | 98 | % | |||||||||||||||
| (a) | Calculated using the average shares method. |
| (b) | The per share amount does not correspond to activity reflected in the Statement of Operations due to class specific expenses during the period. |
| (c) | The Fund’s operating expenses, not including interest expense, are contractually limited to the amounts discussed in Note 3. The ratios in these financial highlights reflect the limitation, including the interest expense, when applicable. |
The accompanying notes are an integral part of the financial statements.
| ||
| Annual Report | September 30, 2017 | 55 | |
Table of Contents
| ICON Risk-Managed Balanced Fund | Financial Highlights | |
| For a Share Outstanding Throughout the Years Presented |
| Class C | Year Ended September 30, 2017 | Year Ended September 30, 2016 | Year Ended September 30, 2015 | Year Ended September 30, 2014 | Year Ended September 30, 2013 | ||||||||||||||||||||
Net asset value, beginning of period | $ | 13.27 | $ | 12.89 | $ | 12.90 | $ | 12.39 | $ | 11.41 | |||||||||||||||
Income/(loss) from investment operations: | |||||||||||||||||||||||||
Net investment income/(loss)(a)(b) | 0.06 | 0.04 | 0.03 | 0.09 | 0.09 | ||||||||||||||||||||
Net realized and unrealized gains/(losses) on investments | 1.19 | 0.39 | 0.01 | 0.54 | 0.98 | ||||||||||||||||||||
Total from investment operations | 1.25 | 0.43 | 0.04 | 0.63 | 1.07 | ||||||||||||||||||||
Less dividends and distributions: | |||||||||||||||||||||||||
Dividends from net investment income | (0.10) | (0.05) | (0.05) | (0.12) | (0.09) | ||||||||||||||||||||
Total dividends and distributions | (0.10) | (0.05) | (0.05) | (0.12) | (0.09) | ||||||||||||||||||||
Net asset value, end of period | $ | 14.42 | $ | 13.27 | $ | 12.89 | $ | 12.90 | $ | 12.39 | |||||||||||||||
Total Return(c) | 9.44 | % | 3.35 | % | 0.31 | % | 5.06 | % | 9.45 | % | |||||||||||||||
Ratios and Supplemental Data | |||||||||||||||||||||||||
Net assets, end of period (in 000s) | $ | 16,583 | $ | 15,151 | $ | 13,061 | $ | 9,469 | $ | 5,667 | |||||||||||||||
Ratio of expenses to average net assets | |||||||||||||||||||||||||
Before expense limitation | 2.30 | % | 2.29 | % | 2.38 | % | 2.33 | % | 2.72 | % | |||||||||||||||
After expense | 2.20 | % | 2.20 | % | 2.20 | % | 2.20 | % | 2.22 | % | |||||||||||||||
Ratio of net investment income/(loss) to average net assets | |||||||||||||||||||||||||
Before expense limitation | 0.35 | % | 0.24 | % | 0.06 | % | 0.61 | % | 0.22 | % | |||||||||||||||
After expense | 0.45 | % | 0.33 | % | 0.24 | % | 0.74 | % | 0.72 | % | |||||||||||||||
Portfolio turnover rate | 83 | % | 109 | % | 119 | % | 137 | % | 98 | % | |||||||||||||||
| (a) | Calculated using the average shares method. |
| (b) | The per share amount does not correspond to activity reflected in the Statement of Operations due to class specific expenses during the period. |
| (c) | The total return calculation excludes any sales charges. |
| (d) | The Fund’s operating expenses, not including interest expense, are contractually limited to the amounts discussed in Note 3. The ratios in these financial highlights reflect the limitation, including the interest expense, when applicable. |
The accompanying notes are an integral part of the financial statements.
| ||
| 56 | www.iconfunds.com | |
Table of Contents
| ICON Risk-Managed Balanced Fund | Financial Highlights | |
| For a Share Outstanding Throughout the Years Presented |
| Class A | Year Ended September 30, 2017 | Year Ended September 30, 2016 | Year Ended September 30, 2015 | Year Ended September 30, 2014 | Year Ended September 30, 2013 | ||||||||||||||||||||
Net asset value, beginning of period | $ | 14.11 | $ | 13.68 | $ | 13.69 | $ | 13.12 | $ | 12.06 | |||||||||||||||
Income/(loss) from investment operations: | |||||||||||||||||||||||||
Net investment income/(loss)(a)(b) | 0.17 | 0.15 | 0.14 | 0.20 | 0.18 | ||||||||||||||||||||
Net realized and unrealized gains/(losses) on investments | 1.27 | 0.42 | 0.00 | (c) | 0.57 | 1.05 | |||||||||||||||||||
Total from investment operations | 1.44 | 0.57 | 0.14 | 0.77 | 1.23 | ||||||||||||||||||||
Less dividends and distributions: | |||||||||||||||||||||||||
Dividends from net investment income | (0.19) | (0.14) | (0.15) | (0.20) | (0.17) | ||||||||||||||||||||
Total dividends and distributions | (0.19) | (0.14) | (0.15) | (0.20) | (0.17) | ||||||||||||||||||||
Net asset value, end of period | $ | 15.36 | $ | 14.11 | $ | 13.68 | $ | 13.69 | $ | 13.12 | |||||||||||||||
Total Return(d) | 10.29 | % | 4.18 | % | 1.00 | % | 5.88 | % | 10.28 | % | |||||||||||||||
Ratios and Supplemental Data | |||||||||||||||||||||||||
Net assets, end of period (in 000s) | $ | 7,084 | $ | 9,095 | $ | 8,446 | $ | 7,014 | $ | 7,819 | |||||||||||||||
Ratio of expenses to average net assets | |||||||||||||||||||||||||
Before expense limitation | 1.64 | % | 1.60 | % | 1.70 | % | 1.65 | % | 2.12 | % | |||||||||||||||
After expense limitation(e) | 1.45 | % | 1.45 | % | 1.45 | % | 1.45 | % | 1.47 | % | |||||||||||||||
Ratio of net investment income/(loss) to average net assets | |||||||||||||||||||||||||
Before expense limitation | 0.98 | % | 0.93 | % | 0.71 | % | 1.29 | % | 0.81 | % | |||||||||||||||
After expense limitation(e) | 1.17 | % | 1.08 | % | 0.96 | % | 1.49 | % | 1.46 | % | |||||||||||||||
Portfolio turnover rate | 83 | % | 109 | % | 119 | % | 137 | % | 98 | % | |||||||||||||||
| (a) | Calculated using the average shares method. |
| (b) | The per share amount does not correspond to activity reflected in the Statement of Operations due to class specific expenses during the period. |
| (c) | Amount less than $0.005. |
| (d) | The total return calculation excludes any sales charges. |
| (e) | The Fund’s operating expenses, not including interest expense, are contractually limited to the amounts discussed in Note 3. The ratios in these financial highlights reflect the limitation, including the interest expense, when applicable. |
The accompanying notes are an integral part of the financial statements.
| ||
| Annual Report | September 30, 2017 | 57 | |
Table of Contents
| ICON Diversified Funds | Notes to Financial Statements | |
| September 30, 2017 |
1. ORGANIZATION
The Bond Fund (“Bond Fund”), ICON Equity Income Fund (“Equity Income Fund”), ICON Fund (“ICON Fund”), ICON Long/Short Fund (“Long/Short Fund”), ICON Opportunities Fund (“Opportunities Fund”) and ICON Risk-Managed Balanced Fund (“Risk-Managed Balanced Fund”) are a series of funds (individually a “Fund” and collectively, the “Funds”). The Funds are part of the ICON Funds (the “Trust”), a Massachusetts business trust registered under the Investment Company Act of 1940, as amended (the “1940 Act”) as an open-end investment management company. Each Fund, with the exception of the Opportunities Fund, offers three classes of shares: Class S, Class C and Class A. The Opportunities Fund is a single-class fund. All classes have equal rights as to earnings, assets and voting privileges except that each Class may bear different distribution fees, registration costs, legal costs, mailing and printing costs and shareholder servicing costs and each Class has exclusive voting rights with respect to its distribution plan. There are currently eleven other active Funds within the Trust. Those Funds are covered by separate prospectuses and shareholder reports.
Each Fund is authorized to issue an unlimited number of no par shares. The investment objective of the Bond Fund is to maximize total return. The investment objective of the Equity Income Fund is modest capital appreciation and income. The investment objective of the ICON Fund is long-term capital appreciation with a secondary objective of capital preservation to provide long-term growth. The investment objective of the Opportunities Fund is to provide capital appreciation. The investment objective of the Long/Short Fund is to provide capital appreciation. The investment objective of the Risk-Managed Balanced Fund is modest capital appreciation and income.
The Funds, like all investments in securities, have elements of risk, including risk of loss of principal. There is no assurance that the Funds will achieve their investment objectives and may underperform funds with similar investment objectives. An investment concentrated in sectors and industries involves greater risk and volatility than a more diversified investment. Securities of small companies generally involve greater risks than investments in larger companies. Small company securities tend to be more volatile and less liquid than equity securities of larger companies. Investing in fixed income securities such as bonds involves interest rate risk. When interest rates rise, the value of fixed income securities generally decreases. Additionally, the Bond Fund, Equity Income Fund and Risk-Managed Balanced Fund may invest in medium-and lower-quality debt securities. High-yield bonds, also known as “junk bonds” are speculative investments and involve a greater risk of default and price volatility than U.S. government and other high-quality bonds. Junk bonds are also less liquid (more difficult to sell) than equities and higher credit bonds. Reduced liquidity may adversely affect the market price of, and ability of a Fund to value and sell particular securities at certain times, thereby making it difficult to make specific valuation determinations.
The Bond Fund, Equity Income Fund and Risk-Managed Balanced Fund may invest in mortgage-related securities, which are interests in pools of mortgage loans made to residential home buyers, including mortgage loans made by savings and loan institutions, mortgage bankers, commercial banks and others. Pools of mortgage loans are assembled as securities for sale to investors by various governmental and government-related organizations. The Bond Fund, Equity Income Fund and Risk-Managed Balanced Fund also may invest in debt securities that are secured with collateral consisting of mortgage related securities (a Collateralized Mortgage Obligations or “CMO”), and in other types of mortgage-related or other asset-backed securities. CMOs are debt obligations of a legal entity that are collateralized by whole mortgage loans or private mortgage bonds and divided into classes. CMOs are typically structured into multiple classes, often referred to as “tranches,” with each class bearing a different stated maturity and entitled to a different schedule for payments of principal and interest, including prepayments. CMOs may be less liquid and may exhibit greater price volatility than other types of mortgage-related or asset-backed securities. Many of the risks of investing in mortgage-related securities secured by commercial mortgage loans reflect the effects of local and other economic conditions on real estate markets, the ability of tenants to make lease payments, and the ability of a property to attract and retain tenants. These securities may be less liquid and may exhibit greater price volatility than other types of mortgage-related or other asset-backed securities. Other asset-backed securities are created from many types of assets, including auto loans, credit card receivables, home equity loans, and student loans. The ICON Fund and Long/Short Fund also may invest in such securities for temporary defensive purposes.
The Long/Short Fund may engage in short selling; there are risks associated with selling short, including the risk that the Long/Short Fund may have to cover its short position at a higher price than the short sale, resulting in a loss. The Long/Short Fund’s loss on a short sale is potentially unlimited as a loss occurs when the value of a security sold short increases.
The Risk-Managed Balanced Fund invests in call options; selling/writing call options involves certain risks, such as limiting gains and lack of liquidity of the underlying securities, and are not suitable for all investors.
Investments in foreign securities and currency transactions may involve certain considerations and risks not typically associated with those of U.S. dollar-denominated transactions as a result of, among other factors, the possibility of less government supervision and regulation of foreign securities markets and the possibility of political or economic instability. Financial statements of foreign companies are governed by different accounting, auditing, and financial standards than U.S. companies and may be less transparent and uniform than in the United States. Many corporate governance standards, which help ensure the integrity of public information in the United States, may not exist in some foreign
| ||
| 58 | www.iconfunds.com | |
Table of Contents
| ICON Diversified Funds | Notes to Financial Statements | |
| September 30, 2017 |
countries. In general, there may be less governmental supervision of foreign stock exchanges and securities brokers and issuers. There are also risks associated with small- and mid-cap investing, including limited product lines, less liquidity and small market share.
The Equity Income Fund has a significant weighting in the Information Technology sector, the ICON Fund has a significant weighting in the Information Technology, Financial and Consumer Discretionary sectors, the Long/Short Fund has a significant weighting in the Information Technology and Financial sectors, the Opportunities Fund has a significant weighting in the Information Technology and Consumer Discretionary sectors which may cause the Funds’ performance to be susceptible to the economic, business and/or other developments that may affect those sectors.
In the normal course of business, the Funds may enter into various agreements that provide for general indemnifications. Each Fund’s maximum exposure under these arrangements is unknown as any potential exposure involving future claims that may be made against each Fund is unknown. However, based on experience, the Funds expect the risk of loss to be remote.
2. SIGNIFICANT ACCOUNTING POLICIES
The following is a summary of significant accounting policies consistently followed by the Funds in the preparation of their financial statements. The financial statements are prepared in conformity with accounting principles generally accepted in the United States of America (“GAAP”), which requires management to make certain estimates and assumptions that affect the reported amounts of assets and liabilities, disclosure of contingent assets and liabilities at the date of the financial statements, and the reported amounts of income and expenses during the reporting period. Actual results may differ from these estimates. Each Fund is considered an investment company under GAAP and follows the accounting and reporting guidance applicable to investment companies in the Financial Accounting Standards Board Accounting Standards Codification Topic 946.
Investment Valuation
The Funds’ securities and other assets, excluding options on securities indexes, are valued at the closing price as of the close of regular trading on the New York Stock Exchange (the “NYSE”) (normally 4 p.m. Eastern Standard Time) each day the NYSE is open, except that securities traded primarily on the NASDAQ Stock Market (“NASDAQ”) are normally valued by the Funds at the NASDAQ Official Closing Price provided by NASDAQ each business day. If the NYSE closes unexpectedly and there is active trading on other exchanges, the securities will be valued at the Valuation Time based off of those exchanges. Options on securities indexes are valued at the close of the Chicago Board Options Exchange (normally 4:15 p.m. Eastern Standard Time) on each day the NYSE is open for trading.
The Funds use pricing services to obtain the fair value of securities in their portfolios. If a pricing service is not able to provide a price, or the pricing service’s valuation is considered inaccurate or does not, in the Funds’ judgment, reflect the fair value of the security, prices may be obtained through market quotations from independent broker/dealers. If market quotations from these sources are not readily available, the Funds’ securities or other assets are valued at fair value as determined in good faith by the Funds’ Board of Trustees (the “Board”) or pursuant to procedures approved by the Board.
Lacking any sales that day, a security is valued at the current closing bid price (or yield equivalent thereof) or based on quotes obtained from dealers making a market for the security. Exchange traded options are valued at the composite price, using the National Best Bid and Offer quotes (“NBBO”). NBBO consists of the highest bid price and lowest ask price across any of the exchanges on which an option is quoted, thus providing a view across the entire U.S. options marketplace. Debt securities with a remaining maturity of greater than 60 days are valued using the evaluated bid price supplied by the pricing service. The evaluated bid price supplied by the pricing service is based upon a matrix valuation system which considers such factors as security prices, yields, maturities and ratings. Short-term debt securities with remaining maturities of 60 days or less are generally valued at amortized cost or original cost plus accrued interest, which approximates fair value. Currency rates as of the close of the NYSE are used to convert foreign security values into U.S. dollars.
Mortgage-related and asset-backed securities are typically issued as separate tranches, or classes, of securities within each deal. These securities are also normally valued by pricing service providers that use broker-dealer quotations, reported trades or valuation estimates from their internal pricing models. The pricing models for these securities usually consider tranche level attributes, current market data, estimated cash flows and market based yield spreads for each tranche, and incorporate deal collateral performance, as available. Mortgage-related and asset-backed securities that use similar valuation techniques and inputs as described above are categorized as Level 2 of the fair value hierarchy.
Securities of investment companies that trade on an exchange are valued at the last sales price or official closing price as of the close of the customary trading session on the exchange where the security is principally traded. Investments in shares of funds, including money market funds, that are not traded on an exchange are valued at the end of day net asset value (“NAV”) per share of such fund. Securities in the underlying funds, including restricted securities are valued in accordance with the valuation policy of such fund.
| ||
| Annual Report | September 30, 2017 | 59 | |
Table of Contents
| ICON Diversified Funds | Notes to Financial Statements | |
| September 30, 2017 |
The Funds’ securities traded in countries outside of the Western Hemisphere are fair valued daily by utilizing the quotations of an independent pricing service, unless the Board determines that use of another valuation methodology is appropriate. The purposes of daily fair valuation are to avoid stale prices and to take into account, among other things, any significant events occurring after the close of foreign markets. The pricing service uses statistical analyses and quantitative models to adjust local market prices using factors such as subsequent movements and changes in the prices of indexes, securities and exchange rates in other markets to determine fair value as of the time a Fund calculates its net asset value (“NAV”). The valuation assigned to fair-value securities for purposes of calculating each Fund’s NAV may differ from the security’s most recent closing market price and from the prices used by other mutual funds to calculate their NAVs.
Various inputs are used to determine the value of the Funds’ investments. These inputs are summarized in the three broad levels listed below:
Level 1 | — | quoted prices in active markets for identical securities. | ||
Level 2 | — | significant observable inputs other than Level 1 quoted prices (including, but not limited to, quoted prices for similar securities, interest rates, prepayment speeds, and credit risk). | ||
Level 3 | — | significant unobservable inputs. |
Observable inputs are those based on market data obtained from sources independent of the Funds, and unobservable inputs reflect the Funds’ own assumptions based on the best information available. The input levels are not necessarily an indication of the risk or liquidity associated with investments at that level. For example, non-U.S. equity securities actively traded in foreign markets may be reflected in Level 2 despite the availability of closing prices, because the Funds evaluate and determine whether those closing prices reflect fair value at the close of the NYSE or require adjustment, as described above. The following table summarizes the Funds’ investments, based on the inputs used to determine their values on September 30, 2017:
ICON Bond Fund
| Investments in Securities at Value* | Level 1 - Quoted and Unadjusted Prices | Level 2 - Other Significant Observable Inputs | Level 3 - Significant Unobservable Inputs | Total | ||||||||||||
Corporate Bonds | $ | – | $ | 65,871,986 | $ | – | $ | 65,871,986 | ||||||||
Convertible Corporate Bonds | – | 3,787,500 | – | 3,787,500 | ||||||||||||
U.S. Treasury Obligations | – | 2,993,828 | – | 2,993,828 | ||||||||||||
Preferred Stocks | 5,454,924 | – | – | 5,454,924 | ||||||||||||
Closed-End Mutual Funds | 8,129,436 | – | – | 8,129,436 | ||||||||||||
Collateral for Securities on Loan | – | 1,134,685 | – | 1,134,685 | ||||||||||||
| ||||||||||||||||
Total | $ | 13,584,360 | $ | 73,787,999 | $ | – | $ | 87,372,359 | ||||||||
| ||||||||||||||||
ICON Equity Income Fund
| ||||||||||||||||
| Investments in Securities at Value* | Level 1 - Quoted and Unadjusted | Level 2 - Other Significant Observable Inputs | Level 3 - Significant Unobservable Inputs | Total | ||||||||||||
Corporate Bonds | $ | – | $ | 4,689,881 | $ | – | $ | 4,689,881 | ||||||||
Convertible Corporate Bonds | – | 353,500 | – | 353,500 | ||||||||||||
Common Stocks | 74,578,194 | – | – | 74,578,194 | ||||||||||||
Preferred Stocks | 1,862,432 | – | – | 1,862,432 | ||||||||||||
Convertible Preferred Stocks | 526,000 | – | – | 526,000 | ||||||||||||
Closed-End Mutual Funds | 4,067,023 | – | – | 4,067,023 | ||||||||||||
Put Options Purchased | 7,200 | – | – | 7,200 | ||||||||||||
Collateral for Securities on Loan | – | 2,793,426 | – | 2,793,426 | ||||||||||||
| ||||||||||||||||
Total | $ | 81,040,849 | $ | 7,836,807 | $ | – | $ | 88,877,656 | ||||||||
| ||||||||||||||||
ICON Fund
| ||||||||||||||||
| Investments in Securities at Value* | Level 1 - Quoted and Unadjusted Prices | Level 2 - Other Significant Observable Inputs | Level 3 - Significant Unobservable Inputs | Total | ||||||||||||
Common Stocks | $ | 50,487,571 | $ | – | $ | – | $ | 50,487,571 | ||||||||
| ||||||||||||||||
Total | $ | 50,487,571 | $ | – | $ | – | $ | 50,487,571 | ||||||||
| ||||||||||||||||
| ||
| 60 | www.iconfunds.com | |
Table of Contents
| ICON Diversified Funds | Notes to Financial Statements | |
| September 30, 2017 |
ICON Long/Short Fund
| Investments in Securities at Value* | Level 1 - Quoted and Unadjusted Prices | Level 2 - Other Significant Observable Inputs | Level 3 - Significant Unobservable Inputs | Total | ||||||||||||
Common Stocks | $ | 22,769,776 | $ | – | $ | – | $ | 22,769,776 | ||||||||
Total | $ | 22,769,776 | $ | – | $ | – | $ | 22,769,776 | ||||||||
ICON Opportunities Fund
| ||||||||||||||||
| Investments in Securities at Value* | Level 1 - Quoted and Unadjusted Prices | Level 2 - Other Significant Observable Inputs | Level 3 - Significant Unobservable Inputs | Total | ||||||||||||
Common Stocks | $ | 19,296,965 | $ | – | $ | – | $ | 19,296,965 | ||||||||
Collateral for Securities on Loan | – | 1,213,802 | – | 1,213,802 | ||||||||||||
Total | $ | 19,296,965 | $ | 1,213,802 | $ | – | $ | 20,510,767 | ||||||||
ICON Risk-Managed Balanced Fund
| Investments in Securities at Value* | Level 1 - Quoted and Unadjusted Prices | Level 2 - Other Significant Observable Inputs | Level 3 - Significant Unobservable Inputs | Total | ||||||||||||
Corporate Bonds | $ | – | $ | 9,382,263 | $ | – | $ | 9,382,263 | ||||||||
Convertible Corporate Bonds | – | 505,000 | – | 505,000 | ||||||||||||
U.S. Treasury Obligations | – | 6,078,317 | – | 6,078,317 | ||||||||||||
Common Stocks | 17,622,969 | – | – | 17,622,969 | ||||||||||||
Preferred Stocks | 816,493 | – | – | 816,493 | ||||||||||||
Closed-End Mutual Funds | 2,656,653 | – | – | 2,656,653 | ||||||||||||
Exchange Traded Funds | 387,882 | – | – | 387,882 | ||||||||||||
Put Options Purchased | 1,350 | – | – | 1,350 | ||||||||||||
Collateral for Securities on Loan | – | 546,525 | – | 546,525 | ||||||||||||
Total | $ | 21,485,347 | $ | 16,512,105 | $ | – | $ | 37,997,452 | ||||||||
| * | Please refer to the Schedule of Investments and the Sector/Industry Classification and Credit Diversification tables for additional security details. |
There were no Level 3 securities held in any of the Funds at September 30, 2017.
For the year ended September 30, 2017, there was no transfer activity between Level 1, Level 2 or Level 3.
The end of period timing recognition is used for transfers between levels of each Fund’s assets and liabilities.
Fund Share Valuation
Fund shares are sold and redeemed on a daily basis at the NAV. NAV per share is determined daily as of the close of trading on the NYSE on each day the NYSE is open for trading. The NAV is computed by dividing the total value of each Fund’s investments and other assets, less liabilities, by the number of Fund shares outstanding.
Cash and Cash Equivalents
Idle cash may be swept into various overnight demand deposits and is classified as cash and cash equivalents on the Statements of Assets and Liabilities. The Funds maintain cash in bank deposit accounts which, at times, may exceed United States federally insured limits. Amounts swept overnight are available on the next business day.
| ||
| Annual Report | September 30, 2017 | 61 | |
Table of Contents
| ICON Diversified Funds | Notes to Financial Statements | |
| September 30, 2017 |
Foreign Currency Translation
The accounting records of the Funds are maintained in U.S. dollars. Investment securities and other assets and liabilities denominated in a foreign currency are translated daily into U.S. dollars at the prevailing rates of exchange. Income and expenses are translated into U.S. dollars at the prevailing exchange rate on the respective dates of the transactions. Purchases and sales of securities are translated into U.S. dollars at the contractual currency exchange rates established at the time of each trade.
The Funds do not isolate that portion of the results of operations resulting from changes in foreign exchange rates on investments from the fluctuations arising from changes in market prices of securities held. Net unrealized appreciation or depreciation on investments and foreign currency translations arise from changes in the value of assets and liabilities resulting from changes in the exchange rates and changes in market prices of securities held.
Options Transactions
The Funds’ use of derivatives for the year ended September 30, 2017 was limited to purchased and written options.
The Risk-Managed Balance Fund’s primary investment strategy involves the use of options. Each of the other Funds may also purchase and/or write (sell) call and put options on any security in which it may invest. A Fund may use derivatives to hedge risks inherent in its portfolio, to enhance the potential return of its portfolio, to diversify its portfolio, as a substitute for taking a position in an underlying asset, to reduce transaction costs associated with managing a portfolio, or to implement an investment strategy through investments that may be more tax-efficient than a direct equity investment.
Option contracts involve market risk and liquidity risk and can be highly volatile. Should prices of securities or securities indexes move in an unexpected manner, the Funds may not achieve the desired benefits and may realize losses and thus be in a worse position than if such strategies had not been utilized.
When a Fund writes a put or call option, an amount equal to the premium received is included on the Statements of Assets and Liabilities as a liability. The amount of the liability is subsequently marked-to-market to reflect the current fair value of the option. If an option expires on its stipulated expiration date or if the Fund enters into a closing purchase transaction, a gain or loss is realized. If a written call option on an individual security is exercised, a gain or loss is realized for the sale of the underlying security, and the proceeds from the sale are increased by the premium originally received. If a written call option on a securities index is exercised, a gain or loss is realized as determined by the premium originally received, the exercise price and the fair value of the index. If a written put option on an individual security is exercised, the cost of the security acquired is decreased by the premium originally received. As a writer of an option, a Fund bears the market risk of an unfavorable change in the price of the individual security or securities index underlying the written option. Additionally, written call options may involve the risk of limiting gains.
Each Fund may also purchase put and call options. When a Fund purchases a put or call option, an amount equal to the premium paid is included on the Fund’s Statement of Assets and Liabilities as an investment, and is subsequently marked-to-market to reflect the current fair value of the option. If an option expires on the stipulated expiration date or if the Fund enters into a closing purchase or sale transaction, a gain or loss is realized. If the Fund exercises a call option on an individual security, the cost of the security acquired is increased by the premium paid for the call. If the Fund exercises a put option on an individual security, a gain or loss is realized from the sale of the underlying security, and the proceeds from such a sale are decreased by the premium originally paid. If the Fund exercises a put or a call option on a security index, a gain or loss is realized as determined by the premium originally paid, the exercise price and the fair value of the index. Written and purchased options are non-income producing securities.
For the year ended September 30, 2017, the Equity Income Fund engaged in purchased put option transactions and the Risk-Managed Balanced Fund engaged in written call and purchased put options transactions. All open option contracts are included on each Fund’s Schedule of Investments. The Risk-Managed Balanced Fund’s written options were collateralized by cash and/or securities held in a segregated account at the Fund’s custodian during the year. The securities pledged as collateral would be included on the Schedule of Investments if they were held at year end. Such collateral is restricted from the Fund’s use. The cash collateral held for the custodian and/or borrowings from the custodian, if any, is included on the Statements of Assets and Liabilities.
| 62 | www.iconfunds.com | |
Table of Contents
| ICON Diversified Funds | Notes to Financial Statements | |
| September 30, 2017 |
The following is a summary of how these derivatives are treated in the financial statements and their impact on the Funds:
| ICON Equity Income Fund | Asset Derivatives | Liability Derivatives | ||||||||||||||
|
| |||||||||||||||
| Risk Exposure | Statements of Assets and Liabilities Location | Fair Value | Statements of Assets and Liabilities Location | Fair Value | ||||||||||||
| ||||||||||||||||
Equity Contracts (Purchased Options) | Investments, at value | $ | 7,200 | N/A | N/A | |||||||||||
| ||||||||||||||||
Total | $ | 7,200 | $ | – | ||||||||||||
| ||||||||||||||||
| ICON Risk-Managed Balanced Fund | Asset Derivatives | Liability Derivatives | ||||||||||||||
|
| |||||||||||||||
| Risk Exposure | Statements of Assets and Liabilities Location | Fair Value | Statements of Assets and Liabilities Location | Fair Value | ||||||||||||
| ||||||||||||||||
Equity Contracts (Purchased Options) | Investments, at value | $ | 1,350 | N/A | N/A | |||||||||||
| ||||||||||||||||
Total | $ | 1,350 | $ | – | ||||||||||||
| ||||||||||||||||
| Realized Gain/(Loss) on | Change in Unrealized Appreciation/ (Depreciation) | |||||||||
| ICON Equity Income Fund | Derivatives | on Derivatives | ||||||||
| Recognized | Recognized | |||||||||
| Risk Exposure | Statements of Operations Location | in Income | in Income | |||||||
| ||||||||||
Equity Contracts | Net realized gain/(loss) on Investments and foreign currency translations/Change in unrealized net appreciation/(depreciation) on Investments and foreign currency | $ | (838,127 | ) | $ | 58,666 | ||||
| ||||||||||
Total | $ | (838,127 | ) | $ | 58,666 | |||||
| ||||||||||
| Realized Gain/(Loss) on | Change in Unrealized Appreciation/ (Depreciation) | |||||||||
| ICON Risk-Managed Balanced Fund | Derivatives | on Derivatives | ||||||||
| Recognized | Recognized | |||||||||
| Risk Exposure | Statements of Operations Location | in Income | in Income | |||||||
| ||||||||||
Equity Contracts | Net realized gain/(loss) on Investments and foreign currency translations/Change in unrealized net appreciation/(depreciation) on Investments and foreign currency | $ | (659,358) | $ | 288,132 | |||||
Equity Contracts | Net realized gain/(loss) on written options/Change in unrealized appreciation/(depreciation) on written options | 26,394 | – | |||||||
| ||||||||||
Total | $ | (632,964) | $ | 288,132 | ||||||
| ||||||||||
| Annual Report | September 30, 2017 | 63 | |
Table of Contents
| ICON Diversified Funds | Notes to Financial Statements | |
| September 30, 2017 |
The average purchased and written option contracts during the year ended September 30, 2017, was as follows:
ICON Equity Income Fund
| Derivative Type | Unit of Measurement | Average Contracts+ | Days Held | |||
Purchased Options | Contracts | 401 | 338 | |||
| ICON Risk-Managed Balanced Fund | ||||||
| Derivative Type | Unit of Measurement | Average Contracts+ | Days Held | |||
Purchased Options | Contracts | 70 | 365 | |||
Written Options | Contracts | 17 | 140 | |||
| + | The average is calculated based on the actual number of days with outstanding derivatives. |
The Funds value derivatives at fair value, as described above, and recognize changes in fair value currently in the results of operations. Accordingly, the Funds do not follow hedge accounting, even for derivatives employed as economic hedges.
Short Sales
The Long/Short Fund may engage in short sales (selling securities it does not own) as part of its normal investment activities. The Long/Short Fund enters into short positions in equity securities identified as being overvalued in management’s opinion.
Short sales involve market risk. If a security sold short increases in price, the Long/Short Fund may have to cover its short position at a higher price than the short sale price, resulting in a loss. These short sales are collateralized by cash and/or securities held with the Fund’s prime broker and in a segregated account at the Funds’ prime broker. The collateral required is determined daily by reference to the fair value of the short positions. Such collateral for the Fund is restricted from use. The cash collateral that is restricted from use is included on the Statements of Assets and Liabilities as “Deposits for short sales.” The securities pledged as collateral that are restricted from use are included on the Schedule of Investments. Dividends received on short sales are treated as an expense on the Statements of Operations. Liabilities for securities sold short are closed out by purchasing the applicable securities for delivery to the Fund’s prime broker. As of and for the year ended September 30, 2017, the Long/Short Fund did not engage in short selling.
Securities Lending
Under procedures adopted by the Board, the Funds may lend securities to certain approved brokers, dealers and other financial institutions to earn additional income. Cash collateral is received in exchange for securities on loan in the amount of at least 102% of the value of U.S. securities loaned or at least 105% of the value of non-U.S. securities loaned, marked to market daily. The Funds retain certain benefits of owning the securities, including receipt of dividends or interest generated by the security, but give up other rights including the right to vote proxies. The Funds retain the ability to recall the loans at any time and could do so in order to vote proxies or to sell the loaned securities. Each loan is collateralized by cash that generally exceeds the value of the securities on loan. The fair value of the loaned securities is determined daily at the close of business of the Funds and any additional required collateral is delivered to each Fund on the next business day.
Generally, in the event of borrower default, the Funds have the right to use the collateral to offset any losses incurred. In the event the Funds are delayed or prevented from exercising their rights to dispose of the collateral, there may be a potential loss to the Funds. Some of these losses may be indemnified by the lending agent.
Effective October 14, 2016, the Funds have elected to invest the cash collateral received from lending in the State Street Navigator Securities Lending Government Money Market Portfolio which is disclosed on the Schedules of Investments. Prior to October 14, 2016, the Funds used the State Street Navigator Prime Portfolio. The Funds bear the risk of loss with respect to the investment of collateral. The net securities lending income earned by the Funds for the year ended September 30, 2017, is included in the Statements of Operations.
| ||
| 64 | www.iconfunds.com | |
Table of Contents
| ICON Diversified Funds | Notes to Financial Statements | |
| September 30, 2017 |
The following table indicates the total amount of securities loaned by type, reconciled to gross liability payable upon return of the securities loaned by the Funds as of September 30, 2017:
| Remaining contractual maturity of the lending agreement | ||||||||||||||||||||||||||||
Overnight & Continuous | Up to 30 days | 30-90 days | Greater than 90 days | Fair Value | Collateral Received | Excess amount due to counterparty | ||||||||||||||||||||||
Securities Lending Transactions | ||||||||||||||||||||||||||||
ICON Bond Fund | ||||||||||||||||||||||||||||
Corporate Securities | $ | 1,057,702 | $ | – | $ | – | $ | – | $ | 1,057,702 | $ | 1,057,702 | $ | 32,408 | ||||||||||||||
Equity Securities | 39,795 | – | – | – | 39,795 | 39,795 | 4,780 | |||||||||||||||||||||
Total | 1,097,497 | 1,097,497 | 37,188 | |||||||||||||||||||||||||
ICON Equity Income Fund | ||||||||||||||||||||||||||||
Equity Securities | 2,739,447 | – | – | – | 2,739,447 | 2,739,447 | 53,979 | |||||||||||||||||||||
ICON Opportunities Fund | ||||||||||||||||||||||||||||
Equity Securities | 1,187,477 | – | – | – | 1,187,477 | 1,187,477 | 26,325 | |||||||||||||||||||||
ICON Risk-Managed Balanced Fund | ||||||||||||||||||||||||||||
Corporate Securities | 207,750 | – | – | – | 207,750 | 207,750 | 5,250 | |||||||||||||||||||||
Equity Securities | 330,817 | – | – | – | 330,817 | 330,817 | 2,708 | |||||||||||||||||||||
Total | 538,567 | 538,567 | 7,958 | |||||||||||||||||||||||||
Income Taxes, Dividends, and Distributions
The Funds intend to continue to qualify as regulated investment companies under Subchapter M of the Internal Revenue Code and, accordingly, the Funds will generally not be subject to federal and state income taxes or federal excise taxes to the extent that they intend to make sufficient distributions of net investment income and net realized capital gains. As of and during the year ended September 30, 2017, the Funds did not have a liability for any unrecognized tax benefits in the accompanying financial statements. The Funds recognize the interest and penalties, if any, related to the unrecognized tax benefits as income tax expense in the Statements of Operations. During the period, the Funds did not incur any interest or penalties.
Dividends paid by the Funds from net investment income and distributions of net realized short-term gains are, for federal income tax purposes, taxable as ordinary income to shareholders.
Dividends and distributions to shareholders are recorded by the Funds on the ex-dividend/distribution date. The Bond Fund distributes net investment income, if any, to shareholders monthly. The Equity Income Fund and the Risk-Managed Balanced Fund intend to distribute net investment income, if any, to shareholders quarterly. The other Funds distribute income, if any, annually. The Funds distribute net realized capital gains, if any, to shareholders at least annually, if not offset by capital loss carryforwards. The Funds may utilize equalization accounting for tax purposes and designate earnings and profits, including net realized gains distributed to shareholders on redemption of shares, as part of the dividends paid deduction for income tax purposes. Income distributions and capital gain distributions are determined in accordance with income tax regulations, which may differ from GAAP.
Management has analyzed the Funds’ tax positions taken on federal income tax returns for all open tax periods and has concluded that no provision for federal income tax is required in the Funds’ financial statements.
The Funds file U.S. tax returns. While the statute of limitations remains open to examine the Funds’ U.S. tax returns filed for the past three years, no examinations are in progress or anticipated at this time. The Funds are not aware of any tax positions for which it is reasonably possible that the total amounts of unrecognized tax benefits will significantly change in the next twelve months.
Certain foreign countries impose a capital gains tax which is accrued by the Funds based on the unrealized appreciation, if any, on affected securities. Any accrual would reduce a Fund’s NAV. The tax is paid when the gain is realized and is included in capital gains tax in the Statements of Operations.
| Annual Report | September 30, 2017 | 65 | |
Table of Contents
| ICON Diversified Funds | Notes to Financial Statements | |
| September 30, 2017 |
Investment Income
Dividend income is recorded on the ex-dividend date. Non-cash dividends included in dividend income, if any, are recorded at the fair value of the securities received. Interest income is accrued as earned. Certain dividends from foreign securities are recorded as soon as the Funds are informed of the dividend if such information is obtained subsequent to the ex-dividend date. Discounts and premiums on fixed income securities purchased are accreted or amortized to income over the life of the respective securities based on the effective yield. Paydown gains and losses on mortgage-related and other asset-backed securities are recorded as components of interest income on the Statements of Operations.
Investment Transactions
Security transactions are accounted for no later than one business day after the trade date. However, for financial reporting purposes, security transactions are accounted for on the trade date. Gains and losses on securities sold are determined on the basis of identified cost.
Withholding Tax
Withholding taxes on foreign dividends have been provided for in accordance with the Funds’ understanding of the applicable country’s tax rules and rates. The ability of issuers of debt securities held by the Funds to meet their obligations may be affected by economic and political developments in specific country or region.
Other
The Funds hold certain investments which pay dividends to their shareholders based upon available funds from operations. It is possible for these dividends to exceed the underlying investments’ taxable earnings and profits resulting in the excess portion of such dividends being designated as a return of capital. Distributions received from investments in securities that represent a return of capital or capital gains are recorded as a reduction of the cost of investments or as a realized gain, respectively.
Allocation of Expenses
Each class of a Fund’s shares bears expenses incurred specifically on its behalf and, in addition, each class bears a portion of general expenses, based upon relative net assets of each class or number of shareholder accounts. Expenses which cannot be directly attributed to a specific Fund in the Trust are apportioned between all Funds in the Trust based upon relative net assets or number of shareholder accounts. In calculating the net asset value per share of each class, investment income, realized and unrealized gains and losses and expenses other than class-specific expenses are allocated daily to each class of shares based upon the proportion of net assets.
| 66 | www.iconfunds.com | |
Table of Contents
| ICON Diversified Funds | Notes to Financial Statements | |
| September 30, 2017 |
Below are additional class level expenses for the year ended September 30, 2017 that are included on the Statements of Operations:
| Fund | Printing Fees | Transfer Agent Fees* | Registration Fees | |||||||||
| ||||||||||||
ICON Bond Fund | ||||||||||||
Class S | $ | 11,802 | $ | 30,253 | $ | 20,337 | ||||||
Class C | 736 | 6,347 | 11,360 | |||||||||
Class A | 1,023 | 5,297 | 10,917 | |||||||||
ICON Equity Income Fund | ||||||||||||
Class S | 11,333 | 48,248 | 19,861 | |||||||||
Class C | 2,531 | 13,511 | 12,602 | |||||||||
Class A | 2,926 | 16,361 | 13,908 | |||||||||
ICON Fund | ||||||||||||
Class S | 7,336 | 11,182 | 17,238 | |||||||||
Class C | 2,186 | 22,363 | 13,254 | |||||||||
Class A | 1,262 | 9,514 | 11,484 | |||||||||
ICON Long/Short Fund | ||||||||||||
Class S | 2,530 | 13,798 | 12,064 | |||||||||
Class C | 1,288 | 10,231 | 12,442 | |||||||||
Class A | 1,882 | 14,492 | 13,732 | |||||||||
ICON Risk-Managed Balanced Fund | ||||||||||||
Class S | 3,696 | 25,606 | 13,525 | |||||||||
Class C | 3,202 | 16,351 | 14,633 | |||||||||
Class A | 1,730 | 9,500 | 12,875 | |||||||||
| * | Transfer agent out of pocket fees are a Fund level expense. |
3. FEES AND OTHER TRANSACTIONS WITH AFFILIATES
Investment Advisory Fees
ICON Advisers, Inc. (“ICON Advisers”) serves as investment adviser to the Funds and is responsible for managing the Funds’ portfolios of securities. ICON Advisers receives a monthly management fee that is computed daily at an annual rate of 0.60% of average daily net assets of the Bond Fund, 0.75% of average daily net assets of the Equity Income Fund, ICON Fund, Opportunities Fund and Risk-Managed Balanced Fund, and 0.85% of average daily net assets of the Long/Short Fund.
ICON Advisers has contractually agreed to limit the Funds’ expenses (exclusive of brokerage, interest, taxes, dividends on short sales, acquired fund fees and expenses and extraordinary expenses) to the extent necessary to ensure that the Funds’ expenses do not exceed the following amounts:
| Fund | Fund | Class S | Class C | Class A | ||||||||||||||||
| ||||||||||||||||||||
ICON Bond Fund | – | 0.75% | 1.60% | 1.00% | ||||||||||||||||
ICON Equity Income Fund* | – | 0.99% | 1.99% | 1.24% | ||||||||||||||||
ICON Fund | – | 1.25% | 2.25% | 1.50% | ||||||||||||||||
ICON Long/Short Fund | – | 1.25% | 2.30% | 1.55% | ||||||||||||||||
ICON Opportunities Fund** | 1.30% | – | – | – | ||||||||||||||||
ICON Risk-Managed Balanced Fund | – | 1.20% | 2.20% | 1.45% | ||||||||||||||||
| * | From October 1, 2016 to January 25, 2017, the annual expense limitation rates for the Equity Income Fund’s Class S, Class C and Class A were 1.20%, 2.20% and 1.45%, respectively. |
| ** | From October 1, 2016 to June 30, 2017, the annual expense limitation rate for the Opportunities Fund was 1.50%. |
| Annual Report | September 30, 2017 | 67 | |
Table of Contents
| ICON Diversified Funds | Notes to Financial Statements | |
| September 30, 2017 |
The Funds’ expense limitations, excluding the Bond Fund Class A, all classes of the Equity Income Fund, all classes of the ICON Fund and the Opportunities Fund, will continue in effect until at least January 31, 2021. The expense limitations for the Bond Fund Class A, all classes of the Equity Income Fund, and all classes of the ICON Fund will continue in effect until at least January 31, 2018. The expense limitation for the Opportunities Fund will continue in effect until at least January 31, 2019. To the extent ICON Advisers reimburses or absorbs fees and expenses, it may seek payment of such amounts for up to three years after the expenses were reimbursed or absorbed. A Fund will make no such payment, however, if the total Fund operating expenses exceed the expense limits in effect at the time these payments are proposed.
As of September 30, 2017, the following amounts were available for recoupment by ICON Advisers based upon their potential expiration dates:
| Fund | Expires 2018 | Expires 2019 | Expires 2020 | |||||||||
| ||||||||||||
ICON Bond Fund | $ | 180,067 | $ | 180,193 | $ | 162,616 | ||||||
ICON Equity Income Fund | 24,336 | 35,317 | 92,199 | |||||||||
ICON Fund | 4,518 | 28,516 | 16,031 | |||||||||
ICON Long/Short Fund | 50,987 | 80,331 | 66,063 | |||||||||
ICON Opportunities Fund | 8,827 | 3,029 | 3,673 | |||||||||
ICON Risk-Managed Balanced Fund | 61,973 | 44,620 | 53,919 | |||||||||
Accounting, Custody and Transfer Agent Fees
ALPS Fund Services, Inc. (“ALPS”) serves as the fund accounting agent for the Trust. For its services, the Trust pays ALPS a fee that is calculated daily and paid monthly at an annual rate based on the aggregate average daily net assets of the Trust.
State Street is the custodian of the Trust’s investments. For its services, the Trust pays State Street asset-based fees that vary according to the number of positions and transactions, plus out-of-pocket expenses.
ALPS is the Trust’s transfer agent. For these services, the Trust pays an annual fee plus annual base fee per Fund, per account fees and out-of-pocket expenses.
Administrative Services
The Trust has entered into an administrative services agreement with ICON Advisers pursuant to which ICON Advisers oversees the administration of the Trust’s business and affairs. This agreement provides for an annual fee of 0.05% on the Trust’s first $1.5 billion of average daily net assets, 0.045% on the next $1.5 billion of average daily net assets, 0.040% on the next $2 billion of average daily net assets and 0.030% on average daily net assets over $5 billion. For the year ended September 30, 2017, each Fund’s payment for administrative services to ICON Advisers is included on the Statements of Operations. The administrative services agreement provides that ICON Advisers will not be liable for any error of judgment, mistake of law, or any loss suffered by the Trust in connection with matters to which the administrative services agreement relates, except for a loss resulting from willful misfeasance, bad faith or negligence by ICON Advisers in the performance of its duties.
ICON Advisers has a sub-administration agreement, with ALPS, under which ALPS assists ICON Advisers with the administration and business affairs of the Trust. For its services, ICON Advisers pays ALPS a fee that is calculated daily and paid monthly at an annual rate based on the aggregate average daily net assets of the Trust.
Distribution Fees
ICON Distributors, Inc. (“IDI” or “Distributor”), a wholly-owned subsidiary of ICON Management and Research and affiliate of ICON Advisers, Inc., serves the Trust as Distributor. The Trust has adopted a Distribution Plan pursuant to Rule 12b-1 under the 1940 Act (“12b-1 Plan”) under which the Funds are authorized to compensate or reimburse the Distributor for the sale and distribution of shares and for other shareholder services. The Bond Fund Class C shareholders pay an annual distribution fee of 0.85% of average daily net assets and Class A shareholders pay an annual distribution fee of 0.25% of average daily net assets. The shareholders of the other Funds pay an annual distribution fee of 1.00% of average daily net assets for Class C shares and an annual distribution fee of 0.25% of average daily net assets for Class A shares. There is no annual distribution fee for Class S shares. The total amount paid by each Fund under the 12b-1 Plan is shown on the Statements of Operations.
| 68 | www.iconfunds.com | |
Table of Contents
| ICON Diversified Funds | Notes to Financial Statements | |
| September 30, 2017 |
Class A Shares are subject to an initial sales charge and the public offering price of Class A shares equals net asset value plus the applicable sales charge, which is a maximum of 5.75% (4.75% for Class A shares of the ICON Bond Fund). For the year ended September 30, 2017, IDI collected sales charges on purchases of Class A Shares, the majority of which were paid out as concessions to financial intermediaries, as follows:
| Fund | Sales Charges Collected | |||
ICON Bond Fund Class A | $ 2,471 | |||
ICON Equity Income Fund Class A | 16,766 | |||
ICON Fund Class A | 2,789 | |||
ICON Long/Short Fund Class A | 5,790 | |||
ICON Risk-Managed Balanced Fund Class A | 3,101 | |||
In addition, IDI receives a contingent deferred sales charge of 1.00% of the purchase price on redemptions of Class C shares made within one year following the date of purchase. A 1.00% contingent deferred sales charge may also apply to certain redemptions of Class A shares made within one year following the purchase of $1 million or more without an initial sales charge. For the year ended September 30, 2017, IDI collected the following contingent deferred sales charges:
| Fund | Contingent Deferred Sales Charges Collected | |||
ICON Bond Fund Class C | $ 1,606 | |||
ICON Equity Income Fund Class C | 3,013 | |||
ICON Fund Class C | 393 | |||
ICON Long/Short Fund Class C | 1,276 | |||
ICON Risk-Managed Balanced Fund Class A | 91 | |||
ICON Risk-Managed Balanced Fund Class C | 2,221 | |||
Other Related Parties
Certain Officers and Directors of ICON Advisers are also Officers and Trustees of the Funds; however, such Officers and Trustees (with the exception of the Chief Compliance Officer, “CCO”) receive no compensation from the Funds. The Trust pays a portion of the CCO’s salary and the remaining portion, along with other employee related expenses, is paid by ICON Advisers. For the year ended September 30, 2017, the total related amounts paid by the Funds under this arrangement are included in Other Expenses on the Statements of Operations.
The Funds may reimburse ICON Advisers for legal work performed for the Funds by its attorneys outside of the advisory and administration contracts. The Board reviews and approves such reimbursements. For the year ended September 30, 2017, the total related amounts accrued or paid by the Funds under this arrangement was $3,970 and is included in Other Expenses on the Statements of Operations.
During the year ended September 30, 2017, the ICON Equity Income Fund engaged in a cross trade transaction, pursuant to Rule 17a-7 under the 1940 Act, with an investment portfolio that is sub-advised by ICON Advisers. Generally, cross trading is the buying or selling of portfolio securities between funds or investment portfolios to which the Adviser serves as the investment adviser or sub-adviser. The Board previously adopted procedures that apply to transactions between the Funds and its affiliates pursuant to Rule 17a-7. At its regularly scheduled meetings, the Board reviews such transactions as of the most current calendar quarter for compliance with the requirements set forth by Rule 17a-7 and the Funds’ procedures. The procedures require that the transactions be a purchase or sale for no consideration other than cash payment against prompt delivery of a security for which market quotations are readily available, and be consistent with the investment policies of each Fund.
Transactions related to cross trades during the year ended September 30, 2017 were as follows:
| Fund | Transaction | Date | Security | Shares | Execution Price | Realized Gain/(Loss) | ||||||||
ICON Equity Income Fund | Purchase | February 8, 2017 | Pacholder High Yield Fund | 17,000.00 | $ | 7.7850 | $ – | |||||||
4. BORROWINGS
The Trust has entered into an uncommitted, unsecured, revolving Line of Credit agreement/arrangement with State Street to provide temporary funding for redemption requests. The maximum borrowing limit is $50 million. Interest on domestic borrowings is charged at a rate quoted and determined by State Street. The interest rate as of September 30, 2017 was 2.48%. The Line of Credit agreement/arrangement expires on March 19, 2018.
As of September 30, 2017, the ICON Fund had an outstanding borrowing in the amount of $108,660.
| Annual Report | September 30, 2017 | 69 | |
Table of Contents
| ICON Diversified Funds | Notes to Financial Statements | |
| September 30, 2017 |
For the year ended September 30, 2017, the average outstanding loan by Fund was as follows:
| Fund | Maximum Borrowing (10/01/16 - 9/30/17) | Average Borrowing (10/01/16 - 9/30/17)^ | Average Interest Rates (10/01/16 - 9/30/17)^ | |||||||
ICON Bond Fund* | $ | 1,140,852 | $ | 1,140,852 | 2.23% | |||||
ICON Equity Income Fund* | 269,881 | 58,969 | 2.44% | |||||||
ICON Fund | 2,002,524 | 303,689 | 2.03% | |||||||
ICON Long/Short Fund* | 498,627 | 115,486 | 1.94% | |||||||
ICON Opportunities Fund* | 211,089 | 50,566 | 2.10% | |||||||
ICON Risk-Managed Balanced Fund* | 2,920,340 | 363,446 | 1.81% | |||||||
| * | There were no outstanding borrowings under this agreement/arrangement as of September 30, 2017. |
| ^ | The average is calculated based on the actual number of days with outstanding borrowings. |
5. PURCHASES AND SALES OF INVESTMENT SECURITIES
For the year ended September 30, 2017, the aggregate cost of purchases and proceeds from sales of investment securities (excluding securities sold short, short-term securities and written options contracts) was as follows:
| Fund | Purchases of Securities | Proceeds from Sales of Securities | Purchases of Long Term U.S. Government Obligations | Proceeds from Sales of Long Term U.S. Government Obligations | ||||||||||||
ICON Bond Fund | $ | 130,659,405 | $ 123,214,725 | $ | 8,911,094 | $ | 8,781,758 | |||||||||
ICON Equity Income Fund | 172,576,814 | 159,536,769 | – | – | ||||||||||||
ICON Fund | 6,894,333 | 15,739,375 | – | – | ||||||||||||
ICON Long/Short Fund | 4,996,871 | 4,550,401 | – | – | ||||||||||||
ICON Opportunities Fund | 4,483,498 | 5,897,540 | – | – | ||||||||||||
ICON Risk-Managed Balanced Fund | 25,413,940 | 38,528,424 | 4,836,883 | 2,738,230 | ||||||||||||
6. FEDERAL INCOME TAX
The following information is presented on an income tax basis. Differences between GAAP and federal income tax purposes that are permanent in nature are reclassified within the capital accounts. Temporary differences do not require reclassification. Temporary and permanent differences do not impact the NAVs of the Funds. These differences are primarily due to differing treatments for items such as deferrals of wash sale losses, foreign currency transactions, expiring capital losses, partnership adjustments, net investment losses, and the treatment of TIPS, trust preferred securities, and paydowns.
Under the Regulated Investment Company Modernization Act of 2010 (the “Act”) capital losses generated by a Fund may be carried over indefinitely, but these losses must be used prior to the utilization of any pre-enactment capital losses. Since pre-enactment capital losses may only be carried forward for eight years there may be a greater likelihood that all or a portion of each Fund’s pre-enactment capital losses will expire unused.
For the year ended September 30, 2017, the following Funds had capital loss carryforwards:
| Fund | Expiring in 2018 | |||
ICON Equity Income Fund | $ | 15,697,877 | ||
ICON Fund | 17,897,797 | |||
ICON Long/Short Fund | 19,325,857 | |||
ICON Risk-Managed Balanced Fund | 11,869,984 | |||
| 70 | www.iconfunds.com | |
Table of Contents
| ICON Diversified Funds | Notes to Financial Statements | |
| September 30, 2017 |
Future capital loss carryforward utilization in any given year may be limited if there are substantial shareholder redemptions or contributions. During the year ended September 30, 2017, the following Funds utilized capital loss carryforwards:
| Fund | Amount | |||
ICON Bond Fund | $ | 67,069 | ||
ICON Equity Income Fund | 3,326,391 | |||
ICON Fund | 584,499 | |||
ICON Risk-Managed Balanced Fund | 1,106,682 | |||
The following Funds elect to defer to the period ending September 30, 2018, capital losses recognized during the period November 1, 2016 to September 30, 2017:
| Fund | Capital Losses Deferred | |||
ICON Bond Fund | $ | 180,901 | ||
ICON Opportunities Fund | 65,537 | |||
The following Funds elect to defer to the period ending September 30, 2018, late year ordinary losses:
| Fund | Ordinary Losses Deferred | |||
ICON Fund | $ | 155,596 | ||
ICON Long/Short Fund | 24,615 | |||
ICON Opportunities Fund | 103,428 | |||
The capital losses with no expiration were as follows:
| Fund | Short-Term | Long-Term | ||||||
ICON Bond Fund | $ | 710,170 | $ | 1,305,310 | ||||
ICON Fund | 849,251 | – | ||||||
ICON Long/Short Fund | 1,547,544 | – | ||||||
For the Long/Short Fund capital losses of $33,675,749 expired on September 30, 2017.
For the year ended September 30, 2017, the following reclassification, which had no impact on results of operations or net assets was recorded to reflect the tax character of the Funds net operating loss:
| Fund | Paid-in Capital | Accumulated Net Investment Income/(Loss) | Accumulated Net Realized Gain/(Loss) on Investments | |||||||||
ICON Bond Fund | $ | 2 | $ | 18,156 | $ | (18,158) | ||||||
ICON Equity Income Fund | – | 41,384 | (41,384) | |||||||||
ICON Fund | (25,550) | 25,550 | – | |||||||||
ICON Long/Short Fund | (33,675,749) | – | 33,675,749 | |||||||||
ICON Opportunities Fund | (60,913) | 60,913 | – | |||||||||
ICON Risk-Managed Balanced Fund | (16) | 538 | (522) | |||||||||
For ICON Fund and Opportunities Fund included in the amounts for reclassified were a net operating loss offset to paid in capital of $25,550 and $60,913, respectively.
The tax characteristics of distributions paid to shareholders during the fiscal year ended September 30, 2017, were as follows:
| Fund | Ordinary Income | Long-Term Capital Gains | ||||||
ICON Bond Fund | $ | 3,291,245 | $ | – | ||||
ICON Equity Income Fund | 2,542,191 | – | ||||||
ICON Opportunities Fund | – | 221,532 | ||||||
ICON Risk-Managed Balanced Fund | 433,548 | – | ||||||
| Annual Report | September 30, 2017 | 71 | |
Table of Contents
| ICON Diversified Funds | Notes to Financial Statements | |
| September 30, 2017 |
The tax characteristics of distributions paid to shareholders during the fiscal year ended September 30, 2016, were as follows:
| Fund | Ordinary Income | Long-Term Capital Gains | ||||||
ICON Bond Fund | $ | 2,950,335 | $ | – | ||||
ICON Equity Income Fund | 1,921,339 | – | ||||||
ICON Opportunities Fund | – | 10,170 | ||||||
ICON Risk-Managed Balanced Fund | 453,746 | – | ||||||
As of September 30, 2017, the components of accumulated earnings/(deficit) on a tax basis were as follows:
| Fund | Undistributed Ordinary Income | Accumulated Capital Gains/(Losses) | Other Cumulative Effect of Timing Differences | Unrealized Appreciation/(Depreciation)* | Total Accumulated Earnings/(Deficit) | ||||||||||||||||||||
ICON Bond Fund | $ | 64,493 | $ | (2,196,381) | $ | (5,118) | $ | (185,449) | $ | (2,322,455) | |||||||||||||||
ICON Equity Income Fund | 209,345 | (15,697,877) | 3,400 | 5,500,015 | (9,985,117) | ||||||||||||||||||||
ICON Fund | – | (18,747,048) | (155,596) | 13,149,670 | (5,752,974) | ||||||||||||||||||||
ICON Long/Short Fund | – | (20,873,401) | (24,615) | 5,489,405 | (15,408,611) | ||||||||||||||||||||
ICON Opportunities Fund | – | 227,029 | (168,965) | 5,340,538 | 5,398,602 | ||||||||||||||||||||
ICON Risk-Managed Balanced Fund | 10,980 | (11,869,984) | 955 | 2,395,257 | (9,462,792) | ||||||||||||||||||||
| * | Differences between the book-basis and tax-basis unrealized appreciation/(depreciation) are attributable primarily to tax deferral of losses on wash sales and mark-to-market adjustments on passive foreign investment companies and options. |
As of September 30, 2017, cost on investments for federal income tax purposes and the amount of net unrealized appreciation/(depreciation) were as follows:
| Fund | Gross Appreciation (excess of value over tax cost) | Gross Depreciation (excess of tax cost over value) | Net Appreciation/(Depreciation) of Foreign Currency | Net Unrealized Appreciation/ (Depreciation) | Cost of Investments for Income Tax Purposes | ||||||||||||||||||||
ICON Bond Fund | $ | 412,325 | $ | (597,774) | $ | – | $ | (185,449) | $ | 87,557,808 | |||||||||||||||
ICON Equity Income Fund | 6,622,051 | (1,122,047) | 11 | 5,500,015 | 83,377,652 | ||||||||||||||||||||
ICON Fund | 13,541,880 | (392,210) | – | 13,149,670 | 37,337,901 | ||||||||||||||||||||
ICON Long/Short Fund | 5,680,462 | (191,057) | – | 5,489,405 | 17,280,371 | ||||||||||||||||||||
ICON Opportunities Fund | 5,468,384 | (127,846) | – | 5,340,538 | 15,170,229 | ||||||||||||||||||||
ICON Risk-Managed Balanced Fund | 3,102,919 | (707,660) | (2) | 2,395,257 | 35,602,193 | ||||||||||||||||||||
7. RECENT ACCOUNTING PRONOUNCEMENT
In December 2016, the Financial Accounting Standards Board (“FASB”) issued Accounting Standards Update (“ASU”) 2016-19, “Technical Corrections and Improvements.” It includes an update to Accounting Standards Codification Topic 820 (“Topic 820”), Fair Value Measurement. The update to Topic 820 clarifies the difference between a valuation approach and a valuation technique. It also requires disclosure when there has been a change in either or both a valuation approach and/or a valuation technique. The changes related to Topic 820 are effective for annual reporting periods, including interim periods within those annual periods, beginning after December 15, 2016. Management is currently evaluating the impact of the ASU to the financial statements.
8. SUBSEQUENT EVENTS
Donovan J. (Jerry) Paul is the Portfolio Manager of the Bond Fund. Mr. Paul became Co-Portfolio Manager of the Fund in March 2014.
Effective with the Fund’s prospectus filing in January 2018, the Bond Fund will change its name to the ICON Flexible Bond Fund. Its principal investment strategies will remain the same.
Donovan J. (Jerry) Paul, Craig T. Callahan and Scott Callahan are the Co-Portfolio Managers of the Risk-Managed Balanced Fund. Mr. Paul became Co-Portfolio Manager of the Fund in March 2014, primarily managing the fixed income portion of the Portfolio. Craig T. Callahan and Scott Callahan became Co-Portfolio Managers in November 2017, primarily managing the equity portion of the Portfolio.
| 72 | www.iconfunds.com | |
Table of Contents
| ICON Diversified Funds | Report of Independent Registered Public Accounting Firm | |
To the Shareholders and Board of Trustees of
ICON Funds
We have audited the accompanying statements of assets and liabilities, including the schedules of investments, of ICON Bond Fund, ICON Equity Income Fund, ICON Fund, ICON Long/Short Fund, ICON Opportunities Fund, and ICON Risk-Managed Balanced Fund (the “Funds”), each a series of ICON Funds, as of September 30, 2017, and the related statements of operations for the year then ended, and the statements of changes in net assets and the financial highlights for each of the two years in the period then ended. These financial statements and financial highlights are the responsibility of the Funds’ management. Our responsibility is to express an opinion on these financial statements and financial highlights based on our audits. The Funds’ financial statements and financial highlights for the years ended September 30, 2015 and prior, were audited by other auditors, whose report dated November 18, 2015 expressed an unqualified opinion on those financial statements and financial highlights.
We conducted our audits in accordance with the standards of the Public Company Accounting Oversight Board (United States). Those standards require that we plan and perform the audit to obtain reasonable assurance about whether the financial statements and financial highlights are free of material misstatement. An audit includes examining, on a test basis, evidence supporting the amounts and disclosures in the financial statements. Our procedures included confirmation of securities owned as of September 30, 2017, by correspondence with the custodian and brokers or by other appropriate auditing procedures where replies from brokers or counterparties were not received. An audit also includes assessing the accounting principles used and significant estimates made by management, as well as evaluating the overall financial statement presentation. We believe that our audits provide a reasonable basis for our opinion.
In our opinion, the financial statements and financial highlights referred to above present fairly, in all material respects, the financial position of each of the Funds as of September 30, 2017, the results of their operations for the year then ended, and the statements of changes in their net assets and the financial highlights for each of the two years in the period then ended, in conformity with accounting principles generally accepted in the United States of America.

COHEN & COMPANY, LTD.
Cleveland, Ohio
November 22, 2017
| Annual Report | September 30, 2017 | 73 | |
Table of Contents
| ICON Diversified Funds | Disclosure of Fund Expenses | |
| September 30, 2017 (Unaudited) |
Example
As a shareholder of a Fund you may pay two types of fees: transaction fees and fund-related fees. Certain funds charge transaction fees, including sales charges (loads) on purchase payments, reinvested dividends, or other distributions; redemption fees; and exchange fees. Funds also incur various ongoing expenses, including management fees, distribution and/or service fees, and other fund expenses, which are indirectly paid by shareholders.
This Example is intended to help you understand your ongoing costs (in dollars) of investing in the various ICON Funds and to compare these costs with the ongoing costs of investing in other mutual funds. This Example is based on an investment of $1,000 invested at the beginning of the six-month period and held for the six-month period (4/01/17 – 9/30/17).
Actual Expenses
The first line in the table for each Fund provides information about actual account values and actual expenses. The Example includes, but is not limited to, management fees, 12b-1 fees, fund accounting, custody and transfer agent fees. However, the Example does not include client specific fees, such as the $15 fee charged to IRA accounts, or the $15 fee charged for wire redemptions. You may use this information, together with the amount you invested, to estimate the expenses that you paid over the period. Simply divide your account value by $1,000 (for example, an $8,600 account value divided by $1,000 = 8.6), then multiply the result by the number in the first line for each Fund under the heading entitled “Expenses Paid During Period” to estimate the expenses you paid on your account during this period.
Hypothetical Example for Comparison Purposes
The second line in the table for each Fund provides information about hypothetical account values and hypothetical expenses based on the Fund’s actual expense ratio and an assumed rate of return of 5% per year before expenses, which is not the Fund’s actual return. The hypothetical account values and expenses may not be used to estimate the actual ending account balance or expenses you paid for the period. You may use this information to compare the ongoing costs of investing in the Fund and other funds. To do so, compare this 5% hypothetical example with the 5% hypothetical examples that appear in the shareholder reports of the other funds. Please note that the expenses shown in the table are meant to highlight your ongoing costs only and do not reflect any transactional costs, such as sales charges (loads), redemption fees, or exchange fees that may be charged by other funds. Therefore, this information is useful in comparing ongoing costs only, and will not help you determine the relative total costs of owning different funds.
| Beginning Account Value April 1, 2017 | Ending Account Value September 30, 2017 | Expense Ratio(a) | Expenses Paid During period April 1, 2017 - September 30, 2017(b) | |||||||||
ICON Bond Fund | ||||||||||||
Class S | ||||||||||||
Actual | $ 1,000.00 | $ 1,023.10 | 0.75% | $ 3.80 | ||||||||
Hypothetical (5% return before expenses) | $ 1,000.00 | $ 1,021.31 | 0.75% | $ 3.80 | ||||||||
Class C | ||||||||||||
Actual | $ 1,000.00 | $ 1,018.90 | 1.60% | $ 8.10 | ||||||||
Hypothetical (5% return before expenses) | $ 1,000.00 | $ 1,017.05 | 1.60% | $ 8.09 | ||||||||
Class A | ||||||||||||
Actual | $ 1,000.00 | $ 1,020.80 | 1.00% | $ 5.07 | ||||||||
Hypothetical (5% return before expenses) | $ 1,000.00 | $ 1,020.05 | 1.00% | $ 5.06 | ||||||||
ICON Equity Income Fund | ||||||||||||
Class S | ||||||||||||
Actual | $ 1,000.00 | $ 1,050.60 | 0.99% | $ 5.09 | ||||||||
Hypothetical (5% return before expenses) | $ 1,000.00 | $ 1,020.10 | 0.99% | $ 5.01 | ||||||||
Class C | ||||||||||||
Actual | $ 1,000.00 | $ 1,045.10 | 1.99% | $10.20 | ||||||||
Hypothetical (5% return before expenses) | $ 1,000.00 | $ 1,015.09 | 1.99% | $10.05 | ||||||||
Class A | ||||||||||||
Actual | $ 1,000.00 | $ 1,048.80 | 1.24% | $ 6.37 | ||||||||
Hypothetical (5% return before expenses) | $ 1,000.00 | $ 1,018.85 | 1.24% | $ 6.28 | ||||||||
| 74 | www.iconfunds.com | |
Table of Contents
| ICON Diversified Funds | Disclosure of Fund Expenses | |
| September 30, 2017 (Unaudited) |
| Beginning Account Value April 1, 2017 | Ending Account Value September 30, 2017 | Expense Ratio(a) | Expenses Paid During period April 1, 2017 - September 30, 2017(b) | |||||||
ICON Fund | ||||||||||
Class S | ||||||||||
Actual | $ 1,000.00 | $ 1,096.90 | 1.10% | $ 5.78 | ||||||
Hypothetical (5% return before expenses) | $ 1,000.00 | $ 1,019.55 | 1.10% | $ 5.57 | ||||||
Class C | ||||||||||
Actual | $ 1,000.00 | $ 1,090.80 | 2.25% | $11.79 | ||||||
Hypothetical (5% return before expenses) | $ 1,000.00 | $ 1,013.79 | 2.25% | $11.36 | ||||||
Class A | ||||||||||
Actual | $ 1,000.00 | $ 1,095.20 | 1.50% | $ 7.88 | ||||||
Hypothetical (5% return before expenses) | $ 1,000.00 | $ 1,017.55 | 1.50% | $ 7.59 | ||||||
ICON Long/Short Fund | ||||||||||
Class S | ||||||||||
Actual | $ 1,000.00 | $ 1,100.70 | 1.25% | $ 6.58 | ||||||
Hypothetical (5% return before expenses) | $ 1,000.00 | $ 1,018.80 | 1.25% | $ 6.33 | ||||||
Class C | ||||||||||
Actual | $ 1,000.00 | $ 1,095.00 | 2.30% | $12.08 | ||||||
Hypothetical (5% return before expenses) | $ 1,000.00 | $ 1,013.54 | 2.30% | $11.61 | ||||||
Class A | ||||||||||
Actual | $ 1,000.00 | $ 1,099.40 | 1.56% | $ 8.21 | ||||||
Hypothetical (5% return before expenses) | $ 1,000.00 | $ 1,017.25 | 1.56% | $ 7.89 | ||||||
ICON Opportunities Fund | ||||||||||
Actual | $ 1,000.00 | $ 1,125.80 | 1.40% | $ 7.46 | ||||||
Hypothetical (5% return before expenses) | $ 1,000.00 | $ 1,018.05 | 1.40% | $ 7.08 | ||||||
ICON Risk-Managed Balanced Fund | ||||||||||
Class S | ||||||||||
Actual | $ 1,000.00 | $ 1,040.70 | 1.20% | $ 6.14 | ||||||
Hypothetical (5% return before expenses) | $ 1,000.00 | $ 1,019.05 | 1.20% | $ 6.07 | ||||||
Class C | ||||||||||
Actual | $ 1,000.00 | $ 1,035.10 | 2.20% | $11.22 | ||||||
Hypothetical (5% return before expenses) | $ 1,000.00 | $ 1,014.04 | 2.20% | $11.11 | ||||||
Class A | ||||||||||
Actual | $ 1,000.00 | $ 1,039.70 | 1.45% | $ 7.41 | ||||||
Hypothetical (5% return before expenses) | $ 1,000.00 | $ 1,017.80 | 1.45% | $ 7.33 | ||||||
| (a) | The Fund’s expense ratios have been annualized based on the Fund’s most recent fiscal half-year expenses. |
| (b) | Expenses are equal to the Fund’s annualized expense ratio multiplied by the average account value over the period, multiplied by the number of days in the most recent fiscal half-year 183/365 (to reflect the half-year period). |
Total returns exclude applicable sales charges. If sales charges were included (maximum 5.75%), returns would be lower.
| Annual Report | September 30, 2017 | 75 | |
Table of Contents
| ICON Diversified Funds | Board of Trustees and Fund Officers | |
| September 30, 2017 (Unaudited) |
The ICON Funds Board of Trustees (the “Board”) consists of four Trustees who oversee the 17 ICON Funds (the “Funds”). The Board is responsible for general oversight of the Funds’ business and for assuring that the Funds are managed in the best interest of the Funds’ shareholders. The Trustees, and their ages, and principal occupations are set forth below. The address of the Trustees is 5299 DTC Blvd., Suite 1200, Greenwood Village, CO 80111. Trustees have no official term of office and generally serve until they resign or are not re-elected.
Interested Trustee
Craig T. Callahan, 66. Chairman of the Board. Dr. Callahan has been a Trustee of the Funds since their inception. Dr. Callahan also serves as President (2014 to present and 1998 to 2013) and Chairman of the Investment Committee (2005 to present) and served as the Chief Investment Officer (1991 to 2004) of ICON Advisers, Inc. Dr. Callahan is also Executive Vice President (2005 to present); Director (1991 to present); and was previously President (1998 to 2005) and Chief Compliance Officer (2005) of ICO Distributors, Inc. Dr. Callahan also serves as the President (1998 to present) and Chairman of the Board of Directors (1994 to present) of IM&R, the parent company of ICON Advisers, Inc. and ICON Distributors, Inc.
Independent Trustees
Glen F. Bergert, 67. Mr. Bergert has been a Trustee of the Funds since 1999. Mr. Bergert is President of Venture Capital Management LLC (1997 to present), General Partner of SOGNO Partners LP, a venture capital company (2001 to 2015), General Partner of Bergert Properties, LLP, a real estate holding company (1997 to present), General Partner of Pyramid Real Estate Partnership, a real estate development company (1998 to present), General Partner of Chamois Partners, LP, a venture capital company (2004 to present) and was previously a General Partner with KPMG Peat Marwick, LLP (1979 to 1997). Mr. Bergert is also a Director of Delta Dental of California (2013 to present and 2006 to 2012), Delta Dental of Pennsylvania (2010 to present and 1998 to 2009), Delta Reinsurance Corporation (2015 to present; 2011 to 2014 and 2000 to 2009) and Dentegra Group, Inc. (2017 to present; 2010 to 2014).
John C. Pomeroy, Jr., 70. Mr. Pomeroy has been a Trustee of the Funds since 2002. Mr. Pomeroy is Chief Investment Officer and Director of Investments, Pennsylvania State University (2001 to present) and was Portfolio Manager and Product Manager, Trinity Investment Management Corporation (1989 to 2001).
R. Michael Sentel, 69. Mr. Sentel has been a Trustee of the Funds since their inception. Mr. Sentel is a Senior Attorney with the U.S. Department of Education (1996 to present) and was engaged in private practice of securities and corporate law (1981 to 2017). Mr. Sentel began his legal career with the U.S. Securities and Exchange Commission’s Division of Enforcement and served as a Branch Chief (1980 to 1981). Later he served as the Section Chief for the Professional Liability Section of the Federal Deposit Insurance Corp. with responsibility for the Rocky Mountain Region (1991 to 1994).
Mark Manassee, 52. Mr. Manassee has been a Trustee of the Funds since 2017. Mr. Manassee is a Senior Advisor to McKinsey’s Wealth and Asset Management Practice. Mr. Manassee was Principal and President of Market Metrics, LLC, a subsidiary of FactSet Research Systems, Inc. (1998 to 2016). Mr. Manassee was also a Director of Matrix-Data, Ltd (UK) (2013 to 2016) and Rhetorik, Ltd (UK) (2013 to 2016).
The Officers of the Funds are:
Craig T. Callahan, 66. Chairman of the Board. Dr. Callahan has been a Trustee of the Funds since their inception. Dr. Callahan also serves as President (2014 to present and 1998 to 2013) and Chairman of the Investment Committee (2005 to present) and served as the Chief Investment Officer (1991 to 2004) of ICON Advisers, Inc. Dr. Callahan is also Executive Vice President (2005 to present); Director (1991 to present); and was previously President (1998 to 2005) and Chief Compliance Officer (2005) of ICO Distributors, Inc. Dr. Callahan also serves as the President (1998 to present) and Chairman of the Board of Directors (1994 to present) of IM&R, the parent company of ICON Advisers, Inc. and ICON Distributors, Inc.
Donald Salcito, 64. Mr. Salcito serves as Vice President and Secretary of the Funds (2006 to present). Mr. Salcito is also Executive Vice President and General Counsel (2005 to present) of ICON Advisers, Inc.; Director of IM&R (2005 to present); Executive Vice President, Secretary, General Counsel of ICON Distributors, Inc. (2005 to 2017). Previously, he was a Partner in various national law firms, practicing in the securities law area (1980 to 2005).
Brian D. Harding, 38. Mr. Harding serves as Principal Financial Officer and Treasurer of the Funds (2017 to present). Mr. Harding is also Chief Financial Officer of ICON Advisers, Inc. (2013 to present) and Director and IM&R (2013 to present). Previously he was Chief Compliance Officer and Anti-Money Laundering Officer of the Funds (2008 to 2013), Chief Compliance Officer of ICON Advisers, Inc. (2011 to 2013), and Manager at PricewaterhouseCoopers LLP (2001 to 2008).
Jack M. Quillin, 45. Mr. Quillin serves as Assistant Treasurer of the Funds (2017 to present). Mr. Quillin is also a Compliance and Fund Accounting Associate of ICON Advisers, Inc. (2016 to present). Previously, he was a compliance analyst at Marsico Capital Management, LLC (2011 to 2015), an assistant vice president in the municipal derivatives finance department at Merrill Lynch (2004 to 2008), and a senior accountant in the Regulatory Reporting group at Wells Fargo & Company (1998 to 2003).
| ||
| 76 | www.iconfunds.com | |
Table of Contents
| ICON Diversified Funds | Board of Trustees and Fund Officers | |
| September 30, 2017 (Unaudited) |
Christopher R. Ambruso, 37. Mr. Ambruso serves as Chief Compliance Officer and Anti-Money Laundering Officer (2017 to present) of the Funds. Mr. Ambruso is also Chief Compliance Officer of ICON Advisers, Inc. (2017 to present). Previously he served as Assistant Secretary (2016 to 2017 and 2008 to 2012) of the Funds and Associate Counsel (2013 to 2017); Associate Attorney (2008 to 2013); and Staff Attorney (2007 to 2008) of ICON Advisers, Inc.
Stephen E. Abrams, 54. Mr. Abrams serves as Assistant Secretary of the Funds (2017 to present). Mr. Abrams is also Associate General Counsel of ICON Advisers, Inc. (2005 to present); Executive Vice President and General Counsel (2017 to present) and Chief Compliance Officer (2007 to present) of ICON Distributors, Inc. Previously, he worked as an Associate Attorney before becoming a Partner at a national law firm, practicing general litigation and securities law (1994 to 2005).
| ||
| Annual Report | September 30, 2017 | 77 | |
Table of Contents
| ICON Diversified Funds | Additional Information | |
| September 30, 2017 (Unaudited) |
Renewal of Investment Advisory Agreement
On August 25, 2017, the Board of Trustees, including all of the Trustees that are not “interested persons” of the Trust (the “Independent Trustees”), approved continuation of the Advisory Agreements (as defined below) with the Adviser for each Fund for an additional one-year term commencing October 1, 2017.
In determining to renew the investment advisory agreements between ICON Funds (the “Trust”) and ICON Advisers, Inc. (“ICON” or the “Adviser”) the Trustees requested, were provided with and reviewed data with respect to the Adviser, its personnel, and the services provided and to be provided to each Fund by the Adviser under the Trust’s Investment Advisory Agreement dated October 9, 1996, as amended (related to the Sector Funds, the International Funds and ICON Fund) and under the Trust’s Investment Advisory Agreement dated July 9, 2002 and effective October 1, 2002, as amended (related to the U.S. Diversified Funds — Bond, Risk-Managed Balanced, Equity Income, Opportunities and Long/Short Funds) (collectively, the “Advisory Agreements”).
The Trustees agreed that consideration of the Advisory Agreements should also include consideration of other agreements between the Adviser and the Trust that impact provisions of the Advisory Agreements, including expense limitation agreements as amended effective January and July, 2016. The Trustees were provided with and reviewed data with respect to the Adviser, its personnel, and the services provided and to be provided to each Fund by the Adviser under the Trust’s Advisory Agreements, Administrative Services Agreement and Expense Limitation Agreement and the Distribution Agreement with ICON Distributors, Inc. (“IDI”). The data included information concerning advisory, distribution and administrative services provided to the Funds by ICON and its related companies; information concerning other businesses of those companies; and comparative data obtained from Broadridge Financial Solutions (“Broadridge”) related to Fund performance and Fund expenses (the “Broadridge Report”).
The Board convened a meeting with Broadridge on August 11, 2017 to discuss the Broadridge Report and the information contained within the Broadridge Report. At that meeting, Broadridge representatives discussed the findings of the Broadridge Report with the Independent Trustees. Management personnel participated in the Broadridge meeting to discuss the data with the Board. The Trustees were represented at that meeting by independent legal counsel. At the meeting, Broadridge discussed its methodology and peer selection. Broadridge addressed the difficulty of determining peer selection of some sector Funds that had no statistical group of peers from which to present reliable data, expenses and fees. In addition, Broadridge discussed the difficulty of presenting information on three Funds whose expenses were reduced after the annual report, and performance relative to the respective Funds’ peers. Broadridge also discussed the Funds’ size and how an individual fund’s size would affect economies of scale generally and operating expenses in particular. Broadridge presented no information on how expenses were affected by a fund complex size.
Also included in the 15(c) discussion was a briefing on factors affecting the ICON investment model; expenses and expense ratios of each Fund and other ICON managed products; relative performance of each Fund; status of expense reimbursements to the Funds by the Adviser; sales and marketing initiatives; specific business factors affecting the Adviser; the work load on ICON as adviser and administrator to the Funds; current profitability of ICON; staffing levels and staff morale.
The Independent Trustees were represented by independent legal counsel in the entire 15(c) process. In August, after participating in the meeting with Broadridge and management, the Independent Trustees met separately as a group in private sessions with their independent legal counsel to review and discuss a variety of qualitative and quantitative information, including information they had received throughout the year as part of their regular oversight of the Funds. Based on these discussions, independent legal counsel and/or the Lead Independent Trustee also contacted management to request additional information from Broadridge. The Board received materials from independent legal counsel discussing the legal standards applicable to their consideration of the ICON-Trust agreements.
In considering the nature, extent and quality of the services provided by the Adviser, the Board reviewed information relating to ICON’s operations and personnel. Among other things, the Adviser provided biographical information on its professional staff and descriptions of its organizational and management structure. In the course of their deliberations the Board evaluated, among other things, information relating to the investment philosophy, strategies and techniques used in managing each Fund, the qualifications and experience of ICON’s investment personnel, ICON’s compliance programs, ICON’s brokerage practices, including the extent to which the Adviser obtains research through “soft dollar” arrangements with the Funds’ brokerage, compliance reports on the foregoing, and the financial and non-financial resources available to provide services required under the Advisory Agreement.
Management and the Trustees discussed the Broadridge Report and management personnel showed performance for each Fund and discussed the factors affecting performance.
| ||
| 78 | www.iconfunds.com | |
Table of Contents
| ICON Diversified Funds | Additional Information | |
| September 30, 2017 (Unaudited) |
During the discussion on performance, Management personnel noted the importance of advisory fees in total. The novelty and uniqueness of ICON’s management style (specifically, the fact that it is market-cap agnostic, its willingness to actively manage for performance based on active share without adhering strictly to benchmark holdings, the fact that it is a value manager that considers forward looking earnings) must be evaluated when comparing management fees.
In connection with reviewing data bearing upon the nature, quality, and extent of services furnished by ICON to each Fund, the Board assessed data concerning ICON’s staffing, systems and facilities. The Board also assessed ICON’s non-Trust business to see if there are any initiatives that would dilute service to the Trust. The Board concluded:
| A. | That the breadth and the quality of investment advisory and other services being provided to each Fund are satisfactory; |
| B. | That ICON has made significant expenditures in the past year and in prior years to ensure that the Trust has the right product mix for the market and the Adviser has the sophisticated systems and highly trained personnel necessary for it to be able to continue to provide quality service to the Funds’ shareholders; |
| C. | That the Board is satisfied with the research, portfolio management, and trading services, among others, being provided by ICON to the Trust, and has determined that ICON is charging fair and reasonable fees. |
| D. | The risks assumed by ICON in providing investment advisory services to each Fund including the capital commitments which have been made in the past and which continue to be made by ICON to ensure the continuation of the highest quality of service to the Trust is made with the recognition that the Trust’s advisory relationship with ICON can be terminated at any time and must be renewed on an annual basis. |
In considering the reasonableness of the fees paid to the Adviser for managing each Fund, the Board reviewed, among other things, data concerning other funds from the Broadridge Report, financial statements of the Adviser and an analysis of the profitability of the Adviser, and its affiliates, and their relationship with each Fund over various time periods. Such analysis identified all revenues and other benefits received by the Adviser and its affiliates from managing each Fund, the costs associated with providing such services and the resulting profitability to the Adviser and its affiliates and a comparison of similar data from reports filed by publicly traded firms.
The Board assessed actual (net) fees for advisory services and Fund expense ratios under the contractual relationship (the Advisory agreements, the Administration Agreement and the Expense Limitation Agreements) with the Adviser as opposed to the fees specified in the applicable Advisory Agreement and expense ratios without application of the expense limitations and the low cost of the Administration Agreement. The Board concluded that the focus should be on actual expense ratios after application of the Expense Limitation Agreements.
The Board considered the current and anticipated asset levels of each Fund and the contractual commitments of the Adviser to waive fees and pay expenses of the Funds from time to time to limit the total expenses of the Funds. The Board also considered the Adviser’s contractual commitment regarding administration and the fact it would continue to lose money on administration. In this regard the Board discussed asset levels in each Fund covered by the Advisory Agreements. ICON’s ability to provide the services called for under the Advisory Agreements was assessed in light of current and projected asset levels. Fund expenses and expense ratios were also assessed in light of current and projected asset levels. The Board concluded that the Adviser has the resources necessary to provide the services called for under the Advisory Agreements; that profitability to the Adviser and its affiliates from their relationship with the Funds, and services provided to the Funds, is not excessive; and that the Adviser is not realizing benefits from economies of scale that would warrant adjustments to the fees for any Fund at this time. The Board of Trustees concluded that, in light of the nature, extent and quality of the services provided by the Adviser and the levels of profitability associated with providing these services, the fees charged by the Adviser under the Advisory Agreements to each Fund are reasonable.
In connection with assessing data bearing on the fairness of fee arrangements, the Board considered the Broadridge Report, information they had received throughout the year as part of their regular oversight of the Funds (including Morningstar data on peer groupings), and information from independent broker/dealers evaluating fees for platform sales. It was noted that Broadridge was selected at the May 2017 Board meeting to prepare its reports, an extensive analysis of the expense data of other comparable funds; and that Trustee input was solicited and provided in the process. Among other information discussed, it was noted that:
| A. | Upon review of the advisory fee structures of each Fund (taking into consideration management fees and breakpoint fees), the level of investment advisory fees paid by each Fund is within competitive ranges for the size of each Fund and Fund mandate; |
| B. | The expense ratio of each Fund is generally reasonable and understandable in light of the existing Fund Trust structure and Fund performance; |
| C. | ICON has contractually agreed to impose expense limitations on all Funds at a cost to ICON and is considering new expense limitations; |
| ||
| Annual Report | September 30, 2017 | 79 | |
Table of Contents
| ICON Diversified Funds | Additional Information | |
| September 30, 2017 (Unaudited) |
| D. | The advisory and other fees payable by the Funds to ICON are essentially fees which would be similar to those which would have resulted solely from “arm’s-length” bargaining. |
| E. | The fees paid to ICON for managing other institutional accounts (such as individual or sub-advised portfolios) are lower, but there are good reasons such accounts are less costly for ICON to manage, including, but not limited to, the level of work needed to service the institutional portfolios and the size and stability of such institutional accounts. |
| F. | The extent to which economies of scale could be realized as a Fund grows in assets and whether the Fund’s fees reflect these economies of scale for the benefit of Fund shareholders. |
| G. | The costs borne by ICON in providing advisory services to each Fund and the profitability of ICON in light of the estimated profitability analysis which had been provided by ICON. |
The Board also considered the fees charged by the Adviser to other advisory clients, including institutional and sub-advised clients as outlined in its Registration Application on Form ADV in connection with assessing data bearing on the fairness of fee arrangements.
The Board concluded the Adviser is providing the Funds with professional management at a price that would have been arrived at in an arm’s length negotiation.
In connection with assessing the direct and indirect benefits to ICON from serving as the Funds’ adviser, the Board discussed services provided under the Distribution Agreement and the Administrative Services Agreement which are in addition to services under the Advisory Agreements. It was noted that ICON benefits from serving directly or through affiliates as the principal underwriter and administrative agent for the Funds. The services provided by ICON and its affiliates to the Funds are reasonably satisfactory, and the profits derived from providing the services are competitive and reasonable. It was further noted that ICON receives research assistance from the use of soft dollars generated from Fund portfolio transactions. The Trustees noted that such research assists ICON in providing quality investment advisory services to the Funds as well as other accounts to which it provides advisory services.
Based on all these considerations and other data as discussed above, the Board, including all of the Independent Trustees, concluded that: 1) the continuation of the Advisory Agreements was in the best interests of each Fund and its shareholders, 2) the services to be performed under the Advisory Agreements were required for the operation of the Funds, 3) the advisory services were satisfactory to the Funds in the past, and 4) the fees for the advisory services and other benefits from the relationship with the Trust received by ICON, and its affiliates, were within the range of what would have been negotiated at arm’s length in light of all the circumstances.
Supplemental Tax Information
Pursuant to Section 852(b)(3) of the Internal Revenue Code the following Funds designate the amounts listed below as long-term capital gain dividends:
ICON Bond Fund | $0 | |||
ICON Equity Income Fund | $0 | |||
ICON Fund | $0 | |||
ICON Long/Short Fund | $0 | |||
ICON Opportunities Fund | $221,532 | |||
ICON Risk-Managed Balanced Fund | $0 |
The following Funds designate the percentages listed below of the income dividends distributed in 2016 as qualified dividend income (QDI) as defined in Section 1(h)(11) of the Internal Revenue Code:
ICON Bond Fund | 00.42 | % | ||
ICON Equity Income Fund | 67.68 | % | ||
ICON Fund | 0.00 | % | ||
ICON Long/Short Fund | 0.00 | % | ||
ICON Opportunities Fund | 0.00 | % | ||
ICON Risk-Managed Balanced Fund | 54.74 | % |
| ||
| 80 | www.iconfunds.com | |
Table of Contents
| ICON Diversified Funds | Additional Information | |
| September 30, 2017 (Unaudited) |
The following Funds designate the percentages listed below of the income dividends distributed in 2016 as qualifying for the corporate dividends received deduction (DRD) as defined in Section 854(b)(2) of the Internal Revenue Code:
ICON Bond Fund | 0.52 | % | ||
ICON Equity Income Fund | 65.77 | % | ||
ICON Fund | 0.00 | % | ||
ICON Long/Short Fund | 0.00 | % | ||
ICON Opportunities Fund | 0.00 | % | ||
ICON Risk-Managed Balanced Fund | 50.47 | % |
Portfolio Holdings
Information related to the 10 largest portfolio holdings of each Fund is made available at www.iconfunds.com within approximately 10 business days after month-end. Additionally, a complete list of each Fund’s holdings is made available approximately 30 days after month-end. Each ICON Fund also files a complete schedule of portfolio holdings for the first and third quarters of its fiscal year with the Securities and Exchange Commission (the “Commission”) on Form N-Q. The ICON Funds’ Forms N-Q are available at www.sec.gov or may be reviewed and copied at the Commission’s Public Reference Room in Washington, DC. Information about the Public Reference Room may be obtained by calling 1-800-SEC-0330.
Proxy Voting
A summarized description of the policies and procedures the ICON Funds use to vote proxies is available free of charge at www.iconfunds.com or by calling 1-800-764-0442.
Information about how the ICON Funds voted proxies related to each Fund’s portfolio securities during the 12-month period ended June 30 is available free of charge at www.iconfunds.com or on the Commission’s website at www.sec.gov.
For More Information
This report is for the general information of the Funds’ shareholders and is not authorized for distribution to prospective investors unless preceded or accompanied by a current prospectus. You may obtain a copy of the prospectus, which contains information about the investment objectives, risks, charges, expenses, and share classes of each ICON Fund, by visiting www.iconfunds.com or by calling 1-800-764-0442. Please read the prospectus carefully before investing.
ICON Distributors, Inc., Distributor.
| ||
| Annual Report | September 30, 2017 | 81 | |
Table of Contents
| ICON Diversified Funds | Privacy Policy | |
| September 30, 2017 (Unaudited) |
FACTS | WHAT DOES ICON DO WITH YOUR PERSONAL INFORMATION? | |
Why? | Financial companies choose how they share your personal information. Federal law gives consumers the right to limit some but not all sharing. Federal law also requires us to tell you how we collect, share, and protect your personal information. Please read this notice carefully to understand what we do. | |
What? | The types of personal information we collect and share depend on the product or service you have with us. This information can include: | |
• Social Security number and account balances | ||
• income and transaction history | ||
• checking account information and wire transfer instructions | ||
| When you are no longer our customer, we continue to share your information as described in this notice. | ||
How? | All financial companies need to share customers’ personal information to run their everyday business. In the section below, we list the reasons financial companies can share their customers’ personal information; the reasons ICON chooses to share; and whether you can limit this sharing. | |
Reasons we can share your personal information | Does ICON share? | Can you limit this sharing? | ||||
For our everyday business purposes — such as to process your transactions, maintain your account(s), respond to court orders and legal investigations, or report to credit bureaus | Yes | No | ||||
For our marketing purposes — to offer our products and services to you | No | We don’t share | ||||
For joint marketing with other financial companies | No | We don’t share | ||||
For our affiliates’ everyday business purposes — information about your transactions and experiences | No | We don’t share | ||||
For our affiliates’ everyday business purposes — information about your creditworthiness | No | We don’t share | ||||
For nonaffiliates to market to you | No | We don’t share | ||||
Questions? | Call 1-800-764-0442 for the ICON Funds and 1-800-828-4881 for ICON Advisers, Inc. and ICON Distributors, Inc. | |||
| ||
| 82 | www.iconfunds.com | |
Table of Contents
| ICON Diversified Funds | Privacy Policy | |
| September 30, 2017 (Unaudited) |
| Who We Are | ||
| Who is providing this notice? | ICON Funds, ICON Advisers, Inc., and ICON Distributors, Inc. (collectively “ICON”) | |
| What We Do | ||
How does ICON protect my personal information? | To protect your personal information from unauthorized access and use, we use security measures that comply with federal law. These measures include computer safeguards and secured files and buildings. | |
| Contracts with our service providers require them to restrict access to your non-public personal information, and to maintain physical, electronic and procedural safeguards against unintended disclosure. | ||
How does ICON collect my personal information? | We collect your personal information, for example, when you | |
• open an account or enter into an investment advisory contract | ||
• provide account information or give us your contact information | ||
• make a wire transfer | ||
| We also collect your personal information from others, such as credit bureaus, affiliates, or other companies. | ||
| Why can’t I limit all sharing? | Federal law gives you the right to limit only | |
• sharing for affiliates’ everyday business purposes — information about your creditworthiness | ||
• affiliates from using your information to market to you | ||
• sharing for nonaffiliates to market to you | ||
| State laws and individual companies may give you additional rights to limit sharing. | ||
| Definitions | ||
| Affiliates | Companies related by common ownership or control. They can be financial and nonfinancial companies. | |
• Our affiliates include financial companies such as ICON Funds, ICON Advisers, Inc., and ICON Distributors, Inc. | ||
| Nonaffiliates | Companies not related by common ownership or control. They can be financial and nonfinancial companies. | |
• Nonaffiliates we share with can include financial companies such as custodians, transfer agents, registered representatives, financial advisers and nonfinancial companies such as fulfillment, proxy voting, and class action service providers | ||
| Joint marketing | A formal agreement between nonaffiliated financial companies that together market financial products or services to you. | |
• ICON doesn’t jointly market | ||
| ||
| Annual Report | September 30, 2017 | 83 | |
Table of Contents

For more information about the ICON Funds, contact us:
By Telephone | 1-800-764-0442 | |
By E-Mail | info@iconadvisers.com | |
By Mail | ICON Funds | P.O. Box 1920 | Denver, CO 80201 | |
In Person | ICON Funds | 5299 DTC Boulevard, 12th Floor | |
Greenwood Village, CO 80111 | ||
On the Internet | www.iconfunds.com |
Table of Contents
ICON Emerging Markets Fund
ICON International Equity Fund
Table of Contents

You can now sign up for electronic delivery of ICON Fund shareholder reports, including prospectuses, annual reports, semiannual reports and proxy statements.
When these materials are available, you will receive an email from ICON with instructions on how to view the documents. Statements, transaction confirmations and other documents that are not available online will continue to be sent to you by U.S. mail.
Visit ICON’s website at www.iconfunds.com to learn more and sign up.
You may change or cancel your participation in eDelivery by visiting www.iconfunds.com, or you can request a hard copy of any of the materials free of charge by calling ICON Funds at 1-800-764-0442.
1-800-764-0442
| ●
| www.iconfunds.com
| ||||||
Table of Contents
| 2 | ||||
Management Overview (Unaudited) and Schedules of Investments | ||||
| 3 | ||||
| 10 | ||||
| 18 | ||||
| 21 | ||||
| 26 | ||||
| 35 | ||||
| 36 | ||||
| 37 | ||||
| 39 | ||||
| 43 | ||||
Table of Contents
| ICON International Funds | About This Report | |
| September 30, 2017 (Unaudited) |
Historical Returns
All total returns mentioned in this Report account for the change in a Fund’s per-share price and the reinvestment of any dividends, capital gain distributions and adjustments for financial statement purposes. If your account is set up to receive Fund distributions in cash rather than to reinvest them, your actual return may differ from these figures. The Funds’ performance results do not reflect the deduction of taxes that a shareholder would pay on Fund distributions or on the redemption of Fund shares. The Adviser may have reimbursed certain fees or expenses of some of the Funds. If not for these reimbursements, performance would have been lower. Fund results shown, unless otherwise indicated, are at net asset value. If a sales charge (maximum 5.75%) had been deducted, results would have been lower.
Past performance does not guarantee future results. Investment return and principal value will fluctuate so that an investor’s shares, when redeemed, may be worth more or less than their original cost. Performance results represent past performance, and current performance may be higher or lower. Please call 1-800-764-0442 or visit www.iconfunds.com for performance results current to the most recent month-end.
Portfolio Data
This Report reflects ICON’s portfolio holdings as of September 30, 2017, the end of the reporting period. The information is not a complete analysis of every aspect of any sector, industry, security or the Funds.
There are risks associated with mutual fund investing, including the loss of principal. The likelihood of loss may be greater if you invest for a shorter period of time. There is no assurance that the investment process will consistently lead to successful results.
An investment in a region fund may involve greater risk and volatility than a diversified fund. An investment concentrated in sectors and industries may involve greater risk and volatility than a more diversified investment.
Investments in foreign securities may entail unique risks, including political, market, and currency risks. Financial statements of foreign companies are governed by different accounting, auditing, and financial standards than U.S. companies and may be less transparent and uniform than in the United States. Many corporate governance standards, which help ensure the integrity of public information in the United States, do not exist in foreign countries. In general, there may be less governmental supervision of foreign stock exchanges and securities brokers and issuers. The ICON system relies on the integrity of the financial statements released to the market as part of our analysis.
The prospectus and statement of additional information contain this and other information about the Funds and are available by visiting www.iconfunds.com or calling 1-800-764-0442. Please read the prospectus and statement of additional information carefully.
Financial Intermediary
If you purchase the Fund through a broker-dealer or other financial intermediary (such as a bank), the Fund and its related companies may pay the intermediary for the sale of Fund shares and related services. These payments may influence the broker-dealer or other intermediary and your salesperson to recommend the Fund over another investment. Ask your salesperson or visit your financial intermediary’s website for more information.
| 2 | www.iconfunds.com | |
Table of Contents
| ICON Emerging Markets Fund | Management Overview | |
| September 30, 2017 (Unaudited) |
| Q. | How did the Fund perform relative to its benchmark? |
| A. | The ICON Emerging Markets Fund (the Fund) Class S returned 11.34% for the fiscal year ended September 30, 2017, while its benchmark, the MSCI Emerging Markets Index, returned 22.91%. Total returns for other periods and additional Class shares as of September 30, 2017, appear in the subsequent pages of this Fund’s Management Overview. |
| Q. | What primary factors were behind the Fund’s relative performance? |
| A. | Earnings optimism coupled with a continuation of tightening credit spreads drove emerging markets’ performance during fiscal year 2017. In the context of total return, Poland and Hungary led gains for the year, followed closely by both China and Brazil. Global growth appears to be accelerating in a uniform fashion for the first time in several years, which contributed to positive risk sentiment. In addition, monetary policy remains accommodative globally due to benign inflation indicators, meaning it remains relatively easy for businesses to borrow money. This, in turn, has led to a supportive backdrop for emerging markets. In Asia, China’s economic growth remained relatively stable and rose slightly over the year as currency fluctuations in the Yuan/U.S. Dollar failed to have any meaningful effect on the economy. In Latin America, Brazil experienced economic growth after emerging from a devastating two-year recession. Strength in the Information Technology sector was a global theme throughout the year and was particularly influential in the Asia–Pacific region. |
At the beginning of our fiscal year (Oct 2016), our valuation model showed the emerging market universe had an 8% upside to fair value. However, these readings quickly headed lower and reached fair value in the next two months as interest rates rose following the U.S. election. In response to this low value environment, the Fund reduced exposure in markets we believed were over-priced, and also held cash for defensive reasons. Despite the higher interest rates, investors sought out higher yielding emerging markets debt, sparking an uninterrupted buying frenzy over the year that brought credit spreads to decade tight levels. Equity prices moved higher after bottoming in December, and the Fund’s defensive cash position ultimately detracted from performance over the course of the year. Sector positioning was tilted towards cyclical areas of the market, yet Information Technology was investors’ clear favorite as it posted returns that nearly doubled the benchmark. The Fund had exposure to this sector throughout the year, but gradually rotated away to other areas that looked more attractive in our valuation model. Regionally, our valuations pointed us away from the Western Hemisphere and toward countries in the Asia-Pacific area. Performance across all regions was fairly consistent. Going forward, we believe our disciplined focus on value, which at times may seem contrarian to the investor, will benefit the Fund.
| Q. | How did the Fund’s composition affect performance? |
| A. | While all geographic regions saw gains over the period, there were clear differences among countries throughout the year. The Western Hemisphere’s performance was largely driven by Brazil. Brazil had a value-to-price ratio (V/P) of 1.02 at the start of the year, suggesting we believed fair value in Brazilian equities was 2% higher than where they were trading. Nonetheless, seeing more value in other regions and countries, we maintained an underweight position in Brazil. The Asia-Pacific region was largely driven by China, which had a V/P of 1.05 at the start of the year. |
From a country perspective, South Korea was the primary detractor to relative performance due to the Fund’s stock selection in the Utilities and Financials sectors. Indonesia was another underperforming area. While Indonesia’s Financials sector performed well, the Fund’s allocation to infrastructure areas, specifically the engineering and construction industry, detracted from relative returns. In addition, Brazil ended the year at record highs as the country’s political rhetoric was evidently overshadowed by the belief that Brazil would continue to experience growth. India and Taiwan both contributed positively to performance at the allocation and selection levels, with the Financials sector being the primary contributor.
At the sector and industry level, the Fund’s primary contributors relative to the benchmark were in the Financials and consumer-related sectors. Specifically, an overweight position in the home furnishings and specialty stores industries drove the majority of the Consumer Discretionary outperformance, while stock selection in diversified banks contributed positively in Financials. Conversely, an overweight position in Industrials, specifically in the engineering and construction industry, coupled with an underweight in internet software and services in Information Technology, both detracted from performance. In addition, the Fund’s overweight position in gold mining companies dragged on performance. Given the low valuation readings in the early part of the year, the Fund’s cash allocation for defensive positioning was also a relative detractor to the benchmark.
| Q. | What is your investment outlook for emerging markets? |
| A. | At the end of fiscal year 2017, emerging markets as a whole had an overall average value-to-price (V/P) ratio of 1.07, implying that, on average, our estimate of fair value for stocks is about 7% higher than where they are now trading. We currently favor Financials, Energy and Materials from a sector perspective and more specifically the industries of diversified banks, construction materials and paper and products. Conversely, Consumer Staples, Health Care and Real Estate look less attractive and represent underweight positions relative to the benchmark. While corporate earnings and growth look strong, we will continue to monitor the credit environment for signs of risk aversion, as we currently find ourselves at exceptionally tight spread levels. While interest rates remain low, thanks in great part to loose monetary policy and extraordinary central bank intervention, we are now at a stage where policy moves are starting to decouple across the globe with some |
| Annual Report | September 30, 2017 | 3 | |
Table of Contents
| ICON Emerging Markets Fund | Management Overview | |
| September 30, 2017 (Unaudited) |
countries removing stimulus and raising interest rates. As always, we will continue to monitor the capital markets and their effect on our investment system.
Regionally, according to our system, Europe in general, and Turkey and Hungary in particular, represent the best bargains in emerging markets space. The Asia-Pacific region looks favorable as well, with South Korea, Thailand, and the Philippines showing good value. Within the Western Hemisphere, Mexico looks attractive. The Fund’s country underweights include Brazil, India, and South Africa as these show less upside within our valuation system. Based on our disciplined, systematic and non-emotional approach to investing, we will continue deploying capital toward areas that we deem to have the most opportunity, based on what our investment system dictates.
| 4 | www.iconfunds.com | |
Table of Contents
| ICON Emerging Markets Fund | Management Overview | |
| September 30, 2017 (Unaudited) |
Average Annual Total Return (as of September 30, 2017)
| Inception Date | 1 Year | 5 Years | 10 Years | Since Inception | Gross Expense Ratio* | Net Expense Ratio* | ||||||||
ICON Emerging Markets Fund – Class S | 2/25/97 | 11.34% | 5.62% | 0.33% | 3.35% | 1.85% | 1.55% | |||||||
ICON Emerging Markets Fund – Class A | 5/31/06 | 11.06% | 5.41% | 0.10% | 3.02% | 2.16% | 1.80% | |||||||
ICON Emerging Markets Fund – Class A | 5/31/06 | 4.64% | 4.18% | -0.49% | 2.48% | 2.16% | 1.80% | |||||||
MSCI Emerging Markets Index | 22.91% | 4.36% | 1.65% | 6.49% | N/A | N/A |
Past performance is not a guarantee of future results. Information about these performance results and the comparative indexes can be found in the About This Report section. The Fund’s name and investment strategy changed effective May 5, 2014. The Fund’s past performance would have been different if the current strategy had been in effect. The Adviser has agreed to limit certain Fund expenses; without these limitations, returns would have been lower. The limitation provisions may be terminated in the future.
| * | Please see the most recent prospectus for details. |
Value of a $10,000 Investment (through September 30, 2017)
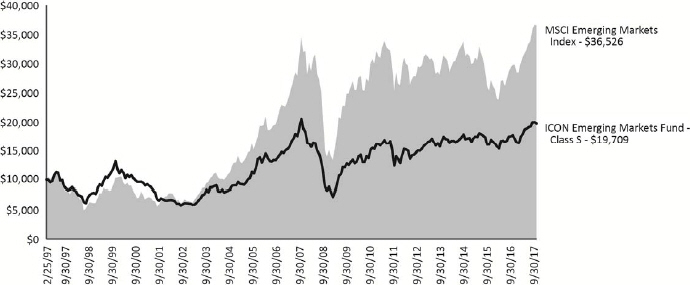
Past performance is not a guarantee of future results. The above graph compares a $10,000 investment made in the Emerging Markets Fund’s Class S shares on the Class’ inception date of 2/25/97 to a $10,000 investment made in an unmanaged securities index on that date. The Fund’s name and investment strategy changed effective May 5, 2014. The Fund’s past performance would have been different if the current strategy had been in effect. Performance for the Emerging Markets Fund’s other share classes will vary due to differences in charges and expenses. The Emerging Markets Fund’s performance in this chart and the performance table assumes the reinvestment of dividends, capital gain distributions and tax return of capital, but does not reflect the deduction of taxes that a shareholder would pay on Fund distributions or on the redemption of Fund shares.
| Annual Report | September 30, 2017 | 5 | |
Table of Contents
| ICON Emerging Markets Fund | Schedule of Investments | |
| September 30, 2017 |
| Shares or Principal Amount | Value | |||||
Common Stocks (96.97%) | ||||||
Airlines (2.01%) | ||||||
Cebu Air, Inc. | 602,000 | $ 1,300,001 | ||||
| ||||||
Alternative Carriers (0.99%) | ||||||
Link Net Tbk PT | 1,659,000 | 637,414 | ||||
| ||||||
Aluminum (0.21%) | ||||||
China Hongqiao Group, | 270,000 | 138,256 | ||||
| ||||||
Apparel, Accessories & Luxury Goods (0.44%) | ||||||
Shenzhou International Group Holdings, Ltd. | 36,000 | 282,326 | ||||
| ||||||
Biotechnology (0.42%) | ||||||
Shire PLC | 5,300 | 269,949 | ||||
| ||||||
Building Products (0.83%) | ||||||
China Lesso Group Holdings, Ltd. | 788,000 | 538,843 | ||||
| ||||||
Cable & Satellite (1.28%) | ||||||
Megacable Holdings SAB de CV | 126,575 | 527,222 | ||||
Sky PLC | 25,000 | 306,697 | ||||
| ||||||
| 833,919 | ||||||
| ||||||
Coal & Consumable Fuels (3.41%) |
| |||||
Indo Tambangraya Megah Tbk PT | 770,000 | 1,158,421 | ||||
Tambang Batubara Bukit Asam Persero Tbk PT | 1,350,000 | 1,047,965 | ||||
| ||||||
| 2,206,386 | ||||||
| ||||||
Commodity Chemicals (1.18%) |
| |||||
Mexichem SAB de CV | 170,246 | 448,847 | ||||
Petronas Chemicals Group Bhd | 184,000 | 317,840 | ||||
| ||||||
| 766,687 | ||||||
| ||||||
Construction & Engineering (3.85%) |
| |||||
China Communications Construction Co., Ltd., Class H | 280,000 | 351,182 | ||||
China State Construction International Holdings, Ltd. | 240,000 | 350,870 | ||||
Pembangunan Perumahan Persero Tbk PT | 2,177,573 | 374,013 | ||||
Waskita Karya Persero Tbk PT | 5,246,000 | 692,289 | ||||
Wijaya Karya Persero Tbk PT | 5,431,809 | 722,998 | ||||
| ||||||
| 2,491,352 | ||||||
| ||||||
Construction Materials (8.02%) |
| |||||
China Resources Cement Holdings, Ltd. | 1,906,000 | 1,175,072 | ||||
Cimsa Cimento Sanayi VE Ticaret AS | 142,000 | 565,174 | ||||
Siam Cement PCL | 16,500 | 247,609 | ||||
Tipco Asphalt PCL | 1,292,000 | 934,516 | ||||
Waskita Beton Precast Tbk PT | 21,000,000 | 561,605 | ||||
West China Cement, Ltd.(a) | 9,000,000 | 1,468,521 | ||||
| Shares or Principal Amount | Value | |||||
Construction Materials (continued) |
| |||||
Wijaya Karya Beton Tbk PT | 6,000,000 | $ 238,473 | ||||
| ||||||
| 5,190,970 | ||||||
| ||||||
Consumer Finance (1.38%) | ||||||
Gentera SAB de CV | 552,000 | 894,234 | ||||
| ||||||
Department Stores (0.00%)(c) |
| |||||
Grupo Sanborns SAB de CV | 945 | 1,105 | ||||
| ||||||
Distillers & Vintners (1.11%) |
| |||||
Thai Beverage PCL | 1,084,000 | 720,011 | ||||
| ||||||
Diversified Banks (17.49%) |
| |||||
Agricultural Bank of China, Ltd., Class H | 2,374,000 | 1,068,658 | ||||
Bank Negara Indonesia Persero Tbk PT | 1,850,000 | 1,017,271 | ||||
Bank of China, Ltd., Class H | 2,356,000 | 1,170,280 | ||||
Bank Pan Indonesia Tbk PT(a) | 16,827,400 | 1,425,208 | ||||
China Construction Bank Corp., Class H | 1,120,000 | 935,706 | ||||
Credicorp, Ltd. | 2,200 | 451,044 | ||||
Grupo Financiero Banorte SAB de CV, Class O | 55,000 | 378,657 | ||||
Industrial Bank of Korea | 52,000 | 655,531 | ||||
Kasikornbank PCL | 44,760 | 278,360 | ||||
Metropolitan Bank & Trust Co. | 580,000 | 988,672 | ||||
Moneta Money Bank AS | 77,600 | 273,224 | ||||
Sberbank of Russia PJSC, Sponsored ADR | 70,000 | 998,166 | ||||
Shinhan Financial Group Co., Ltd. | 28,000 | 1,237,552 | ||||
Yes Bank, Ltd. | 81,500 | 437,492 | ||||
| ||||||
| 11,315,821 | ||||||
| ||||||
Electric Utilities (1.05%) | ||||||
Korea Electric Power Corp. | 20,000 | 679,506 | ||||
| ||||||
Electronic Components (1.92%) |
| |||||
Kingboard Chemical Holdings, Ltd. | 60,000 | 319,547 | ||||
Tongda Group Holdings, Ltd. | 3,440,000 | 927,467 | ||||
| ||||||
| 1,247,014 | ||||||
| ||||||
Electronic Equipment & Instruments (1.43%) | ||||||
China Railway Signal & Communication Corp., Ltd., Class H | 797,000 | 599,216 | ||||
SFA Engineering Corp. | 9,000 | 325,944 | ||||
| ||||||
| 925,160 | ||||||
| ||||||
Electronic Manufacturing Services (1.01%) | ||||||
Fabrinet(a) | 17,700 | 655,962 | ||||
| ||||||
Environmental & Facilities Services (1.10%) | ||||||
China Everbright International, Ltd. | 566,000 | 713,236 | ||||
| ||||||
The accompanying notes are an integral part of the financial statements.
| ||
| 6 | www.iconfunds.com | |
Table of Contents
| ICON Emerging Markets Fund | Schedule of Investments | |
| September 30, 2017 |
| Shares or Principal Amount | Value | |||
Financial Exchanges & Data (0.34%) | ||||
Bolsa Mexicana de Valores SAB de CV | 130,000 | $ 216,952 | ||
| ||||
Gold (3.26%) | ||||
Cia de Minas Buenaventura SAA, ADR | 60,000 | 767,400 | ||
Randgold Resources, Ltd. | 7,800 | 762,347 | ||
Zijin Mining Group Co., Ltd., Class H | 1,680,000 | 577,949 | ||
| ||||
| 2,107,696 | ||||
| ||||
Highways & Railtracks (1.26%) | ||||
Shenzhen Expressway Co., Ltd., Class H | 840,000 | 816,811 | ||
| ||||
Independent Power Producers & Energy Traders (2.21%) | ||||
Aboitiz Power Corp. | 642,000 | 541,535 | ||
Electricity Generating PCL | 94,000 | 662,369 | ||
First Gen Corp. | 600,000 | 223,606 | ||
| ||||
| 1,427,510 | ||||
| ||||
Industrial Machinery (1.42%) | ||||
China Conch Venture Holdings, Ltd. | 470,000 | 916,333 | ||
| ||||
Integrated Oil & Gas (3.23%) | ||||
China Petroleum & Chemical Corp., Class H | 652,000 | 491,400 | ||
LUKOIL PJSC, Sponsored ADR | 14,500 | 769,012 | ||
MOL Hungarian Oil & Gas PLC | 57,600 | 655,059 | ||
Rosneft Oil Co. PJSC, GDR | 31,500 | 175,281 | ||
| ||||
| 2,090,752 | ||||
| ||||
Integrated Telecommunication Services (2.47%) | ||||
KT Corp., Sponsored ADR | 64,000 | 887,680 | ||
Telekomunikasi Indonesia Persero Tbk PT | 2,049,000 | 712,600 | ||
| ||||
| 1,600,280 | ||||
| ||||
Internet Software & Services (1.22%) | ||||
Alibaba Group Holding, Ltd., Sponsored ADR(a) | 2,400 | 414,504 | ||
Tencent Holdings, Ltd. | 8,545 | 373,593 | ||
| ||||
| 788,097 | ||||
| ||||
IT Consulting & Other Services (2.75%) | ||||
HCL Technologies, Ltd. | 68,000 | 911,279 | ||
Infosys, Ltd. | 63,000 | 869,822 | ||
| ||||
| 1,781,101 | ||||
| ||||
Multi-Utilities (0.48%) | ||||
Avista Corp. | 6,000 | 310,620 | ||
| ||||
Oil & Gas Equipment & Services (0.80%) | ||||
U.S. Silica Holdings, Inc.(d) | 16,600 | 515,762 | ||
| ||||
Oil & Gas Exploration & Production (2.98%) | ||||
CNOOC, Ltd. | 600,000 | 776,731 | ||
Diamondback Energy, Inc.(a) | 8,575 | 840,007 | ||
| Shares or Principal Amount | Value | |||
Oil & Gas Exploration & Production (continued) | ||||
Gulfport Energy Corp.(a) | 21,800 | $ 312,612 | ||
| ||||
| 1,929,350 | ||||
| ||||
Oil & Gas Refining & Marketing (2.68%) | ||||
Petron Corp. | 3,750,000 | 773,630 | ||
SK Innovation Co., Ltd. | 5,500 | 958,618 | ||
| ||||
| 1,732,248 | ||||
| ||||
Paper Packaging (2.08%) | ||||
Smurfit Kappa Group PLC | 43,000 | 1,348,307 | ||
| ||||
Paper Products (2.76%) | ||||
Lee & Man Paper Manufacturing, Ltd. | 1,387,000 | 1,784,632 | ||
| ||||
Pharmaceuticals (0.95%) | ||||
Indivior PLC(a) | 73,000 | 332,508 | ||
Sawai Pharmaceutical Co., Ltd. | 5,000 | 284,269 | ||
| ||||
| 616,777 | ||||
| ||||
Regional Banks (5.86%) | ||||
Bank Tabungan Negara Persero Tbk PT | 3,000,000 | 702,615 | ||
Banregio Grupo Financiero SAB de CV | 223,800 | 1,332,845 | ||
DGB Financial Group, Inc. | 127,000 | 1,165,639 | ||
Grupo Financiero Interacciones SA de CV, Class O | 98,666 | 588,962 | ||
| ||||
| 3,790,061 | ||||
| ||||
Renewable Electricity (1.37%) | ||||
China Everbright Greentech, | 1,004,792 | 849,866 | ||
Energy Development Corp. | 375,361 | 41,567 | ||
| ||||
| 891,433 | ||||
| ||||
Semiconductors (1.12%) | ||||
Taiwan Semiconductor Manufacturing Co., Ltd. | 101,000 | 723,409 | ||
| ||||
Technology Hardware, Storage & Peripherals (0.52%) | ||||
Samsung Electronics Co., Ltd. | 150 | 337,534 | ||
| ||||
Tobacco (1.57%) | ||||
KT&G Corp. | 11,000 | 1,015,088 | ||
| ||||
Water Utilities (1.82%) | ||||
Guangdong Investment, Ltd. | 460,000 | 656,840 | ||
TTW PCL | 1,599,400 | 517,947 | ||
| ||||
| 1,174,787 | ||||
| ||||
Wireless Telecommunication Services (4.69%) | ||||
China Mobile, Ltd. | 123,000 | 1,248,691 | ||
Indosat Tbk PT | 67,250 | 31,206 | ||
SK Telecom Co., Ltd., Sponsored ADR | 42,500 | 1,045,075 | ||
The accompanying notes are an integral part of the financial statements.
| ||
| Annual Report | September 30, 2017 | 7 | |
Table of Contents
ICON Emerging Markets Fund | Schedule of Investments | |
| September 30, 2017 |
| Shares or Principal Amount | Value | |||||||
Wireless Telecommunication Services (continued) |
| |||||||
Turkcell Iletisim Hizmetleri AS | 200,000 | $ | 711,304 | |||||
|
| |||||||
| 3,036,276 | ||||||||
|
| |||||||
Total Common Stocks (Cost $60,948,547) | 62,759,968 | |||||||
|
| |||||||
Collateral for Securities on Loan (0.54%) | ||||||||
State Street Navigator Securities Lending Government Money Market Portfolio, 7-Day Yield 1.01% | 346,438 | 346,438 | ||||||
|
| |||||||
Total Collateral for Securities on Loan (Cost $346,438) | 346,438 | |||||||
|
| |||||||
Total Investments (97.51%) (Cost $61,294,985) | $ | 63,106,406 | ||||||
Other Assets Less Liabilities (2.49%) | 1,613,212 | |||||||
|
| |||||||
Net Assets (100.00%) | $ | 64,719,618 | ||||||
|
| |||||||
| (a) | Non-income producing security. |
| (b) | Fair valued security; valued by management in accordance with procedures approved by the Fund’s Board of Trustees. As of September 30, 2017, these securities had an aggregate market value of $138,256 or 0.21% of total net assets. |
| (c) | Less than 0.005%. |
| (d) | All or a portion of the security was on loan as of September 30, 2017. |
ADR - American Depositary Receipt
GDR - Global Depositary Receipt
| Country Composition (September 30, 2017) | ||||
China | 16.88 | % | ||
Indonesia | 14.42 | % | ||
South Korea | 12.82 | % | ||
Hong Kong | 12.40 | % | ||
Mexico | 6.78 | % | ||
Thailand | 6.19 | % | ||
Philippines | 5.99 | % | ||
India | 3.43 | % | ||
United States | 3.06 | % | ||
Russia | 3.00 | % | ||
Ireland | 2.50 | % | ||
Turkey | 1.97 | % | ||
Peru | 1.89 | % | ||
Jersey | 1.18 | % | ||
Taiwan | 1.12 | % | ||
Hungary | 1.01 | % | ||
United Kingdom | 0.98 | % | ||
Malaysia | 0.49 | % | ||
Japan | 0.44 | % | ||
Czech Republic | 0.42 | % | ||
| 96.97 | % | |||
Percentages are based upon common stocks as a percentage of net assets.
The accompanying notes are an integral part of the financial statements.
| ||
| 8 | www.iconfunds.com | |
Table of Contents
| ICON Emerging Markets Fund | Schedule of Investments | |
| September 30, 2017 |
Sector Composition (September 30, 2017) | ||||
Financial | 25.07% | |||
Materials | 17.51% | |||
Energy | 13.10% | |||
Industrials | 10.47% | |||
Information Technology | 9.97% | |||
Telecommunication Services | 8.15% | |||
Utilities | 6.93% | |||
Consumer Staples | 2.68% | |||
Consumer Discretionary | 1.72% | |||
Health Care | 1.37% | |||
|
| |||
| 96.97% | ||||
|
| |||
Percentages are based upon common stocks as a percentage of net assets.
| Industry Composition (September 30, 2017) | ||||
Diversified Banks | 17.49% | |||
Construction Materials | 8.02% | |||
Regional Banks | 5.86% | |||
Wireless Telecommunication Services | 4.69% | |||
Construction & Engineering | 3.85% | |||
Coal & Consumable Fuels | 3.41% | |||
Gold | 3.26% | |||
Integrated Oil & Gas | 3.23% | |||
Oil & Gas Exploration & Production | 2.98% | |||
Paper Products | 2.76% | |||
IT Consulting & Other Services | 2.75% | |||
Oil & Gas Refining & Marketing | 2.68% | |||
Integrated Telecommunication Services | 2.47% | |||
Independent Power Producers & Energy Traders | 2.21% | |||
Paper Packaging | 2.08% | |||
Airlines | 2.01% | |||
Electronic Components | 1.92% | |||
Water Utilities | 1.82% | |||
Tobacco | 1.57% | |||
Electronic Equipment & Instruments | 1.43% | |||
Industrial Machinery | 1.42% | |||
Consumer Finance | 1.38% | |||
Renewable Electricity | 1.37% | |||
Cable & Satellite | 1.28% | |||
Highways & Railtracks | 1.26% | |||
Internet Software & Services | 1.22% | |||
Commodity Chemicals | 1.18% | |||
Semiconductors | 1.12% | |||
Distillers & Vintners | 1.11% | |||
Environmental & Facilities Services | 1.10% | |||
Electric Utilities | 1.05% | |||
Electronic Manufacturing Services | 1.01% | |||
Other Industries (each less than 1%) | 5.98% | |||
|
| |||
| 96.97% | ||||
|
| |||
Percentages are based upon common stocks as a percentage of net assets.
The accompanying notes are an integral part of the financial statements.
| ||
| Annual Report | September 30, 2017 | 9 | |
Table of Contents
| ICON International Equity Fund | Management Overview | |
| September 30, 2017 (Unaudited) |
| Q. | How did the Fund perform relative to its benchmark? |
| A. | The ICON International Equity Fund (the Fund) Class S returned 10.30% for the fiscal year ended September 30, 2017, while the MSCI All Country World Index ex-United States (ACWI ex-U.S.) returned 20.15%. Total returns for other periods and additional Class shares as of September 30, 2017, appear in the subsequent pages of this Fund’s Management Overview. |
| Q. | What primary factors were behind the Fund’s relative performance? |
| A. | We finished fiscal year 2017 with global stock market gains. Volatility contracted and monetary policy remained accommodative, which encouraged investors to commit capital to the equity markets. In Asia, China’s economic growth remained relatively stable and rose slightly over the year as currency fluctuations in the Yuan/U.S. Dollar failed to have any meaningful effect on the economy. Japan emerged from its prior deflationary environment and experienced modest growth. Markets in Europe were mixed. The Eurozone region saw an increase in economic activity, while Britain had a modest contraction on the heels of last year’s decision to leave the European Union. In Latin America, Brazil experienced economic growth following a deep, two-year recession. As the period closed, and as detailed elsewhere in this overview, we still see upside in the global markets, with some regions showing great bargains and others appearing less attractive according to our system. |
At the beginning of the fiscal year, our valuation model signaled a 22% upside to fair value for global markets and pointed the Fund towards positioning in both cyclical and defensive sectors of the market. As fiscal year 2017 began, the Fund’s largest weighted sectors were Information Technology and Health Care. From a regional perspective, the Fund held an overweight position in Asia-Pacific and ultimately increased exposure to European equities throughout the year. In addition, the Fund held an overweight position in emerging market equities, though the Fund’s exposure to this space was gradually lower by the end of fiscal year 2017, as we saw better opportunities in the developed markets. Despite the ongoing issues looming over the world economy, our discipline and focus on value guided our decisions, which we believe will benefit the Fund going forward. |
As a multi-cap manager, we are not restricted by market capitalization. However, our valuation readings led us to a higher concentration in small- and mid-cap companies during the period and an underweight position in large-cap stocks relative to the benchmark. Overall, large-cap stocks outperformed their small- and mid-cap peers by a wide margin, which detracted from the Fund’s relative performance. |
| Q. | How did the Fund’s composition affect performance? |
| A. | The Fund’s primary contributors to benchmark relative performance came from the Consumer Staples and Industrials sectors. Specifically, underweight positions in the packaged foods & meats and tobacco industries within the Consumer Staples sector and overweight positions in the airlines and building products industries within the Industrials Sector contributed to performance relative to the benchmark. Further, an overweight position in the electronic equipment and instruments industry within the top performing Information Technology sector proved beneficial. |
Conversely, the Materials sector was a detractor, as the gold and diversified metals & mining industries hindered the Fund’s relative returns versus the benchmark. Our industry selection within the Information Technology sector was another source of relative underperformance, with our holdings in communications equipment and electronic components industries detracting from the Fund’s returns. Additionally, the Fund rotated away from the Information Technology sector too early, missing out on the sector’s leadership which continued through the end of the period. When our system saw value decline in segments of the market, we went to cash. This defensive move proved problematic, however, when equities ultimately remained resilient. |
While all geographic regions saw gains over the period, there were areas of differentiation among certain countries throughout the year. European equities had the highest returns, though the Eurozone countries outperformed the United Kingdom by a wide margin. Within the Asia-Pacific region, countries with larger concentrations in the Information Technology sector, including China and South Korea, stood out. The leadership in these sectors resulted in emerging market countries outperforming their developed peers for the period. The Fund’s overweight allocations to South Africa and underweight in Brazil, where we struggled to find value opportunities, led to underperformance over the year. |
| Q. | What is your investment outlook for the international equity market? |
| A. | International equities, on average, still remain below our estimate of their intrinsic value. At the end of the period, international markets as a whole had an overall average value-to-price (V/P) ratio of 1.15, implying that, on average, our estimate of fair value for stocks is about 15% higher than where they are currently trading. Investors have become less risk averse as equity prices have risen steadily over the years. Corporate earnings continue to rise, major economies are generally growing, and volatility remains low despite ongoing geopolitical concerns. While interest rates remain low, thanks in great part to loose monetary policy and extraordinary central bank intervention, we are now at a stage where policy moves are starting to decouple across the globe, with some countries removing stimulus and raising interest rates. As always, we will continue to monitor the capital markets and their effect on our investment system. |
| 10 | www.iconfunds.com | |
Table of Contents
| ICON International Equity Fund | Management Overview | |
| September 30, 2017 (Unaudited) |
According to our valuation system, Europe represents the best opportunity from a regional perspective, with the Western Hemisphere showing the least upside. Within Europe, we find attractive opportunities in the United Kingdom, France, and Germany in particular. As of the end of the fiscal year 2017, we estimate that, on average, fair value for European equities is 21% higher than where prices are currently trading. Within the Western Hemisphere, Mexico looks attractive to our system, with South Korea, Indonesia, and Thailand currently showing the most value in the Asia-Pacific region. Dramatic improvements in sentiment and our system’s valuations have led to our overweight emerging markets position versus developed, Western Hemisphere markets. |
From a sector perspective, we are still tilted towards the Financials, Materials, and Industrials sectors. Our system sees little upside in the defensive Health Care and Consumer Staples sectors, which are underweight in the Fund relative to the benchmark. |
At ICON we continue to seek out industries that our system identifies as trading at a discount to fair value. Guided by our disciplined, systematic and non-emotional approach to investing, we see numerous opportunities in these ever-changing markets. We believe it is nearly impossible to accurately time market bottoms and we believe rallies do not offer invitations. Therefore, given our current valuations, we remain almost fully invested. As market conditions dictate, we will adjust accordingly. |
| ||
| Annual Report | September 30, 2017 | 11 | |
Table of Contents
| ICON International Equity Fund | Management Overview | |
| September 30, 2017 (Unaudited) |
Average Annual Total Return (as of September 30, 2017)
| Inception Date | 1 Year | 5 Years | 10 Years | Since Inception | Gross Expense Ratio* | Net Expense Ratio* | |||||||||||||||||||||||||||||
ICON International Equity Fund – Class S | 2/18/97 | 10.30 | % | 3.68 | % | -2.42 | % | 5.04 | % | 1.45% | 1.45% | ||||||||||||||||||||||||
ICON International Equity Fund – Class C | 2/19/04 | 9.19 | % | 2.56 | % | -3.52 | % | 2.55 | % | 3.13% | 2.55% | ||||||||||||||||||||||||
ICON International Equity Fund – Class A | 5/31/06 | 10.03 | % | 3.34 | % | -2.80 | % | 0.40 | % | 2.43% | 1.80% | ||||||||||||||||||||||||
ICON International Equity Fund – Class A | 5/31/06 | 3.69 | % | 2.13 | % | -3.37 | % | -0.13 | % | 2.43% | 1.80% | ||||||||||||||||||||||||
MSCI ACWI ex-U.S. | 20.15 | % | 7.45 | % | 1.74 | % | 5.83 | % | N/A | N/A | |||||||||||||||||||||||||
Past performance is not a guarantee of future results. Information about these performance results and the comparative indexes can be found in the About This Report section. The Fund’s name and investment strategy changed effective January 29, 2004. The Fund’s past performance would have been different if the current strategy had been in effect. The Adviser has agreed to limit certain Fund expenses; without these limitations, returns would have been lower. The limitation provisions may be terminated in the future.
| * | Please see the most recent prospectus for details. |
Class C total returns exclude applicable sales charges. If sales charges were included returns would be lower.
Value of a $10,000 Investment (through September 30, 2017)
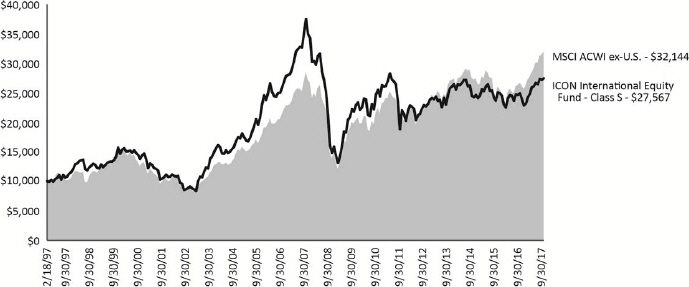
Past performance is not a guarantee of future results. The above graph compares a $10,000 investment made in the International Equity Fund’s Class S shares on the Class’ inception date of 2/18/97 to a $10,000 investment made in an unmanaged securities index on that date. The Fund’s name and investment strategy changed effective January 29, 2004. The Fund’s past performance would have been different if the current strategy had been in effect. Performance for the International Equity Fund’s other share classes will vary due to differences in charges and expenses. The International Equity Fund’s performance in this chart and the performance table assumes the reinvestment of dividends, capital gain distributions and tax return of capital, but does not reflect the deduction of taxes that a shareholder would pay on Fund distributions or on the redemption of Fund shares.
| 12 | www.iconfunds.com | |
Table of Contents
| ICON International Equity Fund | Schedule of Investments | |
| September 30, 2017 |
| Shares or Principal Amount | Value | |||||||
Common Stocks (98.54%) | ||||||||
Aerospace & Defense (1.18%) | ||||||||
Airbus SE(a) | 6,200 | $ | 589,921 | |||||
|
| |||||||
Airlines (1.00%) | ||||||||
Cebu Air, Inc. | 230,000 | 496,678 | ||||||
|
| |||||||
Alternative Carriers (0.62%) | ||||||||
Link Net Tbk PT | 800,000 | 307,373 | ||||||
|
| |||||||
Aluminum (0.19%) | ||||||||
China Hongqiao Group, Ltd.(a)(b) | 183,000 | 93,707 | ||||||
|
| |||||||
Application Software (0.80%) |
| |||||||
Open Text Corp. | 12,300 | 396,873 | ||||||
|
| |||||||
Biotechnology (1.96%) | ||||||||
Shire PLC | 19,200 | 977,929 | ||||||
|
| |||||||
Building Products (3.75%) | ||||||||
China Lesso Group Holdings, Ltd. | 370,000 | 253,010 | ||||||
Cie de Saint-Gobain | 12,800 | 762,625 | ||||||
Sanwa Holdings Corp. | 22,000 | 252,654 | ||||||
Tyman PLC | 139,054 | 600,922 | ||||||
|
| |||||||
| 1,869,211 | ||||||||
|
| |||||||
Cable & Satellite (3.48%) |
| |||||||
Megacable Holdings SAB de CV | 71,351 | 297,198 | ||||||
NOS SGPS SA | 37,000 | 229,307 | ||||||
Quebecor, Inc., Class B | 25,600 | 962,039 | ||||||
Sky PLC | 20,000 | 245,358 | ||||||
|
| |||||||
| 1,733,902 | ||||||||
|
| |||||||
Casinos & Gaming (0.94%) |
| |||||||
Ladbrokes Coral Group PLC | 287,000 | 469,572 | ||||||
|
| |||||||
Coal & Consumable Fuels (1.10%) |
| |||||||
Indo Tambangraya Megah Tbk PT | 203,000 | 305,402 | ||||||
Tambang Batubara Bukit Asam Persero Tbk PT | 316,000 | 245,302 | ||||||
|
| |||||||
| 550,704 | ||||||||
|
| |||||||
Commodity Chemicals (1.72%) |
| |||||||
Mexichem SAB de CV | 82,654 | 217,914 | ||||||
Petronas Chemicals Group Bhd | 77,000 | 133,009 | ||||||
Zeon Corp. | 39,000 | 505,968 | ||||||
|
| |||||||
| 856,891 | ||||||||
|
| |||||||
Construction & Engineering (4.38%) |
| |||||||
China Communications Construction Co., Ltd., Class H | 290,000 | 363,725 | ||||||
China State Construction International Holdings, Ltd. | 230,000 | 336,251 | ||||||
Obayashi Corp. | 24,000 | 287,867 | ||||||
Pembangunan Perumahan Persero Tbk PT | 1,318,427 | 226,449 | ||||||
Penta-Ocean Construction Co., Ltd | 49,000 | 309,375 | ||||||
| Shares or Principal Amount | Value | |||||||
Construction & Engineering (continued) |
| |||||||
Waskita Karya Persero Tbk PT | 2,420,000 | $ | 319,356 | |||||
Wijaya Karya Persero Tbk PT | 2,582,391 | 343,728 | ||||||
|
| |||||||
| 2,186,751 | ||||||||
|
| |||||||
Construction Materials (3.74%) |
| |||||||
China Resources Cement Holdings, Ltd. | 776,000 | 478,413 | ||||||
Cimsa Cimento Sanayi VE Ticaret AS | 55,000 | 218,905 | ||||||
Tipco Asphalt PCL | 490,000 | 354,422 | ||||||
Waskita Beton Precast Tbk PT | 11,700,000 | 312,894 | ||||||
West China Cement, | 2,580,000 | 420,976 | ||||||
Wijaya Karya Beton Tbk PT | 2,000,000 | 79,491 | ||||||
|
| |||||||
| 1,865,101 | ||||||||
|
| |||||||
Department Stores (0.00%)(c) |
| |||||||
Grupo Sanborns SAB de CV | 630 | 737 | ||||||
|
| |||||||
Distillers & Vintners (0.48%) | ||||||||
Thai Beverage PCL | 360,000 | 239,118 | ||||||
|
| |||||||
Diversified Banks (11.21%) | ||||||||
ABN AMRO Group NV | 7,200 | 215,599 | ||||||
Banco Bilbao Vizcaya Argentaria SA | 16,000 | 143,047 | ||||||
Banco Santander SA | 51,000 | 356,738 | ||||||
Bank Negara Indonesia Persero Tbk PT | 520,000 | 285,936 | ||||||
Bank of China, Ltd., Class H | 1,060,000 | 526,526 | ||||||
BNP Paribas SA | 3,100 | 250,095 | ||||||
Credicorp, Ltd. | 1,100 | 225,522 | ||||||
DBS Group Holdings, Ltd. | 6,500 | 100,061 | ||||||
DNB ASA | 7,700 | 155,464 | ||||||
HSBC Holdings PLC | 35,000 | 346,004 | ||||||
KB Financial Group, Inc. | 4,700 | 231,236 | ||||||
Metropolitan Bank & Trust Co. | 233,000 | 397,173 | ||||||
Moneta Money Bank AS | 110,000 | 387,302 | ||||||
Oversea-Chinese Banking Corp., Ltd. | 12,000 | 98,955 | ||||||
Sberbank of Russia PJSC, Sponsored ADR | 47,000 | 670,197 | ||||||
Shinhan Financial Group Co., Ltd. | 3,200 | 141,435 | ||||||
Societe Generale SA | 4,400 | 257,846 | ||||||
Swedbank AB, Class A | 13,500 | 373,836 | ||||||
UniCredit SpA(a) | 11,600 | 247,541 | ||||||
Yes Bank, Ltd. | 35,000 | 187,880 | ||||||
|
| |||||||
| 5,598,393 | ||||||||
|
| |||||||
Electric Utilities (3.50%) |
| |||||||
CK Infrastructure Holdings, Ltd. | 54,000 | 465,538 | ||||||
Emera, Inc. | 6,000 | 227,257 | ||||||
Enel SpA | 92,000 | 554,237 | ||||||
Iberdrola SA | 64,000 | 497,641 | ||||||
|
| |||||||
| 1,744,673 | ||||||||
|
| |||||||
The accompanying notes are an integral part of the financial statements.
| ||
| Annual Report | September 30, 2017 | 13 | |
Table of Contents
| ICON International Equity Fund | Schedule of Investments | |
| September 30, 2017 |
| Shares or Principal Amount | Value | |||
Electronic Equipment & Instruments (1.80%) | ||||
China Railway Signal & Communication Corp., Ltd., Class H | 660,000 | $ 496,214 | ||
SFA Engineering Corp. | 11,200 | 405,619 | ||
| ||||
| 901,833 | ||||
| ||||
Electronic Manufacturing Services (0.85%) | ||||
Fabrinet(a) | 11,400 | 422,484 | ||
| ||||
Environmental & Facilities Services (0.98%) | ||||
China Everbright International, Ltd. | 390,000 | 491,452 | ||
| ||||
Gold (3.72%) | ||||
Barrick Gold Corp. | 11,600 | 186,678 | ||
Cia de Minas Buenaventura SAA, ADR | 19,200 | 245,568 | ||
Randgold Resources, Ltd. | 7,500 | 733,026 | ||
SEMAFO, Inc.(a) | 131,000 | 346,464 | ||
Zijin Mining Group Co., Ltd., Class H | 1,020,000 | 350,897 | ||
| ||||
| 1,862,633 | ||||
| ||||
Health Care Technology (0.47%) | ||||
M3, Inc. | 8,200 | 233,793 | ||
| ||||
Highways & Railtracks (1.21%) | ||||
Shenzhen Expressway Co., Ltd., Class H | 620,000 | 602,884 | ||
| ||||
Hotels, Resorts & Cruise Lines (1.15%) | ||||
Melia Hotels International SA | 13,000 | 188,033 | ||
TUI AG | 22,500 | 382,498 | ||
| ||||
| 570,531 | ||||
| ||||
Independent Power Producers & Energy Traders (2.41%) | ||||
Aboitiz Power Corp. | 290,000 | 244,619 | ||
Electric Power Development Co., Ltd. | 19,300 | 484,832 | ||
Electricity Generating PCL | 52,000 | 366,417 | ||
First Gen Corp. | 300,000 | 111,803 | ||
| ||||
| 1,207,671 | ||||
| ||||
Industrial Conglomerates (1.11%) | ||||
DCC PLC | 2,000 | 194,203 | ||
Seibu Holdings, Inc. | 21,000 | 358,701 | ||
| ||||
| 552,904 | ||||
| ||||
Industrial Machinery (1.05%) | ||||
China Conch Venture Holdings, Ltd. | 270,000 | 526,404 | ||
| ||||
Integrated Oil & Gas (1.76%) | ||||
China Petroleum & Chemical Corp., Class H | 244,000 | 183,898 | ||
LUKOIL PJSC, Sponsored ADR | 6,700 | 355,336 | ||
MOL Hungarian Oil & Gas PLC | 21,600 | 245,647 | ||
| Shares or Principal Amount | Value | |||||
Integrated Oil & Gas (continued) |
| |||||
Rosneft Oil Co. PJSC, GDR | 16,700 | $ | 92,927 | |||
|
| |||||
| 877,808 | ||||||
|
| |||||
Integrated Telecommunication Services (1.73%) |
| |||||
KT Corp., Sponsored ADR | 14,000 | 194,180 | ||||
Orange SA | 15,000 | 245,609 | ||||
Telecom Italia SpA(a) | 450,000 | 422,117 | ||||
|
| |||||
| 861,906 | ||||||
|
| |||||
Investment Banking & Brokerage (0.45%) |
| |||||
Nomura Holdings, Inc. | 40,000 | 224,440 | ||||
|
| |||||
IT Consulting & Other Services (1.00%) | ||||||
HCL Technologies, Ltd. | 19,300 | 258,643 | ||||
Infosys, Ltd. | 17,300 | 238,856 | ||||
|
| |||||
| 497,499 | ||||||
|
| |||||
Life & Health Insurance (1.93%) |
| |||||
AIA Group, Ltd. | 57,000 | 421,988 | ||||
Legal & General Group PLC | 99,000 | 345,063 | ||||
Prudential PLC | 8,200 | 196,230 | ||||
|
| |||||
| 963,281 | ||||||
|
| |||||
Metal & Glass Containers (1.97%) |
| |||||
RPC Group PLC | 74,000 | 982,698 | ||||
|
| |||||
Multi-line Insurance (1.73%) | ||||||
Allianz SE | 1,200 | 269,504 | ||||
Assicurazioni Generali SpA | 9,300 | 173,457 | ||||
Aviva PLC | 28,000 | 193,254 | ||||
AXA SA | 7,400 | 223,718 | ||||
|
| |||||
| 859,933 | ||||||
|
| |||||
Multi-Utilities (2.63%) |
| |||||
Avista Corp. | 4,600 | 238,142 | ||||
Engie SA | 34,900 | 592,652 | ||||
RWE AG(a) | 6,000 | 136,500 | ||||
Veolia Environnement SA | 15,000 | 346,620 | ||||
|
| |||||
| 1,313,914 | ||||||
|
| |||||
Oil & Gas Equipment & Services (2.42%) |
| |||||
Enerflex, Ltd. | 29,300 | 432,074 | ||||
John Wood Group PLC | 18,000 | 164,410 | ||||
SBM Offshore NV | 15,000 | 271,996 | ||||
U.S. Silica Holdings, Inc.(d) | 11,000 | 341,770 | ||||
|
| |||||
| 1,210,250 | ||||||
|
| |||||
Oil & Gas Exploration & Production (5.88%) |
| |||||
CNOOC, Ltd. | 504,000 | 652,454 | ||||
Diamondback Energy, | 6,376 | 624,593 | ||||
Encana Corp. | 16,000 | 188,371 | ||||
Gulfport Energy Corp.(a) | 21,574 | 309,371 | ||||
Newfield Exploration Co.(a) | 14,200 | 421,314 | ||||
Parsley Energy, Inc., | 9,230 | 243,118 | ||||
Seven Generations Energy, Ltd., Class A(a) | 31,200 | 493,599 | ||||
|
| |||||
| 2,932,820 | ||||||
|
| |||||
Oil & Gas Refining & Marketing (2.82%) |
| |||||
Idemitsu Kosan Co., Ltd. | 9,300 | 262,835 | ||||
JXTG Holdings, Inc. | 60,500 | 311,951 | ||||
The accompanying notes are an integral part of the financial statements.
| ||
| 14 | www.iconfunds.com | |
Table of Contents
| ICON International Equity Fund | Schedule of Investments | |
| September 30, 2017 |
| Shares or Principal Amount | Value | |||||
Oil & Gas Refining & Marketing (continued) | ||||||
Petron Corp. | 2,000,000 | $ 412,603 | ||||
SK Innovation Co., Ltd. | 2,400 | 418,306 | ||||
| ||||||
| 1,405,695 | ||||||
| ||||||
Oil & Gas Storage & Transportation (0.91%) |
| |||||
Pembina Pipeline Corp. | 13,000 | 456,133 | ||||
| ||||||
Paper Packaging (2.06%) | ||||||
Rengo Co., Ltd. | 34,000 | 202,381 | ||||
Smurfit Kappa Group PLC | 26,300 | 824,662 | ||||
| ||||||
| 1,027,043 | ||||||
| ||||||
Paper Products (0.62%) | ||||||
Lee & Man Paper Manufacturing, Ltd. | 240,000 | 308,804 | ||||
| ||||||
Pharmaceuticals (2.77%) | ||||||
Indivior PLC(a) | 56,000 | 255,075 | ||||
Ipsen SA | 2,200 | 292,718 | ||||
Roche Holding AG | 1,500 | 383,430 | ||||
Sawai Pharmaceutical Co., Ltd. | 4,200 | 238,786 | ||||
Shionogi & Co., Ltd. | 3,800 | 207,734 | ||||
| ||||||
| 1,377,743 | ||||||
| ||||||
Regional Banks (2.24%) | ||||||
Banregio Grupo Financiero SAB de CV | 66,000 | 393,064 | ||||
DGB Financial Group, Inc. | 38,000 | 348,774 | ||||
Grupo Financiero Interacciones SA de CV, Class O | 62,955 | 375,794 | ||||
| ||||||
| 1,117,632 | ||||||
| ||||||
Renewable Electricity (1.01%) | ||||||
China Everbright Greentech, Ltd.(a) | 595,009 | 503,266 | ||||
| ||||||
Specialty Chemicals (0.99%) | ||||||
Covestro AG | 3,200 | 275,362 | ||||
Koninklijke DSM NV | 2,700 | 221,039 | ||||
| ||||||
| 496,401 | ||||||
| ||||||
Specialty Stores (0.38%) | ||||||
Beauty Community PCL | 400,000 | 192,103 | ||||
| ||||||
Steel (2.29%) | ||||||
ArcelorMittal(a) | 36,000 | 928,667 | ||||
Bekaert SA | 4,500 | 216,037 | ||||
| ||||||
| 1,144,704 | ||||||
| ||||||
Tobacco (1.73%) | ||||||
British American Tobacco PLC | 6,100 | 381,883 | ||||
KT&G Corp. | 5,200 | 479,860 | ||||
| ||||||
| 861,743 | ||||||
| ||||||
Trading Companies & Distributors (1.57%) | ||||||
Mitsubishi Corp. | 16,800 | 390,866 | ||||
Sojitz Corp. | 142,000 | 392,919 | ||||
| ||||||
| 783,785 | ||||||
| ||||||
Water Utilities (0.64%) | ||||||
Pennon Group PLC | 30,000 | 320,318 | ||||
| ||||||
| Shares or Principal Amount | Value | |||||||
Wireless Telecommunication Services (2.21%) |
| |||||||
China Mobile, Ltd. | 39,000 | $ 395,926 | ||||||
Indosat Tbk PT | 67,250 | 31,206 | ||||||
SK Telecom Co., Ltd., Sponsored ADR | 13,200 | 324,588 | ||||||
Turkcell Iletisim Hizmetleri AS | 100,000 | 355,652 | ||||||
|
| |||||||
| 1,107,372 | ||||||||
|
| |||||||
Total Common Stocks (Cost $48,272,246) | 49,177,414 | |||||||
|
| |||||||
Collateral for Securities on Loan (0.69%) |
| |||||||
State Street Navigator Securities Lending Government Money Market Portfolio, 7-Day Yield 1.01% | 343,750 | 343,750 | ||||||
|
| |||||||
Total Collateral for Securities on Loan (Cost $343,750) | 343,750 | |||||||
|
| |||||||
Total Investments (99.23%) (Cost $48,615,996) | $49,521,164 | |||||||
Other Assets Less Liabilities (0.77%) | 383,261 | |||||||
|
| |||||||
Net Assets (100.00%) | $49,904,425 | |||||||
|
| |||||||
| (a) | Non-income producing security. |
| (b) | Fair valued security; valued by management in accordance with procedures approved by the Fund’s Board of Trustees. As of September 30, 2017, these securities had an aggregate market value of $93,707 or 0.19% of total net assets. |
| (c) | Less than 0.005%. |
| (d) | All or a portion of the security was on loan as of September 30, 2017. |
ADR - American Depositary Receipt
GDR - Global Depositary Receipt
The accompanying notes are an integral part of the financial statements.
| ||
| Annual Report | September 30, 2017 | 15 | |
Table of Contents
| ICON International Equity Fund | Schedule of Investments | |
| September 30, 2017 |
Country Composition (September 30, 2017) |
| |||
Japan | 9.36% | |||
China | 8.95% | |||
Canada | 7.40% | |||
France | 7.14% | |||
Hong Kong | 6.81% | |||
South Korea | 5.09% | |||
Great Britain | 5.01% | |||
Indonesia | 4.92% | |||
United States | 4.36% | |||
Ireland | 4.00% | |||
United Kingdom | 4.00% | |||
Philippines | 3.34% | |||
Thailand | 3.15% | |||
Italy | 2.81% | |||
Mexico | 2.58% | |||
Spain | 2.38% | |||
Russia | 2.24% | |||
Germany | 2.13% | |||
Luxembourg | 1.86% | |||
Jersey | 1.47% | |||
Netherlands | 1.41% | |||
India | 1.38% | |||
Turkey | 1.15% | |||
Peru | 0.94% | |||
Czech Republic | 0.78% | |||
Switzerland | 0.77% | |||
Sweden | 0.75% | |||
Hungary | 0.49% | |||
Portugal | 0.46% | |||
Belgium | 0.43% | |||
Singapore | 0.40% | |||
Norway | 0.31% | |||
Malaysia | 0.27% | |||
|
| |||
| 98.54% | ||||
|
| |||
Percentages are based upon common stocks as a percentage of net assets.
Sector Composition (September 30, 2017) |
| |||
Financial | 17.56% | |||
Materials | 17.30% | |||
Industrials | 16.23% | |||
Energy | 14.89% | |||
Utilities | 10.19% | |||
Consumer Discretionary | 5.95% | |||
Health Care | 5.20% | |||
Telecommunication Services | 4.56% | |||
Information Technology | 4.45% | |||
Consumer Staples | 2.21% | |||
|
| |||
| 98.54% | ||||
|
| |||
Percentages are based upon common stocks as a percentage of net assets.
The accompanying notes are an integral part of the financial statements.
| ||
| 16 | www.iconfunds.com | |
Table of Contents
| ICON International Equity Fund | Schedule of Investments | |
| September 30, 2017 |
Industry Composition (September 30, 2017) |
| |||
Diversified Banks | 11.21% | |||
Oil & Gas Exploration & Production | 5.88% | |||
Construction & Engineering | 4.38% | |||
Building Products | 3.75% | |||
Construction Materials | 3.74% | |||
Gold | 3.72% | |||
Electric Utilities | 3.50% | |||
Cable & Satellite | 3.48% | |||
Oil & Gas Refining & Marketing | 2.82% | |||
Pharmaceuticals | 2.77% | |||
Multi-Utilities | 2.63% | |||
Oil & Gas Equipment & Services | 2.42% | |||
Independent Power Producers & Energy Traders | 2.41% | |||
Steel | 2.29% | |||
Regional Banks | 2.24% | |||
Wireless Telecommunication Services | 2.21% | |||
Paper Packaging | 2.06% | |||
Metal & Glass Containers | 1.97% | |||
Biotechnology | 1.96% | |||
Life & Health Insurance | 1.93% | |||
Electronic Equipment & Instruments | 1.80% | |||
Integrated Oil & Gas | 1.76% | |||
Multi-line Insurance | 1.73% | |||
Tobacco | 1.73% | |||
Integrated Telecommunication Services | 1.73% | |||
Commodity Chemicals | 1.72% | |||
Trading Companies & Distributors | 1.57% | |||
Highways & Railtracks | 1.21% | |||
Aerospace & Defense | 1.18% | |||
Hotels, Resorts & Cruise Lines | 1.15% | |||
Industrial Conglomerates | 1.11% | |||
Coal & Consumable Fuels | 1.10% | |||
Industrial Machinery | 1.05% | |||
Renewable Electricity | 1.01% | |||
Airlines | 1.00% | |||
IT Consulting & Other Services | 1.00% | |||
Other Industries (each less than 1%) | 9.32% | |||
|
| |||
| 98.54% | ||||
|
| |||
Percentages are based upon common stocks as a percentage of net assets.
The accompanying notes are an integral part of the financial statements.
| ||
| Annual Report | September 30, 2017 | 17 | |
Table of Contents
| ICON International Funds | Statements of Assets and Liabilities | |
| September 30, 2017 |
| ICON Emerging Markets Fund | ICON International Equity Fund | |||||||
Assets | ||||||||
Investments, at cost | $ | 61,294,985 | $ | 48,615,996 | ||||
|
| |||||||
Investments, at value(a) | 63,106,406 | 49,521,164 | ||||||
Cash and cash equivalents | 1,088,026 | 380,649 | ||||||
Foreign currency, at value (Cost $308,818 and $1,900, respectively) | 309,986 | 1,206 | ||||||
Receivables: | ||||||||
Investments sold | 783,023 | 568,186 | ||||||
Fund shares sold | 204,703 | 9,361 | ||||||
Expense reimbursements due from Adviser | 27,222 | 14,327 | ||||||
Dividends | 55,278 | 80,066 | ||||||
Foreign tax reclaims | 246 | 54,504 | ||||||
Other assets | 14,238 | 13,739 | ||||||
|
| |||||||
Total assets | 65,589,128 | 50,643,202 | ||||||
|
| |||||||
Liabilities | ||||||||
Payables: | ||||||||
Payable for collateral received on securities loaned | 346,438 | 343,750 | ||||||
Investments purchased | 339,980 | 258,747 | ||||||
Capital gains tax | – | 1,574 | ||||||
Fund shares redeemed | 7,049 | 1,923 | ||||||
Advisory fees | 53,353 | 40,705 | ||||||
Transfer agent fees | 44,445 | 11,356 | ||||||
Fund accounting fees | 19,118 | 26,997 | ||||||
Accrued distribution fees | 2,653 | 2,501 | ||||||
Trustee fees and expenses | 3,664 | 2,842 | ||||||
Administration fees | 2,666 | 2,035 | ||||||
Accrued expenses | 50,144 | 46,347 | ||||||
|
| |||||||
Total liabilities | 869,510 | 738,777 | ||||||
|
| |||||||
Net Assets - all share classes | $ | 64,719,618 | $ | 49,904,425 | ||||
|
| |||||||
Net Assets - Class S | $ | 51,832,598 | $ | 45,144,360 | ||||
|
| |||||||
Net Assets - Class C | $ | – | $ | 2,484,375 | ||||
|
| |||||||
Net Assets - Class A | $ | 12,887,020 | $ | 2,275,690 | ||||
|
| |||||||
Net Assets Consists of | ||||||||
Paid-in capital | $ | 62,807,146 | $ | 84,069,809 | ||||
Accumulated undistributed net investment income/(loss) | 100,506 | (102,068) | ||||||
Accumulated undistributed net realized gain/(loss) | – | (34,967,250) | ||||||
Unrealized appreciation/(depreciation) | 1,811,966 | 903,934 | ||||||
�� |
| |||||||
Net Assets | $ | 64,719,618 | $ | 49,904,425 | ||||
|
| |||||||
Shares outstanding (unlimited shares authorized, no par value) | ||||||||
Class S | 3,259,669 | 3,428,233 | ||||||
Class C | – | 213,402 | ||||||
Class A | 817,166 | 175,929 | ||||||
Net asset value (offering and redemption price per share) | ||||||||
Class S | $ | 15.90 | $ | 13.17 | ||||
Class C | $ | – | $ | 11.64 | ||||
Class A | $ | 15.77 | $ | 12.94 | ||||
Class A maximum offering price (100%/ (100%-maximum sales charge)) of net asset value adjusted to the nearest cent per share | $ | 16.73 | $ | 13.72 | ||||
(a) Includes securities on loan of | $ | 344,442 | $ | 341,770 | ||||
The accompanying notes are an integral part of the financial statements.
| ||
| 18 | www.iconfunds.com | |
Table of Contents
| ICON International Funds | Statements of Operations | |
| Year Ended September 30, 2017 |
| ICON Emerging Markets Fund | ICON International Equity Fund | ||||||
Investment Income | ||||||||
Interest | $ | 2,825 | $ | 2,373 | ||||
Dividends | 1,236,072 | 985,157 | ||||||
Foreign taxes withheld | (143,401) | (91,247) | ||||||
Income from securities lending, net | 755 | 27,453 | ||||||
|
| |||||||
Total investment income | 1,096,251 | 923,736 | ||||||
|
| |||||||
Expenses | ||||||||
Advisory fees | 538,176 | 493,187 | ||||||
Administration fees | 26,837 | 24,581 | ||||||
Transfer agent fees | 123,179 | 42,512 | ||||||
Distribution fees: | ||||||||
Class C(a) | 2,500 | 26,016 | ||||||
Class A | 23,553 | 5,909 | ||||||
Registration fees | 40,586 | 39,842 | ||||||
Audit and tax service expense | 25,545 | 25,545 | ||||||
Fund accounting fees | 55,803 | 72,940 | ||||||
Trustee fees and expenses | 12,174 | 10,830 | ||||||
Insurance expense | 5,210 | 4,308 | ||||||
Custody fees | 46,145 | 33,183 | ||||||
Printing fees | 16,555 | 9,101 | ||||||
Other expenses | 54,424 | 57,408 | ||||||
|
| |||||||
Total expenses before expense reimbursement | 970,687 | 845,362 | ||||||
Expense reimbursement by Adviser due to expense limitation agreement | (110,029) | (49,267) | ||||||
|
| |||||||
Net Expenses | 860,658 | 796,095 | ||||||
|
| |||||||
Net Investment Income/(Loss) | 235,593 | 127,641 | ||||||
|
| |||||||
Realized and Unrealized Gain/(Loss) | ||||||||
Net realized gain/(loss) on: | ||||||||
Investments and foreign currency translations | 4,126,115 | 2,569,275 | ||||||
Capital gains tax | (56,584) | (68,449) | ||||||
|
| |||||||
| 4,069,531 | 2,500,826 | |||||||
|
| |||||||
Change in unrealized net appreciation/(depreciation) on: | ||||||||
Investments and foreign currency | 794,783 | 1,848,050 | ||||||
Capital gains tax | – | (1,574) | ||||||
|
| |||||||
| 794,783 | 1,846,476 | |||||||
|
| |||||||
Net realized and unrealized gain/(loss) | 4,864,314 | 4,347,302 | ||||||
|
| |||||||
Net Increase/(Decrease) in Net Assets Resulting From Operations | $ | 5,099,907 | $ | 4,474,943 | ||||
|
| |||||||
| (a) | Emerging Markets Fund Class C shares merged into Class A shares on January 10, 2017. The information presented is for expenses incurred before the merger. |
The accompanying notes are an integral part of the financial statements.
| ||
| Annual Report | September 30, 2017 | 19 | |
Table of Contents
| ICON International Funds | Statements of Changes in Net Assets | |
| ICON Emerging Markets Fund | ICON International Equity Fund | |||||||||||||||
| Year Ended September 30, 2017 | Year Ended September 30, 2016 | Year Ended September 30, 2017 | Year Ended September 30, 2016 | |||||||||||||
Operations | ||||||||||||||||
Net investment income/(loss) | $ | 235,593 | $ | (20,622) | $ | 127,641 | $ | 264,296 | ||||||||
Net realized gain/(loss) | 4,069,531 | 2,067,753 | 2,500,826 | (2,700,624) | ||||||||||||
Change in net unrealized appreciation/(depreciation) | 794,783 | 2,013,423 | 1,846,476 | 5,285,537 | ||||||||||||
|
| |||||||||||||||
Net increase/(decrease) in net assets resulting from operations | 5,099,907 | 4,060,554 | 4,474,943 | 2,849,209 | ||||||||||||
|
| |||||||||||||||
Fund Share Transactions | ||||||||||||||||
Shares sold | ||||||||||||||||
Class S | 26,312,322 | 35,539,610 | 4,368,367 | 3,354,948 | ||||||||||||
Class C(a) | 43,641 | 823,176 | 123,670 | 81,425 | ||||||||||||
Class A(a) | 9,477,499 | 12,243,987 | 168,244 | 175,210 | ||||||||||||
Shares repurchased | ||||||||||||||||
Class S | (24,352,508) | (9,328,014) | (13,299,835) | (23,174,814) | ||||||||||||
Class C(a) | (995,637) | (459,358) | (784,395) | (552,431) | ||||||||||||
Class A(a) | (6,735,963) | (4,458,977) | (921,210) | (1,184,134) | ||||||||||||
|
| |||||||||||||||
Net increase/(decrease) from fund share transactions | 3,749,354 | 34,360,424 | (10,345,159) | (21,299,796) | ||||||||||||
|
| |||||||||||||||
Total net increase/(decrease) in net assets | 8,849,261 | 38,420,978 | (5,870,216) | (18,450,587) | ||||||||||||
Net Assets | ||||||||||||||||
Beginning of year | 55,870,357 | 17,449,379 | 55,774,641 | 74,225,228 | ||||||||||||
|
| |||||||||||||||
End of year | $ | 64,719,618 | $ | 55,870,357 | $ | 49,904,425 | $ | 55,774,641 | ||||||||
|
| |||||||||||||||
Accumulated undistributed net investment income/(loss) | $ | 100,506 | $ | (121,597) | $ | (102,068) | $ | (227,984) | ||||||||
|
| |||||||||||||||
Transactions in Fund Shares | ||||||||||||||||
Shares sold | ||||||||||||||||
Class S | 1,779,885 | 2,656,595 | 350,531 | 291,975 | ||||||||||||
Class C(a) | 3,312 | 64,476 | 11,284 | 7,727 | ||||||||||||
Class A(a) | 652,238 | 918,881 | 13,905 | 15,507 | ||||||||||||
Shares repurchased | ||||||||||||||||
Class S | (1,727,057) | (694,300) | (1,110,895) | (2,012,460) | ||||||||||||
Class C(a) | (78,688) | (37,993) | (73,749) | (53,203) | ||||||||||||
Class A(a) | (474,151) | (335,946) | (78,612) | (106,353) | ||||||||||||
|
| |||||||||||||||
Net increase/(decrease) | 155,539 | 2,571,713 | (887,536) | (1,856,807) | ||||||||||||
|
| |||||||||||||||
Shares outstanding, beginning of year | 3,921,296 | 1,349,583 | 4,705,100 | 6,561,907 | ||||||||||||
|
| |||||||||||||||
Shares outstanding, end of year | 4,076,835 | 3,921,296 | 3,817,564 | 4,705,100 | ||||||||||||
|
| |||||||||||||||
| (a) | Emerging Markets Fund Class C shares merged into Class A shares on January 10, 2017. The information presented includes the activity for Class C prior to the merger as well as Class C shares redeemed, 67,738 shares, and Class A shares issued, 63,928 shares, in connection with the merger of $853,918. |
The accompanying notes are an integral part of the financial statements.
| ||
| 20 | www.iconfunds.com | |
Table of Contents
| ICON Emerging Markets Fund | Financial Highlights | |
| For a Share Outstanding Throughout the Years Presented |
| Class S | Year Ended September 30, 2017 | Year Ended September 30, 2016 | Year Ended September 30, 2015 | Year Ended September 30, 2014 | Year Ended September 30, 2013 | |||||||||||||||||||||||
Net asset value, beginning of period | $ | 14.28 | $ | 12.95 | $ | 13.72 | $ | 13.51 | $ | 12.21 | ||||||||||||||||||
Income/(loss) from investment operations: | ||||||||||||||||||||||||||||
Net investment income/(loss)(a)(b) | 0.07 | (0.00) | (c) | (0.03) | (0.03) | 0.06 | ||||||||||||||||||||||
Net realized and unrealized gains/(losses) on investments | 1.55 | 1.33 | (0.74) | 0.27 | 1.33 | |||||||||||||||||||||||
Total from investment operations | 1.62 | 1.33 | (0.77) | 0.24 | 1.39 | |||||||||||||||||||||||
Less dividends and distributions: | ||||||||||||||||||||||||||||
Dividends from net investment income | – | – | – | (0.03) | (0.09) | |||||||||||||||||||||||
Total dividends and distributions | – | – | – | (0.03) | (0.09) | |||||||||||||||||||||||
Net asset value, end of period | $ | 15.90 | $ | 14.28 | $ | 12.95 | $ | 13.72 | $ | 13.51 | ||||||||||||||||||
Total Return | 11.34 | % | 10.27 | % | (5.61) | % | 1.78 | % | 11.44 | % | ||||||||||||||||||
Ratios and Supplemental Data | ||||||||||||||||||||||||||||
Net assets, end of period (in 000s) | $ | 51,833 | $ | 45,786 | $ | 16,123 | $ | 8,942 | $ | 29,053 | ||||||||||||||||||
Ratio of expenses to average net assets | ||||||||||||||||||||||||||||
Before expense limitation | 1.72 | % | 1.85 | % | 2.44 | % | 2.11 | % | 1.64 | % | ||||||||||||||||||
After expense limitation | 1.55 | %(d) | 1.55 | %(d) | 1.55 | %(d) | 1.88 | %(e) | 1.64 | % | ||||||||||||||||||
Ratio of net investment income/(loss) to average net assets | ||||||||||||||||||||||||||||
Before expense limitation | 0.29 | % | (0.32) | % | (1.08) | % | (0.42) | % | 0.46 | % | ||||||||||||||||||
After expense limitation | 0.46 | %(d) | (0.02) | %(d) | (0.19) | %(d) | (0.19) | %(e) | 0.46 | % | ||||||||||||||||||
Portfolio turnover rate | 169 | % | 156 | % | 76 | % | 92 | % | 60 | % | ||||||||||||||||||
| (a) | Calculated using the average shares method. |
| (b) | The per share amount does not correspond to activity reflected in the Statement of Operations due to class specific expenses during the period. |
| (c) | Amount less than $(0.005). |
| (d) | The Fund’s operating expenses, not including interest expense, are contractually limited to the amounts discussed in Note 3. The ratios in these financial highlights reflect the limitation, including the interest expense, when applicable. |
| (e) | Effective May 5, 2014, Class S’s operating expenses, not including interest expense, were contractually limited to the amounts discussed in Note 3 of the 2014 Annual Report. The ratios in these financial highlights reflect the limitation, including the interest expense. |
The accompanying notes are an integral part of the financial statements.
| ||
| Annual Report | September 30, 2017 | 21 | |
Table of Contents
| ICON Emerging Markets Fund | Financial Highlights | |
| For a Share Outstanding Throughout the Years Presented |
| Class A(a) | Year Ended September 30, 2017 | Year Ended September 30, 2016 | Year Ended September 30, 2015 | Year Ended September 30, 2014 | Year Ended September 30, | |||||||||||||||||||||||
Net asset value, beginning of period | $ | 14.20 | $ | 12.91 | $ | 13.71 | $ | 13.51 | $ | 12.17 | ||||||||||||||||||
Income/(loss) from investment operations: | ||||||||||||||||||||||||||||
Net investment income/(loss)(b)(c) | 0.06 | (0.01) | (0.07) | (0.04) | 0.04 | |||||||||||||||||||||||
Net realized and unrealized gains/(losses) on investments | 1.51 | 1.30 | (0.73) | 0.27 | 1.33 | |||||||||||||||||||||||
Total from investment operations | 1.57 | 1.29 | (0.80) | 0.23 | 1.37 | |||||||||||||||||||||||
Less dividends and distributions: | ||||||||||||||||||||||||||||
Dividends from net investment income | – | – | – | (0.03) | (0.03) | |||||||||||||||||||||||
Total dividends and distributions | – | – | – | (0.03) | (0.03) | |||||||||||||||||||||||
Net asset value, end of period | $ | 15.77 | $ | 14.20 | $ | 12.91 | $ | 13.71 | $ | 13.51 | ||||||||||||||||||
Total Return(d) | 11.06 | % | 9.99 | % | (5.84) | % | 1.68 | % | 11.29 | % | ||||||||||||||||||
Ratios and Supplemental Data | ||||||||||||||||||||||||||||
Net assets, end of period (in 000s) | $ | 12,887 | $ | 9,072 | $ | 725 | $ | 305 | $ | 789 | ||||||||||||||||||
Ratio of expenses to average net assets | ||||||||||||||||||||||||||||
Before expense limitation | 2.12 | % | 2.16 | % | 4.75 | % | 4.32 | % | 2.97 | % | ||||||||||||||||||
After expense limitation(e) | 1.80 | % | 1.80 | % | 1.80 | % | 1.95 | % | 1.81 | % | ||||||||||||||||||
Ratio of net investment income/(loss) to average net assets | ||||||||||||||||||||||||||||
Before expense limitation | 0.08 | % | (0.43) | % | (3.44) | % | (2.65) | % | (0.82) | % | ||||||||||||||||||
After expense limitation(e) | 0.40 | % | (0.07) | % | (0.49) | % | (0.28) | % | 0.34 | % | ||||||||||||||||||
Portfolio turnover rate | 169 | % | 156 | % | 76 | % | 92 | % | 60 | % | ||||||||||||||||||
| (a) | Class C shares were merged into Class A on January 10, 2017. The amounts presented represent the results of the Class A shares for the periods prior to the merger and the results of the combined share class for the period subsequent to the merger. |
| (b) | Calculated using the average shares method. |
| (c) | The per share amount does not correspond to activity reflected in the Statement of Operations due to class specific expenses during the period. |
| (d) | The total return calculation excludes any sales charges. |
| (e) | The Fund’s operating expenses, not including interest expense, are contractually limited to the amounts discussed in Note 3. The ratios in these financial highlights reflect the limitation, including the interest expense, when applicable. |
The accompanying notes are an integral part of the financial statements.
| ||
| 22 | www.iconfunds.com | |
Table of Contents
| ICON International Equity Fund | Financial Highlights | |
| For a Share Outstanding Throughout the Years Presented |
| Class S | Year Ended September 30, 2017 | Year Ended September 30, 2016 | Year Ended September 30, 2015 | Year Ended September 30, 2014 | Year Ended September 30, 2013 | |||||||||||||||||||||||
Net asset value, beginning of period | $ | 11.94 | $ | 11.37 | $ | 11.75 | $ | 11.81 | $ | 11.05 | ||||||||||||||||||
Income/(loss) from investment operations: | ||||||||||||||||||||||||||||
Net investment income/(loss)(a)(b) | 0.04 | 0.05 | 0.00 | (c) | 0.06 | 0.07 | ||||||||||||||||||||||
Net realized and unrealized gains/(losses) on investments | 1.19 | 0.52 | (0.37) | (0.12) | 0.74 | |||||||||||||||||||||||
Total from investment operations | 1.23 | 0.57 | (0.37) | (0.06) | 0.81 | |||||||||||||||||||||||
Less dividends and distributions: | ||||||||||||||||||||||||||||
Dividends from net investment income | – | – | (0.01) | – | (0.00) | (d) | ||||||||||||||||||||||
Distributions from net realized gains | – | – | – | – | (0.05) | |||||||||||||||||||||||
Total dividends and distributions | – | – | (0.01) | – | (0.05) | |||||||||||||||||||||||
Net asset value, end of period | $ | 13.17 | $ | 11.94 | $ | 11.37 | $ | 11.75 | $ | 11.81 | ||||||||||||||||||
Total Return | 10.30 | % | 5.01 | % | (3.15) | % | (0.51) | % | 7.33 | % | ||||||||||||||||||
Ratios and Supplemental Data | ||||||||||||||||||||||||||||
Net assets, end of period (in 000s) | $ | 45,144 | $ | 50,005 | $ | 67,201 | $ | 80,356 | $ | 42,105 | ||||||||||||||||||
Ratio of expenses to average net assets | ||||||||||||||||||||||||||||
Before expense limitation | 1.57 | % | 1.45 | % | 1.41 | % | 1.41 | % | 1.45 | % | ||||||||||||||||||
After expense limitation(e) | 1.55 | % | 1.45 | % | 1.41 | % | 1.41 | % | 1.45 | % | ||||||||||||||||||
Ratio of net investment income/(loss) to average net assets | ||||||||||||||||||||||||||||
Before expense limitation | 0.31 | % | 0.45 | % | 0.00% | (f) | 0.44 | % | 0.65 | % | ||||||||||||||||||
After expense limitation(e) | 0.33 | % | 0.45 | % | 0.00% | (f) | 0.44 | % | 0.65 | % | ||||||||||||||||||
Portfolio turnover rate | 209 | % | 198 | % | 204 | % | 193 | % | 138 | % | ||||||||||||||||||
| (a) | Calculated using the average shares method. |
| (b) | The per share amount does not correspond to activity reflected in the Statement of Operations due to class specific expenses during the period. |
| (c) | Amount less than $0.005. |
| (d) | Amount less than $(0.005). |
| (e) | The Fund’s operating expenses, not including interest expense, are contractually limited to the amounts discussed in Note 3. The ratios in these financial highlights reflect the limitation, including the interest expense, when applicable. |
| (f) | Less than 0.005% of average net assets. |
The accompanying notes are an integral part of the financial statements.
| ||
| Annual Report | September 30, 2017 | 23 | |
Table of Contents
| ICON International Equity Fund | Financial Highlights | |
| For a Share Outstanding Throughout the Years Presented |
| Class C | Year Ended September 30, 2017 | Year Ended September 30, 2016 | Year Ended September 30, | Year Ended September 30, 2014 | Year Ended September 30, 2013 | |||||||||||||||||||||||
Net asset value, beginning of period | $ | 10.66 | $ | 10.27 | $ | 10.72 | $ | 10.89 | $ | 10.26 | ||||||||||||||||||
Income/(loss) from investment operations: | ||||||||||||||||||||||||||||
Net investment income/(loss)(a)(b) | (0.07) | (0.09) | (0.12) | (0.08) | (0.04) | |||||||||||||||||||||||
Net realized and unrealized gains/(losses) on investments | 1.05 | 0.48 | (0.33) | (0.09) | 0.67 | |||||||||||||||||||||||
Total from investment operations | 0.98 | 0.39 | (0.45) | (0.17) | 0.63 | |||||||||||||||||||||||
Net asset value, end of period | $ | 11.64 | $ | 10.66 | $ | 10.27 | $ | 10.72 | $ | 10.89 | ||||||||||||||||||
Total Return(c) | 9.19 | % | 3.80 | % | (4.20) | % | (1.56) | % | 6.14 | % | ||||||||||||||||||
Ratios and Supplemental Data | ||||||||||||||||||||||||||||
Net assets, end of period (in 000s) | $ | 2,484 | $ | 2,941 | $ | 3,299 | $ | 4,597 | $ | 5,657 | ||||||||||||||||||
Ratio of expenses to average net assets | ||||||||||||||||||||||||||||
Before expense limitation | 3.35 | % | 3.13 | % | 2.96 | % | 2.82 | % | 2.77 | % | ||||||||||||||||||
After expense limitation(d) | 2.55 | % | 2.55 | % | 2.55 | % | 2.56 | % | 2.56 | % | ||||||||||||||||||
Ratio of net investment income/(loss) to average net assets | ||||||||||||||||||||||||||||
Before expense limitation | (1.48) | % | (1.40) | % | (1.56) | % | (0.99) | % | (0.63) | % | ||||||||||||||||||
After expense limitation(d) | (0.68) | % | (0.82) | % | (1.15) | % | (0.73) | % | (0.42) | % | ||||||||||||||||||
Portfolio turnover rate | 209 | % | 198 | % | 204 | % | 193 | % | 138 | % | ||||||||||||||||||
| (a) | Calculated using the average shares method. |
| (b) | The per share amount does not correspond to activity reflected in the Statement of Operations due to class specific expenses during the period. |
| (c) | The total return calculation excludes any sales charges. |
| (d) | The Fund’s operating expenses, not including interest expense, are contractually limited to the amounts discussed in Note 3. The ratios in these financial highlights reflect the limitation, including the interest expense, when applicable. |
The accompanying notes are an integral part of the financial statements.
| ||
| 24 | www.iconfunds.com | |
Table of Contents
| ICON International Equity Fund | Financial Highlights | |
| For a Share Outstanding Throughout the Years Presented |
| Class A | Year Ended September 30, | Year Ended September 30, | Year Ended September 30, | Year Ended September 30, | Year Ended September 30, | |||||||||||||||||||||||
Net asset value, beginning of period | $ | 11.76 | $ | 11.24 | $ | 11.65 | $ | 11.75 | $ | 10.99 | ||||||||||||||||||
Income/(loss) from investment operations: | ||||||||||||||||||||||||||||
Net investment income/(loss)(a)(b) | 0.01 | 0.05 | (0.04) | 0.00 | (c) | 0.04 | ||||||||||||||||||||||
Net realized and unrealized gains/(losses) on investments | 1.17 | 0.47 | (0.37) | (0.10) | 0.73 | |||||||||||||||||||||||
Total from investment operations | 1.18 | 0.52 | (0.41) | (0.10) | 0.77 | |||||||||||||||||||||||
Less dividends and distributions: | ||||||||||||||||||||||||||||
Dividends from net investment income | – | – | – | – | (0.00) | (d) | ||||||||||||||||||||||
Distributions from net realized gains | – | – | – | – | (0.01) | |||||||||||||||||||||||
Total dividends and distributions | – | – | – | – | (0.01) | |||||||||||||||||||||||
Net asset value, end of period | $ | 12.94 | $ | 11.76 | $ | 11.24 | $ | 11.65 | $ | 11.75 | ||||||||||||||||||
Total Return(e) | 10.03 | % | 4.63 | % | (3.52) | % | (0.85) | % | 7.03 | % | ||||||||||||||||||
Ratios and Supplemental Data | ||||||||||||||||||||||||||||
Net assets, end of period (in 000s) | $ | 2,276 | $ | 2,829 | $ | 3,725 | $ | 4,089 | $ | 5,043 | ||||||||||||||||||
Ratio of expenses to average net assets | ||||||||||||||||||||||||||||
Before expense limitation | 2.67 | % | 2.43 | % | 2.25 | % | 2.12 | % | 2.19 | % | ||||||||||||||||||
After expense limitation(f) | 1.80 | % | 1.80 | % | 1.80 | % | 1.81 | % | 1.81 | % | ||||||||||||||||||
Ratio of net investment income/(loss) to average net assets | ||||||||||||||||||||||||||||
Before expense limitation | (0.80) | % | (0.19) | % | (0.77) | % | (0.27) | % | (0.06) | % | ||||||||||||||||||
After expense limitation(f) | 0.07 | % | 0.44 | % | (0.32) | % | 0.04 | % | 0.32 | % | ||||||||||||||||||
Portfolio turnover rate | 209 | % | 198 | % | 204 | % | 193 | % | 138 | % | ||||||||||||||||||
| (a) | Calculated using the average shares method. |
| (b) | The per share amount does not correspond to activity reflected in the Statement of Operations due to class specific expenses during the period. |
| (c) | Amount less than $0.005. |
| (d) | Amount less than $(0.005). |
| (e) | The total return calculation excludes any sales charges. |
| (f) | The Fund’s operating expenses, not including interest expense, are contractually limited to the amounts discussed in Note 3. The ratios in these financial highlights reflect the limitation, including the interest expense, when applicable. |
The accompanying notes are an integral part of the financial statements.
| ||
| Annual Report | September 30, 2017 | 25 | |
Table of Contents
| ICON International Funds | Notes to Financial Statements | |
| September 30, 2017 |
1. ORGANIZATION
The ICON Emerging Markets Fund (“Emerging Markets Fund”) and ICON International Equity Fund (“International Equity Fund”) are series funds (individually a “Fund” and collectively, the “Funds”). The Funds are part of the ICON Funds (the “Trust”), a Massachusetts business trust registered under the Investment Company Act of 1940, as amended (the “1940 Act”) as an open-end investment management company. Each Fund offers two classes of shares: Class S and Class A. The International Equity Fund also offers a Class C share. On January 10, 2017, the Class C shares of the Emerging Markets Fund merged into the Class A shares of the Emerging Markets Fund. The Class C shares of the Emerging Markets Fund were closed. The merger activity is shown in the Statements of Changes in Net Assets. All classes have equal rights as to earnings, assets and voting privileges except that each Class may bear different distribution fees, registration costs, legal costs, mailing and printing costs and shareholder servicing costs and each Class has exclusive voting rights with respect to its distribution plan. There are currently fifteen other active Funds within the Trust. Those Funds are covered by separate prospectuses and shareholder reports.
Each Fund is authorized to issue an unlimited number of no par shares. The Funds primarily invest in foreign securities; the Emerging Markets Fund primarily invests in securities of issuers whose principal activities are in emerging markets, or are economically tied to an emerging market country. The International Equity Fund primarily invests in foreign equity securities. Foreign equity securities refer to securities of issuers, wherever organized, whose securities are listed or traded principally on a recognized stock exchange or over-the-counter market outside the United States. The investment objective of each Fund is to provide long-term capital appreciation.
The Funds, like all investments in securities, have elements of risk, including risk of loss of principal. There is no assurance that the Funds will achieve their investment objectives and may underperform funds with similar investment objectives. An investment concentrated in sectors and industries involves greater risk and volatility than a more diversified investment. Investments in foreign securities and currency transactions may involve certain considerations and risks not typically associated with those of U.S. dollar-denominated transactions as a result of, among other factors, the possibility of less government supervision and regulation of foreign securities markets and the possibility of political or economic instability. Financial statements of foreign companies are governed by different accounting, auditing, and financial standards than U.S. companies and may be less transparent and uniform than in the United States. Many corporate governance standards, which help ensure the integrity of public information in the United States, may not exist in some foreign countries. In general, there may be less governmental supervision of foreign stock exchanges and securities brokers and issuers. Securities of emerging or developing market companies may be less liquid and more volatile than securities in countries with more mature markets. There are also risks associated with small-and mid-cap investing, including limited product lines, less liquidity, and small market share.
In the normal course of business, the Funds may enter into various agreements that provide for general indemnifications. Each Fund’s maximum exposure under these arrangements is unknown as any potential exposure involving future claims that may be made against each Fund is unknown. However, based on experience, the Funds expect the risk of loss to be remote.
2. SIGNIFICANT ACCOUNTING POLICIES
The following is a summary of significant accounting policies consistently followed by the Funds in the preparation of their financial statements. The financial statements are prepared in conformity with accounting principles generally accepted in the United States of America (“GAAP”), which requires management to make certain estimates and assumptions that affect the reported amounts of assets and liabilities, disclosure of contingent assets and liabilities at the date of the financial statements, and the reported amounts of income and expenses during the reporting period. Actual results may differ from these estimates. Each Fund is considered an investment company under GAAP and follows the accounting and reporting guidance applicable to investment companies in the Financial Accounting Standards Board Accounting Standards Codification Topic 946.
Investment Valuation
The Funds’ securities and other assets, excluding options on securities indexes, are valued at the closing price as of the close of regular trading on the New York Stock Exchange (the “NYSE”) (normally 4 p.m. Eastern Standard Time) each day the NYSE is open, except that securities traded primarily on the NASDAQ Stock Market (“NASDAQ”) are normally valued by the Funds at the NASDAQ Official Closing Price provided by NASDAQ each business day. If the NYSE closes unexpectedly and there is active trading on other exchanges, the securities will be valued at the Valuation Time based off of those exchanges. Options on securities indexes are valued at the close of the Chicago Board Options Exchange (normally 4:15 p.m. Eastern Standard Time) on each day the NYSE is open for trading.
The Funds use pricing services to obtain the fair value of securities in their portfolios. If a pricing service is not able to provide a price, or the pricing service’s valuation is considered inaccurate or does not, in the Funds’ judgment, reflect the fair value of the security, prices may be obtained through market quotations from independent broker/dealers. If market quotations from these sources are not readily available, the Funds’ securities or other assets are valued at fair value as determined in good faith by the Funds’ Board of Trustees (the “Board”) or pursuant to procedures approved by the Board.
| 26 | www.iconfunds.com | |
Table of Contents
| ICON International Funds | Notes to Financial Statements | |
| September 30, 2017 |
Lacking any sales that day, a security is valued at the current closing bid price (or yield equivalent thereof) or based on quotes obtained from dealers making a market for the security. Exchange traded options are valued at the composite price, using the National Best Bid and Offer quotes (“NBBO”). NBBO consists of the highest bid price and lowest ask price across any of the exchanges on which an option is quoted, thus providing a view across the entire U.S. options marketplace. Debt securities with a remaining maturity of greater than 60 days are valued using the evaluated bid price supplied by the pricing service. The evaluated bid price supplied by the pricing service is based upon a matrix valuation system which considers such factors as security prices, yields, maturities and ratings. Short-term debt securities with remaining maturities of 60 days or less are generally valued at amortized cost or original cost plus accrued interest, which approximates fair value. Currency rates as of the close of the NYSE are used to convert foreign security values into U.S. dollars.
Securities of investment companies that trade on an exchange are valued at the last sales price or official closing price as of the close of the customary trading session on the exchange where the security is principally traded. Investments in shares of funds, including money market funds, that are not traded on an exchange are valued at the end of day net asset value (“NAV”) per share of such fund. Securities in the underlying funds, including restricted securities are valued in accordance with the valuation policy of such fund.
The Funds’ securities traded in countries outside of the Western Hemisphere are fair valued daily by utilizing the quotations of an independent pricing service, unless the Board determines that use of another valuation methodology is appropriate. The purposes of daily fair valuation are to avoid stale prices and to take into account, among other things, any significant events occurring after the close of foreign markets. The pricing service uses statistical analyses and quantitative models to adjust local market prices using factors such as subsequent movements and changes in the prices of indexes, securities and exchange rates in other markets to determine fair value as of the time a Fund calculates its net asset value (“NAV”). The valuation assigned to fair-value securities for purposes of calculating a Fund’s NAV may differ from the security’s most recent closing market price and from the prices used by other mutual funds to calculate their NAVs.
Various inputs are used to determine the value of the Funds’ investments. These inputs are summarized in the three broad levels listed below:
| Level 1 – | quoted prices in active markets for identical securities. |
| Level 2 – | significant observable inputs other than Level 1 quoted prices (including, but not limited to, quoted prices for similar securities, interest rates, prepayment speeds, and credit risk). |
| Level 3 – | significant unobservable inputs. |
Observable inputs are those based on market data obtained from sources independent of the Funds, and unobservable inputs reflect the Funds’ own assumptions based on the best information available. The input levels are not necessarily an indication of the risk or liquidity associated with investments at that level. For example, non-U.S. equity securities actively traded in foreign markets may be reflected in Level 2 despite the availability of closing prices, because the Funds evaluate and determine whether those closing prices reflect fair value at the close of the NYSE or require adjustment, as described above. The following table summarizes the Funds’ investments, based on the inputs used to determine their values on September 30, 2017:
ICON Emerging Markets Fund
| Investments in Securities at Value* | Level 1 - Quoted and Unadjusted Prices | Level 2 - Other Significant Observable Inputs | Level 3 - Significant Unobservable Inputs | Total | ||||||||||||
Common Stocks | ||||||||||||||||
Cable & Satellite | $ | 527,222 | $ | 306,697 | $ | – | $ | 833,919 | ||||||||
Commodity Chemicals | 448,847 | 317,840 | – | 766,687 | ||||||||||||
Diversified Banks | 1,102,925 | 10,212,896 | – | 11,315,821 | ||||||||||||
Gold | 767,400 | 1,340,296 | – | 2,107,696 | ||||||||||||
Independent Power Producers & Energy Traders | 1,203,904 | 223,606 | �� | – | 1,427,510 | |||||||||||
Integrated Telecommunication Services | 887,680 | 712,600 | – | 1,600,280 | ||||||||||||
Internet Software & Services | 414,504 | 373,593 | – | 788,097 | ||||||||||||
Oil & Gas Exploration & Production | 1,152,619 | 776,731 | – | 1,929,350 | ||||||||||||
Oil & Gas Refining & Marketing | 773,630 | 958,618 | – | 1,732,248 | ||||||||||||
Regional Banks | 1,921,807 | 1,868,254 | – | 3,790,061 | ||||||||||||
Water Utilities | 517,947 | 656,840 | – | 1,174,787 | ||||||||||||
Wireless Telecommunication Services | 1,076,281 | 1,959,995 | – | 3,036,276 | ||||||||||||
Other | 4,532,050 | 27,725,186 | – | 32,257,236 | ||||||||||||
Collateral for Securities on Loan | – | 346,438 | – | 346,438 | ||||||||||||
Total | $ | 15,326,816 | $ | 47,779,590 | $ | – | $ | 63,106,406 | ||||||||
| Annual Report | September 30, 2017 | 27 | |
Table of Contents
| ICON International Funds | Notes to Financial Statements | |
| September 30, 2017 |
ICON International Equity Fund
| Investments in Securities at Value* | Level 1 - Quoted and Unadjusted Prices | Level 2 - Other Significant Observable Inputs | Level 3 - Significant Unobservable Inputs | Total | ||||||||||||
Common Stocks | ||||||||||||||||
Building Products | $ | 600,922 | $ | 1,268,289 | $ | – | $ | 1,869,211 | ||||||||
Cable & Satellite | 1,259,237 | 474,665 | – | 1,733,902 | ||||||||||||
Commodity Chemicals | 217,914 | 638,977 | – | 856,891 | ||||||||||||
Diversified Banks | 612,824 | 4,985,569 | – | 5,598,393 | ||||||||||||
Electric Utilities | 227,257 | 1,517,416 | – | 1,744,673 | ||||||||||||
Gold | 778,710 | 1,083,923 | – | 1,862,633 | ||||||||||||
Independent Power Producers & Energy Traders | 611,036 | 596,635 | – | 1,207,671 | ||||||||||||
Integrated Telecommunication Services | 194,180 | 667,726 | – | 861,906 | ||||||||||||
Multi-Utilities | 238,142 | 1,075,772 | – | 1,313,914 | ||||||||||||
Oil & Gas Equipment & Services | 773,844 | 436,406 | – | 1,210,250 | ||||||||||||
Oil & Gas Exploration & Production | 2,280,366 | 652,454 | – | 2,932,820 | ||||||||||||
Oil & Gas Refining & Marketing | 412,603 | 993,092 | – | 1,405,695 | ||||||||||||
Regional Banks | 768,858 | 348,774 | – | 1,117,632 | ||||||||||||
Wireless Telecommunication Services | 355,794 | 751,578 | – | 1,107,372 | ||||||||||||
Other | 2,549,850 | 21,804,601 | – | 24,354,451 | ||||||||||||
Collateral for Securities on Loan | – | 343,750 | – | 343,750 | ||||||||||||
Total | $ | 11,881,537 | $ | 37,639,627 | $ | – | $ | 49,521,164 | ||||||||
| * | Please refer to the Schedule of Investments and the Sector/Industry Classification and Country Composition tables for additional security details. |
There were no Level 3 securities held in any of the Funds at September 30, 2017.
For the Emerging Markets Fund and International Equity Fund, there was no transfer activity between Level 1 and Level 2 for the year ended September 30, 2017.
The end of period timing recognition is used for the transfers between levels of each Fund’s assets and liabilities.
Fund Share Valuation
Fund shares are sold and redeemed on a daily basis at NAV. NAV per share is determined daily as of the close of trading on the NYSE on each day the NYSE is open for trading. The NAV is computed by dividing the total value of the Fund’s investments and other assets, less liabilities, by the number of Fund shares outstanding.
Cash and Cash Equivalents
Idle cash may be swept into various overnight demand deposits and is classified as cash and cash equivalents on the Statements of Assets and Liabilities. The Funds maintain cash in bank deposit accounts which, at times, may exceed United States federally insured limits. Amounts swept overnight are available on the next business day.
Foreign Currency Translation
The accounting records of the Funds are maintained in U.S. dollars. Investment securities and other assets and liabilities denominated in a foreign currency are translated daily into U.S. dollars at the prevailing rates of exchange. Income and expenses are translated into U.S. dollars at the prevailing exchange rate on the respective dates of the transactions. Purchases and sales of securities are translated into U.S. dollars at the contractual currency exchange rates established at the time of each trade.
The Funds do not isolate that portion of the results of operations resulting from changes in foreign exchange rates on investments from the fluctuations arising from changes in market prices of securities held. Net unrealized appreciation or depreciation on investments and foreign currency translations arise from changes in the value of assets and liabilities resulting from changes in the exchange rates and changes in market prices of securities held.
| 28 | www.iconfunds.com | |
Table of Contents
| ICON International Funds | Notes to Financial Statements | |
| September 30, 2017 |
Forward Foreign Currency Contracts
The Funds may enter into short-term forward foreign currency contracts. A forward foreign currency contract is an agreement between contracting parties to exchange an amount of currency at some future time at an agreed upon rate. The Funds may use forward foreign currency contracts to manage foreign currency exposure with respect to transactional hedging, positional hedging, cross hedging and proxy hedging.
These contracts involve market risk and do not eliminate fluctuations in the prices of portfolio securities or prevent losses if the prices of those securities decline. The Funds could be exposed to risk if the value of the currency changes unfavorably. Additionally, the Funds could be exposed to counterparty risk if the counterparties are unable to meet the terms of the contracts.
These contracts are marked-to-market daily. Net realized gains and losses on foreign currency transactions represent disposition of foreign currencies, and the difference between the amount recorded at the time of the transaction and the U.S. dollar amount actually received. Any realized gain or loss incurred by the Funds due to foreign currency translation is included on the Statements of Operations. At September 30, 2017 and for the year then ended, the Emerging Markets Fund and International Equity Fund had no outstanding forward foreign currency contracts.
Securities Lending
Under procedures adopted by the Board, the Funds may lend securities to certain approved brokers, dealers and other financial institutions to earn additional income. Cash collateral is received in exchange for securities on loan in the amount of at least 102% of the value of U.S. securities loaned or at least 105% of the value of non-U.S. securities loaned, marked to market daily. The Funds retain certain benefits of owning the securities, including receipt of dividends or interest generated by the security, but give up other rights including the right to vote proxies. The Funds retain the ability to recall the loans at any time and could do so in order to vote proxies or to sell the loaned securities. Each loan is collateralized by cash that generally exceeds the value of the securities on loan. The fair value of the loaned securities is determined daily at the close of business of the Funds and any additional required collateral is delivered to each Fund on the next business day.
Generally, in the event of borrower default, the Funds have the right to use the collateral to offset any losses incurred. In the event the Funds are delayed or prevented from exercising their rights to dispose of the collateral, there may be a potential loss to the Funds. Some of these losses may be indemnified by the lending agent.
Effective October 14, 2016, the Funds have elected to invest the cash collateral received from lending in the State Street Navigator Securities Lending Government Money Market Portfolio which is disclosed on the Schedules of Investments. Prior to October 14, 2016, the Funds used the State Street Navigator Prime Portfolio. The Funds bear the risk of loss with respect to the investment of collateral. The net securities lending income earned by the Funds for the year ended September 30, 2017, is included in the Statements of Operations.
The following table indicates the total amount of securities loaned by type, reconciled to gross liability payable upon return of the securities loaned by the Fund as of September 30, 2017:
| Remaining contractual maturity of the lending agreement | ||||||||||||||||||||||||||||
| Overnight & Continuous | Up to 30 days | 30-90 days | Greater than 90 days | Fair Value | Collateral Received | Excess amount due to counterparty | ||||||||||||||||||||||
Securities Lending Transactions | ||||||||||||||||||||||||||||
ICON Emerging Markets Fund | ||||||||||||||||||||||||||||
Equity Securities | $ | 344,442 | $ | – | $ | – | $ | – | $ | 344,442 | $ | 344,442 | $ | 1,996 | ||||||||||||||
ICON International Equity Fund | ||||||||||||||||||||||||||||
Equity Securities | 341,770 | – | – | – | 341,770 | 341,770 | 1,980 | |||||||||||||||||||||
Income Taxes, Dividends, and Distributions
The Funds intend to continue to qualify as regulated investment companies under Subchapter M of the Internal Revenue Code and, accordingly, the Funds will generally not be subject to federal and state income taxes or federal excise taxes to the extent that they intend to make sufficient distributions of net investment income and net realized capital gains. As of and during the year ended September 30, 2017, the Funds did not have a liability for any unrecognized tax benefits in the accompanying financial statements. The Funds recognize the interest and penalties, if any, related to the unrecognized tax benefits as income tax expense in the Statements of Operations. During the period, the Funds did not incur any interest or penalties.
Dividends paid by the Funds from net investment income and distributions of net realized short-term gains are, for federal income tax purposes, taxable as ordinary income to shareholders.
| Annual Report | September 30, 2017 | 29 | |
Table of Contents
| ICON International Funds | Notes to Financial Statements | |
| September 30, 2017 |
Dividends and distributions to shareholders are recorded by the Funds on the ex-dividend/distribution date. The Funds distribute income and net realized capital gains, if any, to shareholders at least annually, if not offset by capital loss carryforward. The Funds may utilize equalization accounting for tax purposes and designate earnings and profits, including net realized gains distributed to shareholders on redemption of shares, as part of the dividends paid deduction for income tax purposes. Income distributions and capital gain distributions are determined in accordance with income tax regulations, which may differ from GAAP.
Management has analyzed the Funds’ tax positions taken on federal income tax returns for all open tax years and has concluded that no provision for federal income tax is required in the Funds’ financial statements.
The Funds file U.S. tax returns. While the statute of limitations remains open to examine the Funds’ U.S. tax returns filed for the past three years, no examinations are in progress or anticipated at this time. The Funds are not aware of any tax positions for which it is reasonably possible that the total amounts of unrecognized tax benefits will significantly change in the next twelve months.
Certain foreign countries impose a capital gains tax which is accrued by the Funds based on the unrealized appreciation, if any, on affected securities. Any accrual would reduce a Fund’s NAV. The tax is paid when the gain is realized and is included in capital gains tax in the Statements of Operations.
Investment Income
Dividend income is recorded on the ex-dividend date. Non-cash dividends included in dividend income, if any, are recorded at the fair value of the securities received. Interest income is accrued as earned. Certain dividends from foreign securities are recorded as soon as the Funds are informed of the dividend if such information is obtained subsequent to the ex-dividend date. Discounts and premiums on fixed income securities purchased are accreted or amortized to income over the life of the respective securities based on effective yield.
Investment Transactions
Security transactions are accounted for no later than one business day after the trade date. However, for financial reporting purposes, security transactions are accounted for on the trade date. Gains and losses on securities sold are determined on the basis of identified cost.
Withholding Tax
Withholding taxes on foreign dividends have been provided for in accordance with the Funds’ understanding of the applicable country’s tax rules and rates. The ability of issuers of debt securities held by the Funds to meet their obligations may be affected by economic and political developments in specific country or region.
Other
The Funds hold certain investments which pay dividends to their shareholders based upon available funds from operations. It is possible for these dividends to exceed the underlying investments’ taxable earnings and profits resulting in the excess portion of such dividends being designated as a return of capital. Distributions received from investments in securities that represent a return of capital or capital gains are recorded as a reduction of the cost of investments or as a realized gain, respectively.
Allocation of Expenses
Each class of a Fund’s shares bears expenses incurred specifically on its behalf and, in addition, each class bears a portion of general expenses, based upon relative net assets of each class or number of shareholder accounts. Expenses which cannot be directly attributed to a specific Fund in the Trust are apportioned between all Funds in the Trust based upon relative net assets or number of shareholder accounts. In calculating the net asset value per share of each class, investment income, realized and unrealized gains and losses and expenses other than class-specific expenses are allocated daily to each class of shares based upon the proportion of net assets.
| 30 | www.iconfunds.com | |
Table of Contents
| ICON International Funds | Notes to Financial Statements | |
| September 30, 2017 |
Below are additional class level expenses for the year ended September 30, 2017 that are included on the Statements of Operations:
| Fund | Printing Fees | Transfer Agent Fees* | Registration Fees | |||||||||
ICON Emerging Markets Fund | ||||||||||||
Class S | $ | 13,764 | $ | 79,914 | $ | 20,945 | ||||||
Class C(a) | 105 | 957 | 2,863 | |||||||||
Class A | 2,686 | 19,682 | 16,778 | |||||||||
ICON International Equity Fund | ||||||||||||
Class S | 7,838 | 14,752 | 17,257 | |||||||||
Class C | 511 | 10,400 | 11,804 | |||||||||
Class A | 752 | 10,722 | 10,781 | |||||||||
| * | Transfer agent out of pocket fees are a Fund level expense. |
| (a) | Emerging Markets Fund Class C shares merged into Class A shares on January 10, 2017. The information presented is for expenses incurred before the merger. |
3. FEES AND OTHER TRANSACTIONS WITH AFFILIATES
Investment Advisory Fees
ICON Advisers, Inc. (“ICON Advisers”) serves as investment adviser to the Funds and is responsible for managing the Funds’ portfolios of securities. ICON Advisers receives a monthly management fee that is computed daily at an annual rate of 1.00% of each Fund’s average daily net assets.
ICON Advisers has contractually agreed to limit the Funds’ operating expenses (exclusive of brokerage, interest, taxes, acquired fund fees and expenses and extraordinary expenses) to the extent necessary to ensure that the Funds’ expenses do not exceed the following amounts:
| Fund | Class S | Class C | Class A | |||||
ICON Emerging Markets Fund | 1.55% | – | 1.80% | |||||
ICON International Equity Fund | 1.55% | 2.55% | 1.80% |
The Funds’ expense limitations will continue in effect until at least January 31, 2021 for the Emerging Markets Fund Class A and all classes of the International Equity Fund. The expense limitation for the Emerging Markets Fund Class S will continue in effect until at least January 31, 2018. To the extent ICON Advisers reimburses or absorbs fees and expenses, it may seek payment of such amounts for up to three years after the expenses were reimbursed or absorbed. A Fund will make no such payment, however, if the total Fund operating expenses exceed the expense limits in effect at the time these payments are proposed.
As of September 30, 2017, the following amounts were available for recoupment by ICON Advisers based upon their potential expiration dates:
| Fund | Expires 2018 | Expires 2019 | Expires 2020 | |||||||||||||
ICON Emerging Markets Fund | $ | 112,887 | $ | 106,751 | $ | 106,329 | (a) | |||||||||
ICON International Equity Fund | 34,662 | 38,568 | 49,267 | |||||||||||||
| (a) | Emerging Markets Fund Class C shares merged into Class A shares on January 10, 2017. The Class C amount is not available for recoupment. |
Accounting, Custody and Transfer Agent Fees
ALPS Fund Services, Inc. (“ALPS”) serves as the fund accounting agent for the Trust. For its services, the Trust pays ALPS a fee that is calculated daily and paid monthly at an annual rate based on the aggregate average daily net assets of the Trust.
State Street is the custodian of the Trust’s investments. For its services, the Trust pays State Street asset-based fees that vary according to the number of positions and transactions, plus out-of-pocket expenses.
ALPS is the Trust’s transfer agent. For these services, the Trust pays an annual fee plus annual base fee per Fund, per account fees and out-of-pocket expenses.
| Annual Report | September 30, 2017 | 31 | |
Table of Contents
| ICON International Funds | Notes to Financial Statements | |
| September 30, 2017 |
Administrative Services
The Trust has entered into an administrative services agreement with ICON Advisers pursuant to which ICON Advisers oversees the administration of the Trust’s business and affairs. This agreement provides for an annual fee of 0.05% on the Trust’s first $1.5 billion of average daily net assets, 0.045% on the next $1.5 billion of average daily net assets, 0.040% on the next $2 billion of average daily net assets and 0.030% on average daily net assets over $5 billion. For the year ended September 30, 2017, each Fund’s payment for administrative services to ICON Advisers is included on the Statements of Operations. The administrative services agreement provides that ICON Advisers will not be liable for any error of judgment, mistake of law, or any loss suffered by the Trust in connection with matters to which the administrative services agreement relates, except for a loss resulting from willful misfeasance, bad faith or negligence by ICON Advisers in the performance of its duties.
ICON Advisers has a sub-administration agreement, with ALPS, under which ALPS assists ICON Advisers with the administration and business affairs of the Trust. For its services, ICON Advisers pays ALPS a fee that is calculated daily and paid monthly at an annual rate based on the aggregate average daily net assets of the Trust.
Distribution Fees
ICON Distributors, Inc. (“IDI” or “Distributor”), a wholly-owned subsidiary of ICON Management and Research and affiliate of ICON Advisers, Inc., serves the Trust as Distributor. The Trust has adopted a Distribution Plan pursuant to Rule 12b-1 under the 1940 Act (“12b-1 Plan”) under which the Funds are authorized to compensate or reimburse the Distributor for the sale and distribution of shares and for other shareholder services. The shareholders of the Funds pay an annual distribution fee of 1.00% of average daily net assets for Class C shares and an annual distribution fee of 0.25% of average daily net assets for Class A shares. There is no annual distribution fee for Class S shares. The total amount paid by each Fund under the 12b-1 Plan is shown on the Statements of Operations.
Class A Shares are subject to an initial sales charge and the public offering price of Class A shares equals net asset value plus the applicable sales charge, which is a maximum of 5.75%. For the year ended September 30, 2017, IDI collected sales charges on purchases of Class A Shares, the majority of which were paid out as concessions to financial intermediaries, as follows:
| Fund | Sales Charges Collected | |||||||||
ICON Emerging Markets Fund Class A | $ | 4,128 | ||||||||
ICON International Equity Fund Class A | 623 | |||||||||
In addition, IDI receives a contingent deferred sales charge of 1.00% of the purchase price on redemptions of Class C shares made within one year following the date of purchase. A 1.00% contingent deferred sales charge may also apply to certain redemptions of Class A shares made within one year following the purchase of $1 million or more without an initial sales charge. For the year ended September 30, 2017, IDI collected the following contingent deferred sales charges:
| Fund | Contingent Deferred Sales Charges Collected | |||||||||
ICON Emerging Markets Fund Class C | $ | 382 | ||||||||
ICON International Equity Fund Class C | 39 | |||||||||
Other Related Parties
Certain Officers and Directors of ICON Advisers are also Officers and Trustees of the Funds; however, such Officers and Trustees (with the exception of the Chief Compliance Officer, “CCO”) receive no compensation from the Funds. The Trust pays a portion of the CCO’s salary and the remaining portion, along with other employee related expenses, is paid by ICON Advisers. For the year ended September 30, 2017, the total related amounts paid by the Funds under this arrangement are included in Other Expenses on the Statements of Operations.
The Funds may reimburse ICON Advisers for legal work performed for the Funds by its attorneys outside of the advisory and administration contracts. The Board of Trustees reviews and approves such reimbursements. For the year ended September 30, 2017, the total related amounts accrued or paid by the Funds under this arrangement was $1,418 and is included in Other Expenses on the Statements of Operations.
The Funds did not engage in cross trades with each other, during the year ended September 30, 2017, pursuant to Rule 17a-7 under the 1940 Act. Generally, cross trading is the buying or selling of portfolio securities between funds to which the Adviser serves as the investment adviser. The Board previously adopted procedures that apply to transactions between the Funds and its affiliates pursuant to Rule 17a-7. At its regularly scheduled meetings, the Board reviews such transactions as of the most current calendar quarter for compliance with the requirements set forth by Rule 17a-7 and the Funds’ procedures. The procedures require that the transactions be a purchase or sale for no consideration other than cash
| 32 | www.iconfunds.com | |
Table of Contents
| ICON International Funds | Notes to Financial Statements | |
| September 30, 2017 |
payment against prompt delivery of a security for which market quotations are readily available, and be consistent with the investment policies of each Fund.
4. BORROWINGS
The Trust has entered into an uncommitted, unsecured, revolving Line of Credit agreement/arrangement with State Street to provide temporary funding for redemption requests. The maximum borrowing limit is $50 million. Interest on domestic borrowings is charged at a rate quoted and determined by State Street. The interest rate as of September 30, 2017 was 2.48%. The Line of Credit agreement/arrangement expires on March 19, 2018.
For the year ended September 30, 2017, there were no outstanding borrowings under this agreement/arrangement for these funds.
5. PURCHASES AND SALES OF INVESTMENT SECURITIES
For the year ended September 30, 2017, the aggregate cost of purchases and proceeds from sales of securities (excluding short-term securities) was as follows:
| Fund | Purchases of Securities | Proceeds from Sales of Securities | ||||||
ICON Emerging Markets Fund | $ | 91,530,153 | $ | 83,222,171 | ||||
ICON International Equity Fund | 94,184,742 | 99,543,213 | ||||||
6. FEDERAL INCOME TAX
The following information is presented on an income tax basis. Differences between GAAP and federal income tax purposes that are permanent in nature are reclassified within the capital accounts. Temporary differences do not require reclassification. Temporary and permanent differences do not impact the NAVs of the Funds. These differences are due to differing treatments for items such as passive foreign investment companies, foreign currency transactions, foreign capital gain tax treatment, expiring capital loss carryforwards and net investment losses.
Under the Regulated Investment Company Modernization Act of 2010 (the “Act”) capital losses generated by a Fund may be carried over indefinitely, but these losses must be used prior to the utilization of any pre-enactment capital losses. Since pre-enactment capital losses may only be carried forward for eight years there may be a greater likelihood that all or a portion of each Fund’s pre-enactment capital losses will expire unused.
For the year ended September 30, 2017 the following Funds had capital loss carryforwards:
| Fund | Expiring in 2018 | |||
ICON International Equity Fund | $ | 27,012,993 | ||
For Emerging Markets Fund and the International Equity Fund, the capital loss carryovers used during the year ended September 30, 2017 were $4,083,021 and $1,685,270, respectively.
For International Equity Fund, the short-term and long-term capital losses with no expiration were $4,016,565 and $3,533,938, respectively.
For Emerging Markets Fund and the International Equity Fund, the capital losses expired on September 30, 2017 were $1,428,310 and $53,195,839, respectively.
The International Equity Fund elects to defer to the period ending September 30, 2018, capital losses recognized during the period November 1, 2016 to September 30, 2017 in the amount of $403,754.
The International Equity Fund elects to defer to the period ending September 30, 2018, late year ordinary losses in the amount of $102,068.
| Annual Report | September 30, 2017 | 33 | |
Table of Contents
| ICON International Funds | Notes to Financial Statements | |
| September 30, 2017 |
For the year ended September 30, 2017, the following reclassification, which had no impact on results of operations or net assets was recorded to reflect the tax character of the Funds net operating loss:
| Fund | Paid-in Capital | Accumulated Net Investment Income/(Loss) | Accumulated Net Realized Gain/(Loss) on Investments | |||||||||
ICON Emerging Markets Fund | $ | (1,428,310 | ) | $ | (13,490 | ) | $ | 1,441,800 | ||||
ICON International Equity Fund | (53,367,818 | ) | (1,725 | ) | 53,369,543 | |||||||
For International Equity Fund, included in the amounts reclassified was a net operating loss offset to paid in capital of $171,981.
The Funds did not pay distributions to shareholders during the fiscal years ended September 30, 2017 and September 30, 2016.
As of September 30, 2017, the components of accumulated earnings/(deficit) on a tax basis were as follows:
| Fund | Undistributed Ordinary Income | Accumulated Capital Gains/(Losses) | Other Cumulative Effect of Timing Differences | Unrealized Appreciation | Total Accumulated Earnings/(Deficit) | |||||||||||||||
ICON Emerging Markets Fund | $ | 100,506 | $ | – | $ | – | $ | 1,811,966 | $ | 1,912,472 | ||||||||||
ICON International Equity Fund | – | (34,967,250) | (102,068) | 903,934 | (34,165,384) | |||||||||||||||
As of September 30, 2017, cost on investments for federal income tax purposes and the amount of net unrealized appreciation/(depreciation) were as follows:
| Fund | Gross Appreciation (excess of value over tax cost) | Gross Depreciation (excess of tax cost over value) | Net Appreciation/ (Depreciation) of Foreign Currency | Net Unrealized Appreciation/ (Depreciation) | Cost of Investments for Income Tax Purposes | |||||||||||||||
ICON Emerging Markets Fund | $ | 4,903,467 | $ | (3,092,046 | ) | $ | 545 | $ | 1,811,966 | $ | 61,294,985 | |||||||||
ICON International Equity Fund | 3,021,005 | (2,117,411 | ) | 340 | 903,934 | 48,617,570 | ||||||||||||||
7. RECENT ACCOUNTING PRONOUNCEMENT
In December 2016, the Financial Accounting Standards Board (“FASB”) issued Accounting Standards Update (“ASU”) 2016-19, “Technical Corrections and Improvements.” It includes an update to Accounting Standards Codification Topic 820 (“Topic 820”), Fair Value Measurement. The update to Topic 820 clarifies the difference between a valuation approach and a valuation technique. It also requires disclosure when there has been a change in either or both a valuation approach and/or a valuation technique. The changes related to Topic 820 are effective for annual reporting periods, including interim periods within those annual periods, beginning after December 15, 2016. Management is currently evaluating the impact of the ASU to the financial statements.
| 34 | www.iconfunds.com | |
Table of Contents
| ICON International Funds | Report of Independent Registered Public Accounting Firm | |
To the Shareholders and Board of Trustees of
ICON Funds
We have audited the accompanying statements of assets and liabilities, including the schedules of investments, of the ICON Emerging Markets Fund and ICON International Fund (the “Funds”), each a series of ICON Funds, as of September 30, 2017, and the related statements of operations for the year then ended, and the statements of changes in net assets and the financial highlights for each of the two years in the period then ended. These financial statements and financial highlights are the responsibility of the Funds’ management. Our responsibility is to express an opinion on these financial statements and financial highlights based on our audits. The Funds’ financial statements and financial highlights for the years ended September 30, 2015 and prior, were audited by other auditors, whose report dated November 18, 2015 expressed an unqualified opinion on those financial statements and financial highlights.
We conducted our audits in accordance with the standards of the Public Company Accounting Oversight Board (United States). Those standards require that we plan and perform the audit to obtain reasonable assurance about whether the financial statements and financial highlights are free of material misstatement. An audit includes examining, on a test basis, evidence supporting the amounts and disclosures in the financial statements. Our procedures included confirmation of securities owned as of September 30, 2017, by correspondence with the custodian and brokers or by other appropriate auditing procedures where replies from brokers or counterparties were not received. An audit also includes assessing the accounting principles used and significant estimates made by management, as well as evaluating the overall financial statement presentation. We believe that our audits provide a reasonable basis for our opinion.
In our opinion, the financial statements and financial highlights referred to above present fairly, in all material respects, the financial position of each of the Funds as of September 30, 2017, the results of their operations for the year then ended, and the statements of changes in their net assets and the financial highlights for each of the two years in the period then ended, in conformity with accounting principles generally accepted in the United States of America.

COHEN & COMPANY, LTD.
Cleveland, Ohio
November 22, 2017
| Annual Report | September 30, 2017 | 35 | |
Table of Contents
| ICON International Funds | Disclosure of Fund Expenses | |
| September 30, 2017 (Unaudited) |
Example
As a shareholder of a Fund you may pay two types of fees: transaction fees and fund-related fees. Certain funds charge transaction fees, including sales charges (loads) on purchase payments, reinvested dividends, or other distributions; redemption fees; and exchange fees. Funds also incur various ongoing expenses, including management fees, distribution and/or service fees, and other fund expenses, which are indirectly paid by shareholders.
This Example is intended to help you understand your ongoing costs (in dollars) of investing in the various ICON Funds and to compare these costs with the ongoing costs of investing in other mutual funds. This Example is based on an investment of $1,000 invested at the beginning of the six-month period and held for the six-month period (4/01/17 – 9/30/17).
Actual Expenses
The first line in the table for each Fund provides information about actual account values and actual expenses. The Example includes, but is not limited to, management fees, 12b-1 fees, fund accounting, custody and transfer agent fees. However, the Example does not include client specific fees, such as the $15 fee charged to IRA accounts, or the $15 fee charged for wire redemptions. You may use this information, together with the amount you invested, to estimate the expenses that you paid over the period. Simply divide your account value by $1,000 (for example, an $8,600 account value divided by $1,000 = 8.6), then multiply the result by the number in the first line for each Fund under the heading entitled “Expenses Paid During Period” to estimate the expenses you paid on your account during this period.
Hypothetical Example for Comparison Purposes
The second line in the table for each Fund provides information about hypothetical account values and hypothetical expenses based on the Fund’s actual expense ratio and an assumed rate of return of 5% per year before expenses, which is not the Fund’s actual return. The hypothetical account values and expenses may not be used to estimate the actual ending account balance or expenses you paid for the period. You may use this information to compare the ongoing costs of investing in the Fund and other funds. To do so, compare this 5% hypothetical example with the 5% hypothetical examples that appear in the shareholder reports of the other funds. Please note that the expenses shown in the table are meant to highlight your ongoing costs only and do not reflect any transactional costs, such as sales charges (loads), redemption fees, or exchange fees that may be charged by other funds. Therefore, this information is useful in comparing ongoing costs only, and will not help you determine the relative total costs of owning different funds.
| Beginning Account Value April 1, 2017 | Ending Account Value September 30, 2017 | Expense Ratio(a) | Expenses Paid During period | |||||||||||
ICON Emerging Markets Fund | ||||||||||||||
Class S | ||||||||||||||
Actual | $ 1,000.00 | $ 1,053.70 | 1.55% | $ 7.98 | ||||||||||
Hypothetical (5% return before expenses) | $ 1,000.00 | $ 1,017.30 | 1.55% | $ 7.84 | ||||||||||
Class A | ||||||||||||||
Actual | $ 1,000.00 | $ 1,052.70 | 1.80% | $ 9.26 | ||||||||||
Hypothetical (5% return before expenses) | $ 1,000.00 | $ 1,016.04 | 1.80% | $ 9.10 | ||||||||||
ICON International Equity Fund | ||||||||||||||
Class S | ||||||||||||||
Actual | $ 1,000.00 | $ 1,059.50 | 1.55% | $ 8.00 | ||||||||||
Hypothetical (5% return before expenses) | $ 1,000.00 | $ 1,017.30 | 1.55% | $ 7.84 | ||||||||||
Class C | ||||||||||||||
Actual | $ 1,000.00 | $ 1,053.40 | 2.55% | $13.13 | ||||||||||
Hypothetical (5% return before expenses) | $ 1,000.00 | $ 1,012.28 | 2.55% | $12.86 | ||||||||||
Class A | ||||||||||||||
Actual | $ 1,000.00 | $ 1,058.10 | 1.80% | $ 9.29 | ||||||||||
Hypothetical (5% return before expenses) | $ 1,000.00 | $ 1,016.04 | 1.80% | $ 9.10 | ||||||||||
| (a) | The Fund’s expense ratios have been annualized based on the Fund’s most recent fiscal half-year expenses. |
| (b) | Expenses are equal to the Fund’s annualized expense ratio multiplied by the average account value over the period, multiplied by the number of days in the most recent fiscal half-year 183/365 (to reflect the half-year period). |
Total returns exclude applicable sales charges. If sales charges were included (maximum 5.75%), returns would be lower.
| 36 | www.iconfunds.com | |
Table of Contents
| ICON International Funds | Board of Trustees and Fund Officers | |
| September 30, 2017 (Unaudited) |
The ICON Funds Board of Trustees (the “Board”) consists of four Trustees who oversee the 17 ICON Funds (the “Funds”). The Board is responsible for general oversight of the Funds’ business and for assuring that the Funds are managed in the best interest of the Funds’ shareholders. The Trustees, and their ages, and principal occupations are set forth below. The address of the Trustees is 5299 DTC Blvd., Suite 1200, Greenwood Village, CO 80111. Trustees have no official term of office and generally serve until they resign or are not re-elected.
Interested Trustee
Craig T. Callahan, 66. Chairman of the Board. Dr. Callahan has been a Trustee of the Funds since their inception. Dr. Callahan also serves as President (2014 to present and 1998 to 2013) and Chairman of the Investment Committee (2005 to present) and served as the Chief Investment Officer (1991 to 2004) of ICON Advisers, Inc. Dr. Callahan is also Executive Vice President (2005 to present); Director (1991 to present); and was previously President (1998 to 2005) and Chief Compliance Officer (2005) of ICO Distributors, Inc. Dr. Callahan also serves as the President (1998 to present) and Chairman of the Board of Directors (1994 to present) of IM&R, the parent company of ICON Advisers, Inc. and ICON Distributors, Inc.
Independent Trustees
Glen F. Bergert, 67. Mr. Bergert has been a Trustee of the Funds since 1999. Mr. Bergert is President of Venture Capital Management LLC (1997 to present), General Partner of SOGNO Partners LP, a venture capital company (2001 to 2015), General Partner of Bergert Properties, LLP, a real estate holding company (1997 to present), General Partner of Pyramid Real Estate Partnership, a real estate development company (1998 to present), General Partner of Chamois Partners, LP, a venture capital company (2004 to present) and was previously a General Partner with KPMG Peat Marwick, LLP (1979 to 1997). Mr. Bergert is also a Director of Delta Dental of California (2013 to present and 2006 to 2012), Delta Dental of Pennsylvania (2010 to present and 1998 to 2009), Delta Reinsurance Corporation (2015 to present; 2011 to 2014 and 2000 to 2009) and Dentegra Group, Inc. (2017 to present; 2010 to 2014).
John C. Pomeroy, Jr., 70. Mr. Pomeroy has been a Trustee of the Funds since 2002. Mr. Pomeroy is Chief Investment Officer and Director of Investments, Pennsylvania State University (2001 to present) and was Portfolio Manager and Product Manager, Trinity Investment Management Corporation (1989 to 2001).
R. Michael Sentel, 69. Mr. Sentel has been a Trustee of the Funds since their inception. Mr. Sentel is a Senior Attorney with the U.S. Department of Education (1996 to present) and was engaged in private practice of securities and corporate law (1981 to 2017). Mr. Sentel began his legal career with the U.S. Securities and Exchange Commission’s Division of Enforcement and served as a Branch Chief (1980 to 1981). Later he served as the Section Chief for the Professional Liability Section of the Federal Deposit Insurance Corp. with responsibility for the Rocky Mountain Region (1991 to 1994).
Mark Manassee, 52. Mr. Manassee has been a Trustee of the Funds since 2017. Mr. Manassee is a Senior Advisor to McKinsey’s Wealth and Asset Management Practice. Mr. Manassee was Principal and President of Market Metrics, LLC, a subsidiary of FactSet Research Systems, Inc. (1998 to 2016). Mr. Manassee was also a Director of Matrix-Data, Ltd (UK) (2013 to 2016) and Rhetorik, Ltd (UK) (2013 to 2016).
The Officers of the Funds are:
Craig T. Callahan, 66. Chairman of the Board. Dr. Callahan has been a Trustee of the Funds since their inception. Dr. Callahan also serves as President (2014 to present and 1998 to 2013) and Chairman of the Investment Committee (2005 to present) and served as the Chief Investment Officer (1991 to 2004) of ICON Advisers, Inc. Dr. Callahan is also Executive Vice President (2005 to present); Director (1991 to present); and was previously President (1998 to 2005) and Chief Compliance Officer (2005) of ICO Distributors, Inc. Dr. Callahan also serves as the President (1998 to present) and Chairman of the Board of Directors (1994 to present) of IM&R, the parent company of ICON Advisers, Inc. and ICON Distributors, Inc.
Donald Salcito, 64. Mr. Salcito serves as Vice President and Secretary of the Funds (2006 to present). Mr. Salcito is also Executive Vice President and General Counsel (2005 to present) of ICON Advisers, Inc.; Director of IM&R (2005 to present); Executive Vice President, Secretary, General Counsel of ICON Distributors, Inc. (2005 to 2017). Previously, he was a Partner in various national law firms, practicing in the securities law area (1980 to 2005).
Brian D. Harding, 38. Mr. Harding serves as Principal Financial Officer and Treasurer of the Funds (2017 to present). Mr. Harding is also Chief Financial Officer of ICON Advisers, Inc. (2013 to present) and Director and IM&R (2013 to present). Previously he was Chief Compliance Officer and Anti-Money Laundering Officer of the Funds (2008 to 2013), Chief Compliance Officer of ICON Advisers, Inc. (2011 to 2013), and Manager at PricewaterhouseCoopers LLP (2001 to 2008).
Jack M. Quillin, 45. Mr. Quillin serves as Assistant Treasurer of the Funds (2017 to present). Mr. Quillin is also a Compliance and Fund Accounting Associate of ICON Advisers, Inc. (2016 to present). Previously, he was a compliance analyst at Marsico Capital Management, LLC (2011 to 2015), an assistant vice president in the municipal derivatives finance department at Merrill Lynch (2004 to 2008), and a senior accountant in the Regulatory Reporting group at Wells Fargo & Company (1998 to 2003).
| Annual Report | September 30, 2017 | 37 | |
Table of Contents
| ICON International Funds | Board of Trustees and Fund Officers | |
| September 30, 2017 (Unaudited) |
Christopher R. Ambruso, 37. Mr. Ambruso serves as Chief Compliance Officer and Anti-Money Laundering Officer (2017 to present) of the Funds. Mr. Ambruso is also Chief Compliance Officer of ICON Advisers, Inc. (2017 to present). Previously he served as Assistant Secretary (2016 to 2017 and 2008 to 2012) of the Funds and Associate Counsel (2013 to 2017); Associate Attorney (2008 to 2013); and Staff Attorney (2007 to 2008) of ICON Advisers, Inc.
Stephen E. Abrams, 54. Mr. Abrams serves as Assistant Secretary of the Funds (2017 to present). Mr. Abrams is also Associate General Counsel of ICON Advisers, Inc. (2005 to present); Executive Vice President and General Counsel (2017 to present) and Chief Compliance Officer (2007 to present) of ICON Distributors, Inc. Previously, he worked as an Associate Attorney before becoming a Partner at a national law firm, practicing general litigation and securities law (1994 to 2005).
| 38 | www.iconfunds.com | |
Table of Contents
| ICON International Funds | Additional Information | |
| September 30, 2017 (Unaudited) |
Renewal of Investment Advisory Agreement
On August 25, 2017, the Board of Trustees, including all of the Trustees that are not “interested persons” of the Trust (the “Independent Trustees”), approved continuation of the Advisory Agreements (as defined below) with the Adviser for each Fund for an additional one-year term commencing October 1, 2017.
In determining to renew the investment advisory agreements between ICON Funds (the “Trust”) and ICON Advisers, Inc. (“ICON” or the “Adviser”) the Trustees requested, were provided with and reviewed data with respect to the Adviser, its personnel, and the services provided and to be provided to each Fund by the Adviser under the Trust’s Investment Advisory Agreement dated October 9, 1996, as amended (related to the Sector Funds, the International Funds and ICON Fund) and under the Trust’s Investment Advisory Agreement dated July 9, 2002 and effective October 1, 2002, as amended (related to the U.S. Diversified Funds — Bond, Risk-Managed Balanced, Equity Income, Opportunities and Long/Short Funds) (collectively, the “Advisory Agreements”).
The Trustees agreed that consideration of the Advisory Agreements should also include consideration of other agreements between the Adviser and the Trust that impact provisions of the Advisory Agreements, including expense limitation agreements as amended effective January and July, 2016. The Trustees were provided with and reviewed data with respect to the Adviser, its personnel, and the services provided and to be provided to each Fund by the Adviser under the Trust’s Advisory Agreements, Administrative Services Agreement and Expense Limitation Agreement and the Distribution Agreement with ICON Distributors, Inc. (“IDI”). The data included information concerning advisory, distribution and administrative services provided to the Funds by ICON and its related companies; information concerning other businesses of those companies; and comparative data obtained from Broadridge Financial Solutions (“Broadridge”) related to Fund performance and Fund expenses (the “Broadridge Report”).
The Board convened a meeting with Broadridge on August 11, 2017 to discuss the Broadridge Report and the information contained within the Broadridge Report. At that meeting, Broadridge representatives discussed the findings of the Broadridge Report with the Independent Trustees. Management personnel participated in the Broadridge meeting to discuss the data with the Board. The Trustees were represented at that meeting by independent legal counsel. At the meeting, Broadridge discussed its methodology and peer selection. Broadridge addressed the difficulty of determining peer selection of some sector Funds that had no statistical group of peers from which to present reliable data, expenses and fees. In addition, Broadridge discussed the difficulty of presenting information on three Funds whose expenses were reduced after the annual report, and performance relative to the respective Funds’ peers. Broadridge also discussed the Funds’ size and how an individual fund’s size would affect economies of scale generally and operating expenses in particular. Broadridge presented no information on how expenses were affected by a fund complex size.
Also included in the 15(c) discussion was a briefing on factors affecting the ICON investment model; expenses and expense ratios of each Fund and other ICON managed products; relative performance of each Fund; status of expense reimbursements to the Funds by the Adviser; sales and marketing initiatives; specific business factors affecting the Adviser; the work load on ICON as adviser and administrator to the Funds; current profitability of ICON; staffing levels and staff morale.
The Independent Trustees were represented by independent legal counsel in the entire 15(c) process. In August, after participating in the meeting with Broadridge and management, the Independent Trustees met separately as a group in private sessions with their independent legal counsel to review and discuss a variety of qualitative and quantitative information, including information they had received throughout the year as part of their regular oversight of the Funds. Based on these discussions, independent legal counsel and/or the Lead Independent Trustee also contacted management to request additional information from Broadridge. The Board received materials from independent legal counsel discussing the legal standards applicable to their consideration of the ICON-Trust agreements.
In considering the nature, extent and quality of the services provided by the Adviser, the Board reviewed information relating to ICON’s operations and personnel. Among other things, the Adviser provided biographical information on its professional staff and descriptions of its organizational and management structure. In the course of their deliberations the Board evaluated, among other things, information relating to the investment philosophy, strategies and techniques used in managing each Fund, the qualifications and experience of ICON’s investment personnel, ICON’s compliance programs, ICON’s brokerage practices, including the extent to which the Adviser obtains research through “soft dollar” arrangements with the Funds’ brokerage, compliance reports on the foregoing, and the financial and non-financial resources available to provide services required under the Advisory Agreement.
Management and the Trustees discussed the Broadridge Report and management personnel showed performance for each Fund and discussed the factors affecting performance.
During the discussion on performance, Management personnel noted the importance of advisory fees in total. The novelty and uniqueness of ICON’s management style (specifically, the fact that it is market-cap agnostic, its willingness to actively manage for performance based on active share without adhering strictly to benchmark holdings, the fact that it is a value manager that considers forward looking earnings) must be evaluated when comparing management fees.
| Annual Report | September 30, 2017 | 39 | |
Table of Contents
| ICON International Funds | Additional Information | |
| September 30, 2017 (Unaudited) |
In connection with reviewing data bearing upon the nature, quality, and extent of services furnished by ICON to each Fund, the Board assessed data concerning ICON’s staffing, systems and facilities. The Board also assessed ICON’s non-Trust business to see if there are any initiatives that would dilute service to the Trust. The Board concluded:
| A. | That the breadth and the quality of investment advisory and other services being provided to each Fund are satisfactory; |
| B. | That ICON has made significant expenditures in the past year and in prior years to ensure that the Trust has the right product mix for the market and the Adviser has the sophisticated systems and highly trained personnel necessary for it to be able to continue to provide quality service to the Funds’ shareholders; |
| C. | That the Board is satisfied with the research, portfolio management, and trading services, among others, being provided by ICON to the Trust, and has determined that ICON is charging fair and reasonable fees. |
| D. | The risks assumed by ICON in providing investment advisory services to each Fund including the capital commitments which have been made in the past and which continue to be made by ICON to ensure the continuation of the highest quality of service to the Trust is made with the recognition that the Trust’s advisory relationship with ICON can be terminated at any time and must be renewed on an annual basis. |
In considering the reasonableness of the fees paid to the Adviser for managing each Fund, the Board reviewed, among other things, data concerning other funds from the Broadridge Report, financial statements of the Adviser and an analysis of the profitability of the Adviser, and its affiliates, and their relationship with each Fund over various time periods. Such analysis identified all revenues and other benefits received by the Adviser and its affiliates from managing each Fund, the costs associated with providing such services and the resulting profitability to the Adviser and its affiliates and a comparison of similar data from reports filed by publicly traded firms.
The Board assessed actual (net) fees for advisory services and Fund expense ratios under the contractual relationship (the Advisory agreements, the Administration Agreement and the Expense Limitation Agreements) with the Adviser as opposed to the fees specified in the applicable Advisory Agreement and expense ratios without application of the expense limitations and the low cost of the Administration Agreement. The Board concluded that the focus should be on actual expense ratios after application of the Expense Limitation Agreements.
The Board considered the current and anticipated asset levels of each Fund and the contractual commitments of the Adviser to waive fees and pay expenses of the Funds from time to time to limit the total expenses of the Funds. The Board also considered the Adviser’s contractual commitment regarding administration and the fact it would continue to lose money on administration. In this regard the Board discussed asset levels in each Fund covered by the Advisory Agreements. ICON’s ability to provide the services called for under the Advisory Agreements was assessed in light of current and projected asset levels. Fund expenses and expense ratios were also assessed in light of current and projected asset levels. The Board concluded that the Adviser has the resources necessary to provide the services called for under the Advisory Agreements; that profitability to the Adviser and its affiliates from their relationship with the Funds, and services provided to the Funds, is not excessive; and that the Adviser is not realizing benefits from economies of scale that would warrant adjustments to the fees for any Fund at this time. The Board of Trustees concluded that, in light of the nature, extent and quality of the services provided by the Adviser and the levels of profitability associated with providing these services, the fees charged by the Adviser under the Advisory Agreements to each Fund are reasonable.
In connection with assessing data bearing on the fairness of fee arrangements, the Board considered the Broadridge Report, information they had received throughout the year as part of their regular oversight of the Funds (including Morningstar data on peer groupings), and information from independent broker/dealers evaluating fees for platform sales. It was noted that Broadridge was selected at the May 2017 Board meeting to prepare its reports, an extensive analysis of the expense data of other comparable funds; and that Trustee input was solicited and provided in the process. Among other information discussed, it was noted that:
| A. | Upon review of the advisory fee structures of each Fund (taking into consideration management fees and breakpoint fees), the level of investment advisory fees paid by each Fund is within competitive ranges for the size of each Fund and Fund mandate; |
| B. | The expense ratio of each Fund is generally reasonable and understandable in light of the existing Fund Trust structure and Fund performance; |
| C. | ICON has contractually agreed to impose expense limitations on all Funds at a cost to ICON and is considering new expense limitations; |
| D. | The advisory and other fees payable by the Funds to ICON are essentially fees which would be similar to those which would have resulted solely from “arm’s-length” bargaining. |
| 40 | www.iconfunds.com | |
Table of Contents
| ICON International Funds | Additional Information | |
| September 30, 2017 (Unaudited) |
| E. | The fees paid to ICON for managing other institutional accounts (such as individual or sub-advised portfolios) are lower, but there are good reasons such accounts are less costly for ICON to manage, including, but not limited to, the level of work needed to service the institutional portfolios and the size and stability of such institutional accounts. |
| F. | The extent to which economies of scale could be realized as a Fund grows in assets and whether the Fund’s fees reflect these economies of scale for the benefit of Fund shareholders. |
| G. | The costs borne by ICON in providing advisory services to each Fund and the profitability of ICON in light of the estimated profitability analysis which had been provided by ICON. |
The Board also considered the fees charged by the Adviser to other advisory clients, including institutional and sub-advised clients as outlined in its Registration Application on Form ADV in connection with assessing data bearing on the fairness of fee arrangements.
The Board concluded the Adviser is providing the Funds with professional management at a price that would have been arrived at in an arm’s length negotiation.
In connection with assessing the direct and indirect benefits to ICON from serving as the Funds’ adviser, the Board discussed services provided under the Distribution Agreement and the Administrative Services Agreement which are in addition to services under the Advisory Agreements. It was noted that ICON benefits from serving directly or through affiliates as the principal underwriter and administrative agent for the Funds. The services provided by ICON and its affiliates to the Funds are reasonably satisfactory, and the profits derived from providing the services are competitive and reasonable. It was further noted that ICON receives research assistance from the use of soft dollars generated from Fund portfolio transactions. The Trustees noted that such research assists ICON in providing quality investment advisory services to the Funds as well as other accounts to which it provides advisory services.
Based on all these considerations and other data as discussed above, the Board, including all of the Independent Trustees, concluded that: 1) the continuation of the Advisory Agreements was in the best interests of each Fund and its shareholders, 2) the services to be performed under the Advisory Agreements were required for the operation of the Funds, 3) the advisory services were satisfactory to the Funds in the past, and 4) the fees for the advisory services and other benefits from the relationship with the Trust received by ICON, and its affiliates, were within the range of what would have been negotiated at arm’s length in light of all the circumstances.
Supplemental Tax Information
Pursuant to Section 852(b)(3) of the Internal Revenue Code the following Funds designate the amounts listed below as long-term capital gain dividends:
ICON Emerging Markets Fund | $ | 0 | ||
ICON International Equity Fund | $ | 0 |
The following Funds designate the percentages listed below of the income dividends distributed in 2016 as qualified dividend income (QDI) as defined in Section 1(h)(11) of the Internal Revenue Code:
ICON Emerging Markets Fund | 0.00 | % | ||
ICON International Equity Fund | 0.00 | % |
The following Funds designate the percentages listed below of the income dividends distributed in 2016 as qualifying for the corporate dividends received deduction (DRD) as defined in Section 854(b)(2) of the Internal Revenue Code:
ICON Emerging Markets Fund | 0.00 | % | ||
ICON International Equity Fund | 0.00 | % |
Pursuant to §853 of the Internal Revenue Code, the ICON Emerging Markets Fund designates the following amounts as foreign taxes paid for the current fiscal year. Foreign taxes paid for purposes of §853 may be less than actual foreign taxes paid for financial statement purposes.
| Annual Report | September 30, 2017 | 41 | |
Table of Contents
| ICON International Funds | Additional Information | |
| September 30, 2017 (Unaudited) |
Creditable Foreign Taxes Paid
$184,101
Portion of Ordinary Income Distribution derived from Foreign Sourced Income*
99.77%
| * | The Fund has not derived any income from ineligible foreign sources as defined under §901(j) of the Internal Revenue Code. |
Foreign taxes paid or withheld should be included in taxable income with an offsetting deduction from gross income or as a credit for taxes paid to foreign governments.
Above figures may differ from those cited elsewhere in this report due to differences in the calculation of income and gains under U.S. generally accepted accounting principles (book) purposes and Internal Revenue Service (tax) purposes.
Portfolio Holdings
Information related to the 10 largest portfolio holdings of each Fund is made available at www.iconfunds.com within approximately 10 business days after month-end. Additionally, a complete list of each Fund’s holdings is made available approximately 30 days after month-end. Each ICON Fund also files a complete schedule of portfolio holdings for the first and third quarters of its fiscal year with the Securities and Exchange Commission (the “Commission”) on Form N-Q. The ICON Funds’ Forms N-Q are available at www.sec.gov or may be reviewed and copied at the Commission’s Public Reference Room in Washington, DC. Information about the Public Reference Room may be obtained by calling 1-800-SEC-0330.
Proxy Voting
A summarized description of the policies and procedures the ICON Funds use to vote proxies is available free of charge at www.iconfunds.com or by calling 1-800-764-0442.
Information about how the ICON Funds voted proxies related to each Fund’s portfolio securities during the 12-month period ended June 30 is available free of charge at www.iconfunds.com or on the Commission’s website at www.sec.gov.
For More Information
This report is for the general information of the Funds’ shareholders and is not authorized for distribution to prospective investors unless preceded or accompanied by a current prospectus. You may obtain a copy of the prospectus, which contains information about the investment objectives, risks, charges, expenses, and share classes of each ICON Fund, by visiting www.iconfunds.com or by calling 1-800-764-0442. Please read the prospectus carefully before investing.
ICON Distributors, Inc., Distributor.
| 42 | www.iconfunds.com | |
Table of Contents
| ICON International Funds | Privacy Policy | |
| September 30, 2017 (Unaudited) |
FACTS | WHAT DOES ICON DO WITH YOUR PERSONAL INFORMATION? | |
Why? | Financial companies choose how they share your personal information. Federal law gives consumers the right to limit some but not all sharing. Federal law also requires us to tell you how we collect, share, and protect your personal information. Please read this notice carefully to understand what we do. | |
What? | The types of personal information we collect and share depend on the product or service you have with us. This information can include: | |
• Social Security number and account balances | ||
• income and transaction history | ||
• checking account information and wire transfer instructions | ||
| When you are no longer our customer, we continue to share your information as described in this notice. | ||
How? | All financial companies need to share customers’ personal information to run their everyday business. In the section below, we list the reasons financial companies can share their customers’ personal information; the reasons ICON chooses to share; and whether you can limit this sharing. | |
Reasons we can share your personal information | Does ICON share? | Can you limit this sharing? | ||||
For our everyday business purposes — such as to process your transactions, maintain your account(s), respond to court orders and legal investigations, or report to credit bureaus | Yes | No | ||||
For our marketing purposes — to offer our products and services to you | No | We don’t share | ||||
For joint marketing with other financial companies | No | We don’t share | ||||
For our affiliates’ everyday business purposes — information about your transactions and experiences | No | We don’t share | ||||
For our affiliates’ everyday business purposes — information about your creditworthiness | No | We don’t share | ||||
For nonaffiliates to market to you | No | We don’t share | ||||
Questions? | Call 1-800-764-0442 for the ICON Funds and 1-800-828-4881 for ICON Advisers, Inc. and ICON Distributors, Inc. | |
| Annual Report | September 30, 2017 | 43 | |
Table of Contents
| ICON International Funds | Privacy Policy | |
| September 30, 2017 (Unaudited) |
| Who We Are | ||
| Who is providing this notice? | ICON Funds, ICON Advisers, Inc., and ICON Distributors, Inc. (collectively “ICON”) | |
| What We Do | ||
How does ICON protect my personal information? | To protect your personal information from unauthorized access and use, we use security measures that comply with federal law. These measures include computer safeguards and secured files and buildings. | |
| Contracts with our service providers require them to restrict access to your non-public personal information, and to maintain physical, electronic and procedural safeguards against unintended disclosure. | ||
How does ICON collect my personal information? | We collect your personal information, for example, when you | |
• open an account or enter into an investment advisory contract | ||
• provide account information or give us your contact information | ||
• make a wire transfer | ||
| We also collect your personal information from others, such as credit bureaus, affiliates, or other companies. | ||
| Why can’t I limit all sharing? | Federal law gives you the right to limit only | |
• sharing for affiliates’ everyday business purposes — information about your creditworthiness | ||
• affiliates from using your information to market to you | ||
• sharing for nonaffiliates to market to you | ||
| State laws and individual companies may give you additional rights to limit sharing. | ||
| Definitions | ||
| Affiliates | Companies related by common ownership or control. They can be financial and nonfinancial companies. | |
• Our affiliates include financial companies such as ICON Funds, ICON Advisers, Inc., and ICON Distributors, Inc. | ||
| Nonaffiliates | Companies not related by common ownership or control. They can be financial and nonfinancial companies. | |
• Nonaffiliates we share with can include financial companies such as custodians, transfer agents, registered representatives, financial advisers and nonfinancial companies such as fulfillment, proxy voting, and class action service providers | ||
| Joint marketing | A formal agreement between nonaffiliated financial companies that together market financial products or services to you. | |
• ICON doesn’t jointly market | ||
| 44 | www.iconfunds.com | |
Table of Contents

For more information about the ICON Funds, contact us:
By Telephone | 1-800-764-0442 | |
By E-Mail | info@iconadvisers.com | |
By Mail | ICON Funds | P.O. Box 1920 | Denver, CO 80201 | |
In Person | ICON Funds | 5299 DTC Boulevard, 12th Floor | |
Greenwood Village, CO 80111 | ||
On the Internet | www.iconfunds.com |
Table of Contents
ICON Consumer Discretionary Fund
ICON Consumer Staples Fund
ICON Energy Fund
ICON Financial Fund
ICON Healthcare Fund
ICON Industrials Fund
ICON Information Technology Fund
ICON Natural Resources Fund
ICON Utilities Fund
Table of Contents
|
You can now sign up for electronic delivery of ICON Fund shareholder reports, including prospectuses, annual reports, semiannual reports and proxy statements.
When these materials are available, you will receive an email from ICON with instructions on how to view the documents. Statements, transaction confirmations and other documents that are not available online will continue to be sent to you by U.S. mail.
Visit ICON’s website at www.iconfunds.com to learn more and sign up.
You may change or cancel your participation in eDelivery by visiting www.iconfunds.com, or you can request a hard copy of any of the materials free of charge by calling ICON Funds at 1-800-764-0442. |

1-800-764-0442
| ●
| www.iconfunds.com
| ||||||
Table of Contents
| 2 | ||||
Management Overview (Unaudited) and Schedules of Investments | ||||
| 3 | ||||
| 7 | ||||
| 11 | ||||
| 14 | ||||
| 18 | ||||
| 21 | ||||
| 24 | ||||
| 28 | ||||
| 32 | ||||
| 36 | ||||
| 48 | ||||
| 68 | ||||
| 82 | ||||
| 83 | ||||
| 86 | ||||
| 88 | ||||
| 93 | ||||
Table of Contents
| ICON Sector Funds | About This Report | |
| September 30, 2017 (Unaudited) |
Historical Returns
All total returns mentioned in this Report account for the change in a Fund’s per-share price and the reinvestment of any dividends, capital gain distributions and adjustments for financial statement purposes. If your account is set up to receive Fund distributions in cash rather than to reinvest them, your actual return may differ from these figures. The Funds’ performance results do not reflect the deduction of taxes that a shareholder would pay on Fund distributions or on the redemption of Fund shares. The Adviser may have reimbursed certain fees or expenses of some of the Funds. If not for these reimbursements, performance would have been lower. Fund results shown, unless otherwise indicated, are at net asset value. If a sales charge (maximum 5.75%) had been deducted, results would have been lower.
Past performance does not guarantee future results. Investment return and principal value will fluctuate so that an investor’s shares, when redeemed, may be worth more or less than their original cost. Performance results represent past performance, and current performance may be higher or lower. Please call 1-800-764-0442 or visit www.iconfunds.com for performance results current to the most recent month-end.
Portfolio Data
This Report reflects ICON’s portfolio holdings as of September 30, 2017, the end of the reporting period. The information is not a complete analysis of every aspect of any sector, industry, security or the Funds.
There are risks associated with mutual fund investing, including the loss of principal. The likelihood of loss may be greater if you invest for a shorter period of time. There is no assurance that the investment process will consistently lead to successful results.
An investment concentrated in sectors and industries may involve greater risk and volatility than a more diversified investment. Investments in foreign securities may entail unique risks, including political, market, and currency risks. Financial statements of foreign companies are governed by different accounting, auditing, and financial standards than U.S. companies and may be less transparent and uniform than in the United States. Many corporate governance standards, which help ensure the integrity of public information in the United States, do not exist in foreign countries. In general, there may be less governmental supervision of foreign stock exchanges and securities brokers and issuers. The ICON system relies on the integrity of the financial statements released to the market as part of our analysis.
The prospectus and statement of additional information contain this and other information about the Funds and are available by visiting www.iconfunds.com or calling 1-800-764-0442. Please read the prospectus and statement of additional information carefully.
Financial Intermediary
If you purchase the Fund through a broker-dealer or other financial intermediary (such as a bank), the Fund and its related companies may pay the intermediary for the sale of Fund shares and related services. These payments may influence the broker-dealer or other intermediary and your salesperson to recommend the Fund over another investment. Ask your salesperson or visit your financial intermediary’s website for more information.
| 2 | www.iconfunds.com | |
Table of Contents
| ICON Consumer Discretionary Fund | Management Overview | |
| September 30, 2017 (Unaudited) |
| Q. | How did the Fund Perform relative to its benchmark? |
| A. | The ICON Consumer Discretionary Fund Class S (the Fund) returned 8.93% for the fiscal year ended September 30, 2017, while the benchmark S&P Composite 1500 Consumer Discretionary Index rose 14.62%. The broad market S&P Composite 1500 Index returned 18.61%. Total returns for other periods and additional Class shares as of September 30, 2017 appear in the subsequent pages of this Fund’s Management Overview. |
| Q. | What primary factors influenced the Fund’s relative performance during the period? |
| A. | The broad equity market began the past fiscal year with losses, as investors became increasingly concerned with matters surrounding the United States presidential election in November and the implied influences it may have had on capital markets. These worries quickly abated, however, as equities began a nearly uninterrupted rally after Election Day, ending the fiscal year at all-time highs on many market indexes. As equity prices rose, our methodology saw value deteriorate in the Consumer Discretionary sector for much of the year, suggesting the sector as a whole was overpriced. In response, the Fund held a cash position for defensive purposes, which ultimately detracted from relative returns during the strong market move throughout the year. |
Other factors that influenced the Fund’s relative performance included competitive pressures from online retailers, changing trends in media consumption, and a strong housing market. As internet retail continued to grow and take market share away from traditional bricks-and-mortar sources, investors’ preferences for internet retail shifted in concert. Our valuation system ultimately favored more of the traditional bricks-and-mortar companies, which in turn, detracted from the Fund’s relative returns. The evolution of media consumption towards internet streaming providers continued for the year, ultimately aiding Netflix, Inc. While this company saw strong gains and an increase in its benchmark weight, our valuation system favored other companies which did not perform as well. On the positive side, aided by a resilient US economy, the housing market experienced a robust year. The Fund held an overweight position to the homebuilding industry throughout the year, which helped offset the impact of the Fund’s underperforming holdings. |
| Q. | How did the Fund’s Composition affect performance? |
| A. | Homebuilding was the greatest contributor to the Fund’s relative performance on an industry level during fiscal year 2017. Rising home values buoyed earnings in this industry, and names such as Installed Building Products, Inc. and LGI Homes, Inc. contributed to the Fund’s performance. The apparel retail industry was another positive Fund contributor. This industry suffered losses over the year, though the Fund was able to outperform the benchmark in this industry because of strong stock selection, including significant positions in TJX Cos., Inc. and Foot Locker, Inc. The movies & entertainment industry was another positive contributor, as Walt Disney Co. and Time Warner, Inc. contributed positively to the Fund’s performance. |
The housewares & specialties industry was the Fund’s largest detractor to relative performance, as Newell Brands, Inc. suffered losses over the period. The automotive retail industry also adversely impacted the Fund, as O’Reilly Automotive, Inc. and AutoZone, Inc. failed to perform as anticipated. Finally, the Fund’s lack of exposure to Amazon.com Inc., which posted large returns, ultimately contributed negatively to the performance of the Fund relative to the benchmark. The Fund held a cash position throughout the year for defensive reasons as our system suggested the Consumer Discretionary sector was generally overvalued. Our defensive positioning proved detrimental to Fund performance, however, because equities within the sector showed resilience during this bull market. |
| Q. | What is your investment outlook for the Consumer Discretionary sector? |
| A. | At the close of the fiscal year, our model indicates the Consumer Discretionary sector has a value-to-price (V/P) ratio of 1.00. In other words, we believe stocks in the Consumer Discretionary sector are trading at fair value and offer no upside on the broad sector level. Drilling down to the industry level, however, we currently see bargains in the tires & rubber and homebuilding industries. Still, over the course of the last 12-months, economic growth accelerated, unemployment fell to 10 year lows, and inflation remained subdued by historical standards. These factors could remain tailwinds for the US consumer and should benefit companies and industries in this sector of the economy. As always, we look to value as our primary guide and will adjust our positioning as market conditions dictate. |
| Annual Report | September 30, 2017 | 3 | |
Table of Contents
| ICON Consumer Discretionary Fund | Management Overview | |
| September 30, 2017 (Unaudited) |
Average Annual Total Return (as of September 30, 2017)
| Inception Date | 1 Year | 5 Years | 10 Years | Since Inception | Gross Expense Ratio* | Net Expense Ratio* | |||||||||||||||||||||||||||||
ICON Consumer Discretionary Fund - Class S | 7/9/97 | 8.93 | % | 9.68 | % | 7.48 | % | 5.94 | % | 1.42 | % | 1.42 | % | ||||||||||||||||||||||
ICON Consumer Discretionary Fund - Class A | 9/30/10 | 8.32 | % | 9.18 | % | N/A | 12.50 | % | 2.13 | % | 1.99 | % | |||||||||||||||||||||||
ICON Consumer Discretionary Fund - Class A (including maximum sales charge of 5.75%) | 9/30/10 | 2.06 | % | 7.90 | % | N/A | 11.56 | % | 2.13 | % | 1.99 | % | |||||||||||||||||||||||
S&P 1500 Consumer Discretionary Index | 14.62 | % | 15.50 | % | 10.98 | % | 8.92 | % | N/A | N/A | |||||||||||||||||||||||||
S&P Composite 1500 Index | 18.61 | % | 14.29 | % | 7.63 | % | 7.52 | % | N/A | N/A | |||||||||||||||||||||||||
Past performance is not a guarantee of future results. The performance of the S&P 1500 Consumer Discretionary Index includes the reinvestment of the dividends and capital gain distributions beginning on January 1, 2002. Additional information about these performance results and the comparative indexes can be found in the About This Report section. The Adviser has agreed to limit certain Fund expenses; without these limitations, returns would have been lower. The limitation provisions may be terminated in the future.
| * | Please see the most recent prospectus for details. |
Value of a $10,000 Investment (through September 30, 2017)
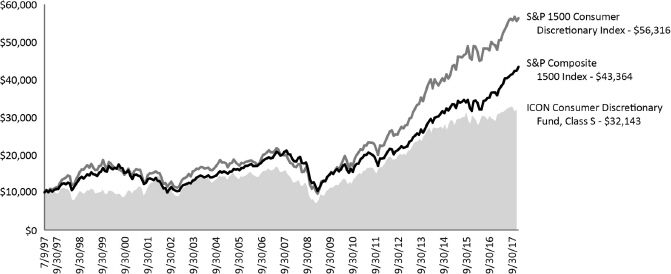
Past performance is not a guarantee of future results. The above graph compares a $10,000 investment made in the Fund’s Class S shares on the Class’ inception date of 7/9/97 to a $10,000 investment made in unmanaged securities indexes on that date. The Fund’s performance in this chart and the performance table assumes the reinvestment of dividends and capital gain distributions but does not reflect the deduction of taxes that a shareholder would pay on Fund distributions or on the redemption of Fund shares.
| 4 | www.iconfunds.com | |
Table of Contents
| ICON Consumer Discretionary Fund | Schedule of Investments | |
| September 30, 2017 |
| Shares or Principal Amount | Value | |||||
Common Stocks (93.26%) | ||||||
Apparel Retail (2.15%) | ||||||
TJX Cos., Inc. | 7,600 | $ 560,348 | ||||
| ||||||
Auto Parts & Equipment (6.79%) | ||||||
Horizon Global Corp.(a)(b) | 36,800 | 649,152 | ||||
Modine Manufacturing Co.(a) | 58,200 | 1,120,350 | ||||
| ||||||
| 1,769,502 | ||||||
| ||||||
Automotive Retail (7.59%) | ||||||
AutoZone, Inc.(a) | 500 | 297,555 | ||||
O’Reilly Automotive, Inc.(a) | 7,800 | 1,679,886 | ||||
| ||||||
| 1,977,441 | ||||||
| ||||||
Broadcasting (9.05%) | ||||||
CBS Corp., Class B | 16,000 | 928,000 | ||||
Gray Television, Inc.(a) | 18,500 | 290,450 | ||||
Hemisphere Media Group, Inc.(a) | 16,000 | 191,200 | ||||
Nexstar Media Group, Inc., | 946,960 | |||||
| ||||||
| 2,356,610 | ||||||
| ||||||
Cable & Satellite (7.23%) | ||||||
Comcast Corp., Class A | 48,900 | 1,881,672 | ||||
| ||||||
Casinos & Gaming (0.95%) | ||||||
MGM Resorts International | 7,600 | 247,684 | ||||
| ||||||
Home Improvement Retail (2.27%) | ||||||
Lowe’s Cos., Inc. | 7,400 | 591,556 | ||||
| ||||||
Homebuilding (13.15%) | ||||||
Century Communities, Inc.(a) | 22,500 | 555,750 | ||||
Installed Building Products, Inc.(a) | 15,700 | 1,017,360 | ||||
M/I Homes, Inc.(a) | 19,800 | 529,254 | ||||
PulteGroup, Inc. | 21,000 | 573,930 | ||||
TopBuild Corp.(a) | 11,500 | 749,455 | ||||
| ||||||
| 3,425,749 | ||||||
| ||||||
Hotels, Resorts & Cruise Lines (5.01%) | ||||||
Choice Hotels International, Inc. | 4,300 | 274,770 | ||||
Norwegian Cruise Line Holdings, Ltd.(a) | 9,600 | 518,880 | ||||
Royal Caribbean Cruises, Ltd. | 4,300 | 509,722 | ||||
| ||||||
| 1,303,372 | ||||||
| ||||||
Household Appliances (2.27%) | ||||||
Whirlpool Corp. | 3,200 | 590,208 | ||||
| ||||||
Housewares & Specialties (7.61%) | ||||||
Lifetime Brands, Inc. | 6,500 | 118,950 | ||||
Newell Brands, Inc. | 43,600 | 1,860,412 | ||||
| ||||||
| 1,979,362 | ||||||
| ||||||
Hypermarkets & Super Centers (0.95%) | ||||||
Costco Wholesale Corp. | 1,500 | 246,435 | ||||
| ||||||
Internet & Direct Marketing Retail (2.11%) | ||||||
Priceline Group, Inc.(a) | 300 | 549,246 | ||||
| ||||||
| Shares or Principal Amount | Value | |||||
Movies & Entertainment (13.05%) | ||||||
Time Warner, Inc. | 7,600 | $ 778,620 | ||||
Twenty-First Century Fox, Inc., Class A | 29,000 | 765,020 | ||||
Viacom, Inc., Class B | 11,300 | 314,592 | ||||
Walt Disney Co. | 15,600 | 1,537,692 | ||||
| ||||||
| 3,395,924 | ||||||
| ||||||
Specialized Consumer Services (0.79%) | ||||||
Liberty Tax, Inc. | 14,295 | 205,848 | ||||
| ||||||
Specialty Stores (5.38%) | ||||||
Ulta Beauty, Inc.(a) | 6,200 | 1,401,572 | ||||
| ||||||
Tires & Rubber (6.91%) | ||||||
Cooper Tire & Rubber Co.(b) | 21,400 | 800,360 | ||||
Goodyear Tire & Rubber Co. | 30,100 | 1,000,825 | ||||
| ||||||
| 1,801,185 | ||||||
| ||||||
Total Common Stocks (Cost $24,216,610) |
| 24,283,714 | ||||
| ||||||
Collateral for Securities on Loan (2.27%) | ||||||
State Street Navigator Securities Lending Government Money Market Portfolio, | 592,080 | 592,080 | ||||
| ||||||
Total Collateral for Securities on Loan (Cost $592,080) |
| 592,080 | ||||
| ||||||
Total Investments (95.53%) (Cost $24,808,690) |
| $24,875,794 | ||||
Other Assets Less Liabilities (4.47%) |
| 1,164,062 | ||||
| ||||||
Net Assets (100.00%) |
| $26,039,856 | ||||
| ||||||
| (a) | Non-income producing security. |
| (b) | All or a portion of the security was on loan as of September 30, 2017. |
| Sector Composition (September 30, 2017) | ||||
Consumer Discretionary | 92.31 | % | ||
Consumer Staples | 0.95 | % | ||
| 93.26 | % | |||
Percentages are based upon common stocks as a percentage of net assets.
The accompanying notes are an integral part of the financial statements.
| ||
| Annual Report | September 30, 2017 | 5 | |
Table of Contents
| ICON Consumer Discretionary Fund | Schedule of Investments | |
| September 30, 2017 |
| Industry Composition (September 30, 2017) | ||||
Homebuilding | 13.15 | % | ||
Movies & Entertainment | 13.05 | % | ||
Broadcasting | 9.05 | % | ||
Housewares & Specialties | 7.61 | % | ||
Automotive Retail | 7.59 | % | ||
Cable & Satellite | 7.23 | % | ||
Tires & Rubber | 6.91 | % | ||
Auto Parts & Equipment | 6.79 | % | ||
Specialty Stores | 5.38 | % | ||
Hotels, Resorts & Cruise Lines | 5.01 | % | ||
Home Improvement Retail | 2.27 | % | ||
Household Appliances | 2.27 | % | ||
Apparel Retail | 2.15 | % | ||
Internet & Direct Marketing Retail | 2.11 | % | ||
Other Industries (each less than 1%) | 2.69 | % | ||
| 93.26 | % | |||
Percentages are based upon common stocks as a percentage of net assets.
The accompanying notes are an integral part of the financial statements.
| ||
| 6 | www.iconfunds.com | |
Table of Contents
| ICON Consumer Staples Fund | Management Overview | |
| September 30, 2017 (Unaudited) |
| Q. | How did the Fund perform relative to its benchmarks? |
| A. | The ICON Consumer Staples Fund (the Fund) Class S returned 6.15% for the fiscal year ended September 30, 2017, while its sector-specific benchmark, the S&P Composite 1500 Consumer Staples Index, returned 4.36%, and the S&P Composite 1500 Index returned 18.61%. Total returns for other periods and additional Class shares as of September 30, 2017, appear in the subsequent pages of this Fund’s Management Overview. |
| Q. | What primary factors were behind the Fund’s relative performance? |
| A. | After outperforming the market over the last two years, the Consumer Staples sector underperformed the overall U.S. equity market by a wide margin. As we warned last year, rising interest rates were a risk to this sector’s leadership and that appears to have taken place for this year. Consumer Staples stocks were previously sought out as “bond proxies” in a search for higher dividend yields in the low interest rate environment, oftentimes bidding stocks up to levels deemed expensive by our valuations throughout the year. In response to these low value conditions, the Fund held a cash position for defensive purposes, which detracted from relative performance as the sector experienced gains alongside the broad equity market. |
Food prices experienced a deflationary environment for the year, which acted as a headwind on a number of industries within this sector. Already under pressure from shifting consumer preferences towards fresher product offerings, the packaged foods & meats industry suffered broad losses throughout the year. Nonetheless, our valuation system ultimately identified this industry as a bargain. The Fund maintained an overweight packaged foods & meats industry position, with our positions contributing to positive relative performance. In addition to food price deflation, the evolution of online retail impacted the Consumer Staples sector for the fiscal year, weakening select areas of the food & staples retailing industry group. While the Fund had exposure to the food & staples retailing industry, the Fund’s underweight position in this industry proved beneficial to relative performance. Finally, other areas of the sector, often referred to as “sin stocks”, including the distillers & vintners and tobacco industries, proved resilient to shifting consumer tastes and pricing pressures. The Fund’s holdings in these industries also contributed positively to relative returns for the year. |
| Q. | How did the Fund’s composition affect performance? |
| A. | Packaged foods & meats was the greatest contributor to the Fund’s performance on an industry level during fiscal year 2017. The Fund was able to outperform the benchmark in this industry with overweight positions in strong performing Blue Buffalo Pet Products, Inc. and Tyson Foods, Inc. The distillers & vintners industry was another positive contributor as Constellation Brands, Inc. was a standout performer that contributed positively to the Fund. |
Newell Brands, Inc., a housewares & specialties company, was the Fund’s largest detractor, as the company experienced losses in the final quarter of the fiscal year. Additionally, the brewers industry detracted from relative performance as Molson Coors Brewing Co. suffered losses. Finally, because our system suggested the Consumer Staples sector was generally overvalued, we held a cash position during the year for defensive purposes. This cash position dragged against the Fund’s returns as the sector experienced gains for the year. |
| Q. | What is your investment outlook for the Consumer Staples sector? |
| A. | At the close of the fiscal year, our model indicates the Consumer Staples sector has an overall value-to-price (V/P) ratio of 1.04. In other words, we believe the fair value for stocks in the Consumer Staples sector as a whole is approximately 4% higher than where the securities are now trading. We currently see bargains in the tobacco, soft drinks, and packaged foods & meats industries. Over the course of the last 12-months, economic growth accelerated, unemployment fell to 10 year lows, and inflation remained subdued by historical standards. These factors could remain tailwinds for the U.S. consumer and should benefit companies and industries in this sector of the economy. As always, we look to value as our primary guide and will adjust our positioning as market conditions dictate. |
| Annual Report | September 30, 2017 | 7 | |
Table of Contents
| ICON Consumer Staples Fund | Management Overview | |
| September 30, 2017 (Unaudited) |
Average Annual Total Return (as of September 30, 2017)
| Inception Date | 1 Year | 5 Years | 10 Years | Since Inception | Gross Expense Ratio* | Net Expense Ratio* | |||||||||||||||||||||||||||||
ICON Consumer Staples Fund - Class S | 5/9/97 | 6.15% | 10.36% | 6.96% | 8.58% | 1.74% | 1.51% | ||||||||||||||||||||||||||||
ICON Consumer Staples Fund - Class A | 9/30/10 | 5.91% | 10.10% | N/A | 11.36% | 1.97% | 1.76% | ||||||||||||||||||||||||||||
ICON Consumer Staples Fund - Class A | 9/30/10 | -0.23% | 8.82% | N/A | 10.43% | 1.97% | 1.76% | ||||||||||||||||||||||||||||
S&P 1500 Consumer Staples Index | 4.36% | 11.71% | 9.93% | 8.17% | N/A | N/A | |||||||||||||||||||||||||||||
S&P Composite 1500 Index | 18.61% | 14.29% | 7.63% | 7.98% | N/A | N/A | |||||||||||||||||||||||||||||
Past performance is not a guarantee of future results. The performance of the S&P 1500 Consumer Staples Index includes the reinvestment of the dividends and capital gain distributions beginning on January 1, 2002. Additional information about these performance results and the comparative indexes can be found in the About This Report section. The Adviser has agreed to limit certain Fund expenses; without these limitations, returns would have been lower. The limitation provisions may be terminated in the future.
| * | Please see the most recent prospectus for details. |
Value of a $10,000 Investment (through September 30, 2017)
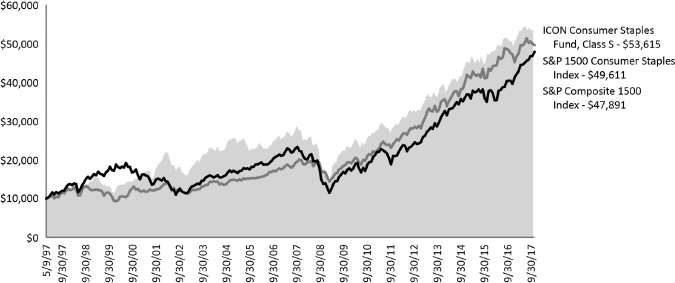
Past performance is not a guarantee of future results. The above graph compares a $10,000 investment made in the Fund’s Class S shares on the Class’ inception date of 5/9/97 to a $10,000 investment made in unmanaged securities indexes on that date. The Fund’s performance in this chart and the performance table assumes the reinvestment of dividends and capital gain distributions but does not reflect the deduction of taxes that a shareholder would pay on Fund distributions or on the redemption of Fund shares.
| 8 | www.iconfunds.com | |
Table of Contents
| ICON Consumer Staples Fund | Schedule of Investments | |
| September 30, 2017 |
| Shares or Principal Amount | Value | |||||
Common Stocks (98.31%) | ||||||
Agricultural Products (2.26%) | ||||||
Fresh Del Monte Produce, Inc. | 13,700 | $ 622,802 | ||||
| ||||||
Distillers & Vintners (4.42%) | ||||||
Constellation Brands, Inc., Class A | 6,100 | 1,216,645 | ||||
| ||||||
Drug Retail (11.35%) | ||||||
CVS Health Corp. | 17,900 | 1,455,628 | ||||
Walgreens Boots Alliance, Inc. | 21,600 | 1,667,952 | ||||
| ||||||
| 3,123,580 | ||||||
| ||||||
Food Distributors (7.11%) | ||||||
Sysco Corp. | 23,100 | 1,246,245 | ||||
U.S. Foods Holding Corp.(a) | 26,700 | 712,890 | ||||
| ||||||
| 1,959,135 | ||||||
| ||||||
Household Products (11.89%) | ||||||
Colgate-Palmolive Co. | 7,500 | 546,375 | ||||
Energizer Holdings, Inc. | 6,300 | 290,115 | ||||
Orchids Paper Products | 10,103 | 142,250 | ||||
Procter & Gamble Co. | 14,200 | 1,291,916 | ||||
Spectrum Brands Holdings, Inc.(b) | 9,500 | 1,006,240 | ||||
| ||||||
| 3,276,896 | ||||||
| ||||||
Housewares & Specialties (4.29%) |
| |||||
Newell Brands, Inc. | 27,700 | 1,181,959 | ||||
| ||||||
Hypermarkets & Super Centers (4.06%) |
| |||||
Costco Wholesale Corp. | 6,800 | 1,117,172 | ||||
| ||||||
Packaged Foods & Meats (32.57%) |
| |||||
Blue Buffalo Pet Products, Inc.(a)(b) | 65,500 | 1,856,925 | ||||
Campbell Soup Co. | 5,800 | 271,556 | ||||
Conagra Foods, Inc. | 8,900 | 300,286 | ||||
J.M. Smucker Co. | 2,600 | 272,818 | ||||
Kellogg Co. | 4,500 | 280,665 | ||||
Kraft Heinz Co. | 3,300 | 255,915 | ||||
Lamb Weston Holdings, Inc. | 16,700 | 783,063 | ||||
McCormick & Co., Inc. | 5,600 | 574,784 | ||||
Mondelez International, Inc., Class A | 33,400 | 1,358,044 | ||||
Omega Protein Corp. | 17,000 | 283,050 | ||||
Pinnacle Foods, Inc. | 12,000 | 686,040 | ||||
TreeHouse Foods, Inc.(a)(b) | 4,000 | 270,920 | ||||
Tyson Foods, Inc., Class A | 25,200 | 1,775,340 | ||||
| ||||||
| 8,969,406 | ||||||
| ||||||
Personal Products (2.25%) | ||||||
elf Beauty, Inc.(a)(b) | 27,500 | 620,125 | ||||
| ||||||
Soft Drinks (15.66%) | ||||||
Coca-Cola Co. | 39,000 | 1,755,390 | ||||
Dr. Pepper Snapple Group, Inc. | 2,700 | 238,869 | ||||
Monster Beverage Corp.(a) | 4,900 | 270,725 | ||||
PepsiCo, Inc. | 18,400 | 2,050,312 | ||||
| ||||||
| 4,315,296 | ||||||
| ||||||
| Shares or Principal Amount | Value | |||||
Tobacco (2.45%) | ||||||
British American Tobacco PLC, | 10,800 | $ 674,460 | ||||
| ||||||
Total Common Stocks (Cost $27,177,578) | 27,077,476 | |||||
| ||||||
Collateral for Securities on Loan (7.30%) |
| |||||
State Street Navigator Securities Lending Government Money | 2,009,724 | 2,009,724 | ||||
| ||||||
Total Collateral for Securities on Loan (Cost $2,009,724) |
| 2,009,724 | ||||
| ||||||
Total Investments (105.61%) (Cost $29,187,302) |
| $29,087,200 | ||||
Liabilities Less Other Assets (-5.61%) |
| (1,544,633) | ||||
| ||||||
Net Assets (100.00%) | $27,542,567 | |||||
| ||||||
| (a) | Non-income producing security. |
| (b) | All or a portion of the security was on loan as of September 30, 2017. |
ADR - American Depositary Receipt
| Sector Composition (September 30, 2017) | ||||
Consumer Staples | 94.02% | |||
Consumer Discretionary | 4.29% | |||
|
| |||
| 98.31% | ||||
|
| |||
Percentages are based upon common stocks as a percentage of net assets.
The accompanying notes are an integral part of the financial statements.
| ||
| Annual Report | September 30, 2017 | 9 | |
Table of Contents
| ICON Consumer Staples Fund | Schedule of Investments | |
| September 30, 2017 |
| Industry Composition (September 30, 2017) | ||||
Packaged Foods & Meats | 32.57% | |||
Soft Drinks | 15.66% | |||
Household Products | 11.89% | |||
Drug Retail | 11.35% | |||
Food Distributors | 7.11% | |||
Distillers & Vintners | 4.42% | |||
Housewares & Specialties | 4.29% | |||
Hypermarkets & Super Centers | 4.06% | |||
Tobacco | 2.45% | |||
Agricultural Products | 2.26% | |||
Personal Products | 2.25% | |||
|
| |||
| 98.31% | ||||
|
| |||
Percentages are based upon common stocks as a percentage of net assets.
The accompanying notes are an integral part of the financial statements.
| ||
| 10 | www.iconfunds.com | |
Table of Contents
| ICON Energy Fund | Management Overview | |
| September 30, 2017 (Unaudited) |
| Q. | How did the Fund perform relative to its benchmarks? |
| A. | For the fiscal year ending September 30, 2017, the ICON Energy Fund (the Fund) Class S returned -0.44%, slightly outperforming its sector-specific benchmark, the S&P 1500 Energy Index, which returned -0.91%. The Fund also lagged the broad benchmark, the S&P Composite 1500 Index, which returned 18.61%. Total returns for other periods and additional Class shares as of September 30, 2017, appear in the subsequent pages of this Fund’s Management Overview. |
| Q. | What primary factors were behind the Fund’s relative performance? |
| A. | The Energy sector’s underperformance relative to the broad market reflected the uncertainty and volatility in oil prices during fiscal year 2017. From mid-November through the end of February one-month oil futures contracts measured by West Texas Intermediate (WTI) crude, gained around 25.7% before falling close to 22% by the last half of June. Still, and again as measured by the WTI one-month futures contract, oil prices gained 7% during the fiscal year. Natural gas experienced the same volatility as oil over the course of the year, but prices (as again measured by one-month futures contracts) rose 3.5%. Between September 30, 2016 and July 31, 2017, US oil production increased 8%. The threat of oversupply combined with continued volatility has made many investors leery of Energy. |
Guided by our methodology, we were underweight certain industries within the Energy sector, including the oil & gas drilling and oil & gas equipment & services industries, which contributed positively to Fund performance Over the course of the fiscal year, overall average value-to-price (V/P) ratio for the Energy sector fell below 1.00 and we turned elsewhere for opportunities. We found value in the Utilities sector, which, with a V/P of 1.08 in early 2017, had the highest V/P of the sectors we track. The Fund’s Utilities holdings in the first quarter of 2017 allowed the Fund to perform well during this volatile timeframe. The volatility in oil, natural gas and other Energy-related commodities led to attractive valuations in the oil & gas exploration and production industry during the last quarter of the fiscal year. In response to these valuations, we sold the Utilities stocks which had served the Fund well during the first part of the year and increased our exposure to the oil & gas exploration and production industry. This increased exposure to oil & gas exploration and production helped the Fund outperform its sector-specific benchmark, although it detracted from performance relative to the broad benchmark. |
| Q. | How did the Fund’s composition affect performance? |
| A. | The Fund’s performance was buoyed by its underweight position in the oil & gas equipment & services industry, which returned –6.3% during the fiscal year. Although this industry comprised 15.4% of the Fund’s benchmark, the Fund on average held only 13.4% over the course of the 12-month period. Guided by our value methodology, the Fund found opportunities even within the oil & gas equipment & services industry. RPC, Inc., for example, was the single largest positive contributor to Fund performance, gaining over 48% during the fiscal year. The Fund’s Utilities sector holdings also contributed to its being able to outperform the benchmark. Over the course of the fiscal year, the Fund’s holding in the Utilities sector returned about 11.8%. National Fuel Gas Co., a gas utilities company, was one of the top contributors in this sector. |
The oil & gas exploration & production industry was the largest detractor to Fund performance relative to the benchmark at the industry level. Carrizo Oil & Gas, Inc. was the single largest detractor to the Fund’s relative performance in this industry, as the stock dropped 57.8% over the course of the fiscal year. |
| Q. | What is your investment outlook for the Energy sector? |
| A. | At the end of the fiscal year, the overall V/P ratio for the Energy sector was 0.92, while the V/P ratio for the overall market was 1.00. Still, we see opportunities at the industry level in spite of the sector’s low V/P. Oil & gas exploration & production, for example, has a V/P above 1.00 and improving forward-looking earnings per share. We continue to look for stabilization in forward-looking earnings (and otherwise) within the Energy sector and will reposition the Fund as our valuation methodology dictates. |
| Annual Report | September 30, 2017 | 11 | |
Table of Contents
| ICON Energy Fund | Management Overview | |
September 30, 2017 (Unaudited) |
Average Annual Total Return (as of September 30, 2017)
| Inception Date | 1 Year | 5 Years | 10 Years | Since Inception | Gross Expense Ratio* | Net Expense Ratio* | ||||||||
ICON Energy Fund - Class S | 11/5/97 | -0.44% | -2.43% | -1.19% | 8.01% | 1.44% | 1.44% | |||||||
ICON Energy Fund - Class C | 9/30/10 | -1.46% | -3.45% | N/A | -0.24% | 2.49% | 2.49% | |||||||
ICON Energy Fund - Class A | 9/30/10 | -0.76% | -2.71% | N/A | 0.53% | 1.73% | 1.73% | |||||||
ICON Energy Fund - Class A | 9/30/10 | -6.48% | -3.86% | N/A | -0.32% | 1.73% | 1.73% | |||||||
S&P 1500 Energy Index | -0.91% | 0.34% | 0.71% | 7.04% | N/A | N/A | ||||||||
S&P Composite 1500 Index | 18.61% | 14.29% | 7.63% | 7.36% | N/A | N/A |
Past performance is not a guarantee of future results. Information about these performance results and the comparative indexes can be found in the About This Report section. The Adviser has agreed to limit certain Fund expenses; without these limitations, returns would have been lower. The limitation provisions may be terminated in the future.
| * | Please see the most recent prospectus for details. |
Class C total returns exclude applicable sales charges. If sales charges were included returns would be lower.
Value of a $10,000 Investment (through September 30, 2017)
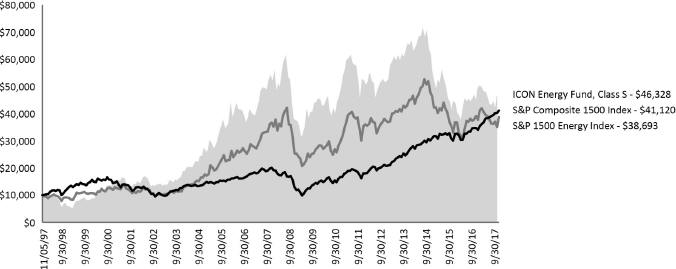
Past performance is not a guarantee of future results. The above graph compares a $10,000 investment made in the Fund’s Class S shares on the Class’ inception date of 11/5/97 to a $10,000 investment made in unmanaged securities indexes on that date. The Fund’s performance in this chart and the performance table assumes the reinvestment of dividends and capital gain distributions but does not reflect the deduction of taxes that a shareholder would pay on Fund distributions or on the redemption of Fund shares.
| 12 | www.iconfunds.com | |
Table of Contents
| ICON Energy Fund | Schedule of Investments | |
| September 30, 2017 |
| Shares or Principal Amount | Value | ||||
Common Stocks (97.85%) | ||||||
Construction & Engineering (1.91%) | ||||||
MasTec, Inc.(a) | 98,600 | $ 4,575,040 | ||||
| ||||||
Integrated Oil & Gas (19.96%) | ||||||
Chevron Corp. | 139,100 | 16,344,250 | ||||
Exxon Mobil Corp. | 291,800 | 23,921,764 | ||||
Suncor Energy, Inc. | 214,300 | 7,506,929 | ||||
| ||||||
| 47,772,943 | ||||||
| ||||||
Multi-Utilities (1.36%) | ||||||
CenterPoint Energy, Inc. | 111,200 | 3,248,152 | ||||
| ||||||
Oil & Gas Equipment & Services (12.29%) |
| |||||
RPC, Inc.(b) | 461,900 | 11,450,501 | ||||
Schlumberger, Ltd. | 143,950 | 10,041,952 | ||||
U.S. Silica Holdings, Inc. | 254,800 | 7,916,636 | ||||
| ||||||
| 29,409,089 | ||||||
| ||||||
Oil & Gas Exploration & Production (51.99%) | ||||||
Antero Resources Corp.(a) | 155,800 | 3,100,420 | ||||
Cabot Oil & Gas Corp. | 325,600 | 8,709,800 | ||||
Carrizo Oil & Gas, Inc.(a)(b) | 419,100 | 7,179,183 | ||||
Chesapeake Energy | 1,302,850 | 5,602,255 | ||||
Cimarex Energy Co. | 93,900 | 10,673,613 | ||||
Continental Resources, | 62,350 | 2,407,333 | ||||
Diamondback Energy, | 145,250 | 14,228,690 | ||||
EOG Resources, Inc. | 24,700 | 2,389,478 | ||||
EQT Corp. | 71,800 | 4,684,232 | ||||
Gulfport Energy Corp.(a) | 628,400 | 9,011,256 | ||||
Laredo Petroleum, Inc.(a)(b) | 483,150 | 6,247,130 | ||||
Matador Resources Co.(a) | 255,100 | 6,925,965 | ||||
Newfield Exploration Co.(a) | 327,400 | 9,713,958 | ||||
Parsley Energy, Inc., | 183,400 | 4,830,756 | ||||
Range Resources Corp. | 147,000 | 2,876,790 | ||||
Ring Energy, Inc.(a) | 490,800 | 7,111,692 | ||||
Southwestern Energy | 1,031,100 | 6,300,021 | ||||
SRC Energy, Inc.(a) | 1,288,350 | 12,458,345 | ||||
| ||||||
| 124,450,917 | ||||||
| ||||||
Oil & Gas Refining & Marketing (5.57%) |
| |||||
Andeavor | 63,900 | 6,591,285 | ||||
HollyFrontier Corp. | 187,900 | 6,758,763 | ||||
| ||||||
| 13,350,048 | ||||||
| ||||||
Oil & Gas Storage & Transportation (4.77%) | ||||||
Magellan Midstream Partners LP | 74,000 | 5,258,440 | ||||
Teekay LNG Partners LP | 345,508 | 6,150,042 | ||||
| 11,408,482 | ||||||
| ||||||
| Total Common Stocks (Cost $227,633,718) | 234,214,671 | |||||
| ||||||
| Shares or Principal Amount | Value | ||||
Collateral for Securities on Loan (7.65%) | ||||||
State Street Navigator Securities Lending Government Money Market Portfolio, 7-Day Yield 1.01% | 18,303,527 | $ 18,303,527 | ||||
| ||||||
Total Collateral for Securities on Loan (Cost $18,303,527) | 18,303,527 | |||||
| ||||||
| Total Investments (105.50%) (Cost $245,937,245) | $252,518,198 | |||||
| Liabilities Less Other Assets (-5.50%) | (13,165,827) | |||||
| ||||||
| Net Assets (100.00%) | $239,352,371 | |||||
| ||||||
| (a) | Non-income producing security. |
| (b) | All or a portion of the security was on loan as of September 30, 2017. |
Sector Composition (September 30, 2017) |
| |||
Energy | 94.58% | |||
Industrials | 1.91% | |||
Utilities | 1.36% | |||
|
| |||
| 97.85% | ||||
|
| |||
Percentages are based upon common stocks as a percentage of net assets.
Industry Composition (September 30, 2017) |
| |||
Oil & Gas Exploration & Production | 51.99% | |||
Integrated Oil & Gas | 19.96% | |||
Oil & Gas Equipment & Services | 12.29% | |||
Oil & Gas Refining & Marketing | 5.57% | |||
Oil & Gas Storage & Transportation | 4.77% | |||
Construction & Engineering | 1.91% | |||
Multi-Utilities | 1.36% | |||
|
| |||
| 97.85% | ||||
|
| |||
Percentages are based upon common stocks as a percentage of net assets.
The accompanying notes are an integral part of the financial statements.
| ||
| Annual Report | September 30, 2017 | 13 | |
Table of Contents
| ICON Financial Fund | Management Overview | |
| September 30, 2017 (Unaudited) |
| Q. | How did the Fund perform relative to its benchmarks? |
| A. | The ICON Financial Fund (the Fund) Class S returned 30.96% for the fiscal year ending September 30, 2017, lagging its sector-specific benchmark, the S&P 1500 Financials Index, which returned 35.21%. The Fund outperformed its broad benchmark, the S&P Composite 1500 Index, which returned 18.61%. Total returns for other periods and additional Class shares as of September 30, 2017, appear in the subsequent pages of this Fund’s Management Overview. |
| Q. | What primary factors were behind the Fund’s relative performance? |
| A. | In the wake of the presidential election, markets surged as many investors anticipated an administration that would be aggressively pro-growth and infrastructure-oriented. The Financials sector was a beneficiary of this “Trump trade” and investors welcomed an environment they believed would see a rise in interest rates and a reduction in banking and other financial regulations. While the regulatory environment remains uncertain, the 10 year U.S. Treasury Note, which is particularly influential in loan rates commercial banks charge their customers, went from 1.86% the day before the election to over 2.50% a month later, before declining to 2.33% by fiscal year end. . Rising interest rates and the potential for a more finance- and banking-friendly regulatory environment contributed to gains in the diversified banks industry, which was the second best performing industry in the Financials sector over the fiscal year. We held within the limits permitted by law, but were unable to capitalize on the considerable value we saw in the diversified banks industry because we could not legally increase the Fund’s exposure. Favorable valuations also led us to holdings in the consumer finance industry, which likewise contributed positively to Fund performance. Insurance companies continue to face challenges with claims filed in the wake of Hurricanes Harvey and Irma in August. We were overweight the property & casualty insurance and multi-line insurance industries and the Fund was negatively impacted by as a result of the storms. |
The leadership in the Financials sector made sense to us given its value-to-price (V/P) ratio of 1.35 at the start of the fiscal year – the highest V/P (suggesting the highest potential upside) among all the sectors we track. |
| Q. | How did the Fund’s composition affect performance? |
| A. | The Fund benefitted from its holdings in the financial exchanges & data industry. Over the course of the fiscal year, MSCI, Inc., a provider of financial indices and portfolio analysis tools, returned around 46% within the Fund. Additional gains came from the Fund’s holdings in the life & health insurance industry. |
The biggest detractor to Fund performance relative to the benchmark was the Fund’s exposure to the property & casualty insurance industry. The Fund’s positions in this industry fell over 8% during the course of the fiscal year while the S&P 1500 Property & Casualty Insurance Industry Index gained almost 1%. Much of this underperformance can be explained by the Fund’s holding AmTrust Financial Services, Inc. (AFSI), which fell over 19% on February 22, 2017, on the announcement that it had identified “material weaknesses in [its] internal control over financial reporting.” AFSI’s stock price fell again when the company delayed reporting its earnings less than a month later. The Fund’s cash position, though small, likewise had a negative impact. |
| Q. | What is your investment outlook for the Financials sector? |
| A. | As of September 30, 2017, the Financials sector has a V/P ratio of 1.13, suggesting considerable upside potential, while ICON’s overall market V/P stands at 1.00. We see several bargains at the industry level. By way of example, we are overweight the thrifts & diversified banks industry, which has a V/P of 1.41 at fiscal year end. As always, and guided by value, we will continue to look for opportunities in the Financials sector. |
| 14 | www.iconfunds.com | |
Table of Contents
| ICON Financial Fund | Management Overview | |
| September 30, 2017 (Unaudited) |
Average Annual Total Return (as of September 30, 2017)
| Inception Date | 1 Year | 5 Years | 10 Years | Since Inception | Gross Expense Ratio* | Net Expense Ratio* | ||||||||
ICON Financial Fund - Class S | 7/1/97 | 30.96% | 11.54% | -1.08% | 4.53% | 1.56% | 1.56% | |||||||
ICON Financial Fund - Class A | 9/30/10 | 30.68% | 11.21% | N/A | 9.23% | 2.28% | 1.91% | |||||||
ICON Financial Fund - Class A | 9/30/10 | 23.05% | 9.87% | N/A | 8.29% | 2.28% | 1.91% | |||||||
S&P 1500 Financials Index | 35.21% | 17.47% | 2.10% | 5.56% | N/A | N/A | ||||||||
S&P Composite 1500 Index | 18.61% | 14.29% | 7.63% | 7.61% | N/A | N/A |
Past performance is not a guarantee of future results. Information about these performance results and the comparative indexes can be found in the About This Report section. The Adviser has agreed to limit certain Fund expenses; without these limitations, returns would have been lower. The limitation provisions may be terminated in the future.
| * | Please see the most recent prospectus for details. |
Value of a $10,000 Investment (through September 30, 2017)
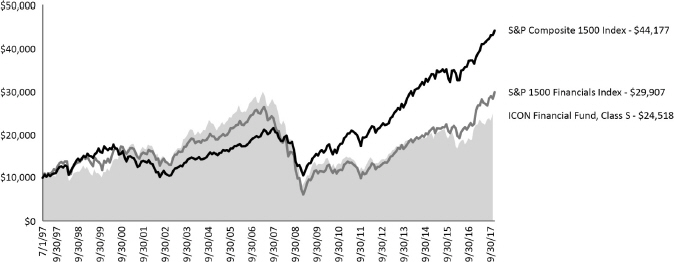
Past performance is not a guarantee of future results. The above graph compares a $10,000 investment made in the Fund’s Class S shares on the Class’ inception date of 7/1/97 to a $10,000 investment made in unmanaged securities indexes on that date. The Fund’s performance in this chart and the performance table assumes the reinvestment of dividends and capital gain distributions but does not reflect the deduction of taxes that a shareholder would pay on Fund distributions or on the redemption of Fund shares.
| Annual Report | September 30, 2017 | 15 | |
Table of Contents
| ICON Financial Fund | Schedule of Investments | |
| September 30, 2017 |
| Shares or Principal Amount | Value | |||||||
Common Stocks (98.63%) | ||||||||
Asset Management & Custody Banks (6.26%) |
| |||||||
Ameriprise Financial, Inc. | 5,600 | $ | 831,656 | |||||
Financial Engines, Inc. | 23,800 | 827,050 | ||||||
State Street Corp. | 9,600 | 917,184 | ||||||
|
| |||||||
| 2,575,890 | ||||||||
|
| |||||||
Consumer Finance (7.58%) |
| |||||||
Ally Financial, Inc. | 34,100 | 827,266 | ||||||
American Express Co. | 12,400 | 1,121,704 | ||||||
Discover Financial Services | 18,200 | 1,173,536 | ||||||
|
| |||||||
| 3,122,506 | ||||||||
|
| |||||||
Diversified Banks (36.64%) |
| |||||||
Bank of America Corp. | 156,200 | 3,958,108 | ||||||
Citigroup, Inc. | 46,300 | 3,367,862 | ||||||
JPMorgan Chase & Co. | 43,300 | 4,135,583 | ||||||
U.S. Bancorp | 27,600 | 1,479,084 | ||||||
Wells Fargo & Co. | 39,000 | 2,150,850 | ||||||
|
| |||||||
| 15,091,487 | ||||||||
|
| |||||||
Financial Exchanges & Data (1.96%) |
| |||||||
MSCI, Inc. | 6,900 | 806,610 | ||||||
|
| |||||||
Investment Banking & Brokerage (7.47%) |
| |||||||
BGC Partners, Inc., | 36,200 | 523,814 | ||||||
Goldman Sachs Group, Inc. | 5,600 | 1,328,264 | ||||||
Morgan Stanley | 25,500 | 1,228,335 | ||||||
|
| |||||||
| 3,080,413 | ||||||||
|
| |||||||
Life & Health Insurance (4.56%) |
| |||||||
CNO Financial Group, Inc. | 29,000 | 676,860 | ||||||
Prudential Financial, Inc. | 5,100 | 542,232 | ||||||
Sun Life Financial, Inc. | 16,500 | 657,030 | ||||||
|
| |||||||
| 1,876,122 | ||||||||
|
| |||||||
Multi-line Insurance (3.49%) |
| |||||||
American International Group, Inc. | 23,400 | 1,436,526 | ||||||
|
| |||||||
Other Diversified Financial Services (2.24%) |
| |||||||
Voya Financial, Inc. | 23,100 | 921,459 | ||||||
|
| |||||||
Property & Casualty Insurance (5.20%) |
| |||||||
Stewart Information Services Corp. | 10,900 | 411,584 | ||||||
United Insurance Holdings Corp. | 57,400 | 935,620 | ||||||
XL Group, Ltd. | 20,200 | 796,890 | ||||||
|
| |||||||
| 2,144,094 | ||||||||
|
| |||||||
Regional Banks (16.75%) |
| |||||||
Bank of the Ozarks, Inc. | 17,500 | 840,875 | ||||||
Comerica, Inc. | 13,300 | 1,014,258 | ||||||
Fifth Third Bancorp | 32,600 | 912,148 | ||||||
First Commonwealth Financial Corp. | 56,800 | 802,584 | ||||||
First Horizon National | 24,000 | 459,600 | ||||||
First Midwest Bancorp, | 46,200 | 1,082,004 | ||||||
KeyCorp | 57,100 | 1,074,622 | ||||||
| Shares or Principal Amount | Value | |||||||
Regional Banks (continued) |
| |||||||
Webster Financial Corp. | 13,600 | $ | 714,680 | |||||
|
| |||||||
| 6,900,771 | ||||||||
|
| |||||||
Thrifts & Mortgage Finance (6.48%) |
| |||||||
BofI Holding, Inc.(a)(b) | 17,500 | 498,225 | ||||||
Essent Group, Ltd.(a) | 26,800 | 1,085,400 | ||||||
HomeStreet, Inc.(a) | 20,000 | 540,000 | ||||||
Radian Group, Inc. | 29,300 | 547,617 | ||||||
|
| |||||||
| 2,671,242 | ||||||||
|
| |||||||
Total Common Stocks (Cost $33,648,452) | 40,627,120 | |||||||
|
| |||||||
Collateral for Securities on Loan (1.24%) |
| |||||||
State Street Navigator Securities Lending Government Money Market Portfolio, 7-Day Yield 1.01% | 511,875 | 511,875 | ||||||
|
| |||||||
Total Collateral for Securities on Loan (Cost $511,875) |
| 511,875 | ||||||
|
| |||||||
Total Investments (99.87%) (Cost $34,160,327) | $ | 41,138,995 | ||||||
Other Assets Less Liabilities (0.13%) |
| 52,178 | ||||||
|
| |||||||
Net Assets (100.00%) | $ | 41,191,173 | ||||||
|
| |||||||
| (a) | Non-income producing security. |
| (b) | All or a portion of the security was on loan as of September 30, 2017. |
| Sector Composition (September 30, 2017) | ||||
| Financial | 98.63% | |||
|
| |||
| 98.63% | ||||
|
| |||
Percentages are based upon common stocks as a percentage of net assets.
The accompanying notes are an integral part of the financial statements.
| ||
| 16 | www.iconfunds.com | |
Table of Contents
| ICON Financial Fund | Schedule of Investments | |
| September 30, 2017 |
| Industry Composition (September 30, 2017) | ||||
Diversified Banks | 36.64% | |||
Regional Banks | 16.75% | |||
Consumer Finance | 7.58% | |||
Investment Banking & Brokerage | 7.47% | |||
Thrifts & Mortgage Finance | 6.48% | |||
Asset Management & Custody Banks | 6.26% | |||
Property & Casualty Insurance | 5.20% | |||
Life & Health Insurance | 4.56% | |||
Multi-line Insurance | 3.49% | |||
Other Diversified Financial Services | 2.24% | |||
Financial Exchanges & Data | 1.96% | |||
|
| |||
| 98.63% | ||||
|
| |||
Percentages are based upon common stocks as a percentage of net assets.
The accompanying notes are an integral part of the financial statements.
| ||
| Annual Report | September 30, 2017 | 17 | |
Table of Contents
| ICON Healthcare Fund | Management Overview | |
| September 30, 2017 (Unaudited) |
| Q. | How did the Fund perform relative to its benchmarks? |
| A. | The ICON Healthcare Fund Class S (the Fund) returned 11.94% for the fiscal year ended September 30, 2017, under-performing its sector-specific benchmark, the S&P 1500 Health Care Index, which returned 15.94%, and under-performing its broad benchmark, the S&P Composite 1500 Index, which returned 18.61%. Total returns for other periods and additional Class shares as of September 30, 2017 appear in the subsequent pages of this Fund’s Management Overview. |
| Q. | What primary factors were behind the Fund’s relative performance? |
| A. | The broad equity market began the past fiscal year with losses, as investors became increasingly concerned with matters surrounding the United States presidential election in November and the implied influences it may have had on capital markets. These worries quickly abated, however, as equities began a nearly uninterrupted rally after Election Day, ending the fiscal year at all-time highs on many market indexes. The Health Care sector showed modest upside to our estimation of fair value for most of the year, oscillating between periods of overvaluation and undervaluation according to the ICON methodology. During these periods of low valuation readings, the Fund held a cash position for defensive purposes, which detracted from relative returns as the Health Care sector moved higher. |
The Health Care sector dealt with a number of its own unique challenges, although most are not new and have been points of concern with investors for many years. The pharmaceuticals industry faced increased scrutiny from the incoming presidential administration, citing issues related to drug pricing. Our valuation system favored this industry, particularly those smaller companies focusing on specialty or generic drugs. Those companies ultimately saw losses throughout the year as concerns about future earnings growth and balance sheet health weighed on these shares, ultimately detracting from relative performance.
Generic pricing pressures also affected the health care distributor industry, as a deflationary environment weighed on earnings and investor sentiment. This industry was the worst performing group in the Health Care sector for this year, and provided positive relative performance as The Fund was able to avoid these losses by maintaining an underweight position.
The sector has also dealt with implications of the potential repeal or replacement of the Affordable Care Act. Despite multiple failed attempts by Congress to pass new legislation, the possibility for broad change looms over the sector. While the public health insurance exchanges have floundered, companies in the managed health care industry have been the ultimate near-term beneficiaries. Managed health care was the sector’s highest performing industry. We saw better value in the pharmaceuticals industry, however, which ultimately led to the Fund’s holding an underweight position in managed health care for much of the year, detracting from relative performance.
| Q. | What were the Fund’s greatest contributors/detractors? |
| A. | Health care services was the greatest contributor to the Fund’s performance relative to the benchmark during the fiscal year, as performance was buoyed by individual stock selection within the industry. BioTelemetry, Inc. was the primary contributor, posting high returns while the industry as a whole suffered losses. Additionally, the health care equipment industry was a positive contributor to the Fund’s relative performance, with companies like Cutera, Inc. and Boston Scientific Corp. providing gains to this industry’s returns. |
The pharmaceutical industry was the Fund’s largest detractor to relative performance. Specifically, stock selection associated with the specialty and generic pharmaceutical companies within the industry had a negative effect on performance as Mallinckrodt PLC, Endo International PLC, Teva Pharmaceuticals, Ltd., and Mylan NV detracted from relative returns. Additionally, and as previously noted, the managed health care industry was a detractor from relative performance as the Fund was underweight this strong performing industry in favor of opportunities in the pharmaceuticals and biotechnology industries for the year.
| Q. | What is your investment outlook for the Health Care sector? |
| A. | After positive returns for most of the past fiscal year, the Health Care sector has an overall average value-to-price (V/P) ratio of 1.02 according to our methodology. In other words, and generally speaking, we believe stocks in the Health Care sector are worth approximately 2% more than where they are currently trading. We currently see modest value across much of the sector, most notably in the pharmaceuticals and managed health care industries. Overall, innovation, strategic execution, and mergers and acquisitions activity continue to shape this sector’s ever-changing landscape. As always, we look to value as our primary guide and will adjust our positioning as market conditions dictate. |
| 18 | www.iconfunds.com | |
Table of Contents
| ICON Healthcare Fund | Management Overview | |
| September 30, 2017 (Unaudited) |
Average Annual Total Return (as of September 30, 2017)
| Inception Date | 1 Year | 5 Years | 10 Years | Since Inception | Gross Expense Ratio* | Net Expense Ratio* | ||||||||||
ICON Healthcare Fund - Class S | 2/24/97 | 11.94% | 16.20% | 9.01% | 10.53% | 1.44% | 1.44% | |||||||||
ICON Healthcare Fund - Class A | 9/30/10 | 11.58% | 15.79% | N/A | 16.34% | 1.79% | 1.75% | |||||||||
ICON Healthcare Fund - Class A | 9/30/10 | 5.13% | 14.43% | N/A | 15.36% | 1.79% | 1.75% | |||||||||
S&P 1500 Health Care Index | 15.94% | 17.57% | 11.19% | 9.69% | N/A | N/A | ||||||||||
S&P Composite 1500 Index | 18.61% | 14.29% | 7.63% | 8.00% | N/A | N/A | ||||||||||
Past performance is not a guarantee of future results. Information about these performance results and the comparative indexes can be found in the About This Report section. The Adviser has agreed to limit certain Fund expenses; without these limitations, returns would have been lower. The limitation provisions may be terminated in the future.
| * | Please see the most recent prospectus for details. |
Value of a $10,000 Investment (through September 30, 2017)
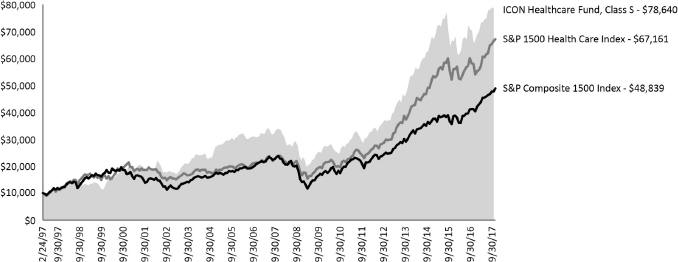
Past performance is not a guarantee of future results. The above graph compares a $10,000 investment made in the Fund’s Class S shares on the Class’ inception date of 2/24/97 to a $10,000 investment made in unmanaged securities indexes on that date. The Fund’s performance in this chart and the performance table assumes the reinvestment of dividends and capital gain distributions but does not reflect the deduction of taxes that a shareholder would pay on Fund distributions or on the redemption of Fund shares.
| Annual Report | September 30, 2017 | 19 | |
Table of Contents
| ICON Healthcare Fund | Schedule of Investments | |
| September 30, 2017 |
| Shares or Principal Amount | Value | ||||||
Common Stocks (96.23%) | ||||||||
Biotechnology (30.96%) | ||||||||
AbbVie, Inc. | 41,600 | $ | 3,696,576 | |||||
Alexion Pharmaceuticals, | 34,000 | 4,769,860 | ||||||
Biogen, Inc.(a) | 5,700 | 1,784,784 | ||||||
Celgene Corp.(a) | 28,800 | 4,199,616 | ||||||
Emergent BioSolutions, Inc.(a) | 41,500 | 1,678,675 | ||||||
Exelixis, Inc.(a) | 32,000 | 775,360 | ||||||
Regeneron Pharmaceuticals, Inc.(a) | 3,000 | 1,341,360 | ||||||
Shire PLC, ADR | 31,100 | 4,762,654 | ||||||
Vertex Pharmaceuticals, Inc.(a) | 26,253 | 3,991,506 | ||||||
|
| |||||||
| 27,000,391 | ||||||||
|
| |||||||
Health Care Equipment (14.42%) | ||||||||
Abbott Laboratories | 46,300 | 2,470,568 | ||||||
Becton, Dickinson and Co. | 4,500 | 881,775 | ||||||
Boston Scientific Corp.(a) | 92,200 | 2,689,474 | ||||||
Cutera, Inc.(a) | 52,310 | 2,163,019 | ||||||
Edwards Lifesciences Corp.(a) | 13,100 | 1,431,961 | ||||||
Hill-Rom Holdings, Inc. | 5,800 | 429,200 | ||||||
Medtronic PLC | 10,946 | 851,270 | ||||||
NuVasive, Inc.(a) | 6,500 | 360,490 | ||||||
Zimmer Biomet Holdings, Inc. | 11,200 | 1,311,408 | ||||||
|
| |||||||
| 12,589,165 | ||||||||
|
| |||||||
Health Care Facilities (4.10%) | ||||||||
HCA Healthcare, Inc.(a) | 22,600 | 1,798,734 | ||||||
Universal Health Services, Inc., Class B | 16,000 | 1,775,040 | ||||||
|
| |||||||
| 3,573,774 | ||||||||
|
| |||||||
Health Care Services (9.10%) | ||||||||
BioTelemetry, Inc.(a) | 134,997 | 4,454,901 | ||||||
Envision Healthcare Corp.(a) | 20,000 | 899,000 | ||||||
Premier, Inc., Class A(a) | 79,132 | 2,577,329 | ||||||
|
| |||||||
| 7,931,230 | ||||||||
|
| |||||||
Life Sciences Tools & Services (7.05%) | ||||||||
INC Research Holdings, Inc., Class A(a) | 1,600 | 83,680 | ||||||
PRA Health Sciences, Inc.(a) | 40,500 | 3,084,885 | ||||||
Thermo Fisher Scientific, Inc. | 15,700 | 2,970,440 | ||||||
|
| |||||||
| 6,139,005 | ||||||||
|
| |||||||
Managed Health Care (12.17%) | ||||||||
Aetna, Inc. | 6,056 | 962,965 | ||||||
Anthem, Inc. | 6,900 | 1,310,172 | ||||||
Cigna Corp. | 6,300 | 1,177,722 | ||||||
Humana, Inc. | 5,400 | 1,315,602 | ||||||
UnitedHealth Group, Inc. | 29,900 | 5,855,915 | ||||||
|
| |||||||
| 10,622,376 | ||||||||
|
| |||||||
Pharmaceuticals (18.43%) | ||||||||
Allergan PLC | 18,400 | 3,771,080 | ||||||
Bristol-Myers Squibb Co. | 14,000 | 892,360 | ||||||
Eli Lilly & Co. | 21,200 | 1,813,448 | ||||||
Jazz Pharmaceuticals PLC(a) | 23,300 | 3,407,625 | ||||||
Merck & Co., Inc. | 83,000 | 5,314,490 | ||||||
| Shares or Principal Amount | Value | ||||||
Pharmaceuticals (continued) | ||||||||
Mylan NV(a) | 28,000 | $ | 878,360 | |||||
|
| |||||||
| 16,077,363 | ||||||||
|
| |||||||
Total Common Stocks (Cost $78,276,022) | 83,933,304 | |||||||
|
| |||||||
Total Investments (96.23%) (Cost $78,276,022) | $ | 83,933,304 | ||||||
|
| |||||||
Other Assets Less Liabilities (3.77%) | 3,289,117 | |||||||
|
| |||||||
Net Assets (100.00%) | $ | 87,222,421 | ||||||
|
| |||||||
| (a) | Non-income producing security. |
ADR - American Depositary Receipt
Sector Composition (September 30, 2017) | ||||
Health Care | 96.23% | |||
|
| |||
| 96.23% | ||||
|
| |||
Percentages are based upon common stocks as a percentage of net assets.
Industry Composition (September 30, 2017) | ||||
Biotechnology | 30.96% | |||
Pharmaceuticals | 18.43% | |||
Health Care Equipment | 14.42% | |||
Managed Health Care | 12.17% | |||
Health Care Services | 9.10% | |||
Life Sciences Tools & Services | 7.05% | |||
Health Care Facilities | 4.10% | |||
|
| |||
| 96.23% | ||||
|
| |||
Percentages are based upon common stocks as a percentage of net assets.
The accompanying notes are an integral part of the financial statements.
| ||
| 20 | www.iconfunds.com | |
Table of Contents
| ICON Industrials Fund | Management Overview | |
| September 30, 2017 (Unaudited) |
| Q. | How did the Fund perform relative to its benchmarks? |
| A. | The ICON Industrials Fund (the Fund) Class S shares returned 22.10% for the fiscal year ended September 30, 2017, while its sector-specific benchmark, the S&P 1500 Industrials Index, returned 22.98%, and the S&P Composite 1500 Index returned 18.61%. Total returns for other periods and additional Class shares as of September 30, 2017, appear in the subsequent pages of this Fund’s Management Overview. |
| Q. | What primary factors were behind the Fund’s relative performance? |
| A. | From a valuation standpoint, we began the period with a value-to-price (V/P) ratio of 1.02 for the Industrials sector. Under our system, this V/P indicates the sector is trading relatively close to fair value. In spite of these muted return expectations, the sector produced strong gains over the course of the fiscal year as investors anticipated an increase in infrastructure-based projects and a general economic rebound. The first quarter of the fiscal year began with a strong broad market move driven largely by gains that took place at the conclusion of the presidential election. The Industrials sector was one of the largest beneficiaries of this rally, with industries tied to employment growth, manufacturing gains, and construction leading the way. The remainder of the fiscal year saw continued sector gains with relatively similar industry leadership and one noticeable addition: the aerospace & defense industry. The aerospace & defense industry was the second strongest performing industry within the Industrials sector, producing returns in excess of 40%. Companies in this industry tend to derive revenues from ties to commercial airliners and through governmental contracts for both aircraft and defense uses. |
Overall, the Fund’s holdings performed well relative to the benchmark during the fiscal year largely because of strong stock selections. Due to low valuation readings, however, the Fund held a larger than normal cash position, which detracted from relative returns during the strong market move.
| Q. | How did the Fund’s composition affect performance? |
| A. | Industry-level returns within the Industrials sector varied significantly, from approximately +129% (security & alarm services) to approximately -24% (marine), demonstrating the large role that industry rotation can play in sector investing. Additionally, sector returns were relatively broad-based, with 15 of 22 industries producing double digit gains. |
Relative to the benchmark, positive industry contributors to the Fund’s performance include aerospace & defense, diversified support services, trading companies & distributors, human resources & employment services, and industrial conglomerates. All of these industries produced positive total effect due to overweight industry positions or outperforming holdings.
Relative to the benchmark, industries that detracted most from the Fund’s performance include trucking, research & consulting services, electrical components & equipment, industrial machinery, and office services & supplies. Either overweight positions or underperforming holdings in these industries resulted in relative underperformance during the fiscal year.
| Q. | What is your investment outlook for the Industrials sector? |
| A. | At the end of fiscal year 2017, the Industrials sector had a V/P ratio of 1.00, an indication that our system sees the Industrials sector as trading right in line with fair value. While broad sector valuations indicate muted return expectations, individual industries (specifically railroads, service based industries, and industrial machinery) continue to show opportunity under our system. Additionally, as our valuation metric takes into account forward looking earnings expectations, the “fair value” of each industry within the sector could be an upward moving target if we see continued growth and economic expansion. As always, we look for industries that our system identifies as trading at a discount to fair value. Guided by our disciplined, systematic and non-emotional approach to investing, we remain vigilant for prospective investments, ready to reallocate and adapt as our investment system dictates. |
| Annual Report | September 30, 2017 | 21 | |
Table of Contents
| ICON Industrials Fund | Management Overview | |
| September 30, 2017 (Unaudited) |
Average Annual Total Return (as of September 30, 2017)
| Inception Date | 1 Year | 5 Years | 10 Years | Since Inception | Gross Expense Ratio* | Net Expense Ratio* | ||||||||||||||||||||||||||||
ICON Industrials Fund - Class S | 5/9/97 | 22.10 | % | 13.07 | % | 4.39 | % | 5.91 | % | 1.73 | % | 1.50% | |||||||||||||||||||||||
ICON Industrials Fund - Class A | 9/30/10 | 21.83 | % | 12.83 | % | N/A | 10.58 | % | 2.96 | % | 1.75% | ||||||||||||||||||||||||
ICON Industrials Fund - Class A (including maximum sales charge of 5.75%) | 9/30/10 | 14.83 | % | 11.51 | % | N/A | 9.64 | % | 2.96 | % | 1.75% | ||||||||||||||||||||||||
S&P 1500 Industrials Index | 22.98 | % | 16.44 | % | 7.87 | % | 8.54 | % | N/A | N/A | |||||||||||||||||||||||||
S&P Composite 1500 Index | 18.61 | % | 14.29 | % | 7.63 | % | 7.98 | % | N/A | N/A | |||||||||||||||||||||||||
Past performance is not a guarantee of future results. Information about these performance results and the comparative indexes can be found in the About This Report section. The Adviser has agreed to limit certain Fund expenses; without these limitations, returns would have been lower. The limitation provisions may be terminated in the future.
| * | Please see the most recent prospectus for details. |
Value of a $10,000 Investment (through September 30, 2017)
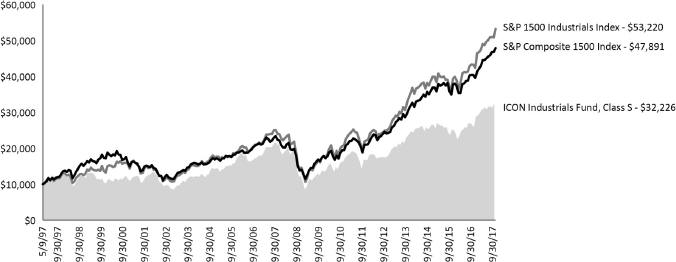
Past performance is not a guarantee of future results. The above graph compares a $10,000 investment made in the Fund’s Class S shares on the Class’ inception date of 5/9/97 to a $10,000 investment made in unmanaged securities indexes on that date. The Fund’s performance in this chart and the performance table assumes the reinvestment of dividends and capital gain distributions but does not reflect the deduction of taxes that a shareholder would pay on Fund distributions or on the redemption of Fund shares.
| 22 | www.iconfunds.com | |
Table of Contents
| ICON Industrials Fund | Schedule of Investments | |
| September 30, 2017 |
| Shares or Principal Amount | Value | ||||
Common Stocks (95.88%) | ||||||
Aerospace & Defense (7.68%) | ||||||
Hexcel Corp. | 5,000 | $ | 287,100 | |||
Orbital ATK, Inc. | 1,890 | 251,673 | ||||
Raytheon Co. | 1,100 | 205,238 | ||||
Rockwell Collins, Inc. | 775 | 101,300 | ||||
Spirit AeroSystems Holdings, Inc., Class A | 3,500 | 272,020 | ||||
TransDigm Group, Inc. | 1,000 | 255,650 | ||||
|
| |||||
| 1,372,981 | ||||||
|
| |||||
Airlines (3.03%) | ||||||
Alaska Air Group, Inc. | 7,100 | 541,517 | ||||
|
| |||||
Building Products (27.93%) | ||||||
Armstrong World Industries, Inc.(a) | 5,000 | 256,250 | ||||
Builders FirstSource, | 33,100 | 595,469 | ||||
Fortune Brands Home & Security, Inc. | 16,500 | 1,109,295 | ||||
Johnson Controls International PLC | 38,000 | 1,531,020 | ||||
Masco Corp. | 26,500 | 1,033,765 | ||||
Quanex Building Products Corp. | 20,500 | 470,475 | ||||
|
| |||||
| 4,996,274 | ||||||
|
| |||||
Commercial Printing (7.44%) | ||||||
Deluxe Corp. | 16,700 | 1,218,432 | ||||
InnerWorkings, Inc.(a) | 10,000 | 112,500 | ||||
|
| |||||
| 1,330,932 | ||||||
|
| |||||
Construction & Engineering (10.16%) | ||||||
Comfort Systems U.S.A., Inc. | 14,500 | 517,650 | ||||
Dycom Industries, Inc.(a) | 6,500 | 558,220 | ||||
MasTec, Inc.(a) | 16,000 | 742,400 | ||||
|
| |||||
| 1,818,270 | ||||||
|
| |||||
Construction Machinery & Heavy Trucks (3.15%) | ||||||
Allison Transmission Holdings, Inc. | 15,000 | 562,950 | ||||
|
| |||||
Electrical Components & Equipment (0.96%) | ||||||
Acuity Brands, Inc. | 1,000 | �� | 171,280 | |||
|
| |||||
Human Resource & Employment Services (1.65%) | ||||||
Korn/Ferry International | 3,000 | 118,290 | ||||
ManpowerGroup, Inc. | 1,500 | 176,730 | ||||
|
| |||||
| 295,020 | ||||||
|
| |||||
Industrial Conglomerates (13.19%) | ||||||
Carlisle Cos., Inc. | 7,000 | 702,030 | ||||
General Electric Co. | 61,000 | 1,474,980 | ||||
Honeywell International, Inc. | 1,300 | 184,262 | ||||
|
| |||||
| 2,361,272 | ||||||
|
| |||||
Industrial Machinery (7.03%) | ||||||
Middleby Corp.(a) | 4,000 | 512,680 | ||||
Snap-on, Inc. | 5,000 | 745,050 | ||||
|
| |||||
| 1,257,730 | ||||||
|
| |||||
| Shares or Principal Amount | Value | ||||
Office Services & Supplies (2.32%) | ||||||
HNI Corp. | 10,000 | $ | 414,700 | |||
|
| |||||
Railroads (6.54%) | ||||||
Canadian Pacific Railway, Ltd. | 4,700 | 789,741 | ||||
Kansas City Southern | 3,500 | 380,380 | ||||
|
| |||||
| 1,170,121 | ||||||
|
| |||||
Trading Companies & Distributors (4.80%) | ||||||
Air Lease Corp. | 12,000 | 511,440 | ||||
United Rentals, Inc.(a) | 2,500 | 346,850 | ||||
|
| |||||
| 858,290 | ||||||
|
| |||||
Total Common Stocks (Cost $15,614,496) | 17,151,337 | |||||
|
| |||||
Total Investments (95.88%) (Cost $15,614,496) | $ | 17,151,337 | ||||
Other Assets Less Liabilities (4.12%) | 736,195 | |||||
|
| |||||
Net Assets (100.00%) | $ | 17,887,532 | ||||
|
| |||||
| (a) | Non-income producing security. |
Sector Composition (September 30, 2017) | ||||
Industrials | 95.88% | |||
|
| |||
| 95.88% | ||||
|
| |||
Percentages are based upon common stocks as a percentage of net assets.
Industry Composition (September 30, 2017) | ||||
Building Products | 27.93% | |||
Industrial Conglomerates | 13.19% | |||
Construction & Engineering | 10.16% | |||
Aerospace & Defense | 7.68% | |||
Commercial Printing | 7.44% | |||
Industrial Machinery | 7.03% | |||
Railroads | 6.54% | |||
Trading Companies & Distributors | 4.80% | |||
Construction Machinery & Heavy Trucks | 3.15% | |||
Airlines | 3.03% | |||
Office Services & Supplies | 2.32% | |||
Human Resource & Employment Services | 1.65% | |||
Other Industries (each less than 1%) | 0.96% | |||
|
| |||
| 95.88% | ||||
|
| |||
Percentages are based upon common stocks as a percentage of net assets.
The accompanying notes are an integral part of the financial statements.
| ||
| Annual Report | September 30, 2017 | 23 | |
Table of Contents
| ICON Information Technology Fund | Management Overview | |
| September 30, 2017 (Unaudited) |
| Q. | How did the Fund perform relative to its benchmarks? |
| A. | The ICON Information Technology Fund (the Fund), Class S shares, returned 29.46% for the fiscal year ended September 30, 2017, while its sector-specific benchmark, the S&P 1500 Information Technology Index, returned 28.63%, and the S&P Composite 1500 Index gained 18.61%. Total returns for other periods and additional Class shares as of September 30, 2017, appear in the subsequent pages of this Fund’s Management Overview. |
| Q. | What primary factors were behind the Fund’s relative performance? |
| A. | As fiscal year 2017 began, the Information Technology sector had a value-to-price (V/P) ratio of 1.09 under the ICON system, meaning we believed the sector’s fair value was approximately 9% higher than where prices were generally trading. As illustrated above, the sector outperformed even our upside expectations. One of the primary drivers for the sector’s achievements was the performance of the “FANG Stocks” – an acronym representing the stock of Facebook, Inc., Amazon.com Inc., Netflix Inc. and Alphabet Inc. (Google). Since the end of 2016, these stocks are up 48.5%, 28.2%, 46.5% and 24.3% respectively, while the S&P 1500 Technology Index returned 26.4% in the same period. While technically only Facebook, Inc. and Alphabet Inc. are actually classified by GICS in the Information Technology sector, technology obviously impacts each of the FANG entities. FANG stocks dominated market headlines during the last half of the fiscal year, drawing attention to the Information Technology sector and driving its performance. The Fund had exposure to FANG stocks through its holdings in both Alphabet Inc. and Facebook, Inc. The sector likewise benefitted from growth in the semiconductors industry and that product’s use in cell phones, automobiles and appliances. Similarly, the related semiconductor equipment industry performed well, with the S&P 1500 Semiconductor Equipment Index gaining over 70% during the fiscal year. The Fund had significant exposure to both of these industries. |
| Q. | How did the Fund’s composition affect performance? |
| A. | As previously indicated, both the semiconductors and related semiconductor equipment industries had a strong year. The Fund was overweight both of these industries, holding a position exceeding 8% in the semiconductor equipment industry, compared to a 2% weighting in the S&P 1500 Information Technology Index. Stock selection in the internet software & services and the IT consulting & other services industries likewise contributed to the Fund’s outperformance relative to its benchmark. The Fund had exposure to American depositary receipts in Chinese companies within the internet software & services industry, specifically Alibaba Group Holding Ltd. and SINA Corp. Both companies returned more than 70% while held within the Fund during the fiscal year. Additional gains came from the Fund’s exposure to Cognizant Technology Solutions Corp. in the IT consulting & other services industry. The stock was up over 52% during the 12-month period. |
The Fund’s gains were offset in part by the Fund’s cash position and poor performance from the Fund’s holding in the electronic equipment & instruments industry. Fitbit, Inc. missed earnings and revised revenue estimates downward for the last quarter of 2017. The day after the above announcement, the stock fell over 30%, becoming one of the largest detractors from the Fund’s performance.
| Q. | What is your investment outlook for the Information Technology sector? |
| A. | At the end of fiscal year 2017, the Information Technology sector had a V/P of 1.07. Specific industries that are demonstrating value under our system include both the semiconductor and semiconductor equipment industries. Accordingly, the Fund is overweight those two industries relative to the benchmark. Guided by value, we will continue to look for opportunities in the Information Technology sector. |
| 24 | www.iconfunds.com | |
Table of Contents
| ICON Information Technology Fund | Management Overview | |
| September 30, 2017 (Unaudited) |
Average Annual Total Return (as of September 30, 2017)
| Inception Date | 1 Year | 5 Years | 10 Years | Since Inception | Gross Expense Ratio* | Net Expense Ratio* | |||||||||||||||||||||||||||||
ICON Information Technology Fund - Class S | 2/19/97 | 29.46 | % | 16.75 | % | 7.81 | % | 9.69 | % | 1.49 | % | 1.49 | % | ||||||||||||||||||||||
ICON Information Technology Fund - Class A | 9/30/10 | 29.08 | % | 16.29 | % | N/A | 15.93 | % | 2.17 | % | 1.75 | % | |||||||||||||||||||||||
ICON Information Technology Fund - Class A | 9/30/10 | 21.72 | % | 14.92 | % | N/A | 14.95 | % | 2.17 | % | 1.75 | % | |||||||||||||||||||||||
S&P 1500 Information Technology Index | 28.63 | % | 17.46 | % | 10.83 | % | 8.80 | % | N/A | N/A | |||||||||||||||||||||||||
NASDAQ Composite Index | 22.29 | % | 15.83 | % | 9.17 | % | 7.86 | % | N/A | N/A | |||||||||||||||||||||||||
S&P Composite 1500 Index | 18.61 | % | 14.29 | % | 7.63 | % | 7.98 | % | N/A | N/A | |||||||||||||||||||||||||
Past performance is not a guarantee of future results. Information about these performance results and the comparative indexes can be found in the About This Report section. The Adviser has agreed to limit certain Fund expenses; without these limitations, returns would have been lower. The limitation provisions may be terminated in the future.
| * | Please see the most recent prospectus for details. |
Value of a $10,000 Investment (through September 30, 2017)

Past performance is not a guarantee of future results. The above graph compares a $10,000 investment made in the Fund’s Class S shares on the Class’ inception date of 2/19/97 to a $10,000 investment made in unmanaged securities indexes on that date. The Fund’s performance in this chart and the performance table assumes the reinvestment of dividends and capital gain distributions but does not reflect the deduction of taxes that a shareholder would pay on Fund distributions or on the redemption of Fund shares.
| ||
| Annual Report | September 30, 2017 | 25 | |
Table of Contents
| ICON Information Technology Fund | Schedule of Investments | |
| September 30, 2017 |
| Shares or Principal Amount | Value | |||||
Common Stocks (97.95%) | ||||||
Application Software (4.74%) | ||||||
CDK Global, Inc. | 31,800 | $ 2,006,262 | ||||
SAP SE, Sponsored ADR | 13,700 | 1,502,205 | ||||
| ||||||
| 3,508,467 | ||||||
| ||||||
Communications Equipment (2.12%) |
| |||||
F5 Networks, Inc.(a) | 6,600 | 795,696 | ||||
Motorola Solutions, Inc. | 9,200 | 780,804 | ||||
| ||||||
| 1,576,500 | ||||||
| ||||||
Data Processing & Outsourced |
| |||||
Alliance Data Systems Corp. | 3,500 | 775,425 | ||||
Broadridge Financial Solutions, Inc. | 14,200 | 1,147,644 | ||||
Cardtronics PLC, Class A(a) | 48,600 | 1,118,286 | ||||
Euronet Worldwide, Inc.(a) | 19,300 | 1,829,447 | ||||
ExlService Holdings, Inc.(a) | 17,800 | 1,038,096 | ||||
Genpact, Ltd. | 43,000 | 1,236,250 | ||||
Mastercard, Inc., Class A | 12,200 | 1,722,640 | ||||
MAXIMUS, Inc. | 22,500 | 1,451,250 | ||||
Visa, Inc., Class A | 24,180 | 2,544,703 | ||||
| ||||||
| 12,863,741 | ||||||
| ||||||
Electronic Equipment & Instruments (2.16%) |
| |||||
Coherent, Inc.(a) | 6,800 | 1,599,156 | ||||
| ||||||
Electronic Manufacturing Services (6.06%) |
| |||||
Fabrinet(a) | 36,800 | 1,363,808 | ||||
IPG Photonics Corp.(a) | 5,535 | 1,024,307 | ||||
Methode Electronics, Inc. | 49,700 | 2,104,795 | ||||
| ||||||
| 4,492,910 | ||||||
| ||||||
Home Entertainment Software (0.96%) |
| |||||
Electronic Arts, Inc.(a) | 6,000 | 708,360 | ||||
| ||||||
Internet Software & Services (9.86%) |
| |||||
Facebook, Inc., Class A(a) | 26,600 | 4,545,142 | ||||
LogMeIn, Inc. | 15,500 | 1,705,775 | ||||
SINA Corp.(a) | 9,200 | 1,054,780 | ||||
| ||||||
| 7,305,697 | ||||||
| ||||||
IT Consulting & Other Services (4.89%) |
| |||||
Cognizant Technology Solutions Corp., Class A | 26,300 | 1,907,802 | ||||
DXC Technology Co. | 19,900 | 1,709,012 | ||||
| ||||||
| 3,616,814 | ||||||
| ||||||
Semiconductor Equipment (17.90%) |
| |||||
Advanced Energy Industries, | 19,900 | 1,607,124 | ||||
Applied Materials, Inc. | 43,300 | 2,255,497 | ||||
Brooks Automation, Inc. | 74,600 | 2,264,856 | ||||
MKS Instruments, Inc. | 19,600 | 1,851,220 | ||||
Photronics, Inc.(a) | 158,500 | 1,402,725 | ||||
Teradyne, Inc. | 49,500 | 1,845,855 | ||||
Ultra Clean Holdings, Inc.(a) | 66,500 | 2,036,230 | ||||
| ||||||
| 13,263,507 | ||||||
| ||||||
Semiconductors (17.54%) |
| |||||
Broadcom, Ltd. | 5,600 | 1,358,224 | ||||
Cavium, Inc.(a) | 21,100 | 1,391,334 | ||||
| Shares or Principal Amount | Value | |||||
Semiconductors (continued) | ||||||
Cirrus Logic, Inc.(a) | 19,100 | $ 1,018,412 | ||||
Marvell Technology Group, Ltd. | 75,300 | 1,347,870 | ||||
Micron Technology, Inc.(a) | 40,000 | 1,573,200 | ||||
Monolithic Power Systems, Inc. | 8,400 | 895,020 | ||||
ON Semiconductor Corp.(a) | 113,700 | 2,100,039 | ||||
Qorvo, Inc.(a) | 10,000 | 706,800 | ||||
Skyworks Solutions, Inc. | 9,900 | 1,008,810 | ||||
Taiwan Semiconductor Manufacturing Co., Ltd., Sponsored ADR | 42,800 | 1,607,140 | ||||
| ||||||
| 13,006,849 | ||||||
| ||||||
Systems Software (1.81%) |
| |||||
VMware, Inc., Class A(a) | 12,300 | 1,343,037 | ||||
| ||||||
Technology Distributors (3.44%) |
| |||||
PCM, Inc.(a) | 97,300 | 1,362,200 | ||||
Tech Data Corp.(a) | 13,300 | 1,181,705 | ||||
| ||||||
| 2,543,905 | ||||||
| ||||||
Technology Hardware, Storage & |
| |||||
Apple, Inc. | 28,100 | 4,330,772 | ||||
HP, Inc. | 36,200 | 722,552 | ||||
NCR Corp.(a) | 20,000 | 750,400 | ||||
Super Micro Computer, Inc.(a) | 42,200 | 932,620 | ||||
| ||||||
| 6,736,344 | ||||||
| ||||||
Total Common Stocks (Cost $61,074,561) | 72,565,287 | |||||
| ||||||
Total Investments (97.95%) (Cost $61,074,561) | $72,565,287 | |||||
Other Assets Less | 1,519,103 | |||||
| ||||||
Net Assets (100.00%) | $74,084,390 | |||||
| ||||||
| (a) | Non-income producing security. |
ADR - American Depositary Receipt
Sector Composition (September 30, 2017) | ||
Information Technology | 97.95% | |
| ||
| 97.95% | ||
| ||
Percentages are based upon common stocks as a percentage of net assets.
The accompanying notes are an integral part of the financial statements.
| ||
| 26 | www.iconfunds.com | |
Table of Contents
| ICON Information Technology Fund | Schedule of Investments | |
| September 30, 2017 |
Industry Composition (September 30, 2017) | ||
Semiconductor Equipment | 17.90% | |
Semiconductors | 17.54% | |
Data Processing & Outsourced Services | 17.37% | |
Internet Software & Services | 9.86% | |
Technology Hardware, Storage & Peripherals | 9.10% | |
Electronic Manufacturing Services | 6.06% | |
IT Consulting & Other Services | 4.89% | |
Application Software | 4.74% | |
Technology Distributors | 3.44% | |
Electronic Equipment & Instruments | 2.16% | |
Communications Equipment | 2.12% | |
Systems Software | 1.81% | |
Other Industries (each less than 1%) | 0.96% | |
| ||
| 97.95% | ||
| ||
Percentages are based upon common stocks as a percentage of net assets.
The accompanying notes are an integral part of the financial statements.
| ||
| Annual Report | September 30, 2017 | 27 | |
Table of Contents
| ICON Natural Resources Fund | Management Overview | |
| September 30, 2017 (Unaudited) |
| Q. | How did the Fund perform relative to its benchmarks? |
| A. | The ICON Natural Resources Fund (the Fund) returned 20.13% for the fiscal year ended September 30, 2017, while the S&P Composite 1500 Index rose by 18.61%. Total returns for other periods and additional Class shares as of September 30, 2017, appear in the subsequent pages of this Fund’s Management Overview. |
| Q. | What primary factors were behind the Fund’s relative performance? |
| A. | The natural resources segment of the market produced strong returns over fiscal year 2017, as many commodities and economically sensitive industries rebounded from relatively low levels. However, these returns came with substantial volatility, especially in sectors and industries tied to the price of oil. The fiscal year began with an aggressive upward move in response to the conclusion of the presidential election. This so-called “Trump Trade” was heavily focused on the most economically sensitive segments of the market with investors anticipating a more pro-growth and infrastructure oriented platform. The ICON Natural Resources Fund was able to perform well in this environment, gaining 8.60% in the 4th quarter of 2016. |
Both the 1st and 2nd quarter of 2017 proved to be a tougher environment for natural resources investors, specifically for oil and energy-related equities. From December 30, 2016 through June 21, 2017, crude oil fell from $53.72 a barrel to $42.53 a barrel, as excess supply and declining global demand weighed heavily on the commodity. Over the same time period, the S&P 1500 Energy Index fell by approximately 15%, as the profitability (and, in some cases, even the viability) of oil-related companies came into question. The ICON Natural Resources Fund was able to insulate investors from this downturn because our valuation numbers warranted our continued caution in the Energy sector leading up to this sell-off.
The final quarter of fiscal year 2017 produced another round of strong returns for the space including a strong rebound in the price of oil and energy-related equities. From a positioning standpoint, our valuation methodology led us to a number of attractive investment opportunities within the Energy sector in general and the oil & gas exploration & production industry in particular. Based on these valuations, the ICON Natural Resources Fund established a strong position in the exploration & production industry and was able to fully participate in this final move of fiscal year 2017.
| Q. | How did the Fund’s composition affect performance? |
| A. | Positive industry contributors to the Fund’s performance during fiscal year 2017 included diversified chemicals, construction materials, gold, specialty chemicals, and commodity chemicals. |
Negative industry detractors from the Fund’s performance during fiscal year 2017 included oil & gas equipment & services, oil & gas storage & transportation, silver, and copper.
| Q. | What is your investment outlook for the Natural Resources space? |
| A. | At the close of the fiscal year, both the broad market and the natural resources segment of the market were trading relatively close to fair value based on our valuation methodology. However, there has been a recent increase in future growth expectations, specifically within the Energy sector, which could result in higher return expectations going forward. We continue to look for industries that our system identifies as trading at a discount to fair value. Guided by our disciplined, systematic and non-emotional approach to investing, we remain vigilant for prospective investments, ready to reallocate and adapt as our investment system dictates. |
| 28 | www.iconfunds.com | |
Table of Contents
| ICON Natural Resources Fund | Management Overview | |
| September 30, 2017 (Unaudited) |
Average Annual Total Return (as of September 30, 2017)
| Inception Date | 1 Year | 5 Years | 10 Years | Since Inception | Gross Expense Ratio* | Net Expense Ratio* | ||||||||
| ||||||||||||||
ICON Natural Resources Fund - Class S | 5/5/97 | 20.13% | 8.98% | 3.27% | 5.08% | 1.62% | 1.53% | |||||||
ICON Natural Resources Fund - Class C | 9/30/10 | 18.97% | 7.84% | N/A | 6.98% | 3.05% | 2.54% | |||||||
ICON Natural Resources Fund - Class A | 9/30/10 | 19.81% | 8.65% | N/A | 7.77% | 2.05% | 1.78% | |||||||
ICON Natural Resources Fund - Class A | 9/30/10 | 12.89% | 7.37% | N/A | 6.87% | 2.05% | 1.78% | |||||||
S&P Composite 1500 Index | 18.61% | 14.29% | 7.63% | 7.95% | N/A | N/A | ||||||||
Past performance is not a guarantee of future results. Information about these performance results and the comparative indexes can be found in the About This Report section. The Adviser has agreed to limit certain Fund expenses; without these limitations, returns would have been lower. The limitation provisions may be terminated in the future.
| * | Please see the most recent prospectus for details. |
Class C total returns exclude applicable sales charges. If sales charges were included returns would be lower.
Value of a $10,000 Investment (through September 30, 2017)
Past performance is not a guarantee of future results. The above graph compares a $10,000 investment made in the Fund’s Class S shares on the Class’ inception date of 5/5/97 to a $10,000 investment made in unmanaged securities indexes on that date. The Fund’s name changed effective January 22, 2016 and the investment strategy changed effective August 18, 2016. The Fund’s past performance would have been different if the current strategy had been in effect. The Fund’s performance in this chart and the performance table assumes the reinvestment of dividends and capital gain distributions but does not reflect the deduction of taxes that a shareholder would pay on Fund distributions or on the redemption of Fund shares.
| Annual Report | September 30, 2017 | 29 | |
Table of Contents
| ICON Natural Resources Fund | Schedule of Investments | |
| September 30, 2017 |
| Shares or Principal Amount | Value | |||||||
| ||||||||
Common Stocks (93.35%) | ||||||||
Building Products (3.42%) | ||||||||
Fortune Brands Home & Security, Inc. | 14,500 | $ | 974,835 | |||||
Masco Corp. | 25,000 | 975,250 | ||||||
Tarkett SA | 15,000 | 675,738 | ||||||
|
| |||||||
| 2,625,823 | ||||||||
|
| |||||||
Commodity Chemicals (4.10%) |
| |||||||
Cabot Corp. | 7,000 | 390,600 | ||||||
Koppers Holdings, Inc.(a) | 20,000 | 923,000 | ||||||
LyondellBasell Industries NV, Class A | 4,000 | 396,200 | ||||||
Methanex Corp. | 9,939 | 499,932 | ||||||
Olin Corp. | 27,339 | 936,361 | ||||||
|
| |||||||
| 3,146,093 | ||||||||
|
| |||||||
Construction & Engineering (4.50%) |
| |||||||
Comfort Systems U.S.A., Inc. | 31,940 | 1,140,258 | ||||||
MasTec, Inc.(a) | 50,000 | 2,320,000 | ||||||
|
| |||||||
| 3,460,258 | ||||||||
|
| |||||||
Construction Materials (5.40%) |
| |||||||
Buzzi Unicem SpA | 60,000 | 1,621,400 | ||||||
Eagle Materials, Inc. | 8,000 | 853,600 | ||||||
Vulcan Materials Co. | 14,000 | 1,674,400 | ||||||
|
| |||||||
| 4,149,400 | ||||||||
|
| |||||||
Diversified Chemicals (10.38%) |
| |||||||
BASF SE | 23,000 | 2,450,336 | ||||||
DowDuPont, Inc. | 28,745 | 1,990,016 | ||||||
Eastman Chemical Co. | 30,000 | 2,714,700 | ||||||
Huntsman Corp. | 30,000 | 822,600 | ||||||
|
| |||||||
| 7,977,652 | ||||||||
|
| |||||||
Fertilizers & Agricultural Chemicals (0.77%) |
| |||||||
Agrium, Inc. | 5,500 | 589,655 | ||||||
|
| |||||||
Gold (9.71%) | ||||||||
Cia de Minas Buenaventura SAA, ADR | 235,000 | 3,005,650 | ||||||
Randgold Resources, Ltd. | 22,728 | 2,221,362 | ||||||
Royal Gold, Inc. | 26,000 | 2,237,040 | ||||||
|
| |||||||
| 7,464,052 | ||||||||
|
| |||||||
Integrated Oil & Gas (3.54%) |
| |||||||
BP PLC | 140,000 | 896,840 | ||||||
Royal Dutch Shell PLC, Class A, Sponsored ADR | 30,000 | 1,817,400 | ||||||
|
| |||||||
| 2,714,240 | ||||||||
|
| |||||||
Metal & Glass Containers (3.82%) |
| |||||||
Ball Corp. | 35,000 | 1,445,500 | ||||||
Crown Holdings, Inc.(a) | 25,000 | 1,493,000 | ||||||
|
| |||||||
| 2,938,500 | ||||||||
|
| |||||||
Oil & Gas Equipment & Services (6.14%) |
| |||||||
Schlumberger, Ltd. | 32,000 | 2,232,320 | ||||||
U.S. Silica Holdings, Inc. | 80,000 | 2,485,600 | ||||||
|
| |||||||
| 4,717,920 | ||||||||
|
| |||||||
| Shares or Principal Amount | Value | |||||||
| ||||||||
Oil & Gas Exploration & Production (20.83%) |
| |||||||
Cabot Oil & Gas Corp. | 65,000 | $ | 1,738,750 | |||||
Carrizo Oil & Gas, Inc.(a) | 80,000 | 1,370,400 | ||||||
Cimarex Energy Co. | 22,000 | 2,500,740 | ||||||
Diamondback Energy, | 34,300 | 3,360,028 | ||||||
Gulfport Energy Corp.(a) | 120,000 | 1,720,800 | ||||||
Newfield Exploration Co.(a) | 25,000 | 741,750 | ||||||
Parsley Energy, Inc., Class A | 30,000 | 790,200 | ||||||
Range Resources Corp. | 45,000 | 880,650 | ||||||
SRC Energy, Inc.(a) | 300,000 | 2,901,000 | ||||||
|
| |||||||
| 16,004,318 | ||||||||
|
| |||||||
Oil & Gas Refining & Marketing (1.34%) |
| |||||||
Andeavor | 10,000 | 1,031,500 | ||||||
|
| |||||||
Oil & Gas Storage & Transportation (0.76%) |
| |||||||
Enbridge, Inc. | 14,000 | 584,796 | ||||||
|
| |||||||
Paper Packaging (6.72%) | ||||||||
Graphic Packaging Holding Co. | 370,000 | 5,161,500 | ||||||
|
| |||||||
Silver (2.61%) | ||||||||
Wheaton Precious Metals Corp. | 105,000 | 2,004,450 | ||||||
|
| |||||||
Specialty Chemicals (8.73%) |
| |||||||
Celanese Corp., Class A | 17,000 | 1,772,590 | ||||||
PolyOne Corp. | 60,000 | 2,401,800 | ||||||
WR Grace & Co. | 35,000 | 2,525,250 | ||||||
|
| |||||||
| 6,699,640 | ||||||||
|
| |||||||
Steel (0.58%) | ||||||||
Nucor Corp. | 8,000 | 448,320 | ||||||
|
| |||||||
Total Common Stocks (Cost $64,268,400) | 71,718,117 | |||||||
|
| |||||||
Total Investments (93.35%) (Cost $64,268,400) | $ | 71,718,117 | ||||||
Other Assets Less Liabilities (6.65%) |
| 5,111,407 | ||||||
|
| |||||||
Net Assets (100.00%) |
| $ | 76,829,524 | |||||
|
| |||||||
| (a) | Non-income producing security. |
ADR - American Depositary Receipt
The accompanying notes are an integral part of the financial statements.
| ||
| 30 | www.iconfunds.com | |
Table of Contents
| ICON Natural Resources Fund | Schedule of Investments | |
| September 30, 2017 |
| Country Composition (September 30, 2017) | ||||
| ||||
United States | 72.04% | |||
Canada | 4.79% | |||
Peru | 3.91% | |||
Germany | 3.19% | |||
Jersey | 2.89% | |||
Netherlands | 2.37% | |||
Italy | 2.11% | |||
United Kingdom | 1.17% | |||
France | 0.88% | |||
|
| |||
| 93.35% | ||||
|
| |||
Percentages are based upon common stocks as a percentage of net assets.
| Sector Composition (September 30, 2017) | ||||
| ||||
Materials | 52.82% | |||
Energy | 32.61% | |||
Industrials | 7.92% | |||
|
| |||
| 93.35% | ||||
|
| |||
Percentages are based upon common stocks as a percentage of net assets.
| Industry Composition (September 30, 2017) | ||||
| ||||
Oil & Gas Exploration & Production | 20.83% | |||
Diversified Chemicals | 10.38% | |||
Gold | 9.71% | |||
Specialty Chemicals | 8.73% | |||
Paper Packaging | 6.72% | |||
Oil & Gas Equipment & Services | 6.14% | |||
Construction Materials | 5.40% | |||
Construction & Engineering | 4.50% | |||
Commodity Chemicals | 4.10% | |||
Metal & Glass Containers | 3.82% | |||
Integrated Oil & Gas | 3.54% | |||
Building Products | 3.42% | |||
Silver | 2.61% | |||
Oil & Gas Refining & Marketing | 1.34% | |||
Other Industries (each less than 1%) | 2.11% | |||
|
| |||
| 93.35% | ||||
|
| |||
Percentages are based upon common stocks as a percentage of net assets.
The accompanying notes are an integral part of the financial statements.
| ||
| Annual Report | September 30, 2017 | 31 | |
Table of Contents
| ICON Utilities Fund | Management Overview | |
| September 30, 2017 (Unaudited) |
| Q. | How did the Fund perform relative to its benchmarks? |
| A. | The ICON Utilities Fund (the Fund) Class S returned 9.88% for the fiscal year ending September 30, 2017, lagging its sector-specific benchmark, the S&P 1500 Utilities Index, which returned 12.50%. The broad benchmark, the S&P Composite 1500 Index, returned 18.61%. Total returns for other periods and additional Class shares as of September 30, 2017, appear in the subsequent pages of this Fund’s Management Overview. |
| Q. | What primary factors were behind the Fund’s relative performance? |
| A. | According to our valuation methodology, at the end of fiscal year 2016, the Utilities sector had a value-to-price (V/P) ratio of 1.14 (suggesting upside potential, with stock prices below our estimate of their fair value) while the average V/P ratio for the overall equity market stood at 1.09. Although we began the year believing the Utilities sector offered better upside potential than the broader market, the sector lagged the market considerably by the end of the fiscal year. Changes in fixed income yields explain some of this underperformance. The yield on the 10-year U.S. Treasury Note, for example, increased from 1.60% on September 30, 2016 to 2.33% on September 30, 2017. The relative improvement in treasury yields reduced the demand for Utilities stocks as a yield alternative to fixed income investments. Higher dividend yielding stocks generally underperformed lower dividend paying stocks across both the broader equity market and in the Utilities sector. For example, our valuations favored high-dividend yield producing stocks in the independent power producers & energy traders industry. These high-dividend holdings underperformed the industry and adversely impacted the Fund’s performance. Over the course of the fiscal year, we saw value in the oil & gas exploration and production industry, and increased the Fund’s exposure to this industry. While our oil & gas exploration and production positions helped the Fund in the last quarter of the fiscal year, we held these securities too early, ignoring other opportunities that might have contributed to better relative performance. Additionally, the broader stock market returns were dominated by high growth stocks. With moderately lower growth rates than the equity market in general, the Utilities sector lagged during the fiscal year. |
| Q. | How did the Fund’s composition affect performance? |
| A. | The Fund benefited by strong stock selection in both the multi-utilities and the electric utilities industries. The stocks selected to represent the multi-utilities industry returned 15% over the course of the fiscal year, outperforming its industry benchmark, which returned 11%. The Fund’s electric utilities industry holdings returned in excess of 17% while the benchmark returned just over 12%. Avangrid, Inc. an energy services and delivery company that is part of the electric utilities industry, was up over 28% for the Fund over the fiscal year. |
The Fund had exposure to stocks outside of the Utilities sector as well. The Fund’s holdings in the oil & gas exploration & production industry detracted from Fund performance. For example, Gulfport Energy Corp., a company focused primarily on natural gas exploration, was the largest detractor, losing over 30% of its value during the fiscal year. The stock section within the independent power producers & energy traders industry had a negative impact on the Fund as well. The Fund’s holdings in this industry realized a net loss of about 8.5%, while the industry posted positive returns for the benchmark. Finally, the Fund faced additional headwinds in its exposure to the Telecommunication Services sector. |
| Q. | What is your investment outlook for the Utilities sector? |
| A. | As of September 30, 2017, we believe the Utilities sector has a V/P ratio of 1.07. Given these V/P readings we generally have a positive outlook for the sector and remain optimistic for the year ahead. However, because the Utilities sector is seen by some investors as a fixed income alternative in a low interest rate environment, the sector may again lag the broader benchmark if an interest rate increase makes the sector less attractive in the short term. As always, we look to value as our primary guide and will adjust our positioning as market conditions dictate. |
| 32 | www.iconfunds.com | |
Table of Contents
| ICON Utilities Fund | Management Overview | |
| September 30, 2017 (Unaudited) |
Average Annual Total Return (as of September 30, 2017)
| Inception Date | 1 Year | 5 Years | 10 Years | Since Inception | Gross Expense Ratio* | Net Expense Ratio* | |||||||||||||||||||||||||||||
ICON Utilities Fund - Class S | 7/9/97 | 9.88% | 11.56% | 5.63% | 8.54% | 1.59% | 1.50% | ||||||||||||||||||||||||||||
ICON Utilities Fund - Class A | 9/30/10 | 9.63% | 11.26% | N/A | 10.95% | 1.79% | 1.75% | ||||||||||||||||||||||||||||
ICON Utilities Fund - Class A | 9/30/10 | 3.33% | 9.95% | N/A | 10.00% | 1.79% | 1.75% | ||||||||||||||||||||||||||||
S&P 1500 Utilities Index | 12.50% | 12.37% | 7.78% | 8.56% | N/A | N/A | |||||||||||||||||||||||||||||
S&P Composite 1500 Index | 18.61% | 14.29% | 7.63% | 7.52% | N/A | N/A | |||||||||||||||||||||||||||||
Past performance is not a guarantee of future results. Information about these performance results and the comparative indexes can be found in the About This Report section. The Adviser has agreed to limit certain Fund expenses; without these limitations, returns would have been lower. The limitation provisions may be terminated in the future.
| * | Please see the most recent prospectus for details. |
Value of a $10,000 Investment (through September 30, 2017)
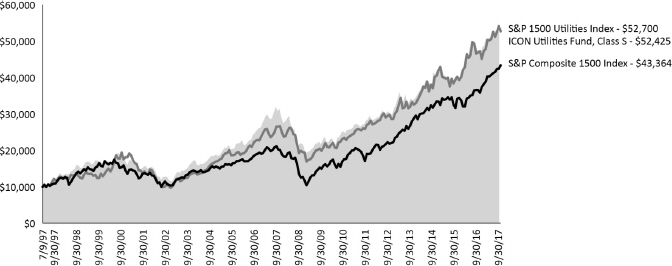
Past performance is not a guarantee of future results. The above graph compares a $10,000 investment made in the Fund’s Class S shares on the Class’ inception date of 7/9/97 to a $10,000 investment made in unmanaged securities indexes on that date. The Fund’s performance in this chart and the performance table assumes the reinvestment of dividends and capital gain distributions but does not reflect the deduction of taxes that a shareholder would pay on Fund distributions or on the redemption of Fund shares.
| Annual Report | September 30, 2017 | 33 | |
Table of Contents
| ICON Utilities Fund | Schedule of Investments | |
| September 30, 2017 |
| Shares or Principal Amount | Value | |||||
Common Stocks (98.87%) | ||||||
Construction & Engineering (1.55%) |
| |||||
MasTec, Inc.(a) | 14,700 | $ | 682,080 | |||
|
| |||||
Electric Utilities (38.24%) |
| |||||
Avangrid, Inc. | 53,200 | 2,522,744 | ||||
Edison International | 37,000 | 2,855,290 | ||||
Eversource Energy | 44,000 | 2,659,360 | ||||
OGE Energy Corp. | 38,700 | 1,394,361 | ||||
Otter Tail Corp. | 46,700 | 2,024,445 | ||||
PG&E Corp. | 31,100 | 2,117,599 | ||||
Pinnacle West Capital Corp. | 15,600 | 1,319,136 | ||||
Westar Energy, Inc. | 39,800 | 1,974,080 | ||||
|
| |||||
| 16,867,015 | ||||||
|
| |||||
Gas Utilities (5.49%) |
| |||||
National Fuel Gas Co. | 42,800 | 2,422,908 | ||||
|
| |||||
Independent Power Producers & Energy Traders (2.82%) |
| |||||
AES Corp. | 112,900 | 1,244,158 | ||||
|
| |||||
Integrated Oil & Gas (2.05%) |
| |||||
TOTAL SA, Sponsored ADR | 16,900 | 904,488 | ||||
|
| |||||
Integrated Telecommunication Services (2.47%) |
| |||||
AT&T, Inc. | 27,800 | 1,088,926 | ||||
|
| |||||
Multi-Utilities (30.97%) | ||||||
Ameren Corp. | 38,800 | 2,244,192 | ||||
CenterPoint Energy, Inc. | 86,200 | 2,517,902 | ||||
CMS Energy Corp. | 46,776 | 2,166,664 | ||||
DTE Energy Co. | 25,200 | 2,705,472 | ||||
NiSource, Inc. | 85,700 | 2,193,063 | ||||
SCANA Corp. | 16,200 | 785,538 | ||||
Sempra Energy | 9,200 | 1,049,996 | ||||
|
| |||||
| 13,662,827 | ||||||
|
| |||||
Oil & Gas Equipment & Services (1.15%) |
| |||||
U.S. Silica Holdings, Inc.(b) | 16,300 | 506,441 | ||||
|
| |||||
Oil & Gas Exploration & Production (8.25%) |
| |||||
Diamondback Energy, Inc.(a) | 9,600 | 940,416 | ||||
EOG Resources, Inc. | 7,500 | 725,550 | ||||
Gulfport Energy Corp.(a) | 56,500 | 810,210 | ||||
Range Resources Corp. | 22,700 | 444,239 | ||||
SRC Energy, Inc.(a) | 74,000 | 715,580 | ||||
|
| |||||
| 3,635,995 | ||||||
|
| |||||
Water Utilities (2.84%) |
| |||||
Consolidated Water Co., Ltd. | 97,846 | 1,252,429 | ||||
|
| |||||
| Shares or Principal Amount | Value | |||||
Wireless Telecommunication Services (3.04%) |
| |||||
NTT DOCOMO, Inc., Sponsored ADR(b) | 58,900 | $ | 1,342,331 | |||
|
| |||||
Total Common Stocks (Cost $42,014,860) | 43,609,598 | |||||
|
| |||||
Collateral for Securities on Loan (4.26%) |
| |||||
State Street Navigator Securities Lending Government Money Market Portfolio, 7-Day Yield 1.01% | 1,878,800 | 1,878,800 | ||||
|
| |||||
Total Collateral for Securities on Loan (Cost $1,878,800) | 1,878,800 | |||||
|
| |||||
Total Investments (103.13%) (Cost $43,893,660) | $ | 45,488,398 | ||||
Liabilities Less Other Assets (-3.13%) | (1,378,623) | |||||
|
| |||||
Net Assets (100.00%) | $ | 44,109,775 | ||||
|
| |||||
| (a) | Non-income producing security. |
| (b) | All or a portion of the security was on loan as of September 30, 2017. |
ADR - American Depositary Receipt
Sector Composition (September 30, 2017) | ||||
Utilities | 80.36% | |||
Energy | 11.45% | |||
Telecommunication Services | 5.51% | |||
Industrials | 1.55% | |||
|
| |||
| 98.87% | ||||
|
| |||
Percentages are based upon common stocks as a percentage of net assets.
The accompanying notes are an integral part of the financial statements.
| ||
| 34 | www.iconfunds.com | |
Table of Contents
| ICON Utilities Fund | Schedule of Investments | |
| September 30, 2017 |
Industry Composition (September 30, 2017) | ||||
Electric Utilities | 38.24% | |||
Multi-Utilities | 30.97% | |||
Oil & Gas Exploration & Production | 8.25% | |||
Gas Utilities | 5.49% | |||
Wireless Telecommunication Services | 3.04% | |||
Water Utilities | 2.84% | |||
Independent Power Producers & Energy Traders | 2.82% | |||
Integrated Telecommunication Services | 2.47% | |||
Integrated Oil & Gas | 2.05% | |||
Construction & Engineering | 1.55% | |||
Oil & Gas Equipment & Services | 1.15% | |||
|
| |||
| 98.87% | ||||
|
| |||
Percentages are based upon common stocks as a percentage of net assets.
The accompanying notes are an integral part of the financial statements.
| ||
| Annual Report | September 30, 2017 | 35 | |
Table of Contents
| ICON Sector Funds | Statements of Assets and Liabilities | |
| September 30, 2017 |
| ICON Consumer Discretionary Fund | ICON Consumer Staples Fund | ICON Energy Fund | ||||||||||
Assets | ||||||||||||
Investments, at cost | $ | 24,808,690 | $ | 29,187,302 | $ | 245,937,245 | ||||||
|
| |||||||||||
Investments, at value(a) | 24,875,794 | 29,087,200 | 252,518,198 | |||||||||
Cash and cash equivalents | 2,328,104 | 1,083,153 | 2,533,230 | |||||||||
Receivables: | ||||||||||||
Investments sold | 15,036 | 278,795 | 7,821,116 | |||||||||
Fund shares sold | 8,181 | 10,990 | 69,122 | |||||||||
Expense reimbursements due from Adviser | – | 12,087 | – | |||||||||
Dividends | 14,270 | 27,251 | 87,917 | |||||||||
Foreign tax reclaims | – | – | – | |||||||||
Other assets | 7,269 | 8,105 | 57,838 | |||||||||
|
| |||||||||||
Total assets | 27,248,654 | 30,507,581 | 263,087,421 | |||||||||
|
| |||||||||||
Liabilities | ||||||||||||
Payables: | ||||||||||||
Payable for collateral received on securities loaned | 592,080 | 2,009,724 | 18,303,527 | |||||||||
Expense recoupment due to Adviser | 529 | – | – | |||||||||
Investments purchased | 542,597 | 834,249 | 4,668,413 | |||||||||
Fund shares redeemed | 8,878 | 35,449 | 243,813 | |||||||||
Advisory fees | 21,123 | 22,744 | 187,738 | |||||||||
Transfer agent fees | 12,871 | 31,262 | 218,906 | |||||||||
Fund accounting fees | 3,144 | 3,503 | 16,961 | |||||||||
Accrued distribution fees | 296 | 720 | 7,703 | |||||||||
Trustee fees and expenses | 1,572 | 1,733 | 13,788 | |||||||||
Administration fees | 1,056 | 1,137 | 9,387 | |||||||||
Accrued expenses | 24,652 | 24,493 | 64,814 | |||||||||
|
| |||||||||||
Total liabilities | 1,208,798 | 2,965,014 | 23,735,050 | |||||||||
|
| |||||||||||
Net Assets - all share classes | $ | 26,039,856 | $ | 27,542,567 | $ | 239,352,371 | ||||||
|
| |||||||||||
Net Assets - Class S | $ | 24,566,073 | $ | 24,069,075 | $ | 222,706,577 | ||||||
|
| |||||||||||
Net Assets - Class C | $ | – | $ | – | $ | 7,333,346 | ||||||
|
| |||||||||||
Net Assets - Class A | $ | 1,473,783 | $ | 3,473,492 | $ | 9,312,448 | ||||||
|
| |||||||||||
Net Assets Consists of | ||||||||||||
Paid-in capital | $ | 25,025,812 | $ | 26,859,989 | $ | 403,293,623 | ||||||
Accumulated undistributed net investment income/(loss) | – | 9,783 | 2,001,726 | |||||||||
Accumulated undistributed net realized gain/(loss) | 946,940 | 772,897 | (172,523,931) | |||||||||
Unrealized appreciation/(depreciation) | 67,104 | (100,102) | 6,580,953 | |||||||||
|
| |||||||||||
Net Assets | $ | 26,039,856 | $ | 27,542,567 | $ | 239,352,371 | ||||||
|
| |||||||||||
Shares outstanding (unlimited shares authorized, no par value) | ||||||||||||
Class S | 1,758,866 | 3,238,234 | 17,777,486 | |||||||||
Class C | – | – | 615,451 | |||||||||
Class A | 110,315 | 469,513 | 748,389 | |||||||||
Net asset value (offering and redemption price per share) | ||||||||||||
Class S | $ | 13.97 | $ | 7.43 | $ | 12.53 | ||||||
Class C | $ | – | $ | – | $ | 11.92 | ||||||
Class A | $ | 13.36 | $ | 7.40 | $ | 12.44 | ||||||
Class A maximum offering price (100%/ (100%-maximum sales charge)) of net asset value adjusted to the nearest cent per share | $ | 14.17 | $ | 7.85 | $ | 13.20 | ||||||
(a) Includes securities on loan of | $ | 573,784 | $ | 1,965,934 | $ | 17,817,440 | ||||||
The accompanying notes are an integral part of the financial statements.
| ||
| 36 | www.iconfunds.com | |
Table of Contents
| ICON Sector Funds | Statements of Assets and Liabilities | |
| September 30, 2017 |
| ICON Financial Fund | ICON Healthcare Fund | ICON Industrials Fund | ||||||||||
Assets | ||||||||||||
Investments, at cost | $ | 34,160,327 | $ | 78,276,022 | $ | 15,614,496 | ||||||
|
| |||||||||||
Investments, at value(a) | 41,138,995 | 83,933,304 | 17,151,337 | |||||||||
Cash and cash equivalents | 783,432 | 5,505,026 | 733,443 | |||||||||
Foreign currency, at value (Cost $4,889, $– and $–, respectively) | 4,890 | – | – | |||||||||
Receivables: | ||||||||||||
Investments sold | 426,600 | 499,517 | – | |||||||||
Fund shares sold | 12,832 | 14,109 | 33,925 | |||||||||
Expense reimbursements due from Adviser | 767 | – | 11,481 | |||||||||
Dividends | 33,979 | 53,874 | 28,756 | |||||||||
Foreign tax reclaims | – | 3,493 | – | |||||||||
Other assets | 8,230 | 13,309 | 7,259 | |||||||||
|
| |||||||||||
Total assets | 42,409,725 | 90,022,632 | 17,966,201 | |||||||||
|
| |||||||||||
Liabilities | ||||||||||||
Payables: | ||||||||||||
Payable for collateral received on securities loaned | 511,875 | – | – | |||||||||
Expense recoupment due to Adviser | – | 804 | – | |||||||||
Investments purchased | 620,309 | 2,624,197 | – | |||||||||
Fund shares redeemed | 3,642 | 5,012 | 20,794 | |||||||||
Advisory fees | 32,743 | 72,666 | 14,551 | |||||||||
Transfer agent fees | 14,296 | 46,341 | 14,549 | |||||||||
Fund accounting fees | 4,831 | 7,777 | 3,029 | |||||||||
Accrued distribution fees | 431 | 830 | 503 | |||||||||
Trustee fees and expenses | 2,422 | 5,173 | 1,115 | |||||||||
Administration fees | 1,637 | 3,633 | 727 | |||||||||
Accrued expenses | 26,366 | 33,778 | 23,401 | |||||||||
|
| |||||||||||
Total liabilities | 1,218,552 | 2,800,211 | 78,669 | |||||||||
|
| |||||||||||
Net Assets - all share classes | $ | 41,191,173 | $ | 87,222,421 | $ | 17,887,532 | ||||||
|
| |||||||||||
Net Assets - Class S | $ | 39,071,715 | $ | 83,233,841 | $ | 15,482,021 | ||||||
|
| |||||||||||
Net Assets - Class A | $ | 2,119,458 | $ | 3,988,580 | $ | 2,405,511 | ||||||
|
| |||||||||||
Net Assets Consists of | ||||||||||||
Paid-in capital | $ | 78,347,128 | $ | 79,488,622 | $ | 30,892,860 | ||||||
Accumulated undistributed net investment income/(loss) | 74,836 | – | (36,399) | |||||||||
Accumulated undistributed net realized gain/(loss) | (44,209,459) | 2,076,517 | (14,505,764) | |||||||||
Unrealized appreciation/(depreciation) | 6,978,668 | 5,657,282 | 1,536,835 | |||||||||
|
| |||||||||||
Net Assets | $ | 41,191,173 | $ | 87,222,421 | $ | 17,887,532 | ||||||
|
| |||||||||||
Shares outstanding (unlimited shares authorized, no par value) | ||||||||||||
Class S | 3,925,663 | 4,903,781 | 1,033,873 | |||||||||
Class A | 212,256 | 244,890 | 162,677 | |||||||||
Net asset value (offering and redemption price per share) | ||||||||||||
Class S | $ | 9.95 | $ | 16.97 | $ | 14.97 | ||||||
Class A | $ | 9.99 | $ | 16.29 | $ | 14.79 | ||||||
Class A maximum offering price (100%/ (100%-maximum sales charge)) of net asset value adjusted to the nearest cent per share | $ | 10.59 | $ | 17.28 | $ | 15.69 | ||||||
(a) Includes securities on loan of | $ | 498,225 | $ | – | $ | – | ||||||
The accompanying notes are an integral part of the financial statements.
| ||
| Annual Report | September 30, 2017 | 37 | |
Table of Contents
| ICON Sector Funds | Statements of Assets and Liabilities | |
| September 30, 2017 |
| ICON Information Technology Fund | ICON Natural Resources Fund | ICON Utilities Fund | ||||||||||
Assets | ||||||||||||
Investments, at cost | $ | 61,074,561 | $ | 64,268,400 | $ | 43,893,660 | ||||||
|
| |||||||||||
Investments, at value(a) | 72,565,287 | 71,718,117 | 45,488,398 | |||||||||
Cash and cash equivalents | 362,435 | 5,473,107 | – | |||||||||
Receivables: | ||||||||||||
Investments sold | 1,249,797 | 946,561 | 447,843 | |||||||||
Fund shares sold | 25,190 | 63,102 | 52,276 | |||||||||
Expense reimbursements due from Adviser | 1,362 | 4,280 | 29,823 | |||||||||
Dividends | 14,771 | 92,520 | 358,091 | |||||||||
Foreign tax reclaims | – | 2,472 | 3,047 | |||||||||
Other assets | 12,908 | 15,760 | 9,358 | |||||||||
|
| |||||||||||
Total assets | 74,231,750 | 78,315,919 | 46,388,836 | |||||||||
|
| |||||||||||
Liabilities | ||||||||||||
Payables: | ||||||||||||
Payable for collateral received on securities loaned | – | – | 1,878,800 | |||||||||
Payable for distribution | – | – | 29,598 | |||||||||
Loan payable, at value (Cost $–, $– and $177,025) | – | – | 177,025 | |||||||||
Investments purchased | – | 1,275,411 | – | |||||||||
Fund shares redeemed | 16,597 | 34,811 | 85,349 | |||||||||
Advisory fees | 59,476 | 60,981 | 37,664 | |||||||||
Transfer agent fees | 27,088 | 65,691 | 29,275 | |||||||||
Fund accounting fees | 6,496 | 7,387 | 4,617 | |||||||||
Accrued distribution fees | 563 | 2,544 | 1,766 | |||||||||
Trustee fees and expenses | 4,019 | 4,156 | 2,760 | |||||||||
Administration fees | 2,973 | 3,049 | 1,884 | |||||||||
Accrued expenses | 30,148 | 32,365 | 30,323 | |||||||||
|
| |||||||||||
Total liabilities | 147,360 | 1,486,395 | 2,279,061 | |||||||||
|
| |||||||||||
Net Assets - all share classes | $ | 74,084,390 | $ | 76,829,524 | $ | 44,109,775 | ||||||
|
| |||||||||||
Net Assets - Class S | $ | 71,248,763 | $ | 69,444,464 | $ | 35,816,467 | ||||||
|
| |||||||||||
Net Assets - Class C | $ | – | $ | 1,756,062 | $ | – | ||||||
|
| |||||||||||
Net Assets - Class A | $ | 2,835,627 | $ | 5,628,998 | $ | 8,293,308 | ||||||
|
| |||||||||||
Net Assets Consists of | ||||||||||||
Paid-in capital | $ | 49,270,237 | $ | 68,368,418 | $ | 40,200,199 | ||||||
Accumulated undistributed net investment income/(loss) | (165,161) | – | 225,952 | |||||||||
Accumulated undistributed net realized gain/(loss) | 13,488,588 | 1,011,297 | 2,089,223 | |||||||||
Unrealized appreciation/(depreciation) | 11,490,726 | 7,449,809 | 1,594,401 | |||||||||
|
| |||||||||||
Net Assets | $ | 74,084,390 | $ | 76,829,524 | $ | 44,109,775 | ||||||
|
| |||||||||||
Shares outstanding (unlimited shares authorized, no par value) | ||||||||||||
Class S | 3,721,863 | 4,531,552 | 3,855,392 | |||||||||
Class C | ��� | 119,850 | – | |||||||||
Class A | 152,894 | 370,991 | 907,320 | |||||||||
Net asset value (offering and redemption price per share) | ||||||||||||
Class S | $ | 19.14 | $ | 15.32 | $ | 9.29 | ||||||
Class C | $ | – | $ | 14.65 | $ | – | ||||||
Class A | $ | 18.55 | $ | 15.17 | $ | 9.14 | ||||||
Class A maximum offering price (100%/ (100%-maximum sales charge)) of net asset value adjusted to the nearest cent per share | $ | 19.68 | $ | 16.10 | $ | 9.70 | ||||||
(a) Includes securities on loan of | $ | – | $ | – | $ | 1,848,772 | ||||||
The accompanying notes are an integral part of the financial statements.
| ||
| 38 | www.iconfunds.com | |
Table of Contents
| ICON Sector Funds | Statements of Operations | |
| Year Ended September 30, 2017 |
| ICON Consumer Discretionary Fund | ICON Consumer Staples Fund | ICON Energy Fund | ||||||||||
Investment Income | ||||||||||||
Interest | $ | 3,839 | $ | 2,452 | $ | 4,064 | ||||||
Dividends | 338,941 | 538,718 | 5,655,643 | |||||||||
Foreign taxes withheld | – | (71) | (149,135) | |||||||||
Income from securities lending, net | 9,840 | 3,517 | 203,745 | |||||||||
|
| |||||||||||
Total investment income | 352,620 | 544,616 | 5,714,317 | |||||||||
|
| |||||||||||
Expenses | ||||||||||||
Advisory fees | 341,859 | 315,279 | 3,065,309 | |||||||||
Administration fees | 17,037 | 15,707 | 152,791 | |||||||||
Transfer agent fees | 46,705 | 96,588 | 607,523 | |||||||||
Distribution fees: | ||||||||||||
Class C | – | – | 87,589 | |||||||||
Class A | 4,558 | 13,024 | 30,202 | |||||||||
Registration fees | 25,899 | 33,318 | 57,352 | |||||||||
Audit and tax service expense | 17,657 | 17,657 | 21,753 | |||||||||
Fund accounting fees | 14,295 | 13,554 | 113,045 | |||||||||
Trustee fees and expenses | 7,272 | 6,925 | 66,160 | |||||||||
Insurance expense | 3,073 | 3,631 | 27,738 | |||||||||
Custody fees | 4,266 | 4,056 | 13,243 | |||||||||
Printing fees | 9,315 | 9,619 | 59,635 | |||||||||
Interest expense | 81 | 1,417 | 10,079 | |||||||||
Recoupment of previously reimbursed expenses | 919 | 2,240 | – | |||||||||
Other expenses | 19,091 | 17,277 | 133,694 | |||||||||
|
| |||||||||||
Total expenses before expense reimbursement | 512,027 | 550,292 | 4,446,113 | |||||||||
Expense reimbursement by Adviser due to expense limitation agreement | (4,198) | (63,487) | – | |||||||||
|
| |||||||||||
Net Expenses | 507,829 | 486,805 | 4,446,113 | |||||||||
|
| |||||||||||
Net Investment Income/(Loss) | (155,209) | 57,811 | 1,268,204 | |||||||||
|
| |||||||||||
Realized and Unrealized Gain/(Loss) | ||||||||||||
Net realized gain/(loss) on: | ||||||||||||
Investments and foreign currency translations | 1,102,738 | 1,494,029 | (10,044,040) | |||||||||
|
| |||||||||||
| 1,102,738 | 1,494,029 | (10,044,040) | ||||||||||
|
| |||||||||||
Change in unrealized net appreciation/(depreciation) on: | ||||||||||||
Investments and foreign currency | 2,370,464 | (51,630) | 4,187,058 | |||||||||
|
| |||||||||||
| 2,370,464 | (51,630) | 4,187,058 | ||||||||||
|
| |||||||||||
Net realized and unrealized gain/(loss) | 3,473,202 | 1,442,399 | (5,856,982) | |||||||||
|
| |||||||||||
Net Increase/(Decrease) in Net Assets Resulting From Operations | $ | 3,317,993 | $ | 1,500,210 | $ | (4,588,778) | ||||||
|
| |||||||||||
The accompanying notes are an integral part of the financial statements.
| ||
| Annual Report | September 30, 2017 | 39 | |
Table of Contents
| ICON Sector Funds | Statements of Operations | |
| Year Ended September 30, 2017 |
| ICON Financial Fund | ICON Healthcare Fund | ICON Industrials Fund | ||||||||||
Investment Income | ||||||||||||
Interest | $ | 977 | $ | 4,434 | $ | 996 | ||||||
Dividends | 739,878 | 920,022 | 269,538 | |||||||||
Foreign taxes withheld | (1,249) | (14,600) | (319) | |||||||||
Income from securities lending, net | 18,658 | 4,460 | 196 | |||||||||
|
| |||||||||||
Total investment income | 758,264 | 914,316 | 270,411 | |||||||||
|
| |||||||||||
Expenses | ||||||||||||
Advisory fees | 450,871 | 845,318 | 225,977 | |||||||||
Administration fees | 22,478 | 42,156 | 11,274 | |||||||||
Transfer agent fees | 50,871 | 140,197 | 54,836 | |||||||||
Distribution fees: | ||||||||||||
Class A | 5,715 | 11,083 | 6,804 | |||||||||
Registration fees | 27,130 | 32,180 | 27,421 | |||||||||
Audit and tax service expense | 17,657 | 17,657 | 17,657 | |||||||||
Fund accounting fees | 19,195 | 33,582 | 10,585 | |||||||||
Trustee fees and expenses | 9,918 | 18,896 | 5,023 | |||||||||
Insurance expense | 3,897 | 5,904 | 1,984 | |||||||||
Custody fees | 4,398 | 9,889 | 3,679 | |||||||||
Printing fees | 10,357 | 16,998 | 9,357 | |||||||||
Interest expense | 572 | 268 | 1,744 | |||||||||
Recoupment of previously reimbursed expenses | 315 | 1,108 | 2,165 | |||||||||
Other expenses | 23,587 | 39,089 | 13,429 | |||||||||
|
| |||||||||||
Total expenses before expense reimbursement | 646,961 | 1,214,325 | 391,935 | |||||||||
Expense reimbursement by Adviser due to expense limitation agreement | (6,790) | (4,986) | (44,703) | |||||||||
|
| |||||||||||
Net Expenses | 640,171 | 1,209,339 | 347,232 | |||||||||
|
| |||||||||||
Net Investment Income/(Loss) | 118,093 | (295,023) | (76,821) | |||||||||
|
| |||||||||||
Realized and Unrealized Gain/(Loss) | ||||||||||||
Net realized gain/(loss) on: | ||||||||||||
Investments and foreign currency translations | 4,547,025 | 2,483,501 | 3,708,253 | |||||||||
|
| |||||||||||
| 4,547,025 | 2,483,501 | 3,708,253 | ||||||||||
|
| |||||||||||
Change in unrealized net appreciation/(depreciation) on: | ||||||||||||
Investments and foreign currency | 8,265,316 | 7,387,024 | 196,291 | |||||||||
|
| |||||||||||
| 8,265,316 | 7,387,024 | 196,291 | ||||||||||
|
| |||||||||||
Net realized and unrealized gain/(loss) | 12,812,341 | 9,870,525 | 3,904,544 | |||||||||
|
| |||||||||||
Net Increase/(Decrease) in Net Assets Resulting From Operations | $ | 12,930,434 | $ | 9,575,502 | $ | 3,827,723 | ||||||
|
| |||||||||||
The accompanying notes are an integral part of the financial statements.
| ||
| 40 | www.iconfunds.com | |
Table of Contents
| ICON Sector Funds | Statements of Operations | |
| Year Ended September 30, 2017 |
ICON Information Technology Fund | ICON Natural Resources Fund | ICON Utilities Fund | ||||||||||
Investment Income | ||||||||||||
Interest | $ | 1,403 | $ | 5,730 | $ | 479 | ||||||
Dividends | 492,593 | 1,191,943 | 2,185,204 | |||||||||
Foreign taxes withheld | (11,571) | (35,085) | (42,285) | |||||||||
Income from securities lending, net | 6,271 | 12,948 | 10,724 | |||||||||
|
| |||||||||||
Total investment income | 488,696 | 1,175,536 | 2,154,122 | |||||||||
|
| |||||||||||
Expenses | ||||||||||||
Advisory fees | 583,558 | 745,353 | 494,628 | |||||||||
Administration fees | 29,109 | 37,167 | 24,653 | |||||||||
Transfer agent fees | 87,288 | 166,737 | 105,898 | |||||||||
Distribution fees: | ||||||||||||
Class C | – | 16,480 | – | |||||||||
Class A | 6,560 | 13,003 | 24,549 | |||||||||
Registration fees | 30,973 | 41,322 | 40,503 | |||||||||
Audit and tax service expense | 17,657 | 17,753 | 17,657 | |||||||||
Fund accounting fees | 23,887 | 31,190 | 20,107 | |||||||||
Trustee fees and expenses | 13,418 | 16,395 | 10,644 | |||||||||
Insurance expense | 4,290 | 5,756 | 5,391 | |||||||||
Custody fees | 5,660 | 5,316 | 5,136 | |||||||||
Printing fees | 13,265 | 24,604 | 15,383 | |||||||||
Interest expense | 710 | 12 | 1,822 | |||||||||
Recoupment of previously reimbursed expenses | 245 | 17,124 | 1,233 | |||||||||
Other expenses | 27,350 | 36,055 | 24,126 | |||||||||
|
| |||||||||||
Total expenses before expense reimbursement | 843,970 | 1,174,267 | 791,730 | |||||||||
Expense reimbursement by Adviser due to expense limitation agreement | (6,814) | (26,508) | (57,017) | |||||||||
|
| |||||||||||
Net Expenses | 837,156 | 1,147,759 | 734,713 | |||||||||
|
| |||||||||||
Net Investment Income/(Loss) | (348,460) | 27,777 | 1,419,409 | |||||||||
|
| |||||||||||
Realized and Unrealized Gain/(Loss) | ||||||||||||
Net realized gain/(loss) on: | ||||||||||||
Investments and foreign currency translations | 14,152,932 | 6,414,936 | 2,393,910 | |||||||||
|
| |||||||||||
| 14,152,932 | 6,414,936 | 2,393,910 | ||||||||||
|
| |||||||||||
Change in unrealized net appreciation/(depreciation) on: | ||||||||||||
Investments and foreign currency | 1,556,770 | 7,243,434 | 556,216 | |||||||||
|
| |||||||||||
| 1,556,770 | 7,243,434 | 556,216 | ||||||||||
|
| |||||||||||
Net realized and unrealized gain/(loss) | 15,709,702 | 13,658,370 | 2,950,126 | |||||||||
|
| |||||||||||
Net Increase/(Decrease) in Net Assets Resulting From Operations | $ | 15,361,242 | $ | 13,686,147 | $ | 4,369,535 | ||||||
|
| |||||||||||
The accompanying notes are an integral part of the financial statements.
| ||
| Annual Report | September 30, 2017 | 41 | |
Table of Contents
| ICON Sector Funds | Statements of Changes in Net Assets | |
| ICON Consumer Discretionary Fund | ICON Consumer Staples Fund | |||||||||||||||
Year Ended September 30, | Year Ended September 30, 2016 | Year Ended September 30, 2017 | Year Ended 2016 | |||||||||||||
Operations | ||||||||||||||||
Net investment income/(loss) | $ | (155,209 | ) | $ | (115,723 | ) | $ | 57,811 | $ | 35,430 | ||||||
Net realized gain/(loss) | 1,102,738 | 2,371,232 | 1,494,029 | 3,041,135 | ||||||||||||
Change in net unrealized appreciation/(depreciation) | 2,370,464 | (204,909 | ) | (51,630 | ) | (1,151,918) | ||||||||||
|
| |||||||||||||||
Net increase/(decrease) in net assets resulting from operations | 3,317,993 | 2,050,600 | 1,500,210 | 1,924,647 | ||||||||||||
|
| |||||||||||||||
Dividends and Distributions to Shareholders | ||||||||||||||||
Net investment income | ||||||||||||||||
Class S | – | – | (73,624 | ) | (2,775) | |||||||||||
Class A | – | – | (7,526 | ) | (282) | |||||||||||
Net realized gains | ||||||||||||||||
Class S | (2,138,950 | ) | (4,142,603 | ) | (3,218,507 | ) | (1,689,533) | |||||||||
Class A | (116,512 | ) | (324,745 | ) | (543,760 | ) | (1,018,358) | |||||||||
|
| |||||||||||||||
Net decrease from dividends and distributions | (2,255,462 | ) | (4,467,348 | ) | (3,843,417 | ) | (2,710,948) | |||||||||
|
| |||||||||||||||
Fund Share Transactions | ||||||||||||||||
Shares sold | ||||||||||||||||
Class S | 9,497,500 | 3,598,562 | 11,907,619 | 31,781,091 | ||||||||||||
Class A | 246,883 | 978,272 | 2,671,835 | 9,210,875 | ||||||||||||
Reinvested dividends and distributions | ||||||||||||||||
Class S | 2,120,009 | 4,104,730 | 3,170,250 | 1,604,272 | ||||||||||||
Class A | 100,528 | 289,861 | 405,750 | 808,132 | ||||||||||||
Shares repurchased | ||||||||||||||||
Class S | (25,345,622 | ) | (13,145,470 | ) | (20,882,818 | ) | (9,693,926) | |||||||||
Class A | (1,272,734 | ) | (1,690,501 | ) | (7,594,959 | ) | (4,969,477) | |||||||||
|
| |||||||||||||||
Net increase/(decrease) from fund share transactions | (14,653,436 | ) | (5,864,546 | ) | (10,322,323 | ) | 28,740,967 | |||||||||
|
| |||||||||||||||
Total net increase/(decrease) in net assets | (13,590,905 | ) | (8,281,294 | ) | (12,665,530 | ) | 27,954,666 | |||||||||
Net Assets | ||||||||||||||||
Beginning of year | 39,630,761 | 47,912,055 | 40,208,097 | 12,253,431 | ||||||||||||
|
| |||||||||||||||
End of year | $ | 26,039,856 | $ | 39,630,761 | $ | 27,542,567 | $ | 40,208,097 | ||||||||
|
| |||||||||||||||
Accumulated undistributed net investment income/(loss) | $ | – | $ | – | $ | 9,783 | $ | 33,122 | ||||||||
|
| |||||||||||||||
Transactions in Fund Shares | ||||||||||||||||
Shares sold | ||||||||||||||||
Class S | 681,550 | 251,318 | 1,568,687 | 3,991,017 | ||||||||||||
Class A | 18,527 | 70,735 | 359,812 | 1,184,079 | ||||||||||||
Issued to shareholders in reinvestment of distributions | ||||||||||||||||
Class S | 155,218 | 307,240 | 450,960 | 212,768 | ||||||||||||
Class A | 7,662 | 22,418 | 57,882 | 107,322 | ||||||||||||
Shares repurchased | ||||||||||||||||
Class S | (1,827,935 | ) | (955,082 | ) | (2,764,087 | ) | (1,161,279) | |||||||||
Class A | (97,189 | ) | (128,008 | ) | (1,004,810 | ) | (626,714) | |||||||||
|
| |||||||||||||||
Net increase/(decrease) | (1,062,167 | ) | (431,379 | ) | (1,331,556 | ) | 3,707,193 | |||||||||
|
| |||||||||||||||
Shares outstanding, beginning of year | 2,931,348 | 3,362,727 | 5,039,303 | 1,332,110 | ||||||||||||
|
| |||||||||||||||
Shares outstanding, end of year | 1,869,181 | 2,931,348 | 3,707,747 | 5,039,303 | ||||||||||||
|
| |||||||||||||||
The accompanying notes are an integral part of the financial statements.
| ||
| 42 | www.iconfunds.com | |
Table of Contents
| ICON Sector Funds | Statements of Changes in Net Assets |
| ICON Energy Fund | ICON Financial Fund | |||||||||||||||
| Year Ended September 30, 2017 | Year Ended September 30, 2016 | Year Ended September 30, 2017 | Year Ended September 30, 2016 | |||||||||||||
Operations | ||||||||||||||||
Net investment income/(loss) | $ | 1,268,204 | $ | 6,869,776 | $ | 118,093 | $ | 487,539 | ||||||||
Net realized gain/(loss) | (10,044,040) | (57,720,482) | 4,547,025 | (4,872,140) | ||||||||||||
Net realized gain/(loss) on long-term capital gain distributions from other investment companies | – | – | – | 3,543 | ||||||||||||
Change in net unrealized appreciation/(depreciation) | 4,187,058 | 100,616,370 | 8,265,316 | 2,869,562 | ||||||||||||
|
| |||||||||||||||
Net increase/(decrease) in net assets resulting from operations | (4,588,778) | 49,765,664 | 12,930,434 | (1,511,496) | ||||||||||||
|
| |||||||||||||||
Dividends and Distributions to Shareholders | ||||||||||||||||
Net investment income | ||||||||||||||||
Class S | (1,879,265) | (3,080,658) | (509,224) | – | ||||||||||||
Class C | (30,917) | (46,988) | – | – | ||||||||||||
Class A | (67,792) | (87,124) | (21,428 | ) | – | |||||||||||
|
| |||||||||||||||
Net decrease from dividends and distributions | (1,977,974) | (3,214,770) | (530,652) | – | ||||||||||||
|
| |||||||||||||||
Fund Share Transactions | ||||||||||||||||
Shares sold | ||||||||||||||||
Class S | 46,169,160 | 109,808,067 | 8,827,182 | 11,122,679 | ||||||||||||
Class C | 443,280 | 1,926,758 | – | – | ||||||||||||
Class A | 1,527,261 | 4,574,292 | 1,061,317 | 1,691,237 | ||||||||||||
Reinvested dividends and distributions | ||||||||||||||||
Class S | 1,809,660 | 2,963,225 | 500,838 | – | ||||||||||||
Class C | 26,876 | 40,797 | – | – | ||||||||||||
Class A | 51,520 | 66,909 | 18,938 | – | ||||||||||||
Shares repurchased | ||||||||||||||||
Class S | (146,633,212) | (149,229,594) | (25,448,695) | (15,374,878) | ||||||||||||
Class C | (3,069,723) | (2,980,604) | – | – | ||||||||||||
Class A | (6,674,244) | (6,498,389) | (2,063,563) | (1,112,225) | ||||||||||||
|
| |||||||||||||||
Net decrease from fund share transactions | (106,349,422) | (39,328,539) | (17,103,983) | (3,673,187) | ||||||||||||
|
| |||||||||||||||
Total net increase/(decrease) in net assets | (112,916,174) | 7,222,355 | (4,704,201) | (5,184,683) | ||||||||||||
Net Assets | ||||||||||||||||
Beginning of year | 352,268,545 | 345,046,190 | 45,895,374 | 51,080,057 | ||||||||||||
|
| |||||||||||||||
End of year | $ | 239,352,371 | $ | 352,268,545 | $ | 41,191,173 | $ | 45,895,374 | ||||||||
|
| |||||||||||||||
Accumulated undistributed net investment income/(loss) | $ | 2,001,726 | $ | (33,682 | ) | $ | 74,836 | $ | 487,449 | |||||||
|
| |||||||||||||||
Transactions in Fund Shares | ||||||||||||||||
Shares sold | ||||||||||||||||
Class S | 3,633,098 | 9,937,173 | 997,694 | 1,386,325 | ||||||||||||
Class C | 35,320 | 173,976 | – | – | ||||||||||||
Class A | 120,649 | 405,435 | 116,684 | 225,786 | ||||||||||||
Issued to shareholders in reinvestment of distributions | ||||||||||||||||
Class S | 137,774 | 278,237 | 54,796 | – | ||||||||||||
Class C | 2,223 | 3,961 | – | – | ||||||||||||
Class A | 3,966 | 6,295 | 2,061 | – | ||||||||||||
Shares repurchased | ||||||||||||||||
Class S | (11,866,130) | (13,027,347) | (2,780,941) | (2,072,996) | ||||||||||||
Class C | (256,061) | (270,035) | – | – | ||||||||||||
Class A | (538,667) | (561,929) | (236,075) | (148,818) | ||||||||||||
|
| |||||||||||||||
Net decrease | (8,727,828) | (3,054,234) | (1,845,781) | (609,703) | ||||||||||||
|
| |||||||||||||||
Shares outstanding, beginning of year | 27,869,154 | 30,923,388 | 5,983,700 | 6,593,403 | ||||||||||||
|
| |||||||||||||||
Shares outstanding, end of year | 19,141,326 | 27,869,154 | 4,137,919 | 5,983,700 | ||||||||||||
|
| |||||||||||||||
The accompanying notes are an integral part of the financial statements.
| ||
| Annual Report | September 30, 2017 | 43 | |
Table of Contents
| ICON Sector Funds | Statements of Changes in Net Assets | |
| ICON Healthcare Fund | ICON Industrials Fund | |||||||||||||||
| ||||||||||||||||
| Year Ended September 30, 2017 | Year Ended September 30, 2016 | Year Ended September 30, 2017 | Year Ended September 30, 2016 | |||||||||||||
| ||||||||||||||||
Operations | ||||||||||||||||
Net investment income/(loss) | $ | (295,023) | $ | (256,229) | $ | (76,821) | $ | (24,274) | ||||||||
Net realized gain/(loss) | 2,483,501 | 1,360,141 | 3,708,253 | 1,229,396 | ||||||||||||
Change in net unrealized appreciation/(depreciation) | 7,387,024 | 6,368,752 | 196,291 | 210,733 | ||||||||||||
|
| |||||||||||||||
Net increase/(decrease) in net assets resulting from operations | 9,575,502 | 7,472,664 | 3,827,723 | 1,415,855 | ||||||||||||
|
| |||||||||||||||
Dividends and Distributions to Shareholders | ||||||||||||||||
Net realized gains | ||||||||||||||||
Class S | (1,138,922) | (18,074,605) | – | – | ||||||||||||
Class A | (76,949) | (2,959,679) | – | – | ||||||||||||
|
| |||||||||||||||
Net decrease from dividends and distributions | (1,215,871) | (21,034,284) | – | – | ||||||||||||
|
| |||||||||||||||
Fund Share Transactions | ||||||||||||||||
Shares sold | ||||||||||||||||
Class S | 22,175,488 | 8,840,606 | 15,170,976 | 13,580,388 | ||||||||||||
Class A | 1,114,090 | 1,044,829 | 3,385,400 | 865,729 | ||||||||||||
Reinvested dividends and distributions | ||||||||||||||||
Class S | 1,092,964 | 17,161,570 | – | – | ||||||||||||
Class A | 69,063 | 2,747,924 | – | – | ||||||||||||
Shares repurchased | ||||||||||||||||
Class S | (24,240,347) | (33,976,571) | (27,048,093) | (5,225,967) | ||||||||||||
Class A | (2,487,427) | (11,543,997) | (2,403,341) | (528,190) | ||||||||||||
|
| |||||||||||||||
Net increase/(decrease) from fund share transactions | (2,276,169) | (15,725,639) | (10,895,058) | 8,691,960 | ||||||||||||
|
| |||||||||||||||
Total net increase/(decrease) in net assets | 6,083,462 | (29,287,259) | (7,067,335) | 10,107,815 | ||||||||||||
Net Assets | ||||||||||||||||
Beginning of year | 81,138,959 | 110,426,218 | 24,954,867 | 14,847,052 | ||||||||||||
|
| |||||||||||||||
End of year | $ | 87,222,421 | $ | 81,138,959 | $ | 17,887,532 | $ | 24,954,867 | ||||||||
|
| |||||||||||||||
Accumulated undistributed net investment income/(loss) | $ | – | $ | (63,244) | $ | (36,399) | $ | (22,535) | ||||||||
|
| |||||||||||||||
Transactions in Fund Shares | ||||||||||||||||
Shares sold | ||||||||||||||||
Class S | 1,440,106 | 571,957 | 1,120,214 | 1,102,557 | ||||||||||||
Class A | 74,903 | 67,963 | 250,786 | 72,878 | ||||||||||||
Issued to shareholders in reinvestment of distributions | ||||||||||||||||
Class S | 73,403 | 1,165,868 | – | – | ||||||||||||
Class A | 4,823 | 193,108 | – | – | ||||||||||||
Shares repurchased | ||||||||||||||||
Class S | (1,557,432) | (2,124,163) | (2,039,881) | (451,383) | ||||||||||||
Class A | (166,432) | (811,470) | (170,333) | (45,537) | ||||||||||||
|
| |||||||||||||||
Net increase/(decrease) | (130,629) | (936,737) | (839,214) | 678,515 | ||||||||||||
|
| |||||||||||||||
Shares outstanding, beginning of year | 5,279,300 | 6,216,037 | 2,035,764 | 1,357,249 | ||||||||||||
|
| |||||||||||||||
Shares outstanding, end of year | 5,148,671 | 5,279,300 | 1,196,550 | 2,035,764 | ||||||||||||
|
| |||||||||||||||
The accompanying notes are an integral part of the financial statements.
| ||
| 44 | www.iconfunds.com | |
Table of Contents
| ICON Sector Funds | Statements of Changes in Net Assets | |
| ICON Information Technology Fund | ICON Natural Resources Fund | |||||||||||||||
| ||||||||||||||||
| Year Ended September 30, 2017 | Year Ended September 30, 2016 | Year Ended September 30, 2017 | Year Ended September 30, 2016 (a) | |||||||||||||
| ||||||||||||||||
Operations | ||||||||||||||||
Net investment income/(loss) | $ | (348,460) | $ | (219,517) | $ | 27,777 | $ | 524,612 | ||||||||
Net realized gain/(loss) | 14,152,932 | 9,737,627 | 6,414,936 | (4,590,557) | ||||||||||||
Change in net unrealized appreciation/(depreciation) | 1,556,770 | (1,066,435) | 7,243,434 | 15,224,010 | ||||||||||||
|
| |||||||||||||||
Net increase/(decrease) in net assets resulting from operations | 15,361,242 | 8,451,675 | 13,686,147 | 11,158,065 | ||||||||||||
|
| |||||||||||||||
Dividends and Distributions to Shareholders | ||||||||||||||||
Net investment income | ||||||||||||||||
Class S | – | – | (388,278) | (322,749) | ||||||||||||
Class C | – | – | (5,892) | – | ||||||||||||
Class A | – | – | (22,709) | (2,353) | ||||||||||||
Net realized gains | ||||||||||||||||
Class S | (8,893,473) | – | – | (4,489,113) | ||||||||||||
Class C | – | – | – | (52,186) | ||||||||||||
Class A | (461,260) | – | – | (201,365) | ||||||||||||
|
| |||||||||||||||
Net decrease from dividends and distributions | (9,354,733) | – | (416,879) | (5,067,766) | ||||||||||||
|
| |||||||||||||||
Fund Share Transactions | ||||||||||||||||
Shares sold | ||||||||||||||||
Class S | 28,195,461 | 18,296,541 | 23,396,295 | 16,580,790 | ||||||||||||
Class C | – | – | 537,226 | 828,203 | ||||||||||||
Class A | 801,128 | 1,908,013 | 3,523,369 | 4,545,786 | ||||||||||||
Reinvested dividends and distributions | ||||||||||||||||
Class S | 8,699,541 | – | 378,212 | 4,690,853 | ||||||||||||
Class C | – | – | 5,266 | 43,566 | ||||||||||||
Class A | 403,556 | – | 19,756 | 183,313 | ||||||||||||
Shares repurchased | ||||||||||||||||
Class S | (20,398,791) | (22,597,870) | (32,337,540) | (21,368,193) | ||||||||||||
Class C | – | – | (496,670) | (401,215) | ||||||||||||
Class A | (1,206,856) | (2,987,018) | (3,138,040) | (3,837,341) | ||||||||||||
|
| |||||||||||||||
Net increase/(decrease) from fund share transactions | 16,494,039 | (5,380,334) | (8,112,126) | 1,265,762 | ||||||||||||
|
| |||||||||||||||
Total net increase in net assets | 22,500,548 | 3,071,341 | 5,157,142 | 7,356,061 | ||||||||||||
Net Assets | ||||||||||||||||
Beginning of year | 51,583,842 | 48,512,501 | 71,672,382 | 64,316,321 | ||||||||||||
|
| |||||||||||||||
End of year | $ | 74,084,390 | $ | 51,583,842 | $ | 76,829,524 | $ | 71,672,382 | ||||||||
|
| |||||||||||||||
Accumulated undistributed net investment income/(loss) | $ | (165,161) | $ | – | $ | – | $ | 400,690 | ||||||||
|
| |||||||||||||||
The accompanying notes are an integral part of the financial statements.
| ||
| Annual Report | September 30, 2017 | 45 | |
Table of Contents
| ICON Sector Funds | Statements of Changes in Net Assets | |
| ICON Information Technology Fund | ICON Natural Resources Fund | |||||||||||||
| ||||||||||||||
| Year Ended September 30, 2017 | Year Ended September 30, 2016 | Year Ended September 30, 2017 | Year Ended September 30, 2016 (a) | |||||||||||
| ||||||||||||||
Transactions in Fund Shares | ||||||||||||||
Shares sold | ||||||||||||||
Class S | 1,640,887 | 1,105,056 | 1,669,498 | 1,391,294 | ||||||||||
Class C | – | – | 39,885 | 72,656 | ||||||||||
Class A | 48,922 | 119,658 | 251,811 | 384,690 | ||||||||||
Issued to shareholders in reinvestment of distributions | ||||||||||||||
Class S | 574,606 | – | 27,073 | 422,219 | ||||||||||
Class C | – | – | 391 | 4,038 | ||||||||||
Class A | 27,453 | – | 1,425 | 16,604 | ||||||||||
Shares repurchased | ||||||||||||||
Class S | (1,219,807) | (1,410,912) | (2,294,834) | (1,776,770) | ||||||||||
Class C | – | – | (36,440) | (33,139) | ||||||||||
Class A | (73,420) | (186,123) | (231,822) | (313,793) | ||||||||||
|
| |||||||||||||
Net increase/(decrease) | 998,641 | (372,321) | (573,013) | 167,799 | ||||||||||
|
| |||||||||||||
Shares outstanding, beginning of year | 2,876,116 | 3,248,437 | 5,595,406 | 5,427,607 | ||||||||||
|
| |||||||||||||
Shares outstanding, end of year | 3,874,757 | 2,876,116 | 5,022,393 | 5,595,406 | ||||||||||
|
| |||||||||||||
| (a) | Prior to January 22, 2016, the ICON Natural Resources Fund was known as the ICON Materials Fund. |
The accompanying notes are an integral part of the financial statements.
| ||
| 46 | www.iconfunds.com | |
Table of Contents
| ICON Sector Funds | Statements of Changes in Net Assets | |
| ICON Utilities Fund | ||||||||
| Year Ended September 30, 2017 | Year Ended September 30, 2016 | ||||||
Operations | ||||||||
Net investment income/(loss) | $ | 1,419,409 | $ | 1,459,825 | ||||
Net realized gain/(loss) | 2,393,910 | 4,283,561 | ||||||
Change in net unrealized appreciation/(depreciation) | 556,216 | 1,873,338 | ||||||
|
| |||||||
Net increase/(decrease) in net assets resulting from operations | 4,369,535 | 7,616,724 | ||||||
|
| |||||||
Dividends and Distributions to Shareholders | ||||||||
Net investment income | ||||||||
Class S | (1,153,157) | (1,106,247) | ||||||
Class A | (256,453) | (318,477) | ||||||
Net realized gains | ||||||||
Class S | (3,388,000) | – | ||||||
Class A | (880,434) | – | ||||||
|
| |||||||
Net decrease from dividends and distributions | (5,678,044) | (1,424,724) | ||||||
|
| |||||||
Fund Share Transactions | ||||||||
Shares sold | ||||||||
Class S | 17,370,144 | 50,937,665 | ||||||
Class A | 2,115,878 | 12,140,072 | ||||||
Reinvested dividends and distributions | ||||||||
Class S | 4,286,520 | 1,060,746 | ||||||
Class A | 729,618 | 221,423 | ||||||
Shares repurchased | ||||||||
Class S | (28,830,643) | (31,789,944) | ||||||
Class A | (9,984,766) | (3,816,717) | ||||||
|
| |||||||
Net increase/(decrease) from fund share transactions | (14,313,249) | 28,753,245 | ||||||
|
| |||||||
Total net increase/(decrease) in net assets | (15,621,758) | 34,945,245 | ||||||
Net Assets | ||||||||
Beginning of year | 59,731,533 | 24,786,288 | ||||||
|
| |||||||
End of year | $ | 44,109,775 | $ | 59,731,533 | ||||
|
| |||||||
Accumulated undistributed net investment income/(loss) | $ | 225,952 | $ | 22,990 | ||||
|
| |||||||
Transactions in Fund Shares | ||||||||
Shares sold | ||||||||
Class S | 1,896,662 | 5,504,446 | ||||||
Class A | 234,414 | 1,380,355 | ||||||
Issued to shareholders in reinvestment of distributions | ||||||||
Class S | 482,202 | 114,167 | ||||||
Class A | 83,540 | 23,829 | ||||||
Shares repurchased | ||||||||
Class S | (3,147,439) | (3,372,689) | ||||||
Class A | (1,107,673) | (424,156) | ||||||
|
| |||||||
Net increase/(decrease) | (1,558,294) | 3,225,952 | ||||||
|
| |||||||
Shares outstanding, beginning of year | 6,321,006 | 3,095,054 | ||||||
|
| |||||||
Shares outstanding, end of year | 4,762,712 | 6,321,006 | ||||||
|
| |||||||
The accompanying notes are an integral part of the financial statements.
| ||
| Annual Report | September 30, 2017 | 47 | |
Table of Contents
| ICON Consumer Discretionary Fund | Financial Highlights | |
| For a Share Outstanding Throughout the Periods Presented |
| Class S | Year Ended September 30, 2017 | Year Ended September 30, 2016 | Year Ended September 30, 2015 | Year Ended September 30, 2014 | Year Ended September 30, 2013 | |||||||||||||||||||||||
Net asset value, beginning of period | $ | 13.55 | $ | 14.27 | $ | 15.55 | $ | 14.50 | $ | 11.82 | ||||||||||||||||||
Income/(loss) from investment operations: | ||||||||||||||||||||||||||||
Net investment income/(loss)(a)(b) | (0.06) | (0.03) | (0.07) | (0.07) | (0.03) | |||||||||||||||||||||||
Net realized and unrealized gains/(losses) on investments | 1.25 | 0.65 | 1.03 | 1.12 | 2.73 | |||||||||||||||||||||||
Total from investment operations | 1.19 | 0.62 | 0.96 | 1.05 | 2.70 | |||||||||||||||||||||||
Less dividends and distributions: | ||||||||||||||||||||||||||||
Dividends from net investment income | – | – | – | – | (0.02) | |||||||||||||||||||||||
Distributions from net realized gains | (0.77) | (1.34) | (2.24) | – | – | |||||||||||||||||||||||
Total dividends and distributions | (0.77) | (1.34) | (2.24) | – | (0.02) | |||||||||||||||||||||||
Net asset value, end of period | $ | 13.97 | $ | 13.55 | $ | 14.27 | $ | 15.55 | $ | 14.50 | ||||||||||||||||||
Total Return | 8.93 | % | 4.49 | % | 5.80 | % | 7.24 | % | 22.91 | % | ||||||||||||||||||
Ratios and Supplemental Data | ||||||||||||||||||||||||||||
Net assets, end of period (in 000s) | $ | 24,566 | $ | 37,263 | $ | 44,913 | $ | 55,476 | $ | 39,883 | ||||||||||||||||||
Ratio of expenses to average net assets | ||||||||||||||||||||||||||||
Before expense limitation | 1.46 | % | 1.42 | % | 1.43 | % | 1.46 | % | 1.38 | % | ||||||||||||||||||
After expense limitation(c) | 1.46 | % | 1.42 | % | 1.43 | % | 1.46 | % | 1.38 | % | ||||||||||||||||||
Ratio of net investment income/(loss) to average net assets | ||||||||||||||||||||||||||||
Before expense limitation | (0.43) | % | (0.22) | % | (0.44) | % | (0.47) | % | (0.21) | % | ||||||||||||||||||
After expense limitation(c) | (0.43) | % | (0.22) | % | (0.44) | % | (0.47) | % | (0.21) | % | ||||||||||||||||||
Portfolio turnover rate | 152 | % | 158 | % | 201 | % | 202 | % | 87 | % | ||||||||||||||||||
| (a) | Calculated using the average shares method. |
| (b) | The per share amount does not correspond to activity reflected in the Statement of Operations due to class specific expenses during the period. |
| (c) | The Fund’s operating expenses, not including interest expense, are contractually limited to the amounts discussed in Note 3. The ratios in these financial highlights reflect the limitation, including the interest expense, when applicable. |
The accompanying notes are an integral part of the financial statements.
| ||
| 48 | www.iconfunds.com | |
Table of Contents
| ICON Consumer Discretionary Fund | Financial Highlights | |
| For a Share Outstanding Throughout the Periods Presented |
| Class A(a) | Year Ended September 30, 2017 | Year Ended September 30, 2016 | Year Ended September 30, 2015 | Year Ended September 30, 2014 | Year Ended September 30, 2013 | |||||||||||||||||||||||
Net asset value, beginning of period | $ | 13.06 | $ | 13.88 | $ | 15.24 | $ | 14.25 | $ | 11.65 | ||||||||||||||||||
Income/(loss) from investment operations: | ||||||||||||||||||||||||||||
Net investment income/(loss)(b)(c) | (0.13) | (0.10) | (0.14) | (0.12) | (0.09) | |||||||||||||||||||||||
Net realized and unrealized gains/(losses) on investments | 1.20 | 0.62 | 1.02 | 1.11 | 2.69 | |||||||||||||||||||||||
Total from investment operations | 1.07 | 0.52 | 0.88 | 0.99 | 2.60 | |||||||||||||||||||||||
Less dividends and distributions: | ||||||||||||||||||||||||||||
Distributions from net realized gains | (0.77) | (1.34) | (2.24) | – | – | |||||||||||||||||||||||
Total dividends and distributions | (0.77) | (1.34) | (2.24) | – | – | |||||||||||||||||||||||
Net asset value, end of period | $ | 13.36 | $ | 13.06 | $ | 13.88 | $ | 15.24 | $ | 14.25 | ||||||||||||||||||
Total Return(d) | 8.32 | % | 3.86 | % | 5.34 | % | 6.95 | % | 22.42 | % | ||||||||||||||||||
Ratios and Supplemental Data | ||||||||||||||||||||||||||||
Net assets, end of period (in 000s) | $ | 1,474 | $ | 2,368 | $ | 2,999 | $ | 2,492 | $ | 4,699 | ||||||||||||||||||
Ratio of expenses to average net assets | ||||||||||||||||||||||||||||
Before expense limitation | 2.22 | % | 2.13 | % | 1.91 | % | 1.76 | % | 1.78 | % | ||||||||||||||||||
After expense limitation(e) | 1.99 | % | 1.99 | % | 1.91 | % | 1.76 | % | 1.78 | % | ||||||||||||||||||
Ratio of net investment income/(loss) to average net assets | ||||||||||||||||||||||||||||
Before expense limitation | (1.20) | % | (0.92) | % | (0.97) | % | (0.80) | % | (0.66) | % | ||||||||||||||||||
After expense limitation(e) | (0.97) | % | (0.78) | % | (0.97) | % | (0.80) | % | (0.66) | % | ||||||||||||||||||
Portfolio turnover rate | 152 | % | 158 | % | 201 | % | 202 | % | 87 | % | ||||||||||||||||||
| (a) | Class C shares were merged into Class A on September 25, 2015. The amounts presented represent the results of the Class A shares for the periods prior to the merger and the results of the combined share class for the period subsequent to the merger. |
| (b) | Calculated using the average shares method. |
| (c) | The per share amount does not correspond to activity reflected in the Statement of Operations due to class specific expenses during the period. |
| (d) | The total return calculation excludes any sales charges. |
| (e) | The Fund’s operating expenses, not including interest expense, are contractually limited to the amounts discussed in Note 3. The ratios in these financial highlights reflect the limitation, including the interest expense, when applicable. |
The accompanying notes are an integral part of the financial statements.
| ||
| Annual Report | September 30, 2017 | 49 | |
Table of Contents
| ICON Consumer Staples Fund | Financial Highlights | |
| For a Share Outstanding Throughout the Periods Presented |
| Class S | Year Ended September 30, 2017 | Year Ended September 30, 2016 | Year Ended September 30, 2015 | Year Ended September 30, 2014 | Year Ended September 30, 2013 | |||||||||||||||||||||||
Net asset value, beginning of period | $ | 7.98 | $ | 9.20 | $ | 11.55 | $ | 11.18 | $ | 10.20 | ||||||||||||||||||
Income/(loss) from investment operations: | ||||||||||||||||||||||||||||
Net investment income/(loss)(a)(b) | 0.02 | 0.02 | 0.04 | 0.11 | 0.21 | |||||||||||||||||||||||
Net realized and unrealized gains/(losses) on investments | 0.41 | 0.96 | 0.98 | 1.31 | 0.98 | |||||||||||||||||||||||
Total from investment operations | 0.43 | 0.98 | 1.02 | 1.42 | 1.19 | |||||||||||||||||||||||
Less dividends and distributions: | ||||||||||||||||||||||||||||
Dividends from net investment income | (0.02) | (0.00) | (c) | (0.22) | (0.03) | (0.21) | ||||||||||||||||||||||
Distributions from net realized gains | (0.96) | (2.20) | (3.15) | (1.02) | – | |||||||||||||||||||||||
Total dividends and distributions | (0.98) | (2.20) | (3.37) | (1.05) | (0.21) | |||||||||||||||||||||||
Net asset value, end of period | $ | 7.43 | $ | 7.98 | $ | 9.20 | $ | 11.55 | $ | 11.18 | ||||||||||||||||||
Total Return | 6.15 | % | 12.09 | % | 8.66 | % | 13.32 | % | 11.75 | % | ||||||||||||||||||
Ratios and Supplemental Data | ||||||||||||||||||||||||||||
Net assets, end of period (in 000s) | $ | 24,069 | $ | 31,799 | $ | 8,651 | $ | 25,731 | $ | 33,813 | ||||||||||||||||||
Ratio of expenses to average net assets | ||||||||||||||||||||||||||||
Before expense limitation | 1.70 | % | 1.74 | % | 1.87 | % | 1.45 | % | 1.51 | % | ||||||||||||||||||
After expense limitation(d) | 1.50 | % | 1.51 | % | 1.51 | % | 1.45 | % | 1.51 | % | ||||||||||||||||||
Ratio of net investment income/(loss) to average net assets | ||||||||||||||||||||||||||||
Before expense limitation | 0.04 | % | 0.00% | (e) | (0.01) | % | 0.94 | % | 1.92 | % | ||||||||||||||||||
After expense limitation(d) | 0.24 | % | 0.23 | % | 0.35 | % | 0.94 | % | 1.92 | % | ||||||||||||||||||
Portfolio turnover rate | 118 | % | 125 | % | 16 | % | 52 | % | 91 | % | ||||||||||||||||||
| (a) | Calculated using the average shares method. |
| (b) | The per share amount does not correspond to activity reflected in the Statement of Operations due to class specific expenses during the period. |
| (c) | Amount less than $(0.005). |
| (d) | The Fund’s operating expenses, not including interest expense, are contractually limited to the amounts discussed in Note 3. The ratios in these financial highlights reflect the limitation, including the interest expense, when applicable. |
| (e) | Less than 0.005% of average net assets. |
The accompanying notes are an integral part of the financial statements.
| ||
| 50 | www.iconfunds.com | |
Table of Contents
| ICON Consumer Staples Fund | Financial Highlights | |
| For a Share Outstanding Throughout the Periods Presented |
| Class A(a) | Year Ended September 30, 2017 | Year Ended September 30, 2016 | Year Ended September 30, 2015 | Year Ended September 30, 2014 | Year Ended September 30, 2013 | |||||||||||||||||||||||
Net asset value, beginning of period | $ | 7.96 | $ | 9.19 | $ | 11.58 | $ | 11.23 | $ | 10.24 | ||||||||||||||||||
Income/(loss) from investment operations: | ||||||||||||||||||||||||||||
Net investment income/(loss)(b)(c) | (0.01) | (0.00) | (d) | 0.02 | 0.07 | 0.14 | ||||||||||||||||||||||
Net realized and unrealized gains/(losses) on investments | 0.42 | 0.97 | 0.97 | 1.32 | 1.03 | |||||||||||||||||||||||
Total from investment operations | 0.41 | 0.97 | 0.99 | 1.39 | 1.17 | |||||||||||||||||||||||
Less dividends and distributions: | ||||||||||||||||||||||||||||
Dividends from net investment income | (0.01) | (0.00) | (d) | (0.23) | (0.02) | (0.18) | ||||||||||||||||||||||
Distributions from net realized gains | (0.96) | (2.20) | (3.15) | (1.02) | – | |||||||||||||||||||||||
Total dividends and distributions | (0.97) | (2.20) | (3.38) | (1.04) | (0.18) | |||||||||||||||||||||||
Net asset value, end of period | $ | 7.40 | $ | 7.96 | $ | 9.19 | $ | 11.58 | $ | 11.23 | ||||||||||||||||||
Total Return(e) | 5.91 | % | 11.93 | % | 8.32 | % | 12.99 | % | 11.52 | % | ||||||||||||||||||
Ratios and Supplemental Data | ||||||||||||||||||||||||||||
Net assets, end of period (in 000s) | $ | 3,473 | $ | 8,409 | $ | 3,602 | $ | 2,740 | $ | 2,744 | ||||||||||||||||||
Ratio of expenses to average net assets | ||||||||||||||||||||||||||||
Before expense limitation | 1.97 | % | 1.97 | % | 2.12 | % | 2.04 | % | 1.84 | % | ||||||||||||||||||
After expense limitation(f) | 1.75 | % | 1.76 | % | 1.76 | % | 1.75 | % | 1.75 | % | ||||||||||||||||||
Ratio of net investment income/(loss) to average net assets | ||||||||||||||||||||||||||||
Before expense limitation | (0.30) | % | (0.23) | % | (0.15) | % | 0.35 | % | 1.20 | % | ||||||||||||||||||
After expense limitation(f) | (0.08) | % | (0.02) | % | 0.21 | % | 0.64 | % | 1.29 | % | ||||||||||||||||||
Portfolio turnover rate | 118 | % | 125 | % | 16 | % | 52 | % | 91 | % | ||||||||||||||||||
| (a) | Class C shares were merged into Class A on September 25, 2015. The amounts presented represent the results of the Class A shares for the periods prior to the merger and the results of the combined share class for the period subsequent to the merger. |
| (b) | Calculated using the average shares method. |
| (c) | The per share amount does not correspond to activity reflected in the Statement of Operations due to class specific expenses during the period. |
| (d) | Amount less than $(0.005). |
| (e) | The total return calculation excludes any sales charges. |
| (f) | The Fund’s operating expenses, not including interest expense, are contractually limited to the amounts discussed in Note 3. The ratios in these financial highlights reflect the limitation, including the interest expense, when applicable. |
The accompanying notes are an integral part of the financial statements.
| ||
| Annual Report | September 30, 2017 | 51 | |
Table of Contents
| ICON Energy Fund | Financial Highlights | |
| For a Share Outstanding Throughout the Periods Presented |
| Class S | Year Ended September 30, 2017 | Year Ended September 30, 2016 | Year Ended September 30, 2015 | Year Ended September 30, 2014 | Year Ended September 30, 2013 | |||||||||||||||||||||||
Net asset value, beginning of period | $ | 12.66 | $ | 11.17 | $ | 22.30 | $ | 22.59 | $ | 19.18 | ||||||||||||||||||
Income/(loss) from investment operations: | ||||||||||||||||||||||||||||
Net investment income/(loss)(a)(b) | 0.06 | 0.24 | 0.11 | 0.11 | 0.18 | |||||||||||||||||||||||
Net realized and unrealized gains/(losses) on investments | (0.11) | 1.36 | (7.42) | 0.33 | 3.51 | |||||||||||||||||||||||
Total from investment operations | (0.05) | 1.60 | (7.31) | 0.44 | 3.69 | |||||||||||||||||||||||
Less dividends and distributions: | ||||||||||||||||||||||||||||
Dividends from net investment income | (0.08) | (0.11) | (0.09) | (0.06) | (0.28) | |||||||||||||||||||||||
Distributions from net realized gains | – | – | (3.73) | (0.67) | – | |||||||||||||||||||||||
Total dividends and distributions | (0.08) | (0.11) | (3.82) | (0.73) | (0.28) | |||||||||||||||||||||||
Net asset value, end of period | $ | 12.53 | $ | 12.66 | $ | 11.17 | $ | 22.30 | $ | 22.59 | ||||||||||||||||||
Total Return | (0.44) | % | 14.55 | % | (36.37) | % | 1.92 | % | 19.55 | % | ||||||||||||||||||
Ratios and Supplemental Data | ||||||||||||||||||||||||||||
Net assets, end of period (in 000s) | $ | 222,707 | $ | 327,497 | $ | 320,486 | $ | 615,541 | $ | 659,581 | ||||||||||||||||||
Ratio of expenses to average net assets | ||||||||||||||||||||||||||||
Before expense limitation | 1.41 | % | 1.44 | % | 1.42 | % | 1.28 | % | 1.29 | % | ||||||||||||||||||
After expense limitation(c) | 1.41 | % | 1.44 | % | 1.42 | % | 1.28 | % | 1.29 | % | ||||||||||||||||||
Ratio of net investment income/(loss) to average net assets | ||||||||||||||||||||||||||||
Before expense limitation | 0.46 | % | 2.04 | % | 0.74 | % | 0.46 | % | 0.85 | % | ||||||||||||||||||
After expense limitation(c) | 0.46 | % | 2.04 | % | 0.74 | % | 0.46 | % | 0.85 | % | ||||||||||||||||||
Portfolio turnover rate | 74 | % | 99 | % | 154 | % | 97 | % | 88 | % | ||||||||||||||||||
| (a) | Calculated using the average shares method. |
| (b) | The per share amount does not correspond to activity reflected in the Statement of Operations due to class specific expenses during the period. |
| (c) | The Fund’s operating expenses, not including interest expense, are contractually limited to the amounts discussed in Note 3. The ratios in these financial highlights reflect the limitation, including the interest expense, when applicable. |
The accompanying notes are an integral part of the financial statements.
| ||
| 52 | www.iconfunds.com | |
Table of Contents
| ICON Energy Fund | Financial Highlights | |
| For a Share Outstanding Throughout the Periods Presented |
| Class C | Year Ended September 30, 2017 | Year Ended September 30, 2016 | Year Ended September 30, 2015 | Year Ended September 30, 2014 | Year Ended September 30, 2013 | |||||||||||||||||||||||
Net asset value, beginning of period | $ | 12.14 | $ | 10.77 | $ | 21.74 | $ | 22.21 | $ | 18.87 | ||||||||||||||||||
Income/(loss) from investment operations: | ||||||||||||||||||||||||||||
Net investment income/(loss)(a)(b) | (0.07) | 0.11 | (0.04) | (0.15) | (0.05) | |||||||||||||||||||||||
Net realized and unrealized gains/(losses) on investments | (0.11) | 1.31 | (7.20) | 0.35 | 3.48 | |||||||||||||||||||||||
Total from investment operations | (0.18) | 1.42 | (7.24) | 0.20 | 3.43 | |||||||||||||||||||||||
Less dividends and distributions: | ||||||||||||||||||||||||||||
Dividends from net investment income | (0.04) | (0.05) | – | – | (0.09) | |||||||||||||||||||||||
Distributions from net realized gains | – | – | (3.73) | (0.67) | – | |||||||||||||||||||||||
Total dividends and distributions | (0.04) | (0.05) | (3.73) | (0.67) | (0.09) | |||||||||||||||||||||||
Net asset value, end of period | $ | 11.92 | $ | 12.14 | $ | 10.77 | $ | 21.74 | $ | 22.21 | ||||||||||||||||||
Total Return(c) | (1.46) | % | 13.31 | % | (36.99) | % | 0.83 | % | 18.30 | % | ||||||||||||||||||
Ratios and Supplemental Data | ||||||||||||||||||||||||||||
Net assets, end of period (in 000s) | $ | 7,333 | $ | 10,124 | $ | 9,972 | $ | 17,170 | $ | 14,691 | ||||||||||||||||||
Ratio of expenses to average net assets | ||||||||||||||||||||||||||||
Before expense limitation | 2.47 | % | 2.49 | % | 2.43 | % | 2.38 | % | 2.35 | % | ||||||||||||||||||
After expense limitation(d) | 2.47 | % | 2.49 | % | 2.43 | % | 2.38 | % | 2.35 | % | ||||||||||||||||||
Ratio of net investment income/(loss) to average net assets | ||||||||||||||||||||||||||||
Before expense limitation | (0.61) | % | 0.99 | % | (0.26) | % | (0.65) | % | (0.25) | % | ||||||||||||||||||
After expense limitation(d) | (0.61) | % | 0.99 | % | (0.26) | % | (0.65) | % | (0.25) | % | ||||||||||||||||||
Portfolio turnover rate | 74 | % | 99 | % | 154 | % | 97 | % | 88 | % | ||||||||||||||||||
| (a) | Calculated using the average shares method. |
| (b) | The per share amount does not correspond to activity reflected in the Statement of Operations due to class specific expenses during the period. |
| (c) | The total return calculation excludes any sales charges. |
| (d) | The Fund’s operating expenses, not including interest expense, are contractually limited to the amounts discussed in Note 3. The ratios in these financial highlights reflect the limitation, including the interest expense, when applicable. |
The accompanying notes are an integral part of the financial statements.
| ||
| Annual Report | September 30, 2017 | 53 | |
Table of Contents
| ICON Energy Fund | Financial Highlights | |
| For a Share Outstanding Throughout the Periods Presented |
| Class A | Year Ended 2017 | Year Ended 2016 | Year Ended 2015 | Year Ended 2014 | Year Ended 2013 | |||||||||||||||||||||||
Net asset value, beginning of period | $ | 12.60 | $ | 11.11 | $ | 22.20 | $ | 22.50 | $ | 19.12 | ||||||||||||||||||
Income/(loss) from investment operations: | ||||||||||||||||||||||||||||
Net investment income/(loss)(a)(b) | 0.02 | 0.21 | 0.07 | 0.04 | 0.11 | |||||||||||||||||||||||
Net realized and unrealized gains/(losses) on investments | (0.11) | 1.35 | (7.39) | 0.35 | 3.51 | |||||||||||||||||||||||
Total from investment operations | (0.09) | 1.56 | (7.32) | 0.39 | 3.62 | |||||||||||||||||||||||
Less dividends and distributions: | ||||||||||||||||||||||||||||
Dividends from net investment income | (0.07) | (0.07) | (0.04) | (0.02) | (0.24) | |||||||||||||||||||||||
Distributions from net realized gains | – | – | (3.73) | (0.67) | – | |||||||||||||||||||||||
Total dividends and distributions | (0.07) | (0.07) | (3.77) | (0.69) | (0.24) | |||||||||||||||||||||||
Net asset value, end of period | $ | 12.44 | $ | 12.60 | $ | 11.11 | $ | 22.20 | $ | 22.50 | ||||||||||||||||||
Total Return(c) | (0.76) | % | 14.19 | % | (36.55) | % | 1.67 | % | 19.21 | % | ||||||||||||||||||
Ratios and Supplemental Data | ||||||||||||||||||||||||||||
Net assets, end of period (in 000s) | $ | 9,312 | $ | 14,648 | $ | 14,588 | $ | 26,695 | $ | 26,170 | ||||||||||||||||||
Ratio of expenses to average net assets | ||||||||||||||||||||||||||||
Before expense limitation | 1.72 | % | 1.73 | % | 1.66 | % | 1.55 | % | 1.61 | % | ||||||||||||||||||
After expense limitation(d) | 1.72 | % | 1.73 | % | 1.66 | % | 1.55 | % | 1.61 | % | ||||||||||||||||||
Ratio of net investment income/(loss) to average net assets | ||||||||||||||||||||||||||||
Before expense limitation | 0.15 | % | 1.77 | % | 0.50 | % | 0.19 | % | 0.51 | % | ||||||||||||||||||
After expense limitation(d) | 0.15 | % | 1.77 | % | 0.50 | % | 0.19 | % | 0.51 | % | ||||||||||||||||||
Portfolio turnover rate | 74 | % | 99 | % | 154 | % | 97 | % | 88 | % | ||||||||||||||||||
| (a) | Calculated using the average shares method. |
| (b) | The per share amount does not correspond to activity reflected in the Statement of Operations due to class specific expenses during the period. |
| (c) | The total return calculation excludes any sales charges. |
| (d) | The Fund’s operating expenses, not including interest expense, are contractually limited to the amounts discussed in Note 3. The ratios in these financial highlights reflect the limitation, including the interest expense, when applicable. |
The accompanying notes are an integral part of the financial statements.
| ||
| 54 | www.iconfunds.com | |
Table of Contents
| ICON Financial Fund | Financial Highlights | |
| For a Share Outstanding Throughout the Periods Presented |
| Class S | Year Ended September 30, 2017 | Year Ended September 30, 2016 | Year Ended September 30, 2015 | Year Ended September 30, 2014 | Year Ended September 30, 2013 | ||||||||||||||||||||
Net asset value, beginning of period | $ | 7.67 | $ | 7.74 | $ | 7.83 | $ | 7.47 | $ | 6.04 | |||||||||||||||
Income/(loss) from investment operations: | |||||||||||||||||||||||||
Net investment income/(loss)(a)(b) | 0.03 | 0.08 | 0.04 | 0.00 | (c) | 0.04 | |||||||||||||||||||
Net realized and unrealized gains/(losses) on investments | 2.34 | (0.15) | (0.08) | 0.54 | 1.44 | ||||||||||||||||||||
Total from investment operations | 2.37 | (0.07) | (0.04) | 0.54 | 1.48 | ||||||||||||||||||||
Less dividends and distributions: | |||||||||||||||||||||||||
Dividends from net investment income | (0.09) | – | (0.05) | (0.18) | (0.05) | ||||||||||||||||||||
Total dividends and distributions | (0.09) | – | (0.05) | (0.18) | (0.05) | ||||||||||||||||||||
Net asset value, end of period | $ | 9.95 | $ | 7.67 | $ | 7.74 | $ | 7.83 | $ | 7.47 | |||||||||||||||
Total Return | 30.96 | % | (0.90) | % | (0.55) | % | 7.27 | % | 24.68 | % | |||||||||||||||
Ratios and Supplemental Data | |||||||||||||||||||||||||
Net assets, end of period (in 000s) | $ | 39,072 | $ | 43,354 | $ | 49,106 | $ | 32,286 | $ | 11,853 | |||||||||||||||
Ratio of expenses to average net assets | |||||||||||||||||||||||||
Before expense limitation | 1.40 | % | 1.40 | % | 1.49 | % | 1.64 | % | 1.47 | % | |||||||||||||||
After expense limitation(d) | 1.40 | % | 1.40 | % | 1.49 | % | 1.50 | % | 1.47 | % | |||||||||||||||
Ratio of net investment income/(loss) to average net assets | |||||||||||||||||||||||||
Before expense limitation | 0.28 | % | 1.00 | % | 0.52 | % | (0.20) | % | 0.65 | % | |||||||||||||||
After expense limitation(d) | 0.28 | % | 1.00 | % | 0.52 | % | (0.06) | % | 0.65 | % | |||||||||||||||
Portfolio turnover rate | 68 | % | 49 | % | 51 | % | 79 | % | 95 | % | |||||||||||||||
| (a) | Calculated using the average shares method. |
| (b) | The per share amount does not correspond to activity reflected in the Statement of Operations due to class specific expenses during the period. |
| (c) | Amount less than $0.005. |
| (d) | The Fund’s operating expenses, not including interest expense, are contractually limited to the amounts discussed in Note 3. The ratios in these financial highlights reflect the limitation, including the interest expense, when applicable. |
The accompanying notes are an integral part of the financial statements.
| ||
| Annual Report | September 30, 2017 | 55 | |
Table of Contents
| ICON Financial Fund | Financial Highlights | |
| For a Share Outstanding Throughout the Periods Presented |
| Class A(a) | Year Ended September 30, 2017 | Year Ended September 30, 2016 | Year Ended September 30, 2015 | Year Ended September 30, 2014 | Year Ended September 30, 2013 | |||||||||||||||||||||||
Net asset value, beginning of period | $ | 7.71 | $ | 7.82 | $ | 7.89 | $ | 7.37 | $ | 5.99 | ||||||||||||||||||
Income/(loss) from investment operations: | ||||||||||||||||||||||||||||
Net investment income/(loss)(b)(c) | (0.01) | 0.05 | 0.02 | (0.02) | 0.06 | |||||||||||||||||||||||
Net realized and unrealized gains/(losses) on investments | 2.37 | (0.16) | (0.07) | 0.54 | 1.38 | |||||||||||||||||||||||
Total from investment operations | 2.36 | (0.11) | (0.05) | 0.52 | 1.44 | |||||||||||||||||||||||
Less dividends and distributions: | ||||||||||||||||||||||||||||
Dividends from net investment income | (0.08) | – | (0.02) | – | (0.06) | |||||||||||||||||||||||
Total dividends and distributions | (0.08) | – | (0.02) | – | (0.06) | |||||||||||||||||||||||
Net asset value, end of period | $ | 9.99 | $ | 7.71 | $ | 7.82 | $ | 7.89 | $ | 7.37 | ||||||||||||||||||
Total Return(d) | 30.68 | % | (1.41) | % | (0.69) | % | 7.20 | % | 24.20 | % | ||||||||||||||||||
Ratios and Supplemental Data | ||||||||||||||||||||||||||||
Net assets, end of period (in 000s) | $ | 2,119 | $ | 2,542 | $ | 1,974 | $ | 541 | $ | 936 | ||||||||||||||||||
Ratio of expenses to average net assets | ||||||||||||||||||||||||||||
Before expense limitation | 2.05 | % | 2.12 | % | 2.19 | % | 2.35 | % | 1.88 | % | ||||||||||||||||||
After expense limitation(e) | 1.75 | % | 1.75 | % | 1.75 | % | 1.75 | % | 1.76 | % | ||||||||||||||||||
Ratio of net investment income/(loss) to average net assets | ||||||||||||||||||||||||||||
Before expense limitation | (0.37) | % | 0.26 | % | (0.15) | % | (0.86) | % | 0.82 | % | ||||||||||||||||||
After expense limitation(e) | (0.07) | % | 0.63 | % | 0.29 | % | (0.26) | % | 0.94 | % | ||||||||||||||||||
Portfolio turnover rate | 68 | % | 49 | % | 51 | % | 79 | % | 95 | % | ||||||||||||||||||
| (a) | Class C shares were merged into Class A on September 25, 2015. The amounts presented represent the results of the Class A shares for the periods prior to the merger and the results of the combined share class for the period subsequent to the merger. |
| (b) | Calculated using the average shares method. |
| (c) | The per share amount does not correspond to activity reflected in the Statement of Operations due to class specific expenses during the period. |
| (d) | The total return calculation excludes any sales charges. |
| (e) | The Fund’s operating expenses, not including interest expense, are contractually limited to the amounts discussed in Note 3. The ratios in these financial highlights reflect the limitation, including the interest expense, when applicable. |
The accompanying notes are an integral part of the financial statements.
| ||
| 56 | www.iconfunds.com | |
Table of Contents
| ICON Healthcare Fund | Financial Highlights | |
| For a Share Outstanding Throughout the Periods Presented |
| Class S | Year Ended September 30, | Year Ended September 30, 2016 | Year Ended September 30, 2015 | Year Ended September 30, 2014 | Year Ended September 30, 2013 | |||||||||||||||||||||||
Net asset value, beginning of period | $ | 15.40 | $ | 17.83 | $ | 22.42 | $ | 22.17 | $ | 17.56 | ||||||||||||||||||
Income/(loss) from investment operations: | ||||||||||||||||||||||||||||
Net investment income/(loss)(a)(b) | (0.05) | (0.04) | (0.09) | (0.11) | 0.03 | |||||||||||||||||||||||
Net realized and unrealized gains/(losses) on investments | 1.86 | 1.54 | 1.02 | 6.18 | 4.75 | |||||||||||||||||||||||
Total from investment operations | 1.81 | 1.50 | 0.93 | 6.07 | 4.78 | |||||||||||||||||||||||
Less dividends and distributions: | ||||||||||||||||||||||||||||
Dividends from net investment income | – | – | – | (0.03) | (0.17) | |||||||||||||||||||||||
Distributions from net realized gains | (0.24) | (3.93) | (5.52) | (5.79) | – | |||||||||||||||||||||||
Total dividends and distributions | (0.24) | (3.93) | (5.52) | (5.82) | (0.17) | |||||||||||||||||||||||
Net asset value, end of period | $ | 16.97 | $ | 15.40 | $ | 17.83 | $ | 22.42 | $ | 22.17 | ||||||||||||||||||
Total Return | 11.94 | % | 9.44 | % | 2.55 | % | 32.27 | % | 27.48 | % | ||||||||||||||||||
Ratios and Supplemental Data | ||||||||||||||||||||||||||||
Net assets, end of period (in 000s) | $ | 83,234 | $ | 76,218 | $ | 95,109 | $ | 148,261 | $ | 92,171 | ||||||||||||||||||
Ratio of expenses to average net assets | ||||||||||||||||||||||||||||
Before expense limitation | 1.41 | % | 1.44 | % | 1.36 | % | 1.36 | % | 1.39 | % | ||||||||||||||||||
After expense limitation(c) | 1.41 | % | 1.44 | % | 1.36 | % | 1.36 | % | 1.39 | % | ||||||||||||||||||
Ratio of net investment income/(loss) to average net assets | ||||||||||||||||||||||||||||
Before expense limitation | (0.33) | % | (0.26) | % | (0.45) | % | (0.53) | % | 0.13 | % | ||||||||||||||||||
After expense limitation(c) | (0.33) | % | (0.26) | % | (0.45) | % | (0.53) | % | 0.13 | % | ||||||||||||||||||
Portfolio turnover rate | 174 | % | 107 | % | 141 | % | 188 | % | 112 | % | ||||||||||||||||||
| (a) | Calculated using the average shares method. |
| (b) | The per share amount does not correspond to activity reflected in the Statement of Operations due to class specific expenses during the period. |
| (c) | The Fund’s operating expenses, not including interest expense, are contractually limited to the amounts discussed in Note 3. The ratios in these financial highlights reflect the limitation, including the interest expense, when applicable. |
The accompanying notes are an integral part of the financial statements.
| ||
| Annual Report | September 30, 2017 | 57 | |
Table of Contents
| ICON Healthcare Fund | Financial Highlights | |
| For a Share Outstanding Throughout the Periods Presented |
| Class A(a) | Year Ended 2017 | Year Ended 2016 | Year Ended 2015 | Year Ended 2014 | Year Ended 2013 | |||||||||||||||||||||||
Net asset value, beginning of period | $ | 14.84 | $ | 17.37 | $ | 22.01 | $ | 21.92 | $ | 17.42 | ||||||||||||||||||
Income/(loss) from investment operations: | ||||||||||||||||||||||||||||
Net investment income/(loss)(b)(c) | (0.10) | (0.09) | (0.14) | (0.14) | (0.03) | |||||||||||||||||||||||
Net realized and unrealized gains/(losses) on investments | 1.79 | 1.49 | 1.02 | 6.03 | 4.69 | |||||||||||||||||||||||
Total from investment operations | 1.69 | 1.40 | 0.88 | 5.89 | 4.66 | |||||||||||||||||||||||
Less dividends and distributions: | ||||||||||||||||||||||||||||
Dividends from net investment income | – | – | – | (0.01) | (0.16) | |||||||||||||||||||||||
Distributions from net realized gains | (0.24) | (3.93) | (5.52) | (5.79) | – | |||||||||||||||||||||||
Total dividends and distributions | (0.24) | (3.93) | (5.52) | (5.80) | (0.16) | |||||||||||||||||||||||
Net asset value, end of period | $ | 16.29 | $ | 14.84 | $ | 17.37 | $ | 22.01 | $ | 21.92 | ||||||||||||||||||
Total Return(d) | 11.58 | % | 9.03 | % | 2.33 | % | 31.72 | % | 26.95 | % | ||||||||||||||||||
Ratios and Supplemental Data | ||||||||||||||||||||||||||||
Net assets, end of period (in 000s) | $ | 3,989 | $ | 4,921 | $ | 15,317 | $ | 10,878 | $ | 3,748 | ||||||||||||||||||
Ratio of expenses to average net assets | ||||||||||||||||||||||||||||
Before expense limitation | 1.86 | % | 1.79 | % | 1.62 | % | 1.62 | % | 1.69 | % | ||||||||||||||||||
After expense limitation(e) | 1.75 | % | 1.75 | % | 1.62 | % | 1.62 | % | 1.69 | % | ||||||||||||||||||
Ratio of net investment income/(loss) to average net assets | ||||||||||||||||||||||||||||
Before expense limitation | (0.78) | % | (0.63) | % | (0.69) | % | (0.66) | % | (0.15) | % | ||||||||||||||||||
After expense limitation(e) | (0.67) | % | (0.59) | % | (0.69) | % | (0.66) | % | (0.15) | % | ||||||||||||||||||
Portfolio turnover rate | 174 | % | 107 | % | 141 | % | 188 | % | 112 | % | ||||||||||||||||||
| (a) | Class C shares were merged into Class A on September 25, 2015. The amounts presented represent the results of the Class A shares for the periods prior to the merger and the results of the combined share class for the period subsequent to the merger. |
| (b) | Calculated using the average shares method. |
| (c) | The per share amount does not correspond to activity reflected in the Statement of Operations due to class specific expenses during the period. |
| (d) | The total return calculation excludes any sales charges. |
| (e) | The Fund’s operating expenses, not including interest expense, are contractually limited to the amounts discussed in Note 3. The ratios in these financial highlights reflect the limitation, including the interest expense, when applicable. |
The accompanying notes are an integral part of the financial statements.
| ||
| 58 | www.iconfunds.com | |
Table of Contents
| ICON Industrials Fund | Financial Highlights | |
| For a Share Outstanding Throughout the Periods Presented |
| Class S | Year Ended September 30, 2017 | Year Ended September 30, 2016 | Year Ended September 30, 2015 | Year Ended September 30, 2014 | Year Ended September 30, 2013 | |||||||||||||||||||||||
Net asset value, beginning of period | $ | 12.26 | $ | 10.94 | $ | 11.67 | $ | 10.56 | $ | 8.26 | ||||||||||||||||||
Income/(loss) from investment operations: | ||||||||||||||||||||||||||||
Net investment income/(loss)(a)(b) | (0.04) | (0.02) | 0.01 | 0.01 | 0.06 | |||||||||||||||||||||||
Net realized and unrealized gains/(losses) on investments | 2.75 | 1.34 | (0.73) | 1.16 | 2.35 | |||||||||||||||||||||||
Total from investment operations | 2.71 | 1.32 | (0.72) | 1.17 | 2.41 | |||||||||||||||||||||||
Less dividends and distributions: | ||||||||||||||||||||||||||||
Dividends from net investment income | – | – | (0.01) | (0.06) | (0.11) | |||||||||||||||||||||||
Total dividends and distributions | – | – | (0.01) | (0.06) | (0.11) | |||||||||||||||||||||||
Net asset value, end of period | $ | 14.97 | $ | 12.26 | $ | 10.94 | $ | 11.67 | $ | 10.56 | ||||||||||||||||||
Total Return | 22.10 | % | 12.07 | % | (6.15) | % | 11.14 | % | 29.52 | % | ||||||||||||||||||
Ratios and Supplemental Data | ||||||||||||||||||||||||||||
Net assets, end of period (in 000s) | $ | 15,482 | $ | 23,957 | $ | 14,251 | $ | 35,883 | $ | 34,409 | ||||||||||||||||||
Ratio of expenses to average net assets | ||||||||||||||||||||||||||||
Before expense limitation | 1.69 | % | 1.73 | % | 1.53 | % | 1.41 | % | 1.46 | % | ||||||||||||||||||
After expense limitation(c) | 1.51 | % | 1.50 | % | 1.50 | % | 1.41 | % | 1.46 | % | ||||||||||||||||||
Ratio of net investment income/(loss) to average net assets | ||||||||||||||||||||||||||||
Before expense limitation | (0.50) | % | (0.37) | % | 0.07 | % | 0.07 | % | 0.60 | % | ||||||||||||||||||
After expense limitation(c) | (0.32) | % | (0.14) | % | 0.10 | % | 0.07 | % | 0.60 | % | ||||||||||||||||||
Portfolio turnover rate | 75 | % | 87 | % | 23 | % | 30 | % | 46 | % | ||||||||||||||||||
| (a) | Calculated using the average shares method. |
| (b) | The per share amount does not correspond to activity reflected in the Statement of Operations due to class specific expenses during the period. |
| (c) | The Fund’s operating expenses, not including interest expense, are contractually limited to the amounts discussed in Note 3. The ratios in these financial highlights reflect the limitation, including the interest expense, when applicable. |
The accompanying notes are an integral part of the financial statements.
| ||
| Annual Report | September 30, 2017 | 59 | |
Table of Contents
| ICON Industrials Fund | Financial Highlights | |
| For a Share Outstanding Throughout the Periods Presented |
| Class A(a) | Year Ended September 30, 2017 | Year Ended September 30, 2016 | Year Ended September 30, 2015 | Year Ended September 30, 2014 | Year Ended September 30, 2013 | |||||||||||||||||||||||
Net asset value, beginning of period | $ | 12.14 | $ | 10.86 | $ | 11.58 | $ | 10.45 | $ | 8.10 | ||||||||||||||||||
Income/(loss) from investment operations: | ||||||||||||||||||||||||||||
Net investment income/(loss)(b)(c) | (0.07) | (0.04) | (0.02) | (0.03) | 0.00 | (d) | ||||||||||||||||||||||
Net realized and unrealized gains/(losses) on investments | 2.72 | 1.32 | (0.70) | 1.16 | 2.36 | |||||||||||||||||||||||
Total from investment operations | 2.65 | 1.28 | (0.72) | 1.13 | 2.36 | |||||||||||||||||||||||
Less dividends and distributions: | ||||||||||||||||||||||||||||
Dividends from net investment income | – | – | – | – | (0.01) | |||||||||||||||||||||||
Total dividends and distributions | – | – | – | – | (0.01) | |||||||||||||||||||||||
Net asset value, end of period | $ | 14.79 | $ | 12.14 | $ | 10.86 | $ | 11.58 | $ | 10.45 | ||||||||||||||||||
Total Return(e) | 21.83 | % | 11.79 | % | (6.22) | % | 10.81 | % | 29.20 | % | ||||||||||||||||||
Ratios and Supplemental Data | ||||||||||||||||||||||||||||
Net assets, end of period (in 000s) | $ | 2,406 | $ | 998 | $ | 596 | $ | 298 | $ | 4,322 | ||||||||||||||||||
Ratio of expenses to average net assets | ||||||||||||||||||||||||||||
Before expense limitation | 2.05 | % | 2.96 | % | 2.67 | % | 2.02 | % | 2.09 | % | ||||||||||||||||||
After expense limitation(f) | 1.76 | % | 1.75 | % | 1.75 | % | 1.75 | % | 1.75 | % | ||||||||||||||||||
Ratio of net investment income/(loss) to average net assets | ||||||||||||||||||||||||||||
Before expense limitation | (0.79) | % | (1.59) | % | (1.11) | % | (0.56) | % | (0.32) | % | ||||||||||||||||||
After expense limitation(f) | (0.50) | % | (0.38) | % | (0.19) | % | (0.29) | % | 0.02 | % | ||||||||||||||||||
Portfolio turnover rate | 75 | % | 87 | % | 23 | % | 30 | % | 46 | % | ||||||||||||||||||
| (a) | Class C shares were merged into Class A on September 25, 2015. The amounts presented represent the results of the Class A shares for the periods prior to the merger and the results of the combined share class for the period subsequent to the merger. |
| (b) | Calculated using the average shares method. |
| (c) | The per share amount does not correspond to activity reflected in the Statement of Operations due to class specific expenses during the period. |
| (d) | Amount less than $0.005. |
| (e) | The total return calculation excludes any sales charges. |
| (f) | The Fund’s operating expenses, not including interest expense, are contractually limited to the amounts discussed in Note 3. The ratios in these financial highlights reflect the limitation, including the interest expense, when applicable. |
The accompanying notes are an integral part of the financial statements.
| ||
| 60 | www.iconfunds.com | |
Table of Contents
| ICON Information Technology Fund | Financial Highlights | |
| For a Share Outstanding Throughout the Periods Presented |
| Class S | Year Ended September 30, 2017 | Year Ended September 30, 2016 | Year Ended September 30, 2015 | Year Ended September 30, 2014 | Year Ended September 30, 2013 | |||||||||||||||||||||||
Net asset value, beginning of period | $ | 17.96 | $ | 14.95 | $ | 13.55 | $ | 11.44 | $ | 10.72 | ||||||||||||||||||
Income/(loss) from investment operations: | ||||||||||||||||||||||||||||
Net investment income/(loss)(a)(b) | (0.10) | (0.07) | (0.09) | (0.07) | (0.02) | |||||||||||||||||||||||
Net realized and unrealized gains/(losses) on investments | 4.53 | 3.08 | 1.49 | 2.18 | 0.74 | |||||||||||||||||||||||
Total from investment operations | 4.43 | 3.01 | 1.40 | 2.11 | 0.72 | |||||||||||||||||||||||
Less dividends and distributions: | ||||||||||||||||||||||||||||
Distributions from net realized gains | (3.25) | – | – | – | – | |||||||||||||||||||||||
Total dividends and distributions | (3.25) | – | – | – | – | |||||||||||||||||||||||
Net asset value, end of period | $ | 19.14 | $ | 17.96 | $ | 14.95 | $ | 13.55 | $ | 11.44 | ||||||||||||||||||
Total Return | 29.46 | % | 20.13 | % | 10.33 | % | 18.44 | % | 6.72 | % | ||||||||||||||||||
Ratios and Supplemental Data | ||||||||||||||||||||||||||||
Net assets, end of period (in 000s) | $ | 71,249 | $ | 48,953 | $ | 45,343 | $ | 50,363 | $ | 73,851 | ||||||||||||||||||
Ratio of expenses to average net assets | ||||||||||||||||||||||||||||
Before expense limitation | 1.42 | % | 1.49 | % | 1.44 | % | 1.40 | % | 1.38 | % | ||||||||||||||||||
After expense limitation(c) | 1.42 | % | 1.49 | % | 1.44 | % | 1.40 | % | 1.38 | % | ||||||||||||||||||
Ratio of net investment income/(loss) to average net assets | ||||||||||||||||||||||||||||
Before expense limitation | (0.58) | % | (0.46) | % | (0.62) | % | (0.56) | % | (0.22) | % | ||||||||||||||||||
After expense limitation(c) | (0.58) | % | (0.46) | % | (0.62) | % | (0.56) | % | (0.22) | % | ||||||||||||||||||
Portfolio turnover rate | 116 | % | 94 | % | 43 | % | 48 | % | 52 | % | ||||||||||||||||||
| (a) | Calculated using the average shares method. |
| (b) | The per share amount does not correspond to activity reflected in the Statement of Operations due to class specific expenses during the period. |
| (c) | The Fund’s operating expenses, not including interest expense, are contractually limited to the amounts discussed in Note 3. The ratios in these financial highlights reflect the limitation, including the interest expense, when applicable. |
The accompanying notes are an integral part of the financial statements.
| ||
| Annual Report | September 30, 2017 | 61 | |
Table of Contents
| ICON Information Technology Fund | Financial Highlights | |
| For a Share Outstanding Throughout the Periods Presented |
| Class A(a) | Year Ended September 30, 2017 | Year Ended September 30, 2016 | Year Ended September 30, 2015 | Year Ended September 30, 2014 | Year Ended September 30, 2013 | |||||||||||||||||||||||
Net asset value, beginning of period | $ | 17.55 | $ | 14.65 | $ | 13.32 | $ | 11.30 | $ | 10.65 | ||||||||||||||||||
Income/(loss) from investment operations: | ||||||||||||||||||||||||||||
Net investment income/(loss)(b)(c) | (0.15) | (0.11) | (0.14) | (0.11) | (0.05) | |||||||||||||||||||||||
Net realized and unrealized gains/(losses) on investments | 4.40 | 3.01 | 1.47 | 2.13 | 0.70 | |||||||||||||||||||||||
Total from investment operations | 4.25 | 2.90 | 1.33 | 2.02 | 0.65 | |||||||||||||||||||||||
Less dividends and distributions: | ||||||||||||||||||||||||||||
Distributions from net realized gains | (3.25) | – | – | – | – | |||||||||||||||||||||||
Total dividends and distributions | (3.25) | – | – | – | – | |||||||||||||||||||||||
Net asset value, end of period | $ | 18.55 | $ | 17.55 | $ | 14.65 | $ | 13.32 | $ | 11.30 | ||||||||||||||||||
Total Return(d) | 29.08 | % | 19.80 | % | 9.99 | % | 17.88 | % | 6.10 | % | ||||||||||||||||||
Ratios and Supplemental Data | ||||||||||||||||||||||||||||
Net assets, end of period (in 000s) | $ | 2,836 | $ | 2,631 | $ | 3,170 | $ | 455 | $ | 2,330 | ||||||||||||||||||
Ratio of expenses to average net assets | ||||||||||||||||||||||||||||
Before expense limitation | 2.01 | % | 2.17 | % | 1.90 | % | 1.94 | % | 2.23 | % | ||||||||||||||||||
After expense limitation(e) | 1.75 | % | 1.75 | % | 1.75 | % | 1.75 | % | 1.75 | % | ||||||||||||||||||
Ratio of net investment income/(loss) to average net assets | ||||||||||||||||||||||||||||
Before expense limitation | (1.16) | % | (1.12) | % | (1.07) | % | (1.10) | % | (0.94) | % | ||||||||||||||||||
After expense limitation(e) | (0.90) | % | (0.70) | % | (0.92) | % | (0.91) | % | (0.45) | % | ||||||||||||||||||
Portfolio turnover rate | 116 | % | 94 | % | 43 | % | 48 | % | 52 | % | ||||||||||||||||||
| (a) | Class C shares were merged into Class A on September 25, 2015. The amounts presented represent the results of the Class A shares for the periods prior to the merger and the results of the combined share class for the period subsequent to the merger. |
| (b) | Calculated using the average shares method. |
| (c) | The per share amount does not correspond to activity reflected in the Statement of Operations due to class specific expenses during the period. |
| (d) | The total return calculation excludes any sales charges. |
| (e) | The Fund’s operating expenses, not including interest expense, are contractually limited to the amounts discussed in Note 3. The ratios in these financial highlights reflect the limitation, including the interest expense, when applicable. |
The accompanying notes are an integral part of the financial statements.
| ||
| 62 | www.iconfunds.com | |
Table of Contents
| ICON Natural Resources Fund | Financial Highlights | |
| For a Share Outstanding Throughout the Periods Presented |
| Class S | Year Ended September 30, 2017 | Year Ended September 30, 2016 (a) | Year Ended September 30, 2015 | Year Ended September 30, 2014 | Year Ended September 30, 2013 | |||||||||||||||||||||||
Net asset value, beginning of period | $ | 12.82 | $ | 11.86 | $ | 15.09 | $ | 13.43 | $ | 11.12 | ||||||||||||||||||
Income/(loss) from investment operations: | ||||||||||||||||||||||||||||
Net investment income/(loss)(b)(c) | 0.01 | 0.10 | 0.04 | 0.04 | 0.09 | |||||||||||||||||||||||
Net realized and unrealized gains/(losses) on investments | 2.56 | 1.80 | (3.23) | 1.68 | 2.40 | |||||||||||||||||||||||
Total from investment operations | 2.57 | 1.90 | (3.19) | 1.72 | 2.49 | |||||||||||||||||||||||
Less dividends and distributions: | ||||||||||||||||||||||||||||
Dividends from net investment income | (0.07) | (0.06) | (0.04) | (0.06) | (0.18) | |||||||||||||||||||||||
Distributions from net realized gains | – | (0.88) | – | – | – | |||||||||||||||||||||||
Total dividends and distributions | (0.07) | (0.94) | (0.04) | (0.06) | (0.18) | |||||||||||||||||||||||
Net asset value, end of period | $ | 15.32 | $ | 12.82 | $ | 11.86 | $ | 15.09 | $ | 13.43 | ||||||||||||||||||
Total Return | 20.13 | % | 17.24 | % | (21.22) | % | 12.85 | % | 22.73 | % | ||||||||||||||||||
Ratios and Supplemental Data | ||||||||||||||||||||||||||||
Net assets, end of period (in 000s) | $ | 69,444 | $ | 65,787 | $ | 60,404 | $ | 93,610 | $ | 65,782 | ||||||||||||||||||
Ratio of expenses to average net assets | ||||||||||||||||||||||||||||
Before expense limitation | 1.52 | % | 1.59 | % | 1.42 | % | 1.36 | % | 1.45 | % | ||||||||||||||||||
After expense limitation(d) | 1.50 | % | 1.50 | % | 1.42 | % | 1.36 | % | 1.45 | % | ||||||||||||||||||
Ratio of net investment income/(loss) to average net assets | ||||||||||||||||||||||||||||
Before expense limitation | 0.06 | % | 0.70 | % | 0.27 | % | 0.26 | % | 0.72 | % | ||||||||||||||||||
After expense limitation(d) | 0.08 | % | 0.79 | % | 0.27 | % | 0.26 | % | 0.72 | % | ||||||||||||||||||
Portfolio turnover rate | 68 | % | 81 | % | 48 | % | 33 | % | 56 | % | ||||||||||||||||||
| (a) | Prior to January 22, 2016, the ICON Natural Resources Fund was known as the ICON Materials Fund. |
| (b) | Calculated using the average shares method. |
| (c) | The per share amount does not correspond to activity reflected in the Statement of Operations due to class specific expenses during the period. |
| (d) | The Fund’s operating expenses, not including interest expense, are contractually limited to the amounts discussed in Note 3. The ratios in these financial highlights reflect the limitation, including the interest expense, when applicable. |
The accompanying notes are an integral part of the financial statements.
| ||
| Annual Report | September 30, 2017 | 63 | |
Table of Contents
| ICON Natural Resources Fund | Financial Highlights | |
| For a Share Outstanding Throughout the Periods Presented |
| Class C | Year Ended September 30, 2017 | Year Ended September 30, 2016 (a) | Year Ended September 30, 2015 | Year Ended September 30, 2014 | Year Ended September 30, 2013 | |||||||||||||||||||||||
Net asset value, beginning of period | $ | 12.36 | $ | 11.51 | $ | 14.77 | $ | 13.24 | $ | 10.94 | ||||||||||||||||||
Income/(loss) from investment operations: | ||||||||||||||||||||||||||||
Net investment income/(loss)(b)(c) | (0.13) | (0.03) | (0.11) | (0.12) | (0.04) | |||||||||||||||||||||||
Net realized and unrealized gains/(losses) on investments | 2.47 | �� | 1.76 | (3.15) | 1.65 | 2.38 | ||||||||||||||||||||||
Total from investment operations | 2.34 | 1.73 | (3.26) | 1.53 | 2.34 | |||||||||||||||||||||||
Less dividends and distributions: | ||||||||||||||||||||||||||||
Dividends from net investment income | (0.05) | – | – | – | (0.04) | |||||||||||||||||||||||
Distributions from net realized gains | – | (0.88) | – | – | – | |||||||||||||||||||||||
Total dividends and distributions | (0.05) | (0.88) | – | – | (0.04) | |||||||||||||||||||||||
Net asset value, end of period | $ | 14.65 | $ | 12.36 | $ | 11.51 | $ | 14.77 | $ | 13.24 | ||||||||||||||||||
Total Return(d) | 18.97 | % | 16.11 | % | (22.07) | % | 11.56 | % | 21.43 | % | ||||||||||||||||||
Ratios and Supplemental Data | ||||||||||||||||||||||||||||
Net assets, end of period (in 000s) | $ | 1,756 | $ | 1,435 | $ | 834 | $ | 675 | $ | 218 | ||||||||||||||||||
Ratio of expenses to average net assets | ||||||||||||||||||||||||||||
Before expense limitation | 2.85 | % | 3.01 | % | 2.94 | % | 4.17 | % | 4.12 | % | ||||||||||||||||||
After expense limitation(e) | 2.50 | % | 2.51 | % | 2.50 | % | 2.50 | % | 2.50 | % | ||||||||||||||||||
Ratio of net investment income/(loss) to average net assets | ||||||||||||||||||||||||||||
Before expense limitation | (1.27) | % | (0.73) | % | (1.22) | % | (2.51) | % | (1.95) | % | ||||||||||||||||||
After expense limitation(e) | (0.92) | % | (0.23) | % | (0.78) | % | (0.84) | % | (0.33) | % | ||||||||||||||||||
Portfolio turnover rate | 68 | % | 81 | % | 48 | % | 33 | % | 56 | % | ||||||||||||||||||
| (a) | Prior to January 22, 2016, the ICON Natural Resources Fund was known as the ICON Materials Fund. |
| (b) | Calculated using the average shares method. |
| (c) | The per share amount does not correspond to activity reflected in the Statement of Operations due to class specific expenses during the period. |
| (d) | The total return calculation excludes any sales charges. |
| (e) | The Fund’s operating expenses, not including interest expense, are contractually limited to the amounts discussed in Note 3. The ratios in these financial highlights reflect the limitation, including the interest expense, when applicable. |
The accompanying notes are an integral part of the financial statements.
| ||
| 64 | www.iconfunds.com | |
Table of Contents
| ICON Natural Resources Fund | Financial Highlights | |
| For a Share Outstanding Throughout the Periods Presented |
| Class A | Year Ended September 30, 2017 | Year Ended September 30, 2016 (a) | Year Ended September 30, 2015 | Year Ended September 30, 2014 | Year Ended September 30, 2013 | |||||||||||||||||||||||
Net asset value, beginning of period | $ | 12.73 | $ | 11.75 | $ | 14.96 | $ | 13.36 | $ | 11.07 | ||||||||||||||||||
Income/(loss) from investment operations: | ||||||||||||||||||||||||||||
Net investment income/(loss)(b)(c) | (0.03) | 0.06 | (0.01) | (0.01) | 0.05 | |||||||||||||||||||||||
Net realized and unrealized gains/(losses) on investments | 2.54 | 1.81 | (3.20) | 1.67 | 2.38 | |||||||||||||||||||||||
Total from investment operations | 2.51 | 1.87 | (3.21) | 1.66 | 2.43 | |||||||||||||||||||||||
Less dividends and distributions: | ||||||||||||||||||||||||||||
Dividends from net investment income | (0.07) | (0.01) | – | (0.06) | (0.14) | |||||||||||||||||||||||
Distributions from net realized gains | – | (0.88) | – | – | – | |||||||||||||||||||||||
Total dividends and distributions | (0.07) | (0.89) | – | (0.06) | (0.14) | |||||||||||||||||||||||
Net asset value, end of period | $ | 15.17 | $ | 12.73 | $ | 11.75 | $ | 14.96 | $ | 13.36 | ||||||||||||||||||
Total Return(d) | 19.81 | % | 17.05 | % | (21.46) | % | 12.47 | % | 22.24 | % | ||||||||||||||||||
Ratios and Supplemental Data | ||||||||||||||||||||||||||||
Net assets, end of period (in 000s) | $ | 5,629 | $ | 4,451 | $ | 3,078 | $ | 8,229 | $ | 1,883 | ||||||||||||||||||
Ratio of expenses to average net assets | ||||||||||||||||||||||||||||
Before expense limitation | 1.91 | % | 2.02 | % | 1.76 | % | 1.72 | % | 2.02 | % | ||||||||||||||||||
After expense limitation(e) | 1.75 | % | 1.75 | % | 1.75 | % | 1.72 | % | 1.75 | % | ||||||||||||||||||
Ratio of net investment income/(loss) to average net assets | ||||||||||||||||||||||||||||
Before expense limitation | (0.35) | % | 0.24 | % | (0.06) | % | (0.07) | % | 0.17 | % | ||||||||||||||||||
After expense limitation(e) | (0.19) | % | 0.51 | % | (0.05) | % | (0.07) | % | 0.44 | % | ||||||||||||||||||
Portfolio turnover rate | 68 | % | 81 | % | 48 | % | 33 | % | 56 | % | ||||||||||||||||||
| (a) | Prior to January 22, 2016, the ICON Natural Resources Fund was known as the ICON Materials Fund. |
| (b) | Calculated using the average shares method. |
| (c) | The per share amount does not correspond to activity reflected in the Statement of Operations due to class specific expenses during the period. |
| (d) | The total return calculation excludes any sales charges. |
| (e) | The Fund’s operating expenses, not including interest expense, are contractually limited to the amounts discussed in Note 3. The ratios in these financial highlights reflect the limitation, including the interest expense, when applicable. |
The accompanying notes are an integral part of the financial statements.
| ||
| Annual Report | September 30, 2017 | 65 | |
Table of Contents
| ICON Utilities Fund | Financial Highlights | |
| For a Share Outstanding Throughout the Periods Presented |
| Class S | Year Ended 2017 | Year Ended 2016 | Year Ended 2015 | Year Ended 2014 | Year Ended 2013 | |||||||||||||||||||||||
Net asset value, beginning of period | $ | 9.49 | $ | 8.03 | $ | 7.90 | $ | 7.22 | $ | 6.81 | ||||||||||||||||||
Income/(loss) from investment operations: | ||||||||||||||||||||||||||||
Net investment income/(loss)(a)(b) | 0.27 | 0.30 | 0.28 | 0.22 | 0.20 | |||||||||||||||||||||||
Net realized and unrealized gains/(losses) on investments | 0.59 | 1.43 | 0.11 | 0.69 | 0.43 | |||||||||||||||||||||||
Total from investment operations | 0.86 | 1.73 | 0.39 | 0.91 | 0.63 | |||||||||||||||||||||||
Less dividends and distributions: | ||||||||||||||||||||||||||||
Dividends from net investment income | (0.27) | (0.27) | (0.26) | (0.23) | (0.22) | |||||||||||||||||||||||
Distributions from net realized gains | (0.79) | – | – | – | – | |||||||||||||||||||||||
Total dividends and distributions | (1.06) | (0.27) | (0.26) | (0.23) | (0.22) | |||||||||||||||||||||||
Net asset value, end of period | $ | 9.29 | $ | 9.49 | $ | 8.03 | $ | 7.90 | $ | 7.22 | ||||||||||||||||||
Total Return | 9.88 | % | 21.74 | % | 4.93 | % | 12.69 | % | 9.25 | % | ||||||||||||||||||
Ratios and Supplemental Data | ||||||||||||||||||||||||||||
Net assets, end of period (in 000s) | $ | 35,816 | $ | 43,864 | $ | 19,107 | $ | 17,920 | $ | 29,117 | ||||||||||||||||||
Ratio of expenses to average net assets | ||||||||||||||||||||||||||||
Before expense limitation | 1.54 | % | 1.59 | % | 1.70 | % | 1.52 | % | 1.62 | % | ||||||||||||||||||
After expense limitation(c) | 1.44% | (d) | 1.50 | % | 1.50 | % | 1.50 | % | 1.51 | % | ||||||||||||||||||
Ratio of net investment income/(loss) to average net assets | ||||||||||||||||||||||||||||
Before expense limitation | 2.83 | % | 3.15 | % | 3.12 | % | 2.84 | % | 2.71 | % | ||||||||||||||||||
After expense limitation(c) | 2.93 | % | 3.24 | % | 3.32 | % | 2.86 | % | 2.81 | % | ||||||||||||||||||
Portfolio turnover rate | 160 | % | 168 | % | 243 | % | 107 | % | 121 | % | ||||||||||||||||||
| (a) | Calculated using the average shares method. |
| (b) | The per share amount does not correspond to activity reflected in the Statement of Operations due to class specific expenses during the period. |
| (c) | The Fund’s operating expenses, not including interest expense, are contractually limited to the amounts discussed in Note 3. The ratios in these financial highlights reflect the limitation, including the interest expense, when applicable. |
| (d) | Effective July 1, 2017, the annual expense limitation rate changed from 1.50% to 1.22%. |
The accompanying notes are an integral part of the financial statements.
| ||
| 66 | www.iconfunds.com | |
Table of Contents
| ICON Utilities Fund | Financial Highlights | |
| For a Share Outstanding Throughout the Periods Presented |
| Class A(a) | Year Ended September 30, 2017 | Year Ended September 30, 2016 | Year Ended September 30, 2015 | Year Ended September 30, 2014 | Year Ended September 30, 2013 | |||||||||||||||||||||||
Net asset value, beginning of period | $ | 9.35 | $ | 7.92 | $ | 7.81 | $ | 7.14 | $ | 6.73 | ||||||||||||||||||
Income/(loss) from investment operations: | ||||||||||||||||||||||||||||
Net investment income/(loss)(b)(c) | 0.24 | 0.28 | 0.26 | 0.21 | 0.18 | |||||||||||||||||||||||
Net realized and unrealized gains/(losses) on investments | 0.59 | 1.40 | 0.11 | 0.68 | 0.42 | |||||||||||||||||||||||
Total from investment operations | 0.83 | 1.68 | 0.37 | 0.89 | 0.60 | |||||||||||||||||||||||
Less dividends and distributions: | ||||||||||||||||||||||||||||
Dividends from net investment income | (0.25) | (0.25) | (0.26) | (0.22) | (0.19) | |||||||||||||||||||||||
Distributions from net realized gains | (0.79) | – | – | – | – | |||||||||||||||||||||||
Total dividends and distributions | (1.04) | (0.25) | (0.26) | (0.22) | (0.19) | |||||||||||||||||||||||
Net asset value, end of period | $ | 9.14 | $ | 9.35 | $ | 7.92 | $ | 7.81 | $ | 7.14 | ||||||||||||||||||
Total Return(d) | 9.63 | % | 21.29 | % | 4.63 | % | 12.44 | % | 8.96 | % | ||||||||||||||||||
Ratios and Supplemental Data | ||||||||||||||||||||||||||||
Net assets, end of period (in 000s) | $ | 8,293 | $ | 15,868 | $ | 5,679 | $ | 2,517 | $ | 2,402 | ||||||||||||||||||
Ratio of expenses to average net assets | ||||||||||||||||||||||||||||
Before expense limitation | 1.84 | % | 1.79 | % | 1.89 | % | 1.81 | % | 1.74 | % | ||||||||||||||||||
After expense limitation(e) | 1.69% | (f) | 1.75 | % | 1.75 | % | 1.75 | % | 1.74 | % | ||||||||||||||||||
Ratio of net investment income/(loss) to average net assets | ||||||||||||||||||||||||||||
Before expense limitation | 2.48 | % | 3.10 | % | 3.04 | % | 2.69 | % | 2.55 | % | ||||||||||||||||||
After expense limitation(e) | 2.63 | % | 3.14 | % | 3.18 | % | 2.75 | % | 2.55 | % | ||||||||||||||||||
Portfolio turnover rate | 160 | % | 168 | % | 243 | % | 107 | % | 121 | % | ||||||||||||||||||
| (a) | Class C shares were merged into Class A on September 25, 2015. The amounts presented represent the results of the Class A shares for the periods prior to the merger and the results of the combined share class for the period subsequent to the merger. |
| (b) | Calculated using the average shares method. |
| (c) | The per share amount does not correspond to activity reflected in the Statement of Operations due to class specific expenses during the period. |
| (d) | The total return calculation excludes any sales charges. |
| (e) | The Fund’s operating expenses, not including interest expense, are contractually limited to the amounts discussed in Note 3. The ratios in these financial highlights reflect the limitation, including the interest expense, when applicable. |
| (f) | Effective July 1, 2017, the annual expense limitation rate changed from 1.75% to 1.47%. |
The accompanying notes are an integral part of the financial statements.
| ||
| Annual Report | September 30, 2017 | 67 | |
Table of Contents
| ICON Sector Funds | Notes to Financial Statements | |
| September 30, 2017 |
1. ORGANIZATION
The ICON Consumer Discretionary Fund (“Consumer Discretionary Fund”), ICON Consumer Staples Fund (“Consumer Staples Fund”), ICON Energy Fund (“Energy Fund”), ICON Financial Fund (“Financial Fund”), ICON Healthcare Fund (“Healthcare Fund”), ICON Industrials Fund (“Industrials Fund”), ICON Information Technology Fund (“Information Technology Fund”), ICON Natural Resources Fund (formerly ICON Materials Fund) (“Natural Resources Fund”) and ICON Utilities Fund (“Utilities Fund”) are series funds (individually a “Fund” and collectively, the “Funds”). The Funds are part of the ICON Funds (the “Trust”), a Massachusetts business trust registered under the Investment Company Act of 1940, as amended (the “1940 Act”) as an open-end non-diversified investment management company. Each Fund offers two classes of shares: Class S and Class A. The Energy Fund and the Natural Resources Fund also offer a Class C share. All classes have equal rights as to earnings, assets, and voting privileges except that each Class may bear different distribution fees, registration costs, legal costs, mailing and printing costs and shareholder servicing costs and each Class has exclusive voting rights with respect to its distribution plan. There are currently eight other active Funds within the Trust. Those Funds are covered by separate prospectuses and shareholder reports.
Each Fund is authorized to issue an unlimited number of no par shares. The Funds invest primarily in securities of companies whose principal business activities fall within specific sectors and industries. The investment objective of each Fund is to provide long-term capital appreciation.
The Funds, like all investments in securities, have elements of risk, including risk of loss of principal. There is no assurance that the Funds will achieve their investment objectives and may underperform funds with similar investment objectives. An investment concentrated in sectors and industries involves greater risk and volatility than a more diversified investment. Investments in foreign securities and currency transactions may involve certain considerations and risks not typically associated with those of U.S. dollar-denominated transactions as a result of, among other factors, the possibility of lower government supervision and regulation of foreign securities markets and the possibility of political or economic instability. Financial statements of foreign companies are governed by different accounting, auditing, and financial standards than U.S. companies and may be less transparent and uniform than in the United States. Many corporate governance standards, which help ensure the integrity of public information in the United States, may not exist in some foreign countries. In general, there may be less governmental supervision of foreign stock exchanges and securities brokers and issuers. There are also risks associated with small-and mid-cap investing, including limited product lines, less liquidity and small market share.
The Consumer Staples Fund has a significant weighting in the Packaged Foods & Meats industry, the Energy Fund has a significant weighting in the Oil & Gas Exploration & Production industry, the Financial Fund has a significant weighting in the Diversified Banks industry, the Healthcare Fund has a significant weighting in the Biotechnology industry, the Industrials Fund has a significant weighting in the Building Products industry, the Natural Resources Fund has a significant weighting in the Oil & Gas Exploration & Production industry and the Utilities Fund has a significant weighting in the Electric Utilities industry and the Multi-Utilities industry which may cause the Funds’ performance to be susceptible to the economic, business and/or other developments that may affect those industries.
In the normal course of business, the Funds may enter into various agreements that provide for general indemnifications. Each Fund’s maximum exposure under these arrangements is unknown as any potential exposure involving future claims that may be made against each Fund is unknown. However, based on experience, the Funds expect the risk of loss to be remote.
2. SIGNIFICANT ACCOUNTING POLICIES
The following is a summary of significant accounting policies consistently followed by the Funds in the preparation of their financial statements. The financial statements are prepared in conformity with accounting principles generally accepted in the United States of America (“GAAP”), which requires management to make certain estimates and assumptions that affect the reported amounts of assets and liabilities, disclosure of contingent assets and liabilities at the date of the financial statements, and the reported amounts of income and expenses during the reporting period. Actual results may differ from these estimates. Each Fund is considered an investment company under GAAP and follows the accounting and reporting guidance applicable to investment companies in the Financial Accounting Standards Board Accounting Standards Codification Topic 946.
Investment Valuation
The Funds’ securities and other assets, excluding options on securities indexes, are valued at the closing price as of the close of regular trading on the New York Stock Exchange (the “NYSE”) (normally 4 p.m. Eastern Standard Time) each day the NYSE is open, except that securities traded primarily on the NASDAQ Stock Market (“NASDAQ”) are normally valued by the Funds at the NASDAQ Official Closing Price provided by NASDAQ each business day. If the NYSE closes unexpectedly and there is active trading on other exchanges, the securities will be valued at the Valuation Time based off of those exchanges. Options on securities indexes are valued at the close of the Chicago Board Options Exchange (normally 4:15 p.m. Eastern Standard Time) on each day the NYSE is open for trading.
The Funds use pricing services to obtain the fair value of securities in their portfolios. If a pricing service is not able to provide a price, or the pricing service’s valuation is considered inaccurate or does not, in the Funds’ judgment, reflect the fair value of the security, prices may be obtained
| 68 | www.iconfunds.com | |
Table of Contents
| ICON Sector Funds | Notes to Financial Statements | |
| September 30, 2017 |
through market quotations from independent broker/dealers. If market quotations from these sources are not readily available, the Funds’ securities or other assets are valued at fair value as determined in good faith by the Funds’ Board of Trustees (the “Board”) or pursuant to procedures approved by the Board.
Lacking any sales that day, a security is valued at the current closing bid price (or yield equivalent thereof) or based on quotes obtained from dealers making a market for the security. Exchange traded options are valued at the composite price, using the National Best Bid and Offer quotes (“NBBO”). NBBO consists of the highest bid price and lowest ask price across any of the exchanges on which an option is quoted, thus providing a view across the entire U.S. options marketplace. Debt securities with a remaining maturity of greater than 60 days are valued using the evaluated bid price supplied by the pricing service. The evaluated bid price supplied by the pricing service is based upon a matrix valuation system which considers such factors as security prices, yields, maturities and ratings. Short-term debt securities with remaining maturities of 60 days or less are generally valued at amortized cost or original cost plus accrued interest, which approximates fair value. Currency rates as of the close of the NYSE are used to convert foreign security values into U.S. dollars.
Securities of investment companies that trade on an exchange are valued at the last sales price or official closing price as of the close of the customary trading session on the exchange where the security is principally traded. Investments in shares of funds, including money market funds, that are not traded on an exchange are valued at the end of day net asset value (“NAV”) per share of such fund. Securities in the underlying funds, including restricted securities are valued in accordance with the valuation policy of such fund.
The Funds’ securities traded in countries outside of the Western Hemisphere are fair valued daily by utilizing the quotations of an independent pricing service, unless the Board determines that use of another valuation methodology is appropriate. The purposes of daily fair valuation are to avoid stale prices and to take into account, among other things, any significant events occurring after the close of foreign markets. The pricing service uses statistical analyses and quantitative models to adjust local market prices using factors such as subsequent movements and changes in the prices of indexes, securities and exchange rates in other markets to determine fair value as of the time a Fund calculates its net asset value (“NAV”). The valuation assigned to fair-value securities for purposes of calculating a Fund’s NAV may differ from the security’s most recent closing market price and from the prices used by other mutual funds to calculate their NAVs.
Various inputs are used to determine the value of the Funds’ investments. These inputs are summarized in the three broad levels listed below:
Level 1 — | quoted prices in active markets for identical securities. | |
Level 2 — | significant observable inputs other than Level 1 quoted prices (including, but not limited to, quoted prices for similar securities, interest rates, prepayment speeds, and credit risk). | |
Level 3 — | significant unobservable inputs. |
Observable inputs are those based on market data obtained from sources independent of the Funds, and unobservable inputs reflect the Funds’ own assumptions based on the best information available. The input levels are not necessarily an indication of the risk or liquidity associated with investments at that level. For example, non-U.S. equity securities actively traded in foreign markets may be reflected in Level 2 despite the availability of closing prices, because the Funds evaluate and determine whether those closing prices reflect fair value at the close of the NYSE or require adjustment, as described above. The following table summarizes the Funds’ investments, based on the inputs used to determine their values on September 30, 2017:
ICON Consumer Discretionary Fund
| Investments in Securities at Value* | Level 1 - Quoted and Unadjusted Prices | Level 2 - Other Significant Observable Inputs | Level 3 - Significant Unobservable Inputs | Total | ||||||||||||
| ||||||||||||||||
Common Stocks | $ | 24,283,714 | $ | – | $ | – | $ | 24,283,714 | ||||||||
Collateral for Securities on Loan | – | 592,080 | – | 592,080 | ||||||||||||
| ||||||||||||||||
Total | $ | 24,283,714 | $ | 592,080 | $ | – | $ | 24,875,794 | ||||||||
| ||||||||||||||||
| ICON Consumer Staples Fund | ||||||||||||||||
| Investments in Securities at Value* | Level 1 - Quoted and Unadjusted Prices | Level 2 - Other Significant Observable Inputs | Level 3 - Significant Unobservable Inputs | Total | ||||||||||||
| ||||||||||||||||
Common Stocks | $ | 27,077,476 | $ | – | $ | – | $ | 27,077,476 | ||||||||
Collateral for Securities on Loan | – | 2,009,724 | – | 2,009,724 | ||||||||||||
| ||||||||||||||||
Total | $ | 27,077,476 | $ | 2,009,724 | $ | – | $ | 29,087,200 | ||||||||
| ||||||||||||||||
| Annual Report | September 30, 2017 | 69 | |
Table of Contents
| ICON Sector Funds | Notes to Financial Statements | |
| September 30, 2017 |
| ICON Energy Fund | ||||||||||||||||
| Investments in Securities at Value* | Level 1 - Quoted and Unadjusted Prices | Level 2 - Other Significant Observable Inputs | Level 3 - Significant Unobservable Inputs | Total | ||||||||||||
| ||||||||||||||||
Common Stocks | $ | 234,214,671 | $ | – | $ | – | $ | 234,214,671 | ||||||||
Collateral for Securities on Loan | – | 18,303,527 | – | 18,303,527 | ||||||||||||
| ||||||||||||||||
Total | $ | 234,214,671 | $ | 18,303,527 | $ | – | $ | 252,518,198 | ||||||||
| ||||||||||||||||
| ICON Financial Fund | ||||||||||||||||
| Investments in Securities at Value* | Level 1 - Quoted and Unadjusted Prices | Level 2 - Other Significant Observable Inputs | Level 3 - Significant Unobservable Inputs | Total | ||||||||||||
| ||||||||||||||||
Common Stocks | $ | 40,627,120 | $ | – | $ | – | $ | 40,627,120 | ||||||||
Collateral for Securities on Loan | – | 511,875 | – | 511,875 | ||||||||||||
| ||||||||||||||||
Total | $ | 40,627,120 | $ | 511,875 | $ | – | $ | 41,138,995 | ||||||||
| ||||||||||||||||
| ICON Healthcare Fund | ||||||||||||||||
| Investments in Securities at Value* | Level 1 - Quoted and Unadjusted Prices | Level 2 - Other Significant Observable Inputs | Level 3 - Significant Unobservable Inputs | Total | ||||||||||||
| ||||||||||||||||
Common Stocks | $ | 83,933,304 | $ | – | $ | – | $ | 83,933,304 | ||||||||
| ||||||||||||||||
Total | $ | 83,933,304 | $ | – | $ | – | $ | 83,933,304 | ||||||||
| ||||||||||||||||
| ICON Industrials Fund | ||||||||||||||||
| Investments in Securities at Value* | Level 1 - Quoted and Unadjusted Prices | Level 2 - Other Significant Observable Inputs | Level 3 - Significant Unobservable Inputs | Total | ||||||||||||
| ||||||||||||||||
Common Stocks | $ | 17,151,337 | $ | – | $ | – | $ | 17,151,337 | ||||||||
| ||||||||||||||||
Total | $ | 17,151,337 | $ | – | $ | – | $ | 17,151,337 | ||||||||
| ||||||||||||||||
| ICON Information Technology Fund | ||||||||||||||||
| Investments in Securities at Value* | Level 1 - Quoted and Unadjusted Prices | Level 2 - Other Significant Observable Inputs | Level 3 - Significant Unobservable Inputs | Total | ||||||||||||
| ||||||||||||||||
Common Stocks | $ | 72,565,287 | $ | – | $ | – | $ | 72,565,287 | ||||||||
| ||||||||||||||||
Total | $ | 72,565,287 | $ | – | $ | – | $ | 72,565,287 | ||||||||
| ||||||||||||||||
| ICON Natural Resources Fund | ||||||||||||||||
| Investments in Securities at Value* | Level 1 - Quoted and Unadjusted Prices | Level 2 - Other Significant Observable Inputs | Level 3 - Significant Unobservable Inputs | Total | ||||||||||||
| ||||||||||||||||
Common Stocks | ||||||||||||||||
Building Products | $ | 1,950,085 | $ | 675,738 | $ | – | $ | 2,625,823 | ||||||||
Construction Materials | 2,528,000 | 1,621,400 | – | 4,149,400 | ||||||||||||
Diversified Chemicals | 5,527,316 | 2,450,336 | – | 7,977,652 | ||||||||||||
Gold | 5,242,690 | 2,221,362 | – | 7,464,052 | ||||||||||||
Integrated Oil & Gas | 1,817,400 | 896,840 | – | 2,714,240 | ||||||||||||
Other | 46,786,950 | – | – | 46,786,950 | ||||||||||||
| ||||||||||||||||
Total | $ | 63,852,441 | $ | 7,865,676 | $ | – | $ | 71,718,117 | ||||||||
| ||||||||||||||||
| ICON Utilities Fund | ||||||||||||||||
| Investments in Securities at Value* | Level 1 - Quoted and Unadjusted Prices | Level 2 - Other Significant Observable Inputs | Level 3 - Significant Unobservable Inputs | Total | ||||||||||||
| ||||||||||||||||
Common Stocks | $ | 43,609,598 | $ | – | $ | – | $ | 43,609,598 | ||||||||
Collateral for Securities on Loan | – | 1,878,800 | – | 1,878,800 | ||||||||||||
| ||||||||||||||||
Total | $ | 43,609,598 | $ | 1,878,800 | $ | – | $ | 45,488,398 | ||||||||
| ||||||||||||||||
| 70 | www.iconfunds.com | |
Table of Contents
| ICON Sector Funds | Notes to Financial Statements | |
| September 30, 2017 |
| * | Please refer to the Schedule of Investments and the Sector/Industry Classification tables for additional security details. |
There were no Level 3 securities held in any of the Funds at September 30, 2017.
For the year ended September 30, 2017, there was no transfer activity between Level 1, Level 2 or Level 3.
The end of period timing recognition is used for the transfers between levels of each Fund’s assets and liabilities.
Fund Share Valuation
Fund shares are sold and redeemed on a daily basis at NAV. NAV per share is determined daily as of the close of trading on the NYSE on each day the NYSE is open for trading. The NAV is computed by dividing the total value of the Fund’s investments and other assets, less liabilities, by the number of Fund shares outstanding.
Cash and Cash Equivalents
Idle cash may be swept into various overnight demand deposits and is classified as cash and cash equivalents on the Statements of Assets and Liabilities. The Funds maintain cash in bank deposit accounts which, at times, may exceed United States federally insured limits. Amounts swept overnight are available on the next business day.
Foreign Currency Translation
The accounting records of the Funds are maintained in U.S. dollars. Investment securities and other assets and liabilities denominated in a foreign currency are translated daily into U.S. dollars at the prevailing rates of exchange. Income and expenses are translated into U.S. dollars at the prevailing exchange rate on the respective dates of the transactions. Purchases and sales of securities are translated into U.S. dollars at the contractual currency exchange rates established at the time of each trade.
The Funds do not isolate that portion of the results of operations resulting from changes in foreign exchange rates on investments from the fluctuations arising from changes in market prices of securities held. Net unrealized appreciation or depreciation on investments and foreign currency translations arise from changes in the value of assets and liabilities resulting from changes in the exchange rates and changes in market prices of securities held.
Options Transactions
The Funds’ use of derivatives for the year ended September 30, 2017 was limited to purchased options.
The Funds may purchase and/or write (sell) call and put options on any security in which it may invest. The Funds utilize options to hedge against changes in market conditions or to provide market exposure while trying to reduce transaction costs.
Option contracts involve market risk and liquidity risk and can be highly volatile. Should prices of securities or securities indexes move in an unexpected manner, the Funds may not achieve the desired benefits and may realize losses and thus be in a worse position than if such strategies had not been utilized.
When a Fund writes a put or call option, an amount equal to the premium received is included on the Statements of Assets and Liabilities as a liability. The amount of the liability is subsequently marked-to-market to reflect the current fair value of the option. If an option expires on its stipulated expiration date or if the Fund enters into a closing purchase transaction, a gain or loss is realized. If a written call option on an individual security is exercised, a gain or loss is realized for the sale of the underlying security, and the proceeds from the sale are increased by the premium originally received. If a written call option on a securities index is exercised, a gain or loss is realized as determined by the premium originally received, the exercise price and the fair value of the index. If a written put option on an individual security is exercised, the cost of the security acquired is decreased by the premium originally received. As a writer of an option, a Fund bears the market risk of an unfavorable change in the price of the individual security or securities index underlying the written option. Additionally, written call options may involve the risk of limiting gains.
| Annual Report | September 30, 2017 | 71 | |
Table of Contents
| ICON Sector Funds | Notes to Financial Statements | |
| September 30, 2017 |
Each Fund may also purchase put and call options. When a Fund purchases a put or call option, an amount equal to the premium paid is included on the Fund’s Statement of Assets and Liabilities as an investment, and is subsequently marked-to-market to reflect the current fair value of the option. If an option expires on the stipulated expiration date or if the Fund enters into a closing purchase or sale transaction, a gain or loss is realized. If the Fund exercises a call option on an individual security, the cost of the security acquired is increased by the premium paid for the call. If the Fund exercises a put option on an individual security, a gain or loss is realized from the sale of the underlying security, and the proceeds from such a sale are decreased by the premium originally paid. If the Fund exercises a put or a call option on a security index, a gain or loss is realized as determined by the premium originally paid, the exercise price and the fair value of the index. Written and purchased options are non-income producing securities.
As of September 30, 2017, no Funds engaged in purchased option transactions.
The following is a summary of how these derivatives are treated in the financial statements and their impact on the Funds:
ICON Energy Fund
Risk Exposure | Statements of Operations Location | Realized Gain/(Loss) on Derivatives Recognized in Income | Change in (Depreciation) on Derivatives Recognized in Income | |||||||
| ||||||||||
Equity Contracts | Net realized gain/(loss) on Investments and foreign currency translations/ Change in unrealized net appreciation/(depreciation) on Investments and foreign currency | $ | (1,003,925) | $ | – | |||||
| ||||||||||
Total | $ | (1,003,925 | ) | $ | – | |||||
| ||||||||||
ICON Financial Fund
Risk Exposure | Statements of Operations Location | Realized Gain/(Loss) on Derivatives Recognized in Income | Change in (Depreciation) on Derivatives Recognized in Income | |||||||
| ||||||||||
Equity Contracts | Net realized gain/(loss) on Investments and foreign currency translations/ Change in unrealized net appreciation/(depreciation) on Investments and foreign currency | $ | (197,893) | $ | – | |||||
| ||||||||||
Total | $ | (197,893 | ) | $ | – | |||||
| ||||||||||
ICON Utilities Fund
Risk Exposure | Statements of Operations Location | Realized Gain/(Loss) on Derivatives Recognized in Income | Change in (Depreciation) on Derivatives Recognized in Income | |||||||
| ||||||||||
Equity Contracts (Purchased Options) | Net realized gain/(loss) on Investments and foreign currency translations/ Change in unrealized net appreciation/(depreciation) on Investments and foreign currency | $ | 175,954 | $ | (80,609) | |||||
| ||||||||||
Total | $ | 175,954 | $ | (80,609) | ||||||
| ||||||||||
| 72 | www.iconfunds.com | |
Table of Contents
| ICON Sector Funds | Notes to Financial Statements | |
| September 30, 2017 |
The average purchased option contracts during the year ended September 30, 2017, was as follows:
ICON Energy Fund | ||||||||||||
| Derivative Type | Unit of Measurement | Average Contracts+ | Days Held | |||||||||
Purchased Options | Contracts | 6,242 | 144 | |||||||||
ICON Financial Fund | ||||||||||||
| Derivative Type | Unit of Measurement | Average Contracts+ | Days Held | |||||||||
Purchased Options | Contracts | 2,797 | 92 | |||||||||
ICON Utilities Fund | ||||||||||||
| Derivative Type | Unit of Measurement | Average Contracts+ | Days Held | |||||||||
Purchased Options | Contracts | 609 | 79 | |||||||||
| + | The average is calculated based on the actual number of days with outstanding derivatives. |
The Funds value derivatives at fair value, as described above, and recognize changes in fair value currently in the results of operations. Accordingly the Funds do not follow hedge accounting, even for derivatives employed as economic hedges.
Securities Lending
Under procedures adopted by the Board, the Funds may lend securities to certain approved brokers, dealers and other financial institutions to earn additional income. Cash collateral is received in exchange for securities on loan in the amount of at least 102% of the value of U.S. securities loaned or at least 105% of the value of non-U.S. securities loaned, marked to market daily. The Funds retain certain benefits of owning the securities, including receipt of dividends or interest generated by the security, but give up other rights including the right to vote proxies. The Funds retain the ability to recall the loans at any time and could do so in order to vote proxies or to sell the loaned securities. Each loan is collateralized by cash that generally exceeds the value of the securities on loan. The fair value of the loaned securities is determined daily at the close of business of the Funds and any additional required collateral is delivered to each Fund on the next business day.
Generally, in the event of borrower default, the Funds have the right to use the collateral to offset any losses incurred. In the event the Funds are delayed or prevented from exercising their rights to dispose of the collateral, there may be a potential loss to the Funds. Some of these losses may be indemnified by the lending agent.
Effective October 14, 2016, the Funds have elected to invest the cash collateral received from lending in the State Street Navigator Securities Lending Government Money Market Portfolio which is disclosed on the Schedules of Investments. Prior to October 14, 2016, the Funds used the State Street Navigator Prime Portfolio. The Funds bear the risk of loss with respect to the investment of collateral. The net securities lending income earned by the Funds for the year ended September 30, 2017, is included in the Statements of Operations.
The following table indicates the total amount of securities loaned by type, reconciled to gross liability payable upon return of the securities loaned by the Funds as of September 30, 2017:
| Remaining contractual maturity of the lending agreement | ||||||||||||||||||||||||||||
| Overnight & Continuous | Up to 30 days | 30-90 days | Greater than 90 days | Fair Value | Collateral Received | Excess amount due to | ||||||||||||||||||||||
Securities Lending Transactions | ||||||||||||||||||||||||||||
ICON Consumer Discretionary Fund | ||||||||||||||||||||||||||||
Equity Securities | $ | 573,784 | $ | – | $ | – | $ | – | $ | 573,784 | $ | 573,784 | $ | 18,296 | ||||||||||||||
ICON Consumer Staples Fund | ||||||||||||||||||||||||||||
Equity Securities | 1,965,934 | – | – | – | 1,965,934 | 1,965,934 | 43,790 | |||||||||||||||||||||
ICON Energy Fund | ||||||||||||||||||||||||||||
Equity Securities | 17,817,440 | – | – | – | 17,817,440 | 17,817,440 | 486,087 | |||||||||||||||||||||
ICON Financial Fund | ||||||||||||||||||||||||||||
Equity Securities | 498,225 | – | – | – | 498,225 | 498,225 | 13,650 | |||||||||||||||||||||
ICON Utilities Fund | ||||||||||||||||||||||||||||
Equity Securities | 1,848,772 | – | – | – | 1,848,772 | 1,848,772 | 30,028 | |||||||||||||||||||||
| Annual Report | September 30, 2017 | 73 | |
Table of Contents
| ICON Sector Funds | Notes to Financial Statements | |
| September 30, 2017 |
Income Taxes, Dividends, and Distributions
The Funds intend to continue to qualify as regulated investment companies under Subchapter M of the Internal Revenue Code and, accordingly, the Funds will generally not be subject to federal and state income taxes or federal excise taxes to the extent that they intend to make sufficient distributions of net investment income and net realized capital gains. As of and during the year ended September 30, 2017, the Funds did not have a liability for any unrecognized tax benefits in the accompanying financial statements. The Funds recognize the interest and penalties, if any, related to the unrecognized tax benefits as income tax expense in the Statements of Operations. During the period, the Funds did not incur any interest or penalties.
Dividends paid by the Funds from net investment income and distributions of net realized short-term gains are, for federal income tax purposes, taxable as ordinary income to shareholders.
Dividends and distributions to shareholders are recorded by the Funds on the ex-dividend/distribution date. The Funds distribute income and net realized capital gains, if any, to shareholders at least annually, if not offset by capital loss carryforward. The Funds may utilize equalization accounting for tax purposes and designate earnings and profits, including net realized gains distributed to shareholders on redemption of shares, as part of the dividends paid deduction for income tax purposes. Income distributions and capital gain distributions are determined in accordance with income tax regulations, which may differ from GAAP.
Management has analyzed the Funds’ tax positions taken on federal income tax returns for all open tax periods and has concluded that no provision for federal income tax is required in the Funds’ financial statements.
The Funds file U.S. tax returns. While the statute of limitations remains open to examine the Funds’ U.S. tax returns filed for the past three years, no examinations are in progress or anticipated at this time. The Funds are not aware of any tax positions for which it is reasonably possible that the total amounts of unrecognized tax benefits will significantly change in the next twelve months.
Certain foreign countries impose a capital gains tax which is accrued by the Funds based on the unrealized appreciation, if any, on affected securities. Any accrual would reduce a Fund’s NAV. The tax is paid when the gain is realized and is included in capital gains tax in the Statements of Operations.
Investment Income
Dividend income is recorded on the ex-dividend date. Non-cash dividends included in dividend income, if any, are recorded at the fair value of the securities received. Interest income is accrued as earned. Certain dividends from foreign securities are recorded as soon as the Funds are informed of the dividend if such information is obtained subsequent to the ex-dividend date. Discounts and premiums on fixed income securities purchased are accreted or amortized to income over the life of the respective securities based on the effective yield.
Investment Transactions
Security transactions are accounted for no later than one business day after the trade date. However, for financial reporting purposes, security transactions are accounted for on the trade date. Gains and losses on securities sold are determined on the basis of identified cost.
Withholding Tax
Withholding taxes on foreign dividends have been provided for in accordance with the Funds’ understanding of the applicable country’s tax rules and rates. The ability of issuers of debt securities held by the Funds to meet their obligations may be affected by economic and political developments in specific country or region.
Other
The Funds hold certain investments which pay dividends to their shareholders based upon available funds from operations. It is possible for these dividends to exceed the underlying investments’ taxable earnings and profits resulting in the excess portion of such dividends being designated as a return of capital. Distributions received from investments in securities that represent a return of capital or capital gains are recorded as a reduction of the cost of investments or as a realized gain, respectively.
| 74 | www.iconfunds.com | |
Table of Contents
| ICON Sector Funds | Notes to Financial Statements | |
| September 30, 2017 |
Allocation of Expenses
Each class of a Fund’s shares bears expenses incurred specifically on its behalf and, in addition, each class bears a portion of general expenses, based upon relative net assets of each class or number of shareholder accounts. Expenses which cannot be directly attributed to a specific Fund in the Trust are apportioned between all Funds in the Trust based upon relative net assets or number of shareholder accounts. In calculating the net asset value per share of each class, investment income, realized and unrealized gains and losses and expenses other than class-specific expenses are allocated daily to each class of shares based upon the proportion of net assets.
Below are additional class level expenses for the year ended September 30, 2017 that are included on the Statements of Operations:
| Fund | Printing Fees | Transfer Agent Fees* | Registration Fees | |||||||||
ICON Consumer Discretionary Fund | ||||||||||||
Class S | $ | 8,859 | $ | 36,553 | $ | 18,464 | ||||||
Class A | 456 | 4,070 | 7,435 | |||||||||
ICON Consumer Staples Fund | ||||||||||||
Class S | 8,564 | 79,269 | 21,542 | |||||||||
Class A | 1,055 | 9,479 | 11,776 | |||||||||
ICON Energy Fund | ||||||||||||
Class S | 55,466 | 480,072 | 37,439 | |||||||||
Class C | 1,763 | 11,935 | 9,476 | |||||||||
Class A | 2,406 | 18,414 | 10,437 | |||||||||
ICON Financial Fund | ||||||||||||
Class S | 9,744 | 39,769 | 19,382 | |||||||||
Class A | 613 | 4,009 | 7,748 | |||||||||
ICON Healthcare Fund | ||||||||||||
Class S | 16,114 | 105,929 | 23,894 | |||||||||
Class A | 884 | 6,610 | 8,286 | |||||||||
ICON Industrials Fund | ||||||||||||
Class S | 8,657 | 44,890 | 18,575 | |||||||||
Class A | 700 | 3,690 | 8,846 | |||||||||
ICON Information Technology Fund | ||||||||||||
Class S | 12,638 | 68,273 | 22,220 | |||||||||
Class A | 627 | 4,208 | 8,753 | |||||||||
ICON Natural Resources Fund | ||||||||||||
Class S | 22,391 | 134,365 | 24,548 | |||||||||
Class C | 431 | 2,046 | 7,781 | |||||||||
Class A | 1,782 | 11,541 | 8,993 | |||||||||
ICON Utilities Fund | ||||||||||||
Class S | 10,714 | 71,656 | 28,489 | |||||||||
Class A | 4,669 | 14,345 | 12,014 | |||||||||
| * | Transfer agent out of pocket fees are a Fund level expense. |
3. FEES AND OTHER TRANSACTIONS WITH AFFILIATES
Investment Advisory Fees
ICON Advisers, Inc. (“ICON Advisers”) serves as investment adviser to the Funds and is responsible for managing the Funds’ portfolios of securities. ICON Advisers receives a monthly management fee that is computed daily at an annual rate of 1.00% on the first $500 million of average daily net assets, 0.95% on the next $250 million, 0.925% on the next $750 million, 0.90% on the next $3.5 billion, and 0.875% on average daily net assets over $5 billion.
| Annual Report | September 30, 2017 | 75 | |
Table of Contents
| ICON Sector Funds | Notes to Financial Statements | |
| September 30, 2017 |
ICON Advisers has contractually agreed to limit its Funds’ expenses (exclusive of brokerage, interest, taxes, dividends on short sales, acquired fund fees and expenses and extraordinary expenses) to the extent necessary to ensure that the Funds’ operating expenses do not exceed the following amounts:
| Fund | Class S | Class C | Class A | |||||||||
| ||||||||||||
ICON Consumer Discretionary Fund | 1.74% | – | 1.99 | % | ||||||||
ICON Consumer Staples Fund | 1.50% | – | 1.75 | % | ||||||||
ICON Energy Fund | 1.50% | 2.50% | 1.75 | % | ||||||||
ICON Financial Fund | 1.50% | – | 1.75 | % | ||||||||
ICON Healthcare Fund | 1.50% | – | 1.75 | % | ||||||||
ICON Industrials Fund | 1.50% | – | 1.75 | % | ||||||||
ICON Information Technology Fund | 1.50% | – | 1.75 | % | ||||||||
ICON Natural Resources Fund | 1.50% | 2.50% | 1.75 | % | ||||||||
ICON Utilities Fund* | 1.22% | – | 1.47 | % | ||||||||
| * | From October 1, 2016 to June 30, 2017, the annual expense limitation rates for the Utilities Fund’s Class S and Class A were 1.50% and 1.75%, respectively. |
The Funds’ expense limitations, excluding the Utilities Fund Class S and Class A, will continue in effect until at least January 31, 2018. The expense limitations for the Utilities Fund Class S and Class A will continue in effect until at least January 31, 2019. To the extent ICON Advisers reimburses or absorbs fees and expenses, it may seek payment of such amounts for up to three years after the expenses were reimbursed or absorbed. A Fund will make no such payment, however, if the total Fund operating expenses exceed the expense limits in effect at the time these payments are proposed.
As of September 30, 2017, the following amounts were available for recoupment by ICON Advisers based upon their potential expiration dates:
| Fund | Expires 2018 | Expires 2019 | Expires 2020 | |||||||||
| ||||||||||||
ICON Consumer Discretionary Fund | $ | – | $ | 3,370 | $ | 4,198 | ||||||
ICON Consumer Staples Fund | 36,127 | 51,650 | 63,487 | |||||||||
ICON Financial Fund | 3,369 | 8,903 | 6,790 | |||||||||
ICON Healthcare Fund | – | 1,898 | 4,986 | |||||||||
ICON Industrials Fund | 5,501 | 44,625 | 44,703 | |||||||||
ICON Information Technology Fund | 1,387 | 8,637 | 6,814 | |||||||||
ICON Natural Resources Fund | 3,552 | 56,774 | 26,508 | |||||||||
ICON Utilities Fund | 30,003 | 31,946 | 57,017 | |||||||||
Accounting, Custody and Transfer Agent Fees
ALPS Fund Services (“ALPS”) serves as the fund accounting agent for the Trust. For its services, the Trust pays ALPS a fee that is calculated daily and paid monthly at an annual rate based on the aggregate average daily net assets of the Trust.
State Street is the custodian of the Trust’s investments. For its services, the Trust pays State Street asset-based fees that vary according to the number of positions and transactions, plus out-of-pocket expenses.
ALPS is the Trust’s transfer agent. For these services, the Trust pays an annual fee plus annual base fee per Fund, per account fees and out-of-pocket expenses.
Administrative Services
The Trust has entered into an administrative services agreement with ICON Advisers pursuant to which ICON Advisers oversees the administration of the Trust’s business and affairs. This agreement provides for an annual fee of 0.05% on the Trust’s first $1.5 billion of average daily net assets, 0.045% on the next $1.5 billion of average daily net assets, 0.040% on the next $2 billion of average daily net assets and 0.030% on average daily net assets over $5 billion. For the year ended September 30, 2017, each Fund’s payment for administrative services to ICON Advisers is included on the Statements of Operations. The administrative services agreement provides that ICON Advisers will not be liable for any error of judgment, mistake of law, or any loss suffered by the Trust in connection with matters to which the administrative services agreement relates, except for a loss resulting from willful misfeasance, bad faith or negligence by ICON Advisers in the performance of its duties.
| 76 | www.iconfunds.com | |
Table of Contents
| ICON Sector Funds | Notes to Financial Statements | |
| September 30, 2017 |
ICON Advisers has a sub-administration agreement, with ALPS, under which ALPS assists ICON Advisers with the administration and business affairs of the Trust. For its services, ICON Advisers pays ALPS a fee that is calculated daily and paid monthly at an annual rate based on the aggregate average daily net assets of the Trust.
Distribution Fees
ICON Distributors, Inc. (“IDI” or “Distributor”), a wholly-owned subsidiary of ICON Management and Research and affiliate of ICON Advisers, Inc., serves the Trust as Distributor. The Trust has adopted a Distribution Plan pursuant to Rule 12b-1 under the 1940 Act (“12b-1 Plan”) under which the Funds are authorized to compensate or reimburse the Distributor for the sale and distribution of shares and for other shareholder services. The shareholders of the Funds pay an annual distribution fee of 1.00% of average daily net assets for Class C shares and an annual distribution fee of 0.25% of average daily net assets for Class A shares. There is no annual distribution fee for Class S shares. The total amount paid by each Fund under the 12b-1 Plan is shown on the Statements of Operations.
Class A Shares are subject to an initial sales charge and the public offering price of Class A shares equals net asset value plus the applicable sales charge, which is a maximum of 5.75%. For the year ended September 30, 2017, IDI collected sales charges on purchases of Class A Shares, the majority of which were paid out as concessions to financial intermediaries, as follows:
| Fund | Sales Charges Collected | |||
ICON Consumer Discretionary Fund Class A | $ 391 | |||
ICON Consumer Staples Fund Class A | 5,664 | |||
ICON Energy Fund Class A | 3,685 | |||
ICON Financial Fund Class A | 2,030 | |||
ICON Healthcare Fund Class A | 3,450 | |||
ICON Industrials Fund Class A | 4,257 | |||
ICON Information Technology Fund Class A | 4,398 | |||
ICON Natural Resources Fund Class A | 6,766 | |||
ICON Utilities Fund Class A | 5,839 | |||
In addition, IDI receives a contingent deferred sales charge of 1.00% of the purchase price on redemptions of Class C shares made within one year following the date of purchase. A 1.00% contingent deferred sales charge may also apply to certain redemptions of Class A shares made within one year following the purchase of $1 million or more without an initial sales charge. For the year ended September 30, 2017, IDI collected the following contingent deferred sales charges:
| Fund | Contingent Deferred Sales Charges Collected | |||
ICON Energy Fund Class C | $ 652 | |||
ICON Natural Resources Fund Class C | 115 | |||
Other Related Parties
Certain Officers and Directors of ICON Advisers are also Officers and Trustees of the Funds; however, such Officers and Trustees (with the exception of the Chief Compliance Officer, “CCO”) receive no compensation from the Funds. The Trust pays a portion of the CCO’s salary and the remaining portion, along with other employee related expenses, is paid by ICON Advisers. For the year ended September 30, 2017, the total related amounts paid by the Funds under this arrangement are included in Other Expenses on the Statements of Operations.
The Funds may reimburse ICON Advisers for legal work performed for the Funds by its attorneys outside of the advisory and administration contracts. The Board reviews and approves such reimbursements. For the year ended September 30, 2017, the total related amounts accrued or paid by the Funds under this arrangement was $9,212 and is included in Other Expenses on the Statements of Operations.
The Funds did not engage in cross trades with each other, during the year ended September 30, 2017, pursuant to Rule 17a-7 under the 1940 Act. Generally, cross trading is the buying or selling of portfolio securities between funds to which the Adviser serves as the investment adviser. The Board previously adopted procedures that apply to transactions between the Funds and its affiliates pursuant to Rule 17a-7. At its regularly scheduled meetings, the Board reviews such transactions as of the most current calendar quarter for compliance with the requirements set forth by Rule 17a-7 and the Funds’ procedures. The procedures require that the transactions be a purchase or sale for no consideration other than cash payment against prompt delivery of a security for which market quotations are readily available, and be consistent with the investment policies of each Fund.
| Annual Report | September 30, 2017 | 77 | |
Table of Contents
| ICON Sector Funds | Notes to Financial Statements | |
| September 30, 2017 |
4. BORROWINGS
The Trust has entered into an uncommitted, unsecured, revolving Line of Credit agreement/arrangement with State Street to provide temporary funding for redemption requests. The maximum borrowing limit is $50 million. Interest on domestic borrowings is charged at a rate quoted and determined by State Street. The interest rate as of September 30, 2017 was 2.48%. The Line of Credit agreement/arrangement expires on March 19, 2018.
As of September 30, 2017, the Utilities Fund had an outstanding borrowing in the amount of $177,025.
For the year ended September 30, 2017, the average outstanding loan by Fund was as follows:
| Fund | Maximum Borrowing (10/01/16 - 9/30/17) | Average Borrowing (10/01/16 - 9/30/17)^ | Average Interest Rates (10/01/16 - 9/30/17)^ | |||||||
ICON Consumer Discreationay Fund* | $ | 455,349 | $ | 325,587 | 2.24% | |||||
ICON Consumer Staples Fund* | 4,675,799 | 1,963,828 | 2.08% | |||||||
ICON Energy Fund* | 15,318,795 | 4,365,834 | 2.33% | |||||||
ICON Financial Fund* | 2,898,338 | 394,785 | 1.94% | |||||||
ICON Healthcare Fund* | 346,532 | 132,009 | 2.23% | |||||||
ICON Industrials Fund* | 6,824,961 | 1,040,547 | 2.18% | |||||||
ICON Information Technology Fund* | 1,615,940 | 723,295 | 1.91% | |||||||
ICON Natural Resources Fund* | 179,119 | 179,119 | 2.02% | |||||||
ICON Utilities Fund | 5,108,504 | 405,080 | 2.15% | |||||||
| * | There were no outstanding borrowings under this agreement/arrangement as of September 30, 2017. |
| ^ | The average is calculated based on the actual number of days with outstanding borrowings. |
5. PURCHASES AND SALES OF INVESTMENT SECURITIES
For the year ended September 30, 2017, the aggregate cost of purchases and proceeds from sales of investment securities (excluding short-term securities) was as follows:
| Fund | Purchases of Securities | Proceeds from Sales of Securities | ||||||||
ICON Consumer Discretionary Fund | $ | 42,417,838 | $ | 59,420,421 | ||||||
ICON Consumer Staples Fund | 33,189,275 | 44,454,041 | ||||||||
ICON Energy Fund | 219,872,043 | 325,639,984 | ||||||||
ICON Financial Fund | 29,515,388 | 47,834,313 | ||||||||
ICON Healthcare Fund | 137,907,027 | 142,684,099 | ||||||||
ICON Industrials Fund | 15,285,700 | 25,144,360 | ||||||||
ICON Information Technology Fund | 71,704,044 | 65,977,436 | ||||||||
ICON Natural Resources Fund | 45,223,244 | 53,342,541 | ||||||||
ICON Utilities Fund | 78,540,587 | 95,849,096 | ||||||||
6. FEDERAL INCOME TAX
The following information is presented on an income tax basis. Differences between GAAP and federal income tax purposes that are permanent in nature are reclassified within the capital accounts. Temporary differences do not require reclassification. Temporary and permanent differences do not impact the NAVs of the Funds. These differences are due to differing treatments for items such as deferrals of wash sale losses, foreign currency transactions, equalization, excise tax paid, expiring capital losses, distribution adjustments, partnership adjustments, and net investment losses.
| 78 | www.iconfunds.com | |
Table of Contents
| ICON Sector Funds | Notes to Financial Statements | |
| September 30, 2017 |
Under the Regulated Investment Company Modernization Act of 2010 (the “Act”) capital losses generated by a Fund may be carried over indefinitely, but these losses must be used prior to the utilization of any pre-enactment capital losses. Since pre-enactment capital losses may only be carried forward for eight years there may be a greater likelihood that all or a portion of each Fund’s pre-enactment capital losses will expire unused.
For the year ended September 30, 2017, the following Funds had capital loss carryforwards:
| Fund | Expiring in 2018 | |||
ICON Financial Fund | $ | 43,715,782 | ||
ICON Industrials Fund | 14,505,764 | |||
Future capital loss carryforward utilization in any given year may be limited if there are substantial shareholder redemptions or contributions. During the year ended September 30, 2017, the following Funds utilized capital loss carryforwards:
| Fund | Amount | |||
ICON Industrials Fund | $ | 3,708,253 | ||
For Energy Fund, the short-term and long-term capital losses with no expiration were $86,007,958 and $65,788,384, respectively. For Financial Fund, the short-term capital losses with no expiration were $493,677, capital losses of $42,575,056 expired on September 30, 2017.
The Energy Fund elects to defer to the period ending September 30, 2018, capital losses recognized during the period November 1, 2016 to September 30, 2017 in the amount of $18,358,462.
The Industrials Fund elects to defer to the period ending September 30, 2018, late year ordinary losses in the amount of $36,399.
For the year ended September 30, 2017, the following reclassifications, which had no impact on results of operations or net assets was recorded to reflect the tax character of the Funds net operating loss:
| Fund | Paid-in Capital | Accumulated Net Investment Income/(Loss) | Accumulated Net Realized Gain/(Loss) on Investments | |||||||||
ICON Consumer Discretionary Fund | $ | 581 | $ | 155,209 | $ | (155,790) | ||||||
ICON Energy Fund | 1,540,881 | 2,745,178 | (4,286,059) | |||||||||
ICON Financial Fund | (42,575,056) | (54) | 42,575,110 | |||||||||
ICON Healthcare Fund | – | 358,267 | (358,267) | |||||||||
ICON Industrials Fund | (62,957) | 62,957 | – | |||||||||
ICON Information Technology Fund | – | 183,299 | (183,299) | |||||||||
ICON Natural Resources Fund | – | (11,588) | 11,588 | |||||||||
ICON Utilities Fund | (158) | 193,163 | (193,005) | |||||||||
For Industrials Fund included in the amounts reclassified was a net operating loss offset to paid in capital of $62,957.
The tax characteristics of distributions paid to shareholders during the fiscal year ended September 30, 2017, were as follows:
| Fund | Ordinary Income | Long-Term Capital Gains | ||||||
ICON Consumer Discretionary Fund | $ | 585,099 | $ | 1,670,363 | ||||
ICON Consumer Staples Fund | 2,065,125 | 1,778,292 | ||||||
ICON Energy Fund | 1,977,974 | – | ||||||
ICON Financial Fund | 530,652 | – | ||||||
ICON Healthcare Fund | – | 1,215,871 | ||||||
ICON Information Technology Fund | 629,475 | 8,725,258 | ||||||
ICON Natural Resources Fund | 416,879 | – | ||||||
ICON Utilities Fund | 4,557,628 | 1,120,416 | ||||||
| Annual Report | September 30, 2017 | 79 | |
Table of Contents
| ICON Sector Funds | Notes to Financial Statements | |
| September 30, 2017 |
The tax characteristics of distributions paid to shareholders during the fiscal year ended September 30, 2016, were as follows:
| Fund | Ordinary Income | Long-Term Capital Gains | ||||||
ICON Consumer Discretionary Fund | $ | 1,967,808 | $ | 2,499,540 | ||||
ICON Consumer Staples Fund | 528,316 | 2,182,632 | ||||||
ICON Energy Fund | 3,214,770 | – | ||||||
ICON Healthcare Fund | 16,435,757 | 4,598,527 | ||||||
ICON Natural Resources Fund | 325,103 | 4,742,663 | ||||||
ICON Utilities Fund | 1,424,724 | – | ||||||
As of September 30, 2017, the components of accumulated earnings/(deficit) on a tax basis were as follows:
| Fund | Undistributed Ordinary Income | Accumulated Capital Gains/ (Losses) | Other Cumulative Effect of Timing Differences | Unrealized (Depreciation)* | Total Accumulated Earnings/(Deficit) | |||||||||||||||
ICON Consumer Discretionary Fund | $ | 946,940 | $ | – | $ | – | $ | 67,104 | $ | 1,014,044 | ||||||||||
ICON Consumer Staples Fund | 500,273 | 282,407 | – | (100,102) | 682,578 | |||||||||||||||
ICON Energy Fund | 3,396,071 | (170,154,804) | (1,959,875) | 4,777,356 | (163,941,252) | |||||||||||||||
ICON Financial Fund | 74,836 | (44,209,459) | – | 6,978,668 | (37,155,955) | |||||||||||||||
ICON Healthcare Fund | 833,111 | 1,243,406 | – | 5,657,282 | 7,733,799 | |||||||||||||||
ICON Industrials Fund | – | (14,505,764) | (36,399) | 1,536,835 | (13,005,328) | |||||||||||||||
ICON Information Technology Fund | 3,404,832 | 10,355,627 | – | 11,053,694 | 24,814,153 | |||||||||||||||
ICON Natural Resources Fund | 1,011,297 | – | – | 7,449,809 | 8,461,106 | |||||||||||||||
ICON Utilities Fund | 1,121,252 | 1,205,110 | – | 1,583,214 | 3,909,576 | |||||||||||||||
| * | Differences between the book-basis and tax-basis unrealized appreciation/(depreciation) are attributable primarily to tax treatment of partnerships and passive foreign investment companies, and tax deferral of losses on wash sales. |
As of September 30, 2017, cost on investments for federal income tax purposes and the amount of net unrealized appreciation/(depreciation) were as follows:
| Fund | Gross Appreciation (excess of value over tax cost) | Gross Depreciation (excess of tax cost over value) | Net Appreciation/ (Depreciation) of Foreign Currency | Net Unrealized Appreciation/ (Depreciation) | Cost of Investments for Income Tax Purposes | |||||||||||||||
ICON Consumer Discretionary Fund | $ | 1,589,227 | $ | (1,522,123 | ) | $ | – | $ | 67,104 | $ | 24,808,690 | |||||||||
ICON Consumer Staples Fund | 1,114,661 | (1,214,763 | ) | – | (100,102 | ) | 29,187,302 | |||||||||||||
ICON Energy Fund | 27,545,279 | (22,767,923 | ) | – | 4,777,356 | 247,740,842 | ||||||||||||||
ICON Financial Fund | 7,074,547 | (95,879 | ) | – | 6,978,668 | 34,160,327 | ||||||||||||||
ICON Healthcare Fund | 8,288,381 | (2,631,099 | ) | – | 5,657,282 | 78,276,022 | ||||||||||||||
ICON Industrials Fund | 2,187,806 | (650,964 | ) | (7 | ) | 1,536,835 | 15,614,495 | |||||||||||||
ICON Information Technology Fund | 12,643,816 | (1,590,123 | ) | 1 | 11,053,694 | 61,511,594 | ||||||||||||||
ICON Natural Resources Fund | 9,766,871 | (2,317,154 | ) | 92 | 7,449,809 | 64,268,400 | ||||||||||||||
ICON Utilities Fund | 3,028,877 | (1,445,326 | ) | (337 | ) | 1,583,214 | 43,904,847 | |||||||||||||
7. RECENT ACCOUNTING PRONOUNCEMENT
In December 2016, the Financial Accounting Standards Board (“FASB”) issued Accounting Standards Update (“ASU”) 2016-19, “Technical Corrections and Improvements.” It includes an update to Accounting Standards Codification Topic 820 (“Topic 820”), Fair Value Measurement. The update to Topic 820 clarifies the difference between a valuation approach and a valuation technique. It also requires disclosure when there has been a change in either or both a valuation approach and/or a valuation technique. The changes related to Topic 820 are effective for annual reporting periods, including interim periods within those annual periods, beginning after December 15, 2016. Management is currently evaluating the impact of the ASU to the financial statements.
| 80 | www.iconfunds.com | |
Table of Contents
| ICON Sector Funds | Notes to Financial Statements | |
| September 30, 2017 |
8. SUBSEQUENT EVENTS
Rob Young is the Portfolio Manager of the Industrials Fund. Mr. Young became the Portfolio Manager of the Fund in November 2017.
Rob Young is the Portfolio Manager of the Natural Resources Fund. Mr. Young became the Portfolio Manager of the Fund in November 2017.
| Annual Report | September 30, 2017 | 81 | |
Table of Contents
| ICON Sector Funds | Report of Independent Registered Public Accounting Firm | |
To the Shareholders and Board of Trustees of ICON Funds
We have audited the accompanying statements of assets and liabilities, including the schedules of investments, of ICON Consumer Discretionary Fund, ICON Consumer Staples Fund, ICON Energy Fund, ICON Financial Fund, ICON Healthcare Fund, ICON Industrials Fund, ICON Information Technology Fund, ICON Natural Resources Fund, and ICON Utilities Fund (the “Funds”), each a series of ICON Funds, as of September 30, 2017, and the related statements of operations for the year then ended, and the statements of changes in net assets and the financial highlights for each of the two years in the period then ended. These financial statements and financial highlights are the responsibility of the Funds’ management. Our responsibility is to express an opinion on these financial statements and financial highlights based on our audits. The Funds’ financial statements and financial highlights for the years ended September 30, 2015 and prior, were audited by other auditors, whose report dated November 18, 2015 expressed an unqualified opinion on those financial statements and financial highlights.
We conducted our audits in accordance with the standards of the Public Company Accounting Oversight Board (United States). Those standards require that we plan and perform the audit to obtain reasonable assurance about whether the financial statements and financial highlights are free of material misstatement. An audit includes examining, on a test basis, evidence supporting the amounts and disclosures in the financial statements. Our procedures included confirmation of securities owned as of September 30, 2017, by correspondence with the custodian and brokers or by other appropriate auditing procedures where replies from brokers or counterparties were not received. An audit also includes assessing the accounting principles used and significant estimates made by management, as well as evaluating the overall financial statement presentation. We believe that our audits provide a reasonable basis for our opinion.
In our opinion, the financial statements and financial highlights referred to above present fairly, in all material respects, the financial position of each of the Funds as of September 30, 2017, the results of their operations for the year then ended, and the statements of changes in their net assets and the financial highlights for each of the two years in the period then ended, in conformity with accounting principles generally accepted in the United States of America.

COHEN & COMPANY, LTD.
Cleveland, Ohio
November 22, 2017
| 82 | www.iconfunds.com | |
Table of Contents
| ICON Sector Funds | Disclosure of Fund Expenses | |
| September 30, 2017 (Unaudited) |
Example
As a shareholder of a Fund you may pay two types of fees: transaction fees and fund-related fees. Certain funds charge transaction fees, including sales charges (loads) on purchase payments, reinvested dividends, or other distributions; redemption fees; and exchange fees. Funds also incur various ongoing expenses, including management fees, distribution and/or service fees, and other fund expenses, which are indirectly paid by shareholders.
This Example is intended to help you understand your ongoing costs (in dollars) of investing in the various ICON Funds and to compare these costs with the ongoing costs of investing in other mutual funds. This Example is based on an investment of $1,000 invested at the beginning of the six-month period and held for the six-month period (4/01/17 – 9/30/17).
Actual Expenses
The first line in the table for each Fund provides information about actual account values and actual expenses. The Example includes, but is not limited to, management fees, 12b-1 fees, fund accounting, custody and transfer agent fees. However, the Example does not include client specific fees, such as the $15 fee charged to IRA accounts, or the $15 fee charged for wire redemptions. You may use this information, together with the amount you invested, to estimate the expenses that you paid over the period. Simply divide your account value by $1,000 (for example, an $8,600 account value divided by $1,000 = 8.6), then multiply the result by the number in the first line for each Fund under the heading entitled “Expenses Paid During Period” to estimate the expenses you paid on your account during this period.
Hypothetical Example for Comparison Purposes
The second line in the table for each Fund provides information about hypothetical account values and hypothetical expenses based on the Fund’s actual expense ratio and an assumed rate of return of 5% per year before expenses, which is not the Fund’s actual return. The hypothetical account values and expenses may not be used to estimate the actual ending account balance or expenses you paid for the period. You may use this information to compare the ongoing costs of investing in the Fund and other funds. To do so, compare this 5% hypothetical example with the 5% hypothetical examples that appear in the shareholder reports of the other funds. Please note that the expenses shown in the table are meant to highlight your ongoing costs only and do not reflect any transactional costs, such as sales charges (loads), redemption fees, or exchange fees that may be charged by other funds. Therefore, this information is useful in comparing ongoing costs only, and will not help you determine the relative total costs of owning different funds.
Beginning Account April 1, 2017 | Ending Account Value September 30, 2017 | Expense Ratio(a) | Expenses Paid April 1, 2017 - | |||||||||
ICON Consumer Discretionary Fund | ||||||||||||
Class S | ||||||||||||
Actual | $ 1,000.00 | $ 1,008.70 | 1.51% | $ 7.60 | ||||||||
Hypothetical (5% return before expenses) | $ 1,000.00 | $ 1,017.50 | 1.51% | $ 7.64 | ||||||||
Class A | ||||||||||||
Actual | $ 1,000.00 | $ 1,006.00 | 1.99% | $ 10.01 | ||||||||
Hypothetical (5% return before expenses) | $ 1,000.00 | $ 1,015.09 | 1.99% | $ 10.05 | ||||||||
ICON Consumer Staples Fund | ||||||||||||
Class S | ||||||||||||
Actual | $ 1,000.00 | $ 1,009.50 | 1.50% | $ 7.56 | ||||||||
Hypothetical (5% return before expenses) | $ 1,000.00 | $ 1,017.55 | 1.50% | $ 7.59 | ||||||||
Class A | ||||||||||||
Actual | $ 1,000.00 | $ 1,008.20 | 1.75% | $ 8.81 | ||||||||
Hypothetical (5% return before expenses) | $ 1,000.00 | $ 1,016.29 | 1.75% | $ 8.85 | ||||||||
| Annual Report | September 30, 2017 | 83 | |
Table of Contents
| ICON Sector Funds | Disclosure of Fund Expenses | |
| September 30, 2017 (Unaudited) |
Beginning Account April 1, 2017 | Ending Account Value September 30, 2017 | Expense Ratio(a) | Expenses Paid During period April 1, 2017 - September 30, 2017(b) | |||||||||||||||||
ICON Energy Fund | ||||||||||||||||||||
Class S | ||||||||||||||||||||
Actual | $ | 1,000.00 | $ | 970.20 | 1.41 | % | $ | 6.96 | ||||||||||||
Hypothetical (5% return before expenses) | $ | 1,000.00 | $ | 1,018.00 | 1.41 | % | $ | 7.13 | ||||||||||||
Class C | ||||||||||||||||||||
Actual | $ | 1,000.00 | $ | 964.80 | 2.49 | % | $ | 12.26 | ||||||||||||
Hypothetical (5% return before expenses) | $ | 1,000.00 | $ | 1,012.58 | 2.49 | % | $ | 12.56 | ||||||||||||
Class A | ||||||||||||||||||||
Actual | $ | 1,000.00 | $ | 968.50 | 1.70 | % | $ | 8.39 | ||||||||||||
Hypothetical (5% return before expenses) | $ | 1,000.00 | $ | 1,016.55 | 1.70 | % | $ | 8.59 | ||||||||||||
ICON Financial Fund | ||||||||||||||||||||
Class S | ||||||||||||||||||||
Actual | $ | 1,000.00 | $ | 1,075.70 | 1.44 | % | $ | 7.49 | ||||||||||||
Hypothetical (5% return before expenses) | $ | 1,000.00 | $ | 1,017.85 | 1.44 | % | $ | 7.28 | ||||||||||||
Class A | ||||||||||||||||||||
Actual | $ | 1,000.00 | $ | 1,075.30 | 1.75 | % | $ | 9.10 | ||||||||||||
Hypothetical (5% return before expenses) | $ | 1,000.00 | $ | 1,016.29 | 1.75 | % | $ | 8.85 | ||||||||||||
ICON Healthcare Fund | ||||||||||||||||||||
Class S | ||||||||||||||||||||
Actual | $ | 1,000.00 | $ | 1,074.70 | 1.41 | % | $ | 7.33 | ||||||||||||
Hypothetical (5% return before expenses) | $ | 1,000.00 | $ | 1,018.00 | 1.41 | % | $ | 7.13 | ||||||||||||
Class A | ||||||||||||||||||||
Actual | $ | 1,000.00 | $ | 1,073.10 | 1.75 | % | $ | 9.09 | ||||||||||||
Hypothetical (5% return before expenses) | $ | 1,000.00 | $ | 1,016.29 | 1.75 | % | $ | 8.85 | ||||||||||||
ICON Industrials Fund | ||||||||||||||||||||
Class S | ||||||||||||||||||||
Actual | $ | 1,000.00 | $ | 1,045.40 | 1.50 | % | $ | 7.69 | ||||||||||||
Hypothetical (5% return before expenses) | $ | 1,000.00 | $ | 1,017.55 | 1.50 | % | $ | 7.59 | ||||||||||||
Class A | ||||||||||||||||||||
Actual | $ | 1,000.00 | $ | 1,045.20 | 1.75 | % | $ | 8.97 | ||||||||||||
Hypothetical (5% return before expenses) | $ | 1,000.00 | $ | 1,016.29 | 1.75 | % | $ | 8.85 | ||||||||||||
ICON Information Technology Fund | ||||||||||||||||||||
Class S | ||||||||||||||||||||
Actual | $ | 1,000.00 | $ | 1,144.10 | 1.38 | % | $ | 7.42 | ||||||||||||
Hypothetical (5% return before expenses) | $ | 1,000.00 | $ | 1,018.15 | 1.38 | % | $ | 6.98 | ||||||||||||
Class A | ||||||||||||||||||||
Actual | $ | 1,000.00 | $ | 1,142.90 | 1.75 | % | $ | 9.40 | ||||||||||||
Hypothetical (5% return before expenses) | $ | 1,000.00 | $ | 1,016.29 | 1.75 | % | $ | 8.85 | ||||||||||||
ICON Natural Resources Fund | ||||||||||||||||||||
Class S | ||||||||||||||||||||
Actual | $ | 1,000.00 | $ | 1,062.40 | 1.50 | % | $ | 7.76 | ||||||||||||
Hypothetical (5% return before expenses) | $ | 1,000.00 | $ | 1,017.55 | 1.50 | % | $ | 7.59 | ||||||||||||
Class C | ||||||||||||||||||||
Actual | $ | 1,000.00 | $ | 1,057.80 | 2.50 | % | $ | 12.90 | ||||||||||||
Hypothetical (5% return before expenses) | $ | 1,000.00 | $ | 1,012.53 | 2.50 | % | $ | 12.61 | ||||||||||||
Class A | ||||||||||||||||||||
Actual | $ | 1,000.00 | $ | 1,061.60 | 1.75 | % | $ | 9.04 | ||||||||||||
Hypothetical (5% return before expenses) | $ | 1,000.00 | $ | 1,016.29 | 1.75 | % | $ | 8.85 | ||||||||||||
| ||
| 84 | www.iconfunds.com | |
Table of Contents
| ICON Sector Funds | Disclosure of Fund Expenses | |
| September 30, 2017 (Unaudited) |
Beginning Account April 1, 2017 | Ending Account Value September 30, 2017 | Expense Ratio(a) | Expenses Paid During period April 1, 2017 - September 30, 2017(b) | |||||||||||||||||
ICON Utilities Fund | ||||||||||||||||||||
Class S | ||||||||||||||||||||
Actual | $ | 1,000.00 | $ | 1,029.80 | 1.37 | % | $ | 6.97 | ||||||||||||
Hypothetical (5% return before expenses) | $ | 1,000.00 | $ | 1,018.20 | 1.37 | % | $ | 6.93 | ||||||||||||
Class A | ||||||||||||||||||||
Actual | $ | 1,000.00 | $ | 1,027.80 | 1.62 | % | $ | 8.24 | ||||||||||||
Hypothetical (5% return before expenses) | $ | 1,000.00 | $ | 1,016.95 | 1.62 | % | $ | 8.19 | ||||||||||||
| (a) | The Fund’s expense ratios have been annualized based on the Fund’s most recent fiscal half-year expenses. |
| (b) | Expenses are equal to the Fund’s annualized expense ratio multiplied by the average account value over the period, multiplied by the number of days in the most recent fiscal half-year 183/365 (to reflect the half-year period). |
Total returns exclude applicable sales charges. If sales charges were included (maximum 5.75%), returns would be lower.
| ||
| Annual Report | September 30, 2017 | 85 | |
Table of Contents
| ICON Sector Funds | Board of Trustees and Fund Officers | |
| September 30, 2017 (Unaudited) |
The ICON Funds Board of Trustees (the “Board”) consists of four Trustees who oversee the 17 ICON Funds (the “Funds”). The Board is responsible for general oversight of the Funds’ business and for assuring that the Funds are managed in the best interest of the Funds’ shareholders. The Trustees, and their ages, and principal occupations are set forth below. The address of the Trustees is 5299 DTC Blvd., Suite 1200, Greenwood Village, CO 80111. Trustees have no official term of office and generally serve until they resign or are not re-elected.
Interested Trustee
Craig T. Callahan, 66. Chairman of the Board. Dr. Callahan has been a Trustee of the Funds since their inception. Dr. Callahan also serves as President (2014 to present and 1998 to 2013) and Chairman of the Investment Committee (2005 to present) and served as the Chief Investment Officer (1991 to 2004) of ICON Advisers, Inc. Dr. Callahan is also Executive Vice President (2005 to present); Director (1991 to present); and was previously President (1998 to 2005) and Chief Compliance Officer (2005) of ICO Distributors, Inc. Dr. Callahan also serves as the President (1998 to present) and Chairman of the Board of Directors (1994 to present) of IM&R, the parent company of ICON Advisers, Inc. and ICON Distributors, Inc.
Independent Trustees
Glen F. Bergert, 67. Mr. Bergert has been a Trustee of the Funds since 1999. Mr. Bergert is President of Venture Capital Management LLC (1997 to present), General Partner of SOGNO Partners LP, a venture capital company (2001 to 2015), General Partner of Bergert Properties, LLP, a real estate holding company (1997 to present), General Partner of Pyramid Real Estate Partnership, a real estate development company (1998 to present), General Partner of Chamois Partners, LP, a venture capital company (2004 to present) and was previously a General Partner with KPMG Peat Marwick, LLP (1979 to 1997). Mr. Bergert is also a Director of Delta Dental of California (2013 to present and 2006 to 2012), Delta Dental of Pennsylvania (2010 to present and 1998 to 2009), Delta Reinsurance Corporation (2015 to present; 2011 to 2014 and 2000 to 2009) and Dentegra Group, Inc. (2017 to present; 2010 to 2014).
John C. Pomeroy, Jr., 70. Mr. Pomeroy has been a Trustee of the Funds since 2002. Mr. Pomeroy is Chief Investment Officer and Director of Investments, Pennsylvania State University (2001 to present) and was Portfolio Manager and Product Manager, Trinity Investment Management Corporation (1989 to 2001).
R. Michael Sentel, 69. Mr. Sentel has been a Trustee of the Funds since their inception. Mr. Sentel is a Senior Attorney with the U.S. Department of Education (1996 to present) and was engaged in private practice of securities and corporate law (1981 to 2017). Mr. Sentel began his legal career with the U.S. Securities and Exchange Commission’s Division of Enforcement and served as a Branch Chief (1980 to 1981). Later he served as the Section Chief for the Professional Liability Section of the Federal Deposit Insurance Corp. with responsibility for the Rocky Mountain Region (1991 to 1994).
Mark Manassee, 52. Mr. Manassee has been a Trustee of the Funds since 2017. Mr. Manassee is a Senior Advisor to McKinsey’s Wealth and Asset Management Practice. Mr. Manassee was Principal and President of Market Metrics, LLC, a subsidiary of FactSet Research Systems, Inc. (1998 to 2016). Mr. Manassee was also a Director of Matrix-Data, Ltd (UK) (2013 to 2016) and Rhetorik, Ltd (UK) (2013 to 2016).
The Officers of the Funds are:
Craig T. Callahan, 66. Chairman of the Board. Dr. Callahan has been a Trustee of the Funds since their inception. Dr. Callahan also serves as President (2014 to present and 1998 to 2013) and Chairman of the Investment Committee (2005 to present) and served as the Chief Investment Officer (1991 to 2004) of ICON Advisers, Inc. Dr. Callahan is also Executive Vice President (2005 to present); Director (1991 to present); and was previously President (1998 to 2005) and Chief Compliance Officer (2005) of ICO Distributors, Inc. Dr. Callahan also serves as the President (1998 to present) and Chairman of the Board of Directors (1994 to present) of IM&R, the parent company of ICON Advisers, Inc. and ICON Distributors, Inc.
Donald Salcito, 64. Mr. Salcito serves as Vice President and Secretary of the Funds (2006 to present). Mr. Salcito is also Executive Vice President and General Counsel (2005 to present) of ICON Advisers, Inc.; Director of IM&R (2005 to present); Executive Vice President, Secretary, General Counsel of ICON Distributors, Inc. (2005 to 2017). Previously, he was a Partner in various national law firms, practicing in the securities law area (1980 to 2005).
Brian D. Harding, 38. Mr. Harding serves as Principal Financial Officer and Treasurer of the Funds (2017 to present). Mr. Harding is also Chief Financial Officer of ICON Advisers, Inc. (2013 to present) and Director and IM&R (2013 to present). Previously he was Chief Compliance Officer and Anti-Money Laundering Officer of the Funds (2008 to 2013), Chief Compliance Officer of ICON Advisers, Inc. (2011 to 2013), and Manager at PricewaterhouseCoopers LLP (2001 to 2008).
Jack M. Quillin, 45. Mr. Quillin serves as Assistant Treasurer of the Funds (2017 to present). Mr. Quillin is also a Compliance and Fund Accounting Associate of ICON Advisers, Inc. (2016 to present). Previously, he was a compliance analyst at Marsico Capital Management, LLC (2011 to 2015), an assistant vice president in the municipal derivatives finance department at Merrill Lynch (2004 to 2008), and a senior accountant in the Regulatory Reporting group at Wells Fargo & Company (1998 to 2003).
| 86 | www.iconfunds.com | |
Table of Contents
| ICON Sector Funds | Board of Trustees and Fund Officers | |
| September 30, 2017 |
Christopher R. Ambruso, 37. Mr. Ambruso serves as Chief Compliance Officer and Anti-Money Laundering Officer (2017 to present) of the Funds. Mr. Ambruso is also Chief Compliance Officer of ICON Advisers, Inc. (2017 to present). Previously he served as Assistant Secretary (2016 to 2017 and 2008 to 2012) of the Funds and Associate Counsel (2013 to 2017); Associate Attorney (2008 to 2013); and Staff Attorney (2007 to 2008) of ICON Advisers, Inc.
Stephen E. Abrams, 54. Mr. Abrams serves as Assistant Secretary of the Funds (2017 to present). Mr. Abrams is also Associate General Counsel of ICON Advisers, Inc. (2005 to present); Executive Vice President and General Counsel (2017 to present) and Chief Compliance Officer (2007 to present) of ICON Distributors, Inc. Previously, he worked as an Associate Attorney before becoming a Partner at a national law firm, practicing general litigation and securities law (1994 to 2005).
| Annual Report | September 30, 2017 | 87 | |
Table of Contents
| ICON Sector Funds | Additional Information | |
| September 30, 2017 (Unaudited) |
Renewal of Investment Advisory Agreement
On August 25, 2017, the Board of Trustees, including all of the Trustees that are not “interested persons” of the Trust (the “Independent Trustees”), approved continuation of the Advisory Agreements (as defined below) with the Adviser for each Fund for an additional one-year term commencing October 1, 2017.
In determining to renew the investment advisory agreements between ICON Funds (the “Trust”) and ICON Advisers, Inc. (“ICON” or the “Adviser”) the Trustees requested, were provided with and reviewed data with respect to the Adviser, its personnel, and the services provided and to be provided to each Fund by the Adviser under the Trust’s Investment Advisory Agreement dated October 9, 1996, as amended (related to the Sector Funds, the International Funds and ICON Fund) and under the Trust’s Investment Advisory Agreement dated July 9, 2002 and effective October 1, 2002, as amended (related to the U.S. Diversified Funds — Bond, Risk-Managed Balanced, Equity Income, Opportunities and Long/Short Funds) (collectively, the “Advisory Agreements”).
The Trustees agreed that consideration of the Advisory Agreements should also include consideration of other agreements between the Adviser and the Trust that impact provisions of the Advisory Agreements, including expense limitation agreements as amended effective January and July, 2016. The Trustees were provided with and reviewed data with respect to the Adviser, its personnel, and the services provided and to be provided to each Fund by the Adviser under the Trust’s Advisory Agreements, Administrative Services Agreement and Expense Limitation Agreement and the Distribution Agreement with ICON Distributors, Inc. (“IDI”). The data included information concerning advisory, distribution and administrative services provided to the Funds by ICON and its related companies; information concerning other businesses of those companies; and comparative data obtained from Broadridge Financial Solutions (“Broadridge”) related to Fund performance and Fund expenses (the “Broadridge Report”).
The Board convened a meeting with Broadridge on August 11, 2017 to discuss the Broadridge Report and the information contained within the Broadridge Report. At that meeting, Broadridge representatives discussed the findings of the Broadridge Report with the Independent Trustees. Management personnel participated in the Broadridge meeting to discuss the data with the Board. The Trustees were represented at that meeting by independent legal counsel. At the meeting, Broadridge discussed its methodology and peer selection. Broadridge addressed the difficulty of determining peer selection of some sector Funds that had no statistical group of peers from which to present reliable data, expenses and fees. In addition, Broadridge discussed the difficulty of presenting information on three Funds whose expenses were reduced after the annual report, and performance relative to the respective Funds’ peers. Broadridge also discussed the Funds’ size and how an individual fund’s size would affect economies of scale generally and operating expenses in particular. Broadridge presented no information on how expenses were affected by a fund complex size.
Also included in the 15(c) discussion was a briefing on factors affecting the ICON investment model; expenses and expense ratios of each Fund and other ICON managed products; relative performance of each Fund; status of expense reimbursements to the Funds by the Adviser; sales and marketing initiatives; specific business factors affecting the Adviser; the work load on ICON as adviser and administrator to the Funds; current profitability of ICON; staffing levels and staff morale.
The Independent Trustees were represented by independent legal counsel in the entire 15(c) process. In August, after participating in the meeting with Broadridge and management, the Independent Trustees met separately as a group in private sessions with their independent legal counsel to review and discuss a variety of qualitative and quantitative information, including information they had received throughout the year as part of their regular oversight of the Funds. Based on these discussions, independent legal counsel and/or the Lead Independent Trustee also contacted management to request additional information from Broadridge. The Board received materials from independent legal counsel discussing the legal standards applicable to their consideration of the ICON-Trust agreements.
In considering the nature, extent and quality of the services provided by the Adviser, the Board reviewed information relating to ICON’s operations and personnel. Among other things, the Adviser provided biographical information on its professional staff and descriptions of its organizational and management structure. In the course of their deliberations the Board evaluated, among other things, information relating to the investment philosophy, strategies and techniques used in managing each Fund, the qualifications and experience of ICON’s investment personnel, ICON’s compliance programs, ICON’s brokerage practices, including the extent to which the Adviser obtains research through “soft dollar” arrangements with the Funds’ brokerage, compliance reports on the foregoing, and the financial and non-financial resources available to provide services required under the Advisory Agreement.
Management and the Trustees discussed the Broadridge Report and management personnel showed performance for each Fund and discussed the factors affecting performance.
During the discussion on performance, Management personnel noted the importance of advisory fees in total. The novelty and uniqueness of ICON’s management style (specifically, the fact that it is market-cap agnostic, its willingness to actively manage for performance based on active share without adhering strictly to benchmark holdings, the fact that it is a value manager that considers forward looking earnings) must be evaluated when comparing management fees.
| 88 | www.iconfunds.com | |
Table of Contents
| ICON Sector Funds | Additional Information | |
| September 30, 2017 (Unaudited) |
In connection with reviewing data bearing upon the nature, quality, and extent of services furnished by ICON to each Fund, the Board assessed data concerning ICON’s staffing, systems and facilities. The Board also assessed ICON’s non-Trust business to see if there are any initiatives that would dilute service to the Trust. The Board concluded:
| A. | That the breadth and the quality of investment advisory and other services being provided to each Fund are satisfactory; |
| B. | That ICON has made significant expenditures in the past year and in prior years to ensure that the Trust has the right product mix for the market and the Adviser has the sophisticated systems and highly trained personnel necessary for it to be able to continue to provide quality service to the Funds’ shareholders; |
| C. | That the Board is satisfied with the research, portfolio management, and trading services, among others, being provided by ICON to the Trust, and has determined that ICON is charging fair and reasonable fees. |
| D. | The risks assumed by ICON in providing investment advisory services to each Fund including the capital commitments which have been made in the past and which continue to be made by ICON to ensure the continuation of the highest quality of service to the Trust is made with the recognition that the Trust’s advisory relationship with ICON can be terminated at any time and must be renewed on an annual basis. |
In considering the reasonableness of the fees paid to the Adviser for managing each Fund, the Board reviewed, among other things, data concerning other funds from the Broadridge Report, financial statements of the Adviser and an analysis of the profitability of the Adviser, and its affiliates, and their relationship with each Fund over various time periods. Such analysis identified all revenues and other benefits received by the Adviser and its affiliates from managing each Fund, the costs associated with providing such services and the resulting profitability to the Adviser and its affiliates and a comparison of similar data from reports filed by publicly traded firms.
The Board assessed actual (net) fees for advisory services and Fund expense ratios under the contractual relationship (the Advisory agreements, the Administration Agreement and the Expense Limitation Agreements) with the Adviser as opposed to the fees specified in the applicable Advisory Agreement and expense ratios without application of the expense limitations and the low cost of the Administration Agreement. The Board concluded that the focus should be on actual expense ratios after application of the Expense Limitation Agreements.
The Board considered the current and anticipated asset levels of each Fund and the contractual commitments of the Adviser to waive fees and pay expenses of the Funds from time to time to limit the total expenses of the Funds. The Board also considered the Adviser’s contractual commitment regarding administration and the fact it would continue to lose money on administration. In this regard the Board discussed asset levels in each Fund covered by the Advisory Agreements. ICON’s ability to provide the services called for under the Advisory Agreements was assessed in light of current and projected asset levels. Fund expenses and expense ratios were also assessed in light of current and projected asset levels. The Board concluded that the Adviser has the resources necessary to provide the services called for under the Advisory Agreements; that profitability to the Adviser and its affiliates from their relationship with the Funds, and services provided to the Funds, is not excessive; and that the Adviser is not realizing benefits from economies of scale that would warrant adjustments to the fees for any Fund at this time. The Board of Trustees concluded that, in light of the nature, extent and quality of the services provided by the Adviser and the levels of profitability associated with providing these services, the fees charged by the Adviser under the Advisory Agreements to each Fund are reasonable.
In connection with assessing data bearing on the fairness of fee arrangements, the Board considered the Broadridge Report, information they had received throughout the year as part of their regular oversight of the Funds (including Morningstar data on peer groupings), and information from independent broker/dealers evaluating fees for platform sales. It was noted that Broadridge was selected at the May 2017 Board meeting to prepare its reports, an extensive analysis of the expense data of other comparable funds; and that Trustee input was solicited and provided in the process. Among other information discussed, it was noted that:
| A. | Upon review of the advisory fee structures of each Fund (taking into consideration management fees and breakpoint fees), the level of investment advisory fees paid by each Fund is within competitive ranges for the size of each Fund and Fund mandate; |
| B. | The expense ratio of each Fund is generally reasonable and understandable in light of the existing Fund Trust structure and Fund performance; |
| C. | ICON has contractually agreed to impose expense limitations on all Funds at a cost to ICON and is considering new expense limitations; |
| D. | The advisory and other fees payable by the Funds to ICON are essentially fees which would be similar to those which would have resulted solely from “arm’s-length” bargaining. |
| Annual Report | September 30, 2017 | 89 | |
Table of Contents
| ICON Sector Funds | Additional Information | |
| September 30, 2017 (Unaudited) |
| E. | The fees paid to ICON for managing other institutional accounts (such as individual or sub-advised portfolios) are lower, but there are good reasons such accounts are less costly for ICON to manage, including, but not limited to, the level of work needed to service the institutional portfolios and the size and stability of such institutional accounts. |
| F. | The extent to which economies of scale could be realized as a Fund grows in assets and whether the Fund’s fees reflect these economies of scale for the benefit of Fund shareholders. |
| G. | The costs borne by ICON in providing advisory services to each Fund and the profitability of ICON in light of the estimated profitability analysis which had been provided by ICON. |
The Board also considered the fees charged by the Adviser to other advisory clients, including institutional and sub-advised clients as outlined in its Registration Application on Form ADV in connection with assessing data bearing on the fairness of fee arrangements.
The Board concluded the Adviser is providing the Funds with professional management at a price that would have been arrived at in an arm’s length negotiation.
In connection with assessing the direct and indirect benefits to ICON from serving as the Funds’ adviser, the Board discussed services provided under the Distribution Agreement and the Administrative Services Agreement which are in addition to services under the Advisory Agreements. It was noted that ICON benefits from serving directly or through affiliates as the principal underwriter and administrative agent for the Funds. The services provided by ICON and its affiliates to the Funds are reasonably satisfactory, and the profits derived from providing the services are competitive and reasonable. It was further noted that ICON receives research assistance from the use of soft dollars generated from Fund portfolio transactions. The Trustees noted that such research assists ICON in providing quality investment advisory services to the Funds as well as other accounts to which it provides advisory services.
Based on all these considerations and other data as discussed above, the Board, including all of the Independent Trustees, concluded that: 1) the continuation of the Advisory Agreements was in the best interests of each Fund and its shareholders, 2) the services to be performed under the Advisory Agreements were required for the operation of the Funds, 3) the advisory services were satisfactory to the Funds in the past, and 4) the fees for the advisory services and other benefits from the relationship with the Trust received by ICON, and its affiliates, were within the range of what would have been negotiated at arm’s length in light of all the circumstances.
| 90 | www.iconfunds.com | |
Table of Contents
| ICON Sector Funds | Additional Information | |
| September 30, 2017 (Unaudited) |
Supplemental Tax Information
Pursuant to Section 852(b)(3) of the Internal Revenue Code the following Funds designate the amounts listed below as long-term capital gain dividends:
ICON Consumer Discretionary Fund | $ | 1,670,363 | ||
ICON Consumer Staples Fund | $ | 1,778,292 | ||
ICON Energy Fund | $0 | |||
ICON Financial Fund | $0 | |||
ICON Healthcare Fund | $ | 1,215,871 | ||
ICON Industrials Fund | $0 | |||
ICON Information Technology Fund | $ | 8,725,258 | ||
ICON Natural Resources Fund | $0 | |||
ICON Utilities Fund | $ | 1,120,416 |
The following Funds designate the percentages listed below of the income dividends distributed in 2016 as qualified dividend income (QDI) as defined in Section 1(h)(11) of the Internal Revenue Code:
ICON Consumer Discretionary Fund | 72.05 | % | ||
ICON Consumer Staples Fund | 22.87 | % | ||
ICON Energy Fund | 100.00 | % | ||
ICON Financial Fund | 77.04 | % | ||
ICON Healthcare Fund | 0.00 | % | ||
ICON Industrials Fund | 0.00 | % | ||
ICON Information Technology Fund | 0.00 | % | ||
ICON Natural Resources Fund | 98.25 | % | ||
ICON Utilities Fund | 39.24 | % |
The following Funds designate the percentages listed below of the income dividends distributed in 2016 as qualifying for the corporate dividends received deduction (DRD) as defined in Section 854(b)(2) of the Internal Revenue Code:
ICON Consumer Discretionary Fund | 73.01 | % | ||
ICON Consumer Staples Fund | 23.70 | % | ||
ICON Energy Fund | 100.00 | % | ||
ICON Financial Fund | 77.04 | % | ||
ICON Healthcare Fund | 0.00 | % | ||
ICON Industrials Fund | 0.00 | % | ||
ICON Information Technology Fund | 0.00 | % | ||
ICON Natural Resources Fund | 98.25 | % | ||
ICON Utilities Fund | 38.60 | % |
Portfolio Holdings
Information related to the 10 largest portfolio holdings of each Fund is made available at www.iconfunds.com within approximately 10 business days after month-end. Additionally, a complete list of each Fund’s holdings is made available approximately 30 days after month-end. Each ICON Fund also files a complete schedule of portfolio holdings for the first and third quarters of its fiscal year with the Securities and Exchange Commission (the “Commission”) on Form N-Q. The ICON Funds’ Forms N-Q are available at www.sec.gov or may be reviewed and copied at the Commission’s Public Reference Room in Washington, DC. Information about the Public Reference Room may be obtained by calling 1-800-SEC-0330.
Proxy Voting
A summarized description of the policies and procedures the ICON Funds use to vote proxies is available free of charge at www.iconfunds.com or by calling 1-800-764-0442.
Information about how the ICON Funds voted proxies related to each Fund’s portfolio securities during the 12-month period ended June 30 is available free of charge at www.iconfunds.com or on the Commission’s website at www.sec.gov.
| Annual Report | September 30, 2017 | 91 | |
Table of Contents
| ICON Sector Funds | Additional Information | |
| September 30, 2017 (Unaudited) |
For More Information
This report is for the general information of the Funds’ shareholders and is not authorized for distribution to prospective investors unless preceded or accompanied by a current prospectus. You may obtain a copy of the prospectus, which contains information about the investment objectives, risks, charges, expenses, and share classes of each ICON Fund, by visiting www.iconfunds.com or by calling 1-800-764-0442. Please read the prospectus carefully before investing.
ICON Distributors, Inc., Distributor.
| 92 | www.iconfunds.com | |
Table of Contents
| ICON Sector Funds | Privacy Policy | |
| September 30, 2017 (Unaudited) |
FACTS | WHAT DOES ICON DO WITH YOUR PERSONAL INFORMATION? | |
Why? | Financial companies choose how they share your personal information. Federal law gives consumers the right to limit some but not all sharing. Federal law also requires us to tell you how we collect, share, and protect your personal information. Please read this notice carefully to understand what we do.
| |
What? | The types of personal information we collect and share depend on the product or service you have with us. This information can include: | |
• Social Security number and account balances | ||
• income and transaction history | ||
• checking account information and wire transfer instructions | ||
When you are no longer our customer, we continue to share your information as described in this notice.
| ||
How? | All financial companies need to share customers’ personal information to run their everyday business. In the section below, we list the reasons financial companies can share their customers’ personal information; the reasons ICON chooses to share; and whether you can limit this sharing.
| |
Reasons we can share your personal information | Does ICON share? | Can you limit this sharing? | ||||
For our everyday business purposes — such as to process your transactions, maintain your account(s), respond to court orders and legal investigations, or report to credit bureaus
| Yes
| No
| ||||
For our marketing purposes — to offer our products and services to you
| No
| We don’t share
| ||||
For joint marketing with other financial companies
| No
| We don’t share
| ||||
For our affiliates’ everyday business purposes — information about your transactions and experiences
| No
| We don’t share
| ||||
For our affiliates’ everyday business purposes — information about your creditworthiness
| No
| We don’t share
| ||||
For nonaffiliates to market to you
| No
| We don’t share
| ||||
Questions? | Call 1-800-764-0442 for the ICON Funds and 1-800-828-4881 for ICON Advisers, Inc. and ICON Distributors, Inc. | |
| ||
| Annual Report | September 30, 2017 | 93 | |
Table of Contents
| ICON Sector Funds | Privacy Policy | |
| September 30, 2017 (Unaudited) |
| Who We Are | ||
Who is providing this notice?
| ICON Funds, ICON Advisers, Inc., and ICON Distributors, Inc. (collectively “ICON”)
| |
| What We Do | ||
How does ICON protect my personal information? | To protect your personal information from unauthorized access and use, we use security measures that comply with federal law. These measures include computer safeguards and secured files and buildings. | |
Contracts with our service providers require them to restrict access to your non-public personal information, and to maintain physical, electronic and procedural safeguards against unintended disclosure.
| ||
How does ICON collect my personal information? | We collect your personal information, for example, when you | |
• open an account or enter into an investment advisory contract | ||
• provide account information or give us your contact information | ||
• make a wire transfer | ||
We also collect your personal information from others, such as credit bureaus, affiliates, or other companies.
| ||
| Why can’t I limit all sharing? | Federal law gives you the right to limit only | |
• sharing for affiliates’ everyday business purposes — information about your creditworthiness | ||
• affiliates from using your information to market to you | ||
• sharing for nonaffiliates to market to you | ||
State laws and individual companies may give you additional rights to limit sharing.
| ||
| Definitions | ||
| Affiliates | Companies related by common ownership or control. They can be financial and nonfinancial companies. | |
• Our affiliates include financial companies such as ICON Funds, ICON Advisers, Inc., and ICON Distributors, Inc.
| ||
| Nonaffiliates | Companies not related by common ownership or control. They can be financial and nonfinancial companies. | |
• Nonaffiliates we share with can include financial companies such as custodians, transfer agents, registered representatives, financial advisers and nonfinancial companies such as fulfillment, proxy voting, and class action service providers
| ||
| Joint marketing | A formal agreement between nonaffiliated financial companies that together market financial products or services to you. | |
• ICON doesn’t jointly market
| ||
| ||
| 94 | www.iconfunds.com | |
Table of Contents
INTENTIONALLY LEFT BLANK
Table of Contents
By Telephone | 1-800-764-0442 | |
By E-Mail | info@iconadvisers.com | |
By Mail | ICON Funds | P.O. Box 1920 | Denver, CO 80201 | |
In Person | ICON Funds | 5299 DTC Boulevard, 12th Floor | |
Greenwood Village, CO 80111 | ||
On the Internet | www.iconfunds.com |
Table of Contents
Item 2. Code of Ethics.
(a) The registrant has adopted a code of ethics that applies to the registrant’s principal executive officer, principal financial officer, principal accounting officer or controller, or persons performing similar functions. This code of ethics is included as an Exhibit.
(b) Not used.
(c) There were no amendments, during the period covered by this report, to a provision of the code of ethics that applies to the Registrant’s principal executive officer, principal financial officer, principal accounting officer or controller, or persons performing similar functions, regardless of whether these individuals are employed by the Registrant or a third party, and that relates to any element of the code of ethics description.
(d) The registrant has not granted any waivers, including an implicit waiver, from a provision of the code of ethics that applies to the Registrant’s principal executive officer, principal financial officer, principal accounting officer or controller, or persons performing similar functions, regardless of whether these individuals are employed by the Registrant or a third party, that relates to one or more of the items set forth in paragraph (b) of this item’s instructions.
(e) Not applicable.
(f) See the attached Exhibit.
Item 3. Audit Committee Financial Expert.
3(a)(1) The Registrant’s Board of Trustees has determined that the registrant has at least one audit committee financial expert serving on its audit committee.
Table of Contents
3(a)(2) The audit committee financial experts are Glen F. Bergert and R. Michael Sentel, who are “independent” for purposes of this Item 3 of Form N-CSR.
3(a)(3) Not applicable.
Item 4. Principal Accountant Fees and Services.
| (a) | Audit Fees |
In each of the fiscal years ended September 30, 2017 and September 30, 2016, the aggregate Audit Fees billed (or to be billed) by Cohen & Company, LTD. (“Cohen”) for professional services rendered for the audits of the financial statements, or services that are normally provided in connection with statutory and regulatory filings or engagements as well as reimbursable expenses are listed below. All of the below fees were paid by the Registrant.
| 2017 | 2016 | |||||
| $216,000 | $ | 216,000 | ||||
| (b) | Audit-Related Fees |
In each of the fiscal years ended September 30, 2017 and September 30, 2016, the aggregate Audit-Related Fees billed (or to be billed) by Cohen for services rendered for assurance and related services to each fund that are reasonably related to the performance of the audit or review of the fund’s financial statements, but not reported as Audit Fees, are shown in the table below.
| 2017 | 2016 | |||||
| $ | 0 | $ | 0 | |||
| (c) | Tax Fees |
In each of the fiscal years ended September 30, 2017 and September 30, 2016 the aggregate Tax Fees billed (or to be billed) by Cohen for professional services rendered for tax return preparation, tax compliance, tax advice and tax planning are shown in the table below. All of the below fees were paid by the Registrant.
| 2017 | 2016 | |||||
| $81,000 | $ | 81,000 | ||||
| (d) | All Other Fees |
In each of the fiscal years ended September 30, 2017 and September 30, 2016 the aggregate Other Fees billed (or to be billed) by Cohen for all other non-audit services rendered are shown in the table below. All of the below fees were paid by the Registrant.
| 2017 | 2016 | |||||
| $ | 0 | $ | 0 | |||
(e)(1) The audit committee of the Registrant’s Board of Trustees is required to pre-approve all services to be provided by the independent accountants to the Registrant or the Registrant’s investment adviser and to any entity controlling, controlled by or under common control with the investment adviser that provides on-going services to the Registrant to determine whether the services performed by the independent accountants impair their independence from the Registrant. The audit committee has delegated authority to the Chairman of the audit committee, subject to review and ratification by the full audit committee.
(e)(2) 100% of the fees were approved by the Registrant’s audit committee pursuant to paragraph (c)(7)(i)(C) if Rule 2-01 of Regulation S-X.
(f) For the fiscal year ended September 30, 2017, the percentage of hours spent on the audit of the Registrant’s financial statements that were attributed to work performed by persons who are not full-time, permanent employees of Cohen was less than 50%.
Table of Contents
(g) See Item 4(d) above.
(h) There were no non-audit fees provided by Cohen in the fiscal year ending September 30, 2017 or September 30, 2016 to the investment adviser or to any entity controlling, controlled by, or under common control with the investment adviser that provides on-going services to the Registrant.
| Item 5. | Audit Committee of Listed Registrants. |
Not applicable.
| Item 6. | Investments. |
(a) The schedule of investments in securities of unaffiliated issuers is included in Item 1.
(b) Not applicable.
Item 7. Disclosure of Proxy Voting Policies and Procedures for Closed-End Management Investment Companies.
Not applicable.
Item 8. Portfolio Managers of Closed-End Management Investment Companies.
Not applicable.
Item 9. Purchases of Equity Securities by Closed-End Management Investment Company and Affiliated Purchasers.
Not applicable.
Item 10. Submission of Matters to a Vote of Security Holders.
Not applicable.
Item 11. Controls and Procedures.
(a) The registrant’s principal executive officer and principal financial officer have concluded, based on their evaluation of the Registrant’s disclosure controls and procedures as conducted within 90 days of the filing date of this report, that these disclosure controls and procedures are adequately designed and are operating effectively to ensure that information required to be disclosed by the registrant on Form N-CSR is recorded, processed, summarized and reported within the time periods specified in the Securities and Exchange Commission’s rules and forms.
(b) There were no changes in the registrant’s internal control over financial reporting that occurred during the second fiscal quarter of the period covered by this report that have materially affected or are reasonably likely to materially affect, the registrant’s internal control over financial reporting.
Item 12. Disclosure of Securities Lending Activities for Closed-End Management Investment Companies.
Not applicable.
Item 13. Exhibits.
(a)(1) The code of ethics is attached.
(a)(2) Certifications pursuant to Rule 30a-2(a) are attached.
(a)(3) Not applicable.
(b) Certifications pursuant to Rule 30a-2(b) are furnished herewith.
Table of Contents
SIGNATURES
Pursuant to the requirements of the Securities Exchange Act of 1934 and the Investment Company Act of 1940, the registrant has duly caused this report to be signed on its behalf by the undersigned, thereunto duly authorized.
| (Registrant) | ICON Funds |
| By (Signature and Title)* | /s/ Craig T. Callahan | |
| Craig T. Callahan, President (Principal Executive Officer) |
| Date | December 1, 2017 |
Pursuant to the requirements of the Securities Exchange Act of 1934 and the Investment Company Act of 1940, this report has been signed below by the following persons on behalf of the registrant and in the capacities and on the dates indicated.
| By (Signature and Title)* | /s/ Craig T. Callahan | |
| Craig T. Callahan, President (Principal Executive Officer) |
| Date | December 1, 2017 |
| By (Signature and Title)* | /s/ Brian D. Harding | |
| Brian D. Harding, Treasurer (Principal Financial Officer) |
| Date | December 1, 2017 |
| * | Print the name and title of each signing officer under his or her signature. |