UNITED STATES
SECURITIES AND EXCHANGE COMMISSION
Washington, D.C. 20549
FORM N-CSR
CERTIFIED SHAREHOLDER REPORT OF REGISTERED
MANAGEMENT INVESTMENT COMPANIES
Investment Company Act file number 811-07883
ICON Funds
(Exact name of registrant as specified in charter)
5299 DTC Blvd. Suite 1200 Greenwood Village, CO 80111
(Address of principal executive offices) (Zip code)
Brian Harding
5299 DTC Blvd. Suite 1200 Greenwood Village, CO 80111
(Name and address of agent for service)
Registrant’s telephone number, including area code: 303-790-1600
Date of fiscal year end: September 30, 2019
Date of reporting period: September 30, 2019
Item 1. | Reports to Stockholders. |

Diversified Funds
ICON Equity Income Fund (IOEZX, IOECX, IEQAX)
ICON Flexible Bond Fund (IOBZX, IOBCX, IOBAX)
ICON Fund (ICNZX, ICNCX, ICNAX)
ICON Long/Short Fund (IOLZX, IOLCX, ISTAX)
ICON Opportunities Fund (ICONX)
ICON Risk-Managed Balanced Fund (IOCZX, IOCCX, IOCAX)

You can now sign up for electronic delivery of ICON Fund shareholder reports, including prospectuses, annual reports, semiannual reports and proxy statements.
When these materials are available, you will receive an email from ICON with instructions on how to view the documents. Statements, transaction confirmations and other documents that are not available online will continue to be sent to you by U.S. mail.
Visit ICON’s website atwww.iconfunds.comto learn more and sign up.
You may change or cancel your participation ineDeliveryby visitingwww.iconfunds.com, or you can request a hard copy of any of the materials free of charge by calling ICON Funds at 1-800-764-0442.
Beginning on January 1, 2021, ICON will no longer send paper copies of the Funds’ annual and semi-annual shareholder reports by mail, unless you specifically request paper copies of the reports. Instead, the reports will be made available on a website and you will be notified by mail each time a report is posted and given a website address of where to access the report.
If you have already opted to receive e-delivery, this change will not affect you and you do not need to take any action. At any time, shareholders who invest directly in the ICON Funds may generally elect to receive reports or other communications electronically by enrolling at www.iconfunds.com or calling 1-800-764-0442 or, if you are a retirement plan sponsor or invest in the funds through a financial intermediary (such as an investment advisor, broker- dealer, insurance company, or bank), by contacting your representative or your financial intermediary.
You may elect to continue receiving paper copies of future shareholder reports free of charge. To do so, if you invest directly with ICON, please call 1-800-764-0442. If you are a retirement plan sponsor or invest in the ICON Funds through a financial intermediary, please contact your representative or financial intermediary. Your election to receive reports as a paper copy will apply to all ICON Funds held in your account. Your election can be changed at any time in the future.
| 1-800-764-0442 | ● | www.iconfunds.com |
TABLE OF CONTENTS
| ICON Diversified Funds | About this Report |
| | September 30, 2019 (Unaudited) |
Historical Returns
All total returns mentioned in this Report account for the change in a Fund’s per-share price and the reinvestment of any dividends, capital gain distributions and adjustments for financial statement purposes. If your account is set up to receive Fund distributions in cash rather than to reinvest them, your actual return may differ from these figures. The Funds’ performance results do not reflect the deduction of taxes that a shareholder would pay on Fund distributions or on the redemption of Fund shares. The Adviser may have reimbursed certain fees or expenses of some of the Funds. If not for these reimbursements, performance would have been lower. Fund results shown, unless otherwise indicated, are at net asset value. If a sales charge (maximum 5.75%) had been deducted, results would have been lower.
Past performance does not guarantee future results. Investment return and principal value will fluctuate so that an investor’s shares, when redeemed, may be worth more or less than their original cost. Performance results represent past performance, and current performance may be higher or lower. Please call 1-800-764-0442 or visit www.iconfunds.com for performance results current to the most recent month-end.
Portfolio Data
This Report reflects ICON’s portfolio holdings as of September 30, 2019, the end of the reporting period. The information is not a complete analysis of every aspect of any sector, industry, security or the Funds.
There are risks associated with mutual fund investing, including the loss of principal. The likelihood of loss may be greater if you invest for a shorter period of time. There is no assurance that the investment process will consistently lead to successful results.
There are risks associated with selling short, including the risk that the ICON Long/Short Fund may have to cover its short position at a higher price than the short price, resulting in a loss. The ICON Long/Short Fund’s loss on a short sale is potentially unlimited as a loss occurs when the value of a security sold short increases. Call options involve certain risks, such as limited gains and lack of liquidity in the underlying securities, and are not suitable for all investors.
Investing in fixed income securities such as bonds involves interest rate risk. When interest rates rise, the value of fixed income securities generally decreases. The ICON Equity Income Fund and ICON Flexible Bond Fund may invest up to 25% and 35% of its assets in high-yield bonds that are below investment grade, respectively. ICON Risk-Managed Balanced Fund may invest up to 10% of its assets in high-yield bonds that are below investment grade. High-yield bonds involve a greater risk of default and price volatility than U.S. Government and other higher-quality bonds.
An investment concentrated in sectors and industries may involve greater risk and volatility than a more diversified investment.
Investments in foreign securities may entail unique risks, including political, market, and currency risks. Financial statements of foreign companies are governed by different accounting, auditing, and financial standards than U.S. companies and may be less transparent and uniform than in the United States. Many corporate governance standards, which help ensure the integrity of public information in the United States, do not exist in foreign countries. In general, there may be less governmental supervision of foreign stock exchanges and securities brokers and issuers. The ICON system relies on the integrity of the financial statements released to the market as part of our analysis.
Investments in other mutual fund companies may entail certain risks. For example, the Fund’s performance depends on the underlying funds in which it invests, and it is subject to the risks of the underlying funds. Additionally, an investment by the Fund or underlying fund in exchange-traded funds generally presents the same primary risks as an investment in a mutual fund.
The prospectus and statement of additional information contain this and other information about the Funds and are available by visiting www.iconfunds.com or calling 1-800-764-0442. Please read the prospectus and statement of additional information carefully.
Financial Intermediary
If you purchase the Fund through a broker-dealer or other financial intermediary (such as a bank), the Fund and its related companies may pay the intermediary for the sale of Fund shares and related services. These payments may influence the broker-dealer or other intermediary and your salesperson to recommend the Fund over another investment. Ask your salesperson or visit your financial intermediary’s website for more information.
| ICON Equity Income Fund | Management Overview |
| | September 30, 2019 (Unaudited) |
| Q. | How did the Fund perform relative to its benchmarks? |
| A. | The ICON Equity-Income Fund (the Fund) Class S returned 3.45% for the fiscal year ended September 30, 2019, while its benchmark, the S&P 1500 Index, returned 3.39%. Total returns for other periods and additional Class shares as of September 30, 2019, appear in the subsequent pages of this Fund’s Management Overview. |
| Q. | What primary factors were behind the Fund’s relative performance? |
| A. | The S&P 1500 Index dropped sharply from September 30, 2018 to December 24, 2018, losing about 19.32%. The Fund fell about 16.05% during that period. The Fund’s positions in dividend oriented sectors like Utilities and Consumer Staples along with its approximately 10% allocation to fixed income cushioned its decline. From the low December 24, 2018 through September 30, 2019, the fund participated in the rebound but lagged the S&P 1500, about 28.15% return for the index versus about 22.92% for the Fund. Ultimately the Fund slightly outperformed its benchmark over the fiscal year. |
| Q. | How did the Fund’s composition affect performance? |
| A. | The five biggest contributors to Fund performance were Microsoft Corporation, Fortune Brands Home & Security, Knoll Incorporated, Lockheed Martin Corporation and Broadcom Incorporated. Microsoft and Broadcom are in the Information Technology sector. The other three are in the Industrials sector. Broadcom has been sold. The other four remained in the portfolio as of September 30, 2019. |
The five stocks that detracted the most from Fund performance were Cimarex Energy, Cabot Oil & Gas, Diamondback Energy Corporation, Altria Group and Marathon Petroleum Corporation. Cimarex, Cabot, Diamondback and Marathon are in the Energy sector and were hurt by the drop in the price of oil. Three were sold, with only Marathon remaining in the portfolio. Altria is in the Consumer Stales sectors and remained in the portfolio as of September 30, 2019.
| Q. | What is your investment outlook for the overall market? |
| A. | We still find dividend paying stocks to be more attractive than bonds. For example, on September 30, 2019, the yield on the 10-Year U.S. Treasury Note was 1.67% whereas the yields on the S&P 500 Index and the S&P 500 Utilities Index were 1.92% and 3.07%, respectively. As of September 30, 2019, ICON’s valuation model shows a value-to-price (V/P) ratio of 1.17 for the overall market. In other words, we believe stock prices, on average, are below our estimate of fair value. Although news events could interfere, we expect prices to move up toward our estimate of fair value. |
| Annual Report | September 30, 2019 | 3 |
| ICON Equity Income Fund | Management Overview |
| | September 30, 2019 (Unaudited) |
Average Annual Total Return(as of September 30, 2019)
| | Inception Date | 1 Year | 5 Years | 10 Years | Since Inception | Gross Expense Ratio* | Net Expense Ratio* |
| ICON Equity Income Fund - Class S | 5/10/04 | 3.45% | 7.48% | 9.75% | 6.99% | 1.22% | 1.05% |
| ICON Equity Income Fund - Class C | 11/8/02 | 2.38% | 6.41% | 8.67% | 6.95% | 2.22% | 2.05% |
| ICON Equity Income Fund - Class A | 5/31/06 | 3.20% | 7.22% | 9.49% | 5.96% | 1.51% | 1.30% |
| ICON Equity Income Fund - Class A | | | | | | | |
| (including maximum sales charge of 5.75%) | 5/31/06 | -2.72% | 5.96% | 8.84% | 5.49% | 1.51% | 1.30% |
| S&P Composite 1500 Index | | 3.39% | 10.69% | 13.21% | 9.13% | N/A | N/A |
Past performance is not a guarantee of future results.Information about these performance results and the comparative indexes can be found in the About This Report section. The Adviser has agreed to limit certain Fund expenses; without these limitations, returns would have been lower. The limitation provisions may be terminated in the future.
| * | Please see the most recent prospectus for details. |
Class C total returns exclude applicable sales charges. If sales charges were included returns would be lower.
Value of a $10,000 Investment(through September 30, 2019)
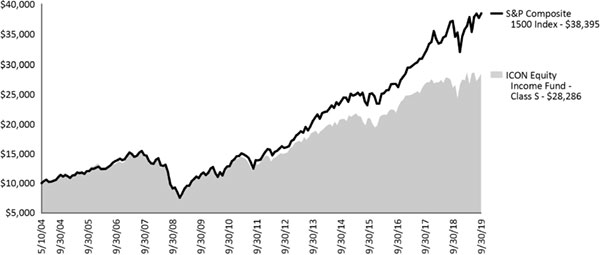
Past performance is not a guarantee of future results.The above graph compares a $10,000 investment made in the Equity Income Fund’s Class S shares on the Class’ inception date of 5/10/04 to a $10,000 investment made in an unmanaged securities index on that date. Performance for the Equity Income Fund’s other share classes will vary due to differences in charges and expenses. The Equity Income Fund’s performance in this chart and the performance table assumes the reinvestment of dividends and capital gain distributions but does not reflect the deduction of taxes that a shareholder would pay on Fund distributions or on the redemption of Fund shares.
| ICON Equity Income Fund | Schedule of Investments |
| | September 30, 2019 |
| | | Shares or | | | | |
| | | Principal | | | | |
| | | Amount | | | Value | |
| Corporate Bonds (5.53%) | | | | | | | | |
| Communication Services (0.80%) | | | | |
CSC Holdings LLC
10.88%, 10/15/25(a) | | $ | 350,000 | | | $ | 396,358 | |
Lee Enterprises, Inc.
9.50%, 03/15/22(a) | | | 250,000 | | | | 250,000 | |
| | | | | | | 646,358 | |
| Consumer Discretionary (1.82%) | | | | |
Foot Locker, Inc.
8.50%, 01/15/22 | | | 500,000 | | | | 550,000 | |
M/I Homes, Inc.
6.75%, 01/15/21 | | | 200,000 | | | | 202,000 | |
Reliance Intermediate Holdings LP
6.50%, 04/01/23(a) | | | 650,000 | | | | 669,500 | |
William Lyon Homes, Inc.
7.00%, 08/15/22 | | | 50,000 | | | | 50,125 | |
| | | | | | | | 1,471,625 | |
| Consumer Staples (0.77%) | | | | |
Central Garden & Pet Co.
6.13%, 11/15/23 | | | 600,000 | | | | 621,000 | |
| | | | | | | | | |
| Energy (0.51%) | | | | | | | | |
Antero Resources Corp.
5.38%, 11/01/21 | | | 250,000 | | | | 241,875 | |
Continental Resources, Inc.
5.00%, 09/15/22 | | | 172,000 | | | | 173,515 | |
| | | | | | | | 415,390 | |
| Health Care (0.26%) | | | | | | | | |
Molina Healthcare, Inc.
5.38%, 11/15/22 | | | 200,000 | | | | 212,008 | |
| | | | | | | | | |
| Industrials (0.91%) | | | | | | | | |
Air Canada
7.75%, 04/15/21(a) | | | 200,000 | | | | 214,250 | |
Ashtead Capital, Inc.
5.63%, 10/01/24(a) | | | 250,000 | | | | 257,500 | |
RR Donnelley & Sons Co.
7.88%, 03/15/21 | | | 155,000 | | | | 160,038 | |
USG Corp.
5.50%, 03/01/25(a) | | | 100,000 | | | | 101,250 | |
| | | | | | | | 733,038 | |
| Materials (0.08%) | | | | | | | | |
First Quantum Minerals, Ltd.
7.00%, 02/15/21(a) | | | 67,000 | | | | 67,544 | |
| | | | | | | | | |
| Telecommunication Services (0.25%) | | | | |
Level 3 Parent LLC
5.75%, 12/01/22 | | | 200,000 | | | | 200,800 | |
| | | Shares or | | | | |
| | | Principal | | | | |
| | | Amount | | | Value | |
| Utilities (0.13%) | | | | | | |
Vistra Energy Corp.
8.13%, 01/30/26(a) | | $ | 100,000 | | | $ | 107,250 | |
| | | | | | | | | |
| Total Corporate Bonds | | | | | | | | |
| (Cost $4,462,656) | | | | | | | 4,475,013 | |
| | | | | | | | | |
| Common Stocks (89.97%) | | | | |
| Aerospace & Defense (5.08%) | | | | |
| Boeing Co. | | | 2,200 | | | | 837,034 | |
| Lockheed Martin Corp. | | | 4,800 | | | | 1,872,288 | |
| Raytheon Co. | | | 7,200 | | | | 1,412,568 | |
| | | | | | | | 4,121,890 | |
| Apparel Retail (0.79%) | | | | | | | | |
| Foot Locker, Inc. | | | 14,869 | | | | 641,746 | |
| | | | | |
| Apparel, Accessories & Luxury Goods (4.93%) | | | | |
| Kontoor Brands, Inc.(b) | | | 2,528 | | | | 88,733 | |
| Tapestry, Inc. | | | 47,200 | | | | 1,229,560 | |
| VF Corp. | | | 30,000 | | | | 2,669,700 | |
| | | | | | | | 3,987,993 | |
| Auto Parts & Equipment (1.57%) | | | | |
| Magna International, Inc. | | | 23,800 | | | | 1,269,254 | |
| | | | | | | | | |
| Building Products (2.04%) | | | | | | | | |
| Fortune Brands Home & Security, Inc. | | | 30,200 | | | | 1,651,940 | |
| | | | | | | | | |
| Construction Machinery & Heavy Trucks (1.95%) | | | | |
| Cummins, Inc. | | | 9,700 | | | | 1,577,899 | |
| | | | | | | | | |
| Consumer Finance (2.98%) | | | | | | | | |
| Navient Corp. | | | 188,400 | | | | 2,411,520 | |
| | | | | | | | | |
| Diversified Banks (6.78%) | | | | | | | | |
| Bank of America Corp. | | | 65,500 | | | | 1,910,635 | |
| JPMorgan Chase & Co. | | | 18,000 | | | | 2,118,420 | |
| US Bancorp | | | 26,300 | | | | 1,455,442 | |
| | | | | | | | 5,484,497 | |
| Diversified Chemicals (1.29%) | | | | |
| Eastman Chemical Co. | | | 14,100 | | | | 1,041,003 | |
| | | | | | | | | |
| Electric Utilities (4.29%) | | | | | | | | |
| Avangrid, Inc. | | | 24,400 | | | | 1,274,900 | |
| Evergy, Inc. | | | 14,500 | | | | 965,120 | |
| Otter Tail Corp. | | | 23,100 | | | | 1,241,625 | |
| | | | | | | | 3,481,645 | |
| Electrical Components & Equipment (1.84%) | | | | |
| Eaton Corp. PLC | | | 17,900 | | | | 1,488,385 | |
| | | | | | | | | |
| Electronic Components (1.38%) | | | | |
| Corning, Inc. | | | 39,100 | | | | 1,115,132 | |
The accompanying notes are an integral part of the financial statement
| Annual Report | September 30, 2019 | 5 |
| ICON Equity Income Fund | Schedule of Investments |
| | September 30, 2019 |
| | | Shares or | | | | |
| | | Principal | | | | |
| | | Amount | | | Value | |
| Electronic Manufacturing Services (1.45%) | | | | |
| TE Connectivity, Ltd. | | | 12,626 | | | $ | 1,176,490 | |
| | | | | | | | | |
| Hotels, Resorts & Cruise Lines (1.67%) | | | | |
| Royal Caribbean Cruises, Ltd. | | | 12,500 | | | | 1,354,125 | |
| | | | | | | | | |
| Integrated Telecommunication Services (1.06%) | | | | |
| BCE, Inc. | | | 17,800 | | | | 861,698 | |
| | | | | | | | | |
| Investment Banking & Brokerage (1.92%) | | | | |
| Morgan Stanley | | | 36,400 | | | | 1,553,188 | |
| | | | | | | | | |
| IT Consulting & Other Services (2.20%) | | | | |
| Infosys, Ltd., Sponsored ADR | | | 81,200 | | | | 923,244 | |
| International Business Machines Corp. | | | 5,900 | | | | 857,978 | |
| | | | | | | | 1,781,222 | |
| Life & Health Insurance (5.06%) | | | | |
| CNO Financial Group, Inc. | | | 49,000 | | | | 775,670 | |
| MetLife, Inc. | | | 37,400 | | | | 1,763,784 | |
| Prudential Financial, Inc. | | | 17,300 | | | | 1,556,135 | |
| | | | | | | | 4,095,589 | |
| Managed Health Care (2.60%) | | | | |
| Anthem, Inc. | | | 3,700 | | | | 888,370 | |
| UnitedHealth Group, Inc. | | | 5,600 | | | | 1,216,992 | |
| | | | | | | | 2,105,362 | |
| Multi-Utilities (3.02%) | | | | |
| Avista Corp. | | | 33,300 | | | | 1,613,052 | |
| CenterPoint Energy, Inc. | | | 27,700 | | | | 835,986 | |
| | | | | | | | 2,449,038 | |
| Office Services & Supplies (1.99%) | | | | |
| Knoll, Inc. | | | 63,600 | | | | 1,612,260 | |
| | | | | | | | | |
| Oil & Gas Refining & Marketing (1.89%) | | | | |
| Marathon Petroleum Corp. | | | 7,700 | | | | 467,775 | |
| Phillips 66 | | | 10,400 | | | | 1,064,960 | |
| | | | | | | | 1,532,735 | |
| Paper Packaging (4.05%) | | | | |
| Avery Dennison Corp. | | | 13,000 | | | | 1,476,410 | |
| International Paper Co. | | | 17,300 | | | | 723,486 | |
| Packaging Corp. of America | | | 10,200 | | | | 1,082,220 | |
| | | | | | | | 3,282,116 | |
| Pharmaceuticals (5.70%) | | | | |
| Allergan PLC | | | 10,300 | | | | 1,733,387 | |
| Johnson & Johnson | | | 9,800 | | | | 1,267,924 | |
| Merck & Co., Inc. | | | 19,100 | | | | 1,607,838 | |
| | | | | | | | 4,609,149 | |
| Property & Casualty Insurance (2.24%) | | | | |
| Axis Capital Holdings, Ltd. | | | 27,200 | | | | 1,814,784 | |
| | | | | | | | | |
| Railroads (1.62%) | | | | | | | | |
| Union Pacific Corp. | | | 8,100 | | | | 1,312,038 | |
| | | | | | | | | |
| Regional Banks (4.74%) | | | | | | | | |
| Fifth Third Bancorp | | | 57,300 | | | | 1,568,874 | |
| | | Shares or | | | | |
| | | Principal | | | | |
| | | Amount | | | Value | |
| Regional Banks (continued) | | | | |
| KeyCorp | | | 61,900 | | | $ | 1,104,296 | |
| Webster Financial Corp. | | | 24,900 | | | | 1,167,063 | |
| | | | | | | | 3,840,233 | |
| Restaurants (3.01%) | | | | | | | | |
| Cracker Barrel Old Country Store, Inc.(b) | | | 15,000 | | | | 2,439,750 | |
| | | | | |
| Security & Alarm Services (0.98%) | | | | |
| ADT, Inc.(b) | | | 126,300 | | | | 791,901 | |
| | | | | |
| Specialized REITs (1.49%) | | | | |
| Lamar Advertising Co., Class A | | | 14,700 | | | | 1,204,371 | |
| | | | | |
| Systems Software (1.77%) | | | | |
| Microsoft Corp. | | | 10,300 | | | | 1,432,009 | |
| | | | | | | | | |
| Tobacco (2.99%) | | | | |
| Altria Group, Inc. | | | 25,700 | | | | 1,051,130 | |
| Philip Morris International, Inc. | | | 18,000 | | | | 1,366,740 | |
| | | | | | | | 2,417,870 | |
| Trading Companies & Distributors (1.93%) | | | | |
| Aircastle, Ltd. | | | 69,600 | | | | 1,561,128 | |
| | | | | | | | | |
| Trucking (1.67%) | | | | | | | | |
| Ryder System, Inc. | | | 26,100 | | | | 1,351,197 | |
| | | | | | | | | |
| Total Common Stocks | | | | | | | | |
| (Cost $68,988,247) | | | | | | | 72,851,157 | |
| | | | | | | | | |
| Preferred Stocks (0.81%) | | | | | | | | |
| Property & Casualty Insurance (0.81%) | | | | |
Argo Group US, Inc.
6.50%, 09/15/42 | | | 25,619 | | | | 656,359 | |
| | | | | | | | | |
| Total Preferred Stocks | | | | | | | | |
| (Cost $647,451) | | | | | | | 656,359 | |
| | | | | | | | | |
| Closed-End Mutual Funds (2.86%) | | | | |
| BlackRock Muni New York Intermediate Duration Fund, Inc. | | | 7,500 | | | | 110,325 | |
| Duff & Phelps Utility and Corporate Bond Trust, Inc. | | | 23,619 | | | | 218,476 | |
| Invesco Dynamic Credit Opportunities Fund | | | 38,001 | | | | 418,391 | |
| Neuberger Berman High Yield Strategies Fund, Inc. | | | 4,800 | | | | 57,936 | |
| Nuveen High Income December 2019 Target Term Fund | | | 20,000 | | | | 197,200 | |
| Nuveen Mortgage Opportunity Term Fund | | | 53,522 | | | | 1,234,217 | |
The accompanying notes are an integral part of the financial statements.
| ICON Equity Income Fund | Schedule of Investments |
| | September 30, 2019 |
| | | Shares or | | | | |
| | | Principal | | | | |
| | | Amount | | | Value | |
| Closed-End Mutual Funds (continued) | | | | |
| Pioneer Diversified High Income Trust | | | 5,711 | | | $ | 82,810 | |
| | | | | | | | | |
| Total Closed-End Mutual Funds | | | | | | | | |
| (Cost $2,306,422) | | | | | | | 2,319,355 | |
| | | | | | | | | |
| Collateral for Securities on Loan (1.01%) | | | | |
| State Street Navigator Securities | | | | | | | | |
| Lending Government Money | | | | | | | | |
| Market Portfolio, | | | | | | | | |
| 7-Day Yield 2.09% | | | 820,950 | | | | 820,950 | |
| | | | | | | | | |
| Total Collateral for Securities on Loan | | | | |
| (Cost $820,950) | | | | | | | 820,950 | |
| | | | | | | | | |
| Total Investments (100.18%) | | | | | | | | |
| (Cost $77,225,726) | | | | | | $ | 81,122,834 | |
| | | | | | | | | |
| Liabilities Less Other Assets (-0.18%) | | | (145,135 | ) |
| | | | | |
| Net Assets (100.00%) | | | | | | $ | 80,977,699 | |
Investment Abbreviations:
ADR - American Depositary Receipt
REIT - Real Estate Investment Trust
| (a) | Security was purchased pursuant to Rule 144A or Section4(a)(2) under the Securities Act of 1933 and may be resold intransactions exempt from registration only to qualified institutional buyers. As of September 30, 2019, these securities had a total aggregate market value of $2,063,652. |
| (b) | All or a portion of the security was on loan as of September 30, 2019. |
| Sector Composition(September 30, 2019) | | | | |
| | | | | |
| Financials | | | 24.53 | % |
| Industrials | | | 20.01 | % |
| Consumer Discretionary | | | 13.79 | % |
| Health Care | | | 8.56 | % |
| Utilities | | | 7.44 | % |
| Information Technology | | | 6.80 | % |
| Materials | | | 5.42 | % |
| Consumer Staples | | | 3.76 | % |
| Energy | | | 2.40 | % |
| Communication Services | | | 2.11 | % |
| Real Estate | | | 1.49 | % |
| | | | 96.31 | % |
Percentages are based upon corporate bonds, common stocks and preferred stocks as a percentage of net assets.
| Industry Composition(September 30, 2019) | | | |
| | | | | |
| Diversified Banks | | | 6.78 | % |
| Pharmaceuticals | | | 5.70 | % |
| Aerospace & Defense | | | 5.08 | % |
| Life & Health Insurance | | | 5.06 | % |
| Apparel, Accessories & Luxury Goods | | | 4.93 | % |
| Regional Banks | | | 4.74 | % |
| Electric Utilities | | | 4.29 | % |
| Paper Packaging | | | 4.05 | % |
| Property & Casualty Insurance | | | 3.05 | % |
| Multi-Utilities | | | 3.02 | % |
| Restaurants | | | 3.01 | % |
| Tobacco | | | 2.99 | % |
| Consumer Finance | | | 2.98 | % |
| Managed Health Care | | | 2.86 | % |
| IT Consulting & Other Services | | | 2.20 | % |
| Building Products | | | 2.17 | % |
| Office Services & Supplies | | | 1.99 | % |
| Construction Machinery & Heavy Trucks | | | 1.95 | % |
| Trading Companies & Distributors | | | 1.93 | % |
| Investment Banking & Brokerage | | | 1.92 | % |
| Oil & Gas Refining & Marketing | | | 1.89 | % |
| Electrical Components & Equipment | | | 1.84 | % |
| Systems Software | | | 1.77 | % |
| Trucking | | | 1.67 | % |
| Hotels, Resorts & Cruise Lines | | | 1.67 | % |
| Railroads | | | 1.62 | % |
| Auto Parts & Equipment | | | 1.57 | % |
| Specialized REITs | | | 1.49 | % |
| Apparel Retail | | | 1.47 | % |
| Electronic Manufacturing Services | | | 1.45 | % |
| Electronic Components | | | 1.38 | % |
| Diversified Chemicals | | | 1.29 | % |
| Integrated Telecommunication Services | | | 1.06 | % |
| Other Industries (each less than 1%) | | | 5.44 | % |
| | | | 96.31 | % |
Percentages are based upon corporate bonds, common stocks and preferred stocks as a percentage of net assets.
The accompanying notes are an integral part of the financial statements.
| Annual Report | September 30, 2019 | 7 |
| ICON Flexible Bond Fund | Management Overview |
| | September 30, 2019 (Unaudited) |
| Q. | How did the Fund perform relative to its benchmark? |
| A. | For the fiscal year ended September 30, 2019, the ICON Flexible Bond Fund (the Fund) Class S shares underperformed its benchmark, the Barclays Capital U.S. Universal Index (ex-MBS). The Fund returned 6.02% while the Barclays Capital U.S. Universal Index (ex-MBS) returned 10.76%. Total returns for other periods and additional Class shares as of September 30, 2019, appear in the subsequent pages of this Fund’s Management Overview. |
| Q. | What primary factors were behind the Fund’s relative performance? |
| A. | Falling interest rates over the course of fiscal year 2019 generally resulted in positive total returns for bond funds. Further, in general, the longer a fund’s duration the more positive returns proved to be. The Fund has had a much shorter duration than the benchmark for several years and we expect to continue with this approach. |
Despite its short duration, the Fund fared relatively well and generally had lower volatility relative to the overall bond market. The Fund’s corporate credit orientation and special situation/event-driven focus allowed the Fund to capitalize on opportunities that others may have missed. This contributed in part to offsetting the negative impact on the Fund of having a relatively shorter duration in a falling interest rate environment.
| Q. | How did the Fund’s composition affect performance? |
| A. | As stated above, the Fund underperformed its benchmark during the fiscal year, largely stemming from the Fund’s short duration. The Fund’s positions in corporate credit and the preferred share segment of the market both contributed to performance during the fiscal year, providing some offset to the short duration impact. As the year went on, the Fund’s allocation to preferred stocks tapered as they became less attractive. In addition, the Fund benefited from several credit upgrades which resulted in price improvement for the underlying bonds. The Fund’s high coupon yield to call holdings generally helped offset some of the Fund’s interest rate sensitivity due to holdings’ short duration and attractive yields. |
Closed-end fund (CEF) positions also contributed positively to the Fund’s performance. In the CEF space, the Fund looks to purchase CEFs at discounts to their net asset value (NAV). In particular, we look for CEFs that we believe may be converted to an open-end fund or which may liquidate and capitalize upon the discount. The Fund was successful with several positions this past year, enabling it to capture the original discount to net asset value at which each CEF had been acquired.
| Q. | What is your investment outlook for the bond market? |
| A. | At the end of fiscal year 2019, investment-grade and high yield corporate bond yield spreads continue to trade at levels we regard as excessively tight and overvalued. With spreads at these levels, we have been focused on positions in defensively structured fixed income and are utilizing our bottom up approach to find this type of issue-specific opportunity. We don’t spend a lot of time and effort in forecasting interest rates, however, the Fund continues to be positioned in the lower portion of its historical duration range as we move into fiscal year 2020. This should result in reduced volatility vs. the overall market. We continue to evaluate CEF opportunities and expect them to remain an important contributor to the Fund’s returns. While future bond market volatility is likely, we believe our bottom up investment methodology will help the Fund navigate the changing market. |
| ICON Flexible Bond Fund | Management Overview |
| | September 30, 2019 (Unaudited) |
Average Annual Total Return(as of September 30, 2019)
| | Inception Date | 1 Year | 5 Years | 10 Years | Since
Inception | Gross Expense
Ratio* | Net Expense
Ratio* |
| ICON Flexible Bond Fund - Class S | 5/6/04 | 6.02% | 3.56% | 4.29% | 4.44% | 1.05% | 0.88% |
| ICON Flexible Bond Fund - Class C | 10/21/02 | 5.12% | 2.68% | 3.41% | 3.87% | 2.33% | 1.73% |
| ICON Flexible Bond Fund - Class A | 9/30/10 | 5.76% | 3.28% | N/A | 3.37% | 1.58% | 1.13% |
| ICON Flexible Bond Fund - Class A | | | | | | | |
| (including maximum sales charge of 4.75%) | 9/30/10 | 0.73% | 2.29% | N/A | 2.81% | 1.58% | 1.13% |
| Barclays Capital U.S. Universal Index | | 10.07% | 3.62% | 4.14% | 4.64% | N/A | N/A |
| Barclays Capital U.S. Universal Index (ex-MBS) | | 10.76% | 3.87% | 4.50% | 4.74% | N/A | N/A |
Past performance is not a guarantee of future results.Information about these performance results and the comparative indexes can be found in the About This Report section. The Adviser has agreed to limit certain Fund expenses; without these limitations, returns would have been lower. The limitation provisions may be terminated in the future.
* Please see the most recent prospectus for details.
Class C total returns exclude applicable sales charges. If sales charges were included returns would be lower.
Value of a $10,000 Investment(through September 30, 2019)
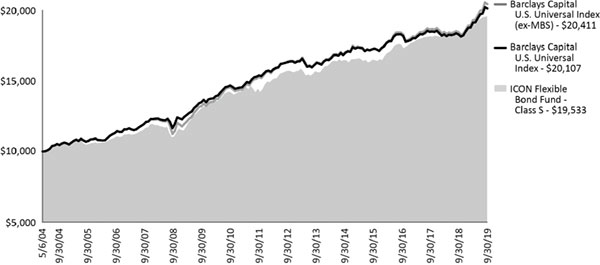
Past performance is not a guarantee of future results.The above graph compares a $10,000 investment made in the Bond Fund’s Class S shares on the Class’ inception date of 5/6/04 to a $10,000 investment made in an unmanaged securities index on that date. Performance for the Bond Fund’s other share classes will vary due to differences in charges and expenses. The Bond Fund’s performance in this chart and the performance table assumes the reinvestment of dividends and capital gain distributions but does not reflect the deduction of taxes that a shareholder would pay on Fund distributions or on the redemption of Fund shares.
| Annual Report | September 30, 2019 | 9 |
| ICON Flexible Bond Fund | Schedule of Investments |
| | September 30, 2019 |
| | | Shares or | | | | |
| | | Principal | | | | |
| | | Amount | | | Value | |
| Corporate Bonds (76.85%) | | | | |
| Communication Services (5.05%) | | | | |
CSC Holdings LLC
10.88%, 10/15/25(a) | | $ | 2,200,000 | | | $ | 2,491,390 | |
Lee Enterprises, Inc.
9.50%, 03/15/22(a) | | | 1,650,000 | | | | 1,650,000 | |
Walt Disney Co.
7.75%, 02/01/24(a) | | | 3,000,000 | | | | 3,643,327 | |
| | | | | | | | 7,784,717 | |
| Consumer Discretionary (16.64%) | | | | |
Brookfield Residential Properties, Inc.
6.50%, 12/15/20(a) | | | 100,000 | | | | 100,030 | |
Foot Locker, Inc.
8.50%, 01/15/22 | | | 3,750,000 | | | | 4,125,000 | |
KB Home
7.63%, 05/15/23 | | | 400,000 | | | | 453,000 | |
Lear Corp.
5.25%, 01/15/25 | | | 4,250,000 | | | | 4,390,076 | |
M/I Homes, Inc.
6.75%, 01/15/21 | | | 1,316,000 | | | | 1,329,160 | |
Mattamy Group Corp.
6.88%, 12/15/23(a) | | | 750,000 | | | | 780,000 | |
Nexteer Automotive Group, Ltd.
5.88%, 11/15/21(a) | | | 200,000 | | | | 203,463 | |
Prime Security Services Borrower LLC / Prime Finance, Inc.
9.25%, 05/15/23(a) | | | 282,000 | | | | 296,467 | |
Reliance Intermediate Holdings LP
6.50%, 04/01/23(a) | | | 4,650,000 | | | | 4,789,500 | |
Silversea Cruise Finance, Ltd.
7.25%, 02/01/25(a) | | | 8,250,000 | | | | 8,806,875 | |
William Lyon Homes, Inc.
7.00%, 08/15/22 | | | 364,000 | | | | 364,910 | |
| | | | | | | | 25,638,481 | |
| Consumer Staples (3.44%) | | | | |
Central Garden & Pet Co.
6.13%, 11/15/23 | | | 2,550,000 | | | | 2,639,250 | |
Conagra Brands, Inc.
7.13%, 10/01/26 | | | 1,150,000 | | | | 1,406,846 | |
Kraft Heinz Foods Co.
4.88%, 02/15/25(a) | | | 1,216,000 | | | | 1,251,855 | |
| | | | | | | | 5,297,951 | |
| Energy (11.50%) | | | | |
Antero Resources Corp.
5.38%, 11/01/21 | | | 1,200,000 | | | | 1,161,000 | |
Continental Resources, Inc.
5.00%, 09/15/22 | | | 4,639,000 | | | | 4,679,870 | |
CVR Refining LLC / Coffeyville Finance, Inc.
6.50%, 11/01/22 | | | 900,000 | | | | 911,250 | |
| MPLX LP | | | | | | | | |
| 6.25%, 10/15/22(a) | | | 4,399,000 | | | | 4,509,311 | |
| 6.38%, 05/01/24(a) | | | 6,144,000 | | | | 6,445,114 | |
| | | | | | | | 17,706,545 | |
| | | Shares or | | | | |
| | | Principal | | | | |
| | | Amount | | | Value | |
| Financial (23.39%) | | |
Catlin Insurance Co., Ltd.
3M US L + 2.975%(a)(b)(c)(d) | | $ | 8,600,000 | | | $ | 8,608,600 | |
Delphi Financial Group, Inc.
7.88%, 01/31/20 | | | 800,000 | | | | 813,907 | |
JPMorgan Chase & Co., Series I
3M US L + 3.47%(b)(c) | | | 7,213,000 | | | | 7,246,807 | |
MPT Operating Partnership LP / MPT Finance Corp.
6.38%, 03/01/24 | | | 1,700,000 | | | | 1,782,093 | |
Principal Financial Group, Inc.
3M US L + 3.044%, 05/15/55(b) | | | 9,110,000 | | | | 9,075,838 | |
Prudential Financial, Inc.
3M US L + 4.175%, 09/15/42(b) | | | 2,800,000 | | | | 3,016,076 | |
QBE Capital Funding III, Ltd.
7.25%, 05/24/41(a)(e) | | | 1,795,000 | | | | 1,896,121 | |
VFH Parent LLC / Orchestra Co.-Issuer, Inc.
6.75%, 06/15/22(a) | | | 500,000 | | | | 517,150 | |
Voyager Aviation Holdings LLC / Voyager Finance Co.
8.50%, 08/15/21(a) | | | 3,000,000 | | | | 3,078,000 | |
| | | | | | | | 36,034,592 | |
| Health Care (1.83%) | | | | |
Bausch Health Cos., Inc.
7.00%, 03/15/24(a) | | | 500,000 | | | | 525,480 | |
Hill-Rom Holdings, Inc.
5.75%, 09/01/23(a)(d) | | | 1,200,000 | | | | 1,232,040 | |
Molina Healthcare, Inc.
5.38%, 11/15/22 | | | 1,000,000 | | | | 1,060,040 | |
| | | | | | | | 2,817,560 | |
| Industrials (9.23%) | | | | |
Air Canada
7.75%, 04/15/21(a) | | | 2,924,000 | | | | 3,132,335 | |
Ashtead Capital, Inc.
5.63%, 10/01/24(a) | | | 2,685,000 | | | | 2,765,550 | |
| Fortress Transportation & Infrastructure Investors LLC | | | | | | | | |
| 6.50%, 10/01/25(a) | | | 500,000 | | | | 513,750 | |
| 6.75%, 03/15/22(a) | | | 1,300,000 | | | | 1,358,500 | |
Meritor, Inc.
6.25%, 02/15/24 | | | 1,000,000 | | | | 1,028,750 | |
Oshkosh Corp.
5.38%, 03/01/25 | | | 1,244,000 | | | | 1,292,205 | |
RR Donnelley & Sons Co.
7.88%, 03/15/21 | | | 309,000 | | | | 319,042 | |
Tervita Escrow Corp.
7.63%, 12/01/21(a) | | | 1,250,000 | | | | 1,270,313 | |
TransDigm, Inc.
6.00%, 07/15/22 | | | 1,500,000 | | | | 1,522,500 | |
USG Corp.
5.50%, 03/01/25(a) | | | 1,000,000 | | | | 1,012,500 | |
| | | | | | | | 14,215,445 | |
The accompanying notes are an integral part of the financial statements.
| ICON Flexible Bond Fund | Schedule of Investments |
| | September 30, 2019 |
| | | Shares or | | | | |
| | | Principal | | | | |
| | | Amount | | | Value | |
| Information Technology (1.68%) | | | | |
Dell International LLC / EMC Corp.
7.13%, 06/15/24(a) | | $ | 1,352,000 | | | $ | 1,427,036 | |
Nielsen Co. Luxembourg SARL
5.50%, 10/01/21(a) | | | 500,000 | | | | 501,875 | |
Unisys Corp.
10.75%, 04/15/22(a) | | | 600,000 | | | | 655,500 | |
| | | | | | | | 2,584,411 | |
| Materials (2.23%) | | | | |
Century Aluminum Co.
7.50%, 06/01/21(a) | | | 1,250,000 | | | | 1,231,250 | |
Chemours Co.
6.63%, 05/15/23 | | | 500,000 | | | | 493,750 | |
First Quantum Minerals, Ltd.
7.00%, 02/15/21(a) | | | 667,000 | | | | 672,419 | |
Standard Industries, Inc.
5.38%, 11/15/24(a) | | | 1,000,000 | | | | 1,030,000 | |
| | | | | | | | 3,427,419 | |
| Telecommunication Services (0.89%) | | | | |
Level 3 Parent LLC
5.75%, 12/01/22 | | | 1,372,000 | | | | 1,377,488 | |
| | | | | | | | | |
| Utilities (0.97%) | | | | |
Vistra Energy Corp.
8.13%, 01/30/26(a) | | | 1,400,000 | | | | 1,501,500 | |
| | | | | | | | | |
| Total Corporate Bonds | | | | |
| (Cost $117,814,529) | | | 118,386,109 | |
| | | | | | | | | |
| Asset-Backed Securities (1.88%) |
| SMB Private Education Loan Trust | | | | | | | | |
| Series 2014-A, Class C | | | | | | | | |
| 4.50%, 11/15/25(a)(e) | | | 3,000,000 | | | | 2,904,047 | |
| | | | | | | | | |
| Total Asset-Backed Securities | | | | |
| (Cost $2,897,950) | | | | | | | 2,904,047 | |
| | | | | | | | | |
| Preferred Stocks (8.80%) | | | | |
| Diversified Banks (1.44%) | | | | |
GMAC Capital Trust I, Series 2
3M US L + 5.785%, 02/15/40(b) | | | 4,000 | | | | 104,840 | |
Wells Fargo & Co., Series V
6.00%(c)(d) | | | 82,086 | | | | 2,113,714 | |
| | | | | | | | 2,218,554 | |
| Property & Casualty Insurance (4.20%) | | | | |
Allstate Corp., Series E
6.63%, 10/15/19(d) | | | 70,842 | | | | 1,768,216 | |
| Allstate Corp., Series H 5.10%(c)(d) | | | 22,603 | | | | 593,555 | |
Argo Group US, Inc.
6.50%, 09/15/42 | | | 160,290 | | | | 4,106,630 | |
| | | | | | | | 6,468,401 | |
| | | Shares or | | | | |
| | | Principal | | | | |
| | | Amount | | | Value | |
| Wireline Telecommunication Services (3.16%) | | | | |
Centaur Funding Corp.
9.08%, 04/21/20(a) | | | 4,700 | | | $ | 4,864,500 | |
| | | | | | | | | |
| Total Preferred Stocks | | | | |
| (Cost $13,588,046) | | | 13,551,455 | |
| | | | | | | | | |
| Closed-End Mutual Funds (9.61%) | | | | |
| BlackRock Muni New York Intermediate Duration Fund, Inc. | | | 61,048 | | | | 898,016 | |
| BlackRock New York Municipal Bond Trust(d) | | | 69,397 | | | | 1,020,830 | |
| Duff & Phelps Utility and Corporate Bond Trust, Inc.(d) | | | 457,454 | | | | 4,231,450 | |
| Eaton Vance California Municipal Income Trust | | | 25,152 | | | | 338,043 | |
| First Trust Aberdeen Global Opportunity Income Fund | | | 600 | | | | 6,336 | |
| Invesco Dynamic Credit Opportunities Fund | | | 178,377 | | | | 1,963,931 | |
| Nuveen Connecticut Quality Municipal Income Fund | | | 36,903 | | | | 495,238 | |
| Nuveen Mortgage Opportunity Term Fund | | | 182,233 | | | | 4,202,293 | |
| Nuveen New York Municipal Value Fund 2 | | | 47,402 | | | | 671,686 | |
| Pioneer Diversified High Income Trust | | | 65,160 | | | | 944,820 | |
| Western Asset High Income Opportunity Fund, Inc. | | | 4,700 | | | | 23,735 | |
| | | | | | | | | |
| Total Closed-End Mutual Funds | | | | |
| (Cost $14,525,433) | | | 14,796,378 | |
| | | | | | | | | |
| Collateral for Securities on Loan (1.98%) | | | | | | | | |
State Street Navigator Securities Lending Government Money Market Portfolio,
7-Day Yield 2.09% | | | 3,047,450 | | | | 3,047,450 | |
| | | | | | | | | |
| Total Collateral for Securities on Loan | | | | |
| (Cost $3,047,450) | | | 3,047,450 | |
| | | | | | | | | |
| Total Investments (99.12%) | | | | |
| (Cost $151,873,408) | | $ | 152,685,439 | |
| | | | | | | | | |
| Other Assets Less Liabilities (0.88%) | | | 1,354,257 | |
| | | | | | | | | |
| Net Assets (100.00%) | | $ | 154,039,696 | |
The accompanying notes are an integral part of the financial statements.
| Annual Report | September 30, 2019 | 11 |
| ICON Flexible Bond Fund | Schedule of Investments |
| | September 30, 2019 |
Investment Abbreviations:
LIBOR - London Interbank Offered Rate
LIBOR Rates:
3M US L - 3 Month LIBOR as of September 30, 2019 was 2.09%
| (a) | Security was purchased pursuant to Rule 144A or Section 4(a)(2) under the Securities Act of 1933 and may be resold in transactions exempt from registration only to qualified institutional buyers. As of September 30, 2019, these securities had a total aggregate market value of $75,665,798. |
| (b) | Floating or variable rate security. The reference rate is described above. The rate in effect as of September 30, 2019 is based on the reference rate plus the displayed spread as of the security’s last reset date. |
| (c) | This security has no contractual maturity date, is not redeemable and contractually pays an indefinite stream of interest. |
| (d) | All or a portion of the security was on loan as of September 30, 2019. |
| (e) | These securities are considered, by management, to be illiquid. The aggregate value of these securities at September 30, 2019 was $4,800,168, which represent 3.12% of the Fund’s net assets. |
| Credit Diversification(September 30, 2019) |
| |
| Baa2 | | | 27.09 | % |
| NR* | | | 9.86 | % |
| Ba2 | | | 9.76 | % |
| B1 | | | 7.20 | % |
| Ba1 | | | 5.03 | % |
| Baa1 | | | 3.19 | % |
| B3 | | | 3.01 | % |
| Baa3 | | | 2.84 | % |
| B2 | | | 2.82 | % |
| A2 | | | 2.37 | % |
| Ba3 | | | 2.34 | % |
| B | | | 2.00 | % |
| Caa1 | | | 1.24 | % |
| Total: | | | 78.75 | % |
Percentages are based upon corporate bonds and asset-backed securities investments as a percentage of net assets. Ratings based on Moody’s Investors Service, Inc where available, otherwise on Standard & Poor’s Financial Services LLC.
* NR - Not Rated
The accompanying notes are an integral part of the financial statements.
| ICON Fund | Management Overview |
| | September 30, 2019 (Unaudited) |
| Q. | How did the Fund perform relative to its benchmark? |
| A. | The ICON Fund (the Fund) Class S returned 0.88% for the fiscal year ended September 30, 2019, while its benchmark, the S&P 1500 Index, returned 3.39%. Total returns for other periods and additional Class shares as of September 30, 2019, appear in the subsequent pages of this Fund’s Management Overview. |
| Q. | What primary factors were behind the Fund’s relative performance? |
| A. | The S&P 1500 Index dropped sharply from September 30, 2018 to December 24, 2018, losing about 19.32%. The Fund fell about 24.14% during that period. That decline featured a complete sector theme reversal punishing the Fund’s large weightings in Information Technology, Industrials, and Consumer Discretionary. From the low December 24, 2018 through September 30, 2019, when those same three sectors were among the leaders, the Fund outpaced the S&P 1500, with the Fund returning about 32.98% versus the index return of about 28.15%. However, that outperformance during the market rebound was not enough to overcome the underperformance during the late 2018 decline. |
| Q. | How did the Fund’s composition affect performance? |
| A. | The five biggest contributors to Fund performance were NXP Semiconductors, Martin Marietta Materials, Dollar General Corporation, NIKE and Dollar Tree. Dollar General, NIKE and Dollar Tree are in the Consumer Discretionary sector. Martin Marietta is in Materials and NXP Semiconductors is in the Information Technology sector. All five remained in the portfolio as of September 30, 2019. |
The five stocks that detracted the most from Fund performance were Parsley Energy, Diamondback Energy Corporation, SVB Financial Group, Alexion Pharmaceuticals and Polaris. Polaris and Parsley Energy have been sold. The other three companies remain in the Fund. It is interesting to note that SVB Financial Group was among the top five contributors the previous year.
| Q. | What is your investment outlook for the overall market? |
| A. | As of September 30, 2019, ICON’s valuation model shows a value-to-price (V/P) ratio of 1.17 for the overall market. In other words, we believe stock prices, on average, are below our estimate of fair value. Although news events could interfere, we expect prices to move up toward our estimate of fair value. |
| Annual Report | September 30, 2019 | 13 |
| ICON Fund | Management Overview |
| | September 30, 2019 (Unaudited) |
Average Annual Total Return(as of September 30, 2019)
| | Inception Date | 1 Year | 5 Years | 10 Years | Since
Inception | Gross Expense
Ratio* | Net Expense
Ratio* |
| ICON Fund - Class S | 5/6/04 | 0.88% | 6.69% | 8.49% | 4.83% | 1.10% | 1.10% |
| ICON Fund - Class C | 11/28/00 | -0.16% | 5.50% | 7.56% | 3.90% | 2.27% | 2.25% |
| ICON Fund - Class A | 5/31/06 | 0.67% | 6.31% | 8.11% | 2.65% | 1.63% | 1.50% |
| ICON Fund - Class A (including maximum sales charge of 5.75%) | 5/31/06 | -5.13% | 5.07% | 7.48% | 2.20% | 1.63% | 1.50% |
| S&P Composite 1500 Index | | 3.39% | 10.69% | 13.21% | 8.94% | N/A | N/A |
Past performance is not a guarantee of future results.Information about these performance results and the comparative indexes can be found in the About This Report section. The Since Inception performance results for Class C shares include returns for certain time periods that were restarted as of June 8, 2004.
* Please see the most recent prospectus for details.
Class C total returns exclude applicable sales charges. If sales charges were included returns would be lower.
Value of a $10,000 Investment(through September 30, 2019)
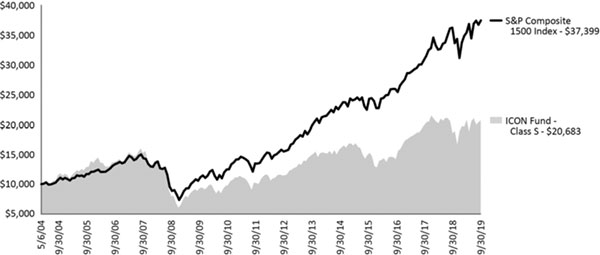
Past performance is not a guarantee of future results.The above graph compares a $10,000 investment made in the ICON Fund’s Class S shares on the Class’ inception date of 5/6/04 to a $10,000 investment made in an unmanaged securities index on that date. Performance for the ICON Fund’s other share classes will vary due to differences in charges and expenses. The ICON Fund’s performance in this chart and the performance table assumes the reinvestment of dividends and capital gain distributions but does not reflect the deduction of taxes that a shareholder would pay on Fund distributions or on the redemption of Fund shares.
| ICON Fund | Schedule of Investments |
| | September 30, 2019 |
| | | Shares or | | | | |
| | | Principal | | | | |
| | | Amount | | | Value | |
| Common Stocks (97.58%) | | | | |
| Aerospace & Defense (8.03%) | | | | |
| L3Harris Technologies, Inc. | | | 7,600 | | | $ | 1,585,664 | |
| Northrop Grumman Corp. | | | 4,900 | | | | 1,836,471 | |
| | | | | | | | 3,422,135 | |
| Application Software (3.05%) | | | | |
| Adobe, Inc.(a) | | | 4,700 | | | | 1,298,375 | |
| | | | | | | | | |
| Auto Parts & Equipment (2.78%) | | | | |
| Magna International, Inc. | | | 22,200 | | | | 1,183,926 | |
| | | | | | | | | |
| Biotechnology (2.67%) | | | | |
| Alexion Pharmaceuticals, Inc.(a) | | | 11,609 | | | | 1,136,986 | |
| | | | | | | | | |
| Building Products (3.82%) | | | | |
| Masco Corp. | | | 39,000 | | | | 1,625,520 | |
| | | | | | | | | |
| Construction Materials (7.23%) | | | | |
| Eagle Materials, Inc. | | | 7,100 | | | | 639,071 | |
| Martin Marietta Materials, Inc. | | | 8,900 | | | | 2,439,490 | |
| | | | | | | | 3,078,561 | |
| Data Processing & Outsourced Services (5.47%) | | | | |
| Global Payments, Inc. | | | 14,663 | | | | 2,331,387 | |
| | | | | | | | | |
| Diversified Banks (13.30%) |
| Bank of America Corp. | | | 144,978 | | | | 4,229,008 | |
| JPMorgan Chase & Co. | | | 12,200 | | | | 1,435,818 | |
| | | | | | | | 5,664,826 | |
| Footwear (3.46%) | | | | |
| NIKE, Inc., Class B | | | 15,700 | | | | 1,474,544 | |
| | | | | | | | | |
| General Merchandise Stores (5.79%) | | | | |
| Dollar General Corp. | | | 7,700 | | | | 1,223,838 | |
| Dollar Tree, Inc.(a) | | | 10,900 | | | | 1,244,344 | |
| | | | | | | | 2,468,182 | |
| Home Improvement Retail (2.45%) | | | | |
| Home Depot, Inc. | | | 4,500 | | | | 1,044,090 | |
| | | | | | | | | |
| Hotels, Resorts & Cruise Lines (2.92%) | | | | |
| Royal Caribbean Cruises, Ltd. | | | 11,500 | | | | 1,245,795 | |
| | | | | | | | | |
| Internet & Direct Marketing Retail (2.74%) | | | | |
| Expedia, Inc. | | | 8,687 | | | | 1,167,620 | |
| | | | | | | | | |
| Oil & Gas Exploration & Production (3.05%) | | | | |
| Diamondback Energy, Inc. | | | 6,600 | | | | 593,406 | |
| Pioneer Natural Resources Co. | | | 5,604 | | | | 704,815 | |
| | | | | | | | 1,298,221 | |
| Oil & Gas Refining & Marketing (2.25%) | | | | |
| Marathon Petroleum Corp. | | | 15,800 | | | | 959,850 | |
| | | Shares or | | | | |
| | | Principal | | | | |
| | | Amount | | | Value | |
| Pharmaceuticals (1.72%) | | |
| Jazz Pharmaceuticals PLC(a) | | | 5,700 | | | $ | 730,398 | |
| | | | | | | | | |
| Railroads (2.77%) | | | | |
| Canadian Pacific Railway, Ltd. | | | 5,303 | | | | 1,179,705 | |
| | | | | | | | | |
| Regional Banks (9.84%) | | | | |
| KeyCorp | | | 26,400 | | | | 470,976 | |
| Signature Bank | | | 16,300 | | | | 1,943,286 | |
| SVB Financial Group(a) | | | 8,500 | | | | 1,776,075 | |
| | | | | | | | 4,190,337 | |
| Semiconductors (12.06%) |
| NXP Semiconductors NV | | | 12,900 | | | | 1,407,648 | |
| Qorvo, Inc.(a) | | | 20,300 | | | | 1,505,042 | |
| Skyworks Solutions, Inc. | | | 28,100 | | | | 2,226,925 | |
| | | | | | | | 5,139,615 | |
| Specialty Stores (2.18%) | | | | |
| Ulta Beauty, Inc.(a) | | | 3,700 | | | | 927,405 | |
| | | | | | | | | |
| Total Common Stocks | | | | |
| (Cost $31,584,644) | | | 41,567,478 | |
| | | | | | | | | |
| Exchange Traded Funds (1.50%) | | | | |
| Direxion Daily S&P 500® Bull 3X(b) | | | 12,168 | | | | 636,508 | |
| | | | | | | | | |
| Total Exchange Traded Funds | | | | |
| (Cost $377,896) | | | 636,508 | |
| | | | | | | | | |
| Collateral for Securities on Loan (1.20%) | | | | |
State Street Navigator Securities Lending Government Money Market Portfolio,
7-Day Yield 2.09% | | | 511,675 | | | | 511,675 | |
| | | | | | | | | |
| Total Collateral for Securities on Loan | | | | |
| (Cost $511,675) | | | 511,675 | |
| | | | | | | | | |
| Total Investments (100.28%) | | | | |
| (Cost $32,474,215) | | $ | 42,715,661 | |
| | | | | | | | | |
| Liabilities Less Other Assets (-0.28%) | | | (117,954 | ) |
| | | | | | | | | |
| Net Assets (100.00%) | | $ | 42,597,707 | |
(a) Non-income producing security.
(b) All or a portion of the security was on loan as of September 30, 2019.
The accompanying notes are an integral part of the financial statements.
| Annual Report | September 30, 2019 | 15 |
| ICON Fund | Schedule of Investments |
| | September 30, 2019 |
Sector Composition(September 30, 2019)
| Financials | | | 23.14 | % |
| Consumer Discretionary | | | 22.32 | % |
| Information Technology | | | 20.58 | % |
| Industrials | | | 14.62 | % |
| Materials | | | 7.23 | % |
| Energy | | | 5.30 | % |
| Health Care | | | 4.39 | % |
| | | | 97.58 | % |
Percentages are based upon common stocks as a percentage of net assets.
Industry Composition(September 30, 2019)
| Diversified Banks | | | 13.30 | % |
| Semiconductors | | | 12.06 | % |
| Regional Banks | | | 9.84 | % |
| Aerospace & Defense | | | 8.03 | % |
| Construction Materials | | | 7.23 | % |
| General Merchandise Stores | | | 5.79 | % |
| Data Processing & Outsourced Services | | | 5.47 | % |
| Building Products | | | 3.82 | % |
| Footwear | | | 3.46 | % |
| Application Software | | | 3.05 | % |
| Oil & Gas Exploration & Production | | | 3.05 | % |
| Hotels, Resorts & Cruise Lines | | | 2.92 | % |
| Auto Parts & Equipment | | | 2.78 | % |
| Railroads | | | 2.77 | % |
| Internet & Direct Marketing Retail | | | 2.74 | % |
| Biotechnology | | | 2.67 | % |
| Home Improvement Retail | | | 2.45 | % |
| Oil & Gas Refining & Marketing | | | 2.25 | % |
| Specialty Stores | | | 2.18 | % |
| Pharmaceuticals | | | 1.72 | % |
| | | | 97.58 | % |
Percentages are based upon common stocks as a percentage of net assets.
The accompanying notes are an integral part of the financial statements.
| ICON Long/Short Fund | Management Overview |
| | September 30, 2019 (Unaudited) |
| Q. | How did the Fund perform relative to its benchmark? |
| A. | The ICON Long-Short Fund (the Fund) Class S returned 0.56% for the fiscal year ended September 30, 2019, while its benchmark, the S&P 1500 Index, returned 3.39%. Total returns for other periods and additional Class shares as of September 30, 2019, appear in the subsequent pages of this Fund’s Management Overview. |
| Q. | What primary factors were behind the Fund’s relative performance? |
| A. | The S&P 1500 Index dropped sharply from September 30, 2018 to December 24, 2018, losing about 19.32%. The Fund fell about 23.84% during that period. That decline featured a complete sector theme reversal punishing the Fund’s large weightings in Information Technology, Industrials, and Consumer Discretionary. From the low December 24, 2018 through September 30, 2019, when those same three sectors were among the leaders, the Fund outpaced the S&P 1500, with the Fund returning about 32.04% versus the index return of about 28.15%. However, that outperformance during the market rebound was not enough to overcome the underperformance during the late 2018 decline. With regard to short selling, no stocks were sold short during the fiscal year. While some stocks do drop in price during a rising, bull market, we believed the broad market would move up to all-time highs and did not want to sell short “against the current.” |
| Q. | How did the Fund’s composition affect performance? |
| A. | The five biggest contributors to Fund performance were Martin Marietta Materials, Dollar General Corporation, Dollar Tree, NIKE and Voya Financial. Dollar General, Dollar Tree and NIKE are in the Consumer Discretionary sector. Martin Marietta is in Materials and Voya is in the Financials sector. All five remained in the portfolio as of September 30, 2019. |
The five stocks that detracted the most from Fund performance were Parsley Energy, FedEx Corporation, SVB Financial Group, Diamond Back Energy and Polaris. Polaris has been sold. The other four companies remain in the Fund. It is interesting to note that SVB Financial Group was among the top five contributors the previous year.
| Q. | What is your investment outlook for the overall market? |
| A. | As of September 30, 2019, ICON’s valuation model shows a value-to-price (V/P) ratio of 1.17 for the overall market. In other words, we believe stock prices, on average, are below our estimate of fair value. Although news events could interfere, we expect prices to move up toward our estimate of fair value. In regards to short selling, we will increase our search for short sell candidates when we see over-pricing and other behaviors that suggest the bull market is nearing an end. |
| Annual Report | September 30, 2019 | 17 |
| ICON Long/Short Fund | Management Overview |
| | September 30, 2019 (Unaudited) |
Average Annual Total Return(as of September 30, 2019)
| Inception Date | 1 Year | 5 Years | 10 Years | Since
Inception | Gross Expense
Ratio* | Net Expense
Ratio* |
| ICON Long/Short Fund - Class S | 5/6/04 | 0.56% | 8.17% | 8.93% | 5.43% | 1.38% | 1.25% |
| ICON Long/Short Fund - Class C | 10/17/02 | -0.47% | 7.04% | 7.79% | 5.68% | 2.60% | 2.30% |
| ICON Long/Short Fund - Class A | 5/31/06 | 0.27% | 7.84% | 8.60% | 3.95% | 1.83% | 1.55% |
| ICON Long/Short Fund - Class A | | | | | | | |
| (including maximum sales charge of 5.75%) | 5/31/06 | -5.51% | 6.57% | 7.96% | 3.49% | 1.83% | 1.55% |
| S&P Composite 1500 Index | | 3.39% | 10.69% | 13.21% | 8.94% | N/A | N/A |
Past performance is not a guarantee of future results.Information about these performance results and the comparative indexes can be found in the About This Report section. The Adviser has agreed to limit certain Fund expenses; without these limitations, returns would have been lower. The limitation provisions may be terminated in the future.
* Please see the most recent prospectus for details.
Class C total returns exclude applicable sales charges. If sales charges were included returns would be lower.
Value of a $10,000 Investment(through September 30, 2019)
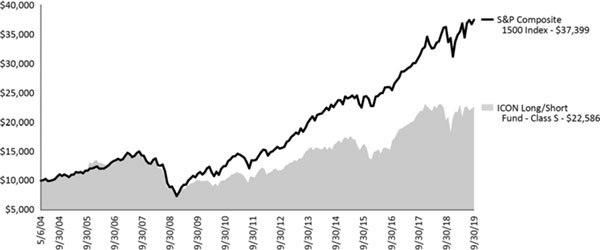
Past performance is not a guarantee of future results.The above graph compares a $10,000 investment made in the Long/Short Fund’s Class S shares on the Class’ inception date of 5/6/04 to a $10,000 investment made in an unmanaged securities index on that date. Performance for the Long/Short Fund’s other share classes will vary due to differences in charges and expenses. The Long/Short Fund’s performance in this chart and the performance table assumes the reinvestment of dividends and capital gain distributions but does not reflect the deduction of taxes that a shareholder would pay on Fund distributions or on the redemption of Fund shares.
| ICON Long/Short Fund | Schedule of Investments |
| | September 30, 2019 |
| | | Shares or | | | | |
| | | Principal | | | | |
| | | Amount | | | Value | |
| Common Stocks (98.48%) | | | | |
| Aerospace & Defense (2.34%) | | | | |
| L3Harris Technologies, Inc. | | | 2,300 | | | $ | 479,872 | |
| | | | | | | | | |
| Air Freight & Logistics (2.91%) | | | | |
| FedEx Corp. | | | 4,100 | | | | 596,837 | |
| | | | | | | | | |
| Application Software (2.83%) | | | | |
| Adobe, Inc.(a) | | | 2,100 | | | | 580,125 | |
| | | | | | | | | |
| Auto Parts & Equipment (1.95%) | | | | | | | | |
| Magna International, Inc. | | | 7,500 | | | | 399,975 | |
| | | | | | | | | |
| Broadcasting (2.30%) | | | | |
| Discovery Communications, Inc., Class A(a)(b) | | | 17,700 | | | | 471,351 | |
| | | | | | | | | |
| Building Products (3.88%) | | | | |
| Masco Corp. | | | 19,100 | | | | 796,088 | |
| | | | | | | | | |
| Construction Materials (6.14%) | | | | |
| Eagle Materials, Inc. | | | 6,700 | | | | 603,067 | |
| Martin Marietta Materials, Inc. | | | 2,400 | | | | 657,840 | |
| | | | | | | | 1,260,907 | |
| Data Processing & Outsourced Services (12.17%) | | | | |
| Euronet Worldwide, Inc.(a) | | | 3,561 | | | | 520,974 | |
| Global Payments, Inc. | | | 2,700 | | | | 429,300 | |
| Mastercard, Inc., Class A | | | 5,700 | | | | 1,547,949 | |
| | | | | | | | 2,498,223 | |
| Diversified Banks (8.46%) | | | | |
| Bank of America Corp.(c) | | | 40,200 | | | | 1,172,634 | |
| JPMorgan Chase & Co. | | | 4,800 | | | | 564,912 | |
| | | | | | | | 1,737,546 | |
| Footwear (3.52%) | | | | |
| NIKE, Inc., Class B | | | 7,700 | | | | 723,184 | |
| | | | | | | | | |
| General Merchandise Stores (9.80%) | | | | |
| Dollar General Corp. | | | 6,400 | | | | 1,017,216 | |
| Dollar Tree, Inc.(a) | | | 8,700 | | | | 993,192 | |
| | | | | | | | 2,010,408 | |
| Hotels, Resorts & Cruise Lines (3.75%) | | | | |
| Royal Caribbean Cruises, Ltd. | | | 7,100 | | | | 769,143 | |
| | | | | | | | | |
| Insurance Brokers (2.97%) | | | | |
| Arthur J Gallagher & Co. | | | 6,800 | | | | 609,076 | |
| | | | | | | | | |
| IT Consulting & Other Services (3.02%) | | | | |
| EPAM Systems, Inc.(a) | | | 3,400 | | | | 619,888 | |
| | | | | | | | | |
| Oil & Gas Equipment & Services (2.09%) | | | | |
| Baker Hughes a GE Co. | | | 18,502 | | | | 429,247 | |
| | | Shares or | | | | |
| | | Principal | | | | |
| | | Amount | | | Value | |
| Oil & Gas Exploration & Production (2.01%) | | | | |
| Parsley Energy, Inc., Class A | | | 24,500 | | | $ | 411,600 | |
| | | | | | | | | |
| Oil & Gas Refining & Marketing (2.22%) | | | | |
| Marathon Petroleum Corp. | | | 7,500 | | | | 455,625 | |
| | | | | | | | | |
| Other Diversified Financial Services (4.32%) | | | | |
| Voya Financial, Inc. | | | 16,300 | | | | 887,372 | |
| | | | | | | | | |
| Railroads (8.05%) | | | | |
| CSX Corp. | | | 12,700 | | | | 879,729 | |
| Kansas City Southern | | | 5,800 | | | | 771,458 | |
| | | | | | | | 1,651,187 | |
| Regional Banks (6.44%) | | | | |
| Signature Bank | | | 6,000 | | | | 715,320 | |
| SVB Financial Group(a) | | | 2,900 | | | | 605,955 | |
| | | | | | | | 1,321,275 | |
| Semiconductors (3.69%) | | | | |
| Qorvo, Inc.(a) | | | 6,300 | | | | 467,082 | |
| Skyworks Solutions, Inc. | | | 3,656 | | | | 289,738 | |
| | | | | | | | 756,820 | |
| Systems Software (1.98%) | | | | |
| ServiceNow, Inc.(a) | | | 1,600 | | | | 406,160 | |
| | | | | | | | | |
| Trading Companies & Distributors (1.64%) | | | | |
| United Rentals, Inc.(a) | | | 2,700 | | | | 336,528 | |
| | | | | | | | | |
| Total Common Stocks | | | | |
| (Cost $16,724,365) | | | 20,208,437 | |
| | | | | | | | | |
| Exchange Traded Funds (1.51%) | | | | |
| Direxion Daily S&P 500® Bull 3X(b) | | | 5,926 | | | | 309,989 | |
| | | | | | | | | |
Total Exchange Traded Funds (Cost $184,041) | | | 309,989 | |
| | | | | | | | | |
| Collateral for Securities on Loan (0.01%) | | | | |
State Street Navigator Securities Lending Government Money Market Portfolio,
7-Day Yield 2.09% | | | 1,055 | | | | 1,055 | |
| | | | | | | | | |
Total Collateral for Securities on Loan
(Cost $1,055) | | | 1,055 | |
| | | | | | | | | |
Total Investments (100.00%) (Cost $16,909,461) | | $ | 20,519,481 | |
| | | | | | | | | |
| Other Assets Less Liabilities (0.00%) | | | 583 | |
| | | | | | | | | |
| Net Assets (100.00%) | | | | | | $ | 20,520,064 | |
The accompanying notes are an integral part of the financial statements.
| Annual Report | September 30, 2019 | 19 |
| ICON Long/Short Fund | Schedule of Investments |
| | September 30, 2019 |
| (a) | Non-income producing security. |
| (b) | All or a portion of the security was on loan as of September 30, 2019. |
| (c) | Security, or portion of security, is being held as collateral for securities sold short. |
Sector Composition(September 30, 2019)
| Information Technology | | | 23.69 | % |
| Financials | | | 22.19 | % |
| Consumer Discretionary | | | 19.02 | % |
| Industrials | | | 18.82 | % |
| Energy | | | 6.32 | % |
| Materials | | | 6.14 | % |
| Communication Services | | | 2.30 | % |
| | | | 98.48 | % |
Percentages are based upon common stocks as a percentage of net assets.
Industry Composition(September 30, 2019)
| Data Processing & Outsourced Services | | | 12.17 | % |
| General Merchandise Stores | | | 9.80 | % |
| Diversified Banks | | | 8.46 | % |
| Railroads | | | 8.05 | % |
| Regional Banks | | | 6.44 | % |
| Construction Materials | | | 6.14 | % |
| Other Diversified Financial Services | | | 4.32 | % |
| Building Products | | | 3.88 | % |
| Hotels, Resorts & Cruise Lines | | | 3.75 | % |
| Semiconductors | | | 3.69 | % |
| Footwear | | | 3.52 | % |
| IT Consulting & Other Services | | | 3.02 | % |
| Insurance Brokers | | | 2.97 | % |
| Air Freight & Logistics | | | 2.91 | % |
| Application Software | | | 2.83 | % |
| Aerospace & Defense | | | 2.34 | % |
| Broadcasting | | | 2.30 | % |
| Oil & Gas Refining & Marketing | | | 2.22 | % |
| Oil & Gas Equipment & Services | | | 2.09 | % |
| Oil & Gas Exploration & Production | | | 2.01 | % |
| Systems Software | | | 1.98 | % |
| Auto Parts & Equipment | | | 1.95 | % |
| Trading Companies & Distributors | | | 1.64 | % |
| | | | 98.48 | % |
Percentages are based upon common stocks as a percentage of net assets.
The accompanying notes are an integral part of the financial statements.
| ICON Opportunities Fund | Management Overview |
| | September 30, 2019 (Unaudited) |
| Q. | How did the Fund perform relative to its benchmark? |
| A. | The ICON Opportunities Fund (the Fund) returned -7.53% for the fiscal year ended September 30, 2019, while its benchmark, the S&P Small-Cap 600 Total Return Index, returned -9.34%. Total returns for other periods as of September 2019, appear in the subsequent pages of this Fund’s Management Overview. It should be noted that over the fiscal year small-cap stocks underperformed large-cap stocks. As mentioned, for the one year period ended September 30, 2019, the S&P Small-cap 600 Index lost 9.34% while the large cap S&P 500 Index gained 3.39%. |
| Q. | What primary factors were behind the Fund’s relative performance? |
| A. | From September 30 2018, to the market low December 24, 2018, the S&P Small-Cap 600 Index dropped about 24.99%. However, the Fund dropped significantly more, falling about 29.00% during that period. During the market rebound from December 24, 2018 through September 30, 2019, the Fund outpaced its benchmark, with the Fund gaining about 30.25% versus the index return of about 20.81. During the advance, the large weightings in Information Technology, Industrials and Consumer Discretionary were rewarded and enabled the Fund to slightly outperform its benchmark over the full one year time period ending September 30, 2019. |
| Q. | How did the Fund’s composition affect performance? |
| A. | The five stocks contributing the most to returns were LGI Homes, Cabot Microelectronics, Mellanox Technologies, KB Home, and Armstrong World Industries. LGI Homes and KB Home are homebuilders, and Armstrong World Industries provides home improvement solutions. Cabot Microelectronics and Mellanox are in the Information Technology sector. Mellanox has been sold, the other four remain in the Fund as of September 30, 2019. |
The following stocks with negative returns detracted the most from Fund performance: Ring Energy, SM Energy Company, SRC Energy, Ligand Pharmaceuticals and Matador Resources Company. Four of those five are from the Energy sector and were hurt by the drop in the price of oil from $85 per barrel to $60 over the fiscal year. Ligand Pharmaceuticals is in the Health Care sector and was one of the top five performing stocks the previous year. All five of those stocks have been sold.
| Q. | What is your investment outlook for the overall market? |
| A. | As of September 30, 2019, ICON’s valuation model shows a value-to-price (V/P) ratio of 1.17 for the overall market. In other words, we believe stock prices, on average, are below our estimate of fair value. Although news events could interfere, we expect prices to move up toward our estimate of fair value. We believe the conditions for small-cap stocks relative to large-cap stocks are more favorable than a year ago. |
| Annual Report | September 30, 2019 | 21 |
| ICON Opportunities Fund | Management Overview |
| | September 30, 2019 (Unaudited) |
Average Annual Total Return(as of September 30, 2019)
| | Inception Date | 1 Year | 5 Year | Since Inception | Gross Expense Ratio* | Net Expense Ratio* |
| ICON Opportunities Fund | 9/28/12 | -7.53% | 7.66% | 9.79% | 1.35% | 1.30% |
| S&P Small Cap Total Return Index | | -9.34% | 9.89% | 12.12% | N/A | N/A |
Past performance is not a guarantee of future results.Information about these performance results and the comparative indexes can be found in the About This Report section. The Adviser has agreed to limit certain Fund expenses; without these limitations, returns would have been lower. The limitation provisions may be terminated in the future.
* Please see the most recent prospectus for details.
Value of a $10,000 Investment(through September 30, 2019)
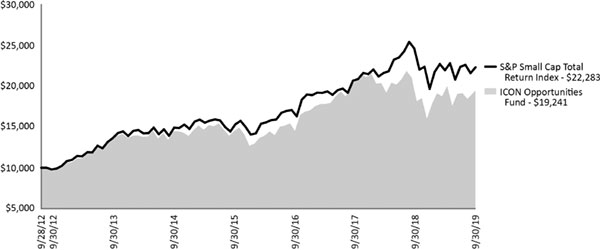
Past performance is not a guarantee of future results.The above graph compares a $10,000 investment made in the Opportunities Fund on the inception date of 9/28/12 to a $10,000 investment made in an unmanaged securities index on that date. The Opportunities Fund’s performance in this chart and the performance table assumes the reinvestment of dividends and capital gain distributions but does not reflect the deduction of taxes that a shareholder would pay on Fund distributions or on the redemption of Fund shares.
| ICON Opportunities Fund | Schedule of Investments |
| | September 30, 2019 |
| | | Shares or | | | | |
| | | Principal | | | | |
| | | Amount | | | Value | |
| Common Stocks (98.92%) | | | | |
| Air Freight & Logistics (3.55%) | | | | |
| Forward Air Corp. | | | 9,200 | | | $ | 586,224 | |
| | | | | | | | | |
| Application Software (2.91%) | | | | |
| Ebix, Inc.(a) | | | 11,400 | | | | 479,940 | |
| | | | | | | | | |
| Building Products (11.05%) | | | | |
| Armstrong World Industries, Inc. | | | 9,600 | | | | 928,320 | |
| Continental Building Products, Inc.(b) | | | 18,400 | | | | 502,136 | |
| Patrick Industries, Inc.(b) | | | 9,200 | | | | 394,496 | |
| | | | | | | | 1,824,952 | |
| Casinos & Gaming (3.05%) | | | | |
| Monarch Casino & Resort, Inc.(b) | | | 12,100 | | | | 504,449 | |
| | | | | | | | | |
| Communications Equipment (1.83%) | | | | |
| Extreme Networks, Inc.(b) | | | 41,600 | | | | 302,640 | |
| | | | | | | | | |
| Construction Machinery & Heavy Trucks (3.35%) | | | | |
| Alamo Group, Inc. | | | 4,700 | | | | 553,284 | |
| | | | | | | | | |
| Electronic Manufacturing Services (3.95%) | | | | |
| Methode Electronics, Inc. | | | 19,400 | | | | 652,616 | |
| | | | | | | | | |
| Homebuilding (12.36%) | | | | |
| KB Home | | | 25,500 | | | | 867,000 | |
| LGI Homes, Inc.(b) | | | 14,100 | | | | 1,174,812 | |
| | | | | | | | 2,041,812 | |
| Homefurnishing Retail (4.55%) | | | | |
| Aaron’s, Inc. | | | 11,700 | | | | 751,842 | |
| | | | | | | | | |
| Industrial Machinery (7.56%) | | | | |
| Albany International Corp., Class A | | | 4,900 | | | | 441,784 | |
| Altra Industrial Motion Corp. | | | 15,400 | | | | 426,503 | |
| Chart Industries, Inc.(b) | | | 6,100 | | | | 380,396 | |
| | | | | | | | 1,248,683 | |
| IT Consulting & Other Services (0.56%) | | | | |
| Perficient, Inc.(b) | | | 2,400 | | | | 92,592 | |
| | | | | | | | | |
| Leisure Products (3.98%) | | | | |
| Brunswick Corp. | | | 12,600 | | | | 656,712 | |
| | | | | | | | | |
| Office Services & Supplies (3.57%) | | | | |
| Herman Miller, Inc. | | | 12,800 | | | | 589,952 | |
| | | | | | | | | |
| Oil & Gas Refining & Marketing (2.05%) | | | | |
| CVR Energy, Inc. | | | 7,700 | | | | 339,031 | |
| | | | | | | | | |
| Regional Banks (3.32%) | | | | |
| First Midwest Bancorp, Inc. | | | 28,127 | | | | 547,914 | |
| | | | | | | | | |
| Semiconductor Equipment (4.10%) | | | | |
| Cabot Microelectronics Corp. | | | 4,800 | | | | 677,808 | |
| | | Shares or | | | | |
| | | Principal | | | | |
| | | Amount | | | Value | |
| Semiconductors (4.57%) | | |
| Diodes, Inc.(b) | | | 18,813 | | | $ | 755,342 | |
| | | | | | | | | |
| Specialty Chemicals (1.41%) | | | | |
| Ferro Corp.(b) | | | 19,600 | | | | 232,456 | |
| | | | | | | | | |
| Specialty Stores (5.34%) | | | | |
| Five Below, Inc.(b) | | | 7,000 | | | | 882,700 | |
| | | | | | | | | |
| Steel (2.32%) | | | | |
| Carpenter Technology Corp. | | | 7,400 | | | | 382,284 | |
| | | | | | | | | |
| Technology Hardware, Storage & Peripherals (4.19%) | | | | |
| Super Micro Computer, Inc.(b) | | | 36,000 | | | | 691,200 | |
| | | | | | | | | |
| Thrifts & Mortgage Finance (9.35%) | | | | |
| Axos Financial, Inc.(b) | | | 28,600 | | | | 790,790 | |
| Essent Group, Ltd. | | | 15,800 | | | | 753,186 | |
| | | | | | | | 1,543,976 | |
| Total Common Stocks | | | | |
| (Cost $14,547,955) | | | 16,338,409 | |
| | | | | | | | | |
| Exchange Traded Funds (1.28%) | | | | |
| Direxion Daily Small Cap Bull 3X Shares(a) | | | 3,800 | | | | 211,546 | |
| | | | | | | | | |
Total Exchange Traded Funds
(Cost $141,587) | | | 211,546 | |
| | | | | | | | | |
| | | | | | | | | |
| Collateral for Securities on Loan (1.05%) | | | | |
State Street Navigator Securities Lending Government Money Market Portfolio,
7-Day Yield 2.09% | | | 173,825 | | | | 173,825 | |
| | | | | | | | | |
Total Collateral for Securities on Loan
(Cost $173,825) | | | 173,825 | |
| | | | | | | | | |
Total Investments (101.25%)
(Cost $14,863,367) | | $ | 16,723,780 | |
| | | | | | | | | |
| Liabilities Less Other Assets (-1.25%) | | | (206,718 | ) |
| | | | | | | | | |
| Net Assets (100.00%) | | $ | 16,517,062 | |
| (a) | All or a portion of the security was on loan as of September 30, 2019. |
| (b) | Non-income producing security. |
The accompanying notes are an integral part of the financial statements.
| Annual Report | September 30, 2019 | 23 |
| ICON Opportunities Fund | Schedule of Investments |
| | September 30, 2019 |
Sector Composition(September 30, 2019)
| Consumer Discretionary | | | 29.28 | % |
| Industrials | | | 29.08 | % |
| Information Technology | | | 22.11 | % |
| Financials | | | 12.67 | % |
| Materials | | | 3.73 | % |
| Energy | | | 2.05 | % |
| | | | 98.92 | % |
Percentages are based upon common stocks as a percentage of net assets.
Industry Composition(September 30, 2019)
| Homebuilding | | | 12.36 | % |
| Building Products | | | 11.05 | % |
| Thrifts & Mortgage Finance | | | 9.35 | % |
| Industrial Machinery | | | 7.56 | % |
| Specialty Stores | | | 5.34 | % |
| Semiconductors | | | 4.57 | % |
| Homefurnishing Retail | | | 4.55 | % |
| Technology Hardware, Storage & Peripherals | | | 4.19 | % |
| Semiconductor Equipment | | | 4.10 | % |
| Leisure Products | | | 3.98 | % |
| Electronic Manufacturing Services | | | 3.95 | % |
| Office Services & Supplies | | | 3.57 | % |
| Air Freight & Logistics | | | 3.55 | % |
| Construction Machinery & Heavy Trucks | | | 3.35 | % |
| Regional Banks | | | 3.32 | % |
| Casinos & Gaming | | | 3.05 | % |
| Application Software | | | 2.91 | % |
| Steel | | | 2.32 | % |
| Oil & Gas Refining & Marketing | | | 2.05 | % |
| Communications Equipment | | | 1.83 | % |
| Specialty Chemicals | | | 1.41 | % |
| IT Consulting & Other Services | | | 0.56 | % |
| | | | 98.92 | % |
Percentages are based upon common stocks as a percentage of net assets.
The accompanying notes are an integral part of the financial statements.
| ICON Risk-Managed Balanced Fund | | Management Overview |
September 30, 2019 (Unaudited)
| Q. | How did the Fund perform relative to its benchmark? |
| A. | The ICON Risk-Managed Balanced Fund (the Fund) Class S returned -0.14% for the fiscal year ended September 30, 2019, while its benchmark, the S&P Composite 1500 Index, returned 3.39%. Total returns for other periods and additional Class shares as of September 30, 2019, appear in the subsequent pages of this Fund’s Management Overview. |
| Q. | What primary factors were behind the Fund’s relative performance? |
| A. | The overall market dropped sharply during the fourth quarter of 2018. During the fourth quarter 2018, the S&P 1500 index dropped over 13.5% over trade concerns and overall declining global growth. The Fund’s equity holdings were concentrated in more cyclical industries, and they were therefore affected more negatively during the short-term downturn. |
According to our valuation methodology, in January 2019 we had with an overall average value-to-price (V/P) ratio for the domestic market of 1.12, indicating we saw the domestic market as priced approximately 12% below our estimate of fair value. Based on this favorable outlook for equities we positioned the Fund with an approximate 70% equities / 30% fixed income allocation. As the equity market regained its upward momentum throughout the remainder of 2019, the Fund recovered from most of the losses from 4Q 2018, but ultimately lagged its benchmark by year-end.
The Fund’s fixed income holdings underperformed relative to the benchmark as interest rates fell. Given our positioning, we generally expect underperformance when rates fall aggressively and relative outperformance when rates rise. The underperformance during a time of falling rates was a result of the Fund’s holdings having a much shorter duration than the benchmark. We continued our focus on credit spread risk with a particular focus on shorter duration. Our fixed income volatility remains relatively low and this contributed favorably to the Fund’s risk adjusted returns. Our use of closed-end fund (CEF) arbitrage continued to be rewarded, as a number of these positions converted to open-end funds or liquidated. As a result, we were able to capture the original discount to net asset value at which the CEF had been acquired.
| Q. | How did the Fund’s composition affect performance? |
| A. | The three biggest contributors to Fund performance were Northrop Grumman, MasterCard, and eBay. All three remained in the portfolio as of September 30, 2019, showing valuations indicating potential for continued price appreciation. |
The three stocks that detracted the most from Fund performance were Ligand Pharmaceuticals, SVB Financial Group, and SRC Energy. These top laggards varied across sectors and shared no common industry-wide theme. Their underperformance, in each case, appeared to be tied to firm-specific disappointing events and financial reporting.
| Q. | What is your investment outlook for the overall market? |
| A. | As of September 30, 2019, ICON’s valuation model shows a value-to-price (V/P) ratio of 1.17 for the overall market. In other words, we believe stock prices, on average, are below our estimate of fair value. Although news events could interfere, we expect prices to move up toward our estimate of fair value. |
| Annual Report | September 30, 2019 | 25 |
| | |
| ICON Risk-Managed Balanced Fund | | Management Overview |
September 30, 2019 (Unaudited)
Average Annual Total Return(as of September 30, 2019)
| | Inception Date | 1 Year | 5 Years | 10 Years | Since
Inception | Gross Expense
Ratio* | Net Expense Ratio* |
| ICON Risk-Managed Balanced Fund - Class S | 5/6/04 | -0.14% | 4.09% | 5.54% | 4.14% | 1.49% | 1.31% |
| ICON Risk-Managed Balanced Fund - Class C | 11/21/02 | -1.13% | 3.05% | 4.49% | 4.05% | 2.39% | 2.31% |
| ICON Risk-Managed Balanced Fund - Class A | 5/31/06 | -0.41% | 3.83% | 5.29% | 3.58% | 1.75% | 1.56% |
| ICON Risk-Managed Balanced Fund - Class A(including maximum sales charge of 5.75%) | 5/31/06 | -6.13% | 2.60% | 4.67% | 3.12% | 1.75% | 1.56% |
| S&P Composite 1500 Index | | 3.39% | 10.69% | 13.21% | 8.94% | N/A | N/A |
Past performance is not a guarantee of future results.Information about these performance results and the comparative indexes can be found in the About This Report section. The Adviser has agreed to limit certain Fund expenses; without these limitations, returns would have been lower. The limitation provisions may be terminated in the future.
| * | Please see the most recent prospectus for details. |
Class C total returns exclude applicable sales charges. If sales charges were included returns would be lower.
Value of a $10,000 Investment(through September 30, 2019)
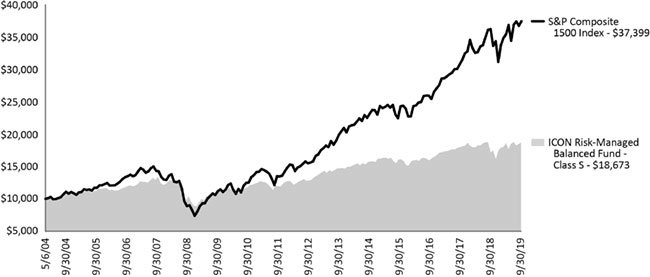
Past performance is not a guarantee of future results.The above graph compares a $10,000 investment made in the Risk-Managed Balanced Fund’s Class S shares on the Class’ inception date of 5/6/04 to a $10,000 investment made in an unmanaged securities index on that date. Performance for the Risk-Managed Balanced Fund’s other share classes will vary due to differences in charges and expenses. The Risk-Managed Balanced Fund’s performance in this chart and the performance table assumes the reinvestment of dividends and capital gain distributions but does not reflect the deduction of taxes that a shareholder would pay on Fund distributions or on the redemption of Fund shares.
| ICON Risk-Managed Balanced Fund | Schedule of Investments |
| | September 30, 2019 |
| | | Shares or Principal
Amount | | | Value | |
| Corporate Bonds (20.17%) | | | | | | | | |
| Communication Services (1.55%) | | | | | | | | |
CSC Holdings LLC
10.88%, 10/15/25(a) | | $ | 200,000 | | | $ | 226,490 | |
Lee Enterprises, Inc.
9.50%, 03/15/22(a) | | | 200,000 | | | | 200,000 | |
| | | | | | | | 426,490 | |
| Consumer Discretionary (4.32%) | | | | | | | | |
Foot Locker, Inc.
8.50%, 01/15/22 | | | 150,000 | | | | 165,000 | |
Lear Corp.
5.25%,01/15/25 | | | 300,000 | | | | 309,888 | |
Reliance Intermediate Holdings LP
6.50%, 04/01/23(a) | | | 400,000 | | | | 412,000 | |
Silversea Cruise Finance, Ltd.
7.25%, 02/01/25(a) | | | 250,000 | | | | 266,875 | |
William Lyon Homes, Inc.
7.00%, 08/15/22 | | | 36,000 | | | | 36,090 | |
| | | | | | | | 1,189,853 | |
| Consumer Staples (2.39%) | | | | | | | | |
Central Garden & Pet Co.
6.13%, 11/15/23 | | | 260,000 | | | | 269,100 | |
Conagra Brands, Inc.
7.13%, 10/01/26 | | | 175,000 | | | | 214,085 | |
Kraft Heinz Foods Co.
4.88%, 02/15/25(a) | | | 171,000 | | | | 176,042 | |
| | | | | | | | 659,227 | |
| Energy (3.65%) | | | | | | | | |
Continental Resources, Inc.
5.00%, 09/15/22 | | | 261,000 | | | | 263,299 | |
MPLX LP
6.25%, 10/15/22(a) | | | 314,000 | | | | 321,874 | |
| 6.38%, 05/01/24(a) | | | 400,000 | | | | 419,604 | |
| | | | | | | | 1,004,777 | |
| Financial (5.13%) | | | | | | | | |
Catlin Insurance Co., Ltd.
3M US L + 2.975%(a)(b)(c) | | | 400,000 | | | | 400,400 | |
JPMorgan Chase & Co., Series I
3M US L + 3.47%(b)(c) | | | 250,000 | | | | 251,172 | |
| MPT Operating Partnership LP / MPT | | | | | | | | |
Finance Corp.
6.38%, 03/01/24 | | | 234,000 | | | | 245,300 | |
Principal Financial Group, Inc.
3M US L + 3.044%, 05/15/55(b) | | | 250,000 | | | | 249,062 | |
Prudential Financial, Inc.
3M US L + 4.175%, 09/15/42(b) | | | 250,000 | | | | 269,293 | |
| | | | | | | | 1,415,227 | |
| Health Care (1.14%) | | | | | | | | |
Bausch Health Cos., Inc.
7.00%, 03/15/24(a) | | | 100,000 | | | | 105,096 | |
Hill-Rom Holdings, Inc.
5.75%, 09/01/23(a) | | | 100,000 | | | | 102,670 | |
| | | Shares or
Principal
Amount | | | Value | |
| Health Care (continued) | | | | | | | | |
Molina Healthcare, Inc.
5.38%, 11/15/22 | | $ | 100,000 | | | $ | 106,004 | |
| | | | | | | | 313,770 | |
| Industrials (1.58%) | | | | | | | | |
Ashtead Capital, Inc.
5.63%, 10/01/24(a) | | | 250,000 | | | | 257,500 | |
USG Corp.
5.50%, 03/01/25(a) | | | 175,000 | | | | 177,188 | |
| | | | | | | | 434,688 | |
| Materials (0.41%) | | | | | | | | |
Teck Resources, Ltd.
6.13%, 10/01/35 | | | 100,000 | | | | 113,312 | |
| | | | | | | | | |
| Total Corporate Bonds | | | | | | | | |
| (Cost $5,509,560) | | | | | | | 5,557,344 | |
| | | | | | | | | |
| Common Stocks (70.91%) | | | | | | | | |
| Aerospace & Defense (5.14%) | | | | | | | | |
| Northrop Grumman Corp. | | | 2,100 | | | | 787,059 | |
| Raytheon Co. | | | 3,200 | | | | 627,808 | |
| | | | | | | | 1,414,867 | |
| Automotive Retail (1.62%) | | | | | | | | |
| AutoZone, Inc.(d) | | | 412 | | | | 446,863 | |
| | | | | | | | | |
| Biotechnology (1.25%) | | | | | | | | |
| AbbVie, Inc. | | | 4,561 | | | | 345,359 | |
| | | | | | | | | |
| Building Products (6.03%) | | | | | | | | |
| AO Smith Corp. | | | 10,707 | | | | 510,831 | |
| Fortune Brands Home & Security, Inc. | | | 11,300 | | | | 618,110 | |
| Masco Corp. | | | 12,846 | | | | 535,421 | |
| | | | | | | | 1,664,362 | |
| Construction Materials (1.41%) | | | | | | | | |
| Eagle Materials, Inc. | | | 4,318 | | | | 388,663 | |
| | | | | | | | | |
| Data Processing & Outsourced Services (6.53%) | | | | | | | | |
| Mastercard, Inc., Class A | | | 3,729 | | | | 1,012,685 | |
| Visa, Inc., Class A | | | 4,567 | | | | 785,570 | |
| | | | | | | | 1,798,255 | |
| Diversified Banks (5.18%) | | | | | | | | |
| Bank of America Corp. | | | 23,362 | | | | 681,470 | |
| JPMorgan Chase & Co. | | | 6,353 | | | | 747,685 | |
| | | | | | | | 1,429,155 | |
| Footwear (2.59%) | | | | | | | | |
| NIKE, Inc., Class B | | | 7,600 | | | | 713,792 | |
| | | | | | | | | |
| Health Care Services (1.24%) | | | | | | | | |
| Cigna Corp. | | | 2,253 | | | | 341,983 | |
| | | | | | | | | |
| Homebuilding (2.10%) | | | | | | | | |
| DR Horton, Inc. | | | 10,994 | | | | 579,494 | |
| The accompanying notes are an integral part of the financial statements. | |
| Annual Report | September 30, 2019 | 27 |
| ICON Risk-Managed Balanced Fund | Schedule of Investments |
| | September 30, 2019 |
| | | Shares or Principal Amount | | | Value | |
| Hotels, Resorts & Cruise Lines (2.79%) | | | | | | | | |
| Marriott Vacations Worldwide Corp. | | | 2,800 | | | $ | 290,108 | |
| Royal Caribbean Cruises, Ltd. | | | 4,438 | | | | 480,769 | |
| | | | | | | | 770,877 | |
| Interactive Media & Services (2.62%) | | | | | | | | |
| Alphabet, Inc., Class C(d) | | | 254 | | | | 309,626 | |
| Facebook, Inc., Class A(d) | | | 2,323 | | | | 413,680 | |
| | | | | | | | 723,306 | |
| Internet & Direct Marketing Retail (2.55%) | | | | | | | | |
| eBay, Inc. | | | 18,000 | | | | 701,640 | |
| | | | | | | | | |
| Leisure Products (1.45%) | | | | | | | | |
| Brunswick Corp. | | | 7,657 | | | | 399,083 | |
| | | | | | | | | |
| Life & Health Insurance (4.61%) | | | | | | | | |
| Lincoln National Corp. | | | 12,700 | | | | 766,064 | |
| Prudential Financial, Inc. | | | 5,600 | | | | 503,720 | |
| | | | | | | | 1,269,784 | |
| Life Sciences Tools & Services (4.45%) | | | | | | | | |
| PerkinElmer, Inc. | | | 5,812 | | | | 495,008 | |
| PRA Health Sciences, Inc.(d) | | | 2,644 | | | | 262,364 | |
| Thermo Fisher Scientific, Inc. | | | 1,605 | | | | 467,488 | |
| | | | | | | | 1,224,860 | |
| Oil & Gas Exploration & Production (1.53%) | | | | | | | | |
| Cimarex Energy Co. | | | 3,100 | | | | 148,614 | |
| Diamondback Energy, Inc. | | | 3,023 | | | | 271,798 | |
| | | | | | | | 420,412 | |
| Oil & Gas Refining & Marketing (1.13%) | | | | | | | | |
| Marathon Petroleum Corp. | | | 5,146 | | | | 312,619 | |
| | | | | | | | | |
| Paper Packaging (5.34%) | | | | | | | | |
| Graphic Packaging Holding Co. | | | 25,667 | | | | 378,588 | |
| International Paper Co. | | | 11,900 | | | | 497,658 | |
| Packaging Corp. of America | | | 5,600 | | | | 594,160 | |
| | | | | | | | 1,470,406 | |
| Railroads (3.45%) | | | | | | | | |
| Canadian Pacific Railway, Ltd. | | | 2,000 | | | | 444,920 | |
| Union Pacific Corp. | | | 3,129 | | | | 506,835 | |
| | | | | | | | 951,755 | |
| Regional Banks (5.04%) | | | | | | | | |
| KeyCorp | | | 21,031 | | | | 375,193 | |
| Signature Bank | | | 4,102 | | | | 489,040 | |
| SVB Financial Group(d) | | | 2,500 | | | | 522,375 | |
| | | | | | | | 1,386,608 | |
| Restaurants (1.42%) | | | | | | | | |
| Darden Restaurants, Inc. | | | 3,300 | | | | 390,126 | |
| | | | | | | | | |
| Trading Companies & Distributors (1.44%) | | | | | | | | |
| Air Lease Corp. | | | 9,485 | | | | 396,663 | |
| | | | | | | | | |
| Total Common Stocks | | | | | | | | |
| (Cost $17,210,540) | | | | | | | 19,540,932 | |
| | | Shares or Principal Amount | | | Value | |
| Preferred Stocks (1.57%) | | | | | | | | |
| Property & Casualty Insurance (0.82%) | | | | | | | | |
Argo Group US, Inc.
6.50%, 09/15/42 | | | 8,816 | | | $ | 225,866 | |
| | | | | | | | | |
| Wireline Telecommunication Services (0.75%) | | | | | | | | |
Centaur Funding Corp.
9.08%, 04/21/20(a) | | | 200 | | | | 207,000 | |
| | | | | | | | | |
| Total Preferred Stocks | | | | | | | | |
| (Cost $434,077) | | | | | | | 432,866 | |
| | | | | | | | | |
| Closed-End Mutual Funds (5.65%) | | | | | | | | |
| BlackRock Muni New York Intermediate Duration Fund, Inc. | | | 6,798 | | | | 99,999 | |
| BlackRock New York Municipal Bond Trust | | | 9,455 | | | | 139,083 | |
| Duff & Phelps Utility and Corporate Bond Trust, Inc. | | | 37,226 | | | | 344,340 | |
| Eaton Vance California Municipal Income Trust | | | 15,404 | | | | 207,030 | |
| Invesco Dynamic Credit Opportunities Fund | | | 5,000 | | | | 55,050 | |
| Nuveen Mortgage Opportunity Term Fund | | | 23,692 | | | | 546,337 | |
| Nuveen New York Municipal Value Fund 2 | | | 5,966 | | | | 84,538 | |
| Pioneer Diversified High Income Trust | | | 5,500 | | | | 79,750 | |
| | | | | | | | | |
| Total Closed-End Mutual Funds | | | | | | | | |
| (Cost $1,515,984) | | | | | | | 1,556,127 | |
| | | | | | | | | |
Underlying Security/Expiration Date/Exercise
Price/ Notional Amount | | Contracts | | | Value | |
| Purchased Put Options (0.05%) | | | | | | | | |
S&P 500® Index
11/15/19, 2,750, $2,976,740 | | | 10 | | | | 15,300 | |
| Total Purchased Put Options | | | | | | | | |
| (Cost $48,919) | | | | | | | 15,300 | |
| | | | | | | | | |
| Total Investments (98.35%) | | | | | | | | |
| (Cost $24,719,080) | | | | | | $ | 27,102,569 | |
| | | | | | | | | |
| Other Assets Less Liabilities (1.65%) | | | | | | | 454,672 | |
| | | | | | | | | |
| Net Assets (100.00%) | | | | | | $ | 27,557,241 | |
| The accompanying notes are an integral part of the financial statements. | |
| 28 | www.iconfunds.com |
| ICON Risk-Managed Balanced Fund | Schedule of Investments |
| | September 30, 2019 |
Investment Abbreviations:
LIBOR - London Interbank Offered Rate
LIBOR Rates:
3M US L - 3 Month LIBOR as of September 30, 2019 was 2.09%
| (a) | Security was purchased pursuant to Rule 144A or Section 4(a)(2) under the Securities Act of 1933 and may be resold in transactions exempt from registration only to qualified institutional buyers. As of September 30, 2019, these securities had a total aggregate market value of $3,272,739. |
| (b) | Floating or variable rate security. The reference rate is described above. The rate in effect as of September 30, 2019 is based on the reference rate plus the displayed spread as of the security’s last reset date. |
| (c) | This security has no contractual maturity date, is not redeemable and contractually pays an indefinite stream of interest. |
| (d) | Non-income producing security. |
| Sector Composition(September 30, 2019) | | | | |
| | | | | |
| Financials | | | 20.78 | % |
| Consumer Discretionary | | | 18.84 | % |
| Industrials | | | 17.64 | % |
| Health Care | | | 8.08 | % |
| Materials | | | 7.16 | % |
| Information Technology | | | 6.53 | % |
| Energy | | | 6.31 | % |
| Communication Services | | | 4.92 | % |
| Consumer Staples | | | 2.39 | % |
| | | | 92.65 | % |
Percentages are based upon corporate bonds, common stocks and preferred stocks as a percentage of net assets.
| Industry Composition(September 30, 2019) | | | | |
| | | | | |
| Building Products | | | 6.67 | % |
| Data Processing & Outsourced Services | | | 6.53 | % |
| Life & Health Insurance | | | 6.49 | % |
| Diversified Banks | | | 6.09 | % |
| Paper Packaging | | | 5.34 | % |
| Aerospace & Defense | | | 5.14 | % |
| Regional Banks | | | 5.04 | % |
| Life Sciences Tools & Services | | | 4.45 | % |
| Railroads | | | 3.45 | % |
| Hotels, Resorts & Cruise Lines | | | 2.79 | % |
| Oil & Gas Storage & Transportation | | | 2.69 | % |
| Interactive Media & Services | | | 2.62 | % |
| Consumer Discretionary | | | 2.60 | % |
| Footwear | | | 2.59 | % |
| Internet & Direct Marketing Retail | | | 2.55 | % |
| Oil & Gas Exploration & Production | | | 2.49 | % |
| Financials | | | 2.34 | % |
| Homebuilding | | | 2.10 | % |
| Automotive Retail | | | 1.62 | % |
| Leisure Products | | | 1.45 | % |
| Trading Companies & Distributors | | | 1.44 | % |
| Restaurants | | | 1.42 | % |
| Construction Materials | | | 1.41 | % |
| Biotechnology | | | 1.25 | % |
| Health Care Services | | | 1.24 | % |
| Oil & Gas Refining & Marketing | | | 1.13 | % |
| Auto Parts & Equipment | | | 1.12 | % |
| Other Industries (each less than 1%) | | | 8.60 | % |
| | | | 92.65 | % |
Percentages are based upon corporate bonds, common stocks and preferred stocks as a percentage of net assets.
| The accompanying notes are an integral part of the financial statements. | |
| Annual Report | September 30, 2019 | 29 |
| ICON Risk-Managed Balanced Fund | Schedule of Investments |
| | September 30, 2019 |
| Credit Diversification(September 30, 2019) | | | | |
| | | | | |
| Baa2 | | | 7.23 | % |
| Ba2 | | | 2.48 | % |
| NR* | | | 2.47 | % |
| Baa3 | | | 2.12 | % |
| Ba1 | | | 1.85 | % |
| B2 | | | 1.24 | % |
| B1 | | | 0.98 | % |
| Baa1 | | | 0.98 | % |
| B3 | | | 0.82 | % |
| Total: | | | 20.17 | % |
Percentages are based upon corporate bond, U.S. Treasury obligations and asset-backed securities investments as a percentage of net assets. Ratings based on Moody’s Investors Service, Inc.
| The accompanying notes are an integral part of the financial statements. | |
| 30 | www.iconfunds.com |
| ICON Diversified Funds | Statements of Assets and Liabilities |
| | September 30, 2019 |
| | ICON Equity Income
Fund | | | ICON Flexible Bond
Fund | | | ICON Fund | |
| Assets | | | | | | | | | | | | |
| Investments, at cost | | $ | 77,225,726 | | | $ | 151,873,408 | | | $ | 32,474,215 | |
| Investments, at value(a) | | | 81,122,834 | | | | 152,685,439 | | | | 42,715,661 | |
| Cash and cash equivalents | | | 384,859 | | | | 2,025,356 | | | | 455,271 | |
| Receivables: | | | | | | | | | | | | |
| Investments sold | | | 127,155 | | | | 2,002,962 | | | | — | |
| Fund shares sold | | | 98,404 | | | | 156,750 | | | | 2,014 | |
| Expense reimbursements due from Adviser | | | 45,964 | | | | 105,625 | | | | 7,911 | |
| Interest | | | 84,695 | | | | 1,899,798 | | | | 148 | |
| Dividends | | | 134,711 | | | | 69,433 | | | | 18,372 | |
| Foreign tax reclaims | | | 11,657 | | | | — | | | | — | |
| Other assets | | | 11,353 | | | | 11,897 | | | | 8,145 | |
| Total assets | | | 82,021,632 | | | | 158,957,260 | | | | 43,207,522 | |
| | | | | | | | | | | | | |
| Liabilities | | | | | | | | | | | | |
| Payables: | | | | | | | | | | | | |
| Payable for collateral received on securities loaned | | | 820,950 | | | | 3,047,450 | | | | 511,675 | |
| Distributions due to shareholders | | | 17,136 | | | | 37,275 | | | | — | |
| Investments purchased | | | — | | | | 1,398,019 | | | | — | |
| Fund shares redeemed | | | 41,256 | | | | 214,954 | | | | 1,680 | |
| Advisory fees | | | 49,672 | | | | 75,467 | | | | 26,210 | |
| Transfer agent fees | | | 43,271 | | | | 58,255 | | | | 25,635 | |
| Fund accounting fees | | | 9,248 | | | | 16,886 | | | | 4,492 | |
| Accrued distribution fees | | | 17,072 | | | | 4,472 | | | | 7,888 | |
| Trustee fees and expenses | | | 2,774 | | | | 5,189 | | | | 1,437 | |
| Administration fees | | | 3,316 | | | | 6,288 | | | | 1,746 | |
| Accrued expenses | | | 39,238 | | | | 53,309 | | | | 29,052 | |
| Total liabilities | | | 1,043,933 | | | | 4,917,564 | | | | 609,815 | |
| Net Assets - all share classes | | $ | 80,977,699 | | | $ | 154,039,696 | | | $ | 42,597,707 | |
| Net Assets - Class S | | $ | 51,852,989 | | | $ | 143,632,508 | | | $ | 27,449,953 | |
| Net Assets - Class C | | $ | 18,272,579 | | | $ | 4,674,554 | | | $ | 7,791,948 | |
| Net Assets - Class A | | $ | 10,852,131 | | | $ | 5,732,634 | | | $ | 7,355,806 | |
| | | | | | | | | | | | | |
| Net Assets Consists of | | | | | | | | | | | | |
| Paid-in capital | | $ | 76,214,158 | | | $ | 156,361,992 | | | $ | 30,173,344 | |
| Total distributable earnings | | | 4,763,541 | | | | (2,322,296 | ) | | | 12,424,363 | |
| Net Assets | | $ | 80,977,699 | | | $ | 154,039,696 | | | $ | 42,597,707 | |
| | | | | | | | | | | | | |
| Shares outstanding (unlimited shares authorized, no par value) | | | | | | | | | | | | |
| Class S | | | 2,880,244 | | | | 15,344,911 | | | | 1,386,192 | |
| Class C | | | 1,005,445 | | | | 497,754 | | | | 460,674 | |
| Class A | | | 604,268 | | | | 615,498 | | | | 397,198 | |
| Net asset value (offering and redemption price per share) | | | | | | | | | | | | |
| Class S | | $ | 18.00 | | | $ | 9.36 | | | $ | 19.80 | |
| Class C | | $ | 18.17 | | | $ | 9.39 | | | $ | 16.91 | |
| Class A | | $ | 17.96 | | | $ | 9.31 | | | $ | 18.52 | |
| Class A maximum offering price (100%/ (100%-maximum sales charge)) of net asset value adjusted to the nearest cent per share | | $ | 19.05 | | | $ | 9.78 | | | $ | 19.65 | |
| | | | | | | | | | | | | |
| (a)Includes securities on loan of | | $ | 3,320,384 | | | $ | 5,132,992 | | | $ | 632,951 | |
| The accompanying notes are an integral part of the financial statements. | |
| Annual Report | September 30, 2019 | 31 |
| ICON Diversified Funds | Statements of Assets and Liabilities |
| | September 30, 2019 |
| | | ICON Long/Short
Fund | | | ICON Opportunities Fund | | | ICON Risk-Managed Balanced Fund | |
| Assets | | | | | | | | | |
| Investments, at cost | | $ | 16,909,461 | | | $ | 14,863,367 | | | $ | 24,719,080 | |
| Investments, at value(a) | | | 20,519,481 | | | | 16,723,780 | | | | 27,102,569 | |
| Cash and cash equivalents | | | 23,187 | | | | — | | | | 414,447 | |
| Receivables: | | | | | | | | | | | | |
| Fund shares sold | | | 6,921 | | | | 69 | | | | 40,364 | |
| Expense reimbursements due from Adviser | | | 16,172 | | | | 4,952 | | | | 16,972 | |
| Interest | | | 6 | | | | 17 | | | | 88,333 | |
| Dividends | | | 10,291 | | | | 10,535 | | | | 16,804 | |
| Other assets | | | 9,035 | | | | 7,953 | | | | 8,688 | |
| Total assets | | | 20,585,093 | | | | 16,747,306 | | | | 27,688,177 | |
| | | | | | | | | | | | | |
| Liabilities | | | | | | | | | | | | |
| Payables: | | | | | | | | | | �� | | |
| Payable for collateral received on securities loaned | | | 1,055 | | | | 173,825 | | | | — | |
| Payable due to custodian | | | — | | | | 4,805 | | | | — | |
| Distributions due to shareholders | | | — | | | | — | | | | 3,563 | |
| Investments purchased | | | — | | | | — | | | | 11,568 | |
| Fund shares redeemed | | | — | | | | 963 | | | | 30,363 | |
| Advisory fees | | | 14,475 | | | | 10,109 | | | | 17,000 | |
| Transfer agent fees | | | 15,199 | | | | 12,212 | | | | 16,711 | |
| Fund accounting fees | | | 2,677 | | | | 2,593 | | | | 4,935 | |
| Accrued distribution fees | | | 3,380 | | | | — | | | | 14,389 | |
| Trustee fees and expenses | | | 698 | | | | 545 | | | | 938 | |
| Administration fees | | | 851 | | | | 674 | | | | 1,133 | |
| Accrued expenses | | | 26,694 | | | | 24,518 | | | | 30,336 | |
| Total liabilities | | | 65,029 | | | | 230,244 | | | | 130,936 | |
| Net Assets - all share classes | | $ | 20,520,064 | | | $ | 16,517,062 | | | $ | 27,557,241 | |
| Net Assets - Class S | | $ | 12,763,865 | | | $ | — | | | $ | 7,678,320 | |
| Net Assets - Class C | | $ | 2,861,938 | | | $ | — | | | $ | 16,906,728 | |
| Net Assets - Class A | | $ | 4,894,261 | | | $ | — | | | $ | 2,972,193 | |
| | | | | | | | | | | | | |
| Net Assets Consists of | | | | | | | | | | | | |
| Paid-in capital | | $ | 16,208,465 | | | $ | 15,876,540 | | | $ | 25,522,744 | |
| Total distributable earnings | | | 4,311,599 | | | | 640,522 | | | | 2,034,497 | |
| Net Assets | | $ | 20,520,064 | | | $ | 16,517,062 | | | $ | 27,557,241 | |
| | | | | | | | | | | | | |
| Shares outstanding (unlimited shares authorized, no par value) | | | | | | | 1,221,977 | | | | | |
| Class S | | | 475,753 | | | | — | | | | 477,362 | |
| Class C | | | 123,942 | | | | — | | | | 1,151,497 | |
| Class A | | | 189,618 | | | | — | | | | 189,412 | |
| Net asset value (offering and redemption price per share) | | | | | | $ | 13.52 | | | | | |
| Class S | | $ | 26.83 | | | $ | — | | | $ | 16.08 | |
| Class C | | $ | 23.09 | | | $ | — | | | $ | 14.68 | |
| Class A | | $ | 25.81 | | | $ | — | | | $ | 15.69 | |
| Class A maximum offering price (100%/ (100%-maximum sales charge)) of net asset value adjusted to the nearest cent per share | | $ | 27.39 | | | $ | — | | | $ | 16.65 | |
| | | | | | | | | | | | | |
| (a)Includes securities on loan of | | $ | 288,742 | | | $ | 573,007 | | | $ | — | |
| The accompanying notes are an integral part of the financial statements. | |
| 32 | www.iconfunds.com |
| ICON Diversified Funds | Statements of Operations |
| | Year Ended September 30, 2019 |
| | | ICON Equity Income Fund | | | ICON Flexible Bond Fund | | | ICON Fund | |
| Investment Income | | | | | | | | | | | | |
| Interest | | $ | 223,968 | | | $ | 3,862,016 | | | $ | 215 | |
| Dividends | | | 2,854,757 | | | | 1,923,696 | | | | 563,867 | |
| Foreign taxes withheld | | | (59,705 | ) | | | — | | | | (7,824 | ) |
| Income from securities lending, net | | | 8,598 | | | | 41,093 | | | | 7,619 | |
| Other income | | | 17,275 | | | | 201,078 | | | | — | |
| Total investment income | | | 3,044,893 | | | | 6,027,883 | | | | 563,877 | |
| | | | | | | | | | | | | |
| Expenses | | | | | | | | | | | | |
| Advisory fees | | | 589,726 | | | | 774,843 | | | | 321,637 | |
| Administration fees | | | 39,318 | | | | 64,570 | | | | 21,440 | |
| Transfer agent fees | | | 123,144 | | | | 134,859 | | | | 72,747 | |
| Distribution fees: | | | | | | | | | | | | |
| Class C | | | 179,099 | | | | 33,320 | | | | 93,287 | |
| Class A | | | 24,738 | | | | 11,391 | | | | 13,971 | |
| Registration fees | | | 45,320 | | | | 49,845 | | | | 42,123 | |
| Audit and tax service expense | | | 18,442 | | | | 18,000 | | | | 16,000 | |
| Fund accounting fees | | | 42,930 | | | | 70,572 | | | | 22,167 | |
| Trustee fees and expenses | | | 25,495 | | | | 40,550 | | | | 14,110 | |
| Insurance expense | | | 8,648 | | | | 10,841 | | | | 5,502 | |
| Custody fees | | | 6,983 | | | | 13,481 | | | | 4,034 | |
| Printing fees | | | 18,016 | | | | 19,408 | | | | 8,742 | |
| Interest expense | | | 1,029 | | | | 702 | | | | 1,765 | |
| Other expenses | | | 38,976 | | | | 59,996 | | | | 23,955 | |
| Total expenses before expense reimbursement | | | 1,161,864 | | | | 1,302,378 | | | | 661,480 | |
| Expense reimbursement by Adviser due to expense limitation agreement | | | (178,284 | ) | | | (286,844 | ) | | | (25,082 | ) |
| Net Expenses | | | 983,580 | | | | 1,015,534 | | | | 636,398 | |
| Net Investment Income/(Loss) | | | 2,061,313 | | | | 5,012,349 | | | | (72,521 | ) |
| | | | | | | | | | | | | |
| Realized and Unrealized Gain/(Loss) | | | | | | | | | | | | |
| Net realized gain/(loss) on: | | | | | | | | | | | | |
| Investments, options and foreign currency translations | | | 784,773 | | | | 867,501 | | | | 2,782,540 | |
| Long-term capital gain distributions from other investment companies | | | 1,745 | | | | — | | | | — | |
| | | | 786,518 | | | | 867,501 | | | | 2,782,540 | |
| Change in unrealized net appreciation/(depreciation) on: | | | | | | | | | | | | |
| Investments, options and foreign currency | | | (482,995 | ) | | | 1,919,858 | | | | (2,941,213 | ) |
| | | | (482,995 | ) | | | 1,919,858 | | | | (2,941,213 | ) |
| Net realized and unrealized gain/(loss) | | | 303,523 | | | | 2,787,359 | | | | (158,673 | ) |
| Net Increase/(Decrease) in Net Assets Resulting From Operations | | $ | 2,364,836 | | | $ | 7,799,708 | | | $ | (231,194 | ) |
| The accompanying notes are an integral part of the financial statements. | |
| Annual Report | September 30, 2019 | 33 |
| ICON Diversified Funds | Statements of Operations |
| | Year Ended September 30, 2019 |
| | | ICON Long/Short Fund | | | ICON Opportunities Fun | | | ICON Risk-Managed Balanced Fund | |
| Investment Income | | | | | | | | | | | | |
| Interest | | $ | — | | | $ | 62 | | | $ | 253,981 | |
| Dividends | | | 247,129 | | | | 124,308 | | | | 400,548 | |
| Foreign taxes withheld | | | (1,603 | ) | | | — | | | | (1,097 | ) |
| Income from securities lending, net | | | 3,856 | | | | 6,649 | | | | 816 | |
| Other income | | | — | | | | — | | | | 9,024 | |
| Total investment income | | | 249,382 | | | | 131,019 | | | | 663,272 | |
| | | | | | | | | | | | | |
| Expenses | | | | | | | | | | | | |
| Advisory fees | | | 179,360 | | | | 128,327 | | | | 210,790 | |
| Administration fees | | | 10,550 | | | | 8,554 | | | | 14,053 | |
| Transfer agent fees | | | 51,224 | | | | 37,738 | | | | 56,899 | |
| Distribution fees: | | | | | | | | | | | | |
| Class C | | | 37,954 | | | | — | | | | 158,327 | |
| Class A | | | 11,730 | | | | — | | | | 9,135 | |
| Registration fees | | | 43,391 | | | | 18,175 | | | | 44,039 | |
| Audit and tax service expense | | | 17,500 | | | | 16,000 | | | | 19,500 | |
| Fund accounting fees | | | 11,758 | | | | 10,465 | | | | 18,561 | |
| Trustee fees and expenses | | | 7,017 | | | | 5,689 | | | | 9,209 | |
| Insurance expense | | | 3,016 | | | | 2,391 | | | | 3,344 | |
| Custody fees | | | 3,348 | | | | 3,255 | | | | 4,559 | |
| Printing fees | | | 6,281 | | | | 5,809 | | | | 7,947 | |
| Interest expense | | | 3,190 | | | | 840 | | | | — | |
| Recoupment of previously reimbursed expenses | | | — | | | | 748 | | | | — | |
| Other expenses | | | 15,039 | | | | 11,453 | | | | 16,530 | |
| Total expenses before expense reimbursement | | | 401,358 | | | | 249,444 | | | | 572,893 | |
| Expense reimbursement by Adviser due to expense limitation agreement | | | (80,910 | ) | | | (26,483 | ) | | | (68,339 | ) |
| Net Expenses | | | 320,448 | | | | 222,961 | | | | 504,554 | |
| Net Investment Income/(Loss) | | | (71,066 | ) | | | (91,942 | ) | | | 158,718 | |
| | | | | | | | | | | | | |
| Realized and Unrealized Gain/(Loss) | | | | | | | | | | | | |
| Net realized gain/(loss) on: | | | | | | | | | | | | |
| Investments, options and foreign currency translations | | | 1,069,156 | | | | (779,754 | ) | | | (307,365 | ) |
| Long-term capital gain distributions from other investment companies | | | — | | | | — | | | | 12,872 | |
| | | | 1,069,156 | | | | (779,754 | ) | | | (294,493 | ) |
| Change in unrealized net appreciation/(depreciation) on: | | | | | | | | | | | | |
| Investments, options and foreign currency | | | (2,025,675 | ) | | | (887,557 | ) | | | (413,120 | ) |
| | | | (2,025,675 | ) | | | (887,557 | ) | | | (413,120 | ) |
| Net realized and unrealized gain/(loss) | | | (956,519 | ) | | | (1,667,311 | ) | | | (707,613 | ) |
| Net Increase/(Decrease) in Net Assets Resulting From Operations | | $ | (1,027,585 | ) | | $ | (1,759,253 | ) | | $ | (548,895 | ) |
| The accompanying notes are an integral part of the financial statements. | |
| 34 | www.iconfunds.com |
| ICON Diversified Funds | Statements of Changes in Net Assets |
| | | | ICON Equity Income Fund | | | | ICON Flexible Bond Fund | |
| | | | Year Ended | | | | Year Ended | | | | Year Ended | | | | Year Ended | |
| | | | September 30, 2019 | | | | September 30, 2018 | | | | September 30, 2019 | | | | September 30, 2018(a) | |
| Operations | | | | | | | | | | | | | | | | |
| Net investment income/(loss) | | $ | 2,061,313 | | | $ | 2,241,678 | | | $ | 5,012,349 | | | $ | 3,522,028 | |
| Net realized gain/(loss) | | | 784,773 | | | | 3,050,654 | | | | 867,501 | | | | (877,235 | ) |
| Net realized gain/(loss) on long-term capital gain distributions from other investment companies | | | 1,745 | | | | — | | | | — | | | | — | |
| Change in net unrealized appreciation/(depreciation) | | | (482,995 | ) | | | (979,199 | ) | | | 1,919,858 | | | | (931,423 | ) |
| Net increase/(decrease) in net assets resulting from operations | | | 2,364,836 | | | | 4,313,133 | | | | 7,799,708 | | | | 1,713,370 | |
| | | | | | | | | | | | | | | | | |
| Total Dividends and Distributions to Shareholders | | | | | | | | | | | | | | | | |
| Class S | | | (1,555,574 | ) | | | (1,607,191 | ) | | | (5,760,922 | ) | | | (3,164,850 | ) |
| Class C | | | (368,185 | ) | | | (342,652 | ) | | | (154,050 | ) | | | (100,341 | ) |
| Class A | | | (282,374 | ) | | | (365,825 | ) | | | (207,550 | ) | | | (125,245 | ) |
| Net decrease from dividends and distributions | | | (2,206,133 | ) | | | (2,315,668 | ) | | | (6,122,522 | ) | | | (3,390,436 | ) |
| | | | | | | | | | | | | | | | | |
| Fund Share Transactions | | | | | | | | | | | | | | | | |
| Shares sold | | | | | | | | | | | | | | | | |
| Class S | | | 17,828,923 | | | | 14,018,260 | | | | 81,218,276 | | | | 36,821,738 | |
| Class C | | | 3,726,772 | | | | 3,350,835 | | | | 2,266,664 | | | | 585,449 | |
| Class A | | | 3,328,557 | | | | 2,012,996 | | | | 2,504,061 | | | | 993,823 | |
| Reinvested dividends and distributions | | | | | | | | | | | | | | | | |
| Class S | | | 1,487,328 | | | | 1,536,440 | | | | 5,335,911 | | | | 2,912,727 | |
| Class C | | | 343,543 | | | | 310,512 | | | | 132,038 | | | | 85,079 | |
| Class A | | | 247,336 | | | | 310,987 | | | | 194,232 | | | | 115,309 | |
| Shares repurchased | | | | | | | | | | | | | | | | |
| Class S | | | (18,671,913 | ) | | | (22,765,862 | ) | | | (41,792,561 | ) | | | (21,361,079 | ) |
| Class C | | | (3,349,884 | ) | | | (2,388,940 | ) | | | (1,048,934 | ) | | | (1,067,548 | ) |
| Class A | | | (3,451,831 | ) | | | (6,198,082 | ) | | | (707,527 | ) | | | (1,212,911 | ) |
| Net increase/(decrease) from fund share transactions | | | 1,488,831 | | | | (9,812,854 | ) | | | 48,102,160 | | | | 17,872,587 | |
| | | | | | | | | | | | | | | | | |
| Total net increase/(decrease) in net assets | | | 1,647,534 | | | | (7,815,389 | ) | | | 49,779,346 | | | | 16,195,521 | |
| | | | | | | | | | | | | | | | | |
| Net Assets | | | | | | | | | | | | | | | | |
| Beginning of year | | | 79,330,165 | | | | 87,145,554 | | | | 104,260,350 | | | | 88,064,829 | |
| End of year | | $ | 80,977,699 | | | $ | 79,330,165 | | | $ | 154,039,696 | | | $ | 104,260,350 | |
| | | | | | | | | | | | | | | | | |
| Transactions in Fund Shares | | | | | | | | | | | | | | | | |
| Shares sold | | | | | | | | | | | | | | | | |
| Class S | | | 1,023,897 | | | | 771,961 | | | | 8,777,894 | | | | 3,961,759 | |
| Class C | | | 211,997 | | | | 183,047 | | | | 243,879 | | | | 62,589 | |
| Class A | | | 193,061 | | | | 111,347 | | | | 271,269 | | | | 107,547 | |
| Issued to shareholders in reinvestment of distributions | | | | | | | | | | | | | | | | |
| Class S | | | 87,302 | | | | 85,666 | | | | 575,324 | | | | 313,069 | |
| Class C | | | 20,165 | | | | 17,162 | | | | 14,191 | | | | 9,103 | |
| Class A | | | 14,587 | | | | 17,383 | | | | 21,050 | | | | 12,448 | |
| Shares repurchased | | | | | | | | | | | | | | | | |
| Class S | | | (1,080,145 | ) | | | (1,249,425 | ) | | | (4,515,936 | ) | | | (2,296,036 | ) |
| Class C | | | (189,853 | ) | | | (130,988 | ) | | | (112,492 | ) | | | (114,075 | ) |
| Class A | | | (199,576 | ) | | | (341,407 | ) | | | (76,734 | ) | | | (130,931 | ) |
| Net increase/(decrease) | | | 81,435 | | | | (535,254 | ) | | | 5,198,445 | | | | 1,925,473 | |
| Shares outstanding, beginning of year | | | 4,408,522 | | | | 4,943,776 | | | | 11,259,718 | | | | 9,334,245 | |
| Shares outstanding, end of year | | | 4,489,957 | | | | 4,408,522 | | | | 16,458,163 | | | | 11,259,718 | |
| (a) | Prior to January 23, 2018, the ICON Flexible Bond Fund was known as the ICON Bond Fund. |
| The accompanying notes are an integral part of the financial statements. | |
| Annual Report | September 30, 2019 | 35 |
| ICON Diversified Funds | Statements of Changes in Net Assets |
| | | ICON Fund | | | ICON Long/Short Fund | |
| | | Year Ended | | | Year Ended | | | Year Ended | | | Year Ended | |
| | | September 30, 2019 | | | September 30, 2018 | | | September 30, 2019 | | | September 30, 2018 | |
| Operations | | | | | | | | | | | | |
| Net investment income/(loss) | | $ | (72,521 | ) | | $ | (226,954 | ) | | $ | (71,066 | ) | | $ | (131,995 | ) |
| Net realized gain/(loss) | | | 2,782,540 | | | | 3,356,674 | | | | 1,069,156 | | | | 1,840,083 | |
| Change in net unrealized appreciation/(depreciation) | | | (2,941,213 | ) | | | 32,995 | | | | (2,025,675 | ) | | | 61,132 | |
| Net increase/(decrease) in net assets resulting from operations | | | (231,194 | ) | | | 3,162,715 | | | | (1,027,585 | ) | | | 1,769,220 | |
| | | | | | | | | | | | | | | | | |
| Total Dividends and Distributions to Shareholders | | | | | | | | | | | | | | | | |
| Class S | | | (340,838 | ) | | | — | | | | (171,949 | ) | | | — | |
| Class C | | | (140,023 | ) | | | — | | | | (71,048 | ) | | | — | |
| Class A | | | (60,635 | ) | | | — | | | | (69,039 | ) | | | — | |
| Net decrease from dividends and distributions | | | (541,496 | ) | | | — | | | | (312,036 | ) | | | — | |
| | | | | | | | | | | | | | | | | |
| Fund Share Transactions | | | | | | | | | | | | | | | | |
| Shares sold | | | | | | | | | | | | | | | | |
| Class S | | | 1,077,421 | | | | 3,873,962 | | | | 6,025,489 | | | | 10,816,178 | |
| Class C | | | 372,023 | | | | 547,780 | | | | 147,661 | | | | 761,410 | |
| Class A | | | 2,886,856 | | | | 1,140,529 | | | | 1,338,348 | | | | 2,733,365 | |
| Reinvested dividends and distributions | | | | | | | | | | | | | | | | |
| Class S | | | 333,895 | | | | — | | | | 158,276 | | | | — | |
| Class C | | | 134,838 | | | | — | | | | 68,168 | | | | — | |
| Class A | | | 60,060 | | | | — | | | | 61,419 | | | | — | |
| Shares repurchased | | | | | | | | | | | | | | | | |
| Class S | | | (6,071,506 | ) | | | (6,326,048 | ) | | | (10,957,390 | ) | | | (4,397,179 | ) |
| Class C | | | (3,720,792 | ) | | | (2,476,705 | ) | | | (2,149,420 | ) | | | (711,148 | ) |
| Class A | | | (1,140,854 | ) | | | (1,186,452 | ) | | | (1,800,039 | ) | | | (4,937,947 | ) |
| Net increase/(decrease) from fund share transactions | | | (6,068,059 | ) | | | (4,426,934 | ) | | | (7,107,488 | ) | | | 4,264,679 | |
| | | | | | | | | | | | | | | | | |
| Total net increase/(decrease) in net assets | | | (6,840,749 | ) | | | (1,264,219 | ) | | | (8,447,109 | ) | | | 6,033,899 | |
| | | | | | | | | | | | | | | | | |
| Net Assets | | | | | | | | | | | | | | | | |
| Beginning of year | | | 49,438,456 | | | | 50,702,675 | | | | 28,967,173 | | | | 22,933,274 | |
| End of year | | $ | 42,597,707 | | | $ | 49,438,456 | | | $ | 20,520,064 | | | $ | 28,967,173 | |
| | | | | | | | | | | | | | | | | |
| Transactions in Fund Shares | | | | | | | | | | | | | | | | |
| Shares sold | | | | | | | | | | | | | | | | |
| Class S | | | 57,310 | | | | 192,622 | | | | 235,961 | | | | 399,467 | |
| Class C | | | 22,981 | | | | 31,789 | | | | 7,566 | | | | 32,406 | |
| Class A | | | 169,233 | | | | 59,973 | | | | 55,777 | | | | 103,610 | |
| Issued to shareholders in reinvestment of distributions | | | | | | | | | | | | | | | | |
| Class S | | | 21,159 | | | | — | | | | 7,355 | | | | — | |
| Class C | | | 9,922 | | | | — | | | | 3,651 | | | | — | |
| Class A | | | 4,064 | | | | — | | | | 2,960 | | | | — | |
| Shares repurchased | | | | | | | | | | | | | | | | |
| Class S | | | (330,003 | ) | | | (315,297 | ) | | | (453,031 | ) | | | (162,050 | ) |
| Class C | | | (237,635 | ) | | | (141,244 | ) | | | (100,419 | ) | | | (30,287 | ) |
| Class A | | | (65,537 | ) | | | (63,542 | ) | | | (73,637 | ) | | | (186,954 | ) |
| Net increase/(decrease) | | | (348,506 | ) | | | (235,699 | ) | | | (313,817 | ) | | | 156,192 | |
| Shares outstanding, beginning of year | | | 2,592,570 | | | | 2,828,269 | | | | 1,103,130 | | | | 946,938 | |
| Shares outstanding, end of year | | | 2,244,064 | | | | 2,592,570 | | | | 789,313 | | | | 1,103,130 | |
| The accompanying notes are an integral part of the financial statements. | |
| 36 | www.iconfunds.com |
| ICON Diversified Funds | Statements of Changes in Net Assets |
| | | ICON Opportunities Fund | | | ICON Risk-Managed Balanced Fund | |
| | | Year Ended | | | Year Ended | | | Year Ended | | | Year Ended | |
| | | September 30, 2019 | | | September 30, 2018 | | | September 30, 2019 | | | September 30, 2018 | |
| Operations | | | | | | | | | | | | |
| Net investment income/(loss) | | $ | (91,942 | ) | | $ | (166,742 | ) | | $ | 158,718 | | | $ | 159,711 | |
| Net realized gain/(loss) | | | (779,754 | ) | | | 3,637,781 | | | | (307,365 | ) | | | 783,256 | |
| Net realized gain/(loss) on long-term capital gain distributions from other investment companies | | | — | | | | — | | | | 12,872 | | | | — | |
| Change in net unrealized appreciation/(depreciation) | | | (887,557 | ) | | | (2,599,824 | ) | | | (413,120 | ) | | | 440,875 | |
| Net increase/(decrease) in net assets resulting from operations | | | (1,759,253 | ) | | | 871,215 | | | | (548,895 | ) | | | 1,383,842 | |
| | | | | | | | | | | | | | | | | |
| Total Dividends and Distributions to Shareholders | | | | | | | | | | | | | | | | |
| Dividends and distributions | | | (3,835,809 | ) | | | (307,810 | ) | | | | | | | | |
| Class S | | | — | | | | — | | | | (109,704 | ) | | | (101,832 | ) |
| Class C | | | — | | | | — | | | | (75,982 | ) | | | (23,510 | ) |
| Class A | | | — | | | | — | | | | (37,262 | ) | | | (41,068 | ) |
| Net decrease from dividends and distributions | | | (3,835,809 | ) | | | (307,810 | ) | | | (222,948 | ) | | | (166,410 | ) |
| | | | | | | | | | | | | | | | | |
| Fund Share Transactions | | | | | | | | | | | | | | | | |
| Shares sold | | | 1,522,617 | | | | 8,215,056 | | | | | | | | | |
| Class S | | | — | | | | — | | | | 1,415,642 | | | | 3,005,177 | |
| Class C | | | — | | | | — | | | | 3,838,315 | | | | 3,137,593 | |
| Class A | | | — | | | | — | | | | 326,959 | | | | 1,309,983 | |
| Reinvested dividends and distributions | | | 3,766,343 | | | | 305,435 | | | | | | | | | |
| Class S | | | — | | | | — | | | | 103,308 | | | | 94,076 | |
| Class C | | | — | | | | — | | | | 73,477 | | | | 21,452 | |
| Class A | | | — | | | | — | | | | 32,895 | | | | 38,578 | |
| Shares repurchased | | | (4,261,245 | ) | | | (7,368,889 | ) | | | | | | | | |
| Class S | | | — | | | | — | | | | (4,210,662 | ) | | | (8,100,020 | ) |
| Class C | | | — | | | | — | | | | (3,101,074 | ) | | | (3,902,945 | ) |
| Class A | | | — | | | | — | | | | (2,083,696 | ) | | | (3,826,965 | ) |
| Net increase/(decrease) from fund share transactions | | | 1,027,715 | | | | 1,151,602 | | | | (3,604,836 | ) | | | (8,223,071 | ) |
| | | | | | | | | | | | | | | | | |
| Total net increase/(decrease) in net assets | | | (4,567,347 | ) | | | 1,715,007 | | | | (4,376,679 | ) | | | (7,005,639 | ) |
| | | | | | | | | | | | | | | | | |
| Net Assets | | | | | | | | | | | | | | | | |
| Beginning of year | | | 21,084,409 | | | | 19,369,402 | | | | 31,933,920 | | | | 38,939,559 | |
| End of year | | $ | 16,517,062 | | | $ | 21,084,409 | | | $ | 27,557,241 | | | $ | 31,933,920 | |
| | | | | | | | | | | | | | | | | |
| Transactions in Fund Shares | | | | | | | | | | | | | | | | |
| Shares sold | | | 112,589 | | | | 417,657 | | | | | | | | | |
| Class S | | | — | | | | — | | | | 90,648 | | | | 185,151 | |
| Class C | | | — | | | | — | | | | 268,269 | | | | 214,005 | |
| Class A | | | — | | | | — | | | | 22,068 | | | | 83,430 | |
| Issued to shareholders in reinvestment of distributions | | | 340,230 | | | | 15,481 | | | | | | | | | |
| Class S | | | — | | | | — | | | | 6,794 | | | | 5,890 | |
| Class C | | | — | | | | — | | | | 5,267 | | | | 1,468 | |
| Class A | | | — | | | | — | | | | 2,215 | | | | 2,482 | |
| Shares repurchased | | | (311,733 | ) | | | (377,941 | ) | | | | | | | | |
| Class S | | | — | | | | — | | | | (274,115 | ) | | | (507,106 | ) |
| Class C | | | — | | | | — | | | | (221,774 | ) | | | (265,702 | ) |
| Class A | | | — | | | | — | | | | (139,322 | ) | | | (242,735 | ) |
| Net increase/(decrease) | | | 141,086 | | | | 55,197 | | | | (239,950 | ) | | | (523,117 | ) |
| Shares outstanding, beginning of year | | | 1,080,891 | | | | 1,025,694 | | | | 2,058,221 | | | | 2,581,338 | |
| Shares outstanding, end of year | | | 1,221,977 | | | | 1,080,891 | | | | 1,818,271 | | | | 2,058,221 | |
| The accompanying notes are an integral part of the financial statements. | |
| Annual Report | September 30, 2019 | 37 |
| ICON Equity Income Fund | Financial Highlights |
| | For a Share Outstanding Throughout the Years Presented |
| | | Year Ended | | | Year Ended | | | Year Ended | | | Year Ended | | | Year Ended | |
| Class S | | | September 30, 2019 | | | | September 30, 2018 | | | | September 30, 2017 | | | | September 30, 2016 | | | September 30, 2015 | |
| Net asset value, beginning of period | | $ | 17.96 | | | $ | 17.61 | | | $ | 15.62 | | | $ | 14.36 | | | $ | 14.87 | |
| Income/(loss) from investment operations: | | | | | | | | | | | | | | | | | | | | |
| Net investment income/(loss)(a) | | | 0.50 | | | | 0.53 | | | | 0.61 | | | | 0.60 | | | | 0.56 | |
| Net realized and unrealized gains/(losses) on investments | | | 0.09 | | | | 0.38 | | | | 1.95 | | | | 1.27 | | | | (0.56 | ) |
| Total from investment operations | | | 0.59 | | | | 0.91 | | | | 2.56 | | | | 1.87 | | | | (0.00 | )(b) |
| | | | | | | | | | | | | | | | | | | | | |
| Less dividends and distributions: | | | | | | | | | | | | | | | | | | | | |
| Dividends from net investment income | | | (0.53 | ) | | | (0.56 | ) | | | (0.57 | ) | | | (0.61 | ) | | | (0.51 | ) |
| Distributions from net realized gains | | | (0.02 | ) | | | — | | | | — | | | | — | | | | — | |
| Total dividends and distributions | | | (0.55 | ) | | | (0.56 | ) | | | (0.57 | ) | | | (0.61 | ) | | | (0.51 | ) |
| | | | | | | | | | | | | | | | | | | | | |
| Net asset value, end of period | | $ | 18.00 | | | $ | 17.96 | | | $ | 17.61 | | | $ | 15.62 | | | $ | 14.36 | |
| | | | | | | | | | | | | | | | | | | | | |
| Total Return | | | 3.45 | % | | | 5.19 | % | | | 16.53 | % | | | 13.30 | % | | | (0.17 | )% |
| | | | | | | | | | | | | | | | | | | | | |
| Ratios and Supplemental Data | | | | | | | | | | | | | | | | | | | | |
| Net assets, end of period (in 000s) | | $ | 51,853 | | | $ | 51,185 | | | $ | 57,062 | | | $ | 37,868 | | | $ | 22,779 | |
| | | | | | | | | | | | | | | | | | | | | |
| Ratio of expenses to average net assets | | | | | | | | | | | | | | | | | | | | |
| Before expense limitation | | | 1.21 | % | | | 1.16 | % | | | 1.15 | % | | | 1.24 | % | | | 1.25 | % |
| After expense limitation(c) | | | 0.99 | % | | | 0.99 | % | | | 1.05 | %(d) | | | 1.20 | % | | | 1.20 | % |
| Ratio of net investment income/(loss) to average net assets | | | | | | | | | | | | | | | | | | | | |
| Before expense limitation | | | 2.66 | % | | | 2.76 | % | | | 3.50 | % | | | 3.91 | % | | | 3.52 | % |
| After expense limitation(c) | | | 2.88 | % | | | 2.93 | % | | | 3.60 | % | | | 3.95 | % | | | 3.57 | % |
| Portfolio turnover rate | | | 117 | % | | | 171 | % | | | 206 | % | | | 145 | % | | | 174 | % |
| (a) | Calculated using the average shares method. |
| (b) | Amount less than $(0.005). |
| (c) | The Fund’s operating expenses, not including interest expense, are contractually limited to the amounts discussed in Note 3. The ratios in these financial highlights reflect the limitation, including the interest expense, when applicable. |
| (d) | Effective January 26, 2017, the annual expense limitation rate changed from 1.20% to 0.99%. |
| The accompanying notes are an integral part of the financial statements. | |
| 38 | www.iconfunds.com |
| ICON Equity Income Fund | Financial Highlights |
| | For a Share Outstanding Throughout the Years Presented |
| | Year Ended | | Year Ended | | Year Ended | | Year Ended | | Year Ended | |
| Class C | September 30, 2019 | | September 30, 2018 | | September 30, 2017 | | September 30, 2016 | | September 30, 2015 | |
| Net asset value, beginning of period | $ | 18.13 | | $ | 17.76 | | $ | 15.76 | | $ | 14.45 | | $ | 14.96 | |
| Income/(loss) from investment operations: | | | | | | | | | | | | | | | |
| Net investment income/(loss)(a) | | 0.33 | | | 0.36 | | | 0.45 | | | 0.45 | | | 0.40 | |
| Net realized and unrealized gains/(losses) on investments | | 0.08 | | | 0.38 | | | 1.95 | | | 1.28 | | | (0.56 | ) |
| Total from investment operations | | 0.41 | | | 0.74 | | | 2.40 | | | 1.73 | | | (0.16 | ) |
| | | | | | | | | | | | | | | | |
| Less dividends and distributions: | | | | | | | | | | | | | | | |
| Dividends from net investment income | | (0.35 | ) | | (0.37 | ) | | (0.40 | ) | | (0.42 | ) | | (0.35 | ) |
| Distributions from net realized gains | | (0.02 | ) | | — | | | — | | | — | | | — | |
| Total dividends and distributions | | (0.37 | ) | | (0.37 | ) | | (0.40 | ) | | (0.42 | ) | | (0.35 | ) |
| | | | | | | | | | | | | | | | |
| Net asset value, end of period | $ | 18.17 | | $ | 18.13 | | $ | 17.76 | | $ | 15.76 | | $ | 14.45 | |
| | | | | | | | | | | | | | | | |
| Total Return(b) | | 2.38 | % | | 4.21% | | | 15.34 | % | | 12.15 | % | | (1.16 | )% |
| | | | | | | | | | | | | | | | |
| Ratios and Supplemental Data | | | | | | | | | | | | | | | |
| Net assets, end of period (in 000s) | $ | 18,273 | | $ | 17,460 | | $ | 15,878 | | $ | 10,532 | | $ | 6,825 | |
| | | | | | | | | | | | | | | | |
| Ratio of expenses to average net assets | | | | | | | | | | | | | | | |
| Before expense limitation | | 2.22 | % | | 2.17 | % | | 2.20 | % | | 2.34 | % | | 2.34 | % |
| After expense limitation(c) | | 1.99 | % | | 1.99 | % | | 2.05 | %(d) | | 2.20 | % | | 2.20 | % |
| Ratio of net investment income/(loss) to average net assets | | | | | | | | | | | | | | | |
| Before expense limitation | | 1.65 | % | | 1.81 | % | | 2.49 | % | | 2.80 | % | | 2.40 | % |
| After expense limitation(c) | | 1.88 | % | | 1.99 | % | | 2.64 | % | | 2.94 | % | | 2.54 | % |
| Portfolio turnover rate | | 117 | % | | 171 | % | | 206 | % | | 145 | % | | 174 | % |
| (a) | Calculated using the average shares method. |
| (b) | The total return calculation excludes any sales charges. |
| (c) | The Fund’s operating expenses, not including interest expense, are contractually limited to the amounts discussed in Note 3. The ratios in these financial highlights reflect the limitation, including the interest expense, when applicable. |
| (d) | Effective January 26, 2017, the annual expense limitation rate changed from 2.20% to 1.99%. |
| The accompanying notes are an integral part of the financial statements. | |
| Annual Report | September 30, 2019 | 39 |
| ICON Equity Income Fund | Financial Highlights |
| | For a Share Outstanding Throughout the Years Presented |
| | | Year Ended | | | Year Ended | | | Year Ended | | | Year Ended | | | Year Ended | |
| Class A | | September 30, 2019 | | | September 30, 2018 | | | September 30, 2017 | | | September 30, 2016 | | | September 30, 2015 | |
| Net asset value, beginning of period | | $ | 17.92 | | | $ | 17.56 | | | $ | 15.58 | | | $ | 14.29 | | | $ | 14.79 | |
| Income/(loss) from investment operations: | | | | | | | | | | | | | | | | | | | | |
| Net investment income/(loss)(a) | | | 0.46 | | | | 0.49 | | | | 0.54 | | | | 0.56 | | | | 0.50 | |
| Net realized and unrealized gains/(losses) on investments | | | 0.08 | | | | 0.38 | | | | 1.96 | | | | 1.26 | | | | (0.53 | ) |
| Total from investment operations | | | 0.54 | | | | 0.87 | | | | 2.50 | | | | 1.82 | | | | (0.03 | ) |
| | | | | | | | | | | | | | | | | | | | | |
| Less dividends and distributions: | | | | | | | | | | | | | | | | | | | | |
| Dividends from net investment income | | | (0.48 | ) | | | (0.51 | ) | | | (0.52 | ) | | | (0.53 | ) | | | (0.47 | ) |
| Distributions from net realized gains | | | (0.02 | ) | | | — | | | | — | | | | — | | | | — | |
| Total dividends and distributions | | | (0.50 | ) | | | (0.51 | ) | | | (0.52 | ) | | | (0.53 | ) | | | (0.47 | ) |
| | | | | | | | | | | | | | | | | | | | | |
| Net asset value, end of period | | $ | 17.96 | | | $ | 17.92 | | | $ | 17.56 | | | $ | 15.58 | | | $ | 14.29 | |
| | | | | | | | | | | | | | | | | | | | | |
| Total Return(b) | | | 3.20 | % | | | 4.98 | % | | | 16.20 | % | | | 12.97 | % | | | (0.38 | )% |
| | | | | | | | | | | | | | | | | | | | | |
| Ratios and Supplemental Data | | | | | | | | | | | | | | | | | | | | |
| Net assets, end of period (in 000s) | | $ | 10,852 | | | $ | 10,685 | | | $ | 14,206 | | | $ | 16,775 | | | $ | 13,039 | |
| | | | | | | | | | | | | | | | | | | | | |
| Ratio of expenses to average net assets | | | | | | | | | | | | | | | | | | | | |
| Before expense limitation | | | 1.50 | % | | | 1.45 | % | | | 1.45 | % | | | 1.54 | % | | | 1.52 | % |
| After expense limitation(c) | | | 1.24 | % | | | 1.24 | % | | | 1.31 | %(d) | | | 1.45 | % | | | 1.45 | % |
| Ratio of net investment income/(loss) to average net assets | | | | | | | | | | | | | | | | | | | | |
| Before expense limitation | | | 2.38 | % | | | 2.48 | % | | | 3.06 | % | | | 3.64 | % | | | 3.14 | % |
| After expense limitation(c) | | | 2.64 | % | | | 2.69 | % | | | 3.20 | % | | | 3.73 | % | | | 3.21 | % |
| Portfolio turnover rate | | | 117 | % | | | 171 | % | | | 206 | % | | | 145 | % | | | 174 | % |
| (a) | Calculated using the average shares method. |
| (b) | The total return calculation excludes any sales charges. |
| (c) | The Fund’s operating expenses, not including interest expense, are contractually limited to the amounts discussed in Note 3. The ratios in these financial highlights reflect the limitation, including the interest expense, when applicable. |
| (d) | Effective January 26, 2017, the annual expense limitation rate changed from 1.45% to 1.24%. |
| The accompanying notes are an integral part of the financial statements. | |
| 40 | www.iconfunds.com |
| ICON Flexible Bond Fund | Financial Highlights |
| | For a Share Outstanding Throughout the Years Presented |
| | | Year Ended | | | Year Ended | | | Year Ended | | | Year Ended | | | Year Ended | |
| Class S | | September 30, 2019 | | | September 30, 2018(a) | | | September 30, 2017 | | | September 30, 2016 | | | September 30, 2015 | |
| Net asset value, beginning of period | | $ | 9.26 | | | $ | 9.43 | | | $ | 9.55 | | | $ | 9.20 | | | $ | 9.90 | |
| Income/(loss) from investment operations: | | | | | | | | | | | | | | | | | | | | |
| Net investment income/(loss)(b) | | | 0.36 | | | | 0.36 | | | | 0.37 | | | | 0.34 | | | | 0.41 | |
| Net realized and unrealized gains/(losses) on investments | | | 0.18 | | | | (0.19 | ) | | | (0.11 | ) | | | 0.34 | | | | (0.44 | ) |
| Total from investment operations | | | 0.54 | | | | 0.17 | | | | 0.26 | | | | 0.68 | | | | (0.03 | ) |
| | | | | | | | | | | | | | | | | | | | | |
| Less dividends and distributions: | | | | | | | | | | | | | | | | | | | | |
| Dividends from net investment income | | | (0.44 | ) | | | (0.34 | ) | | | (0.38 | ) | | | (0.33 | ) | | | (0.51 | ) |
| Distributions from net realized gains | | | — | | | | — | | | | — | | | | — | | | | (0.13 | ) |
| Return of capital | | | — | | | | — | | | | — | | | | — | | | | (0.03 | ) |
| Total dividends and distributions | | | (0.44 | ) | | | (0.34 | ) | | | (0.38 | ) | | | (0.33 | ) | | | (0.67 | ) |
| | | | | | | | | | | | | | | | | | | | | |
| Net asset value, end of period | | $ | 9.36 | | | $ | 9.26 | | | $ | 9.43 | | | $ | 9.55 | | | $ | 9.20 | |
| | | | | | | | | | | | | | | | | | | | | |
| Total Return | | | 6.02 | % | | | 1.89 | % | | | 2.82 | % | | | 7.54 | % | | | (0.28 | )% |
| | | | | | | | | | | | | | | | | | | | | |
| Ratios and Supplemental Data | | | | | | | | | | | | | | | | | | | | |
| Net assets, end of period (in 000s) | | $ | 143,633 | | | $ | 97,303 | | | $ | 80,467 | | | $ | 76,656 | | | $ | 73,152 | |
| | | | | | | | | | | | | | | | | | | | | |
| Ratio of expenses to average net assets | | | | | | | | | | | | | | | | | | | | |
| Before expense limitation | | | 0.96 | % | | | 0.92 | % | | | 0.91 | % | | | 0.93 | % | | | 0.91 | % |
| After expense limitation(c) | | | 0.75 | % | | | 0.75 | % | | | 0.75 | % | | | 0.75 | % | | | 0.75 | % |
| Ratio of net investment income/(loss) to average net assets | | | | | | | | | | | | | | | | | | | | |
| Before expense limitation | | | 3.70 | % | | | 3.65 | % | | | 3.80 | % | | | 3.43 | % | | | 4.10 | |
| After expense limitation(c) | | | 3.91 | % | | | 3.82 | % | | | 3.96 | % | | | 3.61 | % | | | 4.26 | % |
| Portfolio turnover rate | | | 144 | % | | | 153 | % | | | 169 | % | | | 141 | % | | | 153 | % |
| (a) | Prior to January 23, 2018, the ICON Flexible Bond Fund was known as the ICON Bond Fund. |
| (b) | Calculated using the average shares method. |
| (c) | The Fund’s operating expenses, not including interest expense, are contractually limited to the amounts discussed in Note 3. The ratios in these financial highlights reflect the limitation, including the interest expense, when applicable. |
| The accompanying notes are an integral part of the financial statements. | |
| Annual Report | September 30, 2019 | 41 |
| ICON Flexible Bond Fund | Financial Highlights |
| | For a Share Outstanding Throughout the Years Presented |
| | | Year Ended | | | Year Ended | | | Year Ended | | | Year Ended | | | Year Ended | |
| Class C | | September 30, 2019 | | | September 30, 2018(a) | | | September 30, 2017 | | | September 30, 2016 | | | September 30, 2015 | |
| Net asset value, beginning of period | | $ | 9.29 | | | $ | 9.48 | | | $ | 9.58 | | | $ | 9.24 | | | $ | 9.94 | |
| Income/(loss) from investment operations: | | | | | | | | | | | | | | | | | | | | |
| Net investment income/(loss)(b) | | | 0.29 | | | | 0.28 | | | | 0.29 | | | | 0.26 | | | | 0.32 | |
| Net realized and unrealized gains/(losses) on investments | | | 0.18 | | | | (0.19 | ) | | | (0.10 | ) | | | 0.34 | | | | (0.43 | ) |
| Total from investment operations | | | 0.47 | | | | 0.09 | | | | 0.19 | | | | 0.60 | | | | (0.11 | ) |
| | | | | | | | | | | | | | | | | | | | | |
| Less dividends and distributions: | | | | | | | | | | | | | | | | | | | | |
| Dividends from net investment income | | | (0.37 | ) | | | (0.28 | ) | | | (0.29 | ) | | | (0.26 | ) | | | (0.43 | ) |
| Distributions from net realized gains | | | — | | | | — | | | | — | | | | — | | | | (0.13 | ) |
| Return of capital | | | — | | | | — | | | | — | | | | — | | | | (0.03 | ) |
| Total dividends and distributions | | | (0.37 | ) | | | (0.28 | ) | | | (0.29 | ) | | | (0.26 | ) | | | (0.59 | ) |
| | | | | | | | | | | | | | | | | | | | | |
| Net asset value, end of period | | $ | 9.39 | | | $ | 9.29 | | | $ | 9.48 | | | $ | 9.58 | | | $ | 9.24 | |
| | | | | | | | | | | | | | | | | | | | | |
| Total Return(c) | | | 5.12 | % | | | 0.92 | % | | | 2.05 | % | | | 6.59 | % | | | (1.10 | )% |
| | | | | | | | | | | | | | | | | | | | | |
| Ratios and Supplemental Data | | | | | | | | | | | | | | | | | | | | |
| Net assets, end of period (in 000s) | | $ | 4,675 | | | $ | 3,272 | | | $ | 3,739 | | | $ | 4,590 | | | $ | 4,142 | |
| | | | | | | | | | | | | | | | | | | | | |
| Ratio of expenses to average net assets | | | | | | | | | | | | | | | | | | | | |
| Before expense limitation | | | 2.12 | % | | | 2.20 | % | | | 2.13 | % | | | 2.10 | % | | | 2.19 | % |
| After expense limitation(d) | | | 1.60 | % | | | 1.60 | % | | | 1.60 | % | | | 1.60 | % | | | 1.60 | % |
| Ratio of net investment income/(loss) to average net asset | | | | | | | | | | | | | | | | | | | | |
| Before expense limitation | | | 2.56 | % | | | 2.36 | % | | | 2.58 | % | | | 2.28 | % | | | 2.76 | % |
| After expense limitation(d) | | | 3.08 | % | | | 2.96 | % | | | 3.11 | % | | | 2.78 | % | | | 3.35 | % |
| Portfolio turnover rate | | | 144 | % | | | 153 | % | | | 169 | % | | | 141 | % | | | 153 | % |
| (a) | Prior to January 23, 2018, the ICON Flexible Bond Fund was known as the ICON Bond Fund. |
| (b) | Calculated using the average shares method. |
| (c) | The total return calculation excludes any sales charges. |
| (d) | The Fund’s operating expenses, not including interest expense, are contractually limited to the amounts discussed in Note 3. The ratios in these financial highlights reflect the limitation, including the interest expense, when applicable. |
| The accompanying notes are an integral part of the financial statements. | |
| 42 | www.iconfunds.com |
| ICON Flexible Bond Fund | Financial Highlights |
| | For a Share Outstanding Throughout the Years Presented |
| | | Year Ended | | | Year Ended | | | Year Ended | | | Year Ended | | | Year Ended | |
| Class A | | September 30, 2019 | | | September 30, 2018(a) | | | September 30, 2017 | | | September 30, 2016 | | | September 30, 2015 | |
| Net asset value, beginning of period | | $ | 9.21 | | | $ | 9.39 | | | $ | 9.51 | | | $ | 9.17 | | | $ | 9.86 | |
| Income/(loss) from investment operations: | | | | | | | | | | | | | | | | | | | | |
| Net investment income/(loss)(b) | | | 0.34 | | | | 0.33 | | | | 0.33 | | | | 0.31 | | | | 0.36 | |
| Net realized and unrealized gains/(losses) on investments | | | 0.18 | | | | (0.19 | ) | | | (0.10 | ) | | | 0.34 | | | | (0.41 | ) |
| Total from investment operations | | | 0.52 | | | | 0.14 | | | | 0.23 | | | | 0.65 | | | | (0.05 | ) |
| | | | | | | | | | | | | | | | | | | | | |
| Less dividends and distributions: | | | | | | | | | | | | | | | | | | | | |
| Dividends from net investment income | | | (0.42 | ) | | | (0.32 | ) | | | (0.35 | ) | | | (0.31 | ) | | | (0.48 | ) |
| Distributions from net realized gains | | | — | | | | — | | | | — | | | | — | | | | (0.13 | ) |
| Return of capital | | | — | | | | — | | | | — | | | | — | | | | (0.03 | ) |
| Total dividends and distributions | | | (0.42 | ) | | | (0.32 | ) | | | (0.35 | ) | | | (0.31 | ) | | | (0.64 | ) |
| | | | | | | | | | | | | | | | | | | | | |
| Net asset value, end of period | | $ | 9.31 | | | $ | 9.21 | | | $ | 9.39 | | | $ | 9.51 | | | $ | 9.17 | |
| | | | | | | | | | | | | | | | | | | | | |
| Total Return(c) | | | 5.76 | % | | | 1.55 | % | | | 2.48 | % | | | 7.25 | % | | | (0.44 | )% |
| | | | | | | | | | | | | | | | | | | | | |
| Ratios and Supplemental Data | | | | | | | | | | | | | | | | | | | | |
| Net assets, end of period (in 000s) | | $ | 5,733 | | | $ | 3,685 | | | $ | 3,859 | | | $ | 6,100 | | | $ | 7,838 | |
| | | | | | | | | | | | | | | | | | | | | |
| Ratio of expenses to average net assets | | | | | | | | | | | | | | | | | | | | |
| Before expense limitation | | | 1.39 | % | | | 1.45 | % | | | 1.41 | % | | | 1.38 | % | | | 1.36 | % |
| After expense limitation(d) | | | 1.00 | % | | | 1.00 | % | | | 1.00 | % | | | 1.00 | % | | | 1.00 | % |
| Ratio of net investment income/(loss) to average net assets | | | | | | | | | | | | | | | | | | | | |
| Before expense limitation | | | 3.29 | % | | | 3.13 | % | | | 3.13 | % | | | 2.98 | % | | | 3.50 | % |
| After expense limitation(d) | | | 3.68 | % | | | 3.58 | % | | | 3.54 | % | | | 3.36 | % | | | 3.86 | % |
| Portfolio turnover rate | | | 144 | % | | | 153 | % | | | 169 | % | | | 141 | % | | | 153 | % |
| (a) | Prior to January 23, 2018, the ICON Flexible Bond Fund was known as the ICON Bond Fund. |
| (b) | Calculated using the average shares method. |
| (c) | The total return calculation excludes any sales charges. |
| (d) | The Fund’s operating expenses, not including interest expense, are contractually limited to the amounts discussed in Note 3. The ratios in these financial highlights reflect the limitation, including the interest expense, when applicable. |
| The accompanying notes are an integral part of the financial statements. | |
| Annual Report | September 30, 2019 | 43 |
| ICON Fund | Financial Highlights |
| | For a Share Outstanding Throughout the Years Presented |
| | | Year Ended | | | Year Ended | | | Year Ended | | | Year Ended | | | Year Ended | |
| Class S | | September 30, 2019 | | | September 30, 2018 | | | September 30, 2017 | | | September 30, 2016 | | | September 30, 2015 | |
| Net asset value, beginning of period | | $ | 19.90 | | | $ | 18.68 | | | $ | 14.08 | | | $ | 13.83 | | | $ | 14.52 | |
| Income/(loss) from investment operations: | | | | | | | | | | | | | | | | | | | | |
| Net investment income/(loss)(a) | | | 0.02 | (b) | | | (0.02 | ) | | | (0.01 | ) | | | 0.05 | | | | (0.02 | ) |
| Net realized and unrealized gains/(losses) on investments | | | 0.10 | (c) | | | 1.24 | | | | 4.61 | | | | 0.20 | | | | (0.67 | ) |
| Total from investment operations | | | 0.12 | | | | 1.22 | | | | 4.60 | | | | 0.25 | | | | (0.69 | ) |
| | | | | | | | | | | | | | | | | | | | | |
| Less dividends and distributions: | | | | | | | | | | | | | | | | | | | | |
| Distributions from net realized gains | | | (0.22 | ) | | | — | | | | — | | | | — | | | | — | |
| Total dividends and distributions | | | (0.22 | ) | | | — | | | | — | | | | — | | | | — | |
| | | | | | | | | | | | | | | | | | | | | |
| Net asset value, end of period | | $ | 19.80 | | | $ | 19.90 | | | $ | 18.68 | | | $ | 14.08 | | | $ | 13.83 | |
| | | | | | | | | | | | | | | | | | | | | |
| Total Return | | | 0.88 | % | | | 6.53 | % | | | 32.67 | % | | | 1.81 | % | | | (4.75 | )% |
| | | | | | | | | | | | | | | | | | | | | |
| Ratios and Supplemental Data | | | | | | | | | | | | | | | | | | | | |
| Net assets, end of period (in 000s) | | $ | 27,450 | | | $ | 32,583 | | | $ | 32,883 | | | $ | 28,897 | | | $ | 33,695 | |
| | | | | | | | | | | | | | | | | | | | | |
| Ratio of expenses to average net assets | | | | | | | | | | | | | | | | | | | | |
| Before expense limitation | | | 1.22 | % | | | 1.11 | % | | | 1.10 | % | | | 1.12 | % | | | 1.09 | % |
| After expense limitation(d) | | | 1.22 | % | | | 1.11 | % | | | 1.10 | % | | | 1.12 | % | | | 1.09 | % |
| Ratio of net investment income/(loss) to average net assets | | | | | | | | | | | | | | | | | | | | |
| Before expense limitation | | | 0.09 | % | | | (0.12 | )% | | | (0.04 | )% | | | 0.39 | % | | | (0.11 | )% |
| After expense limitation(d) | | | 0.09 | % | | | (0.12 | )% | | | (0.04 | )% | | | 0.39 | % | | | (0.11 | )% |
| Portfolio turnover rate | | | 31 | % | | | 25 | % | | | 15 | % | | | 31 | % | | | 54 | % |
| (a) | Calculated using the average shares method. |
| (b) | The per share amount does not correspond to activity reflected in the Statement of Operations due to class specific expenses during the period. |
| (c) | Realized and unrealized gains and losses per share in this caption are balancing amounts necessary to reconcile the change in net asset value per share for the year, and may not reconcile with the aggregate gains and losses in the Statement of Operations due to share transactions for the year. |
| (d) | The Fund’s operating expenses, not including interest expense, are contractually limited to the amounts discussed in Note 3. The ratios in these financial highlights reflect the limitation, including the interest expense, when applicable. |
| The accompanying notes are an integral part of the financial statements. | |
| 44 | www.iconfunds.com |
| ICON Fund | Financial Highlights |
| | For a Share Outstanding Throughout the Years Presented |
| | | Year Ended | | | Year Ended | | | Year Ended | | | Year Ended | | | Year Ended | |
| Class C | | September 30, 2019 | | | September 30, 2018 | | | September 30, 2017 | | | September 30, 2016 | | | September 30, 2015 | |
| Net asset value, beginning of period | | $ | 17.21 | | | $ | 16.34 | | | $ | 12.46 | | | $ | 12.38 | | | $ | 13.15 | |
| Income/(loss) from investment operations: | | | | | | | | | | | | | | | | | | | | |
| Net investment income/(loss)(a) | | | (0.15 | ) | | | (0.22 | ) | | | (0.17 | ) | | | (0.09 | ) | | | (0.18 | ) |
| Net realized and unrealized gains/(losses) on investments | | | 0.07 | (b) | | | 1.09 | | | | 4.05 | | | | 0.17 | | | | (0.59 | ) |
| Total from investment operations | | | (0.08 | ) | | | 0.87 | | | | 3.88 | | | | 0.08 | | | | (0.77 | ) |
| | | | | | | | | | | | | | | | | | | | | |
| Less dividends and distributions: | | | | | | | | | | | | | | | | | | | | |
| Distributions from net realized gains | | | (0.22 | ) | | | — | | | | — | | | | — | | | | — | |
| Total dividends and distributions | | | (0.22 | ) | | | — | | | | — | | | | — | | | | — | |
| | | | | | | | | | | | | | | | | | | | | |
| Net asset value, end of period | | $ | 16.91 | | | $ | 17.21 | | | $ | 16.34 | | | $ | 12.46 | | | $ | 12.38 | |
| | | | | | | | | | | | | | | | | | | | | |
| Total Return(c) | | | (0.16 | )% | | | 5.32% | | | | 31.14% | | | | 0.65% | | | | (5.86 | )% |
| | | | | | | | | | | | | | | | | | | | | |
| Ratios and Supplemental Data | | | | | | | | | | | | | | | | | | | | |
| Net assets, end of period (in 000s) | | $ | 7,792 | | | $ | 11,452 | | | $ | 12,663 | | | $ | 11,520 | | | $ | 13,745 | |
| | | | | | | | | | | | | | | | | | | | | |
| Ratio of expenses to average net assets | | | | | | | | | | | | | | | | | | | | |
| Before expense limitation | | | 2.40 | % | | | 2.27 | % | | | 2.31 | % | | | 2.41 | % | | | 2.27 | % |
| After expense limitation(d) | | | 2.25 | % | | | 2.25 | % | | | 2.25 | % | | | 2.26 | % | | | 2.25 | % |
| Ratio of net investment income/(loss) to average net assets | | | | | | | | | | | | | | | | | | | | |
| Before expense limitation | | | (1.09 | )% | | | (1.28 | )% | | | (1.25 | )% | | | (0.90 | )% | | | (1.29 | )% |
| After expense limitation(d) | | | (0.94 | )% | | | (1.26 | )% | | | (1.19 | )% | | | (0.75 | )% | | | (1.27 | )% |
| Portfolio turnover rate | | | 31% | | | | 25% | | | | 15% | | | | 31% | | | | 54% | |
| (a) | Calculated using the average shares method. |
| (b) | Realized and unrealized gains and losses per share in this caption are balancing amounts necessary to reconcile the change in net asset value per share for the year, and may not reconcile with the aggregate gains and losses in the Statement of Operations due to share transactions for the year. |
| (c) | The total return calculation excludes any sales charges. |
| (d) | The Fund’s operating expenses, not including interest expense, are contractually limited to the amounts discussed in Note 3. The ratios in these financial highlights reflect the limitation, including the interest expense, when applicable. |
| The accompanying notes are an integral part of the financial statements. | |
| Annual Report | September 30, 2019 | 45 |
| ICON Fund | Financial Highlights |
| | For a Share Outstanding Throughout the Years Presented |
| | | Year Ended | | | Year Ended | | | Year Ended | | | Year Ended | | | Year Ended | |
| Class A | | September 30, 2019 | | | September 30, 2018 | | | September 30, 2017 | | | September 30, 2016 | | | September 30, 2015 | |
| Net asset value, beginning of period | | $ | 18.67 | | | $ | 17.60 | | | $ | 13.31 | | | $ | 13.13 | | | $ | 13.84 | |
| Income/(loss) from investment operations: | | | | | | | | | | | | | | | | | | | | |
| Net investment income/(loss)(a) | | | (0.03 | ) | | | (0.10 | ) | | | (0.07 | ) | | | 0.00 | (b) | | | (0.08 | ) |
| Net realized and unrealized gains/(losses) on investments | | | 0.10 | (c) | | | 1.17 | | | | 4.36 | | | | 0.18 | | | | (0.63 | ) |
| Total from investment operations | | | 0.07 | | | | 1.07 | | | | 4.29 | | | | 0.18 | | | | (0.71 | ) |
| | | | | | | | | | | | | | | | | | | | | |
| Less dividends and distributions: | | | | | | | | | | | | | | | | | | | | |
| Distributions from net realized gains | | | (0.22 | ) | | | — | | | | — | | | | — | | | | — | |
| Total dividends and distributions | | | (0.22 | ) | | | — | | | | — | | | | — | | | | — | |
| | | | | | | | | | | | | | | | | | | | | |
| Net asset value, end of period | | $ | 18.52 | | | $ | 18.67 | | | $ | 17.60 | | | $ | 13.31 | | | $ | 13.13 | |
| | | | | | | | | | | | | | | | | | | | | |
| Total Return(d) | | | 0.67 | % | | | 6.08 | % | | | 32.23 | % | | | 1.37 | % | | | (5.13 | )% |
| | | | | | | | | | | | | | | | | | | | | |
| Ratios and Supplemental Data | | | | | | | | | | | | | | | | | | | | |
| Net assets, end of period (in 000s) | | $ | 7,356 | | | $ | 5,404 | | | $ | 5,156 | | | $ | 5,490 | | | $ | 6,994 | |
| | | | | | | | | | | | | | | | | | | | | |
| Ratio of expenses to average net assets | | | | | | | | | | | | | | | | | | | | |
| Before expense limitation | | | 1.72 | % | | | 1.63 | % | | | 1.66 | % | | | 1.67 | % | | | 1.55 | % |
| After expense limitation(e) | | | 1.50 | % | | | 1.50 | % | | | 1.50 | % | | | 1.51 | % | | | 1.50 | % |
| Ratio of net investment income/(loss) to average net assets | | | | | | | | | | | | | | | | | | | | |
| Before expense limitation | | | (0.40 | )% | | | (0.64 | )% | | | (0.60 | )% | | | (0.16 | )% | | | (0.57 | )% |
| After expense limitation(e) | | | (0.18 | )% | | | (0.51 | )% | | | (0.44 | )% | | | 0.00 | %(f) | | | (0.52 | )% |
| Portfolio turnover rate | | | 31 | % | | | 25 | % | | | 15 | % | | | 31 | % | | | 54 | % |
| (a) | Calculated using the average shares method. |
| (b) | Amount less than $0.005. |
| (c) | Realized and unrealized gains and losses per share in this caption are balancing amounts necessary to reconcile the change in net asset value per share for the year, and may not reconcile with the aggregate gains and losses in the Statement of Operations due to share transactions for the year. |
| (d) | The total return calculation excludes any sales charges. |
| (e) | The Fund’s operating expenses, not including interest expense, are contractually limited to the amounts discussed in Note 3. The ratios in these financial highlights reflect the limitation, including the interest expense, when applicable. |
| (f) | Less than 0.005% of average net assets. |
| The accompanying notes are an integral part of the financial statements. | |
| 46 | www.iconfunds.com |
| ICON Long/Short Fund | Financial Highlights |
| | For a Share Outstanding Throughout the Years Presented |
| | | Year Ended | | | Year Ended | | | Year Ended | | | Year Ended | | | Year Ended | |
| Class S | | September 30, 2019 | | | September 30, 2018 | | | September 30, 2017 | | | September 30, 2016 | | | September 30, 2015 | |
| Net asset value, beginning of period | | $ | 27.11 | | | $ | 25.13 | | | $ | 18.70 | | | $ | 18.39 | | | $ | 18.41 | |
| Income/(loss) from investment operations: | | | | | | | | | | | | | | | | | | | | |
| Net investment income/(loss)(a) | | | (0.02 | ) | | | (0.06 | ) | | | (0.04 | ) | | | 0.04 | | | | (0.09 | ) |
| Net realized and unrealized gains/(losses) on investments | | | 0.09 | (b) | | | 2.04 | | | | 6.47 | | | | 0.27 | | | | 0.07 | |
| Total from investment operations | | | 0.07 | | | | 1.98 | | | | 6.43 | | | | 0.31 | | | | (0.02 | ) |
| | | | | | | | | | | | | | | | | | | | | |
| Less dividends and distributions: | | | | | | | | | | | | | | | | | | | | |
| Distributions from net realized gains | | | (0.35 | ) | | | — | | | | — | | | | — | | | | — | |
| Total dividends and distributions | | | (0.35 | ) | | | — | | | | — | | | | — | | | | — | |
| | | | | | | | | | | | | | | | | | | | | |
| Net asset value, end of period | | $ | 26.83 | | | $ | 27.11 | | | $ | 25.13 | | | $ | 18.70 | | | $ | 18.39 | |
| | | | | | | | | | | | | | | | | | | | | |
| Total Return | | | 0.56 | % | | | 7.88 | % | | | 34.39 | % | | | 1.69 | % | | | (0.11 | )% |
| | | | | | | | | | | | | | | | | | | | | |
| Ratios and Supplemental Data | | | | | | | | | | | | | | | | | | | | |
| Net assets, end of period (in 000s) | | $ | 12,764 | | | $ | 18,580 | | | $ | 11,259 | | | $ | 7,114 | | | $ | 17,196 | |
| | | | | | | | | | | | | | | | | | | | | |
| Ratio of expenses to average net assets | | | | | | | | | | | | | | | | | | | | |
| Before expense limitation | | | 1.53 | % | | | 1.38 | % | | | 1.50% | | | | 1.63 | % | | | 1.37 | % |
| After expense limitation(c) | | | 1.25 | % | | | 1.25 | % | | | 1.25% | | | | 1.28 | % | | | 1.28 | % |
| Ratio of net investment income/(loss) to average net assets | | | | | | | | | | | | | | | | | | | | |
| Before expense limitation | | | (0.36 | )% | | | (0.33 | )% | | | (0.43 | )% | | | (0.11 | )% | | | (0.52 | )% |
| After expense limitation(c) | | | (0.08 | )% | | | (0.20 | )% | | | (0.18 | )% | | | 0.24 | % | | | (0.43 | )% |
| Portfolio turnover rate | | | 31 | % | | | 36 | % | | | 24% | | | | 20 | % | | | 74% | % |
| (a) | Calculated using the average shares method. |
| (b) | Realized and unrealized gains and losses per share in this caption are balancing amounts necessary to reconcile the change in net asset value per share for the year, and may not reconcile with the aggregate gains and losses in the Statement of Operations due to share transactions for the year. |
| (c) | The Fund’s operating expenses, not including interest expense or dividends on short positions, are contractually limited to the amounts discussed in Note 3. The ratios in these financial highlights reflect the limitation, including the interest expense and dividends on short positions, when applicable. |
| The accompanying notes are an integral part of the financial statements. | |
| Annual Report | September 30, 2019 | 47 |
| ICON Long/Short Fund | Financial Highlights |
| | For a Share Outstanding Throughout the Years Presented |
| | | Year Ended | | | Year Ended | | | Year Ended | | | Year Ended | | | Year Ended | |
| Class C | | September 30, 2019 | | | September 30, 2018 | | | September 30, 2017 | | | September 30, 2016 | | | September 30, 2015 | |
| Net asset value, beginning of period | | $ | 23.63 | | | $ | 22.13 | | | $ | 16.65 | | | $ | 16.54 | | | $ | 16.74 | |
| Income/(loss) from investment operations: | | | | | | | | | | | | | | | | | | | | |
| Net investment income/(loss)(a) | | | (0.25 | ) | | | (0.30 | ) | | | (0.25 | ) | | | (0.13 | ) | | | (0.27 | ) |
| Net realized and unrealized gains/(losses) on investments | | | 0.06 | (b) | | | 1.80 | | | | 5.73 | | | | 0.24 | | | | 0.07 | |
| Total from investment operations | | | (0.19 | ) | | | 1.50 | | | | 5.48 | | | | 0.11 | | | | (0.20 | ) |
| | | | | | | | | | | | | | | | | | | | | |
| Less dividends and distributions: | | | | | | | | | | | | | | | | | | | | |
| Distributions from net realized gains | | | (0.35 | ) | | | — | | | | — | | | | — | | | | — | |
| Total dividends and distributions | | | (0.35 | ) | | | — | | | | — | | | | — | | | | — | |
| | | | | | | | | | | | | | | | | | | | | |
| Net asset value, end of period | | $ | 23.09 | | | $ | 23.63 | | | $ | 22.13 | | | $ | 16.65 | | | $ | 16.54 | |
| | | | | | | | | | | | | | | | | | | | | |
| Total Return(c) | | | (0.47 | )% | | | 6.78 | % | | | 32.91 | % | | | 0.67 | % | | | (1.19 | )% |
| | | | | | | | | | | | | | | | | | | | | |
| Ratios and Supplemental Data | | | | | | | | | | | | | | | | | | | | |
| Net assets, end of period (in 000s) | | $ | 2,862 | | | $ | 5,036 | | | $ | 4,671 | | | $ | 4,211 | | | $ | 6,300 | |
| | | | | | | | | | | | | | | | | | | | | |
| Ratio of expenses to average net assets | | | | | | | | | | | | | | | | | | | | |
| Before expense limitation | | | 2.84 | % | | | 2.60 | % | | | 2.75 | % | | | 2.76 | % | | | 2.53 | % |
| After expense limitation(d) | | | 2.30 | % | | | 2.30 | % | | | 2.30 | % | | | 2.33 | % | | | 2.33 | % |
| Ratio of net investment income/(loss) to average net assets | | | | | | | | | | | | | | | | | | | | |
| Before expense limitation | | | (1.67 | )% | | | (1.57 | )% | | | (1.69 | )% | | | (1.21 | )% | | | (1.68 | )% |
| After expense limitation(d) | | | (1.13 | )% | | | (1.27 | )% | | | (1.24 | )% | | | (0.78 | )% | | | (1.48 | )% |
| Portfolio turnover rate | | | 31 | % | | | 36 | % | | | 24 | % | | | 20 | % | | | 74 | % |
| (a) | Calculated using the average shares method. |
| (b) | Realized and unrealized gains and losses per share in this caption are balancing amounts necessary to reconcile the change in net asset value per share for the year, and may not reconcile with the aggregate gains and losses in the Statement of Operations due to share transactions for the year. |
| (c) | The total return calculation excludes any sales charges. |
| (d) | The Fund’s operating expenses, not including interest expense or dividends on short positions, are contractually limited to the amounts discussed in Note 3. The ratios in these financial highlights reflect the limitation, including the interest expense and dividends on short positions, when applicable. |
| The accompanying notes are an integral part of the financial statements. | |
| 48 | www.iconfunds.com |
| ICON Long/Short Fund | Financial Highlights |
| | For a Share Outstanding Throughout the Years Presented |
| | | Year Ended | | | Year Ended | | | Year Ended | | | Year Ended | | | Year Ended | |
| Class A | | September 30, 2019 | | | September 30, 2018 | | | September 30, 2017 | | | September 30, 2016 | | | September 30, 2015 | |
| Net asset value, beginning of period | | $ | 26.16 | | | $ | 24.33 | | | $ | 18.16 | | | $ | 17.91 | | | $ | 17.99 | |
| Income/(loss) from investment operations: | | | | | | | | | | | | | | | | | | | | |
| Net investment income/(loss)(a) | | | (0.09 | ) | | | (0.14 | ) | | | (0.11 | ) | | | (0.01 | ) | | | (0.15 | ) |
| Net realized and unrealized gains/(losses) on investments | | | 0.09 | (b) | | | 1.97 | | | | 6.28 | | | | 0.26 | | | | 0.07 | |
| Total from investment operations | | | (0.00 | ) | | | 1.83 | | | | 6.17 | | | | 0.25 | | | | (0.08 | ) |
| | | | | | | | | | | | | | | | | | | | | |
| Less dividends and distributions: | | | | | | | | | | | | | | | | | | | | |
| Distributions from net realized gains | | | (0.35 | ) | | | — | | | | — | | | | — | | | | — | |
| Total dividends and distributions | | | (0.35 | ) | | | — | | | | — | | | | — | | | | — | |
| | | | | | | | | | | | | | | | | | | | | |
| Net asset value, end of period | | $ | 25.81 | | | $ | 26.16 | | | $ | 24.33 | | | $ | 18.16 | | | $ | 17.91 | |
| | | | | | | | | | | | | | | | | | | | | |
| Total Return(c) | | | 0.31 | % | | | 7.52 | % | | | 33.98 | % | | | 1.40 | % | | | (0.44 | )% |
| | | | | | | | | | | | | | | | | | | | | |
| Ratios and Supplemental Data | | | | | | | | | | | | | | | | | | | | |
| Net assets, end of period (in 000s) | | $ | 4,894 | | | $ | 5,351 | | | $ | 7,003 | | | $ | 5,316 | | | $ | 9,186 | |
| | | | | | | | | | | | | | | | | | | | | |
| Ratio of expenses to average net assets | | | | | | | | | | | | | | | | | | | | |
| Before expense limitation | | | 2.08 | % | | | 1.83 | % | | | 1.93 | % | | | 1.95 | % | | | 1.73% | |
| After expense limitation(d) | | | 1.55 | % | | | 1.55 | % | | | 1.55 | % | | | 1.58 | % | | | 1.58% | |
| Ratio of net investment income/(loss) to average net assets | | | | | | | | | | | | | | | | | | | | |
| Before expense limitation | | | (0.92 | )% | | | (0.80 | )% | | | (0.87 | )% | | | (0.40 | )% | | | (0.89 | )% |
| After expense limitation(d) | | | (0.39 | )% | | | (0.52 | )% | | | (0.49 | )% | | | (0.03 | )% | | | (0.74 | )% |
| Portfolio turnover rate | | | 31 | % | | | 36 | % | | | 24 | % | | | 20 | % | | | 74 | % |
| (a) | Calculated using the average shares method. |
| (b) | Realized and unrealized gains and losses per share in this caption are balancing amounts necessary to reconcile the change in net asset value per share for the year, and may not reconcile with the aggregate gains and losses in the Statement of Operations due to share transactions for the year. |
| (c) | The total return calculation excludes any sales charges. |
| (d) | The Fund’s operating expenses, not including interest expense or dividends on short positions, are contractually limited to the amounts discussed in Note 3. The ratios in these financial highlights reflect the limitation, including the interest expense and dividends on short positions, when applicable. |
| The accompanying notes are an integral part of the financial statements. | |
| Annual Report | September 30, 2019 | 49 |
| ICON Opportunities Fund | Financial Highlights |
| | For a Share Outstanding Throughout the Years Presented |
| | | Year Ended | | | Year Ended | | | Year Ended | | | Year Ended | | | Year Ended | |
| | | September 30, 2019 | | | September 30, 2018 | | | September 30, 2017 | | | September 30, 2016 | | | September 30, 2015 | |
| Net asset value, beginning of period | | $ | 19.51 | | | $ | 18.88 | | | $ | 14.74 | | | $ | 13.32 | | | $ | 13.04 | |
| Income/(loss) from investment operations: | | | | | | | | | | | | | | | | | | | | |
| Net investment income/(loss)(a) | | | (0.07 | ) | | | (0.15 | ) | | | (0.13 | ) | | | (0.03 | ) | | | (0.09 | ) |
| Net realized and unrealized gains/(losses) on investments | | | (2.22 | ) | | | 1.07 | | | | 4.48 | | | | 1.46 | | | | 0.58 | |
| Total from investment operations | | | (2.29 | ) | | | 0.92 | | | | 4.35 | | | | 1.43 | | | | 0.49 | |
| | | | | | | | | | | | | | | | | | | | | |
| Less dividends and distributions: | | | | | | | | | | | | | | | | | | | | |
| Distributions from net realized gains | | | (3.70 | ) | | | (0.29 | ) | | | (0.21 | ) | | | (0.01 | ) | | | (0.21 | ) |
| Total dividends and distributions | | | (3.70 | ) | | | (0.29 | ) | | | (0.21 | ) | | | (0.01 | ) | | | (0.21 | ) |
| | | | | | | | | | | | | | | | | | | | | |
| Net asset value, end of period | | $ | 13.52 | | | $ | 19.51 | | | $ | 18.88 | | | $ | 14.74 | | | $ | 13.32 | |
| | | | | | | | | | | | | | | | | | | | | |
| Total Return | | | (7.53 | )% | | | 4.88% | | | | 29.75% | | | | 10.76 | % | | | 3.75 | % |
| | | | | | | | | | | | | | | | | | | | | |
| Ratios and Supplemental Data | | | | | | | | | | | | | | | | | | | | |
| Net assets, end of period (in 000s) | | $ | 16,517 | | | $ | 21,084 | | | $ | 19,369 | | | $ | 16,059 | | | $ | 11,047 | |
| | | | | | | | | | | | | | | | | | | | | |
| Ratio of expenses to average net assets | | | | | | | | | | | | | | | | | | | | |
| Before expense limitation | | | 1.45 | % | | | 1.35 | % | | | 1.47 | % | | | 1.53 | % | | | 1.58 | % |
| After expense limitation(b) | | | 1.30 | % | | | 1.30 | % | | | 1.45 | %(c) | | | 1.51 | % | | | 1.50 | % |
| Ratio of net investment income/(loss) to average net assets | | | | | | | | | | | | | | | | | | | | |
| Before expense limitation | | | (0.69 | )% | | | (0.80 | )% | | | (0.80 | )% | | | (0.27 | )% | | | (0.72 | )% |
| After expense limitation(b) | | | (0.54 | )% | | | (0.75 | )% | | | (0.78 | )% | | | (0.25 | )% | | | (0.65 | )% |
| Portfolio turnover rate | | | 41 | % | | | 87 | % | | | 26 | % | | | 95 | % | | | 76 | % |
| (a) | Calculated using the average shares method. |
| (b) | The Fund’s operating expenses, not including interest expense, are contractually limited to the amounts discussed in Note 3. The ratios in these financial highlights reflect the limitation, including the interest expense, when applicable. |
| (c) | Effective June 30, 2017, the annual expense limitation rate changed from 1.50% to 1.30%. |
| The accompanying notes are an integral part of the financial statements. | |
| 50 | www.iconfunds.com |
| ICON Risk-Managed Balanced Fund | Financial Highlights |
| | For a Share Outstanding Throughout the Years Presented |
| | | Year Ended | | | Year Ended | | | Year Ended | | | Year Ended | | | Year Ended | |
| Class S | | September 30, 2019 | | | September 30, 2018 | | | September 30, 2017 | | | September 30, 2016 | | | September 30, 2015 | |
| Net asset value, beginning of period | | $ | 16.32 | | | $ | 15.74 | | | $ | 14.46 | | | $ | 14.02 | | | $ | 13.98 | |
| Income/(loss) from investment operations: | | | | | | | | | | | | | | | | | | | | |
| Net investment income/(loss)(a) | | | 0.18 | | | | 0.16 | | | | 0.21 | | | | 0.19 | | | | 0.18 | |
| Net realized and unrealized gains/(losses) on investments | | | (0.21 | ) | | | 0.57 | | | | 1.30 | | | | 0.42 | | | | 0.01 | |
| Total from investment operations | | | (0.03 | ) | | | 0.73 | | | | 1.51 | | | | 0.61 | | | | 0.19 | |
| | | | | | | | | | | | | | | | | | | | | |
| Less dividends and distributions: | | | | | | | | | | | | | | | | | | | | |
| Dividends from net investment income | | | (0.21 | ) | | | (0.15 | ) | | | (0.23 | ) | | | (0.17 | ) | | | (0.15 | ) |
| Total dividends and distributions | | | (0.21 | ) | | | (0.15 | ) | | | (0.23 | ) | | | (0.17 | ) | | | (0.15 | ) |
| | | | | | | | | | | | | | | | | | | | | |
| Net asset value, end of period | | $ | 16.08 | | | $ | 16.32 | | | $ | 15.74 | | | $ | 14.46 | | | $ | 14.02 | |
| | | | | | | | | | | | | | | | | | | | | |
| Total Return | | | (0.14 | )% | | | 4.64 | % | | | 10.53 | % | | | 4.39 | % | | | 1.35 | % |
| | | | | | | | | | | | | | | | | | | | | |
| Ratios and Supplemental Data | | | | | | | | | | | | | | | | | | | | |
| Net assets, end of period (in 000s) | | $ | 7,678 | | | $ | 10,676 | | | $ | 15,272 | | | $ | 20,087 | | | $ | 26,677 | |
| | | | | | | | | | | | | | | | | | | | | |
| Ratio of expenses to average net assets | | | | | | | | | | | | | | | | | | | | |
| Before expense limitation | | | 1.51 | % | | | 1.38 | % | | | 1.36 | % | | | 1.27 | % | | | 1.34 | % |
| After expense limitation(b) | | | 1.20 | % | | | 1.20 | % | | | 1.20 | % | | | 1.20 | % | | | 1.20 | % |
| Ratio of net investment income/(loss) to average net assets | | | | | | | | | | | | | | | | | | | | |
| Before expense limitation | | | 0.84 | % | | | 0.82 | % | | | 1.26 | % | | | 1.27 | % | | | 1.09 | % |
| After expense limitation(b) | | | 1.15 | % | | | 1.00 | % | | | 1.42 | % | | | 1.34 | % | | | 1.23 | % |
| Portfolio turnover rate | | | 66 | % | | | 87 | % | | | 83 | % | | | 109 | % | | | 119 | % |
| (a) | Calculated using the average shares method. |
| (b) | The Fund’s operating expenses, not including interest expense, are contractually limited to the amounts discussed in Note 3. The ratios in these financial highlights reflect the limitation, including the interest expense, when applicable. |
| The accompanying notes are an integral part of the financial statements. | |
| Annual Report | September 30, 2019 | 51 |
| ICON Risk-Managed Balanced Fund | Financial Highlights |
| | For a Share Outstanding Throughout the Years Presented |
| | | Year Ended | | | Year Ended | | | Year Ended | | | Year Ended | | | Year Ended | |
| Class C | | | September 30, 2019 | | | | September 30, 2018 | | | | September 30, 2017 | | | | September 30, 2016 | | | September 30, 2015 | |
| Net asset value, beginning of period | | $ | 14.92 | | | $ | 14.42 | | | $ | 13.27 | | | $ | 12.89 | | | $ | 12.90 | |
| Income/(loss) from investment operations: | | | | | | | | | | | | | | | | | | | | |
| Net investment income/(loss)(a) | | | 0.02 | | | | (0.00 | )(b) | | | 0.06 | | | | 0.04 | | | | 0.03 | |
| Net realized and unrealized gains/(losses) on investments | | | (0.19 | ) | | | 0.52 | | | | 1.19 | | | | 0.39 | | | | 0.01 | |
| Total from investment operations | | | (0.17 | ) | | | 0.52 | | | | 1.25 | | | | 0.43 | | | | 0.04 | |
| | | | | | | | | | | | | | | | | | | | | |
| Less dividends and distributions: | | | | | | | | | | | | | | | | | | | | |
| Dividends from net investment income | | | (0.07 | ) | | | (0.02 | ) | | | (0.10 | ) | | | (0.05 | ) | | | (0.05 | ) |
| Total dividends and distributions | | | (0.07 | ) | | | (0.02 | ) | | | (0.10 | ) | | | (0.05 | ) | | | (0.05 | ) |
| | | | | | | | | | | | | | | | | | | | | |
| Net asset value, end of period | | $ | 14.68 | | | $ | 14.92 | | | $ | 14.42 | | | $ | 13.27 | | | $ | 12.89 | |
| | | | | | | | | | | | | | | | | | | | | |
| Total Return(c) | | | (1.13 | )% | | | 3.61 | % | | | 9.44 | % | | | 3.35 | % | | | 0.31 | % |
| | | | | | | | | | | | | | | | | | | | | |
| Ratios and Supplemental Data | | | | | | | | | | | | | | | | | | | | |
| Net assets, end of period (in 000s) | | $ | 16,907 | | | $ | 16,409 | | | $ | 16,583 | | | $ | 15,151 | | | $ | 13,061 | |
| | | | | | | | | | | | | | | | | | | | | |
| Ratio of expenses to average net assets | | | | | | | | | | | | | | | | | | | | |
| Before expense limitation | | | 2.37 | % | | | 2.28 | % | | | 2.30 | % | | | 2.29 | % | | | 2.38 | % |
| After expense limitation(d) | | | 2.20 | % | | | 2.20 | % | | | 2.20 | % | | | 2.20 | % | | | 2.20 | % |
| Ratio of net investment income/(loss) to average net assets | | | | | | | | | | | | | | | | | | | | |
| Before expense limitation | | | 0.00 | %(e) | | | (0.08 | )% | | | 0.35 | % | | | 0.24 | % | | | 0.06 | % |
| After expense limitation(d) | | | 0.17 | % | | | 0.00 | %(e) | | | 0.45 | % | | | 0.33 | % | | | 0.24 | % |
| Portfolio turnover rate | | | 66 | % | | | 87 | % | | | 83 | % | | | 109 | % | | | 119 | % |
| (a) | Calculated using the average shares method. |
| (b) | Amount less than $(0.005). |
| (c) | The total return calculation excludes any sales charges. |
| (d) | The Fund’s operating expenses, not including interest expense, are contractually limited to the amounts discussed in Note 3. The ratios in these financial highlights reflect the limitation, including the interest expense, when applicable. |
| (e) | Less than 0.005% of average net assets. |
| The accompanying notes are an integral part of the financial statements. | |
| 52 | www.iconfunds.com |
| ICON Risk-Managed Balanced Fund | Financial Highlights |
| | For a Share Outstanding Throughout the Years Presented |
| | | Year Ended | | | Year Ended | | | Year Ended | | | Year Ended | | | Year Ended | |
| Class A | | | September 30, 2019 | | | | September 30, 2018 | | | | September 30, 2017 | | | | September 30, 2016 | | | September 30, 2015 | |
| Net asset value, beginning of period | | $ | 15.93 | | | $ | 15.36 | | | $ | 14.11 | | | $ | 13.68 | | | $ | 13.69 | |
| Income/(loss) from investment operations: | | | | | | | | | | | | | | | | | | | | |
| Net investment income/(loss)(a) | | | 0.13 | | | | 0.12 | | | | 0.17 | | | | 0.15 | | | | 0.14 | |
| Net realized and unrealized gains/(losses) on investments | | | (0.20 | ) | | | 0.55 | | | | 1.27 | | | | 0.42 | | | | 0.00 | (b) |
| Total from investment operations | | | (0.07 | ) | | | 0.67 | | | | 1.44 | | | | 0.57 | | | | 0.14 | |
| | | | | | | | | | | | | | | | | | | | | |
| Less dividends and distributions: | | | | | | | | | | | | | | | | | | | | |
| Dividends from net investment income | | | (0.17 | ) | | | (0.10 | ) | | | (0.19 | ) | | | (0.14 | ) | | | (0.15 | ) |
| Total dividends and distributions | | | (0.17 | ) | | | (0.10 | ) | | | (0.19 | ) | | | (0.14 | ) | | | (0.15 | ) |
| | | | | | | | | | | | | | | | | | | | | |
| Net asset value, end of period | | $ | 15.69 | | | $ | 15.93 | | | $ | 15.36 | | | $ | 14.11 | | | $ | 13.68 | |
| | | | | | | | | | | | | | | | | | | | | |
| Total Return(c) | | | (0.41 | )% | | | 4.40 | % | | | 10.29 | % | | | 4.18 | % | | | 1.00 | % |
| | | | | | | | | | | | | | | | | | | | | |
| Ratios and Supplemental Data | | | | | | | | | | | | | | | | | | | | |
| Net assets, end of period (in 000s) | | $ | 2,972 | | | $ | 4,849 | | | $ | 7,084 | | | $ | 9,095 | | | $ | 8,446 | |
| | | | | | | | | | | | | | | | | | | | | |
| Ratio of expenses to average net assets | | | | | | | | | | | | | | | | | | | | |
| Before expense limitation | | | 1.87 | % | | | 1.64 | % | | | 1.64 | % | | | 1.60 | % | | | 1.70 | % |
| After expense limitation(d) | | | 1.45 | % | | | 1.45 | % | | | 1.45 | % | | | 1.45 | % | | | 1.45 | % |
| Ratio of net investment income/(loss) to average net assets | | | | | | | | | | | | | | | | | | | | |
| Before expense limitation | | | 0.47 | % | | | 0.56 | % | | | 0.98 | % | | | 0.93 | % | | | 0.71 | % |
| After expense limitation(d) | | | 0.89 | % | | | 0.75 | % | | | 1.17 | % | | | 1.08 | % | | | 0.96 | % |
| Portfolio turnover rate | | | 66 | % | | | 87 | % | | | 83 | % | | | 109 | % | | | 119 | % |
| (a) | Calculated using the average shares method. |
| (b) | Less than $0.005. |
| (c) | The total return calculation excludes any sales charges. |
| (d) | The Fund’s operating expenses, not including interest expense, are contractually limited to the amounts discussed in Note 3. The ratios in these financial highlights reflect the limitation, including the interest expense, when applicable. |
| The accompanying notes are an integral part of the financial statements. | |
| Annual Report | September 30, 2019 | 53 |
| ICON Diversified Funds | Notes to Financial Statements |
| | September 30, 2019 |
The ICON Equity Income Fund (“Equity Income Fund”), ICON Flexible Bond Fund (“Flexible Bond Fund”), ICON Fund (“ICON Fund”), ICON Long/Short Fund (“Long/ Short Fund”), ICON Opportunities Fund (“Opportunities Fund”) and ICON Risk-Managed Balanced Fund (“Risk-Managed Balanced Fund”) are a series of funds (individually a “Fund” and collectively, the “Funds”). The Funds are part of the ICON Funds (the “Trust”), a Massachusetts business trust registered under the Investment Company Act of 1940, as amended (the “1940 Act”) as an open-end investment management company. Each Fund, with the exception of the Opportunities Fund, offers three classes of shares: Class S, Class C and Class A. The Opportunities Fund is a single-class fund. All classes have equal rights as to earnings, assets and voting privileges except that each Class may bear different distribution fees, registration costs, legal costs, mailing and printing costs and shareholder servicing costs and each Class has exclusive voting rights with respect to its distribution plan. There are currently eleven other active Funds within the Trust. Those Funds are covered by separate prospectuses and shareholder reports.
Each Fund is authorized to issue an unlimited number of no par shares. The investment objective of the Equity Income Fund is modest capital appreciation and income. The investment objective of the Flexible Bond Fund is to maximize total return. The investment objective of the ICON Fund is capital appreciation with a secondary objective of capital preservation to provide long-term growth. The investment objective of the Opportunities Fund is to provide capital appreciation. The investment objective of the Long/Short Fund is to provide capital appreciation. The investment objective of the Risk-Managed Balanced Fund is modest capital appreciation and income.
The Funds, like all investments in securities, have elements of risk, including risk of loss of principal. There is no assurance that the Funds will achieve their investment objectives and may underperform funds with similar investment objectives. An investment concentrated in sectors and industries involves greater risk and volatility than a more diversified investment. Securities of small companies generally involve greater risks than investments in larger companies. Small company securities tend to be more volatile and less liquid than equity securities of larger companies. Investing in fixed income securities such as bonds involves interest rate risk. When interest rates rise, the value of fixed income securities generally decreases.
The Funds may invest in other investment companies. As with other investments, investments in other investment companies, including closed-end funds (which include business development companies (BDCs)), unit investment trusts, open-end investment companies, and exchange traded funds, are subject to many of the same risks as investing directly in the underlying instruments, including market risk and, for non-index strategies, selection risk. In addition, if a Fund acquires shares of investment companies, shareholders bear both their proportionate share of expenses in the Fund (including management and advisory fees) and, indirectly, the expenses of the investment companies (including management and advisory fees). If a Fund acquires shares of one or more underlying funds, shareholders bear both their proportionate share of expenses in the Fund (excluding management and advisory fees attributable to those assets of the Fund invested in the underlying funds) and, indirectly, the expenses of the underlying funds (including management and advisory fees). Further, the closed-end fund market is inefficient. Many closed-end funds (CEFs), including many in which the Funds invest, are small or microcap securities. There is little independent research published on CEFs and limited availability of data makes research difficult and time consuming. CEFs may trade unpredictably. The underlying assets may be unknown and their value not readily determinable. The Funds often purchase CEFs believing they are trading at a discount to NAV, and an ongoing corporate action will cause the discount to narrow or disappear. With little independent analysis of the CEFs’ individual assets, the Fund essentially makes a value based arbitrage strategy. The Fund will look to events like pending or proposed tender offers, liquidations, take-over plays etc. If the event is not preceded by an official announcement — and is, instead, “pending” or “anticipated” — this strategy can be very risky. If the event is announced, there is still the possibility that it will not happen. In sum, investing in CEFs in general, and CEF arbitrage plays in particular carry unique and arguably heightened risks.
The Equity Income Fund, Flexible Bond Fund and Risk-Managed Balanced Fund may invest in medium-and lower-quality debt securities. High-yield bonds, also known as “junk bonds” are speculative investments and involve a greater risk of default and price volatility than U.S. government and other high-quality bonds. Junk bonds are also less liquid (more difficult to sell) than equities and higher credit bonds. Reduced liquidity may adversely affect the market price of, and ability of a Fund to value and sell particular securities at certain times, thereby making it difficult to make specific valuation determinations.
The Equity Income Fund, Flexible Bond Fund and Risk-Managed Balanced Fund may invest in mortgage-related securities, which are interests in pools of mortgage loans made to residential home buyers, including mortgage loans made by savings and loan institutions, mortgage bankers, commercial banks and others. Pools of mortgage loans are assembled as securities for sale to investors by various governmental and government-related organizations. The Equity Income Fund, Flexible Bond Fund and Risk-Managed Balanced Fund also may invest in debt securities that are secured with collateral consisting of mortgage related securities (Collateralized Mortgage Obligations or “CMO’s”), and in other types of mortgage-related or other asset-backed securities. CMOs are debt obligations of a legal entity that are collateralized by whole mortgage loans or private mortgage bonds and divided into classes. CMOs are typically structured into multiple classes, often referred to as “tranches,” with each class bearing a different stated maturity and entitled to a different schedule for payments of principal and interest, including prepayments. CMOs may be less liquid and may exhibit greater price volatility than other types of mortgage-related or asset-backed securities. Many of the risks of investing in mortgage-related securities secured by commercial mortgage loans reflect the effects of local and other economic conditions on real estate markets, the ability of tenants to make lease payments, and the ability of a property to attract and retain tenants. These securities may be less liquid and may exhibit greater price volatility than other types of mortgage-related or other asset-backed securities. Other asset-backed securities are created from many types of assets, including auto loans, credit card receivables, home equity loans, and student loans. The ICON Fund and Long/Short Fund also may invest in such securities for temporary defensive purposes.
| ICON Diversified Funds | Notes to Financial Statements |
| | September 30, 2019 |
The Long/Short Fund may engage in short selling; there are risks associated with selling short, including the risk that the Long/Short Fund may have to cover its short position at a higher price than the short sale, resulting in a loss. The Long/Short Fund’s loss on a short sale is potentially unlimited as a loss occurs when the value of a security sold short increases.
The Risk-Managed Balanced Fund may invest in call options; selling/writing call options involves certain risks, such as limiting gains and lack of liquidity of the underlying securities, and are not suitable for all investors.
Investments in foreign securities and currency transactions may involve certain considerations and risks not typically associated with those of U.S. dollar-denominated transactions as a result of, among other factors, the possibility of less government supervision and regulation of foreign securities markets and the possibility of political or economic instability. Financial statements of foreign companies are governed by different accounting, auditing, and financial standards than U.S. companies and may be less transparent and uniform than in the United States. Many corporate governance standards, which help ensure the integrity of public information in the United States, may not exist in some foreign countries. In general, there may be less governmental supervision of foreign stock exchanges and securities brokers and issuers. There are also risks associated with small- and mid-cap investing, including limited product lines, less liquidity and small market share.
The Flexible Bond Fund has a significant weighting in the Financials and Consumer Discretionary sector, the Opportunities Fund has a significant weighting in the Consumer Discretionary and Industrials sectors which may cause the Funds’ performance to be susceptible to the economic, business and/or other developments that may affect those sectors.
In the normal course of business, the Funds may enter into various agreements that provide for general indemnifications. Each Fund’s maximum exposure under these arrangements is unknown as any potential exposure involving future claims that may be made against each Fund is unknown. However, based on experience, the Funds expect the risk of loss to be remote.
| 2. | SIGNIFICANT ACCOUNTING POLICIES |
The following is a summary of significant accounting policies consistently followed by the Funds in the preparation of their financial statements. The financial statements are prepared in conformity with accounting principles generally accepted in the United States of America (“GAAP”), which requires management to make certain estimates and assumptions that affect the reported amounts of assets and liabilities, disclosure of contingent assets and liabilities at the date of the financial statements, and the reported amounts of income and expenses during the reporting period. Actual results may differ from these estimates. Each Fund is considered an investment company under GAAP and follows the accounting and reporting guidance applicable to investment companies in the Financial Accounting Standards Board Accounting Standards Codification Topic 946.
Investment Valuation
The Funds’ securities and other assets, excluding options on securities indexes, are valued at the closing price as of the close of regular trading on the New York Stock Exchange (the “NYSE”) (normally 4 p.m. Eastern Time) each day the NYSE is open, except that securities traded primarily on the NASDAQ Stock Market (“NASDAQ”) are normally valued by the Funds at the NASDAQ Official Closing Price provided by NASDAQ each business day. If the NYSE closes unexpectedly and there is active trading on other exchanges, the securities will be valued at the Valuation Time based off of those exchanges. Options on securities indexes are valued at the close of the Chicago Board Options Exchange (normally 4:15 p.m. Eastern Time) on each day the NYSE is open for trading.
The Funds use pricing services to obtain the fair value of securities in their portfolios. If a pricing service is not able to provide a price, or the pricing service’s valuation is considered inaccurate or does not, in the Funds’ judgment, reflect the fair value of the security, prices may be obtained through market quotations from independent broker/dealers. If market quotations from these sources are not readily available, the Funds’ securities or other assets are valued at fair value as determined in good faith by the Funds’ Valuation Committee pursuant to procedures approved by the Funds’ Board of Trustees (the “Board”).
Lacking any sales that day, a security is valued at the current closing bid price (or yield equivalent thereof) or based on quotes obtained from dealers making a market for the security. Exchange traded options are valued at the composite price, using the National Best Bid and Offer quotes (“NBBO”). NBBO consists of the highest bid price and lowest ask price across any of the exchanges on which an option is quoted, thus providing a view across the entire U.S. options marketplace. Debt securities with a remaining maturity of greater than 60 days are valued using the evaluated bid price supplied by the pricing service. The evaluated bid price supplied by the pricing service is based upon a matrix valuation system which considers such factors as security prices, yields, maturities and ratings. Short-term debt securities with remaining maturities of 60 days or less are generally valued at amortized cost or original cost plus accrued interest, which approximates fair value. Currency rates as of the close of the NYSE are used to convert foreign security values into U.S. dollars.
| Annual Report | September 30, 2019 | 55 |
| ICON Diversified Funds | Notes to Financial Statements |
| | September 30, 2019 |
Mortgage-related and asset-backed securities are typically issued as separate tranches, or classes, of securities within each deal. These securities are also normally valued by pricing service providers that use broker-dealer quotations, reported trades or valuation estimates from their internal pricing models. The pricing models for these securities usually consider tranche level attributes, current market data, estimated cash flows and market based yield spreads for each tranche, and incorporate deal collateral performance, as available. Mortgage-related and asset-backed securities that use similar valuation techniques and inputs as described above are categorized as Level 2 of the fair value hierarchy.
Securities of investment companies that trade on an exchange are valued at the last sales price or official closing price as of the close of the customary trading session on the exchange where the security is principally traded. Investments in shares of funds, including money market funds, that are not traded on an exchange are valued at the end of day net asset value (“NAV”) per share of such fund. Securities in the underlying funds, including restricted securities, are valued in accordance with the valuation policy of such fund.
The Funds’ securities traded in countries outside of the Western Hemisphere are fair valued daily by utilizing the quotations of an independent pricing service, unless the Funds’ Valuation Committee determines that use of another valuation methodology is appropriate. The purpose of daily fair valuation is to avoid stale prices and to take into account, among other things, any significant events occurring after the close of foreign markets. The pricing service uses statistical analyses and quantitative models to adjust local market prices using factors such as subsequent movements and changes in the prices of indexes, securities and exchange rates in other markets to determine fair value as of the time a Fund calculates its NAV. The valuation assigned to fair-value securities for purposes of calculating each Fund’s NAV may differ from the security’s most recent closing market price and from the prices used by other mutual funds to calculate their NAVs.
Various inputs are used to determine the value of the Funds’ investments. These inputs are summarized in the three broad levels listed below:
| Level 1 — | quoted prices in active markets for identical securities. |
| Level 2 — | significant observable inputs other than Level 1 quoted prices (including, but not limited to, quoted prices for similar securities, interest rates, prepayment speeds, and credit risk). |
| Level 3 — | significant unobservable inputs. |
Observable inputs are those based on market data obtained from sources independent of the Funds, and unobservable inputs reflect the Funds’ own assumptions based on the best information available. The input levels are not necessarily an indication of the risk or liquidity associated with investments at that level. For example, non-U.S. equity securities actively traded in foreign markets may be reflected in Level 2 despite the availability of closing prices, because the Funds evaluate and determine whether those closing prices reflect fair value at the close of the NYSE or require adjustment, as described above. The following table summarizes the Funds’ investments, based on the inputs used to determine their values on September 30, 2019:
ICON Equity Income Fund
| Investments in Securities at Value* | Level 1 - Quoted
and Unadjusted
Prices | Level 2 - Other
Significant
Observable Inputs | Level 3 - Significant
Unobservable
Inputs | Total |
| Corporate Bonds | $ | — | | $ | 4,475,013 | | $ | — | | $ | 4,475,013 | |
| Common Stocks | | 72,851,157 | | | — | | | — | | | 72,851,157 | |
| Preferred Stocks | | 656,359 | | | — | | | — | | | 656,359 | |
| Closed-End Mutual Funds | | 2,319,355 | | | — | | | — | | | 2,319,355 | |
| Collateral for Securities on Loan | | — | | | 820,950 | | | — | | | 820,950 | |
| Total | $ | 75,826,871 | | $ | 5,295,963 | | $ | — | | $ | 81,122,834 | |
| ICON Diversified Funds | Notes to Financial Statements |
| | September 30, 2019 |
ICON Flexible Bond Fund
| Investments in Securities at Value* | Level 1 - Quoted
and Unadjusted
Prices | Level 2 - Other
Significant
Observable Inputs | Level 3 - Significant
Unobservable
Inputs | Total |
| Corporate Bonds | $ | — | | $ | 118,386,109 | | $ | — | | $ | 118,386,109 | |
| Asset-Backed Securities | | — | | | 2,904,047 | | | — | | | 2,904,047 | |
| Preferred Stocks | | 13,551,455 | | | — | | | — | | | 13,551,455 | |
| Closed-End Mutual Funds | | 14,796,378 | | | — | | | — | | | 14,796,378 | |
| Collateral for Securities on Loan | | — | | | 3,047,450 | | | — | | | 3,047,450 | |
| Total | $ | 28,347,833 | | $ | 124,337,606 | | $ | — | | $ | 152,685,439 | |
ICON Fund
| Investments in Securities at Value* | Level 1 - Quoted
and Unadjusted
Prices | Level 2 - Other
Significant
Observable Inputs | Level 3 - Significant
Unobservable Inputs | Total |
| Common Stocks | $ | 41,567,478 | | $ | — | | $ | — | | $ | 41,567,478 | |
| Exchange Traded Funds | | 636,508 | | | — | | | — | | | 636,508 | |
| Collateral for Securities on Loan | | — | | | 511,675 | | | — | | | 511,675 | |
| Total | $ | 42,203,986 | | $ | 511,675 | | $ | — | | $ | 42,715,661 | |
ICON Long/Short Fund
| Investments in Securities at Value* | Level 1 - Quoted
and Unadjusted
Prices | Level 2 - Other
Significant
Observable Inputs | Level 3 - Significant
Unobservable
Inputs | Total |
| Common Stocks | $ | 20,208,437 | | $ | — | | $ | — | | $ | 20,208,437 | |
| Exchange Traded Funds | | 309,989 | | | — | | | — | | | 309,989 | |
| Collateral for Securities on Loan | | — | | | 1,055 | | | — | | | 1,055 | |
| Total | $ | 20,518,426 | | $ | 1,055 | | $ | — | | $ | 20,519,481 | |
ICON Opportunities Fund
| Investments in Securities at Value* | Level 1 - Quoted
and Unadjusted Prices | Level 2 - Other
Significant
Observable Inputs | Level 3 - Significant
Unobservable
Inputs | Total |
| Common Stocks | $ | 16,338,409 | | $ | — | | $ | — | | $ | 16,338,409 | |
| Exchange Traded Funds | | 211,546 | | | — | | | — | | | 211,546 | |
| Collateral for Securities on Loan | | — | | | 173,825 | | | — | | | 173,825 | |
| Total | $ | 16,549,955 | | $ | 173,825 | | $ | — | | $ | 16,723,780 | |
ICON Risk-Managed Balanced Fund
| Investments in Securities at Value* | Level 1 - Quoted
and Unadjusted
Prices | Level 2 - Other
Significant
Observable Inputs | Level 3 - Significants
Unobservable
Input | Total |
| Corporate Bonds | $ | — | | $ | 5,557,344 | | $ | — | | $ | 5,557,344 | |
| Common Stocks | | 19,540,932 | | | — | | | — | | | 19,540,932 | |
| Preferred Stocks | | 432,866 | | | — | | | — | | | 432,866 | |
| Closed-End Mutual Funds | | 1,556,127 | | | — | | | — | | | 1,556,127 | |
| Purchased Put Options | | 15,300 | | | — | | | — | | | 15,300 | |
| Total | $ | 21,545,225 | | $ | 5,557,344 | | $ | — | | $ | 27,102,569 | |
| * | Please refer to the Schedule of Investments and the Sector/Industry Classification and Credit Diversification tables for additional security details. |
There were no Level 3 securities held in any of the Funds at September 30, 2019.
| Annual Report | September 30, 2019 | 57 |
| ICON Diversified Funds | Notes to Financial Statements |
| | September 30, 2019 |
Fund Share Valuation
Fund shares are sold and redeemed on a daily basis at the NAV. NAV per share is determined daily as of the close of trading on the NYSE on each day the NYSE is open for trading. The NAV is computed by dividing the total value of each Fund’s investments and other assets, less liabilities, by the number of Fund shares outstanding.
Cash and Cash Equivalents
Idle cash may be swept into an overnight demand deposit account and is classified as cash and cash equivalents on the Statements of Assets and Liabilities. The Funds maintain cash in bank deposit accounts which, at times, may exceed United States federally insured limits. Amounts swept overnight are available on the next business day.
Foreign Currency Translation
The accounting records of the Funds are maintained in U.S. dollars. Investment securities and other assets and liabilities denominated in a foreign currency are translated daily into U.S. dollars at the prevailing rates of exchange. Income and expenses are translated into U.S. dollars at the prevailing exchange rate on the respective dates of the transactions. Purchases and sales of securities are translated into U.S. dollars at the contractual currency exchange rates established at the time of each trade.
The Funds do not isolate that portion of the results of operations resulting from changes in foreign exchange rates on investments from the fluctuations arising from changes in market prices of securities held. Net unrealized appreciation or depreciation on investments and foreign currency translations arise from changes in the value of assets and liabilities resulting from changes in the exchange rates and changes in market prices of securities held.
Options Transactions
The Funds’ use of derivatives for the year ended September 30, 2019 was limited to purchased options.
The Risk-Managed Balanced Fund’s primary investment strategy involves the use of options. Each of the other Funds may also purchase and/or write (sell) call and put options on any security in which it may invest. A Fund may use derivatives to hedge risks inherent in its portfolio, to enhance the potential return of its portfolio, to diversify its portfolio, as a substitute for taking a position in an underlying asset, to reduce transaction costs associated with managing a portfolio, or to implement an investment strategy through investments that may be more tax-efficient than a direct equity investment.
Option contracts involve market risk and liquidity risk and can be highly volatile. Should prices of securities or securities indexes move in an unexpected manner, the Funds may not achieve the desired benefits and may realize losses and thus be in a worse position than if such strategies had not been utilized.
When a Fund writes a put or call option, an amount equal to the premium received is included on the Statements of Assets and Liabilities as a liability. The amount of the liability is subsequently marked-to-market to reflect the current fair value of the option. If an option expires on its stipulated expiration date or if the Fund enters into a closing purchase transaction, a gain or loss is realized. If a written call option on an individual security is exercised, a gain or loss is realized for the sale of the underlying security, and the proceeds from the sale are increased by the premium originally received. If a written call option on a securities index is exercised, a gain or loss is realized as determined by the premium originally received, the exercise price and the fair value of the index. If a written put option on an individual security is exercised, the cost of the security acquired is decreased by the premium originally received. As a writer of an option, a Fund bears the market risk of an unfavorable change in the price of the individual security or securities index underlying the written option. Additionally, written call options may involve the risk of limiting gains.
Each Fund may also purchase put and call options. When a Fund purchases a put or call option, an amount equal to the premium paid is included on the Fund’s Statement of Assets and Liabilities as an investment, and is subsequently marked-to-market to reflect the current fair value of the option. If an option expires on the stipulated expiration date or if the Fund enters into a closing purchase or sale transaction, a gain or loss is realized. If the Fund exercises a call option on an individual security, the cost of the security acquired is increased by the premium paid for the call. If the Fund exercises a put option on an individual security, a gain or loss is realized from the sale of the underlying security, and the proceeds from such a sale are decreased by the premium originally paid. If the Fund exercises a put or a call option on a security index, a gain or loss is realized as determined by the premium originally paid, the exercise price and the fair value of the index. Written and purchased options are non-income producing securities.
| ICON Diversified Funds | Notes to Financial Statements |
| | September 30, 2019 |
For the year ended September 30, 2019, the Equity Income Fund and the Risk-Managed Balanced Fund engaged in purchased put option transactions. All open option contracts are included on each Fund’s Schedule of Investments.
The following is a summary of how these derivatives are treated in the financial statements and their impact on the Funds:
| ICON Risk-Managed Balanced Fund | Asset Derivatives | Liability Derivatives |
| Risk Exposure | Statements of Assets and
Liabilities Location | Fair Value | Statements of Assets and
Liabilities Location | Fair Value |
| Equity Contracts (Purchased Options) | Investments, at value | $ | 15,300 | | N/A | | N/A | |
| Total | | $ | 15,300 | | | $ | — | |
ICON Equity Income Fund Risk Exposure | Statements of Operations Location | Realized
Gain/(Loss) on
Derivatives
Recognized
in Income | Change in
Unrealized Appreciation/
(Depreciation)
on Derivatives
Recognized
in Income |
Equity Contracts
(Purchased Options) | Net realized gain/(loss) on Investments, options and foreign currency translations/ Change in unrealized net appreciation/(depreciation) on Investments, options and foreign currency | $ | (106,158 | ) | $ | 142,915 | |
| Total | | $ | (106,158 | ) | $ | 142,915 | |
ICON Risk-Managed Balanced Fund Risk Exposure | Statements of Operations Location | Realized
Gain/(Loss) on
Derivatives
Recognized
in Income | Change in
Unrealized Appreciation/
(Depreciation)
on Derivatives
Recognized
in Income |
Equity Contracts
(Purchased Options) | Net realized gain/(loss) on Investments, options and foreign currency translations/ Change in unrealized net appreciation/(depreciation) on Investments, options and foreign Currency | $ | (89,138 | ) | $ | (24,960 | ) |
| Total | | $ | (89,138 | ) | $ | (24,960 | ) |
| Annual Report | September 30, 2019 | 59 |
| ICON Diversified Funds | Notes to Financial Statements |
| | September 30, 2019 |
The average purchased option contracts during the year ended September 30, 2019, were as follows:
ICON Equity Income Fund Derivative Type | Unit of Measurement | Average Contracts+ | Days Held |
Purchased Options | Contracts | 65 | 223 |
| ICON Risk-Managed Balanced Fund | | | |
| | | | |
| Derivative Type | Unit of Measurement | Average Contracts+ | Days Held |
| Purchased Options | Contracts | 11 | 277 |
| + | The average is calculated based on the actual number of days with outstanding derivatives. |
The Funds value derivatives at fair value, as described above, and recognize changes in fair value currently in the results of operations. Accordingly, the Funds do not follow hedge accounting, even for derivatives employed as economic hedges.
Short Sales
The Long/Short Fund may engage in short sales (selling securities it does not own) as part of its normal investment activities. The Long/Short Fund enters into short positions in equity securities identified as being overvalued in management’s opinion.
Short sales involve market risk. If a security sold short increases in price, the Long/Short Fund may have to cover its short position at a higher price than the short sale price, resulting in a loss. These short sales are collateralized by cash and/or securities held with the Fund’s prime broker and in a segregated account at the Fund’s prime broker. The collateral required is determined daily by reference to the fair value of the short positions. Such collateral for the Fund is restricted from use. The cash collateral that is restricted from use is included on the Statement of Assets and Liabilities as “Deposits for short sales.” The securities pledged as collateral that are restricted from use are included on the Schedule of Investments. Dividends received on short sales are treated as an expense on the Statement of Operations. Liabilities for securities sold short are closed out by purchasing the applicable securities for delivery to the Fund’s prime broker. As of and for the year ended September 30, 2019, the Long/Short Fund did not engage in short selling.
Securities Lending
Under procedures adopted by the Board, the Funds may lend securities to certain approved brokers, dealers and other financial institutions to earn additional income. Collateral is received in exchange for securities on loan in the amount of at least 102% of the value of U.S. securities loaned or at least 105% of the value of non-U.S. securities loaned, marked to market daily. The Funds retain certain benefits of owning the securities, including receipt of dividends or interest generated by the security, but give up other rights including the right to vote proxies. The Funds retain the ability to recall the loans at any time and could do so in order to vote proxies or to sell the loaned securities. Each loan is collateralized by assets that generally exceed the value of the securities on loan. Collateral may consist of cash or securities issued or guaranteed by the United States government or its agencies or instrumentalities. The fair value of the loaned securities is determined daily at the close of business of the Funds and any additional required collateral is delivered to each Fund on the next business day.
The following is a summary of the Funds’ securities lending positions and related cash and non-cash collateral received as of September 30, 2019:
| | | Market Value of
Securities on Loan | | Market Value of
Cash Collateral
Received | | Market Value of
Non-Cash Collateral
Received | | Total Collateral
Received | | Excess Collateral |
| ICON Equity Income Fund | | $ | 3,320,384 | | | $ | 820,950 | | | $ | 2,552,862 | | | $ | 3,373,812 | | | $ | 53,428 | |
| ICON Flexible Bond Fund | | | 5,132,992 | | | | 3,047,450 | | | | 2,199,570 | | | | 5,247,020 | | | | 114,028 | |
| ICON Fund | | | 632,951 | | | | 511,675 | | | | 126,600 | | | | 638,275 | | | | 5,324 | |
| ICON Long/Short Fund | | | 288,742 | | | | 1,055 | | | | 294,336 | | | | 295,391 | | | | 6,649 | |
| ICON Opportunities Fund | | | 573,007 | | | | 173,825 | | | | 406,631 | | | | 580,456 | | | | 7,449 | |
Generally, in the event of borrower default, the Funds have the right to use the collateral to offset any losses incurred. In the event the Funds are delayed or prevented from exercising their rights to dispose of the collateral, there may be a potential loss to the Funds. Some of these losses may be indemnified by the lending agent.
| ICON Diversified Funds | Notes to Financial Statements |
| | September 30, 2019 |
The Funds have elected to invest cash collateral received from lending in the State Street Navigator Securities Lending Government Money Market Portfolio which is disclosed on the Schedules of Investments. The Funds bear the risk of loss with respect to the investment of cash collateral. The State Street Navigator Securities Lending Government Money Market Portfolio is a Government Money Market Portfolio designed to provide continuous daily liquidity. Non-Cash collateral received consists of securities issued or guaranteed by the United States government or its agencies or instrumentalities with remaining maturities ranging from overnight to 30 years. Non-cash collateral is not disclosed on the Funds’ Schedules of Investments or their Statements of Assets and Liabilities as the Funds do not have the ability to re-hypothecate these securities. The net securities lending income earned by the Funds for the year ended September 30, 2019, is included in the Statements of Operations.
The value of the collateral could include collateral held for securities that were sold on or before September 30, 2019. It may also include collateral received from the pre-funding of security loans.
Security loans consist of equity and corporate fixed income securities and generally do not have a stated maturity date. The Funds may recall a loaned security at any time.
Income Taxes, Dividends, and Distributions
The Funds intend to continue to qualify as regulated investment companies under Subchapter M of the Internal Revenue Code and, accordingly, the Funds will generally not be subject to federal and state income taxes or federal excise taxes to the extent that they intend to make sufficient distributions of net investment income and net realized capital gains. As of and during the year ended September 30, 2019, the Funds did not have a liability for any unrecognized tax benefits in the accompanying financial statements. The Funds recognize the interest and penalties, if any, related to the unrecognized tax benefits as income tax expense in the Statements of Operations. During the period, the Funds did not incur any interest or penalties.
Dividends paid by the Funds from net investment income and distributions of net realized short-term gains are, for federal income tax purposes, taxable as ordinary income to shareholders.
Dividends and distributions to shareholders are recorded by the Funds on the ex-dividend/distribution date. The Flexible Bond Fund distributes net investment income, if any, to shareholders monthly. The Equity Income Fund and the Risk-Managed Balanced Fund intend to distribute net investment income, if any, to shareholders quarterly. The other Funds distribute income, if any, annually. The Funds distribute net realized capital gains, if any, to shareholders at least annually, if not offset by capital loss carryforwards. Income distributions and capital gain distributions are determined in accordance with income tax regulations, which may differ from GAAP.
Management has analyzed the Funds’ tax positions taken on federal income tax returns for all open tax periods and has concluded that no provision for federal income tax is required in the Funds’ financial statements.
The Funds file U.S. tax returns. While the statute of limitations remains open to examine the Funds’ U.S. tax returns filed for the past three years, no examinations are in progress or anticipated at this time. The Funds are not aware of any tax positions for which it is reasonably possible that the total amounts of unrecognized tax benefits will significantly change in the next twelve months.
Certain foreign countries impose a capital gains tax which is accrued by the Funds based on the unrealized appreciation, if any, on affected securities. Any accrual would reduce a Fund’s NAV. The tax is paid when the gain is realized and is included in capital gains tax in the Statements of Operations.
Investment Income
Dividend income is recorded on the ex-dividend date. Non-cash dividends included in dividend income, if any, are recorded at the fair value of the securities received. Interest income is accrued as earned. Certain dividends from foreign securities are recorded as soon as the Funds are informed of the dividend if such information is obtained subsequent to the ex-dividend date. Discounts and premiums on fixed income securities purchased are accreted or amortized to income over the life of the respective securities based on the effective yield. Paydown gains and losses on mortgage-related and other asset-backed securities are recorded as components of interest income on the Statements of Operations.
Investment Transactions
Security transactions are accounted for no later than one business day after the trade date. However, for financial reporting purposes, security transactions are accounted for on the trade date. Gains and losses on securities sold are determined on the basis of identified cost.
| Annual Report | September 30, 2019 | 61 |
| ICON Diversified Funds | Notes to Financial Statements |
| | September 30, 2019 |
Withholding Tax
Withholding taxes on foreign dividends have been provided for in accordance with the Funds’ understanding of the applicable country’s tax rules and rates.
Other
The Funds hold certain investments which pay dividends to their shareholders based upon available funds from operations. It is possible for these dividends to exceed the underlying investments’ taxable earnings and profits resulting in the excess portion of such dividends being designated as a return of capital. Distributions received from investments in securities that represent a return of capital or capital gains are recorded as a reduction of the cost of investments or as a realized gain, respectively.
The ability of issuers of debt securities held by the Funds to meet their obligations may be affected by economic and political developments in a specific country or region.
Allocation of Expenses
Each class of a Fund’s shares bears expenses incurred specifically on its behalf and, in addition, each class bears a portion of general expenses, based upon relative net assets of each class or number of shareholder accounts. Expenses which cannot be directly attributed to a specific Fund in the Trust are apportioned between all Funds in the Trust based upon relative net assets or number of shareholder accounts. In calculating the net asset value per share of each class, investment income, realized and unrealized gains and losses and expenses other than class-specific expenses are allocated daily to each class of shares based upon the proportion of net assets.
Below are additional class level expenses for the year ended September 30, 2019 that are included on the Statements of Operations:
| Fund | | Printing Fees* | | Transfer Agent Fees* | | Registration Fees |
| ICON Equity Income Fund | | | | | | | | | | | | |
| Class S | | $ | 6,125 | | | $ | 74,582 | | | $ | 18,486 | |
| Class C | | | 1,936 | | | | 20,169 | | | | 14,109 | |
| Class A | | | 712 | | | | 10,098 | | | | 12,725 | |
| ICON Flexible Bond Fund | | | | | | | | | | | | |
| Class S | | | 6,379 | | | | 112,679 | | | | 29,979 | |
| Class C | | | 489 | | | | 4,838 | | | | 11,865 | |
| Class A | | | 285 | | | | 5,798 | | | | 8,001 | |
| ICON Fund | | | | | | | | | | | | |
| Class S | | | 2,402 | | | | 33,788 | | | | 16,397 | |
| Class C | | | 675 | | | | 18,887 | | | | 13,693 | |
| Class A | | | 444 | | | | 11,592 | | | | 12,033 | |
| ICON Long/Short Fund | | | | | | | | | | | | |
| Class S | | | 1,516 | | | | 23,125 | | | | 14,325 | |
| Class C | | | 474 | | | | 8,825 | | | | 13,724 | |
| Class A | | | 513 | | | | 12,540 | | | | 15,342 | |
| ICON Risk-Managed Balanced Fund | | | | | | | | | | | | |
| Class S | | | 1,454 | | | | 20,319 | | | | 13,264 | |
| Class C | | | 1,366 | | | | 22,131 | | | | 17,674 | |
| Class A | | | 275 | | | | 5,136 | | | | 13,101 | |
| * | Printing fees and Transfer agent out of pocket fees are a Fund level expense. |
| 3. | FEES, OTHER SERVICES AND OTHER TRANSACTIONS WITH AFFILIATES |
Investment Advisory Fees
ICON Advisers, Inc. (“ICON Advisers”) serves as investment adviser to the Funds and is responsible for managing the Funds’ portfolios of investments. ICON Advisers receives a monthly management fee that is computed daily at an annual rate of 0.60% of average daily net assets of the Flexible Bond Fund, 0.75% of average daily net assets of the Equity Income Fund, ICON Fund, Opportunities Fund and Risk-Managed Balanced Fund, and 0.85% of average daily net assets of the Long/Short Fund.
| ICON Diversified Funds | Notes to Financial Statements |
| | September 30, 2019 |
ICON Advisers has contractually agreed to limit the Funds’ expenses (exclusive of brokerage, interest, taxes, dividends on short sales, acquired fund fees and expenses and extraordinary expenses) to the extent necessary to ensure that the Funds’ expenses do not exceed the following amounts:
| Fund | | Fund | | Class S | | Class C | | Class A |
| ICON Equity Income Fund | | | — | | | | 0.99% | | | | 1.99% | | | | 1.24% | |
| ICON Flexible Bond Fund | | | — | | | | 0.75% | | | | 1.60% | | | | 1.00% | |
| ICON Fund | | | — | | | | 1.25% | | | | 2.25% | | | | 1.50% | |
| ICON Long/Short Fund | | | — | | | | 1.25% | | | | 2.30% | | | | 1.55% | |
| ICON Opportunities Fund | | | 1.30% | | | | — | | | | — | | | | — | |
| ICON Risk-Managed Balanced Fund | | | — | | | | 1.20% | | | | 2.20% | | | | 1.45% | |
The Funds’ expense limitations, will continue in effect until at least January 31, 2021. To the extent ICON Advisers reimburses or absorbs fees and expenses, it may seek payment of such amounts for up to three years after the expenses were reimbursed or absorbed. A Fund will make no such payment, however, if the total Fund operating expenses exceed the expense limits in effect at the time these payments are proposed.
As of September 30, 2019, the following amounts were available for recoupment by ICON Advisers based upon their potential expiration dates:
| Fund | | Expires
2020 | | Expires
2021 | | Expires
2022 |
| ICON Equity Income Fund | | $ | 92,199 | | | $ | 146,948 | | | $ | 178,284 | |
| ICON Flexible Bond Fund | | | 162,616 | | | | 184,480 | | | | 286,844 | |
| ICON Fund | | | 16,031 | | | | 9,658 | | | | 25,082 | |
| ICON Long/Short Fund | | | 66,063 | | | | 54,396 | | | | 80,910 | |
| ICON Opportunities Fund | | | 3,673 | | | | 11,238 | | | | 26,483 | |
| ICON Risk-Managed Balanced Fund | | | 53,919 | | | | 45,213 | | | | 68,339 | |
Accounting, Custody and Transfer Agent Fees
ALPS Fund Services, Inc. (“ALPS”) serves as the fund accounting agent for the Trust. For its services, the Trust pays ALPS a fee, that is calculated daily and paid monthly, which is the greater of an annual rate based on the aggregate average daily net assets of the Trust or a contractual minimum annual fee.
State Street is the custodian of the Trust’s investments. For its services, the Trust pays State Street asset-based fees that vary according to the number of positions and transactions, plus out-of-pocket expenses.
ALPS is the Trust’s transfer agent. For these services, the Trust pays an annual fee plus annual base fee per Fund, per account fees and out-of-pocket expenses.
Administrative Services
The Trust has entered into an administrative services agreement with ICON Advisers pursuant to which ICON Advisers oversees the administration of the Trust’s business and affairs. This agreement provides for an annual fee of 0.05% on the Trust’s first $1.5 billion of average daily net assets, 0.045% on the next $1.5 billion of average daily net assets, 0.040% on the next $2 billion of average daily net assets and 0.030% on average daily net assets over $5 billion. For the year ended September 30, 2019, each Fund’s payment for administrative services to ICON Advisers is included on the Statements of Operations. The administrative services agreement provides that ICON Advisers will not be liable for any error of judgment, mistake of law, or any loss suffered by the Trust in connection with matters to which the administrative services agreement relates, except for a loss resulting from willful misfeasance, bad faith or negligence by ICON Advisers in the performance of its duties.
ICON Advisers has a sub-administration agreement, with ALPS, under which ALPS assists ICON Advisers with the administration and business affairs of the Trust. For its services, ICON Advisers pays ALPS a fee, that is calculated daily and paid monthly, which is the greater of an annual rate based on the aggregate average daily net assets of the Trust or a contractual minimum annual fee.
Distribution Fees
ICON Distributors, Inc. (“IDI” or “Distributor”), a wholly-owned subsidiary of ICON Management and Research and affiliate of ICON Advisers, Inc., serves the Trust as Distributor. The Trust has adopted a Distribution Plan pursuant to Rule 12b-1 under the 1940 Act ("12b-1 Plan”) under which the Funds are authorized to compensate or reimburse the Distributor for the sale and distribution of shares and for other shareholder services.
| Annual Report | September 30, 2019 | 63 |
| ICON Diversified Funds | Notes to Financial Statements |
| | September 30, 2019 |
The Flexible Bond Fund Class C shareholders pay an annual distribution fee of 0.85% of average daily net assets and Class A shareholders pay an annual distribution fee of 0.25% of average daily net assets. The shareholders of the other Funds pay an annual distribution fee of 1.00% of average daily net assets for Class C shares and an annual distribution fee of 0.25% of average daily net assets for Class A shares. There is no annual distribution fee for Class S shares or the ICON Opportunities Fund. The total amount paid by each Fund under the 12b-1 Plan is shown on the Statements of Operations.
Class A Shares are subject to an initial sales charge and the public offering price of Class A shares equals net asset value plus the applicable sales charge, which is a maximum of 5.75% (4.75% for Class A shares of the ICON Flexible Bond Fund). For the year ended September 30, 2019, IDI collected sales charges on purchases of Class A Shares, the majority of which were paid out as concessions to financial intermediaries, as follows:
| Fund | | Sales Charges Collected |
| ICON Equity Income Fund Class A | | $ | 6,952 | |
| ICON Flexible Bond Fund Class A | | | 10,286 | |
| ICON Fund Class A | | | 532 | |
| ICON Long/Short Fund Class A | | | 1,347 | |
| ICON Risk-Managed Balanced Fund Class A | | | 120 | |
In addition, IDI receives a contingent deferred sales charge of 1.00% of the purchase price on redemptions of Class C shares made within one year following the date of purchase. A 1.00% contingent deferred sales charge may also apply to certain redemptions of Class A shares made within one year following the purchase of $1 million or more without an initial sales charge. For the year ended September 30, 2019, IDI collected the following contingent deferred sales charges:
| Fund | | Contingent Deferred Sales
Charges Collected |
| ICON Equity Income Fund Class C | | $ | 408 | |
| ICON Flexible Bond Fund Class C | | | 14 | |
| ICON Fund Class C | | | 389 | |
| ICON Long/Short Fund Class C | | | 136 | |
| ICON Risk-Managed Balanced Fund Class C | | | 655 | |
Other Related Parties
Certain Officers and Directors of ICON Advisers are also Officers and Trustees of the Funds; however, such Officers and Trustees (with the exception of the Chief Compliance Officer, “CCO”) receive no compensation from the Funds. The Trust pays a portion of the CCO’s salary and the remaining portion, along with other employee related expenses, is paid by ICON Advisers. For the year ended September 30, 2019, the total related amounts paid by the Funds under this arrangement are included in Other Expenses on the Statements of Operations.
The Funds may reimburse ICON Advisers for legal work performed for the Funds by its attorneys outside of the advisory and administration contracts. The Board reviews and approves such reimbursements. For the year ended September 30, 2019, the total related amounts accrued by the Funds under this arrangement was $0.
The Flexible Bond Fund engaged in two cross trade transactions during the year ended September 30, 2019, pursuant to Rule 17a-7 under the 1940 Act. The first cross trade was between the Flexible Bond Fund and the Equity Income Fund on January 15, 2019. The second cross trade was between the Flexible Bond Fund and a separate investment portfolio that is sub-advised by ICON Advisers on February 21, 2019. Generally, cross trading is the buying or selling of portfolio securities between funds or investment portfolios to which the Adviser serves as the investment adviser or sub-adviser. The Board previously adopted procedures that apply to transactions between the Funds and its affiliates pursuant to Rule 17a-7. At its regularly scheduled meetings, the Board reviews such transactions as of the most current calendar quarter for compliance with the requirements set forth by Rule 17a-7 and the Funds’ procedures. The procedures require that the transactions be a purchase or sale for no consideration other than cash payment against prompt delivery of a security for which market quotations are readily available, and be consistent with the investment policies of each Fund.
| ICON Diversified Funds | Notes to Financial Statements |
| | September 30, 2019 |
Transactions related to cross trades during the year ended September 30, 2019 were as follows:
Fund | | Transaction | | Date | | Security | | Shares | | Execution Price | | Realized Gain/(Loss) |
| ICON Equity Income Fund | | | Sale | | | | January 15, 2019 | | | Equity Commonwealth
6.5% Perpetual Pfd | | | 10,000.00 | | | $ | 25.60 | | | $ | (3,721 | ) |
| ICON Flexible Bond Fund | | | Purchase | | | | January 15, 2019 | | | Equity Commonwealth
6.5% Perpetual Pfd | | | 10,000.00 | | | | 25.60 | | | $ | — | |
| ICON Flexible Bond Fund | | | Purchase | | | | February 21, 2019 | | | Argo Group US, Inc.
6.5% 9/15/42 Pfd | | | 10,000.00 | | | | 25.50 | | | $ | — | |
The Trust has entered into an uncommitted, unsecured, revolving Line of Credit agreement/arrangement with State Street to provide temporary funding for redemption requests. The maximum borrowing limit is $30 million. Interest on domestic borrowings is charged at a rate quoted and determined by State Street. The interest rate as of September 30, 2019 was 3.27%. The Line of Credit agreement/arrangement expires on March 16, 2020.
For the year ended September 30, 2019, the average outstanding loan by Fund was as follows:
| Fund | | Maximum Borrowing
(10/01/18 - 09/30/19) | | Average Borrowing
(10/01/18 - 09/30/19)^ | | Average Interest Rates
(10/01/18 - 09/30/19)^ |
| ICON Equity Income Fund* | | $ | 2,245,666 | | | $ | 298,816 | | | | 3.63% | |
| ICON Flexible Bond Fund* | | | 1,132,181 | | | | 359,512 | | | | 3.62% | |
| ICON Fund* | | | 338,117 | | | | 84,681 | | | | 3.64% | |
| ICON Long/Short Fund* | | | 2,859,202 | | | | 177,759 | | | | 3.66% | |
| ICON Opportunities Fund* | | | 421,781 | | | | 103,876 | | | | 3.60% | |
| * | There were no outstanding borrowings under this agreement/arrangement as of September 30, 2019. |
| ^ | The average is calculated based on the actual number of days with outstanding borrowings. |
| 5. | PURCHASES AND SALES OF INVESTMENT SECURITIES |
For the year ended September 30, 2019, the aggregate cost of purchases and proceeds from sales of investment securities (excluding securities sold short, short-term securities and written options contracts) was as follows:
Fund | | Purchases of
Securities | | Proceeds from
Sales of Securities | | Purchases of Long
Term U.S.
Government Obligations | | Proceeds from
Sales of Long Term
U.S. Government Obligations |
| ICON Equity Income Fund | | $ | 93,093,555 | | | $ | 90,911,630 | | | $ | — | | | $ | — | |
| ICON Flexible Bond Fund | | | 214,069,429 | | | | 159,687,430 | | | | 9,652,617 | | | | 18,082,000 | |
| ICON Fund | | | 13,497,231 | | | | 20,540,558 | | | | — | | | | — | |
| ICON Long/Short Fund | | | 6,653,484 | | | | 13,967,340 | | | | — | | | | — | |
| ICON Opportunities Fund | | | 7,028,720 | | | | 9,865,111 | | | | — | | | | — | |
| ICON Risk-Managed Balanced Fund | | | 16,456,975 | | | | 18,923,628 | | | | 1,724,522 | | | | 2,769,480 | |
The following information is presented on an income tax basis. Differences between GAAP and federal income tax purposes that are permanent in nature are reclassified within the capital accounts. Temporary differences do not require reclassification. Temporary and permanent differences do not impact the NAVs of the Funds.
Under current law, capital losses maintain their character as short-term or long-term and are carried forward to the next tax year without expiration.
| Annual Report | September 30, 2019 | 65 |
| ICON Diversified Funds | Notes to Financial Statements |
| | September 30, 2019 |
The capital losses with no expiration were as follows:
| Fund | | Short-Term | | Long-Term |
| ICON Flexible Bond Fund | | $ | 775,746 | | | $ | 1,668,701 | |
| ICON Risk-Managed Balanced Fund | | | — | | | | 17,398 | |
During the year ended September 30, 2019, the ICON Flexible Bond Fund utilized capital loss carryforwards of $549,954.
The following Funds elect to defer to the period ending September 30, 2020, capital losses recognized during the period November 1, 2018 to September 30, 2019:
| Fund | | Capital Losses Deferred |
| ICON Flexible Bond Fund | | $ | 217,260 | |
| ICON Opportunities Fund | | | 1,151,785 | |
| ICON Risk-Managed Balanced Fund | | | 340,806 | |
The following Funds elect to defer to the period ending September 30, 2020, late year ordinary losses:
Fund | | Ordinary Losses Deferred |
| ICON Fund | | $ | 58,149 | |
| ICON Long/Short Fund | | | 55,541 | |
| ICON Opportunities Fund | | | 68,106 | |
For the year ended September 30, 2019, the following reclassifications were made, which had no impact on results of operations or net assets.
| Fund | | Paid-in Capital | | Total Distributable
Earnings |
| ICON Equity Income Fund | | $ | 5,383 | | | $ | (5,383 | ) |
| ICON Flexible Bond Fund | | | (39 | ) | | | 39 | |
| ICON Fund | | | (179,724 | ) | | | 179,724 | |
| ICON Long/Short Fund | | | (169,498 | ) | | | 169,498 | |
| ICON Opportunities Fund | | | (129,703 | ) | | | 129,703 | |
| ICON Risk-Managed Balanced Fund | | | 6,942 | | | | (6,942 | ) |
For ICON Fund, Long/Short Fund and Opportunities Fund included in the amounts for reclassified were a net operating loss offset to paid in capital of $179,724, $169,498 and $109,709.
The tax characteristics of distributions paid to shareholders during the fiscal year ended September 30, 2019, were as follows:
Fund | | Ordinary Income | | Long-Term Capital
Gains |
| ICON Equity Income Fund | | $ | 2,166,210 | | | $ | 39,923 | |
| ICON Flexible Bond Fund | | | 6,122,522 | | | | — | |
| ICON Fund | | | — | | | | 541,496 | |
| ICON Long/Short Fund | | | — | | | | 312,036 | |
| ICON Opportunities Fund | | | 19,994 | | | | 3,815,815 | |
| ICON Risk-Managed Balanced Fund | | | 222,948 | | | | — | |
The tax characteristics of distributions paid to shareholders during the fiscal year ended September 30, 2018, were as follows:
Fund | | Ordinary Income | | Long-Term Capital
Gains |
| ICON Equity Income Fund | | $ | 2,315,668 | | | $ | — | |
| ICON Flexible Bond Fund | | | 3,390,436 | | | | — | |
| ICON Opportunities Fund | | | — | | | | 307,810 | |
| ICON Risk-Managed Balanced Fund | | | 166,410 | | | | — | |
| ICON Diversified Funds | Notes to Financial Statements |
| | September 30, 2019 |
As of September 30, 2019, the components of accumulated earnings/(deficit) on a tax basis were as follows:
| Fund | | Undistributed
Ordinary Income | | Accumulated Capital
Gains/(Losses) | | Other Cumulative
Effect of Timing
Differences | | Unrealized
Appreciation/(Depreciation)* | | Total Accumulated
Earnings/(Deficit) |
| ICON Equity Income Fund | | $ | 573,127 | | | $ | 918,409 | | | $ | — | | | $ | 3,272,005 | | | $ | 4,763,541 | |
| ICON Flexible Bond Fund | | | 140,015 | | | | (2,661,707 | ) | | | — | | | | 199,396 | | | | (2,322,296 | ) |
| ICON Fund | | | — | | | | 2,241,060 | | | | (58,149 | ) | | | 10,241,452 | | | | 12,424,363 | |
| ICON Long/Short Fund | | | — | | | | 757,120 | | | | (55,541 | ) | | | 3,610,020 | | | | 4,311,599 | |
| ICON Opportunities Fund | | | — | | | | (1,151,785 | ) | | | (68,106 | ) | | | 1,860,413 | | | | 640,522 | |
| ICON Risk-Managed Balanced Fund | | | 11,623 | | | | (358,204 | ) | | | — | | | | 2,381,078 | | | | 2,034,497 | |
| * | Differences between the book-basis and tax-basis unrealized appreciation/(depreciation) are attributable primarily to tax treatment of tax deferral of losses on wash sales. |
As of September 30, 2019, cost on investments for federal income tax purposes and the amount of net unrealized appreciation/(depreciation) were as follows:
Fund | | Gross Appreciation
(excess of value over tax cost | | Gross Depreciation
(excess of tax cost over value) | | Net Appreciation/
(Depreciation) of Foreign Currency | | Net Unrealized
Appreciation/ (Depreciation)* | | Cost of Investments
for Income Tax Purposes |
| ICON Equity Income Fund | | $ | 5,846,623 | | | $ | (2,574,641 | ) | | $ | 23 | | | $ | 3,272,005 | | | $ | 77,850,852 | |
| ICON Flexible Bond Fund | | | 548,827 | | | | (349,431 | ) | | | — | | | | 199,396 | | | | 152,486,043 | |
| ICON Fund | | | 11,387,464 | | | | (1,146,018 | ) | | | 6 | | | | 10,241,452 | | | | 32,474,215 | |
| ICON Long/Short Fund | | | 4,468,395 | | | | (858,375 | ) | | | — | | | | 3,610,020 | | | | 16,909,461 | |
| ICON Opportunities Fund | | | 2,991,401 | | | | (1,130,988 | ) | | | — | | | | 1,860,413 | | | | 14,863,367 | |
| ICON Risk-Managed Balanced Fund | | | 3,416,826 | | | | (1,035,750 | ) | | | 2 | | | | 2,381,078 | | | | 24,721,493 | |
| * | This balance includes appreciation/(depreciation) of foreign currency. |
| 7. | RECENT ACCOUNTING PRONOUNCEMENTS |
In March 2017, the Financial Accounting Standards Board (“FASB”) issued Accounting Standards Update No. 2017-08 (“ASU 2017-08"), “Receivables—Nonrefundable Fees and Other Costs (Subtopic 310-20): Premium Amortization on Purchased Callable Debt Securities.” ASU 2017-08 changed the amortization period for certain callable debt securities held at a premium. Specifically, it required the premium to be amortized to the earliest call date. The Funds have adopted and applied ASU 2017-08 on a modified retrospective basis through a cumulative-effect adjustment as of the beginning of the period of adoption. As a result of the adoption of ASU 2017-08, as of January 1, 2019, the amortized cost basis of investments in the Equity Income Fund was reduced by $26,513 and unrealized appreciation of investments was increased by $26,513, the amortized cost basis of investments in the Flexible Income Fund was reduced by $508,011 and unrealized appreciation of investments was increased by $508,011 and the amortized cost basis of investments in the Risk-Managed Balanced Fund was reduced by $34,982 and unrealized appreciation of investments was increased by $34,982. The adoption of ASU 2017-08 had no impact on beginning net assets, the current period results from operations, or any prior period information presented in the financial statements.
In August 2018, the Financial Accounting Standards Board (“FASB”) issued Accounting Standards Update (“ASU”) 2018-13, which changes the fair value measurement disclosure requirements of FASB Accounting Standards Codification Topic 820, Fair Value Measurement. The update to Topic 820 includes new, eliminated, and modified disclosure requirements. ASU 2018-13 is effective for fiscal years beginning after December 15, 2019, including interim periods. Early adoption is permitted for any eliminated or modified disclosures. Management has eliminated and modified disclosures and is currently evaluating the impact of the remaining ASU.
| Annual Report | September 30, 2019 | 67 |
| ICON Diversified Funds | Report of Independent Registered
Public Accounting Firm |
To the Shareholders and Board of Trustees of
ICON Funds
Opinion on the Financial Statements
We have audited the accompanying statements of assets and liabilities, including the schedules of investments, of ICON Equity Income Fund, ICON Flexible Bond Fund, ICON Fund, ICON Long/Short Fund, ICON Opportunities Fund, and ICON Risk-Managed Balanced Fund (the “Funds”), each a series of ICON Funds, as of September 30, 2019, and the related statements of operations for the year then ended, the statements of changes in net assets for each of the two years in the period then ended, including the related notes, and the financial highlights for each of the four years in the period then ended (collectively referred to as the “financial statements”). In our opinion, the financial statements present fairly, in all material respects, the financial position of each of the Funds as of September 30, 2019, the results of their operations for the year then ended, the changes in their net assets for each of the two years in the period then ended, and the financial highlights for each of the four years in the period then ended, in conformity with accounting principles generally accepted in the United States of America.
The Funds’ financial highlights for the year ended September 30, 2015, were audited by other auditors whose report dated November 18, 2015, expressed an unqualified opinion on those financial highlights.
Basis for Opinion
These financial statements are the responsibility of the Funds’ management. Our responsibility is to express an opinion on the Funds’ financial statements based on our audits. We are a public accounting firm registered with the Public Company Accounting Oversight Board (United States) (“PCAOB”) and are required to be independent with respect to the Funds in accordance with the U.S. federal securities laws and the applicable rules and regulations of the Securities and Exchange Commission and the PCAOB.
We conducted our audits in accordance with the standards of the PCAOB. Those standards require that we plan and perform the audit to obtain reasonable assurance about whether the financial statements are free of material misstatement, whether due to error or fraud.
Our audits included performing procedures to assess the risks of material misstatement of the financial statements, whether due to error or fraud, and performing procedures that respond to those risks. Such procedures included examining, on a test basis, evidence regarding the amounts and disclosures in the financial statements. Our procedures included confirmation of securities owned as of September 30, 2019, by correspondence with the custodian and brokers. Our audits also included evaluating the accounting principles used and significant estimates made by management, as well as evaluating the overall presentation of the financial statements. We believe that our audits provide a reasonable basis for our opinion.
We have served as the Funds’ auditor since 2016.

COHEN & COMPANY, LTD.
Cleveland, Ohio
November 25, 2019
| ICON Diversified Funds | Disclosure of Fund Expenses |
| | September 30, 2019 (Unaudited) |
Example
As a shareholder of a Fund you may pay two types of fees: transaction fees and fund-related fees. Certain funds charge transaction fees, including sales charges (loads) on purchase payments, reinvested dividends, or other distributions; redemption fees; and exchange fees. Funds also incur various ongoing expenses, including management fees, distribution and/or service fees, and other fund expenses, which are indirectly paid by shareholders.
This Example is intended to help you understand your ongoing costs (in dollars) of investing in the various ICON Funds and to compare these costs with the ongoing costs of investing in other mutual funds. This Example is based on an investment of $1,000 invested at the beginning of the six-month period and held for the six-month period (04/01/19 – 09/30/19).
Actual Expenses
The first line in the table for each Fund provides information about actual account values and actual expenses. The Example includes, but is not limited to, management fees, 12b-1 fees, fund accounting, custody and transfer agent fees. However, the Example does not include client specific fees, such as the $15 fee charged to IRA accounts, or the $15 fee charged for wire redemptions. You may use this information, together with the amount you invested, to estimate the expenses that you paid over the period. Simply divide your account value by $1,000 (for example, an $8,600 account value divided by $1,000 = 8.6), then multiply the result by the number in the first line for each Fund under the heading entitled “Expenses Paid During Period” to estimate the expenses you paid on your account during this period.
Hypothetical Example for Comparison Purposes
The second line in the table for each Fund provides information about hypothetical account values and hypothetical expenses based on the Fund’s actual expense ratio and an assumed rate of return of 5% per year before expenses, which is not the Fund’s actual return. The hypothetical account values and expenses may not be used to estimate the actual ending account balance or expenses you paid for the period. You may use this information to compare the ongoing costs of investing in the Fund and other funds. To do so, compare this 5% hypothetical example with the 5% hypothetical examples that appear in the shareholder reports of the other funds. Please note that the expenses shown in the table are meant to highlight your ongoing costs only and do not reflect any transactional costs, such as sales charges (loads), redemption fees, or exchange fees that may be charged by other funds. Therefore, this information is useful in comparing ongoing costs only, and will not help you determine the relative total costs of owning different funds.
| | | Beginning Account
Value
April 1, 2019 | | Ending Account
Value
September 30, 2019 | | Expense Ratio(a) | | Expenses Paid
During period
April 1, 2019 -
September 30, 2019(b) |
| ICON Equity Income Fund | | | | | | | | | | | | | | | | |
| Class S | | | | | | | | | | | | | | | | |
| Actual | | $ | 1,000.00 | | | $ | 1,040.00 | | | | 0.99% | | | $ | 5.06 | |
| Hypothetical (5% return before expenses) | | $ | 1,000.00 | | | $ | 1,020.10 | | | | 0.99% | | | $ | 5.01 | |
| Class C | | | | | | | | | | | | | | | | |
| Actual | | $ | 1,000.00 | | | $ | 1,034.40 | | | | 1.99% | | | $ | 10.15 | |
| Hypothetical (5% return before expenses) | | $ | 1,000.00 | | | $ | 1,015.09 | | | | 1.99% | | | $ | 10.05 | |
| Class A | | | | | | | | | | | | | | | | |
| Actual | | $ | 1,000.00 | | | $ | 1,038.80 | | | | 1.24% | | | $ | 6.34 | |
| Hypothetical (5% return before expenses) | | $ | 1,000.00 | | | $ | 1,018.85 | | | | 1.24% | | | $ | 6.28 | |
| | | | | | | | | | | | | | | | | |
| ICON Flexible Bond Fund | | | | | | | | | | | | | | | | |
| Class S | | | | | | | | | | | | | | | | |
| Actual | | $ | 1,000.00 | | | $ | 1,030.20 | | | | 0.75% | | | $ | 3.82 | |
| Hypothetical (5% return before expenses) | | $ | 1,000.00 | | | $ | 1,021.31 | | | | 0.75% | | | $ | 3.80 | |
| Class C | | | | | | | | | | | | | | | | |
| Actual | | $ | 1,000.00 | | | $ | 1,025.80 | | | | 1.60% | | | $ | 8.13 | |
| Hypothetical (5% return before expenses) | | $ | 1,000.00 | | | $ | 1,017.05 | | | | 1.60% | | | $ | 8.09 | |
| Class A | | | | | | | | | | | | | | | | |
| Actual | | $ | 1,000.00 | | | $ | 1,027.80 | | | | 1.00% | | | $ | 5.08 | |
| Hypothetical (5% return before expenses) | | $ | 1,000.00 | | | $ | 1,020.05 | | | | 1.00% | | | $ | 5.06 | |
| Annual Report | September 30, 2019 | 69 |
| ICON Diversified Funds | Disclosure of Fund Expenses |
| | September 30, 2019 (Unaudited) |
| | | Beginning Account
Value
April 1, 2019 | | Ending Account
Value
September 30, 2019 | | Expense Ratio(a) | | Expenses Paid
During period
April 1, 2019 -
September 30, 2019(b) |
| ICON Fund | | | | | | | | |
| Class S | | | | | | | | | | | | | | | | |
| Actual | | $ | 1,000.00 | | | $ | 1,056.00 | | | | 1.23% | | | $ | 6.34 | |
| Hypothetical (5% return before expenses) | | $ | 1,000.00 | | | $ | 1,018.90 | | | | 1.23% | | | $ | 6.23 | |
| Class C | | | | | | | | | | | | | | | | |
| Actual | | $ | 1,000.00 | | | $ | 1,050.30 | | | | 2.26% | | | $ | 11.62 | |
| Hypothetical (5% return before expenses) | | $ | 1,000.00 | | | $ | 1,013.74 | | | | 2.26% | | | $ | 11.41 | |
| Class A | | | | | | | | | | | | | | | | |
| Actual | | $ | 1,000.00 | | | $ | 1,055.30 | | | | 1.50% | | | $ | 7.73 | |
| Hypothetical (5% return before expenses) | | $ | 1,000.00 | | | $ | 1,017.55 | | | | 1.50% | | | $ | 7.59 | |
| | | | | | | | | | | | | | | | | |
| ICON Long/Short Fund | | | | | | | | | | | | | | | | |
| Class S | | | | | | | | | | | | | | | | |
| Actual | | $ | 1,000.00 | | | $ | 1,042.30 | | | | 1.23% | | | $ | 6.30 | |
| Hypothetical (5% return before expenses) | | $ | 1,000.00 | | | $ | 1,018.90 | | | | 1.23% | | | $ | 6.23 | |
| Class C | | | | | | | | | | | | | | | | |
| Actual | | $ | 1,000.00 | | | $ | 1,036.80 | | | | 2.27% | | | $ | 11.59 | |
| Hypothetical (5% return before expenses) | | $ | 1,000.00 | | | $ | 1,013.69 | | | | 2.27% | | | $ | 11.46 | |
| Class A | | | | | | | | | | | | | | | | |
| Actual | | $ | 1,000.00 | | | $ | 1,040.70 | | | | 1.53% | | | $ | 7.83 | |
| Hypothetical (5% return before expenses) | | $ | 1,000.00 | | | $ | 1,017.40 | | | | 1.53% | | | $ | 7.74 | |
| | | | | | | | | | | | | | | | | |
| ICON Opportunities Fund | | | | | | | | | | | | | | | | |
| Actual | | $ | 1,000.00 | | | $ | 1,037.60 | | | | 1.30% | | | $ | 6.64 | |
| Hypothetical (5% return before expenses) | | $ | 1,000.00 | | | $ | 1,018.55 | | | | 1.30% | | | $ | 6.58 | |
| | | | | | | | | | | | | | | | | |
| ICON Risk-Managed Balanced Fund | | | | | | | | | | | | | | | | |
| Class S | | | | | | | | | | | | | | | | |
| Actual | | $ | 1,000.00 | | | $ | 1,038.10 | | | | 1.20% | | | $ | 6.13 | |
| Hypothetical (5% return before expenses) | | $ | 1,000.00 | | | $ | 1,019.05 | | | | 1.20% | | | $ | 6.07 | |
| Class C | | | | | | | | | | | | | | | | |
| Actual | | $ | 1,000.00 | | | $ | 1,033.20 | | | | 2.20% | | | $ | 11.21 | |
| Hypothetical (5% return before expenses) | | $ | 1,000.00 | | | $ | 1,014.04 | | | | 2.20% | | | $ | 11.11 | |
| Class A | | | | | | | | | | | | | | | | |
| Actual | | $ | 1,000.00 | | | $ | 1,037.00 | | | | 1.45% | | | $ | 7.40 | |
| Hypothetical (5% return before expenses) | | $ | 1,000.00 | | | $ | 1,017.80 | | | | 1.45% | | | $ | 7.33 | |
| (a) | The Fund’s expense ratios have been annualized based on the Fund’s most recent fiscal half-year expenses. |
| (b) | Expenses are equal to the Fund’s annualized expense ratio multiplied by the average account value over the period, multiplied by the number of days in the most recent fiscal half-year 183/365 (to reflect the half-year period). |
Total returns exclude applicable sales charges. If sales charges were included (maximum 5.75%), returns would be lower.
| ICON Diversified Funds | Board of Trustees and Officers |
| | September 30, 2019 (Unaudited) |
The ICON Funds Board of Trustees (the “Board”) consists of four Trustees who oversee the 17 ICON Funds (the “Funds”). The Board is responsible for general oversight of the Funds’ business and for assuring that the Funds are managed in the best interest of the Funds’ shareholders. The Trustees, and their ages, and principal occupations are set forth below. The address of the Trustees is 5299 DTC Blvd., Suite 1200, Greenwood Village, CO 80111. Trustees have no official term of office and generally serve until they resign or are not re-elected.
Interested Trustee
Craig T. Callahan,68. Chairman of the Board. Dr. Callahan has been a Trustee of the Funds since their inception. Dr. Callahan also serves as President (2014 to present and 1998 to 2013) and Chairman of the Investment Committee (2005 to present) and served as the Chief Investment Officer (1991 to 2004) of ICON Advisers, Inc. Dr. Callahan is also Executive Vice President (2005 to present); Director (1991 to present); and was previously President (1998 to 2005) and Chief Compliance Officer (2005) of ICON Distributors, Inc. Dr. Callahan also serves as the President (1998 to present) and Chairman of the Board of Directors (1994 to present) of IM&R, the parent company of ICON Advisers, Inc. and ICON Distributors, Inc.
Independent Trustees
Glen F. Bergert,69. Mr. Bergert has been a Trustee of the Funds since 1999. Mr. Bergert is President of Venture Capital Management LLC (1997 to present), General Partner of SOGNO Partners LP, a venture capital company (2001 to 2015), General Partner of Bergert Properties, LLP, a real estate holding company (1997 to present), General Partner of Pyramid Real Estate Partnership, a real estate development company (1998 to present), General Partner of Chamois Partners, LP, a venture capital company (2004 to present), and was previously a General Partner with KPMG Peat Marwick, LLP (1979 to 1997). Mr. Bergert is also a Director of Delta Dental of California (2013 to present and 2006 to 2012), Delta Dental of Pennsylvania (2010 to present and 1998 to 2009), Delta Reinsurance Corporation (2015 to present; 2011 to 2014 and 2000 to 2009) and Dentegra Group, Inc. (2017 to present; 2010 to 2014).
John C. Pomeroy,Jr., 72. Mr. Pomeroy has been a Trustee of the Funds since 2002. Mr. Pomeroy was Chief Investment Officer and Director of Investments, Pennsylvania State University (2001 to 2018) and was Portfolio Manager and Product Manager, Trinity Investment Management Corporation (1989 to 2001).
R. Michael Sentel,71. Mr. Sentel has been a Trustee of the Funds since their inception. Mr. Sentel was a Senior Attorney with the U.S. Department of Education (1996 to 2018) and was engaged in private practice of securities and corporate law (1981 to 2017). Mr. Sentel began his legal career with the U.S. Securities and Exchange Commission’s Division of Enforcement and served as a Branch Chief (1980 to 1981). Later he served as the Section Chief for the Professional Liability Section of the Federal Deposit Insurance Corp. with responsibility for the Rocky Mountain Region (1991 to 1994).
Mark Manassee,54. Mr. Manassee has been a Trustee of the Funds since 2017. Mr. Manassee is a Senior Advisor to McKinsey’s Wealth and Asset Management Practice. Mr. Manassee was Principal and President of Market Metrics, LLC, a subsidiary of FactSet Research Systems, Inc. (1998 to 2016). Mr. Manassee was also Chairman of the Board of FundRock Partners, Ltd (UK) (2017 to 2019) and a Director of Matrix-Data, Ltd (UK) (2013 to 2016) and Rhetorik, Ltd (UK) (2013 to 2016).
The Officers of the Funds are:
Craig T. Callahan, 68. Chairman of the Board. Dr. Callahan has been a Trustee of the Funds since their inception. Dr. Callahan also serves as President (2014 to present and 1998 to 2013) and Chairman of the Investment Committee (2005 to present) and served as the Chief Investment Officer (1991 to 2004) of ICON Advisers, Inc. Dr. Callahan is also Executive Vice President (2005 to present); Director (1991 to present); and was previously President (1998 to 2005) and Chief Compliance Officer (2005) of ICON Distributors, Inc. Dr. Callahan also serves as the President (1998 to present) and Chairman of the Board of Directors (1994 to present) of IM&R, the parent company of ICON Advisers, Inc. and ICON Distributors, Inc.
Brian D. Harding,40. Mr. Harding serves as Principal Financial Officer and Treasurer of the Funds (2017 to present). Mr. Harding is also Chief Financial Officer of ICON Advisers, Inc. (2013 to present) and Director of IM&R (2013 to present). Previously he was Chief Compliance Officer and Anti-Money Laundering Officer of the Funds (2008 to 2013), Chief Compliance Officer of ICON Advisers, Inc. (2011 to 2013), and Manager at PricewaterhouseCoopers LLP (2001 to 2008).
Jack M. Quillin,47. Mr. Quillin serves as Chief Compliance Officer and Anti-Money Laundering Officer of the Funds (2019 to present). Mr. Quillin is also Chief Compliance Officer of ICON Advisers, Inc. (2019 to present). Previously he served as Assistant Treasurer of the Funds (2017 to 2019) and a Compliance and Fund Accounting Associate of ICON Advisers, Inc. (2016 to 2019). Previously, he was a compliance analyst at Marsico Capital Management, LLC (2011 to 2015), an assistant vice president in the municipal derivatives finance department at Merrill Lynch (2004 to 2008), and a senior accountant in the Regulatory Reporting group at Wells Fargo & Company (1998 to 2003).
| Annual Report | September 30, 2019 | 71 |
| ICON Diversified Funds | Board of Trustees and Officers |
| | September 30, 2019 (Unaudited) |
Christopher R. Ambruso,39. Mr. Ambruso serves as Secretary of the Funds (2019 to present). Mr. Ambruso is also General Counsel of ICON Advisers, Inc. (2019 to present), Chief Compliance Officer of ICON Distributors, Inc. (2019 to present), and Director of IM&R (2019 to present). Previously he served as Chief Compliance Officer and Anti-Money Laundering Officer (2017 to 2019) and Assistant Secretary (2016 to 2017 and 2008 to 2012) of the Funds and Chief Compliance Officer (2017 to 2019), Associate Counsel (2013 to 2017), Associate Attorney (2008 to 2013), and Staff Attorney (2007 to 2008) of ICON Advisers, Inc.
Lesley Caviness,53. Ms. Caviness serves as Assistant Treasurer of the Funds (2019 to present). Ms. Caviness is also Compliance and Fund Accounting Associate of ICON Advisers, Inc. (2017 to present). Previously she served as Mutual Fund Accounting Associate of ICON Advisers, Inc. (2013 to 2017) and Assistant Treasurer of the Funds (2014 to 2017). Prior to Joining ICON Ms. Caviness worked for Oppenheimer Funds in Fund Accounting and Shareholder Accounting as well as at PricewaterhouseCoopers LLP as an Audit Associate and Audit Senior Associate.
| ICON Diversified Funds | Additional Information |
| | September 30, 2019 (Unaudited) |
Renewal of Investment Advisory Agreement
On September 19, 2019, the Board of Trustees, including all of the Trustees that are not “interested persons” of the Trust (the “Independent Trustees”), approved continuation of the Advisory Agreements (as defined below) with the Adviser for each Fund for an additional one-year term commencing October 1, 2019.
The Trustees considered the renewal of the investment advisory agreements between the Trust and the Adviser – the Trust’s Investment Advisory Agreement dated October 9, 1996, as amended (related to the Sector Funds, the International Funds and the ICON Fund) and the Trust’s Investment Advisory Agreement dated July 9, 2002 and effective October 1, 2002, as amended (related to the U.S. Diversified Funds — Flexible Bond, Risk-Managed Balanced, Equity Income, Opportunities and Long/Short Funds) (collectively, the “Advisory Agreements”). The Trustees agreed that consideration of the Advisory Agreements should also include consideration of other agreements between the Adviser and the Trust that impact provisions of the Advisory Agreements, including the expense limitation agreements.
The Trustees were provided with and reviewed data with respect to the Adviser, its personnel, and the services provided and to be provided to each Fund by the Adviser under the Trust’s Advisory Agreements, Administrative Services Agreement and Expense Limitation Agreement and the Distribution Agreement with ICON Distributo rs, Inc. (“IDI”). The data included information concerning advisory, distribution and administrative services provided to the Funds by ICON and its related companies; information concerning other businesses of those companies; and comparative data obtained from Broadridge related to Fund performance and Fund expenses (the “Broadridge Report”).
The Independent Trustees met separately with Broadridge on July 31, 2019 to discuss the Broadridge Report and the information contained within the Broadridge Report.
Also included in the 15(c) discussion was a briefing on factors affecting the ICON investment model; expenses and expense ratios of each Fund and other ICON managed products; relative performance of each Fund; status of expense reimbursements to the Funds by the Adviser; sales and marketing initiatives; specific business factors affecting IDI; the work load on ICON as adviser and administrator to the Funds; current profitability and financial position of ICON; staffing levels and staff morale.
The Independent Trustees were represented by independent legal counsel in the entire 15(c) process. Several times, in August and September, after participating in the meeting with Broadridge and management, the Independent Trustees met separately as a group in private sessions with their independent legal counsel to review and discuss a wide variety of qualitative and quantitative information, including information they had received throughout the year as part of their regular oversight of the Funds. Based on these discussions, independent legal counsel and/or the Lead Independent Trustee also contacted management to request additional information. The Board received materials from independent legal counsel discussing the legal standards applicable to their consideration of the ICON-Trust agreements.
In considering the nature, extent and quality of the services provided by the Adviser,the Board reviewed information relating to ICON’s operations and personnel. Among other things, the Adviser provided biographical information on its professional staff and descriptions of its current organizational and management structure. In the course of their deliberations the Board evaluated among other things, information relating to the investment philosophy, strategies and techniques used in managing each Fund, the qualifications and experience of ICON’s investment personnel, ICON’s compliance programs, ICON’s brokerage practices, including the extent to which the Adviser obtains research through “soft dollar” arrangements with the Funds’ brokerage, compliance reports on the foregoing, and the financial and non-financial resources available to provide services required under the Advisory Agreement.
Management and the Trustees discussed the Broadridge Report and Management personnel showed performance for each Fund and discussed the factors affecting performance. During a lengthy and spirited discussion, the Trustees expressed their concerns regarding both the ICON Funds’ performance relative to similarly situated funds and the overall rate of redemptions relative to sales.
With regard to the ICON Funds’ performance, the Chief Investment Officer (“CIO”) stated that the current market continues to favor growth rather than value-based systems or styles. Further, the current market is challenging for the ICON system due to generally increased volatility and quick, inconsistent market leadership themes. The Funds’ performance during the market selloff in the fourth quarter of 2018 was generally worse than the Funds’ Benchmark returns. Despite the current market, the CIO reiterated his faith in the ICON system, noting its past successes.
The Trustees discussed the reductions in staff in May 2019 as well as the decrease in assets under management of the Adviser in August 2019 due to a large account which ICON was the sub-advisor on moving to a different sub-advisor. From a sales perspective, Management has been working to continue to narrow the focus of ICON’s sales team in order to get the most out of the Regional Vice Presidents in the field and the Internal Sales Associates in the office. Management noted that it hired a new National Sales Director in January 2019. Similar to the past several years, Management has been challenged to penetrate and retain sales in the full-service wirehouse firms. Wirehouses, Management noted, are intent on capturing assets while moving from a transaction-based compensation model (e.g. paying per trade) to a fee-based compensation model (e.g. paying a fixed percentage for asset management). Wirehouses are culling their recommended lists and/or looking to pare down the number of fund families with whom they do business. Management has seen most of the ICON Funds culled from wirehouses, in large part because of the size of the Funds. Management has begun focusing on alternatives to the wirehouse space.
| Annual Report | September 30, 2019 | 73 |
| ICON Diversified Funds | Additional Information |
| | September 30, 2019 (Unaudited) |
In connection with reviewing data bearing upon the nature, quality, and extent of services furnished by ICON to each Fund, the Board assessed data concerning ICON’s staffing, systems and facilities. The Board also assessed ICON’s non-Trust business to see if there are any initiatives that would dilute service to the Trust. The Board concluded:
| A. | That the breadth and the quality of investment advisory and other services being provided to each Fund are satisfactory; |
| B. | That ICON has made significant expenditures in the past year and in prior years by way of expense reimbursements and the Adviser has the systems and trained personnel necessary for it to be able to continue to provide quality service to the Funds’ shareholders; |
| C. | That the Board is satisfied with the research, portfolio management, and trading services, among others, being provided by ICON to the Trust, and has determined that ICON is charging fair and reasonable fees. |
| D. | The risks assumed by ICON in providing investment advisory services to each Fund including the capital commitments which have been made in the past and which continue to be made by ICON to ensure the continuation of the highest quality of service to the Trust is made with the recognition that the Trust’s advisory relationship with ICON can be terminated at any time and must be renewed on an annual basis. |
In considering the reasonableness of the fees paid to the Adviser for managing each Fund,the Board reviewed, among other things, data concerning other funds from the Broadridge Report, financial statements of the Adviser and an analysis of the profitability and financial position (including cash available over the next 12 months) of the Adviser, and its affiliates, and their relationship with each Fund over various time periods. Such analysis identified all revenues and other benefits received by the Adviser and its affiliates from managing each Fund, the costs associated with providing such services and the resulting profitability to the Adviser and its affiliates and a comparison of similar data from reports filed by publicly traded firms.
The Board assessed actual (net) fees for advisory services and Fund expense ratios under the contractual relationship (the Advisory agreements, the Administration Agreement and the Expense Limitation Agreements) with the Adviser as opposed to the fees specified in the applicable Advisory Agreement and expense ratios without application of the expense limitations and the low cost of the Administration Agreement and concluded that the focus should be on actual expense ratios after application of the Expense Limitation Agreements.
The Board considered the current and anticipated asset levels of each Fund and the contractual commitments of the Adviser to waive fees and pay expenses of the Funds from time to time to limit the total expenses of the Funds. The Board also considered the Adviser’s contractual commitment regarding administration and the fact it would continue to lose money on administration. In this regard the Board discussed asset levels in each Fund covered by the Advisory Agreements. ICON’s ability to provide the services called for under the Advisory Agreements was assessed in light of current and projected asset levels. Fund expenses and expense ratios were also assessed in light of current and projected asset levels. The Board concluded that the Adviser has the resources necessary to provide the services called for under the Advisory Agreements; that profitability to the Adviser and its affiliates from their relationship with the Funds, and services provided to the Funds, is not excessive; and that the Adviser is not realizing benefits from economies of scale that would warrant adjustments to the fees for any Fund at this time. The Board of Trustees concluded that, in light of the nature, extent and quality of the services provided by the Adviser and the levels of profitability associated with providing these services, the fees charged by the Adviser under the Advisory Agreements to each Fund are reasonable.
In connection with assessing data bearing on the fairness of fee arrangements,the Board considered the Broadridge Report, and information that they had received throughout the year as part of their regular oversight of the Funds, including Morningstar and Lipper data on the peer groupings. Among other information discussed, it was noted that:
| A. | Upon review of the advisory fee structures of each Fund in comparison with other similar funds of similar size, the level of investment advisory fees paid by each Fund is competitive; |
| B. | The total expense ratio and contractual management fees at common asset levels of each Fund are generally competitive with their expense groups; |
| C. | ICON has contractually agreed to impose expense limitations on all Funds at a cost to ICON; |
| ICON Diversified Funds | Additional Information |
| | September 30, 2019 (Unaudited) |
| D. | That the advisory and other fees payable by the Funds to ICON are essentially fees which would be similar to those which would have resulted solely from “arm’s-length” bargaining; |
| E. | That the fees paid to ICON for managing other institutional accounts (such as individuals or sub-advised portfolios) are lower than the fees paid by similarly managed ICON funds, but the reason why they are lower is reasonably related to the cost for ICON to manage such accounts; and |
| F. | The extent to which economies of scale could be realized as a Fund grows in assets and whether the Fund’s fees reflect these economies of scale for the benefit of Fund shareholders. |
| G. | The costs borne by ICON in providing advisory services to each Fund and the profitability and financial position of ICON in light of the estimated profitability analysis which had been provided by ICON, including cash available for the next 12 months to meet the Advisor’s commitments to the Fund with respect to the expense reimbursements and other operating expenses required to carry out its duties under the Agreement. |
The Board also considered the fees charged by the Adviser to other advisory clients as outlined in its Registration Application on Form ADV in connection with assessing data bearing on the fairness of fee arrangements. The Trustees and Management recognized that the Adviser is continuously evaluating Fund expense ratios and expense limits to assess the competitiveness of the Funds and whether any downward adjustments affect Fund sales.
The Board concluded that the Adviser is providing the Funds with professional management at a price that would have been arrived at in an arm’s length negotiation.
In connection with assessing the direct and indirect benefits to ICON from serving as the Funds’ adviser, the Board discussed services provided under the Distribution Agreement and the Administrative Services Agreement which are in addition to services under the Advisory Agreements. It was noted that:
| A. | ICON benefits from serving directly or through affiliates as the principal underwriter and administrative agent for the Funds; the services provided by ICON and its affiliates to the Funds are reasonably satisfactory, and whether the profits derived from providing the services are competitive and reasonable; |
| B. | ICON receives research assistance from the use of soft dollars generated from Fund portfolio transactions; the Trustees noted that such research is necessary to run the Funds and assists ICON in providing investment advisory services to the Funds as well as other accounts to which it provides advisory services. |
Based on all these considerations and other data as discussed above,the Board, including all of the Independent Trustees, concluded that: 1) the continuation of the Advisory Agreements was in the best interests of each Fund and its shareholders, 2) the services to be performed under the Advisory Agreements were required for the operation of the Funds, 3) the advisory services were satisfactory to the Funds in the past, and 4) the fees for the advisory services and other benefits from the relationship with the Trust received by ICON, and its affiliates, were within the range of what would have been negotiated at arm’s length in light of all the circumstances. The Board noted that its conclusions were based on the assumption that no significant transactions involving the Fund would take place during the year, although any transaction costs in connection with exploring possible transactions might be incurred in addition to normal operating costs.
Supplemental Tax Info
Pursuant to Section 852(b)(3) of the Internal Revenue Code the following Funds designate the amounts listed below as long-term capital gain dividends:
| ICON Equity Income Fund | $39,923 |
| ICON Flexible Bond Fund | $0 |
| ICON Fund | $541,496 |
| ICON Long/Short Fund | $312,036 |
| ICON Opportunities Fund | $3,815,815 |
| ICON Risk-Managed Balanced Fund | $0 |
| Annual Report | September 30, 2019 | 75 |
| ICON Diversified Funds | Additional Information |
| | September 30, 2019 (Unaudited) |
The following Funds designate the percentages listed below of the income dividends distributed in 2018 as qualified dividend income (QDI) as defined in Section 1(h)(11) of the Internal Revenue Code:
| ICON Equity Income Fund | 68.53% |
| ICON Flexible Bond Fund | 0.00% |
| ICON Fund | 0.00% |
| ICON Long/Short Fund | 0.00% |
| ICON Opportunities Fund | 100.00% |
| ICON Risk-Managed Balanced Fund | 100.00% |
The following Funds designate the percentages listed below of the income dividends distributed in 2018 as qualifying for the corporate dividends received deduction (DRD) as defined in Section 854(b)(2) of the Internal Revenue Code:
| ICON Equity Income Fund | 65.82% |
| ICON Flexible Bond Fund | 0.00% |
| ICON Fund | 0.00% |
| ICON Long/Short Fund | 0.00% |
| ICON Opportunities Fund | 100.00% |
ICON Risk-Managed Balanced Fund | 100.00% |
Portfolio Holdings
Information related to the 10 largest portfolio holdings of each Fund is made available at www.iconfunds.com within approximately 10 business days after month-end. Additionally, a complete list of each Fund’s holdings is made available approximately 30 days after month-end. Each ICON Fund also files a complete schedule of portfolio holdings for the first and third quarters of its fiscal year with the Securities and Exchange Commission (the “Commission”) on Form N-Q. The ICON Funds’ Forms N-Q are available at www.sec.gov or may be reviewed and copied at the Commission’s Public Reference Room in Washington, DC. Information about the Public Reference Room may be obtained by calling 1-800-SEC-0330.
Proxy Voting
A summarized description of the policies and procedures the ICON Funds use to vote proxies is available free of charge at www.iconfunds.com or by calling 1-800-764-0442.
Information about how the ICON Funds voted proxies related to each Fund’s portfolio securities during the 12-month period ended June 30 is available free of charge at www.iconfunds.com or on the Commission’s website at www.sec.gov.
For More Information
This report is for the general information of the Funds’ shareholders and is not authorized for distribution to prospective investors unless preceded or accompanied by a current prospectus. You may obtain a copy of the prospectus, which contains information about the investment objectives, risks, charges, expenses, and share classes of each ICON Fund, by visiting www.iconfunds.com or by calling 1-800-764-0442. Please read the prospectus carefully before investing.
ICON Distributors, Inc., Distributor.
| ICON Diversified Funds | Privacy Policy |
| | September 30, 2019 (Unaudited) |
| FACTS | WHAT DOES ICON DO WITH YOUR PERSONAL INFORMATION? |
| Why? | Financial companies choose how they share your personal information. Federal law gives consumers the right to limit some but not all sharing. Federal law also requires us to tell you how we collect, share, and protect your personal information. Please read this notice carefully to understand what we do. |
| What? | The types of personal information we collect and share depend on the product or service you have with us. This information can include: ● Social Security number and account balances ● income and transaction history ● checking account information and wire transfer instructions When you areno longerour customer, we continue to share your information as described in this notice. |
| How? | All financial companies need to share customers’ personal information to run their everyday business. In the section below, we list the reasons financial companies can share their customers’ personal information; the reasons ICON chooses to share; and whether you can limit this sharing. |
| Reasons we can share your personal information | Does ICON share? | Can you limit this sharing? |
| For our everyday business purposes— such as to process your transactions, maintain your account(s), respond to court orders and legal investigations, or report to credit bureaus | Yes | No |
| For our marketing purposes— to offer our products and services to you | No | We don’t share |
| For joint marketing with other financial companies | No | We don’t share |
| For our affiliates’ everyday business purposes— information about your transactions and experiences | No | We don’t share |
| For our affiliates’ everyday business purposes— information about your creditworthiness | No | We don’t share |
| For nonaffiliates to market to you | No | We don’t share |
Questions? Call 1-800-764-0442 for the ICON Funds and 1-800-828-4881 for ICON Advisers, Inc. and ICON Distributors, Inc.
| Annual Report | September 30, 2019 | 77 |
| ICON Diversified Funds | Privacy Policy |
| | September 30, 2019 (Unaudited) |
| Who We Are |
| Who is providing this notice? | ICON Funds, ICON Advisers, Inc., and ICON Distributors, Inc. (collectively “ICON”) |
| What We Do |
| How does ICON protect my personal information? | To protect your personal information from unauthorized access and use, we use security measures that comply with federal law. These measures include computer safeguards and secured files and buildings. Contracts with our service providers require them to restrict access to your non-public personal information, and to maintain physical, electronic and procedural safeguards against unintended disclosure. |
| How does ICON collect my personal information? | We collect your personal information, for example, when you ● open an account or enter into an investment advisory contract ● provide account information or give us your contact information ● make a wire transfer We also collect your personal information from others, such as credit bureaus, affiliates, or other companies. |
| Why can’t I limit all sharing? | Federal law gives you the right to limit only ● sharing for affiliates’ everyday business purposes — information about your creditworthiness ● affiliates from using your information to market to you ● sharing for nonaffiliates to market to you State laws and individual companies may give you additional rights to limit sharing. |
| Definitions |
| Affiliates | Companies related by common ownership or control. They can be financial and nonfinancial companies. ● Our affiliates include financial companies such as ICON Funds, ICON Advisers, Inc., and ICON Distributors, Inc. |
| Nonaffiliates | Companies not related by common ownership or control. They can be financial and nonfinancial companies. ● Nonaffiliates we share with can include financial companies such as custodians, transfer agents, registered representatives, financial advisers and nonfinancial companies such as fulfillment, proxy voting, and class action service providers |
| Joint marketing | A formal agreement between nonaffiliated financial companies that together market financial products or services to you. ● ICON doesn’t jointly market |
Intentionally Left Blank

For more information about the ICON Funds, contact us:
| By Telephone | 1-800-764-0442 |
| By E-Mail | info@iconadvisers.com |
| By Mail | ICON Funds | P.O. Box 1920 | Denver, CO 80201 |
| In Person | ICON Funds | 5299 DTC Boulevard, Suite 1200
Greenwood Village, CO 80111 |
| On the Internet | www.iconfunds.com |
International Funds
ICON Emerging Markets Fund (ICARX, IPCAX)
ICON International Equity Fund (ICNEX, IIQCX, IIQAX)

You can now sign up for electronic delivery of ICON Fund shareholder reports, including prospectuses, annual reports, semiannual reports and proxy statements.
When these materials are available, you will receive an email from ICON with instructions on how to view the documents. Statements, transaction confirmations and other documents that are not available online will continue to be sent to you by U.S. mail.
Visit ICON’s website atwww.iconfunds.com to learn more and sign up.
You may change or cancel your participation ineDelivery by visitingwww.iconfunds.com, or you can request a hard copy of any of the materials free of charge by calling ICON Funds at 1-800-764-0442.
Beginning on January 1, 2021, ICON will no longer send paper copies of the Funds’ annual and semi-annual shareholder reports by mail, unless you specifically request paper copies of the reports. Instead, the reports will be made available on a website and you will be notified by mail each time a report is posted and given a website address of where to access the report.
If you have already opted to receive e-delivery, this change will not affect you and you do not need to take any action. At any time, shareholders who invest directly in the ICON Funds may generally elect to receive reports or other communications electronically by enrolling atwww.iconfunds.com or calling 1-800-764-0442 or, if you are a retirement plan sponsor or invest in the funds through a financial intermediary (such as an investment advisor, broker-dealer, insurance company, or bank), by contacting your representative or your financial intermediary.
You may elect to continue receiving paper copies of future shareholder reports free of charge. To do so, if you invest directly with ICON, please call 1-800-764-0442. If you are a retirement plan sponsor or invest in the ICON Funds through a financial intermediary, please contact your representative or financial intermediary. Your election to receive reports as a paper copy will apply to all ICON Funds held in your account. Your election can be changed at any time in the future.
| | | | | | | | |
| | | | |
| | 1-800-764-0442 | | ● | | www.iconfunds.com | | |
| | |
| ICON International Funds | | About This Report |
| | September 30, 2019 (Unaudited) |
Historical Returns
All total returns mentioned in this Report account for the change in a Fund’s per-share price and the reinvestment of any dividends, capital gain distributions and adjustments for financial statement purposes. If your account is set up to receive Fund distributions in cash rather than to reinvest them, your actual return may differ from these figures. The Funds’ performance results do not reflect the deduction of taxes that a shareholder would pay on Fund distributions or on the redemption of Fund shares. The Adviser may have reimbursed certain fees or expenses of some of the Funds. If not for these reimbursements, performance would have been lower. Fund results shown, unless otherwise indicated, are at net asset value. If a sales charge (maximum 5.75%) had been deducted, results would have been lower.
Past performance does not guarantee future results. Investment return and principal value will fluctuate so that an investor’s shares, when redeemed, may be worth more or less than their original cost. Performance results represent past performance, and current performance may be higher or lower. Please call 1-800-764-0442 orvisit www.iconfunds.com for performance results current to the most recent month-end.
Portfolio Data
This Report reflects ICON’s portfolio holdings as of September 30, 2019, the end of the reporting period. The information is not a complete analysis of every aspect of any sector, industry, security or the Funds.
There are risks associated with mutual fund investing, including the loss of principal. The likelihood of loss may be greater if you invest for a shorter period of time. There is no assurance that the investment process will consistently lead to successful results.
An investment in a region fund may involve greater risk and volatility than a diversified fund. An investment concentrated in sectors and industries may involve greater risk and volatility than a more diversified investment.
Investments in foreign securities may entail unique risks, including political, market, and currency risks. Financial statements of foreign companies are governed by different accounting, auditing, and financial standards than U.S. companies and may be less transparent and uniform than in the United States. Many corporate governance standards, which help ensure the integrity of public information in the United States, do not exist in foreign countries. In general, there may be less governmental supervision of foreign stock exchanges and securities brokers and issuers. The ICON system relies on the integrity of the financial statements released to the market as part of our analysis.
The prospectus and statement of additional information contain this and other information about the Funds and are available by visitingwww.iconfunds.com or calling 1-800-764-0442. Please read the prospectus and statement of additional information carefully.
Financial Intermediary
If you purchase the Fund through a broker-dealer or other financial intermediary (such as a bank), the Fund and its related companies may pay the intermediary for the sale of Fund shares and related services. These payments may influence the broker-dealer or other intermediary and your salesperson to recommend the Fund over another investment. Ask your salesperson or visit your financial intermediary’s website for more information.
| ICON Emerging Markets Fund | | Management Overview |
| | September 30, 2019 (Unaudited) |
| Q. | How did the Fund perform relative to its benchmark? |
| A. | The ICON Emerging Markets Fund (the Fund) Class S returned -5.60% for the fiscal year ended September 30, 2019, while its benchmark, the MSCI Emerging Markets Index, returned -1.63%. Total returns for other periods and additional Class shares as of September 30, 2019, appear in the subsequent pages of this Fund’s Management Overview. |
| Q. | What primary factors were behind the Fund’s relative performance? |
| A. | At the beginning of the fiscal year, our valuation model indicated our average overall emerging markets universe had a value-to-price (V/P) ratio of 1.02, implying that, on average, our estimate of fair value for stocks in our emerging markets universe was about 2% higher than where they were trading. The weighted average V/P of the Fund was 1.11 at the time, meaning that the Fund was able to find value relative to price slightly higher than ICON’s estimation of value in the overall emerging markets market. The biggest effect on the Fund’s performance came during the fourth quarter of 2018, with the MSCI Emerging Markets Index returning about -7.40% and the Fund returning about -9.00% for the quarter. For the first, second and third quarters of 2019, the Fund and the benchmark kept pace and had similar positive returns. The Fund’s holdings in China and Mexico had the greatest effect on performance during the fourth quarter 2018. Not only were the Mexican and Chinese indexes down, but the Fund’s holdings in those countries were down more than the benchmark. |
| Q. | How did the Fund’s composition affect performance? |
| A. | From the sector perspective, the Fund’s holdings in the Consumer Staples, Information Technology, and Real Estate sectors contributed to the Fund’s performance. Conversely, the Fund’s exposure in the Materials and Energy sectors detracted from performance. |
| | From a country perspective, China was the Fund’s largest country position and was overweight the benchmark by about 5% on average during the course of the year. South Korea was the next largest position by country on average during the fiscal year, but was underweight the benchmark. These two countries were the most significant contributors to underperformance in the Fund. Brazil was generally overweight during the fiscal year and outperformed the benchmark, which had a positive effect on the Fund’s returns. India was close to the same weight in the benchmark and the Fund throughout the period, but the underlying stock selection in the country had a positive effect to the Fund’s returns. |
| Q. | What is your investment outlook for emerging markets? |
| A. | At the end of fiscal year 2019, emerging markets had an overall average V/P of 1.14, implying that we believe the fair value for emerging markets stocks as a whole is approximately 14% higher than where the securities are now trading. This V/P suggests that the emerging markets should have room to grow in the coming year. Brazil and Mexico are two countries with strong V/P ratios and based on our system we would expect these countries to lead in the coming months. |
| |
| Annual Report | September 30, 2019 | | 3 |
| ICON Emerging Markets Fund | | Management Overview |
| | September 30, 2019 (Unaudited) |
Average Annual Total Return(as of September 30, 2019)
| | | Inception Date | | 1 Year | | 5 Years | | 10 Years | | Since Inception | | Gross Expense Ratio* | | Net Expense Ratio* |
| ICON Emerging Markets Fund – Class S | | 2/25/97 | | -5.60% | | 2.26% | | 4.04% | | 2.89% | | 1.60% | | 1.55% |
| ICON Emerging Markets Fund – Class A | | 5/31/06 | | -5.87% | | 2.00% | | 3.82% | | 2.25% | | 1.96% | | 1.80% |
ICON Emerging Markets Fund – Class A
(including maximum sales charge of 5.75%) | | 5/31/06 | | -11.27% | | 0.79% | | 3.20% | | 1.79% | | 1.96% | | 1.80% |
| MSCI Emerging Markets Index | | | | -1.63% | | 2.71% | | 3.73% | | 5.80% | | N/A | | N/A |
Past performance is not a guarantee of future results. Information about these performance results and the comparative indexes can be found in the About This Report section. The Fund’s name and investment strategy changed effective May 5, 2014. The Fund’s past performance would have been different if the current strategy had been in effect. The Adviser has agreed to limit certain Fund expenses; without these limitations, returns would have been lower. The limitation provisions may be terminated in the future.
| * | Please see the most recent prospectus for details. |
Value of a $10,000 Investment(through September 30, 2019)
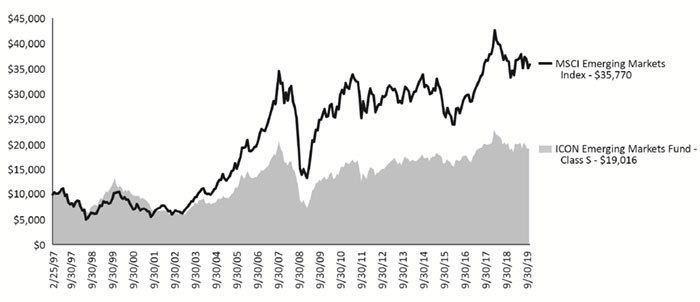
Past performance is not a guarantee of future results. The above graph compares a $10,000 investment made in the Emerging Markets Fund’s Class S shares on the Class’ inception date of 2/25/97 to a $10,000 investment made in an unmanaged securities index on that date. The Fund’s name and investment strategy changed effective May 5, 2014. The Fund’s past performance would have been different if the current strategy had been in effect. Performance for the Emerging Markets Fund’s other share classes will vary due to differences in charges and expenses. The Emerging Markets Fund’s performance in this chart and the performance table assumes the reinvestment of dividends, capital gain distributions and tax return of capital, but does not reflect the deduction of taxes that a shareholder would pay on Fund distributions or on the redemption of Fund shares.
| ICON Emerging Markets Fund | Schedule of Investments |
September 30, 2019
| | | Shares or
Principal
Amount | | | Value | |
| Common Stocks (89.01%) |
| Brewers (8.75%) |
| China Resources Beer Holdings Co., Ltd. | | | 375,200 | | | $ | 1,987,875 | |
| Tsingtao Brewery Co., Ltd., Class H | | | 305,500 | | | | 1,843,199 | |
| | | | | | | | 3,831,074 | |
| Cable & Satellite (0.04%) |
| MultiChoice Group(a) | | | 2,000 | | | | 15,570 | |
| | | | | | | | | |
| Communications Equipment (2.89%) |
| Accton Technology Corp. | | | 240,000 | | | | 1,264,187 | |
| | | | | | | | | |
| Construction Materials (3.12%) |
| China Resources Cement Holdings, Ltd. | | | 454,000 | | | | 455,354 | |
| Siam Cement PCL | | | 68,168 | | | | 909,022 | |
| | | | | | | | 1,364,376 | |
| Diversified Banks (23.55%) |
| Agricultural Bank of China, Ltd., Class H | | | 3,364,000 | | | | 1,317,329 | |
| Akbank T.A.S.(a) | | | 250,000 | | | | 358,757 | |
| Bank of China, Ltd., Class H | | | 3,462,000 | | | | 1,357,697 | |
| Bank of Georgia Group PLC | | | 40,000 | | | | 659,027 | |
| China Construction Bank Corp., Class H | | | 1,750,000 | | | | 1,333,429 | |
| Grupo Financiero Banorte SAB de CV, Class O | | | 194,108 | | | | 1,046,180 | |
| Industrial & Commercial Bank of China, Ltd., Class H | | | 1,052,000 | | | | 704,772 | |
| Industrial Bank of Korea | | | 52,000 | | | | 573,637 | |
| OTP Bank Nyrt | | | 18,000 | | | | 749,797 | |
| Sberbank of Russia PJSC, Sponsored ADR | | | 123,000 | | | | 1,739,527 | |
| Turkiye Garanti Bankasi AS(a) | | | 260,000 | | | | 469,449 | |
| | | | | | | | 10,309,601 | |
| Drug Retail (3.01%) |
| Raia Drogasil SA, Sponsored ADR | | | 67,000 | | | | 1,315,880 | |
| | | | | | | | | |
| Electric Utilities (1.98%) |
| Power Grid Corp. of India, Ltd. | | | 308,000 | | | | 865,335 | |
| | | | | | | | | |
| Gas Utilities (2.24%) |
| Kunlun Energy Co., Ltd. | | | 1,138,000 | | | | 980,588 | |
| | | | | | | | | |
| Independent Power Producers & Energy Traders (3.60%) |
| Aboitiz Power Corp. | | | 642,000 | | | | 474,713 | |
| Electricity Generating PCL | | | 94,000 | | | | 1,103,455 | |
| | | | | | | | 1,578,168 | |
| Integrated Oil & Gas (4.38%) |
| Gazprom PJSC, Sponsored ADR | | | 178,000 | | | | 1,228,912 | |
| Rosneft Oil Co. PJSC, GDR | | | 107,000 | | | | 686,512 | |
| | | | | | | | 1,915,424 | |
| Interactive Media & Services (7.40%) |
| Momo, Inc., Sponsored ADR | | | 14,000 | | | | 433,720 | |
| Tencent Holdings, Ltd. | | | 31,545 | | | | 1,319,462 | |
| Yandex NV, Class A(a) | | | 31,976 | | | | 1,119,480 | |
| YY, Inc., ADR(a) | | | 6,500 | | | | 365,495 | |
| | | | | | | | 3,238,157 | |
| | | Shares or
Principal
Amount | | | Value | |
| Internet & Direct Marketing Retail (5.34%) |
| Alibaba Group Holding, Ltd., Sponsored ADR(a) | | | 11,500 | | | $ | 1,923,145 | |
| Naspers, Ltd., Class N | | | 2,739 | | | | 414,710 | |
| | | | | | | | 2,337,855 | |
| IT Consulting & Other Services (1.89%) |
| HCL Technologies, Ltd. | | | 25,657 | | | | 391,288 | |
| Infosys, Ltd. | | | 38,488 | | | | 435,711 | |
| | | | | | | | 826,999 | |
| Multi-line Insurance (4.53%) | | | | | | | | |
| Sul America SA | | | 172,725 | | | | 1,984,179 | |
| | | | | | | | | |
| Paper Packaging (0.55%) |
| DS Smith PLC | | | 54,000 | | | | 239,111 | |
| | | | | | | | | |
| Paper Products (0.53%) |
| Mondi PLC | | | 12,000 | | | | 229,768 | |
| | | | | | | | | |
| Real Estate Development (2.34%) |
| LSR Group PJSC, GDR | | | 200,000 | | | | 434,000 | |
| Megaworld Corp. | | | 7,023,000 | | | | 592,305 | |
| | | | | | | | 1,026,305 | |
| Real Estate Operating Companies (5.04%) |
| BR Malls Participacoes SA | | | 312,000 | | | | 1,088,071 | |
| Iguatemi Empresa de Shopping Centers SA | | | 98,000 | | | | 1,117,756 | |
| | | | | | | | 2,205,827 | |
| Regional Banks (2.34%) |
| Regional SAB de CV | | | 223,800 | | | | 1,025,665 | |
| | | | | | | | | |
| Semiconductors (2.31%) |
| Taiwan Semiconductor Manufacturing Co., Ltd. | | | 114,000 | | | | 1,012,495 | |
| | | | | | | | | |
| Technology Hardware, Storage & Peripherals (1.54%) |
| Samsung Electronics Co., Ltd. | | | 16,500 | | | | 675,577 | |
| | | | | | | | | |
| Water Utilities (1.64%) |
| TTW PCL | | | 1,599,400 | | | | 716,648 | |
| | | | | | | | | |
Total Common Stocks
(Cost $39,040,724) | | | | | | | 38,958,789 | |
| | | | | | | | | |
| Preferred Stocks (2.45%) |
| Integrated Oil & Gas (0.88%) |
| Petroleo Brasileiro SA | | | 58,000 | | | | 384,019 | |
The accompanying notes are an integral part of the financial statements.
| Annual Report | September 30, 2019 | 5 |
| ICON Emerging Markets Fund | Schedule of Investments |
September 30, 2019
| | | Shares or
Principal
Amount | | | Value | |
| Integrated Telecommunication Services (1.57%) |
| Telefonica Brasil SA | | | 52,000 | | | $ | 687,084 | |
| | | | | | | | | |
Total Preferred Stocks
(Cost $1,087,553) | | | | | | | 1,071,103 | |
| | | | | | | | | |
| Exchange Traded Funds (9.46%) |
| iShares®China Large-Cap ETF(b) | | | 22,000 | | | | 875,600 | |
| iShares®MSCI Brazil ETF(b) | | | 41,000 | | | | 1,727,330 | |
| iShares®MSCI Mexico ETF(b) | | | 36,000 | | | | 1,537,920 | |
| | | | | | | | | |
Total Exchange Traded Funds
(Cost $4,146,252) | | | | | | | 4,140,850 | |
| | | | | | | | | |
| Collateral for Securities on Loan (4.88%) |
| State Street Navigator Securities Lending Government Money Market Portfolio, 7-Day Yield 2.09% | | | 2,134,300 | | | | 2,134,300 | |
| | | | | | | | | |
Total Collateral for Securities on Loan
(Cost $2,134,300) | | | | | | | 2,134,300 | |
| | | | | | | | | |
Total Investments (105.80%)
(Cost $46,408,829) | | | | | | $ | 46,305,042 | |
| | | | | | | | | |
| Liabilities Less Other Assets (-5.80%) | | | | | | | (2,535,050 | ) |
| | | | | | | | | |
| Net Assets (100.00%) | | | | | | $ | 43,769,992 | |
| (a) | Non-income producing security. |
| (b) | All or a portion of the security was on loan as of September 30, 2019. |
ADR - American Depositary Receipt
GDR - Global Depositary Receipt
| Country Composition(September 30, 2019) |
| | | | | |
| China | | | 24.21 | % |
| Brazil | | | 15.03 | % |
| Russia | | | 11.90 | % |
| Hong Kong | | | 7.82 | % |
| Thailand | | | 6.24 | % |
| Taiwan | | | 5.20 | % |
| Mexico | | | 4.73 | % |
| India | | | 3.87 | % |
| South Korea | | | 2.85 | % |
| Philippines | | | 2.43 | % |
| Turkey | | | 1.89 | % |
| Hungary | | | 1.71 | % |
| Georgia | | | 1.51 | % |
| United Kingdom | | | 1.08 | % |
| South Africa | | | 0.99 | % |
| | | | 91.46 | % |
Percentages are based upon common and preferred stocks as a percentage of net assets.
| Sector Composition(September 30, 2019) |
| | | | | |
| Financials | | | 30.42 | % |
| Consumer Staples | | | 11.76 | % |
| Utilities | | | 9.46 | % |
| Communication Services | | | 9.01 | % |
| Information Technology | | | 8.63 | % |
| Real Estate | | | 7.38 | % |
| Consumer Discretionary | | | 5.34 | % |
| Energy | | | 5.26 | % |
| Materials | | | 4.20 | % |
| | | | 91.46 | % |
Percentages are based upon common and preferred stocks as a percentage of net assets.
The accompanying notes are an integral part of the financial statements.
| ICON Emerging Markets Fund | Schedule of Investments |
September 30, 2019
| Industry Composition(September 30, 2019) |
| | | | | |
| Diversified Banks | | | 23.55 | % |
| Brewers | | | 8.75 | % |
| Interactive Media & Services | | | 7.40 | % |
| Internet & Direct Marketing Retail | | | 5.34 | % |
| Integrated Oil & Gas | | | 5.26 | % |
| Real Estate Operating Companies | | | 5.04 | % |
| Multi-line Insurance | | | 4.53 | % |
| Independent Power Producers & Energy Traders | | | 3.60 | % |
| Construction Materials | | | 3.12 | % |
| Drug Retail | | | 3.01 | % |
| Communications Equipment | | | 2.89 | % |
| Real Estate Development | | | 2.34 | % |
| Regional Banks | | | 2.34 | % |
| Semiconductors | | | 2.31 | % |
| Gas Utilities | | | 2.24 | % |
| Electric Utilities | | | 1.98 | % |
| IT Consulting & Other Services | | | 1.89 | % |
| Water Utilities | | | 1.64 | % |
| Integrated Telecommunication Services | | | 1.57 | % |
| Technology Hardware, Storage & Peripherals | | | 1.54 | % |
| Other Industries (each less than 1%) | | | 1.12 | % |
| | | | 91.46 | % |
Percentages are based upon common and preferred stocks as a percentage of net assets.
The accompanying notes are an integral part of the financial statements.
| Annual Report | September 30, 2019 | 7 |
| ICON International Equity Fund | Management Overview |
September 30, 2019 (Unaudited)
| Q. | How did the Fund perform relative to its benchmark? |
| A. | The ICON International Equity Fund (the Fund) Class S returned -12.55% for the fiscal year ended September 30, 2019, while the MSCI All Country World Index ex-United States (ACWI ex-U.S.) returned -0.72%. Total returns for other periods and additional Class shares as of September 30, 2019, appear in the subsequent pages of this Fund’s Management Overview. |
| Q. | What primary factors were behind the Fund’s relative performance? |
| A. | At the beginning of the fiscal year, our valuation model indicated our average overall value-to-price (V/P) ratio for our international universe was 1.09, implying that, on average, our estimate of fair value for stocks in our international universe was about 9% higher than where they were trading. The weighted average V/P of the Fund was 1.13 at the time, meaning that the Fund was able to find value relative to price slightly higher than ICON’s estimation of value in the overall market international market. The biggest effect on the Fund’s performance came during the fourth quarter of 2018, with the benchmark returning about -11.42% and the Fund returning about -15.35% for the quarter. For the rest of the first, second and third quarters of 2019, the Fund and the benchmark had positive returns. The Fund’s holdings in the United Kingdom and Japan had the greatest effect on performance during that quarter. Not only were the United Kingdom and Japanese indexes down, but the Fund’s holdings in those countries were down more than the benchmark. |
| Q. | How did the Fund’s composition affect performance? |
| A. | From the sector perspective, the Fund’s holdings in the Financials and Utilities sectors contributed to the Fund’s performance. Conversely, the Fund’s exposure in the Materials and Energy sectors were the largest detractors from performance. |
From a country perspective over the entire period, Japan and the United Kingdom were the largest holdings and they had the largest contribution to negative returns. Thailand and Turkey were generally overweight relative to the benchmark during the fiscal year. The Fund’s holdings in Thailand had positive returns, while Thailand holdings in the benchmark had negative returns. The Fund’s Turkey holdings were overweight the benchmark, which resulted in positive returns that outperformed the benchmark.
| Q. | What is your investment outlook for the international equity market? |
| A. | At the end of fiscal year 2019, the ICON international markets universe had an overall average V/P of 1.16, implying that we believe the fair value for international markets stocks as a whole is approximately 16% higher than where the securities are now trading. This V/P suggests that the international markets should have room to grow in the coming year. France and Brazil are two countries with strong V/P ratios and based on our system, we would expect these countries to lead in the coming months. |
| ICON International Equity Fund | Management Overview |
September 30, 2019 (Unaudited)
Average Annual Total Return(as of September 30, 2019)
| | | Inception Date | | 1 Year | | 5 Years | | 10 Years | | Since
Inception | | Gross Expense
Ratio* | | Net Expense
Ratio* |
| ICON International Equity Fund – Class S | | 2/18/97 | | -12.55 | % | | -0.81 | % | | 0.54 | % | | 3.87 | % | | 1.49 | % | | 1.49 | % |
| ICON International Equity Fund – Class C | | 2/19/04 | | -13.52 | % | | -1.87 | % | | -0.55 | % | | 1.07 | % | | 3.29 | % | | 2.55 | % |
| ICON International Equity Fund – Class A | | 5/31/06 | | -12.79 | % | | -1.11 | % | | 0.20 | % | | -0.87 | % | | 2.59 | % | | 1.80 | % |
ICON International Equity Fund – Class A
(including maximum sales charge of 5.75%) | | 5/31/06 | | -17.80 | % | | -2.28 | % | | -0.40 | % | | -1.31 | % | | 2.59 | % | | 1.80 | % |
| MSCI ACWI ex-U.S. | | | | -0.72 | % | | 3.39 | % | | 4.93 | % | | 5.37 | % | | N/A | | N/A |
Past performance is not a guarantee of future results.Information about these performance results and the comparative indexes can be found in the About This Report section. The Fund’s name and investment strategy changed effective January 29, 2004. The Fund’s past performance would have been different if the current strategy had been in effect. The Adviser has agreed to limit certain Fund expenses; without these limitations, returns would have been lower. The limitation provisions may be terminated in the future.
| * | Please see the most recent prospectus for details. |
Class C total returns exclude applicable sales charges. If sales charges were included returns would be lower.
Value of a $10,000 Investment(through September 30, 2019)
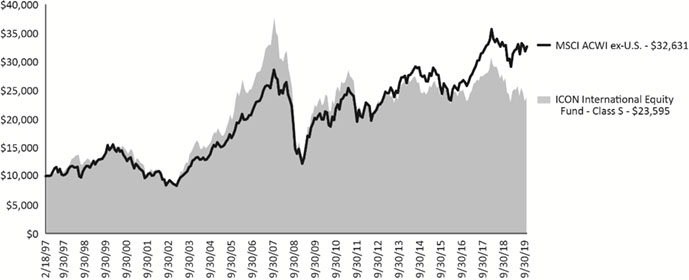
Past performance is not a guarantee of future results.The above graph compares a $10,000 investment made in the International Equity Fund’s Class S shares on the Class’ inception date of 2/18/97 to a $10,000 investment made in an unmanaged securities index on that date. The Fund’s name and investment strategy changed effective January 29, 2004. The Fund’s past performance would have been different if the current strategy had been in effect. Performance for the International Equity Fund’s other share classes will vary due to differences in charges and expenses. The International Equity Fund’s performance in this chart and the performance table assumes the reinvestment of dividends, capital gain distributions and tax return of capital, but does not reflect the deduction of taxes that a shareholder would pay on Fund distributions or on the redemption of Fund shares.
| Annual Report | September 30, 2019 | 9 |
| ICON International Equity Fund | Schedule of Investments |
September 30, 2019
| | | Shares or
Principal
Amount | | | Value | |
| Common Stocks (96.51%) |
| Aerospace & Defense (1.49%) |
| Airbus SE | | | 3,500 | | | $ | 454,401 | |
| | | | | | | | | |
| Application Software (0.80%) |
| Open Text Corp. | | | 6,000 | | | | 244,737 | |
| | | | | | | | | |
| Biotechnology (0.90%) |
| Alexion Pharmaceuticals, Inc.(a) | | | 2,800 | | | | 274,232 | |
| | | | | | | | | |
| Building Products (0.88%) |
| Tyman PLC | | | 90,264 | | | | 267,470 | |
| | | | | | | | | |
| Commodity Chemicals (1.40%) |
| Indorama Ventures PCL | | | 100,000 | | | | 106,210 | |
| Kumho Petrochemical Co., Ltd. | | | 2,400 | | | | 143,515 | |
| PTT Global Chemical PCL | | | 100,000 | | | | 175,851 | |
| | | | | | | | 425,576 | |
| Diversified Banks (13.83%) |
| ABN AMRO Bank NV | | | 7,200 | | | | 126,839 | |
| Agricultural Bank of China, Ltd., Class H | | | 500,000 | | | | 195,798 | |
| Banco Santander SA | | | 115,000 | | | | 467,916 | |
| Bank of China, Ltd., Class H | | | 1,060,000 | | | | 415,702 | |
| DNB ASA | | | 7,700 | | | | 135,735 | |
| Grupo Financiero Banorte SAB de CV, Class O | | | 25,591 | | | | 137,927 | |
| HSBC Holdings PLC | | | 35,482 | | | | 271,871 | |
| ING Groep NV | | | 19,600 | | | | 204,757 | |
| KB Financial Group, Inc. | | | 2,700 | | | | 96,367 | |
| OTP Bank Nyrt | | | 8,000 | | | | 333,243 | |
| Oversea-Chinese Banking Corp., Ltd. | | | 48,000 | | | | 377,347 | |
| Sberbank of Russia PJSC, Sponsored ADR | | | 42,000 | | | | 593,985 | |
| Toronto-Dominion Bank | | | 6,100 | | | | 355,682 | |
| UniCredit SpA | | | 43,584 | | | | 513,727 | |
| | | | | | | | 4,226,896 | |
| Diversified Chemicals (1.52%) |
| BASF SE | | | 5,000 | | | | 349,592 | |
| Sumitomo Chemical Co., Ltd. | | | 26,000 | | | | 117,384 | |
| | | | | | | | 466,976 | |
| Drug Retail (2.38%) |
| Raia Drogasil SA, Sponsored ADR(b) | | | 37,000 | | | | 726,680 | |
| | | | | | | | | |
| Electric Utilities (5.75%) |
| CK Infrastructure Holdings, Ltd. | | | 74,000 | | | | 497,651 | |
| Enel SpA | | | 101,600 | | | | 758,883 | |
| Iberdrola SA | | | 22,306 | | | | 231,844 | |
| Kansai Electric Power Co., Inc.(b) | | | 24,000 | | | | 268,807 | |
| | | | | | | | 1,757,185 | |
| Gas Utilities (2.43%) |
| Beijing Enterprises Holdings, Ltd. | | | 52,000 | | | | 239,266 | |
| Kunlun Energy Co., Ltd. | | | 314,000 | | | | 270,567 | |
| Rubis SCA | | | 4,000 | | | | 232,329 | |
| | | | | | | | 742,162 | |
| | | Shares or
Principal
Amount | | | Value | |
| Health Care Services (0.84%) |
| Cigna Corp. | | | 1,700 | | | $ | 258,043 | |
| | | | | | | | | |
| Independent Power Producers & Energy Traders (3.61%) |
| Aboitiz Power Corp. | | | 290,000 | | | | 214,434 | |
| Electric Power Development Co., Ltd. | | | 12,200 | | | | 278,899 | |
| Electricity Generating PCL | | | 52,000 | | | | 610,422 | |
| | | | | | | | 1,103,755 | |
| Industrial Machinery (0.61%) | | | | | | | | |
| China Conch Venture Holdings, Ltd. | | | 50,000 | | | | 184,913 | |
| | | | | | | | | |
| Integrated Oil & Gas (9.32%) | | | | | | | | |
| Eni SpA | | | 21,000 | | | | 320,981 | |
| Gazprom PJSC, Sponsored ADR | | | 33,000 | | | | 227,832 | |
| MOL Hungarian Oil & Gas PLC | | | 31,600 | | | | 297,234 | |
| Rosneft Oil Co. PJSC, GDR | | | 75,700 | | | | 485,691 | |
| Royal Dutch Shell PLC, Class B | | | 27,000 | | | | 797,993 | |
| TOTAL SA | | | 13,800 | | | | 718,523 | |
| | | | | | | | 2,848,254 | |
| Integrated Telecommunication Services (2.03%) | | | | | | | | |
| Masmovil Ibercom SA(a) | | | 30,600 | | | | 621,251 | |
| | | | | | | | | |
| Interactive Media & Services (1.83%) | | | | | | | | |
| Momo, Inc., Sponsored ADR | | | 3,200 | | | | 99,136 | |
| Tencent Holdings, Ltd. | | | 7,000 | | | | 292,795 | |
| Yandex NV, Class A(a) | | | 4,800 | | | | 168,048 | |
| | | | | | | | 559,979 | |
| Internet & Direct Marketing Retail (0.82%) |
| Alibaba Group Holding, Ltd., Sponsored ADR(a) | | | 1,500 | | | | 250,845 | |
| | | | | | | | | |
| Life & Health Insurance (1.23%) |
| NN Group NV | | | 6,351 | | | | 225,071 | |
| Prudential PLC | | | 8,200 | | | | 148,593 | |
| | | | | | | | 373,664 | |
| Managed Health Care (1.57%) |
| Anthem, Inc. | | | 1,000 | | | | 240,100 | |
| UnitedHealth Group, Inc. | | | 1,100 | | | | 239,052 | |
| | | | | | | | 479,152 | |
| Multi-line Insurance (8.41%) |
| Allianz SE | | | 4,500 | | | | 1,047,478 | |
| Assicurazioni Generali SpA | | | 28,300 | | | | 548,447 | |
| Aviva PLC | | | 77,000 | | | | 378,005 | |
| AXA SA | | | 23,200 | | | | 592,386 | |
| | | | | | | | 2,566,316 | |
| Multi-Utilities (3.99%) |
| E.ON SE | | | 34,000 | | | | 330,570 | |
| Engie SA | | | 17,000 | | | | 277,478 | |
| National Grid PLC | | | 31,800 | | | | 344,307 | |
| Veolia Environnement SA | | | 10,500 | | | | 265,983 | |
| | | | | | | | 1,218,338 | |
| Oil & Gas Exploration & Production (0.41%) |
| DNO ASA | | | 88,000 | | | | 126,243 | |
The accompanying notes are an integral part of the financial statements.
| ICON International Equity Fund | Schedule of Investments |
September 30, 2019
| | | Shares or
Principal
Amount | | | Value | |
| Packaged Foods & Meats (1.99%) |
| Danone SA | | | 6,900 | | | $ | 607,766 | |
| | | | | | | | | |
| Paper Packaging (3.00%) |
| DS Smith PLC | | | 117,300 | | | | 519,402 | |
| Rengo Co., Ltd. | | | 55,000 | | | | 397,480 | |
| | | | | | | | 916,882 | |
| Paper Products (1.09%) |
| Oji Holdings Corp. | | | 71,000 | | | | 333,344 | |
| | | | | | | | | |
| Pharmaceuticals (5.86%) |
| GlaxoSmithKline PLC | | | 9,400 | | | | 201,484 | |
| Merck & Co., Inc. | | | 7,100 | | | | 597,678 | |
| Roche Holding AG | | | 3,000 | | | | 873,494 | |
| Takeda Pharmaceutical Co., Ltd. | | | 3,400 | | | | 116,673 | |
| | | | | | | | 1,789,329 | |
| Real Estate Development (1.49%) |
| Daiwa House Industry Co., Ltd.(b) | | | 14,000 | | | | 455,066 | |
| | | | | | | | | |
| Real Estate Operating Companies (7.16%) |
| BR Malls Participacoes SA | | | 300,000 | | | | 1,046,222 | |
| Iguatemi Empresa de Shopping Centers SA | | | 100,000 | | | | 1,140,567 | |
| | | | | | | | 2,186,789 | |
| Regional Banks (0.99%) |
| Regional SAB de CV | | | 66,000 | | | | 302,475 | |
| | | | | | | | | |
| Specialty Chemicals (2.28%) |
| Covestro AG(c) | | | 4,500 | | | | 222,670 | |
| Shin-Etsu Chemical Co., Ltd. | | | 4,400 | | | | 473,486 | |
| | | | | | | | 696,156 | |
| Tobacco (1.54%) |
| British American Tobacco PLC | | | 12,700 | | | | 469,012 | |
| | | | | | | | | |
| Trading Companies & Distributors (2.19%) |
| Ashtead Group PLC | | | 24,100 | | | | 670,206 | |
| | | | | | | | | |
| Wireless Telecommunication Services (2.87%) |
| China Mobile, Ltd. | | | 18,000 | | | | 149,108 | |
| SoftBank Group Corp.(b) | | | 18,400 | | | | 726,072 | |
| | | | | | | | 875,180 | |
| | | | | | | | | |
Total Common Stocks
(Cost $33,066,465) | | | | | | | 29,479,273 | |
| | | | | | | | | |
| Exchange Traded Funds (3.08%) | | | | | | | | |
| iShares®China Large-Cap ETF(b) | | | 7,556 | | | | 300,729 | |
| iShares®MSCI Brazil ETF(b) | | | 15,204 | | | | 640,544 | |
| | | | | | | | | |
Total Exchange Traded Funds
(Cost $987,842) | | | | | | | 941,273 | |
| | | Shares or
Principal
Amount | | | Value | |
| Collateral for Securities on Loan (2.08%) |
| State Street Navigator Securities Lending Government Money Market Portfolio, 7-Day Yield 2.09% | | | 635,068 | | | $ | 635,068 | |
| | | | | | | | | |
Total Collateral for Securities on Loan
(Cost $635,068) | | | | | | | 635,068 | |
| | | | | | | | | |
Total Investments (101.67%)
(Cost $34,689,375) | | | | | | $ | 31,055,614 | |
| | | | | | | | | |
| Liabilities Less Other Assets (-1.67%) | | | | | | | (509,004 | ) |
| | | | | | | | | |
| Net Assets (100.00%) | | | | | | $ | 30,546,610 | |
| (a) | Non-income producing security. |
| (b) | All or a portion of the security was on loan as of September 30, 2019. |
| (c) | Security was purchased pursuant to Rule 144A or Section 4(a)(2) under the Securities Act of 1933 and may be resold in transactions exempt from registration only to qualified institutional buyers. As of September 30, 2019, these securities had a total aggregate market value of $222,670. |
ADR - American Depositary Receipt
GDR - Global Depositary Receipt
The accompanying notes are an integral part of the financial statements.
| Annual Report | September 30, 2019 | 11 |
| ICON International Equity Fund | Schedule of Investments |
September 30, 2019
| Country Composition(September 30, 2019) | | | | |
| | | | | |
| United Kingdom | | | 13.33 | % |
| Japan | | | 10.36 | % |
| France | | | 10.31 | % |
| Brazil | | | 9.54 | % |
| Italy | | | 7.01 | % |
| Germany | | | 6.38 | % |
| United States | | | 5.27 | % |
| Russia | | | 4.83 | % |
| China | | | 4.71 | % |
| Spain | | | 4.32 | % |
| Hong Kong | | | 3.79 | % |
| Thailand | | | 2.93 | % |
| Switzerland | | | 2.86 | % |
| Hungary | | | 2.06 | % |
| Canada | | | 1.96 | % |
| Netherlands | | | 1.83 | % |
| Mexico | | | 1.44 | % |
| Singapore | | | 1.24 | % |
| Norway | | | 0.85 | % |
| South Korea | | | 0.79 | % |
| Philippines | | | 0.70 | % |
| | | | 96.51 | % |
Percentages are based upon common stocks as a percentage of net assets.
| Sector Composition(September 30, 2019) | | | | |
| | | | | |
| Financials | | | 24.46 | % |
| Utilities | | | 15.78 | % |
| Energy | | | 9.73 | % |
| Materials | | | 9.29 | % |
| Health Care | | | 9.17 | % |
| Real Estate | | | 8.65 | % |
| Communication Services | | | 6.73 | % |
| Consumer Staples | | | 5.91 | % |
| Industrials | | | 5.17 | % |
| Consumer Discretionary | | | 0.82 | % |
| Information Technology | | | 0.80 | % |
| | | | 96.51 | % |
Percentages are based upon common stocks as a percentage of net assets.
| Industry Composition(September 30, 2019) | | | | |
| | | | | |
| Diversified Banks | | | 13.83 | % |
| Integrated Oil & Gas | | | 9.32 | % |
| Multi-line Insurance | | | 8.41 | % |
| Real Estate Operating Companies | | | 7.16 | % |
| Pharmaceuticals | | | 5.86 | % |
| Electric Utilities | | | 5.75 | % |
| Multi-Utilities | | | 3.99 | % |
| Independent Power Producers & Energy Traders | | | 3.61 | % |
| Paper Packaging | | | 3.00 | % |
| Wireless Telecommunication Services | | | 2.87 | % |
| Gas Utilities | | | 2.43 | % |
| Drug Retail | | | 2.38 | % |
| Specialty Chemicals | | | 2.28 | % |
| Trading Companies & Distributors | | | 2.19 | % |
| Integrated Telecommunication Services | | | 2.03 | % |
| Packaged Foods & Meats | | | 1.99 | % |
| Interactive Media & Services | | | 1.83 | % |
| Managed Health Care | | | 1.57 | % |
| Tobacco | | | 1.54 | % |
| Diversified Chemicals | | | 1.52 | % |
| Diversified Real Estate Activities | | | 1.49 | % |
| Aerospace & Defense | | | 1.49 | % |
| Commodity Chemicals | | | 1.40 | % |
| Life & Health Insurance | | | 1.23 | % |
| Paper Products | | | 1.09 | % |
| Other Industries (each less than 1%) | | | 6.25 | % |
| | | | 96.51 | % |
Percentages are based upon common stocks as a percentage of net assets.
The accompanying notes are an integral part of the financial statements.
| ICON International Funds | Statements of Assets and Liabilities |
September 30, 2019
| | | ICON Emerging Markets Fund | | ICON International Equity Fund |
| Assets | | | | |
| Investments, at cost | | $ | 46,408,829 | | | $ | 34,689,375 | |
| Investments, at value(a) | | | 46,305,042 | | | | 31,055,614 | |
| Cash and cash equivalents | | | — | | | | 80,870 | |
| Foreign currency, at value (Cost $569,149 and $37,053, respectively) | | | 571,694 | | | | 37,173 | |
| Receivables: | | | | | | | | |
| Fund shares sold | | | 16,011 | | | | 375 | |
| Expense reimbursements due from Adviser | | | 41,588 | | | | 24,005 | |
| Interest | | | 178 | | | | 33 | |
| Dividends | | | 62,153 | | | | 60,958 | |
| Foreign tax reclaims | | | — | | | | 31,610 | |
| Other assets | | | 10,009 | | | | 9,585 | |
| Total assets | | | 47,006,675 | | | | 31,300,223 | |
| | | | | | | | | |
| Liabilities | | | | | | | | |
| Payables: | | | | | | | | |
| Payable for collateral received on securities loaned | | | 2,134,300 | | | | 635,068 | |
| Loan payable, at value (Cost $821,513 and $–) | | | 821,513 | | | | — | |
| Capital gains tax | | | 33,147 | | | | — | |
| Fund shares redeemed | | | 74,058 | | | | 5,474 | |
| Advisory fees | | | 36,990 | | | | 25,348 | |
| Transfer agent fees | | | 56,716 | | | | 18,360 | |
| Fund accounting fees | | | 15,477 | | | | 22,538 | |
| Accrued distribution fees | | | 401 | | | | 956 | |
| Trustee fees and expenses | | | 1,591 | | | | 1,069 | |
| Administration fees | | | 1,847 | | | | 1,267 | |
| Accrued expenses | | | 60,643 | | | | 43,533 | |
| Total liabilities | | | 3,236,683 | | | | 753,613 | |
| Net Assets - all share classes | | $ | 43,769,992 | | | $ | 30,546,610 | |
| Net Assets - Class S | | $ | 41,844,914 | | | $ | 28,025,284 | |
| Net Assets - Class C | | $ | — | | | $ | 708,212 | |
| Net Assets - Class A | | $ | 1,925,078 | | | $ | 1,813,114 | |
| | | | | | | | | |
| Net Assets Consists of | | | | | | | | |
| Paid-in capital | | $ | 45,601,369 | | | $ | 44,620,310 | |
| Total distributable earnings | | | (1,831,377 | ) | | | (14,073,700 | ) |
| Net Assets | | $ | 43,769,992 | | | $ | 30,546,610 | |
| | | | | | | | | |
| Shares outstanding (unlimited shares authorized, no par value) | | | | | | | | |
| Class S | | | 2,824,191 | | | | 2,524,545 | |
| Class C | | | — | | | | 73,682 | |
| Class A | | | 130,665 | | | | 167,077 | |
| Net asset value (offering and redemption price per share) | | | | | | | | |
| Class S | | $ | 14.82 | | | $ | 11.10 | |
| Class C | | $ | — | | | $ | 9.61 | |
| Class A | | $ | 14.73 | | | $ | 10.85 | |
| Class A maximum offering price (100%/ (100%-maximum sales charge)) of net asset value adjusted to the nearest cent per share | | $ | 15.63 | | | $ | 11.51 | |
| | | | | | | | | |
| (a) Includes securities on loan of | | $ | 2,924,273 | | | $ | 2,334,280 | |
The accompanying notes are an integral part of the financial statements.
| Annual Report | September 30, 2019 | 13 |
| ICON International Funds | Statements of Operations |
Year Ended September 30, 2019
| | | ICON Emerging Markets Fund | | ICON International Equity Fund |
| Investment Income | | | | |
| Dividends | | $ | 1,991,225 | | | $ | 1,245,089 | |
| Foreign taxes withheld | | | (172,065 | ) | | | (113,533 | ) |
| Income from securities lending, net | | | 3,405 | | | | 6,333 | |
| Total investment income | | | 1,822,565 | | | | 1,137,889 | |
| | | | | | | | | |
| Expenses | | | | | | | | |
| Advisory fees | | | 517,179 | | | | 353,572 | |
| Administration fees | | | 25,856 | | | | 17,677 | |
| Transfer agent fees | | | 152,344 | | | | 54,311 | |
| Distribution fees: | | | | | | | | |
| Class C | | | — | | | | 12,875 | |
| Class A | | | 9,526 | | | | 3,706 | |
| Registration fees | | | 35,608 | | | | 40,260 | |
| Audit and tax service expense | | | 24,500 | | | | 24,800 | |
| Fund accounting fees | | | 45,794 | | | | 52,084 | |
| Trustee fees and expenses | | | 17,020 | | | | 11,749 | |
| Insurance expense | | | 6,116 | | | | 4,653 | |
| Custody fees | | | 46,182 | | | | 20,537 | |
| Printing fees | | | 18,960 | | | | 9,468 | |
| Interest expense | | | 4,870 | | | | 643 | |
| Recoupment of previously reimbursed expenses | | | 456 | | | | — | |
| Other expenses | | | 33,549 | | | | 27,148 | |
| Total expenses before expense reimbursement | | | 937,960 | | | | 633,483 | |
| Expense reimbursement by Adviser due to expense limitation agreement | | | (122,802 | ) | | | (68,987 | ) |
| Net Expenses | | | 815,158 | | | | 564,496 | |
| Net Investment Income/(Loss) | | | 1,007,407 | | | | 573,393 | |
| | | | | | | | | |
| Realized and Unrealized Gain/(Loss) | | | | | | | | |
| Net realized gain/(loss) on: | | | | | | | | |
| Investments and foreign currency translations | | | (2,531,415 | ) | | | (3,733,506 | ) |
| | | | (2,531,415 | ) | | | (3,733,506 | ) |
| Change in unrealized net appreciation/(depreciation) on: | | | | | | | | |
| Investments and foreign currency | | | (1,876,211 | ) | | | (2,092,910 | ) |
| Capital gains tax | | | 72,949 | | | | 10,312 | |
| | | | (1,803,262 | ) | | | (2,082,598 | ) |
| Net realized and unrealized gain/(loss) | | | (4,334,677 | ) | | | (5,816,104 | ) |
| Net Increase/(Decrease) in Net Assets Resulting From Operations | | $ | (3,327,270 | ) | | $ | (5,242,711 | ) |
The accompanying notes are an integral part of the financial statements.
| ICON International Funds | Statements of Changes in Net Assets |
| | | ICON Emerging Markets Fund | | ICON International Equity Fund |
| | | Year Ended September 30, 2019 | | Year Ended September 30, 2018 | | Year Ended September 30, 2019 | | Year Ended September 30, 2018 |
| Operations | | | | | | | | |
| Net investment income/(loss) | | $ | 1,007,407 | | | $ | 1,155,711 | | | $ | 573,393 | | | $ | 709,879 | |
| Net realized gain/(loss) | | | (2,531,415 | ) | | | 257,464 | | | | (3,733,506 | ) | | | 592,186 | |
| Change in net unrealized appreciation/(depreciation) | | | (1,803,262 | ) | | | (146,633 | ) | | | (2,082,598 | ) | | | (2,455,976 | ) |
| Net increase/(decrease) in net assets resulting from operations | | | (3,327,270 | ) | | | 1,266,542 | | | | (5,242,711 | ) | | | (1,153,911 | ) |
| | | | | | | | | | | | | | | | | |
| Total Dividends and Distributions to Shareholders | | | | | | | | | | | | | | | | |
| Class S | | | (1,423,899 | ) | | | (100,052 | ) | | | (484,584 | ) | | | — | |
| Class C | | | — | | | | — | | | | (22,016 | ) | | | — | |
| Class A | | | (158,692 | ) | | | (478 | ) | | | (18,087 | ) | | | — | |
| Net decrease from dividends and distributions | | | (1,582,591 | ) | | | (100,530 | ) | | | (524,687 | ) | | | — | |
| | | | | | | | | | | | | | | | | |
| Fund Share Transactions | | | | | | | | | | | | | | | | |
| Shares sold | | | | | | | | | | | | | | | | |
| Class S | | | 17,253,254 | | | | 21,485,982 | | | | 1,426,654 | | | | 7,643,709 | |
| Class C | | | — | | �� | | — | | | | 117,325 | | | | 176,801 | |
| Class A | | | 2,780,869 | | | | 3,063,930 | | | | 704,985 | | | | 82,833 | |
| Reinvested dividends and distributions | | | | | | | | | | | | | | | | |
| Class S | | | 1,374,068 | | | | 95,422 | | | | 477,537 | | | | — | |
| Class C | | | — | | | | — | | | | 21,671 | | | | — | |
| Class A | | | 142,269 | | | | 424 | | | | 15,393 | | | | — | |
| Shares repurchased | | | | | | | | | | | | | | | | |
| Class S | | | (23,122,177 | ) | | | (23,337,380 | ) | | | (8,672,586 | ) | | | (11,643,496 | ) |
| Class C | | | — | | | | — | | | | (1,113,346 | ) | | | (664,995 | ) |
| Class A | | | (7,081,250 | ) | | | (9,861,188 | ) | | | (159,807 | ) | | | (849,184 | ) |
| Net decrease from fund share transactions | | | (8,652,967 | ) | | | (8,552,810 | ) | | | (7,182,174 | ) | | | (5,254,332 | ) |
| | | | | | | | | | | | | | | | | |
| Total net decrease in net assets | | | (13,562,828 | ) | | | (7,386,798 | ) | | | (12,949,572 | ) | | | (6,408,243 | ) |
| | | | | | | | | | | | | | | | | |
| Net Assets | | | | | | | | | | | | | | | | |
| Beginning of year | | | 57,332,820 | | | | 64,719,618 | | | | 43,496,182 | | | | 49,904,425 | |
| End of year | | $ | 43,769,992 | | | $ | 57,332,820 | | | $ | 30,546,610 | | | $ | 43,496,182 | |
| | | | | | | | | | | | | | | | | |
| Transactions in Fund Shares | | | | | | | | | | | | | | | | |
| Shares sold | | | | | | | | | | | | | | | | |
| Class S | | | 1,126,509 | | | | 1,282,140 | | | | 124,926 | | | | 564,142 | |
| Class C | | | — | | | | — | | | | 12,032 | | | | 15,057 | |
| Class A | | | 179,903 | | | | 184,221 | | | | 63,850 | | | | 6,230 | |
| Issued to shareholders in reinvestment of distributions | | | | | | | | | | | | | | | | |
| Class S | | | 97,521 | | | | 5,942 | | | | 44,881 | | | | — | |
| Class C | | | — | | | | — | | | | 2,333 | | | | — | |
| Class A | | | 10,133 | | | | 26 | | | | 1,479 | | | | — | |
| Shares repurchased | | | | | | | | | | | | | | | | |
| Class S | | | (1,537,333 | ) | | | (1,410,257 | ) | | | (754,791 | ) | | | (882,846 | ) |
| Class C | | | — | | | | — | | | | (112,180 | ) | | | (56,962 | ) |
| Class A | | | (459,642 | ) | | | (601,142 | ) | | | (14,333 | ) | | | (66,078 | ) |
| Net decrease | | | (582,909 | ) | | | (539,070 | ) | | | (631,803 | ) | | | (420,457 | ) |
| Shares outstanding, beginning of year | | | 3,537,765 | | | | 4,076,835 | | | | 3,397,107 | | | | 3,817,564 | |
| Shares outstanding, end of year | | | 2,954,856 | | | | 3,537,765 | | | | 2,765,304 | | | | 3,397,107 | |
The accompanying notes are an integral part of the financial statements.
| Annual Report | September 30, 2019 | 15 |
| ICON Emerging Markets Fund | Financial Highlights |
For a Share Outstanding Throughout the Years Presented
| Class S | | Year Ended
September 30, 2019 | | Year Ended
September 30, 2018 | | Year Ended
September 30, 2017 | | Year Ended
September 30, 2016 | | Year Ended
September 30, 2015 |
| Net asset value, beginning of period | | $ | 16.22 | | | $ | 15.90 | | | $ | 14.28 | | | $ | 12.95 | | | $ | 13.72 | |
| Income/(loss) from investment operations: | | | | | | | | | | | | | | | | | | | | |
| Net investment income/(loss)(a) | | | 0.31 | | | | 0.31 | | | | 0.07 | | | | (0.00 | )(b) | | | (0.03 | ) |
| Net realized and unrealized gains/(losses) on investments | | | (1.24 | ) | | | 0.04 | | | | 1.55 | | | | 1.33 | | | | (0.74 | ) |
| Total from investment operations | | | (0.93 | ) | | | 0.35 | | | | 1.62 | | | | 1.33 | | | | (0.77 | ) |
| | | | | | | | | | | | | | | | | | | | | |
| Less dividends and distributions: | | | | | | | | | | | | | | | | | | | | |
| Dividends from net investment income | | | (0.31 | ) | | | (0.03 | ) | | | — | | | | — | | | | — | |
| Distributions from net realized gains | | | (0.16 | ) | | | — | | | | — | | | | — | | | | — | |
| Total dividends and distributions | | | (0.47 | ) | | | (0.03 | ) | | | — | | | | — | | | | — | |
| | | | | | | | | | | | | | | | | | | | | |
| Net asset value, end of period | | $ | 14.82 | | | $ | 16.22 | | | $ | 15.90 | | | $ | 14.28 | | | $ | 12.95 | |
| | | | | | | | | | | | | | | | | | | | | |
| Total Return | | | (5.60 | )% | | | 2.21 | % | | | 11.34 | % | | | 10.27 | % | | | (5.61 | )% |
| | | | | | | | | | | | | | | | | | | | | |
| Ratios and Supplemental Data | | | | | | | | | | | | | | | | | | | | |
| Net assets, end of period (in 000s) | | $ | 41,845 | | | $ | 50,897 | | | $ | 51,833 | | | $ | 45,786 | | | $ | 16,123 | |
| | | | | | | | | | | | | | | | | | | | | |
| Ratio of expenses to average net assets | | | | | | | | | | | | | | | | | | | | |
| Before expense limitation | | | 1.78 | % | | | 1.61 | % | | | 1.72 | % | | | 1.85 | % | | | 2.44 | % |
| After expense limitation(c) | | | 1.56 | % | | | 1.55 | % | | | 1.55 | % | | | 1.55 | % | | | 1.55 | % |
| Ratio of net investment income/(loss) to average net assets | | | | | | | | | | | | | | | | | | | | |
| Before expense limitation | | | 1.81 | % | | | 1.83 | % | | | 0.29 | % | | | (0.32 | )% | | | (1.08 | )% |
| After expense limitation(c) | | | 2.03 | % | | | 1.89 | % | | | 0.46 | % | | | (0.02 | )% | | | (0.19 | )% |
| Portfolio turnover rate | | | 78 | % | | | 63 | % | | | 169 | % | | | 156 | % | | | 76 | % |
| (a) | Calculated using the average shares method. |
| (b) | Amount less than $(0.005). |
| (c) | The Fund’s operating expenses, not including interest expense, are contractually limited to the amounts discussed in Note 3. The ratios in these financial highlights reflect the limitation, including the interest expense, when applicable. |
The accompanying notes are an integral part of the financial statements.
| ICON Emerging Markets Fund | Financial Highlights |
For a Share Outstanding Throughout the Years Presented
| Class A(a) | | Year Ended September 30, 2019 | | Year Ended
September 30, 2018 | | Year Ended
September 30, 2017 | | Year Ended
September 30, 2016 | | Year Ended
September 30, 2015 |
| Net asset value, beginning of period | | $ | 16.08 | | | $ | 15.77 | | | $ | 14.20 | | | $ | 12.91 | | | $ | 13.71 | |
| Income/(loss) from investment operations: | | | | | | | | | | | | | | | | | | | | |
| Net investment income/(loss)(b) | | | 0.14 | | | | 0.24 | | | | 0.06 | | | | (0.01 | ) | | | (0.07 | ) |
| Net realized and unrealized gains/(losses) on investments | | | (1.10 | ) | | | 0.07 | | | | 1.51 | | | | 1.30 | | | | (0.73 | ) |
| Total from investment operations | | | (0.96 | ) | | | 0.31 | | | | 1.57 | | | | 1.29 | | | | (0.80 | ) |
| | | | | | | | | | | | | | | | | | | | | |
| Less dividends and distributions: | | | | | | | | | | | | | | | | | | | | |
| Dividends from net investment income | | | (0.23 | ) | | | (0.00 | )(c) | | | — | | | | — | | | | — | |
| Distributions from net realized gains | | | (0.16 | ) | | | — | | | | — | | | | — | | | | — | |
| Total dividends and distributions | | | (0.39 | ) | | | (0.00 | ) | | | — | | | | — | | | | — | |
| | | | | | | | | | | | | | | | | | | | | |
| Net asset value, end of period | | $ | 14.73 | | | $ | 16.08 | | | $ | 15.77 | | | $ | 14.20 | | | $ | 12.91 | |
| | | | | | | | | | | | | | | | | | | | | |
| Total Return(d) | | | (5.87 | )% | | | 1.97 | % | | | 11.06 | % | | | 9.99 | % | | | (5.84 | )% |
| | | | | | | | | | | | | | | | | | | | | |
| Ratios and Supplemental Data | | | | | | | | | | | | | | | | | | | | |
| Net assets, end of period (in 000s) | | $ | 1,925 | | | $ | 6,436 | | | $ | 12,887 | | | $ | 9,072 | | | $ | 725 | |
| | | | | | | | | | | | | | | | | | | | | |
| Ratio of expenses to average net assets | | | | | | | | | | | | | | | | | | | | |
| Before expense limitation | | | 2.26 | % | | | 1.96 | % | | | 2.12 | % | | | 2.16 | % | | | 4.75 | % |
| After expense limitation(e) | | | 1.81 | % | | | 1.80 | % | | | 1.80 | % | | | 1.80 | % | | | 1.80 | % |
| Ratio of net investment income/(loss) to average net assets | | | | | | | | | | | | | | | | | | | | |
| Before expense limitation | | | 0.45 | % | | | 1.32 | % | | | 0.08 | % | | | (0.43 | )% | | | (3.44 | )% |
| After expense limitation(e) | | | 0.90 | % | | | 1.48 | % | | | 0.40 | % | | | (0.07 | )% | | | (0.49 | )% |
| Portfolio turnover rate | | | 78 | % | | | 63 | % | | | 169 | % | | | 156 | % | | | 76 | % |
| (a) | Class C shares were merged into Class A on January 10, 2017. The amounts presented represent the results of the Class A shares for the periods prior to the merger and the results of the combined share class for the period subsequent to the merger. |
| (b) | Calculated using the average shares method. |
| (c) | Amount less than $(0.005). |
| (d) | The total return calculation excludes any sales charges. |
| (e) | The Fund’s operating expenses, not including interest expense, are contractually limited to the amounts discussed in Note 3. The ratios in these financial highlights reflect the limitation, including the interest expense, when applicable. |
The accompanying notes are an integral part of the financial statements.
| Annual Report | September 30, 2019 | 17 |
| ICON International Equity Fund | Financial Highlights |
For a Share Outstanding Throughout the Years Presented
| Class S | | Year Ended
September 30, 2019 | | Year Ended
September 30, 2018 | | Year Ended
September 30, 2017 | | Year Ended
September 30, 2016 | | Year Ended
September 30, 2015 |
| Net asset value, beginning of period | | $ | 12.89 | | | $ | 13.17 | | | $ | 11.94 | | | $ | 11.37 | | | $ | 11.75 | |
| Income/(loss) from investment operations: | | | | | | | | | | | | | | | | | | | | |
| Net investment income/(loss)(a) | | | 0.19 | | | | 0.20 | | | | 0.04 | | | | 0.05 | | | | 0.00 | (b) |
| Net realized and unrealized gains/(losses) on investments | | | (1.81 | ) | | | (0.48 | ) | | | 1.19 | | | | 0.52 | | | | (0.37 | ) |
| Total from investment operations | | | (1.62 | ) | | | (0.28 | ) | | | 1.23 | | | | 0.57 | | | | (0.37 | ) |
| | | | | | | | | | | | | | | | | | | | | |
| Less dividends and distributions: | | | | | | | | | | | | | | | | | | | | |
| Dividends from net investment income | | | (0.17 | ) | | | — | | | | — | | | | — | | | | (0.01 | ) |
| Total dividends and distributions | | | (0.17 | ) | | | — | | | | — | | | | — | | | | (0.01 | ) |
| | | | | | | | | | | | | | | | | | | | | |
| Net asset value, end of period | | $ | 11.10 | | | $ | 12.89 | | | $ | 13.17 | | | $ | 11.94 | | | $ | 11.37 | |
| | | | | | | | | | | | | | | | | | | | | |
| Total Return | | | (12.55 | )% | | | (2.13 | )% | | | 10.30 | % | | | 5.01 | % | | | (3.15 | )% |
| | | | | | | | | | | | | | | | | | | | | |
| Ratios and Supplemental Data | | | | | | | | | | | | | | | | | | | | |
| Net assets, end of period (in 000s) | | $ | 28,025 | | | $ | 40,096 | | | $ | 45,144 | | | $ | 50,005 | | | $ | 67,201 | |
| | | | | | | | | | | | | | | | | | | | | |
| Ratio of expenses to average net assets | | | | | | | | | | | | | | | | | | | | |
| Before expense limitation | | | 1.64 | % | | | 1.49 | % | | | 1.57 | % | | | 1.45 | % | | | 1.41 | % |
| After expense limitation(c) | | | 1.55 | % | | | 1.49 | % | | | 1.55 | % | | | 1.45 | % | | | 1.41 | % |
| Ratio of net investment income/(loss) to average net assets | | | | | | | | | | | | | | | | | | | | |
| Before expense limitation | | | 1.58 | % | | | 1.46 | % | | | 0.31 | % | | | 0.45 | % | | | 0.00 | %(d) |
| After expense limitation(c) | | | 1.67 | % | | | 1.46 | % | | | 0.33 | % | | | 0.45 | % | | | 0.00 | %(d) |
| Portfolio turnover rate | | | 40 | % | | | 92 | % | | | 209 | % | | | 198 | % | | | 204 | % |
| (a) | Calculated using the average shares method. |
| (b) | Amount less than $0.005. |
| (c) | The Fund’s operating expenses, not including interest expense, are contractually limited to the amounts discussed in Note 3. The ratios in these financial highlights reflect the limitation, including the interest expense, when applicable. |
| (d) | Less than 0.005% of average net assets. |
The accompanying notes are an integral part of the financial statements.
| ICON International Equity Fund | Financial Highlights |
For a Share Outstanding Throughout the Years Presented
| Class C | | Year Ended
September 30, 2019 | | Year Ended
September 30, 2018 | | Year Ended
September 30, 2017 | | Year Ended
September 30, 2016 | | Year Ended
September 30, 2015 |
| Net asset value, beginning of period | | $ | 11.28 | | | $ | 11.64 | | | $ | 10.66 | | | $ | 10.27 | | | $ | 10.72 | |
| Income/(loss) from investment operations: | | | | | | | | | | | | | | | | | | | | |
| Net investment income/(loss)(a) | | | 0.06 | | | | 0.04 | | | | (0.07 | ) | | | (0.09 | ) | | | (0.12 | ) |
| Net realized and unrealized gains/(losses) on investments | | | (1.59 | ) | | | (0.40 | ) | | | 1.05 | | | | 0.48 | | | | (0.33 | ) |
| Total from investment operations | | | (1.53 | ) | | | (0.36 | ) | | | 0.98 | | | | 0.39 | | | | (0.45 | ) |
| | | | | | | | | | | | | | | | | | | | | |
| Less dividends and distributions: | | | | | | | | | | | | | | | | | | | | |
| Dividends from net investment income | | | (0.14 | ) | | | — | | | | — | | | | — | | | | — | |
| Total dividends and distributions | | | (0.14 | ) | | | — | | | | — | | | | — | | | | — | |
| | | | | | | | | | | | | | | | | | | | | |
| Net asset value, end of period | | $ | 9.61 | | | $ | 11.28 | | | $ | 11.64 | | | $ | 10.66 | | | $ | 10.27 | |
| | | | | | | | | | | | | | | | | | | | | |
| Total Return(b) | | | (13.52 | )% | | | (3.09 | )% | | | 9.19 | % | | | 3.80 | % | | | (4.20 | )% |
| | | | | | | | | | | | | | | | | | | | | |
| Ratios and Supplemental Data | | | | | | | | | | | | | | | | | | | | |
| Net assets, end of period (in 000s) | | $ | 708 | | | $ | 1,934 | | | $ | 2,484 | | | $ | 2,941 | | | $ | 3,299 | |
| | | | | | | | | | | | | | | | | | | | | |
| Ratio of expenses to average net assets | | | | | | | | | | | | | | | | | | | | |
| Before expense limitation | | | 4.09 | % | | | 3.29 | % | | | 3.35 | % | | | 3.13 | % | | | 2.96 | % |
| After expense limitation(c) | | | 2.56 | % | | | 2.55 | % | | | 2.55 | % | | | 2.55 | % | | | 2.55 | % |
| Ratio of net investment income/(loss) to average net assets | | | | | | | | | | | | | | | | | | | | |
| Before expense limitation | | | (0.91 | )% | | | (0.42 | )% | | | (1.48 | )% | | | (1.40 | )% | | | (1.56 | )% |
| After expense limitation(c) | | | 0.62 | % | | | 0.32 | % | | | (0.68 | )% | | | (0.82 | )% | | | (1.15 | )% |
| Portfolio turnover rate | | | 40 | % | | | 92 | % | | | 209 | % | | | 198 | % | | | 204 | % |
| (a) | Calculated using the average shares method. |
| (b) | The total return calculation excludes any sales charges. |
| (c) | The Fund’s operating expenses, not including interest expense, are contractually limited to the amounts discussed in Note 3. The ratios in these financial highlights reflect the limitation, including the interest expense, when applicable. |
The accompanying notes are an integral part of the financial statements.
| Annual Report | September 30, 2019 | 19 |
| ICON International Equity Fund | Financial Highlights |
For a Share Outstanding Throughout the Years Presented
| Class A | | Year Ended
September 30, 2019 | | Year Ended
September 30, 2018 | | Year Ended
September 30, 2017 | | Year Ended
September 30, 2016 | | Year Ended
September 30, 2015 |
| Net asset value, beginning of period | | $ | 12.63 | | | $ | 12.94 | | | $ | 11.76 | | | $ | 11.24 | | | $ | 11.65 | |
| Income/(loss) from investment operations: | | | | | | | | | | | | | | | | | | | | |
| Net investment income/(loss)(a) | | | 0.17 | | | | 0.14 | | | | 0.01 | | | | 0.05 | | | | (0.04 | ) |
| Net realized and unrealized gains/(losses) on investments | | | (1.79 | ) | | | (0.45 | ) | | | 1.17 | | | | 0.47 | | | | (0.37 | ) |
| Total from investment operations | | | (1.62 | ) | | | (0.31 | ) | | | 1.18 | | | | 0.52 | | | | (0.41 | ) |
| | | | | | | | | | | | | | | | | | | | | |
| Less dividends and distributions: | | | | | | | | | | | | | | | | | | | | |
| Dividends from net investment income | | | (0.16 | ) | | | — | | | | — | | | | — | | | | — | |
| Total dividends and distributions | | | (0.16 | ) | | | — | | | | — | | | | — | | | | — | |
| | | | | | | | | | | | | | | | | | | | | |
| Net asset value, end of period | | $ | 10.85 | | | $ | 12.63 | | | $ | 12.94 | | | $ | 11.76 | | | $ | 11.24 | |
| | | | | | | | | | | | | | | | | | | | | |
| Total Return(b) | | | (12.79 | )% | | | (2.40 | )% | | | 10.03 | % | | | 4.63 | % | | | (3.52 | )% |
| | | | | | | | | | | | | | | | | | | | | |
| Ratios and Supplemental Data | | | | | | | | | | | | | | | | | | | | |
| Net assets, end of period (in 000s) | | $ | 1,813 | | | $ | 1,466 | | | $ | 2,276 | | | $ | 2,829 | | | $ | 3,725 | |
| | | | | | | | | | | | | | | | | | | | | |
| Ratio of expenses to average net assets | | | | | | | | | | | | | | | | | | | | |
| Before expense limitation | | | 3.15 | % | | | 2.59 | % | | | 2.67 | % | | | 2.43 | % | | | 2.25 | % |
| After expense limitation(c) | | | 1.80 | % | | | 1.80 | % | | | 1.80 | % | | | 1.80 | % | | | 1.80 | % |
| Ratio of net investment income/(loss) to average net assets | | | | | | | | | | | | | | | | | | | | |
| Before expense limitation | | | 0.14 | % | | | 0.28 | % | | | (0.80 | )% | | | (0.19 | )% | | | (0.77 | )% |
| After expense limitation(c) | | | 1.49 | % | | | 1.07 | % | | | 0.07 | % | | | 0.44 | % | | | (0.32 | )% |
| Portfolio turnover rate | | | 40 | % | | | 92 | % | | | 209 | % | | | 198 | % | | | 204 | % |
| (a) | Calculated using the average shares method. |
| (b) | The total return calculation excludes any sales charges. |
| (c) | The Fund’s operating expenses, not including interest expense, are contractually limited to the amounts discussed in Note 3. The ratios in these financial highlights reflect the limitation, including the interest expense, when applicable. |
The accompanying notes are an integral part of the financial statements.
| ICON International Funds | Notes to Financial Statements |
September 30, 2019
1. ORGANIZATION
The ICON Emerging Markets Fund (“Emerging Markets Fund”) and ICON International Equity Fund (“International Equity Fund”) are series funds (individually a “Fund” and collectively, the “Funds”). The Funds are part of the ICON Funds (the “Trust”), a Massachusetts business trust registered under the Investment Company Act of 1940, as amended (the “1940 Act”) as an open-end investment management company. Each Fund offers two classes of shares: Class S and Class A. The International Equity Fund also offers Class C shares. All classes have equal rights as to earnings, assets and voting privileges except that each Class may bear different distribution fees, registration costs, legal costs, mailing and printing costs and shareholder servicing costs and each Class has exclusive voting rights with respect to its distribution plan. There are currently fifteen other active Funds within the Trust. Those Funds are covered by separate prospectuses and shareholder reports.
Each Fund is authorized to issue an unlimited number of no par shares. The Funds primarily invest in foreign securities; the Emerging Markets Fund primarily invests in securities of issuers whose principal activities are in emerging markets, or are economically tied to an emerging market country. The International Equity Fund primarily invests in foreign equity securities. Foreign equity securities refer to securities of issuers, wherever organized, whose securities are listed or traded principally on a recognized stock exchange or over-the-counter market outside the United States. The investment objective of each Fund is to provide long-term capital appreciation.
The Funds, like all investments in securities, have elements of risk, including risk of loss of principal. There is no assurance that the Funds will achieve their investment objectives and may underperform funds with similar investment objectives. An investment concentrated in sectors and industries involves greater risk and volatility than a more diversified investment. Investments in foreign securities and currency transactions may involve certain considerations and risks not typically associated with those of U.S. dollar-denominated transactions as a result of, among other factors, the possibility of less government supervision and regulation of foreign securities markets and the possibility of political or economic instability. Financial statements of foreign companies are governed by different accounting, auditing, and financial standards than U.S. companies and may be less transparent and uniform than in the United States. Many corporate governance standards, which help ensure the integrity of public information in the United States, may not exist in some foreign countries. In general, there may be less governmental supervision of foreign stock exchanges and securities brokers and issuers. Securities of emerging or developing market companies may be less liquid and more volatile than securities in countries with more mature markets. There are also risks associated with small-and mid-cap investing, including limited product lines, less liquidity, and small market share.
In the normal course of business, the Funds may enter into various agreements that provide for general indemnifications. Each Fund’s maximum exposure under these arrangements is unknown as any potential exposure involving future claims that may be made against each Fund is unknown. However, based on experience, the Funds expect the risk of loss to be remote.
2. SIGNIFICANT ACCOUNTING POLICIES
The following is a summary of significant accounting policies consistently followed by the Funds in the preparation of their financial statements. The financial statements are prepared in conformity with accounting principles generally accepted in the United States of America (“GAAP”), which requires management to make certain estimates and assumptions that affect the reported amounts of assets and liabilities, disclosure of contingent assets and liabilities at the date of the financial statements, and the reported amounts of income and expenses during the reporting period. Actual results may differ from these estimates. Each Fund is considered an investment company under GAAP and follows the accounting and reporting guidance applicable to investment companies in the Financial Accounting Standards Board Accounting Standards Codification Topic 946.
Investment Valuation
The Funds’ securities and other assets, excluding options on securities indexes, are valued at the closing price as of the close of regular trading on the New York Stock Exchange (the “NYSE”) (normally 4 p.m. Eastern Time) each day the NYSE is open, except that securities traded primarily on the NASDAQ Stock Market (“NASDAQ”) are normally valued by the Funds at the NASDAQ Official Closing Price provided by NASDAQ each business day. If the NYSE closes unexpectedly and there is active trading on other exchanges, the securities will be valued at the Valuation Time based off of those exchanges. Options on securities indexes are valued at the close of the Chicago Board Options Exchange (normally 4:15 p.m. Eastern Time) on each day the NYSE is open for trading.
The Funds use pricing services to obtain the fair value of securities in their portfolios. If a pricing service is not able to provide a price, or the pricing service’s valuation is considered inaccurate or does not, in the Funds’ judgment, reflect the fair value of the security, prices may be obtained through market quotations from independent broker/dealers. If market quotations from these sources are not readily available, the Funds’ securities or other assets are valued at fair value as determined in good faith by the Funds’ Valuation Committee pursuant to procedures approved by the Funds’ Board of Trustees (the “Board”).
| Annual Report | September 30, 2019 | 21 |
| ICON International Funds | Notes to Financial Statements |
September 30, 2019
Lacking any sales that day, a security is valued at the current closing bid price (or yield equivalent thereof) or based on quotes obtained from dealers making a market for the security. Exchange traded options are valued at the composite price, using the National Best Bid and Offer quotes (“NBBO”). NBBO consists of the highest bid price and lowest ask price across any of the exchanges on which an option is quoted, thus providing a view across the entire U.S. options marketplace. Debt securities with a remaining maturity of greater than 60 days are valued using the evaluated bid price supplied by the pricing service. The evaluated bid price supplied by the pricing service is based upon a matrix valuation system which considers such factors as security prices, yields, maturities and ratings. Short-term debt securities with remaining maturities of 60 days or less are generally valued at amortized cost or original cost plus accrued interest, which approximates fair value. Currency rates as of the close of the NYSE are used to convert foreign security values into U.S. dollars.
Securities of investment companies that trade on an exchange are valued at the last sales price or official closing price as of the close of the customary trading session on the exchange where the security is principally traded. Investments in shares of funds, including money market funds, that are not traded on an exchange are valued at the end of day net asset value (“NAV”) per share of such fund. Securities in the underlying funds, including restricted securities, are valued in accordance with the valuation policy of such fund.
The Funds’ securities traded in countries outside of the Western Hemisphere are fair valued daily by utilizing the quotations of an independent pricing service, unless the Funds’ Valuation Committee determines that use of another valuation methodology is appropriate. The purposes of daily fair valuation is to avoid stale prices and to take into account, among other things, any significant events occurring after the close of foreign markets. The pricing service uses statistical analyses and quantitative models to adjust local market prices using factors such as subsequent movements and changes in the prices of indexes, securities and exchange rates in other markets to determine fair value as of the time a Fund calculates its NAV. The valuation assigned to fair-value securities for purposes of calculating a Fund’s NAV may differ from the security’s most recent closing market price and from the prices used by other mutual funds to calculate their NAVs.
Various inputs are used to determine the value of the Funds’ investments. These inputs are summarized in the three broad levels listed below:
| Level 1 — | quoted prices in active markets for identical securities. |
| Level 2 — | significant observable inputs other than Level 1 quoted prices (including, but not limited to, quoted prices for similar securities, interest rates, prepayment speeds, and credit risk). |
| Level 3 — | significant unobservable inputs. |
Observable inputs are those based on market data obtained from sources independent of the Funds, and unobservable inputs reflect the Funds’ own assumptions based on the best information available. The input levels are not necessarily an indication of the risk or liquidity associated with investments at that level. For example, non-U.S. equity securities actively traded in foreign markets may be reflected in Level 2 despite the availability of closing prices, because the Funds evaluate and determine whether those closing prices reflect fair value at the close of the NYSE or require adjustment, as described above. The following table summarizes the Funds’ investments, based on the inputs used to determine their values on September 30, 2019:
ICON Emerging Markets Fund
| Investments in Securities at Value* | | Level 1 - Quoted
and Unadjusted
Prices | | | Level 2 - Other
Significant
Observable Inputs | | | Level 3 - Significant
Unobservable
Inputs | | | Total | |
| Common Stocks | | | | | | | | | | | | | | | | |
| Diversified Banks | | $ | 2,785,707 | | | $ | 7,523,894 | | | $ | — | | | $ | 10,309,601 | |
| Interactive Media & Services | | | 1,918,695 | | | | 1,319,462 | | | | — | | | | 3,238,157 | |
| Internet & Direct Marketing Retail | | | 1,923,145 | | | | 414,710 | | | | — | | | | 2,337,855 | |
| Real Estate Development | | | 434,000 | | | | 592,305 | | | | — | | | | 1,026,305 | |
| Other | | | 8,446,975 | | | | 13,599,896 | | | | — | | | | 22,046,871 | |
| Preferred Stocks | | | 1,071,103 | | | | — | | | | — | | | | 1,071,103 | |
| Exchange Traded Funds | | | 4,140,850 | | | | — | | | | — | | | | 4,140,850 | |
| Collateral for Securities on Loan | | | — | | | | 2,134,300 | | | | — | | | | 2,134,300 | |
| Total | | $ | 20,720,475 | | | $ | 25,584,567 | | | $ | — | | | $ | 46,305,042 | |
| ICON International Funds | Notes to Financial Statements |
September 30, 2019
ICON International Equity Fund
| Investments in Securities at Value* | | Level 1 - Quoted
and Unadjusted
Prices | | | Level 2 - Other
Significant
Observable Inputs | | | Level 3 - Significant
Unobservable
Inputs | | | Total | |
| Common Stocks | | | | | | | | | | | | | | | | |
| Diversified Banks | | $ | 1,087,594 | | | $ | 3,139,302 | | | $ | — | | | $ | 4,226,896 | |
| Integrated Oil & Gas | | | 713,523 | | | | 2,134,731 | | | | — | | | | 2,848,254 | |
| Interactive Media & Services | | | 267,184 | | | | 292,795 | | | | — | | | | 559,979 | |
| Pharmaceuticals | | | 597,678 | | | | 1,191,651 | | | | — | | | | 1,789,329 | |
| Other | | | 4,990,423 | | | | 15,064,392 | | | | — | | | | 20,054,815 | |
| Exchange Traded Funds | | | 941,273 | | | | — | | | | — | | | | 941,273 | |
| Collateral for Securities on Loan | | | — | | | | 635,068 | | | | — | | | | 635,068 | |
| Total | | $ | 8,597,675 | | | $ | 22,457,939 | | | $ | — | | | $ | 31,055,614 | |
| * | Please refer to the Schedule of Investments and the Sector/Industry Classification and Country Composition tables for additional security details. |
There were no Level 3 securities held in any of the Funds at September 30, 2019.
Fund Share Valuation
Fund shares are sold and redeemed on a daily basis at NAV. NAV per share is determined daily as of the close of trading on the NYSE on each day the NYSE is open for trading. The NAV is computed by dividing the total value of the Fund’s investments and other assets, less liabilities, by the number of Fund shares outstanding.
Cash and Cash Equivalents
Idle cash may be swept into an overnight demand deposit account and is classified as cash and cash equivalents on the Statements of Assets and Liabilities. The Funds maintain cash in bank deposit accounts which, at times, may exceed United States federally insured limits. Amounts swept overnight are available on the next business day.
Foreign Currency Translation
The accounting records of the Funds are maintained in U.S. dollars. Investment securities and other assets and liabilities denominated in a foreign currency are translated daily into U.S. dollars at the prevailing rates of exchange. Income and expenses are translated into U.S. dollars at the prevailing exchange rate on the respective dates of the transactions. Purchases and sales of securities are translated into U.S. dollars at the contractual currency exchange rates established at the time of each trade.
The Funds do not isolate that portion of the results of operations resulting from changes in foreign exchange rates on investments from the fluctuations arising from changes in market prices of securities held. Net unrealized appreciation or depreciation on investments and foreign currency translations arise from changes in the value of assets and liabilities resulting from changes in the exchange rates and changes in market prices of securities held.
Forward Foreign Currency Contracts
The Funds may enter into short-term forward foreign currency contracts. A forward foreign currency contract is an agreement between contracting parties to exchange an amount of currency at some future time at an agreed upon rate. The Funds may use forward foreign currency contracts to manage foreign currency exposure with respect to transactional hedging, positional hedging, cross hedging and proxy hedging.
These contracts involve market risk and do not eliminate fluctuations in the prices of portfolio securities or prevent losses if the prices of those securities decline. The Funds could be exposed to risk if the value of the currency changes unfavorably. Additionally, the Funds could be exposed to counterparty risk if the counterparties are unable to meet the terms of the contracts.
These contracts are marked-to-market daily. Net realized gains and losses on foreign currency transactions represent disposition of foreign currencies, and the difference between the amount recorded at the time of the transaction and the U.S. dollar amount actually received. Any realized gain or loss incurred by the Funds due to foreign currency translation is included on the Statements of Operations. At September 30, 2019 and for the year then ended, the Emerging Markets Fund and International Equity Fund had no outstanding forward foreign currency contracts.
| Annual Report | September 30, 2019 | 23 |
| ICON International Funds | Notes to Financial Statements |
September 30, 2019
Securities Lending
Under procedures adopted by the Board, the Funds may lend securities to certain approved brokers, dealers and other financial institutions to earn additional income. Collateral is received in exchange for securities on loan in the amount of at least 102% of the value of U.S. securities loaned or at least 105% of the value of non-U.S. securities loaned, marked to market daily. The Funds retain certain benefits of owning the securities, including receipt of dividends or interest generated by the security, but give up other rights including the right to vote proxies. The Funds retain the ability to recall the loans at any time and could do so in order to vote proxies or to sell the loaned securities. Each loan is collateralized by assets that generally exceed the value of the securities on loan. Collateral may consist of cash or securities issued or guaranteed by the United States government or its agencies or instrumentalities. The fair value of the loaned securities is determined daily at the close of business of the Funds and any additional required collateral is delivered to each Fund on the next business day.
The following is a summary of the Funds’ securities lending positions and related cash and non-cash collateral received as of September 30, 2019:
| | | Market Value of
Securities on Loan | | | Market Value of
Cash Collateral
Received | | | Market Value of
Non-Cash Collateral
Received | | | Total Collateral
Received | | | Excess Collateral | |
| ICON Emerging Markets Fund | | $ | 2,924,273 | | | $ | 2,134,300 | | | $ | 851,891 | | | $ | 2,986,191 | | | $ | 61,918 | |
| ICON International Equity Fund | | | 2,334,280 | | | | 635,068 | | | | 1,836,059 | | | | 2,471,127 | | | | 136,847 | |
Generally, in the event of borrower default, the Funds have the right to use the collateral to offset any losses incurred. In the event the Funds are delayed or prevented from exercising their rights to dispose of the collateral, there may be a potential loss to the Funds. Some of these losses may be indemnified by the lending agent.
The Funds have elected to invest cash collateral received from lending in the State Street Navigator Securities Lending Government Money Market Portfolio which is disclosed on the Schedules of Investments. The Funds bear the risk of loss with respect to the investment of cash collateral. The State Street Navigator Securities Lending Government Money Market Portfolio is a Government Money Market Portfolio designed to provide continuous daily liquidity. Non-Cash collateral received consists of securities issued or guaranteed by the United States government or its agencies or instrumentalities with remaining maturities ranging from overnight to 30 years. Non-cash collateral is not disclosed on the Funds’ Schedules of Investments or their Statements of Assets and Liabilities as the Funds do not have the ability to re-hypothecate these securities. The net securities lending income earned by the Funds for the year ended September 30, 2019, is included in the Statements of Operations.
The value of the collateral could include collateral held for securities that were sold on or before September 30, 2019. It may also include collateral received from the pre-funding of security loans.
Security loans consist of equity securities and generally do not have a stated maturity date. The Funds may recall a loaned security at any time.
Income Taxes, Dividends, and Distributions
The Funds intend to continue to qualify as regulated investment companies under Subchapter M of the Internal Revenue Code and, accordingly, the Funds will generally not be subject to federal and state income taxes or federal excise taxes to the extent that they intend to make sufficient distributions of net investment income and net realized capital gains. As of and during the year ended September 30, 2019, the Funds did not have a liability for any unrecognized tax benefits in the accompanying financial statements. The Funds recognize the interest and penalties, if any, related to the unrecognized tax benefits as income tax expense in the Statements of Operations. During the period, the Funds did not incur any interest or penalties.
Dividends paid by the Funds from net investment income and distributions of net realized short-term gains are, for federal income tax purposes, taxable as ordinary income to shareholders.
Dividends and distributions to shareholders are recorded by the Funds on the ex-dividend/distribution date. The Funds distribute income and net realized capital gains, if any, to shareholders at least annually, if not offset by capital loss carryforward. Income distributions and capital gain distributions are determined in accordance with income tax regulations, which may differ from GAAP.
Management has analyzed the Funds’ tax positions taken on federal income tax returns for all open tax years and has concluded that no provision for federal income tax is required in the Funds’ financial statements.
| ICON International Funds | Notes to Financial Statements |
September 30, 2019
The Funds file U.S. tax returns. While the statute of limitations remains open to examine the Funds’ U.S. tax returns filed for the past three years, no examinations are in progress or anticipated at this time. The Funds are not aware of any tax positions for which it is reasonably possible that the total amounts of unrecognized tax benefits will significantly change in the next twelve months.
Certain foreign countries impose a capital gains tax which is accrued by the Funds based on the unrealized appreciation, if any, on affected securities. Any accrual would reduce a Fund’s NAV. The tax is paid when the gain is realized and is included in capital gains tax in the Statements of Operations.
Investment Income
Dividend income is recorded on the ex-dividend date. Non-cash dividends included in dividend income, if any, are recorded at the fair value of the securities received. Interest income is accrued as earned. Certain dividends from foreign securities are recorded as soon as the Funds are informed of the dividend if such information is obtained subsequent to the ex-dividend date. Discounts and premiums on fixed income securities purchased are accreted or amortized to income over the life of the respective securities based on effective yield.
Investment Transactions
Security transactions are accounted for no later than one business day after the trade date. However, for financial reporting purposes, security transactions are accounted for on the trade date. Gains and losses on securities sold are determined on the basis of identified cost.
Withholding Tax
Withholding taxes on foreign dividends have been provided for in accordance with the Funds’ understanding of the applicable country’s tax rules and rates.
Other
The Funds hold certain investments which pay dividends to their shareholders based upon available funds from operations. It is possible for these dividends to exceed the underlying investments’ taxable earnings and profits resulting in the excess portion of such dividends being designated as a return of capital. Distributions received from investments in securities that represent a return of capital or capital gains are recorded as a reduction of the cost of investments or as a realized gain, respectively.
The ability of issuers of debt securities held by the Funds to meet their obligations may be affected by economic and political developments in a specific country or region.
Allocation of Expenses
Each class of a Fund’s shares bears expenses incurred specifically on its behalf and, in addition, each class bears a portion of general expenses, based upon relative net assets of each class or number of shareholder accounts. Expenses which cannot be directly attributed to a specific Fund in the Trust are apportioned between all Funds in the Trust based upon relative net assets or number of shareholder accounts. In calculating the net asset value per share of each class, investment income, realized and unrealized gains and losses and expenses other than class-specific expenses are allocated daily to each class of shares based upon the proportion of net assets.
Below are additional class level expenses for the year ended September 30, 2019 that are included on the Statements of Operations:
| Fund | | Printing
Fees* | | | Transfer Agent
Fees* | | | Registration
Fees | |
| ICON Emerging Markets Fund | | | | | | | | | | | | |
| Class S | | $ | 9,841 | | | $ | 123,298 | | | $ | 23,423 | |
| Class A | | | 395 | | | | 9,166 | | | | 12,185 | |
| ICON International Equity Fund | | | | | | | | | | | | |
| Class S | | | 2,362 | | | | 30,918 | | | | 17,934 | |
| Class C | | | 630 | | | | 8,725 | | | | 11,203 | |
| Class A | | | 399 | | | | 9,365 | | | | 11,123 | |
| * | Printing fees and Transfer agent out of pocket fees are a Fund level expense. |
| Annual Report | September 30, 2019 | 25 |
| ICON International Funds | Notes to Financial Statements |
September 30, 2019
3. FEES, OTHER SERVICES AND OTHER TRANSACTIONS WITH AFFILIATES
Investment Advisory Fees
ICON Advisers, Inc. (“ICON Advisers”) serves as investment adviser to the Funds and is responsible for managing the Funds’ portfolios of investments. ICON Advisers receives a monthly management fee that is computed daily at an annual rate of 1.00% of each Fund’s average daily net assets.
ICON Advisers has contractually agreed to limit the Funds’ operating expenses (exclusive of brokerage, interest, taxes, dividends on short sales, acquired fund fees and expenses and extraordinary expenses) to the extent necessary to ensure that the Funds’ expenses do not exceed the following amounts:
| Fund | Class S | Class C | Class A |
| ICON Emerging Markets Fund | 1.55% | — | 1.80% |
| ICON International Equity Fund | 1.55% | 2.55% | 1.80% |
The Funds’ expense limitations will continue in effect until at least January 31, 2021 for the Emerging Markets Fund Class A and all classes of the International Equity Fund. The expense limitation for the Emerging Markets Fund Class S will continue in effect until at least January 31, 2020. To the extent ICON Advisers reimburses or absorbs fees and expenses, it may seek payment of such amounts for up to three years after the expenses were reimbursed or absorbed. A Fund will make no such payment, however, if the total Fund operating expenses exceed the expense limits in effect at the time these payments are proposed.
As of September 30, 2019, the following amounts were available for recoupment by ICON Advisers based upon their potential expiration dates:
| Fund | | Expires
2020 | | | Expires
2021 | | | Expires
2022 | |
| ICON Emerging Markets Fund | | $ | 106,329 | (a) | | $ | 46,120 | | | $ | 122,802 | |
| ICON International Equity Fund | | | 41,389 | | | | 34,771 | | | | 68,987 | |
| (a) | Emerging Markets Fund Class C shares merged into Class A shares on January 10, 2017. The Class C amount is not available for recoupment. |
Accounting, Custody and Transfer Agent Fees
ALPS Fund Services, Inc. (“ALPS”) serves as the fund accounting agent for the Trust. For its services, the Trust pays ALPS a fee that is calculated daily and paid monthly, which is greater of an annual rate based on the aggregate average daily net assets of the Trust or a contractual minimum annual fee.
State Street is the custodian of the Trust’s investments. For its services, the Trust pays State Street asset-based fees that vary according to the number of positions and transactions, plus out-of-pocket expenses.
ALPS is the Trust’s transfer agent. For these services, the Trust pays an annual fee plus annual base fee per Fund, per account fees and out-of-pocket expenses.
Administrative Services
The Trust has entered into an administrative services agreement with ICON Advisers pursuant to which ICON Advisers oversees the administration of the Trust’s business and affairs. This agreement provides for an annual fee of 0.05% on the Trust’s first $1.5 billion of average daily net assets, 0.045% on the next $1.5 billion of average daily net assets, 0.040% on the next $2 billion of average daily net assets and 0.030% on average daily net assets over $5 billion. For the year ended September 30, 2019, each Fund’s payment for administrative services to ICON Advisers is included on the Statements of Operations. The administrative services agreement provides that ICON Advisers will not be liable for any error of judgment, mistake of law, or any loss suffered by the Trust in connection with matters to which the administrative services agreement relates, except for a loss resulting from willful misfeasance, bad faith or negligence by ICON Advisers in the performance of its duties.
ICON Advisers has a sub-administration agreement, with ALPS, under which ALPS assists ICON Advisers with the administration and business affairs of the Trust. For its services, ICON Advisers pays ALPS a fee, that is calculated daily and paid monthly, which is the greater of an annual rate based on the aggregate average daily net assets of the Trust or a contractual minimum annual fee.
| ICON International Funds | Notes to Financial Statements |
September 30, 2019
Distribution Fees
ICON Distributors, Inc. (“IDI” or “Distributor”), a wholly-owned subsidiary of ICON Management and Research and affiliate of ICON Advisers, Inc., serves the Trust as Distributor. The Trust has adopted a Distribution Plan pursuant to Rule 12b-1 under the 1940 Act ("12b-1 Plan”) under which the Funds are authorized to compensate or reimburse the Distributor for the sale and distribution of shares and for other shareholder services. The shareholders of the ICON International Equity Fund Class C pay an annual distribution fee of 1.00% of average daily net assets. The shareholders of the Funds Class A shares pay an annual distribution fee of 0.25% of average daily net assets. There is no annual distribution fee for Class S shares. The total amount paid by each Fund under the 12b-1 Plan is shown on the Statements of Operations.
Class A Shares are subject to an initial sales charge and the public offering price of Class A shares equals net asset value plus the applicable sales charge, which is a maximum of 5.75%. For the year ended September 30, 2019, IDI collected sales charges on purchases of Class A Shares, the majority of which were paid out as concessions to financial intermediaries, as follows:
| Fund | | Sales Charges Collected |
| ICON Emerging Markets Fund Class A | | $ | 2,684 | |
| ICON International Equity Fund Class A | | | 76 | |
In addition, IDI receives a contingent deferred sales charge of 1.00% of the purchase price on redemptions of Class C shares made within one year following the date of purchase. A 1.00% contingent deferred sales charge may also apply to certain redemptions of Class A shares made within one year following the purchase of $1 million or more without an initial sales charge. For the year ended September 30, 2019, IDI collected the following contingent deferred sales charges:
| Fund | | Contingent Deferred Sales
Charges Collected |
| ICON International Equity Fund Class C | | $ | 92 | |
Other Related Parties
Certain Officers and Directors of ICON Advisers are also Officers and Trustees of the Funds; however, such Officers and Trustees (with the exception of the Chief Compliance Officer, “CCO”) receive no compensation from the Funds. The Trust pays a portion of the CCO’s salary and the remaining portion, along with other employee related expenses, is paid by ICON Advisers. For the year ended September 30, 2019, the total related amounts paid by the Funds under this arrangement are included in Other Expenses on the Statements of Operations.
The Funds may reimburse ICON Advisers for legal work performed for the Funds by its attorneys outside of the advisory and administration contracts. The Board reviews and approves such reimbursements. For the year ended September 30, 2019, the total related amounts accrued and paid by the Funds under this arrangement was $0.
The Funds did not engage in cross trades with each other, during the year ended September 30, 2019, pursuant to Rule 17a-7 under the 1940 Act. Generally, cross trading is the buying or selling of portfolio securities between funds to which the Adviser serves as the investment adviser. The Board previously adopted procedures that apply to transactions between the Funds and its affiliates pursuant to Rule 17a-7. At its regularly scheduled meetings, the Board reviews such transactions as of the most current calendar quarter for compliance with the requirements set forth by Rule 17a-7 and the Funds’ procedures. The procedures require that the transactions be a purchase or sale for no consideration other than cash payment against prompt delivery of a security for which market quotations are readily available, and be consistent with the investment policies of each Fund.
4. BORROWINGS
The Trust has entered into an uncommitted, unsecured, revolving Line of Credit agreement/arrangement with State Street to provide temporary funding for redemption requests. The maximum borrowing limit is $30 million. Interest on domestic borrowings is charged at a rate quoted and determined by State Street. The interest rate as of September 30, 2019 was 3.27%. The Line of Credit agreement/arrangement expires on March 16, 2020.
As of September 30, 2019, the Emerging Markets Fund had an outstanding borrowing in the amount of $821,513.
| Annual Report | September 30, 2019 | 27 |
| ICON International Funds | Notes to Financial Statements |
September 30, 2019
For the year ended September 30, 2019, the average outstanding loan by Fund was as follows:
| Fund | | Maximum Borrowing
(10/01/18 – 09/30/19) | | Average Borrowing
(10/01/18 – 09/30/19)^ | | Average Interest Rates
(10/01/18 – 09/30/19)^ |
| ICON Emerging Markets Fund | | $ | 2,594,890 | | | $ | 817,775 | | | | 3.58% | |
| ICON International Equity Fund* | | | 1,643,608 | | | | 278,589 | | | | 3.51% | |
| * | There were no outstanding borrowings under this agreement/arrangement as of September 30, 2019. |
| ^ | The average is calculated based on the actual number of days with outstanding borrowings. |
5. PURCHASES AND SALES OF INVESTMENT SECURITIES
For the year ended September 30, 2019, the aggregate cost of purchases and proceeds from sales of securities (excluding short-term securities) was as follows:
| Fund | | Purchases of
Securities | | Proceeds from Sales
of Securities |
| ICON Emerging Markets Fund | | $ | 38,526,233 | | | $ | 43,954,612 | |
| ICON International Equity Fund | | | 13,516,258 | | | | 18,840,532 | |
6. FEDERAL INCOME TAX
The following information is presented on an income tax basis. Differences between GAAP and federal income tax purposes that are permanent in nature are reclassified within the capital accounts. Temporary differences do not require reclassification. Temporary and permanent differences do not impact the NAVs of the Funds.
Under current law, capital losses maintain their character as short-term or long-term and are carried forward to the next tax year without expiration.
For International Equity Fund, the short-term and long-term capital losses with no expiration were $3,305,017 and $7,651,699, respectively.
The Emerging Markets Fund elects to defer to the period ending September 30, 2020, capital losses recognized during the period November 1, 2018 to September 30, 2019 in the amount of $2,545,406.
The tax characteristics of distributions paid to shareholders during the fiscal year ended September 30, 2019, were as follows:
| Fund | | Ordinary Income | | Long-Term Capital
Gains |
| ICON Emerging Markets Fund | | $ | 1,506,869 | | | $ | 75,722 | |
| ICON International Equity Fund | | | 524,687 | | | | — | |
The tax characteristics of distributions paid to shareholders during the fiscal year ended September 30, 2018, were as follows:
| Fund | | Ordinary Income |
| ICON Emerging Markets Fund | | $ | 100,530 | |
As of September 30, 2019, the components of accumulated earnings/(deficit) on a tax basis were as follows:
| Fund | | Undistributed
Ordinary Income | | Accumulated Capital
Gains/(Losses) | | Other Cumulative
Effect of Timing
Differences | | Unrealized
Appreciation/(Depreciation) | | Total Accumulated
Earnings/(Deficit) |
| ICON Emerging Markets Fund | | $ | 852,007 | | | $ | (2,545,406 | ) | | $ | — | | | $ | (137,978 | ) | | $ | (1,831,377 | ) |
| ICON International Equity Fund | | | 517,656 | | | | (10,956,716 | ) | | | — | | | | (3,634,640 | ) | | | (14,073,700 | ) |
| ICON International Funds | Notes to Financial Statements |
September 30, 2019
As of September 30, 2019, cost on investments for federal income tax purposes and the amount of net unrealized appreciation/(depreciation) were as follows:
| Fund | | Gross Appreciation
(excess of value over
tax cost) | | Gross Depreciation
(excess of tax cost
over value) | | Net Appreciation/
(Depreciation) of
Foreign Currency | | Net Unrealized
Appreciation/
(Depreciation)* | | Cost of Investments
for Income Tax
Purposes |
| ICON Emerging Markets Fund | | $ | 3,806,059 | | | $ | (3,909,895 | ) | | $ | (995 | ) | | $ | (104,831 | ) | | $ | 46,408,878 | |
| ICON International Equity Fund | | | 1,433,603 | | | | (5,067,364 | ) | | | (879 | ) | | | (3,634,640 | ) | | | 34,689,375 | |
| * | This balance includes appreciation/(depreciation) of foreign currency. |
7. RECENT ACCOUNTING PRONOUNCEMENT
In August 2018, the Financial Accounting Standards Board (“FASB”) issued Accounting Standards Update (“ASU”) 2018-13, which changes the fair value measurement disclosure requirements of FASB Accounting Standards Codification Topic 820, Fair Value Measurement. The update to Topic 820 includes new, eliminated, and modified disclosure requirements. ASU 2018-13 is effective for fiscal years beginning after December 15, 2019, including interim periods. Early adoption is permitted for any eliminated or modified disclosures. Management has eliminated and modified disclosures and is currently evaluating the impact of the remaining ASU.
| Annual Report | September 30, 2019 | 29 |
| | Report of Independent Registered |
| ICON International Funds | Public Accounting Firm |
To the Shareholders and Board of Trustees of
ICON Funds
Opinion on the Financial Statements
We have audited the accompanying statements of assets and liabilities, including the schedules of investments, of ICON Emerging Markets Fund and ICON International Equity Fund (the “Funds”), each a series of ICON Funds, as of September 30, 2019, and the related statements of operations for the year then ended, the statements of changes in net assets for each of the two years in the period then ended, including the related notes, and the financial highlights for each of the four years in the period then ended (collectively referred to as the “financial statements”). In our opinion, the financial statements present fairly, in all material respects, the financial position of each of the Funds as of September 30, 2019, the results of their operations for the year then ended, the changes in their net assets for each of the two years in the period then ended, and the financial highlights for each of the four years in the period then ended, in conformity with accounting principles generally accepted in the United States of America.
The Funds’ financial highlights for the year ended September 30, 2015, were audited by other auditors whose report dated November 18, 2015, expressed an unqualified opinion on those financial highlights.
Basis for Opinion
These financial statements are the responsibility of the Funds’ management. Our responsibility is to express an opinion on the Funds’ financial statements based on our audits. We are a public accounting firm registered with the Public Company Accounting Oversight Board (United States) (“PCAOB”) and are required to be independent with respect to the Funds in accordance with the U.S. federal securities laws and the applicable rules and regulations of the Securities and Exchange Commission and the PCAOB.
We conducted our audits in accordance with the standards of the PCAOB. Those standards require that we plan and perform the audit to obtain reasonable assurance about whether the financial statements are free of material misstatement, whether due to error or fraud.
Our audits included performing procedures to assess the risks of material misstatement of the financial statements, whether due to error or fraud, and performing procedures that respond to those risks. Such procedures included examining, on a test basis, evidence regarding the amounts and disclosures in the financial statements. Our procedures included confirmation of securities owned as of September 30, 2019, by correspondence with the custodian. Our audits also included evaluating the accounting principles used and significant estimates made by management, as well as evaluating the overall presentation of the financial statements. We believe that our audits provide a reasonable basis for our opinion.
We have served as the Funds’ auditor since 2016.

COHEN & COMPANY, LTD.
Cleveland, Ohio
November 25, 2019
| ICON International Funds | Disclosure of Fund Expenses |
September 30, 2019 (Unaudited)
Example
As a shareholder of a Fund you may pay two types of fees: transaction fees and fund-related fees. Certain funds charge transaction fees, including sales charges (loads) on purchase payments, reinvested dividends, or other distributions; redemption fees; and exchange fees. Funds also incur various ongoing expenses, including management fees, distribution and/or service fees, and other fund expenses, which are indirectly paid by shareholders.
This Example is intended to help you understand your ongoing costs (in dollars) of investing in the various ICON Funds and to compare these costs with the ongoing costs of investing in other mutual funds. This Example is based on an investment of $1,000 invested at the beginning of the six-month period and held for the six-month period (04/01/19 – 09/30/19).
Actual Expenses
The first line in the table for each Fund provides information about actual account values and actual expenses. The Example includes, but is not limited to, management fees, 12b-1 fees, fund accounting, custody and transfer agent fees. However, the Example does not include client specific fees, such as the $15 fee charged to IRA accounts, or the $15 fee charged for wire redemptions. You may use this information, together with the amount you invested, to estimate the expenses that you paid over the period. Simply divide your account value by $1,000 (for example, an $8,600 account value divided by $1,000 = 8.6), then multiply the result by the number in the first line for each Fund under the heading entitled “Expenses Paid During Period” to estimate the expenses you paid on your account during this period.
Hypothetical Example for Comparison Purposes
The second line in the table for each Fund provides information about hypothetical account values and hypothetical expenses based on the Fund’s actual expense ratio and an assumed rate of return of 5% per year before expenses, which is not the Fund’s actual return. The hypothetical account values and expenses may not be used to estimate the actual ending account balance or expenses you paid for the period. You may use this information to compare the ongoing costs of investing in the Fund and other funds. To do so, compare this 5% hypothetical example with the 5% hypothetical examples that appear in the shareholder reports of the other funds. Please note that the expenses shown in the table are meant to highlight your ongoing costs only and do not reflect any transactional costs, such as sales charges (loads), redemption fees, or exchange fees that may be charged by other funds. Therefore, this information is useful in comparing ongoing costs only, and will not help you determine the relative total costs of owning different funds.
| | | Beginning Account
Value
April 1, 2019 | | Ending Account
Value
September 30, 2019 | | Expense Ratio(a) | | Expenses Paid
During period
April 1, 2019 -
September 30, 2019(b) |
| ICON Emerging Markets Fund | | | | | | | | | | | | | | | | |
| Class S | | | | | | | | | | | | | | | | |
| Actual | | $ | 1,000.00 | | | $ | 955.50 | | | | 1.57 | % | | $ | 7.70 | |
| Hypothetical (5% return before expenses) | | $ | 1,000.00 | | | $ | 1,017.20 | | | | 1.57 | % | | $ | 7.94 | |
| Class A | | | | | | | | | | | | | | | | |
| Actual | | $ | 1,000.00 | | | $ | 954.00 | | | | 1.82 | % | | $ | 8.92 | |
| Hypothetical (5% return before expenses) | | $ | 1,000.00 | | | $ | 1,015.94 | | | | 1.82 | % | | $ | 9.20 | |
| | | | | | | | | | | | | | | | | |
| ICON International Equity Fund | | | | | | | | | | | | | | | | |
| Class S | | | | | | | | | | | | | | | | |
| Actual | | $ | 1,000.00 | | | $ | 943.90 | | | | 1.55 | % | | $ | 7.55 | |
| Hypothetical (5% return before expenses) | | $ | 1,000.00 | | | $ | 1,017.30 | | | | 1.55 | % | | $ | 7.84 | |
| Class C | | | | | | | | | | | | | | | | |
| Actual | | $ | 1,000.00 | | | $ | 938.50 | | | | 2.55 | % | | $ | 12.39 | |
| Hypothetical (5% return before expenses) | | $ | 1,000.00 | | | $ | 1,012.28 | | | | 2.55 | % | | $ | 12.86 | |
| Class A | | | | | | | | | | | | | | | | |
| Actual | | $ | 1,000.00 | | | $ | 942.70 | | | | 1.80 | % | | $ | 8.77 | |
| Hypothetical (5% return before expenses) | | $ | 1,000.00 | | | $ | 1,016.04 | | | | 1.80 | % | | $ | 9.10 | |
| (a) | The Fund’s expense ratios have been annualized based on the Fund’s most recent fiscal half-year expenses. |
| (b) | Expenses are equal to the Fund’s annualized expense ratio multiplied by the average account value over the period, multiplied by the number of days in the most recent fiscal half-year 183/365 (to reflect the half-year period). |
Total returns exclude applicable sales charges. If sales charges were included (maximum 5.75%), returns would be lower.
| Annual Report | September 30, 2019 | 31 |
| ICON International Funds | Board of Trustees and Fund Officers |
September 30, 2019 (Unaudited)
The ICON Funds Board of Trustees (the “Board”) consists of four Trustees who oversee the 17 ICON Funds (the “Funds”). The Board is responsible for general oversight of the Funds’ business and for assuring that the Funds are managed in the best interest of the Funds’ shareholders. The Trustees, and their ages, and principal occupations are set forth below. The address of the Trustees is 5299 DTC Blvd., Suite 1200, Greenwood Village, CO 80111. Trustees have no official term of office and generally serve until they resign or are not re-elected.
Interested Trustee
Craig T. Callahan,68. Chairman of the Board. Dr. Callahan has been a Trustee of the Funds since their inception. Dr. Callahan also serves as President (2014 to present and 1998 to 2013) and Chairman of the Investment Committee (2005 to present) and served as the Chief Investment Officer (1991 to 2004) of ICON Advisers, Inc. Dr. Callahan is also Executive Vice President (2005 to present); Director (1991 to present); and was previously President (1998 to 2005) and Chief Compliance Officer (2005) of ICON Distributors, Inc. Dr. Callahan also serves as the President (1998 to present) and Chairman of the Board of Directors (1994 to present) of IM&R, the parent company of ICON Advisers, Inc. and ICON Distributors, Inc.
Independent Trustees
Glen F. Bergert,69. Mr. Bergert has been a Trustee of the Funds since 1999. Mr. Bergert is President of Venture Capital Management LLC (1997 to present), General Partner of SOGNO Partners LP, a venture capital company (2001 to 2015), General Partner of Bergert Properties, LLP, a real estate holding company (1997 to present), General Partner of Pyramid Real Estate Partnership, a real estate development company (1998 to present), General Partner of Chamois Partners, LP, a venture capital company (2004 to present), and was previously a General Partner with KPMG Peat Marwick, LLP (1979 to 1997). Mr. Bergert is also a Director of Delta Dental of California (2013 to present and 2006 to 2012), Delta Dental of Pennsylvania (2010 to present and 1998 to 2009), Delta Reinsurance Corporation (2015 to present; 2011 to 2014 and 2000 to 2009) and Dentegra Group, Inc. (2017 to present; 2010 to 2014).
John C. Pomeroy, Jr.,72. Mr. Pomeroy has been a Trustee of the Funds since 2002. Mr. Pomeroy was Chief Investment Officer and Director of Investments, Pennsylvania State University (2001 to 2018) and was Portfolio Manager and Product Manager, Trinity Investment Management Corporation (1989 to 2001).
R. Michael Sentel, 71. Mr. Sentel has been a Trustee of the Funds since their inception. Mr. Sentel was a Senior Attorney with the U.S. Department of Education (1996 to 2018) and was engaged in private practice of securities and corporate law (1981 to 2017). Mr. Sentel began his legal career with the U.S. Securities and Exchange Commission’s Division of Enforcement and served as a Branch Chief (1980 to 1981). Later he served as the Section Chief for the Professional Liability Section of the Federal Deposit Insurance Corp. with responsibility for the Rocky Mountain Region (1991 to 1994).
Mark Manassee,54. Mr. Manassee has been a Trustee of the Funds since 2017. Mr. Manassee is a Senior Advisor to McKinsey’s Wealth and AssetManagement Practice. Mr. Manassee was Principal and President of Market Metrics, LLC, a subsidiary of FactSet Research Systems, Inc. (1998 to 2016). Mr. Manassee was also Chairman of the Board of FundRock Partners, Ltd (UK) (2017 to 2019) and a Director of Matrix-Data, Ltd (UK) (2013 to 2016) and Rhetorik, Ltd (UK) (2013 to 2016).
The Officers of the Funds are:
Craig T. Callahan,68. Chairman of the Board. Dr. Callahan has been a Trustee of the Funds since their inception. Dr. Callahan also serves as President (2014 to present and 1998 to 2013) and Chairman of the Investment Committee (2005 to present) and served as the Chief Investment Officer (1991 to 2004) of ICON Advisers, Inc. Dr. Callahan is also Executive Vice President (2005 to present); Director (1991 to present); and was previously President (1998 to 2005) and Chief Compliance Officer (2005) of ICON Distributors, Inc. Dr. Callahan also serves as the President (1998 to present) and Chairman of the Board of Directors (1994 to present) of IM&R, the parent company of ICON Advisers, Inc. and ICON Distributors, Inc.
Brian D. Harding, 40. Mr. Harding serves as Principal Financial Officer and Treasurer of the Funds (2017 to present). Mr. Harding is also Chief Financial Officer of ICON Advisers, Inc. (2013 to present) and Director of IM&R (2013 to present). Previously he was Chief Compliance Officer and Anti-Money Laundering Officer of the Funds (2008 to 2013), Chief Compliance Officer of ICON Advisers, Inc. (2011 to 2013), and Manager at PricewaterhouseCoopers LLP (2001 to 2008).
Jack M. Quillin,47. Mr. Quillin serves as Chief Compliance Officer and Anti-Money Laundering Officer of the Funds (2019 to present). Mr. Quillin is also Chief Compliance Officer of ICON Advisers, Inc. (2019 to present). Previously he served as Assistant Treasurer of the Funds (2017 to 2019) and a Compliance and Fund Accounting Associate of ICON Advisers, Inc. (2016 to 2019). Previously, he was a compliance analyst at Marsico Capital Management, LLC (2011 to 2015), an assistant vice president in the municipal derivatives finance department at Merrill Lynch (2004 to 2008), and a senior accountant in the Regulatory Reporting group at Wells Fargo & Company (1998 to 2003).
| ICON International Funds | Board of Trustees and Fund Officers |
September 30, 2019 (Unaudited)
Christopher R. Ambruso,39. Mr. Ambruso serves as Secretary of the Funds (2019 to present). Mr. Ambruso is also General Counsel of ICON Advisers, Inc. (2019 to present), Chief Compliance Officer of ICON Distributors, Inc. (2019 to present), and Director of IM&R (2019 to present). Previously he served as Chief Compliance Officer and Anti-Money Laundering Officer (2017 to 2019) and Assistant Secretary (2016 to 2017 and2008 to 2012) of the Funds and Chief Compliance Officer (2017 to 2019), Associate Counsel (2013 to 2017), Associate Attorney (2008 to 2013), and Staff Attorney (2007 to 2008) of ICON Advisers, Inc.
Lesley Caviness,53. Ms. Caviness serves as Assistant Treasurer of the Funds (2019 to present). Ms. Caviness is also Compliance and Fund Accounting Associate of ICON Advisers, Inc. (2017 to present). Previously she served as Mutual Fund Accounting Associate of ICON Advisers, Inc. (2013 to 2017) and Assistant Treasurer of the Funds (2014 to 2017). Prior to Joining ICON Ms. Caviness worked for Oppenheimer Funds in Fund Accounting and Shareholder Accounting as well as at PricewaterhouseCoopers LLP as an Audit Associate and Audit Senior Associate.
| Annual Report | September 30, 2019 | 33 |
| ICON International Funds | Additional Information |
September 30, 2019 (Unaudited)
Renewal of Investment Advisory Agreement
On September 19, 2019, the Board of Trustees, including all of the Trustees that are not “interested persons” of the Trust (the “Independent Trustees”), approved continuation of the Advisory Agreements (as defined below) with the Adviser for each Fund for an additional one-year term commencing October 1, 2019.
The Trustees considered the renewal of the investment advisory agreements between the Trust and the Adviser – the Trust’s Investment Advisory Agreement dated October 9, 1996, as amended (related to the Sector Funds, the International Funds and the ICON Fund) and the Trust’s Investment Advisory Agreement dated July 9, 2002 and effective October 1, 2002, as amended (related to the U.S. Diversified Funds — Flexible Bond, Risk-Managed Balanced, Equity Income, Opportunities and Long/Short Funds) (collectively, the “Advisory Agreements”). The Trustees agreed that consideration of the Advisory Agreements should also include consideration of other agreements between the Adviser and the Trust that impact provisions of the Advisory Agreements, including the expense limitation agreements.
The Trustees were provided with and reviewed data with respect to the Adviser, its personnel, and the services provided and to be provided to each Fund by the Adviser under the Trust’s Advisory Agreements, Administrative Services Agreement and Expense Limitation Agreement and the Distribution Agreement with ICON Distributors, Inc. (“IDI”). The data included information concerning advisory, distribution and administrative services provided to the Funds by ICON and its related companies; information concerning other businesses of those companies; and comparative data obtained from Broadridge related to Fund performance and Fund expenses (the “Broadridge Report”).
The Independent Trustees met separately with Broadridge on July 31, 2019 to discuss the Broadridge Report and the information contained within the Broadridge Report.
Also included in the 15(c) discussion was a briefing on factors affecting the ICON investment model; expenses and expense ratios of each Fund and other ICON managed products; relative performance of each Fund; status of expense reimbursements to the Funds by the Adviser; sales and marketing initiatives; specific business factors affecting IDI; the work load on ICON as adviser and administrator to the Funds; current profitability and financial position of ICON; staffing levels and staff morale.
The Independent Trustees were represented by independent legal counsel in the entire 15(c) process. Several times, in August and September, after participating in the meeting with Broadridge and management, the Independent Trustees met separately as a group in private sessions with their independent legal counsel to review and discuss a wide variety of qualitative and quantitative information, including information they had received throughout the year as part of their regular oversight of the Funds. Based on these discussions, independent legal counsel and/or the Lead Independent Trustee also contacted management to request additional information. The Board received materials from independent legal counsel discussing the legal standards applicable to their consideration of the ICON-Trust agreements.
In considering the nature, extent and quality of the services provided by the Adviser,the Board reviewed information relating to ICON’s operations and personnel. Among other things, the Adviser provided biographical information on its professional staff and descriptions of its current organizational and management structure. In the course of their deliberations the Board evaluated among other things, information relating to the investment philosophy, strategies and techniques used in managing each Fund, the qualifications and experience of ICON’s investment personnel, ICON’s compliance programs, ICON’s brokerage practices, including the extent to which the Adviser obtains research through “soft dollar” arrangements with the Funds’ brokerage, compliance reports on the foregoing, and the financial and non-financial resources available to provide services required under the Advisory Agreement.
Management and the Trustees discussed the Broadridge Report and Management personnel showed performance for each Fund and discussed the factors affecting performance. During a lengthy and spirited discussion, the Trustees expressed their concerns regarding both the ICON Funds’ performance relative to similarly situated funds and the overall rate of redemptions relative to sales.
With regard to the ICON Funds’ performance, the Chief Investment Officer (“CIO”) stated that the current market continues to favor growth rather than value-based systems or styles. Further, the current market is challenging for the ICON system due to generally increased volatility and quick, inconsistent market leadership themes. The Funds’ performance during the market selloff in the fourth quarter of 2018 was generally worse than the Funds’ Benchmark returns. Despite the current market, the CIO reiterated his faith in the ICON system, noting its past successes.
The Trustees discussed the reductions in staff in May 2019 as well as the decrease in assets under management of the Adviser in August 2019 due to a large account which ICON was the sub-advisor on moving to a different sub-advisor. From a sales perspective, Management has been working to continue to narrow the focus of ICON’s sales team in order to get the most out of the Regional Vice Presidents in the field and the Internal Sales Associates in the office. Management noted that it hired a new National Sales Director in January 2019. Similar to the past several years, Management has been challenged to penetrate and retain sales in the full-service wirehouse firms. Wirehouses, Management noted, are intent on capturing assets while moving from a transaction-based compensation model (e.g. paying per trade) to a fee-based compensation model (e.g. paying a fixed percentage for asset management). Wirehouses are culling their recommended lists and/or looking to pare down the number of fund families with whom they do business. Management has seen most of the ICON Funds culled from wirehouses, in large part because of the size of the Funds. Management has begun focusing on alternatives to the wirehouse space.
| ICON International Funds | Additional Information |
September 30, 2019 (Unaudited)
In connection with reviewing data bearing upon the nature, quality, and extent of services furnished by ICON to each Fund, the Board assessed data concerning ICON’s staffing, systems and facilities. The Board also assessed ICON’s non-Trust business to see if there are any initiatives that would dilute service to the Trust. The Board concluded:
| A. | That the breadth and the quality of investment advisory and other services being provided to each Fund are satisfactory; |
| B. | That ICON has made significant expenditures in the past year and in prior years by way of expense reimbursements and the Adviser has the systems and trained personnel necessary for it to be able to continue to provide quality service to the Funds’ shareholders; |
| C. | That the Board is satisfied with the research, portfolio management, and trading services, among others, being provided by ICON to the Trust, and has determined that ICON is charging fair and reasonable fees. |
| D. | The risks assumed by ICON in providing investment advisory services to each Fund including the capital commitments which have been made in the past and which continue to be made by ICON to ensure the continuation of the highest quality of service to the Trust is made with the recognition that the Trust’s advisory relationship with ICON can be terminated at any time and must be renewed on an annual basis. |
In considering the reasonableness of the fees paid to the Adviser for managing each Fund,the Board reviewed, among other things, data concerning other funds from the Broadridge Report, financial statements of the Adviser and an analysis of the profitability and financial position (including cash available over the next 12 months) of the Adviser, and its affiliates, and their relationship with each Fund over various time periods. Such analysis identified all revenues and other benefits received by the Adviser and its affiliates from managing each Fund, the costs associated with providing such services and the resulting profitability to the Adviser and its affiliates and a comparison of similar data from reports filed by publicly traded firms.
The Board assessed actual (net) fees for advisory services and Fund expense ratios under the contractual relationship (the Advisory agreements, the Administration Agreement and the Expense Limitation Agreements) with the Adviser as opposed to the fees specified in the applicable Advisory Agreement and expense ratios without application of the expense limitations and the low cost of the Administration Agreement and concluded that the focus should be on actual expense ratios after application of the Expense Limitation Agreements.
The Board considered the current and anticipated asset levels of each Fund and the contractual commitments of the Adviser to waive fees and pay expenses of the Funds from time to time to limit the total expenses of the Funds. The Board also considered the Adviser’s contractual commitment regarding administration and the fact it would continue to lose money on administration. In this regard the Board discussed asset levels in each Fund covered by the Advisory Agreements. ICON’s ability to provide the services called for under the Advisory Agreements was assessed in light of current and projected asset levels. Fund expenses and expense ratios were also assessed in light of current and projected asset levels. The Board concluded that the Adviser has the resources necessary to provide the services called for under the Advisory Agreements; that profitability to the Adviser and its affiliates from their relationship with the Funds, and services provided to the Funds, is not excessive; and that the Adviser is not realizing benefits from economies of scale that would warrant adjustments to the fees for any Fund at this time. The Board of Trustees concluded that, in light of the nature, extent and quality of the services provided by the Adviser and the levels of profitability associated with providing these services, the fees charged by the Adviser under the Advisory Agreements to each Fund are reasonable.
In connection with assessing data bearing on the fairness of fee arrangements,the Board considered the Broadridge Report, and information that they had received throughout the year as part of their regular oversight of the Funds, including Morningstar and Lipper data on the peer groupings. Among other information discussed, it was noted that:
| A. | Upon review of the advisory fee structures of each Fund in comparison with other similar funds of similar size, the level of investment advisory fees paid by each Fund is competitive; |
| B. | The total expense ratio and contractual management fees at common asset levels of each Fund are generally competitive with their expense groups; |
| C. | ICON has contractually agreed to impose expense limitations on all Funds at a cost to ICON; |
| D. | That the advisory and other fees payable by the Funds to ICON are essentially fees which would be similar to those which would have resulted solely from “arm’s-length” bargaining; |
| Annual Report | September 30, 2019 | 35 |
| ICON International Funds | Additional Information |
September 30, 2019 (Unaudited)
| E. | That the fees paid to ICON for managing other institutional accounts (such as individuals or sub-advised portfolios) are lower than the fees paid by similarly managed ICON funds, but the reason why they are lower is reasonably related to the cost for ICON to manage such accounts; and |
| F. | The extent to which economies of scale could be realized as a Fund grows in assets and whether the Fund’s fees reflect these economies of scale for the benefit of Fund shareholders. |
| G. | The costs borne by ICON in providing advisory services to each Fund and the profitability and financial position of ICON in light of the estimated profitability analysis which had been provided by ICON, including cash available for the next 12 months to meet the Advisor’s commitments to the Fund with respect to the expense reimbursements and other operating expenses required to carry out its duties under the Agreement. |
The Board also considered the fees charged by the Adviser to other advisory clients as outlined in its Registration Application on Form ADV in connection with assessing data bearing on the fairness of fee arrangements. The Trustees and Management recognized that the Adviser is continuously evaluating Fund expense ratios and expense limits to assess the competitiveness of the Funds and whether any downward adjustments affect Fund sales.
The Board concluded that the Adviser is providing the Funds with professional management at a price that would have been arrived at in an arm’s length negotiation.
In connection with assessing the direct and indirect benefits to ICON from serving as the Funds’ adviser, the Board discussed services provided under the Distribution Agreement and the Administrative Services Agreement which are in addition to services under the Advisory Agreements. It was noted that:
| A. | ICON benefits from serving directly or through affiliates as the principal underwriter and administrative agent for the Funds; the services provided by ICON and its affiliates to the Funds are reasonably satisfactory, and whether the profits derived from providing the services are competitive and reasonable; |
| B. | ICON receives research assistance from the use of soft dollars generated from Fund portfolio transactions; the Trustees noted that such research is necessary to run the Funds and assists ICON in providing investment advisory services to the Funds as well as other accounts to which it provides advisory services. |
Based on all these considerations and other data as discussed above,the Board, including all of the Independent Trustees, concluded that: 1) the continuation of the Advisory Agreements was in the best interests of each Fund and its shareholders, 2) the services to be performed under the Advisory Agreements were required for the operation of the Funds, 3) the advisory services were satisfactory to the Funds in the past, and 4) the fees for the advisory services and other benefits from the relationship with the Trust received by ICON, and its affiliates, were within the range of what would have been negotiated at arm’s length in light of all the circumstances. The Board noted that its conclusions were based on the assumption that no significant transactions involving the Fund would take place during the year, although any transaction costs in connection with exploring possible transactions might be incurred in addition to normal operating costs.
Supplemental Tax Information
Pursuant to Section 852(b)(3) of the Internal Revenue Code the following Funds designate the amounts listed below as long-term capital gain dividends:
| ICON Emerging Markets Fund | $75,722 |
| ICON International Equity Fund | $0 |
The following Funds designate the percentages listed below of the income dividends distributed in 2018 as qualified dividend income (QDI) as defined in Section 1(h)(11) of the Internal Revenue Code:
| ICON Emerging Markets Fund | 100.00% |
| ICON International Equity Fund | 100.00% |
The following Funds designate the percentages listed below of the income dividends distributed in 2018 as qualifying for the corporate dividends received deduction (DRD) as defined in Section 854(b)(2) of the Internal Revenue Code:
| ICON Emerging Markets Fund | 0.50% |
| ICON International Equity Fund | 0.52% |
| ICON International Funds | Additional Information |
September 30, 2019 (Unaudited)
Pursuant to §853 of the Internal Revenue Code, the ICON Emerging Markets Fund and ICON International Equity Fund designate the following amounts as foreign taxes paid for the current fiscal year. Foreign taxes paid for purposes of §853 may be less than actual foreign taxes paid for financial statement purposes.
Creditable Foreign Taxes Paid
| ICON Emerging Markets Fund | $215,510 |
| ICON International Equity Fund | $94,774 |
Portion of Ordinary Income Distribution derived from Foreign Sourced Income*
| ICON Emerging Markets Fund | 97.52% |
| ICON International Equity Fund | 98.83% |
| * | The Fund has not derived any income from ineligible foreign sources as defined under §901(j) of the Internal Revenue Code. |
Foreign taxes paid or withheld should be included in taxable income with an offsetting deduction from gross income or as a credit for taxes paid to foreign governments.
Above figures may differ from those cited elsewhere in this report due to differences in the calculation of income and gains under U.S. generally accepted accounting principles (book) purposes and Internal Revenue Service (tax) purposes.
Portfolio Holdings
Information related to the 10 largest portfolio holdings of each Fund is made available at www.iconfunds.com within approximately 10 business days after month-end. Additionally, a complete list of each Fund’s holdings is made available approximately 30 days after month-end. Each ICON Fund also files a complete schedule of portfolio holdings for the first and third quarters of its fiscal year with the Securities and Exchange Commission (the “Commission”) on Form N-Q. The ICON Funds’ Forms N-Q are available at www.sec.gov or may be reviewed and copied at the Commission’s Public Reference Room in Washington, DC. Information about the Public Reference Room may be obtained by calling 1-800-SEC-0330.
Proxy Voting
A summarized description of the policies and procedures the ICON Funds use to vote proxies is available free of charge at www.iconfunds.com or by calling 1-800-764-0442.
Information about how the ICON Funds voted proxies related to each Fund’s portfolio securities during the 12-month period ended June 30 is available free of charge at www.iconfunds.com or on the Commission’s website at www.sec.gov.
For More Information
This report is for the general information of the Funds’ shareholders and is not authorized for distribution to prospective investors unless preceded or accompanied by a current prospectus. You may obtain a copy of the prospectus, which contains information about the investment objectives, risks, charges, expenses, and share classes of each ICON Fund, by visiting www.iconfunds.com or by calling 1-800-764-0442. Please read the prospectus carefully before investing.
ICON Distributors, Inc., Distributor.
| Annual Report | September 30, 2019 | 37 |
| | |
| ICON International Funds | | Privacy Policy |
| | September 30, 2019 (Unaudited) |
| | |
| |
| | WHAT DOES ICON DO WITH YOUR PERSONAL INFORMATION? |
| |
Why? | | Financial companies choose how they share your personal information. Federal law gives consumers the right to limit some but not all sharing. Federal law also requires us to tell you how we collect, share, and protect your personal information. Please read this notice carefully to understand what we do. |
| |
What? | | The types of personal information we collect and share depend on the product or service you have with us. This information can include: |
| |
| | ● Social Security number and account balances |
| | ● income and transaction history |
| | ● checking account information and wire transfer instructions |
| |
| | | When you are no longer our customer, we continue to share your information as described in this notice. |
| |
How? | | All financial companies need to share customers’ personal information to run their everyday business. In the section below, we list the reasons financial companies can share their customers’ personal information; the reasons ICON chooses to share; and whether you can limit this sharing. |
| | | | | | |
| | | |
Reasons we can share your personal information | | | | Does ICON share? | | Can you limit this sharing? |
| | | |
For our everyday business purposes — such as to process your transactions, maintain your account(s), respond to court orders and legal investigations, or report to credit bureaus | | | | Yes | | No |
| | | |
For our marketing purposes — to offer our products and services to you | | | | No | | We don’t share |
| | | |
For joint marketing with other financial companies | | | | No | | We don’t share |
| | | |
For our affiliates’ everyday business purposes — information about your transactions and experiences | | | | No | | We don’t share |
| | | |
For our affiliates’ everyday business purposes — information about your creditworthiness | | | | No | | We don’t share |
| | | |
For nonaffiliates to market to you | | | | No | | We don’t share |
| | |
| |
Questions? | | Call1-800-764-0442 for the ICON Funds and1-800-828-4881 for ICON Advisers, Inc. and ICON Distributors, Inc. |
| | |
| ICON International Funds | | Privacy Policy |
| | September 30, 2019 (Unaudited) |
| | |
|
| Who We Are |
| |
| Who is providing this notice? | | ICON Funds, ICON Advisers, Inc., and ICON Distributors, Inc. (collectively “ICON”) |
|
| What We Do |
| |
How does ICON protect my personal information? | | To protect your personal information from unauthorized access and use, we use security measures that comply with federal law. These measures include computer safeguards and secured files and buildings. |
| |
| | Contracts with our service providers require them to restrict access to yournon-public personal information, and to maintain physical, electronic and procedural safeguards against unintended disclosure. |
| | |
How does ICON collect my | | We collect your personal information, for example, when you |
| personal information? | |
| | ● open an account or enter into an investment advisory contract |
| | ● provide account information or give us your contact information |
| | ● make a wire transfer |
| |
| | We also collect your personal information from others, such as credit bureaus, affiliates, or other companies. |
| | |
| Why can’t I limit all sharing? | | Federal law gives you the right to limit only |
| |
| | ● sharing for affiliates’ everyday business purposes — information about your creditworthiness |
| | ● affiliates from using your information to market to you |
| | ● sharing for nonaffiliates to market to you |
| |
| | | State laws and individual companies may give you additional rights to limit sharing. |
|
| Definitions |
| |
| Affiliates | | Companies related by common ownership or control. They can be financial and nonfinancial companies. |
| |
| | | ● Our affiliates include financial companies such as ICON Funds, ICON Advisers, Inc., and ICON Distributors, Inc. |
| |
| Nonaffiliates | | Companies not related by common ownership or control. They can be financial and nonfinancial companies. |
| |
| | | ● Nonaffiliates we share with can include financial companies such ascustodians, transfer agents, registered representatives, financial advisers and nonfinancial companies such as fulfillment, proxy voting, and class action service providers |
| |
| Joint marketing | | A formal agreement between nonaffiliated financial companies that together market financial products or services to you. |
| |
| | | ● ICON doesn’t jointly market |
| |
| Annual Report | September 30, 2019 | | 39 |

For more information about the ICON Funds, contact us:
| | |
By Telephone | | 1-800-764-0442 |
ByE-Mail | | info@iconadvisers.com |
By Mail | | ICON Funds | P.O. Box 1920 | Denver, CO 80201 |
In Person | | ICON Funds | 5299 DTC Boulevard, Suite 1200 |
| | Greenwood Village, CO 80111 |
On the Internet | | www.iconfunds.com |
Sector Funds
ICON Consumer Discretionary Fund (ICCCX, ICCAX)
ICON Consumer Staples Fund (ICLEX, ICRAX)
ICON Energy Fund (ICENX, ICEEX, ICEAX)
ICON Financial Fund (ICFSX, ICFAX)
ICON Healthcare Fund (ICHCX, ICHAX)
ICON Industrials Fund (ICTRX, ICIAX)
ICON Information Technology Fund (ICTEX, ICTTX)
ICON Natural Resources Fund (ICBMX, ICBCX, ICBAX)
ICON Utilities Fund (ICTUX, ICTVX)

You can now sign up for electronic delivery of ICON Fund shareholder reports, including prospectuses, annual reports, semiannual reports and proxy statements.
When these materials are available, you will receive an email from ICON with instructions on how to view the documents. Statements, transaction confirmations and other documents that are not available online will continue to be sent to you by U.S. mail.
Visit ICON’s website atwww.iconfunds.com to learn more and sign up.
You may change or cancel your participation ineDelivery by visitingwww.iconfunds.com, or you can request a hard copy of any of the materials free of charge by calling ICON Funds at 1-800-764-0442.
Beginning on January 1, 2021, ICON will no longer send paper copies of the Funds’ annual and semi-annual shareholder reports by mail, unless you specifically request paper copies of the reports. Instead, the reports will be made available on a website and you will be notified by mail each time a report is posted and given a website address of where to access the report.
If you have already opted to receive e-delivery, this change will not affect you and you do not need to take any action. At any time, shareholders who invest directly in the ICON Funds may generally elect to receive reports or other communications electronically by enrolling at www.iconfunds.com or calling 1-800-764-0442 or, if you are a retirement plan sponsor or invest in the funds through a financial intermediary (such as an investment advisor, broker-dealer, insurance company, or bank), by contacting your representative or your financial intermediary.
You may elect to continue receiving paper copies of future shareholder reports free of charge. To do so, if you invest directly with ICON, please call 1-800-764-0442. If you are a retirement plan sponsor or invest in the ICON Funds through a financial intermediary, please contact your representative or financial intermediary. Your election to receive reports as a paper copy will apply to all ICON Funds held in your account. Your election can be changed at any time in the future.
| | | | |
| | 1-800-764-0442 | | ● | | www.iconfunds.com | | |
TABLE OF CONTENTS
| ICON Sector Funds | | About This Report |
| | September 30, 2019 (Unaudited) |
Historical Returns
All total returns mentioned in this Report account for the change in a Fund’s per-share price and the reinvestment of any dividends, capital gain distributions and adjustments for financial statement purposes. If your account is set up to receive Fund distributions in cash rather than to reinvest them, your actual return may differ from these figures. The Funds’ performance results do not reflect the deduction of taxes that a shareholder would pay on Fund distributions or on the redemption of Fund shares. The Adviser may have reimbursed certain fees or expenses of some of the Funds. If not for these reimbursements, performance would have been lower. Fund results shown, unless otherwise indicated, are at net asset value. If a sales charge (maximum 5.75%) had been deducted, results would have been lower.
Past performance does not guarantee future results. Investment return and principal value will fluctuate so that an investor’s shares, when redeemed, may be worth more or less than their original cost. Performance results represent past performance, and current performance may be higher or lower. Please call 1-800-764-0442 or visit www.iconfunds.com for performance results current to the most recent month-end.
Portfolio Data
This Report reflects ICON’s portfolio holdings as of September 30, 2019, the end of the reporting period. The information is not a complete analysis of every aspect of any sector, industry, security or the Funds.
There are risks associated with mutual fund investing, including the loss of principal. The likelihood of loss may be greater if you invest for a shorter period of time. There is no assurance that the investment process will consistently lead to successful results.
An investment concentrated in sectors and industries may involve greater risk and volatility than a more diversified investment. Investments in foreign securities may entail unique risks, including political, market, and currency risks. Financial statements of foreign companies are governed by different accounting, auditing, and financial standards than U.S. companies and may be less transparent and uniform than in the United States. Many corporate governance standards, which help ensure the integrity of public information in the United States, do not exist in foreign countries. In general, there may be less governmental supervision of foreign stock exchanges and securities brokers and issuers. The ICON system relies on the integrity of the financial statements released to the market as part of our analysis.
The prospectus and statement of additional information contain this and other information about the Funds and are available by visiting www.iconfunds.com or calling 1-800-764-0442. Please read the prospectus and statement of additional information carefully.
Financial Intermediary
If you purchase the Fund through a broker-dealer or other financial intermediary (such as a bank), the Fund and its related companies may pay the intermediary for the sale of Fund shares and related services. These payments may influence the broker-dealer or other intermediary and your salesperson to recommend the Fund over another investment. Ask your salesperson or visit your financial intermediary’s website for more information.
| ICON Consumer Discretionary Fund | | Management Overview |
| | September 30, 2019 (Unaudited) |
| Q. | How did the Fund Perform relative to its benchmark? |
| A. | The ICON Consumer Discretionary Fund, Class S (the Fund), returned -3.55% for the fiscal year ended September 30, 2019, while the benchmark S&P 1500 Consumer Discretionary Index returned 1.30%. The broad market S&P 1500 Index returned 3.39%. Total returns for other periods and additional Class shares as of September 30, 2019 appear in the subsequent pages of this Fund’s Management Overview. |
| Q. | What primary factors influenced the Fund’s relative performance during the period? |
| A. | Throughout the equity market downturn during the fourth quarter of 2018, the S&P 1500 Consumer Discretionary Index returned about - 16.68% while the Fund returned about -12.75%. During this time, the Fund was generally overweight, relative to its benchmark, companies and industries that held up better during the downturn. For example, the Fund was underweight the internet & direct marketing retail and apparel retail industries during the fourth quarter 2018, both of which underperformed the overall benchmark. Further, the Fund’s holdings in the footwear industry were slightly overweight relative to the benchmark during the fourth quarter of 2018 and the Fund’s holdings in the industry had positive returns compared to the benchmark’s negative returns in the same industry. However, the Fund underperformed during the first, second and third quarters of 2019, as both the broad market and the Consumer Discretionary sector rebounded. This underperformance came primarily during the second half of the fiscal year from April to September as the Fund was overweight the apparel accessories & luxury goods and apparel retail industries relative to the benchmark. Both industries underperformed the overall sector benchmark. |
| Q. | How did the Fund’s Composition affect performance? |
| A. | During the entire fiscal year, performance was hampered primarily by holdings in three industries. The Fund’s holdings in the apparel accessories & luxury goods, apparel retail, and hotels resorts & cruise lines industries were all overweight in the Fund relative to the benchmark and all had negative returns. The apparel accessories & luxury goods industry was overweight relative to the benchmark during the entire period by about 10% on average, which was the biggest performance detractor for the Fund. |
| | Another industry that detracted from the Fund’s performance was the specialized consumer services industry. Even though the Fund and the benchmark were close to equal weight in this industry, the Fund’s holdings were down much more than the benchmark holdings. |
| | On the opposite side, the Fund’s overweight positions relative to the benchmark in the cable & satellite and homebuilding industries contributed positively as both outperformed the benchmark. Ultimately, the positive return in these industries was not enough to offset the losses in the three underperforming industries discussed above. |
| Q. | What is your investment outlook for the Consumer Discretionary sector? |
| A. | At the close of the fiscal year, our value based investing model indicates the Consumer Discretionary sector has a value-to-price (V/P) ratio of 1.27. In other words, we see the fair value of the overall Consumer Discretionary sector as 27% higher than where the sector is currently trading. Drilling down to the industry level, we currently see bargains in the footwear, computer & electronics retail, homebuilding and home furnishing retail industries. As always, we look to value as our primary guide and will adjust our positioning as market conditions dictate. |
| |
| Annual Report | September 30, 2019 | | 3 |
| ICON Consumer Discretionary Fund | | Management Overview |
| | September 30, 2019 (Unaudited) |
Average Annual Total Return(as of September 30, 2019)
| | | Inception Date | | 1 Year | | 5 Years | | 10 Years | | Since Inception | | Gross Expense Ratio* | | Net Expense Ratio* |
| ICON Consumer Discretionary Fund - Class S | | 7/9/97 | | -3.55% | | 3.07% | | 10.68% | | 5.23% | | 1.60% | | 1.60% |
| ICON Consumer Discretionary Fund - Class A | | 9/30/10 | | -3.89% | | 2.59% | | N/A | | 9.08% | | 2.28% | | 1.99% |
ICON Consumer Discretionary Fund - Class A
(including maximum sales charge of 5.75%) | | 9/30/10 | | -9.39% | | 1.38% | | N/A | | 8.37% | | 2.28% | | 1.99% |
| S&P 1500 Consumer Discretionary Index | | | | 1.30% | | 13.10% | | 17.04% | | 9.45% | | N/A | | N/A |
| S&P Composite 1500 Index | | | | 3.39% | | 10.69% | | 13.21% | | 7.77% | | N/A | | N/A |
Past performance is not a guarantee of future results.The performance of the S&P 1500 Consumer Discretionary Index includes the reinvestment of the dividends and capital gain distributions beginning on January 1, 2002. Additional information about these performance results and the comparative indexes can be found in the About This Report section. The Adviser has agreed to limit certain Fund expenses; without these limitations, returns would have been lower. The limitation provisions may be terminated in the future.
| * | Please see the most recent prospectus for details. |
Value of a $10,000 Investment(through September 30, 2019)
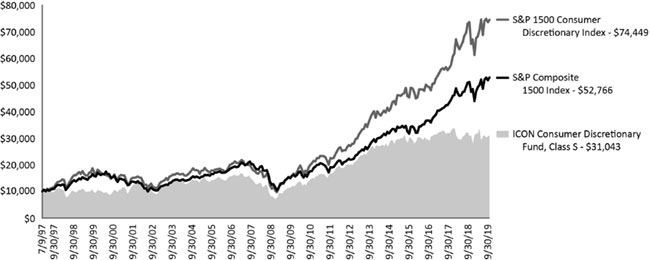
Past performance is not a guarantee of future results.The above graph compares a $10,000 investment made in the Fund’s Class S shares on the Class’ inception date of 7/9/97 to a $10,000 investment made in unmanaged securities indexes on that date. The Fund’s performance in this chart and the performance table assumes the reinvestment of dividends and capital gain distributions but does not reflect the deduction of taxes that a shareholder would pay on Fund distributions or on the redemption of Fund shares.
| | |
| ICON Consumer Discretionary Fund | | Schedule of Investments |
| | September 30, 2019 |
| | | Shares or
Principal
Amount | | | Value | |
| Common Stocks (99.62%) | | | | | | | | |
| Apparel Retail (4.33%) | | | | | | | | |
| TJX Cos., Inc. | | | 15,602 | | | $ | 869,655 | |
| | | | | | | | | |
| Apparel, Accessories & Luxury Goods (14.58%) | | | | | | | | |
| Columbia Sportswear Co. | | | 8,300 | | | | 804,187 | |
| Lululemon Athletica, Inc.(a) | | | 5,900 | | | | 1,135,927 | |
| VF Corp. | | | 11,100 | | | | 987,789 | |
| | | | | | | | 2,927,903 | |
| Automotive Retail (2.78%) | | | | | | | | |
| O’Reilly Automotive, Inc.(a) | | | 1,400 | | | | 557,914 | |
| | | | | | | | | |
| Cable & Satellite (4.29%) | | | | | | | | |
| Comcast Corp., Class A | | | 19,100 | | | | 861,028 | |
| | | | | | | | | |
| Data Processing & Outsourced Services (3.24%) | | | | | | | | |
| Mastercard, Inc., Class A | | | 2,400 | | | | 651,768 | |
| | | | | | | | | |
| Distributors (2.38%) | | | | | | | | |
| LKQ Corp.(a) | | | 15,200 | | | | 478,040 | |
| | | | | | | | | |
| Footwear (5.89%) | | | | | | | | |
| NIKE, Inc., Class B | | | 12,600 | | | | 1,183,392 | |
| | | | | | | | | |
| General Merchandise Stores (4.67%) | | | | | | | | |
| Dollar General Corp. | | | 5,900 | | | | 937,746 | |
| | | | | | | | | |
| Home Furnishings (4.39%) | | | | | | | | |
| Mohawk Industries, Inc.(a) | | | 7,100 | | | | 880,897 | |
| | | | | | | | | |
| Home Improvement Retail (4.54%) | | | | | | | | |
| Lowe’s Cos., Inc. | | | 8,300 | | | | 912,668 | |
| | | | | | | | | |
| Homebuilding (11.01%) | | | | | | | | |
| Cavco Industries, Inc.(a) | | | 5,400 | | | | 1,037,286 | |
| LGI Homes, Inc.(a) | | | 14,100 | | | | 1,174,812 | |
| | | | | | | | 2,212,098 | |
| Hotels, Resorts & Cruise Lines (13.45%) | | | | | | | | |
| Carnival Corp. | | | 16,112 | | | | 704,255 | |
| Marriott Vacations Worldwide Corp. | | | 10,800 | | | | 1,118,988 | |
| Royal Caribbean Cruises, Ltd. | | | 8,099 | | | | 877,365 | |
| | | | | | | | 2,700,608 | |
| Interactive Media & Services (3.64%) | | | | | | | | |
| Alphabet, Inc., Class C(a) | | | 600 | | | | 731,400 | |
| | | | | | | | | |
| Internet & Direct Marketing Retail (15.81%) | | | | | | | | |
| Alibaba Group Holding, Ltd., Sponsored ADR(a) | | | 6,600 | | | | 1,103,718 | |
| Amazon.com, Inc.(a) | | | 1,194 | | | | 2,072,677 | |
| | | | | | | | 3,176,395 | |
| | | Shares or
Principal
Amount | | | Value | |
| Specialty Stores (4.62%) | | | | | | | | |
| Ulta Beauty, Inc.(a) | | | 3,700 | | | $ | 927,405 | |
| | | | | | | | | |
| Total Common Stocks | | | | | | | | |
| (Cost $18,514,587) | | | | | | | 20,008,917 | |
| | | | | | | | | |
| Total Investments (99.62%) | | | | | | | | |
| (Cost $18,514,587) | | | | | | $ | 20,008,917 | |
| | | | | | | | | |
| Other Assets Less Liabilities (0.38%) | | | | | | | 75,712 | |
| | | | | | | | | |
| Net Assets (100.00%) | | | | | | $ | 20,084,629 | |
| (a) | Non-income producing security. |
ADR - American Depositary Receipt
| The accompanying notes are an integral part of the financial statements. |
| Annual Report | September 30, 2019 | | 5 |
| ICON Consumer Discretionary Fund | | Schedule of Investments |
| | September 30, 2019 |
| Sector Composition(September 30, 2019) | | | |
| Consumer Discretionary | | | 88.45 | % |
| Communication Services | | | 7.93 | % |
| Information Technology | | | 3.24 | % |
| | | | 99.62 | % |
Percentages are based upon common stocks as a percentage of net assets.
Industry Composition(September 30, 2019)
| Internet & Direct Marketing Retail | | | 15.81 | % |
| Apparel, Accessories & Luxury Goods | | | 14.58 | % |
| Hotels, Resorts & Cruise Lines | | | 13.45 | % |
| Homebuilding | | | 11.01 | % |
| Footwear | | | 5.89 | % |
| General Merchandise Stores | | | 4.67 | % |
| Specialty Stores | | | 4.62 | % |
| Home Improvement Retail | | | 4.54 | % |
| Home Furnishings | | | 4.39 | % |
| Apparel Retail | | | 4.33 | % |
| Cable & Satellite | | | 4.29 | % |
| Interactive Media & Services | | | 3.64 | % |
| Data Processing & Outsourced Services | | | 3.24 | % |
| Automotive Retail | | | 2.78 | % |
| Distributors | | | 2.38 | % |
| | | | 99.62 | % |
Percentages are based upon common stocks as a percentage of net assets.
| The accompanying notes are an integral part of the financial statements. |
| 6 | | www.iconfunds.com |
| | |
| ICON Consumer Staples Fund | | Management Overview |
| | September 30, 2019 (Unaudited) |
| Q. | How did the Fund perform relative to its benchmark? |
| A. | The ICON Consumer Staples Fund, Class S (the Fund), returned 3.12% for the fiscal year ended September 30, 2019, while its benchmark, the S&P Composite 1500 Consumer Staples Index, returned 15.91%. Total returns for other periods and additional Class shares as of September 30, 2019, appear in the subsequent pages of this Fund’s Management Overview. |
| Q. | What primary factors were behind the Fund’s relative performance? |
| A. | Markets began the fiscal year with sharp declines during the fourth quarter of 2018. It appeared that the market decline was due at least in part to investors’ concerns over continued trade war threats and overall declining global growth. Even though the Consumer Staples sector was the second best performing sector during this downturn (the Utilities sector was the top performer), the Fund underperformed its benchmark as the Fund returned about -9.06% and the S&P Composite 1500 Consumer Staples Index returned about -5.47% during the fourth quarter of 2018. Throughout the remaining three quarters of the fiscal year, markets recovered swiftly, however the Fund continued to trail its benchmark throughout the recovery. This was largely due in part to several large-cap companies outperforming the broad market, of which the Fund either did not hold or held an underweight position relative to the benchmark. Specifically, the Fund held an average weighted position of 2.9% in P&G, almost five times less than its weight in the benchmark. Proctor & Gamble shares outperformed and rose over 54% for the year ended September 30, 2019, causing significant underperformance of the Fund relative to the benchmark. Additionally, the Fund held overweight positions in the distillers & vintners industry, as well as holdings in Consumer Staples-related companies in the Health Care sector. These industries’ low returns over the period were a significant detractor from the Fund’s performance. |
| Q. | How did the Fund’s composition affect performance? |
| A. | The three biggest contributors to Fund performance were Procter & Gamble, Walmart, and PepsiCo. All three of these companies generally rose steadily throughout the later part of the fiscal year on positive earnings reports and forecasts. However, while all three of these large-cap stocks contributed the most to total portfolio return, they were also held at positions below benchmark weight and therefore still contributed to lagging performance relative to the benchmark. |
| | The three stocks that detracted the most from Fund performance were Altria Group, Medifast, and Walgreens Boots Alliance. Altria shares were negatively affected by the tobacco industry-wide concern over the health effects of vaping. Medifast’s negative returns followed in line with the overall downward trend of the personal products industry (excluding Avon Products, which grew more than 100% over the course of the year). Finally, Walgreens Boots Alliance was negatively impacted by political pressures to lower drug prices as well as weakened global demand and tariff concerns. |
| Q. | What is your investment outlook for the overall market? |
| A. | As of September 30, 2019, ICON’s valuation model shows a value-to-price (V/P) ratio of 1.13 for the Consumer Staples sector. In other words, we believe stock prices, on average, are below our estimate of fair value. The Fund enters 2020 with its largest industry weighting in the packaged food & meats industry, which started the new fiscal year with an industry VP of 1.19. ICON valuations also lead the Fund to favor the personal products, distillers & vintners, and brewers industries. Overall market valuations are indicating to us the potential for the recent upward market momentum to continue to grow into 2020. |
| |
| Annual Report | September 30, 2019 | | 7 |
| ICON Consumer Staples Fund | Management Overview |
September 30, 2019 (Unaudited)
Average Annual Total Return(as of September 30, 2019)
| | | Inception
Date | | 1 Year | | 5 Years | | 10 Years | | Since
Inception | | Gross Expense
Ratio* | | Net Expense
Ratio* |
| ICON Consumer Staples Fund - Class S | | 5/9/97 | | 3.12 | % | | 6.03 | % | | 9.49 | % | | 7.96 | % | | 2.16 | % | | 1.51 | % |
| ICON Consumer Staples Fund - Class A | | 9/30/10 | | 3.04 | % | | 5.80 | % | | N/A | | 9.11 | % | | 2.29 | % | | 1.77 | % |
ICON Consumer Staples Fund - Class A
(including maximum sales charge of 5.75%) | | 9/30/10 | | -2.84 | % | | 4.54 | % | | N/A | | 8.40 | % | | 2.29 | % | | 1.77 | % |
| S&P 1500 Consumer Staples Index | | | | 15.91 | % | | 9.10 | % | | 12.39 | % | | 8.28 | % | | N/A | | N/A |
| S&P Composite 1500 Index | | | | 3.39 | % | | 10.69 | % | | 13.21 | % | | 8.19 | % | | N/A | | N/A |
Past performance is not a guarantee of future results.The performance of the S&P 1500 Consumer Staples Index includes the reinvestment of the dividends and capital gain distributions beginning on January 1, 2002. Additional information about these performance results and the comparative indexes can be found in the About This Report section. The Adviser has agreed to limit certain Fund expenses; without these limitations, returns would have been lower. The limitation provisions may be terminated in the future.
| * | Please see the most recent prospectus for details. |
Value of a $10,000 Investment(through September 30, 2019)
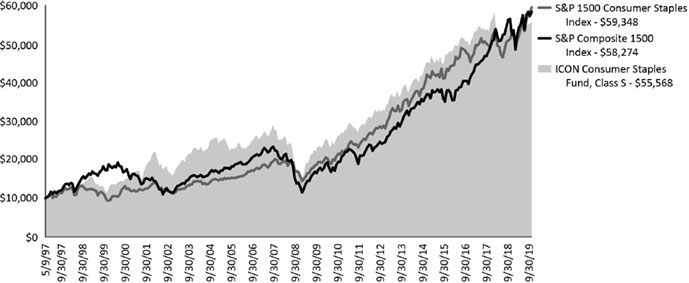
Past performance is not a guarantee of future results.The above graph compares a $10,000 investment made in the Fund’s Class S shares on the Class’ inception date of 5/9/97 to a $10,000 investment made in unmanaged securities indexes on that date. The Fund’s performance in this chart and the performance table assumes the reinvestment of dividends and capital gain distributions but does not reflect the deduction of taxes that a shareholder would pay on Fund distributions or on the redemption of Fund shares.
| ICON Consumer Staples Fund | Schedule of Investments |
September 30, 2019
| | | Shares or
Principal
Amount | | | Value | |
| Common Stocks (98.64%) |
| Apparel, Accessories & Luxury Goods (2.20%) |
| VF Corp. | | | 2,800 | | | $ | 249,172 | |
| | | | | | | | | |
| Brewers (4.79%) |
| Anheuser-Busch InBev SA/NV, Sponsored ADR(a) | | | 5,700 | | | | 542,355 | |
| | | | | | | | | |
| Distillers & Vintners (8.31%) |
| Diageo PLC, Sponsored ADR | | | 2,800 | | | | 457,856 | |
| MGP Ingredients, Inc.(a) | | | 9,700 | | | | 481,896 | |
| | | | | | | | 939,752 | |
| Food Distributors (3.51%) |
| Sysco Corp. | | | 5,000 | | | | 397,000 | |
| | | | | | | | | |
| Footwear (2.99%) |
| NIKE, Inc., Class B | | | 3,600 | | | | 338,112 | |
| | | | | | | | | |
| General Merchandise Stores (5.57%) |
| Dollar General Corp. | | | 2,100 | | | | 333,774 | |
| Dollar Tree, Inc.(b) | | | 2,600 | | | | 296,816 | |
| | | | | | | | 630,590 | |
| Household Products (4.04%) |
| Kimberly-Clark Corp. | | | 1,900 | | | | 269,895 | |
| Procter & Gamble Co. | | | 1,500 | | | | 186,570 | |
| | | | | | | | 456,465 | |
| Internet & Direct Marketing Retail (8.14%) |
| Amazon.com, Inc.(b) | | | 250 | | | | 433,977 | |
| eBay, Inc. | | | 3,500 | | | | 136,430 | |
| Expedia, Inc. | | | 2,600 | | | | 349,466 | |
| | | | | | | | 919,873 | |
| Packaged Foods & Meats (23.30%) |
| Calavo Growers, Inc.(a) | | | 4,400 | | | | 418,792 | |
| General Mills, Inc. | | | 5,700 | | | | 314,184 | |
| J.M. Smucker Co. | | | 1,900 | | | | 209,038 | |
| Nestle SA, Sponsored ADR | | | 3,000 | | | | 325,200 | |
| Pilgrim’s Pride Corp.(b) | | | 19,900 | | | | 637,696 | |
| Post Holdings, Inc.(b) | | | 2,100 | | | | 222,264 | |
| Tyson Foods, Inc., Class A | | | 5,900 | | | | 508,226 | |
| | | | | | | | 2,635,400 | |
| Personal Products (12.87%) |
| Estee Lauder Cos., Inc., Class A | | | 2,100 | | | | 417,795 | |
| Medifast, Inc.(a) | | | 4,400 | | | | 455,972 | |
| Unilever PLC, Sponsored ADR | | | 9,700 | | | | 582,970 | |
| | | | | | | | 1,456,737 | |
| Soft Drinks (11.12%) |
| Coca-Cola Co. | | | 3,900 | | | | 212,316 | |
| Coca-Cola European Partners PLC | | | 8,400 | | | | 465,780 | |
| Keurig Dr Pepper, Inc.(a) | | | 21,196 | | | | 579,075 | |
| | | | | | | | 1,257,171 | |
| Tobacco (11.80%) | | | | | | | | |
| Altria Group, Inc. | | | 9,400 | | | | 384,460 | |
| British American Tobacco PLC, Sponsored ADR | | | 13,000 | | | | 479,700 | |
| | | Shares or
Principal
Amount | | | Value | |
| Tobacco (continued) |
| Philip Morris International, Inc. | | | 6,200 | | | $ | 470,766 | |
| | | | | | | | 1,334,926 | |
| | | | | | | | | |
Total Common Stocks
(Cost $11,061,466) | | | | | | | 11,157,553 | |
| | | | | | | | | |
| Collateral for Securities on Loan (6.61%) |
| State Street Navigator Securities Lending Government Money Market Portfolio, 7-Day Yield 2.09% | | | 748,025 | | | | 748,025 | |
| | | | | | | | | |
Total Collateral for Securities on Loan
(Cost $748,025) | | | | | | | 748,025 | |
| | | | | | | | | |
Total Investments (105.25%)
(Cost $11,809,491) | | | | | | $ | 11,905,578 | |
| | | | | | | | | |
| Liabilities Less Other Assets (-5.25%) | | | | | | | (594,611 | ) |
| | | | | | | | | |
| Net Assets (100.00%) | | | | | | $ | 11,310,967 | |
| (a) | All or a portion of the security was on loan as of September 30, 2019. |
| (b) | Non-income producing security. |
ADR - American Depositary Receipt
| Sector Composition(September 30, 2019) |
| | | | | |
| Consumer Staples | | | 79.74 | % |
| Consumer Discretionary | | | 18.90 | % |
| | | | 98.64 | % |
Percentages are based upon common stocks as a percentage of net assets.
The accompanying notes are an integral part of the financial statements.
| Annual Report | September 30, 2019 | 9 |
| ICON Consumer Staples Fund | Schedule of Investments |
September 30, 2019
| Industry Composition(September 30, 2019) | | | | |
| | | | | |
| Packaged Foods & Meats | | | 23.30 | % |
| Personal Products | | | 12.87 | % |
| Tobacco | | | 11.80 | % |
| Soft Drinks | | | 11.12 | % |
| Distillers & Vintners | | | 8.31 | % |
| Internet & Direct Marketing Retail | | | 8.14 | % |
| General Merchandise Stores | | | 5.57 | % |
| Brewers | | | 4.79 | % |
| Household Products | | | 4.04 | % |
| Food Distributors | | | 3.51 | % |
| Footwear | | | 2.99 | % |
| Apparel, Accessories & Luxury Goods | | | 2.20 | % |
| | | | 98.64 | % |
Percentages are based upon common stocks as a percentage of net assets.
The accompanying notes are an integral part of the financial statements.
| ICON Energy Fund | Management Overview |
September 30, 2019 (Unaudited)
| Q. | How did the Fund perform relative to its benchmarks? |
| A. | The ICON Energy Fund (the Fund) Class S returned -27.95% for the fiscal year ended September 30, 2019, underperforming its sector-specific benchmark, the S&P 1500 Energy Index, which returned -22.38%. The Fund also lagged the broad benchmark, the S&P 1500 Index, which returned 3.39%. Total returns for other periods and additional Class shares as of September 30, 2019, appear in the subsequent pages of this Fund’s Management Overview. |
| Q. | What primary factors were behind the Fund’s relative performance? |
| A. | At the beginning of fiscal year 2019, our valuation model indicated the domestic Energy sector had a value-to-price (V/P) ratio of 0.96, implying that, on average, our estimate of fair value for stocks in the Energy sector was about 4% lower than where they were trading. Despite the overall average V/P indicating our system estimated the sector was, on average, trading above our estimate of fair value the weighted average V/P of the Fund’s holdings was 1.17, meaning that the Fund was able to invest in securities within the sector that our system indicated were trading below our estimate of their fair value. The biggest impact on the Fund’s underperformance relative to its benchmark came during the fourth quarter of 2018, with the Fund’s benchmark returning about -25.40% for the fourth quarter while the Fund returned about -28.33% over the same period. For the remainder of the fiscal year, the Fund and benchmark had similar returns. During the fourth quarter of 2018, the Fund’s holdings in the oil & gas exploration and production industry was overweight relative to the benchmark by about 18.5%; while both the Fund holdings and the benchmark holdings in that industry had negative returns, the Fund’s overweight position caused a greater effect on the overall returns for the quarter. |
| Q. | How did the Fund’s composition affect performance? |
| A. | As previously discussed, the Fund’s performance was hindered by its positions in the oil & gas exploration & production industry, not just for the fourth quarter of 2018, but the entire fiscal year. The Fund’s returns for holdings in that industry for the fiscal year were about -45%, making it the biggest detractor on performance. Another detractor from performance was the oil & gas storage and transportation industry, which was underweight its benchmark during the fiscal year. The industry had positive returns and thus the benefit to the Fund’s returns was minimal relative to the benchmark. |
The Fund’s position in the oil & gas equipment & services industry had a positive impact on performance. While the industry made up 10.4% of the S&P Composite 1500 Energy index, and returned -43.15%, the industry only accounted for 6.5% of the Fund’s holdings and the Fund’s positions in the industry had a positive return of about 2%.
| Q. | What is your investment outlook for the Energy sector? |
| A. | While the downturn in the Energy sector over the past several years has resulted in our valuation system indicating some bargains exist in the sector looking ahead at the next fiscal year, at ICON we also consider the relative strength of sectors, industries, and companies. At the beginning of the new fiscal year, our V/P ratio for the Energy sector was 1.21 vs. 1.18 for the entire domestic market; however, the relative strength for the Energy sector is 0.84. Relative strength (RS) is intended to provide us with an estimate of a sector or industry’s recent performance compared to the entire market. If RS for a sector is below 1.00, that would indicate that the sector is not a part of the current market theme. At ICON we like sectors and industries to not only have value, but to also be part of a market theme. The Energy sector has been the lowest returning sector in the recent past; which helps give the sector value, but hurts its relative strength. At ICON we will continue to hold companies and industries within the sector with good V/P and will continue to seek out companies and industries with strong relative strength where possible. Within the sector, the oil & gas refining & marketing industry has V/P and RS above 1.00 to begin the fiscal year. There are also individual companies within other industries like oil & gas exploration & production that have value and relative strength according to our system. Our outlook for the sector sees a lot of value, but low relative strength suggests that it may take a long time to build the momentum to realize that value. |
| Annual Report | September 30, 2019 | 11 |
| ICON Energy Fund | Management Overview |
September 30, 2019 (Unaudited)
Average Annual Total Return(as of September 30, 2019)
| | | Inception
Date | | 1 Year | | 5 Years | | 10 Years | | Since
Inception | | Gross Expense
Ratio* | | Net Expense
Ratio* |
| ICON Energy Fund - Class S | | 11/5/97 | | -27.95 | % | | -11.30 | % | | -2.20 | % | | 5.89 | % | | 1.50 | % | | 1.50 | % |
| ICON Energy Fund - Class C | | 9/30/10 | | -28.64 | % | | -12.21 | % | | N/A | | -3.45 | % | | 2.55 | % | | 2.50 | % |
| ICON Energy Fund - Class A | | 9/30/10 | | -28.11 | % | | -11.55 | % | | N/A | | -2.71 | % | | 1.75 | % | | 1.75 | % |
ICON Energy Fund - Class A
(including maximum sales charge of 5.75%) | | 9/30/10 | | -32.23 | % | | -12.59 | % | | N/A | | -3.35 | % | | 1.75 | % | | 1.75 | % |
| S&P 1500 Energy Index | | | | -22.38 | % | | -6.34 | % | | 2.60 | % | | 5.82 | % | | N/A | | N/A |
| S&P Composite 1500 Index | | | | 3.39 | % | | 10.69 | % | | 13.21 | % | | 7.63 | % | | N/A | | N/A |
Past performance is not a guarantee of future results.Information about these performance results and the comparative indexes can be found in the About This Report section. The Adviser has agreed to limit certain Fund expenses; without these limitations, returns would have been lower. The limitation provisions may be terminated in the future.
| * | Please see the most recent prospectus for details. |
Class C total returns exclude applicable sales charges. If sales charges were included returns would be lower.
Value of a $10,000 Investment(through September 30, 2019)
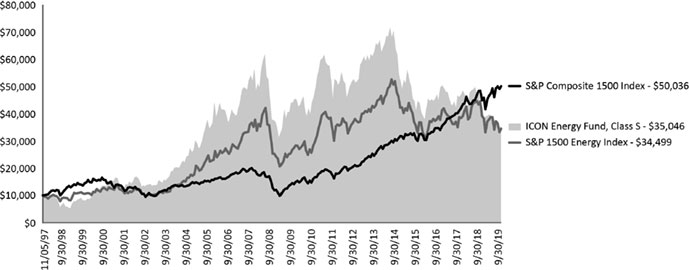
Past performance is not a guarantee of future results.The above graph compares a $10,000 investment made in the Fund’s Class S shares on the Class’ inception date of 11/5/97 to a $10,000 investment made in unmanaged securities indexes on that date. The Fund’s performance in this chart and the performance table assumes the reinvestment of dividends and capital gain distributions but does not reflect the deduction of taxes that a shareholder would pay on Fund distributions or on the redemption of Fund shares.
| ICON Energy Fund | Schedule of Investments |
September 30, 2019
| | | Shares or
Principal
Amount | | | Value | |
| Common Stocks (100.35%) |
| Commodity Chemicals (3.24%) |
| Cabot Corp. | | | 72,300 | | | $ | 3,276,636 | |
| | | | | | | | | |
| Industrial Machinery (1.97%) | | | | | | | | |
| Chart Industries, Inc.(a) | | | 31,900 | | | | 1,989,284 | |
| | | | | | | | | |
| Integrated Oil & Gas (29.44%) |
| Chevron Corp. | | | 145,800 | | | | 17,291,880 | |
| Exxon Mobil Corp. | | | 176,400 | | | | 12,455,604 | |
| | | | | | | | 29,747,484 | |
| Marine (3.43%) |
| Kirby Corp.(a) | | | 42,200 | | | | 3,467,152 | |
| | | | | | | | | |
| Oil & Gas Exploration & Production (27.83%) |
| Bonanza Creek Energy, Inc.(a) | | | 80,500 | | | | 1,802,395 | |
| Callon Petroleum Co.(a)(b) | | | 401,400 | | | | 1,742,076 | |
| Carrizo Oil & Gas, Inc.(a)(b) | | | 129,800 | | | | 1,114,333 | |
| Cimarex Energy Co. | | | 52,000 | | | | 2,492,880 | |
| ConocoPhillips | | | 57,000 | | | | 3,247,860 | |
| Diamondback Energy, Inc. | | | 62,161 | | | | 5,588,896 | |
| EOG Resources, Inc. | | | 68,400 | | | | 5,076,648 | |
| Matador Resources Co.(a)(b) | | | 65,300 | | | | 1,079,409 | |
| Parsley Energy, Inc., Class A | | | 160,700 | | | | 2,699,760 | |
| Pioneer Natural Resources Co. | | | 26,100 | | | | 3,282,597 | |
| | | | | | | | 28,126,854 | |
| Oil & Gas Refining & Marketing (16.59%) |
| HollyFrontier Corp. | | | 29,700 | | | | 1,593,108 | |
| Marathon Petroleum Corp. | | | 80,300 | | | | 4,878,225 | |
| Phillips 66 | | | 55,200 | | | | 5,652,480 | |
| Valero Energy Corp. | | | 54,400 | | | | 4,637,056 | |
| | | | | | | | 16,760,869 | |
| Oil & Gas Storage & Transportation (10.34%) |
| Magellan Midstream Partners LP | | | 48,300 | | | | 3,200,841 | |
| ONEOK, Inc. | | | 56,300 | | | | 4,148,747 | |
| Williams Cos., Inc. | | | 128,600 | | | | 3,094,116 | |
| | | | | | | | 10,443,704 | |
| Specialty Chemicals (3.38%) |
| WR Grace & Co. | | | 51,200 | | | | 3,418,112 | |
| | | | | | | | | |
| Steel (4.13%) |
| Carpenter Technology Corp. | | | 80,700 | | | | 4,168,962 | |
| | | | | | | | | |
Total Common Stocks
(Cost $111,565,504) | | | | | | | 101,399,057 | |
| | | Shares or
Principal
Amount | | | Value | |
| Collateral for Securities on Loan (0.25%) |
| State Street Navigator Securities Lending Government Money Market Portfolio, 7-Day Yield 2.09% | | | 255,037 | | | $ | 255,037 | |
| | | | | | | | | |
Total Collateral for Securities on Loan
(Cost $255,037) | | | | | | | 255,037 | |
| | | | | | | | | |
Total Investments (100.60%)
(Cost $111,820,541) | | | | | | $ | 101,654,094 | |
| | | | | | | | | |
| Liabilities Less Other Assets (-0.60%) | | | | | | | (612,201 | ) |
| | | | | | | | | |
| Net Assets (100.00%) | | | | | | $ | 101,041,893 | |
| (a) | Non-income producing security. |
| (b) | All or a portion of the security was on loan as of September 30, 2019. |
| Sector Composition(September 30, 2019) | | | | |
| | | | | |
| Energy | | | 84.20 | % |
| Materials | | | 10.75 | % |
| Industrials | | | 5.40 | % |
| | | | 100.35 | % |
Percentages are based upon common stocks as a percentage of net assets.
| Industry Composition(September 30, 2019) | | | | |
| Integrated Oil & Gas | | | 29.44 | % |
| Oil & Gas Exploration & Production | | | 27.83 | % |
| Oil & Gas Refining & Marketing | | | 16.59 | % |
| Oil & Gas Storage & Transportation | | | 10.34 | % |
| Steel | | | 4.13 | % |
| Marine | | | 3.43 | % |
| Specialty Chemicals | | | 3.38 | % |
| Commodity Chemicals | | | 3.24 | % |
| Industrial Machinery | | | 1.97 | % |
| | | | 100.35 | % |
Percentages are based upon common stocks as a percentage of net assets.
The accompanying notes are an integral part of the financial statements.
| Annual Report | September 30, 2019 | 13 |
| ICON Financial Fund | Management Overview |
September 30, 2019 (Unaudited)
| Q. | How did the Fund perform relative to its benchmarks? |
| A. | The ICON Financial Fund (the Fund) Class S returned -1.26% for the fiscal year ended September 30, 2019, while its sector-specific benchmark, the S&P 1500 Financial Index returned 3.40%. Total returns for other periods and additional Class shares as of September 30, 2019 appear in the subsequent pages of this Fund’s Management Overview. |
| Q. | What primary factors were behind the Fund’s relative performance? |
| A. | The fourth quarter of 2018 had the biggest impact on the Fund’s performance, with the Fund returning about -19.07% for the quarter compared to its benchmark’s return of -13.36%. We see this quarter as unusual, but it accounts for the majority of the Fund’s underperformance, due in large part to two industries – the life & health insurance and regional bank industries. The life & health insurance industry was overweight in the Fund by almost double the benchmark during the fourth quarter of 2018 and the industry had negative returns overall for the quarter. The regional banks industry was about equal weight in the Fund and the benchmark during this period, but the holdings in the Fund were down more than the benchmark. For the following three quarters of the fiscal year, the Fund outperformed its benchmark. During the last three quarters of the fiscal year, the Fund was overweight in two industries that were the primary contributors to outperformance – consumer finance and diversified banks. |
| Q. | How did the Fund’s composition affect performance? |
| A. | The Fund benefitted from its holdings in the consumer finance industry. The Fund was overweight consumer finance and had positive returns in the industry, and thus benefitted both from the holdings vs. that of its benchmark as well as its overweight position. Additionally, the Fund’s holdings in the multi-line insurance industry contributed positively to the Fund’s performance as its holdings in the industry were a similar weight to the benchmark’s industry weighting, but the Fund’s holdings outperformed the benchmark. |
The biggest detractors to Fund performance relative to the benchmark were the Fund’s exposures in life & health insurance and regional banks industries. The Fund’s holdings in life & health insurance had negative returns for the entire period, while the benchmark holdings in the same industry were positive. For regional banks, both holdings in the Fund and benchmark were negative, but the holdings within the Fund were down more.
| Q. | What is your investment outlook for the Financials sector? |
| A. | As of September 30, 2019, the Financials sector has a value-to-price (V/P) ratio of 1.19 according to the ICON valuation system, suggesting upside potential over the next year. We see several bargains within the sector at the industry level. For example, as we enter the new fiscal year our model shows value in the other diversified financial services industry, which has a V/P of 1.33. Most industries in the sector have good value, but at the beginning of the new fiscal year, the Fund is overweight the consumer finance, diversified banks, life & health insurance, investment banking & brokerage, and the thrifts & mortgage finance industries. As always, and guided by value, we will continue to look for opportunities in the Financials sector. |
| ICON Financial Fund | Management Overview |
September 30, 2019 (Unaudited)
Average Annual Total Return(as of September 30, 2019)
| | | Inception
Date | | 1 Year | | 5 Years | | 10 Years | | Since
Inception | | Gross Expense
Ratio* | | Net Expense
Ratio* |
| ICON Financial Fund - Class S | | 7/1/97 | | -1.26% | | 7.08% | | 6.98% | | 4.52% | | 1.44% | | 1.44% |
| ICON Financial Fund - Class A | | 9/30/10 | | -1.51% | | 6.76% | | N/A | | 8.07% | | 1.98% | | 1.75% |
ICON Financial Fund - Class A
(including maximum sales charge of 5.75%) | | 9/30/10 | | -7.17% | | 5.51% | | N/A | | 7.36% | | 1.98% | | 1.75% |
| S&P 1500 Financials Index | | | | 3.40% | | 10.79% | | 11.06% | | 5.60% | | N/A | | N/A |
| S&P Composite 1500 Index | | | | 3.39% | | 10.69% | | 13.21% | | 7.85% | | N/A | | N/A |
Past performance is not a guarantee of future results. Information about these performance results and the comparative indexes can be found in the About This Report section. The Adviser has agreed to limit certain Fund expenses; without these limitations, returns would have been lower. The limitation provisions may be terminated in the future.
| * | Please see the most recent prospectus for details. |
Value of a $10,000 Investment(through September 30, 2019)
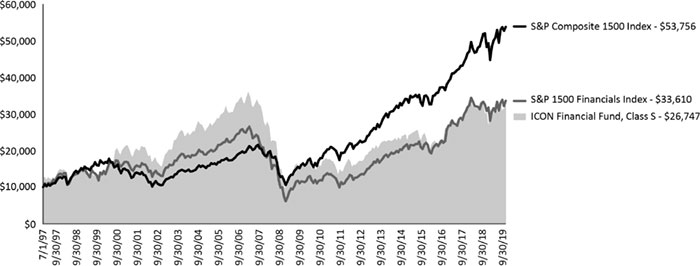
Past performance is not a guarantee of future results. The above graph compares a $10,000 investment made in the Fund’s Class S shares on the Class’ inception date of 7/1/97 to a $10,000 investment made in unmanaged securities indexes on that date. The Fund’s performance in this chart and the performance table assumes the reinvestment of dividends and capital gain distributions but does not reflect the deduction of taxes that a shareholder would pay on Fund distributions or on the redemption of Fund shares.
| Annual Report | September 30, 2019 | 15 |
| ICON Financial Fund | Schedule of Investments |
September 30, 2019
| | | Shares or
Principal
Amount | | | Value | |
| Common Stocks (100.04%) | | | | | | | |
| Consumer Finance (14.24%) | | | | | | | |
| Ally Financial, Inc. | | 21,700 | | | $ | 719,572 | |
| American Express Co. | | 10,700 | | | | 1,265,596 | |
| Capital One Financial Corp. | | 4,100 | | | | 373,018 | |
| Discover Financial Services | | 16,298 | | | | 1,321,605 | |
| Encore Capital Group, Inc.(a)(b) | | 21,900 | | | | 729,817 | |
| Navient Corp. | | 56,900 | | | | 728,320 | |
| | | | | | | 5,137,928 | |
| Data Processing & Outsourced Services (10.59%) | |
| Euronet Worldwide, Inc.(a) | | 4,700 | | | | 687,610 | |
| Global Payments, Inc. | | 5,200 | | | | 826,800 | |
| Mastercard, Inc., Class A | | 4,300 | | | | 1,167,751 | |
| Visa, Inc., Class A | | 6,600 | | | | 1,135,266 | |
| | | | | | | 3,817,427 | |
| Diversified Banks (41.66%) | | | | | | | |
| Bank of America Corp. | | 143,900 | | | | 4,197,563 | |
| Citigroup, Inc. | | 44,100 | | | | 3,046,428 | |
| JPMorgan Chase & Co. | | 41,200 | | | | 4,848,828 | |
| U.S. Bancorp | | 36,300 | | | | 2,008,842 | |
| Wells Fargo & Co. | | 18,300 | | | | 923,052 | |
| | | | | | | 15,024,713 | |
| Investment Banking & Brokerage (5.97%) | | | | | | | |
| Goldman Sachs Group, Inc. | | 4,400 | | | | 911,812 | |
| Morgan Stanley | | 29,100 | | | | 1,241,697 | |
| | | | | | | 2,153,509 | |
| Life & Health Insurance (7.66%) | | | | | | | |
| Athene Holding, Ltd., Class A(a) | | 9,000 | | | | 378,540 | |
| CNO Financial Group, Inc. | | 55,200 | | | | 873,816 | |
| Lincoln National Corp. | | 15,500 | | | | 934,960 | |
| Prudential Financial, Inc. | | 6,400 | | | | 575,680 | |
| | | | | | | 2,762,996 | |
| Multi-line Insurance (4.05%) | | | | | | | |
| Assurant, Inc. | | 4,400 | | | | 553,608 | |
| Hartford Financial Services Group, Inc. | | 15,000 | | | | 909,150 | |
| | | | | | | 1,462,758 | |
| Other Diversified Financial Services (3.49%) | | | | | | | |
| Voya Financial, Inc. | | 23,100 | | | | 1,257,564 | |
| | | | | | | | |
| Property & Casualty Insurance (2.74%) | | | | | | | |
| Arch Capital Group, Ltd.(a) | | 23,500 | | | | 986,530 | |
| | | | | | | | |
| Regional Banks (5.50%) | | | | | | | |
| Citizens Financial Group, Inc. | | 10,600 | | | | 374,922 | |
| East West Bancorp, Inc. | | 14,100 | | | | 624,489 | |
| KeyCorp | | 21,900 | | | | 390,696 | |
| Synovus Financial Corp. | | 16,600 | | | | 593,616 | |
| | | | | | | 1,983,723 | |
| Thrifts & Mortgage Finance (4.14%) | | | | | | | |
| Axos Financial, Inc.(a) | | 27,600 | | | | 763,140 | |
| | | Shares or
Principal
Amount | | | Value | |
| Thrifts & Mortgage Finance (continued) | | | | | | | |
| Essent Group, Ltd. | | 15,300 | | | $ | 729,351 | |
| | | | | | | 1,492,491 | |
Total Common Stocks
(Cost $29,564,126) | | | | | | 36,079,639 | |
| | | | | | | | |
Total Investments (100.04%)
(Cost $29,564,126) | | | | | $ | 36,079,639 | |
| | | | | | | | |
| Liabilities Less Other Assets (-0.04%) | | | | | | (14,539 | ) |
| | | | | | | | |
| Net Assets (100.00%) | | | | | $ | 36,065,100 | |
| (a) | Non-income producing security. |
| (b) | All or a portion of the security was on loan as of September 30, 2019. |
| Sector Composition(September 30, 2019) | | |
| | | |
| Financials | | 89.45% |
| Information Technology | | 10.59% |
| | | 100.04% |
Percentages are based upon common stocks as a percentage of net assets.
| Industry Composition(September 30, 2019) | | |
| | | |
| Diversified Banks | | 41.66% |
| Consumer Finance | | 14.24% |
| Data Processing & Outsourced Services | | 10.59% |
| Life & Health Insurance | | 7.66% |
| Investment Banking & Brokerage | | 5.97% |
| Regional Banks | | 5.50% |
| Thrifts & Mortgage Finance | | 4.14% |
| Multi-line Insurance | | 4.05% |
| Other Diversified Financial Services | | 3.49% |
| Property & Casualty Insurance | | 2.74% |
| | | 100.04% |
Percentages are based upon common stocks as a percentage of net assets.
The accompanying notes are an integral part of the financial statements.
| ICON Healthcare Fund | Management Overview |
September 30, 2019 (Unaudited)
| Q. | How did the Fund perform relative to its benchmark? |
| A. | The ICON Healthcare Fund (the Fund) Class S returned -15.83% for the fiscal year ended September 30, 2019, while its benchmark, the S&P 1500 Health Care Index, returned -4.33%. Total returns for other periods and additional Class shares as of September 30, 2019, appear in the subsequent pages of this Fund’s Management Overview. |
| Q. | What primary factors were behind the Fund’s relative performance? |
| A. | Markets began the fiscal year with sharp declines during the fourth quarter of 2018 over continued trade war concerns and overall declining global growth. During this quarter, the broad market S&P 1500 Index dropped over 13.5% over the 3 month period. Throughout the remaining 3 quarters of the fiscal year, markets recovered swiftly, however the Health Care sector was not a strong participant in this rally. The S&P 1500 Index returned about 20.55% over the last three quarters of the fiscal year, whereas the S&P 1500 Health Care Index only returned 5.83%, making it the second worst performing sector over the period. |
| | The Fund’s relative performance was most negatively attributed to its overweight position in the managed health care and life & health insurance industries. Both industries came under great scrutiny and uncertainty as they became heated debate topics during political primary campaign season. The S&P 1500 Managed Health Care Index, an index designed to track the performance of the managed health care industry, declined -18.83% over the entire fiscal year, and the Fund’s overweight within that industry caused the lag relative to the overall Health Care sector benchmark. |
| Q. | How did the Fund’s composition affect performance? |
| A. | The three biggest contributors to Fund performance were Zoetis Inc., Merck & Co., and Thermo Fischer Scientific. Zoetis and Merck, both pharmaceutical companies, defied the otherwise negative overall performance of their industry index with strong quarterly earnings reports and forward guidance upgrades throughout the year. Thermo Fischer Scientific participated in (and greatly outperformed) a positive year of growth in the life sciences industry, during a year that otherwise saw negative returns for the health care sector. All three remained in the portfolio as of September 30, 2019. |
| | The three stocks that detracted the most from Fund performance were Amneal Pharmaceuticals, Supernus Pharamaceuticals, and Centene Corporation. It can be noted that two-of-the-three top detractors and two-of-the-three top contributors are all in the pharmaceutical industry, an industry that can often see sharp upward/downward price movements based on firm-specific developments and news events. Overall, returns were negative in the pharmaceutical industry for the fiscal year ended September 30, 2019. |
| Q. | What is your investment outlook for the overall market? |
| A. | As of September 30, 2019, ICON’s valuation model shows a value-to-price (V/P) ratio of 1.16 for the Health Care sector. In other words, we believe stock prices, on average, are below our estimate of fair value. While there is potential for increased volatility in the coming election year with health care remaining a heated topic, we still find plenty of value within the health care sector. The Fund is positioned going into the new fiscal year with its largest weighting in the pharmaceuticals industry and almost double the sector benchmark weight in the health care services industry. |
| Annual Report | September 30, 2019 | 17 |
| ICON Healthcare Fund | Management Overview |
September 30, 2019 (Unaudited)
Average Annual Total Return(as of September 30, 2019)
| | | Inception
Date | | 1 Year | | 5 Years | | 10 Years | | Since
Inception | | Gross Expense
Ratio* | | Net Expense
Ratio* |
| ICON Healthcare Fund - Class S | | 2/24/97 | | -15.83% | | | 4.85% | | | 12.12% | | 9.60% | | | 1.45% | | 1.45% |
| ICON Healthcare Fund - Class A | | 9/30/10 | | -16.05% | | | 4.53% | | | N/A | | 12.52% | | | 1.86% | | 1.75% |
ICON Healthcare Fund - Class A
(including maximum sales charge of 5.75%) | | 9/30/10 | | -20.90% | | | 3.30% | | | N/A | | 11.78% | | | 1.86% | | 1.75% |
| S&P 1500 Health Care Index | | | | -4.33% | | | 9.43% | | | 14.62% | | 9.46% | | | N/A | | N/A |
| S&P Composite 1500 Index | | | | 3.39% | | | 10.69% | | | 13.21% | | 8.21% | | | N/A | | N/A |
Past performance is not a guarantee of future results. Information about these performance results and the comparative indexes can be found in the About This Report section. The Adviser has agreed to limit certain Fund expenses; without these limitations, returns would have been lower. The limitation provisions may be terminated in the future.
| * | Please see the most recent prospectus for details. |
Value of a $10,000 Investment(through September 30, 2019)
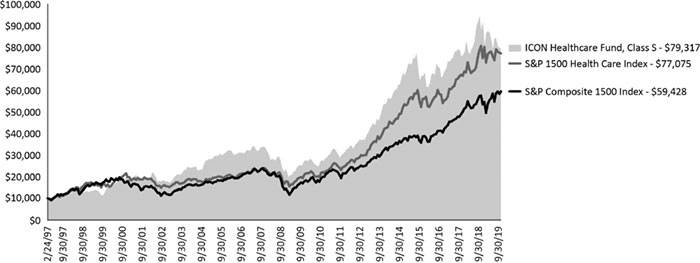
Past performance is not a guarantee of future results. The above graph compares a $10,000 investment made in the Fund’s Class S shares on the Class’ inception date of 2/24/97 to a $10,000 investment made in unmanaged securities indexes on that date. The Fund’s performance in this chart and the performance table assumes the reinvestment of dividends and capital gain distributions but does not reflect the deduction of taxes that a shareholder would pay on Fund distributions or on the redemption of Fund shares.
| ICON Healthcare Fund | Schedule of Investments |
September 30, 2019
| | | Shares or
Principal
Amount | | | Value | |
| Common Stocks (99.84%) | | | | | | | |
| Biotechnology (6.44%) | | | | | | | |
| AbbVie, Inc. | | 21,600 | | | $ | 1,635,552 | |
| Alexion Pharmaceuticals, Inc.(a) | | 12,281 | | | | 1,202,801 | |
| Regeneron Pharmaceuticals, Inc.(a) | | 3,000 | | | | 832,200 | |
| | | | | | | 3,670,553 | |
| Health Care Equipment (5.97%) | | | | | | | |
| Becton Dickinson and Co. | | 5,931 | | | | 1,500,306 | |
| Edwards Lifesciences Corp.(a) | | 3,700 | | | | 813,667 | |
| Teleflex, Inc. | | 3,200 | | | | 1,087,200 | |
| | | | | | | 3,401,173 | |
| Health Care Services (8.78%) | | | | | | | |
| Cigna Corp. | | 16,278 | | | | 2,470,838 | |
| DaVita, Inc.(a) | | 10,300 | | | | 587,821 | |
| MEDNAX, Inc.(a) | | 33,600 | | | | 760,032 | |
| Premier, Inc., Class A(a) | | 41,132 | | | | 1,189,537 | |
| | | | | | | 5,008,228 | |
| Life & Health Insurance (6.37%) | | | | | | | |
| CNO Financial Group, Inc. | | 62,200 | | | | 984,626 | |
| Lincoln National Corp. | | 24,500 | | | | 1,477,840 | |
| Prudential Financial, Inc. | | 13,000 | | | | 1,169,350 | |
| | | | | | | 3,631,816 | |
| Life Sciences Tools & Services (12.80%) | | | | | | | |
| IQVIA Holdings, Inc.(a) | | 10,538 | | | | 1,574,166 | |
| PerkinElmer, Inc. | | 15,100 | | | | 1,286,067 | |
| PRA Health Sciences, Inc.(a) | | 15,100 | | | | 1,498,373 | |
| Thermo Fisher Scientific, Inc. | | 10,082 | | | | 2,936,584 | |
| | | | | | | 7,295,190 | |
| Managed Health Care (22.82%) | | | | | | | |
| Anthem, Inc. | | 9,100 | | | | 2,184,910 | |
| Centene Corp.(a) | | 44,822 | | | | 1,939,000 | |
| HealthEquity, Inc.(a) | | 18,400 | | | | 1,051,468 | |
| Humana, Inc. | | 6,000 | | | | 1,534,020 | |
| UnitedHealth Group, Inc. | | 20,300 | | | | 4,411,596 | |
| WellCare Health Plans, Inc.(a) | | 7,301 | | | | 1,892,200 | |
| | | | | | | 13,013,194 | |
| Pharmaceuticals (36.66%) | | | | | | | |
| Allergan PLC | | 12,200 | | | | 2,053,138 | |
| Bristol-Myers Squibb Co. | | 40,893 | | | | 2,073,684 | |
| Corcept Therapeutics, Inc.(a)(b) | | 62,000 | | | | 876,370 | |
| Eli Lilly & Co. | | 33,100 | | | | 3,701,573 | |
| Jazz Pharmaceuticals PLC(a) | | 14,362 | | | | 1,840,347 | |
| Merck & Co., Inc. | | 56,588 | | | | 4,763,578 | |
| Mylan NV(a) | | 56,000 | | | | 1,107,680 | |
| Supernus Pharmaceuticals, Inc.(a) | | 52,774 | | | | 1,450,229 | |
| Zoetis, Inc. | | 24,388 | | | | 3,038,501 | |
| | | | | | | 20,905,100 | |
| | | | | | | | |
Total Common Stocks
(Cost $54,692,864) | | | | | | 56,925,254 | |
| | |
Value | |
Total Investments (99.84%)
(Cost $54,692,864) | | $ | 56,925,254 | |
| | | | | |
| Other Assets Less Liabilities (0.16%) | | | 89,602 | |
| | | | | |
| Net Assets (100.00%) | | $ | 57,014,856 | |
| (a) | Non-income producing security. |
| (b) | All or a portion of the security was on loan as of September 30, 2019. |
| Sector Composition(September 30, 2019) | | |
| | | |
| Health Care | | 93.47% |
| Financials | | 6.37% |
| | | 99.84% |
Percentages are based upon common stocks as a percentage of net assets.
| Industry Composition(September 30, 2019) | | |
| | | |
| Pharmaceuticals | | 36.66% |
| Managed Health Care | | 22.82% |
| Life Sciences Tools & Services | | 12.80% |
| Health Care Services | | 8.78% |
| Biotechnology | | 6.44% |
| Life & Health Insurance | | 6.37% |
| Health Care Equipment | | 5.97% |
| | | 99.84% |
Percentages are based upon common stocks as a percentage of net assets.
The accompanying notes are an integral part of the financial statements.
| Annual Report | September 30, 2019 | 19 |
| ICON Industrials Fund | Management Overview |
September 30, 2019 (Unaudited)
| Q. | How did the Fund perform relative to its benchmark? |
| A. | The ICON Industrials Fund (the Fund) Class S returned 2.26% for the fiscal year ended September 30, 2019, while its sector-specific benchmark, the S&P 1500 Industrials Index, returned 0.78% and the broad market S&P 1500 Index returned 3.39%. Total returns for other periods and additional Class shares as of September 30, 2019, appear in the subsequent pages of this Fund’s Management Overview. |
| Q. | What primary factors were behind the Fund’s relative performance? |
| A. | During the fourth quarter of 2018, the Fund returned about -19.70% compared to its benchmark’s returns of about -17.75%. Despite the Fund’s underperformance during the fourth quarter of 2018, the Fund was able to outperform the benchmark over the next three quarters, ultimately leading to the Fund outperforming its benchmark for the fiscal year. During the downturn in the fourth quarter of 2018, two industries accounted for the majority of the Fund’s underperformance. The trading companies & distributors and oil & gas exploration & production industries were the two significant underperformers for the Fund. Both industries were overweight during the period and had negative returns in both the Fund and the benchmark, thus the Fund performance was adversely affected vs. the benchmark. |
| Q. | How did the Fund’s composition affect performance? |
| A. | Two positive contributions to Fund performance during fiscal year 2019 included an overweight position in the construction & engineering industry, and a close to equal weighted position in construction machinery & heavy trucks. In both of these industries, the Fund’s holdings had significant positive returns, while the benchmark industries had negative returns. |
| | As discussed above, Fund performance was primarily adversely impacted by performance in the oil & gas exploration & production industry. Additionally, the Fund held overweight positions in the air freight & logistics and trading companies & distributors industries. Both of these industries had negative returns, which adversely affected Fund performance. |
| Q. | What is your investment outlook for Industrials? |
| A. | At the end of fiscal year 2019, the average value to price (V/P) ratio in the Industrials sector was 1.18, implying stocks within the sector are currently priced about 18% below ICON’s estimate of their intrinsic value. Two of the industries where we see the most value are the air freight & logistics and construction machinery & heavy trucks industries. Heading into the new fiscal year, the Fund is overweight both industries. As always, we look to value as our primary guide and will adjust our positioning as market conditions dictate. |
| ICON Industrials Fund | Management Overview |
September 30, 2019 (Unaudited)
Average Annual Total Return(as of September 30, 2019)
| | Inception
Date | 1 Year | 5 Years | 10 Years | Since
Inception | Gross Expense
Ratio* | Net Expense
Ratio* |
| ICON Industrials Fund - Class S | 5/9/97 | 2.26% | 6.34% | 10.19% | 5.63% | 1.80% | 1.50% |
| ICON Industrials Fund - Class A | 9/30/10 | 2.03% | 6.11% | N/A | 8.77% | 2.32% | 1.75% |
| ICON Industrials Fund - Class A (including maximum sales charge of 5.75%) | 9/30/10 | -3.83% | 4.86% | N/A | 8.05% | 2.32% | 1.75% |
| S&P 1500 Industrials Index | | 0.78% | 9.89% | 13.58% | 8.33% | N/A | N/A |
| S&P Composite 1500 Index | | 3.39% | 10.69% | 13.21% | 8.19% | N/A | N/A |
Past performance is not a guarantee of future results.Information about these performance results and the comparative indexes can be found in the About This Report section. The Adviser has agreed to limit certain Fund expenses; without these limitations, returns would have been lower. The limitation provisions may be terminated in the future.
| * | Please see the most recent prospectus for details. |
Value of a $10,000 Investment(through September 30, 2019)
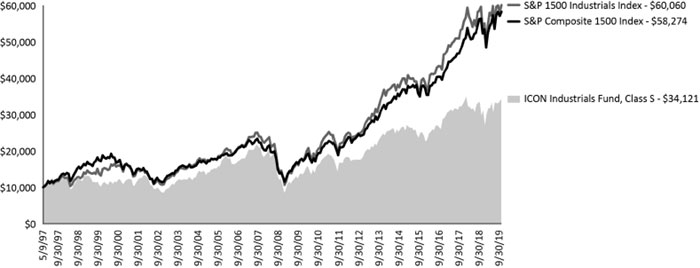
Past performance is not a guarantee of future results.The above graph compares a $10,000 investment made in the Fund’s Class S shares on the Class’ inception date of 5/9/97 to a $10,000 investment made in unmanaged securities indexes on that date. The Fund’s performance in this chart and the performance table assumes the reinvestment of dividends and capital gain distributions but does not reflect the deduction of taxes that a shareholder would pay on Fund distributions or on the redemption of Fund shares.
| Annual Report | September 30, 2019 | 21 |
| ICON Industrials Fund | Schedule of Investments |
September 30, 2019
| | | Shares or
Principal
Amount | | | Value | |
| Common Stocks (99.45%) | | | | | | | | |
| Aerospace & Defense (30.68%) | | | | | | | | |
| Boeing Co. | | | 980 | | | $ | 372,861 | |
| Curtiss-Wright Corp. | | | 2,900 | | | | 375,173 | |
| Lockheed Martin Corp. | | | 1,850 | | | | 721,611 | |
| Northrop Grumman Corp. | | | 2,200 | | | | 824,538 | |
| Raytheon Co. | | | 3,250 | | | | 637,618 | |
| Spirit AeroSystems Holdings, Inc., Class A | | | 6,000 | | | | 493,440 | |
| Textron, Inc. | | | 6,400 | | | | 313,344 | |
| | | | | | | | 3,738,585 | |
| Air Freight & Logistics (6.54%) | | | | | | | | |
| FedEx Corp. | | | 900 | | | | 131,013 | |
| Forward Air Corp. | | | 4,600 | | | | 293,112 | |
| United Parcel Service, Inc., Class B | | | 3,100 | | | | 371,442 | |
| | | | | | | | 795,567 | |
| Building Products (17.49%) | | | | | | | | |
| AO Smith Corp. | | | 8,000 | | | | 381,680 | |
| Armstrong World Industries, Inc. | | | 4,000 | | | | 386,800 | |
| Fortune Brands Home & Security, Inc. | | | 7,100 | | | | 388,370 | |
| Masco Corp. | | | 13,000 | | | | 541,840 | |
| PGT Innovations, Inc.(a) | | | 25,000 | | | | 431,750 | |
| | | | | | | | 2,130,440 | |
| Construction & Engineering (7.53%) | | | | | | | | |
| Jacobs Engineering Group, Inc. | | | 4,000 | | | | 366,000 | |
| MasTec, Inc.(a) | | | 8,500 | | | | 551,905 | |
| | | | | | | | 917,905 | |
| Construction Machinery & Heavy Trucks (5.60%) | | | | | | | | |
| Allison Transmission Holdings, Inc. | | | 5,000 | | | | 235,250 | |
| Cummins, Inc. | | | 2,750 | | | | 447,342 | |
| | | | | | | | 682,592 | |
| Electrical Components & Equipment (3.07%) | | | | | | | | |
| Eaton Corp. PLC | | | 4,500 | | | | 374,175 | |
| | | | | | | | | |
| Industrial Machinery (3.97%) | | | | | | | | |
| Altra Industrial Motion Corp. | | | 11,000 | | | | 304,645 | |
| Ingersoll-Rand PLC | | | 1,450 | | | | 178,655 | |
| | | | | | | | 483,300 | |
| Railroads (16.19%) | | | | | | | | |
| Canadian Pacific Railway, Ltd. | | | 2,500 | | | | 556,150 | |
| CSX Corp. | | | 6,850 | | | | 474,499 | |
| Kansas City Southern | | | 4,400 | | | | 585,244 | |
| Union Pacific Corp. | | | 2,200 | | | | 356,356 | |
| | | | | | | | 1,972,249 | |
| Trading Companies & Distributors (8.38%) | | | | | | | | |
| Air Lease Corp. | | | 12,906 | | | | 539,729 | |
| Herc Holdings, Inc.(a) | | | 3,900 | | | | 181,389 | |
| | | Shares or
Principal
Amount | | | Value | |
| Trading Companies & Distributors (continued) | | | | | | | | |
| United Rentals, Inc.(a) | | | 2,400 | | | $ | 299,136 | |
| | | | | | | | 1,020,254 | |
| Total Common Stocks | | | | | | | | |
| (Cost $10,224,385) | | | | | | | 12,115,067 | |
| | | | | | | | | |
| Total Investments (99.45%) | | | | | | | | |
| (Cost $10,224,385) | | | | | | $ | 12,115,067 | |
| | | | | | | | | |
| Other Assets Less Liabilities (0.55%) | | | | | | | 66,942 | |
| | | | | | | | | |
| Net Assets (100.00%) | | | | | | $ | 12,182,009 | |
| (a) | Non-income producing security. |
Sector Composition(September 30, 2019)
| Industrials | | | 99.45 | % |
| | | | 99.45 | % |
Percentages are based upon common stocks as a percentage of net assets.
Industry Composition(September 30, 2019)
| Aerospace & Defense | | | 30.68 | % |
| Building Products | | | 17.49 | % |
| Railroads | | | 16.19 | % |
| Trading Companies & Distributors | | | 8.38 | % |
| Construction & Engineering | | | 7.53 | % |
| Air Freight & Logistics | | | 6.54 | % |
| Construction Machinery & Heavy Trucks | | | 5.60 | % |
| Industrial Machinery | | | 3.97 | % |
| Electrical Components & Equipment | | | 3.07 | % |
| | | | 99.45 | % |
Percentages are based upon common stocks as a percentage of net assets.
The accompanying notes are an integral part of the financial statements.
| ICON Information Technology Fund | Management Overview |
September 30, 2019 (Unaudited)
| Q. | How did the Fund perform relative to its benchmarks? |
| A. | The ICON Information Technology Fund (the Fund) Class S returned 5.12% for the fiscal year ended September 30, 2019, lagging its sectorspecific benchmark, the S&P 1500 Information Technology Index, which returned 8.39%. Total returns for other periods and additional Class shares as of September 30, 2019, appear in the subsequent pages of this Fund’s Management Overview. |
| Q. | What primary factors were behind the Fund’s relative performance? |
| A. | During the Fourth quarter of 2018, the Fund returned about -17.66% compared to its benchmark return of about -17.33%. This unusual quarter started off the fiscal year with the Fund trailing its benchmark slightly and both the Fund and the benchmark entered the remaining three quarters of the fiscal year with negative returns to overcome. While both the Fund and its benchmark had positive returns the remaining three quarters of the fiscal year and overcame the negative start, the Fund did not keep pace with its benchmark. From January 1, 2019 through the end of the fiscal year, the industries within the sector with the highest returns in the Information Technology sector were the semiconductor equipment and technology hardware, storage, & peripherals industries. |
| Q. | How did the Fund’s composition affect performance? |
| A. | Through the entire fiscal year, the Fund’s holdings in the data processing & outsourced services and systems software industries were the two biggest detractors from the Fund’s performance relative to the benchmark. The data processing & outsourced services industry was slightly overweight in the Fund compared to the benchmark, however the holdings in the Fund returned about half that of the benchmark. The systems software industry was underweight the benchmark by almost a third and this industry had better than average returns, so the underweighting hurt the Fund’s relative performance. The Fund did benefit from its holdings in the semiconductors industry. The semiconductors industry in the Fund was underweight the benchmark, but the Fund’s holdings returned more than the benchmark resulting in positive relative performance. |
| Q. | What is your investment outlook for the Information Technology sector? |
| A. | At the end of fiscal year 2019, the average value to price (V/P) ratio with the Information Technology sector was 1.18, implying stocks within the sector were trading 18% below ICON’s estimate of their intrinsic value. Two of the industries in the Information Technology sector where we see the most value are the semiconductor equipment and technology distributors industries. To start the new fiscal year, the Fund is overweight both industries. As always, we look to value as our primary guide and will adjust our positioning as market conditions dictate. |
| Annual Report | September 30, 2019 | 23 |
| ICON Information Technology Fund | Management Overview |
September 30, 2019 (Unaudited)
Average Annual Total Return(as of September 30, 2019)
| | Inception
Date | 1 Year | 5 Years | 10 Years | Since
Inception | Gross Expense
Ratio* | Net Expense
Ratio* |
| ICON Information Technology Fund - Class S | 2/19/97 | 5.12% | 15.06% | 13.44% | 9.58% | 1.41% | 1.41% |
| ICON Information Technology Fund - Class A | 9/30/10 | 4.79% | 14.71% | N/A | 14.13% | 2.00% | 1.75% |
| ICON Information Technology Fund - Class A (including maximum sales charge of 5.75%) | 9/30/10 | -1.24% | 13.36% | N/A | 13.38% | 2.00% | 1.75% |
| S&P 1500 Information Technology Index | | 8.39% | 18.00% | 16.89% | 9.66% | N/A | N/A |
| NASDAQ Composite Index | | 0.57% | 12.64% | 14.40% | 8.22% | N/A | N/A |
| S&P Composite 1500 Index | | 3.39% | 10.69% | 13.21% | 8.18% | N/A | N/A |
Past performance is not a guarantee of future results.Information about these performance results and the comparative indexes can be found in the About This Report section. The Adviser has agreed to limit certain Fund expenses; without these limitations, returns would have been lower. The limitation provisions may be terminated in the future.
| * | Please see the most recent prospectus for details. |
Value of a $10,000 Investment(through September 30, 2019)
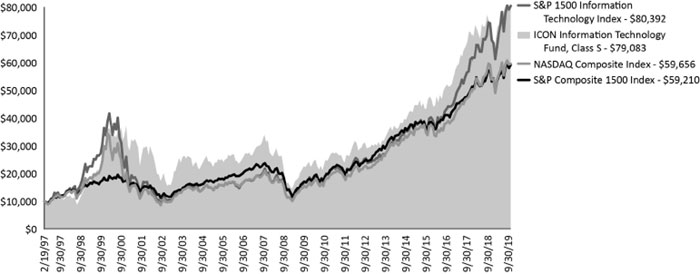
Past performance is not a guarantee of future results.The above graph compares a $10,000 investment made in the Fund’s Class S shares on the Class’ inception date of 2/19/97 to a $10,000 investment made in unmanaged securities indexes on that date. The Fund’s performance in this chart and the performance table assumes the reinvestment of dividends and capital gain distributions but does not reflect the deduction of taxes that a shareholder would pay on Fund distributions or on the redemption of Fund shares.
| ICON Information Technology Fund | Schedule of Investments |
September 30, 2019
| | | Shares or
Principal
Amount | | | Value | |
| Common Stocks (99.89%) | | | | | | | | |
| Aerospace & Defense (4.56%) | | | | | | | | |
| Lockheed Martin Corp. | | | 4,300 | | | $ | 1,677,258 | |
| Northrop Grumman Corp. | | | 2,300 | | | | 862,017 | |
| | | | | | | | 2,539,275 | |
| Application Software (7.89%) | | | | | | | | |
| Adobe, Inc.(a) | | | 10,100 | | | | 2,790,125 | |
| CDK Global, Inc. | | | 11,700 | | | | 562,653 | |
| Globant SA(a) | | | 11,400 | | | | 1,044,012 | |
| | | | | | | | 4,396,790 | |
| Communications Equipment (2.79%) | | | | | | | | |
| Cisco Systems, Inc. | | | 31,500 | | | | 1,556,415 | |
| | | | | | | | | |
| Data Processing & Outsourced Services (27.85%) | | | | | | | | |
| Alliance Data Systems Corp. | | | 8,300 | | | | 1,063,479 | |
| Automatic Data Processing, Inc. | | | 12,700 | | | | 2,050,034 | |
| Euronet Worldwide, Inc.(a) | | | 13,700 | | | | 2,004,310 | |
| Genpact, Ltd. | | | 16,100 | | | | 623,875 | |
| Global Payments, Inc. | | | 24,693 | | | | 3,926,238 | |
| Mastercard, Inc., Class A | | | 9,500 | | | | 2,579,915 | |
| Visa, Inc., Class A | | | 18,980 | | | | 3,264,750 | |
| | | | | | | | 15,512,601 | |
| Electrical Components & Equipment (3.67%) | | | | | | | | |
| Eaton Corp. PLC | | | 12,300 | | | | 1,022,745 | |
| Hubbell, Inc. | | | 7,800 | | | | 1,024,920 | |
| | | | | | | | 2,047,665 | |
| Electronic Components (3.87%) | | | | | | | | |
| II-VI, Inc.(a)(b) | | | 61,200 | | | | 2,154,852 | |
| | | | | | | | | |
| Electronic Manufacturing Services (2.39%) | | | | | | | | |
| TE Connectivity, Ltd. | | | 14,300 | | | | 1,332,474 | |
| | | | | | | | | |
| Internet & Direct Marketing Retail (3.43%) | | | | | | | | |
| Amazon.com, Inc.(a) | | | 1,100 | | | | 1,909,501 | |
| | | | | | | | | |
| IT Consulting & Other Services (12.48%) | | | | | | | | |
| Booz Allen Hamilton Holding Corp. | | | 33,500 | | | | 2,379,170 | |
| Cognizant Technology Solutions Corp., Class A | | | 18,700 | | | | 1,126,955 | |
| EPAM Systems, Inc.(a) | | | 7,600 | | | | 1,385,632 | |
| Perficient, Inc.(a) | | | 53,500 | | | | 2,064,030 | |
| | | | | | | | 6,955,787 | |
| Semiconductor Equipment (0.72%) | | | | | | | | |
| Applied Materials, Inc. | | | 8,100 | | | | 404,190 | |
| | | | | | | | | |
| Semiconductors (6.79%) | | | | | | | | |
| Diodes, Inc.(a) | | | 14,600 | | | | 586,190 | |
| Intel Corp. | | | 18,400 | | | | 948,152 | |
| NXP Semiconductors NV | | | 10,800 | | | | 1,178,496 | |
| Skyworks Solutions, Inc. | | | 13,600 | | | | 1,077,800 | |
| | | | | | | | 3,790,638 | |
| Systems Software (12.46%) | | | | | | | | |
| Microsoft Corp. | | | 44,100 | | | | 6,131,223 | |
| | | Shares or
Principal
Amount | | | Value | |
| Systems Software (continued) | | | | | | | | |
| ServiceNow, Inc.(a) | | | 3,200 | | | $ | 812,320 | |
| | | | | | | | 6,943,543 | |
| Technology Distributors (2.61%) | | | | | | | | |
| SYNNEX Corp. | | | 12,900 | | | | 1,456,410 | |
| | | | | | | | | |
| Technology Hardware, Storage & Peripherals (8.38%) | | | | | | | | |
| Apple, Inc. | | | 18,600 | | | | 4,165,842 | |
| Super Micro Computer, Inc.(a) | | | 26,100 | | | | 501,120 | |
| | | | | | | | 4,666,962 | |
| Total Common Stocks | | | | | | | | |
| (Cost $44,080,950) | | | | | | | 55,667,103 | |
| | | | | | | | | |
| Total Investments (99.89%) | | | | | | | | |
| (Cost $44,080,950) | | | | | | $ | 55,667,103 | |
| | | | | | | | | |
| Other Assets Less Liabilities (0.11%) | | | | | | | 58,829 | |
| | | | | | | | | |
| Net Assets (100.00%) | | | | | | $ | 55,725,932 | |
| (a) | Non-income producing security. |
| (b) | All or a portion of the security was on loan as of September 30, 2019. |
Sector Composition(September 30, 2019)
| Information Technology | | | 88.23 | % |
| Industrials | | | 8.23 | % |
| Consumer Discretionary | | | 3.43 | % |
| | | | 99.89 | % |
Percentages are based upon common stocks as a percentage of net assets.
The accompanying notes are an integral part of the financial statements.
| Annual Report | September 30, 2019 | 25 |
| ICON Information Technology Fund | Schedule of Investments |
September 30, 2019
Industry Composition(September 30, 2019)
| Data Processing & Outsourced Services | | | 27.85 | % |
| IT Consulting & Other Services | | | 12.48 | % |
| Systems Software | | | 12.46 | % |
| Technology Hardware, Storage & Peripherals | | | 8.38 | % |
| Application Software | | | 7.89 | % |
| Semiconductors | | | 6.79 | % |
| Aerospace & Defense | | | 4.56 | % |
| Electronic Components | | | 3.87 | % |
| Electrical Components & Equipment | | | 3.67 | % |
| Internet & Direct Marketing Retail | | | 3.43 | % |
| Communications Equipment | | | 2.79 | % |
| Technology Distributors | | | 2.61 | % |
| Electronic Manufacturing Services | | | 2.39 | % |
| Semiconductor Equipment | | | 0.72 | % |
| | | | 99.89 | % |
Percentages are based upon common stocks as a percentage of net assets.
The accompanying notes are an integral part of the financial statements.
| ICON Natural Resources Fund | Management Overview |
September 30, 2019 (Unaudited)
| Q. | How did the Fund perform relative to its benchmark? |
| A. | The ICON Natural Resources Fund (the Fund) Class S returned -7.69% for the fiscal year ended September 30, 2019, while its benchmark, the S&P 1500 Index returned 3.39%. Total returns for other periods and additional Class shares as of September 30, 2019, appear in the subsequent pages of this Fund’s Management Overview. |
| Q. | What primary factors were behind the Fund’s relative performance? |
| A. | The S&P 1500 (the benchmark) includes all 11 GICS sectors; whereas, the Fund primarily focuses on the Energy, Materials and Industrials sectors. During the fiscal year the best performing sectors in the overall market were Utilities, Real Estate, and Consumer Staples. The worst performing sector was Energy. By design, the Fund’s average weight in the Energy sector during the time period was 57%. The Fund’s heavy tilt towards the Energy sector compared to the benchmark’s more diversified composition was the primary factor behind relative performance during a year that saw the Energy sector as the worst performing sector. During the unusual fourth quarter of 2018, the Fund returned about -19.18% versus the benchmark return of about -13.97%. As stated above, the Fund’s exposure to Energy and Materials during this unusual period were the primary factors behind relative performance. The Fund’s Energy holdings were down about 19.38% and the Materials holdings were down about 19.54%. During this period, one industry stood out as a significant detractor from performance, the oil & gas exploration & production industry, which accounted for about 27.29% of the portfolio and returned about -35.33% during the period. |
| Q. | How did the Fund’s composition affect performance? |
| A. | As noted above, and in broad terms, the Fund was hurt by overweighting the Energy sector. The Fund was also overweight the Materials sector relative to its broad market benchmark, which detracted from performance. The Fund’s Industrials holdings contributed positively to performance. Drilling down beyond the sector level, the Fund’s holdings that contributed the most to Fund performance during the fiscal year 2018 included an overweight position in the aerospace & defense industry within the Industrial sector. The construction materials industry in the Materials sector also had a positive impact on performance. On the flip side, during the fiscal year, the Fund’s overweight positions in the oil & exploration & production industry and in the paper products industry were two of the larger detractors from performance. |
| Q. | What is your investment outlook for Natural Resources? |
| A. | While the downturn in the Energy sector over the past several years has resulted in our valuation system indicating some bargains exist in the sector looking ahead at the next fiscal year, at ICON we also consider the relative strength of sectors, industries, and companies. At the beginning of the new fiscal year, our V/P ratio for the Energy sector was 1.21 vs. 1.18 for the entire domestic market; however, the relative strength for the Energy sector is 0.84. Relative strength (RS) is indicative of a sector or industry’s recent performance compared to the entire market. If RS for a sector is below 1.00, that would indicate that the sector is not a part of the current market theme. At ICON we like sectors and industries to not only have value, but to also be part of a market theme. The Energy sector has been the lowest returning sector in the recent past; which helps give the sector value, but hurts its relative strength. Within the sector the oil & gas refining & marketing industry has V/P and RS above 1.00 to begin the fiscal year. There are also individual companies within other industries like oil & gas exploration & production that have value and relative strength according to our system. Our outlook for the sector sees a lot of value, but low relative strength suggests that it may take a long time to build the momentum to realize that value. The Materials sector has a V/P of 1.14, but also has below average relative strength. At the beginning of the fiscal year, we have overweight positions in paper products, paper packaging, diversified chemicals, and steel industries. We would expect these industries to realize their value at some point throughout the fiscal year. At ICON we will continue to hold companies and industries within the sector with good V/P and will continue to seek out companies and industries with strong relative strength where possible. Our outlook for the sectors within Natural Resources sees a lot of value, but low relative strength suggests that it may take a long time to build the momentum to realize that value. |
| Annual Report | September 30, 2019 | 27 |
| ICON Natural Resources Fund | Management Overview |
September 30, 2019 (Unaudited)
Average Annual Total Return(as of September 30, 2019)
| | Inception
Date | 1 Year | 5 Years | 10 Years | Since
Inception | Gross Expense
Ratio* | Net
Expense Ratio* |
| ICON Natural Resources Fund - Class S | 5/5/97 | -7.69%** | 2.18% | 7.03% | 4.64% | 1.58% | 1.50% |
| ICON Natural Resources Fund - Class C | 9/30/10 | -8.57% | 1.16% | N/A | 5.20% | 2.79% | 2.50% |
| ICON Natural Resources Fund - Class A | 9/30/10 | -7.92% | 1.92% | N/A | 5.98% | 1.86% | 1.75% |
ICON Natural Resources Fund - Class A
(including maximum sales charge of 5.75%) | 9/30/10 | -13.21% | 0.72% | N/A | 5.29% | 1.86% | 1.75% |
| S&P Composite 1500 Index | | 3.39% | 10.69% | 13.21% | 8.16% | N/A | N/A |
Past performance is not a guarantee of future results.Information about these performance results and the comparative indexes can be found in the About This Report section. The Adviser has agreed to limit certain Fund expenses; without these limitations, returns would have been lower. The limitation provisions may be terminated in the future.
| * | Please see the most recent prospectus for details. |
| ** | Excludes adjustments in accordance with the accounting principles generally accepted in the United States of America and as such, the net asset value and total return for shareholder transactions reported to the market at period ended September 30, 2019 may differ from the net asset value for financial reporting purposes. |
Class C total returns exclude applicable sales charges. If sales charges were included returns would be lower.
Value of a $10,000 Investment(through September 30, 2019)
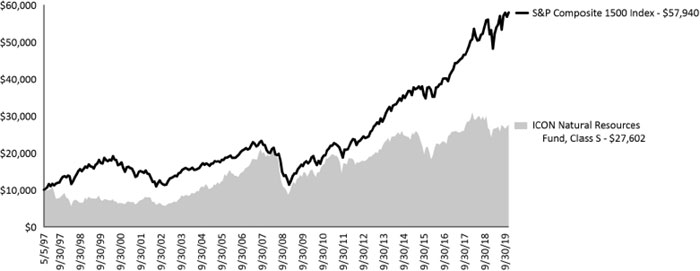
Past performance is not a guarantee of future results.The above graph compares a $10,000 investment made in the Fund’s Class S shares on the Class’ inception date of 5/5/97 to a $10,000 investment made in unmanaged securities indexes on that date. The Fund’s name changed effective January 22, 2016 and the investment strategy changed effective August 18, 2016. The Fund’s past performance would have been different if the current strategy had been in effect. The Fund’s performance in this chart and the performance table assumes the reinvestment of dividends and capital gain distributions but does not reflect the deduction of taxes that a shareholder would pay on Fund distributions or on the redemption of Fund shares.
| ICON Natural Resources Fund | Schedule of Investments |
September 30, 2019
| | | Shares or
Principal
Amount | | | Value | |
| Common Stocks (99.36%) | | | | | | | | |
| Aerospace & Defense (10.09%) | | | | | | | | |
| Boeing Co. | | | 2,500 | | | $ | 951,175 | |
| Lockheed Martin Corp. | | | 3,900 | | | | 1,521,234 | |
| Northrop Grumman Corp. | | | 4,900 | | | | 1,836,471 | |
| Raytheon Co. | | | 8,400 | | | | 1,647,996 | |
| | | | | | | | 5,956,876 | |
| Building Products (8.12%) | | | | | | | | |
| Armstrong World Industries, Inc. | | | 23,800 | | | | 2,301,460 | |
| Masco Corp. | | | 59,800 | | | | 2,492,464 | |
| | | | | | | | 4,793,924 | |
| Commodity Chemicals (3.57%) | | | | | | | | |
| Koppers Holdings, Inc.(a) | | | 72,171 | | | | 2,108,115 | |
| | | | | | | | | |
| Construction & Engineering (6.96%) | | | | | | | | |
| EMCOR Group, Inc. | | | 12,700 | | | | 1,093,724 | |
| MasTec, Inc.(a) | | | 46,395 | | | | 3,012,428 | |
| | | | | | | | 4,106,152 | |
| Construction Materials (8.95%) | | | | | | | | |
| Eagle Materials, Inc. | | | 26,100 | | | | 2,349,261 | |
| Martin Marietta Materials, Inc. | | | 10,700 | | | | 2,932,870 | |
| | | | | | | | 5,282,131 | |
| Diversified Chemicals (6.22%) | | | | | | | | |
| Eastman Chemical Co. | | | 22,400 | | | | 1,653,792 | |
| Huntsman Corp. | | | 86,700 | | | | 2,016,642 | |
| | | | | | | | 3,670,434 | |
| Industrial Machinery (5.89%) | | | | | | | | |
| Ingersoll-Rand PLC | | | 17,600 | | | | 2,168,496 | |
| Mueller Water Products, Inc., Class A | | | 115,900 | | | | 1,302,716 | |
| | | | | | | | 3,471,212 | |
| Integrated Oil & Gas (2.96%) | | | | | | | | |
| Chevron Corp. | | | 14,700 | | | | 1,743,420 | |
| | | | | | | | | |
| Oil & Gas Exploration & Production (8.55%) | | | | | | | | |
| Diamondback Energy, Inc. | | | 12,700 | | | | 1,141,857 | |
| EOG Resources, Inc. | | | 31,000 | | | | 2,300,820 | |
| Parsley Energy, Inc., Class A | | | 30,900 | | | | 519,120 | |
| Pioneer Natural Resources Co. | | | 8,600 | | | | 1,081,622 | |
| | | | | | | | 5,043,419 | |
| Oil & Gas Refining & Marketing (3.19%) | | | | | | | | |
| Marathon Petroleum Corp. | | | 31,000 | | | | 1,883,250 | |
| | | | | | | | | |
| Paper Packaging (14.21%) | | | | | | | | |
| Avery Dennison Corp. | | | 21,800 | | | | 2,475,826 | |
| DS Smith PLC | | | 123,000 | | | | 544,641 | |
| International Paper Co. | | | 44,000 | | | | 1,840,080 | |
| Packaging Corp. of America | | | 16,600 | | | | 1,761,260 | |
| Sealed Air Corp. | | | 42,300 | | | | 1,755,873 | |
| | | | | | | | 8,377,680 | |
| Paper Products (3.46%) | | | | | | | | |
| Mercer International, Inc. | | | 121,300 | | | | 1,521,102 | |
| Mondi PLC | | | 27,000 | | | | 516,977 | |
| | | | | | | | 2,038,079 | |
| | | Shares or
Principal
Amount | | | Value | |
| Railroads (6.35%) | | | | | | |
| CSX Corp. | | | 22,100 | | | $ | 1,530,867 | |
| Union Pacific Corp. | | | 13,700 | | | | 2,219,126 | |
| | | | | | | | 3,749,993 | |
| Specialty Chemicals (10.84%) | | | | | | | | |
| RPM International, Inc. | | | 28,200 | | | | 1,940,442 | |
| Sherwin-Williams Co. | | | 4,200 | | | | 2,309,454 | |
| WR Grace & Co. | | | 32,200 | | | | 2,149,672 | |
| | | | | | | | 6,399,568 | |
| Total Common Stocks | | | | | | | | |
| (Cost $58,315,312) | | | | | | | 58,624,253 | |
| | | | | | | | | |
| Total Investments (99.36%) | | | | | | | | |
| (Cost $58,315,312) | | | | | | $ | 58,624,253 | |
| | | | | | | | | |
| Other Assets Less Liabilities (0.64%) | | | | | | | 379,245 | |
| | | | | | | | | |
| Net Assets (100.00%) | | | | | | $ | 59,003,498 | |
| (a) | Non-income producing security. |
The accompanying notes are an integral part of the financial statements.
| Annual Report | September 30, 2019 | 29 |
| ICON Natural Resources Fund | Schedule of Investments |
September 30, 2019
Country Composition(September 30, 2019)
| United States | | | 94.98 | % |
| Canada | | | 2.58 | % |
| United Kingdom | | | 1.80 | % |
| | | | 99.36 | % |
Percentages are based upon common stocks as a percentage of net assets.
Sector Composition(September 30, 2019)
| Materials | | | 47.25 | % |
| Industrials | | | 37.41 | % |
| Energy | | | 14.70 | % |
| | | | 99.36 | % |
Percentages are based upon common stocks as a percentage of net assets.
Industry Composition(September 30, 2019)
| Paper Packaging | | | 14.21 | % |
| Specialty Chemicals | | | 10.84 | % |
| Aerospace & Defense | | | 10.09 | % |
| Construction Materials | | | 8.95 | % |
| Oil & Gas Exploration & Production | | | 8.55 | % |
| Building Products | | | 8.12 | % |
| Construction & Engineering | | | 6.96 | % |
| Railroads | | | 6.35 | % |
| Diversified Chemicals | | | 6.22 | % |
| Industrial Machinery | | | 5.89 | % |
| Commodity Chemicals | | | 3.57 | % |
| Paper Products | | | 3.46 | % |
| Oil & Gas Refining & Marketing | | | 3.19 | % |
| Integrated Oil & Gas | | | 2.96 | % |
| | | | 99.36 | % |
Percentages are based upon common stocks as a percentage of net assets.
The accompanying notes are an integral part of the financial statements.
| ICON Utilities Fund | Management Overview |
September 30, 2019 (Unaudited)
| Q. | How did the Fund perform relative to its benchmark? |
| A. | The ICON Utilities Fund (the Fund) Class S returned 19.76% for the fiscal year ended September 30, 2019, while its benchmark, the S&P 1500 Utilities Index, returned 25.79%. Total returns for other periods and additional Class shares as of September 30, 2019, appear in the subsequent pages of this Fund’s Management Overview. |
| Q. | What primary factors were behind the Fund’s relative performance? |
| A. | The Utilities sector was the highest returning sector for 2019. Markets began the fiscal year with sharp declines during the fourth quarter of 2018 over continued trade war concerns and overall declining global growth. Despite the drop in the overall market, the S&P 1500 Utilities Index was the only S&P sector index to produce positive returns during the fourth quarter 2018, and it remained one of the leading sectors throughout the remaining first three quarters of 2019. The Fund’s underperformance relative to its benchmark came primarily from holdings in Utilities-related equities within the Energy sector. The roughly 5% portfolio weight in Energy sector securities throughout the year accounted for a large portion of underperformance relative to the benchmark. Within the Utilities sector, water utilities was the highest returning industry. Although the Fund was overweight in this industry relative to its benchmark, stock selection became a detractor from performance. The Fund did not hold the industry’s highest performing stock while it did hold a large position in its lowest performer. |
| Q. | How did the Fund’s composition affect performance? |
| A. | The three biggest contributors to Fund performance were NextEra Energy, Xcel Energy, and Sempra Energy. These firms are all from either the electric utilities or multi-utilities industries. The three stocks that detracted the most from Fund performance were National Fuel Gas Company, EOG Resources, and Total SA. National Fuel Gas Company saw shares steadily decline during the second half of the year after disappointing revenues reports. The latter two companies are in the Energy sector, which severely lagged the broad market. |
| Q. | What is your investment outlook for the overall market? |
| A. | As of September 30, 2019, ICON’s valuation model shows a value-to-price (V/P) ratio of 1.10 for the Utilities sector. In other words, we believe stock prices, on average, are below our estimate of fair value. With the Utilities sector showing value and ranking at the top amongst all the sectors in terms of relative strength, we expect the upward momentum to continue. The Fund is positioned going into the next fiscal year with its largest weighting in the multi-utilities and electric utilities industries. Both industries have valuations above the Utilities sector average that we expect to continue to appreciate towards fair value throughout the next year. |
| Annual Report | September 30, 2019 | 31 |
| ICON Utilities Fund | Management Overview |
September 30, 2019 (Unaudited)
Average Annual Total Return(as of September 30, 2019)
| | Inception
Date | 1 Year | 5 Years | 10 Years | Since
Inception | Gross Expense
Ratio* | Net Expense
Ratio* |
| ICON Utilities Fund - Class S | 7/9/97 | 19.76% | 11.86% | 11.35% | 8.82% | 1.60% | 1.22% |
| ICON Utilities Fund - Class A | 9/30/10 | 19.47% | 11.56% | N/A | 11.06% | 1.73% | 1.47% |
ICON Utilities Fund - Class A
(including maximum sales charge of 5.75%) | 9/30/10 | 12.61% | 10.24% | N/A | 10.32% | 1.73% | 1.47% |
| S&P 1500 Utilities Index | | 25.79% | 13.20% | 12.92% | 9.07% | N/A | N/A |
| S&P Composite 1500 Index | | 3.39% | 10.69% | 13.21% | 7.77% | N/A | N/A |
Past performance is not a guarantee of future results.Information about these performance results and the comparative indexes can be found in the About This Report section. The Adviser has agreed to limit certain Fund expenses; without these limitations, returns would have been lower. The limitation provisions may be terminated in the future.
| * | Please see the most recent prospectus for details. |
Value of a $10,000 Investment(through September 30, 2019)
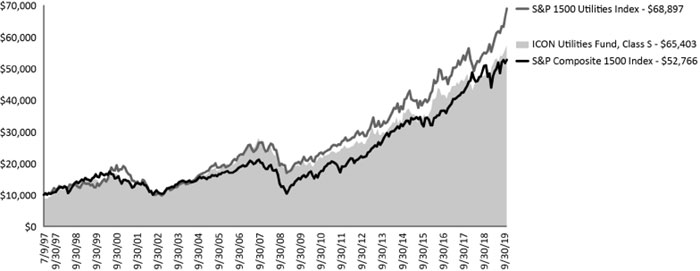
Past performance is not a guarantee of future results.The above graph compares a $10,000 investment made in the Fund’s Class S shares on the Class’ inception date of 7/9/97 to a $10,000 investment made in unmanaged securities indexes on that date. The Fund’s performance in this chart and the performance table assumes the reinvestment of dividends and capital gain distributions but does not reflect the deduction of taxes that a shareholder would pay on Fund distributions or on the redemption of Fund shares.
| ICON Utilities Fund | Schedule of Investments |
September 30, 2019
| | | Shares or
Principal
Amount | | | Value | |
| Common Stocks (99.46%) | | | | | | | | |
| Electric Utilities (39.01%) | | | | | | | | |
| American Electric Power Co., Inc. | | | 21,400 | | | $ | 2,004,966 | |
| Duke Energy Corp. | | | 25,800 | | | | 2,473,188 | |
| Edison International | | | 35,000 | | | | 2,639,700 | |
| Evergy, Inc. | | | 35,500 | | | | 2,362,880 | |
| NextEra Energy, Inc. | | | 10,600 | | | | 2,469,694 | |
| OGE Energy Corp. | | | 45,600 | | | | 2,069,328 | |
| Pinnacle West Capital Corp. | | | 20,500 | | | | 1,989,935 | |
| PPL Corp. | | | 61,300 | | | | 1,930,337 | |
| Xcel Energy, Inc. | | | 36,500 | | | | 2,368,485 | |
| | | | | | | | 20,308,513 | |
| Electrical Components & Equipment (9.07%) | | | | | | | | |
| Eaton Corp. PLC | | | 22,000 | | | | 1,829,300 | |
| Emerson Electric Co. | | | 20,300 | | | | 1,357,258 | |
| Hubbell, Inc. | | | 11,700 | | | | 1,537,380 | |
| | | | | | | | 4,723,938 | |
| Independent Power Producers & Energy Traders (1.24%) |
| AES Corp. | | | 39,500 | | | | 645,430 | |
| | | | | | | | | |
| Integrated Oil & Gas (1.28%) | | | | | | | | |
| Chevron Corp. | | | 3,500 | | | | 415,100 | |
| Exxon Mobil Corp. | | | 3,500 | | | | 247,135 | |
| | | | | | | | 662,235 | |
| Integrated Telecommunication Services (1.12%) | | | | | | | | |
| BCE, Inc. | | | 12,000 | | | | 580,920 | |
| | | | | | | | | |
| Multi-Utilities (40.99%) | | | | | | | | |
| Ameren Corp. | | | 25,900 | | | | 2,073,295 | |
| Black Hills Corp. | | | 15,600 | | | | 1,196,988 | |
| CenterPoint Energy, Inc. | | | 80,300 | | | | 2,423,454 | |
| Consolidated Edison, Inc. | | | 24,600 | | | | 2,323,962 | |
| Dominion Energy, Inc. | | | 28,100 | | | | 2,277,224 | |
| DTE Energy Co. | | | 17,300 | | | | 2,300,208 | |
| MDU Resources Group, Inc. | | | 85,000 | | | | 2,396,150 | |
| NiSource, Inc. | | | 56,700 | | | | 1,696,464 | |
| Public Service Enterprise Group, Inc. | | | 33,600 | | | | 2,085,888 | |
| Sempra Energy | | | 17,400 | | | | 2,568,414 | |
| | | | | | | | 21,342,047 | |
| Oil & Gas Exploration & Production (0.62%) | | | | | | | | |
| Cimarex Energy Co. | | | 6,700 | | | | 321,198 | |
| | | | | | | | | |
| Railroads (1.46%) | | | | | | | | |
| Union Pacific Corp. | | | 4,700 | | | | 761,306 | |
| | | | | | | | | |
| Water Utilities (4.67%) | | | | | | | | |
| American Water Works Co., Inc. | | | 11,300 | | | | 1,403,799 | |
| Consolidated Water Co., Ltd. | | | 62,205 | | | | 1,025,760 | |
| | | | | | | | 2,429,559 | |
| Total Common Stocks | | | | | | | | |
| (Cost $45,187,161) | | | | | | | 51,775,146 | |
| | | Value | |
| Total Investments (99.46%) | | | | |
| (Cost $45,187,161) | | $ | 51,775,146 | |
| | | | | |
| Other Assets Less Liabilities (0.54%) | | | 282,688 | |
| | | | | |
| Net Assets (100.00%) | | $ | 52,057,834 | |
Sector Composition(September 30, 2019)
| | | | | |
| Utilities | | | 85.91 | % |
| Industrials | | | 10.53 | % |
| Energy | | | 1.90 | % |
| Communication Services | | | 1.12 | % |
| | | | 99.46 | % |
Percentages are based upon common stocks as a percentage of net assets.
Industry Composition(September 30, 2019)
| | | | | |
| Multi-Utilities | | | 40.99 | % |
| Electric Utilities | | | 39.01 | % |
| Electrical Components & Equipment | | | 9.07 | % |
| Water Utilities | | | 4.67 | % |
| Railroads | | | 1.46 | % |
| Integrated Oil & Gas | | | 1.28 | % |
| Independent Power Producers & Energy Traders | | | 1.24 | % |
| Integrated Telecommunication Services | | | 1.12 | % |
| Oil & Gas Exploration & Production | | | 0.62 | % |
| | | | 99.46 | % |
Percentages are based upon common stocks as a percentage of net assets.
The accompanying notes are an integral part of the financial statements.
| Annual Report | September 30, 2019 | 33 |
| ICON Sector Funds | Statements of Assets and Liabilities |
September 30, 2019
| | | ICON Consumer
Discretionary Fund | | ICON Consumer
Staples Fund | | ICON Energy Fund |
| Assets | | | | | | |
| Investments, at cost | | $ | 18,514,587 | | | $ | 11,809,491 | | | $ | 111,820,541 | |
| Investments, at value(a) | | | 20,008,917 | | | | 11,905,578 | | | | 101,654,094 | |
| Cash and cash equivalents | | | — | | | | 43,045 | | | | 192,856 | |
| Receivables: | | | | | | | | | | | | |
| Investments sold | | | 406,654 | | | | — | | | | — | |
| Fund shares sold | | | 14,045 | | | | 108,139 | | | | 27,777 | |
| Expense reimbursements due from Adviser | | | 2,124 | | | | 18,519 | | | | 24,064 | |
| Interest | | | 12 | | | | 15 | | | | 44 | |
| Dividends | | | 13,715 | | | | 27,905 | | | | 85,184 | |
| Foreign tax reclaims | | | — | | | | — | | | | 48,046 | |
| Other assets | | | 3,733 | | | | 4,565 | | | | 7,384 | |
| Total assets | | | 20,449,200 | | | | 12,107,766 | | | | 102,039,449 | |
| | | | | | | | | | | | | |
| Liabilities | | | | | | | | | | | | |
| Payables: | | | | | | | | | | | | |
| Payable for collateral received on securities loaned | | | — | | | | 748,025 | | | | 255,037 | |
| Payable due to custodian | | | 2,191 | | | | — | | | | — | |
| Investments purchased | | | 291,844 | | | | — | | | | — | |
| Fund shares redeemed | | | 4,966 | | | | — | | | | 419,614 | |
| Advisory fees | | | 16,690 | | | | 9,167 | | | | 84,802 | |
| Transfer agent fees | | | 18,584 | | | | 11,449 | | | | 166,813 | |
| Fund accounting fees | | | 2,842 | | | | 2,001 | | | | 9,587 | |
| Accrued distribution fees | | | 141 | | | | 279 | | | | 3,381 | |
| Trustee fees and expenses | | | 678 | | | | 384 | | | | 3,475 | |
| Administration fees | | | 834 | | | | 458 | | | | 4,240 | |
| Accrued expenses | | | 25,801 | | | | 25,036 | | | | 50,607 | |
| Total liabilities | | | 364,571 | | | | 796,799 | | | | 997,556 | |
| Net Assets - all share classes | | $ | 20,084,629 | | | $ | 11,310,967 | | | $ | 101,041,893 | |
| Net Assets - Class S | | $ | 19,401,324 | | | $ | 9,970,000 | | | $ | 94,594,236 | |
| Net Assets - Class C | | $ | — | | | $ | — | | | $ | 3,258,553 | |
| Net Assets - Class A | | $ | 683,305 | | | $ | 1,340,967 | | | $ | 3,189,104 | |
| | | | | | | | | | | | | |
| Net Assets Consists of | | | | | | | | | | | | |
| Paid-in capital | | $ | 20,794,843 | | | $ | 11,720,259 | | | $ | 307,405,972 | |
| Total distributable earnings | | | (710,214 | ) | | | (409,292 | ) | | | (206,364,079 | ) |
| Net Assets | | $ | 20,084,629 | | | $ | 11,310,967 | | | $ | 101,041,893 | |
| | | | | | | | | | | | | |
| Shares outstanding (unlimited shares authorized, no par value) | | | | | | | | | | | | |
| Class S | | | 1,489,140 | | | | 1,472,484 | | | | 10,185,424 | |
| Class C | | | — | | | | — | | | | 374,619 | |
| Class A | | | 55,314 | | | | 199,097 | | | | 347,002 | |
| Net asset value (offering and redemption price per share) | | | | | | | | | | | | |
| Class S | | $ | 13.03 | | | $ | 6.77 | | | $ | 9.29 | |
| Class C | | $ | — | | | $ | — | | | $ | 8.70 | |
| Class A | | $ | 12.35 | | | $ | 6.74 | | | $ | 9.19 | |
| Class A maximum offering price (100%/ (100%-maximum sales charge)) of net asset value adjusted to the nearest cent per share | | $ | 13.11 | | | $ | 7.15 | | | $ | 9.75 | |
| | | | | | | | | | | | | |
| (a)Includes securities on loan of | | $ | — | | | $ | 2,478,090 | | | $ | 3,704,650 | |
The accompanying notes are an integral part of the financial statements.
| ICON Sector Funds | Statements of Assets and Liabilities |
September 30, 2019
| | | ICON Financial Fund | | ICON Healthcare
Fund | | ICON Industrials
Fund |
| Assets | | | | | | | | | | | | |
| Investments, at cost | | $ | 29,564,126 | | | $ | 54,692,864 | | | $ | 10,224,385 | |
| Investments, at value(a) | | | 36,079,639 | | | | 56,925,254 | | | | 12,115,067 | |
| Cash and cash equivalents | | | 31,518 | | | | 386,208 | | | | 75,947 | |
| Receivables: | | | | | | | | | | | | |
| Fund shares sold | | | 18,551 | | | | 4,751 | | | | 11,668 | |
| Expense reimbursements due from Adviser | | | 5,345 | | | | 4,085 | | | | 19,241 | |
| Interest | | | 12 | | | | 46 | | | | 5 | |
| Dividends | | | 25,926 | | | | 36,339 | | | | 7,896 | |
| Foreign tax reclaims | | | — | | | | 3,493 | | | | — | |
| Other assets | | | 5,102 | | | | 4,995 | | | | 4,762 | |
| Total assets | | | 36,166,093 | | | | 57,365,171 | | | | 12,234,586 | |
| | | | | | | | | | | | | |
| Liabilities | | | | | | | | | | | | |
| Payables: | | | | | | | | | | | | |
| Fund shares redeemed | | | 7,379 | | | | 203,369 | | | | 1,311 | |
| Advisory fees | | | 29,870 | | | | 48,346 | | | | 10,033 | |
| Transfer agent fees | | | 28,061 | | | | 53,654 | | | | 13,734 | |
| Fund accounting fees | | | 4,163 | | | | 6,178 | | | | 2,013 | |
| Accrued distribution fees | | | 303 | | | | 362 | | | | 141 | |
| Trustee fees and expenses | | | 1,241 | | | | 2,089 | | | | 404 | |
| Administration fees | | | 1,494 | | | | 2,417 | | | | 502 | |
| Accrued expenses | | | 28,482 | | | | 33,900 | | | | 24,439 | |
| Total liabilities | | | 100,993 | | | | 350,315 | | | | 52,577 | |
| Net Assets - all share classes | | $ | 36,065,100 | | | $ | 57,014,856 | | | $ | 12,182,009 | |
| Net Assets - Class S | | $ | 34,578,367 | | | $ | 55,282,959 | | | $ | 11,522,922 | |
| Net Assets - Class A | | $ | 1,486,733 | | | $ | 1,731,897 | | | $ | 659,087 | |
| | | | | | | | | | | | | |
| Net Assets Consists of | | | | | | | | | | | | |
| Paid-in capital | | $ | 29,294,028 | | | $ | 55,292,149 | | | $ | 10,819,757 | |
| Total distributable earnings | | | 6,771,072 | | | | 1,722,707 | | | | 1,362,252 | |
| Net Assets | | $ | 36,065,100 | | | $ | 57,014,856 | | | $ | 12,182,009 | |
| | | | | | | | | | | | | |
| Shares outstanding (unlimited shares authorized, no par value) | | | | | | | | | | | | |
| Class S | | | 3,216,179 | | | | 3,565,188 | | | | 726,960 | |
| Class A | | | 138,382 | | | | 117,594 | | | | 42,309 | |
| Net asset value (offering and redemption price per share) | | | | | | | | | | | | |
| Class S | | $ | 10.75 | | | $ | 15.51 | | | $ | 15.85 | |
| Class A | | $ | 10.74 | | | $ | 14.73 | | | $ | 15.58 | |
| Class A maximum offering price (100%/ (100%-maximum sales charge)) of net asset value adjusted to the nearest cent per share | | $ | 11.40 | | | $ | 15.63 | | | $ | 16.53 | |
| | | | | | | | | | | | | |
| (a)Includes securities on loan of | | $ | 729,818 | | | $ | 46,448 | | | $ | — | |
The accompanying notes are an integral part of the financial statements.
| Annual Report | September 30, 2019 | 35 |
| ICON Sector Funds | Statements of Assets and Liabilities |
September 30, 2019
| | | ICON Information
Technology Fund | | ICON Natural
Resources Fund | | ICON Utilities Fund |
| Assets | | | | | | |
| Investments, at cost | | $ | 44,080,950 | | | $ | 58,315,312 | | | $ | 45,187,161 | |
| Investments, at value(a) | | | 55,667,103 | | | | 58,624,253 | | | | 51,775,146 | |
| Cash and cash equivalents | | | 143,741 | | | | 513,287 | | | | 643,170 | |
| Receivables: | | | | | | | | | | | | |
| Fund shares sold | | | 21,289 | | | | 26,146 | | | | 103,700 | |
| Expense reimbursements due from Adviser | | | 3,607 | | | | 28,279 | | | | 43,605 | |
| Interest | | | 37 | | | | 179 | | | | 165 | |
| Dividends | | | 13,476 | | | | 47,465 | | | | 123,291 | |
| Foreign tax reclaims | | | — | | | | 13,489 | | | | 4,983 | |
| Other assets | | | 6,282 | | | | 8,074 | | | | 5,681 | |
| Total assets | | | 55,855,535 | | | | 59,261,172 | | | | 52,699,741 | |
| | | | | | | | | | | | | |
| Liabilities | | | | | | | | | | | | |
| Payables: | | | | | | | | | | | | |
| Distributions due to shareholders | | | — | | | | — | | | | 13,357 | |
| Investments purchased | | | — | | | | — | | | | 461,340 | |
| Fund shares redeemed | | | 3,362 | | | | 61,815 | | | | 47,119 | |
| Advisory fees | | | 46,345 | | | | 47,424 | | | | 41,559 | |
| Transfer agent fees | | | 36,914 | | | | 74,986 | | | | 36,456 | |
| Fund accounting fees | | | 5,946 | | | | 9,085 | | | | 5,224 | |
| Accrued distribution fees | | | 302 | | | | 1,298 | | | | 1,222 | |
| Trustee fees and expenses | | | 1,928 | | | | 1,901 | | | | 1,613 | |
| Administration fees | | | 2,317 | | | | 2,372 | | | | 2,078 | |
| Accrued expenses | | | 32,489 | | | | 58,793 | | | | 31,939 | |
| Total liabilities | | | 129,603 | | | | 257,674 | | | | 641,907 | |
| Net Assets - all share classes | | $ | 55,725,932 | | | $ | 59,003,498 | | | $ | 52,057,834 | |
| Net Assets - Class S | | $ | 54,262,728 | | | $ | 55,352,646 | | | $ | 46,005,812 | |
| Net Assets - Class C | | $ | — | | | $ | 917,360 | | | $ | — | |
| Net Assets - Class A | | $ | 1,463,204 | | | $ | 2,733,492 | | | $ | 6,052,022 | |
| | | | | | | | | | | | | |
| | | | | | | | | | | | | |
| Net Assets Consists of | | | | | | | | | | | | |
| Paid-in capital | | $ | 41,859,210 | | | $ | 63,174,432 | | | $ | 43,987,488 | |
| Total distributable earnings | | | 13,866,722 | | | | (4,170,934 | ) | | | 8,070,346 | |
| Net Assets | | $ | 55,725,932 | | | $ | 59,003,498 | | | $ | 52,057,834 | |
| | | | | | | | | | | | | |
| Shares outstanding (unlimited shares authorized, no par value) | | | | | | | | | | | | |
| Class S | | | 3,510,540 | | | | 4,430,382 | | | | 4,486,665 | |
| Class C | | | — | | | | 77,895 | | | | — | |
| Class A | | | 99,260 | | | | 221,082 | | | | 601,172 | |
| Net asset value (offering and redemption price per share) | | | | | | | | | | | | |
| Class S | | $ | 15.46 | | | $ | 12.49 | | | $ | 10.25 | |
| Class C | | $ | — | | | $ | 11.78 | | | $ | — | |
| Class A | | $ | 14.74 | | | $ | 12.36 | | | $ | 10.07 | |
| Class A maximum offering price (100%/ (100%-maximum sales charge)) of net asset value adjusted to the nearest cent per share | | $ | 15.64 | | | $ | 13.12 | | | $ | 10.68 | |
| | | | | | | | | | | | | |
| (a) Includes securities on loan of | | $ | 897,151 | | | $ | — | | | $ | — | |
The accompanying notes are an integral part of the financial statements.
| ICON Sector Funds | Statements of Operations |
Year Ended September 30, 2019
| | | ICON Consumer
Discretionary Fund | | ICON Consumer
Staples Fund | | ICON Energy Fund |
| Investment Income | | | | | | | | | | | | |
| Dividends | | $ | 258,943 | | | $ | 204,438 | | | $ | 3,141,253 | |
| Foreign taxes withheld | | | — | | | | (1,402 | ) | | | (5,759 | ) |
| Income from securities lending, net | | | 1,391 | | | | 1,750 | | | | 19,034 | |
| Total investment income | | | 260,334 | | | | 204,786 | | | | 3,154,528 | |
| | | | | | | | | | | | | |
| Expenses | | | | | | | | | | | | |
| Advisory fees | | | 211,546 | | | | 86,943 | | | | 1,264,333 | |
| Administration fees | | | 10,576 | | | | 4,347 | | | | 63,208 | |
| Transfer agent fees | | | 53,953 | | | | 39,038 | | | | 443,764 | |
| Distribution fees: | | | | | | | | | | | | |
| Class C | | | — | | | | — | | | | 37,791 | |
| Class A | | | 1,602 | | | | 4,432 | | | | 10,348 | |
| Registration fees | | | 24,321 | | | | 23,875 | | | | 42,642 | |
| Audit and tax service expense | | | 16,000 | | | | 16,000 | | | | 20,000 | |
| Fund accounting fees | | | 12,526 | | | | 6,102 | | | | 61,902 | |
| Trustee fees and expenses | | | 6,968 | | | | 2,730 | | | | 42,857 | |
| Insurance expense | | | 2,552 | | | | 644 | | | | 19,032 | |
| Custody fees | | | 4,757 | | | | 5,468 | | | | 6,024 | |
| Printing fees | | | 9,693 | | | | 5,311 | | | | 42,126 | |
| Interest expense | | | 115 | | | | 1,220 | | | | 2,825 | |
| Other expenses | | | 13,901 | | | | 8,795 | | | | 61,950 | |
| Total expenses before expense reimbursement | | | 368,510 | | | | 204,905 | | | | 2,118,802 | |
| Expense reimbursement by Adviser due to expense limitation agreement | | | (6,302 | ) | | | (68,895 | ) | | | (176,080 | ) |
| Net Expenses | | | 362,208 | | | | 136,010 | | | | 1,942,722 | |
| Net Investment Income/(Loss) | | | (101,874 | ) | | | 68,776 | | | | 1,211,806 | |
| | | | | | | | | | | | | |
| Realized and Unrealized Gain/(Loss) | | | | | | | | | | | | |
| Net realized gain/(loss) on: | | | | | | | | | | | | |
| Investments, options and foreign currency translations | | | (1,732,286 | ) | | | 5,200 | | | | (21,238,302 | ) |
| | | | (1,732,286 | ) | | | 5,200 | | | | (21,238,302 | ) |
| Change in unrealized net appreciation/(depreciation) on: | | | | | | | | | | | | |
| Investments, options and foreign currency | | | 1,143,109 | | | | 123,534 | | | | (27,840,873 | ) |
| | | | 1,143,109 | | | | 123,534 | | | | (27,840,873 | ) |
| Net realized and unrealized gain/(loss) | | | (589,177 | ) | | | 128,734 | | | | (49,079,175 | ) |
| Net Increase/(Decrease) in Net Assets Resulting From Operations | | $ | (691,051 | ) | | $ | 197,510 | | | $ | (47,867,369 | ) |
The accompanying notes are an integral part of the financial statements.
| Annual Report | September 30, 2019 | 37 |
| ICON Sector Funds | Statements of Operations |
Year Ended September 30, 2019
| | | ICON Financial Fund | | ICON Healthcare
Fund | | ICON Industrials
Fund |
| Investment Income | | | | | | | | | | | | |
| Dividends | | $ | 866,194 | | | $ | 705,371 | | | $ | 245,479 | |
| Foreign taxes withheld | | | — | | | | — | | | | (3,542 | ) |
| Income from securities lending, net | | | 534 | | | | 18,799 | | | | 621 | |
| Total investment income | | | 866,728 | | | | 724,170 | | | | 242,558 | |
| | | | | | | | | | | | | |
| Expenses | | | | | | | | | | | | |
| Advisory fees | | | 375,349 | | | | 692,831 | | | | 124,722 | |
| Administration fees | | | 18,766 | | | | 34,642 | | | | 6,236 | |
| Transfer agent fees | | | 74,385 | | | | 155,406 | | | | 41,614 | |
| Distribution fees: | | | | | | | | | | | | |
| Class A | | | 3,590 | | | | 5,714 | | | | 3,504 | |
| Registration fees | | | 25,596 | | | | 26,490 | | | | 24,020 | |
| Audit and tax service expense | | | 16,000 | | | | 16,000 | | | | 16,000 | |
| Fund accounting fees | | | 20,117 | | | | 35,323 | | | | 7,587 | |
| Trustee fees and expenses | | | 12,442 | | | | 22,940 | | | | 4,093 | |
| Insurance expense | | | 5,038 | | | | 8,281 | | | | 1,315 | |
| Custody fees | | | 3,742 | | | | 4,431 | | | | 3,451 | |
| Printing fees | | | 12,300 | | | | 20,137 | | | | 8,419 | |
| Interest expense | | | 1,283 | | | | 1,136 | | | | 515 | |
| Other expenses | | | 21,034 | | | | 34,450 | | | | 10,305 | |
| Total expenses before expense reimbursement | | | 589,642 | | | | 1,057,781 | | | | 251,781 | |
| Expense reimbursement by Adviser due to expense limitation agreement | | | (22,242 | ) | | | (12,643 | ) | | | (60,705 | ) |
| Net Expenses | | | 567,400 | | | | 1,045,138 | | | | 191,076 | |
| Net Investment Income/(Loss) | | | 299,328 | | | | (320,968 | ) | | | 51,482 | |
| | | | | | | | | | | | | |
| Realized and Unrealized Gain/(Loss) | | | | | | | | | | | | |
| Net realized gain/(loss) on: | | | | | | | | | | | | |
| Investments and foreign currency translations | | | 37,433 | | | | 35,809 | | | | (577,245 | ) |
| | | | 37,433 | | | | 35,809 | | | | (577,245 | ) |
| | | | | | | | | | | | | |
| Change in unrealized net appreciation/(depreciation) on: | | | | | | | | | | | | |
| Investments and foreign currency | | | (1,312,468 | ) | | | (12,317,222 | ) | | | 748,502 | |
| | | | (1,312,468 | ) | | | (12,317,222 | ) | | | 748,502 | |
| Net realized and unrealized gain/(loss) | | | (1,275,035 | ) | | | (12,281,413 | ) | | | 171,257 | |
| Net Increase/(Decrease) in Net Assets Resulting From Operations | | $ | (975,707 | ) | | $ | (12,602,381 | ) | | $ | 222,739 | |
The accompanying notes are an integral part of the financial statements.
| ICON Sector Funds | Statements of Operations |
Year Ended September 30, 2019
| | | ICON Information
Technology Fund | | ICON Natural
Resources Fund | | ICON Utilities Fund |
| Investment Income | | | | | | | | | | | | |
| Dividends | | $ | 690,282 | | | $ | 2,012,343 | | | $ | 1,716,222 | |
| Foreign taxes withheld | | | (1,256 | ) | | | (142,722 | ) | | | (10,480 | ) |
| Income from securities lending, net | | | 1,918 | | | | 7,082 | | | | 1,453 | |
| Total investment income | | | 690,944 | | | | 1,876,703 | | | | 1,707,195 | |
| | | | | | | | | | | | | |
| Expenses | | | | | | | | | | | | |
| Advisory fees | | | 558,766 | | | | 620,123 | | | | 430,851 | |
| Administration fees | | | 27,937 | | | | 31,004 | | | | 21,545 | |
| Transfer agent fees | | | 104,646 | | | | 197,926 | | | | 100,035 | |
| Distribution fees: | | | | | | | | | | | | |
| Class C | | | — | | | | 9,818 | | | | — | |
| Class A | | | 4,097 | | | | 7,583 | | | | 14,791 | |
| Registration fees | | | 27,896 | | | | 35,462 | | | | 26,909 | |
| Audit and tax service expense | | | 16,000 | | | | 16,000 | | | | 16,000 | |
| Fund accounting fees | | | 29,041 | | | | 37,414 | | | | 22,952 | |
| Trustee fees and expenses | | | 18,287 | | | | 20,528 | | | | 13,491 | |
| Insurance expense | | | 6,944 | | | | 8,586 | | | | 3,850 | |
| Custody fees | | | 4,846 | | | | 41,588 | | | | 5,101 | |
| Printing fees | | | 15,277 | | | | 24,229 | | | | 11,766 | |
| Interest expense | | | 380 | | | | 2,476 | | | | 1,678 | |
| Other expenses | | | 28,716 | | | | 32,796 | | | | 22,395 | |
| Total expenses before expense reimbursement | | | 842,833 | | | | 1,085,533 | | | | 691,364 | |
| Expense reimbursement by Adviser due to expense limitation agreement | | | (8,958 | ) | | | (137,022 | ) | | | (148,743 | ) |
| Net Expenses | | | 833,875 | | | | 948,511 | | | | 542,621 | |
| Net Investment Income/(Loss) | | | (142,931 | ) | | | 928,192 | | | | 1,164,574 | |
| | | | | | | | | | | | | |
| Realized and Unrealized Gain/(Loss) | | | | | | | | | | | | |
| Net realized gain/(loss) on: | | | | | | | | | | | | |
| Investments and foreign currency translations | | | 2,451,694 | | | | (5,401,806 | ) | | | 1,720,446 | |
| | | | 2,451,694 | | | | (5,401,806 | ) | | | 1,720,446 | |
| | | | | | | | | | | | | |
| Change in unrealized net appreciation/(depreciation) on: | | | | | | | | | | | | |
| Investments and foreign currency | | | (70,871 | ) | | | (2,827,298 | ) | | | 4,843,813 | |
| | | | (70,871 | ) | | | (2,827,298 | ) | | | 4,843,813 | |
| Net realized and unrealized gain/(loss) | | | 2,380,823 | | | | (8,229,104 | ) | | | 6,564,259 | |
| Net Increase/(Decrease) in Net Assets Resulting From Operations | | $ | 2,237,892 | | | $ | (7,300,912 | ) | | $ | 7,728,833 | |
The accompanying notes are an integral part of the financial statements.
| Annual Report | September 30, 2019 | 39 |
| ICON Sector Funds | Statements of Changes in Net Assets |
| | | ICON Consumer Discretionary Fund | | ICON Consumer Staples Fund |
| | | Year Ended
September 30, 2019 | | Year Ended
September 30, 2018 | | Year Ended
September 30, 2019 | | Year Ended
September 30, 2018 |
| Operations | | | | | | | | | | | | | | | | |
| Net investment income/(loss) | | $ | (101,874 | ) | | $ | (114,346 | ) | | $ | 68,776 | | | $ | 102,349 | |
| Net realized gain/(loss) | | | (1,732,286 | ) | | | (258,587 | ) | | | 5,200 | | | | (206,426 | ) |
| Change in net unrealized appreciation/(depreciation) | | | 1,143,109 | | | | 284,117 | | | | 123,534 | | | | 72,655 | |
| Net increase/(decrease) in net assets resulting from operations | | | (691,051 | ) | | | (88,816 | ) | | | 197,510 | | | | (31,422 | ) |
| | | | | | | | | | | | | | | | | |
| Total Dividends and Distributions to Shareholders | | | | | | | | | | | | | | | | |
| Class S | | | — | | | | (897,131 | ) | | | (84,696 | ) | | | (822,922 | ) |
| Class A | | | — | | | | (49,825 | ) | | | (17,641 | ) | | | (332,699 | ) |
| Net decrease from dividends and distributions | | | — | | | | (946,956 | ) | | | (102,337 | ) | | | (1,155,621 | ) |
| | | | | | | | | | | | | | | | | |
| Fund Share Transactions | | | | | | | | | | | | | | | | |
| Shares sold | | | | | | | | | | | | | | | | |
| Class S | | | 3,342,892 | | | | 6,793,747 | | | | 11,093,056 | | | | 3,369,557 | |
| Class A | | | 217,420 | | | | 917,651 | | | | 4,123,833 | | | | 1,568,876 | |
| Reinvested dividends and distributions | | | | | | | | | | | | | | | | |
| Class S | | | — | | | | 890,044 | | | | 82,330 | | | | 813,554 | |
| Class A | | | — | | | | 45,382 | | | | 15,874 | | | | 281,512 | |
| Shares repurchased | | | | | | | | | | | | | | | | |
| Class S | | | (6,044,347 | ) | | | (8,520,523 | ) | | | (6,459,945 | ) | | | (22,117,864 | ) |
| Class A | | | (989,740 | ) | | | (880,930 | ) | | | (4,652,196 | ) | | | (3,258,317 | ) |
| Net increase/(decrease) from fund share transactions | | | (3,473,775 | ) | | | (754,629 | ) | | | 4,202,952 | | | | (19,342,682 | ) |
| | | | | | | | | | | | | | | | | |
| Total net increase/(decrease) in net assets | | | (4,164,826 | ) | | | (1,790,401 | ) | | | 4,298,125 | | | | (20,529,725 | ) |
| | | | | | | | | | | | | | | | | |
| Net Assets | | | | | | | | | | | | | | | | �� |
| Beginning of year | | | 24,249,455 | | | | 26,039,856 | | | | 7,012,842 | | | | 27,542,567 | |
| End of year | | $ | 20,084,629 | | | $ | 24,249,455 | | | $ | 11,310,967 | | | $ | 7,012,842 | |
| | | | | | | | | | | | | | | | | |
| Transactions in Fund Shares | | | | | | | | | | | | | | | | |
| Shares sold | | | | | | | | | | | | | | | | |
| Class S | | | 271,725 | | | | 507,945 | | | | 1,673,883 | | | | 473,310 | |
| Class A | | | 18,007 | | | | 72,430 | | | | 661,136 | | | | 239,901 | |
| Issued to shareholders in reinvestment of distributions | | | | | | | | | | | | | | | | |
| Class S | | | — | | | | 62,767 | | | | 13,344 | | | | 117,058 | |
| Class A | | | — | | | | 3,357 | | | | 2,581 | | | | 40,681 | |
| Shares repurchased | | | | | | | | | | | | | | | | |
| Class S | | | (466,767 | ) | | | (645,396 | ) | | | (1,006,735 | ) | | | (3,036,610 | ) |
| Class A | | | (78,993 | ) | | | (69,802 | ) | | | (727,531 | ) | | | (487,184 | ) |
| Net increase/(decrease) | | | (256,028 | ) | | | (68,699 | ) | | | 616,678 | | | | (2,652,844 | ) |
| Shares outstanding, beginning of year | | | 1,800,482 | | | | 1,869,181 | | | | 1,054,903 | | | | 3,707,747 | |
| Shares outstanding, end of year | | | 1,544,454 | | | | 1,800,482 | | | | 1,671,581 | | | | 1,054,903 | |
The accompanying notes are an integral part of the financial statements.
| ICON Sector Funds | Statements of Changes in Net Assets |
| | | ICON Energy Fund | | ICON Financial Fund |
| | | Year Ended
September 30, 2019 | | Year Ended
September 30, 2018 | | Year Ended
September 30, 2019 | | Year Ended
September 30, 2018 |
| Operations | | | | | | | | |
| Net investment income/(loss) | | $ | 1,211,806 | | | $ | 499,299 | | | $ | 299,328 | | | $ | 183,321 | |
| Net realized gain/(loss) | | | (21,238,302 | ) | | | (2,764,994 | ) | | | 37,433 | | | | 3,379,014 | |
| Change in net unrealized appreciation/(depreciation) | | | (27,840,873 | ) | | | 11,093,473 | | | | (1,312,468 | ) | | | 849,313 | |
| Net increase/(decrease) in net assets resulting from operations | | | (47,867,369 | ) | | | 8,827,778 | | | | (975,707 | ) | | | 4,411,648 | |
| | | | | | | | | | | | | | | | | |
| Total Dividends and Distributions to Shareholders | | | | | | | | | | | | | | | | |
| Class S | | | (35,230 | ) | | | (3,237,108 | ) | | | (236,071 | ) | | | (92,213 | ) |
| Class C | | | (376 | ) | | | (89,725 | ) | | | — | | | | — | |
| Class A | | | (1,147 | ) | | | (119,376 | ) | | | (8,439 | ) | | | (2,629 | ) |
| Return of capital | | | | | | | | | | | | | | | | |
| Class S | | | (465,071 | ) | | | — | | | | — | | | | — | |
| Class C | | | (4,960 | ) | | | — | | | | — | | | | — | |
| Class A | | | (15,148 | ) | | | — | | | | — | | | | — | |
| Net decrease from dividends and distributions | | | (521,932 | ) | | | (3,446,209 | ) | | | (244,510 | ) | | | (94,842 | ) |
| | | | | | | | | | | | | | | | | |
| Fund Share Transactions | | | | | | | | | | | | | | | | |
| Shares sold | | | | | | | | | | | | | | | | |
| Class S | | | 8,993,666 | | | | 18,098,615 | | | | 4,334,883 | | | | 10,035,038 | |
| Class C | | | 681,491 | | | | 241,401 | | | | — | | | | — | |
| Class A | | | 968,596 | | | | 1,463,565 | | | | 343,890 | | | | 813,466 | |
| Reinvested dividends and distributions | | | | | | | | | | | | | | | | |
| Class S | | | 484,438 | | | | 3,129,585 | | | | 230,086 | | | | 90,005 | |
| Class C | | | 4,627 | | | | 77,225 | | | | — | | | | — | |
| Class A | | | 11,327 | | | | 82,657 | | | | 7,617 | | | | 2,397 | |
| Shares repurchased, net of redemption fees | | | | | | | | | | | | | | | | |
| Class S | | | (39,238,599 | ) | | | (79,304,224 | ) | | | (12,300,293 | ) | | | (9,788,249 | ) |
| Class C | | | (999,281 | ) | | | (2,796,501 | ) | | | — | | | | — | |
| Class A | | | (2,470,141 | ) | | | (4,731,193 | ) | | | (342,882 | ) | | | (1,648,620 | ) |
| Net decrease from fund share transactions | | | (31,563,876 | ) | | | (63,738,870 | ) | | | (7,726,699 | ) | | | (495,963 | ) |
| | | | | | | | | | | | | | | | | |
| Total net increase/(decrease) in net assets | | | (79,953,177 | ) | | | (58,357,301 | ) | | | (8,946,916 | ) | | | 3,820,843 | |
| | | | | | | | | | | | | | | | | |
| Net Assets | | | | | | | | | | | | | | | | |
| Beginning of year | | | 180,995,070 | | | | 239,352,371 | | | | 45,012,016 | | | | 41,191,173 | |
| End of year | | $ | 101,041,893 | | | $ | 180,995,070 | | | $ | 36,065,100 | | | $ | 45,012,016 | |
| | | | | | | | | | | | | | | | | |
| Transactions in Fund Shares | | | | | | | | | | | | | | | | |
| Shares sold | | | | | | | | | | | | | | | | |
| Class S | | | 883,317 | | | | 1,437,533 | | | | 429,351 | | | | 938,255 | |
| Class C | | | 74,694 | | | | 20,373 | | | | — | | | | — | |
| Class A | | | 96,780 | | | | 120,172 | | | | 33,708 | | | | 73,446 | |
| Issued to shareholders in reinvestment of distributions | | | | | | | | | | | | | | | | |
| Class S | | | 51,923 | | | | 251,574 | | | | 26,477 | | | | 8,357 | |
| Class C | | | 526 | | | | 6,534 | | | | — | | | | — | |
| Class A | | | 1,225 | | | | 6,692 | | | | 876 | | | | 222 | |
| Shares repurchased | | | | | | | | | | | | | | | | |
| Class S | | | (3,855,520 | ) | | | (6,360,889 | ) | | | (1,205,530 | ) | | | (906,394 | ) |
| Class C | | | (105,178 | ) | | | (237,781 | ) | | | — | | | | — | |
| Class A | | | (249,157 | ) | | | (377,099 | ) | | | (33,917 | ) | | | (148,209 | ) |
| Net decrease | | | (3,101,390 | ) | | | (5,132,891 | ) | | | (749,035 | ) | | | (34,323 | ) |
| Shares outstanding, beginning of year | | | 14,008,435 | | | | 19,141,326 | | | | 4,103,596 | | | | 4,137,919 | |
| Shares outstanding, end of year | | | 10,907,045 | | | | 14,008,435 | | | | 3,354,561 | | | | 4,103,596 | |
The accompanying notes are an integral part of the financial statements.
| Annual Report | September 30, 2019 | 41 |
| ICON Sector Funds | Statements of Changes in Net Assets |
| | | ICON Healthcare Fund | | ICON Industrials Fund |
| | | Year Ended
September 30, 2019 | | Year Ended
September 30, 2018 | | Year Ended
September 30, 2019 | | Year Ended
September 30, 2018 |
| Operations | | | | | | | | |
| Net investment income/(loss) | | $ | (320,968 | ) | | $ | (474,043 | ) | | $ | 51,482 | | | $ | (3,465 | ) |
| Net realized gain/(loss) | | | 35,809 | | | | 5,271,578 | | | | (577,245 | ) | | | 787,164 | |
| Change in net unrealized appreciation/(depreciation) | | | (12,317,222 | ) | | | 8,892,330 | | | | 748,502 | | | | (394,652 | ) |
| Net increase/(decrease) in net assets resulting from operations | | | (12,602,381 | ) | | | 13,689,865 | | | | 222,739 | | | | 389,047 | |
| | | | | | | | | | | | | | | | | |
| Total Dividends and Distributions to Shareholders | | | | | | | | | | | | | | | | |
| Class S | | | (4,850,318 | ) | | | (1,986,285 | ) | | | — | | | | — | |
| Class A | | | (171,738 | ) | | | (90,235 | ) | | | — | | | | — | |
| Net decrease from dividends and distributions | | | (5,022,056 | ) | | | (2,076,520 | ) | | | — | | | | — | |
| | | | | | | | | | | | | | | | | |
| Fund Share Transactions | | | | | | | | | | | | | | | | |
| Shares sold | | | | | | | | | | | | | | | | |
| Class S | | | 7,285,222 | | | | 8,386,003 | | | | 2,983,468 | | | | 4,277,404 | |
| Class A | | | 157,606 | | | | 246,905 | | | | 1,590,693 | | | | 166,793 | |
| Reinvested dividends and distributions | | | | | | | | | | | | | | | | |
| Class S | | | 4,678,462 | | | | 1,910,895 | | | | — | | | | — | |
| Class A | | | 153,187 | | | | 81,620 | | | | — | | | | — | |
| Shares repurchased | | | | | | | | | | | | | | | | |
| Class S | | | (18,614,974 | ) | | | (25,718,143 | ) | | | (3,436,664 | ) | | | (8,470,654 | ) |
| Class A | | | (809,216 | ) | | | (1,954,040 | ) | | | (1,948,245 | ) | | | (1,480,104 | ) |
| Net decrease from fund share transactions | | | (7,149,713 | ) | | | (17,046,760 | ) | | | (810,748 | ) | | | (5,506,561 | ) |
| | | | | | | | | | | | | | | | | |
| Total net decrease in net assets | | | (24,774,150 | ) | | | (5,433,415 | ) | | | (588,009 | ) | | | (5,117,514 | ) |
| | | | | | | | | | | | | | | | | |
| Net Assets | | | | | | | | | | | | | | | | |
| Beginning of year | | | 81,789,006 | | | | 87,222,421 | | | | 12,770,018 | | | | 17,887,532 | |
| End of year | | $ | 57,014,856 | | | $ | 81,789,006 | | | $ | 12,182,009 | | | $ | 12,770,018 | |
| | | | | | | | | | | | | | | | | |
| Transactions in Fund Shares | | | | | | | | | | | | | | | | |
| Shares sold | | | | | | | | | | | | | | | | |
| Class S | | | 401,962 | | | | 473,772 | | | | 216,530 | | | | 281,772 | |
| Class A | | | 9,765 | | | | 14,777 | | | | 104,331 | | | | 11,365 | |
| Issued to shareholders in reinvestment of distributions | | | | | | | | | | | | | | | | |
| Class S | | | 298,181 | | | | 116,647 | | | | — | | | | — | |
| Class A | | | 10,260 | | | | 5,202 | | | | — | | | | — | |
| Shares repurchased | | | | | | | | | | | | | | | | |
| Class S | | | (1,117,915 | ) | | | (1,511,240 | ) | | | (238,692 | ) | | | (566,523 | ) |
| Class A | | | (50,966 | ) | | | (116,334 | ) | | | (137,727 | ) | | | (98,337 | ) |
| Net decrease | | | (448,713 | ) | | | (1,017,176 | ) | | | (55,558 | ) | | | (371,723 | ) |
| Shares outstanding, beginning of year | | | 4,131,495 | | | | 5,148,671 | | | | 824,827 | | | | 1,196,550 | |
| Shares outstanding, end of year | | | 3,682,782 | | | | 4,131,495 | | | | 769,269 | | | | 824,827 | |
The accompanying notes are an integral part of the financial statements.
| ICON Sector Funds | Statements of Changes in Net Assets |
| | | ICON Information Technology Fund | | ICON Natural Resources Fund |
| | | Year Ended
September 30, 2019 | | Year Ended
September 30, 2018 | | Year Ended
September 30, 2019 | | Year Ended
September 30, 2018 |
| Operations | | | | | | | | | | | | | | | | |
| Net investment income/(loss) | | $ | (142,931 | ) | | $ | (411,753 | ) | | $ | 928,192 | | | $ | 1,608,237 | |
| Net realized gain/(loss) | | | 2,451,694 | | | | 8,085,910 | | | | (5,401,806 | ) | | | 9,330,986 | |
| Change in net unrealized appreciation/(depreciation) | | | (70,871 | ) | | | 166,298 | | | | (2,827,298 | ) | | | (4,314,715 | ) |
| Net increase/(decrease) in net assets resulting from operations | | | 2,237,892 | | | | 7,840,455 | | | | (7,300,912 | ) | | | 6,624,508 | |
| | | | | | | | | | | | | | | | | |
| Total Dividends and Distributions to Shareholders | | | | | | | | | | | | | | | | |
| Class S | | | (7,045,061 | ) | | | (13,288,826 | ) | | | (10,265,181 | ) | | | (926,150 | ) |
| Class C | | | — | | | | — | | | | (184,114 | ) | | | (20,983 | ) |
| Class A | | | (238,720 | ) | | | (488,662 | ) | | | (489,958 | ) | | | (64,170 | ) |
| Net decrease from dividends and distributions | | | (7,283,781 | ) | | | (13,777,488 | ) | | | (10,939,253 | ) | | | (1,011,303 | ) |
| | | | | | | | | | | | | | | | | |
| Fund Share Transactions | | | | | | | | | | | | | | | | |
| Shares sold | | | | | | | | | | | | | | | | |
| Class S | | | 2,706,351 | | | | 8,513,236 | | | | 13,570,652 | | | | 29,189,297 | |
| Class C | | | — | | | | — | | | | 531,929 | | | | 358,860 | |
| Class A | | | 285,579 | | | | 471,172 | | | | 639,333 | | | | 2,692,213 | |
| Reinvested dividends and distributions | | | | | | | | | | | | | | | | |
| Class S | | | 6,871,071 | | | | 12,849,470 | | | | 9,920,274 | | | | 896,662 | |
| Class C | | | — | | | | — | | | | 167,425 | | | | 19,514 | |
| Class A | | | 207,711 | | | | 431,663 | | | | 452,538 | | | | 54,020 | |
| Shares repurchased | | | | | | | | | | | | | | | | |
| Class S | | | (11,955,339 | ) | | | (25,411,771 | ) | | | (28,012,211 | ) | | | (27,779,331 | ) |
| Class C | | | — | | | | — | | | | (669,089 | ) | | | (1,053,050 | ) |
| Class A | | | (918,104 | ) | | | (1,426,575 | ) | | | (1,680,312 | ) | | | (4,497,790 | ) |
| Net decrease from fund share transactions | | | (2,802,731 | ) | | | (4,572,805 | ) | | | (5,079,461 | ) | | | (119,605 | ) |
| | | | | | | | | | | | | | | | | |
| Total net increase/(decrease) in net assets | | | (7,848,620 | ) | | | (10,509,838 | ) | | | (23,319,626 | ) | | | 5,493,600 | |
| | | | | | | | | | | | | | | | | |
| Net Assets | | | | | | | | | | | | | | | | |
| Beginning of year | | | 63,574,552 | | | | 74,084,390 | | | | 82,323,124 | | | | 76,829,524 | |
| End of year | | $ | 55,725,932 | | | $ | 63,574,552 | | | $ | 59,003,498 | | | $ | 82,323,124 | |
| | | | | | | | | | | | | | | | | |
| Transactions in Fund Shares | | | | | | | | | | | | | | | | |
| Shares sold | | | | | | | | | | | | | | | | |
| Class S | | | 187,406 | | | | 490,644 | | | | 1,082,418 | | | | 1,826,509 | |
| Class C | | | — | | | | — | | | | 45,808 | | | | 23,436 | |
| Class A | | | 19,663 | | | | 27,989 | | | | 47,089 | | | | 168,035 | |
| Issued to shareholders in reinvestment of distributions | | | | | | | | | | | | | | | | |
| Class S | | | 567,857 | | | | 798,104 | | | | 915,154 | | | | 57,149 | |
| Class C | | | — | | | | — | | | | 16,255 | | | | 1,304 | |
| Class A | | | 17,953 | | | | 27,778 | | | | 42,097 | | | | 3,481 | |
| Shares repurchased | | | | | | | | | | | | | | | | |
| Class S | | | (820,983 | ) | | | (1,434,351 | ) | | | (2,241,524 | ) | | | (1,740,876 | ) |
| Class C | | | — | | | | — | | | | (59,755 | ) | | | (69,003 | ) |
| Class A | | | (65,328 | ) | | | (81,689 | ) | | | (128,484 | ) | | | (282,127 | ) |
| Net decrease | | | (93,432 | ) | | | (171,525 | ) | | | (280,942 | ) | | | (12,092 | ) |
| Shares outstanding, beginning of year | | | 3,703,232 | | | | 3,874,757 | | | | 5,010,301 | | | | 5,022,393 | |
| Shares outstanding, end of year | | | 3,609,800 | | | | 3,703,232 | | | | 4,729,359 | | | | 5,010,301 | |
The accompanying notes are an integral part of the financial statements.
| Annual Report | September 30, 2019 | 43 |
| ICON Sector Funds | Statements of Changes in Net Assets |
| | | ICON Utilities Fund |
| | | Year Ended September 30, 2019 | | Year Ended September 30, 2018 |
| Operations | | | | | | |
| Net investment income/(loss) | | $ | 1,164,574 | | | $ | 1,140,787 | |
| Net realized gain/(loss) | | | 1,720,446 | | | | (63,162 | ) |
| Change in net unrealized appreciation/(depreciation) | | | 4,843,813 | | | | 149,787 | |
| Net increase/(decrease) in net assets resulting from operations | | | 7,728,833 | | | | 1,227,412 | |
| | | | | | | | | |
| Total Dividends and Distributions to Shareholders | | | | | | | | |
| Class S | | | (1,256,680 | ) | | | (2,743,816 | ) |
| Class A | | | (184,092 | ) | | | (610,900 | ) |
| Net decrease from dividends and distributions | | | (1,440,772 | ) | | | (3,354,716 | ) |
| | | | | | | | | |
| Fund Share Transactions | | | | | | | | |
| Shares sold | | | | | | | | |
| Class S | | | 26,190,608 | | | | 9,480,817 | |
| Class A | | | 1,997,184 | | | | 482,608 | |
| Reinvested dividends and distributions | | | | | | | | |
| Class S | | | 1,217,775 | | | | 2,667,776 | |
| Class A | | | 79,606 | | | | 332,205 | |
| Shares repurchased | | | | | | | | |
| Class S | | | (17,698,891 | ) | | | (15,345,698 | ) |
| Class A | | | (2,439,744 | ) | | | (3,176,944 | ) |
| Net increase/(decrease) from fund share transactions | | | 9,346,538 | | | | (5,559,236 | ) |
| | | | | | | | | |
| Total net increase/(decrease) in net assets | | | 15,634,599 | | | | (7,686,540 | ) |
| | | | | | | | | |
| Net Assets | | | | | | | | |
| Beginning of year | | | 36,423,235 | | | | 44,109,775 | |
| End of year | | $ | 52,057,834 | | | $ | 36,423,235 | |
| | | | | | | | | |
| Transactions in Fund Shares | | | | | | | | |
| Shares sold | | | | | | | | |
| Class S | | | 2,789,173 | | | | 1,072,968 | |
| Class A | | | 218,778 | | | | 55,872 | |
| Issued to shareholders in reinvestment of distributions | | | | | | | | |
| Class S | | | 131,427 | | | | 305,598 | |
| Class A | | | 8,767 | | | | 38,729 | |
| Shares repurchased | | | | | | | | |
| Class S | | | (1,923,279 | ) | | | (1,744,614 | ) |
| Class A | | | (263,469 | ) | | | (364,825 | ) |
| Net increase/(decrease) | | | 961,397 | | | | (636,272 | ) |
| Shares outstanding, beginning of year | | | 4,126,440 | | | | 4,762,712 | |
| Shares outstanding, end of year | | | 5,087,837 | | | | 4,126,440 | |
The accompanying notes are an integral part of the financial statements.
| ICON Consumer Discretionary Fund | Financial Highlights |
For a Share Outstanding Throughout the Periods Presented
| Class S | | Year Ended September 30, 2019 | | Year Ended September 30, 2018 | | Year Ended September 30, 2017 | | Year Ended September 30, 2016 | | Year Ended September 30, 2015 |
| Net asset value, beginning of period | | $ | 13.51 | | | $ | 13.97 | | | $ | 13.55 | | | $ | 14.27 | | | $ | 15.55 | |
| Income/(loss) from investment operations: | | | | | | | | | | | | | | | | | | | | |
| Net investment income/(loss)(a) | | | (0.06 | ) | | | (0.06 | ) | | | (0.06 | ) | | | (0.03 | ) | | | (0.07 | ) |
| Net realized and unrealized gains/(losses) on investments | | | (0.42 | ) | | | 0.10 | | | | 1.25 | | | | 0.65 | | | | 1.03 | |
| Total from investment operations | | | (0.48 | ) | | | 0.04 | | | | 1.19 | | | | 0.62 | | | | 0.96 | |
| | | | | | | | | | | | | | | | | | | | | |
| Less dividends and distributions: | | | | | | | | | | | | | | | | | | | | |
| Distributions from net realized gains | | | — | | | | (0.50 | ) | | | (0.77 | ) | | | (1.34 | ) | | | (2.24 | ) |
| Total dividends and distributions | | | — | | | | (0.50 | ) | | | (0.77 | ) | | | (1.34 | ) | | | (2.24 | ) |
| | | | | | | | | | | | | | | | | | | | | |
| Net asset value, end of period | | $ | 13.03 | | | $ | 13.51 | | | $ | 13.97 | | | $ | 13.55 | | | $ | 14.27 | |
| | | | | | | | | | | | | | | | | | | | | |
| Total Return | | | (3.55 | )% | | | 0.14 | % | | | 8.93 | % | | | 4.49 | % | | | 5.80 | % |
| | | | | | | | | | | | | | | | | | | | | |
| Ratios and Supplemental Data | | | | | | | | | | | | | | | | | | | | |
| Net assets, end of period (in 000s) | | $ | 19,401 | | | $ | 22,755 | | | $ | 24,566 | | | $ | 37,263 | | | $ | 44,913 | |
| | | | | | | | | | | | | | | | | | | | | |
| Ratio of expenses to average net assets | | | | | | | | | | | | | | | | | | | | |
| Before expense limitation | | | 1.71 | % | | | 1.60 | % | | | 1.46 | % | | | 1.42 | % | | | 1.43 | % |
| After expense limitation(b) | | | 1.71 | % | | | 1.60 | % | | | 1.46 | % | | | 1.42 | % | | | 1.43 | % |
| Ratio of net investment income/(loss) to average net assets | | | | | | | | | | | | | | | | | | | | |
| Before expense limitation | | | (0.47 | )% | | | (0.44 | )% | | | (0.43 | )% | | | (0.22 | )% | | | (0.44 | )% |
| After expense limitation(b) | | | (0.47 | )% | | | (0.44 | )% | | | (0.43 | )% | | | (0.22 | )% | | | (0.44 | )% |
| Portfolio turnover rate | | | 163 | % | | | 137 | % | | | 152 | % | | | 158 | % | | | 201 | % |
| (a) | Calculated using the average shares method. |
| (b) | The Fund’s operating expenses, not including interest expense, are contractually limited to the amounts discussed in Note 3. The ratios in these financial highlights reflect the limitation, including the interest expense, when applicable. |
The accompanying notes are an integral part of the financial statements.
| Annual Report | September 30, 2019 | 45 |
| ICON Consumer Discretionary Fund | Financial Highlights |
For a Share Outstanding Throughout the Periods Presented
| Class A(a) | | Year Ended
September 30, 2019 | | Year Ended
September 30, 2018 | | Year Ended
September 30, 2017 | | Year Ended
September 30, 2016 | | Year Ended
September 30, 2015 |
| Net asset value, beginning of period | | $ | 12.85 | | | $ | 13.36 | | | $ | 13.06 | | | $ | 13.88 | | | $ | 15.24 | |
| Income/(loss) from investment operations: | | | | | | | | | | | | | | | | | | | | |
| Net investment income/(loss)(b) | | | (0.09 | ) | | | (0.11 | ) | | | (0.13 | ) | | | (0.10 | ) | | | (0.14 | ) |
| Net realized and unrealized gains/(losses) on investments | | | (0.41 | ) | | | 0.10 | | | | 1.20 | | | | 0.62 | | | | 1.02 | |
| Total from investment operations | | | (0.50 | ) | | | (0.01 | ) | | | 1.07 | | | | 0.52 | | | | 0.88 | |
| | | | | | | | | | | | | | | | | | | | | |
| Less dividends and distributions: | | | | | | | | | | | | | | | | | | | | |
| Distributions from net realized gains | | | — | | | | (0.50 | ) | | | (0.77 | ) | | | (1.34 | ) | | | (2.24 | ) |
| Total dividends and distributions | | | — | | | | (0.50 | ) | | | (0.77 | ) | | | (1.34 | ) | | | (2.24 | ) |
| | | | | | | | | | | | | | | | | | | | | |
| Net asset value, end of period | | $ | 12.35 | | | $ | 12.85 | | | $ | 13.36 | | | $ | 13.06 | | | $ | 13.88 | |
| | | | | | | | | | | | | | | | | | | | | |
| Total Return(c) | | | (3.89 | )% | | | (0.24 | )% | | | 8.32 | % | | | 3.86 | % | | | 5.34 | % |
| | | | | | | | | | | | | | | | | | | | | |
| Ratios and Supplemental Data | | | | | | | | | | | | | | | | | | | | |
| Net assets, end of period (in 000s) | | $ | 683 | | | $ | 1,495 | | | $ | 1,474 | | | $ | 2,368 | | | $ | 2,999 | |
| | | | | | | | | | | | | | | | | | | | | |
| Ratio of expenses to average net assets | | | | | | | | | | | | | | | | | | | | |
| Before expense limitation | | | 2.98 | % | | | 2.28 | % | | | 2.22 | % | | | 2.13 | % | | | 1.91 | % |
| After expense limitation(d) | | | 1.99 | % | | | 1.99 | % | | | 1.99 | % | | | 1.99 | % | | | 1.91 | % |
| Ratio of net investment income/(loss) to average net assets | | | | | | | | | | | | | | | | | | | | |
| Before expense limitation | | | (1.72 | )% | | | (1.14 | )% | | | (1.20 | )% | | | (0.92 | )% | | | (0.97 | )% |
| After expense limitation(d) | | | (0.73 | )% | | | (0.85 | )% | | | (0.97 | )% | | | (0.78 | )% | | | (0.97 | )% |
| Portfolio turnover rate | | | 163 | % | | | 137 | % | | | 152 | % | | | 158 | % | | | 201 | % |
| (a) | Class C shares were merged into Class A on September 25, 2015. The amounts presented represent the results of the Class A shares for the periods prior to the merger and the results of the combined share class for the period subsequent to the merger. |
| (b) | Calculated using the average shares method. |
| (c) | The total return calculation excludes any sales charges. |
| (d) | The Fund’s operating expenses, not including interest expense, are contractually limited to the amounts discussed in Note 3. The ratios in these financial highlights reflect the limitation, including the interest expense, when applicable. |
The accompanying notes are an integral part of the financial statements.
| ICON Consumer Staples Fund | Financial Highlights |
For a Share Outstanding Throughout the Periods Presented
| Class S | | Year Ended September 30, 2019 | | Year Ended September 30, 2018 | | Year Ended September 30, 2017 | | Year Ended September 30, 2016 | | Year Ended September 30, 2015 |
| Net asset value, beginning of period | | $ | 6.66 | | | $ | 7.43 | | | $ | 7.98 | | | $ | 9.20 | | | $ | 11.55 | |
| Income/(loss) from investment operations: | | | | | | | | | | | | | | | | | | | | |
| Net investment income/(loss)(a) | | | 0.05 | | | | 0.06 | | | | 0.02 | | | | 0.02 | | | | 0.04 | |
| Net realized and unrealized gains/(losses) on investments | | | 0.15 | | | | 0.01 | | | | 0.41 | | | | 0.96 | | | | 0.98 | |
| Total from investment operations | | | 0.20 | | | | 0.07 | | | | 0.43 | | | | 0.98 | | | | 1.02 | |
| | | | | | | | | | | | | | | | | | | | | |
| Less dividends and distributions: | | | | | | | | | | | | | | | | | | | | |
| Dividends from net investment income | | | (0.09 | ) | | | (0.01 | ) | | | (0.02 | ) | | | (0.00 | )(b) | | | (0.22 | ) |
| Distributions from net realized gains | | | — | | | | (0.83 | ) | | | (0.96 | ) | | | (2.20 | ) | | | (3.15 | ) |
| Total dividends and distributions | | | (0.09 | ) | | | (0.84 | ) | | | (0.98 | ) | | | (2.20 | ) | | | (3.37 | ) |
| | | | | | | | | | | | | | | | | | | | | |
| Net asset value, end of period | | $ | 6.77 | | | $ | 6.66 | | | $ | 7.43 | | | $ | 7.98 | | | $ | 9.20 | |
| | | | | | | | | | | | | | | | | | | | | |
| Total Return | | | 3.12 | % | | | 0.50 | % | | | 6.15 | % | | | 12.09 | % | | | 8.66 | % |
| | | | | | | | | | | | | | | | | | | | | |
| Ratios and Supplemental Data | | | | | | | | | | | | | | | | | | | | |
| Net assets, end of period (in 000s) | | $ | 9,970 | | | $ | 5,275 | | | $ | 24,069 | | | $ | 31,799 | | | $ | 8,651 | |
| | | | | | | | | | | | | | | | | | | | | |
| Ratio of expenses to average net assets | | | | | | | | | | | | | | | | | | | | |
| Before expense limitation | | | 2.25 | % | | | 2.17 | % | | | 1.70 | % | | | 1.74 | % | | | 1.87 | % |
| After expense limitation(c) | | | 1.50 | % | | | 1.51 | % | | | 1.50 | % | | | 1.51 | % | | | 1.51 | % |
| Ratio of net investment income/(loss) to average net assets | | | | | | | | | | | | | | | | | | | | |
| Before expense limitation | | | 0.09 | % | | | 0.28 | % | | | 0.04 | % | | | 0.00 | %(d) | | | (0.01 | )% |
| After expense limitation(c) | | | 0.84 | % | | | 0.94 | % | | | 0.24 | % | | | 0.23 | % | | | 0.35 | % |
| Portfolio turnover rate | | | 192 | % | | | 58 | % | | | 118 | % | | | 125 | % | | | 16 | % |
| (a) | Calculated using the average shares method. |
| (b) | Amount less than $(0.005). |
| (c) | The Fund’s operating expenses, not including interest expense, are contractually limited to the amounts discussed in Note 3. The ratios in these financial highlights reflect the limitation, including the interest expense, when applicable. |
| (d) | Less than 0.005% of average net assets. |
The accompanying notes are an integral part of the financial statements.
| Annual Report | September 30, 2019 | 47 |
| ICON Consumer Staples Fund | Financial Highlights |
For a Share Outstanding Throughout the Periods Presented
| Class A(a) | | Year Ended September 30, 2019 | | Year Ended September 30, 2018 | | Year Ended September 30, 2017 | | Year Ended September 30, 2016 | | Year Ended September 30, 2015 |
| Net asset value, beginning of period | | $ | 6.61 | | | $ | 7.40 | | | $ | 7.96 | | | $ | 9.19 | | | $ | 11.58 | |
| Income/(loss) from investment operations: | | | | | | | | | | | | | | | | | | | | |
| Net investment income/(loss)(b) | | | 0.04 | | | | 0.06 | | | | (0.01 | ) | | | (0.00 | )(c) | | | 0.02 | |
| Net realized and unrealized gains/(losses) on investments | | | 0.15 | | | | (0.01 | ) | | | 0.42 | | | | 0.97 | | | | 0.97 | |
| Total from investment operations | | | 0.19 | | | | 0.05 | | | | 0.41 | | | | 0.97 | | | | 0.99 | |
| | | | | | | | | | | | | | | | | | | | | |
| Less dividends and distributions: | | | | | | | | | | | | | | | | | | | | |
| Dividends from net investment income | | | (0.06 | ) | | | (0.01 | ) | | | (0.01 | ) | | | (0.00 | )(c) | | | (0.23 | ) |
| Distributions from net realized gains | | | — | | | | (0.83 | ) | | | (0.96 | ) | | | (2.20 | ) | | | (3.15 | ) |
| Total dividends and distributions | | | (0.06 | ) | | | (0.84 | ) | | | (0.97 | ) | | | (2.20 | ) | | | (3.38 | ) |
| | | | | | | | | | | | | | | | | | | | | |
| Net asset value, end of period | | $ | 6.74 | | | $ | 6.61 | | | $ | 7.40 | | | $ | 7.96 | | | $ | 9.19 | |
| | | | | | | | | | | | | | | | | | | | | |
| Total Return(d) | | | 3.04 | % | | | 0.17 | % | | | 5.91 | % | | | 11.93 | % | | | 8.32 | % |
| | | | | | | | | | | | | | | | | | | | | |
| Ratios and Supplemental Data | | | | | | | | | | | | | | | | | | | | |
| Net assets, end of period (in 000s) | | $ | 1,341 | | | $ | 1,738 | | | $ | 3,473 | | | $ | 8,409 | | | $ | 3,602 | |
| | | | | | | | | | | | | | | | | | | | | |
| Ratio of expenses to average net assets | | | | | | | | | | | | | | | | | | | | |
| Before expense limitation | | | 2.77 | % | | | 2.29 | % | | | 1.97 | % | | | 1.97 | % | | | 2.12 | % |
| After expense limitation(e) | | | 1.75 | % | | | 1.77 | % | | | 1.75 | % | | | 1.76 | % | | | 1.76 | % |
| Ratio of net investment income/(loss) to average net assets | | | | | | | | | | | | | | | | | | | | |
| Before expense limitation | | | (0.36 | )% | | | 0.31 | % | | | (0.30 | )% | | | (0.23 | )% | | | (0.15 | )% |
| After expense limitation(e) | | | 0.66 | % | | | 0.83 | % | | | (0.08 | )% | | | (0.02 | )% | | | 0.21 | % |
| Portfolio turnover rate | | | 192 | % | | | 58 | % | | | 118 | % | | | 125 | % | | | 16 | % |
| (a) | Class C shares were merged into Class A on September 25, 2015. The amounts presented represent the results of the Class A shares for the periods prior to the merger and the results of the combined share class for the period subsequent to the merger. |
| (b) | Calculated using the average shares method. |
| (c) | Amount less than $(0.005). |
| (d) | The total return calculation excludes any sales charges. |
| (e) | The Fund’s operating expenses, not including interest expense, are contractually limited to the amounts discussed in Note 3. The ratios in these financial highlights reflect the limitation, including the interest expense, when applicable. |
The accompanying notes are an integral part of the financial statements.
| ICON Energy Fund | Financial Highlights |
For a Share Outstanding Throughout the Periods Presented
| Class S | | Year Ended September 30, 2019 | | Year Ended September 30, 2018 | | Year Ended September 30, 2017 | | Year Ended September 30, 2016 | | Year Ended September 30, 2015 |
| Net asset value, beginning of period | | $ | 12.95 | | | $ | 12.53 | | | $ | 12.66 | | | $ | 11.17 | | | $ | 22.30 | |
| Income/(loss) from investment operations: | | | | | | | | | | | | | | | | | | | | |
| Net investment income/(loss)(a) | | | 0.10 | | | | 0.04 | | | | 0.06 | | | | 0.24 | | | | 0.11 | |
| Net realized and unrealized gains/(losses) on investments | | | (3.72 | ) | | | 0.58 | | | | (0.11 | ) | | | 1.36 | | | | (7.42 | ) |
| Total from investment operations | | | (3.62 | ) | | | 0.62 | | | | (0.05 | ) | | | 1.60 | | | | (7.31 | ) |
| | | | | | | | | | | | | | | | | | | | | |
| Less dividends and distributions: | | | | | | | | | | | | | | | | | | | | |
| Dividends from net investment income | | | (0.00 | )(b) | | | (0.20 | ) | | | (0.08 | ) | | | (0.11 | ) | | | (0.09 | ) |
| Distributions from net realized gains | | | — | | | | — | | | | — | | | | — | | | | (3.73 | ) |
| Return of capital | | | (0.04 | ) | | | — | | | | — | | | | — | | | | — | |
| Total dividends and distributions | | | (0.04 | ) | | | (0.20 | ) | | | (0.08 | ) | | | (0.11 | ) | | | (3.82 | ) |
| | | | | | | | | | | | | | | | | | | | | |
| Net asset value, end of period | | $ | 9.29 | | | $ | 12.95 | | | $ | 12.53 | | | $ | 12.66 | | | $ | 11.17 | |
| | | | | | | | | | | | | | | | | | | | | |
| Total Return | | | (27.95 | )% | | | 4.99 | % | | | (0.44 | )% | | | 14.55 | % | | | (36.37 | )% |
| | | | | | | | | | | | | | | | | | | | | |
| Ratios and Supplemental Data | | | | | | | | | | | | | | | | | | | | |
| Net assets, end of period (in 000s) | | $ | 94,594 | | | $ | 169,661 | | | $ | 222,707 | | | $ | 327,497 | | | $ | 320,486 | |
| | | | | | | | | | | | | | | | | | | | | |
| Ratio of expenses to average net assets | | | | | | | | | | | | | | | | | | | | |
| Before expense limitation | | | 1.63 | % | | | 1.50 | % | | | 1.41 | % | | | 1.44 | % | | | 1.42 | % |
| After expense limitation(c) | | | 1.50 | % | | | 1.50 | % | | | 1.41 | % | | | 1.44 | % | | | 1.42 | % |
| Ratio of net investment income/(loss) to average net assets | | | | | | | | | | | | | | | | | | | | |
| Before expense limitation | | | 0.87 | % | | | 0.28 | % | | | 0.46 | % | | | 2.04 | % | | | 0.74 | % |
| After expense limitation(c) | | | 1.00 | % | | | 0.28 | % | | | 0.46 | % | | | 2.04 | % | | | 0.74 | % |
| Portfolio turnover rate | | | 69 | % | | | 69 | % | | | 74 | % | | | 99 | % | | | 154 | % |
| (a) | Calculated using the average shares method. |
| (b) | Amount less than $(0.005). |
| (c) | The Fund’s operating expenses, not including interest expense, are contractually limited to the amounts discussed in Note 3. The ratios in these financial highlights reflect the limitation, including the interest expense, when applicable. |
The accompanying notes are an integral part of the financial statements.
| Annual Report | September 30, 2019 | 49 |
| ICON Energy Fund | Financial Highlights |
For a Share Outstanding Throughout the Periods Presented
| Class C | | Year Ended
September 30, 2019 | | Year Ended
September 30, 2018 | | Year Ended
September 30, 2017 | | Year Ended
September 30, 2016 | | Year Ended
September 30, 2015 |
| Net asset value, beginning of period | | $ | 12.21 | | | $ | 11.92 | | | $ | 12.14 | | | $ | 10.77 | | | $ | 21.74 | |
| Income/(loss) from investment operations: | | | | | | | | | | | | | | | | | | | | |
| Net investment income/(loss)(a) | | | 0.00 | (b)(c) | | | (0.08 | ) | | | (0.07 | ) | | | 0.11 | | | | (0.04 | ) |
| Net realized and unrealized gains/(losses) on investments | | | (3.50 | ) | | | 0.54 | | | | (0.11 | ) | | | 1.31 | | | | (7.20 | ) |
| Total from investment operations | | | (3.50 | ) | | | 0.46 | | | | (0.18 | ) | | | 1.42 | | | | (7.24 | ) |
| | | | | | | | | | | | | | | | | | | | | |
| Less dividends and distributions: | | | | | | | | | | | | | | | | | | | | |
| Dividends from net investment income | | | (0.00 | )(d) | | | (0.17 | ) | | | (0.04 | ) | | | (0.05 | ) | | | — | |
| Distributions from net realized gains | | | — | | | | — | | | | — | | | | — | | | | (3.73 | ) |
| Return of capital | | | (0.01 | ) | | | — | | | | — | | | | — | | | | — | |
| Total dividends and distributions | | | (0.01 | ) | | | (0.17 | ) | | | (0.04 | ) | | | (0.05 | ) | | | (3.73 | ) |
| | | | | | | | | | | | | | | | | | | | | |
| Redemption fees | | | — | | | | 0.00 | (b) | | | — | | | | — | | | | — | |
| Net asset value, end of period | | $ | 8.70 | | | $ | 12.21 | | | $ | 11.92 | | | $ | 12.14 | | | $ | 10.77 | |
| | | | | | | | | | | | | | | | | | | | | |
| Total Return(e) | | | (28.64 | )% | | | 3.87 | % | | | (1.46 | )% | | | 13.31 | % | | | (36.99 | )% |
| | | | | | | | | | | | | | | | | | | | | |
| Ratios and Supplemental Data | | | | | | | | | | | | | | | | | | | | |
| Net assets, end of period (in 000s) | | $ | 3,259 | | | $ | 4,941 | | | $ | 7,333 | | | $ | 10,124 | | | $ | 9,972 | |
| | | | | | | | | | | | | | | | | | | | | |
| Ratio of expenses to average net assets | | | | | | | | | | | | | | | | | | | | |
| Before expense limitation | | | 2.74 | % | | | 2.55 | % | | | 2.47 | % | | | 2.49 | % | | | 2.43 | % |
| After expense limitation(f) | | | 2.50 | % | | | 2.50 | % | | | 2.47 | % | | | 2.49 | % | | | 2.43 | % |
| Ratio of net investment income/(loss) to average net assets | | | | | | | | | | | | | | | | | | | | |
| Before expense limitation | | | (0.22 | )% | | | (0.76 | )% | | | (0.61 | )% | | | 0.99 | % | | | (0.26 | )% |
| After expense limitation(f) | | | 0.02 | % | | | (0.71 | )% | | | (0.61 | )% | | | 0.99 | % | | | (0.26 | )% |
| Portfolio turnover rate | | | 69 | % | | | 69 | % | | | 74 | % | | | 99 | % | | | 154 | % |
| (a) | Calculated using the average shares method. |
| (b) | Amount less than $0.005. |
| (c) | The per share amount does not correspond to activity reflected in the Statement of Operations due to class specific expenses during the period. |
| (d) | Amount less than $(0.005). |
| (e) | The total return calculation excludes any sales charges. |
| (f) | The Fund’s operating expenses, not including interest expense, are contractually limited to the amounts discussed in Note 3. The ratios in these financial highlights reflect the limitation, including the interest expense, when applicable. |
The accompanying notes are an integral part of the financial statements.
| ICON Energy Fund | Financial Highlights |
For a Share Outstanding Throughout the Periods Presented
| Class A | | Year Ended
September 30, 2019 | | | Year Ended
September 30, 2018 | | | Year Ended
September 30, 2017 | | | Year Ended
September 30, 2016 | | | Year Ended
September 30, 2015 | |
| Net asset value, beginning of period | | $ | 12.83 | | | $ | 12.44 | | | $ | 12.60 | | | $ | 11.11 | | | $ | 22.20 | |
| Income/(loss) from investment operations: | | | | | | | | | | | | | | | | | | | | |
| Net investment income/(loss)(a) | | | 0.07 | | | | 0.01 | | | | 0.02 | | | | 0.21 | | | | 0.07 | |
| Net realized and unrealized gains/(losses) on investments | | | (3.68 | ) | | | 0.57 | | | | (0.11 | ) | | | 1.35 | | | | (7.39 | ) |
| Total from investment operations | | | (3.61 | ) | | | 0.58 | | | | (0.09 | ) | | | 1.56 | | | | (7.32 | ) |
| | | | | | | | | | | | | | | | | | | | | |
| Less dividends and distributions: | | | | | | | | | | | | | | | | | | | | |
| Dividends from net investment income | | | (0.00 | )(b) | | | (0.19 | ) | | | (0.07 | ) | | | (0.07 | ) | | | (0.04 | ) |
| Distributions from net realized gains | | | — | | | | — | | | | — | | | | — | | | | (3.73 | ) |
| Return of capital | | | (0.03 | ) | | | — | | | | — | | | | — | | | | — | |
| Total dividends and distributions | | | (0.03 | ) | | | (0.19 | ) | | | (0.07 | ) | | | (0.07 | ) | | | (3.77 | ) |
| | | | | | | | | | | | | | | | | | | | | |
| Net asset value, end of period | | $ | 9.19 | | | $ | 12.83 | | | $ | 12.44 | | | $ | 12.60 | | | $ | 11.11 | |
| | | | | | | | | | | | | | | | | | | | | |
| Total Return(c) | | | (28.11 | )% | | | 4.71 | % | | | (0.76 | )% | | | 14.19 | % | | | (36.55 | )% |
| | | | | | | | | | | | | | | | | | | | | |
| Ratios and Supplemental Data | | | | | | | | | | | | | | | | | | | | |
| Net assets, end of period (in 000s) | | $ | 3,189 | | | $ | 6,394 | | | $ | 9,312 | | | $ | 14,648 | | | $ | 14,588 | |
| | | | | | | | | | | | | | | | | | | | | |
| Ratio of expenses to average net assets | | | | | | | | | | | | | | | | | | | | |
| Before expense limitation | | | 1.97 | % | | | 1.75 | % | | | 1.72 | % | | | 1.73 | % | | | 1.66 | % |
| After expense limitation(d) | | | 1.75 | % | | | 1.75 | % | | | 1.72 | % | | | 1.73 | % | | | 1.66 | % |
| Ratio of net investment income/(loss) to average net assets | | | | | | | | | | | | | | | | | | | | |
| Before expense limitation | | | 0.51 | % | | | 0.06 | % | | | 0.15 | % | | | 1.77 | % | | | 0.50 | % |
| After expense limitation(d) | | | 0.73 | % | | | 0.06 | % | | | 0.15 | % | | | 1.77 | % | | | 0.50 | % |
| Portfolio turnover rate | | | 69 | % | | | 69 | % | | | 74 | % | | | 99 | % | | | 154 | % |
| (a) | Calculated using the average shares method. |
| (b) | Amount less than $(0.005). |
| (c) | The total return calculation excludes any sales charges. |
| (d) | The Fund’s operating expenses, not including interest expense, are contractually limited to the amounts discussed in Note 3. The ratios in these financial highlights reflect the limitation, including the interest expense, when applicable. |
The accompanying notes are an integral part of the financial statements.
| Annual Report | September 30, 2019 | 51 |
| ICON Financial Fund | Financial Highlights |
For a Share Outstanding Throughout the Periods Presented
| Class S | | Year Ended
September 30, 2019 | | | Year Ended
September 30, 2018 | | | Year Ended
September 30, 2017 | | | Year Ended
September 30, 2016 | | | Year Ended
September 30, 2015 | |
| Net asset value, beginning of period | | $ | 10.97 | | | $ | 9.95 | | | $ | 7.67 | | | $ | 7.74 | | | $ | 7.83 | |
| Income/(loss) from investment operations: | | | | | | | | | | | | | | | | | | | | |
| Net investment income/(loss)(a) | | | 0.08 | | | | 0.05 | | | | 0.03 | | | | 0.08 | | | | 0.04 | |
| Net realized and unrealized gains/(losses) on investments | | | (0.23 | ) | | | 0.99 | | | | 2.34 | | | | (0.15 | ) | | | (0.08 | ) |
| Total from investment operations | | | (0.15 | ) | | | 1.04 | | | | 2.37 | | | | (0.07 | ) | | | (0.04 | ) |
| | | | | | | | | | | | | | | | | | | | | |
| Less dividends and distributions: | | | | | | | | | | | | | | | | | | | | |
| Dividends from net investment income | | | (0.07 | ) | | | (0.02 | ) | | | (0.09 | ) | | | — | | | | (0.05 | ) |
| Total dividends and distributions | | | (0.07 | ) | | | (0.02 | ) | | | (0.09 | ) | | | — | | | | (0.05 | ) |
| | | | | | | | | | | | | | | | | | | | | |
| Net asset value, end of period | | $ | 10.75 | | | $ | 10.97 | | | $ | 9.95 | | | $ | 7.67 | | | $ | 7.74 | |
| | | | | | | | | | | | | | | | | | | | | |
| Total Return | | | (1.26 | )% | | | 10.48 | % | | | 30.96 | % | | | (0.90 | )% | | | (0.55 | )% |
| | | | | | | | | | | | | | | | | | | | | |
| Ratios and Supplemental Data | | | | | | | | | | | | | | | | | | | | |
| Net assets, end of period (in 000s) | | $ | 34,578 | | | $ | 43,500 | | | $ | 39,072 | | | $ | 43,354 | | | $ | 49,106 | |
| | | | | | | | | | | | | | | | | | | | | |
| Ratio of expenses to average net assets | | | | | | | | | | | | | | | | | | | | |
| Before expense limitation | | | 1.54 | % | | | 1.44 | % | | | 1.40 | % | | | 1.40 | % | | | 1.49 | % |
| After expense limitation(b) | | | 1.50 | % | | | 1.44 | % | | | 1.40 | % | | | 1.40 | % | | | 1.49 | % |
| Ratio of net investment income/(loss) to average net assets | | | | | | | | | | | | | | | | | | | | |
| Before expense limitation | | | 0.77 | % | | | 0.41 | % | | | 0.28 | % | | | 1.00 | % | | | 0.52 | % |
| After expense limitation(b) | | | 0.81 | % | | | 0.41 | % | | | 0.28 | % | | | 1.00 | % | | | 0.52 | % |
| Portfolio turnover rate | | | 28 | % | | | 44 | % | | | 68 | % | | | 49 | % | | | 51 | % |
| (a) | Calculated using the average shares method. |
| (b) | The Fund’s operating expenses, not including interest expense, are contractually limited to the amounts discussed in Note 3. The ratios in these financial highlights reflect the limitation, including the interest expense, when applicable. |
The accompanying notes are an integral part of the financial statements.
| ICON Financial Fund | Financial Highlights |
For a Share Outstanding Throughout the Periods Presented
| Class A(a) | | Year Ended
September 30, 2019 | | | Year Ended
September 30, 2018 | | | Year Ended
September 30, 2017 | | | Year Ended
September 30, 2016 | | | Year Ended
September 30, 2015 | |
| Net asset value, beginning of period | | $ | 10.98 | | | $ | 9.99 | | | $ | 7.71 | | | $ | 7.82 | | | $ | 7.89 | |
| Income/(loss) from investment operations: | | | | | | | | | | | | | | | | | | | | |
| Net investment income/(loss)(b) | | | 0.06 | | | | 0.01 | | | | (0.01 | ) | | | 0.05 | | | | 0.02 | |
| Net realized and unrealized gains/(losses) on investments | | | (0.24 | ) | | | 0.99 | | | | 2.37 | | | | (0.16 | ) | | | (0.07 | ) |
| Total from investment operations | | | (0.18 | ) | | | 1.00 | | | | 2.36 | | | | (0.11 | ) | | | (0.05 | ) |
| | | | | | | | | | | | | | | | | | | | | |
| Less dividends and distributions: | | | | | | | | | | | | | | | | | | | | |
| Dividends from net investment income | | | (0.06 | ) | | | (0.01 | ) | | | (0.08 | ) | | | — | | | | (0.02 | ) |
| Total dividends and distributions | | | (0.06 | ) | | | (0.01 | ) | | | (0.08 | ) | | | — | | | | (0.02 | ) |
| | | | | | | | | | | | | | | | | | | | | |
| Net asset value, end of period | | $ | 10.74 | | | $ | 10.98 | | | $ | 9.99 | | | $ | 7.71 | | | $ | 7.82 | |
| | | | | | | | | | | | | | | | | | | | | |
| Total Return(c) | | | (1.51 | )% | | | 10.04 | % | | | 30.68 | % | | | (1.41 | )% | | | (0.69 | )% |
| | | | | | | | | | | | | | | | | | | | | |
| Ratios and Supplemental Data | | | | | | | | | | | | | | | | | | | | |
| Net assets, end of period (in 000s) | | $ | 1,487 | | | $ | 1,512 | | | $ | 2,119 | | | $ | 2,542 | | | $ | 1,974 | |
| | | | | | | | | | | | | | | | | | | | | |
| Ratio of expenses to average net assets | | | | | | | | | | | | | | | | | | | | |
| Before expense limitation | | | 2.24 | % | | | 1.98 | % | | | 2.05 | % | | | 2.12 | % | | | 2.19 | % |
| After expense limitation(d) | | | 1.75 | % | | | 1.75 | % | | | 1.75 | % | | | 1.75 | % | | | 1.75 | % |
| Ratio of net investment income/(loss) to average net assets | | | | | | | | | | | | | | | | | | | | |
| Before expense limitation | | | 0.06 | % | | | (0.13 | )% | | | (0.37 | )% | | | 0.26 | % | | | (0.15 | )% |
| After expense limitation(d) | | | 0.55 | % | | | 0.10 | % | | | (0.07 | )% | | | 0.63 | % | | | 0.29 | % |
| Portfolio turnover rate | | | 28 | % | | | 44 | % | | | 68 | % | | | 49 | % | | | 51 | % |
| (a) | Class C shares were merged into Class A on September 25, 2015. The amounts presented represent the results of the Class A shares for the periods prior to the merger and the results of the combined share class for the period subsequent to the merger. |
| (b) | Calculated using the average shares method. |
| (c) | The total return calculation excludes any sales charges. |
| (d) | The Fund’s operating expenses, not including interest expense, are contractually limited to the amounts discussed in Note 3. The ratios in these financial highlights reflect the limitation, including the interest expense, when applicable. |
The accompanying notes are an integral part of the financial statements.
| Annual Report | September 30, 2019 | 53 |
| ICON Healthcare Fund | Financial Highlights |
For a Share Outstanding Throughout the Periods Presented
| Class S | | Year Ended
September 30, 2019 | | | Year Ended
September 30, 2018 | | | Year Ended
September 30, 2017 | | | Year Ended
September 30, 2016 | | | Year Ended
September 30, 2015 | |
| Net asset value, beginning of period | | $ | 19.83 | | | $ | 16.97 | | | $ | 15.40 | | | $ | 17.83 | | | $ | 22.42 | |
| Income/(loss) from investment operations: | | | | | | | | | | | | | | | | | | | | |
| Net investment income/(loss)(a) | | | (0.08 | ) | | | (0.10 | ) | | | (0.05 | ) | | | (0.04 | ) | | | (0.09 | ) |
| Net realized and unrealized gains/(losses) on investments | | | (3.05 | ) | | | 3.38 | | | | 1.86 | | | | 1.54 | | | | 1.02 | |
| Total from investment operations | | | (3.13 | ) | | | 3.28 | | | | 1.81 | | | | 1.50 | | | | 0.93 | |
| | | | | | | | | | | | | | | | | | | | | |
| Less dividends and distributions: | | | | | | | | | | | | | | | | | | | | |
| Distributions from net realized gains | | | (1.19 | ) | | | (0.42 | ) | | | (0.24 | ) | | | (3.93 | ) | | | (5.52 | ) |
| Total dividends and distributions | | | (1.19 | ) | | | (0.42 | ) | | | (0.24 | ) | | | (3.93 | ) | | | (5.52 | ) |
| | | | | | | | | | | | | | | | | | | | | |
| Net asset value, end of period | | $ | 15.51 | | | $ | 19.83 | | | $ | 16.97 | | | $ | 15.40 | | | $ | 17.83 | |
| | | | | | | | | | | | | | | | | | | | | |
| Total Return | | | (15.83 | )% | | | 19.84 | % | | | 11.94 | % | | | 9.44 | % | | | 2.55 | % |
| | | | | | | | | | | | | | | | | | | | | |
| Ratios and Supplemental Data | | | | | | | | | | | | | | | | | | | | |
| Net assets, end of period (in 000s) | | $ | 55,283 | | | $ | 78,975 | | | $ | 83,234 | | | $ | 76,218 | | | $ | 95,109 | |
| | | | | | | | | | | | | | | | | | | | | |
| Ratio of expenses to average net assets | | | | | | | | | | | | | | | | | | | | |
| Before expense limitation | | | 1.51 | % | | | 1.45 | % | | | 1.41 | % | | | 1.44 | % | | | 1.36 | % |
| After expense limitation(b) | | | 1.50 | % | | | 1.45 | % | | | 1.41 | % | | | 1.44 | % | | | 1.36 | % |
| Ratio of net investment income/(loss) to average net assets | | | | | | | | | | | | | | | | | | | | |
| Before expense limitation | | | (0.47 | )% | | | (0.60 | )% | | | (0.33 | )% | | | (0.26 | )% | | | (0.45 | )% |
| After expense limitation(b) | | | (0.46 | )% | | | (0.60 | )% | | | (0.33 | )% | | | (0.26 | )% | | | (0.45 | )% |
| Portfolio turnover rate | | | 26 | % | | | 63 | % | | | 174 | % | | | 107 | % | | | 141 | % |
| (a) | Calculated using the average shares method. |
| (b) | The Fund’s operating expenses, not including interest expense, are contractually limited to the amounts discussed in Note 3. The ratios in these financial highlights reflect the limitation, including the interest expense, when applicable. |
The accompanying notes are an integral part of the financial statements.
| ICON Healthcare Fund | Financial Highlights |
For a Share Outstanding Throughout the Periods Presented
| Class A(a) | | Year Ended
September 30, 2019 | | | Year Ended
September 30, 2018 | | | Year Ended
September 30, 2017 | | | Year Ended
September 30, 2016 | | | Year Ended
September 30, 2015 | |
| Net asset value, beginning of period | | $ | 18.95 | | | $ | 16.29 | | | $ | 14.84 | | | $ | 17.37 | | | $ | 22.01 | |
| Income/(loss) from investment operations: | | | | | | | | | | | | | | | | | | | | |
| Net investment income/(loss)(b) | | | (0.11 | ) | | | (0.15 | ) | | | (0.10 | ) | | | (0.09 | ) | | | (0.14 | ) |
| Net realized and unrealized gains/(losses) on investments | | | (2.92 | ) | | | 3.23 | | | | 1.79 | | | | 1.49 | | | | 1.02 | |
| Total from investment operations | | | (3.03 | ) | | | 3.08 | | | | 1.69 | | | | 1.40 | | | | 0.88 | |
| | | | | | | | | | | | | | | | | | | | | |
| Less dividends and distributions: | | | | | | | | | | | | | | | | | | | | |
| Distributions from net realized gains | | | (1.19 | ) | | | (0.42 | ) | | | (0.24 | ) | | | (3.93 | ) | | | (5.52 | ) |
| Total dividends and distributions | | | (1.19 | ) | | | (0.42 | ) | | | (0.24 | ) | | | (3.93 | ) | | | (5.52 | ) |
| | | | | | | | | | | | | | | | | | | | | |
| Net asset value, end of period | | $ | 14.73 | | | $ | 18.95 | | | $ | 16.29 | | | $ | 14.84 | | | $ | 17.37 | |
| | | | | | | | | | | | | | | | | | | | | |
| Total Return(c) | | | (16.05 | )% | | | 19.43 | % | | | 11.58 | % | | | 9.03 | % | | | 2.33 | % |
| | | | | | | | | | | | | | | | | | | | | |
| Ratios and Supplemental Data | | | | | | | | | | | | | | | | | | | | |
| Net assets, end of period (in 000s) | | $ | 1,732 | | | $ | 2,814 | | | $ | 3,989 | | | $ | 4,921 | | | $ | 15,317 | |
| | | | | | | | | | | | | | | | | | | | | |
| Ratio of expenses to average net assets | | | | | | | | | | | | | | | | | | | | |
| Before expense limitation | | | 2.06 | % | | | 1.86 | % | | | 1.86 | % | | | 1.79 | % | | | 1.62 | % |
| After expense limitation(d) | | | 1.75 | % | | | 1.75 | % | | | 1.75 | % | | | 1.75 | % | | | 1.62 | % |
| Ratio of net investment income/(loss) to average net assets | | | | | | | | | | | | | | | | | | | | |
| Before expense limitation | | | (1.02 | )% | | | (1.01 | )% | | | (0.78 | )% | | | (0.63 | )% | | | (0.69 | )% |
| After expense limitation(d) | | | (0.71 | )% | | | (0.90 | )% | | | (0.67 | )% | | | (0.59 | )% | | | (0.69 | )% |
| Portfolio turnover rate | | | 26 | % | | | 63 | % | | | 174 | % | | | 107 | % | | | 141 | % |
| (a) | Class C shares were merged into Class A on September 25, 2015. The amounts presented represent the results of the Class A shares for the periods prior to the merger and the results of the combined share class for the period subsequent to the merger. |
| (b) | Calculated using the average shares method. |
| (c) | The total return calculation excludes any sales charges. |
| (d) | The Fund’s operating expenses, not including interest expense, are contractually limited to the amounts discussed in Note 3. The ratios in these financial highlights reflect the limitation, including the interest expense, when applicable. |
The accompanying notes are an integral part of the financial statements.
| Annual Report | September 30, 2019 | 55 |
| ICON Industrials Fund | Financial Highlights |
For a Share Outstanding Throughout the Periods Presented
| Class S | | Year Ended
September 30, 2019 | | Year Ended
September 30, 2018 | | Year Ended
September 30, 2017 | | Year Ended
September 30, 2016 | | Year Ended
September 30, 2015 |
| Net asset value, beginning of period | | $ | 15.50 | | | $ | 14.97 | | | $ | 12.26 | | | $ | 10.94 | | | $ | 11.67 | |
| Income/(loss) from investment operations: | | | | | | | | | | | | | | | | | | | | |
| Net investment income/(loss)(a) | | | 0.06 | | | | 0.00 | (b) | | | (0.04 | ) | | | (0.02 | ) | | | 0.01 | |
| Net realized and unrealized gains/(losses) on investments | | | 0.29 | | | | 0.53 | | | | 2.75 | | | | 1.34 | | | | (0.73 | ) |
| Total from investment operations | | | 0.35 | | | | 0.53 | | | | 2.71 | | | | 1.32 | | | | (0.72 | ) |
| | | | | | | | | | | | | | | | | | | | | |
| Less dividends and distributions: | | | | | | | | | | | | | | | | | | | | |
| Dividends from net investment income | | | — | | | | — | | | | — | | | | — | | | | (0.01 | ) |
| Total dividends and distributions | | | — | | | | — | | | | — | | | | — | | | | (0.01 | ) |
| | | | | | | | | | | | | | | | | | | | | |
| Net asset value, end of period | | $ | 15.85 | | | $ | 15.50 | | | $ | 14.97 | | | $ | 12.26 | | | $ | 10.94 | |
| | | | | | | | | | | | | | | | | | | | | |
| Total Return | | | 2.26 | % | | | 3.54 | % | | | 22.10 | % | | | 12.07 | % | | | (6.15 | )% |
| | | | | | | | | | | | | | | | | | | | | |
| Ratios and Supplemental Data | | | | | | | | | | | | | | | | | | | | |
| Net assets, end of period (in 000s) | | $ | 11,523 | | | $ | 11,614 | | | $ | 15,482 | | | $ | 23,957 | | | $ | 14,251 | |
| | | | | | | | | | | | | | | | | | | | | |
| Ratio of expenses to average net assets | | | | | | | | | | | | | | | | | | | | |
| Before expense limitation | | | 1.97 | % | | | 1.80 | % | | | 1.69 | % | | | 1.73 | % | | | 1.53 | % |
| After expense limitation(c) | | | 1.50 | % | | | 1.50 | % | | | 1.51 | % | | | 1.50 | % | | | 1.50 | % |
| Ratio of net investment income/(loss) to average net assets | | | | | | | | | | | | | | | | | | | | |
| Before expense limitation | | | (0.07 | )% | | | (0.29 | )% | | | (0.50 | )% | | | (0.37 | )% | | | 0.07 | % |
| After expense limitation(c) | | | 0.40 | % | | | 0.01 | % | | | (0.32 | )% | | | (0.14 | )% | | | 0.10 | % |
| Portfolio turnover rate | | | 78 | % | | | 87 | % | | | 75 | % | | | 87 | % | | | 23 | % |
| (a) | Calculated using the average shares method. |
| (b) | Amount less than $0.005. |
| (c) | The Fund’s operating expenses, not including interest expense, are contractually limited to the amounts discussed in Note 3. The ratios in these financial highlights reflect the limitation, including the interest expense, when applicable. |
The accompanying notes are an integral part of the financial statements.
| ICON Industrials Fund | Financial Highlights |
For a Share Outstanding Throughout the Periods Presented
| Class A(a) | | Year Ended
September 30, 2019 | | Year Ended
September 30, 2018 | | Year Ended
September 30, 2017 | | Year Ended
September 30, 2016 | | Year Ended
September 30, 2015 |
| Net asset value, beginning of period | | $ | 15.27 | | | $ | 14.79 | | | $ | 12.14 | | | $ | 10.86 | | | $ | 11.58 | |
| Income/(loss) from investment operations: | | | | | | | | | | | | | | | | | | | | |
| Net investment income/(loss)(b) | | | 0.08 | | | | (0.04 | ) | | | (0.07 | ) | | | (0.04 | ) | | | (0.02 | ) |
| Net realized and unrealized gains/(losses) on investments | | | 0.23 | | | | 0.52 | | | | 2.72 | | | | 1.32 | | | | (0.70 | ) |
| Total from investment operations | | | 0.31 | | | | 0.48 | | | | 2.65 | | | | 1.28 | | | | (0.72 | ) |
| | | | | | | | | | | | | | | | | | | | | |
| Net asset value, end of period | | $ | 15.58 | | | $ | 15.27 | | | $ | 14.79 | | | $ | 12.14 | | | $ | 10.86 | |
| | | | | | | | | | | | | | | | | | | | | |
| Total Return(c) | | | 2.03 | % | | | 3.25 | % | | | 21.83 | % | | | 11.79 | % | | | (6.22 | )% |
| | | | | | | | | | | | | | | | | | | | | |
| Ratios and Supplemental Data | | | | | | | | | | | | | | | | | | | | |
| Net assets, end of period (in 000s) | | $ | 659 | | | $ | 1,156 | | | $ | 2,406 | | | $ | 998 | | | $ | 596 | |
| | | | | | | | | | | | | | | | | | | | | |
| Ratio of expenses to average net assets | | | | | | | | | | | | | | | | | | | | |
| Before expense limitation | | | 2.38 | % | | | 2.32 | % | | | 2.05 | % | | | 2.96 | % | | | 2.67 | % |
| After expense limitation(d) | | | 1.75 | % | | | 1.75 | % | | | 1.76 | % | | | 1.75 | % | | | 1.75 | % |
| Ratio of net investment income/(loss) to average net assets | | | | | | | | | | | | | | | | | | | | |
| Before expense limitation | | | (0.08 | )% | | | (0.85 | )% | | | (0.79 | )% | | | (1.59 | )% | | | (1.11 | )% |
| After expense limitation(d) | | | 0.55 | % | | | (0.28 | )% | | | (0.50 | )% | | | (0.38 | )% | | | (0.19 | )% |
| Portfolio turnover rate | | | 78 | % | | | 87 | % | | | 75 | % | | | 87 | % | | | 23 | % |
| (a) | Class C shares were merged into Class A on September 25, 2015. The amounts presented represent the results of the Class A shares for the periods prior to the merger and the results of the combined share class for the period subsequent to the merger. |
| (b) | Calculated using the average shares method. |
| (c) | The total return calculation excludes any sales charges. |
| (d) | The Fund’s operating expenses, not including interest expense, are contractually limited to the amounts discussed in Note 3. The ratios in these financial highlights reflect the limitation, including the interest expense, when applicable. |
The accompanying notes are an integral part of the financial statements.
| Annual Report | September 30, 2019 | 57 |
| ICON Information Technology Fund | Financial Highlights |
For a Share Outstanding Throughout the Periods Presented
| Class S | | Year Ended
September 30, 2019 | | Year Ended
September 30, 2018 | | Year Ended
September 30, 2017 | | Year Ended
September 30, 2016 | | Year Ended
September 30, 2015 |
| Net asset value, beginning of period | | $ | 17.19 | | | $ | 19.14 | | | $ | 17.96 | | | $ | 14.95 | | | $ | 13.55 | |
| Income/(loss) from investment operations: | | | | | | | | | | | | | | | | | | | | |
| Net investment income/(loss)(a) | | | (0.04 | ) | | | (0.10 | ) | | | (0.10 | ) | | | (0.07 | ) | | | (0.09 | ) |
| Net realized and unrealized gains/(losses) on investments | | | 0.35 | | | | 2.09 | | | | 4.53 | | | | 3.08 | | | | 1.49 | |
| Total from investment operations | | | 0.31 | | | | 1.99 | | | | 4.43 | | | | 3.01 | | | | 1.40 | |
| | | | | | | | | | | | | | | | | | | | | |
| Less dividends and distributions: | | | | | | | | | | | | | | | | | | | | |
| Dividends from net investment income | | | — | | | | (0.08 | ) | | | — | | | | — | | | | — | |
| Distributions from net realized gains | | | (2.04 | ) | | | (3.86 | ) | | | (3.25 | ) | | | — | | | | — | |
| Total dividends and distributions | | | (2.04 | ) | | | (3.94 | ) | | | (3.25 | ) | | | — | | | | — | |
| | | | | | | | | | | | | | | | | | | | | |
| Net asset value, end of period | | $ | 15.46 | | | $ | 17.19 | | | $ | 19.14 | | | $ | 17.96 | | | $ | 14.95 | |
| | | | | | | | | | | | | | | | | | | | | |
| Total Return | | | 5.12 | % | | | 11.82 | % | | | 29.46 | % | | | 20.13 | % | | | 10.33 | % |
| | | | | | | | | | | | | | | | | | | | | |
| Ratios and Supplemental Data | | | | | | | | | | | | | | | | | | | | |
| Net assets, end of period (in 000s) | | $ | 54,263 | | | $ | 61,474 | | | $ | 71,249 | | | $ | 48,953 | | | $ | 45,343 | |
| | | | | | | | | | | | | | | | | | | | | |
| Ratio of expenses to average net assets | | | | | | | | | | | | | | | | | | | | |
| Before expense limitation | | | 1.49 | % | | | 1.41 | % | | | 1.42 | % | | | 1.49 | % | | | 1.44 | % |
| After expense limitation(b) | | | 1.49 | % | | | 1.41 | % | | | 1.42 | % | | | 1.49 | % | | | 1.44 | % |
| Ratio of net investment income/(loss) to average net assets | | | | | | | | | | | | | | | | | | | | |
| Before expense limitation | | | (0.25 | )% | | | (0.60 | )% | | | (0.58 | )% | | | (0.46 | )% | | | (0.62 | )% |
| After expense limitation(b) | | | (0.25 | )% | | | (0.60 | )% | | | (0.58 | )% | | | (0.46 | )% | | | (0.62 | )% |
| Portfolio turnover rate | | | 92 | % | | | 98 | % | | | 116 | % | | | 94 | % | | | 43 | % |
| (a) | Calculated using the average shares method. |
| (b) | The Fund’s operating expenses, not including interest expense, are contractually limited to the amounts discussed in Note 3. The ratios in these financial highlights reflect the limitation, including the interest expense, when applicable. |
The accompanying notes are an integral part of the financial statements.
| ICON Information Technology Fund | Financial Highlights |
For a Share Outstanding Throughout the Periods Presented
| Class A(a) | | Year Ended
September 30, 2019 | | Year Ended
September 30, 2018 | | Year Ended
September 30, 2017 | | Year Ended
September 30, 2016 | | Year Ended
September 30, 2015 |
| Net asset value, beginning of period | | $ | 16.55 | | | $ | 18.55 | | | $ | 17.55 | | | $ | 14.65 | | | $ | 13.32 | |
| Income/(loss) from investment operations: | | | | | | | | | | | | | | | | | | | | |
| Net investment income/(loss)(b) | | | (0.07 | ) | | | (0.16 | ) | | | (0.15 | ) | | | (0.11 | ) | | | (0.14 | ) |
| Net realized and unrealized gains/(losses) on investments | | | 0.30 | | | | 2.02 | | | | 4.40 | | | | 3.01 | | | | 1.47 | |
| Total from investment operations | | | 0.23 | | | | 1.86 | | | | 4.25 | | | | 2.90 | | | | 1.33 | |
| | | | | | | | | | | | | | | | | | | | | |
| Less dividends and distributions: | | | | | | | | | | | | | | | | | | | | |
| Dividends from net investment income | | | — | | | | (0.00 | )(c) | | | — | | | | — | | | | — | |
| Distributions from net realized gains | | | (2.04 | ) | | | (3.86 | ) | | | (3.25 | ) | | | — | | | | — | |
| Total dividends and distributions | | | (2.04 | ) | | | (3.86 | ) | | | (3.25 | ) | | | — | | | | — | |
| | | | | | | | | | | | | | | | | | | | | |
| Net asset value, end of period | | $ | 14.74 | | | $ | 16.55 | | | $ | 18.55 | | | $ | 17.55 | | | $ | 14.65 | |
| | | | | | | | | | | | | | | | | | | | | |
| Total Return(d) | | | 4.79 | % | | | 11.43 | % | | | 29.08 | % | | | 19.80 | % | | | 9.99 | % |
| | | | | | | | | | | | | | | | | | | | | |
| Ratios and Supplemental Data | | | | | | | | | | | | | | | | | | | | |
| Net assets, end of period (in 000s) | | $ | 1,463 | | | $ | 2,101 | | | $ | 2,836 | | | $ | 2,631 | | | $ | 3,170 | |
| | | | | | | | | | | | | | | | | | | | | |
| Ratio of expenses to average net assets | | | | | | | | | | | | | | | | | | | | |
| Before expense limitation | | | 2.30 | % | | | 2.00 | % | | | 2.01 | % | | | 2.17 | % | | | 1.90 | % |
| After expense limitation(e) | | | 1.75 | % | | | 1.75 | % | | | 1.75 | % | | | 1.75 | % | | | 1.75 | % |
| Ratio of net investment income/(loss) to average net assets | | | | | | | | | | | | | | | | | | | | |
| Before expense limitation | | | (1.05 | )% | | | (1.20 | )% | | | (1.16 | )% | | | (1.12 | )% | | | (1.07 | )% |
| After expense limitation(e) | | | (0.50 | )% | | | (0.95 | )% | | | (0.90 | )% | | | (0.70 | )% | | | (0.92 | )% |
| Portfolio turnover rate | | | 92 | % | | | 98 | % | | | 116 | % | | | 94 | % | | | 43 | % |
| (a) | Class C shares were merged into Class A on September 25, 2015. The amounts presented represent the results of the Class A shares for the periods prior to the merger and the results of the combined share class for the period subsequent to the merger. |
| (b) | Calculated using the average shares method. |
| (c) | Amount less than $(0.005). |
| (d) | The total return calculation excludes any sales charges. |
| (e) | The Fund’s operating expenses, not including interest expense, are contractually limited to the amounts discussed in Note 3. The ratios in these financial highlights reflect the limitation, including the interest expense, when applicable. |
The accompanying notes are an integral part of the financial statements.
| Annual Report | September 30, 2019 | 59 |
| ICON Natural Resources Fund | Financial Highlights |
For a Share Outstanding Throughout the Periods Presented
| Class S | | Year Ended
September 30, 2019 | | Year Ended
September 30, 2018 | | Year Ended
September 30, 2017 | | Year Ended
September 30, 2016(a) | | Year Ended
September 30, 2015 |
| Net asset value, beginning of period | | $ | 16.45 | | | $ | 15.32 | | | $ | 12.82 | | | $ | 11.86 | | | $ | 15.09 | |
| Income/(loss) from investment operations: | | | | | | | | | | | | | | | | | | | | |
| Net investment income/(loss)(b) | | | 0.19 | | | | 0.31 | | | | 0.01 | | | | 0.10 | | | | 0.04 | |
| Net realized and unrealized gains/(losses) on investments | | | (1.80 | ) | | | 1.01 | | | | 2.56 | | | | 1.80 | | | | (3.23 | ) |
| Total from investment operations | | | (1.61 | ) | | | 1.32 | | | | 2.57 | | | | 1.90 | | | | (3.19 | ) |
| | | | | | | | | | | | | | | | | | | | | |
| Less dividends and distributions: | | | | | | | | | | | | | | | | | | | | |
| Dividends from net investment income | | | (0.33 | ) | | | — | | | | (0.07 | ) | | | (0.06 | ) | | | (0.04 | ) |
| Distributions from net realized gains | | | (2.02 | ) | | | (0.19 | ) | | | — | | | | (0.88 | ) | | | — | |
| Total dividends and distributions | | | (2.35 | ) | | | (0.19 | ) | | | (0.07 | ) | | | (0.94 | ) | | | (0.04 | ) |
| | | | | | | | | | | | | | | | | | | | | |
| Net asset value, end of period | | $ | 12.49 | | | $ | 16.45 | | | $ | 15.32 | | | $ | 12.82 | | | $ | 11.86 | |
| | | | | | | | | | | | | | | | | | | | | |
| Total Return | | | (7.63 | )% | | | 8.68 | % | | | 20.13 | % | | | 17.24 | % | | | (21.22 | )% |
| | | | | | | | | | | | | | | | | | | | | |
| Ratios and Supplemental Data | | | | | | | | | | | | | | | | | | | | |
| Net assets, end of period (in 000s) | | $ | 55,353 | | | $ | 76,916 | | | $ | 69,444 | | | $ | 65,787 | | | $ | 60,404 | |
| | | | | | | | | | | | | | | | | | | | | |
| Ratio of expenses to average net assets | | | | | | | | | | | | | | | | | | | | |
| Before expense limitation | | | 1.70 | % | | | 1.58 | % | | | 1.52 | % | | | 1.59 | % | | | 1.42 | % |
| After expense limitation(c) | | | 1.50 | % | | | 1.50 | % | | | 1.50 | % | | | 1.50 | % | | | 1.42 | % |
| Ratio of net investment income/(loss) to average net assets | | | | | | | | | | | | | | | | | | | | |
| Before expense limitation | | | 1.33 | % | | | 1.86 | % | | | 0.06 | % | | | 0.70 | % | | | 0.27 | % |
| After expense limitation(c) | | | 1.53 | % | | | 1.94 | % | | | 0.08 | % | | | 0.79 | % | | | 0.27 | % |
| Portfolio turnover rate | | | 111 | % | | | 117 | % | | | 68 | % | | | 81 | % | | | 48 | % |
| (a) | Prior to January 22, 2016, the ICON Natural Resources Fund was known as the ICON Materials Fund. |
| (b) | Calculated using the average shares method. |
| (c) | The Fund’s operating expenses, not including interest expense, are contractually limited to the amounts discussed in Note 3. The ratios in these financial highlights reflect the limitation, including the interest expense, when applicable. |
The accompanying notes are an integral part of the financial statements.
| ICON Natural Resources Fund | Financial Highlights |
For a Share Outstanding Throughout the Periods Presented
| Class C | | Year Ended September 30, 2019 | | Year Ended September 30, 2018 | | Year Ended September 30, 2017 | | Year Ended September 30, 2016(a) | | Year Ended September 30, 2015 |
| Net asset value, beginning of period | | $ | 15.57 | | | $ | 14.65 | | | $ | 12.36 | | | $ | 11.51 | | | $ | 14.77 | |
| Income/(loss) from investment operations: | | | | | | | | | | | | | | | | | | | | |
| Net investment income/(loss)(b) | | | 0.07 | | | | 0.14 | | | | (0.13 | ) | | | (0.03 | ) | | | (0.11 | ) |
| Net realized and unrealized gains/(losses) on investments | | | (1.71 | ) | | | 0.97 | | | | 2.47 | | | | 1.76 | | | | (3.15 | ) |
| Total from investment operations | | | (1.64 | ) | | | 1.11 | | | | 2.34 | | | | 1.73 | | | | (3.26 | ) |
| | | | | | | | | | | | | | | | | | | | | |
| Less dividends and distributions: | | | | | | | | | | | | | | | | | | | | |
| Dividends from net investment income | | | (0.13 | ) | | | — | | | | (0.05 | ) | | | — | | | | — | |
| Distributions from net realized gains | | | (2.02 | ) | | | (0.19 | ) | | | — | | | | (0.88 | ) | | | — | |
| Total dividends and distributions | | | (2.15 | ) | | | (0.19 | ) | | | (0.05 | ) | | | (0.88 | ) | | | — | |
| | | | | | | | | | | | | | | | | | | | | |
| Net asset value, end of period | | $ | 11.78 | | | $ | 15.57 | | | $ | 14.65 | | | $ | 12.36 | | | $ | 11.51 | |
| | | | | | | | | | | | | | | | | | | | | |
| Total Return(c) | | | (8.57 | )% | | | 7.63 | % | | | 18.97 | % | | | 16.11 | % | | | (22.07 | )% |
| | | | | | | | | | | | | | | | | | | | | |
| Ratios and Supplemental Data | | | | | | | | | | | | | | | | | | | | |
| Net assets, end of period (in 000s) | | $ | 917 | | | $ | 1,177 | | | $ | 1,756 | | | $ | 1,435 | | | $ | 834 | |
| | | | | | | | | | | | | | | | | | | | | |
| Ratio of expenses to average net assets | | | | | | | | | | | | | | | | | | | | |
| Before expense limitation | | | 3.19 | % | | | 2.79 | % | | | 2.85 | % | | | 3.01 | % | | | 2.94 | % |
| After expense limitation(d) | | | 2.50 | % | | | 2.50 | % | | | 2.50 | % | | | 2.51 | % | | | 2.50 | % |
| Ratio of net investment income/(loss) to average net assets | | | | | | | | | | | | | | | | | | | | |
| Before expense limitation | | | (0.13 | )% | | | 0.64 | % | | | (1.27 | )% | | | (0.73 | )% | | | (1.22 | )% |
| After expense limitation(d) | | | 0.56 | % | | | 0.93 | % | | | (0.92 | )% | | | (0.23 | )% | | | (0.78 | )% |
| Portfolio turnover rate | | | 111 | % | | | 117 | % | | | 68 | % | | | 81 | % | | | 48 | % |
| (a) | Prior to January 22, 2016, the ICON Natural Resources Fund was known as the ICON Materials Fund. |
| (b) | Calculated using the average shares method. |
| (c) | The total return calculation excludes any sales charges. |
| (d) | The Fund’s operating expenses, not including interest expense, are contractually limited to the amounts discussed in Note 3. The ratios in these financial highlights reflect the limitation, including the interest expense, when applicable. |
The accompanying notes are an integral part of the financial statements.
| Annual Report | September 30, 2019 | 61 |
| ICON Natural Resources Fund | Financial Highlights |
For a Share Outstanding Throughout the Periods Presented
| Class A | | Year Ended September 30, 2019 | | Year Ended September 30, 2018 | | Year Ended September 30, 2017 | | Year Ended September 30, 2016(a) | | Year Ended September 30, 2015 |
| Net asset value, beginning of period | | $ | 16.25 | | | $ | 15.17 | | | $ | 12.73 | | | $ | 11.75 | | | $ | 14.96 | |
| Income/(loss) from investment operations: | | | | | | | | | | | | | | | | | | | | |
| Net investment income/(loss)(b) | | | 0.16 | | | | 0.29 | | | | (0.03 | ) | | | 0.06 | | | | (0.01 | ) |
| Net realized and unrealized gains/(losses) on investments | | | (1.78 | ) | | | 0.98 | | | | 2.54 | | | | 1.81 | | | | (3.20 | ) |
| Total from investment operations | | | (1.62 | ) | | | 1.27 | | | | 2.51 | | | | 1.87 | | | | (3.21 | ) |
| | | | | | | | | | | | | | | | | | | | | |
| Less dividends and distributions: | | | | | | | | | | | | | | | | | | | | |
| Dividends from net investment income | | | (0.25 | ) | | | — | | | | (0.07 | ) | | | (0.01 | ) | | | — | |
| Distributions from net realized gains | | | (2.02 | ) | | | (0.19 | ) | | | — | | | | (0.88 | ) | | | — | |
| Total dividends and distributions | | | (2.27 | ) | | | (0.19 | ) | | | (0.07 | ) | | | (0.89 | ) | | | — | |
| | | | | | | | | | | | | | | | | | | | | |
| Net asset value, end of period | | $ | 12.36 | | | $ | 16.25 | | | $ | 15.17 | | | $ | 12.73 | | | $ | 11.75 | |
| | | | | | | | | | | | | | | | | | | | | |
| Total Return(c) | | | (7.92 | )% | | | 8.43 | % | | | 19.81 | % | | | 17.05 | % | | | (21.46 | )% |
| | | | | | | | | | | | | | | | | | | | | |
| Ratios and Supplemental Data | | | | | | | | | | | | | | | | | | | | |
| Net assets, end of period (in 000s) | | $ | 2,733 | | | $ | 4,231 | | | $ | 5,629 | | | $ | 4,451 | | | $ | 3,078 | |
| | | | | | | | | | | | | | | | | | | | | |
| Ratio of expenses to average net assets | | | | | | | | | | | | | | | | | | | | |
| Before expense limitation | | | 2.19 | % | | | 1.86 | % | | | 1.91 | % | | | 2.02 | % | | | 1.76 | % |
| After expense limitation(d) | | | 1.75 | % | | | 1.75 | % | | | 1.75 | % | | | 1.75 | % | | | 1.75 | % |
| Ratio of net investment income/(loss) to average net assets | | | | | | | | | | | | | | | | | | | | |
| Before expense limitation | | | 0.85 | % | | | 1.71 | % | | | (0.35 | )% | | | 0.24 | % | | | (0.06 | )% |
| After expense limitation(d) | | | 1.29 | % | | | 1.82 | % | | | (0.19 | )% | | | 0.51 | % | | | (0.05 | )% |
| Portfolio turnover rate | | | 111 | % | | | 117 | % | | | 68 | % | | | 81 | % | | | 48 | % |
| (a) | Prior to January 22, 2016, the ICON Natural Resources Fund was known as the ICON Materials Fund. |
| (b) | Calculated using the average shares method. |
| (c) | The total return calculation excludes any sales charges. |
| (d) | The Fund’s operating expenses, not including interest expense, are contractually limited to the amounts discussed in Note 3. The ratios in these financial highlights reflect the limitation, including the interest expense, when applicable. |
The accompanying notes are an integral part of the financial statements.
| ICON Utilities Fund | Financial Highlights |
For a Share Outstanding Throughout the Periods Presented
| Class S | | Year Ended September 30, 2019 | | Year Ended September 30, 2018 | | Year Ended September 30, 2017 | | Year Ended September 30, 2016 | | Year Ended September 30, 2015 |
| Net asset value, beginning of period | | $ | 8.85 | | | $ | 9.29 | | | $ | 9.49 | | | $ | 8.03 | | | $ | 7.90 | |
| Income/(loss) from investment operations: | | | | | | | | | | | | | | | | | | | | |
| Net investment income/(loss)(a) | | | 0.26 | | | | 0.28 | | | | 0.27 | | | | 0.30 | | | | 0.28 | |
| Net realized and unrealized gains/(losses) on investments | | | 1.45 | | | | 0.07 | | | | 0.59 | | | | 1.43 | | | | 0.11 | |
| Total from investment operations | | | 1.71 | | | | 0.35 | | | | 0.86 | | | | 1.73 | | | | 0.39 | |
| | | | | | | | | | | | | | | | | | | | | |
| Less dividends and distributions: | | | | | | | | | | | | | | | | | | | | |
| Dividends from net investment income | | | (0.26 | ) | | | (0.31 | ) | | | (0.27 | ) | | | (0.27 | ) | | | (0.26 | ) |
| Distributions from net realized gains | | | (0.05 | ) | | | (0.48 | ) | | | (0.79 | ) | | | — | | | | — | |
| Total dividends and distributions | | | (0.31 | ) | | | (0.79 | ) | | | (1.06 | ) | | | (0.27 | ) | | | (0.26 | ) |
| | | | | | | | | | | | | | | | | | | | | |
| Net asset value, end of period | | $ | 10.25 | | | $ | 8.85 | | | $ | 9.29 | | | $ | 9.49 | | | $ | 8.03 | |
| | | | | | | | | | | | | | | | | | | | | |
| Total Return | | | 19.76 | % | | | 4.17 | % | | | 9.88 | % | | | 21.74 | % | | | 4.93 | % |
| | | | | | | | | | | | | | | | | | | | | |
| Ratios and Supplemental Data | | | | | | | | | | | | | | | | | | | | |
| Net assets, end of period (in 000s) | | $ | 46,006 | | | $ | 30,883 | | | $ | 35,816 | | | $ | 43,864 | | | $ | 19,107 | |
| | | | | | | | | | | | | | | | | | | | | |
| Ratio of expenses to average net assets | | | | | | | | | | | | | | | | | | | | |
| Before expense limitation | | | 1.57 | % | | | 1.60 | % | | | 1.54 | % | | | 1.59 | % | | | 1.70 | % |
| After expense limitation(b) | | | 1.22 | % | | | 1.22 | % | | | 1.44 | %(c) | | | 1.50 | % | | | 1.50 | % |
| Ratio of net investment income/(loss) to average net assets | | | | | | | | | | | | | | | | | | | | |
| Before expense limitation | | | 2.38 | % | | | 2.82 | % | | | 2.83 | % | | | 3.15 | % | | | 3.12 | % |
| After expense limitation(b) | | | 2.73 | % | | | 3.20 | % | | | 2.93 | % | | | 3.24 | % | | | 3.32 | % |
| Portfolio turnover rate | | | 144 | % | | | 156 | % | | | 160 | % | | | 168 | % | | | 243 | % |
| (a) | Calculated using the average shares method. |
| (b) | The Fund’s operating expenses, not including interest expense, are contractually limited to the amounts discussed in Note 3. The ratios in these financial highlights reflect the limitation, including the interest expense, when applicable. |
| (c) | Effective July 1, 2017, the annual expense limitation rate changed from 1.50% to 1.22%. |
The accompanying notes are an integral part of the financial statements.
| Annual Report | September 30, 2019 | 63 |
| ICON Utilities Fund | Financial Highlights |
For a Share Outstanding Throughout the Periods Presented
| Class A(a) | | Year Ended September 30, 2019 | | Year Ended September 30, 2018 | | Year Ended September 30, 2017 | | Year Ended September 30, 2016 | | Year Ended September 30, 2015 |
| Net asset value, beginning of period | | $ | 8.70 | | | $ | 9.14 | | | $ | 9.35 | | | $ | 7.92 | | | $ | 7.81 | |
| Income/(loss) from investment operations: | | | | | | | | | | | | | | | | | | | | |
| Net investment income/(loss)(b) | | | 0.23 | | | | 0.25 | | | | 0.24 | | | | 0.28 | | | | 0.26 | |
| Net realized and unrealized gains/(losses) on investments | | | 1.43 | | | | 0.08 | | | | 0.59 | | | | 1.40 | | | | 0.11 | |
| Total from investment operations | | | 1.66 | | | | 0.33 | | | | 0.83 | | | | 1.68 | | | | 0.37 | |
| | | | | | | | | | | | | | | | | | | | | |
| Less dividends and distributions: | | | | | | | | | | | | | | | | | | | | |
| Dividends from net investment income | | | (0.24 | ) | | | (0.29 | ) | | | (0.25 | ) | | | (0.25 | ) | | | (0.26 | ) |
| Distributions from net realized gains | | | (0.05 | ) | | | (0.48 | ) | | | (0.79 | ) | | | — | | | | — | |
| Total dividends and distributions | | | (0.29 | ) | | | (0.77 | ) | | | (1.04 | ) | | | (0.25 | ) | | | (0.26 | ) |
| | | | | | | | | | | | | | | | | | | | | |
| Net asset value, end of period | | $ | 10.07 | | | $ | 8.70 | | | $ | 9.14 | | | $ | 9.35 | | | $ | 7.92 | |
| | | | | | | | | | | | | | | | | | | | | |
| Total Return(c) | | | 19.47 | % | | | 3.97 | % | | | 9.63 | % | | | 21.29 | % | | | 4.63 | % |
| | | | | | | | | | | | | | | | | | | | | |
| Ratios and Supplemental Data | | | | | | | | | | | | | | | | | | | | |
| Net assets, end of period (in 000s) | | $ | 6,052 | | | $ | 5,540 | | | $ | 8,293 | | | $ | 15,868 | | | $ | 5,679 | |
| | | | | | | | | | | | | | | | | | | | | |
| Ratio of expenses to average net assets | | | | | | | | | | | | | | | | | | | | |
| Before expense limitation | | | 1.77 | % | | | 1.73 | % | | | 1.84 | % | | | 1.79 | % | | | 1.89 | % |
| After expense limitation(d) | | | 1.47 | % | | | 1.47 | % | | | 1.69 | %(e) | | | 1.75 | % | | | 1.75 | % |
| Ratio of net investment income/(loss) to average net assets | | | | | | | | | | | | | | | | | | | | |
| Before expense limitation | | | 2.20 | % | | | 2.62 | % | | | 2.48 | % | | | 3.10 | % | | | 3.04 | % |
| After expense limitation(d) | | | 2.50 | % | | | 2.88 | % | | | 2.63 | % | | | 3.14 | % | | | 3.18 | % |
| Portfolio turnover rate | | | 144 | % | | | 156 | % | | | 160 | % | | | 168 | % | | | 243 | % |
| (a) | Class C shares were merged into Class A on September 25, 2015. The amounts presented represent the results of the Class A shares for the periods prior to the merger and the results of the combined share class for the period subsequent to the merger. |
| (b) | Calculated using the average shares method. |
| (c) | The total return calculation excludes any sales charges. |
| (d) | The Fund’s operating expenses, not including interest expense, are contractually limited to the amounts discussed in Note 3. The ratios in these financial highlights reflect the limitation, including the interest expense, when applicable. |
| (e) | Effective July 1, 2017, the annual expense limitation rate changed from 1.75% to 1.47%. |
The accompanying notes are an integral part of the financial statements.
| ICON Sector Funds | Notes to Financial Statements |
September 30, 2019
1. ORGANIZATION
The ICON Consumer Discretionary Fund (“Consumer Discretionary Fund”), ICON Consumer Staples Fund (“Consumer Staples Fund”), ICON Energy Fund (“Energy Fund”), ICON Financial Fund (“Financial Fund”), ICON Healthcare Fund (“Healthcare Fund”), ICON Industrials Fund (“Industrials Fund”), ICON Information Technology Fund (“Information Technology Fund”), ICON Natural Resources Fund (“Natural Resources Fund”) and ICON Utilities Fund (“Utilities Fund”) are series funds (individually a “Fund” and collectively, the “Funds”). The Funds are part of the ICON Funds (the “Trust”), a Massachusetts business trust registered under the Investment Company Act of 1940, as amended (the “1940 Act”) as an open-end non-diversified investment management company. Each Fund offers two classes of shares: Class S and Class A. The Energy Fund and the Natural Resources Fund also offer a Class C share. All classes have equal rights as to earnings, assets, and voting privileges except that each Class may bear different distribution fees, registration costs, legal costs, mailing and printing costs and shareholder servicing costs and each Class has exclusive voting rights with respect to its distribution plan. There are currently eight other active Funds within the Trust. Those Funds are covered by separate prospectuses and shareholder reports.
Each Fund is authorized to issue an unlimited number of no par shares. The Funds invest primarily in securities of companies whose principal business activities fall within specific sectors and industries. The investment objective of each Fund is to provide long-term capital appreciation.
The Funds, like all investments in securities, have elements of risk, including risk of loss of principal. There is no assurance that the Funds will achieve their investment objectives and may underperform funds with similar investment objectives. An investment concentrated in sectors and industries involves greater risk and volatility than a more diversified investment. Investments in foreign securities and currency transactions may involve certain considerations and risks not typically associated with those of U.S. dollar-denominated transactions as a result of, among other factors, the possibility of lower government supervision and regulation of foreign securities markets and the possibility of political or economic instability. Financial statements of foreign companies are governed by different accounting, auditing, and financial standards than U.S. companies and may be less transparent and uniform than in the United States. Many corporate governance standards, which help ensure the integrity of public information in the United States, may not exist in some foreign countries. In general, there may be less governmental supervision of foreign stock exchanges and securities brokers and issuers. There are also risks associated with small-and mid-cap investing, including limited product lines, less liquidity and small market share.
The Consumer Staples Fund has a significant weighting in the Packaged Foods & Meats industry, the Energy Fund has a significant weighting in the Oil & Gas Exploration & Production industry and the Integrated Oil & Gas Industry, the Financial Fund has a significant weighting in the Diversified Banks industry, the Healthcare Fund has a significant weighting in the Pharmaceuticals industry and the Managed Health Care industry, the Industrials Fund has a significant weighting in the Aerospace & Defense industry, the Information Technology Fund has a significant weighting in the Data Processing & Outsourced Services industry and the Utilities Fund has a significant weighting in the Electric Utilities industry and the Multi-Utilities industry which may cause the Funds’ performance to be susceptible to the economic, business and/or other developments that may affect those industries.
In the normal course of business, the Funds may enter into various agreements that provide for general indemnifications. Each Fund’s maximum exposure under these arrangements is unknown as any potential exposure involving future claims that may be made against each Fund is unknown. However, based on experience, the Funds expect the risk of loss to be remote.
2. SIGNIFICANT ACCOUNTING POLICIES
The following is a summary of significant accounting policies consistently followed by the Funds in the preparation of their financial statements. The financial statements are prepared in conformity with accounting principles generally accepted in the United States of America (“GAAP”), which requires management to make certain estimates and assumptions that affect the reported amounts of assets and liabilities, disclosure of contingent assets and liabilities at the date of the financial statements, and the reported amounts of income and expenses during the reporting period. Actual results may differ from these estimates. Each Fund is considered an investment company under GAAP and follows the accounting and reporting guidance applicable to investment companies in the Financial Accounting Standards Board Accounting Standards Codification Topic 946.
Investment Valuation
The Funds’ securities and other assets, excluding options on securities indexes, are valued at the closing price as of the close of regular trading on the New York Stock Exchange (the “NYSE”) (normally 4 p.m. Eastern Time) each day the NYSE is open, except that securities traded primarily on the NASDAQ Stock Market (“NASDAQ”) are normally valued by the Funds at the NASDAQ Official Closing Price provided by NASDAQ each business day. If the NYSE closes unexpectedly and there is active trading on other exchanges, the securities will be valued at the Valuation Time based off of those exchanges. Options on securities indexes are valued at the close of the Chicago Board Options Exchange (normally 4:15 p.m. Eastern Time) on each day the NYSE is open for trading.
| Annual Report | September 30, 2019 | 65 |
| ICON Sector Funds | Notes to Financial Statements |
September 30, 2019
The Funds use pricing services to obtain the fair value of securities in their portfolios. If a pricing service is not able to provide a price, or the pricing service’s valuation is considered inaccurate or does not, in the Funds’ judgment, reflect the fair value of the security, prices may be obtained through market quotations from independent broker/dealers. If market quotations from these sources are not readily available, the Funds’ securities or other assets are valued at fair value as determined in good faith by the Funds’ Valuation Committee pursuant to procedures approved by the Funds’ Board of Trustees (the “Board”).
Lacking any sales that day, a security is valued at the current closing bid price (or yield equivalent thereof) or based on quotes obtained from dealers making a market for the security. Exchange traded options are valued at the composite price, using the National Best Bid and Offer quotes (“NBBO”). NBBO consists of the highest bid price and lowest ask price across any of the exchanges on which an option is quoted, thus providing a view across the entire U.S. options marketplace. Debt securities with a remaining maturity of greater than 60 days are valued using the evaluated bid price supplied by the pricing service. The evaluated bid price supplied by the pricing service is based upon a matrix valuation system which considers such factors as security prices, yields, maturities and ratings. Short-term debt securities with remaining maturities of 60 days or less are generally valued at amortized cost or original cost plus accrued interest, which approximates fair value. Currency rates as of the close of the NYSE are used to convert foreign security values into U.S. dollars.
Securities of investment companies that trade on an exchange are valued at the last sales price or official closing price as of the close of the customary trading session on the exchange where the security is principally traded. Investments in shares of funds, including money market funds, that are not traded on an exchange are valued at the end of day net asset value (“NAV”) per share of such fund. Securities in the underlying funds, including restricted securities, are valued in accordance with the valuation policy of such fund.
The Funds’ securities traded in countries outside of the Western Hemisphere are fair valued daily by utilizing the quotations of an independent pricing service, unless the Funds’ Valuation Committee determines that use of another valuation methodology is appropriate. The purposes of daily fair valuation is to avoid stale prices and to take into account, among other things, any significant events occurring after the close of foreign markets. The pricing service uses statistical analyses and quantitative models to adjust local market prices using factors such as subsequent movements and changes in the prices of indexes, securities and exchange rates in other markets to determine fair value as of the time a Fund calculates its NAV. The valuation assigned to fair-value securities for purposes of calculating a Fund’s NAV may differ from the security’s most recent closing market price and from the prices used by other mutual funds to calculate their NAVs.
Various inputs are used to determine the value of the Funds’ investments. These inputs are summarized in the three broad levels listed below:
| Level 1 — | quoted prices in active markets for identical securities. |
| Level 2 — | significant observable inputs other than Level 1 quoted prices (including, but not limited to, quoted prices for similar securities, interest rates, prepayment speeds, and credit risk). |
| Level 3 — | significant unobservable inputs. |
Observable inputs are those based on market data obtained from sources independent of the Funds, and unobservable inputs reflect the Funds’ own assumptions based on the best information available. The input levels are not necessarily an indication of the risk or liquidity associated with investments at that level. For example, non-U.S. equity securities actively traded in foreign markets may be reflected in Level 2 despite the availability of closing prices, because the Funds evaluate and determine whether those closing prices reflect fair value at the close of the NYSE or require adjustment, as described above. The following table summarizes the Funds’ investments based on the inputs used to determine their values on September 30, 2019:
ICON Consumer Discretionary Fund
| Investments in Securities at Value* | | Level 1 - Quoted and Unadjusted Prices | | Level 2 - Other Significant Observable Inputs | | Level 3 - Significant Unobservable Inputs | | Total |
| Common Stocks | | $ | 20,008,917 | | | $ | — | | | $ | — | | | $ | 20,008,917 | |
| Total | | $ | 20,008,917 | | | $ | — | | | $ | — | | | $ | 20,008,917 | |
ICON Consumer Staples Fund
| Investments in Securities at Value* | | Level 1 - Quoted and Unadjusted Prices | | Level 2 - Other Significant Observable Inputs | | Level 3 - Significant Unobservable Inputs | | Total |
| Common Stocks | | $ | 11,157,553 | | | $ | — | | | $ | — | | | $ | 11,157,553 | |
| Collateral for Securities on Loan | | | — | | | | 748,025 | | | | — | | | | 748,025 | |
| Total | | $ | 11,157,553 | | | $ | 748,025 | | | $ | — | | | $ | 11,905,578 | |
| ICON Sector Funds | Notes to Financial Statements |
September 30, 2019
| ICON Energy Fund | | | | | | | | | | | | |
| Investments in Securities at Value* | | Level 1 - Quoted
and Unadjusted
Prices | | | Level 2 - Other
Significant
Observable Inputs | | | Level 3 - Significant
Unobservable
Inputs | | | Total | |
| Common Stocks | | $ | 101,399,057 | | | $ | — | | | $ | — | | | $ | 101,399,057 | |
| Collateral for Securities on Loan | | | — | | | | 255,037 | | | | — | | | | 255,037 | |
| Total | | $ | 101,399,057 | | | $ | 255,037 | | | $ | — | | | $ | 101,654,094 | |
| ICON Financial Fund | | | | | | | | | | | | |
| Investments in Securities at Value* | | Level 1 - Quoted
and Unadjusted
Prices | | | Level 2 - Other
Significant
Observable Inputs | | | Level 3 - Significant
Unobservable
Inputs | | | Total | |
| Common Stocks | | $ | 36,079,639 | | | $ | — | | | $ | — | | | $ | 36,079,639 | |
| Total | | $ | 36,079,639 | | | $ | — | | | $ | — | | | $ | 36,079,639 | |
| ICON Healthcare Fund | | | | | | | | | | | | |
| Investments in Securities at Value* | | Level 1 - Quoted
and Unadjusted
Prices | | | Level 2 - Other
Significant
Observable Inputs | | | Level 3 - Significant
Unobservable
Inputs | | | Total | |
| Common Stocks | | $ | 56,925,254 | | | $ | — | | | $ | — | | | $ | 56,925,254 | |
| Total | | $ | 56,925,254 | | | $ | — | | | $ | — | | | $ | 56,925,254 | |
| ICON Industrials Fund | | | | | | | | | | | | |
| Investments in Securities at Value* | | Level 1 - Quoted
and Unadjusted
Prices | | | Level 2 - Other Significant
Observable Inputs | | | Level 3 - Significant
Unobservable
Inputs | | | Total | |
| Common Stocks | | $ | 12,115,067 | | | $ | — | | | $ | — | | | $ | 12,115,067 | |
| Total | | $ | 12,115,067 | | | $ | — | | | $ | — | | | $ | 12,115,067 | |
| ICON Information Technology Fund | | | | | | | | | | | | |
| Investments in Securities at Value* | | Level 1 - Quoted
and Unadjusted
Prices | | | Level 2 - Other
Significant
Observable Inputs | | | Level 3 - Significant
Unobservable
Inputs | | | Total | |
| Common Stocks | | $ | 55,667,103 | | | $ | — | | | $ | — | | | $ | 55,667,103 | |
| Total | | $ | 55,667,103 | | | $ | — | | | $ | — | | | $ | 55,667,103 | |
| ICON Natural Resources Fund | | | | | | | | | | | | |
| Investments in Securities at Value* | | Level 1 - Quoted
and Unadjusted
Prices | | | Level 2 - Other
Significant
Observable Inputs | | | Level 3 - Significant
Unobservable
Inputs | | | Total | |
| Common Stocks | | | | | | | | | | | | | | | | |
| Paper Packaging | | $ | 7,833,039 | | | $ | 544,641 | | | $ | — | | | $ | 8,377,680 | |
| Paper Products | | | 1,521,102 | | | | 516,977 | | | | — | | | | 2,038,079 | |
| Other | | | 48,208,494 | | | | — | | | | — | | | | 48,208,494 | |
| Total | | $ | 57,562,635 | | | $ | 1,061,618 | | | $ | — | | | $ | 58,624,253 | |
| ICON Utilities Fund | | | | | | | | | | | | |
| Investments in Securities at Value* | | Level 1 - Quoted
and Unadjusted
Prices | | | Level 2 - Other
Significant
Observable Inputs | | | Level 3 - Significant
Unobservable
Inputs | | | Total | |
| Common Stocks | | $ | 51,775,146 | | | $ | — | | | $ | — | | | $ | 51,775,146 | |
| Total | | $ | 51,775,146 | | | $ | — | | | $ | — | | | $ | 51,775,146 | |
| * | Please refer to the Schedule of Investments and the Sector/Industry Classification tables for additional security details. |
There were no Level 3 securities held in any of the Funds at September 30, 2019.
| Annual Report | September 30, 2019 | 67 |
| ICON Sector Funds | Notes to Financial Statements |
September 30, 2019
Fund Share Valuation
Fund shares are sold and redeemed on a daily basis at NAV. NAV per share is determined daily as of the close of trading on the NYSE on each day the NYSE is open for trading. The NAV is computed by dividing the total value of the Fund’s investments and other assets, less liabilities, by the number of Fund shares outstanding.
Cash and Cash Equivalents
Idle cash may be swept into an overnight demand deposit account and is classified as cash and cash equivalents on the Statements of Assets and Liabilities. The Funds maintain cash in bank deposit accounts which, at times, may exceed United States federally insured limits. Amounts swept overnight are available on the next business day.
Foreign Currency Translation
The accounting records of the Funds are maintained in U.S. dollars. Investment securities and other assets and liabilities denominated in a foreign currency are translated daily into U.S. dollars at the prevailing rates of exchange. Income and expenses are translated into U.S. dollars at the prevailing exchange rate on the respective dates of the transactions. Purchases and sales of securities are translated into U.S. dollars at the contractual currency exchange rates established at the time of each trade.
The Funds do not isolate that portion of the results of operations resulting from changes in foreign exchange rates on investments from the fluctuations arising from changes in market prices of securities held. Net unrealized appreciation or depreciation on investments and foreign currency translations arise from changes in the value of assets and liabilities resulting from changes in the exchange rates and changes in market prices of securities held.
Options Transactions
The Funds’ use of derivatives for the year ended September 30, 2019 was limited to purchased options.
The Funds may purchase and/or write (sell) call and put options on any security in which they may invest. The Funds utilize options to hedge against changes in market conditions or to provide market exposure while trying to reduce transaction costs.
Option contracts involve market risk and liquidity risk and can be highly volatile. Should prices of securities or securities indexes move in an unexpected manner, the Funds may not achieve the desired benefits and may realize losses and thus be in a worse position than if such strategies had not been utilized.
When a Fund writes a put or call option, an amount equal to the premium received is included on the Statements of Assets and Liabilities as a liability. The amount of the liability is subsequently marked-to-market to reflect the current fair value of the option. If an option expires on its stipulated expiration date or if the Fund enters into a closing purchase transaction, a gain or loss is realized. If a written call option on an individual security is exercised, a gain or loss is realized for the sale of the underlying security, and the proceeds from the sale are increased by the premium originally received. If a written call option on a securities index is exercised, a gain or loss is realized as determined by the premium originally received, the exercise price and the fair value of the index. If a written put option on an individual security is exercised, the cost of the security acquired is decreased by the premium originally received. As a writer of an option, a Fund bears the market risk of an unfavorable change in the price of the individual security or securities index underlying the written option. Additionally, written call options may involve the risk of limiting gains.
Each Fund may also purchase put and call options. When a Fund purchases a put or call option, an amount equal to the premium paid is included on the Fund’s Statement of Assets and Liabilities as an investment, and is subsequently marked-to-market to reflect the current fair value of the option. If an option expires on the stipulated expiration date or if the Fund enters into a closing purchase or sale transaction, a gain or loss is realized. If the Fund exercises a call option on an individual security, the cost of the security acquired is increased by the premium paid for the call. If the Fund exercises a put option on an individual security, a gain or loss is realized from the sale of the underlying security, and the proceeds from such a sale are decreased by the premium originally paid. If the Fund exercises a put or a call option on a security index, a gain or loss is realized as determined by the premium originally paid, the exercise price and the fair value of the index. Written and purchased options are non-income producing securities.
| ICON Sector Funds | Notes to Financial Statements |
September 30, 2019
During the year ended September 30, 2019, the Energy Fund engaged in purchased option transactions.
The following is a summary of how these derivatives are treated in the financial statements and their impact on the Funds:
ICON Energy Fund
Risk Exposure | | Statements of Operations Location | | | Realized
Gain/(Loss) on
Derivatives
Recognized
in Income | | | | Change in
Unrealized Appreciation/
(Depreciation)
on Derivatives
Recognized
in Income | |
Equity Contracts
(Purchased Options) | | Net realized gain/(loss) on Investments, options and foreign currency translations/ Change in unrealized net appreciation/(depreciation) on Investments, options and foreign currency | | $ | 59,585 | | | $ | (8,967 | ) |
| Total | | | | $ | 59,585 | | | $ | (8,967 | ) |
The average purchased option contracts during the year ended September 30, 2019, were as follows:
| ICON Energy Fund | | | | | | |
| Derivative Type | | Unit of Measurement | | Average Contracts+ | | Days Held |
| Purchased Options | | Contracts | | 1,025 | | 266 |
| + | The average is calculated based on the actual number of days with outstanding derivatives. |
The Funds value derivatives at fair value, as described above, and recognize changes in fair value currently in the results of operations. Accordingly the Funds do not follow hedge accounting, even for derivatives employed as economic hedges.
Securities Lending
Under procedures adopted by the Board, the Funds may lend securities to certain approved brokers, dealers and other financial institutions to earn additional income. Collateral is received in exchange for securities on loan in the amount of at least 102% of the value of U.S. securities loaned or at least 105% of the value of non-U.S. securities loaned, marked to market daily. The Funds retain certain benefits of owning the securities, including receipt of dividends or interest generated by the security, but give up other rights including the right to vote proxies. The Funds retain the ability to recall the loans at any time and could do so in order to vote proxies or to sell the loaned securities. Each loan is collateralized by assets that generally exceed the value of the securities on loan. Collateral may consist of cash or securities issued or guaranteed by the United States government or its agencies or instrumentalities. The fair value of the loaned securities is determined daily at the close of business of the Funds and any additional required collateral is delivered to each Fund on the next business day.
The following is a summary of the Funds’ securities lending positions and related cash and non-cash collateral received as of September 30, 2019:
| | | Market Value of
Securities on Loan | | | Market Value of
Cash Collateral
Received | | | Market Value of
Non-Cash Collateral
Received | | | Total Collateral
Received | | | Excess Collateral | |
| ICON Consumer Staples Fund | | $ | 2,478,090 | | | $ | 748,025 | | | $ | 1,769,539 | | | $ | 2,517,564 | | | $ | 39,474 | |
| ICON Energy Fund | | | 3,704,650 | | | | 255,037 | | | | 3,671,245 | | | | 3,926,282 | | | | 221,632 | |
| ICON Financial Fund | | | 729,818 | | | | — | | | | 733,650 | | | | 733,650 | | | | 3,832 | |
| ICON Healthcare Fund | | | 46,448 | | | | — | | | | 49,290 | | | | 49,290 | | | | 2,842 | |
| ICON Information Technology Fund | | | 897,151 | | | | — | | | | 949,130 | | | | 949,130 | | | | 51,979 | |
| Annual Report | September 30, 2019 | 69 |
| ICON Sector Funds | | Notes to Financial Statements |
| | September 30, 2019 |
Generally, in the event of borrower default, the Funds have the right to use the collateral to offset any losses incurred. In the event the Funds are delayed or prevented from exercising their rights to dispose of the collateral, there may be a potential loss to the Funds. Some of these losses may be indemnified by the lending agent.
The Funds have elected to invest cash collateral received from lending in the State Street Navigator Securities Lending Government Money Market Portfolio which is disclosed on the Schedules of Investments. The Funds bear the risk of loss with respect to the investment of cash collateral. The State Street Navigator Securities Lending Government Money Market Portfolio is a Government Money Market Portfolio designed to provide continuous daily liquidity. Non-Cash collateral received consists of securities issued or guaranteed by the United States government or its agencies or instrumentalities with remaining maturities ranging from overnight to 30 years. Non-cash collateral is not disclosed on the Funds’ Schedules of Investments or their Statements of Assets and Liabilities as the Funds do not have the ability to re-hypothecate these securities. The net securities lending income earned by the Funds for the year ended September 30, 2019, is included in the Statements of Operations.
The value of the collateral could include collateral held for securities that were sold on or before September 30, 2019. It may also include collateral received from the pre-funding of security loans.
Security loans consist of equity securities and generally do not have a stated maturity date. The Funds may recall a loaned security at any time.
Income Taxes, Dividends, and Distributions
The Funds intend to continue to qualify as regulated investment companies under Subchapter M of the Internal Revenue Code and, accordingly, the Funds will generally not be subject to federal and state income taxes or federal excise taxes to the extent that they intend to make sufficient distributions of net investment income and net realized capital gains. As of and during the year ended September 30, 2019, the Funds did not have a liability for any unrecognized tax benefits in the accompanying financial statements. The Funds recognize the interest and penalties, if any, related to the unrecognized tax benefits as income tax expense in the Statements of Operations. During the period, the Funds did not incur any interest or penalties.
Dividends paid by the Funds from net investment income and distributions of net realized short-term gains are, for federal income tax purposes, taxable as ordinary income to shareholders.
Dividends and distributions to shareholders are recorded by the Funds on the ex-dividend/distribution date. The Funds distribute income and net realized capital gains, if any, to shareholders at least annually, if not offset by capital loss carryforward. Income distributions and capital gain distributions are determined in accordance with income tax regulations, which may differ from GAAP.
Management has analyzed the Funds’ tax positions taken on federal income tax returns for all open tax periods and has concluded that no provision for federal income tax is required in the Funds’ financial statements.
The Funds file U.S. tax returns. While the statute of limitations remains open to examine the Funds’ U.S. tax returns filed for the past three years, no examinations are in progress or anticipated at this time. The Funds are not aware of any tax positions for which it is reasonably possible that the total amounts of unrecognized tax benefits will significantly change in the next twelve months.
Certain foreign countries impose a capital gains tax which is accrued by the Funds based on the unrealized appreciation, if any, on affected securities. Any accrual would reduce a Fund’s NAV. The tax is paid when the gain is realized and is included in capital gains tax in the Statements of Operations.
Investment Income
Dividend income is recorded on the ex-dividend date. Non-cash dividends included in dividend income, if any, are recorded at the fair value of the securities received. Interest income is accrued as earned. Certain dividends from foreign securities are recorded as soon as the Funds are informed of the dividend if such information is obtained subsequent to the ex-dividend date. Discounts and premiums on fixed income securities purchased are accreted or amortized to income over the life of the respective securities based on the effective yield.
Investment Transactions
Security transactions are accounted for no later than one business day after the trade date. However, for financial reporting purposes, security transactions are accounted for on the trade date. Gains and losses on securities sold are determined on the basis of identified cost.
| ICON Sector Funds | | Notes to Financial Statements |
| | September 30, 2019 |
Withholding Tax
Withholding taxes on foreign dividends have been provided for in accordance with the Funds’ understanding of the applicable country’s tax rules and rates.
Other
The Funds hold certain investments which pay dividends to their shareholders based upon available funds from operations. It is possible for these dividends to exceed the underlying investments’ taxable earnings and profits resulting in the excess portion of such dividends being designated as a return of capital. Distributions received from investments in securities that represent a return of capital or capital gains are recorded as a reduction of the cost of investments or as a realized gain, respectively.
The ability of issuers of debt securities held by the Funds to meet their obligations may be affected by economic and political developments in specific country or region.
Allocation of Expenses
Each class of a Fund’s shares bears expenses incurred specifically on its behalf and, in addition, each class bears a portion of general expenses, based upon relative net assets of each class or number of shareholder accounts. Expenses which cannot be directly attributed to a specific Fund in the Trust are apportioned between all Funds in the Trust based upon relative net assets or number of shareholder accounts. In calculating the net asset value per share of each class, investment income, realized and unrealized gains and losses and expenses other than class-specific expenses are allocated daily to each class of shares based upon the proportion of net assets.
Below are additional class level expenses for the year ended September 30, 2019 that are included on the Statements of Operations:
| Fund | | Printing Fees* | | | Transfer Agent Fees* | | | Registration Fees | |
| ICON Consumer Discretionary Fund | | | | | | | | | | | | |
| Class S | | $ | 4,798 | | | $ | 46,590 | | | $ | 18,695 | |
| Class A | | | 135 | | | | 2,957 | | | | 5,626 | |
| ICON Consumer Staples Fund | | | | | | | | | | | | |
| Class S | | | 1,894 | | | | 27,156 | | | | 16,135 | |
| Class A | | | 232 | | | | 8,075 | | | | 7,740 | |
| ICON Energy Fund | | | | | | | | | | | | |
| Class S | | | 25,156 | | | | 365,482 | | | | 25,231 | |
| Class C | | | 641 | | | | 7,508 | | | | 8,919 | |
| Class A | | | 651 | | | | 8,989 | | | | 8,492 | |
| ICON Financial Fund | | | | | | | | | | | | |
| Class S | | | 5,837 | | | | 64,372 | | | | 19,628 | |
| Class A | | | 120 | | | | 3,887 | | | | 5,968 | |
| ICON Healthcare Fund | | | | | | | | | | | | |
| Class S | | | 10,180 | | | | 127,826 | | | | 19,831 | |
| Class A | | | 327 | | | | 5,301 | | | | 6,659 | |
| ICON Industrials Fund | | | | | | | | | | | | |
| Class S | | | 4,194 | | | | 34,950 | | | | 17,318 | |
| Class A | | | 137 | | | | 2,683 | | | | 6,702 | |
| ICON Information Technology Fund | | | | | | | | | | | | |
| Class S | | | 6,912 | | | | 86,689 | | | | 19,919 | |
| Class A | | | 278 | | | | 4,362 | | | | 7,977 | |
| ICON Natural Resources Fund | | | | | | | | | | | | |
| Class S | | | 13,964 | | | | 164,870 | | | | 20,913 | |
| Class C | | | 116 | | | | 1,794 | | | | 6,308 | |
| Class A | | | 576 | | | | 8,848 | | | | 8,241 | |
| ICON Utilities Fund | | | | | | | | | | | | |
| Class S | | | 5,224 | | | | 83,813 | | | | 18,552 | |
| Class A | | | — | | | | 5,932 | | | | 8,357 | |
| * | Printing fees and Transfer agent out of pocket fees are a Fund level expense. |
| |
| Annual Report | September 30, 2019 | | 71 |
| ICON Sector Funds | | Notes to Financial Statements |
| | September 30, 2019 |
3. FEES, OTHER SERVICES AND OTHER TRANSACTIONS WITH AFFILIATES
Investment Advisory Fees
ICON Advisers, Inc. (“ICON Advisers”) serves as investment adviser to the Funds and is responsible for managing the Funds’ portfolios of investments. ICON Advisers receives a monthly management fee that is computed daily at an annual rate of 1.00% on the first $500 million of average daily net assets, 0.95% on the next $250 million, 0.925% on the next $750 million, 0.90% on the next $3.5 billion, and 0.875% on average daily net assets over $5 billion.
ICON Advisers has contractually agreed to limit its Funds’ expenses (exclusive of brokerage, interest, taxes, dividends on short sales, acquired fund fees and expenses and extraordinary expenses) to the extent necessary to ensure that the Funds’ operating expenses do not exceed the following amounts:
| | | | | | | | | | | | |
| Fund | | Class S | | Class C | | Class A | | | | |
| |
ICON Consumer Discretionary Fund | | 1.74% | | — | | | 1.99 | % | | | | |
ICON Consumer Staples Fund | | 1.50% | | — | | | 1.75 | % | | | | |
ICON Energy Fund | | 1.50% | | 2.50% | | | 1.75 | % | | | | |
ICON Financial Fund | | 1.50% | | — | | | 1.75 | % | | | | |
ICON Healthcare Fund | | 1.50% | | — | | | 1.75 | % | | | | |
ICON Industrials Fund | | 1.50% | | — | | | 1.75 | % | | | | |
ICON Information Technology Fund | | 1.50% | | — | | | 1.75 | % | | | | |
ICON Natural Resources Fund | | 1.50% | | 2.50% | | | 1.75 | % | | | | |
ICON Utilities Fund | | 1.22% | | — | | | 1.47 | % | | | | |
The Funds’ expense limitations will continue in effect until at least January 31, 2021. To the extent ICON Advisers reimburses or absorbs fees and expenses, it may seek payment of such amounts for up to three years after the expenses were reimbursed or absorbed. A Fund will make no such payment, however, if the total Fund operating expenses exceed the expense limits in effect at the time these payments are proposed.
As of September 30, 2019, the following amounts were available for recoupment by ICON Advisers based upon their potential expiration dates:
| Fund | | Expires 2020 | | | Expires 2021 | | | Expires 2022 | |
| ICON Consumer Discretionary Fund | | $ | 4,198 | | | $ | 3,577 | | | $ | 6,302 | |
| ICON Consumer Staples Fund | | | 63,487 | | | | 69,700 | | | | 68,895 | |
| ICON Energy Fund | | | — | | | | 3,104 | | | | 176,080 | |
| ICON Financial Fund | | | 6,790 | | | | 5,239 | | | | 22,242 | |
| ICON Healthcare Fund | | | 4,986 | | | | 3,569 | | | | 12,643 | |
| ICON Industrials Fund | | | 44,703 | | | | 50,110 | | | | 60,705 | |
| ICON Information Technology Fund | | | 6,814 | | | | 5,978 | | | | 8,958 | |
| ICON Natural Resources Fund | | | 26,508 | | | | 69,036 | | | | 137,022 | |
| ICON Utilities Fund | | | 57,017 | | | | 130,032 | | | | 148,743 | |
Accounting, Custody and Transfer Agent Fees
ALPS Fund Services (“ALPS”) serves as the fund accounting agent for the Trust. For its services, the Trust pays ALPS a fee that is calculated daily and paid monthly, which is the greater of an annual rate based on the aggregate average daily net assets of the Trust or a contractual minimum annual fee.
State Street is the custodian of the Trust’s investments. For its services, the Trust pays State Street asset-based fees that vary according to the number of positions and transactions, plus out-of-pocket expenses.
ALPS is the Trust’s transfer agent. For these services, the Trust pays an annual fee plus annual base fee per Fund, per account fees and out-of-pocket expenses.
Administrative Services
The Trust has entered into an administrative services agreement with ICON Advisers pursuant to which ICON Advisers oversees the administration of the Trust’s business and affairs. This agreement provides for an annual fee of 0.05% on the Trust’s first $1.5 billion of average daily net assets, 0.045% on the next $1.5 billion of average daily net assets, 0.040% on the next $2 billion of average daily net assets and 0.030% on average daily
| ICON Sector Funds | | Notes to Financial Statements |
| | September 30, 2019 |
net assets over $5 billion. For the year ended September 30, 2019, each Fund’s payment for administrative services to ICON Advisers is included on the Statements of Operations. The administrative services agreement provides that ICON Advisers will not be liable for any error of judgment, mistake of law, or any loss suffered by the Trust in connection with matters to which the administrative services agreement relates, except for a loss resulting from willful misfeasance, bad faith or negligence by ICON Advisers in the performance of its duties.
ICON Advisers has a sub-administration agreement, with ALPS, under which ALPS assists ICON Advisers with the administration and business affairs of the Trust. For its services, ICON Advisers pays ALPS a fee, that is calculated daily and paid monthly, which is the greater of an annual rate based on the aggregate average daily net assets of the Trust or a contractual minimum annual fee.
Distribution Fees
ICON Distributors, Inc. (“IDI” or “Distributor”), a wholly-owned subsidiary of ICON Management and Research and affiliate of ICON Advisers, Inc., serves the Trust as Distributor. The Trust has adopted a Distribution Plan pursuant to Rule 12b-1 under the 1940 Act (“12b-1 Plan”) under which the Funds are authorized to compensate or reimburse the Distributor for the sale and distribution of shares and for other shareholder services. The shareholders of the Funds pay an annual distribution fee of 1.00% of average daily net assets for Class C shares and an annual distribution fee of 0.25% of average daily net assets for Class A shares. There is no annual distribution fee for Class S shares. The total amount paid by each Fund under the 12b-1 Plan is shown on the Statements of Operations.
Class A Shares are subject to an initial sales charge and the public offering price of Class A shares equals net asset value plus the applicable sales charge, which is a maximum of 5.75%. For the year ended September 30, 2019, IDI collected sales charges on purchases of Class A Shares, the majority of which were paid out as concessions to financial intermediaries, as follows:
| Fund | | Sales Charges Collected |
| ICON Consumer Discretionary Fund Class A | | $ | 253 | |
| ICON Consumer Staples Fund Class A | | | 1,935 | |
| ICON Energy Fund Class A | | | 2,292 | |
| ICON Financial Fund Class A | | | 909 | |
| ICON Healthcare Fund Class A | | | 686 | |
| ICON Information Technology Fund Class A | | | 1,589 | |
| ICON Natural Resources Fund Class A | | | 1,195 | |
| ICON Utilities Fund Class A | | | 5,192 | |
In addition, IDI receives a contingent deferred sales charge of 1.00% of the purchase price on redemptions of Class C shares made within one year following the date of purchase. A 1.00% contingent deferred sales charge may also apply to certain redemptions of Class A shares made within one year following the purchase of $1 million or more without an initial sales charge. For the year ended September 30, 2019, IDI collected the following contingent deferred sales charges:
| | | Contingent Deferred |
| Fund | | Sales Charges Collected |
| ICON Energy Fund Class C | | $ | 13 | |
| ICON Natural Resources Fund Class C | | | 42 | |
Other Related Parties
Certain Officers and Directors of ICON Advisers are also Officers and Trustees of the Funds; however, such Officers and Trustees (with the exception of the Chief Compliance Officer, “CCO”) receive no compensation from the Funds. The Trust pays a portion of the CCO’s salary and the remaining portion, along with other employee related expenses, is paid by ICON Advisers. For the year ended September 30, 2019, the total related amounts paid by the Funds under this arrangement are included in Other Expenses on the Statements of Operations.
The Funds may reimburse ICON Advisers for legal work performed for the Funds by its attorneys outside of the advisory and administration contracts. The Board reviews and approves such reimbursements. For the year ended September 30, 2019, the total related amounts accrued and paid by the Funds under this arrangement was $0.
The Funds did not engage in cross trades with each other, during the year ended September 30, 2019, pursuant to Rule 17a-7 under the 1940 Act. Generally, cross trading is the buying or selling of portfolio securities between funds to which the Adviser serves as the investment adviser. The Board previously adopted procedures that apply to transactions between the Funds and its affiliates pursuant to Rule 17a-7. At its regularly scheduled meetings, the Board reviews such transactions as of the most current calendar quarter for compliance with the requirements set forth by Rule 17a-7 and the Funds’ procedures. The procedures require that the transactions be a purchase or sale for no consideration other than cash
| |
| Annual Report | September 30, 2019 | | 73 |
| ICON Sector Funds | | Notes to Financial Statements |
| | September 30, 2019 |
payment against prompt delivery of a security for which market quotations are readily available, and be consistent with the investment policies of each Fund.
4. BORROWINGS
The Trust has entered into an uncommitted, unsecured, revolving Line of Credit agreement/arrangement with State Street to provide temporary funding for redemption requests. The maximum borrowing limit is $30 million. Interest on domestic borrowings is charged at a rate quoted and determined by State Street. The interest rate as of September 30, 2019 was 3.27%. The Line of Credit agreement/arrangement expires on March 16, 2020.
For the year ended September 30, 2019, the average outstanding loan by Fund was as follows:
| | | Maximum Borrowing | | | Average Borrowing | | | Average Interest Rates |
| Fund | | (10/01/18 - 09/30/19) | | | (10/01/18 - 09/30/19)^ | | | (10/01/18 - 09/30/19)^ |
| ICON Consumer Discretionary Fund* | | $ | 181,555 | | | $ | 88,275 | | | | 3.64 | % |
| ICON Consumer Staples Fund* | | | 2,544,861 | | | | 694,941 | | | | 3.66 | % |
| ICON Energy Fund* | | | 2,553,409 | | | | 589,216 | | | | 3.54 | % |
| ICON Financial Fund* | | | 1,754,817 | | | | 352,452 | | | | 3.57 | % |
| ICON Healthcare Fund* | | | 794,312 | | | | 244,635 | | | | 3.64 | % |
| ICON Industrials Fund* | | | 1,350,397 | | | | 185,718 | | | | 3.64 | % |
| ICON Information Technology Fund* | | | 263,567 | | | | 105,753 | | | | 3.59 | % |
| ICON Natural Resources Fund* | | | 3,231,147 | | | | 580,121 | | | | 3.63 | % |
| ICON Utilities Fund* | | | 1,517,516 | | | | 429,734 | | | | 3.70 | % |
| * | There were no outstanding borrowings under this agreement/arrangement as of September 30, 2019. |
| ^ | The average is calculated based on the actual number of days with outstanding borrowings. |
5. PURCHASES AND SALES OF INVESTMENT SECURITIES
For the year ended September 30, 2019, the aggregate cost of purchases and proceeds from sales of investment securities (excluding short-term securities) was as follows:
| | | Purchases of | | Proceeds from |
| Fund | | Securities | | Sales of Securities |
| ICON Consumer Discretionary Fund | | $ | 32,898,856 | | | $ | 35,208,590 | |
| ICON Consumer Staples Fund | | | 20,420,358 | | | | 16,102,018 | |
| ICON Energy Fund | | | 86,442,895 | | | | 111,899,670 | |
| ICON Financial Fund | | | 10,511,243 | | | | 17,976,526 | |
| ICON Healthcare Fund | | | 18,121,884 | | | | 30,514,605 | |
| ICON Industrials Fund | | | 9,631,421 | | | | 10,326,322 | |
| ICON Information Technology Fund | | | 50,686,656 | | | | 59,053,961 | |
| ICON Natural Resources Fund | | | 68,780,275 | | | | 84,395,473 | |
| ICON Utilities Fund | | | 70,523,968 | | | | 61,055,666 | |
6. FEDERAL INCOME TAX
The following information is presented on an income tax basis. Differences between GAAP and federal income tax purposes that are permanent in nature are reclassified within the capital accounts. Temporary differences do not require reclassification. Temporary and permanent differences do not impact the NAVs of the Funds.
Under current law, capital losses maintain their character as short-term or long-term and are carried forward to the next tax year without expiration.
| ICON Sector Funds | | Notes to Financial Statements |
| | September 30, 2019 |
The capital losses with no expiration were as follows:
| Fund | | Short-Term | | | Long-Term | |
| ICON Consumer Discretionary Fund | | $ | 43,895 | | | $ | 220,648 | |
| ICON Consumer Staples Fund | | | — | | | | 475,915 | |
| ICON Energy Fund | | | 78,475,365 | | | | 95,358,320 | |
| ICON Natural Resources Fund | | | 99,314 | | | | 109,675 | |
The following Funds elect to defer to the period ending September 30, 2020, capital losses recognized during the period November 1, 2018 to September 30, 2019:
| Fund | | Capital Losses Deferred | |
| ICON Consumer Discretionary Fund | | $ | 1,839,002 | |
| ICON Energy Fund | | | 21,782,634 | |
| ICON Healthcare Fund | | | 322,313 | |
| ICON Industrials Fund | | | 572,088 | |
| ICON Natural Resources Fund | | | 5,134,405 | |
The following Funds elect to defer to the period ending September 30, 2020, late year ordinary losses:
| Fund | | Ordinary Losses Deferred | |
| ICON Consumer Discretionary Fund | | $ | 99,309 | |
| ICON Healthcare Fund | | | 187,370 | |
| ICON Information Technology Fund | | | 107,440 | |
For the year ended September 30, 2019, the following reclassifications were made, which had no impact on results of operations or net assets.
| | | | | | Total Distributable | |
| Fund | | Paid-in Capital | | | Earnings | |
| ICON Consumer Discretionary Fund | | $ | (2,565 | ) | | $ | 2,565 | |
| ICON Energy Fund | | | (98,834 | ) | | | 98,834 | |
| ICON Industrials Fund | | | 2,670 | | | | (2,670 | ) |
| ICON Information Technology Fund | | | (35,491 | ) | | | 35,491 | |
| ICON Natural Resources Fund | | | 5,080 | | | | (5,080 | ) |
For Consumer Discretionary Fund and Information Technology Fund included in the amounts reclassified were a net operating loss offset to paid in capital of $2,565 and $35,491, respectively.
The tax characteristics of distributions paid to shareholders during the fiscal year ended September 30, 2019, were as follows:
| | | | | | Long-Term Capital | | | | |
| Fund | | Ordinary Income | | | Gains | | | Return of Capital | |
| ICON Consumer Staples Fund | | $ | 102,337 | | | $ | — | | | $ | — | |
| ICON Energy Fund | | | 36,753 | | | | — | | | | 485,179 | |
| ICON Financial Fund | | | 244,510 | | | | — | | | | — | |
| ICON Healthcare Fund | | | 1,645,473 | | | | 3,376,583 | | | | — | |
| ICON Information Technology Fund | | | 5,119,639 | | | | 2,164,142 | | | | — | |
| ICON Natural Resources Fund | | | 5,186,377 | | | | 5,752,876 | | | | — | |
| ICON Utilities Fund | | | 1,276,398 | | | | 164,374 | | | | — | |
| |
| Annual Report | September 30, 2019 | | 75 |
| ICON Sector Funds | | Notes to Financial Statements |
| | September 30, 2019 |
The tax characteristics of distributions paid to shareholders during the fiscal year ended September 30, 2018, were as follows:
| | | | | | Long-Term Capital | |
| Fund | | Ordinary Income | | | Gains | |
| ICON Consumer Discretionary Fund | | $ | 946,956 | | | $ | — | |
| ICON Consumer Staples Fund | | | 697,696 | | | | 457,925 | |
| ICON Energy Fund | | | 3,446,209 | | | | — | |
| ICON Financial Fund | | | 94,842 | | | | — | |
| ICON Healthcare Fund | | | 833,129 | | | | 1,243,391 | |
| ICON Information Technology Fund | | | 3,421,861 | | | | 10,355,627 | |
| ICON Natural Resources Fund | | | 1,011,303 | | | | — | |
| ICON Utilities Fund | | | 2,149,591 | | | | 1,205,125 | |
As of September 30, 2019, the components of accumulated earnings/(deficit) on a tax basis were as follows:
| | | | | | Accumulated | | | Other Cumulative | | | Unrealized | | | | |
| | | Undistributed | | | Capital | | | Effect of Timing | | | Appreciation/ | | | Total Accumulated | |
| Fund | | Ordinary Income | | | Gains/(Losses) | | | Differences | | | (Depreciation)* | | | Earnings/(Deficit) | |
| ICON Consumer Discretionary Fund | | $ | — | | | $ | (2,103,545 | ) | | $ | (99,309 | ) | | $ | 1,492,640 | | | $ | (710,214 | ) |
| ICON Consumer Staples Fund | | | 68,775 | | | | (475,915 | ) | | | — | | | | (2,152 | ) | | | (409,292 | ) |
| ICON Energy Fund | | | — | | | | (195,616,319 | ) | | | — | | | | (10,747,760 | ) | | | (206,364,079 | ) |
| ICON Financial Fund | | | 218,126 | | | | 224,592 | | | | — | | | | 6,328,354 | | | | 6,771,072 | |
| ICON Healthcare Fund | | | — | | | | (322,313 | ) | | | (187,370 | ) | | | 2,232,390 | | | | 1,722,707 | |
| ICON Industrials Fund | | | 43,655 | | | | (572,088 | ) | | | — | | | | 1,890,685 | | | | 1,362,252 | |
| ICON Information Technology Fund | | | — | | | | 2,388,009 | | | | (107,440 | ) | | | 11,586,153 | | | | 13,866,722 | |
| ICON Natural Resources Fund | | | 864,664 | | | | (5,343,394 | ) | | | — | | | | 307,796 | | | | (4,170,934 | ) |
| ICON Utilities Fund | | | 1,135,342 | | | | 566,581 | | | | — | | | | 6,368,423 | | | | 8,070,346 | |
| * | Differences between the book-basis and tax-basis unrealized appreciation/(depreciation) are attributable primarily to tax treatment of tax deferral of losses on wash sales. |
As of September 30, 2019, cost on investments for federal income tax purposes and the amount of net unrealized appreciation/(depreciation) were as follows:
| | | Gross Appreciation | | | Gross Depreciation | | | Net Appreciation/ | | | Net Unrealized | | | Cost of Investments | |
| | | (excess of value | | | (excess of tax cost | | | (Depreciation) of | | | Appreciation/ | | | for Income Tax | |
| Fund | | over tax cost) | | | over value) | | | Foreign Currency | | | (Depreciation)* | | | Purposes | |
| ICON Consumer Discretionary Fund | | $ | 2,257,852 | | | $ | (765,212 | ) | | $ | — | | | $ | 1,492,640 | | | $ | 18,516,277 | |
| ICON Consumer Staples Fund | | | 582,612 | | | | (584,764 | ) | | | — | | | | (2,152 | ) | | | 11,907,730 | |
| ICON Energy Fund | | | 5,635,505 | | | | (16,383,265 | ) | | | — | | | | (10,747,760 | ) | | | 112,401,854 | |
| ICON Financial Fund | | | 7,740,472 | | | | (1,412,118 | ) | | | — | | | | 6,328,354 | | | | 29,751,285 | |
| ICON Healthcare Fund | | | 8,952,885 | | | | (6,720,495 | ) | | | — | | | | 2,232,390 | | | | 54,692,864 | |
| ICON Industrials Fund | | | 2,037,144 | | | | (146,462 | ) | | | 3 | | | | 1,890,685 | | | | 10,224,385 | |
| ICON Information Technology Fund | | | 12,843,719 | | | | (1,257,566 | ) | | | — | | | | 11,586,153 | | | | 44,080,950 | |
| ICON Natural Resources Fund | | | 4,388,624 | | | | (4,079,683 | ) | | | (1,145 | ) | | | 307,796 | | | | 58,315,312 | |
| ICON Utilities Fund | | | 6,658,615 | | | | (290,208 | ) | | | 16 | | | | 6,368,423 | | | | 45,406,739 | |
| * | This balance includes appreciation/(depreciation) of foreign currency. |
7. RECENT ACCOUNTING PRONOUNCEMENT
In August 2018, the Financial Accounting Standards Board (“FASB”) issued Accounting Standards Update (“ASU”) 2018-13, which changes the fair value measurement disclosure requirements of FASB Accounting Standards Codification Topic 820, Fair Value Measurement. The update to Topic 820 includes new, eliminated, and modified disclosure requirements. ASU 2018-13 is effective for fiscal years beginning after December 15, 2019, including interim periods. Early adoption is permitted for any eliminated or modified disclosures. Management has eliminated and modified disclosures and is currently evaluating the impact of the remaining ASU.
| | Report of Independent Registered |
| ICON Sector Funds | Public Accounting Firm |
To the Shareholders and Board of Trustees of
ICON Funds
Opinion on the Financial Statements
We have audited the accompanying statements of assets and liabilities, including the schedules of investments, of ICON Consumer Discretionary Fund, ICON Consumer Staples Fund, ICON Energy Fund, ICON Financial Fund, ICON Healthcare Fund, ICON Industrials Fund, ICON Information Technology Fund, ICON Natural Resources Fund, and ICON Utilities Fund (the “Funds”), each a series of ICON Funds, as of September 30, 2019, and the related statements of operations for the year then ended, the statements of changes in net assets for each of the two years in the period then ended, including the related notes, and the financial highlights for each of the four years in the period then ended (collectively referred to as the “financial statements”). In our opinion, the financial statements present fairly, in all material respects, the financial position of each of the Funds as of September 30, 2019, the results of their operations for the year then ended, the changes in their net assets for each of the two years in the period then ended, and the financial highlights for each of the four years in the period then ended, in conformity with accounting principles generally accepted in the United States of America.
The Funds’ financial highlights for the year ended September 30, 2015, were audited by other auditors whose report dated November 18, 2015, expressed an unqualified opinion on those financial highlights.
Basis for Opinion
These financial statements are the responsibility of the Funds’ management. Our responsibility is to express an opinion on the Funds’ financial statements based on our audits. We are a public accounting firm registered with the Public Company Accounting Oversight Board (United States) (“PCAOB”) and are required to be independent with respect to the Funds in accordance with the U.S. federal securities laws and the applicable rules and regulations of the Securities and Exchange Commission and the PCAOB.
We conducted our audits in accordance with the standards of the PCAOB. Those standards require that we plan and perform the audit to obtain reasonable assurance about whether the financial statements are free of material misstatement, whether due to error or fraud.
Our audits included performing procedures to assess the risks of material misstatement of the financial statements, whether due to error or fraud, and performing procedures that respond to those risks. Such procedures included examining, on a test basis, evidence regarding the amounts and disclosures in the financial statements. Our procedures included confirmation of securities owned as of September 30, 2019, by correspondence with the custodian and brokers. Our audits also included evaluating the accounting principles used and significant estimates made by management, as well as evaluating the overall presentation of the financial statements. We believe that our audits provide a reasonable basis for our opinion.
We have served as the Funds’ auditor since 2016.

COHEN & COMPANY, LTD.
Cleveland, Ohio
November 25, 2019
| |
| Annual Report | September 30, 2019 | | 77 |
| ICON Sector Funds | Disclosure of Fund Expenses |
September 30, 2019 (Unaudited)
Example
As a shareholder of a Fund you may pay two types of fees: transaction fees and fund-related fees. Certain funds charge transaction fees, including sales charges (loads) on purchase payments, reinvested dividends, or other distributions; redemption fees; and exchange fees. Funds also incur various ongoing expenses, including management fees, distribution and/or service fees, and other fund expenses, which are indirectly paid by shareholders.
This Example is intended to help you understand your ongoing costs (in dollars) of investing in the various ICON Funds and to compare these costs with the ongoing costs of investing in other mutual funds. This Example is based on an investment of $1,000 invested at the beginning of the six- month period and held for the six-months period (04/01/19 – 09/30/19).
Actual Expenses
The first line in the table for each Fund provides information about actual account values and actual expenses. The Example includes, but is not limited to, management fees, 12b-1 fees, fund accounting, custody and transfer agent fees. However, the Example does not include client specific fees, such as the $15 fee charged to IRA accounts, or the $15 fee charged for wire redemptions. You may use this information, together with the amount you invested, to estimate the expenses that you paid over the period. Simply divide your account value by $1,000 (for example, an $8,600 account value divided by $1,000 = 8.6), then multiply the result by the number in the first line for each Fund under the heading entitled “Expenses Paid During Period” to estimate the expenses you paid on your account during this period.
Hypothetical Example for Comparison Purposes
The second line in the table for each Fund provides information about hypothetical account values and hypothetical expenses based on the Fund’s actual expense ratio and an assumed rate of return of 5% per year before expenses, which is not the Fund’s actual return. The hypothetical account values and expenses may not be used to estimate the actual ending account balance or expenses you paid for the period. You may use this information to compare the ongoing costs of investing in the Fund and other funds. To do so, compare this 5% hypothetical example with the 5% hypothetical examples that appear in the shareholder reports of the other funds. Please note that the expenses shown in the table are meant to highlight your ongoing costs only and do not reflect any transactional costs, such as sales charges (loads), redemption fees, or exchange fees that may be charged by other funds. Therefore, this information is useful in comparing ongoing costs only, and will not help you determine the relative total costs of owning different funds.
| | | | | | | | | Expenses Paid |
| | | | | | | | | During period |
| | | Beginning Account | | Ending Account | | | | April 1, 2019 - |
| | | Value | | Value | | | | September 30, |
| | | April 1, 2019 | | September 30, 2019 | | Expense Ratio(a) | | 2019(b) |
| ICON Consumer Discretionary Fund | | | | | | | | | | | | | | | | |
| Class S | | | | | | | | | | | | | | | | |
| Actual | | $ | 1,000.00 | | | $ | 975.30 | | | | 1.71 | % | | $ | 8.47 | |
| Hypothetical (5% return before expenses) | | $ | 1,000.00 | | | $ | 1,016.50 | | | | 1.71 | % | | $ | 8.64 | |
| Class A | | | | | | | | | | | | | | | | |
| Actual | | $ | 1,000.00 | | | $ | 973.20 | | | | 1.99 | % | | $ | 9.84 | |
| Hypothetical (5% return before expenses) | | $ | 1,000.00 | | | $ | 1,015.09 | | | | 1.99 | % | | $ | 10.05 | |
| | | | | | | | | | | | | | | | | |
| ICON Consumer Staples Fund | | | | | | | | | | | | | | | | |
| Class S | | | | | | | | | | | | | | | | |
| Actual | | $ | 1,000.00 | | | $ | 1,013.50 | | | | 1.50 | % | | $ | 7.57 | |
| Hypothetical (5% return before expenses) | | $ | 1,000.00 | | | $ | 1,017.55 | | | | 1.50 | % | | $ | 7.59 | |
| Class A | | | | | | | | | | | | | | | | |
| Actual | | $ | 1,000.00 | | | $ | 1,013.50 | | | | 1.75 | % | | $ | 8.83 | |
| Hypothetical (5% return before expenses) | | $ | 1,000.00 | | | $ | 1,016.29 | | | | 1.75 | % | | $ | 8.85 | |
| ICON Sector Funds | Disclosure of Fund Expenses |
September 30, 2019 (Unaudited)
| | | | | | | | | Expenses Paid |
| | | | | | | | | During period |
| | | Beginning Account | | Ending Account | | | | April 1, 2019 - |
| | | Value | | Value | | | | September 30, |
| | | April 1, 2019 | | September 30, 2019 | | Expense Ratio(a) | | 2019(b) |
| ICON Energy Fund | | | | | | | | | | | | | | | | |
| Class S | | | | | | | | | | | | | | | | |
| Actual | | $ | 1,000.00 | | | $ | 888.10 | | | | 1.50 | % | | $ | 7.10 | |
| Hypothetical (5% return before expenses) | | $ | 1,000.00 | | | $ | 1,017.55 | | | | 1.50 | % | | $ | 7.59 | |
| Class C | | | | | | | | | | | | | | | | |
| Actual | | $ | 1,000.00 | | | $ | 884.10 | | | | 2.50 | % | | $ | 11.81 | |
| Hypothetical (5% return before expenses) | | $ | 1,000.00 | | | $ | 1,012.53 | | | | 2.50 | % | | $ | 12.61 | |
| Class A | | | | | | | | | | | | | | | | |
| Actual | | $ | 1,000.00 | | | $ | 887.10 | | | | 1.75 | % | | $ | 8.28 | |
| Hypothetical (5% return before expenses) | | $ | 1,000.00 | | | $ | 1,016.29 | | | | 1.75 | % | | $ | 8.85 | |
| | | | | | | | | | | | | | | | | |
| ICON Financial Fund | | | | | | | | | | | | | | | | |
| Class S | | | | | | | | | | | | | | | | |
| Actual | | $ | 1,000.00 | | | $ | 1,089.20 | | | | 1.50 | % | | $ | 7.86 | |
| Hypothetical (5% return before expenses) | | $ | 1,000.00 | | | $ | 1,017.55 | | | | 1.50 | % | | $ | 7.59 | |
| Class A | | | | | | | | | | | | | | | | |
| Actual | | $ | 1,000.00 | | | $ | 1,088.10 | | | | 1.75 | % | | $ | 9.16 | |
| Hypothetical (5% return before expenses) | | $ | 1,000.00 | | | $ | 1,016.29 | | | | 1.75 | % | | $ | 8.85 | |
| | | | | | | | | | | | | | | | | |
| ICON Healthcare Fund | | | | | | | | | | | | | | | | |
| Class S | | | | | | | | | | | | | | | | |
| Actual | | $ | 1,000.00 | | | $ | 914.00 | | | | 1.52 | % | | $ | 7.29 | |
| Hypothetical (5% return before expenses) | | $ | 1,000.00 | | | $ | 1,017.45 | | | | 1.52 | % | | $ | 7.69 | |
| Class A | | | | | | | | | | | | | | | | |
| Actual | | $ | 1,000.00 | | | $ | 912.60 | | | | 1.75 | % | | $ | 8.39 | |
| Hypothetical (5% return before expenses) | | $ | 1,000.00 | | | $ | 1,016.29 | | | | 1.75 | % | | $ | 8.85 | |
| | | | | | | | | | | | | | | | | |
| ICON Industrials Fund | | | | | | | | | | | | | | | | |
| Class S | | | | | | | | | | | | | | | | |
| Actual | | $ | 1,000.00 | | | $ | 1,080.40 | | | | 1.50 | % | | $ | 7.82 | |
| Hypothetical (5% return before expenses) | | $ | 1,000.00 | | | $ | 1,017.55 | | | | 1.50 | % | | $ | 7.59 | |
| Class A | | | | | | | | | | | | | | | | |
| Actual | | $ | 1,000.00 | | | $ | 1,079.70 | | | | 1.75 | % | | $ | 9.12 | |
| Hypothetical (5% return before expenses) | | $ | 1,000.00 | | | $ | 1,016.29 | | | | 1.75 | % | | $ | 8.85 | |
| | | | | | | | | | | | | | | | | |
| ICON Information Technology Fund | | | | | | | | | | | | | | | | |
| Class S | | | | | | | | | | | | | | | | |
| Actual | | $ | 1,000.00 | | | $ | 1,071.40 | | | | 1.47 | % | | $ | 7.63 | |
| Hypothetical (5% return before expenses) | | $ | 1,000.00 | | | $ | 1,017.70 | | | | 1.47 | % | | $ | 7.44 | |
| Class A | | | | | | | | | | | | | | | | |
| Actual | | $ | 1,000.00 | | | $ | 1,069.70 | | | | 1.75 | % | | $ | 9.08 | |
| Hypothetical (5% return before expenses) | | $ | 1,000.00 | | | $ | 1,016.29 | | | | 1.75 | % | | $ | 8.85 | |
| |
| Annual Report | September 30, 2019 | | 79 |
| ICON Sector Funds | Disclosure of Fund Expenses |
September 30, 2019 (Unaudited)
| | | | | | | | | |
| | | | | | | | | Expenses Paid |
| | | | | | | | | During period |
| | | Beginning Account | | Ending Account | | | | April 1, 2019 - |
| | | Value | | Value | | | | September 30, |
| | | April 1, 2019 | | September 30, 2019 | | Expense Ratio(a) | | 2019(b) |
| ICON Natural Resources Fund | | | | | | | | | | | | | | | | |
| Class S | | | | | | | | | | | | | | | | |
| Actual | | $ | 1,000.00 | | | $ | 1,036.50 | | | | 1.50 | % | | $ | 7.66 | |
| Hypothetical (5% return before expenses) | | $ | 1,000.00 | | | $ | 1,017.55 | | | | 1.50 | % | | $ | 7.59 | |
| Class C | | | | | | | | | | | | | | | | |
| Actual | | $ | 1,000.00 | | | $ | 1,031.50 | | | | 2.50 | % | | $ | 12.73 | |
| Hypothetical (5% return before expenses) | | $ | 1,000.00 | | | $ | 1,012.53 | | | | 2.50 | % | | $ | 12.61 | |
| Class A | | | | | | | | | | | | | | | | |
| Actual | | $ | 1,000.00 | | | $ | 1,035.20 | | | | 1.75 | % | | $ | 8.93 | |
| Hypothetical (5% return before expenses) | | $ | 1,000.00 | | | $ | 1,016.29 | | | | 1.75 | % | | $ | 8.85 | |
| | | | | | | | | | | | | | | | | |
| ICON Utilities Fund | | | | | | | | | | | | | | | | |
| Class S | | | | | | | | | | | | | | | | |
| Actual | | $ | 1,000.00 | | | $ | 1,081.80 | | | | 1.22 | % | | $ | 6.37 | |
| Hypothetical (5% return before expenses) | | $ | 1,000.00 | | | $ | 1,018.95 | | | | 1.22 | % | | $ | 6.17 | |
| Class A | | | | | | | | | | | | | | | | |
| Actual | | $ | 1,000.00 | | | $ | 1,080.90 | | | | 1.47 | % | | $ | 7.67 | |
| Hypothetical (5% return before expenses) | | $ | 1,000.00 | | | $ | 1,017.70 | | | | 1.47 | % | | $ | 7.44 | |
| (a) | The Fund’s expense ratios have been annualized based on the Fund’s most recent fiscal half-year expenses. |
| (b) | Expenses are equal to the Fund’s annualized expense ratio multiplied by the average account value over the period, multiplied by the number of days in the most recent fiscal half-year 183/365 (to reflect the half-year period). |
Total returns exclude applicable sales charges. If sales charges were included (maximum 5.75%), returns would be lower.
| ICON Sector Funds | Board of Trustees and Fund Officers |
September 30, 2019 (Unaudited)
The ICON Funds Board of Trustees (the “Board”) consists of four Trustees who oversee the 17 ICON Funds (the “Funds”). The Board is responsible for general oversight of the Funds’ business and for assuring that the Funds are managed in the best interest of the Funds’ shareholders. The Trustees, and their ages, and principal occupations are set forth below. The address of the Trustees is 5299 DTC Blvd., Suite 1200, Greenwood Village, CO 80111. Trustees have no official term of office and generally serve until they resign or are not re-elected.
Interested Trustee
Craig T. Callahan,68. Chairman of the Board. Dr. Callahan has been a Trustee of the Funds since their inception. Dr. Callahan also serves as President (2014 to present and 1998 to 2013) and Chairman of the Investment Committee (2005 to present) and served as the Chief Investment Officer (1991 to 2004) of ICON Advisers, Inc. Dr. Callahan is also Executive Vice President (2005 to present); Director (1991 to present); and was previously President (1998 to 2005) and Chief Compliance Officer (2005) of ICON Distributors, Inc. Dr. Callahan also serves as the President (1998 to present) and Chairman of the Board of Directors (1994 to present) of IM&R, the parent company of ICON Advisers, Inc. and ICON Distributors, Inc.
Independent Trustees
Glen F. Bergert, 69. Mr. Bergert has been a Trustee of the Funds since 1999. Mr. Bergert is President of Venture Capital Management LLC (1997 to present), General Partner of SOGNO Partners LP, a venture capital company (2001 to 2015), General Partner of Bergert Properties, LLP, a real estate holding company (1997 to present), General Partner of Pyramid Real Estate Partnership, a real estate development company (1998 to present), General Partner of Chamois Partners, LP, a venture capital company (2004 to present), and was previously a General Partner with KPMG Peat Marwick, LLP (1979 to 1997). Mr. Bergert is also a Director of Delta Dental of California (2013 to present and 2006 to 2012), Delta Dental of Pennsylvania (2010 to present and 1998 to 2009), Delta Reinsurance Corporation (2015 to present; 2011 to 2014 and 2000 to 2009) and Dentegra Group, Inc. (2017 to present; 2010 to 2014).
John C. Pomeroy, Jr., 72. Mr. Pomeroy has been a Trustee of the Funds since 2002. Mr. Pomeroy was Chief Investment Officer and Director of Investments, Pennsylvania State University (2001 to 2018) and was Portfolio Manager and Product Manager, Trinity Investment Management Corporation (1989 to 2001).
R. Michael Sentel, 71. Mr. Sentel has been a Trustee of the Funds since their inception. Mr. Sentel was a Senior Attorney with the U.S. Department of Education (1996 to 2018) and was engaged in private practice of securities and corporate law (1981 to 2017). Mr. Sentel began his legal career with the U.S. Securities and Exchange Commission’s Division of Enforcement and served as a Branch Chief (1980 to 1981). Later he served as the Section Chief for the Professional Liability Section of the Federal Deposit Insurance Corp. with responsibility for the Rocky Mountain Region (1991 to 1994).
Mark Manassee, 54. Mr. Manassee has been a Trustee of the Funds since 2017. Mr. Manassee is a Senior Advisor to McKinsey’s Wealth and Asset Management Practice. Mr. Manassee was Principal and President of Market Metrics, LLC, a subsidiary of FactSet Research Systems, Inc. (1998 to 2016). Mr. Manassee was also Chairman of the Board of FundRock Partners, Ltd (UK) (2017 to 2019) and a Director of Matrix-Data, Ltd (UK) (2013 to 2016) and Rhetorik, Ltd (UK) (2013 to 2016).
The Officers of the Funds are:
Craig T. Callahan,68. Chairman of the Board. Dr. Callahan has been a Trustee of the Funds since their inception. Dr. Callahan also serves as President (2014 to present and 1998 to 2013) and Chairman of the Investment Committee (2005 to present) and served as the Chief Investment Officer (1991 to 2004) of ICON Advisers, Inc. Dr. Callahan is also Executive Vice President (2005 to present); Director (1991 to present); and was previously President (1998 to 2005) and Chief Compliance Officer (2005) of ICON Distributors, Inc. Dr. Callahan also serves as the President (1998 to present) and Chairman of the Board of Directors (1994 to present) of IM&R, the parent company of ICON Advisers, Inc. and ICON Distributors, Inc.
Brian D. Harding, 40. Mr. Harding serves as Principal Financial Officer and Treasurer of the Funds (2017 to present). Mr. Harding is also Chief Financial Officer of ICON Advisers, Inc. (2013 to present) and Director of IM&R (2013 to present). Previously he was Chief Compliance Officer and Anti-Money Laundering Officer of the Funds (2008 to 2013), Chief Compliance Officer of ICON Advisers, Inc. (2011 to 2013), and Manager at PricewaterhouseCoopers LLP (2001 to 2008).
Jack M. Quillin, 47. Mr. Quillin serves as Chief Compliance Officer and Anti-Money Laundering Officer of the Funds (2019 to present). Mr. Quillin is also Chief Compliance Officer of ICON Advisers, Inc. (2019 to present). Previously he served as Assistant Treasurer of the Funds (2017 to 2019) and a Compliance and Fund Accounting Associate of ICON Advisers, Inc. (2016 to 2019). Previously, he was a compliance analyst at Marsico Capital Management, LLC (2011 to 2015), an assistant vice president in the municipal derivatives finance department at Merrill Lynch (2004 to 2008), and a senior accountant in the Regulatory Reporting group at Wells Fargo & Company (1998 to 2003).
| |
| Annual Report | September 30, 2019 | | 81 |
| ICON Sector Funds | Board of Trustees and Fund Officers |
September 30, 2019 (Unaudited)
Christopher R. Ambruso, 39. Mr. Ambruso serves as Secretary of the Funds (2019 to present). Mr. Ambruso is also General Counsel of ICON Advisers, Inc. (2019 to present), Chief Compliance Officer of ICON Distributors, Inc. (2019 to present), and Director of IM&R (2019 to present). Previously he served as Chief Compliance Officer and Anti-Money Laundering Officer (2017 to 2019) and Assistant Secretary (2016 to 2017 and 2008 to 2012) of the Funds and Chief Compliance Officer (2017 to 2019), Associate Counsel (2013 to 2017), Associate Attorney (2008 to 2013), and Staff Attorney (2007 to 2008) of ICON Advisers, Inc.
Lesley Caviness, 53. Ms. Caviness serves as Assistant Treasurer of the Funds (2019 to present). Ms. Caviness is also Compliance and Fund Accounting Associate of ICON Advisers, Inc. (2017 to present). Previously she served as Mutual Fund Accounting Associate of ICON Advisers, Inc. (2013 to 2017) and Assistant Treasurer of the Funds (2014 to 2017). Prior to Joining ICON Ms. Caviness worked for Oppenheimer Funds in Fund Accounting and Shareholder Accounting as well as at PricewaterhouseCoopers LLP as an Audit Associate and Audit Senior Associate.
| ICON Sector Funds | Additional Information |
September 30, 2019 (Unaudited)
Renewal of Investment Advisory Agreement
On September 19, 2019, the Board of Trustees, including all of the Trustees that are not “interested persons” of the Trust (the “Independent Trustees”), approved continuation of the Advisory Agreements (as defined below) with the Adviser for each Fund for an additional one-year term commencing October 1, 2019.
The Trustees considered the renewal of the investment advisory agreements between the Trust and the Adviser — the Trust’s Investment Advisory Agreement dated October 9, 1996, as amended (related to the Sector Funds, the International Funds and the ICON Fund) and the Trust’s Investment Advisory Agreement dated July 9, 2002 and effective October 1, 2002, as amended (related to the U.S. Diversified Funds — Flexible Bond, Risk-Managed Balanced, Equity Income, Opportunities and Long/Short Funds) (collectively, the “Advisory Agreements”). The Trustees agreed that consideration of the Advisory Agreements should also include consideration of other agreements between the Adviser and the Trust that impact provisions of the Advisory Agreements, including the expense limitation agreements.
The Trustees were provided with and reviewed data with respect to the Adviser, its personnel, and the services provided and to be provided to each Fund by the Adviser under the Trust’s Advisory Agreements, Administrative Services Agreement and Expense Limitation Agreement and the Distribution Agreement with ICON Distributors, Inc. (“IDI”). The data included information concerning advisory, distribution and administrative services provided to the Funds by ICON and its related companies; information concerning other businesses of those companies; and comparative data obtained from Broadridge related to Fund performance and Fund expenses (the “Broadridge Report”).
The Independent Trustees met separately with Broadridge on July 31, 2019 to discuss the Broadridge Report and the information contained within the Broadridge Report.
Also included in the 15(c) discussion was a briefing on factors affecting the ICON investment model; expenses and expense ratios of each Fund and other ICON managed products; relative performance of each Fund; status of expense reimbursements to the Funds by the Adviser; sales and marketing initiatives; specific business factors affecting IDI; the work load on ICON as adviser and administrator to the Funds; current profitability and financial position of ICON; staffing levels and staff morale.
The Independent Trustees were represented by independent legal counsel in the entire 15(c) process. Several times, in August and September, after participating in the meeting with Broadridge and management, the Independent Trustees met separately as a group in private sessions with their independent legal counsel to review and discuss a wide variety of qualitative and quantitative information, including information they had received throughout the year as part of their regular oversight of the Funds. Based on these discussions, independent legal counsel and/or the Lead Independent Trustee also contacted management to request additional information. The Board received materials from independent legal counsel discussing the legal standards applicable to their consideration of the ICON-Trust agreements.
In considering the nature, extent and quality of the services provided by the Adviser,the Board reviewed information relating to ICON’s operations and personnel. Among other things, the Adviser provided biographical information on its professional staff and descriptions of its current organizational and management structure. In the course of their deliberations the Board evaluated among other things, information relating to the investment philosophy, strategies and techniques used in managing each Fund, the qualifications and experience of ICON’s investment personnel, ICON’s compliance programs, ICON’s brokerage practices, including the extent to which the Adviser obtains research through “soft dollar” arrangements with the Funds’ brokerage, compliance reports on the foregoing, and the financial and non-financial resources available to provide services required under the Advisory Agreement.
Management and the Trustees discussed the Broadridge Report and Management personnel showed performance for each Fund and discussed the factors affecting performance. During a lengthy and spirited discussion, the Trustees expressed their concerns regarding both the ICON Funds’ performance relative to similarly situated funds and the overall rate of redemptions relative to sales.
With regard to the ICON Funds’ performance, the Chief Investment Officer (“CIO”) stated that the current market continues to favor growth rather than value-based systems or styles. Further, the current market is challenging for the ICON system due to generally increased volatility and quick, inconsistent market leadership themes. The Funds’ performance during the market selloff in the fourth quarter of 2018 was generally worse than the Funds’ Benchmark returns. Despite the current market, the CIO reiterated his faith in the ICON system, noting its past successes.
The Trustees discussed the reductions in staff in May 2019 as well as the decrease in assets under management of the Adviser in August 2019 due to a large account which ICON was the sub-advisor on moving to a different sub-advisor. From a sales perspective, Management has been working to continue to narrow the focus of ICON’s sales team in order to get the most out of the Regional Vice Presidents in the field and the Internal Sales Associates in the office. Management noted that it hired a new National Sales Director in January 2019. Similar to the past several years, Management has been challenged to penetrate and retain sales in the full-service wirehouse firms. Wirehouses, Management noted, are intent on capturing assets while moving from a transaction-based compensation model (e.g. paying per trade) to a fee-based compensation model (e.g.
| Annual Report | September 30, 2019 | 83 |
| ICON Sector Funds | Additional Information |
September 30, 2019 (Unaudited)
paying a fixed percentage for asset management). Wirehouses are culling their recommended lists and/or looking to pare down the number of fund families with whom they do business. Management has seen most of the ICON Funds culled from wirehouses, in large part because of the size of the Funds. Management has begun focusing on alternatives to the wirehouse space.
In connection with reviewing data bearing upon the nature, quality, and extent of services furnished by ICON to each Fund, the Board assessed data concerning ICON’s staffing, systems and facilities. The Board also assessed ICON’s non-Trust business to see if there are any initiatives that would dilute service to the Trust. The Board concluded:
| A. | That the breadth and the quality of investment advisory and other services being provided to each Fund are satisfactory; |
| B. | That ICON has made significant expenditures in the past year and in prior years by way of expense reimbursements and the Adviser has the systems and trained personnel necessary for it to be able to continue to provide quality service to the Funds’ shareholders; |
| C. | That the Board is satisfied with the research, portfolio management, and trading services, among others, being provided by ICON to the Trust, and has determined that ICON is charging fair and reasonable fees. |
| D. | The risks assumed by ICON in providing investment advisory services to each Fund including the capital commitments which have been made in the past and which continue to be made by ICON to ensure the continuation of the highest quality of service to the Trust is made with the recognition that the Trust’s advisory relationship with ICON can be terminated at any time and must be renewed on an annual basis. |
In considering the reasonableness of the fees paid to the Adviser for managing each Fund,the Board reviewed, among other things, data concerning other funds from the Broadridge Report, financial statements of the Adviser and an analysis of the profitability and financial position (including cash available over the next 12 months) of the Adviser, and its affiliates, and their relationship with each Fund over various time periods. Such analysis identified all revenues and other benefits received by the Adviser and its affiliates from managing each Fund, the costs associated with providing such services and the resulting profitability to the Adviser and its affiliates and a comparison of similar data from reports filed by publicly traded firms.
The Board assessed actual (net) fees for advisory services and Fund expense ratios under the contractual relationship (the Advisory agreements, the Administration Agreement and the Expense Limitation Agreements) with the Adviser as opposed to the fees specified in the applicable Advisory Agreement and expense ratios without application of the expense limitations and the low cost of the Administration Agreement and concluded that the focus should be on actual expense ratios after application of the Expense Limitation Agreements.
The Board considered the current and anticipated asset levels of each Fund and the contractual commitments of the Adviser to waive fees and pay expenses of the Funds from time to time to limit the total expenses of the Funds. The Board also considered the Adviser’s contractual commitment regarding administration and the fact it would continue to lose money on administration. In this regard the Board discussed asset levels in each Fund covered by the Advisory Agreements. ICON’s ability to provide the services called for under the Advisory Agreements was assessed in light of current and projected asset levels. Fund expenses and expense ratios were also assessed in light of current and projected asset levels. The Board concluded that the Adviser has the resources necessary to provide the services called for under the Advisory Agreements; that profitability to the Adviser and its affiliates from their relationship with the Funds, and services provided to the Funds, is not excessive; and that the Adviser is not realizing benefits from economies of scale that would warrant adjustments to the fees for any Fund at this time. The Board of Trustees concluded that, in light of the nature, extent and quality of the services provided by the Adviser and the levels of profitability associated with providing these services, the fees charged by the Adviser under the Advisory Agreements to each Fund are reasonable.
In connection with assessing data bearing on the fairness of fee arrangements,the Board considered the Broadridge Report, and information that they had received throughout the year as part of their regular oversight of the Funds, including Morningstar and Lipper data on the peer groupings. Among other information discussed, it was noted that:
| A. | Upon review of the advisory fee structures of each Fund in comparison with other similar funds of similar size, the level of investment advisory fees paid by each Fund is competitive; |
| B. | The total expense ratio and contractual management fees at common asset levels of each Fund are generally competitive with their expense groups; |
| C. | ICON has contractually agreed to impose expense limitations on all Funds at a cost to ICON; |
| D. | That the advisory and other fees payable by the Funds to ICON are essentially fees which would be similar to those which would have resulted solely from “arm’s-length” bargaining; |
| ICON Sector Funds | Additional Information |
September 30, 2019 (Unaudited)
| E. | That the fees paid to ICON for managing other institutional accounts (such as individuals or sub-advised portfolios) are lower than the fees paid by similarly managed ICON funds, but the reason why they are lower is reasonably related to the cost for ICON to manage such accounts; and |
| F. | The extent to which economies of scale could be realized as a Fund grows in assets and whether the Fund’s fees reflect these economies of scale for the benefit of Fund shareholders. |
| G. | The costs borne by ICON in providing advisory services to each Fund and the profitability and financial position of ICON in light of the estimated profitability analysis which had been provided by ICON, including cash available for the next 12 months to meet the Advisor’s commitments to the Fund with respect to the expense reimbursements and other operating expenses required to carry out its duties under the Agreement. |
The Board also considered the fees charged by the Adviser to other advisory clients as outlined in its Registration Application on Form ADV in connection with assessing data bearing on the fairness of fee arrangements. The Trustees and Management recognized that the Adviser is continuously evaluating Fund expense ratios and expense limits to assess the competitiveness of the Funds and whether any downward adjustments affect Fund sales.
The Board concluded that the Adviser is providing the Funds with professional management at a price that would have been arrived at in an arm’s length negotiation.
In connection with assessing the direct and indirect benefits to ICON from serving as the Funds’ adviser, the Board discussed services provided under the Distribution Agreement and the Administrative Services Agreement which are in addition to services under the Advisory Agreements. It was noted that:
| A. | ICON benefits from serving directly or through affiliates as the principal underwriter and administrative agent for the Funds; the services provided by ICON and its affiliates to the Funds are reasonably satisfactory, and whether the profits derived from providing the services are competitive and reasonable; |
| B. | ICON receives research assistance from the use of soft dollars generated from Fund portfolio transactions; the Trustees noted that such research is necessary to run the Funds and assists ICON in providing investment advisory services to the Funds as well as other accounts to which it provides advisory services. |
Based on all these considerations and other data as discussed above,the Board, including all of the Independent Trustees, concluded that: 1) the continuation of the Advisory Agreements was in the best interests of each Fund and its shareholders, 2) the services to be performed under the Advisory Agreements were required for the operation of the Funds, 3) the advisory services were satisfactory to the Funds in the past, and 4) the fees for the advisory services and other benefits from the relationship with the Trust received by ICON, and its affiliates, were within the range of what would have been negotiated at arm’s length in light of all the circumstances. The Board noted that its conclusions were based on the assumption that no significant transactions involving the Fund would take place during the year, although any transaction costs in connection with exploring possible transactions might be incurred in addition to normal operating costs.
| Annual Report | September 30, 2019 | 85 |
| ICON Sector Funds | Additional Information |
September 30, 2019 (Unaudited)
Supplemental Tax Info
Pursuant to Section 852(b)(3) of the Internal Revenue Code the following Funds designate the amounts listed below as long-term capital gain dividends:
| ICON Consumer Discretionary Fund | $0 |
| ICON Consumer Staples Fund | $0 |
| ICON Energy Fund | $0 |
| ICON Financial Fund | $0 |
| ICON Healthcare Fund | $3,376,583 |
| ICON Industrials Fund | $0 |
| ICON Information Technology Fund | $2,164,142 |
| ICON Natural Resources Fund | $5,752,876 |
| ICON Utilities Fund | $164,374 |
The following Funds designate the percentages listed below of the income dividends distributed in 2018 as qualified dividend income (QDI) as defined in Section 1(h)(11) of the Internal Revenue Code:
| ICON Consumer Discretionary Fund | 0.00% |
| ICON Consumer Staples Fund | 100.00% |
| ICON Energy Fund | 100.00% |
| ICON Financial Fund | 100.00% |
| ICON Healthcare Fund | 36.05% |
| ICON Industrials Fund | 0.00% |
| ICON Information Technology Fund | 10.43% |
| ICON Natural Resources Fund | 50.00% |
| ICON Utilities Fund | 81.90% |
The following Funds designate the percentages listed below of the income dividends distributed in 2018 as qualifying for the corporate dividends received deduction (DRD) as defined in Section 854(b)(2) of the Internal Revenue Code:
| ICON Consumer Discretionary Fund | 0.00% |
| ICON Consumer Staples Fund | 100.00% |
| ICON Energy Fund | 100.00% |
| ICON Financial Fund | 100.00% |
| ICON Healthcare Fund | 35.64% |
| ICON Industrials Fund | 0.00% |
| ICON Information Technology Fund | 10.26% |
| ICON Natural Resources Fund | 5.00% |
| ICON Utilities Fund | 82.60% |
Portfolio Holdings
Information related to the 10 largest portfolio holdings of each Fund is made available at www.iconfunds.com within approximately 10 business days after month-end. Additionally, a complete list of each Fund’s holdings is made available approximately 30 days after month-end. Each ICON Fund also files a complete schedule of portfolio holdings for the first and third quarters of its fiscal year with the Securities and Exchange Commission (the “Commission”) on Form N-Q. The ICON Funds’ Forms N-Q are available at www.sec.gov or may be reviewed and copied at the Commission’s Public Reference Room in Washington, DC. Information about the Public Reference Room may be obtained by calling 1-800-SEC-0330.
Proxy Voting
A summarized description of the policies and procedures the ICON Funds use to vote proxies is available free of charge at www.iconfunds.com or by calling 1-800-764-0442.
Information about how the ICON Funds voted proxies related to each Fund’s portfolio securities during the 12-month period ended June 30 is available free of charge at www.iconfunds.com or on the Commission’s website at www.sec.gov.
For More Information
This report is for the general information of the Funds’ shareholders and is not authorized for distribution to prospective investors unless preceded or accompanied by a current prospectus. You may obtain a copy of the prospectus, which contains information about the investment objectives, risks, charges, expenses, and share classes of each ICON Fund, by visiting www.iconfunds.com or by calling 1-800-764-0442. Please read the prospectus carefully before investing.
ICON Distributors, Inc., Distributor.
| ICON Sector Funds | Privacy Policy |
September 30, 2019 (Unaudited)
| | | WHAT DOES ICON DO WITH YOUR PERSONAL INFORMATION? |
| Why? | | Financial companies choose how they share your personal information. Federal law gives consumers the right to limit some but not all sharing. Federal law also requires us to tell you how we collect, share, and protect your personal information. Please read this notice carefully to understand what we do. |
| What? | | The types of personal information we collect and share depend on the product or service you have with us. This information can include: |
| | | |
| | | ● Social Security number and account balances |
| | | ● income and transaction history |
| | | ● checking account information and wire transfer instructions |
| | | |
| | | When you areno longer our customer, we continue to share your information as described in this notice. |
| How? | | All financial companies need to share customers’ personal information to run their everyday business. In the section below, we list the reasons financial companies can share their customers’ personal information; the reasons ICON chooses to share; and whether you can limit this sharing. |
| Reasons we can share your personal information | | | | Does ICON share? | | Can you limit this sharing? |
| For our everyday business purposes — such as to process your transactions, maintain your account(s), respond to court orders and legal investigations, or report to credit bureaus | | | | Yes | | No |
| For our marketing purposes — to offer our products and services to you | | | | No | | We don’t share |
| For joint marketing with other financial companies | | | | No | | We don’t share |
| For our affiliates’ everyday business purposes — information about your transactions and experiences | | | | No | | We don’t share |
| For our affiliates’ everyday business purposes — information about your creditworthiness | | | | No | | We don’t share |
| For nonaffiliates to market to you | | | | No | | We don’t share |
| Questions? | | Call 1-800-764-0442 for the ICON Funds and 1-800-828-4881 for ICON Advisers, Inc. and ICON Distributors, Inc. |
| Annual Report | September 30, 2019 | 87 |
| ICON Sector Funds | Privacy Policy |
September 30, 2019 (Unaudited)
| Who We Are | | |
| Who is providing this notice? | | ICON Funds, ICON Advisers, Inc., and ICON Distributors, Inc. (collectively “ICON”) |
| What We Do | | |
| How does ICON protect my personal information? | | To protect your personal information from unauthorized access and use, we use security measures that comply with federal law. These measures include computer safeguards and secured files and buildings. |
| | | |
| | | Contracts with our service providers require them to restrict access to your non-public personal information, and to maintain physical, electronic and procedural safeguards against unintended disclosure. |
| How does ICON collect my personal | | We collect your personal information, for example, when you |
| information? | | |
| | | ● open an account or enter into an investment advisory contract |
| | | ● provide account information or give us your contact information |
| | | ● make a wire transfer |
| | | |
| | | We also collect your personal information from others, such as credit bureaus, affiliates, or other companies. |
| Why can’t I limit all sharing? | | Federal law gives you the right to limit only |
| | | |
| | | ● sharing for affiliates’ everyday business purposes — information about your creditworthiness |
| | | ● affiliates from using your information to market to you |
| | | ● sharing for nonaffiliates to market to you |
| | | |
| | | State laws and individual companies may give you additional rights to limit sharing. |
| Definitions | | |
| Affiliates | | Companies related by common ownership or control. They can be financial and nonfinancial companies. |
| | | |
| | | ● Our affiliates include financial companies such as ICON Funds, ICON Advisers, Inc., and ICON Distributors, Inc. |
| Nonaffiliates | | Companies not related by common ownership or control. They can be financial and nonfinancial companies. |
| | | |
| | | ● Nonaffiliates we share with can include financial companies such as custodians, transfer agents, registered representatives, financial advisers and nonfinancial companies such as fulfillment, proxy voting, and class action service providers |
| Joint marketing | | A formal agreement between nonaffiliated financial companies that together market financial products or services to you. |
| | | |
| | | ● ICON doesn’t jointly market |

For more information about the ICON Funds, contact us:
| | |
By Telephone | | 1-800-764-0442 |
By E-Mail | | info@iconadvisers.com |
By Mail | | ICON Funds | P.O. Box 1920 | Denver, CO 80201 |
In Person | | ICON Funds | 5299 DTC Boulevard, Suite 1200 |
| | Greenwood Village, CO 80111 |
On the Internet | | www.iconfunds.com |
(a) The registrant has adopted a code of ethics that applies to the registrant’s principal executive officer, principal financial officer, principal accounting officer or controller, or persons performing similar functions. This code of ethics is included as an Exhibit.
(b) Not used.
(c) There were no amendments, during the period covered by this report, to a provision of the code of ethics that applies to the Registrant’s principal executive officer, principal financial officer, principal accounting officer or controller, or persons performing similar functions, regardless of whether these individuals are employed by the Registrant or a third party, and that relates to any element of the code of ethics description.
(d) The registrant has not granted any waivers, including an implicit waiver, from a provision of the code of ethics that applies to the Registrant’s principal executive officer, principal financial officer, principal accounting officer or controller, or persons performing similar functions, regardless of whether these individuals are employed by the Registrant or a third party, that relates to one or more of the items set forth in paragraph (b) of this item’s instructions.
(e) Not applicable.
(f) See the attached Exhibit.
Item 3. | Audit Committee Financial Expert. |
3(a)(1) The Registrant’s Board of Trustees has determined that the registrant has at least one audit committee financial expert serving on its audit committee.
3(a)(2) The audit committee financial experts are Glen F. Bergert and R. Michael Sentel, who are “independent” for purposes of this Item 3 of Form N-CSR.
3(a)(3) Not applicable.
Item 4. | Principal Accountant Fees and Services. |
In each of the fiscal years ended September 30, 2019 and September 30, 2018, the aggregate Audit Fees billed (or to be billed) by Cohen & Company, LTD. (“Cohen”) for professional services rendered for the audits of the financial statements, or services that are normally provided in connection with statutory and regulatory filings or engagements as well as reimbursable expenses are listed below. All of the below fees were paid by the Registrant.
| | | | | | |
| 2019 | | | 2018 | |
| $ | 220,250 | | | $ | 216,000 | |
In each of the fiscal years ended September 30, 2019 and September 30, 2018, the aggregate Audit-Related Fees billed (or to be billed) by Cohen for services rendered for assurance and related services to each fund that are reasonably related to the performance of the audit or review of the fund’s financial statements, but not reported as Audit Fees, are shown in the table below.
In each of the fiscal years ended September 30, 2019 and September 30, 2018 the aggregate Tax Fees billed (or to be billed) by Cohen for professional services rendered for tax return preparation, tax compliance, tax advice and tax planning are shown in the table below. All of the below fees were paid by the Registrant.
| | | | | | |
| 2019 | | | 2018 | |
| $ | 82,700 | | | $ | 86,000 | |
In each of the fiscal years ended September 30, 2019 and September 30, 2018 the aggregate Other Fees billed (or to be billed) by Cohen for all other non-audit services rendered are shown in the table below. All of the below fees were paid by the Registrant.
(e)(1) The audit committee of the Registrant’s Board of Trustees is required to pre-approve all services to be provided by the independent accountants to the Registrant or the Registrant’s investment adviser and to any entity controlling, controlled by or under common control with the investment adviser that provides on-going services to the Registrant to determine whether the services performed by the independent accountants impair their independence from the Registrant. The audit committee has delegated authority to the Chairman of the audit committee, subject to review and ratification by the full audit committee.
(e)(2) 100% of the fees were approved by the Registrant’s audit committee pursuant to paragraph (c)(7)(i)(C) if Rule 2-01 of Regulation S-X.
(f) For the fiscal year ended September 30, 2019, the percentage of hours spent on the audit of the Registrant’s financial statements that were attributed to work performed by persons who are not full-time, permanent employees of Cohen was less than 50%.
(g) See Item 4(d) above.
(h) There were no non-audit services provided by Cohen in the fiscal year ending September 30, 2019 or September 30, 2018 to the investment adviser or to any entity controlling, controlled by, or under common control with the investment adviser that provides on-going services to the Registrant.
| Item 5. | Audit Committee of Listed Registrants. |
Not applicable.
(a) The schedule of investments in securities of unaffiliated issuers is included in Item 1.
(b) Not applicable.
Item 7. | Disclosure of Proxy Voting Policies and Procedures for Closed-End Management Investment Companies. |
Not applicable.
Item 8. | Portfolio Managers of Closed-End Management Investment Companies. |
Not applicable.
Item 9. | Purchases of Equity Securities by Closed-End Management Investment Company and Affiliated Purchasers. |
Not applicable.
Item 10. | Submission of Matters to a Vote of Security Holders. |
Not applicable.
Item 11. | Controls and Procedures. |
(a) The registrant’s principal executive officer and principal financial officer have concluded, based on their evaluation of the Registrant’s disclosure controls and procedures as conducted within 90 days of the filing date of this report, that these disclosure controls and procedures are adequately designed and are operating effectively to ensure that information required to be disclosed by the registrant on Form N-CSR is recorded, processed, summarized and reported within the time periods specified in the Securities and Exchange Commission’s rules and forms.
(b) There were no changes in the registrant’s internal control over financial reporting that occurred during the second fiscal quarter of the period covered by this report that have materially affected or are reasonably likely to materially affect, the registrant’s internal control over financial reporting.
Item 12. | Disclosure of Securities Lending Activities for Closed-End Management Investment Companies. |
Not applicable.
(a)(1) The code of ethics is attached.
(a)(2) Certifications pursuant to Rule 30a-2(a) are attached.
(a)(3) Not applicable.
(a)(4) Not applicable.
(b) Certifications pursuant to Rule 30a-2(b) are furnished herewith.
SIGNATURES
Pursuant to the requirements of the Securities Exchange Act of 1934 and the Investment Company Act of 1940, the registrant has duly caused this report to be signed on its behalf by the undersigned, thereunto duly authorized.
| | |
| By (Signature and Title)* | | /s/ Craig T. Callahan |
| | Craig T. Callahan, President (Principal Executive Officer) |
Pursuant to the requirements of the Securities Exchange Act of 1934 and the Investment Company Act of 1940, this report has been signed below by the following persons on behalf of the registrant and in the capacities and on the dates indicated.
| | |
| By (Signature and Title)* | | /s/ Craig T. Callahan |
| | Craig T. Callahan, President (Principal Executive Officer) |
| | |
| By (Signature and Title)* | | /s/ Brian D. Harding |
| | Brian D. Harding, Treasurer (Principal Financial Officer) |
| * | Print the name and title of each signing officer under his or her signature. |