UNITED STATES
SECURITIES AND EXCHANGE COMMISSION
Washington, D.C. 20549
FORMN-CSR
CERTIFIED SHAREHOLDER REPORT OF REGISTERED
MANAGEMENT INVESTMENT COMPANIES
Investment Company Act file number:811-08189
J.P. Morgan Fleming Mutual Fund Group, Inc.
(Exact name of registrant as specified in charter)
270 Park Avenue
New York, NY 10017
(Address of principal executive offices) (Zip code)
Noah D. Greenhill, Esq.
270 Park Avenue
New York, NY 10017
(Name and Address of Agent for Service)
Registrant’s telephone number, including area code: (800)480-4111
Date of fiscal year end: June 30
Date of reporting period: July 1, 2018 through December 31, 2018
FormN-CSR is to be used by management investment companies to file reports with the Commission not later than 10 days after the transmission to stockholders of any report that is required to be transmitted to stockholders under Rule30e-1 under the Investment Company Act of 1940 (17 CFR270.30e-1). The Commission may use the information provided on FormN-CSR in its regulatory, disclosure review, inspection, and policymaking roles.
A registrant is required to disclose the information specified by FormN-CSR, and the Commission will make this information public. A registrant is not required to respond to the collection of information contained in FormN-CSR unless the Form displays a currently valid Office of Management and Budget (“OMB”) control number. Please direct comments concerning the accuracy of the information collection burden estimate and any suggestions for reducing the burden to Secretary, Securities and Exchange Commission, 450 Fifth Street, NW, Washington, DC 20549-0609. The OMB has reviewed this collection of information under the clearance requirements of 44 U.S.C. Section 3507.
ITEM 1. REPORTS TO STOCKHOLDERS.
The following is a copy of the report transmitted to shareholders pursuant to Rule30e-1 under the Investment Company Act of 1940 (17 CFR270.30e-1).
Semi-Annual Report
J.P. Morgan MidCap/Multi-Cap Funds
December 31, 2018 (Unaudited)
JPMorgan Growth Advantage Fund
JPMorgan Mid Cap Equity Fund
JPMorgan Mid Cap Growth Fund
JPMorgan Mid Cap Value Fund
JPMorgan Value Advantage Fund
Beginning on January 1, 2021, as permitted by regulations adopted by the Securities and Exchange Commission, paper copies of the Funds’ annual and semi-annual shareholder reports will no longer be sent by mail, unless you specifically request paper copies of the reports. Instead, the reports will be made available on the Funds’ websitewww.jpmorganfunds.comand you will be notified by mail each time a report is posted and provided with a website to access the report. If you already elected to receive shareholder reports electronically, you will not be affected by this change and you need not take any action.
You may elect to receive shareholder reports and other communications from the Funds electronically anytime by contacting your financial intermediary (such as a broker dealer, bank, or retirement plan) or, if you are a direct investor, by going towww.jpmorganfunds.com/edelivery.
You may elect to receive paper copies of all future reports free of charge. Contact your financial intermediary or, if you invest directly with the Funds, email us atfunds.website.support@jpmorganfunds.comor call 1-800-480-4111. Your election to receive paper reports will apply to all funds held within your account(s).

CONTENTS
Investments in a Fund are not deposits or obligations of, or guaranteed or endorsed by, any bank and are not insured or guaranteed by the FDIC, the Federal Reserve Board or any other government agency. You could lose money if you sell when a Fund’s share price is lower than when you invested.
Past performance is no guarantee of future performance. The general market views expressed in this report are opinions based on market and other conditions through the end of the reporting period and are subject to change without notice. These views are not intended to predict the future performance of a Fund or the securities markets. References to specific securities and their issuers are for illustrative purposes only and are not intended to be, and should not be interpreted as, recommendations to purchase or sell such securities. Such views are not meant as investment advice and may not be relied on as an indication of trading intent on behalf of any Fund.
Prospective investors should refer to the Funds’ prospectuses for a discussion of the Funds’ investment objectives, strategies and risks. Call J.P. Morgan Funds Service Center at1-800-480-4111 for a prospectus containing more complete information about a Fund, including management fees and other expenses. Please read it carefully before investing.
CEO’S LETTER
February 14, 2019 (Unaudited)
Dear Shareholder,
While the U.S. economy largely outperformed other leading economies during the second half of 2018, record corporate profits and historically low unemployment were overshadowed in December by a sell-off in equity markets, unsettled global trade tensions and a political impasse that led to the temporary shutdown of large parts of the federal government.
| | |
 | | “Overall, economists generally remained optimistic about the fundamental strength of the U.S. economy at the end of 2018.” — George C.W. Gatch |
The second longest U.S. economic expansion on record extended through the third and fourth quarters of 2018. Gross domestic product advanced 3.4% in the third quarter of 2018, and was on pace to grow by about 3% for the full year 2018. In September, the U.S. jobless rate dipped to 3.7% - its lowest level in nearly 50 years - and stood at 3.9% at the end of the year. In response, the U.S. Federal Reserve raised interest rates in September and again in December.
U.S. aggregate corporate revenues and earnings reached record high levels in the second and third quarters of 2018. Though some profit growth was attributed to the temporary benefits of late-2017 tax cut legislation, the outlook for U.S. corporate earnings remained generally positive at the end of the year.
Equity prices in the U.S. largely rose during the third quarter of 2018. The S&P 500 Index hit record highs in August and remained elevated in September. However, early October saw a sharp sell-off in financial markets and the worst December for
the S&P 500 Index since 1931 erased all gains seen in the prior five months.
By the end of 2018, investors were confronted with several worrying developments. Leading economies, particularly China and the European Union, showed significant signs of slowing in the latter half of the year. While U.S.-China trade tariffs had little clear direct impact on the U.S. economy in 2018, a continuation or acceleration of protectionist policies could begin to hinder growth. Though the federal government shutdown ended subsequent to the end of the reporting period, the solution was a short-term budget agreement that failed to alleviate concerns about the possibility of future shutdowns.
Overall, economists generally remained optimistic about the fundamental strength of the U.S. economy at the end of 2018. While U.S. corporate profits and gross domestic product are expected to grow in the year ahead, the extent to which U.S. financial markets benefit remains to be seen, given the length of the current economic expansion.
We believe investors who maintain a patient approach and a well-diversified portfolio may be best positioned to navigate current market conditions. We look forward to managing your investment needs for years to come. Should you have any questions, please visit www.jpmorganfunds.com or contact the J.P. Morgan Funds Service Center at 1-800-480-4111.
Sincerely yours,

George C.W. Gatch
CEO, Global Funds Management
J.P. Morgan Asset Management
| | | | | | | | |
| | | |
| DECEMBER 31, 2018 | | J.P. MORGAN MID CAP/MULTI-CAP FUNDS | | | | | 1 | |
J.P. Morgan MidCap/Multi-Cap Funds
MARKET OVERVIEW
SIX MONTHS ENDED DECEMBER 31, 2018 (Unaudited)
U.S. equity prices were largely supported by strong corporate earnings and revenue, low interest rates and an expanding domestic economy. In August, U.S. equity prices reached record highs and remained elevated through September. However, share prices fell sharply and market volatility spiked in early October, then rebounded slightly in November before plummeting again in December, erasing gains made over the previous five months.
Overall, U.S. large cap equity outperformed mid cap and small cap equity and growth stocks outperformed value stocks. For the six months ended December 31, 2018, the S&P 500 returned-6.85% and the Russell Midcap Index returned-11.14%.
| | | | | | |
| | | |
| 2 | | | | J.P. MORGAN MID CAP/MULTI-CAP FUNDS | | DECEMBER 31, 2018 |
JPMorgan Growth Advantage Fund
FUND COMMENTARY
SIX MONTHS ENDED DECEMBER 31, 2018 (Unaudited)
| | | | |
| REPORTING PERIOD RETURN: | |
| Fund (Class A Shares, without a sales charge)* | | | (10.96)% | |
| Russell 3000 Growth Index | | | (8.90)% | |
| |
| Net Assets as of 12/31/2018 (In Thousands) | | | $7,769,612 | |
INVESTMENT OBJECTIVE**
The JPMorgan Growth Advantage Fund (the “Fund”) seeks to provide long-term capital growth.
WHAT WERE THE MAIN DRIVERS OF THE FUND’S PERFORMANCE?
The Fund’s Class A Shares, without a sales charge, underperformed the Russell 3000 Growth Index (the “Benchmark”) for the six months ended December 31, 2018. The Fund’s security selection in the consumer discretionary and health care sectors was a leading detractor from performance relative to the Benchmark, while the Fund’s security selection in the producer durables and materials & processing sectors was a leading contributor to relative performance.
Leading individual detractors from relative performance included the Fund’s overweight positions in Electronic Arts Inc., Nvidia Corp. and East West Bancorp Inc. Shares of Electronic Arts, a maker of digital interactive games and entertainment, fell after the company reduced its 2019 revenue and earnings forecast and delayed the launch of a significant game. The Fund eliminated its position in the stock during the reporting period. Shares of Nvidia, a semiconductor manufacturer, fell after the company reported weaker-than-expected results for the third quarter of 2018 amid a decline in demand for its specialty semiconductors. Shares of East West Bancorp, a Chinese-American bank, fell amid investor concerns about U.S.-China trade tariffs and a weaker outlook for bank profit margins.
Leading individual contributors to relative performance included the Fund’s overweight positions Lennox International Inc., UnitedHealth Group Inc. and Waste Connections Inc. Shares of Lennox International, a provider of heating, ventilation and air conditioning systems, rose after the company raised its forecast for 2019 earnings. Shares of UnitedHealth Group, a health insurance provider, rose after the company reported better-than-expected earnings and revenue for the third quarter of 2018. Shares of Waste Connections, a provider of solid waste collection, transfer and disposal services not held in the Benchmark, rose after the company reported better-than-expected earnings and revenue for the third quarter of 2018.
HOW WAS THE FUND POSITIONED?
The Fund’s portfolio managers utilized abottom-up approach to stock selection, researching individual companies across market capitalizations in an effort to construct portfolios of stocks that have strong fundamentals. The Fund’s portfolio managers sought to invest in high quality companies with durable franchises that, in their view, possessed the ability to generate strong future earnings growth.
| | | | | | | | |
| TOP TEN EQUITY HOLDINGS OF THE PORTFOLIO*** | |
| | 1. | | | Microsoft Corp. | | | 5.8 | % |
| | 2. | | | Amazon.com, Inc. | | | 5.6 | |
| | 3. | | | Alphabet, Inc., Class C | | | 5.5 | |
| | 4. | | | Apple, Inc. | | | 5.0 | |
| | 5. | | | UnitedHealth Group, Inc. | | | 3.9 | |
| | 6. | | | Waste Connections, Inc. | | | 2.8 | |
| | 7. | | | Mastercard, Inc., Class A | | | 2.4 | |
| | 8. | | | Visa, Inc., Class A | | | 2.3 | |
| | 9. | | | Boeing Co. (The) | | | 2.0 | |
| | 10. | | | salesforce.com, Inc. | | | 1.9 | |
| | | | |
PORTFOLIO COMPOSITION BY SECTOR*** | |
Information Technology | | | 34.9 | % |
Health Care | | | 15.9 | |
Consumer Discretionary | | | 12.9 | |
Industrials | | | 12.9 | |
Communication Services | | | 9.3 | |
Financials | | | 6.9 | |
Materials | | | 2.3 | |
| Investment of cash collateral from securities loaned | | | 1.7 | |
| Energy | | | 1.5 | |
| Real Estate | | | 0.8 | |
| Short-Term Investments | | | 0.9 | |
| * | | The return shown is based on net asset values calculated for shareholder transactions and may differ from the return shown in the financial highlights, which reflects adjustments made to the net asset values in accordance with accounting principles generally accepted in the United States of America. |
| ** | | The adviser seeks to achieve the Fund’s objective. There can be no guarantee it will be achieved. |
| *** | | Percentages indicated are based on total investments as of December 31, 2018. The Fund’s portfolio composition is subject to change. |
| | | | | | | | |
| | | |
| DECEMBER 31, 2018 | | J.P. MORGAN MID CAP/MULTI-CAP FUNDS | | | | | 3 | |
JPMorgan Growth Advantage Fund
FUND COMMENTARY
SIX MONTHS ENDED DECEMBER 31, 2018 (Unaudited) (continued)
| | | | | | | | | | | | | | | | | | |
AVERAGE ANNUAL TOTAL RETURNSAS OF DECEMBER 31, 2018 | |
| | | | | |
| | | INCEPTION DATE OF
CLASS | | 6 MONTH* | | | 1 YEAR | | | 5 YEAR | | | 10 YEAR | |
CLASS A SHARES | | October 29, 1999 | | | | | | | | | | | | | | | | |
With Sales Charge** | | | | | (15.62 | )% | | | (6.80 | )% | | | 8.65 | % | | | 15.21 | % |
Without Sales Charge | | | | | (10.96 | ) | | | (1.63 | ) | | | 9.83 | | | | 15.83 | |
CLASS C SHARES | | May 1, 2006 | | | | | | | | | | | | | | | | |
With CDSC*** | | | | | (12.18 | ) | | | (3.14 | ) | | | 9.28 | | | | 15.24 | |
Without CDSC | | | | | (11.18 | ) | | | (2.14 | ) | | | 9.28 | | | | 15.24 | |
CLASS I SHARES | | May 1, 2006 | | | (10.82 | ) | | | (1.39 | ) | | | 10.05 | | | | 16.07 | |
CLASS R2 SHARES | | July 31, 2017 | | | (11.07 | ) | | | (1.89 | ) | | | 9.55 | | | | 15.55 | |
CLASS R3 SHARES | | May 31, 2017 | | | (10.95 | ) | | | (1.63 | ) | | | 9.84 | | | | 15.85 | |
CLASS R4 SHARES | | May 31, 2017 | | | (10.82 | ) | | | (1.34 | ) | | | 10.09 | | | | 16.13 | |
CLASS R5 SHARES | | January 8, 2009 | | | (10.77 | ) | | | (1.22 | ) | | | 10.24 | | | | 16.29 | |
CLASS R6 SHARES | | December 23, 2013 | | | (10.71 | ) | | | (1.12 | ) | | | 10.36 | | | | 16.34 | |
| ** | | Sales Charge for Class A Shares is 5.25%. |
| *** | | Assumes a 1% CDSC (contingent deferred sales charge) for the 6 month and one year periods and 0% CDSC thereafter. |
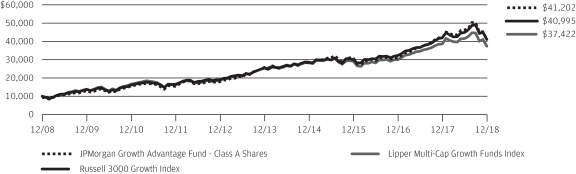
TEN YEAR PERFORMANCE(12/31/08 TO 12/31/18)
The performance quoted is past performance and is not a guarantee of future results. Mutual funds are subject to certain market risks. Investment returns and principal value of an investment will fluctuate so that an investor’s shares, when redeemed, may be worth more or less than their original cost. Current performance may be higher or lower than the performance data shown. Forup-to-datemonth-end performance information pleasecall 1-800-480-4111.
Returns for Class R2 and Class R3 Shares prior to their inception dates are based on the performance of Class A Shares. The actual returns for Class R2 Shares would have been lower than those shown because Class R2 Shares have higher expenses than Class A Shares. The actual returns for Class R3 Shares would have been similar to those shown because Class R3 Shares have similar expenses to Class A Shares.
Returns for Class R4 and Class R5 Shares prior to their inception dates are based on the performance of Class I Shares. The actual returns of Class R4 Shares would have been similar to those shown because Class R4 Shares have similar expenses to Class I Shares. The actual returns of Class R5 Shares would have been different than those shown because Class R5 Shares have different expenses than Class I Shares.
Returns for Class R6 Shares prior to their inception date are based on the performance of Class R5 Shares from January 8, 2009 to December 22, 2013 and Class I Shares prior to January 8, 2009. The actual returns of Class R6 Shares would have been different than those shown because Class R6 Shares have different expenses than Class R5 and Class I Shares.
The graph illustrates comparative performance for $10,000 invested in Class A Shares of the JPMorgan Growth Advantage Fund, the Russell 3000 Growth Index and the LipperMulti-Cap Growth Funds Index from December 31, 2008 to
December 31, 2018. The performance of the Fund assumes reinvestment of all dividends and capital gain distributions, if any, and includes a sales charge. The performance of the Russell 3000 Growth Index does not reflect the deduction of expenses or a sales charge associated with a mutual fund and has been adjusted to reflect reinvestment of all dividends and capital gain distributions of the securities included in the benchmark, if applicable. The performance of the LipperMulti-Cap Growth Funds Index includes expenses associated with a mutual fund, such as investment management fees. These expenses are not identical to the expenses incurred by the Fund. The Russell 3000 Growth Index is an unmanaged index which measures the performance of those Russell 3000 companies (largest 3000 U.S. companies) with higherprice-to-book ratios and higher forecasted growth values. The LipperMulti-Cap Growth Funds Index is an index based on total returns of certain mutual funds within the Fund’s designated category as determined by Lipper, Inc. Investors cannot invest directly in an index.
Class A Shares have a $1,000 minimum initial investment and carry a 5.25% sales charge.
Fund performance may reflect the waiver of the Fund’s fees and reimbursement of expenses for certain periods. Without these waivers and reimbursements, performance would have been lower. Also, performance shown in this section does not reflect the deduction of taxes that a shareholder would pay on Fund distributions or redemptions of Fund shares.
The returns shown are based on net asset values calculated for shareholder transactions and may differ from the returns shown in the financial highlights, which reflect adjustments made to the net asset values in accordance with accounting principles generally accepted in the United States of America.
| | | | | | |
| | | |
| 4 | | | | J.P. MORGAN MID CAP/MULTI-CAP FUNDS | | DECEMBER 31, 2018 |
JPMorgan Mid Cap Equity Fund
FUND COMMENTARY
SIX MONTHS ENDED DECEMBER 31, 2018 (Unaudited)
| | | | |
| REPORTING PERIOD RETURN: | |
| Fund (Class I Shares)* | | | (10.90)% | |
| Russell Midcap Index | | | (11.14)% | |
| |
| Net Assets as of 12/31/2018 (In Thousands) | | | $2,417,474 | |
INVESTMENT OBJECTIVE**
The JPMorgan Mid Cap Equity Fund (the “Fund”) seeks long-term capital growth.
WHAT WERE THE MAIN DRIVERS OF THE FUND’S PERFORMANCE?
The Fund’s Class I Shares outperformed the Russell Midcap Index (the “Benchmark”) for the six months ended December 31, 2018. The Fund’s security selection in the energy sector and the materials & processing sector was a leading contributor to performance relative to the Benchmark, while the Fund’s security selection in the technology and consumer staples sectors was a leading detractor from relative performance.
Leading individual contributors to relative performance included the Fund’s overweight positions in Ball Corp., O’Reilly Automotive Inc. and Red Hat Inc. Shares of Ball, a metal packaging maker, rose after the company reaffirmed its 2019 forecast. Shares of O’Reilly Automotive, an automotive parts retailer, rose amid a healthy environment for the auto parts sector and investor expectations that the company will perform well in the later stages of the economic expansion. Shares of Red Hat, a provider of open source software, rose after IBM Corp. agreed to acquire the company for an estimated $34 billion.
Leading individual detractors from relative performance included the Fund’s overweight positions in EQT Inc., Mohawk Industries Inc. and Electronic Arts Inc. Shares of EQT, a natural gas production and transmission company, fell after the company reported higher operating expenses and lower-than-expected results for the third quarter of 2018. Shares of Mohawk Industries, a maker of commercial and residential flooring, fell amid a slump in the U.S. housing sector. Shares of Electronic Arts, a maker of digital interactive games and entertainment not held in the Benchmark, fell after the company reduced its 2019 revenue and earnings forecast and delayed the launch of a significant game.
HOW WAS THE FUND POSITIONED?
The Fund’s portfolio managers employed abottom-up approach to stock selection, constructing a portfolio based on company fundamentals, quantitative screening and proprietary
fundamental analysis. The Fund’s portfolio managers sought to identify dominant franchises with predictable business models they deemed capable of achieving, in their view, sustained growth, as well as undervalued companies with the potential to grow their intrinsic value per share.
| | | | | | | | |
| TOP TEN EQUITY HOLDINGS OF THE PORTFOLIO*** | |
| | 1. | | | Waste Connections, Inc. | | | 1.4 | % |
| | 2. | | | Hilton Worldwide Holdings, Inc. | | | 1.4 | |
| | 3. | | | Ross Stores, Inc. | | | 1.3 | |
| | 4. | | | O’Reilly Automotive, Inc. | | | 1.3 | |
| | 5. | | | Ball Corp. | | | 1.3 | |
| | 6. | | | Amphenol Corp., Class A | | | 1.3 | |
| | 7. | | | ServiceNow, Inc. | | | 1.2 | |
| | 8. | | | CBRE Group, Inc., Class A | | | 1.1 | |
| | 9. | | | CMS Energy Corp. | | | 1.0 | |
| | 10. | | | Global Payments, Inc. | | | 1.0 | |
| | | | |
PORTFOLIO COMPOSITION BY SECTOR*** | |
| Information Technology | | | 20.1 | % |
| Consumer Discretionary | | | 14.9 | |
| Financials | | | 14.0 | |
| Health Care | | | 12.3 | |
| Industrials | | | 11.3 | |
| Real Estate | | | 6.5 | |
| Utilities | | | 4.9 | |
| Materials | | | 4.3 | |
| Energy | | | 3.5 | |
| Consumer Staples | | | 2.7 | |
| Communication Services | | | 2.0 | |
| Investment of cash collateral from securities loaned | | | 1.9 | |
| Short-Term Investments | | | 1.6 | |
| * | | The return shown is based on net asset values calculated for shareholder transactions and may differ from the return shown in the financial highlights, which reflects adjustments made to the net asset values in accordance with accounting principles generally accepted in the United States of America. |
| ** | | The adviser seeks to achieve the Fund’s objective. There can be no guarantee it will be achieved. |
| *** | | Percentages indicated are based on total investments as of December 31, 2018. The Fund’s portfolio composition is subject to change. |
| | | | | | | | |
| | | |
| DECEMBER 31, 2018 | | J.P. MORGAN MID CAP/MULTI-CAP FUNDS | | | | | 5 | |
JPMorgan Mid Cap Equity Fund
FUND COMMENTARY
SIX MONTHS ENDED DECEMBER 31, 2018 (Unaudited) (continued)
| | | | | | | | | | | | | | | | | | |
AVERAGE ANNUAL TOTAL RETURNSAS OF DECEMBER 31, 2018 | |
| | | | | |
| | | INCEPTION DATE OF
CLASS | | 6 MONTH* | | | 1 YEAR | | | 5 YEAR | | | 10 YEAR | |
CLASS A SHARES | | November 2, 2009 | | | | | | | | | | | | | | | | |
With Sales Charge** | | | | | (15.69 | )% | | | (13.32 | )% | | | 4.71 | % | | | 12.59 | % |
Without Sales Charge | | | | | (11.01 | ) | | | (8.51 | ) | | | 5.85 | | | | 13.20 | |
CLASS C SHARES | | November 2, 2009 | | | | | | | | | | | | | | | | |
With CDSC*** | | | | | (12.21 | ) | | | (9.96 | ) | | | 5.33 | | | | 12.69 | |
Without CDSC | | | | | (11.21 | ) | | | (8.96 | ) | | | 5.33 | | | | 12.69 | |
CLASS I SHARES | | January 1, 1997 | | | (10.90 | ) | | | (8.29 | ) | | | 6.19 | | | | 13.55 | |
CLASS R2 SHARES | | March 14, 2014 | | | (11.11 | ) | | | (8.73 | ) | | | 5.60 | | | | 13.07 | |
CLASS R5 SHARES | | March 14, 2014 | | | (10.82 | ) | | | (8.13 | ) | | | 6.31 | | | | 13.61 | |
CLASS R6 SHARES | | March 14, 2014 | | | (10.77 | ) | | | (8.04 | ) | | | 6.38 | | | | 13.65 | |
| ** | | Sales Charge for Class A Shares is 5.25%. |
| *** | | Assumes a 1% CDSC (contingent deferred sales charge) for the 6 month and one year periods and 0% CDSC thereafter. |
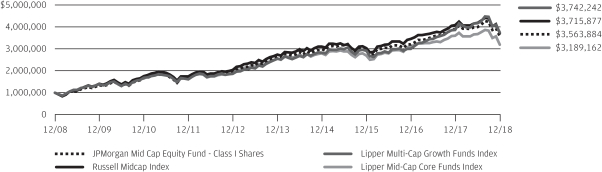
TEN YEAR PERFORMANCE(12/31/08 TO 12/31/18)
The performance quoted is past performance and is not a guarantee of future results. Mutual funds are subject to certain market risks. Investment returns and principal value of an investment will fluctuate so that an investor’s shares, when redeemed, may be worth more or less than their original cost. Current performance may be higher or lower than the performance data shown. Forup-to-datemonth-end performance information pleasecall 1-800-480-4111.
Returns for Class A and Class C Shares prior to their inception dates are based on the performance of Class I Shares. The actual returns of Class A and Class C Shares would have been lower than those shown because Class A and Class C Shares have higher expenses than Class I Shares.
Returns for Class R2 Shares prior to their inception date are based on the performance of Class A Shares from November 2, 2009 to March 13, 2014 and Class I Shares prior to November 2, 2009. The actual returns of Class R2 Shares would have been lower than those shown because Class R2 Shares have higher expenses than Class A and Class I Shares.
Returns for Class R5 and Class R6 Shares prior to their inception dates are based on the performance of Class I Shares. The actual returns of Class R5 and Class R6 Shares would have been different because Class R5 and Class R6 Shares have different expenses than Class I Shares.
The graph illustrates comparative performance for $1,000,000 invested in the Class I Shares of JPMorgan Mid Cap Equity Fund, the Russell Midcap Index, the Lipper Multi-Cap Core Funds Index and the Lipper Multi-Cap Growth Funds Index from December 31, 2008 to December 31, 2018. The performance of the
Fund assumes reinvestment of all dividends and capital gain distributions, if any, and does not include a sales charge. The performance of the Russell Midcap Index does not reflect the deduction of expenses or a sales charge associated with a mutual fund and has been adjusted to reflect reinvestment of all dividends and capital gain distributions of the securities included in the benchmark, if applicable. The performance of the Lipper Mid-Cap Core Funds Index and the Lipper Multi-Cap Growth Funds Index includes expenses associated with a mutual fund, such as investment management fees. These expenses are not identical to the expenses incurred by the Fund. The Russell Midcap Index is an unmanaged index which measures the performance of the 800 smallest companies in the Russell 1000 Index. The Lipper Mid-Cap Core Funds Index and the Lipper Multi-Cap Growth Funds Index are indices based on total returns of certain mutual funds within designated categories as determined by Lipper, Inc. Investors cannot invest directly in an index.
Class I Shares have a $1,000,000 minimum initial investment.
Fund performance may reflect the waiver of the Fund’s fees and reimbursement of expenses for certain periods. Without these waivers and reimbursements, performance would have been lower. Also, performance shown in this section does not reflect the deduction of taxes that a shareholder would pay on Fund distributions or redemptions of Fund shares.
The returns shown are based on net asset values calculated for shareholder transactions and may differ from the returns shown in the financial highlights, which reflect adjustments made to the net asset values in accordance with accounting principles generally accepted in the United States of America.
| | | | | | |
| | | |
| 6 | | | | J.P. MORGAN MID CAP/MULTI-CAP FUNDS | | DECEMBER 31, 2018 |
JPMorgan Mid Cap Growth Fund
FUND COMMENTARY
SIX MONTHS ENDED DECEMBER 31, 2018 (Unaudited)
| | | | |
| REPORTING PERIOD RETURN: | | | |
| Fund (Class I Shares)* | | | (10.54)% | |
| Russell Midcap Growth Index | | | (9.63)% | |
| |
| Net Assets as of 12/31/2018 (In Thousands) | | | $3,526,662 | |
INVESTMENT OBJECTIVE**
The JPMorgan Mid Cap Growth Fund (the “Fund”) seeks growth of capital.
WHAT WERE THE MAIN DRIVERS OF THE FUND’S PERFORMANCE?
The Fund’s Class I Shares underperformed the Russell Midcap Growth Index (the “Benchmark”) for the six months ended December 31, 2018. The Fund’s security selection in the technology sector and its lack of a position in the consumer staples sector were leading detractors from performance relative to the Benchmark, while the Fund’s security selection in the health care and financial services sectors was a leading contributor to relative performance.
Leading individual detractors from relative performance included the Fund’s overweight positions in Electronic Arts Inc. and Red Rock Resorts Inc. and its underweight position in Advanced Micro Devices Inc. Shares of Electronic Arts, a maker of digital interactive games and entertainment not held in the Benchmark, fell after the company reduced its 2019 revenue and earnings forecast and delayed the launch of a significant game. The Fund eliminated its holdings of Electronic Arts during the reporting period. Shares of Red Rock Resorts, a casino and entertainment properties operator not held in the Benchmark, fell amid higher-than-expected construction costs at its Palms project and general industry weakness inper-room revenue. Shares of Advanced Micro Devices, a maker of semiconductors, rose after the company reported better-than-expected results for the third quarter of 2018 and shifted production to smaller, faster processing units.
Leading individual contributors to relative performance included the Fund’s overweight positions in O’Reilly Automotive Inc., DexCom Inc. and Red Hat Inc. Shares of O’Reilly Automotive, an automotive parts retailer, rose amid a healthy environment for the auto parts sector and investor expectations that the company will perform well in the later stages of the economic expansion. Shares of DexCom, a medical device maker, rose after the company reported better-than-expected revenue and strong demand for its blood glucose monitoring devices. Shares of Red Hat, a provider of open source software, rose after IBM Corp. agreed to acquire the company for an estimated $34 billion.
HOW WAS THE FUND POSITIONED?
The Fund’s portfolio managers utilized abottom-up approach to stock selection, researching individual companies in an effort to construct a portfolio of stocks that have strong fundamentals. The Fund’s portfolio managers sought to invest in high quality companies with durable franchises that, in their view, possessed the ability to generate strong future earnings growth.
| | | | | | | | |
| TOP TEN EQUITY HOLDINGS OF THE PORTFOLIO*** | |
| | 1. | | | Waste Connections, Inc. | | | 2.7 | % |
| | 2. | | | Ross Stores, Inc. | | | 2.7 | |
| | 3. | | | O’Reilly Automotive, Inc. | | | 2.6 | |
| | 4. | | | ServiceNow, Inc. | | | 2.4 | |
| | 5. | | | Global Payments, Inc. | | | 1.9 | |
| | 6. | | | Lennox International, Inc. | | | 1.7 | |
| | 7. | | | Red Hat, Inc. | | | 1.6 | |
| | 8. | | | Palo Alto Networks, Inc. | | | 1.6 | |
| | 9. | | | Fiserv, Inc. | | | 1.5 | |
| | 10. | | | GoDaddy, Inc., Class A | | | 1.5 | |
| | | | |
PORTFOLIO COMPOSITION BY SECTOR*** | |
| Information Technology | | | 32.1 | % |
| Health Care | | | 17.7 | |
| Consumer Discretionary | | | 16.4 | |
| Industrials | | | 15.0 | |
| Financials | | | 6.7 | |
| Investment of cash collateral from securities loaned | | | 3.6 | |
| Materials | | | 3.6 | |
| Communication Services | | | 2.4 | |
| Energy | | | 1.1 | |
| Real Estate | | | 1.0 | |
| Short-Term Investments | | | 0.4 | |
| * | | The return shown is based on net asset values calculated for shareholder transactions and may differ from the return shown in the financial highlights, which reflects adjustments made to the net asset values in accordance with accounting principles generally accepted in the United States of America. |
| ** | | The adviser seeks to achieve the Fund’s objective. There can be no guarantee it will be achieved. |
| *** | | Percentages indicated are based on total investments as of December 31, 2018. The Fund’s portfolio composition is subject to change. |
| | | | | | | | |
| | | |
| DECEMBER 31, 2018 | | J.P. MORGAN MID CAP/MULTI-CAP FUNDS | | | | | 7 | |
JPMorgan Mid Cap Growth Fund
FUND COMMENTARY
SIX MONTHS ENDED DECEMBER 31, 2018 (Unaudited) (continued)
| | | | | | | | | | | | | | | | | | |
AVERAGE ANNUAL TOTAL RETURNSAS OF DECEMBER 31, 2018 | |
| | | | | |
| | | INCEPTION DATE OF
CLASS | | 6 MONTH* | | | 1 YEAR | | | 5 YEAR | | | 10 YEAR | |
CLASS A SHARES | | February 18, 1992 | | | | | | | | | | | | | | | | |
With Sales Charge** | | | | | (15.38 | )% | | | (10.40 | )% | | | 5.55 | % | | | 13.69 | % |
Without Sales Charge | | | | | (10.69 | ) | | | (5.44 | ) | | | 6.69 | | | | 14.30 | |
CLASS C SHARES | | November 4, 1997 | | | | | | | | | | | | | | | | |
With CDSC*** | | | | | (11.90 | ) | | | (6.92 | ) | | | 6.17 | | | | 13.72 | |
Without CDSC | | | | | (10.90 | ) | | | (5.92 | ) | | | 6.17 | | | | 13.72 | |
CLASS I SHARES | | March 2, 1989 | | | (10.54 | ) | | | (5.16 | ) | | | 7.03 | | | | 14.65 | |
CLASS R2 SHARES | | June 19, 2009 | | | (10.80 | ) | | | (5.70 | ) | | | 6.49 | | | | 14.10 | |
CLASS R3 SHARES | | September 9, 2016 | | | (10.66 | ) | | | (5.43 | ) | | | 6.70 | | | | 14.30 | |
CLASS R4 SHARES | | September 9, 2016 | | | (10.55 | ) | | | (5.20 | ) | | | 6.97 | | | | 14.59 | |
CLASS R5 SHARES | | November 1, 2011 | | | (10.48 | ) | | | (5.02 | ) | | | 7.17 | | | | 14.77 | |
CLASS R6 SHARES | | November 1, 2011 | | | (10.46 | ) | | | (4.97 | ) | | | 7.23 | | | | 14.81 | |
| ** | | Sales Charge for Class A Shares is 5.25%. |
| *** | | Assumes a 1% CDSC (contingent deferred sales charge) for the 6 month and one year periods and 0% CDSC thereafter. |
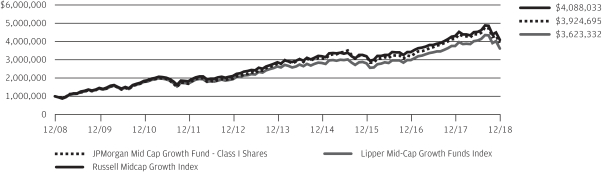
TEN YEAR PERFORMANCE(12/31/08 TO 12/31/18)
The performance quoted is past performance and is not a guarantee of future results. Mutual funds are subject to certain market risks. Investment returns and principal value of an investment will fluctuate so that an investor’s shares, when redeemed, may be worth more or less than their original cost. Current performance may be higher or lower than the performance data shown. Forup-to-datemonth-end performance information please call1-800-480-4111.
Returns for the Class R2, Class R3, Class R4, Class R5 and Class R6 Shares prior to their inception dates are based on the performance of Class I Shares. Prior performance for Class R2, Class R3 and Class R4 Shares has been adjusted to reflect the differences in expenses between classes. The actual returns of Class R5 and Class R6 Shares would have been different than those shown because Class R5 and Class R6 Shares have different expenses than Class I Shares.
The graph illustrates comparative performance for $1,000,000 invested in Class I Shares of the JPMorgan Mid Cap Growth Fund, the Russell Midcap Growth Index and the Lipper Mid-Cap Growth Funds Index from December 31, 2008 to December 31, 2018. The performance of the Fund assumes reinvestment of all dividends and capital gain distributions, if any, and does not include a sales charge. The performance of the Russell Midcap Growth Index does not reflect the deduction of expenses or a sales charge associated with a mutual fund and has been adjusted to reflect reinvestment of all dividends and capital
gain distributions of the securities included in the benchmark, if applicable. The performance of the Lipper Mid-Cap Growth Funds Index includes expenses associated with a mutual fund, such as investment management fees. These expenses are not identical to the expenses incurred by the Fund. The Russell Midcap Growth Index is an unmanaged index which measures the performance of those Russell Midcap companies with higherprice-to-book ratios and higher forecasted growth values. The Lipper Mid-Cap Growth Funds Index is an index based on total returns of certain mutual funds within designated categories as determined by Lipper, Inc. Investors cannot invest directly in an index.
Class I Shares have a $1,000,000 minimum initial investment.
Fund performance may reflect the waiver of the Fund’s fees and reimbursement of expenses for certain periods. Without these waivers and reimbursements, performance would have been lower. Also, performance shown in this section does not reflect the deduction of taxes that a shareholder would pay on Fund distributions or redemptions of Fund shares.
The returns shown are based on net asset values calculated for shareholder transactions and may differ from the returns shown in the financial highlights, which reflect adjustments made to the net asset values in accordance with accounting principles generally accepted in the United States of America.
| | | | | | |
| | | |
| 8 | | | | J.P. MORGAN MID CAP/MULTI-CAP FUNDS | | DECEMBER 31, 2018 |
JPMorgan Mid Cap Value Fund
FUND COMMENTARY
SIX MONTHS ENDED DECEMBER 31, 2018 (Unaudited)
| | | | |
| REPORTING PERIOD RETURN: | | | |
| Fund (Class L Shares)* | | | (11.50)% | |
| Russell Midcap Value Index | | | (12.15)% | |
| |
| Net Assets as of 12/31/2018 (In Thousands) | | | $15,024,150 | |
INVESTMENT OBJECTIVE**
The JPMorgan Mid Cap Value Fund (the “Fund”) seeks growth from capital appreciation.
WHAT WERE THE MAIN DRIVERS OF THE FUND’S PERFORMANCE?
The Fund’s Class L Shares outperformed the Russell Midcap Value Index (the “Benchmark”) for the six months ended December 31, 2018. The Fund’s security selection in the energy and materials sectors was a leading contributor to performance relative to the Benchmark, while the Fund’s security selection in the real estate and consumer staples sectors was a leading detractor from relative performance.
Leading individual contributors to relative performance included the Fund’s overweight positions in Ball Corp. and AutoZone Inc. and an underweight position in Western Digital Co. Shares of Ball, a metal packaging maker, rose after the company reaffirmed its 2019 forecast. Shares of AutoZone, an automotive parts retailer, rose after the company reported better-than-expected earnings and sales for its fiscal first quarter. Shares of Western Digital, a maker of data storage devices not held in the Fund, fell after the company reported lower-than-expected earnings and revenue for its fiscal first quarter.
Leading individual detractors from relative performance included the Fund’s overweight positions EQT Corp., Mohawk Industries Inc. and PVH Corp. Shares of EQT, a natural gas production and transmission company, fell after the company reported higher operating expenses and lower-than-expected results for the third quarter of 2018. Shares of Mohawk Industries, a maker of commercial and residential flooring, fell amid a slump in the U.S. housing sector. Shares of PVH, the parent company of the Calvin Klein and Tommy Hilfiger apparel brands, fell amid investor disappointment with the company’s results for the third quarter of 2018.
HOW WAS THE FUND POSITIONED?
The Fund’s portfolio managers utilized abottom-up approach to stock selection and sought to identify durable franchises possessing the ability to generate, in their view, sustainable levels of free cash flow.
| | | | | | | | |
| TOP TEN EQUITY HOLDINGS OF THE PORTFOLIO*** | |
| | 1. | | | CMS Energy Corp. | | | 2.1 | % |
| | 2. | | | WEC Energy Group, Inc. | | | 2.0 | |
| | 3. | | | Xcel Energy, Inc. | | | 2.0 | |
| | 4. | | | Diamondback Energy, Inc. | | | 1.9 | |
| | 5. | | | Loews Corp. | | | 1.9 | |
| | 6. | | | M&T Bank Corp. | | | 1.8 | |
| | 7. | | | Ball Corp. | | | 1.7 | |
| | 8. | | | Williams Cos., Inc. (The) | | | 1.7 | |
| | 9. | | | AutoZone, Inc. | | | 1.5 | |
| | 10. | | | T. Rowe Price Group, Inc. | | | 1.4 | |
| | | | |
PORTFOLIO COMPOSITION BY SECTOR*** | |
| Financials | | | 21.9 | % |
| Consumer Discretionary | | | 13.4 | |
| Real Estate | | | 11.8 | |
| Utilities | | | 9.9 | |
| Information Technology | | | 7.8 | |
| Industrials | | | 7.6 | |
| Health Care | | | 6.8 | |
| Energy | | | 6.0 | |
| Consumer Staples | | | 5.5 | |
| Materials | | | 5.0 | |
| Communication Services | | | 1.7 | |
| Investment of cash collateral from securities loaned | | | 0.7 | |
| Short-Term Investments | | | 1.9 | |
| * | | The return shown is based on net asset values calculated for shareholder transactions and may differ from the return shown in the financial highlights, which reflects adjustments made to the net asset values in accordance with accounting principles generally accepted in the United States of America. |
| ** | | The adviser seeks to achieve the Fund’s objective. There can be no guarantee it will be achieved. |
| *** | | Percentages indicated are based on total investments as of December 31, 2018. The Fund’s portfolio composition is subject to change. |
| | | | | | | | |
| | | |
| DECEMBER 31, 2018 | | J.P. MORGAN MID CAP/MULTI-CAP FUNDS | | | | | 9 | |
JPMorgan Mid Cap Value Fund
FUND COMMENTARY
SIX MONTHS ENDED DECEMBER 31, 2018 (Unaudited) (continued)
| | | | | | | | | | | | | | | | | | |
AVERAGE ANNUAL TOTAL RETURNSAS OF DECEMBER 31, 2018 | |
| | | | | |
| | | INCEPTION DATE OF
CLASS | | 6 MONTH* | | | 1 YEAR | | | 5 YEAR | | | 10 YEAR | |
CLASS A SHARES | | April 30, 2001 | | | | | | | | | | | | | | | | |
With Sales Charge** | | | | | (16.34 | )% | | | (16.70 | )% | | | 3.66 | % | | | 11.51 | % |
Without Sales Charge | | | | | (11.71 | ) | | | (12.09 | ) | | | 4.79 | | | | 12.11 | |
CLASS C SHARES | | April 30, 2001 | | | | | | | | | | | | | | | | |
With CDSC*** | | | | | (12.93 | ) | | | (13.51 | ) | | | 4.26 | | | | 11.55 | |
Without CDSC | | | | | (11.93 | ) | | | (12.51 | ) | | | 4.26 | | | | 11.55 | |
CLASS I SHARES | | October 31, 2001 | | | (11.60 | ) | | | (11.86 | ) | | | 5.04 | | | | 12.39 | |
CLASS L SHARES | | November 13, 1997 | | | (11.50 | ) | | | (11.65 | ) | | | 5.30 | | | | 12.67 | |
CLASS R2 SHARES | | November 3, 2008 | | | (11.83 | ) | | | (12.32 | ) | | | 4.51 | | | | 11.82 | |
CLASS R3 SHARES | | September 9, 2016 | | | (11.71 | ) | | | (12.09 | ) | | | 4.79 | | | | 12.11 | |
CLASS R4 SHARES | | September 9, 2016 | | | (11.60 | ) | | | (11.84 | ) | | | 5.04 | | | | 12.39 | |
CLASS R5 SHARES | | September 9, 2016 | | | (11.53 | ) | | | (11.73 | ) | | | 5.25 | | | | 12.64 | |
CLASS R6 SHARES | | September 9, 2016 | | | (11.50 | ) | | | (11.66 | ) | | | 5.29 | | | | 12.67 | |
| ** | | Sales Charge for Class A Shares is 5.25%. |
| *** | | Assumes a 1% CDSC (contingent deferred sales charge) for the 6 month and one year periods and 0% CDSC thereafter. |
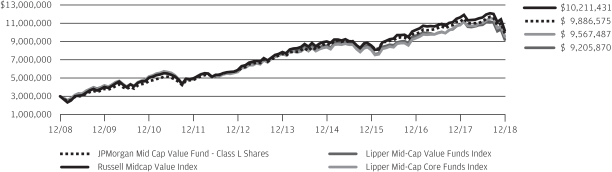
TEN YEAR PERFORMANCE(12/31/08 TO 12/31/18)
The performance quoted is past performance and is not a guarantee of future results. Mutual funds are subject to certain market risks. Investment returns and principal value of an investment will fluctuate so that an investor’s shares, when redeemed, may be worth more or less than their original cost. Current performance may be higher or lower than the performance data shown. Forup-to-datemonth-end performance information please call1-800-480-4111.
Returns for Class R3 Shares prior to their inception dates are based on the performance of Class A Shares. The actual returns of Class R3 Shares would have been lower than those shown because Class R3 Shares have higher expenses than Class A Shares.
Returns for the Class R4 Shares prior to their inception date are based on the performance of Class I Shares. The actual returns of Class R4 Shares would have been lower because Class R4 Shares have higher expenses than Class I Shares.
Returns for the Class R5 and R6 Shares prior to their inception dates are based on the performance of Class L Shares. The actual returns of Class R5 Shares would have been lower than those shown because Class R5 Shares have higher expenses than Class L Shares. The actual returns for Class R6 Shares would have been similar to those shown because Class R6 Shares have similar expenses to Class L Shares.
The graph illustrates comparative performance for $3,000,000 invested in Class L Shares of the JPMorgan Mid Cap Value Fund, the Russell Midcap Value Index, the LipperMid-Cap Value Funds Index and the LipperMid-Cap Core Funds Index from December 31, 2008 to December 31, 2018. The performance of the Fund assumes reinvestment of all dividends and capital gain distributions, if any, and
does not include a sales charge. The performance of the Russell Midcap Value Index does not reflect the deduction of expenses or a sales charge associated with a mutual fund and has been adjusted to reflect reinvestment of all dividends and capital gain distributions of the securities included in the benchmark, if applicable. The performance of the LipperMid-Cap Value Funds Index and the LipperMid-Cap Core Funds Index includes expenses associated with a mutual fund, such as investment management fees. These expenses are not identical to the expenses incurred by the Fund. The Russell Midcap Value Index is an unmanaged index which measures the performance of those Russell Midcap companies with lowerprice-to-book ratios and lower forecasted growth values. The LipperMid-Cap Value Funds Index and the LipperMid-Cap Core Funds Index are indices based on total returns of certain mutual funds within designated categories as determined by Lipper, Inc. Investors cannot invest directly in an index.
Class L Shares have a $3,000,000 minimum initial investment.
Fund performance may reflect the waiver of the Fund’s fees and reimbursement of expenses for certain periods. Without these waivers and reimbursements, performance would have been lower. Also, performance shown in this section does not reflect the deduction of taxes that a shareholder would pay on Fund distributions or redemptions of Fund shares.
The returns shown are based on net asset values calculated for shareholder transactions and may differ from the returns shown in the financial highlights, which reflect adjustments made to the net asset values in accordance with accounting principles generally accepted in the United States of America.
| | | | | | |
| | | |
| 10 | | | | J.P. MORGAN MID CAP/MULTI-CAP FUNDS | | DECEMBER 31, 2018 |
JPMorgan Value Advantage Fund
FUND COMMENTARY
SIX MONTHS ENDED DECEMBER 31, 2018 (Unaudited)
| | | | |
| REPORTING PERIOD RETURN: | |
| Fund (Class L Shares)* | | | (8.03)% | |
| Russell 3000 Value Index | | | (7.51)% | |
| |
| Net Assets as of 12/31/2018 (In Thousands) | | $ | 9,877,347 | |
INVESTMENT OBJECTIVE**
The JPMorgan Value Advantage Fund (the “Fund”) seeks to provide long-term total return from a combination of income and capital gains.
WHAT WERE THE MAIN DRIVERS OF THE FUND’S PERFORMANCE?
The Fund’s Class L Shares underperformed the Russell 3000 Value Index (the “Benchmark”) for the six months ended December 31, 2018. The Fund’s security selection in the financials and communications services sectors was a leading detractor from relative performance, while the Fund’s security selection in the energy and industrials sectors was a leading contributor to relative performance.
Leading individual detractors from relative performance included the Fund’s overweight positions in Capital One Financial Corp., Dish Network Corp. and EQT Corp. Shares of Capital One Financial, a credit card and financial services provider, fell after the company reported third quarter 2018 revenue in line with analysts’ estimates. Shares of Dish Network, a subscription television service, fell after the company reported lower-than-expected revenue and a decline in subscriptions for the third quarter of 2018. Shares of EQT, a natural gas production and transmission company, fell after the company reported higher operating expenses and lower-than-expected results for the third quarter of 2018.
Leading individual contributors to performance relative to the Benchmark included the Fund’s overweight position in Ball Corp. and its underweight positions in General Electric Co. and Schlumberger Ltd. Shares of Ball, a metal packaging maker, rose after the company reaffirmed its 2019 forecast. Shares of General Electric, an industrial conglomerate not held in the Fund, fell after the company reported lower-than-expected earnings for the third quarter of 2018 and reduced its quarterly dividend. Shares of Schlumberger, an oilfield services company not held in the Fund, fell as petroleum prices declined toward the end of the reporting period.
HOW WAS THE FUND POSITIONED?
The Fund’s portfolio managers utilized abottom-up approach to stock selection and sought to identify durable franchises
possessing the ability to generate, in the portfolio managers’ view, significant levels of free cash flow.
| | | | | | | | |
| TOP TEN EQUITY HOLDINGS OF THE PORTFOLIO*** | |
| | 1. | | | Bank of America Corp. | | | 3.1 | % |
| | 2. | | | Pfizer, Inc. | | | 3.1 | |
| | 3. | | | Wells Fargo & Co. | | | 2.7 | |
| | 4. | | | Merck & Co., Inc. | | | 2.1 | |
| | 5. | | | Capital One Financial Corp. | | | 1.9 | |
| | 6. | | | Loews Corp. | | | 1.8 | |
| | 7. | | | Johnson & Johnson | | | 1.7 | |
| | 8. | | | PNC Financial Services Group, Inc. (The) | | | 1.7 | |
| | 9. | | | Verizon Communications, Inc. | | | 1.7 | |
| | 10. | | | Ball Corp. | | | 1.6 | |
| | | | |
PORTFOLIO COMPOSITION BY SECTOR*** | |
| Financials | | | 29.0 | % |
| Health Care | | | 10.1 | |
| Energy | | | 8.5 | |
| Consumer Discretionary | | | 7.8 | |
| Real Estate | | | 7.4 | |
| Information Technology | | | 6.8 | |
| Industrials | | | 6.7 | |
| Consumer Staples | | | 5.8 | |
| Utilities | | | 5.7 | |
| Communication Services | | | 5.6 | |
| Materials | | | 4.9 | |
| Investment of cash collateral from securities loaned | | | 0.8 | |
| Short-Term Investments | | | 0.9 | |
| * | | The return shown is based on net asset values calculated for shareholder transactions and may differ from the return shown in the financial highlights, which reflects adjustments made to the net asset values in accordance with accounting principles generally accepted in the United States of America. |
| ** | | The adviser seeks to achieve the Fund’s objective. There can be no guarantee it will be achieved. |
| *** | | Percentages indicated are based on total investments as of December 31, 2018. The Fund’s portfolio composition is subject to change. |
| | | | | | | | |
| | | |
| DECEMBER 31, 2018 | | J.P. MORGAN MID CAP/MULTI-CAP FUNDS | | | | | 11 | |
JPMorgan Value Advantage Fund
FUND COMMENTARY
SIX MONTHS ENDED DECEMBER 31, 2018 (Unaudited) (continued)
| | | | | | | | | | | | | | | | | | |
AVERAGE ANNUAL TOTAL RETURNSAS OF DECEMBER 31, 2018 | |
| | | | | |
| | | INCEPTION DATE OF
CLASS | | 6 MONTH* | | | 1 YEAR | | | 5 YEAR | | | 10 YEAR | |
CLASS A SHARES | | February 28, 2005 | | | | | | | | | | | | | | | | |
With Sales Charge** | | | | | (13.06 | )% | | | (14.18 | )% | | | 4.17 | % | | | 12.11 | % |
Without Sales Charge | | | | | (8.24 | ) | | | (9.42 | ) | | | 5.30 | | | | 12.71 | |
CLASS C SHARES | | February 28, 2005 | | | | | | | | | | | | | | | | |
With CDSC*** | | | | | (9.45 | ) | | | (10.86 | ) | | | 4.77 | | | | 12.14 | |
Without CDSC | | | | | (8.45 | ) | | | (9.86 | ) | | | 4.77 | | | | 12.14 | |
CLASS I SHARES | | February 28, 2005 | | | (8.12 | ) | | | (9.19 | ) | | | 5.56 | | | | 12.99 | |
CLASS L SHARES | | February 28, 2005 | | | (8.03 | ) | | | (9.05 | ) | | | 5.80 | | | | 13.27 | |
CLASS R2 SHARES | | July 31, 2017 | | | (8.34 | ) | | | (9.64 | ) | | | 5.03 | | | | 12.43 | |
CLASS R3 SHARES | | September 9, 2016 | | | (8.25 | ) | | | (9.41 | ) | | | 5.29 | | | | 12.71 | |
CLASS R4 SHARES | | September 9, 2016 | | | (8.13 | ) | | | (9.18 | ) | | | 5.56 | | | | 12.99 | |
CLASS R5 SHARES | | September 9, 2016 | | | (8.06 | ) | | | (9.06 | ) | | | 5.78 | | | | 13.26 | |
CLASS R6 SHARES | | September 9, 2016 | | | (7.99 | ) | | | (8.97 | ) | | | 5.83 | | | | 13.28 | |
| ** | | Sales Charge for Class A Shares is 5.25%. |
| *** | | Assumes a 1% CDSC (contingent deferred sales charge) for the 6 month and one year periods and 0% CDSC thereafter. |
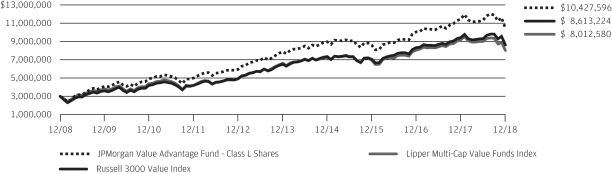
TEN YEAR PERFORMANCE(12/31/08 TO 12/31/18)
The performance quoted is past performance and is not a guarantee of future results. Mutual funds are subject to certain market risks. Investment returns and principal value of an investment will fluctuate so that an investor’s shares, when redeemed, may be worth more or less than their original cost. Current performance may be higher or lower than the performance data shown. Forup-to-datemonth-end performance information please call1-800-480-4111.
Returns for Class R2 and Class R3 Shares prior to their inception date are based on the performance of Class A Shares. The actual returns of Class R2 Shares would have been lower than those shown because Class R2 Shares have higher expenses than Class A Shares. Returns for Class R3 Shares would have been similar to those shown because Class R3 Shares have similar expenses to Class A Shares.
Returns for the Class R4 Shares prior to their inception date are based on the performance of Class I Shares. The actual returns of Class R4 Shares would have been similar to those shown because Class R4 Shares have similar expenses to Class I Shares.
Returns for the Class R5 and Class R6 Shares prior to their inception dates are based on the performance of Class L Shares. The actual returns for Class R5 and Class R6 Shares would have been different to those shown because Class R5 and Class R6 Shares have different expenses to Class L Shares.
The graph illustrates comparative performance for $3,000,000 invested in Class L Shares of the JPMorgan Value Advantage Fund, the Russell 3000 Value Index and the LipperMulti-Cap Value Funds Index from December 31, 2008 to
December 31, 2018. The performance of the Fund assumes reinvestment of all dividends and capital gain distributions, if any, and does not include a sales charge. The performance of the Russell 3000 Value Index does not reflect the deduction of expenses or a sales charge associated with a mutual fund and has been adjusted to reflect reinvestment of all dividends and capital gain distributions of the securities included in the benchmark, if applicable. The performance of the LipperMulti-Cap Value Funds Index includes expenses associated with a mutual fund, such as investment management fees. These expenses are not identical to the expenses incurred by the Fund. The Russell 3000 Value Index is an unmanaged index which measures the performance of those Russell 3000 companies (largest 3000 U.S. companies) with lowerprice-to-book ratios and lower forecasted growth values. The LipperMulti-Cap Value Funds Index is an index based on total returns of certain mutual funds within the Fund’s designated category as determined by Lipper, Inc. Investors cannot invest directly in an index.
Class L Shares have a $3,000,000 minimum initial investment.
Fund performance may reflect the waiver of the Fund’s fees and reimbursement of expenses for certain periods. Without these waivers and reimbursements, performance would have been lower. Also, performance shown in this section does not reflect the deduction of taxes that a shareholder would pay on Fund distributions or redemptions of Fund shares.
The returns shown are based on net asset values calculated for shareholder transactions and may differ from the returns shown in the financial highlights, which reflect adjustments made to the net asset values in accordance with accounting principles generally accepted in the United States of America.
| | | | | | |
| | | |
| 12 | | | | J.P. MORGAN MID CAP/MULTI-CAP FUNDS | | DECEMBER 31, 2018 |
JPMorgan Growth Advantage Fund
SCHEDULE OF PORTFOLIO INVESTMENTS
AS OF DECEMBER 31, 2018 (Unaudited)
| | | | | | | | |
| INVESTMENTS | | SHARES
(000) | | | VALUE
($000) | |
Common Stocks — 99.2% | | | | | | | | |
| | |
Aerospace & Defense — 2.0% | | | | | | | | |
| | |
Boeing Co. (The) | | | 479 | | | | 154,510 | |
| | | | | | | | |
| | |
Airlines — 0.6% | | | | | | | | |
| | |
Delta Air Lines, Inc. | | | 996 | | | | 49,715 | |
| | | | | | | | |
| | |
Automobiles — 1.0% | | | | | | | | |
| | |
Tesla, Inc. * (a) | | | 243 | | | | 80,837 | |
| | | | | | | | |
| | |
Banks — 1.6% | | | | | | | | |
| | |
East West Bancorp, Inc. | | | 1,629 | | | | 70,902 | |
| | |
First Republic Bank | | | 604 | | | | 52,487 | |
| | | | | | | | |
| | |
| | | | | | | 123,389 | |
| | | | | | | | |
| | |
Biotechnology — 3.9% | | | | | | | | |
| | |
Biogen, Inc. * | | | 129 | | | | 38,939 | |
| | |
Exact Sciences Corp. * (a) | | | 925 | | | | 58,336 | |
| | |
Exelixis, Inc. * | | | 2,510 | | | | 49,370 | |
| | |
Intercept Pharmaceuticals, Inc. * | | | 390 | | | | 39,308 | |
| | |
Sage Therapeutics, Inc. * | | | 199 | | | | 19,033 | |
| | |
Spark Therapeutics, Inc. * (a) | | | 565 | | | | 22,130 | |
| | |
Vertex Pharmaceuticals, Inc. * | | | 464 | | | | 76,823 | |
| | | | | | | | |
| | |
| | | | | | | 303,939 | |
| | | | | | | | |
| | |
Building Products — 1.9% | | | | | | | | |
| | |
Fortune Brands Home & Security, Inc. | | | 908 | | | | 34,510 | |
| | |
Lennox International, Inc. | | | 531 | | | | 116,127 | |
| | | | | | | | |
| | |
| | | | | | | 150,637 | |
| | | | | | | | |
| | |
Capital Markets — 4.1% | | | | | | | | |
| | |
BlackRock, Inc. | | | 132 | | | | 51,656 | |
| | |
Charles Schwab Corp. (The) | | | 2,279 | | | | 94,651 | |
| | |
Nasdaq, Inc. | | | 978 | | | | 79,804 | |
| | |
S&P Global, Inc. | | | 531 | | | | 90,187 | |
| | | | | | | | |
| | |
| | | | | | | 316,298 | |
| | | | | | | | |
| | |
Commercial Services & Supplies — 3.8% | | | | | | | | |
| | |
Copart, Inc. * | | | 1,531 | | | | 73,156 | |
| | |
Waste Connections, Inc. (a) | | | 2,994 | | | | 222,286 | |
| | | | | | | | |
| | |
| | | | | | | 295,442 | |
| | | | | | | | |
| | |
Communications Equipment — 1.7% | | | | | | | | |
| | |
Arista Networks, Inc. * | | | 257 | | | | 54,182 | |
| | |
Palo Alto Networks, Inc. * | | | 398 | | | | 75,039 | |
| | | | | | | | |
| | |
| | | | | | | 129,221 | |
| | | | | | | | |
| | |
Construction Materials — 0.7% | | | | | | | | |
| | |
Vulcan Materials Co. | | | 561 | | | | 55,417 | |
| | | | | | | | |
| | |
Containers & Packaging — 1.6% | | | | | | | | |
| | |
Avery Dennison Corp. | | | 790 | | | | 71,002 | |
| | |
Ball Corp. | | | 1,202 | | | | 55,286 | |
| | | | | | | | |
| | |
| | | | | | | 126,288 | |
| | | | | | | | |
| | | | | | | | |
| INVESTMENTS | | SHARES
(000) | | | VALUE
($000) | |
| | | | | | | | |
| | |
Distributors — 0.6% | | | | | | | | |
| | |
LKQ Corp. * | | | 2,096 | | | | 49,726 | |
| | | | | | | | |
|
Electronic Equipment, Instruments & Components — 2.4% | |
| | |
Amphenol Corp., Class A | | | 723 | | | | 58,586 | |
| | |
Corning, Inc. | | | 2,359 | | | | 71,250 | |
| | |
Zebra Technologies Corp., Class A * | | | 335 | | | | 53,358 | |
| | | | | | | | |
| | |
| | | | | | | 183,194 | |
| | | | | | | | |
| | |
Entertainment — 3.1% | | | | | | | | |
| | |
Netflix, Inc. * | | | 464 | | | | 124,221 | |
| | |
Spotify Technology SA * | | | 515 | | | | 58,452 | |
| | |
Take-Two Interactive Software, Inc. * | | | 591 | | | | 60,791 | |
| | | | | | | | |
| | |
| | | | | | | 243,464 | |
| | | | | | | | |
|
Health Care Equipment & Supplies — 1.9% | |
| | |
DexCom, Inc. * | | | 543 | | | | 65,087 | |
| | |
Intuitive Surgical, Inc. * | | | 167 | | | | 80,028 | |
| | | | | | | | |
| | |
| | | | | | | 145,115 | |
| | | | | | | | |
|
Health Care Providers & Services — 5.2% | |
| | |
Acadia Healthcare Co., Inc. * (a) | | | 1,309 | | | | 33,642 | |
| | |
Centene Corp. * | | | 517 | | | | 59,633 | |
| | |
UnitedHealth Group, Inc. | | | 1,254 | | | | 312,471 | |
| | | | | | | | |
| | |
| | | | | | | 405,746 | |
| | | | | | | | |
|
Health Care Technology — 2.1% | |
| | |
Evolent Health, Inc., Class A * (a) | | | 2,175 | | | | 43,391 | |
| | |
Teladoc Health, Inc. * (a) | | | 1,132 | | | | 56,113 | |
| | |
Veeva Systems, Inc., Class A * | | | 720 | | | | 64,302 | |
| | | | | | | | |
| | |
| | | | | | | 163,806 | |
| | | | | | | | |
|
Hotels, Restaurants & Leisure — 0.8% | |
| | |
Hilton Worldwide Holdings, Inc. | | | 876 | | | | 62,878 | |
| | | | | | | | |
| | |
Insurance — 1.3% | | | | | | | | |
| | |
Progressive Corp. (The) | | | 1,720 | | | | 103,786 | |
| | | | | | | | |
| | |
Interactive Media & Services — 6.4% | | | | | | | | |
| | |
Alphabet, Inc., Class C * | | | 419 | | | | 433,408 | |
| | |
Facebook, Inc., Class A * | | | 468 | | | | 61,298 | |
| | | | | | | | |
| | |
| | | | | | | 494,706 | |
| | | | | | | | |
|
Internet & Direct Marketing Retail — 6.1% | |
| | |
Amazon.com, Inc. * | | | 295 | | | | 442,631 | |
| | |
Wayfair, Inc., Class A * (a) | | | 364 | | | | 32,753 | |
| | | | | | | | |
| | |
| | | | | | | 475,384 | |
| | | | | | | | |
|
IT Services — 9.7% | |
| | |
Global Payments, Inc. | | | 1,088 | | | | 112,216 | |
| | |
GoDaddy, Inc., Class A * | | | 1,397 | | | | 91,684 | |
| | |
Mastercard, Inc., Class A | | | 1,014 | | | | 191,197 | |
| | |
PayPal Holdings, Inc. * | | | 1,291 | | | | 108,552 | |
SEE NOTES TO FINANCIAL STATEMENTS.
| | | | | | | | |
| | | |
| DECEMBER 31, 2018 | | J.P. MORGAN MID CAP/MULTI-CAP FUNDS | | | | | 13 | |
JPMorgan Growth Advantage Fund
SCHEDULE OF PORTFOLIO INVESTMENTS
AS OF DECEMBER 31, 2018 (Unaudited) (continued)
| | | | | | | | |
| INVESTMENTS | | SHARES
(000) | | | VALUE
($000) | |
Common Stocks — continued | | | | | | | | |
|
IT Services — continued | |
| | |
Square, Inc., Class A * | | | 254 | | | | 14,219 | |
| | |
Visa, Inc., Class A | | | 1,391 | | | | 183,541 | |
| | |
Worldpay, Inc. * | | | 658 | | | | 50,314 | |
| | | | | | | | |
| | |
| | | | | | | 751,723 | |
| | | | | | | | |
|
Life Sciences Tools & Services — 1.2% | |
| | |
Illumina, Inc. * | | | 308 | | | | 92,259 | |
| | | | | | | | |
|
Machinery — 3.4% | |
| | |
Deere & Co. | | | 333 | | | | 49,599 | |
| | |
Nordson Corp. | | | 344 | | | | 41,092 | |
| | |
Oshkosh Corp. | | | 724 | | | | 44,376 | |
| | |
Parker-Hannifin Corp. | | | 456 | | | | 67,933 | |
| | |
Stanley Black & Decker, Inc. | | | 525 | | | | 62,840 | |
| | | | | | | | |
| | |
| | | | | | | 265,840 | |
| | | | | | | | |
|
Oil, Gas & Consumable Fuels — 1.5% | |
| | |
Concho Resources, Inc. * | | | 595 | | | | 61,170 | |
| | |
EOG Resources, Inc. | | | 679 | | | | 59,233 | |
| | | | | | | | |
| | |
| | | | | | | 120,403 | |
| | | | | | | | |
|
Pharmaceuticals — 1.9% | |
| | |
Catalent, Inc. * | | | 1,327 | | | | 41,370 | |
| | |
Jazz Pharmaceuticals plc * | | | 493 | | | | 61,050 | |
| | |
Revance Therapeutics, Inc. * (a) | | | 1,079 | | | | 21,712 | |
| | |
TherapeuticsMD, Inc. * | | | 5,626 | | | | 21,437 | |
| | | | | | | | |
| | |
| | | | | | | 145,569 | |
| | | | | | | | |
|
Real Estate Management & Development — 0.9% | |
| | |
CBRE Group, Inc., Class A * | | | 1,700 | | | | 68,056 | |
| | | | | | | | |
|
Road & Rail — 0.6% | |
| | |
Old Dominion Freight Line, Inc. (a) | | | 388 | | | | 47,920 | |
| | | | | | | | |
|
Semiconductors & Semiconductor Equipment — 2.5% | |
| | |
Applied Materials, Inc. | | | 1,811 | | | | 59,299 | |
| | |
NVIDIA Corp. | | | 609 | | | | 81,301 | |
| | |
Xilinx, Inc. | | | 607 | | | | 51,724 | |
| | | | | | | | |
| | |
| | | | | | | 192,324 | |
| | | | | | | | |
|
Software — 14.3% | |
| | |
Adobe, Inc. * | | | 329 | | | | 74,501 | |
| | |
DocuSign, Inc. * (a) | | | 758 | | | | 30,369 | |
| | |
Fair Isaac Corp. * | | | 270 | | | | 50,565 | |
| | |
Intuit, Inc. | | | 451 | | | | 88,779 | |
| | |
Microsoft Corp. | | | 4,550 | | | | 462,133 | |
| | |
Red Hat, Inc. * | | | 194 | | | | 34,109 | |
| | |
SailPoint Technologies Holding, Inc. * (a) | | | 1,746 | | | | 41,007 | |
| | |
salesforce.com, Inc. * | | | 1,101 | | | | 150,859 | |
| | |
ServiceNow, Inc. * | | | 605 | | | | 107,791 | |
| | | | | | | | |
| INVESTMENTS | | SHARES
(000) | | | VALUE
($000) | |
| | | | | | | | |
|
Software — continued | |
| | |
Splunk, Inc. * | | | 684 | | | | 71,749 | |
| | | | | | | | |
| | |
| | | | | | | 1,111,862 | |
| | | | | | | | |
|
Specialty Retail — 3.6% | |
| | |
O’Reilly Automotive, Inc. * | | | 233 | | | | 80,091 | |
| | |
Ross Stores, Inc. | | | 1,592 | | | | 132,479 | |
| | |
Tractor Supply Co. | | | 815 | | | | 67,962 | |
| | | | | | | | |
| | |
| | | | | | | 280,532 | |
| | | | | | | | |
|
Technology Hardware, Storage & Peripherals — 5.1% | |
| | |
Apple, Inc. | | | 2,492 | | | | 393,017 | |
| | | | | | | | |
|
Textiles, Apparel & Luxury Goods — 1.0% | |
| | |
Lululemon Athletica, Inc. * | | | 609 | | | | 74,012 | |
| | | | | | | | |
|
Trading Companies & Distributors — 0.7% | |
| | |
WW Grainger, Inc. (a) | | | 205 | | | | 57,911 | |
| | | | | | | | |
| |
Total Common Stocks
(Cost $5,371,661) | | | | 7,714,926 | |
| | | | | | | | |
Short-Term Investments — 0.9% | | | | | | | | |
| | |
Investment Companies — 0.9% | | | | | | | | |
| | |
JPMorgan U.S. Government Money
Market Fund Class Institutional
Shares, 2.40% (b) (c)
(Cost $67,534) | | | 67,534 | | | | 67,534 | |
| | | | | | | | |
|
Investment of Cash Collateral from Securities Loaned — 1.8% | |
| | |
JPMorgan Securities Lending Money Market Fund Class Agency SL Shares, 2.60% (b) (c) | | | 112,011 | | | | 112,000 | |
| | |
JPMorgan U.S. Government Money
Market Fund Class IM
Shares, 2.46% (b) (c) | | | 26,088 | | | | 26,088 | |
| | | | | | | | |
| | |
Total Investment of Cash Collateral from Securities Loaned
(Cost $138,088) | | | | | | | 138,088 | |
| | | | | | | | |
Total Investments — 101.9%
(Cost $5,577,283) | | | | 7,920,548 | |
Liabilities in Excess of
Other Assets — (1.9%) | | | | (150,936 | ) |
| | | | | | | | |
NET ASSETS — 100.0% | | | | | | | 7,769,612 | |
| | | | | | | | |
Percentages indicated are based on net assets.
| | |
| (a) | | The security or a portion of this security is on loan at December 31, 2018. The total value of securities on loan at December 31, 2018 is approximately $135,257,000. |
| (b) | | Investment in affiliate. Fund is registered under the Investment Company Act of 1940, as amended, and advised by J.P. Morgan Investment Management Inc. |
| (C) | | The rate shown is the current yield as of December 31, 2018. |
| * | | Non-income producing security. |
SEE NOTES TO FINANCIAL STATEMENTS.
| | | | | | |
| | | |
| 14 | | | | J.P. MORGAN MID CAP/MULTI-CAP FUNDS | | DECEMBER 31, 2018 |
JPMorgan Mid Cap Equity Fund
SCHEDULE OF PORTFOLIO INVESTMENTS
AS OF DECEMBER 31, 2018 (Unaudited)
| | | | | | | | |
| INVESTMENTS | | SHARES
(000) | | | VALUE
($000) | |
Common Stocks — 98.5% | | | | | | | | |
| | |
Aerospace & Defense — 0.8% | | | | | | | | |
| | |
Curtiss-Wright Corp. | | | 56 | | | | 5,678 | |
| | |
HEICO Corp., Class A | | | 213 | | | | 13,445 | |
| | | | | | | | |
| | |
| | | | | | | 19,123 | |
| | | | | | | | |
|
Auto Components — 0.9% | |
| | |
Aptiv plc | | | 209 | | | | 12,868 | |
| | |
BorgWarner, Inc. | | | 247 | | | | 8,579 | |
| | | | | | | | |
| | |
| | | | | | | 21,447 | |
| | | | | | | | |
|
Automobiles — 0.3% | |
| | |
Tesla, Inc. * (a) | | | 24 | | | | 7,887 | |
| | | | | | | | |
|
Banks — 4.8% | |
| | |
Citizens Financial Group, Inc. | | | 377 | | | | 11,197 | |
| | |
Comerica, Inc. | | | 82 | | | | 5,654 | |
| | |
East West Bancorp, Inc. | | | 260 | | | | 11,325 | |
| | |
Fifth Third Bancorp | | | 692 | | | | 16,272 | |
| | |
First Republic Bank | | | 226 | | | | 19,638 | |
| | |
Huntington Bancshares, Inc. | | | 754 | | | | 8,988 | |
| | |
M&T Bank Corp. | | | 149 | | | | 21,349 | |
| | |
SunTrust Banks, Inc. | | | 340 | | | | 17,128 | |
| | |
Zions Bancorp | | | 110 | | | | 4,494 | |
| | | | | | | | |
| | |
| | | | | | | 116,045 | |
| | | | | | | | |
|
Beverages — 0.8% | |
| | |
Constellation Brands, Inc., Class A | | | 59 | | | | 9,512 | |
| | |
Keurig Dr Pepper, Inc. | | | 194 | | | | 4,976 | |
| | |
Molson Coors Brewing Co., Class B | | | 98 | | | | 5,531 | |
| | | | | | | | |
| | |
| | | | | | | 20,019 | |
| | | | | | | | |
|
Biotechnology — 2.6% | |
| | |
Agios Pharmaceuticals, Inc. * (a) | | | 109 | | | | 5,040 | |
| | |
Alnylam Pharmaceuticals, Inc. * (a) | | | 48 | | | | 3,485 | |
| | |
BioMarin Pharmaceutical, Inc. * | | | 85 | | | | 7,263 | |
| | |
Exact Sciences Corp. * | | | 182 | | | | 11,465 | |
| | |
Exelixis, Inc. * | | | 569 | | | | 11,184 | |
| | |
Intercept Pharmaceuticals, Inc. * | | | 55 | | | | 5,533 | |
| | |
Moderna, Inc. * (a) | | | 217 | | | | 3,306 | |
| | |
Sage Therapeutics, Inc. * (a) | | | 55 | | | | 5,278 | |
| | |
Spark Therapeutics, Inc. * | | | 91 | | | | 3,570 | |
| | |
Vertex Pharmaceuticals, Inc. * | | | 46 | | | | 7,557 | |
| | | | | | | | |
| | |
| | | | | | | 63,681 | |
| | | | | | | | |
|
Building Products — 1.4% | |
| | |
Fortune Brands Home & Security, Inc. | | | 355 | | | | 13,469 | |
| | |
Lennox International, Inc. | | | 96 | | | | 20,954 | |
| | | | | | | | |
| | |
| | | | | | | 34,423 | |
| | | | | | | | |
| | | | | | | | |
| INVESTMENTS | | SHARES
(000) | | | VALUE
($000) | |
| | | | | | | | |
| | |
Capital Markets — 4.5% | | | | | | | | |
| | |
Ameriprise Financial, Inc. | | | 170 | | | | 17,770 | |
| | |
Invesco Ltd. | | | 334 | | | | 5,597 | |
| | |
Nasdaq, Inc. | | | 177 | | | | 14,430 | |
| | |
Northern Trust Corp. | | | 151 | | | | 12,644 | |
| | |
Raymond James Financial, Inc. | | | 148 | | | | 10,981 | |
| | |
S&P Global, Inc. | | | 112 | | | | 19,101 | |
| | |
T. Rowe Price Group, Inc. | | | 183 | | | | 16,924 | |
| | |
TD Ameritrade Holding Corp. | | | 237 | | | | 11,623 | |
| | | | | | | | |
| | |
| | | | | | | 109,070 | |
| | | | | | | | |
|
Chemicals — 0.5% | |
| | |
Sherwin-Williams Co. (The) | | | 28 | | | | 11,033 | |
| | | | | | | | |
|
Commercial Services & Supplies — 2.1% | |
| | |
Copart, Inc. * | | | 318 | | | | 15,194 | |
| | |
Waste Connections, Inc. | | | 464 | | | | 34,422 | |
| | | | | | | | |
| | |
| | | | | | | 49,616 | |
| | | | | | | | |
|
Communications Equipment — 1.6% | |
| | |
Arista Networks, Inc. * | | | 64 | | | | 13,440 | |
| | |
CommScope Holding Co., Inc. * | | | 291 | | | | 4,766 | |
| | |
Palo Alto Networks, Inc. * | | | 104 | | | | 19,581 | |
| | | | | | | | |
| | |
| | | | | | | 37,787 | |
| | | | | | | | |
|
Construction Materials — 1.1% | |
| | |
Martin Marietta Materials, Inc. | | | 49 | | | | 8,495 | |
| | |
Vulcan Materials Co. | | | 178 | | | | 17,557 | |
| | | | | | | | |
| | |
| | | | | | | 26,052 | |
| | | | | | | | |
|
Consumer Finance — 0.4% | |
| | |
Ally Financial, Inc. | | | 460 | | | | 10,426 | |
| | | | | | | | |
|
Containers & Packaging — 2.9% | |
| | |
Avery Dennison Corp. | | | 183 | | | | 16,457 | |
| | |
Ball Corp. | | | 694 | | | | 31,909 | |
| | |
Silgan Holdings, Inc. | | | 457 | | | | 10,798 | |
| | |
Westrock Co. | | | 255 | | | | 9,645 | |
| | | | | | | | |
| | |
| | | | | | | 68,809 | |
| | | | | | | | |
|
Distributors — 0.8% | |
| | |
Genuine Parts Co. | | | 92 | | | | 8,857 | |
| | |
LKQ Corp. * | | | 428 | | | | 10,161 | |
| | | | | | | | |
| | |
| | | | | | | 19,018 | |
| | | | | | | | |
|
Diversified Consumer Services — 0.6% | |
| | |
Bright Horizons Family Solutions, Inc. * | | | 124 | | | | 13,842 | |
| | | | | | | | |
|
Electric Utilities — 1.7% | |
| | |
Edison International | | | 89 | | | | 5,080 | |
| | |
Evergy, Inc. | | | 220 | | | | 12,478 | |
SEE NOTES TO FINANCIAL STATEMENTS.
| | | | | | | | |
| | | |
| DECEMBER 31, 2018 | | J.P. MORGAN MID CAP/MULTI-CAP FUNDS | | | | | 15 | |
JPMorgan Mid Cap Equity Fund
SCHEDULE OF PORTFOLIO INVESTMENTS
AS OF DECEMBER 31, 2018 (Unaudited) (continued)
| | | | | | | | |
| INVESTMENTS | | SHARES
(000) | | | VALUE
($000) | |
Common Stocks — continued | | | | | | | | |
|
Electric Utilities — continued | |
| | |
Xcel Energy, Inc. | | | 488 | | | | 24,029 | |
| | | | | | | | |
| | |
| | | | | | | 41,587 | |
| | | | | | | | |
|
Electrical Equipment — 1.3% | |
| | |
Acuity Brands, Inc. | | | 101 | | | | 11,633 | |
| | |
AMETEK, Inc. | | | 186 | | | | 12,580 | |
| | |
Hubbell, Inc. | | | 61 | | | | 6,056 | |
| | | | | | | | |
| | |
| | | | | | | 30,269 | |
| | | | | | | | |
|
Electronic Equipment, Instruments & Components — 4.0% | |
| | |
Amphenol Corp., Class A | | | 381 | | | | 30,893 | |
| | |
Arrow Electronics, Inc. * | | | 226 | | | | 15,562 | |
| | |
CDW Corp. | | | 168 | | | | 13,581 | |
| | |
Corning, Inc. | | | 440 | | | | 13,295 | |
| | |
Keysight Technologies, Inc. * | | | 184 | | | | 11,431 | |
| | |
Zebra Technologies Corp., Class A * | | | 73 | | | | 11,656 | |
| | | | | | | | |
| | |
| | | | | | | 96,418 | |
| | | | | | | | |
|
Entertainment — 1.2% | |
| | |
Electronic Arts, Inc. * | | | 85 | | | | 6,699 | |
| | |
Spotify Technology SA * | | | 85 | | | | 9,659 | |
| | |
Take-Two Interactive Software, Inc. * | | | 127 | | | | 13,022 | |
| | | | | | | | |
| | |
| | | | | | | 29,380 | |
| | | | | | | | |
|
Equity Real Estate Investment Trusts (REITs) — 5.5% | |
| | |
American Campus Communities, Inc. | | | 164 | | | | 6,789 | |
| | |
American Homes 4 Rent, Class A | | | 332 | | | | 6,596 | |
| | |
AvalonBay Communities, Inc. | | | 89 | | | | 15,527 | |
| | |
Boston Properties, Inc. | | | 122 | | | | 13,692 | |
| | |
Brixmor Property Group, Inc. | | | 594 | | | | 8,726 | |
| | |
Essex Property Trust, Inc. | | | 37 | | | | 9,105 | |
| | |
Federal Realty Investment Trust | | | 104 | | | | 12,244 | |
| | |
JBG SMITH Properties | | | 139 | | | | 4,851 | |
| | |
Kimco Realty Corp. | | | 486 | | | | 7,113 | |
| | |
Outfront Media, Inc. | | | 444 | | | | 8,054 | |
| | |
Rayonier, Inc. | | | 332 | | | | 9,185 | |
| | |
Regency Centers Corp. | | | 124 | | | | 7,299 | |
| | |
Vornado Realty Trust | | | 199 | | | | 12,355 | |
| | |
Weyerhaeuser Co. | | | 254 | | | | 5,542 | |
| | |
WP Carey, Inc. | | | 76 | | | | 4,993 | |
| | | | | | | | |
| | |
| | | | | | | 132,071 | |
| | | | | | | | |
|
Food & Staples Retailing — 0.4% | |
| | |
Kroger Co. (The) | | | 363 | | | | 9,992 | |
| | | | | | | | |
|
Food Products — 0.8% | |
| | |
Conagra Brands, Inc. | | | 437 | | | | 9,336 | |
| | |
Post Holdings, Inc. * | | | 118 | | | | 10,525 | |
| | | | | | | | |
| | |
| | | | | | | 19,861 | |
| | | | | | | | |
| | | | | | | | |
| INVESTMENTS | | SHARES
(000) | | | VALUE
($000) | |
| | | | | | | | |
| | |
Gas Utilities — 0.5% | | | | | | | | |
| | |
National Fuel Gas Co. | | | 249 | | | | 12,737 | |
| | | | | | | | |
|
Health Care Equipment & Supplies — 2.7% | |
| | |
DexCom, Inc. * | | | 143 | | | | 17,107 | |
| | |
Edwards Lifesciences Corp. * | | | 63 | | | | 9,704 | |
| | |
Insulet Corp. * (a) | | | 111 | | | | 8,820 | |
| | |
ResMed, Inc. | | | 142 | | | | 16,158 | |
| | |
Zimmer Biomet Holdings, Inc. | | | 140 | | | | 14,516 | |
| | | | | | | | |
| | |
| | | | | | | 66,305 | |
| | | | | | | | |
| | |
Health Care Providers & Services —4.6% | | | | | | | | |
| | |
Acadia Healthcare Co., Inc. * (a) | | | 203 | | | | 5,219 | |
| | |
AmerisourceBergen Corp. | | | 269 | | | | 19,995 | |
| | |
Centene Corp. * | | | 136 | | | | 15,659 | |
| | |
Cigna Corp. | | | 82 | | | | 15,612 | |
| | |
Henry Schein, Inc. * | | | 107 | | | | 8,365 | |
| | |
Humana, Inc. | | | 25 | | | | 7,282 | |
| | |
Laboratory Corp. of America Holdings * | | | 90 | | | | 11,409 | |
| | |
Universal Health Services, Inc., Class B | | | 106 | | | | 12,301 | |
| | |
WellCare Health Plans, Inc. * | | | 67 | | | | 15,700 | |
| | | | | | | | |
| | |
| | | | | | | 111,542 | |
| | | | | | | | |
| | |
Health Care Technology — 1.0% | | | | | | | | |
| | |
Teladoc Health, Inc. * (a) | | | 194 | | | | 9,607 | |
| | |
Veeva Systems, Inc., Class A * | | | 167 | | | | 14,943 | |
| | | | | | | | |
| | |
| | | | | | | 24,550 | |
| | | | | | | | |
| | |
Hotels, Restaurants & Leisure — 2.1% | | | | | | | | |
| | |
Hilton Worldwide Holdings, Inc. | | | 467 | | | | 33,516 | |
| | |
Red Rock Resorts, Inc., Class A (a) | | | 358 | | | | 7,277 | |
| | |
Vail Resorts, Inc. | | | 41 | | | | 8,728 | |
| | | | | | | | |
| | |
| | | | | | | 49,521 | |
| | | | | | | | |
| | |
Household Durables — 0.8% | | | | | | | | |
| | |
Mohawk Industries, Inc. * | | | 110 | | | | 12,844 | |
| | |
Newell Brands, Inc. | | | 397 | | | | 7,371 | |
| | | | | | | | |
| | |
| | | | | | | 20,215 | |
| | | | | | | | |
| | |
Household Products — 0.3% | | | | | | | | |
| | |
Energizer Holdings, Inc. | | | 145 | | | | 6,539 | |
| | | | | | | | |
|
Industrial Conglomerates — 0.4% | |
| | |
Carlisle Cos., Inc. | | | 92 | | | | 9,256 | |
| | | | | | | | |
| | |
Insurance — 4.5% | | | | | | | | |
| | |
Alleghany Corp. | | | 13 | | | | 8,318 | |
| | |
Hartford Financial Services Group, Inc. (The) | | | 371 | | | | 16,480 | |
| | |
Lincoln National Corp. | | | 142 | | | | 7,261 | |
| | |
Loews Corp. | | | 503 | | | | 22,891 | |
| | |
Marsh & McLennan Cos., Inc. | | | 145 | | | | 11,549 | |
SEE NOTES TO FINANCIAL STATEMENTS.
| | | | | | |
| | | |
| 16 | | | | J.P. MORGAN MID CAP/MULTI-CAP FUNDS | | DECEMBER 31, 2018 |
| | | | | | | | |
| INVESTMENTS | | SHARES
(000) | | | VALUE
($000) | |
Common Stocks — continued | | | | | | | | |
| | |
Insurance — continued | | | | | | | | |
| | |
Principal Financial Group, Inc. | | | 136 | | | | 5,994 | |
| | |
Progressive Corp. (The) | | | 396 | | | | 23,909 | |
| | |
Unum Group | | | 166 | | | | 4,888 | |
| | |
WR Berkley Corp. | | | 103 | | | | 7,579 | |
| | | | | | | | |
| | |
| | | | | | | 108,869 | |
| | | | | | | | |
| | |
Interactive Media & Services — 0.3% | | | | | | | | |
| | |
Match Group, Inc. | | | 173 | | | | 7,414 | |
| | | | | | | | |
|
Internet & Direct Marketing Retail — 1.3% | |
| | |
Expedia Group, Inc. | | | 148 | | | | 16,723 | |
| | |
GrubHub, Inc. * (a) | | | 99 | | | | 7,604 | |
| | |
Wayfair, Inc., Class A * (a) | | | 82 | | | | 7,342 | |
| | | | | | | | |
| | |
| | | | | | | 31,669 | |
| | | | | | | | |
| | |
IT Services — 5.3% | | | | | | | | |
| | |
Booz Allen Hamilton Holding Corp. | | | 292 | | | | 13,178 | |
| | |
Fiserv, Inc. * | | | 263 | | | | 19,357 | |
| | |
Gartner, Inc. * | | | 74 | | | | 9,447 | |
| | |
Global Payments, Inc. | | | 236 | | | | 24,349 | |
| | |
GoDaddy, Inc., Class A * | | | 294 | | | | 19,305 | |
| | |
Jack Henry & Associates, Inc. | | | 94 | | | | 11,931 | |
| | |
Okta, Inc. * (a) | | | 101 | | | | 6,444 | |
| | |
Shopify, Inc., Class A (Canada) * | | | 45 | | | | 6,286 | |
| | |
Square, Inc., Class A * | | | 166 | | | | 9,300 | |
| | |
Worldpay, Inc. * | | | 117 | | | | 8,950 | |
| | | | | | | | |
| | |
| | | | | | | 128,547 | |
| | | | | | | | |
| | |
Life Sciences Tools & Services — 0.4% | | | | | | | | |
| | |
Illumina, Inc. * | | | 35 | | | | 10,432 | |
| | | | | | | | |
|
Machinery — 3.5% | |
| | |
Fortive Corp.(a) | | | 177 | | | | 11,969 | |
| | |
IDEX Corp. | | | 88 | | | | 11,062 | |
| | |
Middleby Corp. (The) * | | | 82 | | | | 8,456 | |
| | |
Nordson Corp. | | | 84 | | | | 10,073 | |
| | |
Oshkosh Corp. | | | 117 | | | | 7,167 | |
| | |
Parker-Hannifin Corp. | | | 79 | | | | 11,752 | |
| | |
Snap-on, Inc. | | | 101 | | | | 14,650 | |
| | |
Stanley Black & Decker, Inc. | | | 85 | | | | 10,202 | |
| | | | | | | | |
| | |
| | | | | | | 85,331 | |
| | | | | | | | |
| | |
Media — 0.5% | | | | | | | | |
| | |
CBS Corp. (Non-Voting), Class B | | | 161 | | | | 7,024 | |
| | |
DISH Network Corp., Class A * | | | 245 | | | | 6,121 | |
| | | | | | | | |
| | |
| | | | | | | 13,145 | |
| | | | | | | | |
| | |
Multiline Retail — 0.9% | | | | | | | | |
| | |
Kohl’s Corp. | | | 224 | | | | 14,852 | |
| | | | | | | | |
| INVESTMENTS | | SHARES
(000) | | | VALUE
($000) | |
| | | | | | | | |
| | |
Multiline Retail — continued | | | | | | | | |
| | |
Nordstrom, Inc. | | | 171 | | | | 7,989 | |
| | | | | | | | |
| | |
| | | | | | | 22,841 | |
| | | | | | | | |
| | |
Multi-Utilities — 2.7% | | | | | | | | |
| | |
CMS Energy Corp. | | | 509 | | | | 25,285 | |
| | |
Sempra Energy | | | 142 | | | | 15,362 | |
| | |
WEC Energy Group, Inc. | | | 350 | | | | 24,270 | |
| | | | | | | | |
| | |
| | | | | | | 64,917 | |
| | | | | | | | |
| | |
Oil, Gas & Consumable Fuels — 3.6% | | | | | | | | |
| | |
Cabot Oil & Gas Corp. | | | 298 | | | | 6,661 | |
| | |
Concho Resources, Inc. * | | | 134 | | | | 13,784 | |
| | |
Diamondback Energy, Inc. | | | 249 | | | | 23,103 | |
| | |
EQT Corp. | | | 419 | | | | 7,906 | |
| | |
Equitrans Midstream Corp. * | | | 386 | | | | 7,719 | |
| | |
PBF Energy, Inc., Class A | | | 223 | | | | 7,294 | |
| | |
Williams Cos., Inc. (The) | | | 915 | | | | 20,173 | |
| | | | | | | | |
| | |
| | | | | | | 86,640 | |
| | | | | | | | |
| | |
Personal Products — 0.4% | | | | | | | | |
| | |
Coty, Inc., Class A | | | 655 | | | | 4,299 | |
| | |
Edgewell Personal Care Co. * | | | 160 | | | | 5,977 | |
| | | | | | | | |
| | |
| | | | | | | 10,276 | |
| | | | | | | | |
| | |
Pharmaceuticals — 1.1% | | | | | | | | |
| | |
Catalent, Inc. * | | | 250 | | | | 7,807 | |
| | |
Elanco Animal Health, Inc. * (a) | | | 132 | | | | 4,159 | |
| | |
Jazz Pharmaceuticals plc * | | | 125 | | | | 15,520 | |
| | | | | | | | |
| | |
| | | | | | | 27,486 | |
| | | | | | | | |
| | |
Professional Services — 0.7% | | | | | | | | |
| | |
Verisk Analytics, Inc. * | | | 145 | | | | 15,811 | |
| | | | | | | | |
|
Real Estate Management & Development — 1.2% | |
| | |
CBRE Group, Inc., Class A * | | | 646 | | | | 25,882 | |
| | |
Cushman & Wakefield plc * | | | 222 | | | | 3,217 | |
| | | | | | | | |
| | |
| | | | | | | 29,099 | |
| | | | | | | | |
| | |
Road & Rail — 0.5% | | | | | | | | |
| | |
Old Dominion Freight Line, Inc. | | | 89 | | | | 10,929 | |
| | | | | | | | |
|
Semiconductors & Semiconductor Equipment — 3.0% | |
| | |
Advanced Micro Devices, Inc. * | | | 445 | | | | 8,215 | |
| | |
Analog Devices, Inc. | | | 155 | | | | 13,271 | |
| | |
Lam Research Corp. | | | 104 | | | | 14,161 | |
| | |
Marvell Technology Group Ltd. | | | 587 | | | | 9,509 | |
| | |
Microchip Technology, Inc. (a) | | | 150 | | | | 10,817 | |
| | |
Xilinx, Inc. | | | 196 | | | | 16,651 | |
| | | | | | | | |
| | |
| | | | | | | 72,624 | |
| | | | | | | | |
SEE NOTES TO FINANCIAL STATEMENTS.
| | | | | | | | |
| | | |
| DECEMBER 31, 2018 | | J.P. MORGAN MID CAP/MULTI-CAP FUNDS | | | | | 17 | |
JPMorgan Mid Cap Equity Fund
SCHEDULE OF PORTFOLIO INVESTMENTS
AS OF DECEMBER 31, 2018 (Unaudited) (continued)
| | | | | | | | |
| INVESTMENTS | | SHARES
(000) | | | VALUE
($000) | |
Common Stocks — continued | | | | | | | | |
| | |
Software — 6.7% | | | | | | | | |
| | |
Autodesk, Inc. * (a) | | | 148 | | | | 19,073 | |
| | |
DocuSign, Inc. * | | | 125 | | | | 5,010 | |
| | |
Fair Isaac Corp. * | | | 52 | | | | 9,687 | |
| | |
Intuit, Inc. | | | 49 | | | | 9,547 | |
| | |
Paycom Software, Inc. * | | | 93 | | | | 11,327 | |
| | |
Proofpoint, Inc. * | | | 118 | | | | 9,881 | |
| | |
Red Hat, Inc. * | | | 115 | | | | 20,163 | |
| | |
ServiceNow, Inc. * | | | 167 | | | | 29,752 | |
| | |
Splunk, Inc. * | | | 160 | | | | 16,765 | |
| | |
Synopsys, Inc. * | | | 236 | | | | 19,862 | |
| | |
Tyler Technologies, Inc. * | | | 56 | | | | 10,332 | |
| | | | | | | | |
| | |
| | | | | | | 161,399 | |
| | | | | | | | |
| | |
Specialty Retail — 6.0% | | | | | | | | |
| | |
AutoZone, Inc. * | | | 21 | | | | 17,631 | |
| | |
Best Buy Co., Inc. | | | 184 | | | | 9,748 | |
| | |
Gap, Inc. (The) | | | 422 | | | | 10,875 | |
| | |
National Vision Holdings, Inc. * | | | 130 | | | | 3,673 | |
| | |
O’Reilly Automotive, Inc. * | | | 96 | | | | 32,884 | |
| | |
Ross Stores, Inc. | | | 399 | | | | 33,205 | |
| | |
Tiffany & Co. | | | 132 | | | | 10,591 | |
| | |
Tractor Supply Co. | | | 211 | | | | 17,614 | |
| | |
Ulta Beauty, Inc. * | | | 35 | | | | 8,496 | |
| | | | | | | | |
| | |
| | | | | | | 144,717 | |
| | | | | | | | |
| | |
Textiles, Apparel & Luxury Goods — 1.5% | | | | | | | | |
| | |
Lululemon Athletica, Inc. * | | | 132 | | | | 16,004 | |
| | |
PVH Corp. | | | 113 | | | | 10,491 | |
| | |
Ralph Lauren Corp. | | | 92 | | | | 9,538 | |
| | | | | | | | |
| | |
| | | | | | | 36,033 | |
| | | | | | | | |
| |
Trading Companies & Distributors — 1.0% | | | | | |
| | |
MSC Industrial Direct Co., Inc., Class A | | | 139 | | | | 10,676 | |
| | |
WW Grainger, Inc. | | | 48 | | | | 13,665 | |
| | | | | | | | |
| | |
| | | | | | | 24,341 | |
| | | | | | | | |
| | |
Total Common Stocks
(Cost $1,876,921) | | | | | | | 2,381,041 | |
| | | | | | | | |
| | | | | | | | |
| INVESTMENTS | | SHARES
(000) | | | VALUE
($000) | |
Short-Term Investments — 1.6% | | | | | | | | |
| | |
Investment Companies — 1.6% | | | | | | | | |
| | |
JPMorgan U.S. Government Money Market Fund Class Institutional Shares, 2.40% (b) (c)
(Cost $39,324) | | | 39,324 | | | | 39,324 | |
| | | | | | | | |
Investment of Cash Collateral from Securities Loaned — 2.0% | |
| | |
JPMorgan Securities Lending Money Market Fund Class Agency SL Shares, 2.60% (b) (c) | | | 40,004 | | | | 40,000 | |
| | |
JPMorgan U.S. Government Money Market Fund Class IM Shares,
2.46% (b) (c) | | | 7,708 | | | | 7,708 | |
| | | | | | | | |
| | |
Total Investment of Cash Collateral from Securities Loaned
(Cost $47,708) | | | | | | | 47,708 | |
| | | | | | | | |
Total Investments — 102.1%
(Cost $1,963,953) | | | | 2,468,073 | |
Liabilities in Excess of
Other Assets — (2.1%) | | | | (50,599 | ) |
| | | | | | | | |
NET ASSETS — 100.0% | | | | 2,417,474 | |
| | | | | | | | |
Percentages indicated are based on net assets.
| | |
| (a) | | The security or a portion of this security is on loan at December 31, 2018. The total value of securities on loan at December 31, 2018 is approximately $47,406,000. |
| (b) | | Investment in affiliate. Fund is registered under the Investment Company Act of 1940, as amended, and advised by J.P. Morgan Investment Management Inc. |
| (c) | | The rate shown is the current yield as of December 31, 2018. |
| * | | Non-income producing security. |
SEE NOTES TO FINANCIAL STATEMENTS.
| | | | | | |
| | | |
| 18 | | | | J.P. MORGAN MID CAP/MULTI-CAP FUNDS | | DECEMBER 31, 2018 |
JPMorgan Mid Cap Growth Fund
SCHEDULE OF PORTFOLIO INVESTMENTS
AS OF DECEMBER 31, 2018 (Unaudited)
| | | | | | | | |
| INVESTMENTS | | SHARES
(000) | | | VALUE
($000) | |
| | | | | | | | |
Common Stocks — 100.3% | | | | | | | | |
| | |
Aerospace & Defense — 1.6% | | | | | | | | |
| | |
Curtiss-Wright Corp. | | | 164 | | | | 16,717 | |
| | |
HEICO Corp., Class A | | | 629 | | | | 39,623 | |
| | | | | | | | |
| | |
| | | | | | | 56,340 | |
| | | | | | | | |
|
Auto Components — 1.1% | |
| | |
Aptiv plc | | | 616 | | | | 37,921 | |
| | | | | | | | |
|
Automobiles — 0.7% | |
| | |
Tesla, Inc. * (a) | | | 69 | | | | 23,096 | |
| | | | | | | | |
|
Banks — 1.6% | |
| | |
East West Bancorp, Inc. | | | 766 | | | | 33,364 | |
| | |
First Republic Bank | | | 285 | | | | 24,775 | |
| | | | | | | | |
| | |
| | | | | | | 58,139 | |
| | | | | | | | |
|
Biotechnology — 5.3% | |
| | |
Agios Pharmaceuticals, Inc. * (a) | | | 321 | | | | 14,806 | |
| | |
Alnylam Pharmaceuticals, Inc. * (a) | | | 141 | | | | 10,273 | |
| | |
BioMarin Pharmaceutical, Inc. * | | | 251 | | | | 21,398 | |
| | |
Exact Sciences Corp. * | | | 536 | | | | 33,790 | |
| | |
Exelixis, Inc. * | | | 1,675 | | | | 32,955 | |
| | |
Intercept Pharmaceuticals, Inc. * | | | 162 | | | | 16,295 | |
| | |
Moderna, Inc. * (a) | | | 636 | | | | 9,712 | |
| | |
Sage Therapeutics, Inc. * | | | 162 | | | | 15,547 | |
| | |
Spark Therapeutics, Inc. * | | | 269 | | | | 10,521 | |
| | |
Vertex Pharmaceuticals, Inc. * | | | 134 | | | | 22,270 | |
| | | | | | | | |
| | |
| | | | | | | 187,567 | |
| | | | | | | | |
|
Building Products — 2.3% | |
| | |
Fortune Brands Home & Security, Inc. | | | 489 | | | | 18,592 | |
| | |
Lennox International, Inc. | | | 283 | | | | 61,857 | |
| | | | | | | | |
| | |
| | | | | | | 80,449 | |
| | | | | | | | |
|
Capital Markets — 4.3% | |
| | |
Ameriprise Financial, Inc. | | | 188 | | | | 19,590 | |
| | |
Nasdaq, Inc. | | | 521 | | | | 42,515 | |
| | |
S&P Global, Inc. | | | 330 | | | | 56,136 | |
| | |
TD Ameritrade Holding Corp. | | | 700 | | | | 34,254 | |
| | | | | | | | |
| | |
| | | | | | | 152,495 | |
| | | | | | | | |
|
Commercial Services & Supplies — 4.1% | |
| | |
Copart, Inc. * | | | 937 | | | | 44,770 | |
| | |
Waste Connections, Inc. (a) | | | 1,361 | | | | 101,083 | |
| | | | | | | | |
| | |
| | | | | | | 145,853 | |
| | | | | | | | |
|
Communications Equipment — 2.8% | |
| | |
Arista Networks, Inc. * | | | 188 | | | | 39,510 | |
| | |
Palo Alto Networks, Inc. * | | | 306 | | | | 57,695 | |
| | | | | | | | |
| | |
| | | | | | | 97,205 | |
| | | | | | | | |
| | | | | | | | |
| INVESTMENTS | | SHARES
(000) | | | VALUE
($000) | |
| | | | | | | | |
| | | | | | | | |
| | |
Construction Materials — 1.5% | | | | | | | | |
| | |
Vulcan Materials Co. | | | 523 | | | | 51,718 | |
| | | | | | | | |
|
Containers & Packaging — 2.3% | |
| | |
Avery Dennison Corp. | | | 540 | | | | 48,490 | |
| | |
Ball Corp. | | | 691 | | | | 31,782 | |
| | | | | | | | |
| | |
| | | | | | | 80,272 | |
| | | | | | | | |
|
Distributors — 0.8% | |
| | |
LKQ Corp. * | | | 1,262 | | | | 29,940 | |
| | | | | | | | |
|
Diversified Consumer Services — 1.2% | |
| | |
Bright Horizons Family Solutions, Inc. * | | | 366 | | | | 40,780 | |
| | | | | | | | |
|
Electronic Equipment, Instruments & Components — 3.6% | |
| | |
Amphenol Corp., Class A | | | 675 | | | | 54,692 | |
| | |
Corning, Inc. | | | 1,297 | | | | 39,173 | |
| | |
Zebra Technologies Corp., Class A * | | | 216 | | | | 34,362 | |
| | | | | | | | |
| | |
| | | | | | | 128,227 | |
| | | | | | | | |
|
Entertainment — 2.5% | |
| | |
Electronic Arts, Inc. * | | | 250 | | | | 19,736 | |
| | |
Spotify Technology SA * | | | 251 | | | | 28,466 | |
| | |
Take-Two Interactive Software, Inc. * | | | 373 | | | | 38,365 | |
| | | | | | | | |
| | |
| | | | | | | 86,567 | |
| | | | | | | | |
|
Health Care Equipment & Supplies — 4.3% | |
| | |
DexCom, Inc. * | | | 421 | | | | 50,400 | |
| | |
Edwards Lifesciences Corp. * | | | 186 | | | | 28,504 | |
| | |
Insulet Corp. * (a) | | | 327 | | | | 25,914 | |
| | |
ResMed, Inc. | | | 418 | | | | 47,609 | |
| | | | | | | | |
| | |
| | | | | | | 152,427 | |
| | | | | | | | |
|
Health Care Providers & Services — 3.6% | |
| | |
Acadia Healthcare Co., Inc. * (a) | | | 596 | | | | 15,329 | |
| | |
AmerisourceBergen Corp. | | | 262 | | | | 19,500 | |
| | |
Centene Corp. * | | | 399 | | | | 45,993 | |
| | |
WellCare Health Plans, Inc. * | | | 195 | | | | 46,132 | |
| | | | | | | | |
| | |
| | | | | | | 126,954 | |
| | | | | | | | |
|
Health Care Technology — 2.1% | |
| | |
Teladoc Health, Inc. * (a) | | | 571 | | | | 28,299 | |
| | |
Veeva Systems, Inc., Class A * | | | 493 | | | | 44,040 | |
| | | | | | | | |
| | |
| | | | | | | 72,339 | |
| | | | | | | | |
|
Hotels, Restaurants & Leisure — 2.8% | |
| | |
Hilton Worldwide Holdings, Inc. | | | 728 | | | | 52,259 | |
| | |
Red Rock Resorts, Inc., Class A (a) | | | 1,053 | | | | 21,393 | |
| | |
Vail Resorts, Inc. | | | 122 | | | | 25,657 | |
| | | | | | | | |
| | |
| | | | | | | 99,309 | |
| | | | | | | | |
SEE NOTES TO FINANCIAL STATEMENTS.
| | | | | | | | |
| | | |
| DECEMBER 31, 2018 | | J.P. MORGAN MID CAP/MULTI-CAP FUNDS | | | | | 19 | |
JPMorgan Mid Cap Growth Fund
SCHEDULE OF PORTFOLIO INVESTMENTS
AS OF DECEMBER 31, 2018 (Unaudited) (continued)
| | | | | | | | |
| INVESTMENTS | | SHARES
(000) | | | VALUE
($000) | |
| | | | | | | | |
Common Stocks — continued | | | | | | | | |
| | |
Insurance — 1.0% | | | | | | | | |
| | |
Progressive Corp. (The) | | | 599 | | | | 36,113 | |
| | | | | | | | |
|
Internet & Direct Marketing Retail — 1.2% | |
| | |
GrubHub, Inc. * (a) | | | 292 | | | | 22,406 | |
| | |
Wayfair, Inc., Class A * (a) | | | 240 | | | | 21,630 | |
| | | | | | | | |
| | |
| | | | | | | 44,036 | |
| | | | | | | | |
|
IT Services — 9.7% | |
| | |
Booz Allen Hamilton Holding Corp. | | | 859 | | | | 38,706 | |
| | |
Fiserv, Inc. * (a) | | | 776 | | | | 57,043 | |
| | |
Gartner, Inc. * | | | 217 | | | | 27,713 | |
| | |
Global Payments, Inc. | | | 696 | | | | 71,748 | |
| | |
GoDaddy, Inc., Class A * | | | 867 | | | | 56,892 | |
| | |
Okta, Inc. * | | | 297 | | | | 18,936 | |
| | |
Shopify, Inc., Class A (Canada) * | | | 133 | | | | 18,469 | |
| | |
Square, Inc., Class A * | | | 489 | | | | 27,406 | |
| | |
Worldpay, Inc. * | | | 344 | | | | 26,272 | |
| | | | | | | | |
| | |
| | | | | | | 343,185 | |
| | | | | | | | |
|
Life Sciences Tools & Services — 0.9% | |
| | |
Illumina, Inc. * | | | 103 | | | | 30,766 | |
| | | | | | | | |
|
Machinery — 4.3% | |
| | |
Fortive Corp. (a) | | | 520 | | | | 35,156 | |
| | |
Nordson Corp. | | | 249 | | | | 29,683 | |
| | |
Oshkosh Corp. | | | 343 | | | | 21,029 | |
| | |
Parker-Hannifin Corp. | | | 232 | | | | 34,630 | |
| | |
Stanley Black & Decker, Inc. | | | 251 | | | | 30,067 | |
| | | | | | | | |
| | |
| | | | | | | 150,565 | |
| | | | | | | | |
|
Oil, Gas & Consumable Fuels — 1.2% | |
| | |
Concho Resources, Inc. * | | | 395 | | | | 40,604 | |
| | | | | | | | |
|
Pharmaceuticals — 2.3% | |
| | |
Catalent, Inc. * | | | 738 | | | | 23,005 | |
| | |
Elanco Animal Health, Inc. * (a) | | | 389 | | | | 12,249 | |
| | |
Jazz Pharmaceuticals plc * (a) | | | 368 | | | | 45,576 | |
| | | | | | | | |
| | |
| | | | | | | 80,830 | |
| | | | | | | | |
|
Professional Services — 1.3% | |
| | |
Verisk Analytics, Inc. * | | | 427 | | | | 46,593 | |
| | | | | | | | |
|
Real Estate Management & Development — 1.1% | |
| | |
CBRE Group, Inc., Class A * | | | 961 | | | | 38,480 | |
| | | | | | | | |
|
Road & Rail — 0.9% | |
| | |
Old Dominion Freight Line, Inc. | | | 261 | | | | 32,194 | |
| | | | | | | | |
|
Semiconductors & Semiconductor Equipment — 5.0% | |
| | |
Advanced Micro Devices, Inc. * | | | 1,311 | | | | 24,207 | |
| | |
Lam Research Corp. | | | 306 | | | | 41,639 | |
| | | | | | | | |
| INVESTMENTS | | SHARES
(000) | | | VALUE
($000) | |
| | | | | | | | |
| | | | | | | | |
|
Semiconductors & Semiconductor Equipment — continued | |
| | |
Marvell Technology Group Ltd. | | | 1,727 | | | | 27,954 | |
| | |
Microchip Technology, Inc. (a) | | | 443 | | | | 31,875 | |
| | |
Xilinx, Inc. | | | 574 | | | | 48,913 | |
| | | | | | | | |
| | |
| | | | | | | 174,588 | |
| | | | | | | | |
|
Software — 12.5% | |
| | |
Autodesk, Inc. * | | | 437 | | | | 56,203 | |
| | |
DocuSign, Inc. * (a) | | | 368 | | | | 14,765 | |
| | |
Fair Isaac Corp. * | | | 153 | | | | 28,555 | |
| | |
Intuit, Inc. | | | 143 | | | | 28,071 | |
| | |
Paycom Software, Inc. * (a) | | | 273 | | | | 33,392 | |
| | |
Proofpoint, Inc. * | | | 347 | | | | 29,116 | |
| | |
Red Hat, Inc. * | | | 337 | | | | 59,243 | |
| | |
ServiceNow, Inc. * | | | 492 | | | | 87,685 | |
| | |
Splunk, Inc. * (a) | | | 471 | | | | 49,388 | |
| | |
Synopsys, Inc. * | | | 274 | | | | 23,090 | |
| | |
Tyler Technologies, Inc. * | | | 164 | | | | 30,419 | |
| | | | | | | | |
| | |
| | | | | | | 439,927 | |
| | | | | | | | |
|
Specialty Retail — 8.0% | |
| | |
National Vision Holdings, Inc. * | | | 383 | | | | 10,789 | |
| | |
O’Reilly Automotive, Inc. * | | | 281 | | | | 96,848 | |
| | |
Ross Stores, Inc. | | | 1,176 | | | | 97,850 | |
| | |
Tractor Supply Co. | | | 622 | | | | 51,908 | |
| | |
Ulta Beauty, Inc. * | | | 102 | | | | 24,965 | |
| | | | | | | | |
| | |
| | | | | | | 282,360 | |
| | | | | | | | |
| | |
Textiles, Apparel & Luxury Goods — 1.3% | | | | | | | | |
| | |
Lululemon Athletica, Inc. * | | | 387 | | | | 47,051 | |
| | | | | | | | |
|
Trading Companies & Distributors — 1.1% | |
| | |
WW Grainger, Inc. (a) | | | 142 | | | | 40,123 | |
| | | | | | | | |
| |
Total Common Stocks
(Cost $2,992,453) | | | | 3,535,013 | |
| | | | | | | | |
Short-Term Investments — 0.4% | | | | | | | | |
| | |
Investment Companies — 0.4% | | | | | | | | |
| | |
JPMorgan U.S. Government Money Market Fund Class Institutional Shares, 2.40% (b) (c)
(Cost $15,690) | | | 15,690 | | | | 15,690 | |
| | | | | | | | |
SEE NOTES TO FINANCIAL STATEMENTS.
| | | | | | |
| | | |
| 20 | | | | J.P. MORGAN MID CAP/MULTI-CAP FUNDS | | DECEMBER 31, 2018 |
| | | | | | | | |
| INVESTMENTS | | SHARES
(000) | | | VALUE
($000) | |
Investment of Cash Collateral from Securities Loaned — 3.8% | |
| | |
JPMorgan Securities Lending Money Market Fund Class Agency SL Shares, 2.60% (b) (c) | | | 114,011 | | | | 114,000 | |
| | |
JPMorgan U.S. Government Money Market Fund Class IM Shares, 2.46% (b) (c) | | | 19,998 | | | | 19,998 | |
| | | | | | | | |
| | |
Total Investment of Cash Collateral from Securities Loaned
(Cost $133,998) | | | | | | | 133,998 | |
| | | | | | | | |
Total Investments — 104.5%
(Cost $3,142,141) | | | | 3,684,701 | |
Liabilities in Excess of
Other Assets — (4.5%) | | | | (158,039 | ) |
| | | | | | | | |
NET ASSETS — 100.0% | | | | 3,526,662 | |
| | | | | | | | |
Percentages indicated are based on net assets.
| | |
| (a) | | The security or a portion of this security is on loan at December 31, 2018. The total value of securities on loan at December 31, 2018 is approximately $132,610,000. |
| (b) | | Investment in affiliate. Fund is registered under the Investment Company Act of 1940, as amended, and advised by J.P. Morgan Investment Management Inc. |
| (c) | | The rate shown is the current yield as of December 31, 2018. |
| * | | Non-income producing security. |
SEE NOTES TO FINANCIAL STATEMENTS.
| | | | | | | | |
| | | |
| DECEMBER 31, 2018 | | J.P. MORGAN MID CAP/MULTI-CAP FUNDS | | | | | 21 | |
JPMorgan Mid Cap Value Fund
SCHEDULE OF PORTFOLIO INVESTMENTS
AS OF DECEMBER 31, 2018 (Unaudited)
| | | | | | | | |
| INVESTMENTS | | SHARES
(000) | | | VALUE
($000) | |
Common Stocks — 99.6% | |
| | |
Auto Components — 0.7% | | | | | | | | |
| | |
BorgWarner, Inc. | | | 3,136 | | | | 108,947 | |
| | | | | | | | |
|
Banks — 8.1% | |
| | |
Citizens Financial Group, Inc. | | | 4,781 | | | | 142,140 | |
| | |
Comerica, Inc. | | | 1,046 | | | | 71,864 | |
| | |
Fifth Third Bancorp | | | 8,775 | | | | 206,487 | |
| | |
First Republic Bank | | | 1,640 | | | | 142,518 | |
| | |
Huntington Bancshares, Inc. (a) | | | 9,575 | | | | 114,134 | |
| | |
M&T Bank Corp. | | | 1,892 | | | | 270,853 | |
| | |
SunTrust Banks, Inc. | | | 4,309 | | | | 217,336 | |
| | |
Zions Bancorp | | | 1,403 | | | | 57,152 | |
| | | | | | | | |
| | |
| | | | | | | 1,222,484 | |
| | | | | | | | |
|
Beverages — 1.6% | |
| | |
Constellation Brands, Inc., Class A | | | 751 | | | | 120,774 | |
| | |
Keurig Dr Pepper, Inc. | | | 2,467 | | | | 63,261 | |
| | |
Molson Coors Brewing Co., Class B | | | 1,099 | | | | 61,697 | |
| | | | | | | | |
| | |
| | | | | | | 245,732 | |
| | | | | | | | |
|
Building Products — 0.6% | |
| | |
Fortune Brands Home & Security, Inc. | | | 2,394 | | | | 90,962 | |
| | | | | | | | |
|
Capital Markets — 4.9% | |
| | |
Ameriprise Financial, Inc. | | | 1,353 | | | | 141,182 | |
| | |
Invesco Ltd. | | | 4,250 | | | | 71,143 | |
| | |
Northern Trust Corp. | | | 1,920 | | | | 160,485 | |
| | |
Raymond James Financial, Inc. | | | 1,873 | | | | 139,405 | |
| | |
T. Rowe Price Group, Inc. | | | 2,393 | | | | 220,951 | |
| | | | | | | | |
| | |
| | | | | | | 733,166 | |
| | | | | | | | |
|
Chemicals — 0.9% | |
| | |
Sherwin-Williams Co. (The) | | | 356 | | | | 140,055 | |
| | | | | | | | |
|
Communications Equipment — 0.4% | |
| | |
CommScope Holding Co., Inc. * | | | 3,714 | | | | 60,865 | |
| | | | | | | | |
|
Construction Materials — 0.7% | |
| | |
Martin Marietta Materials, Inc. (a) | | | 628 | | | | 107,888 | |
| | | | | | | | |
|
Consumer Finance — 0.9% | |
| | |
Ally Financial, Inc. | | | 5,841 | | | | 132,364 | |
| | | | | | | | |
|
Containers & Packaging — 3.5% | |
| | |
Ball Corp. | | | 5,818 | | | | 267,526 | |
| | |
Silgan Holdings, Inc. | | | 5,803 | | | | 137,078 | |
| | |
Westrock Co. | | | 3,243 | | | | 122,470 | |
| | | | | | | | |
| | |
| | | | | | | 527,074 | |
| | | | | | | | |
|
Distributors — 0.7% | |
| | |
Genuine Parts Co. | | | 1,171 | | | | 112,469 | |
| | | | | | | | |
| | | | | | | | |
| INVESTMENTS | | SHARES
(000) | | | VALUE
($000) | |
| | | | | | | | |
|
Electric Utilities — 3.5% | |
| | |
Edison International | | | 1,138 | | | | 64,586 | |
| | |
Evergy, Inc. | | | 2,790 | | | | 158,375 | |
| | |
Xcel Energy, Inc. | | | 6,187 | | | | 304,831 | |
| | | | | | | | |
| | |
| | | | | | | 527,792 | |
| | | | | | | | |
|
Electrical Equipment — 2.6% | |
| | |
Acuity Brands, Inc. | | | 1,285 | | | | 147,665 | |
| | |
AMETEK, Inc. | | | 2,359 | | | | 159,674 | |
| | |
Hubbell, Inc. | | | 775 | | | | 76,961 | |
| | | | | | | | |
| | |
| | | | | | | 384,300 | |
| | | | | | | | |
|
Electronic Equipment, Instruments & Components — 4.5% | |
| | |
Amphenol Corp., Class A | | | 1,933 | | | | 156,583 | |
| | |
Arrow Electronics, Inc. * | | | 2,864 | | | | 197,477 | |
| | |
CDW Corp. | | | 2,127 | | | | 172,359 | |
| | |
Keysight Technologies, Inc. * | | | 2,338 | | | | 145,117 | |
| | | | | | | | |
| | |
| | | | | | | 671,536 | |
| | | | | | | | |
|
Equity Real Estate Investment Trusts (REITs) — 10.8% | |
| | |
American Campus Communities, Inc. | | | 2,084 | | | | 86,250 | |
| | |
American Homes 4 Rent, Class A | | | 4,222 | | | | 83,801 | |
| | |
AvalonBay Communities, Inc. | | | 1,132 | | | | 197,030 | |
| | |
Boston Properties, Inc. | | | 1,544 | | | | 173,764 | |
| | |
Brixmor Property Group, Inc. | | | 7,543 | | | | 110,814 | |
| | |
Essex Property Trust, Inc. | | | 471 | | | | 115,603 | |
| | |
Federal Realty Investment Trust | | | 1,317 | | | | 155,418 | |
| | |
JBG SMITH Properties | | | 1,772 | | | | 61,688 | |
| | |
Kimco Realty Corp. (a) | | | 6,168 | | | | 90,358 | |
| | |
Outfront Media, Inc. | | | 5,817 | | | | 105,398 | |
| | |
Rayonier, Inc. | | | 4,212 | | | | 116,626 | |
| | |
Regency Centers Corp. | | | 1,580 | | | | 92,718 | |
| | |
Vornado Realty Trust | | | 2,528 | | | | 156,823 | |
| | |
Weyerhaeuser Co. | | | 3,223 | | | | 70,447 | |
| | | | | | | | |
| | |
| | | | | | | 1,616,738 | |
| | | | | | | | |
|
Food & Staples Retailing — 0.8% | |
| | |
Kroger Co. (The) | | | 4,613 | | | | 126,860 | |
| | | | | | | | |
|
Food Products — 1.7% | |
| | |
Conagra Brands, Inc. | | | 5,535 | | | | 118,221 | |
| | |
Post Holdings, Inc. * (a) | | | 1,499 | | | | 133,629 | |
| | | | | | | | |
| | |
| | | | | | | 251,850 | |
| | | | | | | | |
|
Gas Utilities — 1.1% | |
| | |
National Fuel Gas Co. (a) | | | 3,159 | | | | 161,664 | |
| | | | | | | | |
|
Health Care Equipment & Supplies — 1.2% | |
| | |
Zimmer Biomet Holdings, Inc. | | | 1,776 | | | | 184,221 | |
| | | | | | | | |
SEE NOTES TO FINANCIAL STATEMENTS.
| | | | | | |
| | | |
| 22 | | | | J.P. MORGAN MID CAP/MULTI-CAP FUNDS | | DECEMBER 31, 2018 |
| | | | | | | | |
| INVESTMENTS | | SHARES
(000) | | | VALUE
($000) | |
Common Stocks — continued | |
|
Health Care Providers & Services — 5.8% | |
| | |
AmerisourceBergen Corp. | | | 2,281 | | | | 169,733 | |
| | |
Cigna Corp. | | | 1,043 | | | | 198,108 | |
| | |
Henry Schein, Inc. * (a) | | | 1,353 | | | | 106,239 | |
| | |
Humana, Inc. | | | 323 | | | | 92,487 | |
| | |
Laboratory Corp. of America Holdings * | | | 1,146 | | | | 144,826 | |
| | |
Universal Health Services, Inc., Class B | | | 1,339 | | | | 156,122 | |
| | | | | | | | |
| | |
| | | | | | | 867,515 | |
| | | | | | | | |
|
Hotels, Restaurants & Leisure — 1.3% | |
| | |
Hilton Worldwide Holdings, Inc. | | | 2,790 | | | | 200,299 | |
| | | | | | | | |
|
Household Durables — 1.7% | |
| | |
Mohawk Industries, Inc. * | | | 1,394 | | | | 163,015 | |
| | |
Newell Brands, Inc. (a) | | | 5,037 | | | | 93,629 | |
| | | | | | | | |
| | |
| | | | | | | 256,644 | |
| | | | | | | | |
|
Household Products — 0.6% | |
| | |
Energizer Holdings, Inc. | | | 1,840 | | | | 83,077 | |
| | | | | | | | |
|
Industrial Conglomerates — 0.8% | |
| | |
Carlisle Cos., Inc. | | | 1,169 | | | | 117,541 | |
| | | | | | | | |
|
Insurance — 8.2% | |
| | |
Alleghany Corp. | | | 170 | | | | 105,662 | |
| | |
Hartford Financial Services Group, Inc. (The) | | | 4,705 | | | | 209,134 | |
| | |
Lincoln National Corp. | | | 1,798 | | | | 92,233 | |
| | |
Loews Corp. | | | 6,380 | | | | 290,404 | |
| | |
Marsh & McLennan Cos., Inc. | | | 1,838 | | | | 146,613 | |
| | |
Principal Financial Group, Inc. | | | 1,725 | | | | 76,181 | |
| | |
Progressive Corp. (The) | | | 2,451 | | | | 147,882 | |
| | |
Unum Group | | | 2,115 | | | | 62,149 | |
| | |
WR Berkley Corp. | | | 1,302 | | | | 96,267 | |
| | | | | | | | |
| | |
| | | | | | | 1,226,525 | |
| | | | | | | | |
|
Interactive Media & Services — 0.6% | |
| | |
Match Group, Inc. (a) | | | 2,202 | | | | 94,174 | |
| | | | | | | | |
|
Internet & Direct Marketing Retail — 1.4% | |
| | |
Expedia Group, Inc. | | | 1,884 | | | | 212,192 | |
| | | | | | | | |
| | |
IT Services — 1.0% | | | | | | | | |
| | |
Jack Henry & Associates, Inc. | | | 1,197 | | | | 151,439 | |
| | | | | | | | |
|
Machinery — 2.9% | |
| | |
IDEX Corp. | | | 1,112 | | | | 140,442 | |
| | |
Middleby Corp. (The) * | | | 1,045 | | | | 107,383 | |
| | |
Snap-on, Inc. | | | 1,280 | | | | 185,913 | |
| | | | | | | | |
| | |
| | | | | | | 433,738 | |
| | | | | | | | |
|
Media — 1.1% | |
| | |
CBS Corp. (Non-Voting), Class B | | | 2,041 | | | | 89,232 | |
| | | | | | | | |
| INVESTMENTS | | SHARES
(000) | | | VALUE
($000) | |
| | | | | | | | |
|
Media — continued | |
| | |
DISH Network Corp., Class A * | | | 3,115 | | | | 77,783 | |
| | | | | | | | |
| | |
| | | | | | | 167,015 | |
| | | | | | | | |
|
Mortgage Real Estate Investment Trusts (REITs) — 0.3% | |
| | |
Starwood Property Trust, Inc. (a) | | | 2,319 | | | | 45,713 | |
| | | | | | | | |
|
Multiline Retail — 1.9% | |
| | |
Kohl’s Corp. | | | 2,841 | | | | 188,472 | |
| | |
Nordstrom, Inc. | | | 2,177 | | | | 101,463 | |
| | | | | | | | |
| | |
| | | | | | | 289,935 | |
| | | | | | | | |
|
Multi-Utilities — 5.5% | |
| | |
CMS Energy Corp. | | | 6,460 | | | | 320,759 | |
| | |
Sempra Energy | | | 1,802 | | | | 194,938 | |
| | |
WEC Energy Group, Inc. | | | 4,445 | | | | 307,888 | |
| | | | | | | | |
| | |
| | | | | | | 823,585 | |
| | | | | | | | |
|
Oil, Gas & Consumable Fuels — 6.2% | |
| | |
Cabot Oil & Gas Corp. | | | 3,786 | | | | 84,619 | |
| | |
Diamondback Energy, Inc. | | | 3,162 | | | | 293,089 | |
| | |
EQT Corp. | | | 5,316 | | | | 100,412 | |
| | |
Equitrans Midstream Corp. * (a) | | | 4,897 | | | | 98,044 | |
| | |
PBF Energy, Inc., Class A | | | 2,836 | | | | 92,660 | |
| | |
Williams Cos., Inc. (The) | | | 11,608 | | | | 255,945 | |
| | | | | | | | |
| | |
| | | | | | | 924,769 | |
| | | | | | | | |
|
Personal Products — 0.9% | |
| | |
Coty, Inc., Class A | | | 8,337 | | | | 54,689 | |
| | |
Edgewell Personal Care Co. * (a) | | | 2,033 | | | | 75,947 | |
| | | | | | | | |
| | |
| | | | | | | 130,636 | |
| | | | | | | | |
|
Real Estate Management & Development — 1.4% | |
| | |
CBRE Group, Inc., Class A * | | | 4,048 | | | | 162,067 | |
| | |
Cushman & Wakefield plc * (a) | | | 2,831 | | | | 40,967 | |
| | | | | | | | |
| | |
| | | | | | | 203,034 | |
| | | | | | | | |
|
Semiconductors & Semiconductor Equipment — 1.1% | |
| | |
Analog Devices, Inc. | | | 1,962 | | | | 168,436 | |
| | | | | | | | |
| | |
Software — 1.0% | | | | | | | | |
| | |
Synopsys, Inc. * | | | 1,810 | | | | 152,455 | |
| | | | | | | | |
| | |
Specialty Retail — 4.1% | | | | | | | | |
| | |
AutoZone, Inc. * | | | 267 | | | | 223,761 | |
| | |
Best Buy Co., Inc. | | | 2,337 | | | | 123,767 | |
| | |
Gap, Inc. (The) | | | 5,359 | | | | 138,048 | |
| | |
Tiffany & Co. (a) | | | 1,670 | | | | 134,464 | |
| | | | | | | | |
| | |
| | | | | | | 620,040 | |
| | | | | | | | |
|
Textiles, Apparel & Luxury Goods — 1.7% | |
| | |
PVH Corp. | | | 1,474 | | | | 137,021 | |
SEE NOTES TO FINANCIAL STATEMENTS.
| | | | | | | | |
| | | |
| DECEMBER 31, 2018 | | J.P. MORGAN MID CAP/MULTI-CAP FUNDS | | | | | 23 | |
JPMorgan Mid Cap Value Fund
SCHEDULE OF PORTFOLIO INVESTMENTS
AS OF DECEMBER 31, 2018 (Unaudited) (continued)
| | | | | | | | |
| INVESTMENTS | | SHARES
(000) | | | VALUE
($000) | |
Common Stocks — continued | |
|
Textiles, Apparel & Luxury Goods — continued | |
| | |
Ralph Lauren Corp. | | | 1,171 | | | | 121,101 | |
| | | | | | | | |
| | |
| | | | | | | 258,122 | |
| | | | | | | | |
|
Trading Companies & Distributors — 0.9% | |
| | |
MSC Industrial Direct Co., Inc., Class A | | | 1,762 | | | | 135,525 | |
| | | | | | | | |
| | |
Total Common Stocks
(Cost $11,042,473) | | | | | | | 14,969,376 | |
| | | | | | | | |
Short-Term Investments — 1.9% | |
|
Investment Companies — 1.9% | |
| | |
JPMorgan U.S. Government Money Market Fund Class Institutional Shares, 2.40% (b) (c)
(Cost $286,144) | | | 286,144 | | | | 286,144 | |
| | | | | | | | |
|
Investment of Cash Collateral from Securities Loaned — 0.7% | |
| | |
JPMorgan Securities Lending Money Market Fund Class Agency SL Shares, 2.60% (b) (c) | | | 89,009 | | | | 89,000 | |
| | |
JPMorgan U.S. Government Money Market Fund Class IM Shares, 2.46% (b) (c) | | | 14,483 | | | | 14,483 | |
| | | | | | | | |
| | |
Total Investment of Cash Collateral from Securities Loaned
(Cost $103,483) | | | | | | | 103,483 | |
| | | | | | | | |
Total Investments — 102.2%
(Cost $11,432,100) | | | | | | | 15,359,003 | |
Liabilities in Excess of
Other Assets — (2.2%) | | | | | | | (334,853 | ) |
| | | | | | | | |
NET ASSETS — 100.0% | | | | | | | 15,024,150 | |
| | | | | | | | |
Percentages indicated are based on net assets.
| | |
| (a) | | The security or a portion of this security is on loan at December 31, 2018. The total value of securities on loan at December 31, 2018 is approximately $101,814,000. |
| (b) | | Investment in affiliate. Fund is registered under the Investment Company Act of 1940, as amended, and advised by J.P. Morgan Investment Management Inc. |
| (c) | | The rate shown is the current yield as of December 31, 2018. |
| * | | Non-income producing security. |
SEE NOTES TO FINANCIAL STATEMENTS.
| | | | | | |
| | | |
| 24 | | | | J.P. MORGAN MID CAP/MULTI-CAP FUNDS | | DECEMBER 31, 2018 |
JPMorgan Value Advantage Fund
SCHEDULE OF PORTFOLIO INVESTMENTS
AS OF DECEMBER 31, 2018 (Unaudited)
| | | | | | | | |
| INVESTMENTS | | SHARES
(000) | | | VALUE
($000) | |
Common Stocks — 99.5% | | | | | | | | |
| | |
Aerospace & Defense — 1.0% | | | | | | | | |
| | |
United Technologies Corp. | | | 910 | | | | 96,872 | |
| | | | | | | | |
|
Airlines — 2.2% | |
| | |
Delta Air Lines, Inc. | | | 3,023 | | | | 150,832 | |
| | |
Southwest Airlines Co. | | | 1,464 | | | | 68,056 | |
| | | | | | | | |
| | |
| | | | | | | 218,888 | |
| | | | | | | | |
| | |
Banks — 14.2% | | | | | | | | |
| | |
Bank of America Corp. | | | 12,743 | | | | 313,978 | |
| | |
Citigroup, Inc. | | | 2,049 | | | | 106,673 | |
| | |
Citizens Financial Group, Inc. | | | 3,057 | | | | 90,882 | |
| | |
Fifth Third Bancorp | | | 2,423 | | | | 57,014 | |
| | |
First Republic Bank | | | 554 | | | | 48,174 | |
| | |
M&T Bank Corp. | | | 1,017 | | | | 145,537 | |
| | |
PNC Financial Services Group, Inc. (The) | | | 1,430 | | | | 167,226 | |
| | |
SunTrust Banks, Inc. | | | 2,163 | | | | 109,100 | |
| | |
US Bancorp | | | 2,195 | | | | 100,320 | |
| | |
Wells Fargo & Co. | | | 5,795 | | | | 267,039 | |
| | | | | | | | |
| | |
| | | | | | | 1,405,943 | |
| | | | | | | | |
| | |
Beverages — 0.9% | | | | | | | | |
| | |
Keurig Dr Pepper, Inc. | | | 1,657 | | | | 42,490 | |
| | |
Molson Coors Brewing Co., Class B | | | 857 | | | | 48,149 | |
| | | | | | | | |
| | |
| | | | | | | 90,639 | |
| | | | | | | | |
| | |
Capital Markets — 4.1% | | | | | | | | |
| | |
Charles Schwab Corp. (The) | | | 1,833 | | | | 76,141 | |
| | |
Invesco Ltd. | | | 2,329 | | | | 38,994 | |
| | |
Morgan Stanley | | | 2,423 | | | | 96,089 | |
| | |
Northern Trust Corp. | | | 757 | | | | 63,240 | |
| | |
T. Rowe Price Group, Inc. | | | 1,383 | | | | 127,645 | |
| | | | | | | | |
| | |
| | | | | | | 402,109 | |
| | | | | | | | |
| | |
Chemicals — 0.2% | | | | | | | | |
| | |
AdvanSix, Inc. * | | | 1,021 | | | | 24,858 | |
| | | | | | | | |
|
Communications Equipment — 1.7% | |
| | |
Cisco Systems, Inc. | | | 2,850 | | | | 123,508 | |
| | |
CommScope Holding Co., Inc. * | | | 2,787 | | | | 45,684 | |
| | | | | | | | |
| | |
| | | | | | | 169,192 | |
| | | | | | | | |
| | |
Construction Materials — 1.4% | | | | | | | | |
| | |
Martin Marietta Materials, Inc. (a) | | | 784 | | | | 134,673 | |
| | | | | | | | |
|
Consumer Finance — 3.3% | |
| | |
Ally Financial, Inc. | | | 1,488 | | | | 33,707 | |
| | |
American Express Co. | | | 1,022 | | | | 97,408 | |
| | |
Capital One Financial Corp. | | | 2,560 | | | | 193,540 | |
| | | | | | | | |
| | |
| | | | | | | 324,655 | |
| | | | | | | | |
| | | | | | | | |
| INVESTMENTS | | SHARES
(000) | | | VALUE
($000) | |
| | | | | | | | |
| | |
Containers & Packaging — 3.3% | | | | | | | | |
| | |
Ball Corp. | | | 3,444 | | | | 158,358 | |
| | |
Graphic Packaging Holding Co. (a) | | | 5,071 | | | | 53,957 | |
| | |
Packaging Corp. of America | | | 723 | | | | 60,358 | |
| | |
Westrock Co. | | | 1,564 | | | | 59,052 | |
| | | | | | | | |
| | |
| | | | | | | 331,725 | |
| | | | | | | | |
| | |
Distributors — 0.5% | | | | | | | | |
| | |
Genuine Parts Co. | | | 530 | | | | 50,924 | |
| | | | | | | | |
|
Diversified Telecommunication Services — 1.7% | |
| | |
Verizon Communications, Inc. | | | 2,959 | | | | 166,354 | |
| | | | | | | | |
|
Electric Utilities — 5.4% | |
| | |
American Electric Power Co., Inc. | | | 1,740 | | | | 130,019 | |
| | |
Duke Energy Corp. | | | 707 | | | | 60,978 | |
| | |
Edison International | | | 733 | | | | 41,585 | |
| | |
Eversource Energy | | | 962 | | | | 62,543 | |
| | |
NextEra Energy, Inc. | | | 645 | | | | 112,199 | |
| | |
Xcel Energy, Inc. | | | 2,612 | | | | 128,715 | |
| | | | | | | | |
| | |
| | | | | | | 536,039 | |
| | | | | | | | |
|
Electronic Equipment, Instruments & Components — 0.9% | |
| | |
Arrow Electronics, Inc. * | | | 1,262 | | | | 87,009 | |
| | | | | | | | |
|
Equity Real Estate Investment Trusts (REITs) — 6.6% | |
| | |
American Homes 4 Rent, Class A | | | 2,680 | | | | 53,192 | |
| | |
Brixmor Property Group, Inc. | | | 4,814 | | | | 70,712 | |
| | |
CorePoint Lodging, Inc. | | | 1,733 | | | | 21,228 | |
| | |
EastGroup Properties, Inc. | | | 527 | | | | 48,332 | |
| | |
Federal Realty Investment Trust | | | 497 | | | | 58,701 | |
| | |
Kimco Realty Corp. (a) | | | 4,166 | | | | 61,028 | |
| | |
Mid-America Apartment Communities, Inc. | | | 1,035 | | | | 99,016 | |
| | |
Outfront Media, Inc. | | | 3,250 | | | | 58,892 | |
| | |
Public Storage | | | 476 | | | | 96,367 | |
| | |
Rayonier, Inc. | | | 1,992 | | | | 55,158 | |
| | |
Weyerhaeuser Co. | | | 1,319 | | | | 28,834 | |
| | | | | | | | |
| | |
| | | | | | | 651,460 | |
| | | | | | | | |
|
Food & Staples Retailing — 1.6% | |
| | |
Kroger Co. (The) | | | 1,648 | | | | 45,308 | |
| | |
Walgreens Boots Alliance, Inc. | | | 1,647 | | | | 112,526 | |
| | | | | | | | |
| | |
| | | | | | | 157,834 | |
| | | | | | | | |
|
Food Products — 0.9% | |
| | |
Post Holdings, Inc. * | | | 1,021 | | | | 91,028 | |
| | | | | | | | |
| |
Health Care Equipment & Supplies — 0.5% | | | | | |
| | |
Medtronic plc | | | 593 | | | | 53,939 | |
| | | | | | | | |
|
Health Care Providers & Services — 1.9% | |
| | |
AmerisourceBergen Corp. | | | 672 | | | | 50,027 | |
SEE NOTES TO FINANCIAL STATEMENTS.
| | | | | | | | |
| | | |
| DECEMBER 31, 2018 | | J.P. MORGAN MID CAP/MULTI-CAP FUNDS | | | | | 25 | |
JPMorgan Value Advantage Fund
SCHEDULE OF PORTFOLIO INVESTMENTS
AS OF DECEMBER 31, 2018 (Unaudited) (continued)
| | | | | | | | |
| INVESTMENTS | | SHARES
(000) | | | VALUE
($000) | |
Common Stocks — continued | | | | | | | | |
|
Health Care Providers & Services — continued | |
| | |
HCA Healthcare, Inc. | | | 341 | | | | 42,380 | |
| | |
UnitedHealth Group, Inc. | | | 367 | | | | 91,436 | |
| | | | | | | | |
| | |
| | | | | | | 183,843 | |
| | | | | | | | |
| | |
Hotels, Restaurants & Leisure — 1.1% | | | | | | | | |
| | |
Brinker International, Inc. (a) | | | 770 | | | | 33,854 | |
| | |
Hilton Worldwide Holdings, Inc. | | | 1,003 | | | | 72,030 | |
| | | | | | | | |
| | |
| | | | | | | 105,884 | |
| | | | | | | | |
| | |
Household Products — 2.1% | | | | | | | | |
| | |
Clorox Co. (The) (a) | | | 263 | | | | 40,477 | |
| | |
Energizer Holdings, Inc. | | | 1,122 | | | | 50,666 | |
| | |
Procter & Gamble Co. (The) | | | 1,229 | | | | 112,927 | |
| | | | | | | | |
| | |
| | | | | | | 204,070 | |
| | | | | | | | |
| | |
Industrial Conglomerates — 1.7% | | | | | | | | |
| | |
Carlisle Cos., Inc. | | | 564 | | | | 56,664 | |
| | |
Honeywell International, Inc. | | | 832 | | | | 109,874 | |
| | | | | | | | |
| | |
| | | | | | | 166,538 | |
| | | | | | | | |
| | |
Insurance — 7.8% | | | | | | | | |
| | |
Alleghany Corp. | | | 66 | | | | 41,012 | |
| | |
American International Group, Inc. | | | 2,479 | | | | 97,704 | |
| | |
Chubb Ltd. | | | 637 | | | | 82,319 | |
| | |
Fairfax Financial Holdings Ltd. (Canada) | | | 109 | | | | 48,184 | |
| | |
Hartford Financial Services Group, Inc. (The) | | | 1,888 | | | | 83,925 | |
| | |
Loews Corp. | | | 3,896 | | | | 177,355 | |
| | |
Marsh & McLennan Cos., Inc. | | | 975 | | | | 77,720 | |
| | |
Prudential Financial, Inc. | | | 386 | | | | 31,466 | |
| | |
Travelers Cos., Inc. (The) | | | 911 | | | | 109,077 | |
| | |
Unum Group | | | 740 | | | | 21,738 | |
| | | | | | | | |
| | |
| | | | | | | 770,500 | |
| | | | | | | | |
|
Internet & Direct Marketing Retail — 0.6% | |
| | |
Expedia Group, Inc. | | | 494 | | | | 55,614 | |
| | | | | | | | |
|
Machinery — 1.9% | |
| | |
Dover Corp. | | | 974 | | | | 69,120 | |
| | |
Illinois Tool Works, Inc. | | | 669 | | | | 84,778 | |
| | |
Middleby Corp. (The) * | | | 325 | | | | 33,429 | |
| | | | | | | | |
| | |
| | | | | | | 187,327 | |
| | | | | | | | |
|
Media — 4.0% | |
| | |
CBS Corp. (Non-Voting), Class B | | | 1,251 | | | | 54,697 | |
| | |
Charter Communications, Inc., Class A * | | | 426 | | | | 121,451 | |
| | |
DISH Network Corp., Class A * | | | 3,999 | | | | 99,863 | |
| | |
Entercom Communications Corp., Class A (a) | | | 6,516 | | | | 37,209 | |
| | |
Nexstar Media Group, Inc., Class A | | | 1,063 | | | | 83,609 | |
| | | | | | | | |
| | |
| | | | | | | 396,829 | |
| | | | | | | | |
| | | | | | | | |
| INVESTMENTS | | SHARES
(000) | | | VALUE
($000) | |
| | | | | | | | |
| | |
Multiline Retail — 1.7% | | | | | | | | |
| | |
Kohl’s Corp. | | | 1,292 | | | | 85,713 | |
| | |
Nordstrom, Inc. | | | 1,801 | | | | 83,963 | |
| | | | | | | | |
| | |
| | | | | | | 169,676 | |
| | | | | | | | |
| | |
Multi-Utilities — 0.4% | | | | | | | | |
| | |
NiSource, Inc. (a) | | | 1,422 | | | | 36,058 | |
| | | | | | | | |
|
Oil, Gas & Consumable Fuels — 8.6% | |
| | |
Chevron Corp. | | | 590 | | | | 64,230 | |
| | |
ConocoPhillips | | | 1,675 | | | | 104,428 | |
| | |
Diamondback Energy, Inc. | | | 457 | | | | 42,345 | |
| | |
EQT Corp. (a) | | | 1,914 | | | | 36,157 | |
| | |
Equitrans Midstream Corp. * | | | 1,485 | | | | 29,728 | |
| | |
Exxon Mobil Corp. | | | 2,063 | | | | 140,677 | |
| | |
Kinder Morgan, Inc. | | | 6,784 | | | | 104,332 | |
| | |
Marathon Petroleum Corp. | | | 1,256 | | | | 74,141 | |
| | |
Occidental Petroleum Corp. | | | 1,478 | | | | 90,738 | |
| | |
PBF Energy, Inc., Class A | | | 659 | | | | 21,541 | |
| | |
Phillips 66 | | | 653 | | | | 56,237 | |
| | |
Williams Cos., Inc. (The) | | | 3,737 | | | | 82,390 | |
| | | | | | | | |
| | |
| | | | | | | 846,944 | |
| | | | | | | | |
| | |
Personal Products — 0.3% | | | | | | | | |
| | |
Coty, Inc., Class A | | | 5,088 | | | | 33,378 | |
| | | | | | | | |
|
Pharmaceuticals — 7.8% | |
| | |
Allergan plc | | | 660 | | | | 88,267 | |
| | |
Johnson & Johnson | | | 1,319 | | | | 170,271 | |
| | |
Merck & Co., Inc. | | | 2,685 | | | | 205,172 | |
| | |
Pfizer, Inc. | | | 7,121 | | | | 310,832 | |
| | | | | | | | |
| | |
| | | | | | | 774,542 | |
| | | | | | | | |
|
Real Estate Management & Development — 0.9% | |
| | |
CBRE Group, Inc., Class A * | | | 2,255 | | | | 90,278 | |
| | | | | | | | |
|
Semiconductors & Semiconductor Equipment — 2.7% | |
| | |
Analog Devices, Inc. | | | 893 | | | | 76,646 | |
| | |
QUALCOMM, Inc. | | | 953 | | | | 54,208 | |
| | |
Texas Instruments, Inc. | | | 1,442 | | | | 136,285 | |
| | | | | | | | |
| | |
| | | | | | | 267,139 | |
| | | | | | | | |
| | |
Software — 1.2% | | | | | | | | |
| | |
Microsoft Corp. | | | 1,133 | | | | 115,040 | |
| | | | | | | | |
|
Specialty Retail — 3.5% | |
| | |
AutoZone, Inc. * | | | 171 | | | | 143,569 | |
| | |
Best Buy Co., Inc. | | | 845 | | | | 44,745 | |
| | |
Home Depot, Inc. (The) | | | 318 | | | | 54,556 | |
| | |
Murphy USA, Inc. * | | | 766 | | | | 58,677 | |
SEE NOTES TO FINANCIAL STATEMENTS.
| | | | | | |
| | | |
| 26 | | | | J.P. MORGAN MID CAP/MULTI-CAP FUNDS | | DECEMBER 31, 2018 |
| | | | | | | | |
| INVESTMENTS | | SHARES
(000) | | | VALUE
($000) | |
Common Stocks — continued | | | | | | | | |
|
Specialty Retail — continued | |
| | |
Tiffany & Co. (a) | | | 558 | | | | 44,924 | |
| | | | | | | | |
| | |
| | | | | | | 346,471 | |
| | | | | | | | |
|
Technology Hardware, Storage & Peripherals — 0.4% | |
| | |
Hewlett Packard Enterprise Co. | | | 2,915 | | | | 38,510 | |
| | | | | | | | |
|
Textiles, Apparel & Luxury Goods —0.5% | |
| | |
Columbia Sportswear Co. (a) | | | 559 | | | | 46,984 | |
| | | | | | | | |
| | |
Total Common Stocks
(Cost $8,164,982) | | | | | | | 9,829,766 | |
| | | | | | | | |
| | | No. of
Rights (000) | | | | |
Rights — 0.0% (b) | | | | |
|
Media — 0.0% (b) | |
| | |
Media General, Inc., CVR * ‡ (Cost $—) | | | 2,982 | | | | 146 | |
| | | | | | | | |
| | | SHARES
(000) | | | | |
Short-Term Investments — 0.9% | |
|
Investment Companies — 0.9% | |
| | |
JPMorgan U.S. Government Money Market Fund Class Institutional Shares, 2.40% (c) (d)
(Cost $89,301) | | | 89,301 | | | | 89,301 | |
| | | | | | | | |
Investment of Cash Collateral from Securities Loaned — 0.8% | |
| | |
JPMorgan Securities Lending Money Market Fund Class Agency SL Shares, 2.60% (c) (d) | | | 63,006 | | | | 63,000 | |
| | |
JPMorgan U.S. Government Money Market Fund Class IM Shares, 2.46% (c) (d) | | | 12,166 | | | | 12,166 | |
| | | | | | | | |
| | |
Total Investment of Cash Collateral from Securities Loaned
(Cost $75,166) | | | | | | | 75,166 | |
| | | | | |
Total Investments — 101.2%
(Cost $8,329,449) | | | | | | | 9,994,379 | |
Liabilities in Excess of
Other Assets — (1.2%) | | | | | | | (117,032 | ) |
| | | | | |
NET ASSETS — 100.0% | | | | | | | 9,877,347 | |
| | | | | | | | |
Percentages indicated are based on net assets.
Abbreviations
| | |
| CVR | | ContingentValue Rights |
| |
| (a) | | The security or a portion of this security is on loan at December 31, 2018. The total value of securities on loan at December 31, 2018 is approximately $73,853,000. |
| (b) | | Amount rounds to less than 0.1% of net assets. |
| (c) | | Investment in affiliate. Fund is registered under the Investment Company Act of 1940, as amended, and advised by J.P. Morgan Investment Management Inc. |
| (d) | | The rate shown is the current yield as of December 31, 2018. |
| * | | Non-income producing security. |
| ‡ | | Value determined using significant unobservable inputs. |
SEE NOTES TO FINANCIAL STATEMENTS.
| | | | | | | | |
| | | |
| DECEMBER 31, 2018 | | J.P. MORGAN MID CAP/MULTI-CAP FUNDS | | | | | 27 | |
STATEMENTS OF ASSETS AND LIABILITIES
AS OF DECEMBER 31, 2018 (Unaudited)
(Amounts in thousands, except per share amounts)
| | | | | | | | | | | | |
| | | JPMorgan
Growth
Advantage
Fund | | | JPMorgan
Mid Cap
Equity Fund | | | JPMorgan
Mid Cap
Growth Fund | |
ASSETS: | | | | | | | | | | | | |
Investments in non-affiliates, at value | | $ | 7,714,926 | | | $ | 2,381,041 | | | $ | 3,535,013 | |
Investments in affiliates, at value | | | 67,534 | | | | 39,324 | | | | 15,690 | |
Investment of cash collateral received from securities loaned, at value (Note 2.B.) | | | 138,088 | | | | 47,708 | | | | 133,998 | |
Receivables: | | | | | | | | | | | | |
Due from custodian | | | — | | | | 1,328 | | | | — | |
Investment securities sold | | | 281 | | | | — | | | | — | |
Fund shares sold | | | 15,464 | | | | 3,265 | | | | 4,867 | |
Dividends from non-affiliates | | | 938 | | | | 2,243 | | | | 848 | |
Dividends from affiliates | | | 188 | | | | 147 | | | | 130 | |
Securities lending income (Note 2.B.) | | | 28 | | | | 21 | | | | 60 | |
| | | | | | | | | | | | |
Total Assets | | | 7,937,447 | | | | 2,475,077 | | | | 3,690,606 | |
| | | | | | | | | | | | |
| | | |
LIABILITIES: | | | | | | | | | | | | |
Payables: | | | | | | | | | | | | |
Due to custodian | | | — | (a) | | | — | | | | 25 | |
Investment securities purchased | | | — | | | | 1,971 | | | | 1,888 | |
Collateral received on securities loaned (Note 2.B.) | | | 138,088 | | | | 47,708 | | | | 133,998 | |
Fund shares redeemed | | | 23,681 | | | | 6,160 | | | | 24,973 | |
Accrued liabilities: | | | | | | | | | | | | |
Investment advisory fees | | | 3,937 | | | | 1,222 | | | | 1,949 | |
Administration fees | | | 256 | | | | 80 | | | | 231 | |
Distribution fees | | | 762 | | | | 92 | | | | 242 | |
Service fees | | | 831 | | | | 140 | | | | 348 | |
Custodian and accounting fees | | | 51 | | | | 18 | | | | 26 | |
Trustees’ and Chief Compliance Officer’s fees | | | — | | | | — | (a) | | | — | |
Other | | | 229 | | | | 212 | | | | 264 | |
| | | | | | | | | | | | |
Total Liabilities | | | 167,835 | | | | 57,603 | | | | 163,944 | |
| | | | | | | | | | | | |
Net Assets | | $ | 7,769,612 | | | $ | 2,417,474 | | | $ | 3,526,662 | |
| | | | | | | | | | | | |
| (a) | Amount rounds to less than one thousand. |
SEE NOTES TO FINANCIAL STATEMENTS.
| | | | | | |
| | | |
| 28 | | | | J.P. MORGAN MID CAP/MULTI-CAP FUNDS | | DECEMBER 31, 2018 |
| | | | | | | | | | | | |
| | | JPMorgan
Growth
Advantage
Fund | | | JPMorgan
Mid Cap
Equity Fund | | | JPMorgan
Mid Cap
Growth Fund | |
NET ASSETS: | | | | | | | | | | | | |
Paid-in-Capital | | $ | 5,423,404 | | | $ | 1,930,821 | | | $ | 3,046,243 | |
Total distributable earnings (loss) (a) | | | 2,346,208 | | | | 486,653 | | | | 480,419 | |
| | | | | | | | | | | | |
Total Net Assets | | $ | 7,769,612 | | | $ | 2,417,474 | | | $ | 3,526,662 | |
| | | | | | | | | | | | |
| | | |
Net Assets: | | | | | | | | | | | | |
Class A | | $ | 1,501,771 | | | $ | 354,294 | | | $ | 810,019 | |
Class C | | | 660,694 | | | | 21,438 | | | | 68,402 | |
Class I | | | 1,638,415 | | | | 268,432 | | | | 949,095 | |
Class R2 | | | 49 | | | | 416 | | | | 34,025 | |
Class R3 | | | 321 | | | | — | | | | 24,148 | |
Class R4 | | | 13,470 | | | | — | | | | 13,809 | |
Class R5 | | | 100,007 | | | | 5,279 | | | | 268,818 | |
Class R6 | | | 3,854,885 | | | | 1,767,615 | | | | 1,358,346 | |
| | | | | | | | | | | | |
Total | | $ | 7,769,612 | | | $ | 2,417,474 | | | $ | 3,526,662 | |
| | | | | | | | | | | | |
| | | |
Outstanding units of beneficial interest (shares) | | | | | | | | | | | | |
($0.0001 par value; unlimited number of shares authorized): | | | | | | | | | | | | |
Class A | | | 84,879 | | | | 8,662 | | | | 31,764 | |
Class C | | | 43,017 | | | | 547 | | | | 3,478 | |
Class I | | | 89,636 | | | | 6,464 | | | | 31,997 | |
Class R2 | | | 3 | | | | 10 | | | | 1,222 | |
Class R3 | | | 18 | | | | — | | | | 821 | |
Class R4 | | | 737 | | | | — | | | | 466 | |
Class R5 | | | 5,364 | | | | 127 | | | | 8,945 | |
Class R6 | | | 205,499 | | | | 42,573 | | | | 44,986 | |
| | | |
Net Asset Value (b): | | | | | | | | | | | | |
Class A — Redemption price per share | | $ | 17.69 | | | $ | 40.90 | | | $ | 25.50 | |
Class C — Offering price per share (c) | | | 15.36 | | | | 39.22 | | | | 19.67 | |
Class I — Offering and redemption price per share | | | 18.28 | | | | 41.53 | | | | 29.66 | |
Class R2 — Offering and redemption price per share | | | 17.62 | | | | 40.50 | | | | 27.83 | |
Class R3 — Offering and redemption price per share | | | 17.70 | | | | — | | | | 29.43 | |
Class R4 — Offering and redemption price per share | | | 18.28 | | | | — | | | | 29.62 | |
Class R5 — Offering and redemption price per share | | | 18.65 | | | | 41.51 | | | | 30.05 | |
Class R6 — Offering and redemption price per share | | | 18.76 | | | | 41.52 | | | | 30.19 | |
Class A maximum sales charge | | | 5.25 | % | | | 5.25 | % | | | 5.25 | % |
Class A maximum public offering price per share
[net asset value per share/(100% — maximum sales charge)] | | $ | 18.67 | | | $ | 43.17 | | | $ | 26.91 | |
| | | | | | | | | | | | |
| | | |
Cost of investments in non-affiliates | | $ | 5,371,661 | | | $ | 1,876,921 | | | $ | 2,992,453 | |
Cost of investments in affiliates | | | 67,534 | | | | 39,324 | | | | 15,690 | |
Investment securities on loan, at value | | | 135,257 | | | | 47,406 | | | | 132,610 | |
Cost of investment of cash collateral | | | 138,088 | | | | 47,708 | | | | 133,998 | |
| (a) | Total distributable earnings have been aggregated to conform to the current presentation requirements for the adoption of the Securities and Exchange Commission’s Disclosure Update and Simplification Rule. See Note 8. |
| (b) | Per share amounts may not recalculate due to rounding of net assets and/or shares outstanding. |
| (c) | Redemption price for Class C Shares varies based upon length of time the shares are held. |
SEE NOTES TO FINANCIAL STATEMENTS.
| | | | | | | | |
| | | |
| DECEMBER 31, 2018 | | J.P. MORGAN MID CAP/MULTI-CAP FUNDS | | | | | 29 | |
STATEMENTS OF ASSETS AND LIABILITIES
AS OF DECEMBER 31, 2018 (Unaudited)(continued)
(Amounts in thousands, except per share amounts)
| | | | | | | | |
| | | JPMorgan Mid
Cap Value
Fund | | | JPMorgan
Value
Advantage
Fund | |
ASSETS: | | | | | | | | |
Investments in non-affiliates, at value | | $ | 14,969,376 | | | $ | 9,829,912 | |
Investments in affiliates, at value | | | 286,144 | | | | 89,301 | |
Investment of cash collateral received from securities loaned, at value (Note 2.B.) | | | 103,483 | | | | 75,166 | |
Receivables: | | | | | | | | |
Fund shares sold | | | 38,379 | | | | 21,175 | |
Interest and dividends from non-affiliates | | | 25,360 | | | | 12,782 | |
Dividends from affiliates | | | 782 | | | | 253 | |
Securities lending income (Note 2.B.) | | | 48 | | | | 13 | |
| | | | | | | | |
Total Assets | | | 15,423,572 | | | | 10,028,602 | |
| | | | | | | | |
| | |
LIABILITIES: | | | | | | | | |
Payables: | | | — | | | | — | |
Collateral received on securities loaned (Note 2.B.) | | | 103,483 | | | | 75,166 | |
Fund shares redeemed | | | 283,621 | | | | 68,276 | |
Accrued liabilities: | | | | | | | | |
Investment advisory fees | | | 8,526 | | | | 5,138 | |
Administration fees | | | 965 | | | | 347 | |
Distribution fees | | | 493 | | | | 578 | |
Service fees | | | 1,183 | | | | 1,063 | |
Custodian and accounting fees | | | 116 | | | | 76 | |
Trustees’ and Chief Compliance Officer’s fees | | | 13 | | | | 1 | |
Other | | | 1,022 | | | | 610 | |
| | | | | | | | |
Total Liabilities | | | 399,422 | | | | 151,255 | |
| | | | | | | | |
Net Assets | | $ | 15,024,150 | | | $ | 9,877,347 | |
| | | | | | | | |
SEE NOTES TO FINANCIAL STATEMENTS.
| | | | | | |
| | | |
| 30 | | | | J.P. MORGAN MID CAP/MULTI-CAP FUNDS | | DECEMBER 31, 2018 |
| | | | | | | | |
| | | JPMorgan Mid
Cap Value
Fund | | | JPMorgan
Value
Advantage
Fund | |
NET ASSETS: | | | | | | | | |
Paid-in-Capital | | $ | 11,014,246 | | | $ | 8,195,257 | |
Total distributable earnings (loss) (a) | | | 4,009,904 | | | | 1,682,090 | |
| | | | | | | | |
Total Net Assets | | $ | 15,024,150 | | | $ | 9,877,347 | |
| | | | | | | | |
| | |
Net Assets: | | | | | | | | |
Class A | | $ | 1,514,797 | | | $ | 1,113,086 | |
Class C | | | 164,325 | | | | 498,528 | |
Class I | | | 2,323,938 | | | | 2,224,973 | |
Class L | | | 9,701,063 | | | | 2,388,550 | |
Class R2 | | | 68,776 | | | | 36 | |
Class R3 | | | 61,548 | | | | 1,763 | |
Class R4 | | | 22,364 | | | | 15,703 | |
Class R5 | | | 73,299 | | | | 6,310 | |
Class R6 | | | 1,094,040 | | | | 3,628,398 | |
| | | | | | | | |
Total | | $ | 15,024,150 | | | $ | 9,877,347 | |
| | | | | | | | |
| | |
Outstanding units of beneficial interest (shares) | | | | | | | | |
($0.0001 par value; unlimited number of shares authorized): | | | | | | | | |
Class A | | | 46,982 | | | | 36,603 | |
Class C | | | 5,305 | | | | 16,431 | |
Class I | | | 71,306 | | | | 72,833 | |
Class L | | | 294,128 | | | | 78,189 | |
Class R2 | | | 2,228 | | | | 1 | |
Class R3 | | | 1,925 | | | | 59 | |
Class R4 | | | 690 | | | | 516 | |
Class R5 | | | 2,225 | | | | 207 | |
Class R6 | | | 33,189 | | | | 118,920 | |
| | |
Net Asset Value (b): | | | | | | | | |
Class A — Redemption price per share | | $ | 32.24 | | | $ | 30.41 | |
Class C — Offering price per share (c) | | | 30.98 | | | | 30.34 | |
Class I — Offering and redemption price per share | | | 32.59 | | | | 30.55 | |
Class L — Offering and redemption price per share | | | 32.98 | | | | 30.55 | |
Class R2 — Offering and redemption price per share | | | 30.86 | | | | 30.26 | |
Class R3 — Offering and redemption price per share | | | 31.97 | | | | 30.08 | |
Class R4 — Offering and redemption price per share | | | 32.43 | | | | 30.42 | |
Class R5 — Offering and redemption price per share | | | 32.95 | | | | 30.49 | |
Class R6 — Offering and redemption price per share | | | 32.96 | | | | 30.51 | |
Class A maximum sales charge | | | 5.25 | % | | | 5.25 | % |
Class A maximum public offering price per share
[net asset value per share/(100% — maximum sales charge)] | | $ | 34.03 | | | $ | 32.09 | |
| | | | | | | | |
| | |
Cost of investments in non-affiliates | | $ | 11,042,473 | | | $ | 8,164,982 | |
Cost of investments in affiliates | | | 286,144 | | | | 89,301 | |
Investment securities on loan, at value | | | 101,814 | | | | 73,853 | |
Cost of investment of cash collateral | | | 103,483 | | | | 75,166 | |
| (a) | Total distributable earnings have been aggregated to conform to the current presentation requirements for the adoption of the Securities and Exchange Commission’s Disclosure Update and Simplification Rule. See Note 8. |
| (b) | Per share amounts may not recalculate due to rounding of net assets and/or shares outstanding. |
| (c) | Redemption price for Class C Shares varies based upon length of time the shares are held. |
SEE NOTES TO FINANCIAL STATEMENTS.
| | | | | | | | |
| | | |
| DECEMBER 31, 2018 | | J.P. MORGAN MID CAP/MULTI-CAP FUNDS | | | | | 31 | |
STATEMENTS OF OPERATIONS
FOR THE SIX MONTHS ENDED DECEMBER 31, 2018 (Unaudited)
(Amounts in thousands)
| | | | | | | | | | | | |
| | | JPMorgan
Growth
Advantage
Fund | | | JPMorgan
Mid Cap
Equity Fund | | | JPMorgan
Mid Cap
Growth
Fund | |
INVESTMENT INCOME: | | | | | | | | | | | | |
Interest income from non-affiliates | | $ | 1 | | | $ | — | (a) | | $ | 1 | |
Interest income from affiliates | | | — | (a) | | | — | (a) | | | — | (a) |
Dividend income from non-affiliates | | | 26,231 | | | | 21,390 | | | | 10,729 | |
Dividend income from affiliates | | | 2,606 | | | | 917 | | | | 1,290 | |
Income from securities lending (net) | | | 74 | | | | 28 | | | | 82 | |
| | | | | | | | | | | | |
Total investment income | | | 28,912 | | | | 22,335 | | | | 12,102 | |
| | | | | | | | | | | | |
| | | |
EXPENSES: | | | | | | | | | | | | |
Investment advisory fees | | | 29,064 | | | | 8,935 | | | | 13,067 | |
Administration fees | | | 3,626 | | | | 1,115 | | | | 1,630 | |
Distribution fees: | | | | | | | | | | | | |
Class A | | | 2,171 | | | | 508 | | | | 1,170 | |
Class C | | | 2,859 | | | | 99 | | | | 304 | |
Class R2 | | | — | (a) | | | 1 | | | | 100 | |
Class R3 | | | — | (a) | | | — | | | | 35 | |
Service fees: | | | | | | | | | | | | |
Class A | | | 2,171 | | | | 508 | | | | 1,170 | |
Class C | | | 953 | | | | 33 | | | | 101 | |
Class I | | | 2,349 | | | | 393 | | | | 1,420 | |
Class R2 | | | — | (a) | | | 1 | | | | 50 | |
Class R3 | | | — | (a) | | | — | | | | 35 | |
Class R4 | | | 16 | | | | — | | | | 19 | |
Class R5 | | | 58 | | | | 3 | | | | 156 | |
Custodian and accounting fees | | | 112 | | | | 38 | | | | 59 | |
Interest expense to affiliates | | | — | | | | 1 | | | | — | |
Professional fees | | | 71 | | | | 41 | | | | 45 | |
Trustees’ and Chief Compliance Officer’s fees | | | 30 | | | | 17 | | | | 21 | |
Printing and mailing costs | | | 220 | | | | 48 | | | | 121 | |
Registration and filing fees | | | 177 | | | | 80 | | | | 81 | |
Transfer agency fees (See Note 2.E.) | | | 117 | | | | 26 | | | | 197 | |
Other | | | 77 | | | | 21 | | | | 36 | |
| | | | | | | | | | | | |
Total expenses | | | 44,071 | | | | 11,868 | | | | 19,817 | |
| | | | | | | | | | | | |
Less fees waived | | | (5,166 | ) | | | (1,621 | ) | | | (940 | ) |
Less expense reimbursements | | | (12 | ) | | | — | | | | (8 | ) |
| | | | | | | | | | | | |
Net expenses | | | 38,893 | | | | 10,247 | | | | 18,869 | |
| | | | | | | | | | | | |
Net investment income (loss) | | | (9,981 | ) | | | 12,088 | | | | (6,767 | ) |
| | | | | | | | | | | | |
| | | |
REALIZED/UNREALIZED GAINS (LOSSES): | | | | | | | | | | | | |
Net realized gain (loss) on transactions from investments in non-affiliates | | | 323,813 | | | | 68,104 | | | | 26,218 | |
Change in net unrealized appreciation/depreciation on investments in non-affiliates | | | (1,279,138 | ) | | | (373,677 | ) | | | (444,145 | ) |
| | | | | | | | | | | | |
Net realized/unrealized gains (losses) | | | (955,325 | ) | | | (305,573 | ) | | | (417,927 | ) |
| | | | | | | | | | | | |
Change in net assets resulting from operations | | $ | (965,306 | ) | | $ | (293,485 | ) | | $ | (424,694 | ) |
| | | | | | | | | | | | |
| (a) | Amount rounds to less than one thousand. |
SEE NOTES TO FINANCIAL STATEMENTS.
| | | | | | |
| | | |
| 32 | | | | J.P. MORGAN MID CAP/MULTI-CAP FUNDS | | DECEMBER 31, 2018 |
| | | | | | | | |
| | | JPMorgan Mid
Cap Value
Fund | | | JPMorgan
Value
Advantage
Fund | |
INVESTMENT INCOME: | | | | | | | | |
Interest income from non-affiliates | | $ | — | (a) | | $ | — | (a) |
Interest income from affiliates | | | — | (a) | | | — | (a) |
Dividend income from non-affiliates | | | 234,395 | | | | 162,477 | |
Dividend income from affiliates | | | 6,229 | | | | 2,637 | |
Income from securities lending (net) | | | 99 | | | | 23 | |
| | | | | | | | |
Total investment income | | | 240,723 | | | | 165,137 | |
| | | | | | | | |
| | |
EXPENSES: | | | | | | | | |
Investment advisory fees | | | 58,889 | | | | 37,442 | |
Administration fees | | | 7,348 | | | | 4,672 | |
Distribution fees: | | | | | | | | |
Class A | | | 2,303 | | | | 1,635 | |
Class C | | | 751 | | | | 2,177 | |
Class R2 | | | 203 | | | | — | (a) |
Class R3 | | | 86 | | | | 2 | |
Service fees: | | | | | | | | |
Class A | | | 2,303 | | | | 1,635 | |
Class C | | | 251 | | | | 726 | |
Class I | | | 3,593 | | | | 3,073 | |
Class L | | | 5,867 | | | | 1,553 | |
Class R2 | | | 101 | | | | — | (a) |
Class R3 | | | 86 | | | | 2 | |
Class R4 | | | 25 | | | | 22 | |
Class R5 | | | 42 | | | | 3 | |
Custodian and accounting fees | | | 231 | | | | 151 | |
Professional fees | | | 106 | | | | 88 | |
Trustees’ and Chief Compliance Officer’s fees | | | 38 | | | | 34 | |
Printing and mailing costs | | | 427 | | | | 226 | |
Registration and filing fees | | | 233 | | | | 214 | |
Transfer agency fees (See Note 2.E.) | | | 440 | | | | 118 | |
Other | | | 169 | | | | 89 | |
| | | | | | | | |
Total expenses | | | 83,492 | | | | 53,862 | |
| | | | | | | | |
Less fees waived | | | (6,713 | ) | | | (6,432 | ) |
Less expense reimbursements | | | (97 | ) | | | (12 | ) |
| | | | | | | | |
Net expenses | | | 76,682 | | | | 47,418 | |
| | | | | | | | |
Net investment income (loss) | | | 164,041 | | | | 117,719 | |
| | | | | | | | |
| | |
REALIZED/UNREALIZED GAINS (LOSSES): | | | | | | | | |
Net realized gain (loss) on transactions from: | | | | | | | | |
Investments in non-affiliates | | | 421,731 | | | | 244,627 | |
Investments in affiliates | | | — | (a) | | | — | |
| | | | | | | | |
Net realized gain (loss) | | | 421,731 | | | | 244,627 | |
| | | | | | | | |
Change in net unrealized appreciation/depreciation on investments in non-affiliates | | | (2,622,701 | ) | | | (1,231,117 | ) |
| | | | | | | | |
Net realized/unrealized gains (losses) | | | (2,200,970 | ) | | | (986,490 | ) |
| | | | | | | | |
Change in net assets resulting from operations | | $ | (2,036,929 | ) | | $ | (868,771 | ) |
| | | | | | | | |
| (a) | Amount rounds to less than one thousand. |
SEE NOTES TO FINANCIAL STATEMENTS.
| | | | | | | | |
| | | |
| DECEMBER 31, 2018 | | J.P. MORGAN MID CAP/MULTI-CAP FUNDS | | | | | 33 | |
STATEMENTS OF CHANGES IN NET ASSETS
FOR THE PERIODS INDICATED
(Amounts in thousands)
| | | | | | | | | | | | | | | | |
| | | JPMorgan Growth Advantage Fund | | | JPMorgan Mid Cap Equity Fund | |
| | | Six Months Ended
December 31, 2018
(Unaudited) | | | Year Ended
June 30, 2018 | | | Six Months Ended
December 31, 2018
(Unaudited) | | | Year Ended
June 30, 2018 | |
CHANGE IN NET ASSETS RESULTING FROM OPERATIONS: | | | | | | | | | | | | | | | | |
Net investment income (loss) | | $ | (9,981 | ) | | $ | (24,732 | ) | | $ | 12,088 | | | $ | 11,549 | |
Net realized gain (loss) | | | 323,813 | | | | 694,039 | | | | 68,104 | | | | 280,150 | |
Change in net unrealized appreciation/depreciation | | | (1,279,138 | ) | | | 1,184,781 | | | | (373,677 | ) | | | 63,890 | |
| | | | | | | | | | | | | | | | |
Change in net assets resulting from operations | | | (965,306 | ) | | | 1,854,088 | | | | (293,485 | ) | | | 355,589 | |
| | | | | | | | | | | | | | | | |
| | | | |
DISTRIBUTIONS TO SHAREHOLDERS: (a) | | | | | | | | | | | | | | | | |
Class A | | | (137,182 | ) | | | (69,162 | ) | | | (41,313 | ) | | | (21,659 | ) |
Class C | | | (69,324 | ) | | | (29,276 | ) | | | (2,590 | ) | | | (1,665 | ) |
Class I | | | (147,315 | ) | | | (52,479 | ) | | | (31,866 | ) | | | (20,261 | ) |
Class R2 (b) | | | (5 | ) | | | (1 | ) | | | (47 | ) | | | (22 | ) |
Class R3 | | | (27 | ) | | | (11 | ) | | | — | | | | — | |
Class R4 | | | (957 | ) | | | (1 | ) | | | — | | | | — | |
Class R5 | | | (8,804 | ) | | | (4,273 | ) | | | (621 | ) | | | (317 | ) |
Class R6 | | | (334,548 | ) | | | (165,239 | ) | | | (209,503 | ) | | | (126,390 | ) |
| | | | | | | | | | | | | | | | |
Total distributions to shareholders | | | (698,162 | ) | | | (320,442 | ) | | | (285,940 | ) | | | (170,314 | ) |
| | | | | | | | | | | | | | | | |
| | | | |
CAPITAL TRANSACTIONS: | | | | | | | | | | | | | | | | |
Change in net assets resulting from capital transactions | | | 741,493 | | | | 60,031 | | | | 263,191 | | | | (260,045 | ) |
| | | | | | | | | | | | | | | | |
| | | | |
NET ASSETS: | | | | | | | | | | | | | | | | |
Change in net assets | | | (921,975 | ) | | | 1,593,677 | | | | (316,234 | ) | | | (74,770 | ) |
Beginning of period | | | 8,691,587 | | | | 7,097,910 | | | | 2,733,708 | | | | 2,808,478 | |
| | | | | | | | | | | | | | | | |
End of period | | $ | 7,769,612 | | | $ | 8,691,587 | | | $ | 2,417,474 | | | $ | 2,733,708 | |
| | | | | | | | | | | | | | | | |
| (a) | The prior period distributions have been reclassified to conform to current period presentation for the adoption of the Securities and Exchange Commission’s Disclosure Update and Simplification Rule. See Note 8. Prior period balances were as follows: |
| | | | | | | | |
| | | JPMorgan Growth
Advantage Fund | | | JPMorgan Mid
Cap Equity Fund | |
Class A | | | | | | | | |
From net realized gains | | $ | (69,162 | ) | | $ | (21,659 | ) |
Class C | | | | | | | | |
From net realized gains | | | (29,276 | ) | | | (1,665 | ) |
Class I | | | | | | | | |
From net investment income | | | — | | | | (521 | ) |
From net realized gains | | | (52,479 | ) | | | (19,740 | ) |
Class R2(b) | | | | | | | | |
From net realized gains | | | (1 | ) | | | (22 | ) |
Class R3 | | | | | | | | |
From net realized gains | | | (11 | ) | | | — | |
Class R4 | | | | | | | | |
From net realized gains | | | (1 | ) | | | — | |
Class R5 | | | | | | | | |
From net investment income | | | — | | | | (17 | ) |
From net realized gains | | | (4,273 | ) | | | (300 | ) |
Class R6 | | | | | | | | |
From net investment income | | | — | | | | (7,565 | ) |
From net realized gains | | | (165,239 | ) | | | (118,825 | ) |
| (b) | Commencement of offering of class of shares effective July 31, 2017 for JPMorgan Growth Advantage Fund. |
SEE NOTES TO FINANCIAL STATEMENTS.
| | | | | | |
| | | |
| 34 | | | | J.P. MORGAN MID CAP/MULTI-CAP FUNDS | | DECEMBER 31, 2018 |
| | | | | | | | | | | | | | | | |
| | | JPMorgan Mid Cap Growth Fund | | | JPMorgan Mid Cap Value Fund | |
| | | Six Months Ended
December 31, 2018
(Unaudited) | | | Year Ended
June 30, 2018 | | | Six Months Ended
December 31, 2018
(Unaudited) | | | Year Ended
June 30, 2018 | |
CHANGE IN NET ASSETS RESULTING FROM OPERATIONS: | |
Net investment income (loss) | | $ | (6,767 | ) | | $ | (12,093 | ) | | $ | 164,041 | | | $ | 165,452 | |
Net realized gain (loss) | | | 26,218 | | | | 321,274 | | | | 421,731 | | | | 714,557 | |
Change in net unrealized appreciation/depreciation | | | (444,145 | ) | | | 272,913 | | | | (2,622,701 | ) | | | 323,839 | |
| | | | | | | | | | | | | | | | |
Change in net assets resulting from operations | | | (424,694 | ) | | | 582,094 | | | | (2,036,929 | ) | | | 1,203,848 | |
| | | | | | | | | | | | | | | | |
| | | | |
DISTRIBUTIONS TO SHAREHOLDERS:(a) | | | | | | | | | | | | | | | | |
Class A | | | (64,068 | ) | | | (64,175 | ) | | | (113,824 | ) | | | (50,500 | ) |
Class C | | | (6,859 | ) | | | (6,964 | ) | | | (11,787 | ) | | | (4,819 | ) |
Class I | | | (66,577 | ) | | | (64,653 | ) | | | (180,706 | ) | | | (76,469 | ) |
Class L | | | — | | | | — | | | | (790,206 | ) | | | (339,034 | ) |
Class R2 | | | (2,466 | ) | | | (2,500 | ) | | | (5,220 | ) | | | (1,965 | ) |
Class R3 | | | (1,655 | ) | | | (102 | ) | | | (4,506 | ) | | | (1,355 | ) |
Class R4 | | | (921 | ) | | | (242 | ) | | | (1,721 | ) | | | (385 | ) |
Class R5 | | | (18,376 | ) | | | (16,962 | ) | | | (5,681 | ) | | | (2,165 | ) |
Class R6 | | | (90,888 | ) | | | (63,898 | ) | | | (86,808 | ) | | | (19,369 | ) |
| | | | | | | | | | | | | | | | |
Total distributions to shareholders | | | (251,810 | ) | | | (219,496 | ) | | | (1,200,459 | ) | | | (496,061 | ) |
| | | | | | | | | | | | | | | | |
|
CAPITAL TRANSACTIONS: | |
Change in net assets resulting from capital transactions | | | 285,922 | | | | 466,368 | | | | (22,313 | ) | | | (826,948 | ) |
| | | | | | | | | | | | | | | | |
|
NET ASSETS: | |
Change in net assets | | | (390,582 | ) | | | 828,966 | | | | (3,259,701 | ) | | | (119,161 | ) |
Beginning of period | | | 3,917,244 | | | | 3,088,278 | | | | 18,283,851 | | | | 18,403,012 | |
| | | | | | | | | | | | | | | | |
End of period | | $ | 3,526,662 | | | $ | 3,917,244 | | | $ | 15,024,150 | | | $ | 18,283,851 | |
| | | | | | | | | | | | | | | | |
| (a) | The prior period distributions have been reclassified to conform to current period presentation for the adoption of the Securities and Exchange Commission’s Disclosure Update and Simplification Rule. See Note 8. Prior period balances were as follows: |
| | | | | | | | |
| | | JPMorgan Mid Cap
Growth Fund | | | JPMorgan Mid Cap
Value Fund | |
Class A | | | | | | | | |
From net investment income | | $ | — | | | $ | (10,151 | ) |
From net realized gains | | | (64,175 | ) | | | (40,349 | ) |
Class C | | | | | | | | |
From net realized gains | | | (6,964 | ) | | | (4,819 | ) |
Class I | | | | | | | | |
From net investment income | | | — | | | | (21,474 | ) |
From net realized gains | | | (64,653 | ) | | | (54,995 | ) |
Class L | | | | | | | | |
From net investment income | | | — | | | | (115,010 | ) |
From net realized gains | | | — | | | | (224,024 | ) |
Class R2 | | | | | | | | |
From net investment income | | | — | | | | (285 | ) |
From net realized gains | | | (2,500 | ) | | | (1,680 | ) |
Class R3 | | | | | | | | |
From net investment income | | | — | | | | (401 | ) |
From net realized gains | | | (102 | ) | | | (954 | ) |
Class R4 | | | | | | | | |
From net investment income | | | — | | | | (124 | ) |
From net realized gains | | | (242 | ) | | | (261 | ) |
Class R5 | | | | | | | | |
From net investment income | | | — | | | | (715 | ) |
From net realized gains | | | (16,962 | ) | | | (1,450 | ) |
Class R6 | | | | | | | | |
From net investment income | | | — | | | | (6,725 | ) |
From net realized gains | | | (63,898 | ) | | | (12,644 | ) |
SEE NOTES TO FINANCIAL STATEMENTS.
| | | | | | | | |
| | | |
| DECEMBER 31, 2018 | | J.P. MORGAN MID CAP/MULTI-CAP FUNDS | | | | | 35 | |
STATEMENTS OF CHANGES IN NET ASSETS
FOR THE PERIODS INDICATED (continued)
(Amounts in thousands)
| | | | | | | | |
| | | JPMorgan Value Advantage Fund | |
| | | Six Months Ended
December 31, 2018
(Unaudited) | | | Year Ended
June 30, 2018 | |
CHANGE IN NET ASSETS RESULTING FROM OPERATIONS: | |
Net investment income (loss) | | $ | 117,719 | | | $ | 153,657 | |
Net realized gain (loss) | | | 244,627 | | | | 371,543 | |
Change in net unrealized appreciation/depreciation | | | (1,231,117 | ) | | | 415,090 | |
| | | | | | | | |
Change in net assets resulting from operations | | | (868,771 | ) | | | 940,290 | |
| | | | | | | | |
| | |
DISTRIBUTIONS TO SHAREHOLDERS:(a) | | | | | | | | |
Class A | | | (75,407 | ) | | | (26,776 | ) |
Class C | | | (31,120 | ) | | | (7,814 | ) |
Class I | | | (161,614 | ) | | | (50,925 | ) |
Class L | | | (175,343 | ) | | | (90,228 | ) |
Class R2 (b) | | | (3 | ) | | | — | (c) |
Class R3 | | | (122 | ) | | | (17 | ) |
Class R4 | | | (1,103 | ) | | | (43 | ) |
Class R5 | | | (452 | ) | | | (115 | ) |
Class R6 | | | (263,786 | ) | | | (77,658 | ) |
| | | | | | | | |
Total distributions to shareholders | | | (708,950 | ) | | | (253,576 | ) |
| | | | | | | | |
| | |
CAPITAL TRANSACTIONS: | | | | | | | | |
Change in net assets resulting from capital transactions | | | 70,831 | | | | (360,503 | ) |
| | | | | | | | |
| | |
NET ASSETS: | | | | | | | | |
Change in net assets | | | (1,506,890 | ) | | | 326,211 | |
Beginning of period | | | 11,384,237 | | | | 11,058,026 | |
| | | | | | | | |
End of period | | $ | 9,877,347 | | | $ | 11,384,237 | |
| | | | | | | | |
| (a) | The prior period distributions have been reclassified to conform to current period presentation for the adoption of the Securities and Exchange Commission’s Disclosure Update and Simplification Rule. See Note 8. Prior period balances were as follows: |
| | | | |
| | | JPMorgan Value
Advantage Fund | |
Class A | | | | |
From net investment income | | $ | (12,114 | ) |
From net realized gains | | | (14,662 | ) |
Class C | | | | |
From net investment income | | | (1,306 | ) |
From net realized gains | | | (6,508 | ) |
Class I | | | | |
From net investment income | | | (27,074 | ) |
From net realized gains | | | (23,851 | ) |
Class L | | | | |
From net investment income | | | (51,294 | ) |
From net realized gains | | | (38,934 | ) |
Class R2(b) | | | | |
From net investment income | | | — | (c) |
From net realized gains | | | — | (c) |
Class R3 | | | | |
From net investment income | | | (9 | ) |
From net realized gains | | | (8 | ) |
Class R4 | | | | |
From net investment income | | | (24 | ) |
From net realized gains | | | (19 | ) |
Class R5 | | | | |
From net investment income | | | (65 | ) |
From net realized gains | | | (50 | ) |
Class R6 | | | | |
From net investment income | | | (44,453 | ) |
From net realized gains | | | (33,205 | ) |
| (b) | Commencement of offering of class of shares effective July 31, 2017. |
| (c) | Amount rounds to less than one thousand. |
SEE NOTES TO FINANCIAL STATEMENTS.
| | | | | | |
| | | |
| 36 | | | | J.P. MORGAN MID CAP/MULTI-CAP FUNDS | | DECEMBER 31, 2018 |
| | | | | | | | | | | | | | | | |
| | | JPMorgan Growth Advantage Fund | | | JPMorgan Mid Cap Equity Fund | |
| | | Six Months Ended
December 31, 2018
(Unaudited) | | | Year Ended
June 30, 2018 | | | Six Months Ended
December 31, 2018
(Unaudited) | | | Year Ended
June 30, 2018 | |
CAPITAL TRANSACTIONS: | | | | | | | | | | | | | | | | |
Class A | | | | | | | | | | | | | | | | |
Proceeds from shares issued | | $ | 214,101 | | | $ | 385,379 | | | $ | 49,447 | | | $ | 69,668 | |
Distributions reinvested | | | 134,593 | | | | 67,889 | | | | 41,253 | | | | 21,589 | |
Cost of shares redeemed | | | (248,175 | ) | | | (604,708 | ) | | | (53,826 | ) | | | (90,548 | ) |
| | | | | | | | | | | | | | | | |
Change in net assets resulting from Class A capital transactions | | $ | 100,519 | | | $ | (151,440 | ) | | $ | 36,874 | | | $ | 709 | |
| | | | | | | | | | | | | | | | |
Class C | | | | | | | | | | | | | | | | |
Proceeds from shares issued | | $ | 92,928 | | | $ | 167,812 | | | $ | 1,008 | | | $ | 2,589 | |
Distributions reinvested | | | 66,057 | | | | 27,785 | | | | 2,589 | | | | 1,665 | |
Cost of shares redeemed | | | (83,772 | ) | | | (179,201 | ) | | | (4,470 | ) | | | (8,820 | ) |
| | | | | | | | | | | | | | | | |
Change in net assets resulting from Class C capital transactions | | $ | 75,213 | | | $ | 16,396 | | | $ | (873 | ) | | $ | (4,566 | ) |
| | | | | | | | | | | | | | | | |
Class I | | | | | | | | | | | | | | | | |
Proceeds from shares issued | | $ | 425,158 | | | $ | 820,383 | | | $ | 24,303 | | | $ | 67,824 | |
Distributions reinvested | | | 135,181 | | | | 48,329 | | | | 31,662 | | | | 19,948 | |
Cost of shares redeemed | | | (315,905 | ) | | | (1,088,919 | ) | | | (48,681 | ) | | | (567,749 | ) |
| | | | | | | | | | | | | | | | |
Change in net assets resulting from Class I capital transactions | | $ | 244,434 | | | $ | (220,207 | ) | | $ | 7,284 | | | $ | (479,977 | ) |
| | | | | | | | | | | | | | | | |
Class R2 (a) | | | | | | | | | | | | | | | | |
Proceeds from shares issued | | $ | 17 | | | $ | 40 | | | $ | 34 | | | $ | 75 | |
Distributions reinvested | | | 5 | | | | 1 | | | | 40 | | | | 19 | |
Cost of shares redeemed | | | (4 | ) | | | (2 | ) | | | (2 | ) | | | (284 | ) |
| | | | | | | | | | | | | | | | |
Change in net assets resulting from Class R2 capital transactions | | $ | 18 | | | $ | 39 | | | $ | 72 | | | $ | (190 | ) |
| | | | | | | | | | | | | | | | |
Class R3 | | | | | | | | | | | | | | | | |
Proceeds from shares issued | | $ | 92 | | | $ | 379 | | | $ | — | | | $ | — | |
Distributions reinvested | | | 27 | | | | 11 | | | | — | | | | — | |
Cost of shares redeemed | | | — | (b) | | | (187 | ) | | | — | | | | — | |
| | | | | | | | | | | | | | | | |
Change in net assets resulting from Class R3 capital transactions | | $ | 119 | | | $ | 203 | | | $ | — | | | $ | — | |
| | | | | | | | | | | | | | | | |
Class R4 | | | | | | | | | | | | | | | | |
Proceeds from shares issued | | $ | 3,974 | | | $ | 12,768 | | | $ | — | | | $ | — | |
Distributions reinvested | | | 957 | | | | 1 | | | | — | | | | — | |
Cost of shares redeemed | | | (1,045 | ) | | | (1,127 | ) | | | — | | | | — | |
| | | | | | | | | | | | | | | | |
Change in net assets resulting from Class R4 capital transactions | | $ | 3,886 | | | $ | 11,642 | | | $ | — | | | $ | — | |
| | | | | | | | | | | | | | | | |
Class R5 | | | | | | | | | | | | | | | | |
Proceeds from shares issued | | $ | 12,640 | | | $ | 22,793 | | | $ | — | | | $ | 4,460 | |
Distributions reinvested | | | 8,802 | | | | 4,273 | | | | 621 | | | | 317 | |
Cost of shares redeemed | | | (13,023 | ) | | | (31,002 | ) | | | (595 | ) | | | (361 | ) |
| | | | | | | | | | | | | | | | |
Change in net assets resulting from Class R5 capital transactions | | $ | 8,419 | | | $ | (3,936 | ) | | $ | 26 | | | $ | 4,416 | |
| | | | | | | | | | | | | | | | |
Class R6 | | | | | | | | | | | | | | | | |
Proceeds from shares issued | | $ | 412,977 | | | $ | 1,307,512 | | | $ | 136,277 | | | $ | 659,956 | |
Distributions reinvested | | | 333,918 | | | | 165,238 | | | | 209,472 | | | | 126,386 | |
Cost of shares redeemed | | | (438,010 | ) | | | (1,065,416 | ) | | | (125,941 | ) | | | (566,779 | ) |
| | | | | | | | | | | | | | | | |
Change in net assets resulting from Class R6 capital transactions | | $ | 308,885 | | | $ | 407,334 | | | $ | 219,808 | | | $ | 219,563 | |
| | | | | | | | | | | | | | | | |
Total change in net assets resulting from capital transactions | | $ | 741,493 | | | $ | 60,031 | | | $ | 263,191 | | | $ | (260,045 | ) |
| | | | | | | | | | | | | | | | |
| (a) | Commencement of offering of class of shares effective July 31, 2017 for JPMorgan Growth Advantage Fund. |
| (b) | Amount rounds to less than one thousand. |
SEE NOTES TO FINANCIAL STATEMENTS.
| | | | | | | | |
| | | |
| DECEMBER 31, 2018 | | J.P. MORGAN MID CAP/MULTI-CAP FUNDS | | | | | 37 | |
STATEMENTS OF CHANGES IN NET ASSETS
FOR THE PERIODS INDICATED (continued)
(Amounts in thousands)
| | | | | | | | | | | | | | | | |
| | | JPMorgan Growth Advantage Fund | | | JPMorgan Mid Cap Equity Fund | |
| | | Six Months Ended
December 31, 2018
(Unaudited) | | | Year Ended
June 30, 2018 | | | Six Months Ended
December 31, 2018
(Unaudited) | | | Year Ended
June 30, 2018 | |
SHARE TRANSACTIONS: | |
Class A | |
Issued | | | 10,056 | | | | 19,063 | | | | 997 | | | | 1,371 | |
Reinvested | | | 7,186 | | | | 3,464 | | | | 952 | | | | 435 | |
Redeemed | | | (11,716 | ) | | | (29,518 | ) | | | (1,100 | ) | | | (1,784 | ) |
| | | | | | | | | | | | | | | | |
Change in Class A Shares | | | 5,526 | | | | (6,991 | ) | | | 849 | | | | 22 | |
| | | | | | | | | | | | | | | | |
Class C | |
Issued | | | 4,896 | | | | 9,329 | | | | 21 | | | | 52 | |
Reinvested | | | 4,060 | | | | 1,603 | | | | 63 | | | | 35 | |
Redeemed | | | (4,604 | ) | | | (10,165 | ) | | | (94 | ) | | | (180 | ) |
| | | | | | | | | | | | | | | | |
Change in Class C Shares | | | 4,352 | | | | 767 | | | | (10 | ) | | | (93 | ) |
| | | | | | | | | | | | | | | | |
Class I | |
Issued | | | 19,146 | | | | 39,183 | | | | 475 | | | | 1,338 | |
Reinvested | | | 6,986 | | | | 2,400 | | | | 719 | | | | 396 | |
Redeemed | | | (14,904 | ) | | | (55,106 | ) | | | (961 | ) | | | (11,347 | ) |
| | | | | | | | | | | | | | | | |
Change in Class I Shares | | | 11,228 | | | | (13,523 | ) | | | 233 | | | | (9,613 | ) |
| | | | | | | | | | | | | | | | |
Class R2 (a) | | | | | | | | | | | | | | | | |
Issued | | | 1 | | | | 2 | | | | 1 | | | | 3 | |
Reinvested | | | — | (b) | | | — | (b) | | | 1 | | | | — | (b) |
Redeemed | | | — | (b) | | | — | (b) | | | (1 | ) | | | (6 | ) |
| | | | | | | | | | | | | | | | |
Change in Class R2 Shares | | | 1 | | | | 2 | | | | 1 | | | | (3 | ) |
| | | | | | | | | | | | | | | | |
Class R3 | |
Issued | | | 5 | | | | 20 | | | | — | | | | — | |
Reinvested | | | 1 | | | | — | (b) | | | — | | | | — | |
Redeemed | | | — | (b) | | | (9 | ) | | | — | | | | — | |
| | | | | | | | | | | | | | | | |
Change in Class R3 Shares | | | 6 | | | | 11 | | | | — | | | | — | |
| | | | | | | | | | | | | | | | |
Class R4 | |
Issued | | | 196 | | | | 587 | | | | — | | | | — | |
Reinvested | | | 50 | | | | — | (b) | | | — | | | | — | |
Redeemed | | | (46 | ) | | | (51 | ) | | | — | | | | — | |
| | | | | | | | | | | | | | | | |
Change in Class R4 Shares | | | 200 | | | | 536 | | | | — | | | | — | |
| | | | | | | | | | | | | | | | |
Class R5 | |
Issued | | | 546 | | | | 1,072 | | | | — | | | | 88 | |
Reinvested | | | 446 | | | | 209 | | | | 14 | | | | 6 | |
Redeemed | | | (586 | ) | | | (1,457 | ) | | | (11 | ) | | | (7 | ) |
| | | | | | | | | | | | | | | | |
Change in Class R5 Shares | | | 406 | | | | (176 | ) | | | 3 | | | | 87 | |
| | | | | | | | | | | | | | | | |
Class R6 | |
Issued | | | 18,215 | | | | 63,769 | | | | 2,657 | | | | 13,118 | |
Reinvested | | | 16,814 | | | | 8,033 | | | | 4,754 | | | | 2,502 | |
Redeemed | | | (19,598 | ) | | | (49,818 | ) | | | (2,445 | ) | | | (10,935 | ) |
| | | | | | | | | | | | | | | | |
Change in Class R6 Shares | | | 15,431 | | | | 21,984 | | | | 4,966 | | | | 4,685 | |
| | | | | | | | | | | | | | | | |
| (a) | Commencement of offering of class of shares effective July 31, 2017 for JPMorgan Growth Advantage Fund. |
| (b) | Amount rounds to less than one thousand. |
SEE NOTES TO FINANCIAL STATEMENTS.
| | | | | | |
| | | |
| 38 | | | | J.P. MORGAN MID CAP/MULTI-CAP FUNDS | | DECEMBER 31, 2018 |
| | | | | | | | | | | | | | | | |
| | | JPMorgan Mid Cap Growth Fund | | | JPMorgan Mid Cap Value Fund | |
| | | Six Months Ended
December 31, 2018
(Unaudited) | | | Year Ended
June 30, 2018 | | | Six Months Ended
December 31, 2018
(Unaudited) | | | Year Ended
June 30, 2018 | |
CAPITAL TRANSACTIONS: | | | | | | | | | | | | | | | | |
Class A | | | | | | | | | | | | | | | | |
Proceeds from shares issued | | $ | 56,848 | | | $ | 118,397 | | | $ | 118,629 | | | $ | 363,088 | |
Distributions reinvested | | | 61,839 | | | | 61,743 | | | | 101,730 | | | | 45,299 | |
Cost of shares redeemed | | | (81,894 | ) | | | (251,332 | ) | | | (357,388 | ) | | | (671,647 | ) |
| | | | | | | | | | | | | | | | |
Change in net assets resulting from Class A capital transactions | | $ | 36,793 | | | $ | (71,192 | ) | | $ | (137,029 | ) | | $ | (263,260 | ) |
| | | | | | | | | | | | | | | | |
Class C | | | | | | | | | | | | | | | | |
Proceeds from shares issued | | $ | 8,903 | | | $ | 14,077 | | | $ | 11,161 | | | $ | 7,880 | |
Distributions reinvested | | | 6,348 | | | | 6,179 | | | | 10,374 | | | | 4,180 | |
Cost of shares redeemed | | | (14,693 | ) | | | (35,034 | ) | | | (37,393 | ) | | | (263,384 | ) |
| | | | | | | | | | | | | | | | |
Change in net assets resulting from Class C capital transactions | | $ | 558 | | | $ | (14,778 | ) | | $ | (15,858 | ) | | $ | (251,324 | ) |
| | | | | | | | | | | | | | | | |
Class I | | | | | | | | | | | | | | | | |
Proceeds from shares issued | | $ | 115,935 | | | $ | 339,754 | | | $ | 413,271 | | | $ | 751,430 | |
Distributions reinvested | | | 63,129 | | | | 61,456 | | | | 166,354 | | | | 70,707 | |
Cost of shares redeemed | | | (187,907 | ) | | | (427,645 | ) | | | (747,800 | ) | | | (851,133 | ) |
| | | | | | | | | | | | | | | | |
Change in net assets resulting from Class I capital transactions | | $ | (8,843 | ) | | $ | (26,435 | ) | | $ | (168,175 | ) | | $ | (28,996 | ) |
| | | | | | | | | | | | | | | | |
Class L | | | | | | | | | | | | | | | | |
Proceeds from shares issued | | $ | — | | | $ | — | | | $ | 961,927 | | | $ | 1,968,939 | |
Distributions reinvested | | | — | | | | — | | | | 713,339 | | | | 306,493 | |
Cost of shares redeemed | | | — | | | | — | | | | (1,659,990 | ) | | | (3,432,839 | ) |
| | | | | | | | | | | | | | | | |
Change in net assets resulting from Class L capital transactions | | $ | — | | | $ | — | | | $ | 15,276 | | | $ | (1,157,407 | ) |
| | | | | | | | | | | | | | | | |
Class R2 | | | | | | | | | | | | | | | | |
Proceeds from shares issued | | $ | 6,220 | | | $ | 14,239 | | | $ | 7,637 | | | $ | 17,627 | |
Distributions reinvested | | | 2,347 | | | | 2,362 | | | | 4,936 | | | | 1,815 | |
Cost of shares redeemed | | | (6,333 | ) | | | (17,165 | ) | | | (11,347 | ) | | | (25,651 | ) |
| | | | | | | | | | | | | | | | |
Change in net assets resulting from Class R2 capital transactions | | $ | 2,234 | | | $ | (564 | ) | | $ | 1,226 | | | $ | (6,209 | ) |
| | | | | | | | | | | | | | | | |
Class R3 | | | | | | | | | | | | | | | | |
Proceeds from shares issued | | $ | 4,397 | | | $ | 27,693 | | | $ | 16,804 | | | $ | 51,385 | |
Distributions reinvested | | | 1,655 | | | | 102 | | | | 4,297 | | | | 1,347 | |
Cost of shares redeemed | | | (3,935 | ) | | | (1,822 | ) | | | (9,500 | ) | | | (10,294 | ) |
| | | | | | | | | | | | | | | | |
Change in net assets resulting from Class R3 capital transactions | | $ | 2,117 | | | $ | 25,973 | | | $ | 11,601 | | | $ | 42,438 | |
| | | | | | | | | | | | | | | | |
Class R4 | | | | | | | | | | | | | | | | |
Proceeds from shares issued | | $ | 3,101 | | | $ | 14,393 | | | $ | 8,478 | | | $ | 18,175 | |
Distributions reinvested | | | 921 | | | | 242 | | | | 1,720 | | | | 385 | |
Cost of shares redeemed | | | (1,935 | ) | | | (897 | ) | | | (1,306 | ) | | | (4,544 | ) |
| | | | | | | | | | | | | | | | |
Change in net assets resulting from Class R4 capital transactions | | $ | 2,087 | | | $ | 13,738 | | | $ | 8,892 | | | $ | 14,016 | |
| | | | | | | | | | | | | | | | |
Class R5 | | | | | | | | | | | | | | | | |
Proceeds from shares issued | | $ | 45,206 | | | $ | 79,191 | | | $ | 8,248 | | | $ | 70,982 | |
Distributions reinvested | | | 17,215 | | | | 15,915 | | | | 5,681 | | | | 2,165 | |
Cost of shares redeemed | | | (57,457 | ) | | | (59,057 | ) | | | (9,664 | ) | | | (21,198 | ) |
| | | | | | | | | | | | | | | | |
Change in net assets resulting from Class R5 capital transactions | | $ | 4,964 | | | $ | 36,049 | | | $ | 4,265 | | | $ | 51,949 | |
| | | | | | | | | | | | | | | | |
Class R6 | | | | | | | | | | | | | | | | |
Proceeds from shares issued | | $ | 311,844 | | | $ | 649,363 | | | $ | 348,686 | | | $ | 924,565 | |
Distributions reinvested | | | 90,442 | | | | 63,657 | | | | 82,670 | | | | 18,935 | |
Cost of shares redeemed | | | (156,274 | ) | | | (209,443 | ) | | | (173,867 | ) | | | (171,655 | ) |
| | | | | | | | | | | | | | | | |
Change in net assets resulting from Class R6 capital transactions | | $ | 246,012 | | | $ | 503,577 | | | $ | 257,489 | | | $ | 771,845 | |
| | | | | | | | | | | | | | | | |
Total change in net assets resulting from capital transactions | | $ | 285,922 | | | $ | 466,368 | | | $ | (22,313 | ) | | $ | (826,948 | ) |
| | | | | | | | | | | | | | | | |
SEE NOTES TO FINANCIAL STATEMENTS.
| | | | | | | | |
| | | |
| DECEMBER 31, 2018 | | J.P. MORGAN MID CAP/MULTI-CAP FUNDS | | | | | 39 | |
STATEMENTS OF CHANGES IN NET ASSETS
FOR THE PERIODS INDICATED (continued)
(Amounts in thousands)
| | | | | | | | | | | | | | | | |
| | | JPMorgan Mid Cap Growth Fund | | | JPMorgan Mid Cap Value Fund | |
| | | Six Months Ended
December 31, 2018
(Unaudited) | | | Year Ended
June 30, 2018 | | | Six Months Ended
December 31, 2018
(Unaudited) | | | Year Ended
June 30, 2018 | |
SHARE TRANSACTIONS: | |
Class A | |
Issued | | | 1,861 | | | | 3,941 | | | | 3,164 | | | | 9,353 | |
Reinvested | | | 2,301 | | | | 2,145 | | | | 2,966 | | | | 1,153 | |
Redeemed | | | (2,719 | ) | | | (8,462 | ) | | | (9,276 | ) | | | (17,242 | ) |
| | | | | | | | | | | | | | | | |
Change in Class A Shares | | | 1,443 | | | | (2,376 | ) | | | (3,146 | ) | | | (6,736 | ) |
| | | | | | | | | | | | | | | | |
Class C | |
Issued | | | 381 | | | | 586 | | | | 334 | | | | 210 | |
Reinvested | | | 306 | | | | 271 | | | | 315 | | | | 111 | |
Redeemed | | | (613 | ) | | | (1,457 | ) | | | (1,032 | ) | | | (7,079 | ) |
| | | | | | | | | | | | | | | | |
Change in Class C Shares | | | 74 | | | | (600 | ) | | | (383 | ) | | | (6,758 | ) |
| | | | | | | | | | | | | | | | |
Class I | |
Issued | | | 3,302 | | | | 9,954 | | | | 11,025 | | | | 19,096 | |
Reinvested | | | 2,019 | | | | 1,861 | | | | 4,798 | | | | 1,778 | |
Redeemed | | | (5,511 | ) | | | (12,666 | ) | | | (19,721 | ) | | | (21,586 | ) |
| | | | | | | | | | | | | | | | |
Change in Class I Shares | | | (190 | ) | | | (851 | ) | | | (3,898 | ) | | | (712 | ) |
| | | | | | | | | | | | | | | | |
Class L | |
Issued | | | — | | | | — | | | | 24,439 | | | | 49,400 | |
Reinvested | | | — | | | | — | | | | 20,337 | | | | 7,611 | |
Redeemed | | | — | | | | — | | | | (43,991 | ) | | | (86,072 | ) |
| | | | | | | | | | | | | | | | |
Change in Class L Shares | | | — | | | | — | | | | 785 | | | | (29,061 | ) |
| | | | | | | | | | | | | | | | |
Class R2 | |
Issued | | | 185 | | | | 437 | | | | 207 | | | | 472 | |
Reinvested | | | 80 | | | | 75 | | | | 150 | | | | 48 | |
Redeemed | | | (192 | ) | | | (526 | ) | | | (310 | ) | | | (686 | ) |
| | | | | | | | | | | | | | | | |
Change in Class R2 Shares | | | 73 | | | | (14 | ) | | | 47 | | | | (166 | ) |
| | | | | | | | | | | | | | | | |
Class R3 | |
Issued | | | 125 | | | | 799 | | | | 436 | | | | 1,326 | |
Reinvested | | | 53 | | | | 3 | | | | 127 | | | | 34 | |
Redeemed | | | (113 | ) | | | (51 | ) | | | (244 | ) | | | (265 | ) |
| | | | | | | | | | | | | | | | |
Change in Class R3 Shares | | | 65 | | | | 751 | | | | 319 | | | | 1,095 | |
| | | | | | | | | | | | | | | | |
Class R4 | |
Issued | | | 86 | | | | 419 | | | | 221 | | | | 464 | |
Reinvested | | | 30 | | | | 7 | | | | 50 | | | | 10 | |
Redeemed | | | (55 | ) | | | (25 | ) | | | (33 | ) | | | (115 | ) |
| | | | | | | | | | | | | | | | |
Change in Class R4 Shares | | | 61 | | | | 401 | | | | 238 | | | | 359 | |
| | | | | | | | | | | | | | | | |
Class R5 | |
Issued | | | 1,249 | | | | 2,258 | | | | 206 | | | | 1,800 | |
Reinvested | | | 544 | | | | 477 | | | | 162 | | | | 54 | |
Redeemed | | | (1,588 | ) | | | (1,695 | ) | | | (247 | ) | | | (534 | ) |
| | | | | | | | | | | | | | | | |
Change in Class R5 Shares | | | 205 | | | | 1,040 | | | | 121 | | | | 1,320 | |
| | | | | | | | | | | | | | | | |
Class R6 | |
Issued | | | 8,635 | | | | 18,762 | | | | 8,664 | | | | 23,270 | |
Reinvested | | | 2,842 | | | | 1,899 | | | | 2,355 | | | | 471 | |
Redeemed | | | (4,430 | ) | | | (6,005 | ) | | | (4,551 | ) | | | (4,290 | ) |
| | | | | | | | | | | | | | | | |
Change in Class R6 Shares | | | 7,047 | | | | 14,656 | | | | 6,468 | | | | 19,451 | |
| | | | | | | | | | | | | | | | |
SEE NOTES TO FINANCIAL STATEMENTS.
| | | | | | |
| | | |
| 40 | | | | J.P. MORGAN MID CAP/MULTI-CAP FUNDS | | DECEMBER 31, 2018 |
| | | | | | | | |
| | | JPMorgan Value Advantage Fund | |
| | | Six Months Ended
December 31, 2018
(Unaudited) | | | Year Ended
June 30, 2018 | |
CAPITAL TRANSACTIONS: | | | | | | | | |
Class A | | | | | | | | |
Proceeds from shares issued | | $ | 117,960 | | | $ | 302,187 | |
Distributions reinvested | | | 70,886 | | | | 25,163 | |
Cost of shares redeemed | | | (248,814 | ) | | | (497,550 | ) |
| | | | | | | | |
Change in net assets resulting from Class A capital transactions | | $ | (59,968 | ) | | $ | (170,200 | ) |
| | | | | | | | |
Class C | | | | | | | | |
Proceeds from shares issued | | $ | 30,813 | | | $ | 58,391 | |
Distributions reinvested | | | 28,076 | | | | 7,029 | |
Cost of shares redeemed | | | (75,187 | ) | | | (261,978 | ) |
| | | | | | | | |
Change in net assets resulting from Class C capital transactions | | $ | (16,298 | ) | | $ | (196,558 | ) |
| | | | | | | | |
Class I | | | | | | | | |
Proceeds from shares issued | | $ | 697,056 | | | $ | 844,644 | |
Distributions reinvested | | | 145,394 | | | | 44,769 | |
Cost of shares redeemed | | | (545,909 | ) | | | (897,538 | ) |
| | | | | | | | |
Change in net assets resulting from Class I capital transactions | | $ | 296,541 | | | $ | (8,125 | ) |
| | | | | | | | |
Class L | | | | | | | | |
Proceeds from shares issued | | $ | 424,278 | | | $ | 1,135,519 | |
Distributions reinvested | | | 161,936 | | | | 85,647 | |
Cost of shares redeemed | | | (1,081,321 | ) | | | (1,811,163 | ) |
| | | | | | | | |
Change in net assets resulting from Class L capital transactions | | $ | (495,107 | ) | | $ | (589,997 | ) |
| | | | | | | | |
Class R2 (a) | | | | | | | | |
Proceeds from shares issued | | $ | 6 | | | $ | 38 | |
Distributions reinvested | | | 2 | | | | — | (b) |
Cost of shares redeemed | | | (6 | ) | | | (1 | ) |
| | | | | | | | |
Change in net assets resulting from Class R2 capital transactions | | $ | 2 | | | $ | 37 | |
| | | | | | | | |
Class R3 | | | | | | | | |
Proceeds from shares issued | | $ | 849 | | | $ | 793 | |
Distributions reinvested | | | 109 | | | | 14 | |
Cost of shares redeemed | | | (13 | ) | | | (103 | ) |
| | | | | | | | |
Change in net assets resulting from Class R3 capital transactions | | $ | 945 | | | $ | 704 | |
| | | | | | | | |
Class R4 | | | | | | | | |
Proceeds from shares issued | | $ | 1,291 | | | $ | 19,694 | |
Distributions reinvested | | | 1,103 | | | | 43 | |
Cost of shares redeemed | | | (1,447 | ) | | | (2,597 | ) |
| | | | | | | | |
Change in net assets resulting from Class R4 capital transactions | | $ | 947 | | | $ | 17,140 | |
| | | | | | | | |
Class R5 | | | | | | | | |
Proceeds from shares issued | | $ | 1,314 | | | $ | 6,381 | |
Distributions reinvested | | | 452 | | | | 115 | |
Cost of shares redeemed | | | (532 | ) | | | (1,014 | ) |
| | | | | | | | |
Change in net assets resulting from Class R5 capital transactions | | $ | 1,234 | | | $ | 5,482 | |
| | | | | | | | |
Class R6 | | | | | | | | |
Proceeds from shares issued | | $ | 321,398 | | | $ | 1,235,372 | |
Distributions reinvested | | | 263,676 | | | | 77,658 | |
Cost of shares redeemed | | | (242,539 | ) | | | (732,016 | ) |
| | | | | | | | |
Change in net assets resulting from Class R6 capital transactions | | $ | 342,535 | | | $ | 581,014 | |
| | | | | | | | |
Total change in net assets resulting from capital transactions | | $ | 70,831 | | | $ | (360,503 | ) |
| | | | | | | | |
| (a) | Commencement of offering of class of shares effective July 31, 2017. |
| (b) | Amount rounds to less than one thousand. |
SEE NOTES TO FINANCIAL STATEMENTS.
| | | | | | | | |
| | | |
| DECEMBER 31, 2018 | | J.P. MORGAN MID CAP/MULTI-CAP FUNDS | | | | | 41 | |
STATEMENTS OF CHANGES IN NET ASSETS
FOR THE PERIODS INDICATED (continued)
(Amounts in thousands)
| | | | | | | | |
| | | JPMorgan Value Advantage Fund | |
| | | Six Months Ended
December 31, 2018
(Unaudited) | | | Year Ended
June 30, 2018 | |
SHARE TRANSACTIONS: | |
Class A | |
Issued | | | 3,379 | | | | 8,673 | |
Reinvested | | | 2,205 | | | | 704 | |
Redeemed | | | (7,031 | ) | | | (14,215 | ) |
| | | | | | | | |
Change in Class A Shares | | | (1,447 | ) | | | (4,838 | ) |
| | �� | | | | | | |
Class C | |
Issued | | | 893 | | | | 1,674 | |
Reinvested | | | 875 | | | | 198 | |
Redeemed | | | (2,145 | ) | | | (7,551 | ) |
| | | | | | | | |
Change in Class C Shares | | | (377 | ) | | | (5,679 | ) |
| | | | | | | | |
Class I | |
Issued | | | 19,534 | | | | 24,044 | |
Reinvested | | | 4,502 | | | | 1,245 | |
Redeemed | | | (15,701 | ) | | | (25,207 | ) |
| | | | | | | | |
Change in Class I Shares | | | 8,335 | | | | 82 | |
| | | | | | | | |
Class L | |
Issued | | | 11,852 | | | | 32,262 | |
Reinvested | | | 5,015 | | | | 2,380 | |
Redeemed | | | (30,100 | ) | | | (51,546 | ) |
| | | | | | | | |
Change in Class L Shares | | | (13,233 | ) | | | (16,904 | ) |
| | | | | | | | |
Class R2(a) | |
Issued | | | — | (b) | | | 1 | |
Reinvested | | | — | (b) | | | — | (b) |
Redeemed | | | — | (b) | | | — | (b) |
| | | | | | | | |
Change in Class R2 Shares | | | — | (b) | | | 1 | |
| | | | | | | | |
Class R3 | |
Issued | | | 24 | | | | 22 | |
Reinvested | | | 3 | | | | 1 | |
Redeemed | | | — | (b) | | | (3 | ) |
| | | | | | | | |
Change in Class R3 Shares | | | 27 | | | | 20 | |
| | | | | | | | |
Class R4 | |
Issued | | | 36 | | | | 558 | |
Reinvested | | | 34 | | | | 1 | |
Redeemed | | | (40 | ) | | | (74 | ) |
| | | | | | | | |
Change in Class R4 Shares | | | 30 | | | | 485 | |
| | | | | | | | |
Class R5 | |
Issued | | | 36 | | | | 186 | |
Reinvested | | | 14 | | | | 3 | |
Redeemed | | | (15 | ) | | | (29 | ) |
| | | | | | | | |
Change in Class R5 Shares | | | 35 | | | | 160 | |
| | | | | | | | |
Class R6 | |
Issued | | | 8,940 | | | | 35,495 | |
Reinvested | | | 8,179 | | | | 2,160 | |
Redeemed | | | (6,893 | ) | | | (20,295 | ) |
| | | | | | | | |
Change in Class R6 Shares | | | 10,226 | | | | 17,360 | |
| | | | | | | | |
| (a) | Commencement of offering of class of shares effective July 31, 2017. |
| (b) | Amount rounds to less than one thousand. |
SEE NOTES TO FINANCIAL STATEMENTS.
| | | | | | |
| | | |
| 42 | | | | J.P. MORGAN MID CAP/MULTI-CAP FUNDS | | DECEMBER 31, 2018 |
THIS PAGE IS INTENTIONALLY LEFT BLANK
| | | | | | | | |
| | | |
| DECEMBER 31, 2017 | | J.P. MORGAN MID CAP/MULTI-CAP FUNDS | | | | | 43 | |
FINANCIAL HIGHLIGHTS
FOR THE PERIODS INDICATED
| | | | | | | | | | | | | | | | | | | | |
| | | | | | Per share operating performance | |
| | | | | | Investment operations | | | Distributions | |
| | | Net asset
value,
beginning
of period | | | Net
investment
income
(loss) (b) | | | Net realized
and unrealized
gains
(losses) on
investments | | | Total from
investment
operations | | | Net realized
gain | |
JPMorgan Growth Advantage Fund | |
Class A | |
Six Months Ended December 31, 2018 (Unaudited) | | $ | 21.73 | | | $ | (0.05 | ) | | $ | (2.23 | ) | | $ | (2.28 | ) | | | $(1.76 | ) |
Year Ended June 30, 2018 | | | 17.95 | | | | (0.12 | ) | | | 4.74 | | | | 4.62 | | | | (0.84 | ) |
Year Ended June 30, 2017 | | | 14.42 | | | | (0.09 | ) | | | 3.62 | | | | 3.53 | | | | — | |
Year Ended June 30, 2016 | | | 15.74 | | | | (0.08 | ) | | | (0.71 | ) | | | (0.79 | ) | | | (0.53 | ) |
Year Ended June 30, 2015 | | | 14.24 | | | | (0.10 | ) | | | 2.17 | | | | 2.07 | | | | (0.57 | ) |
Year Ended June 30, 2014 | | | 11.43 | | | | (0.07 | ) | | | 3.52 | | | | 3.45 | | | | (0.64 | ) |
|
Class C | |
Six Months Ended December 31, 2018 (Unaudited) | | | 19.16 | | | | (0.09 | ) | | | (1.95 | ) | | | (2.04 | ) | | | (1.76 | ) |
Year Ended June 30, 2018 | | | 15.99 | | | | (0.19 | ) | | | 4.20 | | | | 4.01 | | | | (0.84 | ) |
Year Ended June 30, 2017 | | | 12.91 | | | | (0.15 | ) | | | 3.23 | | | | 3.08 | | | | — | |
Year Ended June 30, 2016 | | | 14.22 | | | | (0.14 | ) | | | (0.64 | ) | | | (0.78 | ) | | | (0.53 | ) |
Year Ended June 30, 2015 | | | 12.98 | | | | (0.15 | ) | | | 1.96 | | | | 1.81 | | | | (0.57 | ) |
Year Ended June 30, 2014 | | | 10.51 | | | | (0.12 | ) | | | 3.23 | | | | 3.11 | | | | (0.64 | ) |
|
Class I | |
Six Months Ended December 31, 2018 (Unaudited) | | | 22.36 | | | | (0.03 | ) | | | (2.29 | ) | | | (2.32 | ) | | | (1.76 | ) |
Year Ended June 30, 2018 | | | 18.40 | | | | (0.07 | ) | | | 4.87 | | | | 4.80 | | | | (0.84 | ) |
Year Ended June 30, 2017 | | | 14.75 | | | | (0.05 | ) | | | 3.70 | | | | 3.65 | | | | — | |
Year Ended June 30, 2016 | | | 16.06 | | | | (0.06 | ) | | | (0.72 | ) | | | (0.78 | ) | | | (0.53 | ) |
Year Ended June 30, 2015 | | | 14.50 | | | | (0.07 | ) | | | 2.20 | | | | 2.13 | | | | (0.57 | ) |
Year Ended June 30, 2014 | | | 11.60 | | | | (0.04 | ) | | | 3.58 | | | | 3.54 | | | | (0.64 | ) |
|
Class R2 | |
Six Months Ended December 31, 2018 (Unaudited) | | | 21.68 | | | | (0.08 | ) | | | (2.22 | ) | | | (2.30 | ) | | | (1.76 | ) |
July 31, 2017 (f) through June 30, 2018 | | | 18.47 | | | | (0.14 | ) | | | 4.19 | | | | 4.05 | | | | (0.84 | ) |
|
Class R3 | |
Six Months Ended December 31, 2018 (Unaudited) | | | 21.74 | | | | (0.05 | ) | | | (2.23 | ) | | | (2.28 | ) | | | (1.76 | ) |
Year Ended June 30, 2018 | | | 17.96 | | | | (0.11 | ) | | | 4.73 | | | | 4.62 | | | | (0.84 | ) |
May 31, 2017 (f) through June 30, 2017 | | | 17.85 | | | | (0.01 | ) | | | 0.12 | | | | 0.11 | | | | — | |
|
Class R4 | |
Six Months Ended December 31, 2018 (Unaudited) | | | 22.36 | | | | (0.03 | ) | | | (2.29 | ) | | | (2.32 | ) | | | (1.76 | ) |
Year Ended June 30, 2018 | | | 18.40 | | | | (0.03 | ) | | | 4.83 | | | | 4.80 | | | | (0.84 | ) |
May 31, 2017 (f) through June 30, 2017 | | | 18.29 | | | | — | (g) | | | 0.11 | | | | 0.11 | | | | — | |
|
Class R5 | |
Six Months Ended December 31, 2018 (Unaudited) | | | 22.76 | | | | (0.01 | ) | | | (2.34 | ) | | | (2.35 | ) | | | (1.76 | ) |
Year Ended June 30, 2018 | | | 18.69 | | | | (0.04 | ) | | | 4.95 | | | | 4.91 | | | | (0.84 | ) |
Year Ended June 30, 2017 | | | 14.96 | | | | (0.03 | ) | | | 3.76 | | | | 3.73 | | | | — | |
Year Ended June 30, 2016 | | | 16.25 | | | | (0.03 | ) | | | (0.73 | ) | | | (0.76 | ) | | | (0.53 | ) |
Year Ended June 30, 2015 | | | 14.63 | | | | (0.04 | ) | | | 2.23 | | | | 2.19 | | | | (0.57 | ) |
Year Ended June 30, 2014 | | | 11.68 | | | | (0.02 | ) | | | 3.61 | | | | 3.59 | | | | (0.64 | ) |
|
Class R6 | |
Six Months Ended December 31, 2018 (Unaudited) | | | 22.87 | | | | — | (g) | | | (2.35 | ) | | | (2.35 | ) | | | (1.76 | ) |
Year Ended June 30, 2018 | | | 18.76 | | | | (0.02 | ) | | | 4.97 | | | | 4.95 | | | | (0.84 | ) |
Year Ended June 30, 2017 | | | 15.00 | | | | (0.01 | ) | | | 3.77 | | | | 3.76 | | | | — | |
Year Ended June 30, 2016 | | | 16.27 | | | | (0.01 | ) | | | (0.73 | ) | | | (0.74 | ) | | | (0.53 | ) |
Year Ended June 30, 2015 | | | 14.64 | | | | (0.03 | ) | | | 2.23 | | | | 2.20 | | | | (0.57 | ) |
December 23, 2013 (f) through June 30, 2014 | | | 13.86 | | | | (0.01 | ) | | | 0.79 | | | | 0.78 | | | | — | |
| (a) | Annualized for periods less than one year, unless otherwise noted. |
| (b) | Calculated based upon average shares outstanding. |
| (c) | Not annualized for periods less than one year. |
| (d) | Includes adjustments in accordance with accounting principles generally accepted in the United States of America and as such, the net asset values for financial reporting purposes and the returns based upon those net asset values may differ from the net asset values and returns for shareholder transactions. |
| (e) | Includes earnings credits and interest expense, if applicable, each of which is less than 0.005% unless otherwise noted. |
| (f) | Commencement of offering of class of shares. |
| (g) | Amount rounds to less than $0.005. |
SEE NOTES TO FINANCIAL STATEMENTS.
| | | | | | |
| | | |
| 44 | | | | J.P. MORGAN MID CAP/MULTI-CAP FUNDS | | DECEMBER 31, 2018 |
| | | | | | | | | | | | | | | | | | | | | | | | | | |
| | | Ratios/Supplemental data | |
| | | | | | | | | | Ratios to average net assets(a) | | | | |
Net asset
value,
end of
period | | | Total return
(excludes
sales charge) (c)(d) | | | Net assets,
end of
period
(000’s) | | | Net
expenses (e) | | | Net
investment
income
(loss) | | |
Expenses
without waivers,
reimbursements and
earnings credits | | | Portfolio
turnover
rate (c) | |
| | | | | | | | | | | | | | | | | | | | | | | | | | |
| | | | | | | | | | | | | | | | | | | | | | | | | | |
| $ | 17.69 | | | | (10.96 | )% | | $ | 1,501,771 | | | | 1.13 | % | | | (0.49 | )% | | | 1.25 | % | | | 20 | % |
| | 21.73 | | | | 26.22 | | | | 1,724,681 | | | | 1.16 | | | | (0.57 | ) | | | 1.25 | | | | 31 | |
| | 17.95 | | | | 24.48 | | | | 1,550,092 | | | | 1.24 | | | | (0.56 | ) | | | 1.32 | | | | 34 | |
| | 14.42 | | | | (5.07 | ) | | | 1,643,136 | | | | 1.25 | | | | (0.55 | ) | | | 1.35 | | | | 46 | |
| | 15.74 | | | | 14.99 | | | | 1,174,260 | | | | 1.24 | | | | (0.65 | ) | | | 1.35 | | | | 46 | |
| | 14.24 | | | | 30.69 | | | | 717,564 | | | | 1.24 | | | | (0.51 | ) | | | 1.31 | | | | 62 | |
| | | | | | |
| | | | | | | | | | | | | | | | | | | | | | | | | | |
| | 15.36 | | | | (11.18 | ) | | | 660,694 | | | | 1.64 | | | | (0.99 | ) | | | 1.75 | | | | 20 | |
| | 19.16 | | | | 25.60 | | | | 740,817 | | | | 1.66 | | | | (1.07 | ) | | | 1.76 | | | | 31 | |
| | 15.99 | | | | 23.86 | | | | 605,999 | | | | 1.74 | | | | (1.06 | ) | | | 1.82 | | | | 34 | |
| | 12.91 | | | | (5.55 | ) | | | 594,190 | | | | 1.75 | | | | (1.04 | ) | | | 1.85 | | | | 46 | |
| | 14.22 | | | | 14.43 | | | | 321,500 | | | | 1.74 | | | | (1.14 | ) | | | 1.84 | | | | 46 | |
| | 12.98 | | | | 30.12 | | | | 144,229 | | | | 1.74 | | | | (1.01 | ) | | | 1.81 | | | | 62 | |
| | | | | | |
| | | | | | | | | | | | | | | | | | | | | | | | | | |
| | 18.28 | | | | (10.82 | ) | | | 1,638,415 | | | | 0.88 | | | | (0.23 | ) | | | 1.00 | | | | 20 | |
| | 22.36 | | | | 26.56 | | | | 1,753,505 | | | | 0.92 | | | | (0.32 | ) | | | 1.00 | | | | 31 | |
| | 18.40 | | | | 24.75 | | | | 1,691,899 | | | | 1.00 | | | | (0.31 | ) | | | 1.04 | | | | 34 | |
| | 14.75 | | | | (4.91 | ) | | | 922,981 | | | | 1.08 | | | | (0.41 | ) | | | 1.09 | | | | 46 | |
| | 16.06 | | | | 15.14 | | | | 1,219,501 | | | | 1.09 | | | | (0.48 | ) | | | 1.09 | | | | 46 | |
| | 14.50 | | | | 31.03 | | | | 975,175 | | | | 1.05 | | | | (0.30 | ) | | | 1.06 | | | | 62 | |
| | | | | | |
| | | | | | | | | | | | | | | | | | | | | | | | | | |
| | 17.62 | | | | (11.07 | ) | | | 49 | | | | 1.39 | | | | (0.73 | ) | | | 1.97 | | | | 20 | |
| | 21.68 | | | | 22.39 | | | | 43 | | | | 1.41 | | | | (0.77 | ) | | | 1.59 | | | | 31 | |
| | | | | | |
| | | | | | | | | | | | | | | | | | | | | | | | | | |
| | 17.70 | | | | (10.95 | ) | | | 321 | | | | 1.13 | | | | (0.47 | ) | | | 1.35 | | | | 20 | |
| | 21.74 | | | | 26.20 | | | | 266 | | | | 1.15 | | | | (0.53 | ) | | | 1.28 | | | | 31 | |
| | 17.96 | | | | 0.62 | | | | 20 | | | | 1.25 | | | | (0.55 | ) | | | 1.25 | | | | 34 | |
| | | | | | |
| | | | | | | | | | | | | | | | | | | | | | | | | | |
| | 18.28 | | | | (10.82 | ) | | | 13,470 | | | | 0.88 | | | | (0.24 | ) | | | 1.00 | | | | 20 | |
| | 22.36 | | | | 26.56 | | | | 12,005 | | | | 0.88 | | | | (0.16 | ) | | | 1.00 | | | | 31 | |
| | 18.40 | | | | 0.60 | | | | 20 | | | | 0.99 | | | | (0.29 | ) | | | 1.00 | | | | 34 | |
| | | | | | |
| | | | | | | | | | | | | | | | | | | | | | | | | | |
| | 18.65 | | | | (10.77 | ) | | | 100,007 | | | | 0.73 | | | | (0.09 | ) | | | 0.85 | | | | 20 | |
| | 22.76 | | | | 26.74 | | | | 112,830 | | | | 0.77 | | | | (0.18 | ) | | | 0.85 | | | | 31 | |
| | 18.69 | | | | 24.93 | | | | 95,952 | | | | 0.85 | | | | (0.17 | ) | | | 0.88 | | | | 34 | |
| | 14.96 | | | | (4.72 | ) | | | 82,358 | | | | 0.89 | | | | (0.20 | ) | | | 0.90 | | | | 46 | |
| | 16.25 | | | | 15.42 | | | | 58,686 | | | | 0.86 | | | | (0.25 | ) | | | 0.87 | | | | 46 | |
| | 14.63 | | | | 31.25 | | | | 1,453,864 | | | | 0.85 | | | | (0.11 | ) | | | 0.86 | | | | 62 | |
| | | | | | |
| | | | | | | | | | | | | | | | | | | | | | | | | | |
| | 18.76 | | | | (10.71 | ) | | | 3,854,885 | | | | 0.63 | | | | 0.01 | | | | 0.75 | | | | 20 | |
| | 22.87 | | | | 26.86 | | | | 4,347,440 | | | | 0.67 | | | | (0.07 | ) | | | 0.75 | | | | 31 | |
| | 18.76 | | | | 25.07 | | | | 3,153,928 | | | | 0.74 | | | | (0.06 | ) | | | 0.75 | | | | 34 | |
| | 15.00 | | | | (4.59 | ) | | | 2,720,935 | | | | 0.76 | | | | (0.07 | ) | | | 0.76 | | | | 46 | |
| | 16.27 | | | | 15.48 | | | | 2,414,333 | | | | 0.76 | | | | (0.17 | ) | | | 0.77 | | | | 46 | |
| | 14.64 | | | | 5.63 | | | | 271,958 | | | | 0.80 | | | | (0.15 | ) | | | 0.82 | | | | 62 | |
SEE NOTES TO FINANCIAL STATEMENTS.
| | | | | | | | |
| | | |
| DECEMBER 31, 2018 | | J.P. MORGAN MID CAP/MULTI-CAP FUNDS | | | | | 45 | |
FINANCIAL HIGHLIGHTS
FOR THE PERIODS INDICATED (continued)
| | | | | | | | | | | | | | | | | | | | |
| | | Per share operating performance | |
| | | Investment operations | | | Distributions | |
| | | Net asset
value,
beginning
of period | | | Net
investment
income
(loss) (b) | | | Net realized
and unrealized
gains
(losses) on
investments | | | Total from
investment
operations | | | Net
investment
income | |
JPMorgan Mid Cap Equity Fund | |
Class A | |
Six Months Ended December 31, 2018 (Unaudited) | | $ | 51.57 | | | $ | 0.12 | | | $ | (5.52 | ) | | $ | (5.40 | ) | | | $(0.13) | |
Year Ended June 30, 2018 | | | 48.53 | | | | — | (f) | | | 5.89 | | | | 5.89 | | | | — | |
Year Ended June 30, 2017 | | | 42.95 | | | | (0.02 | ) | | | 7.02 | | | | 7.00 | | | | (0.05 | ) |
Year Ended June 30, 2016 | | | 47.12 | | | | (0.01 | ) | | | (2.02 | ) | | | (2.03 | ) | | | (0.03 | ) |
Year Ended June 30, 2015 | | | 44.91 | | | | (0.03 | ) | | | 4.32 | | | | 4.29 | | | | (0.02 | ) |
Year Ended June 30, 2014 | | | 38.10 | | | | (0.04 | ) | | | 10.25 | | | | 10.21 | | | | (0.02 | ) |
|
Class C | |
Six Months Ended December 31, 2018 (Unaudited) | | | 49.66 | | | | 0.01 | | | | (5.31 | ) | | | (5.30 | ) | | | — | |
Year Ended June 30, 2018 | | | 47.05 | | | | (0.24 | ) | | | 5.70 | | | | 5.46 | | | | — | |
Year Ended June 30, 2017 | | | 41.85 | | | | (0.25 | ) | | | 6.82 | | | | 6.57 | | | | — | |
Year Ended June 30, 2016 | | | 46.16 | | | | (0.23 | ) | | | (1.97 | ) | | | (2.20 | ) | | | — | |
Year Ended June 30, 2015 | | | 44.21 | | | | (0.25 | ) | | | 4.23 | | | | 3.98 | | | | — | |
Year Ended June 30, 2014 | | | 37.71 | | | | (0.24 | ) | | | 10.12 | | | | 9.88 | | | | — | |
|
Class I | |
Six Months Ended December 31, 2018 (Unaudited) | | | 52.32 | | | | 0.21 | | | | (5.63 | ) | | | (5.42 | ) | | | (0.23 | ) |
Year Ended June 30, 2018 | | | 49.13 | | | | 0.14 | | | | 5.97 | | | | 6.11 | | | | (0.07 | ) |
Year Ended June 30, 2017 | | | 43.41 | | | | 0.14 | | | | 7.09 | | | | 7.23 | | | | (0.14 | ) |
Year Ended June 30, 2016 | | | 47.47 | | | | 0.11 | | | | (1.99 | ) | | | (1.88 | ) | | | (0.07 | ) |
Year Ended June 30, 2015 | | | 45.15 | | | | 0.13 | | | | 4.34 | | | | 4.47 | | | | (0.09 | ) |
Year Ended June 30, 2014 | | | 38.22 | | | | 0.11 | | | | 10.30 | | | | 10.41 | | | | (0.10 | ) |
|
Class R2 | |
Six Months Ended December 31, 2018 (Unaudited) | | | 51.08 | | | | 0.05 | | | | (5.46 | ) | | | (5.41 | ) | | | (0.03 | ) |
Year Ended June 30, 2018 | | | 48.21 | | | | (0.14 | ) | | | 5.86 | | | | 5.72 | | | | — | |
Year Ended June 30, 2017 | | | 42.75 | | | | (0.14 | ) | | | 6.98 | | | | 6.84 | | | | (0.01 | ) |
Year Ended June 30, 2016 | | | 46.98 | | | | (0.13 | ) | | | (1.99 | ) | | | (2.12 | ) | | | — | |
Year Ended June 30, 2015 | | | 44.87 | | | | (0.14 | ) | | | 4.30 | | | | 4.16 | | | | — | |
March 14, 2014 (g) through June 30, 2014 | | | 42.92 | | | | (0.05 | ) | | | 2.01 | | | | 1.96 | | | | (0.01 | ) |
|
Class R5 | |
Six Months Ended December 31, 2018 (Unaudited) | | | 52.35 | | | | 0.25 | | | | (5.64 | ) | | | (5.39 | ) | | | (0.31 | ) |
Year Ended June 30, 2018 | | | 49.17 | | | | 0.24 | | | | 5.94 | | | | 6.18 | | | | (0.15 | ) |
Year Ended June 30, 2017 | | | 43.43 | | | | 0.18 | | | | 7.11 | | | | 7.29 | | | | (0.18 | ) |
Year Ended June 30, 2016 | | | 47.49 | | | | 0.18 | | | | (2.03 | ) | | | (1.85 | ) | | | (0.10 | ) |
Year Ended June 30, 2015 | | | 45.15 | | | | 0.20 | | | | 4.33 | | | | 4.53 | | | | (0.13 | ) |
March 14, 2014 (g) through June 30, 2014 | | | 43.14 | | | | 0.04 | | | | 2.02 | | | | 2.06 | | | | (0.05 | ) |
|
Class R6 | |
Six Months Ended December 31, 2018 (Unaudited) | | | 52.39 | | | | 0.26 | | | | (5.63 | ) | | | (5.37 | ) | | | (0.36 | ) |
Year Ended June 30, 2018 | | | 49.18 | | | | 0.27 | | | | 5.96 | | | | 6.23 | | | | (0.17 | ) |
Year Ended June 30, 2017 | | | 43.44 | | | | 0.21 | | | | 7.09 | | | | 7.30 | | | | (0.19 | ) |
Year Ended June 30, 2016 | | | 47.49 | | | | 0.20 | | | | (2.02 | ) | | | (1.82 | ) | | | (0.12 | ) |
Year Ended June 30, 2015 | | | 45.15 | | | | 0.20 | | | | 4.34 | | | | 4.54 | | | | (0.14 | ) |
March 14, 2014 (g) through June 30, 2014 | | | 43.14 | | | | 0.04 | | | | 2.02 | | | | 2.06 | | | | (0.05 | ) |
| (a) | Annualized for periods less than one year, unless otherwise noted. |
| (b) | Calculated based upon average shares outstanding. |
| (c) | Not annualized for periods less than one year. |
| (d) | Includes adjustments in accordance with accounting principles generally accepted in the United States of America and as such, the net asset values for financial reporting purposes and the returns based upon those net asset values may differ from the net asset values and returns for shareholder transactions. |
| (e) | Includes earnings credits and interest expense, if applicable, each of which is less than 0.005% unless otherwise noted. |
| (f) | Amount rounds to less than $0.005. |
| (g) | Commencement of offering of class of shares. |
SEE NOTES TO FINANCIAL STATEMENTS.
| | | | | | |
| | | |
| 46 | | | | J.P. MORGAN MID CAP/MULTI-CAP FUNDS | | DECEMBER 31, 2018 |
| | | | | | | | | | | | | | | | | | | | | | | | | | | | | | | | | | |
| | | Ratios/Supplemental data | |
| | | | | | | | | | | | | | | | Ratios to average net assets(a) | | | | |
Net
realized
gain | | | Total
distributions | | | Net asset
value,
end of
period | | | Total return
(excludes
sales charge) (c)(d) | | | Net assets,
end of
period
(000’s) | | | Net
expenses (e) | | | Net
investment
income
(loss) | | | Expenses
without waivers,
reimbursements and
earnings credits | | | Portfolio
turnover
rate (c) | |
| | | | | | | | | | | | | | | | | | | | | | | | | | | | | | | | | | |
| | | | | | | | | | | | | | | | | | | | | | | | | | | | | | | | | | |
| | $ (5.14 | ) | | | $(5.27 | ) | | $ | 40.90 | | | | (11.01 | )% | | $ | 354,294 | | | | 1.13 | % | | | 0.48 | % | | | 1.26 | % | | | 17 | % |
| | (2.85 | ) | | | (2.85 | ) | | | 51.57 | | | | 12.37 | | | | 402,897 | | | | 1.17 | | | | 0.01 | | | | 1.25 | | | | 31 | |
| | (1.37 | ) | | | (1.42 | ) | | | 48.53 | | | | 16.61 | | | | 378,055 | | | | 1.24 | | | | (0.05 | ) | | | 1.37 | | | | 38 | |
| | (2.11 | ) | | | (2.14 | ) | | | 42.95 | | | | (4.17 | ) | | | 335,424 | | | | 1.25 | | | | (0.03 | ) | | | 1.43 | | | | 39 | |
| | (2.06 | ) | | | (2.08 | ) | | | 47.12 | | | | 9.99 | | | | 232,320 | | | | 1.24 | | | | (0.06 | ) | | | 1.44 | | | | 41 | |
| | (3.38 | ) | | | (3.40 | ) | | | 44.91 | | | | 27.96 | | | | 156,016 | | | | 1.24 | | | | (0.08 | ) | | | 1.41 | | | | 47 | |
| | | | | | | | |
| | | | | | | | | | | | | | | | | | | | | | | | | | | | | | | | | | |
| | (5.14 | ) | | | (5.14 | ) | | | 39.22 | | | | (11.23 | ) | | | 21,438 | | | | 1.63 | | | | 0.05 | | | | 1.76 | | | | 17 | |
| | (2.85 | ) | | | (2.85 | ) | | | 49.66 | | | | 11.83 | | | | 27,666 | | | | 1.67 | | | | (0.50 | ) | | | 1.76 | | | | 31 | |
| | (1.37 | ) | | | (1.37 | ) | | | 47.05 | | | | 16.01 | | | | 30,596 | | | | 1.74 | | | | (0.56 | ) | | | 1.92 | | | | 38 | |
| | (2.11 | ) | | | (2.11 | ) | | | 41.85 | | | | (4.64 | ) | | | 32,045 | | | | 1.75 | | | | (0.54 | ) | | | 1.96 | | | | 39 | |
| | (2.03 | ) | | | (2.03 | ) | | | 46.16 | | | | 9.44 | | | | 25,597 | | | | 1.74 | | | | (0.56 | ) | | | 1.91 | | | | 41 | |
| | (3.38 | ) | | | (3.38 | ) | | | 44.21 | | | | 27.34 | | | | 20,018 | | | | 1.74 | | | | (0.57 | ) | | | 1.93 | | | | 47 | |
| | | | | | | | |
| | | | | | | | | | | | | | | | | | | | | | | | | | | | | | | | | | |
| | (5.14 | ) | | | (5.37 | ) | | | 41.53 | | | | (10.88 | ) | | | 268,432 | | | | 0.88 | | | | 0.80 | | | | 1.00 | | | | 17 | |
| | (2.85 | ) | | | (2.92 | ) | | | 52.32 | | | | 12.68 | | | | 326,026 | | | | 0.89 | | | | 0.26 | | | | 1.00 | | | | 31 | |
| | (1.37 | ) | | | (1.51 | ) | | | 49.13 | | | | 17.01 | | | | 778,378 | | | | 0.89 | | | | 0.30 | | | | 1.08 | | | | 38 | |
| | (2.11 | ) | | | (2.18 | ) | | | 43.41 | | | | (3.81 | ) | | | 622,440 | | | | 0.90 | | | | 0.25 | | | | 1.20 | | | | 39 | |
| | (2.06 | ) | | | (2.15 | ) | | | 47.47 | | | | 10.35 | | | | 1,773,929 | | | | 0.89 | | | | 0.29 | | | | 1.16 | | | | 41 | |
| | (3.38 | ) | | | (3.48 | ) | | | 45.15 | | | | 28.45 | | | | 1,773,321 | | | | 0.89 | | | | 0.27 | | | | 1.18 | | | | 47 | |
| | | | | | | | |
| | | | | | | | | | | | | | | | | | | | | | | | | | | | | | | | | | |
| | (5.14 | ) | | | (5.17 | ) | | | 40.50 | | | | (11.12 | ) | | | 416 | | | | 1.38 | | | | 0.21 | | | | 1.58 | | | | 17 | |
| | (2.85 | ) | | | (2.85 | ) | | | 51.08 | | | | 12.09 | | | | 443 | | | | 1.43 | | | | (0.28 | ) | | | 1.57 | | | | 31 | |
| | (1.37 | ) | | | (1.38 | ) | | | 48.21 | | | | 16.30 | | | | 600 | | | | 1.49 | | | | (0.31 | ) | | | 1.69 | | | | 38 | |
| | (2.11 | ) | | | (2.11 | ) | | | 42.75 | | | | (4.38 | ) | | | 688 | | | | 1.50 | | | | (0.30 | ) | | | 1.81 | | | | 39 | |
| | (2.05 | ) | | | (2.05 | ) | | | 46.98 | | | | 9.71 | | | | 823 | | | | 1.49 | | | | (0.31 | ) | | | 1.69 | | | | 41 | |
| | — | | | | (0.01 | ) | | | 44.87 | | | | 4.56 | | | | 688 | | | | 1.47 | | | | (0.41 | ) | | | 1.60 | | | | 47 | |
| | | | | | | | |
| | | | | | | | | | | | | | | | | | | | | | | | | | | | | | | | | | |
| | (5.14 | ) | | | (5.45 | ) | | | 41.51 | | | | (10.82 | ) | | | 5,279 | | | | 0.73 | | | | 0.97 | | | | 0.86 | | | | 17 | |
| | (2.85 | ) | | | (3.00 | ) | | | 52.35 | | | | 12.83 | | | | 6,499 | | | | 0.75 | | | | 0.47 | | | | 0.85 | | | | 31 | |
| | (1.37 | ) | | | (1.55 | ) | | | 49.17 | | | | 17.14 | | | | 1,804 | | | | 0.79 | | | | 0.40 | | | | 0.87 | | | | 38 | |
| | (2.11 | ) | | | (2.21 | ) | | | 43.43 | | | | (3.73 | ) | | | 2,840 | | | | 0.80 | | | | 0.42 | | | | 0.91 | | | | 39 | |
| | (2.06 | ) | | | (2.19 | ) | | | 47.49 | | | | 10.49 | | | | 1,636 | | | | 0.79 | | | | 0.43 | | | | 0.88 | | | | 41 | |
| | — | | | | (0.05 | ) | | | 45.15 | | | | 4.77 | | | | 91 | | | | 0.78 | | | | 0.27 | | | | 0.91 | | | | 47 | |
| | | | | | | | |
| | | | | | | | | | | | | | | | | | | | | | | | | | | | | | | | | | |
| | (5.14 | ) | | | (5.50 | ) | | | 41.52 | | | | (10.77 | ) | | | 1,767,615 | | | | 0.63 | | | | 0.99 | | | | 0.75 | | | | 17 | |
| | (2.85 | ) | | | (3.02 | ) | | | 52.39 | | | | 12.93 | | | | 1,970,177 | | | | 0.67 | | | | 0.51 | | | | 0.75 | | | | 31 | |
| | (1.37 | ) | | | (1.56 | ) | | | 49.18 | | | | 17.18 | | | | 1,619,045 | | | | 0.74 | | | | 0.45 | | | | 0.75 | | | | 38 | |
| | (2.11 | ) | | | (2.23 | ) | | | 43.44 | | | | (3.66 | ) | | | 1,370,912 | | | | 0.74 | | | | 0.46 | | | | 0.77 | | | | 39 | |
| | (2.06 | ) | | | (2.20 | ) | | | 47.49 | | | | 10.53 | | | | 1,268,988 | | | | 0.74 | | | | 0.45 | | | | 0.80 | | | | 41 | |
| | — | | | | (0.05 | ) | | | 45.15 | | | | 4.78 | | | | 823,036 | | | | 0.73 | | | | 0.34 | | | | 0.86 | | | | 47 | |
SEE NOTES TO FINANCIAL STATEMENTS.
| | | | | | | | |
| | | |
| DECEMBER 31, 2018 | | J.P. MORGAN MID CAP/MULTI-CAP FUNDS | | | | | 47 | |
FINANCIAL HIGHLIGHTS
FOR THE PERIODS INDICATED (continued)
| | | | | | | | | | | | | | | | | | | | |
| | | | | | Per share operating performance | |
| | | | | | Investment operations | | | Distributions | |
| | | Net asset
value,
beginning
of period | | | Net
investment
income
(loss) (b) | | | Net realized
and unrealized
gains
(losses) on
investments | | | Total from
investment
operations | | | Net realized
gain | |
JPMorgan Mid Cap Growth Fund | |
Class A | |
Six Months Ended December 31, 2018 (Unaudited) | | $ | 30.84 | | | $ | (0.10 | ) | | $ | (3.09 | ) | | $ | (3.19 | ) | | $ | (2.15 | ) |
Year Ended June 30, 2018 | | | 27.99 | | | | (0.19 | ) | | | 5.18 | | | | 4.99 | | | | (2.14 | ) |
Year Ended June 30, 2017 | | | 23.43 | | | | (0.14 | ) | | | 4.71 | | | | 4.57 | | | | (0.01 | ) |
Year Ended June 30, 2016 | | | 27.71 | | | | (0.15 | ) | | | (2.67 | ) | | | (2.82 | ) | | | (1.46 | ) |
Year Ended June 30, 2015 | | | 27.49 | | | | (0.18 | ) | | | 3.19 | | | | 3.01 | | | | (2.79 | ) |
Year Ended June 30, 2014 | | | 22.99 | | | | (0.13 | )(f) | | | 7.42 | | | | 7.29 | | | | (2.79 | ) |
Class C | |
Six Months Ended December 31, 2018 (Unaudited) | | | 24.37 | | | | (0.14 | ) | | | (2.41 | ) | | | (2.55 | ) | | | (2.15 | ) |
Year Ended June 30, 2018 | | | 22.64 | | | | (0.27 | ) | | | 4.14 | | | | 3.87 | | | | (2.14 | ) |
Year Ended June 30, 2017 | | | 19.05 | | | | (0.22 | ) | | | 3.82 | | | | 3.60 | | | | (0.01 | ) |
Year Ended June 30, 2016 | | | 22.93 | | | | (0.22 | ) | | | (2.20 | ) | | | (2.42 | ) | | | (1.46 | ) |
Year Ended June 30, 2015 | | | 23.35 | | | | (0.26 | ) | | | 2.63 | | | | 2.37 | | | | (2.79 | ) |
Year Ended June 30, 2014 | | | 19.97 | | | | (0.22 | )(f) | | | 6.39 | | | | 6.17 | | | | (2.79 | ) |
Class I | |
Six Months Ended December 31, 2018 (Unaudited) | | | 35.44 | | | | (0.06 | ) | | | (3.57 | ) | | | (3.63 | ) | | | (2.15 | ) |
Year Ended June 30, 2018 | | | 31.79 | | | | (0.10 | ) | | | 5.89 | | | | 5.79 | | | | (2.14 | ) |
Year Ended June 30, 2017 | | | 26.52 | | | | (0.07 | ) | | | 5.35 | | | | 5.28 | | | | (0.01 | ) |
Year Ended June 30, 2016 | | | 31.06 | | | | (0.09 | ) | | | (2.99 | ) | | | (3.08 | ) | | | (1.46 | ) |
Year Ended June 30, 2015 | | | 30.39 | | | | (0.11 | ) | | | 3.57 | | | | 3.46 | | | | (2.79 | ) |
Year Ended June 30, 2014 | | | 25.08 | | | | (0.06 | )(f) | | | 8.16 | | | | 8.10 | | | | (2.79 | ) |
Class R2 | |
Six Months Ended December 31, 2018 (Unaudited) | | | 33.49 | | | | (0.15 | ) | | | (3.36 | ) | | | (3.51 | ) | | | (2.15 | ) |
Year Ended June 30, 2018 | | | 30.31 | | | | (0.28 | ) | | | 5.60 | | | | 5.32 | | | | (2.14 | ) |
Year Ended June 30, 2017 | | | 25.41 | | | | (0.21 | ) | | | 5.12 | | | | 4.91 | | | | (0.01 | ) |
Year Ended June 30, 2016 | | | 29.96 | | | | (0.18 | ) | | | (2.91 | ) | | | (3.09 | ) | | | (1.46 | ) |
Year Ended June 30, 2015 | | | 29.54 | | | | (0.24 | ) | | | 3.45 | | | | 3.21 | | | | (2.79 | ) |
Year Ended June 30, 2014 | | | 24.56 | | | | (0.20 | )(f) | | | 7.97 | | | | 7.77 | | | | (2.79 | ) |
Class R3 | |
Six Months Ended December 31, 2018 (Unaudited) | | | 35.23 | | | | (0.11 | ) | | | (3.54 | ) | | | (3.65 | ) | | | (2.15 | ) |
Year Ended June 30, 2018 | | | 31.71 | | | | (0.19 | ) | | | 5.85 | | | | 5.66 | | | | (2.14 | ) |
September 9, 2016 (g) through June 30, 2017 | | | 27.06 | | | | (0.13 | ) | | | 4.79 | | | | 4.66 | | | | (0.01 | ) |
Class R4 | |
Six Months Ended December 31, 2018 (Unaudited) | | | 35.40 | | | | (0.07 | ) | | | (3.56 | ) | | | (3.63 | ) | | | (2.15 | ) |
Year Ended June 30, 2018 | | | 31.77 | | | | (0.12 | ) | | | 5.89 | | | | 5.77 | | | | (2.14 | ) |
September 9, 2016 (g) through June 30, 2017 | | | 27.06 | | | | (0.06 | ) | | | 4.78 | | | | 4.72 | | | | (0.01 | ) |
Class R5 | |
Six Months Ended December 31, 2018 (Unaudited) | | | 35.85 | | | | (0.03 | ) | | | (3.62 | ) | | | (3.65 | ) | | | (2.15 | ) |
Year Ended June 30, 2018 | | | 32.09 | | | | (0.06 | ) | | | 5.96 | | | | 5.90 | | | | (2.14 | ) |
Year Ended June 30, 2017 | | | 26.74 | | | | (0.03 | ) | | | 5.39 | | | | 5.36 | | | | (0.01 | ) |
Year Ended June 30, 2016 | | | 31.26 | | | | (0.03 | ) | | | (3.03 | ) | | | (3.06 | ) | | | (1.46 | ) |
Year Ended June 30, 2015 | | | 30.52 | | | | (0.07 | ) | | | 3.60 | | | | 3.53 | | | | (2.79 | ) |
Year Ended June 30, 2014 | | | 25.15 | | | | (0.02 | )(f) | | | 8.18 | | | | 8.16 | | | | (2.79 | ) |
Class R6 | |
Six Months Ended December 31, 2018 (Unaudited) | | | 36.00 | | | | (0.02 | ) | | | (3.64 | ) | | | (3.66 | ) | | | (2.15 | ) |
Year Ended June 30, 2018 | | | 32.20 | | | | (0.04 | ) | | | 5.98 | | | | 5.94 | | | | (2.14 | ) |
Year Ended June 30, 2017 | | | 26.82 | | | | (0.02 | ) | | | 5.41 | | | | 5.39 | | | | (0.01 | ) |
Year Ended June 30, 2016 | | | 31.33 | | | | (0.02 | ) | | | (3.03 | ) | | | (3.05 | ) | | | (1.46 | ) |
Year Ended June 30, 2015 | | | 30.57 | | | | (0.06 | ) | | | 3.61 | | | | 3.55 | | | | (2.79 | ) |
Year Ended June 30, 2014 | | | 25.17 | | | | — | (f)(h) | | | 8.19 | | | | 8.19 | | | | (2.79 | ) |
| (a) | Annualized for periods less than one year, unless otherwise noted. |
| (b) | Calculated based upon average shares outstanding. |
| (c) | Not annualized for periods less than one year. |
| (d) | Includes adjustments in accordance with accounting principles generally accepted in the United States of America and as such, the net asset values for financial reporting purposes and the returns based upon those net asset values may differ from the net asset values and returns for shareholder transactions. |
| (e) | Includes earnings credits and interest expense, if applicable, each of which is less than 0.005% unless otherwise noted. |
| (f) | Reflects special dividends paid out during the period by several of the Fund’s holdings. Had the Fund not received the special dividends the net investment income (loss) per share would have been $(0.14), $(0.23), $(0.06), $(0.20), $(0.02) and $(0.01) and for Class A, Class C, Class I, Class R2, Class R5 and Class R6 Shares, respectively, and the net investment income (loss) ratio would have been (0.53)%, (1.03)%, (0.22)%, (0.73)%, (0.08)%, (0.03)% for Class A, Class C, Class I, Class R2, Class R5 and Class R6 Shares, respectively. |
| (g) | Commencement of offering of class of shares. |
| (h) | Amount rounds to less than $0.005. |
SEE NOTES TO FINANCIAL STATEMENTS.
| | | | | | |
| | | |
| 48 | | | | J.P. MORGAN MID CAP/MULTI-CAP FUNDS | | DECEMBER 31, 2018 |
| | | | | | | | | | | | | | | | | | | | | | | | | | |
| | | Ratios/Supplemental data | |
| | | | | | | | | | Ratios to average net assets(a) | | | | |
Net asset
value,
end of
period | | | Total
return (excludes
sales charge) (c)(d) | | | Net assets,
end of
period
(000’s) | | | Net
expenses (e) | | | Net
investment
income
(loss) | | | Expenses without
waivers,
reimbursements and
earnings credits | | | Portfolio
turnover
rate (c) | |
| | | | | | | | | | | | | | | | | | | | | | | | | | |
| | | | | | | | | | | | | | | | | | | | | | | | | | |
| $ | 25.50 | | | | (10.69 | )% | | $ | 810,019 | | | | 1.23 | % | | | (0.63 | )% | | | 1.28 | % | | | 26 | % |
| | 30.84 | | | | 18.39 | | | | 934,982 | | | | 1.23 | | | | (0.62 | ) | | | 1.30 | | | | 56 | |
| | 27.99 | | | | 19.52 | | | | 915,226 | | | | 1.23 | | | | (0.56 | ) | | | 1.36 | | | | 41 | |
| | 23.43 | | | | (10.29 | ) | | | 949,148 | | | | 1.24 | | | | (0.59 | ) | | | 1.40 | | | | 56 | |
| | 27.71 | | | | 12.37 | | | | 984,262 | | | | 1.23 | | | | (0.68 | ) | | | 1.35 | | | | 57 | |
| | 27.49 | | | | 33.44 | | | | 765,310 | | | | 1.24 | | | | (0.51 | )(f) | | | 1.37 | | | | 69 | |
| | | | | | | | | | | | | | | | | | | | | | | | | | |
| | 19.67 | | | | (10.90 | ) | | | 68,402 | | | | 1.73 | | | | (1.14 | ) | | | 1.76 | | | | 26 | |
| | 24.37 | | | | 17.76 | | | | 82,939 | | | | 1.73 | | | | (1.12 | ) | | | 1.76 | | | | 56 | |
| | 22.64 | | | | 18.92 | | | | 90,640 | | | | 1.73 | | | | (1.06 | ) | | | 1.85 | | | | 41 | |
| | 19.05 | | | | (10.70 | ) | | | 96,729 | | | | 1.74 | | | | (1.08 | ) | | | 1.90 | | | | 56 | |
| | 22.93 | | | | 11.78 | | | | 75,494 | | | | 1.73 | | | | (1.19 | ) | | | 1.86 | | | | 57 | |
| | 23.35 | | | | 32.85 | | | | 41,047 | | | | 1.73 | | | | (1.01 | )(f) | | | 1.86 | | | | 69 | |
| | | | | | | | | | | | | | | | | | | | | | | | | | |
| | 29.66 | | | | (10.54 | ) | | | 949,095 | | | | 0.92 | | | | (0.32 | ) | | | 1.00 | | | | 26 | |
| | 35.44 | | | | 18.72 | | | | 1,140,704 | | | | 0.92 | | | | (0.30 | ) | | | 1.00 | | | | 56 | |
| | 31.79 | | | | 19.92 | | | | 1,050,151 | | | | 0.92 | | | | (0.25 | ) | | | 1.08 | | | | 41 | |
| | 26.52 | | | | (10.01 | ) | | | 929,489 | | | | 0.93 | | | | (0.31 | ) | | | 1.13 | | | | 56 | |
| | 31.06 | | | | 12.68 | | | | 1,562,284 | | | | 0.92 | | | | (0.37 | ) | | | 1.12 | | | | 57 | |
| | 30.39 | | | | 33.91 | | | | 1,254,748 | | | | 0.93 | | | | (0.20 | )(f) | | | 1.12 | | | | 69 | |
| | | | | | | | | | | | | | | | | | | | | | | | | | |
| | 27.83 | | | | (10.80 | ) | | | 34,025 | | | | 1.48 | | | | (0.88 | ) | | | 1.55 | | | | 26 | |
| | 33.49 | | | | 18.06 | | | | 38,486 | | | | 1.48 | | | | (0.87 | ) | | | 1.57 | | | | 56 | |
| | 30.31 | | | | 19.34 | | | | 35,242 | | | | 1.42 | | | | (0.74 | ) | | | 1.69 | | | | 41 | |
| | 25.41 | | | | (10.42 | ) | | | 32,092 | | | | 1.40 | | | | (0.71 | ) | | | 1.71 | | | | 56 | |
| | 29.96 | | | | 12.18 | | | | 9,868 | | | | 1.39 | | | | (0.85 | ) | | | 1.64 | | | | 57 | |
| | 29.54 | | | | 33.25 | | | | 1,852 | | | | 1.40 | | | | (0.71 | )(f) | | | 1.59 | | | | 69 | |
| | | | | | | | | | | | | | | | | | | | | | | | | | |
| | 29.43 | | | | (10.66 | ) | | | 24,148 | | | | 1.23 | | | | (0.63 | ) | | | 1.25 | | | | 26 | |
| | 35.23 | | | | 18.34 | | | | 26,638 | | | | 1.23 | | | | (0.54 | ) | | | 1.26 | | | | 56 | |
| | 31.71 | | | | 17.24 | | | | 152 | | | | 1.23 | | | | (0.54 | ) | | | 1.42 | | | | 41 | |
| | | | | | | | | | | | | | | | | | | | | | | | | | |
| | 29.62 | | | | (10.55 | ) | | | 13,809 | | | | 0.98 | | | | (0.38 | ) | | | 1.00 | | | | 26 | |
| | 35.40 | | | | 18.66 | | | | 14,320 | | | | 0.98 | | | | (0.33 | ) | | | 1.01 | | | | 56 | |
| | 31.77 | | | | 17.46 | | | | 129 | | | | 0.98 | | | | (0.23 | ) | | | 1.10 | | | | 41 | |
| | | | | | | | | | | | | | | | | | | | | | | | | | |
| | 30.05 | | | | (10.48 | ) | | | 268,818 | | | | 0.78 | | | | (0.18 | ) | | | 0.85 | | | | 26 | |
| | 35.85 | | | | 18.89 | | | | 313,336 | | | | 0.78 | | | | (0.16 | ) | | | 0.85 | | | | 56 | |
| | 32.09 | | | | 20.06 | | | | 247,068 | | | | 0.78 | | | | (0.10 | ) | | | 0.89 | | | | 41 | |
| | 26.74 | | | | (9.87 | ) | | | 224,498 | | | | 0.79 | | | | (0.13 | ) | | | 0.91 | | | | 56 | |
| | 31.26 | | | | 12.87 | | | | 164,713 | | | | 0.78 | | | | (0.25 | ) | | | 0.87 | | | | 57 | |
| | 30.52 | | | | 34.06 | | | | 27,454 | | | | 0.79 | | | | (0.06 | )(f) | | | 0.92 | | | | 69 | |
| | | | | | | | | | | | | | | | | | | | | | | | | | |
| | 30.19 | | | | (10.46 | ) | | | 1,358,346 | | | | 0.73 | | | | (0.13 | ) | | | 0.75 | | | | 26 | |
| | 36.00 | | | | 18.95 | | | | 1,365,839 | | | | 0.73 | | | | (0.11 | ) | | | 0.76 | | | | 56 | |
| | 32.20 | | | | 20.11 | | | | 749,670 | | | | 0.73 | | | | (0.06 | ) | | | 0.76 | | | | 41 | |
| | 26.82 | | | | (9.82 | ) | | | 619,527 | | | | 0.73 | | | | (0.06 | ) | | | 0.77 | | | | 56 | |
| | 31.33 | | | | 12.92 | | | | 265,905 | | | | 0.73 | | | | (0.19 | ) | | | 0.78 | | | | 57 | |
| | 30.57 | | | | 34.16 | | | | 86,150 | | | | 0.74 | | | | (0.01 | )(f) | | | 0.86 | | | | 69 | |
SEE NOTES TO FINANCIAL STATEMENTS.
| | | | | | | | |
| | | |
| DECEMBER 31, 2018 | | J.P. MORGAN MID CAP/MULTI-CAP FUNDS | | | | | 49 | |
FINANCIAL HIGHLIGHTS
FOR THE PERIODS INDICATED (continued)
| | | | | | | | | | | | | | | | | | | | | | | | | | | | |
| | | Per share operating performance | | | | |
| | | | | | Investment operations | | | Distributions | |
| | | Net asset
value,
beginning
of period | | | Net
investment
income
(loss) (b) | | | Net realized
and
unrealized gains
(losses) on
investments | | | Total from
investment
operations | | | Net
investment
income | | | Net
realized
gain | | | Total
distributions | |
JPMorgan Mid Cap Value Fund | |
Class A | |
Six Months Ended December 31, 2018 (Unaudited) | | $ | 39.24 | | | $ | 0.31 | | | $ | (4.77 | ) | | $ | (4.46 | ) | | $ | (0.38 | ) | | $ | (2.16 | ) | | $ | (2.54 | ) |
Year Ended June 30, 2018 | | | 37.80 | | | | 0.20 | | | | 2.14 | | | | 2.34 | | | | (0.18 | ) | | | (0.72 | ) | | | (0.90 | ) |
Year Ended June 30, 2017 | | | 35.41 | | | | 0.17 | | | | 4.60 | | | | 4.77 | | | | (0.14 | ) | | | (2.24 | ) | | | (2.38 | ) |
Year Ended June 30, 2016 | | | 36.98 | | | | 0.19 | | | | 0.33 | | | | 0.52 | | | | (0.14 | ) | | | (1.95 | ) | | | (2.09 | ) |
Year Ended June 30, 2015 | | | 37.25 | | | | 0.20 | | | | 2.52 | | | | 2.72 | | | | (0.20 | ) | | | (2.79 | ) | | | (2.99 | ) |
Year Ended June 30, 2014 | | | 31.68 | | | | 0.15 | (f) | | | 7.02 | | | | 7.17 | | | | (0.15 | ) | | | (1.45 | ) | | | (1.60 | ) |
|
Class C | |
Six Months Ended December 31, 2018 (Unaudited) | | | 37.68 | | | | 0.20 | | | | (4.57 | ) | | | (4.37 | ) | | | (0.17 | ) | | | (2.16 | ) | | | (2.33 | ) |
Year Ended June 30, 2018 | | | 36.35 | | | | (0.02 | ) | | | 2.07 | | | | 2.05 | | | | — | | | | (0.72 | ) | | | (0.72 | ) |
Year Ended June 30, 2017 | | | 34.17 | | | | (0.02 | ) | | | 4.44 | | | | 4.42 | | | | — | | | | (2.24 | ) | | | (2.24 | ) |
Year Ended June 30, 2016 | | | 35.79 | | | | 0.01 | | | | 0.32 | | | | 0.33 | | | | — | | | | (1.95 | ) | | | (1.95 | ) |
Year Ended June 30, 2015 | | | 36.19 | | | | 0.01 | | | | 2.44 | | | | 2.45 | | | | (0.06 | ) | | | (2.79 | ) | | | (2.85 | ) |
Year Ended June 30, 2014 | | | 30.84 | | | | (0.03 | )(f) | | | 6.83 | | | | 6.80 | | | | — | (g) | | | (1.45 | ) | | | (1.45 | ) |
|
Class I | |
Six Months Ended December 31, 2018 (Unaudited) | | | 39.70 | | | | 0.35 | | | | (4.82 | ) | | | (4.47 | ) | | | (0.48 | ) | | | (2.16 | ) | | | (2.64 | ) |
Year Ended June 30, 2018 | | | 38.24 | | | | 0.30 | | | | 2.16 | | | | 2.46 | | | | (0.28 | ) | | | (0.72 | ) | | | (1.00 | ) |
Year Ended June 30, 2017 | | | 35.79 | | | | 0.27 | | | | 4.66 | | | | 4.93 | | | | (0.24 | ) | | | (2.24 | ) | | | (2.48 | ) |
Year Ended June 30, 2016 | | | 37.36 | | | | 0.28 | | | | 0.33 | | | | 0.61 | | | | (0.23 | ) | | | (1.95 | ) | | | (2.18 | ) |
Year Ended June 30, 2015 | | | 37.61 | | | | 0.28 | | | | 2.55 | | | | 2.83 | | | | (0.29 | ) | | | (2.79 | ) | | | (3.08 | ) |
Year Ended June 30, 2014 | | | 31.95 | | | | 0.23 | (f) | | | 7.10 | | | | 7.33 | | | | (0.22 | ) | | | (1.45 | ) | | | (1.67 | ) |
|
Class L | |
Six Months Ended December 31, 2018 (Unaudited) | | | 40.21 | | | | 0.38 | | | | (4.87 | ) | | | (4.49 | ) | | | (0.58 | ) | | | (2.16 | ) | | | (2.74 | ) |
Year Ended June 30, 2018 | | | 38.70 | | | | 0.40 | | | | 2.20 | | | | 2.60 | | | | (0.37 | ) | | | (0.72 | ) | | | (1.09 | ) |
Year Ended June 30, 2017 | | | 36.19 | | | | 0.36 | | | | 4.71 | | | | 5.07 | | | | (0.32 | ) | | | (2.24 | ) | | | (2.56 | ) |
Year Ended June 30, 2016 | | | 37.76 | | | | 0.37 | | | | 0.33 | | | | 0.70 | | | | (0.32 | ) | | | (1.95 | ) | | | (2.27 | ) |
Year Ended June 30, 2015 | | | 37.99 | | | | 0.40 | | | | 2.56 | | | | 2.96 | | | | (0.40 | ) | | | (2.79 | ) | | | (3.19 | ) |
Year Ended June 30, 2014 | | | 32.26 | | | | 0.32 | (f) | | | 7.17 | | | | 7.49 | | | | (0.31 | ) | | | (1.45 | ) | | | (1.76 | ) |
|
Class R2 | |
Six Months Ended December 31, 2018 (Unaudited) | | | 37.64 | | | | 0.22 | | | | (4.54 | ) | | | (4.32 | ) | | | (0.30 | ) | | | (2.16 | ) | | | (2.46 | ) |
Year Ended June 30, 2018 | | | 36.33 | | | | 0.10 | | | | 2.05 | | | | 2.15 | | | | (0.12 | ) | | | (0.72 | ) | | | (0.84 | ) |
Year Ended June 30, 2017 | | | 34.14 | | | | 0.07 | | | | 4.43 | | | | 4.50 | | | | (0.07 | ) | | | (2.24 | ) | | | (2.31 | ) |
Year Ended June 30, 2016 | | | 35.73 | | | | 0.10 | | | | 0.32 | | | | 0.42 | | | | (0.06 | ) | | | (1.95 | ) | | | (2.01 | ) |
Year Ended June 30, 2015 | | | 36.14 | | | | 0.10 | | | | 2.43 | | | | 2.53 | | | | (0.15 | ) | | | (2.79 | ) | | | (2.94 | ) |
Year Ended June 30, 2014 | | | 30.81 | | | | 0.06 | (f) | | | 6.82 | | | | 6.88 | | | | (0.10 | ) | | | (1.45 | ) | | | (1.55 | ) |
|
Class R3 | |
Six Months Ended December 31, 2018 (Unaudited) | | | 38.97 | | | | 0.25 | | | | (4.68 | ) | | | (4.43 | ) | | | (0.41 | ) | | | (2.16 | ) | | | (2.57 | ) |
Year Ended June 30, 2018 | | | 37.67 | | | | 0.21 | | | | 2.11 | | | | 2.32 | | | | (0.30 | ) | | | (0.72 | ) | | | (1.02 | ) |
September 9, 2016 (h) through June 30, 2017 | | | 35.78 | | | | 0.26 | | | | 4.15 | | | | 4.41 | | | | (0.28 | ) | | | (2.24 | ) | | | (2.52 | ) |
|
Class R4 | |
Six Months Ended December 31, 2018 (Unaudited) | | | 39.56 | | | | 0.32 | | | | (4.78 | ) | | | (4.46 | ) | | | (0.51 | ) | | | (2.16 | ) | | | (2.67 | ) |
Year Ended June 30, 2018 | | | 38.16 | | | | 0.33 | | | | 2.13 | | | | 2.46 | | | | (0.34 | ) | | | (0.72 | ) | | | (1.06 | ) |
September 9, 2016 (h) through June 30, 2017 | | | 36.18 | | | | 0.38 | | | | 4.15 | | | | 4.53 | | | | (0.31 | ) | | | (2.24 | ) | | | (2.55 | ) |
|
Class R5 | |
Six Months Ended December 31, 2018 (Unaudited) | | | 40.15 | | | | 0.36 | | | | (4.86 | ) | | | (4.50 | ) | | | (0.54 | ) | | | (2.16 | ) | | | (2.70 | ) |
Year Ended June 30, 2018 | | | 38.67 | | | | 0.38 | | | | 2.17 | | | | 2.55 | | | | (0.35 | ) | | | (0.72 | ) | | | (1.07 | ) |
September 9, 2016 (h) through June 30, 2017 | | | 36.60 | | | | 0.36 | | | | 4.28 | | | | 4.64 | | | | (0.33 | ) | | | (2.24 | ) | | | (2.57 | ) |
|
Class R6 | |
Six Months Ended December 31, 2018 (Unaudited) | | | 40.19 | | | | 0.33 | | | | (4.82 | ) | | | (4.49 | ) | | | (0.58 | ) | | | (2.16 | ) | | | (2.74 | ) |
Year Ended June 30, 2018 | | | 38.69 | | | | 0.43 | | | | 2.16 | | | | 2.59 | | | | (0.37 | ) | | | (0.72 | ) | | | (1.09 | ) |
September 9, 2016 (h) through June 30, 2017 | | | 36.60 | | | | 0.32 | | | | 4.34 | | | | 4.66 | | | | (0.33 | ) | | | (2.24 | ) | | | (2.57 | ) |
| (a) | Annualized for periods less than one year, unless otherwise noted. |
| (b) | Calculated based upon average shares outstanding. |
| (c) | Not annualized for periods less than one year. |
| (d) | Includes adjustments in accordance with accounting principles generally accepted in the United States of America and as such, the net asset values for financial reporting purposes and the returns based upon those net asset values may differ from the net asset values and returns for shareholder transactions. |
| (e) | Includes earnings credits and interest expense, if applicable, each of which is less than 0.005% unless otherwise noted. |
| (f) | Reflects special dividends paid out during the period by several of the Fund’s holdings. Had the Fund not received the special dividends the net investment income (loss) per share would have been $0.14, $(0.03), $0.23, $0.32 and $0.05 for Class A, Class C, Class I, Class L and Class R2 Shares, respectively and the net investment income (loss) ratio would have been 0.41%, (0.10)%, 0.66%, 0.90% and 0.16% for Class A, Class C, Class I, Class L and Class R2 Shares, respectively. |
| (g) | Amount rounds to less than $0.005. |
| (h) | Commencement of offering of class of shares. |
SEE NOTES TO FINANCIAL STATEMENTS.
| | | | | | |
| | | |
| 50 | | | | J.P. MORGAN MID CAP/MULTI-CAP FUNDS | | DECEMBER 31, 2018 |
| | | | | | | | | | | | | | | | | | | | | | | | | | |
| | | Ratios/Supplemental data | |
| | | | | | | | | | Ratios to average net assets(a) | | | | |
Net asset value, end of period | | | Total return
(excludes
sales charge) (c)(d) | | | Net assets, end of period
(000’s) | | | Net
expenses (e) | | | Net
investment income
(loss) | | | Expenses
without waivers,
reimbursements
and earnings
credits | | | Portfolio
turnover
rate (c) | |
| | | | | | | | | | | | | | | | | | | | | | | | | | |
| | | | | | | | | | | | | | | | | | | | | | | | | | |
| $ | 32.24 | | | | (11.71 | )% | | $ | 1,514,797 | | | | 1.23 | % | | | 1.57 | % | | | 1.25 | % | | | 7 | % |
| | 39.24 | | | | 6.20 | | | | 1,967,162 | | | | 1.23 | | | | 0.51 | | | | 1.26 | | | | 13 | |
| | 37.80 | | | | 13.83 | | | | 2,149,689 | | | | 1.23 | | | | 0.45 | | | | 1.36 | | | | 23 | |
| | 35.41 | | | | 1.85 | | | | 2,302,567 | | | | 1.24 | | | | 0.54 | | | | 1.41 | | | | 20 | |
| | 36.98 | | | | 7.68 | | | | 2,623,772 | | | | 1.23 | | | | 0.53 | | | | 1.38 | | | | 18 | |
| | 37.25 | | | | 23.25 | | | | 3,404,974 | | | | 1.23 | | | | 0.42 | (f) | | | 1.37 | | | | 25 | |
| | | | | | |
| | | | | | | | | | | | | | | | | | | | | | | | | | |
| | 30.98 | | | | (11.93 | ) | | | 164,325 | | | | 1.74 | | | | 1.09 | | | | 1.75 | | | | 7 | |
| | 37.68 | | | | 5.65 | | | | 214,331 | | | | 1.74 | | | | (0.06 | ) | | | 1.75 | | | | 13 | |
| | 36.35 | | | | 13.27 | | | | 452,351 | | | | 1.74 | | | | (0.06 | ) | | | 1.80 | | | | 23 | |
| | 34.17 | | | | 1.35 | | | | 549,619 | | | | 1.75 | | | | 0.03 | | | | 1.83 | | | | 20 | |
| | 35.79 | | | | 7.12 | | | | 595,385 | | | | 1.74 | | | | 0.03 | | | | 1.84 | | | | 18 | |
| | 36.19 | | | | 22.63 | | | | 608,283 | | | | 1.74 | | | | (0.09 | )(f) | | | 1.87 | | | | 25 | |
| | | | | | |
| | | | | | | | | | | | | | | | | | | | | | | | | | |
| | 32.59 | | | | (11.60 | ) | | | 2,323,938 | | | | 0.98 | | | | 1.74 | | | | 1.00 | | | | 7 | |
| | 39.70 | | | | 6.44 | | | | 2,985,882 | | | | 0.98 | | | | 0.77 | | | | 1.00 | | | | 13 | |
| | 38.24 | | | | 14.15 | | | | 2,902,646 | | | | 0.98 | | | | 0.72 | | | | 1.07 | | | | 23 | |
| | 35.79 | | | | 2.11 | | | | 2,332,160 | | | | 0.99 | | | | 0.80 | | | | 1.11 | | | | 20 | |
| | 37.36 | | | | 7.92 | | | | 2,347,703 | | | | 0.98 | | | | 0.75 | | | | 1.10 | | | | 18 | |
| | 37.61 | | | | 23.59 | | | | 2,967,759 | | | | 0.98 | | | | 0.67 | (f) | | | 1.12 | | | | 25 | |
| | | | | | |
| | | | | | | | | | | | | | | | | | | | | | | | | | |
| | 32.98 | | | | (11.50 | ) | | | 9,701,063 | | | | 0.74 | | | | 1.91 | | | | 0.85 | | | | 7 | |
| | 40.21 | | | | 6.73 | | | | 11,795,588 | | | | 0.74 | | | | 1.00 | | | | 0.86 | | | | 13 | |
| | 38.70 | | | | 14.39 | | | | 12,478,637 | | | | 0.74 | | | | 0.96 | | | | 0.91 | | | | 23 | |
| | 36.19 | | | | 2.35 | | | | 10,313,629 | | | | 0.75 | | | | 1.04 | | | | 0.94 | | | | 20 | |
| | 37.76 | | | | 8.19 | | | | 10,320,516 | | | | 0.74 | | | | 1.05 | | | | 0.94 | | | | 18 | |
| | 37.99 | | | | 23.88 | | | | 8,581,992 | | | | 0.74 | | | | 0.92 | (f) | | | 0.97 | | | | 25 | |
| | | | | | |
| | | | | | | | | | | | | | | | | | | | | | | | | | |
| | 30.86 | | | | (11.83 | ) | | | 68,776 | | | | 1.49 | | | | 1.18 | | | | 1.51 | | | | 7 | |
| | 37.64 | | | | 5.93 | | | | 82,108 | | | | 1.49 | | | | 0.26 | | | | 1.51 | | | | 13 | |
| | 36.33 | | | | 13.53 | | | | 85,287 | | | | 1.49 | | | | 0.21 | | | | 1.65 | | | | 23 | |
| | 34.14 | | | | 1.61 | | | | 66,167 | | | | 1.50 | | | | 0.29 | | | | 1.75 | | | | 20 | |
| | 35.73 | | | | 7.38 | | | | 71,697 | | | | 1.49 | | | | 0.28 | | | | 1.71 | | | | 18 | |
| | 36.14 | | | | 22.94 | | | | 71,958 | | | | 1.49 | | | | 0.17 | (f) | | | 1.62 | | | | 25 | |
| | | | | | |
| | | | | | | | | | | | | | | | | | | | | | | | | | |
| | 31.97 | | | | (11.71 | ) | | | 61,548 | | | | 1.24 | | | | 1.29 | | | | 1.27 | | | | 7 | |
| | 38.97 | | | | 6.17 | | | | 62,576 | | | | 1.24 | | | | 0.55 | | | | 1.25 | | | | 13 | |
| | 37.67 | | | | 12.70 | | | | 19,262 | | | | 1.24 | | | | 0.87 | | | | 1.35 | | | | 23 | |
| | | | | | |
| | | | | | | | | | | | | | | | | | | | | | | | | | |
| | 32.43 | | | | (11.60 | ) | | | 22,364 | | | | 0.99 | | | | 1.63 | | | | 1.00 | | | | 7 | |
| | 39.56 | | | | 6.45 | | | | 17,859 | | | | 0.99 | | | | 0.83 | | | | 1.00 | | | | 13 | |
| | 38.16 | | | | 12.89 | | | | 3,537 | | | | 0.99 | | | | 1.26 | | | | 1.10 | | | | 23 | |
| | | | | | |
| | | | | | | | | | | | | | | | | | | | | | | | | | |
| | 32.95 | | | | (11.53 | ) | | | 73,299 | | | | 0.83 | | | | 1.79 | | | | 0.85 | | | | 7 | |
| | 40.15 | | | | 6.61 | | | | 84,457 | | | | 0.84 | | | | 0.96 | | | | 0.85 | | | | 13 | |
| | 38.67 | | | | 13.06 | | | | 30,334 | | | | 0.84 | | | | 1.18 | | | | 1.02 | | | | 23 | |
| | | | | | |
| | | | | | | | | | | | | | | | | | | | | | | | | | |
| | 32.96 | | | | (11.50 | ) | | | 1,094,040 | | | | 0.73 | | | | 1.63 | | | | 0.75 | | | | 7 | |
| | 40.19 | | | | 6.71 | | | | 1,073,888 | | | | 0.74 | | | | 1.08 | | | | 0.75 | | | | 13 | |
| | 38.69 | | | | 13.13 | | | | 281,269 | | | | 0.74 | | | | 1.05 | | | | 0.75 | | | | 23 | |
SEE NOTES TO FINANCIAL STATEMENTS.
| | | | | | | | |
| | | |
| DECEMBER 31, 2018 | | J.P. MORGAN MID CAP/MULTI-CAP FUNDS | | | | | 51 | |
FINANCIAL HIGHLIGHTS
FOR THE PERIODS INDICATED (continued)
| | | | | | | | | | | | | | | | | | | | | | | | | | | | |
| | | | | | Per share operating performance | |
| | | | | | Investment operations | | | Distributions | |
| | | Net asset
value,
beginning
of period | | | Net
investment
income
(loss) (b) | | | Net realized
and unrealized
gains
(losses) on
investments | | | Total from
investment
operations | | | Net
investment
income | | | Net
realized
gain | | | Total
distributions | |
JPMorgan Value Advantage Fund | | | | | | | | | | | | | | | | | | | | | | | | | | | | |
Class A | | | | | | | | | | | | | | | | | | | | | | | | | | | | |
Six Months Ended December 31, 2018 (Unaudited) | | $ | 35.38 | | | $ | 0.32 | | | $ | (3.14 | ) | | $ | (2.82 | ) | | $ | (0.46 | ) | | $ | (1.69 | ) | | $ | (2.15 | ) |
Year Ended June 30, 2018 | | | 33.40 | | | | 0.35 | (f) | | | 2.26 | | | | 2.61 | | | | (0.28 | ) | | | (0.35 | ) | | | (0.63 | ) |
Year Ended June 30, 2017 | | | 28.66 | | | | 0.27 | | | | 4.77 | | | | 5.04 | | | | (0.30 | ) | | | — | | | | (0.30 | ) |
Year Ended June 30, 2016 | | | 29.84 | | | | 0.27 | | | | (0.99 | ) | | | (0.72 | ) | | | (0.17 | ) | | | (0.29 | ) | | | (0.46 | ) |
Year Ended June 30, 2015 | | | 29.15 | | | | 0.19 | | | | 1.47 | | | | 1.66 | | | | (0.26 | ) | | | (0.71 | ) | | | (0.97 | ) |
Year Ended June 30, 2014 | | | 24.64 | | | | 0.34 | | | | 5.03 | | | | 5.37 | | | | (0.16 | ) | | | (0.70 | ) | | | (0.86 | ) |
| | | | | | | |
Class C | | | | | | | | | | | | | | | | | | | | | | | | | | | | |
Six Months Ended December 31, 2018 (Unaudited) | | | 35.20 | | | | 0.23 | | | | (3.12 | ) | | | (2.89 | ) | | | (0.28 | ) | | | (1.69 | ) | | | (1.97 | ) |
Year Ended June 30, 2018 | | | 33.20 | | | | 0.18 | (f) | | | 2.24 | | | | 2.42 | | | | (0.07 | ) | | | (0.35 | ) | | | (0.42 | ) |
Year Ended June 30, 2017 | | | 28.52 | | | | 0.11 | | | | 4.74 | | | | 4.85 | | | | (0.17 | ) | | | — | | | | (0.17 | ) |
Year Ended June 30, 2016 | | | 29.72 | | | | 0.14 | | | | (0.99 | ) | | | (0.85 | ) | | | (0.06 | ) | | | (0.29 | ) | | | (0.35 | ) |
Year Ended June 30, 2015 | | | 29.08 | | | | 0.04 | | | | 1.47 | | | | 1.51 | | | | (0.16 | ) | | | (0.71 | ) | | | (0.87 | ) |
Year Ended June 30, 2014 | | | 24.61 | | | | 0.20 | | | | 5.02 | | | | 5.22 | | | | (0.05 | ) | | | (0.70 | ) | | | (0.75 | ) |
| | | | | | | |
Class I | | | | | | | | | | | | | | | | | | | | | | | | | | | | |
Six Months Ended December 31, 2018 (Unaudited) | | | 35.60 | | | | 0.34 | | | | (3.14 | ) | | | (2.80 | ) | | | (0.56 | ) | | | (1.69 | ) | | | (2.25 | ) |
Year Ended June 30, 2018 | | | 33.62 | | | | 0.44 | (f) | | | 2.28 | | | | 2.72 | | | | (0.39 | ) | | | (0.35 | ) | | | (0.74 | ) |
Year Ended June 30, 2017 | | | 28.86 | | | | 0.35 | | | | 4.80 | | | | 5.15 | | | | (0.39 | ) | | | — | | | | (0.39 | ) |
Year Ended June 30, 2016 | | | 29.99 | | | | 0.33 | | | | (0.98 | ) | | | (0.65 | ) | | | (0.19 | ) | | | (0.29 | ) | | | (0.48 | ) |
Year Ended June 30, 2015 | | | 29.27 | | | | 0.27 | | | | 1.48 | | | | 1.75 | | | | (0.32 | ) | | | (0.71 | ) | | | (1.03 | ) |
Year Ended June 30, 2014 | | | 24.72 | | | | 0.42 | | | | 5.03 | | | | 5.45 | | | | (0.20 | ) | | | (0.70 | ) | | | (0.90 | ) |
| | | | | | | |
Class L | | | | | | | | | | | | | | | | | | | | | | | | | | | | |
Six Months Ended December 31, 2018 (Unaudited) | | | 35.62 | | | | 0.41 | | | | (3.19 | ) | | | (2.78 | ) | | | (0.60 | ) | | | (1.69 | ) | | | (2.29 | ) |
Year Ended June 30, 2018 | | | 33.63 | | | | 0.50 | (f) | | | 2.29 | | | | 2.79 | | | | (0.45 | ) | | | (0.35 | ) | | | (0.80 | ) |
Year Ended June 30, 2017 | | | 28.86 | | | | 0.41 | | | | 4.82 | | | | 5.23 | | | | (0.46 | ) | | | — | | | | (0.46 | ) |
Year Ended June 30, 2016 | | | 30.06 | | | | 0.43 | | | | (1.02 | ) | | | (0.59 | ) | | | (0.32 | ) | | | (0.29 | ) | | | (0.61 | ) |
Year Ended June 30, 2015 | | | 29.31 | | | | 0.34 | | | | 1.50 | | | | 1.84 | | | | (0.38 | ) | | | (0.71 | ) | | | (1.09 | ) |
Year Ended June 30, 2014 | | | 24.74 | | | | 0.48 | | | | 5.04 | | | | 5.52 | | | | (0.25 | ) | | | (0.70 | ) | | | (0.95 | ) |
| | | | | | | |
Class R2 | | | | | | | | | | | | | | | | | | | | | | | | | | | | |
Six Months Ended December 31, 2018 (Unaudited) | | | 35.22 | | | | 0.30 | | | | (3.15 | ) | | | (2.85 | ) | | | (0.42 | ) | | | (1.69 | ) | | | (2.11 | ) |
July 31, 2017 (g) through June 30, 2018 | | | 34.04 | | | | 0.25 | (f) | | | 1.64 | | | | 1.89 | | | | (0.36 | ) | | | (0.35 | ) | | | (0.71 | ) |
| | | | | | | |
Class R3 | | | | | | | | | | | | | | | | | | | | | | | | | | | | |
Six Months Ended December 31, 2018 (Unaudited) | | | 35.11 | | | | 0.27 | | | | (3.07 | ) | | | (2.80 | ) | | | (0.54 | ) | | | (1.69 | ) | | | (2.23 | ) |
Year Ended June 30, 2018 | | | 33.24 | | | | 0.35 | (f) | | | 2.26 | | | | 2.61 | | | | (0.39 | ) | | | (0.35 | ) | | | (0.74 | ) |
September 9, 2016 (g) through June 30, 2017 | | | 29.33 | | | | 0.29 | | | | 4.06 | | | | 4.35 | | | | (0.44 | ) | | | — | | | | (0.44 | ) |
| | | | | | | |
Class R4 | | | | | | | | | | | | | | | | | | | | | | | | | | | | |
Six Months Ended December 31, 2018 (Unaudited) | | | 35.47 | | | | 0.35 | | | | (3.14 | ) | | | (2.79 | ) | | | (0.57 | ) | | | (1.69 | ) | | | (2.26 | ) |
Year Ended June 30, 2018 | | | 33.55 | | | | 0.51 | (f) | | | 2.20 | | | | 2.71 | | | | (0.44 | ) | | | (0.35 | ) | | | (0.79 | ) |
September 9, 2016 (g) through June 30, 2017 | | | 29.56 | | | | 0.27 | | | | 4.18 | | | | 4.45 | | | | (0.46 | ) | | | — | | | | (0.46 | ) |
| | | | | | | |
Class R5 | | | | | | | | | | | | | | | | | | | | | | | | | | | | |
Six Months Ended December 31, 2018 (Unaudited) | | | 35.57 | | | | 0.35 | | | | (3.12 | ) | | | (2.77 | ) | | | (0.62 | ) | | | (1.69 | ) | | | (2.31 | ) |
Year Ended June 30, 2018 | | | 33.59 | | | | 0.50 | (f) | | | 2.28 | | | | 2.78 | | | | (0.45 | ) | | | (0.35 | ) | | | (0.80 | ) |
September 9, 2016 (g) through June 30, 2017 | | | 29.57 | | | | 0.30 | | | | 4.20 | | | | 4.50 | | | | (0.48 | ) | | | — | | | | (0.48 | ) |
| | | | | | | |
Class R6 | | | | | | | | | | | | | | | | | | | | | | | | | | | | |
Six Months Ended December 31, 2018 (Unaudited) | | | 35.60 | | | | 0.39 | | | | (3.14 | ) | | | (2.75 | ) | | | (0.65 | ) | | | (1.69 | ) | | | (2.34 | ) |
Year Ended June 30, 2018 | | | 33.61 | | | | 0.54 | (f) | | | 2.26 | | | | 2.80 | | | | (0.46 | ) | | | (0.35 | ) | | | (0.81 | ) |
September 9, 2016 (g) through June 30, 2017 | | | 29.57 | | | | 0.36 | | | | 4.17 | | | | 4.53 | | | | (0.49 | ) | | | — | | | | (0.49 | ) |
| (a) | Annualized for periods less than one year, unless otherwise noted. |
| (b) | Calculated based upon average shares outstanding. |
| (c) | Not annualized for periods less than one year. |
| (d) | Includes adjustments in accordance with accounting principles generally accepted in the United States of America and as such, the net asset values for financial reporting purposes and the returns based upon those net asset values may differ from the net asset values and returns for shareholder transactions. |
| (e) | Includes earnings credits and interest expense, if applicable, each of which is less than 0.005% unless otherwise noted. |
| (f) | Net investment income (loss) may appear disproportionate among the classes due to the timing of recognition of income and changes in the relative size of the classes. |
| (g) | Commencement of offering of class of shares. |
SEE NOTES TO FINANCIAL STATEMENTS.
| | | | | | |
| | | |
| 52 | | | | J.P. MORGAN MID CAP/MULTI-CAP FUNDS | | DECEMBER 31, 2018 |
| | | | | | | | | | | | | | | | | | | | | | | | | | |
| | | Ratios/Supplemental data | |
| | | | | | | | | | Ratios to average net assets (a) | | | | |
Net asset
value,
end of
period | | | Total return
(excludes
sales charge) (c)(d) | | | Net assets,
end of
period
(000’s) | | | Net
expenses (e) | | | Net
investment
income
(loss) | | |
Expenses without waivers, reimbursements and
earnings credits | | | Portfolio
turnover
rate (c) | |
| | | | | | | | | | | | | | | | | | | | | | | | | | |
| | | | | | | | | | | | | | | | | | | | | | | | | | |
| $ | 30.41 | | | | (8.24 | )% | | $ | 1,113,086 | | | | 1.14 | % | | | 1.79 | % | | | 1.25 | % | | | 9 | % |
| | 35.38 | | | | 7.81 | | | | 1,346,080 | | | | 1.17 | | | | 1.01 | (f) | | | 1.25 | | | | 23 | |
| | 33.40 | | | | 17.60 | | | | 1,432,370 | | | | 1.24 | | | | 0.85 | | | | 1.36 | | | | 24 | |
| | 28.66 | | | | (2.34 | ) | | | 2,045,698 | | | | 1.24 | | | | 0.98 | | | | 1.43 | | | | 26 | |
| | 29.84 | | | | 5.78 | | | | 2,440,061 | | | | 1.24 | | | | 0.64 | | | | 1.41 | | | | 17 | |
| | 29.15 | | | | 22.19 | | | | 1,701,250 | | | | 1.24 | | | | 1.26 | | | | 1.33 | | | | 36 | |
| | | | | | |
| | | | | | | | | | | | | | | | | | | | | | | | | | |
| | 30.34 | | | | (8.48 | ) | | | 498,528 | | | | 1.64 | | | | 1.28 | | | | 1.75 | | | | 9 | |
| | 35.20 | | | | 7.27 | | | | 591,602 | | | | 1.67 | | | | 0.51 | (f) | | | 1.75 | | | | 23 | |
| | 33.20 | | | | 17.02 | | | | 746,521 | | | | 1.74 | | | | 0.34 | | | | 1.81 | | | | 24 | |
| | 28.52 | | | | (2.82 | ) | | | 728,800 | | | | 1.74 | | | | 0.49 | | | | 1.85 | | | | 26 | |
| | 29.72 | | | | 5.26 | | | | 701,023 | | | | 1.73 | | | | 0.14 | | | | 1.83 | | | | 17 | |
| | 29.08 | | | | 21.58 | | | | 402,880 | | | | 1.74 | | | | 0.74 | | | | 1.83 | | | | 36 | |
| | | | | | |
| | | | | | | | | | | | | | | | | | | | | | | | | | |
| | 30.55 | | | | (8.12 | ) | | | 2,224,973 | | | | 0.89 | | | | 1.90 | | | | 1.00 | | | | 9 | |
| | 35.60 | | | | 8.07 | | | | 2,296,056 | | | | 0.92 | | | | 1.26 | (f) | | | 1.00 | | | | 23 | |
| | 33.62 | | | | 17.89 | | | | 2,165,577 | | | | 0.99 | | | | 1.09 | | | | 1.04 | | | | 24 | |
| | 28.86 | | | | (2.10 | ) | | | 1,414,635 | | | | 0.99 | | | | 1.16 | | | | 1.05 | | | | 26 | |
| | 29.99 | | | | 6.05 | | | | 3,095,251 | | | | 0.99 | | | | 0.89 | | | | 1.05 | | | | 17 | |
| | 29.27 | | | | 22.49 | | | | 2,546,808 | | | | 0.99 | | | | 1.53 | | | | 1.08 | | | | 36 | |
| | | | | | |
| | | | | | | | | | | | | | | | | | | | | | | | | | |
| | 30.55 | | | | (8.06 | ) | | | 2,388,550 | | | | 0.74 | | | | 2.26 | | | | 0.85 | | | | 9 | |
| | 35.62 | | | | 8.29 | | | | 3,255,993 | | | | 0.74 | | | | 1.42 | (f) | | | 0.85 | | | | 23 | |
| | 33.63 | | | | 18.17 | | | | 3,643,327 | | | | 0.75 | | | | 1.32 | | | | 0.87 | | | | 24 | |
| | 28.86 | | | | (1.87 | ) | | | 5,901,818 | | | | 0.74 | | | | 1.50 | | | | 0.88 | | | | 26 | |
| | 30.06 | | | | 6.36 | | | | 5,058,172 | | | | 0.74 | | | | 1.15 | | | | 0.90 | | | | 17 | |
| | 29.31 | | | | 22.77 | | | | 3,042,506 | | | | 0.74 | | | | 1.77 | | | | 0.93 | | | | 36 | |
| | | | | | |
| | | | | | | | | | | | | | | | | | | | | | | | | | |
| | 30.26 | | | | (8.36 | ) | | | 36 | | | | 1.39 | | | | 1.69 | | | | 2.12 | | | | 9 | |
| | 35.22 | | | | 5.54 | | | | 38 | | | | 1.41 | | | | 0.78 | (f) | | | 1.61 | | | | 23 | |
| | | | | | |
| | | | | | | | | | | | | | | | | | | | | | | | | | |
| | 30.08 | | | | (8.25 | ) | | | 1,763 | | | | 1.14 | | | | 1.53 | | | | 1.27 | | | | 9 | |
| | 35.11 | | | | 7.82 | | | | 1,132 | | | | 1.15 | | | | 1.01 | (f) | | | 1.28 | | | | 23 | |
| | 33.24 | | | | 14.87 | | | | 385 | | | | 1.24 | | | | 1.09 | | | | 1.36 | | | | 24 | |
| | | | | | |
| | | | | | | | | | | | | | | | | | | | | | | | | | |
| | 30.42 | | | | (8.13 | ) | | | 15,703 | | | | 0.89 | | | | 1.96 | | | | 1.00 | | | | 9 | |
| | 35.47 | | | | 8.07 | | | | 17,231 | | | | 0.89 | | | | 1.43 | (f) | | | 1.00 | | | | 23 | |
| | 33.55 | | | | 15.10 | | | | 34 | | | | 1.00 | | | | 1.05 | | | | 1.08 | | | | 24 | |
| | | | | | |
| | | | | | | | | | | | | | | | | | | | | | | | | | |
| | 30.49 | | | | (8.06 | ) | | | 6,310 | | | | 0.74 | | | | 1.92 | | | | 0.85 | | | | 9 | |
| | 35.57 | | | | 8.25 | | | | 6,114 | | | | 0.76 | | | | 1.41 | (f) | | | 0.88 | | | | 23 | |
| | 33.59 | | | | 15.27 | | | | 422 | | | | 0.83 | | | | 1.14 | | | | 0.89 | | | | 24 | |
| | | | | | |
| | | | | | | | | | | | | | | | | | | | | | | | | | |
| | 30.51 | | | | (7.99 | ) | | | 3,628,398 | | | | 0.64 | | | | 2.16 | | | | 0.75 | | | | 9 | |
| | 35.60 | | | | 8.31 | | | | 3,869,991 | | | | 0.67 | | | | 1.52 | (f) | | | 0.75 | | | | 23 | |
| | 33.61 | | | | 15.35 | | | | 3,069,390 | | | | 0.74 | | | | 1.39 | | | | 0.75 | | | | 24 | |
SEE NOTES TO FINANCIAL STATEMENTS.
| | | | | | | | |
| | | |
| DECEMBER 31, 2018 | | J.P. MORGAN MID CAP/MULTI-CAP FUNDS | | | | | 53 | |
NOTES TO FINANCIAL STATEMENTS
AS OF DECEMBER 31, 2018 (Unaudited)
1. Organization
JPMorgan Trust I (“JPM I”) and JPMorgan Trust II (“JPM II”) were formed on November 12, 2004, as Delaware statutory trusts, pursuant to Declarations of Trust dated November 5, 2004 and are registered under the Investment Company Act of 1940, as amended (the “1940 Act”), asopen-end management investment companies.
J.P. Morgan Mutual Fund Investment Trust (“JPMMFIT”), anopen-end management investment company, was organized as a Massachusetts business trust on September 23, 1997.
J.P. Morgan Fleming Mutual Fund Group, Inc. (“JPMFMFG”, and with JPM I, JPM II and JPMMFIT, collectively, the “Trusts”), anopen-end management investment company, was organized as a Maryland corporation on August 19, 1997.
The following are 5 separate funds of the Trusts (each, a “Fund” and collectively, the “Funds”) covered by this report:
| | | | | | |
| | | Classes Offered | | Trust | | Diversified/Non-Diversified |
| JPMorgan Growth Advantage Fund | | Class A, Class C, Class I, Class R2*, Class R3, Class R4, Class R5 and Class R6 | | JPMMFIT | | Diversified |
| JPMorgan Mid Cap Equity Fund | | Class A, Class C, Class I, Class R2, Class R5 and Class R6 | | JPM I | | Diversified |
| JPMorgan Mid Cap Growth Fund | | Class A, Class C, Class I, Class R2, Class R3, Class R4, Class R5 and Class R6 | | JPM II | | Diversified |
| JPMorgan Mid Cap Value Fund | | Class A, Class C, Class I, Class L, Class R2, Class R3, Class R4, Class R5 and Class R6 | | JPMFMFG | | Diversified |
| JPMorgan Value Advantage Fund | | Class A, Class C, Class I, Class L, Class R2*, Class R3, Class R4, Class R5 and Class R6 | | JPM I | | Diversified |
| * | | Class R2 Shares commenced operations on July 31, 2017 for JPMorgan Growth Advantage Fund and JPMorgan Value Advantage Fund. |
The investment objective of JPMorgan Growth Advantage Fund (“Growth Advantage Fund”) and JPMorgan Mid Cap Equity Fund (“Mid Cap Equity Fund”) is to seek to provide long-term capital growth.
The investment objective of JPMorgan Mid Cap Growth Fund (“Mid Cap Growth Fund”) is to seek growth of capital.
The investment objective of JPMorgan Mid Cap Value Fund (“Mid Cap Value Fund”) is to seek growth from capital appreciation.
The investment objective of JPMorgan Value Advantage Fund (“Value Advantage Fund”) is to seek to provide long-term total return from a combination of income and capital gains.
Class L Shares of the Mid Cap Value Fund and the Value Advantage Fund are publicly offered only on a limited basis. Investors are not eligible to purchase Class L Shares of these Funds unless they meet certain requirements as described in the Funds’ prospectuses.
Class A Shares generally provide for afront-end sales charge while Class C Shares provide for a contingent deferred sales charge (“CDSC”). No sales charges are assessed with respect to Class I, Class L, Class R2, Class R3, Class R4, Class R5 and Class R6 Shares. Certain Class A Shares, for whichfront-end sales charges have been waived, may be subject to a CDSC as described in the Funds’ prospectuses. Beginning on November 14, 2017, Class C Shares automatically convert to Class A Shares after ten years. All classes of shares have equal rights as to earnings, assets and voting privileges, except that each class may bear different transfer agency, distribution and service fees and each class has exclusive voting rights with respect to its distribution plan and shareholder servicing agreements.
J.P. Morgan Investment Management Inc. (“JPMIM”), an indirect, wholly-owned subsidiary of JPMorgan Chase & Co. (“JPMorgan”), acts as Adviser (the “Adviser”) and Administrator (the “Administrator”) to the Funds.
2. Significant Accounting Policies
The following is a summary of significant accounting policies followed by the Funds in the preparation of their financial statements. The Funds are investment companies and, thus, follow the investment company accounting and reporting guidance of the Financial Accounting Standards Board Accounting Standards Codification Topic 946 — Investment Companies, which is part of U.S. generally accepted accounting principles (“GAAP”). The preparation of financial statements in conformity with GAAP requires management to make estimates and assumptions that affect the reported amounts of assets and liabilities and disclosure of contingent assets and liabilities at the date of the financial statements and the reported amounts of increases and decreases in net assets from operations during the reporting period. Actual results could differ from those estimates.
A. Valuation of Investments — The valuation of investments is in accordance with GAAP and the Funds’ valuation policies set forth by and under the supervision and responsibility of the Boards of Trustees (the “Boards”), which established the following approach to valuation, as described more fully below: (i) investments for which market quotations are readily available shall be valued at their market value and (ii) all other investments for which market quotations are not readily available shall be valued at their fair value as determined in good faith by the Boards.
The Administrator has established the J.P. Morgan Asset Management Americas Valuation Committee (“AVC”) to assist the Boards with the oversight and monitoring of the valuation of the Funds’ investments. The Administrator implements the valuation policies of the Funds’ investments, as
| | | | | | |
| | | |
| 54 | | | | J.P. MORGAN MID CAP/MULTI-CAP FUNDS | | DECEMBER 31, 2018 |
directed by the Boards. The AVC oversees and carries out the policies for the valuation of investments held in the Funds. This includes monitoring the appropriateness of fair values based on results of ongoing valuation oversight including, but not limited to, consideration of macro or security specific events, market events and pricing vendor and broker due diligence. The Administrator is responsible for discussing and assessing the potential impacts to the fair values on an ongoing basis, and at least on a quarterly basis with the AVC and the Boards.
A market-based approach is primarily used to value the Funds’ investments. Investments for which market quotations are not readily available are fair valued by approved affiliated and unaffiliated pricing vendors or third party broker-dealers (collectively referred to as “Pricing Services”) or may be internally fair valued using methods set forth by the valuation policies approved by the Boards. This may include related or comparable assets or liabilities, recent transactions, market multiples, book values and other relevant information for the investment to determine the fair value of the investment. An income-based valuation approach may be used in which the anticipated future cash flows of the investment are discounted to calculate the fair value. Discounts may also be applied due to the nature or duration of any restrictions on the disposition of the investments. Valuations may be based upon current market prices of securities that are comparable in coupon, rating, maturity and industry. It is possible that the estimated values may differ significantly from the values that would have been used, had a ready market for the investments existed, and such differences could be material.
Equities and other exchange-traded instruments are valued at the last sale price or official market closing price on the primary exchange on which the instrument is traded before the net asset values (“NAV”) of the Funds are calculated on a valuation date. Investments inopen-end investment companies (the “Underlying Funds”) are valued at each Underlying Fund’s NAV per share as of the report date.
Valuations reflected in this report are as of the report date. As a result, changes in valuation due to market events and/or issuer related events after the report date and prior to issuance of the report are not reflected herein.
The various inputs that are used in determining the valuation of the Funds’ investments are summarized into the three broad levels listed below.
| • | | Level 1 — Unadjusted inputs using quoted prices in active markets for identical investments. |
| • | | Level 2 — Other significant observable inputs including, but not limited to, quoted prices for similar investments, inputs other than quoted prices that are observable for investments (such as interest rates, prepayment speeds, credit risk, etc.) or other market corroborated inputs. |
| • | | Level 3 — Significant inputs based on the best information available in the circumstances, to the extent observable inputs are not available (including the Funds’ assumptions in determining the fair value of investments). |
A financial instrument’s level within the fair value hierarchy is based on the lowest level of any input, both individually and in the aggregate, that is significant to the fair value measurement. The inputs or methodology used for valuing instruments are not necessarily an indication of the risk associated with investing in those instruments.
The following tables represent each valuation input as presented on the Schedules of Portfolio Investments (“SOIs”) (amounts in thousands):
Growth Advantage Fund
| | | | | | | | | | | | | | | | |
| | | Level 1 Quoted prices | | | Level 2 Other significant
observable inputs | | | Level 3 Significant
unobservable inputs | | | Total | |
Total Investments in Securities(a) | | $ | 7,920,548 | | | $ | — | | | $ | — | | | $ | 7,920,548 | |
| | | | | | | | | | | | | | | | |
| | | | |
| Mid Cap Equity Fund | | | | | | | | | | | | | | | | |
| | | Level 1 Quoted prices | | | Level 2 Other significant
observable inputs | | | Level 3 Significant
unobservable inputs | | | Total | |
Total Investments in Securities(a) | | $ | 2,468,073 | | | $ | — | | | $ | — | | | $ | 2,468,073 | |
| | | | | | | | | | | | | | | | |
| | | | |
| Mid Cap Growth Fund | | | | | | | | | | | | | �� | | | |
| | | Level 1 Quoted prices | | | Level 2 Other significant
observable inputs | | | Level 3 Significant
unobservable inputs | | | Total | |
Total Investments in Securities(a) | | $ | 3,684,701 | | | $ | — | | | $ | — | | | $ | 3,684,701 | |
| | | | | | | | | | | | | | | | |
| | | | |
| Mid Cap Value Fund | | | | | | | | | | | | | | | | |
| | | Level 1 Quoted prices | | | Level 2 Other significant
observable inputs | | | Level 3 Significant
unobservable inputs | | | Total | |
Total Investments in Securities(a) | | $ | 15,359,003 | | | $ | — | | | | $— | | | $ | 15,359,003 | |
| | | | | | | | | | | | | | | | |
| | | | | | | | |
| | | |
| DECEMBER 31, 2018 | | J.P. MORGAN MID CAP/MULTI-CAP FUNDS | | | | | 55 | |
NOTES TO FINANCIAL STATEMENTS
AS OF DECEMBER 31, 2018 (Unaudited) (continued)
| | | | | | | | | | | | | | | | |
| | | | |
| Value Advantage Fund | | | | | | | | | | | | | | | | |
| | | Level 1 Quoted prices | | | Level 2 Other significant
observable inputs | | | Level 3 Significant
unobservable inputs | | | Total | |
Total Investments in Securities(b) | | $ | 9,994,233 | | | $ | — | | | $ | 146 | | | $ | 9,994,379 | |
| | | | | | | | | | | | | | | | |
| (a) | All portfolio holdings designated as level 1 are disclosed individually on the SOIs. Please refer to the SOIs for industry specifics of portfolio holdings. |
| (b) | All portfolio holdings designated as level 1 and level 3 are disclosed individually on the SOIs. Level 3 consists of rights. Please refer to the SOIs for industry specifics of portfolio holdings. |
There were no transfers among any levels for the six months ended December 31, 2018.
B. Securities Lending — Effective October 5, 2018, the Funds became authorized to engage in securities lending in order to generate additional income. The Funds are able to lend to approved borrowers. Citibank N.A. (“Citibank”) serves as lending agent for the Funds, pursuant to a Securities Lending Agency Agreement (the “Securities Lending Agency Agreement”). Securities loaned are collateralized by cash equal to at least 100% of the market value plus accrued interest on the securities lent, which is invested in the IM Shares of JPMorgan U.S. Government Money Market Fund and the Agency SL Shares of the JPMorgan Securities Lending Money Market Fund. The Funds retain loan fees and the interest on cash collateral investments but are required to pay the borrower a rebate for the use of cash collateral. In cases where the lent security is of high value to borrowers, there may be a negative rebate (i.e., a net payment from the borrower to the Funds). Upon termination of a loan, the Funds are required to return to the borrower an amount equal to the cash collateral, plus any rebate owed to the borrowers. The remaining maturities of the securities lending transactions are considered overnight and continuous. Loans are subject to termination by the Funds or the borrower at any time.
The net income earned on the securities lending (after payment of rebates and Citibank’s fee) is included on the Statements of Operations as Income from securities lending (net). The Funds also receive payments from the borrower during the period of the loan, equivalent to dividends and interest earned on the securities loaned, which are recorded as Dividend or Interest income, respectively, on the Statements of Operations (amounts in thousands).
| | | | |
| | | Dividend Income | |
Growth Advantage Fund | | $ | 592 | |
Mid Cap Equity Fund | | | 169 | |
Mid Cap Growth Fund | | | 461 | |
Mid Cap Value Fund | | | 568 | |
Value Advantage Fund | | | 214 | |
Under the Securities Lending Agency Agreement, Citibank marks to market the loaned securities on a daily basis. In the event the cash received from the borrower is less than 102% of the value of the loaned securities (105% for loans ofnon-U.S. securities), Citibank requests additional cash from the borrower so as to maintain a collateralization level of at least 102% of the value of the loaned securities plus accrued interest (105% for loans ofnon-U.S. securities).
The value of securities out on loan is recorded as an asset on the Statements of Assets and Liabilities. The value of the cash collateral received is recorded as a liability on the Statements of Assets and Liabilities and details of Collateral Investments are disclosed on the SOIs. At December 31, 2018, the value of outstanding securities on loan and the value of Collateral investments were as follows (amounts in thousands):
| | | | | | | | | | | | |
| | | Value of
Securities on Loan | | | Cash Collateral
Posted by Borrower | | | Total value of
Collateral
Investments | |
Growth Advantage Fund | | $ | 135,257 | | | $ | 138,088 | | | $ | 138,088 | |
Mid Cap Equity Fund | | | 47,406 | | | | 47,708 | | | | 47,708 | |
Mid Cap Growth Fund | | | 132,610 | | | | 133,998 | | | | 133,998 | |
Mid Cap Value Fund | | | 101,814 | | | | 103,483 | | | | 103,483 | |
Value Advantage Fund | | | 73,853 | | | | 75,166 | | | | 75,166 | |
The Funds bear the risk of loss associated with the Collateral Investments and are not entitled to additional collateral from the borrower to cover any such losses. To the extent that the value of the Collateral Investments declines below the amount owed to a borrower, the Funds may incur losses that exceed the amount they earned on lending the security. Upon termination of a loan, the Funds may use leverage (borrow money) to repay the borrower for cash collateral posted if the Adviser does not believe that it is prudent to sell the Collateral Investments to fund the payment of this liability.
| | | | | | |
| | | |
| 56 | | | | J.P. MORGAN MID CAP/MULTI-CAP FUNDS | | DECEMBER 31, 2018 |
The following table presents the Funds’ value of the securities on loan with Citibank, net of amounts available for offset under the master netting arrangements and any related collated received or posted by the Funds as of December 31, 2018 (amounts in thousands).
| | | | | | | | | | | | |
| | | Investment Securities
on Loan, at value,
Presented on the
Statements of Assets
and Liabilities | | | Cash Collateral
Posted by Borrower | | | Net Amount Due to
Counterparty
(not less than zero) | |
Growth Advantage Fund | | $ | 135,257 | | | $ | (135,257 | ) | | $ | — | |
Mid Cap Equity Fund | | | 47,406 | | | | (47,406 | ) | | | — | |
Mid Cap Growth Fund | | | 132,610 | | | | (132,610 | ) | | | — | |
Mid Cap Value Fund | | | 101,814 | | | | (101,814 | ) | | | — | |
Value Advantage Fund | | | 73,853 | | | | (73,853 | ) | | | — | |
Securities lending also involves counterparty risks, including the risk that the loaned securities may not be returned in a timely manner or at all. Subject to certain conditions, Citibank has agreed to indemnify the Funds from losses resulting from a borrower’s failure to return a loaned security.
JPMIM voluntarily waived investment advisory fees charged to the Funds to reduce the impact of the investment in the JPMorgan U.S. Government Money Market Fund from 0.16% to 0.06%. JPMIM waived fees associated with the Funds’ investment in JPMorgan U.S. Government Money Market Fund as follows (amounts in thousands):
| | | | |
Growth Advantage Fund | | $ | 6 | |
Mid Cap Equity Fund | | | 2 | |
Mid Cap Growth Fund | | | 5 | |
Mid Cap Value Fund | | | 6 | |
Value Advantage Fund | | | 2 | |
The above waiver is included in the determination of earnings on cash collateral investment and in the calculation of Citibank’s compensation and is included on the Statements of Operations as Income from securities lending (net).
C. Investment Transactions with Affiliates — The Funds invested in Underlying Funds which are advised by the Adviser or its affiliates. An issuer which is under common control with the Funds may be considered an affiliate. For the purposes of the financial statements, the Funds assume the issuers listed in the table below to be affiliated issuers. Underlying Funds’ distributions may be reinvested into the Underlying Funds. Reinvestment amounts are included in the purchase cost amounts in the tables below. Amounts in the tables below are in thousands.
Growth Advantage Fund
| | | | | | | | | | | | | | | | | | | | | | | | | | | | | | | | | | | | |
| For the six months ended December 31, 2018 | |
| Security Description | | Value at
June 30,
2018 | | | Purchases
at Cost | | | Proceeds
from Sales | | | Net
Realized
Gain (Loss) | | | Change
in Unrealized
Appreciation/
(Depreciation) | | | Value at
December 31,
2018 | | | Shares at
December 31,
2018 | | | Dividend
Income | | | Capital Gain
Distributions | |
JPMorgan Securities Lending Money Market Fund Class Agency SL Shares, 2.60% (a)(b) | | $ | — | | | $ | 281,000 | | | $ | 169,000 | | | $ | — | | | $ | — | | | $ | 112,000 | | | | 112,011 | | | $ | 446 | * | | $ | — | |
JPMorgan U.S. Government Money Market Fund Class IM Shares, 2.46% (a)(b) | | | — | | | | 220,791 | | | | 194,703 | | | | — | | | | — | | | | 26,088 | | | | 26,088 | | | | 146 | * | | | — | |
JPMorgan U.S. Government Money Market Fund Class Institutional Shares, 2.40% (a)(b) | | | 218,911 | | | | 977,746 | | | | 1,129,123 | | | | — | | | | — | | | | 67,534 | | | | 67,534 | | | | 2,606 | | | | — | |
| | | | | | | | | | | | | | | | | | | | | | | | | | | | | | | | | | | | |
Total | | $ | 218,911 | | | $ | 1,479,537 | | | $ | 1,492,826 | | | $ | — | | | $ | — | | | $ | 205,622 | | | | | | | $ | 3,198 | | | $ | — | |
| | | | | | | | | | | | | | | | | | | | | | | | | | | | | | | | | | | | |
| | | | | | | | |
| | | |
| DECEMBER 31, 2018 | | J.P. MORGAN MID CAP/MULTI-CAP FUNDS | | | | | 57 | |
NOTES TO FINANCIAL STATEMENTS
AS OF DECEMBER 31, 2018 (Unaudited) (continued)
Mid Cap Equity Fund
| | | | | | | | | | | | | | | | | | | | | | | | | | | | | | | | | | | | |
| For the six months ended December 31, 2018 | |
| Security Description | | Value at
June 30,
2018 | | | Purchases
at Cost | | | Proceeds
from Sales | | | Net
Realized
Gain
(Loss) | | | Change
in Unrealized
Appreciation/
(Depreciation) | | | Value at
December 31,
2018 | | | Shares at
December 31,
2018 | | | Dividend
Income | | | Capital Gain
Distributions | |
JPMorgan Securities Lending Money Market Fund Class Agency SL Shares, 2.60% (a)(b) | | $ | — | | | $ | 90,000 | | | $ | 50,000 | | | $ | — | | | $ | — | | | $ | 40,000 | | | | 40,004 | | | $ | 125 | * | | $ | — | |
JPMorgan U.S. Government Money Market Fund Class IM Shares, 2.46% (a)(b) | | | — | | | | 71,460 | | | | 63,752 | | | | — | | | | — | | | | 7,708 | | | | 7,708 | | | | 44 | * | | | — | |
JPMorgan U.S. Government Money Market Fund Class Institutional Shares, 2.40% (a)(b) | | | 80,883 | | | | 313,222 | | | | 354,781 | | | | — | | | | — | | | | 39,324 | | | | 39,324 | | | | 917 | | | | — | |
| | | | | | | | | | | | | | | | | | | | | | | | | | | | | | | | | | | | |
Total | | $ | 80,883 | | | $ | 474,682 | | | $ | 468,533 | | | $ | — | | | $ | — | | | $ | 87,032 | | | | | | | $ | 1,086 | | | $ | — | |
| | | | | | | | | | | | | | | | | | | | | | | | | | | | | | | | | | | | |
Mid Cap Growth Fund
| | | | | | | | | | | | | | | | | | | | | | | | | | | | | | | | | | | | |
| For the six months ended December 31, 2018 | |
| Security Description | | Value at
June 30,
2018 | | | Purchases
at Cost | | | Proceeds
from Sales | | | Net
Realized
Gain
(Loss) | | | Change
in Unrealized
Appreciation/
(Depreciation) | | | Value at
December 31,
2018 | | | Shares at
December 31,
2018 | | | Dividend
Income | | | Capital Gain
Distributions | |
JPMorgan Securities Lending Money Market Fund Class Agency SL Shares, 2.60% (a)(b) | | $ | — | | | $ | 216,000 | | | $ | 102,000 | | | $ | — | | | $ | — | | | $ | 114,000 | | | | 114,011 | | | $ | 351 | * | | $ | — | |
JPMorgan U.S. Government Money Market Fund Class IM Shares, 2.46% (a)(b) | | | — | | | | 149,108 | | | | 129,110 | | | | — | | | | — | | | | 19,998 | | | | 19,998 | | | | 110 | * | | | — | |
JPMorgan U.S. Government Money Market Fund Class Institutional Shares, 2.40% (a)(b) | | | 114,331 | | | | 465,906 | | | | 564,547 | | | | — | | | | — | | | | 15,690 | | | | 15,690 | | | | 1,290 | | | | — | |
| | | | | | | | | | | | | | | | | | | | | | | | | | | | | | | | | | | | |
Total | | $ | 114,331 | | | $ | 831,014 | | | $ | 795,657 | | | $ | — | | | $ | — | | | $ | 149,688 | | | | | | | $ | 1,751 | | | $ | — | |
| | | | | | | | | | | | | | | | | | | | | | | | | | | | | | | | | | | | |
Mid Cap Value Fund
| | | | | | | | | | | | | | | | | | | | | | | | | | | | | | | | | | | | |
| For the six months ended December 31, 2018 | |
| Security Description | | Value at
June 30,
2018 | | | Purchases at
Cost | | | Proceeds
from Sales | | | Net
Realized
Gain
(Loss) | | | Change
in Unrealized
Appreciation/
(Depreciation) | | | Value at
December 31,
2018 | | | Shares at
December 31,
2018 | | | Dividend
Income | | | Capital Gain
Distributions | |
JPMorgan Securities Lending Money Market Fund Class Agency SL Shares, 2.60% (a)(b) | | $ | — | | | $ | 387,000 | | | $ | 298,000 | | | $ | — | | | $ | — | | | $ | 89,000 | | | | 89,009 | | | $ | 428 | * | | $ | — | |
JPMorgan U.S. Government Money Market Fund Class IM Shares, 2.46% (a)(b) | | | — | | | | 244,810 | | | | 230,327 | | | | — | | | | — | | | | 14,483 | | | | 14,483 | | | | 140 | * | | | — | |
JPMorgan U.S. Government Money Market Fund Class Institutional Shares, 2.40% (a)(b) | | | 511,256 | | | | 960,010 | | | | 1,185,122 | | | | — | (c) | | | — | | | | 286,144 | | | | 286,144 | | | | 6,229 | | | | — | |
| | | | | | | | | | | | | | | | | | | | | | | | | | | | | | | | | | | | |
Total | | $ | 511,256 | | | $ | 1,591,820 | | | $ | 1,713,449 | | | $ | — | (c) | | $ | — | | | $ | 389,627 | | | | | | | $ | 6,797 | | | $ | — | |
| | | | | | | | | | | | | | | | | | | | | | | | | | | | | | | | | | | | |
| | | | | | |
| | | |
| 58 | | | | J.P. MORGAN MID CAP/MULTI-CAP FUNDS | | DECEMBER 31, 2018 |
Value Advantage Fund
| | | | | | | | | | | | | | | | | | | | | | | | | | | | | | | | | | | | |
| For the six months ended December 31, 2018 | |
| Security Description | | Value at
June 30,
2018 | | | Purchases at
Cost | | | Proceeds
from Sales | | | Net
Realized
Gain
(Loss) | | | Change
in Unrealized
Appreciation/
(Depreciation) | | | Value at
December 31,
2018 | | | Shares at
December 31,
2018 | | | Dividend
Income | | | Capital Gain
Distributions | |
JPMorgan Securities Lending Money Market Fund Class Agency SL Shares, 2.60% (a)(b) | | $ | — | | | $ | 122,000 | | | $ | 59,000 | | | $ | — | | | $ | — | | | $ | 63,000 | | | | 63,006 | | | $ | 157 | * | | $ | — | |
JPMorgan U.S. Government Money Market Fund Class IM Shares, 2.46% (a)(b) | | | — | | | | 87,845 | | | | 75,679 | | | | — | | | | — | | | | 12,166 | | | | 12,166 | | | | 57 | * | | | — | |
JPMorgan U.S. Government Money Market Fund Class Institutional Shares, 2.40% (a)(b) | | | 253,654 | | | | 1,015,309 | | | | 1,179,662 | | | | — | | | | — | | | | 89,301 | | | | 89,301 | | | | 2,637 | | | | — | |
| | | | | | | | | | | | | | | | | | | | | | | | | | | | | | | | | | | | |
Total | | $ | 253,654 | | | $ | 1,225,154 | | | $ | 1,314,341 | | | $ | — | | | $ | — | | | $ | 164,467 | | | | | | | $ | 2,851 | | | $ | — | |
| | | | | | | | | | | | | | | | | | | | | | | | | | | | | | | | | | | | |
| (a) | Investment in affiliate. Fund is registered under the Investment Company Act of 1940, as amended, and advised by J.P. Morgan Investment Management Inc. |
| (b) | The rate shown is the current yield as of December 31, 2018. |
| (c) | Amount rounds to less than one thousand. |
| * | Amount is included on the Statements of Operations as Income from securities lending (net). |
D. Security Transactions and Investment Income — Investment transactions are accounted for on the trade date (the date the order to buy or sell is executed). Securities gains and losses are calculated on a specifically identified cost basis. Interest income is determined on the basis of coupon interest accrued using the effective interest method which adjusts for amortization of premiums and accretion of discounts. Dividend income, net of foreign taxes withheld, if any, and dividend expense on securities sold short, are recorded on theex-dividend date or when a Fund first learns of the dividend.
To the extent such information is publicly available, the Funds record distributions received in excess of income earned from underlying investments as a reduction of cost of investments and/or realized gain. Such amounts are based on estimates if actual amounts are not available and actual amounts of income, realized gain and return of capital may differ from the estimated amounts. The Funds adjust the estimated amounts of the components of distributions (and consequently their net investment income) as necessary once the issuers provide information about the actual composition of the distributions.
E. Allocation of Income and Expenses — Expenses directly attributable to a fund are charged directly to that fund, while the expenses attributable to more than one fund of the Trusts are allocated among the respective funds. In calculating the NAV of each class, investment income, realized and unrealized gains and losses and expenses, other than class-specific expenses, are allocated daily to each class of shares based upon the proportion of net assets of each class at the beginning of each day.
Transfer agency fees are class-specific expenses. The amount of the transfer agency fees charged to each class of the Funds for the six months ended December 31, 2018 are as follows (amounts in thousands):
| | | | | | | | | | | | | | | | | | | | | | | | | | | | | | | | | | | | | | | | |
| | | Class A | | | Class C | | | Class I | | | Class L | | | Class R2 | | | Class R3 | | | Class R4 | | | Class R5 | | | Class R6 | | | Total | |
Growth Advantage Fund | | | | | | | | | | | | | | | | | | | | | | | | | | | | | | | | | | | | | | | | |
Transfer agency fees | | $ | 51 | | | $ | 23 | | | $ | 22 | | | | n/a | | | $ | — | (a) | | $ | — | (a) | | $ | — | (a) | | $ | 2 | | | $ | 19 | | | $ | 117 | |
Mid Cap Equity Fund | | | | | | | | | | | | | | | | | | | | | | | | | | | | | | | | | | | | | | | | |
Transfer agency fees | | | 12 | | | | 1 | | | | 4 | | | | n/a | | | | — | (a) | | | n/a | | | | n/a | | | | — | (a) | | | 9 | | | | 26 | |
Mid Cap Growth Fund | | | | | | | | | | | | | | | | | | | | | | | | | | | | | | | | | | | | | | | | |
Transfer agency fees | | | 142 | | | | 4 | | | | 17 | | | | n/a | | | | 11 | | | | — | (a) | | | — | (a) | | | 2 | | | | 21 | | | | 197 | |
Mid Cap Value Fund | | | | | | | | | | | | | | | | | | | | | | | | | | | | | | | | | | | | | | | | |
Transfer agency fees | | | 58 | | | | 4 | | | | 20 | | | $ | 338 | | | | 5 | | | | 7 | | | | — | (a) | | | — | (a) | | | 8 | | | | 440 | |
Value Advantage Fund | | | | | | | | | | | | | | | | | | | | | | | | | | | | | | | | | | | | | | | | |
Transfer agency fees | | | 39 | | | | 20 | | | | 18 | | | | 29 | | | | — | (a) | | | — | (a) | | | — | (a) | | | — | (a) | | | 12 | | | | 118 | |
| (a) | Amount rounds to less than one thousand. |
| | | | | | | | |
| | | |
| DECEMBER 31, 2018 | | J.P. MORGAN MID CAP/MULTI-CAP FUNDS | | | | | 59 | |
NOTES TO FINANCIAL STATEMENTS
AS OF DECEMBER 31, 2018 (Unaudited) (continued)
F. Federal Income Taxes — Each Fund is treated as a separate taxable entity for Federal income tax purposes. Each Fund’s policy is to comply with the provisions of the Internal Revenue Code (the “Code”), applicable to regulated investment companies and to distribute to shareholders all of its distributable net investment income and net realized capital gains on investments. Accordingly, no provision for Federal income tax is necessary. Management has reviewed the Funds’ tax positions for all open tax years and has determined that as of December 31, 2018, no liability for income tax is required in the Funds’ financial statements for net unrecognized tax benefits. However, management’s conclusions may be subject to future review based on changes in, or the interpretation of, the accounting standards or tax laws and regulations. Each of the Funds’ Federal tax returns for the prior three fiscal years remains subject to examination by the Internal Revenue Service.
G. Distributions to Shareholders — Distributions from net investment income, if any, are generally declared and paid at least annually. Distributions are declared separately for each class of each Fund. No class has preferential dividend rights; differences in per share rates are due to differences in separate class expenses. Net realized capital gains, if any, are distributed by each Fund at least annually. The amount of distributions from net investment income and net realized capital gains is determined in accordance with Federal income tax regulations, which may differ from GAAP. To the extent these “book/tax” differences are permanent in nature (i.e., that they result from other than timing of recognition — “temporary differences”), such amounts are reclassified within the capital accounts based on their Federaltax-basis treatment.
3. Fees and Other Transactions with Affiliates
A. Investment Advisory Fee — Pursuant to Investment Advisory Agreements, the Adviser supervises the investments of each Fund and for such services is paid a fee. The fee is accrued daily and paid monthly based on each Fund’s respective average daily net assets. The annual rate for each Fund is as follows:
| | | | |
Growth Advantage Fund | | | 0.65 | % |
Mid Cap Equity Fund | | | 0.65 | |
Mid Cap Growth Fund | | | 0.65 | |
Mid Cap Value Fund | | | 0.65 | |
Value Advantage Fund | | | 0.65 | |
The Adviser waived Investment Advisory fees and/or reimbursed expenses as outlined in Note 3.F.
B. Administration Fee — Pursuant to Administration Agreements, the Administrator provides certain administration services to the Funds. In consideration of these services during the six months ended December 31, 2018, the Administrator received a fee that was accrued daily and paid monthly at an annual rate of 0.15% of the first $25 billion of the average daily net assets of all funds in the J.P. Morgan Funds Complex covered by the Administration Agreement (excluding certain funds of funds and money market funds) and 0.075% of the average daily net assets in excess of $25 billion of all such funds. For the six months ended December 31, 2018, the effective annualized rate was 0.08% of each Fund’s average daily net assets, notwithstanding any fee waivers and/or expense reimbursements.
The Administrator waived Administration fees as outlined in Note 3.F.
Effective January 1, 2019, the Administrator receives a fee accrued daily and paid monthly at an annual rate of 0.075% of the first $10 billion of each Fund’s respective average daily net assets, 0.050% of each Fund’s respective average daily net assets between $10 billion and $20 billion, 0.025% of each Fund’s respective average daily net assets between $20 billion and $25 billion and 0.01% of each Fund’s respective average daily net assets in excess of $25 billion.
JPMorgan Chase Bank, N.A. (“JPMCB”), a wholly-owned subsidiary of JPMorgan, serves as the Funds’sub-administrator (the“Sub-administrator”). For its services asSub-administrator, JPMCB receives a portion of the fees payable to the Administrator.
C. Distribution Fees — Pursuant to a Distribution Agreement, JPMorgan Distribution Services, Inc. (“JPMDS”), an indirect, wholly-owned subsidiary of JPMorgan, serves as the Trusts’ principal underwriter and promotes and arranges for the sale of each Fund’s shares.
The Boards have adopted a Distribution Plan (the “Distribution Plan”) for Class A, Class C, Class R2 and Class R3 Shares of the Funds, as applicable, in accordance with Rule12b-1 under the 1940 Act. Class I, Class L, Class R4, Class R5 and Class R6 Shares do not charge a distribution fee. The Distribution Plan provides that each Fund shall pay distribution fees, including payments to JPMDS, at annual rates of the average daily net assets as shown in the table below:
| | | | | | | | | | | | | | | | |
| | | Class A | | | Class C | | | Class R2 | | | Class R3 | |
Growth Advantage Fund | | | 0.25 | % | | | 0.75 | % | | | 0.50 | % | | | 0.25 | % |
Mid Cap Equity Fund | | | 0.25 | | | | 0.75 | | | | 0.50 | | | | n/a | |
Mid Cap Growth Fund | | | 0.25 | | | | 0.75 | | | | 0.50 | | | | 0.25 | |
Mid Cap Value Fund | | | 0.25 | | | | 0.75 | | | | 0.50 | | | | 0.25 | |
Value Advantage Fund | | | 0.25 | | | | 0.75 | | | | 0.50 | | | | 0.25 | |
| | | | | | |
| | | |
| 60 | | | | J.P. MORGAN MID CAP/MULTI-CAP FUNDS | | DECEMBER 31, 2018 |
In addition, JPMDS is entitled to receive thefront-end sales charges from purchases of Class A Shares and the CDSC from redemptions of Class C Shares and certain Class A Shares for whichfront-end sales charges have been waived. For the six months ended December 31, 2018, JPMDS retained the following (amounts in thousands):
| | | | | | | | |
| | | Front-End Sales Charge | | | CDSC | |
Growth Advantage Fund | | $ | 273 | | | $ | 10 | |
Mid Cap Equity Fund | | | 66 | | | | — | |
Mid Cap Growth Fund | | | 50 | | | | — | (a) |
Mid Cap Value Fund | | | 11 | | | | — | (a) |
Value Advantage Fund | | | 89 | | | | — | (a) |
| (a) | Amount rounds to less than one thousand. |
D. Service Fees — The Trusts, on behalf of the Funds, have entered into a Shareholder Servicing Agreement with JPMDS under which JPMDS provides certain support services to the shareholders. For performing these services, JPMDS receives a fee, except for Class R6 Shares which do not charge a service fee, that is accrued daily and paid monthly equal to a percentage of the average daily net assets as shown in the table below:
| | | | | | | | | | | | | | | | | | | | | | | | | | | | | | | | |
| | | Class A | | | Class C | | | Class I | | | Class L | | | Class R2 | | | Class R3 | | | Class R4 | | | Class R5 | |
Growth Advantage Fund | | | 0.25 | % | | | 0.25 | % | | | 0.25 | % | | | n/a | | | | 0.25 | % | | | 0.25 | % | | | 0.25 | % | | | 0.10 | % |
Mid Cap Equity Fund | | | 0.25 | | | | 0.25 | | | | 0.25 | | | | n/a | | | | 0.25 | | | | n/a | | | | n/a | | | | 0.10 | |
Mid Cap Growth Fund | | | 0.25 | | | | 0.25 | | | | 0.25 | | | | n/a | | | | 0.25 | | | | 0.25 | | | | 0.25 | | | | 0.10 | |
Mid Cap Value Fund | | | 0.25 | | | | 0.25 | | | | 0.25 | | | | 0.10 | % | | | 0.25 | | | | 0.25 | | | | 0.25 | | | | 0.10 | |
Value Advantage Fund | | | 0.25 | | | | 0.25 | | | | 0.25 | | | | 0.10 | | | | 0.25 | | | | 0.25 | | | | 0.25 | | | | 0.10 | |
JPMDS has entered into shareholder services contracts with affiliated and unaffiliated financial intermediaries who provide shareholder services and other related services to their clients or customers who invest in the Funds under which JPMDS will pay all or a portion of such fees earned to financial intermediaries for performing such services.
JPMDS waived service fees as outlined in Note 3.F.
E. Custodian and Accounting Fees — JPMCB provides portfolio custody and accounting services to the Funds. For performing these services, the Funds pay JPMCB transaction and asset-based fees that vary according to the number of transactions and positions, plusout-of-pocket expenses. The amounts paid directly to JPMCB by the Funds for custody and accounting services are included in Custodian and accounting fees on the Statements of Operations. Interest income earned on cash balances at the custodian, if any, is included in Interest income from affiliates on the Statements of Operations. Prior to March 1, 2018, payments to the custodian were reduced by credits earned by each Fund, based on uninvested cash balances held by the custodian. Such earnings credits, if any, are presented separately on the Statements of Operations.
Interest expense paid to the custodian related to cash overdrafts, if any, is included in Interest expense to affiliates on the Statements of Operations.
F. Waivers and Reimbursements — The Adviser, Administrator and/or JPMDS have contractually agreed to waive fees and/or reimburse the Funds to the extent that total annual operating expenses (excluding acquired fund fees and expenses other than certain money market fund fees as described below, dividend and interest expenses related to short sales, interest, taxes, expenses related to litigation and potential litigation and extraordinary expenses) exceed the percentages of the Funds’ respective average daily net assets as shown in the table below:
| | | | | | | | | | | | | | | | | | | | | | | | | | | | | | | | | | | | |
| | | Class A | | | Class C | | | Class I | | | Class L | | | Class R2 | | | Class R3 | | | Class R4 | | | Class R5 | | | Class R6 | |
Growth Advantage Fund | | | 1.14 | % | | | 1.64 | % | | | 0.89 | % | | | n/a | | | | 1.39 | % | | | 1.14 | % | | | 0.89 | % | | | 0.74 | % | | | 0.64 | % |
Mid Cap Equity Fund | | | 1.14 | | | | 1.64 | | | | 0.89 | | | | n/a | | | | 1.39 | | | | n/a | | | | n/a | | | | 0.74 | | | | 0.64 | |
Mid Cap Growth Fund | | | 1.24 | | | | 1.74 | | | | 0.93 | | | | n/a | | | | 1.49 | | | | 1.24 | | | | 0.99 | | | | 0.79 | | | | 0.74 | |
Mid Cap Value Fund | | | 1.24 | | | | 1.75 | | | | 0.99 | | | | 0.75 | % | | | 1.50 | | | | 1.25 | | | | 1.00 | | | | 0.85 | | | | 0.73 | * |
Value Advantage Fund | | | 1.14 | | | | 1.64 | | | | 0.89 | | | | 0.75 | | | | 1.39 | | | | 1.14 | | | | 0.89 | | | | 0.74 | | | | 0.64 | |
| * | Prior to November 1, 2018, the contractual expense limitation for Class R6 Shares of Mid Cap Value Fund was 0.75%. The contractual expense percentages in the table above are in place until at least October 31, 2019. |
Except as noted above, the expense limitation agreements were in effect for the six months ended December 31, 2018 and the contractual expense limitation percentages in the table above are in place until at least October 31, 2019.
| | | | | | | | |
| | | |
| DECEMBER 31, 2018 | | J.P. MORGAN MID CAP/MULTI-CAP FUNDS | | | | | 61 | |
NOTES TO FINANCIAL STATEMENTS
AS OF DECEMBER 31, 2018 (Unaudited) (continued)
For the six months ended December 31, 2018, the Funds’ service providers waived fees and/or reimbursed expenses for each of the Funds as follows (amounts in thousands). None of these parties expect the Funds to repay any such waived fees and/or reimbursed expenses in future years.
| | | | | | | | | | | | | | | | | | | | |
| | | Contractual Waivers | | | | |
| | | Investment
Advisory
Fees | | | Administration
Fees | | | Service
Fees | | | Total | | | Contractual
Reimbursements | |
Growth Advantage Fund | | $ | 2,862 | | | $ | 1,908 | | | $ | 91 | | | $ | 4,861 | | | $ | 12 | |
Mid Cap Equity Fund | | | 906 | | | | 604 | | | | 13 | | | | 1,523 | | | | — | |
Mid Cap Growth Fund | | | 131 | | | | 84 | | | | 575 | | | | 790 | | | | 8 | |
Mid Cap Value Fund | | | 221 | | | | 143 | | | | 5,664 | | | | 6,028 | | | | 97 | |
Value Advantage Fund | | | 3,623 | | | | 2,416 | | | | 76 | | | | 6,115 | | | | 12 | |
Additionally, the Funds may invest in one or more money market funds advised by the Adviser or its affiliates (affiliated money market funds). The Adviser, Administrator and/or JPMDS, as shareholder servicing agent, have contractually agreed to waive fees and/or reimburse expenses in an amount sufficient to offset the respective net fees each collects from the affiliated money market fund on the applicable Fund’s investment in such affiliated money market fund.
The amount of waivers resulting from investments in these money market funds for the six months ended December 31, 2018 was as follows (amounts in thousands):
| | | | |
Growth Advantage Fund | | $ | 305 | |
Mid Cap Equity Fund | | | 98 | |
Mid Cap Growth Fund | | | 150 | |
Mid Cap Value Fund | | | 685 | |
Value Advantage Fund | | | 317 | |
G. Other — Certain officers of the Trusts are affiliated with the Adviser, the Administrator and JPMDS. Such officers, with the exception of the Chief Compliance Officer, receive no compensation from the Funds for serving in their respective roles.
The Boards appointed a Chief Compliance Officer to the Funds in accordance with Federal securities regulations. Each Fund, along with other affiliated funds, makes reimbursement payments, on apro-rata basis, to the Administrator for a portion of the fees associated with the Office of the Chief Compliance Officer. Such fees are included in Trustees’ and Chief Compliance Officer’s fees on the Statements of Operations.
The Trusts adopted a Trustee Deferred Compensation Plan (the “Plan”) which allows the Independent Trustees to defer the receipt of all or a portion of compensation related to performance of their duties as Trustees. The deferred fees are invested in various J.P. Morgan Funds until distribution in accordance with the Plan.
During the six months ended December 31, 2018, Growth Advantage Fund, Mid Cap Equity Fund, Mid Cap Growth Fund and Mid Cap Value Fund purchased securities from an underwriting syndicate in which the principal underwriter or members of the syndicate were affiliated with the Adviser.
The Funds may use related party broker-dealers. For the six months ended December 31, 2018, the Funds did not incur any brokerage commissions with broker-dealers affiliated with the Adviser.
The Securities and Exchange Commission (“SEC”) has granted an exemptive order permitting the Funds to engage in principal transactions with J.P. Morgan Securities, Inc., an affiliated broker, involving taxable money market instruments, subject to certain conditions.
4. Investment Transactions
During the six months ended December 31, 2018, purchases and sales of investments (excluding short-term investments and transfersin-kind) were as follows (amounts in thousands):
| | | | | | | | |
| | | Purchases
(excluding
U.S.
Government) | | | Sales
(excluding
U.S.
Government) | |
Growth Advantage Fund | | $ | 2,004,154 | | | $ | 1,745,429 | |
Mid Cap Equity Fund | | | 504,155 | | | | 458,019 | |
Mid Cap Growth Fund | | | 1,178,578 | | | | 998,632 | |
Mid Cap Value Fund | | | 1,217,379 | | | | 1,628,658 | |
Value Advantage Fund | | | 954,437 | | | | 1,240,799 | |
During the six months ended December 31, 2018, there were no purchases or sales of U.S. Government securities.
| | | | | | |
| | | |
| 62 | | | | J.P. MORGAN MID CAP/MULTI-CAP FUNDS | | DECEMBER 31, 2018 |
5. Federal Income Tax Matters
For Federal income tax purposes, the estimated cost and unrealized appreciation (depreciation) in value of investments held at December 31, 2018 were as follows (amounts in thousands):
| | | | | | | | | | | | | | | | |
| | | Aggregate
Cost | | | Gross
Unrealized
Appreciation | | | Gross
Unrealized
Depreciation | | | Net Unrealized
Appreciation
(Depreciation) | |
Growth Advantage Fund | | $ | 5,577,283 | | | $ | 2,546,106 | | | $ | 202,841 | | | $ | 2,343,265 | |
Mid Cap Equity Fund | | | 1,963,953 | | | | 637,589 | | | | 133,469 | | | | 504,120 | |
Mid Cap Growth Fund | | | 3,142,141 | | | | 752,863 | | | | 210,303 | | | | 542,560 | |
Mid Cap Value Fund | | | 11,432,100 | | | | 4,879,740 | | | | 952,837 | | | | 3,926,903 | |
Value Advantage Fund | | | 8,329,449 | | | | 2,223,555 | | | | 558,625 | | | | 1,664,930 | |
Late year ordinary losses incurred after December 31 as well as net capital losses incurred after October 31 and within the taxable year are deemed to arise on the first business day of the Funds’ next taxable year. For the year ended June 30, 2018, the following Funds deferred to July 1, 2018 late year ordinary losses and post-October capital losses of (amounts in thousands):
| | | | |
| | | Late Year Ordinary
Loss Deferral | |
Growth Advantage Fund | | $ | 10,229 | |
Mid Cap Growth Fund | | | 6,257 | |
6. Borrowings
The Funds rely upon an exemptive order granted by the SEC (the “Order”) permitting the establishment and operation of an Interfund Lending Facility (the “Facility”). The Facility allows the Funds to directly lend and borrow money to or from any other fund relying upon the Order at rates beneficial to both the borrowing and lending funds. Advances under the Facility are taken primarily for temporary or emergency purposes, including the meeting of redemption requests that otherwise might require the untimely disposition of securities, and are subject to each Fund’s borrowing restrictions. The Interfund loan rate is determined, as specified in the Order, by averaging the current repurchase agreement rate and the current bank loan rate. The Order was granted to JPM II and may be relied upon by the Funds because the Funds and the series of JPM II are all investment companies in the same “group of investment companies” (as defined in Section 12(d)(1)(G) of the 1940 Act).
The Trusts and JPMCB have entered into a financing arrangement. Under this arrangement, JPMCB provides an unsecured, uncommitted credit facility in the aggregate amount of $100 million to certain of the J.P. Morgan Funds, including the Funds. Advances under the arrangement are taken primarily for temporary or emergency purposes, including the meeting of redemption requests that otherwise might require the untimely disposition of securities, and are subject to each Fund’s borrowing restrictions. Interest on borrowings is payable at a rate determined by JPMCB at the time of borrowing. This agreement has been extended until November 4, 2019.
The Funds had no borrowings outstanding from another fund or from the unsecured, uncommitted credit facility at December 31, 2018. Average borrowings from the Facility during the six months ended December 31, 2018, were as follows (amounts in thousands, except number of days outstanding):
| | | | | | | | | | | | | | | | |
| | | Average
Borrowings | | | Average Interest
Rate Paid | | | Number of
Days Outstanding | | | Interest
Paid | |
Mid Cap Equity Fund | | $ | 13,588 | | | | 2.71 | % | | | 1 | | | $ | 1 | |
The Trusts, along with certain other trusts (“Borrowers”), have entered into a joint syndicated senior unsecured revolving credit facility totaling $1.5 billion (“Credit Facility”) with various lenders and The Bank of New York Mellon, as administrative agent for the lenders. This Credit Facility provides a source of funds to the Borrowers for temporary and emergency purposes, including the meeting of redemption requests that otherwise might require the untimely disposition of securities. Under the terms of the Credit Facility, a borrowing fund must have a minimum of $25,000,000 in adjusted net asset value and not exceed certain adjusted net asset coverage ratios prior to and during the time in which any borrowings are outstanding. If a fund does not comply with the aforementioned requirements, the fund must remediate within three business days with respect to the $25,000,000 minimum adjusted net asset value or within one business day with respect to certain asset coverage ratios or the administrative agent at the request of, or with the consent of, the lenders may terminate the Credit Facility and declare any outstanding borrowings to be due and payable immediately.
Interest associated with any borrowing under the Credit Facility is charged to the borrowing fund at a rate of interest equal to 1.00% plus the greater of the federal funds effective rate or one month LIBOR. The annual commitment fee to maintain the Credit Facility is 0.15% and is incurred on the unused portion of the Credit Facility and is allocated to all participating funds pro rata based on their respective net assets. Effective August 14, 2018, this agreement has been amended and restated for a term of 364 days, unless extended.
| | | | | | | | |
| | | |
| DECEMBER 31, 2018 | | J.P. MORGAN MID CAP/MULTI-CAP FUNDS | | | | | 63 | |
NOTES TO FINANCIAL STATEMENTS
AS OF DECEMBER 31, 2018 (Unaudited) (continued)
The Funds had no borrowings outstanding from the Credit Facility at December 31, 2018. Average borrowings from the Credit Facility for, or at any time during the six months ended December 31, 2018 were as follows (amounts in thousands):
| | | | | | | | | | | | | | | | |
| | | Average
Borrowings | | | Average Interest
Rate Paid | | | Number of
Days Outstanding | | | Interest
Paid | |
Growth Advantage Fund | | $ | 10,500 | | | | 3.38 | % | | | 1 | | | $ | 1 | |
Value Advantage Fund | | $ | 27,500 | | | | 3.38 | % | | | 1 | | | $ | 3 | |
7. Risks, Concentrations and Indemnifications
In the normal course of business, the Funds enter into contracts that contain a variety of representations which provide general indemnifications. Each Fund’s maximum exposure under these arrangements is unknown. The amount of exposure would depend on future claims that may be brought against each Fund. However, based on experience, the Funds expect the risk of loss to be remote.
As of December 31, 2018, the Funds had omnibus accounts which owned more than 10% of the respective Fund’s outstanding shares as follows:
| | | | | | | | | | | | | | | | |
| | | Number of
Affiliated
Omnibus
Accounts | | | % of the Fund | | | Number of
Non-affiliated
Omnibus
Accounts | | | % of the Fund | |
Growth Advantage Fund | | | 4 | | | | 12.1 | % | | | 3 | | | | 15.1 | % |
Mid Cap Equity Fund | | | — | | | | — | | | | 4 | | | | 23.3 | |
Mid Cap Growth Fund | | | — | | | | — | | | | 7 | | | | 15.8 | |
Mid Cap Value Fund | | | — | | | | — | | | | 8 | | | | 33.0 | |
Value Advantage Fund | | | — | | | | — | | | | 6 | | | | 22.0 | |
As of December 31, 2018, the JPMorgan SmartRetirement Funds, which are affiliated funds of funds, owned in the aggregate, shares representing more than 10% of the net assets of the following Funds:
| | | | |
| | | JPMorgan SmartRetirement Funds | |
Growth Advantage Fund | | | 28.3 | % |
Mid Cap Equity Fund | | | 48.0 | |
Value Advantage Fund | | | 22.0 | |
Significant shareholder transactions by these shareholders may impact the Funds’ performance.
8. New Accounting Pronouncements
In August 2018, the Financial Accounting Standard Board (“FASB”) issuedAccounting Standard Update (“ASU”)2018-13 (“ASU2018-13”)Fair Value Measurement (Topic 820): Disclosure Framework — Changes to the Disclosure Requirements for Fair Value Measurement,which adds, removes, and modifies certain aspects of the fair value disclosure. ASU2018-13 amendments are the result of a broader disclosure project, FASB Concepts StatementConceptual Framework for Financial Reporting — Chapter 8: Notes to Financial Statements, to improve the effectiveness of the fair value disclosure requirements. ASU2018-13 is effective for the fiscal years, and interim periods within those fiscal years, beginning after December 15, 2019; early adoption is permitted. We have evaluated the implications of these changes and the amendments are included in the financial statements, which had no effect to the Funds’ net assets or results of operation.
In August 2018, the SEC adopted their Disclosure Update and Simplification Rule (the “Rule”). The Rule is part of the SEC’s overall project to improve disclosure effectiveness by amending certain disclosure requirements that have become redundant, duplicative, overlapping, outdated, or superseded in light of other SEC disclosure requirements, U.S. GAAP, or changes in the information environment. The amendments are intended to facilitate the disclosure of information to investors and simplify compliance without significantly altering the total mix of information provided to investors. We have evaluated the implications of these changes and the amendments are included in the financial statements, which had no effect on the Funds’ net assets or results of operation.
| | | | | | |
| | | |
| 64 | | | | J.P. MORGAN MID CAP/MULTI-CAP FUNDS | | DECEMBER 31, 2018 |
SCHEDULE OF SHAREHOLDER EXPENSES
(Unaudited)
Hypothetical $1,000 Investment
As a shareholder of the Funds, you incur two types of costs: (1) transaction costs, including sales charges (loads) on purchase payments and (2) ongoing costs, including investment advisory fees, administration fees, distribution fees and other Fund expenses. The examples below are intended to help you understand your ongoing costs (in dollars) of investing in the Funds and to compare these ongoing costs with the ongoing costs of investing in other mutual funds. The examples assume that you had a $1,000 investment in each Class at the beginning of the reporting period, July 1, 2018, and continued to hold your shares at the end of the reporting period, December 31, 2018.
Actual Expenses
For each Class of each Fund in the table below, the first line provides information about actual account values and actual expenses. You may use the information in this line, together with the amount you invested, to estimate the expenses that you paid over the period. Simply divide your account value by $1,000 (for example, an $8,600 account value divided by $1,000 = 8.6), then multiply the result by the number in the first line of each Class under the heading entitled “Expenses Paid During the Period” to estimate the expenses you paid on your account during this period.
Hypothetical Example for Comparison Purposes
The second line of each Class in the table below provides information about hypothetical account values and hypothetical expenses based on the Class’ actual expense ratio and an assumed rate of return of 5% per year before expenses, which is not the Class’ actual return. The hypothetical account values and expenses may not be used to estimate the actual ending account balance or expenses you paid for the period. You may use this information to compare the ongoing costs of investing in the Class of the Fund and other funds. To do so, compare this 5% hypothetical example with the 5% hypothetical examples that appear in the shareholder reports of the other funds. Please note that the expenses shown in the table are meant to highlight your ongoing costs only and do not reflect any transaction costs, such as sales charges (loads) or redemption fees. Therefore, the second line for each Class in the table is useful in comparing ongoing costs only, and will not help you determine the relative total costs of owning different funds. In addition, if these transaction costs were included, your costs would have been higher. The examples also assume all dividends and distributions have been reinvested.
| | | | | | | | | | | | | | | | |
| | | Beginning
Account Value
July 1, 2018 | | | Ending
Account Value
December 31, 2018 | | | Expenses
Paid During
the Period* | | | Annualized
Expense
Ratio | |
JPMorgan Growth Advantage Fund | | | | | | | | | | | | | | | | |
Class A | | | | | | | | | | | | | | | | |
Actual | | $ | 1,000.00 | | | $ | 890.40 | | | $ | 5.38 | | | | 1.13 | % |
Hypothetical | | | 1,000.00 | | | | 1,019.51 | | | | 5.75 | | | | 1.13 | |
Class C | | | | | | | | | | | | | | | | |
Actual | | | 1,000.00 | | | | 888.20 | | | | 7.81 | | | | 1.64 | |
Hypothetical | | | 1,000.00 | | | | 1,016.94 | | | | 8.34 | | | | 1.64 | |
Class I | | | | | | | | | | | | | | | | |
Actual | | | 1,000.00 | | | | 891.80 | | | | 4.20 | | | | 0.88 | |
Hypothetical | | | 1,000.00 | | | | 1,020.77 | | | | 4.48 | | | | 0.88 | |
Class R2 | | | | | | | | | | | | | | | | |
Actual | | | 1,000.00 | | | | 889.30 | | | | 6.62 | | | | 1.39 | |
Hypothetical | | | 1,000.00 | | | | 1,018.20 | | | | 7.07 | | | | 1.39 | |
Class R3 | | | | | | | | | | | | | | | | |
Actual | | | 1,000.00 | | | | 890.50 | | | | 5.38 | | | | 1.13 | |
Hypothetical | | | 1,000.00 | | | | 1,019.51 | | | | 5.75 | | | | 1.13 | |
Class R4 | | | | | | | | | | | | | | | | |
Actual | | | 1,000.00 | | | | 891.80 | | | | 4.20 | | | | 0.88 | |
Hypothetical | | | 1,000.00 | | | | 1,020.77 | | | | 4.48 | | | | 0.88 | |
Class R5 | | | | | | | | | | | | | | | | |
Actual | | | 1,000.00 | | | | 892.30 | | | | 3.48 | | | | 0.73 | |
Hypothetical | | | 1,000.00 | | | | 1,021.53 | | | | 3.72 | | | | 0.73 | |
Class R6 | | | | | | | | | | | | | | | | |
Actual | | | 1,000.00 | | | | 892.90 | | | | 3.01 | | | | 0.63 | |
Hypothetical | | | 1,000.00 | | | | 1,022.03 | | | | 3.21 | | | | 0.63 | |
| | | | | | | | |
| | | |
| DECEMBER 31, 2018 | | J.P. MORGAN MID CAP/MULTI-CAP FUNDS | | | | | 65 | |
SCHEDULE OF SHAREHOLDER EXPENSES
(Unaudited) (continued)
Hypothetical $1,000 Investment
| | | | | | | | | | | | | | | | |
| | | Beginning
Account Value
July 1, 2018 | | | Ending
Account Value
December 31, 2018 | | | Expenses
Paid During
the Period* | | | Annualized
Expense
Ratio | |
JPMorgan Mid Cap Equity Fund | | | | | | | | | | | | | | | | |
Class A | | | | | | | | | | | | | | | | |
Actual | | $ | 1,000.00 | | | $ | 889.90 | | | $ | 5.38 | | | | 1.13 | % |
Hypothetical | | | 1,000.00 | | | | 1,019.51 | | | | 5.75 | | | | 1.13 | |
Class C | | | | | | | | | | | | | | | | |
Actual | | | 1,000.00 | | | | 887.70 | | | | 7.76 | | | | 1.63 | |
Hypothetical | | | 1,000.00 | | | | 1,016.99 | | | | 8.29 | | | | 1.63 | |
Class I | | | | | | | | | | | | | | | | |
Actual | | | 1,000.00 | | | | 891.20 | | | | 4.19 | | | | 0.88 | |
Hypothetical | | | 1,000.00 | | | | 1,020.77 | | | | 4.48 | �� | | | 0.88 | |
Class R2 | | | | | | | | | | | | | | | | |
Actual | | | 1,000.00 | | | | 888.80 | | | | 6.57 | | | | 1.38 | |
Hypothetical | | | 1,000.00 | | | | 1,018.25 | | | | 7.02 | | | | 1.38 | |
Class R5 | | | | | | | | | | | | | | | | |
Actual | | | 1,000.00 | | | | 891.80 | | | | 3.48 | | | | 0.73 | |
Hypothetical | | | 1,000.00 | | | | 1,021.53 | | | | 3.72 | | | | 0.73 | |
Class R6 | | | | | | | | | | | | | | | | |
Actual | | | 1,000.00 | | | | 892.30 | | | | 3.00 | | | | 0.63 | |
Hypothetical | | | 1,000.00 | | | | 1,022.03 | | | | 3.21 | | | | 0.63 | |
| | | | |
JPMorgan Mid Cap Growth Fund | | | | | | | | | | | | | | | | |
Class A | | | | | | | | | | | | | | | | |
Actual | | | 1,000.00 | | | | 893.10 | | | | 5.87 | | | | 1.23 | |
Hypothetical | | | 1,000.00 | | | | 1,019.00 | | | | 6.26 | | | | 1.23 | |
Class C | | | | | | | | | | | | | | | | |
Actual | | | 1,000.00 | | | | 891.00 | | | | 8.25 | | | | 1.73 | |
Hypothetical | | | 1,000.00 | | | | 1,016.48 | | | | 8.79 | | | | 1.73 | |
Class I | | | | | | | | | | | | | | | | |
Actual | | | 1,000.00 | | | | 894.60 | | | | 4.39 | | | | 0.92 | |
Hypothetical | | | 1,000.00 | | | | 1,020.57 | | | | 4.69 | | | | 0.92 | |
Class R2 | | | | | | | | | | | | | | | | |
Actual | | | 1,000.00 | | | | 892.00 | | | | 7.06 | | | | 1.48 | |
Hypothetical | | | 1,000.00 | | | | 1,017.74 | | | | 7.53 | | | | 1.48 | |
Class R3 | | | | | | | | | | | | | | | | |
Actual | | | 1,000.00 | | | | 893.40 | | | | 5.87 | | | | 1.23 | |
Hypothetical | | | 1,000.00 | | | | 1,019.00 | | | | 6.26 | | | | 1.23 | |
Class R4 | | | | | | | | | | | | | | | | |
Actual | | | 1,000.00 | | | | 894.50 | | | | 4.68 | | | | 0.98 | |
Hypothetical | | | 1,000.00 | | | | 1,020.27 | | | | 4.99 | | | | 0.98 | |
Class R5 | | | | | | | | | | | | | | | | |
Actual | | | 1,000.00 | | | | 895.20 | | | | 3.73 | | | | 0.78 | |
Hypothetical | | | 1,000.00 | | | | 1,021.27 | | | | 3.97 | | | | 0.78 | |
Class R6 | | | | | | | | | | | | | | | | |
Actual | | | 1,000.00 | | | | 895.40 | | | | 3.49 | | | | 0.73 | |
Hypothetical | | | 1,000.00 | | | | 1,021.53 | | | | 3.72 | | | | 0.73 | |
| | | | |
JPMorgan Mid Cap Value Fund | | | | | | | | | | | | | | | | |
Class A | | | | | | | | | | | | | | | | |
Actual | | | 1,000.00 | | | | 882.90 | | | | 5.84 | | | | 1.23 | |
Hypothetical | | | 1,000.00 | | | | 1,019.00 | | | | 6.26 | | | | 1.23 | |
Class C | | | | | | | | | | | | | | | | |
Actual | | | 1,000.00 | | | | 880.70 | | | | 8.25 | | | | 1.74 | |
Hypothetical | | | 1,000.00 | | | | 1,016.43 | | | | 8.84 | | | | 1.74 | |
Class I | | | | | | | | | | | | | | | | |
Actual | | | 1,000.00 | | | | 884.00 | | | | 4.65 | | | | 0.98 | |
Hypothetical | | | 1,000.00 | | | | 1,020.27 | | | | 4.99 | | | | 0.98 | |
| | | | | | |
| | | |
| 66 | | | | J.P. MORGAN MID CAP/MULTI-CAP FUNDS | | DECEMBER 31, 2018 |
| | | | | | | | | | | | | | | | |
| | | Beginning
Account Value
July 1, 2018 | | | Ending
Account Value
December 31, 2018 | | | Expenses
Paid During
the Period* | | | Annualized
Expense
Ratio | |
JPMorgan Mid Cap Value Fund (continued) | | | | | | | | | | | | | | | | |
Class L | | | | | | | | | | | | | | | | |
Actual | | $ | 1,000.00 | | | $ | 885.00 | | | $ | 3.52 | | | | 0.74 | % |
Hypothetical | | | 1,000.00 | | | | 1,021.48 | | | | 3.77 | | | | 0.74 | |
Class R2 | | | | | | | | | | | | | | | | |
Actual | | | 1,000.00 | | | | 881.70 | | | | 7.07 | | | | 1.49 | |
Hypothetical | | | 1,000.00 | | | | 1,017.69 | | | | 7.58 | | | | 1.49 | |
Class R3 | | | | | | | | | | | | | | | | |
Actual | | | 1,000.00 | | | | 882.90 | | | | 5.88 | | | | 1.24 | |
Hypothetical | | | 1,000.00 | | | | 1,018.95 | | | | 6.31 | | | | 1.24 | |
Class R4 | | | | | | | | | | | | | | | | |
Actual | | | 1,000.00 | | | | 884.00 | | | | 4.70 | | | | 0.99 | |
Hypothetical | | | 1,000.00 | | | | 1,020.21 | | | | 5.04 | | | | 0.99 | |
Class R5 | | | | | | | | | | | | | | | | |
Actual | | | 1,000.00 | | | | 884.70 | | | | 3.94 | | | | 0.83 | |
Hypothetical | | | 1,000.00 | | | | 1,021.02 | | | | 4.23 | | | | 0.83 | |
Class R6 | | | | | | | | | | | | | | | | |
Actual | | | 1,000.00 | | | | 885.00 | | | | 3.47 | | | | 0.73 | |
Hypothetical | | | 1,000.00 | | | | 1,021.53 | | | | 3.72 | | | | 0.73 | |
| | | | |
JPMorgan Value Advantage Fund | | | | | | | | | | | | | | | | |
Class A | | | | | | | | | | | | | | | | |
Actual | | | 1,000.00 | | | | 917.60 | | | | 5.51 | | | | 1.14 | |
Hypothetical | | | 1,000.00 | | | | 1,019.46 | | | | 5.80 | | | | 1.14 | |
Class C | | | | | | | | | | | | | | | | |
Actual | | | 1,000.00 | | | | 915.20 | | | | 7.92 | | | | 1.64 | |
Hypothetical | | | 1,000.00 | | | | 1,016.94 | | | | 8.34 | | | | 1.64 | |
Class I | | | | | | | | | | | | | | | | |
Actual | | | 1,000.00 | | | | 918.80 | | | | 4.30 | | | | 0.89 | |
Hypothetical | | | 1,000.00 | | | | 1,020.72 | | | | 4.53 | | | | 0.89 | |
Class L | | | | | | | | | | | | | | | | |
Actual | | | 1,000.00 | | | | 919.40 | | | | 3.58 | | | | 0.74 | |
Hypothetical | | | 1,000.00 | | | | 1,021.48 | | | | 3.77 | | | | 0.74 | |
Class R2 | | | | | | | | | | | | | | | | |
Actual | | | 1,000.00 | | | | 916.40 | | | | 6.71 | | | | 1.39 | |
Hypothetical | | | 1,000.00 | | | | 1,018.20 | | | | 7.07 | | | | 1.39 | |
Class R3 | | | | | | | | | | | | | | | | |
Actual | | | 1,000.00 | | | | 917.50 | | | | 5.51 | | | | 1.14 | |
Hypothetical | | | 1,000.00 | | | | 1,019.46 | | | | 5.80 | | | | 1.14 | |
Class R4 | | | | | | | | | | | | | | | | |
Actual | | | 1,000.00 | | | | 918.70 | | | | 4.30 | | | | 0.89 | |
Hypothetical | | | 1,000.00 | | | | 1,020.72 | | | | 4.53 | | | | 0.89 | |
Class R5 | | | | | | | | | | | | | | | | |
Actual | | | 1,000.00 | | | | 919.40 | | | | 3.58 | | | | 0.74 | |
Hypothetical | | | 1,000.00 | | | | 1,021.48 | | | | 3.77 | | | | 0.74 | |
Class R6 | | | | | | | | | | | | | | | | |
Actual | | | 1,000.00 | | | | 920.10 | | | | 3.10 | | | | 0.64 | |
Hypothetical | | | 1,000.00 | | | | 1,021.98 | | | | 3.26 | | | | 0.64 | |
| * | Expenses are equal to each Class’ respective annualized expense ratio, multiplied by the average account value over the period, multiplied by 184/365 (to reflect the one-half year period). |
| | | | | | | | |
| | | |
| DECEMBER 31, 2018 | | J.P. MORGAN MID CAP/MULTI-CAP FUNDS | | | | | 67 | |
BOARD APPROVAL OF INVESTMENT ADVISORY AGREEMENTS
(Unaudited)
The Board of Trustees has established various standing committees composed of Trustees with diverse backgrounds, to which the Board of Trustees has assigned specific subject matter responsibilities to further enhance the effectiveness of the Board’s oversight and decision making. The Board of Trustees and its investment committees (money market and alternative products, equity, and fixed income) meet regularly throughout the year and consider factors that are relevant to their annual consideration of investment advisory agreements at each meeting. They also meet for the specific purpose of considering investment advisory agreement annual renewals. The Board of Trustees held meetings in person in June and August 2018, at which the Trustees considered the continuation of the investment advisory agreements for each Fund whose semi-annual report is contained herein (each an “Advisory Agreement” and collectively, the “Advisory Agreements”). At the June meeting, the Board’s investment committees met to review and consider performance, expense and related information for the J.P. Morgan Funds. Each investment committee reported to the full Board, which then considered the investment committee’s preliminary findings. At the August meeting, the Trustees continued their review and consideration. The Trustees, including a majority of the Trustees who are not “interested persons” (as defined in the 1940 Act) of any party to the Advisory Agreements or any of their affiliates, approved the continuation of each Advisory Agreement on August 15, 2018.
As part of their review of the Advisory Agreements, the Trustees considered and reviewed performance and other information about the Funds received from the Adviser. This information includes the Funds’ performance as compared to the performance of their peers and benchmarks and analyses by the Adviser of the Funds’ performance. In addition, the Trustees have engaged an independent management consulting firm (“independent consultant”) to report on the performance of certain J.P. Morgan Funds at each of the Trustees’ regular meetings. In addition, in preparation for the June and August meetings, the Trustees requested, received and evaluated extensive materials from the Adviser, including performance and expense information compiled by Broadridge, using data from Lipper Inc., independent providers of investment company data (together, “Broadridge/Lipper”). The Trustees’ independent consultant also provided additional analyses of the performance of the Funds as compared to the Funds’ objectives and peer groups. Before voting on the Advisory Agreements, the Trustees reviewed the Advisory Agreements with representatives of the Adviser, counsel to the Trusts and independent legal counsel and received a memorandum from independent legal counsel to the Trustees discussing the legal standards for their consideration of the Advisory Agreements. The Trustees also discussed the Advisory Agreements in executive sessions with independent legal counsel at which no representatives of the Adviser were present.
A summary of the material factors evaluated by the Trustees in determining whether to approve each Advisory Agreement is provided below. Each Trustee attributed different weights to the various factors, and no factor alone was considered determinative. The Trustees considered information provided with respect to the Funds throughout the year, as well as materials furnished specifically in connection with the annual review process. From year to year, the Trustees consider and place emphasis on relevant information in light of changing circumstances in market and economic conditions.
After considering and weighing the factors and information they had received, the Trustees found that the compensation to be received by the Adviser from each Fund under the applicable Advisory Agreement was fair and reasonable under the circumstances and determined and that the continuance of each Advisory Agreement was in the best interests of each Fund and its shareholders.
Nature, Extent and Quality of Services Provided by the Adviser
The Trustees received and considered information regarding the nature, extent and quality of the services provided to each Fund under the applicable Advisory Agreement. The Trustees took into account information furnished throughout the year at Trustee meetings, as well as the materials furnished specifically in connection with this annual review process. The Trustees considered the background and experience of the Adviser’s senior management and the expertise of, and the amount of attention given to each Fund by, investment personnel of the Adviser. In addition, the Trustees reviewed the qualifications, backgrounds and responsibilities of the portfolio management team primarily responsible for theday-to-day management of each Fund and the infrastructure supporting the team, including personnel changes. The Trustees also considered information provided by the Adviser and JPMorgan Distribution Services, Inc. (“JPMDS”) about the structure and distribution strategy of each Fund. The Trustees reviewed information relating to the Adviser’s risk governance model and reports showing the Adviser’s compliance structure and ongoing compliance processes. The Trustees also considered the quality of the administrative services provided by the Adviser in its role as administrator.
The Trustees also considered their knowledge of the nature and quality of the services provided by the Adviser and its affiliates to the Funds gained from their experience as Trustees of the J.P. Morgan Funds. In addition, they considered the overall reputation and capabilities of the Adviser and its affiliates, the commitment of the Adviser to provide high quality service to the Funds, their overall confidence in the Adviser’s integrity and the Adviser’s responsiveness to questions or concerns raised by them, including the Adviser’s willingness to consider and implement organizational and operational changes designed to improve investment results and the services provided to each Fund.
| | | | | | |
| | | |
| 68 | | | | J.P. MORGAN MID CAP/MULTI-CAP FUNDS | | DECEMBER 31, 2018 |
Based upon these considerations and other factors, the Trustees concluded that they were satisfied with the nature, extent and quality of the investment advisory services provided to the Funds by the Adviser.
Costs of Services Provided and Profitability to the Adviser and its Affiliates
The Trustees received and considered information regarding the profitability to the Adviser and its affiliates in providing services to each Fund. The Trustees reviewed and discussed this information. The Trustees recognized that this information is not audited and represents the Adviser’s determination of its and its affiliates’ revenues from the contractual services provided to the Funds, less expenses of providing such services. Expenses include direct and indirect costs and are calculated using an allocation methodology developed by the Adviser. The Trustees also recognized that it is difficult to make comparisons of profitability from fund investment advisory contracts because comparative information is not generally publicly available and is affected by numerous factors, including the structure of the particular adviser, the types of funds it manages, its business mix, numerous assumptions regarding allocations and the fact that publicly-traded fund managers’ operating profits and net income are net of distribution and marketing expenses. Based upon their review, the Trustees concluded that the profitability to the Adviser under each Advisory Agreement was not unreasonable in light of the services and benefits provided to each Fund.
The Trustees also considered that JPMDS, an affiliate of the Adviser, and the Adviser earn fees from the Funds for providing shareholder and administrative services, respectively. These fees were shown separately in the profitability analysis presented to the Trustees. The Trustees also considered the payments of Rule12b-1 fees to JPMDS, which also acts as the Funds’ distributor and that these fees are in turn generally paid to financial intermediaries that sell the Funds, including financial intermediaries that are affiliates of the Adviser. The Trustees also considered the fees paid to JPMorgan Chase Bank, N.A. (“JPMCB”) for custody and fund accounting, and other related services.
Fall-Out Benefits
The Trustees reviewed information regarding potential“fall-out” or ancillary benefits received by the Adviser and its affiliates as a result of their relationship with the Funds. The Trustees also reviewed the Adviser’s allocation of fund brokerage for the J.P. Morgan Funds complex, including allocations to brokers who provide research to the Adviser.
Economies of Scale
The Trustees considered the extent to which the Funds may benefit from economies of scale. The Trustees considered that there may not be a direct relationship between economies of
scale realized by the Funds and those realized by the Adviser as assets increase. The Trustees considered the extent to which the Funds were priced to scale and whether it would be appropriate to add advisory fee breakpoints, but noted that each Fund has implemented fee waivers and contractual expense limitations (“Fee Caps”) which allow each Fund’s shareholders to share potential economies of scale from a Fund’s inception and that the fees remain competitive with peer funds. The Trustees also considered that the Adviser has added or enhanced services to the Funds over time, noting the Adviser’s substantial investments in its business in support of the Funds, including investments in trading systems and technology (including cybersecurity improvements), attraction and retention of key talent, additions to analyst and portfolio management teams, and regulatory support enhancements. The Trustees concluded that the current fee structure was reasonable in light of the Fee Caps that the Adviser has in place that serve to limit the overall net expense ratios of each Fund at competitive levels. The Trustees concluded that the Funds’ shareholders received the benefits of potential economies of scale through the Fee Caps and the Adviser’s reinvestment in its operations to serve the Funds and their shareholders.
Independent Written Evaluation of the Funds’ Senior/Chief Compliance Officer
The Trustees noted that, upon their direction, the Senior Officer for the Mid Cap Growth Fund and Mid Cap Value Fund had prepared an independent written evaluation in order to assist the Trustees in determining the reasonableness of the proposed management fees. In determining whether to continue the Advisory Agreements, the Trustees considered the Senior Officer’s report.
The Trustees noted that, upon their direction, the Chief Compliance Officer for the Growth Advantage Fund, Mid Cap Equity Fund, and Value Advantage Fund had prepared an independent written evaluation in order to assist the Trustees in determining the reasonableness of the proposed management fees. The Trustees considered the written evaluation in determining whether to continue the Advisory Agreements.
Fees Relative to Adviser’s Other Clients
The Trustees received and considered information about the nature and extent of investment advisory services and fee rates offered to other clients of the Adviser, including institutional separate accounts and/or fundssub-advised by the Adviser, for investment management styles substantially similar to that of each Fund. The Trustees considered the complexity of investment management for registered mutual funds relative to the Adviser’s other clients and noted differences in the regulatory, legal and other risks and responsibilities of providing services to the different clients. The Trustees considered that serving as an adviser to a registered mutual fund involves greater responsibilities and risks than acting as asub-adviser and
| | | | | | | | |
| | | |
| DECEMBER 31, 2018 | | J.P. MORGAN MID CAP/MULTI-CAP FUNDS | | | | | 69 | |
BOARD APPROVAL OF INVESTMENT ADVISORY AGREEMENTS
(Unaudited) (continued)
observed thatsub-advisory fees may be lower than those charged by the Adviser to each Fund. The Trustees also noted that the adviser, not the mutual fund, pays thesub-advisory fee and that many responsibilities related to the advisory function are retained by the primary adviser. The Trustees concluded that the fee rates charged to each Fund in comparison to those charged to the Adviser’s other clients were reasonable.
Investment Performance
The Trustees received and considered absolute and/or relative performance information for the Funds in a report prepared by Broadridge/Lipper. The Trustees considered the total return performance information, which included the ranking of the Funds within a performance universe made up of funds with the same Broadridge/Lipper investment classification and objective (the “Universe”), as well as a subset of funds within the Universe (the “Peer Group”), by total return for applicableone-, three- and five-year periods. The Trustees reviewed a description of Broadridge/Lipper’s methodology for selecting mutual funds in each Fund’s Peer Group and Universe. The Broadridge/Lipper materials provided to the Trustees highlighted information with respect to certain representative classes to assist the Trustees in their review. As part of this review, the Trustees also reviewed each Fund’s performance against its benchmark and considered the performance information provided for the Funds at regular Board meetings by the Adviser and the Trustees’ independent consultant and also considered the special analysis prepared by the Trustees’ independent consultant. The Trustees also engaged with the Adviser to consider what steps might be taken to improve performance, as applicable. The Broadridge/Lipper performance data noted by the Trustees as part of their review and the determinations made by the Trustees with respect to each Fund’s performance for certain representative classes are summarized below:
The Trustees noted that the Growth Advantage Fund’s performance for Class A and Class I shares was in the first quintile based upon both the Peer Group and Universe, for each of theone-, three-, and five-year periods ended December 31, 2017. The Trustees discussed the performance and investment strategy of the Fund with the Adviser and reviewed the performance analysis and evaluation prepared by the independent consultant. Based upon these discussions and various other factors, the Trustees concluded that the Fund’s performance was satisfactory.
The Trustees noted that the Mid Cap Equity Fund’s performance for Class A shares was in the first, second and first quintiles based upon the Peer Group, and in the first, third and second quintiles based upon the Universe, for theone-, three-, and five-year periods ended December 31, 2017, respectively. The Trustees noted that the performance for Class I shares was in the first, second and first quintiles based upon the Universe, for theone-, three-, and five-year periods ended December 31,
2017, respectively. The Trustees discussed the performance and investment strategy of the Fund with the Adviser and reviewed the performance analysis and evaluation prepared by the independent consultant. Based upon these discussions and various other factors, the Trustees concluded that the Fund’s performance was satisfactory.
The Trustees noted that the Mid Cap Growth Fund’s performance for Class A shares was in the third, fourth and third quintiles based upon the Peer Group, and in the second, fourth and second quintiles based upon the Universe, for theone-, three-, and five-year periods ended December 31, 2017, respectively. The Trustees noted that the performance for Class I shares was in the third quintile based upon the Peer Group for each of theone-, three-, and five-year periods ended December 31, 2017, and in the second, fourth and second quintiles based upon the Universe, for theone-, three-, and five-year periods ended December 31, 2017, respectively. The Trustees discussed the performance and investment strategy of the Fund with the Adviser and reviewed the performance analysis and evaluation prepared by the independent consultant. Based upon these discussions and various other factors, the Trustees concluded that the Fund’s performance was satisfactory under the circumstances.
The Trustees noted that the Mid Cap Value Fund’s performance for Class A shares was in the third, third and second quintiles based upon the Peer Group, and in the fourth, fourth and third quintiles based upon the Universe, for theone-, three-, and five-year periods ended December 31, 2017, respectively. The Trustees noted that the performance for Class I shares was in the third, third and first quintiles based upon the Peer Group, and in the fourth, third and third quintiles based upon the Universe, for theone-, three-, and five-year periods ended December 31, 2017, respectively. The Trustees discussed the performance and investment strategy of the Fund with the Adviser and reviewed the performance analysis and evaluation prepared by the independent consultant. Based upon these discussions and various other factors, the Trustees concluded that the Fund’s performance was satisfactory under the circumstances. The Trustees requested, however, that the Fund’s Adviser provide additional Fund performance information to be reviewed with the members of the Board’s equity committee at each of its regularly scheduled meetings over the course of the next year.
The Trustees noted that the Value Advantage Fund’s performance for Class A shares was in the third, second and third quintiles based upon the Peer Group, and in the fourth, third and third quintiles based upon the Universe, for theone-, three-, and five-year periods ended December 31, 2017, respectively. The Trustees noted that the performance for Class I shares was in the third quintile based upon the Peer Group for each of theone-, three-, and five-year periods ended December 31, 2017, and in the fourth, third and third quintiles based upon the Universe, for theone-, three-, and five-year periods ended
| | | | | | |
| | | |
| 70 | | | | J.P. MORGAN MID CAP/MULTI-CAP FUNDS | | DECEMBER 31, 2018 |
December 31, 2017, respectively. The Trustees discussed the performance and investment strategy of the Fund with the Adviser and reviewed the performance analysis and evaluation prepared by the independent consultant. Based upon these discussions and various other factors, the Trustees concluded that the Fund’s performance was satisfactory under the circumstances.
Advisory Fees and Expense Ratios
The Trustees considered the contractual advisory fee rate and administration fee rate paid by each Fund to the Adviser and compared the combined rate to the information prepared by Broadridge/Lipper concerning management fee rates paid by other funds in the same Broadridge/Lipper category as each Fund. The Trustees recognized that Broadridge/Lipper reported each Fund’s management fee rate as the combined contractual advisory fee and administration fee rates. The Trustees also reviewed information about other expenses and the expense ratios for each Fund. The Trustees considered the Fee Caps currently in place for each Fund, the net advisory fee rate after taking into account any waivers and/or reimbursements, and where deemed appropriate by the Trustees, additional waivers and/or reimbursements. The Trustees recognized that it is difficult to make comparisons of advisory fees because there are variations in the services that are included in the fees paid by other funds. The Trustees’ determinations as a result of the review of each Fund’s advisory fees and expense ratios for certain representative classes are summarized below:
The Trustees noted that the Growth Advantage Fund’s net advisory fee for Class A shares was in the third and second quintiles based upon the Peer Group and Universe, respectively, and that the actual total expenses for Class A shares were in the fifth and second quintiles based upon the Peer Group and Universe, respectively. The Trustees noted that the net advisory fee for Class I shares was in the third quintile based upon both the Peer Group and Universe, and that the actual total expenses for Class I shares were in the second and third quintiles based upon the Peer Group and Universe, respectively. After considering the factors identified above, in light of this information, the Trustees concluded that the advisory fee was satisfactory in light of the services provided to the Fund.
The Trustees noted that the Mid Cap Equity Fund’s net advisory fee and actual total expenses for Class A shares were in the
second quintile based upon both the Peer Group and Universe. The Trustees noted that the net advisory fee and actual total expenses for Class I shares were in the second quintile based upon the Universe. After considering the factors identified above, in light of this information, the Trustees concluded that the advisory fee was satisfactory in light of the services provided to the Fund.
The Trustees noted that the Mid Cap Growth Fund’s net advisory fee for Class A shares was in the third quintile based upon both the Peer Group and Universe, and that the actual total expenses for Class A shares were in the fourth and third quintiles based upon the Peer Group and Universe, respectively. The Trustees noted that the net advisory fee for Class I Shares was in the third quintile based upon both the Peer Group and Universe, and that the actual total expenses for Class I shares were in the second and third quintiles based upon the Peer Group and Universe, respectively. After considering the factors identified above, in light of this information, the Trustees concluded that the advisory fee was satisfactory in light of the services provided to the Fund.
The Trustees noted that the Mid Cap Value Fund’s net advisory fee and actual total expenses for Class A shares was in the fifth and third quintiles based upon the Peer Group and Universe, respectively. The Trustees noted that the net advisory fee for Class I shares was in the third quintile based upon both the Peer Group and Universe, and that the actual total expenses for Class I shares were in the first and third quintiles based upon the Peer Group and Universe, respectively. After considering the factors identified above, in light of this information, the Trustees concluded that the advisory fee was satisfactory in light of the services provided to the Fund.
The Trustees noted that the Value Advantage Fund’s net advisory fee Class A shares was in the third quintile based upon both the Peer Group and Universe, and that the actual total expenses for Class A shares were in the fifth and third quintiles based upon the Peer Group and Universe, respectively. The Trustees noted that the net advisory fee and actual total expenses for Class I shares were in the third quintile based upon both the Peer Group and Universe. After considering the factors identified above, in light of this information, the Trustees concluded that the advisory fee was satisfactory in light of the services provided to the Fund.
| | | | | | | | |
| | | |
| DECEMBER 31, 2018 | | J.P. MORGAN MID CAP/MULTI-CAP FUNDS | | | | | 71 | |
J.P. Morgan Funds are distributed by JPMorgan Distribution Services, Inc., which is an affiliate of JPMorgan Chase & Co. Affiliates of JPMorgan Chase & Co. receive fees for providing various services to the funds.
Contact JPMorgan Distribution Services, Inc. at1-800-480-4111 for a fund prospectus. You can also visit us at www.jpmorganfunds.com. Investors should carefully consider the investment objectives and risk as well as charges and expenses of the mutual fund before investing. The prospectus contains this and other information about the mutual fund. Read the prospectus carefully before investing.
Investors may obtain information about the Securities Investor Protection Corporation (SIPC), including the SIPC brochure, by visiting www.sipc.org or by calling SIPC at202-371-8300.
Each Fund files a complete schedule of its fund holdings for the first and third quarters of its fiscal year with the SEC onForm N-Q. The Funds’ FormsN-Q are available on the SEC’s website at http://www.sec.gov. Shareholders may request the FormN-Q without charge by calling1-800-480-4111 or by visiting the J.P. Morgan Funds’ website at www.jpmorganfunds.com.
A description of each Fund’s policies and procedures with respect to the disclosure of each Fund’s holdings is available in the prospectuses and Statement of Additional Information.
A copy of proxy policies and procedures is available without charge upon request by calling1-800-480-4111 and on the Funds’ website at www.jpmorganfunds.com. A description of such policies and procedures is on the SEC’s website at www.sec.gov. The Trustees have delegated the authority to vote proxies for securities owned by the Funds to the Adviser. A copy of the Funds’ voting record for the most recent12-month period ended June 30 is available on the SEC’s website at www.sec.gov or at the Funds’ website at www.jpmorganfunds.com no later than August 31 of each year. The Funds’ proxy voting record will include, among other things, a brief description of the matter voted on for each fund security, and will state how each vote was cast, for example, for or against the proposal.


J.P. Morgan Asset Management is the marketing name for the asset management businesses of JPMorgan Chase & Co. Those businesses include, but are not limited to, J.P. Morgan Investment Management Inc., Security Capital Research & Management Incorporated and J.P. Morgan Alternative Asset Management, Inc.
| | | | |
| | © JPMorgan Chase & Co., 2018. All rights reserved. December 2018. | | SAN-MC-1218 |
ITEM 2. CODE OF ETHICS.
Disclose whether, as of the end of the period covered by the report, the registrant has adopted a code of ethics that applies to the registrant’s principal executive officer, principal financial officer, principal accounting officer or controller, or persons performing similar functions, regardless of whether these individuals are employed by the registrant or a third party. If the registrant has not adopted such a code of ethics, explain why it has not done so.
The registrant must briefly describe the nature of any amendment, during the period covered by the report, to a provision of its code of ethics that applies to the registrant’s principal executive officer, principal financial officer, principal accounting officer or controller, or persons performing similar functions, regardless of whether these individuals are employed by the registrant or a third party, and that relates to any element of the code of ethics definition enumerated in paragraph (b) of this Item. The registrant must file a copy of any such amendment as an exhibit pursuant to Item 13(a)(1), unless the registrant has elected to satisfy paragraph (f) of this Item by positing its code of ethics on its website pursuant to paragraph (f)(2) of this Item, or by undertaking to provide its code of ethics to any person without charge, upon request, pursuant to paragraph (f)(3) of this Item.
If the registrant has, during the period covered by the report, granted a waiver, including an implicit waiver, from a provision of the code of ethics that applies to the registrant’s principal executive officer, principal financial officer, principal accounting officer or controller, or persons performing similar functions, regardless of whether these individuals are employed by the registrant or third party, that relates to one or more items set forth in paragraph (b) of this Item, the registrant must briefly describe the nature of the waiver, the name of the person to whom the waiver was granted, and the date of the waiver.
Not applicable to a semi-annual report.
ITEM 3. AUDIT COMMITTEE FINANCIAL EXPERT.
(a) (1) Disclose that the registrant’s board of directors has determined that the registrant either:
(i) Has at least one audit committee financial expert serving on its audit committee; or
(ii) Does not have an audit committee financial expert serving on its audit committee.
(2) If the registrant provides the disclosure required by paragraph (a)(1)(i) of this Item, it must disclose the name of the audit committee financial expert and whether that person is “independent.” In order to be considered “independent” for purposes of this Item, a member of an audit committee may not, other than in his or her capacity as a member of the audit committee, the board of directors, or any other board committee:
(i) Accept directly or indirectly any consulting, advisory, or other compensatory fee from the issuer; or
(ii) Be an “interested person” of the investment company as defined in Section 2(a)(19) of the Act (15 U.S.C.80a-2(a)(19)).
(3) If the registrant provides the disclosure required by paragraph (a)(1)(ii) of this Item, it must explain why it does not have an audit committee financial expert.
Not applicable to a semi-annual report.
ITEM 4. PRINCIPAL ACCOUNTANT FEES AND SERVICES.
(a) Disclose, under the caption Audit Fees, the aggregate fees billed for each of the last two fiscal years for professional
services rendered by the principal accountant for the audit of the registrant’s annual financial statements or services that are normally provided by the accountant in connection with statutory and regulatory filings or engagements for those fiscal years.
(b) Disclose, under the caption Audit-Related Fees, the aggregate fees billed in each of the last two fiscal years for assurance and related services by the principal accountant that are reasonably related to the performance of the audit of the registrant’s financial statements and are not reported under paragraph (a) of this Item. Registrants shall describe the nature of the services comprising the fees disclosed under this category.
(c) Disclose, under the caption Tax Fees, the aggregate fees billed in each of the last two fiscal years for professional services rendered by the principal accountant for tax compliance, tax advice, and tax planning. Registrants shall describe the nature of the services comprising the fees disclosed under this category.
(d) Disclose, under the caption All Other Fees, the aggregate fees billed in each of the last two fiscal years for products and services provided by the principal accountant, other than the services reported in paragraphs (a) through (c) of this Item. Registrants shall describe the nature of the services comprising the fees disclosed under this category.
(e) (1) Disclose the audit committee’spre-approval policies and procedures described in paragraph (c)(7) of Rule2-01 of RegulationS-X.
(2) Disclose the percentage of services described in each of paragraphs (b) through (d) of this Item that were approved by the audit committee pursuant to paragraph (c)(7)(i)(C) of Rule2-01 of RegulationS-X.
(f) If greater than 50 percent, disclose the percentage of hours expended on the principal accountant’s engagement to audit the registrant’s financial statements for the most recent fiscal year that were attributed to work performed by persons other than the principal accountant’s full-time, permanent employees.
(g) Disclose the aggregatenon-audit fees billed by the registrant’s accountant for services rendered to the registrant, and rendered to the registrant’s investment adviser (not including anysub-adviser whose role is primarily portfolio management and is subcontracted with or overseen by another investment adviser), and any entity controlling, controlled by, or under common control with the adviser that provides ongoing services to the registrant for each of the last two fiscal years of the registrant.
(h) Disclose whether the registrant’s audit committee of the board of directors has considered whether the provision ofnon-audit services that were rendered to the registrant’s investment adviser (not including any subadviser whose role is primarily portfolio management and is subcontracted with or overseen by another investment adviser), and any entity controlling, controlled by, or under common control with the investment adviser that provides ongoing services to the registrant that were notpre-approved pursuant to paragraph (c)(7)(ii) of Rule2-01 of RegulationS-X is compatible with maintaining the principal accountant’s independence.
Not applicable to a semi-annual report.
ITEM 5. AUDIT COMMITTEE OF LISTED REGISTRANTS.
(a) If the registrant is a listed issuer as defined in Rule10A-3 under the Exchange Act (17CFR240.10A-3), state whether or not the registrant has a separately-designated standing audit committee established in accordance with Section 3(a)(58)(A) of the Exchange Act (15 U.S.C. 78c(a)(58)(A)). If the registrant has such a committee, however designated, identify each committee member. If the entire board of directors is acting as the registrant’s audit committee as specified in Section 3(a)(58)(B) of the Exchange Act (15 U.S.C. 78c(a)(58)(B)), so state.
(b) If applicable, provide the disclosure required by Rule10A-3(d) under the Exchange Act (17CFR240.10A-3(d)) regarding an exemption from the listing standards for all audit committees.
Not applicable to a semi-annual report.
ITEM 6. INVESTMENTS.
File Schedule I – Investments in securities of unaffiliated issuers as of the close of the reporting period as set forth inSection 210.12-12 of RegulationS-X, unless the schedule is included as part of the report to shareholders filed under Item 1 of this Form.
Included in Item 1.
ITEM 7. DISCLOSURE OF PROXY VOTING POLICIES AND PROCEDURES FORCLOSED-END MANAGEMENT INVESTMENT COMPANIES.
Not applicable.
ITEM 8. PORTFOLIO MANAGERS OFCLOSED-END MANAGEMENT INVESTMENT COMPANIES.
Not applicable.
ITEM 9. PURCHASE OF EQUITY SECURITIES BYCLOSED-END MANAGEMENT INVESTMENT COMPANY AND AFFILIATED PURCHASERS.
Not applicable.
ITEM 10. SUBMISSION OF MATTERS TO A VOTE OF SECURITY HOLDERS.
Describe any material changes to the procedures by which shareholders may recommend nominees to the registrant’s board of directors, where those changes were implemented after the registrant last provided disclosure in response to the requirements of Item 7(d)(2)(ii)(G) of Schedule 14A (17 CFR240.14a-101), or this Item.
No material changes to report.
ITEM 11. CONTROLS AND PROCEDURES.
(a) Disclose the conclusions of the registrant’s principal executive and principal financial officers, or persons performing similar functions, regarding the effectiveness of the registrant’s disclosure controls and procedures (as defined in Rule30a-3(c) under the Act (17 CFR270.30a-3(c))) as of a date within 90 days of the filing date of the report that includes the disclosure required by this paragraph, based on the evaluation of these controls and procedures required by Rule30a-3(b) under the Act (17 CFR270.30a-3(b)) and Rules13a-15(b) or15d-15(b) under the Exchange Act (17 CFR240.13a-15(b) or240.15d-15(b)).
The Registrant’s principal executive and principal financial officers have concluded, based on their evaluation of the Registrant’s disclosure controls and procedures as of a date within 90 days of the filing date of this report, that the Registrant’s disclosure controls and procedures are reasonably designed to ensure that information required to be disclosed by the Registrant on FormN-CSR is recorded, processed, summarized and reported within the required time periods and that information required to be disclosed by the Registrant in the reports that it files or submits on FormN-CSR is accumulated and communicated to the Registrant’s management, including its principal executive and principal financial officers, as appropriate to allow timely decisions regarding required disclosure.
(b) Disclose any change in the registrant’s internal control over financial reporting (as defined in Rule30a-3(d) under the Act (17 CFR270.30a-3(d)) that occurred during the registrant’s second fiscal quarter of the period covered by this report that has materially affected, or is reasonably likely to materially affect, the registrant’s internal control over financial reporting.
There were no changes in the Registrant’s internal control over financial reporting that occurred during the last fiscal quarter covered by this report that have materially affected, or are reasonably likely to materially affect, the Registrant’s internal control over financial reporting.
ITEM 12. DISCLOSURE OF SECURITIES LENDING ACTIVITIES FORCLOSED-END MANAGEMENT INVESTMENT COMPANIES.
Not applicable.
ITEM 13. EXHIBITS.
| | (a) | File the exhibits listed below as part of this Form. Letter or number the exhibits in the sequence indicated. |
(1) Any code of ethics, or amendment thereto, that is the subject of the disclosure required by Item 2, to the extent that the registrant intends to satisfy the Item 2 requirements through filing of an exhibit.
Not applicable.
(2) A separate certification for each principal executive officer and principal financial officer of the registrant as required by Rule30a-2(a) under the Act (17 CFR270.30a-2).
Certifications pursuant to Rule30a-2(a) under the Investment Company Act of 1940 are attached hereto.
(3) Any written solicitation to purchase securities under Rule23c-1 under the Act (17 CFR270.23c-1) sent or given during the period covered by the report by or on behalf of the registrant to 10 or more persons.
Not applicable.
| | (b) | A separate or combined certification for each principal executive officer and principal officer of the registrant as required by Rule30a-2(b) under the Act of 1940. |
Certifications pursuant to Rule30a-2(b) under the Investment Company Act of 1940 are attached hereto.
SIGNATURES
Pursuant to the requirements of the Securities Exchange Act of 1934 and the Investment Company Act of 1940, the registrant has duly caused this report to be signed on its behalf by the undersigned, thereunto duly authorized.
| | |
| J.P. Morgan Fleming Mutual Fund Group, Inc. |
| |
| By: | | /s/ Brian S. Shlissel |
| | Brian S. Shlissel |
| | President and Principal Executive Officer |
| | March 07, 2019 |
Pursuant to the requirements of the Securities Exchange Act of 1934 and the Investment Company Act of 1940, this report has been signed below by the following persons on behalf of the registrant and in the capacities and on the dates indicated.
| | |
| By: | | /s/ Brian S. Shlissel |
| | Brian S. Shlissel |
| | President and Principal Executive Officer |
| | March 07, 2019 |
| |
| By: | | /s/ Timothy J. Clemens |
| | Timothy J. Clemens |
| | Treasurer and Principal Financial Officer |
| | March 07, 2019 |