UNITED STATES
SECURITIES AND EXCHANGE COMMISSION
Washington, D.C. 20549
FORM N-CSR
CERTIFIED SHAREHOLDER REPORT OF REGISTERED
MANAGEMENT INVESTMENT COMPANIES
Investment Company Act file number :811-08231
SPIRIT OF AMERICA INVESTMENT FUND, INC.
(Exact name of registrant as specified in charter)
477 Jericho Turnpike
P.O. Box 9006
Syosset, NY 11791-9006
(Address of principal executive offices) (Zip code)
Mr. David Lerner
David Lerner Associates
477 Jericho Turnpike
P.O. Box 9006
Syosset, NY 11791-9006
(Name and address of agent for service)
Registrant’s telephone number, including area code:1-516-390-5565
Date of fiscal year end:November 30
Date of reporting period:November 30, 2019
Form N-CSR is to be used by management investment companies to file reports with the Commission not later than 10 days after the transmission to stockholders of any report that is required to be transmitted to stockholders under Rule 30e-1 under the Investment Company Act of 1940 (17 CFR 270.30e-1). The Commission may use the information provided on Form N-CSR in its regulatory, disclosure review, inspection and policymaking roles.
A registrant is required to disclose the information specified by Form N-CSR, and the Commission will make this information public. A registrant is not required to respond to the collection of information contained in Form N-CSR unless the Form displays a currently valid Office of Management and Budget ("OMB") control number. Please direct comments concerning the accuracy of the information collection burden estimate and any suggestions for reducing the burden to Secretary, Securities and Exchange Commission, 450 Fifth Street, NW, Washington, DC 20549-0609. The OMB has reviewed this collection of information under the clearance requirements of 44 U.S.C. § 3507.
Item 1. Reports to Stockholders.

| |
ANNUAL REPORT NOVEMBER 30, 2019 | |
| | |
| | Spirit of America Energy Fund |
Beginning on January 1, 2021, as permitted by regulations adopted by the Securities and Exchange Commission, paper copies of the Fund’s shareholder reports will no longer be sent by mail, unless you specifically request paper copies of the reports from your financial intermediary, David Lerner Associates Inc. or from the Fund. Instead, the reports will be made available on a website, and you will be notified by mail each time a report is posted and provided with a website link to access the report.
If you already elected to receive shareholder reports electronically, you will not be affected by this change and you need not take any action. You may elect to receive shareholder reports and other communications from the Fund electronically by contacting your investment counselor at David Lerner Associates Inc. or, if you hold your shares directly through the Fund, by calling Shareholder Services at (800) 452-4892.
You may elect to receive all future reports in paper free of charge. You can inform the Fund that you wish to continue receiving paper copies of your shareholder reports by following the instructions included with this document or by contacting your investment counselor at David Lerner Associates Inc. If you hold your shares directly through the Fund, you may call Shareholder Services at (800) 452-4892. Your election to receive reports in paper will apply to all funds held within the fund family.
MESSAGE TO OUR SHAREHOLDERS (UNAUDITED)
Dear Shareholder,
We would like to start off by thanking you, our clients, for investing in the Spirit of America Energy Fund. We believe that the future of energy is bright. American energy independence has finally arrived at our doorstep and it is a welcomed and imminent event. We believe as American energy continues to assert itself on the world stage, the benefits could be substantial.
When we first began this fund in July of 2014 we believed that there had always been a strong and consistent demand for energy; that new sources of energy were creating investment opportunities; and that there was potential for long term growth in the energy sector. This vision is still firmly in place.
The Spirit of America Energy Fund’s investment philosophy moving into 2020 will be to continue to invest in the energy infrastructure of our country. We believe there is long term value to investing in companies that are involved in the midstream oil and gas sector. We are dedicated to diligently focusing on quality companies with the potential for long term growth.
At the end of the 2019 fiscal year, we are extremely proud to highlight that the Energy Fund has over $300 million in assets under management and over 14,000 investors.
We thank you for your support and look forward to a prosperous and successful 2020.
Sincerely,

| 
David Lerner
President
Spirit of America Investment Fund, Inc. | 
| 
Doug Revello*
Portfolio Manager |
* | Effective January 16, 2020, Douglas Revello has replaced William Mason as Portfolio Manager for the Spirit of America Energy Fund. |
MANAGEMENT DISCUSSION OF FUND PERFORMANCE (UNAUDITED)
Economic Summary
At the end of November, the U.S. Bureau of Economic Analysis released its second reading of the third quarter of 2019 gross domestic product (GDP) updating the estimate to a 2.1% pace. This was slightly faster than the initial 1.9% rate, but still down from the 3.1% growth rate seen in the first quarter of 2019. Many economists have expressed their belief that growth is slowing in the current quarter to a sub-1% annual pace. This belief is mostly due to the U.S.-China trade war which has caused business to cut investment and inventories. On the other hand, the holiday shopping season is expected to be relatively healthy given solid job growth and consumer spending.
The U.S. Bureau of Labor Statistics reported the U.S. economy added 266,000 nonfarm payroll jobs in November, beating economists’ expectations of 187,000 jobs. This number is the best since January’s 312,000 jobs growth and above last November’s 196,000. In addition to the November jobs surpassing expectations, both October and September’s estimates were increased by a total of 41,000 jobs. This brings the 2019 monthly average to 180,000 jobs, which compares to 2018’s 223,000. The unemployment rate dropped back down to 3.5%, which matches the lowest jobless rate since 1969. Average hourly earnings, a closely watched sign of whether inflation pressures are building, rose at a 3.1% pace from a year ago.
The minutes released in late November of the most recent Federal Open Market Committee (FOMC), revealed that officials generally agreed they will not likely need to cut interest rates again unless economic conditions change significantly. In October all but two Fed members cut their benchmark rate target down to a range of 1.5%-1.75%, making this the third rate cut in 2019. The summary of the minutes stated that most members saw this cut as enough “to support the outlook of moderate growth, a strong labor market, and inflation near the Committee’s 2% objective.” Notably there are ongoing concerns in regard to the U.S. and China trade war and inflation coming in below the Fed’s 2% target. Members also noted they will continue to watch for changes in economic data when setting policy going forward.
Market Commentary
During the Fund’s fiscal year ended November 30, 2019, the S&P 500 provided a total return of 16.10%. The Alerian MLP Index, a leading gauge of energy MLPs, had a total return of (11.12)% over the fiscal year. The Standard and Poor’s 500 Energy Index had a total return of (7.90)%. At the same time oil prices rose 8.33% with U.S. crude oil closing at $55.17, up significantly from its low of $26.21 on February 11, 2016, but down from its high of the year of $66.30 on April 23, 2019.
The two benchmarks, North Sea Brent and U.S. crude, rose in November partly on expectations of the U.S. and China reaching an initial trade deal by year-end that could lift doubts over future demand for crude along with the health of the global economy. While the prospects of a trade deal are uncertain, oil prices have been supported ahead of the upcoming December OPEC and allies including Russia (OPEC+) meeting. This group is expected to extend existing oil output cuts through mid-2020, with the possibility of a deeper cut. OPEC+ had previously agreed to reduce supply by 1.2 million barrels per day in 2019 through March. Concurrently, U.S. output has continued to climb to record levels.
Fund Summary
The Spirit of America Energy Fund, SOAEX (the “Fund”), remained diversified across many U.S. geographic areas, with a heavy focus on midstream MLPs. The Fund had a total return of (4.15)% (no load, gross of fees) for fiscal year ended November 30, 2019. This compares to the 16.11% returned by its benchmark, the S&P 500 Index, for the same period. The Fund’s underperformance relative to its benchmark was principally due to its focus solely on the energy segment of the market compared to the S&P 500 which is a broader perspective.
While the Fund underperformed the benchmark S&P 500 Index, it did outperform other Energy dedicated indexes including the Alerian MLP Index and the S&P 500 Energy Index. The Fund’s allocations to the Oil & Gas Equipment and Services and Oil and Gas Refining and Marketing, or “downstream” sector classified holdings contributed most to
MANAGEMENT DISCUSSION OF FUND PERFORMANCE (UNAUDITED) (CONT.)
the Fund’s performance. The Fund’s allocations to the Oil & Gas Exploration and Production, or “upstream,” and the Oil and Gas Storage & Transportation, part of the “midstream” sector classified holdings, were the biggest drags on the Fund’s performance for the fiscal 2019 year.
The material factors that affected the Fund were market direction and stock selection. The holdings of the Fund were chosen based on consideration of several factors including market capitalization, stable balance sheets relative to peers, and companies with promising growth potential. The Fund did not rely on derivatives or leverage strategies, and focused on U.S. based energy companies.
Including sales charge and expenses, as of November 30, 2019 the Fund’s fiscal year return was (10.88)%.
Summary of Portfolio Holdings(Unaudited) As of November 30, 2019 |
Oil & Gas Storage & Transportation (MLP) | 55.30% | $196,680,428 |
Common Stocks (non-MLP) | 35.80% | 127,353,108 |
Oil & Gas Equipment & Services (MLP) | 3.95% | 14,056,529 |
Money Market Funds | 0.63% | 2,255,044 |
Oil & Gas Exploration & Production (MLP) | 4.32% | 15,369,500 |
Total Investments | 100.00% | $355,714,609 |
ILLUSTRATION OF INVESTMENT (UNAUDITED)
Average Annual Returns(Unaudited) For the periods ended November 30, 2019 |
| | 1 Year | 3 Year | 5 Year | Since Inception
(July 10, 2014) |
Class A Shares — no load | (5.47)% | (4.68)% | (9.17)% | (10.00)% |
Class A Shares — with load | (10.88)% | (6.55)% | (10.23)% | (10.99)% |
Class C Shares — no load1 | (6.10)% | (5.41)% | (9.99)% | (10.80)% |
Class C Shares — with load1 | (6.87)% | (5.41)% | (9.99)% | (10.80)% |
S&P 500 Index2 | 16.11% | 14.88% | 10.98% | 11.35% |
The Fund’s past performance does not guarantee future results. The investment return and principal value of an investment in the Fund will fluctuate so that an investor’s shares, when redeemed, may be worth more or less than their original cost. Current performance of the Fund may be lower or higher than the performance quoted. Returns shown do not reflect the deduction of taxes that a shareholder would pay on Fund distributions or the redemption of Fund shares. Total returns, with load, include the 5.75% maximum sales charge for the Class A Shares or the 1.00% maximum deferred sales charge for the Class C Shares.
1 | Class C Shares commenced operations on March 15, 2016. Prior to March 15, 2016, performance is based on the performance of Class A Shares adjusted for the Class C Shares’ 12b-1 fees and contingent deferred sales charge. |
2 | S&P 500 Index is an unmanaged capitalization-weighted index of 500 stocks designed to measure the performance of the broad domestic economy through changes in the aggregate market value of 500 stocks representing all major industries. The performance of an index assumes no transaction costs, taxes, management fees or other expenses. A direct investment in an index is not possible. |
Fixed Distribution Policy(Unaudited)
The Board of Directors of the Fund has set a fixed distribution per share policy of $1.6875 per year payable in twelve payments of $0.140625; two payments in January and one payment in each of February through November.
Shareholders should not draw any conclusions about the Fund’s investment performance from the amount of these distributions.
The Fund’s total return based on net asset value is presented in the table above as well as in the Financial Highlights tables.
ILLUSTRATION OF INVESTMENT (UNAUDITED) (CONT.)
Growth of $10,000(Unaudited)
(includes one-time 5.75% maximum sales charge and reinvestment of all distributions)
The graph below compares the increase in value of a $10,000 investment in the Spirit of America Energy Fund Class A Shares with the performance of the S&P 500 Index. The values and returns for Spirit of America Energy Fund Class A Shares include reinvested dividends and the impact of the maximum sales charge of 5.75% placed on purchases. The returns shown do not reflect taxes that a shareholder would pay on fund distributions or on the redemption of fund shares.
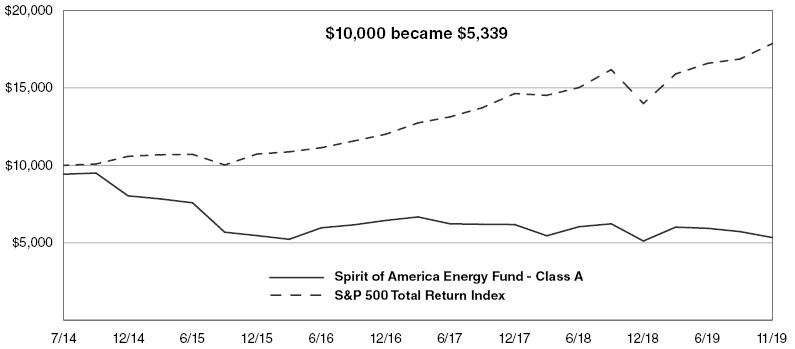
The chart represents historical performance of a hypothetical investment of $10,000 in the Fund made on July 10, 2014 and held through November 30, 2019
Past performance does not guarantee future results. The performance data quoted represents past performance and current returns may be lower or higher. The investment return and net asset value will fluctuate so that an investor’s shares, when redeemed may be worth more or less than the original cost. To obtain performance information current to the most recent month-end, please call (800) 452-4892.
S&P 500 Index is an unmanaged capitalization-weighted index of 500 stocks designed to measure the performance of the broad domestic economy through changes in the aggregate market value of 500 stocks representing all major industries. The performance of an index assumes no transaction costs, taxes, management fees or other expenses. A direct investment in an index is not possible.
SCHEDULE OF INVESTMENTS | NOVEMBER 30, 2019
| | | Shares | | | Market Value | |
Master Limited Partnership —Common Stocks 64.39% |
| |
Oil & Gas Equipment & Services 4.00% |
USA Compression Partners LP | | | 855,020 | | | $ | 14,056,529 | |
| |
Oil & Gas Exploration & Production 4.37% |
Black Stone Minerals LP | | | 436,029 | | | | 5,175,664 | |
Viper Energy Partners LP | | | 429,757 | | | | 10,193,836 | |
| | | | | | | | 15,369,500 | |
Oil & Gas Storage & Transportation 56.02% |
BP Midstream Partners LP | | | 155,696 | | | | 2,273,162 | |
Cheniere Energy Partners LP | | | 436,530 | | | | 16,967,921 | |
CNX Midstream Partners LP | | | 464,715 | | | | 6,738,368 | |
Crestwood Equity Partners LP | | | 401,784 | | | | 12,744,588 | |
DCP Midstream LP | | | 181,030 | | | | 3,821,543 | |
Enable Midstream Partners LP | | | 540,808 | | | | 4,970,026 | |
Energy Transfer Equity LP | | | 1,112,020 | | | | 13,132,956 | |
Enterprise Products Partners LP | | | 627,544 | | | | 16,516,958 | |
EQT Midstream Partners LP | | | 179,153 | | | | 4,150,975 | |
Genesis Energy LP | | | 224,442 | | | | 4,266,642 | |
Global Partners LP | | | 94,897 | | | | 1,899,838 | |
Golar LNG Partners LP | | | 75,063 | | | | 713,849 | |
Hess Midstream Partners LP | | | 245,537 | | | | 5,021,232 | |
Holly Energy Partners LP | | | 104,669 | | | | 2,340,399 | |
Magellan Midstream Partners LP | | | 253,100 | | | | 14,798,757 | |
MPLX LP | | | 723,447 | | | | 17,109,522 | |
NGL Energy Partners LP | | | 144,808 | | | | 1,437,943 | |
Noble Midstream Partners LP | | | 196,719 | | | | 4,101,591 | |
PBF Logistics LP | | | 120,800 | | | | 2,470,360 | |
Phillips 66 Partners LP | | | 313,764 | | | | 17,486,068 | |
Plains All American Pipeline LP | | | 425,399 | | | | 7,401,943 | |
Shell Midstream Partners LP | | | 606,253 | | | | 11,918,934 | |
Sprague Resources LP | | | 185,426 | | | | 2,966,816 | |
Sunoco LP | | | 203,429 | | | | 6,336,813 | |
Tallgrass Energy LP | | | 236,087 | | | | 4,228,318 | |
TC PipeLines LP | | | 70,169 | | | | 2,735,889 | |
Teekay LNG Partners LP | | | 197,801 | | | | 3,016,465 | |
Western Midstream Partners LP | | | 288,356 | | | | 5,112,552 | |
| | | | | | | | 196,680,428 | |
Total Master Limited Partnership — Common Stocks |
(Cost $237,754,436) | | | 226,106,457 | |
| |
Common Stocks 36.26% |
| |
Gas Utilities 1.65% |
UGI Corporation | | | 132,822 | | | | 5,784,398 | |
| |
Integrated Oil & Gas 4.50% |
Chevron Corporation | | | 82,295 | | | | 9,639,213 | |
Exxon Mobil Corporation | | | 64,180 | | | | 4,372,583 | |
Occidental Petroleum Corporation | | | 47,485 | | | | 1,831,497 | |
| | | | | | | | 15,843,293 | |
See accompanying notes which are an integral part of these financial statements
SCHEDULE OF INVESTMENTS (CONT.) | NOVEMBER 30, 2019
| | | Shares | | | Market Value | |
Multi-Utilities 1.88% |
Dominion Energy, Inc. | | | 79,322 | | | $ | 6,592,451 | |
| |
Oil & Gas Exploration & Production 0.99% |
Marathon Oil Corporation | | | 134,473 | | | | 1,566,611 | |
Parsley Energy, Inc., Class A | | | 127,050 | | | | 1,903,209 | |
| | | | | | | | 3,469,820 | |
Oil & Gas Refining & Marketing 7.08% |
Marathon Petroleum Corporation | | | 116,951 | | | | 7,091,909 | |
Phillips 66 | | | 74,392 | | | | 8,534,250 | |
Valero Energy Corporation | | | 96,694 | | | | 9,233,310 | |
| | | | | | | | 24,859,469 | |
Oil & Gas Storage & Transportation 20.16% |
Antero Midstream Corporation | | | 614,114 | | | | 2,812,642 | |
Cheniere Energy, Inc.(a) | | | 26,120 | | | | 1,581,305 | |
Enbridge, Inc. | | | 359,777 | | | | 13,671,526 | |
Kinder Morgan, Inc. | | | 882,394 | | | | 17,303,746 | |
ONEOK, Inc. | | | 210,698 | | | | 14,970,093 | |
Plains GP Holdings, LP, Class A | | | 62,500 | | | | 1,091,875 | |
Targa Resources Corporation | | | 200,595 | | | | 7,327,735 | |
TC Energy Corporation | | | 22,500 | | | | 1,145,925 | |
Williams Companies, Inc. (The) | | | 479,702 | | | | 10,898,830 | |
| | | | | | | | 70,803,677 | |
Total Common Stocks |
(Cost $129,179,767) | | | 127,353,108 | |
| |
Money Market Funds 0.64% |
Morgan Stanley Institutional Liquidity Government Portfolio, Institutional Class, 1.55%(b) | | | 2,255,044 | | | | 2,255,044 | |
| |
Total Money Market Funds |
(Cost $2,255,044) | | | 2,255,044 | |
| |
Total Investments — 101.29% |
(Cost $369,189,247) | | | 355,714,609 | |
Liabilities in Excess of Other Assets — (1.29)% | | | (4,533,205 | ) |
NET ASSETS — 100.00% | | $ | 351,181,404 | |
(a) | Non-income producing security. |
(b) | Rate disclosed is the seven day effective yield as of November 30, 2019. |
The sectors shown on the schedule of investments are based on the Global Industry Classification Standard, or GICS® (“GICS”). The GICS was developed by and/or is the exclusive property of MSCI, Inc. and Standard & Poor’s Financial Services LLC (“S&P”). GICS is a service mark of MSCI, Inc. and S&P and has been licensed for use by Ultimus Fund Solutions, LLC.
See accompanying notes which are an integral part of these financial statements
STATEMENT OF ASSETS AND LIABILITIES | NOVEMBER 30, 2019
ASSETS | | | | |
Investments in securities at value (cost $369,189,247) | | $ | 355,714,609 | |
Receivable for Fund shares sold | | | 2,629,399 | |
Dividends and interest receivable | | | 555,709 | |
Prepaid expenses | | | 42,493 | |
TOTAL ASSETS | | | 358,942,210 | |
| | | | | |
LIABILITIES | | | | |
Payable for Fund shares redeemed | | | 666,072 | |
Payable for distributions to shareholders | | | 6,439,669 | |
Payable for investment advisory fees | | | 291,451 | |
Payable for distribution (12b-1) fees | | | 79,395 | |
Payable for accounting and administration fees | | | 26,205 | |
Payable for transfer agent fees | | | 12,669 | |
Franchise tax expense | | | 11,247 | |
Income tax payable | | | 41,975 | |
Other accrued expenses | | | 192,123 | |
TOTAL LIABILITIES | | | 7,760,806 | |
NET ASSETS | | $ | 351,181,404 | |
| | | | | |
SOURCE OF NET ASSETS | | | | |
As of November 30, 2019, net assets consisted of: | | | | |
Paid-in capital | | $ | 488,145,435 | |
Accumulated earnings (deficit), net of deferred taxes | | | (136,964,031 | ) |
NET ASSETS | | $ | 351,181,404 | |
| | | | | |
NET ASSETS: | | | | |
Class A Shares | | $ | 347,372,779 | |
Class C Shares | | $ | 3,808,625 | |
SHARES OUTSTANDING ($0.001 par value, 500,000,000 authorized shares): | | | | |
Class A Shares | | | 45,583,454 | |
Class C Shares | | | 521,300 | |
NET ASSET VALUE AND REDEMPTION PRICE PER SHARE | | | | |
Class A Shares | | $ | 7.62 | |
Class C Shares | | $ | 7.31 | |
OFFERING PRICE PER SHARE (100%/(100%-maximum sales charge) of net asset value adjusted to the nearest cent) per share: | | | | |
Class A Shares | | $ | 8.08 | |
MAXIMUM SALES CHARGE: | | | | |
Class A Shares | | | 5.75 | % |
See accompanying notes which are an integral part of these financial statements
STATEMENT OF OPERATIONS
| | | For the Year Ended
November 30, 2019 | |
INVESTMENT INCOME | | | | |
MLP Distributions | | $ | 22,919,554 | |
Less Return of Capital | | | (23,018,621 | ) |
Dividends (net of foreign taxes withheld of $138,022) | | | 10,002,524 | |
Interest | | | 125,740 | |
TOTAL INVESTMENT INCOME | | | 10,029,197 | |
| | | | | |
EXPENSES | | | | |
Investment advisory | | | 4,343,192 | |
Distribution (12b-1) — Class A | | | 1,129,658 | |
Distribution (12b-1) — Class C | | | 53,120 | |
Accounting and Administration | | | 271,817 | |
Transfer agent | | | 121,817 | |
Sub transfer agent | | | 106,280 | |
Directors | | | 66,090 | |
Printing | | | 58,070 | |
Insurance | | | 45,472 | |
Custodian | | | 36,871 | |
Registration | | | 34,064 | |
Franchise tax expense | | | 34,013 | |
Auditing | | | 30,973 | |
Legal | | | 28,692 | |
Chief Compliance Officer | | | 12,863 | |
Line of credit | | | 3,488 | |
Interest | | | 1,432 | |
Other | | | 149,646 | |
TOTAL EXPENSES | | | 6,527,558 | |
NET INVESTMENT INCOME BEFORE TAXES | | | 3,501,639 | |
Current and deferred income tax expense/(benefit), net of valuation allowance | | | 45,969 | |
NET INVESTMENT INCOME NET OF DEFERRED TAXES | | | 3,455,670 | |
| | | | | |
REALIZED AND UNREALIZED GAIN (LOSS) ON INVESTMENTS | | | | |
Net realized loss from investment transactions | | | (16,013,639 | ) |
Net realized gain on foreign currency transactions | | | 210 | |
Current and deferred income tax expense/(benefit), net of valuation allowance | | | — | |
Net realized loss, net of deferred taxes | | | (16,013,429 | ) |
Net change in unrealized depreciation of investments | | | (6,267,497 | ) |
Current and deferred income tax expense/(benefit), net of valuation allowance | | | — | |
NET REALIZED AND UNREALIZED LOSS ON INVESTMENTS | | | (22,280,926 | ) |
NET DECREASE IN NET ASSETS RESULTING FROM OPERATIONS | | $ | (18,825,256 | ) |
See accompanying notes which are an integral part of these financial statements
STATEMENTS OF CHANGES IN NET ASSETS
| | | For the Year Ended
November 30, 2019 | | | For the Year Ended
November 30, 2018 | |
OPERATIONS | | | | | | | | |
Net investment income (loss) net of deferred taxes | | $ | 3,455,670 | | | $ | (3,360,494 | ) |
Net realized (loss) on investment transactions, net of deferred taxes | | | (16,013,429 | ) | | | (31,276,939 | ) |
Net change in unrealized (depreciation) appreciation of investments, net of deferred taxes | | | (6,267,497 | ) | | | 7,585,928 | |
Net decrease in net assets resulting from operations | | | (18,825,256 | ) | | | (27,051,505 | ) |
| | | | | | | | | |
DISTRIBUTIONS TO SHAREHOLDERS | | | | | | | | |
From return of capital: | | | | | | | | |
Class A | | | (82,598,520 | ) | | | (99,904,176 | ) |
Class C | | | (1,004,002 | ) | | | (1,075,174 | ) |
Total distributions to shareholders | | | (83,602,522 | ) | | | (100,979,350 | ) |
| | | | | | | | | |
CAPITAL TRANSACTIONS | | | | | | | | |
Class A Shares: | | | | | | | | |
Shares sold | | | 40,249,659 | | | | 78,395,936 | |
Shares issued from reinvestment of distributions | | | 35,055,791 | | | | 46,630,482 | |
Shares redeemed | | | (135,286,722 | ) | | | (136,495,008 | ) |
Total Class A Shares | | | (59,981,272 | ) | | | (11,468,590 | ) |
Class C Shares: | | | | | | | | |
Shares sold | | | 669,892 | | | | 1,469,882 | |
Shares issued from reinvestment of distributions | | | 446,352 | | | | 549,796 | |
Shares redeemed | | | (1,824,817 | ) | | | (1,128,082 | ) |
Total Class C Shares | | | (708,573 | ) | | | 891,596 | |
Decrease in net assets derived from capital share transactions | | | (60,689,845 | ) | | | (10,576,994 | ) |
Total decrease in Net Assets | | | (163,117,623 | ) | | | (138,607,849 | ) |
| | | | | | | | | |
NET ASSETS | | | | | | | | |
Beginning of year | | | 514,299,027 | | | | 652,906,876 | |
End of year | | $ | 351,181,404 | | | $ | 514,299,027 | |
| | | | | | | | | |
SHARE TRANSACTIONS | | | | | | | | |
Class A Shares: | | | | | | | | |
Shares sold | | | 4,398,996 | | | | 6,735,557 | (a) |
Shares issued from reinvestment of distributions | | | 3,923,008 | | | | 4,156,468 | (a) |
Shares redeemed | | | (15,015,299 | ) | | | (12,135,121 | )(a) |
Total Class A Shares | | | (6,693,295 | ) | | | (1,243,096 | ) |
Class C Shares: | | | | | | | | |
Shares sold | | | 73,751 | | | | 128,569 | (a) |
Shares issued from reinvestment of distributions | | | 51,689 | | | | 50,346 | (a) |
Shares redeemed | | | (215,831 | ) | | | (101,246 | )(a) |
Total Class C Shares | | | (90,391 | ) | | | 77,669 | |
Decrease in shares outstanding | | | (6,783,686 | ) | | | (1,165,427 | ) |
(a) | Share amounts have been adjusted for 1:3 reverse stock split that occurred on April 20, 2018. |
See accompanying notes which are an integral part of these financial statements
FINANCIAL HIGHLIGHTS — CLASS A
The table below sets forth financial data for one share of beneficial interest outstanding throughout the period presented.*
| | | For the Year Ended November 30 | |
| | | 2019 | | | 2018 | | | 2017 | | | 2016 | | | 2015 | |
Net Asset Value, Beginning ofYear | | $ | 9.73 | | | $ | 12.09 | | | $ | 14.73 | | | $ | 16.35 | | | $ | 26.79 | |
| | | | | | | | | | | | | | | | | | | | | |
From Investment Operations: | | | | | | | | | | | | | | | | | | | | |
Net investment loss(a) | | | 0.07 | | | | (0.06 | ) | | | (0.12 | ) | | | (0.12 | ) | | | (0.27 | ) |
Return of capital(a) | | | 0.46 | | | | 0.64 | | | | 0.75 | | | | 0.90 | | | | 1.53 | |
Net realized and unrealized loss on investments | | | (0.95 | ) | | | (1.06 | ) | | | (1.02 | ) | | | (0.15 | ) | | | (9.45 | ) |
Total from investment operations | | | (0.42 | ) | | | (0.48 | ) | | | (0.39 | ) | | | 0.63 | | | | (8.19 | ) |
| | | | | | | | | | | | | | | | | | | | | |
Less Distributions: | | | | | | | | | | | | | | | | | | | | |
Distributions from return of capital | | | (1.69 | ) | | | (1.88 | ) | | | (2.25 | ) | | | (2.25 | ) | | | (2.25 | ) |
Total distributions | | | (1.69 | ) | | | (1.88 | ) | | | (2.25 | ) | | | (2.25 | ) | | | (2.25 | ) |
| | | | | | | | | | | | | | | | | | | | |
Net Asset Value, End ofYear | | $ | 7.62 | | | $ | 9.73 | | | $ | 12.09 | | | $ | 14.73 | | | $ | 16.35 | |
Total Return(b) | | | (5.47 | )% | | | (4.95 | )% | | | (3.62 | )% | | | 5.17 | % | | | (32.13 | )% |
| | | | | | | | | | | | | | | | | | | | | |
Ratios and Supplemental Data: | | | | | | | | | | | | | | | | | | | | |
Net assets, end of year (000) | | $ | 347,373 | | | $ | 508,512 | | | $ | 646,562 | | | $ | 554,182 | | | $ | 291,733 | |
Ratio of expenses to average net assets: | | | | | | | | | | | | | | | | | | | | |
Before expense waivers or recoupments and deferred tax benefit | | | 1.43 | % | | | 1.38 | % | | | 1.38 | % | | | 1.43 | % | | | 1.49 | % |
Net of expense waivers or recoupment and before deferred tax benefit | | | 1.43 | % | | | 1.38 | % | | | 1.38 | % | | | 1.43 | % | | | 1.52 | % |
Deferred tax expense(c) | | | 0.00 | % | | | 0.00 | % | | | 0.00 | % | | | 0.00 | % | | | 0.02 | % |
Total net expenses | | | 1.43 | % | | | 1.38 | % | | | 1.38 | % | | | 1.43 | % | | | 1.54 | % |
Ratio of net investment income (loss) to average net assets: | | | | | | | | | | | | | | | | | | | | |
Before expense waivers or recoupments and deferred tax benefit | | | 0.77 | % | | | (0.54 | )% | | | (0.79 | )% | | | (0.87 | )% | | | (1.12 | )% |
Net of expense waivers or recoupment and before deferred tax benefit | | | 0.77 | % | | | (0.54 | )% | | | (0.79 | )% | | | (0.87 | )% | | | (1.15 | )% |
Deferred tax benefit (loss)(d) | | | 0.00 | % | | | 0.00 | % | | | 0.00 | % | | | 0.00 | % | | | (0.06 | )% |
Net investment income (loss) | | | 0.77 | % | | | (0.54 | )% | | | (0.79 | )% | | | (0.87 | )% | | | (1.21 | )% |
Portfolio turnover rate | | | 17 | % | | | 19 | % | | | 11 | % | | | 18 | % | | | 15 | % |
* | Share amounts have been adjusted for 1:3 reverse stock split that occurred on April 20, 2018. |
(a) | Calculated based on the average number of shares outstanding during the period. |
(b) | Calculation does not reflect sales load. |
(c) | Deferred tax benefit (expense) estimate for the ratio calculation is derived from the net investment income (loss) and realized and unrealized gain (loss). |
(d) | Deferred tax benefit (expense) estimate for the ratio calculation is derived from the net investment income (loss) only. |
See accompanying notes which are an integral part of these financial statements
FINANCIAL HIGHLIGHTS — CLASS C
The table below sets forth financial data for one share of beneficial interest outstanding throughout the period presented.*
| | | For the Year Ended November 30 | | | For the
Period Ended
November 30, | |
| | | 2019 | | | 2018 | | | 2017 | | | 2016(a) | |
Net Asset Value, Beginning of Period | | $ | 9.46 | | | $ | 11.88 | | | $ | 14.64 | | | $ | 13.41 | |
| | | | | | | | | | | | | | | | | |
From Investment Operations: | | | | | | | | | | | | | | | | |
Net investment loss(b) | | | — | (c) | | | (0.14 | ) | | | (0.21 | ) | | | (0.18 | ) |
Return of capital(b) | | | 0.44 | | | | 0.62 | | | | 0.75 | | | | 0.72 | |
Net realized and unrealized (loss) gain on investments | | | (0.90 | ) | | | (1.02 | ) | | | (1.05 | ) | | | 2.37 | |
Total from investment operations | | | (0.46 | ) | | | (0.54 | ) | | | (0.51 | ) | | | 2.91 | |
| | | | | | | | | | | | | | | | | |
Less Distributions: | | | | | | | | | | | | | | | | |
Distributions from return of capital | | | (1.69 | ) | | | (1.88 | ) | | | (2.25 | ) | | | (1.68 | ) |
Total distributions | | | (1.69 | ) | | | (1.88 | ) | | | (2.25 | ) | | | (1.68 | ) |
| | | | | | | | | | | | | | | | |
Net Asset Value, End of Period | | $ | 7.31 | | | $ | 9.46 | | | $ | 11.88 | | | $ | 14.64 | |
Total Return(d) | | | (6.10 | )% | | | (5.60 | )% | | | (4.52 | )% | | | 21.58 | %(e) |
| | | | | | | | | | | | | | | | | |
Ratios and Supplemental Data: | | | | | | | | | | | | | | | | |
Net assets, end of period (000) | | $ | 3,809 | | | $ | 5,787 | | | $ | 6,344 | | | $ | 2,851 | |
Ratio of expenses to average net assets: | | | | | | | | | | | | | | | | |
Before deferred tax benefit | | | 2.18 | % | | | 2.13 | % | | | 2.13 | % | | | 2.16 | %(f) |
Deferred tax expense(g) | | | 0.00 | % | | | 0.00 | % | | | 0.00 | % | | | 0.00 | %(f) |
Total net expenses | | | 2.18 | % | | | 2.13 | % | | | 2.13 | % | | | 2.16 | %(f) |
Ratio of net investment income (loss) to average net assets: | | | | | | | | | | | | | | | | |
Before deferred tax benefit | | | 0.02 | % | | | (1.28 | )% | | | (1.49 | )% | | | (1.67 | )%(f) |
Deferred tax benefit (loss)(h) | | | 0.00 | % | | | 0.00 | % | | | 0.00 | % | | | 0.00 | %(f) |
Net investment income (loss) | | | 0.02 | % | | | (1.28 | )% | | | (1.49 | )% | | | (1.67 | )%(f) |
Portfolio turnover rate | | | 17 | % | | | 19 | % | | | 11 | % | | | 18 | %(e) |
* | Share amounts have been adjusted for 1:3 reverse stock split that occurred on April 20, 2018. |
(a) | For the period March 15, 2016 (commencement of operations) to November 30, 2016. |
(b) | Calculated based on the average number of shares outstanding during the period. |
(c) | Amount is less than $0.005. |
(d) | Calculation does not reflect sales load. |
(g) | Deferred tax benefit (expense) estimate for the ratio calculation is derived from the net investment income (loss) and realized and unrealized gain (loss). |
(h) | Deferred tax benefit (expense) estimate for the ratio calculation is derived from the net investment income (loss) only. |
See accompanying notes which are an integral part of these financial statements
NOTES TO FINANCIAL STATEMENTS | NOVEMBER 30, 2019
Note 1 – Organization
Spirit of America Energy Fund (the “Fund”), a series of Spirit of America Investment Fund, Inc. (the “Company”), is an open-end mutual fund registered under the Investment Company Act of 1940, as amended (the “1940 Act”). The Company was incorporated under the laws of Maryland on May 15, 1997. The Company offers 6 separate series, or mutual funds, each with its own investment objective and strategy. The Fund commenced operations on July 10, 2014. The Fund seeks to provide shareholders with total return, which may consist of income dividends, distributions of long-term capital gains and/or return of capital, through diversified exposure to securities of companies principally engaged in activities in the energy industry, such as the exploration, production, and transmission of energy or energy fuels; the making and servicing of component products for such activities; energy research; and energy conservation.
The Fund currently offers Class A Shares and Class C Shares. Each class of shares for the Fund has identical rights and privileges except with respect to distribution (12b-1) and service fees, voting rights on matters affecting a single class of shares, exchange privileges of each class of shares and sales charges. The price at which the Fund will offer or redeem shares is the net asset value (“NAV”) per share next determined after the order is considered received, subject to any applicable front end or contingent deferred sales charges. Class A shares have a maximum sales charge on purchases of 5.75% as a percentage of the original purchase price. A Contingent Deferred Sales Charge (“CDSC”) of 1.00% may be imposed on redemptions of Class A shares that were purchased within one year of the redemption date where an indirect commission was paid. A CDSC of 1.00% on Class C Shares applies to shares sold within 13 months of purchase.
Effective April 20, 2018 the Fund underwent a 1-for-3 reverse share split. The effect of the reverse share split transactions was to divide the number of outstanding shares of the Fund by the reverse split factor, with a corresponding increase in the net asset value per share. These transactions did not change the net assets of the Fund or the value of a shareholder’s investment. The historical share transactions presented in the Statements of Changes in Net Assets and per share data presented in the Financial Highlights have been adjusted retroactively to give effect to the reverse share split.
Note 2 – Significant Accounting Policies
The Fund is an investment company and follows accounting and reporting guidance under Financial Accounting Standards Board Accounting Standards Codification (“ASC”) Topic 946, “Financial Services-Investment Companies”. The following is a summary of significant accounting policies consistently followed by the Fund in the preparation of its financial statements. These policies are in conformity with generally accepted accounting principles in the United States of America (“GAAP”) for investment companies.
A. Security Valuation: The offering price and NAV per share for the Fund are calculated as of the close of regular trading on the New York Stock Exchange (“NYSE”), currently 4:00 p.m., Eastern Time on each day the NYSE is open for trading. The Fund’s securities are valued at the official close or the last reported sales price on the principal exchange on which the security trades, or if no sales price is reported, the mean of the latest bid and asked prices is used. Securities traded over-the-counter are priced at the mean of the latest bid and asked prices. Unlisted securities traded in the over-the-counter market are valued using an evaluated quote provided by the independent pricing service, or, if an evaluated quote is unavailable, such securities are valued using prices received from dealers, provided that if the dealer supplies both bid and ask prices, the price to be used is the mean of the bid and asked prices. The independent pricing service derives an evaluated quote by obtaining dealer quotes, analyzing the listed markets, reviewing trade execution data and employing sensitivity analysis. Evaluated quotes may also reflect appropriate factors such as individual characteristics of the issue, communications with broker-dealers, and other market data. Fund securities for which market quotations are not readily available are valued at fair value as determined in good faith under procedures established by and under the supervision of the Board.
B. Fair Value Measurements: Various inputs are used in determining the fair value of investments which are as follows:
| | ● | Level 1 – Inputs that reflect unadjusted quoted prices in active markets for identical assets or liabilities that the Fund has the ability to access at the measurement date. |
NOTES TO FINANCIAL STATEMENTS (CONT.) | NOVEMBER 30, 2019
| | ● | Level 2 – Observable inputs other than quoted prices included in level 1 that are observable for the asset or liability, either directly or indirectly. These inputs may include quoted prices for the identical instrument on an inactive market, prices for similar instruments, interest rates, prepayment speeds, credit risk, yield curves, default rates and similar data. |
| | ● | Level 3 – Unobservable inputs based on the best information available in the circumstances, to the extent observable inputs are not available (including the Fund’s own assumptions used in determining the fair value of investments). |
The summary of inputs used to value the Fund’s investments as of November 30, 2019 is as follows:
| | Level 1 | | | Level 2 | | | Level 3 | | | Total | |
Investment Securities: | | | | | | | | | | | | | | | | |
Master Limited Partnerships - Common Stocks | | $ | 226,106,457 | | | $ | — | | | $ | — | | | $ | 226,106,457 | |
Common Stocks | | | 127,353,108 | | | | — | | | | — | | | | 127,353,108 | |
Money Market | | | 2,255,044 | | | | — | | | | — | | | | 2,255,044 | |
Total Investment Securities | | $ | 355,714,609 | | | $ | — | | | $ | — | | | $ | 355,714,609 | |
The Fund did not hold any investments at any time during the reporting period in which significant unobservable inputs were used in determining fair value; therefore, no reconciliation of Level 3 securities is included for this reporting period.
C. Security Transactions and Related Income – The Fund follows industry practice and records security transactions on the trade date for financial reporting purposes. The specific identification method is used for determining gains or losses for financial statement and income tax purposes. Dividend income is recorded on the ex-dividend date and interest income is recorded on an accrual basis. Discounts and premiums on securities purchased are accreted or amortized using the effective interest method, if applicable.
D. Federal Income Taxes: The Fund is taxed as a regular C-corporation for federal income tax purposes. This differs from most investment companies, which elect to be treated as “regulated investment companies” under the Code in order to avoid paying entity level income taxes. Under current law, the Fund is not eligible to elect treatment as a regulated investment company due to its investments primarily inMaster Limited Partnerships (“MLPs”) invested in energy assets. As a result, the Fund will be obligated to pay applicable federal and state corporate income taxes on its taxable income as opposed to most other investment companies which are not so obligated. The Fund expects that a portion of the distributions it receives from MLPs may be treated as a tax-deferred return of capital, thus reducing the Fund’s current tax liability. However, the amount of taxes currently paid by the Fund will vary depending on the amount of income and gains derived from investments and/or sales of MLP interests and such taxes will reduce your return from an investment in the Fund.
Cash distributions from MLPs to the Fund that exceed such Fund’s allocable share of such MLPs net taxable income are considered a tax-deferred return of capital that will reduce the Fund’s adjusted tax basis in the equity securities of the MLP. These reductions in such Fund’s adjusted tax basis in the MLP equity securities will increase the amount of gain (or decrease the amount of loss) recognized by the Fund on a subsequent sale of the securities. The Fund will accrue deferred income taxes for any future tax liability associated with (i) that portion of MLP distributions considered to be a tax-deferred return of capital as well as (ii) capital appreciation of its investments. Upon the sale of an MLP security, the Fund may be liable for previously deferred taxes. The Fund will rely to some extent on information provided by the MLPs, which is not necessarily timely, to estimate deferred tax liability for purposes of financial statement reporting and determining the NAV. From time to time, Spirit of America Energy Fund will modify the estimates or assumptions related to the Fund’s deferred tax liability as new information becomes available. The Fund will generally compute deferred income taxes based on the marginal regular federal income tax rate applicable to corporations and an assumed rate attributable to state taxes.
Since the Fund will be subject to taxation on its taxable income, the NAV of Fund shares will also be reduced by the accrual of any deferred tax liabilities. The S&P 500 Index (the “Index”), however, is calculated without any adjustments for taxes. As a result, the Fund’s after tax performance could differ significantly from the Index even if the pretax performance of the Fund and the performance of the Index are closely correlated.
NOTES TO FINANCIAL STATEMENTS (CONT.) | NOVEMBER 30, 2019
The Fund’s income tax expense/(benefit) consists of the following:
November 30, 2019 | | Current | | | Deferred | | | Total | |
Federal | | $ | — | | | $ | (4,362,795 | ) | | $ | (4,362,795 | ) |
State (net of federal) | | | 45,969 | | | | (131,447 | ) | | | (85,478 | ) |
Valuation allowance | | | — | | | | 4,494,242 | | | | 4,494,242 | |
Total tax expense | | $ | 45,969 | | | $ | — | | | $ | 45,969 | |
Deferred income taxes reflect the net tax effect of temporary differences between the carrying amount of assets and liabilities for financial reporting and tax purposes.
Components of the Fund’s deferred tax assets and liabilities are as follows:
Deferred tax assets: | | As of
November 30,
2019 | |
Net operating loss carryforward | | | 17,641,008 | |
Net capital loss carryforward | | | 25,045,163 | |
Other | | | 320,916 | |
Valuation allowance | | | (34,104,820 | ) |
| | | $ | 8,902,267 | |
Deferred tax liability: | | | | |
Net unrealized gain on investment securities | | | (8,902,267 | ) |
Net Deferred Tax Asset/(Liability) | | | — | |
Net operating loss carryforwards are available to offset future taxable income. For net operating losses generated prior to December 31, 2017, net operating loss carryforwards can be carried forward for 20 years and, accordingly, would begin to expire as of November 30, 2036. For tax years after December 31, 2017, net operating losses generated by the Fund in the future are eligible to be carried forward indefinitely. In addition, the utilization of Net Operating Losses (“NOLs”) generated in tax years beginning after December 31, 2017 will be limited to the lesser of the aggregate of available NOLs or 80% of taxable income before any NOL utilization. The 80% limitation is effective for the NOLs generated in the current fiscal year ending November 30, 2019. The Fund has net operating loss carryforwards for federal income tax purposes as follows:
Year-Ended | | Amount | | Expiration |
November 30, 2016 | | $ | 17,205,467 | | November 30, 2036 |
November 30, 2017 | | | 40,373,794 | | November 30, 2037 |
November 30, 2018 | | | 16,667,406 | | Indefinite |
Net capital loss carryforwards are available to offset future capital gains. Capital loss carryforwards can be carried forward for 5 years and, accordingly, would begin to expire as of November 30, 2020. The Fund has net capital loss carryforwards for federal income tax purposes as follows:
Year-Ended | | Amount | | Expiration |
November 30, 2015 | | $ | 9,221,227 | | November 30, 2020 |
November 30, 2016 | | | 35,470,784 | | November 30, 2021 |
November 30, 2017 | | | 6,587,134 | | November 30, 2022 |
November 30, 2018 | | | 26,647,868 | | November 30, 2023 |
November 30, 2019 | | | 27,481,923 | | November 30, 2024 |
The Fund reviews the recoverability of its deferred tax assets based upon the weight of available evidence. When assessing the recoverability of its deferred tax assets, significant weight was given to the effects of potential future realized and unrealized gains on investments and the period over which these deferred tax assets can be realized.
NOTES TO FINANCIAL STATEMENTS (CONT.) | NOVEMBER 30, 2019
Based upon the Fund’s assessment, it has determined that is it more likely than not that a portion of its deferred tax assets will not be realized through future taxable income of the appropriate character. Accordingly, a valuation allowance has been established for the Fund’s deferred tax assets. The Fund will continue to assess the need for additional valuation allowance in the future. Significant changes in the fair value of its portfolio investments may change the Fund’s assessment of the recoverability of these assets and may impact the valuation allowances recorded against all or a portion of the Fund’s gross deferred tax assets.
Total income tax expense (current and deferred) differs from the amount computed by applying the federal statutory income tax rate of 21% to net investment and realized and unrealized gain/(losses) on investment before taxes as follows:
| | | Year Ended
November 30,
2019 | |
Income tax expense at statutory rate | | | (3,943,650 | ) |
State income tax expense (net of federal effect) | | | (518,308 | ) |
Permanent differences, net | | | (533,460 | ) |
Change in estimated state deferred rate | | | 441,052 | |
Other | | | 106,093 | |
Valuation Allowance | | | 4,492,242 | |
Net income tax expense | | $ | 45,969 | |
The Fund recognizes interest accrued related to unrecognized tax benefits and penalties as income tax expense. For the fiscal year ended November 30, 2019, the Fund had no accrued penalties or interest.
The Fund recognizes the tax benefits of uncertain tax positions only where the position is “more likely than not” to be sustained assuming examination by tax authorities. Management has analyzed the Fund’s tax positions, and has concluded that no liability for unrecognized tax benefits should be recorded related to uncertain tax positions taken on U.S. tax returns and state tax returns filed since inception of the fund. No U.S. federal or state income tax returns are currently under examination. The tax periods ended November 30, 2016, November 30, 2017, November 30, 2018 and November 30, 2019 remain subject to examination by tax authorities in the United States. Due to the nature of the Fund’s investments, the Fund may be required to file income tax returns in several states. The Fund is not aware of any tax positions for which it is reasonably possible that the total amounts of unrecognized tax benefits will change materially in the next 12 months.
The adjusted cost basis of investment and gross unrealized appreciation and depreciation of investments for federal income tax purposes were as follows:
| | | Year Ended
November 30,
2019 | |
Gross unrealized appreciation - investment securities | | $ | 77,380,510 | |
Gross unrealized depreciation - investment securities | | | (39,952,543 | ) |
Net unrealized appreciation - investment securities | | $ | 37,427,967 | |
Cost basis of investments | | $ | 318,286,642 | |
E. Use of Estimates: In preparing financial statements in conformity with GAAP, management makes estimates and assumptions that affect the reported amounts of assets and liabilities at the date of the financial statements, as well as the reported amounts of revenues and expenses during the reporting period. Actual results could differ from those estimates.
F. Distributions to Shareholders: The Board has set a distribution policy in which the Fund pays fixed rate monthly distributions to shareholders, all or a portion of which is expected to be characterized as return of capital. Return of capital distributions will generally not be taxable to the shareholders for U.S. federal income tax purposes. The final determination of the amount of the Fund’s return of capital distributions for the period will be made after the end of each calendar year.
NOTES TO FINANCIAL STATEMENTS (CONT.) | NOVEMBER 30, 2019
G. Allocation of Income, Expenses, Gains and Losses: Income, expenses (other than those attributable to a specific class), gains and losses are allocated on a daily basis to each class of shares based upon the relative proportion of net assets represented by such class. Operating expenses directly attributable to a specific class are charged against the operations of that class.
Note 3 – Purchases and Sales of Securities
Purchases and proceeds from the sales of securities for the fiscal year ended November 30, 2019, excluding short-term investments, were $74,000,102 and $216,794,179, respectively.
Note 4 – Investment Management Fee and Other Transactions with Affiliates
Spirit of America Management Corp. (the “Adviser”) has been retained to act as the Company’s investment adviser pursuant to an Investment Advisory Agreement (the “Advisory Agreement”). The Adviser was incorporated in 1997 and is a registered investment adviser under the Investment Advisers Act of 1940, as amended. Under the Advisory Agreement, the Fund pays the Adviser a monthly fee of 1/12 of 0.95% of the Fund’s average daily net assets. Investment advisory fees for the fiscal year ended November 30, 2019 were $4,343,192.
The Fund has adopted a Plan of Distribution (the “12b-1 Plan”) pursuant to Rule 12b-1 under the 1940 Act. The 12b-1 Plan permits the Fund or class, as applicable, to pay David Lerner Associates, Inc. (the “Distributor”) from its own assets for the Distributor’s services and expenses in distributing shares of the Fund (“12b-1 fees”) and providing personal services and/or maintaining shareholder accounts (“service fees”). The Energy Fund’s Class A Shares pay a 12b-1 fee at the annual rate of 0.25% of average daily net assets. With respect to Class C Shares, the fee paid to the Distributor by the Fund is 1.00% of the average daily net assets of the Class C Shares. Of this amount, 0.75% represents distribution fees and 0.25% represents shareholder servicing fees paid to institutions that have agreements with the Distributor to provide such services. Each class of shares of the Energy Fund has exclusive voting rights with respect to its 12b-1 Plan. Since 12b-1 fees are paid out of the assets of the respective share class of the Energy Fund on an on-going basis, over time these fees will increase the cost of your investment and may cost you more than paying other types of sales charges. For the fiscal year ended November 30, 2019, fees paid to the Distributor under the Plan were $1,182,778.
The Fund’s Class A Shares are subject to an initial sales charge imposed at the time of purchase, in accordance with the Fund’s current prospectus. For the fiscal year ended November 30, 2019, sales charges received by the Distributor were $1,772,256. CDSC fees collected for the fiscal year ended November 30, 2019 were $1,422 for Class A Shares and $2,411 for Class C Shares.
Certain Officers and Directors of the Company are “affiliated persons”, as that term is defined in the 1940 Act, of the Adviser or the Distributor. Each Director of the Company, who is not an affiliated person of the Adviser or Distributor, receives a quarterly retainer of $7,580, $1,500 for each Board meeting attended, and $500 for each committee meeting attended plus reimbursement for certain travel and other out-of-pocket expenses incurred in connection with attending Board meetings. The Company does not compensate the Officers directly for the services they provide. There are no Directors’ fees paid to affiliated Directors of the Company. For the fiscal year ended November 30, 2019, the Fund was allocated $12,863 of the Chief Compliance Officer’s salary.
Note 5 – Concentration and Other Risks
The Fund concentrates its investments in securities and other assets of energy and energy related companies. A fund that invests primarily in a particular sector could experience greater volatility than funds investing in a broader range of industries. Due to the fact that the Fund normally invests at least 80% of its assets in the securities of companies principally engaged in activities in the energy industry, the Fund’s performance largely depends on the overall condition of the energy industry. The energy industry could be adversely affected by energy prices, supply-and- demand for energy resources, and various political, regulatory, and economic factors. Investments in securities of MLPs involve risks that differ from investments in common stock, including risks related to limited control and limited rights to vote on matters affecting the MLP, risks related to potential conflicts of interest between the MLP and the MLP’s general partner, cash flow risks, dilution risks and risks related to the general partner’s right to require unit holders to sell their common units at an undesirable time or price.
NOTES TO FINANCIAL STATEMENTS (CONT.) | NOVEMBER 30, 2019
Note 6 – Line of Credit
The Company participates in a short-term credit agreement (“Line of Credit) with The Huntington National Bank, the custodian of the Fund’s investments expiring on May 20, 2020. Borrowings under this agreement bear interest at London Interbank Offered Rate (“LIBOR”) plus 1.500%. Maximum borrowings for the Company is the lesser of $3,000,000 or 10% of the Funds’ daily market value. During the fiscal year ended November 30, 2019, the Fund’s borrowing activity was as follows:
| | | | | |
Total bank line of credit as of November 30, 2019 | | $ | 3,000,000 | |
Average borrowings during period | | $ | 323,483 | |
Number of days outstanding* | | | 35 | |
Average interest rate during period | | | 3.882 | % |
Highest balance drawn during period | | $ | 1,249,711 | |
Highest balance interest rate | | | 4.006 | % |
Interest expense incurred | | $ | 1,432 | |
Interest rate at November 30, 2019 | | | 3.304 | % |
* | Number of days outstanding represents the total days during the fiscal year ended November 30, 2019 that the Fund utilized the line of credit. |
Note 7 – Subsequent Events
Douglas Revello replaced William Mason as the Fund’s Portfolio Manager on January 16, 2020. Mr. Revello also serves as the Portfolio Manager to the Spirit of America Large Cap Value Fund (since January 10, 2018) and the Spirit of America Real Estate Income and Growth Fund (since July 1, 2016), and as the Co-Portfolio Manager to both the Spirit of America Municipal Tax Free Bond Fund (since January 10, 2018) and the Spirit of America Income Fund (since May 1, 2018). Mr. Revello has been associated with the Adviser since May 18, 2009.
Management of the Fund has evaluated the need for disclosures resulting from subsequent events through the date these financial statements were issued. Management has determined that there were no additional items requiring additional disclosure.
REPORT OF INDEPENDENT REGISTERED PUBLIC ACCOUNTING FIRM
To the Board of Directors and Shareholders
Spirit of America Energy Fund
Opinion on the Financial Statements
We have audited the accompanying statement of assets and liabilities of Spirit of America Energy Fund (the “Fund”), a series of Spirit of America Investment Fund, Inc., including the schedule of investments, as of November 30, 2019, the related statement of operations for the year then ended, the statements of changes in net assets for each of the two years in the period then ended, financial highlights for each of the five years in the period then ended, and the related notes (collectively referred to as the “financial statements”). In our opinion, the financial statements present fairly, in all material respects, the financial position of the Fund as of November 30, 2019, the results of its operations for the year then ended, the changes in its net assets for each of the two years in the period then ended, and the financial highlights for each of the five years in the period then ended, in conformity with accounting principles generally accepted in the United States of America.
Basis for Opinion
These financial statements are the responsibility of the Fund’s management. Our responsibility is to express an opinion on the Fund’s financial statements based on our audits. We are a public accounting firm registered with the Public Company Accounting Oversight Board (United States) (“PCAOB”) and are required to be independent with respect to the Fund in accordance with the U.S. federal securities laws and the applicable rules and regulations of the Securities and Exchange Commission and the PCAOB. We have served as the Fund’s auditor since 1998.
We conducted our audits in accordance with the standards of the PCAOB. Those standards require that we plan and perform the audit to obtain reasonable assurance about whether the financial statements are free of material misstatement, whether due to error or fraud. The Fund is not required to have, nor were we engaged to perform, an audit of its internal control over financial reporting. As part of our audits we are required to obtain an understanding of internal control over financial reporting, but not for the purpose of expressing an opinion on the effectiveness of the Fund’s internal control over financial reporting. Accordingly, we express no such opinion.
Our audits included performing procedures to assess the risks of material misstatement of the financial statements, whether due to error or fraud, and performing procedures that respond to those risks. Such procedures included examining, on a test basis, evidence regarding the amounts and disclosures in the financial statements. Our audits also included evaluating the accounting principles used and significant estimates made by management, as well as evaluating the overall presentation of the financial statements. Our procedures included confirmation of securities owned as of November 30, 2019 by correspondence with the custodian. We believe that our audits provide a reasonable basis for our opinion.
Philadelphia, Pennsylvania
January28, 2020
DISCLOSURE OF FUND EXPENSES (UNAUDITED)
FOR THE SIX MONTH PERIOD JUNE 1, 2019 TO NOVEMBER 30, 2019
We believe it is important for you to understand the impact of fees regarding your investment. All mutual funds have operating expenses. As a shareholder of the Fund, you incur ongoing costs, which include costs for portfolio management, administrative services, and shareholder reports (like this one), among others. Operating expenses, which are deducted from the Fund’s gross income, directly reduce the investment return of the Fund.
The Fund’s expenses are expressed as a percentage of its average net assets. This figure is known as the expense ratio. The following examples are intended to help you understand the ongoing fees (in dollars) of investing in your Fund and to compare these costs with those of other mutual funds. The examples are based on an investment of $1,000 made at the beginning of the period shown and held for the six month period, June 1, 2019 to November 30, 2019.
| Beginning
Account Value,
June 1, 2019 | Ending
Account Value,
November 30, 2019 | Expenses
Annualized
Expense Ratio | Expenses
Paid During
Period(a) |
Class A Shares | | | | |
Actual | $1,000.00 | $ 932.90 | 1.46% | $ 7.07 |
Hypothetical(b) | $1,000.00 | $1,017.75 | 1.46% | $ 7.38 |
Class C Shares | | | | |
Actual | $1,000.00 | $ 930.30 | 2.21% | $10.70 |
Hypothetical(b) | $1,000.00 | $1,013.99 | 2.21% | $11.16 |
(a) | Expenses are equal to the Fund’s annualized expense ratios, multiplied by the average account value over the period, multiplied by 183/365 (to reflect the one-half year period). |
(b) | Assumes a 5% annual return before expenses. |
This table illustrates your Fund’s costs in two ways:
Actual Fund Return: This section helps you to estimate the actual expenses that you paid over the period. The “Ending Account Value” shown is derived from the Fund’s actual return, the third column shows the period’s annualized expense ratio, and the last column shows the dollar amount that would have been paid by an investor who started with $1,000 in the Fund at the beginning of the period. You may use the information here, together with your account value, to estimate the expenses that you paid over the period.
To do so, simply divide your account value by $1,000 (for example, an $8,600 account value divided by $1,000 = 8.6), then multiply the result by the number in the first line under the heading entitled “Expenses Paid During Period.”
Hypothetical 5% Return:This section is intended to help you compare your Fund’s costs with those of other mutual funds. It assumes that the Fund had a return of 5% before expenses during the period shown, but that the expense ratio is unchanged. In this case, because the return used is not the Fund’s actual return, the results do not apply to your investment. You can assess your Fund’s costs by comparing this hypothetical example with the hypothetical examples that appear in shareholder reports of other funds.
Please note that the expenses shown in the table are meant to highlight your ongoing costs only and do not reflect any transactional costs such as sales charges (loads), or redemption fees.
MANAGEMENT OF THE COMPANY (UNAUDITED)
Information pertaining to the Directors and Officers of the Company is set forth below. The Statement of Additional Information includes additional information about the Directors and is available without charge, upon request, by calling (516) 390-5565.
Name, (Age) and Address1
Position(s) with the Company | Term of Office2
and Length of
Time Served | Principal Occupation(s)
During Past Five Years | Number of
Portfolios in
Fund Complex
Overseen by
Director | Other Directorships
Held by Director |
INTERESTED DIRECTORS | | | | |
David Lerner3 (83) Director, Chairman of the Board, President | Since 1998 | Founder, David Lerner Associates, Inc., a registered broker-dealer and the Company’s Distributor; and President, Spirit of America Management Corp., the Company’s investment adviser. | 6 | President and a Director of Spirit of America Management Corp., the Company’s investment adviser. |
Daniel Lerner3 (58) Director | Since 1998 | Senior Vice President, Investment Counselor with David Lerner Associates, Inc., a registered broker-dealer and the Company’s Distributor, since September 2000. | 6 | Director of David Lerner Associates, Inc., a registered broker-dealer and the Company’s Distributor. |
INDEPENDENT DIRECTORS | | | | |
Allen Kaufman (83) Director | Since 1998 | President and Chief Executive Officer of K.G.K. Agency, Inc., a property and casualty insurance agency, since 1963.4 | 6 | Director of K.G.K. Agency, Inc., a property and casualty insurance agency. |
Stanley S. Thune (83) Lead Director | Since 1998 | President and Chief Executive Officer, Freight Management Systems, Inc., a third party logistics management company, since 1994; private investor. | 6 | Director of Freight Management Systems, Inc. |
Richard Weinberger (83) Director | Since 2005 | Of Counsel to Ballon Stoll Bader & Nadler, P.C., a mid-sized law firm, since January 2005 to March 2011; Shareholder, Ballon Stoll Bader & Nadler, P.C., January 2000 to December 2004. | 6 | None. |
OFFICERS | | | | |
David Lerner President (see biography above) | | | | |
Alan P. Chodosh (66) Treasurer and Secretary | Since 2003 (Treasurer) Since 2005 (Secretary) | Senior Advisor at David Lerner Associates, Inc. since April 2016; Executive Vice President and Chief Financial Officer of David Lerner Associates, Inc. from June 1999, until April 2016. | N/A | N/A |
Joseph Pickard (59) Chief Compliance Officer | Since 2007 | Chief Compliance Officer of Spirit of America Investment Fund, Inc. and Spirit of America Management Corp. since July 2007; Counsel to the Interested Directors of Spirit of America Investment Fund, Inc. since July 2002; General Counsel of David Lerner Associates, Inc. since July 2002. | N/A | N/A |
1 | All addresses are in c/o Spirit of America Investment Fund, Inc., 477 Jericho Turnpike, Syosset, New York 11791. |
2 | Each Director serves for an indefinite term, until his successor is elected. |
3 | David Lerner is an “interested” Director, as defined in the 1940 Act, by reason of his positions with the Adviser, and Daniel Lerner is an “interested” Director by reason of his position with the Distributor. Daniel Lerner is the son of David Lerner. |
4 | K.G.K. Agency, Inc. provides insurance to David Lerner Associates, Inc. and affiliated entities. However, the Board has determined that Mr. Kaufman is not an “interested” Director because the insurance services are less than $120,000 in value. |
Proxy Voting Information
The Company’s Statement of Additional Information (“SAI”) containing a description of the policies and procedures that the Spirit of America Energy Fund uses to determine how to vote proxies relating to portfolio securities, along with the Company’s proxy voting record relating to portfolio securities held during the 12-month period ended June 30 are available (i) without charge, upon request, by calling (516) 390-5565; and (ii) on the SEC’s website at http://www.sec.gov.
Portfolio Disclosure
The Company files its complete schedule of portfolio holdings with the SEC for the first and third quarters of each fiscal year within sixty days after the end of the period. The Company’s portfolio holdings will be available on the SEC’s website at http://www.sec.gov.
Investment Adviser
Spirit of America Management Corp.
477 Jericho Turnpike
P.O. Box 9006
Syosset, NY 11791-9006
Distributor
David Lerner Associates, Inc.
477 Jericho Turnpike
P.O. Box 9006
Syosset, NY 11791-9006
Shareholder Services
Ultimus Asset Services, LLC
225 Pictoria Drive, Suite 450
Cincinnati, OH 45246
Custodian
The Huntington National Bank
7 Easton Oval
Columbus, OH 43219
Independent Registered
Public Accounting Firm
Tait Weller & Baker LLP
Two Liberty Place
50 South 16th Street, Suite 2900
Philadelphia, PA 19102-2529
Counsel
Blank Rome LLP
1271 Avenue of the Americas
New York, NY 10020

For additional information about the Spirit of America Energy Fund, call (800) 452-4892 or (516) 390-5565.
This report is submitted for the general information of the shareholders of the Fund. It is not authorized for distribution to prospective investors in the Fund unless preceded or accompanied by an effective Prospectus which includes details regarding the Fund’s objectives, risks, policies, expenses, and other information.
©Copyright 2019 Spirit of America | SOAEN-AR19 |
Item 2. Code of Ethics.
(a) As of the end of the period covered by the report, the registrant has adopted a code of ethics that applies to the registrant’s Principal Executive Officer and Principal Financial Officer.
(b) Not applicable.
(c) During the period covered by the report, with respect to the registrant's code of ethics that applies to its Principal Executive Officer and Principal Financial Officer: there have been no amendments to a provision that relates to any element of the code of ethics definition enumerated in paragraph (b) of this Item 2.
(d) During the period covered by the report, with respect to the registrant's code of ethics that applies to its Principal Executive Officer and Principal Financial Officer: there have been no waivers granted from a provision that relates to any element of the code of ethics definition enumerated in paragraph (b) of this Item 2.
(e) Not applicable.
(f) The registrant has included a copy of the code of ethics that applies to the registrant’s Principal Executive Officer and Principal Financial Officer. This code of ethics is included as an Exhibit on this Form N-CSR.
Item 3. Audit Committee Financial Expert.
(a) The registrant’s board of trustees has determined that the registrant does not have an audit committee financial expert. The committee members and the full Board considered a possibility of adding a member that would qualify as an expert. The audit committee determined that, although none of its members meet the technical definition of an audit committee expert, the committee has sufficient financial expertise to adequately perform its duties under the Audit Committee Charter without the addition of a qualified expert.
Item 4. Principal Accountant Fees and Services.
(a) Audit Fees billed to the registrant by its principal accountants for the two most recent fiscal years:
Fiscal year ended 2019: $26,073
Fiscal year ended 2018: $26,073
(b) Audit-Related Fees billed to the registrant by its principal accountants for the two most recent fiscal years:
Fiscal year ended 2019: $0
Fiscal year ended 2018: $0
Fees for 2019 and 2018 related to the agreed-upon review of items within the Management’s Discussion of Fund Performance sections of the Funds’ Form N-CSR filing. Amount requiring approval of the registrant's audit committee pursuant to paragraph (c)(7)(ii) of Rule 2-01 of Regulation S-X, $0 and $0 respectively.
(c) Tax Fees billed to the registrant by its principal accountants for the two most recent fiscal years:
Fiscal year ended 2019: $3,900
Fiscal year ended 2018: $3,900
Fees for 2019 and 2018 related to the review of the registrant's tax returns. Amount requiring approval of the registrant's audit committee pursuant to paragraph (c)(7)(ii) of Rule 2-01 of Regulation S-X, $0 and $0 respectively.
(d) All other fees billed to the registrant by its principal accountants for the two most recent fiscal years:
Fiscal year ended 2019: $0
Fiscal year ended 2018: $0
Amount requiring approval of the registrant's audit committee pursuant to paragraph (c)(7)(ii) of Rule 2-01 of Regulation S-X, $0 and $0 respectively.
(e)(1) Disclose the audit committee’s pre-approval policies and procedures described in paragraph (c)(7) of Rule 2-01 of Regulation S-X
Pre-Approval of Audit and Permitted Non-Audit Services Provided to the Company
Pre-Approval Requirements. The Committee shall pre-approve all auditing services and permissible non-audit services (e.g., tax services) to be provided to the Company by the Auditor, including the fees therefor. The Committee may delegate to one or more of its members the authority to grant pre-approvals. In connection with such delegation, the Committee shall establish pre-approval policies and procedures, including the requirement that the decisions of any member to whom authority is delegated under this section (B) shall be presented to the full Committee at each of its scheduled meetings.
De Minimis Exception to Pre-Approval: Pre-approval for a permitted non-audit service shall not be required if:
| | a. | the aggregate amount of all such non-audit services is not more than 5% of the total revenues paid by the Company to the Auditor in the fiscal year in which the non-audit services are provided; |
| | b. | such services were not recognized by the Company at the time of the engagement to be non-audit services; and |
| | c. | such services are promptly brought to the attention of the Committee and approved prior to the completion of the audit by the Committee or by one or more members of the Committee to whom authority to grant such approvals has been delegated by the Committee. |
Additionally, the Committee shall pre-approve the Auditor’s engagements for non-audit services with the Adviser and any affiliate of the Adviser that provides ongoing services to the Company in accordance with the foregoing, if the engagement relates directly to the operations and financial reporting of the Company, unless the aggregate amount of all services provided constitutes no more than 5% of the total amount of revenues paid to the Auditor by the Company, the Adviser and any affiliate of the Adviser that provides ongoing services to the Company during the fiscal year in which the services are provided that would have to be pre-approved by the Committee pursuant to this paragraph (without regard to this exception).
(e)(2) The percentage of services described in each of paragraphs (b) through (d) of this Item that were approved by the audit committee pursuant to paragraph (c)(7)(i)(C) of Rule 2-01 of Regulation S-X are as follows:
(b) 0%
(c) 0 %
(d) 0%
(f) The percentage of hours expended on the principal accountant’s engagement to audit the registrant’s financial statements for the most recent fiscal year that were attributed to work performed by persons other than the principal accountant’s full-time, permanent employees was 0%.
(g) The aggregate non-audit fees billed by the registrant’s accountant for services rendered to the registrant, and rendered to the registrant’s investment adviser (not including any sub-adviser whose role is primarily portfolio management and is subcontracted with or overseen by another investment adviser), and any entity controlling, controlled by, or under common control with the adviser that provides ongoing services to the registrant for fiscal years ended December 31, 2018 and December 31, 2019 are $0 and $0, respectively
(h) The registrant’s audit committee of the board of directors has considered whether the provision of non-audit services that were rendered to the registrant’s investment adviser (not including any sub-adviser whose role is primarily portfolio management and is subcontracted with or overseen by another investment adviser), and any entity controlling, controlled by, or under common control with the investment adviser that provides ongoing services to the registrant that were not pre-approved pursuant to paragraph (c)(7)(ii) of Rule 2-01 of Regulation S-X is compatible with maintaining the principal accountant’s independence.
| Item 5. | Audit Committee of Listed Registrants. |
Not applicable.
| Item 6. | Schedule of Investments. |
(a) Not applicable.
(b) Not applicable.
Item 7. Disclosure of Proxy Voting Policies and Procedures for Closed-End Management Investment Companies.
Not applicable.
Item 8. Portfolio Managers of Closed-End Management Investment Companies.
Not applicable.
Item 9. Purchases of Equity Securities by Closed-End Management Investment Company and Affiliated Purchasers.
Not applicable.
Item 10. Submission of Matters to a Vote of Security Holders.
Not applicable.
Item 11. Controls and Procedures.
(a) The registrant’s Principal Executive Officer and Principal Financial Officer have concluded that the registrant's disclosure controls and procedures (as defined in Rule 30a-3(c) under the Act) are effective in design and operation and are sufficient to form the basis of the certifications required by Rule 30a-2 under the Act, based on their evaluation of these disclosure controls and procedures within 90 days of the filing of this report on Form N-CSR.
(b) There were no changes in the registrant’s internal control over financial reporting (as defined in Rule 30a-3(d) under the Act (17 CFR 270.30a-3(d)) that occurred during the period covered by this report that have materially affected or are reasonably likely to materially affect, the registrant’s internal control over financial reporting.
Item 12. Disclosure of Securities Lending Activities for Closed-End Investment Companies.
Not Applicable.
Item 13. Exhibits.
(a)(1) The code of ethics that is the subject of the disclosure required by Item 2 is attached hereto.
(a)(2) Certifications pursuant to Rule 30a-2(a) are attached hereto.
(a)(3) Not applicable.
(b) Certifications pursuant to Rule 30a-2(b) are furnished herewith.
SIGNATURES
Pursuant to the requirements of the Securities Exchange Act of 1934 and the Investment Company Act of 1940, the registrant has duly caused this report to be signed on its behalf by the undersigned, thereunto duly authorized.
| (Registrant) | The Spirit of America Funds, Inc. | |
| | | |
| By (Signature and Title)* | /s/ David Lerner | |
| | David Lerner, Principal Executive Officer | |
| | | |
| Date | 2/4/2020 | |
Pursuant to the requirements of the Securities Exchange Act of 1934 and the Investment Company Act of 1940, this report has been signed below by the following persons on behalf of the registrant and in the capacities and on the dates indicated.
| By (Signature and Title)* | /s/ David Lerner | |
| | David Lerner, Principal Executive Officer | |
| | | |
| Date | 2/4/2020 | |
| | | |
| By (Signature and Title)* | /s/ Alan P. Chodosh | |
| | Alan P. Chodosh, Principal Financial Officer | |
| | | |
| Date | 2/4/2020 | |