UNITED STATES
SECURITIES AND EXCHANGE COMMISSION
Washington, D.C. 20549
FORM N-CSR
CERTIFIED SHAREHOLDER REPORT OF REGISTERED MANAGEMENT INVESTMENT COMPANIES
Investment Company Act file number: 811-08629
HARTFORD SERIES FUND, INC.
(Exact name of registrant as specified in charter)
P. O. Box 2999, Hartford, Connecticut 06104-2999
(Address of Principal Executive Offices)
Edward P. Macdonald, Esquire
Life Law Unit
The Hartford Financial Services Group, Inc.
200 Hopmeadow Street
Simsbury, Connecticut 06089
(Name and Address of Agent for Service)
Registrant’s telephone number, including area code: (860) 843-9934
Date of fiscal year end: December 31st
Date of reporting period: January 1, 2010 – June 30, 2010
Form N-CSR is to be used by management investment companies to file reports with the Commission not later than 10 days after the transmission to stockholders of any report that is required to be transmitted to stockholders under Rule 30e-1 under the Investment Company Act of 1940 (17 CFR 270.30e-1). The Commission may use the information provided on Form N-CSR in its regulatory, disclosure review, inspection, and policymaking roles.
A registrant is required to disclose the information specified by Form N-CSR, and the Commission will make this information public. A registrant is not required to respond to the collection of information contained in Form N-CSR unless the Form displays a currently valid Office of Management and Budget ("OMB") control number. Please direct comments concerning the accuracy of the information collection burden estimate and any suggestions for reducing the burden to Secretary, Securities and Exchange Commission, 450 Fifth Street, NW, Washington, DC 20549-0609. The OMB has reviewed this collection of information under the clearance requirements of 44 U.S.C. § 3507.
Item 1. Reports to Stockholders.
| American Funds HLS Funds |
 |
Hartford Series Fund, Inc.
| Manager Discussions (Unaudited) | 2 |
| Hartford Series Fund, Inc. Financial Statements: | |
| Schedule of Investment as of June 30, 2010 (Unaudited): | |
| 13 | |
| 13 | |
| 14 | |
| 14 | |
| 15 | |
| 15 | |
| 16 | |
| 16 | |
| 17 | |
| 17 | |
| 18 | |
| 20 | |
| 22 | |
| 24 | |
| 28 | |
| 36 | |
| 38 | |
| 40 | |
| 40 | |
| 41 | |
| 42 |
This report is prepared for the general information of contract owners and is not an offer of contracts. It should not be used in connection with any offer, except in conjunction with the appropriate prospectus which contains all pertinent information including the applicable sales, administrative and other charges.
American Funds Asset Allocation HLS Fund inception 4/30/2008
(advised by HL Investment Advisors, LLC)
Investment Goal: Seeks high total return (including income and capital gains) consistent with preservation of capital over the long term.
Performance Overview 4/30/08 - 6/30/10
Growth of $10,000 investment

Barclays Capital U.S. Aggregate Index represents the U.S. investment-grade fixed-rate bond market.
Citigroup Broad Investment-Grade Bond Index is a market capitalization-weighted index that includes fixed-rate U.S. Treasury, government-sponsored, mortgage, asset-backed and investment-grade corporates with a maturity of one year or longer.
S&P 500 Index is a market capitalization-weighted price index composed of 500 widely held common stocks.
You cannot invest directly in an index.
The chart represents a hypothetical investment in the Fund. Performance data represents past performance and current performance could be higher or lower.
Average Annual Returns (as of 6/30/10)
| 6 | 1 | Since | ||||
| Month† | Year | Inception | ||||
| American Funds Asset Allocation HLS Fund IB | -5.29% | 10.99% | -6.93% | |||
| Barclays Capital U.S. Aggregate Index | 5.33% | 9.50% | 6.74% | |||
| Citigroup Broad Investment-Grade Bond Index | 5.27% | 9.03% | 7.01% | |||
| S&P 500 Index | -6.64% | 14.43% | -10.66% |
† | Not Annualized |
PAST PERFORMANCE IS NOT INDICATIVE OF FUTURE RESULTS.
Performance information may reflect historical or current expense waivers from the investment adviser, without which performance would have been lower. For information on current expense waivers/reimbursements, please see the prospectus.
The value of the contract will fluctuate so that when redeemed, it may be worth more or less than the original investment. The chart and table do not reflect the deduction of taxes that a shareholder would pay on portfolio distributions or the redemption of portfolio shares. The figures do not include sales charges or other fees which may be applied at the variable life insurance, variable annuity or qualified retirement plan product level. Any such additional sales charges or other fees would lower the Fund’s performance.
How did the Fund perform?
The Class IB Shares of the American Funds Asset Allocation HLS Fund returned -5.29% for the six-month period ended June 30, 2010, versus the returns of -6.64% for the S&P 500 Index, 5.27% for the Citigroup Broad Investment-Grade Bond Index and 5.33% for the Barclays Capital U.S. Aggregate Index. The Fund underperformed the - -4.37% average return of the Lipper Mixed Asset Target Allocation Growth Funds VP-UF peer group, a group of funds with investment strategies similar to those of the Fund.
The performance of the American Funds Asset Allocation HLS Fund is directly related to the performance of the American Funds Insurance Series – Asset Allocation Fund Class 1, in which the Fund invests. The financial statements of the American Funds Insurance Series – Asset Allocation Fund Class 1, including the Schedule of Investments, are provided in the accompanying report and should be read in conjunction with the American Funds Asset Allocation HLS Fund’s financial statements.
American Funds Blue Chip Income and Growth HLS Fund
inception 4/30/2008
inception 4/30/2008
(advised by HL Investment Advisors, LLC)
Investment Goal: Seeks to produce income exceeding the average yield of U.S. stocks generally (as represented by the average yield on the S&P 500 Index) and to provide an opportunity for growth of principal consistent with sound common stock investing.
Performance Overview 4/30/08 - 6/30/10
Growth of $10,000 investment

S&P 500 Index is a market capitalization-weighted price index composed of 500 widely held common stocks.
You cannot invest directly in an index.
The chart represents a hypothetical investment in the Fund. Performance data represents past performance and current performance could be higher or lower.
Average Annual Returns (as of 6/30/10)
| 6 | 1 | Since | ||||
| Month† | Year | Inception | ||||
| American Funds Blue Chip Income and Growth HLS Fund IB | -7.37% | 14.99% | -10.03% | |||
| S&P 500 Index | -6.64% | 14.43% | -10.66% |
| † | Not Annualized |
PAST PERFORMANCE IS NOT INDICATIVE OF FUTURE RESULTS.
Performance information may reflect historical or current expense waivers from the investment adviser, without which performance would have been lower. For information on current expense waivers/reimbursements, please see the prospectus.
The value of the contract will fluctuate so that when redeemed, it may be worth more or less than the original investment. The chart and table do not reflect the deduction of taxes that a shareholder would pay on portfolio distributions or the redemption of portfolio shares. The figures do not include sales charges or other fees which may be applied at the variable life insurance, variable annuity or qualified retirement plan product level. Any such additional sales charges or other fees would lower the Fund’s performance.
How did the Fund perform?
The Class IB Shares of the American Funds Blue Chip Income and Growth HLS Fund returned - -7.37% for the six-month period ended June 30, 2010, versus the return of -6.64% for the S&P 500 Index. The Fund outperformed the -7.67% average return of the Lipper Large Cap Core Funds VP-UF peer group, a group of funds with investment strategies similar to those of the Fund.
The performance of the American Funds Blue Chip Income and Growth HLS Fund is directly related to the performance of the American Funds Insurance Series – Blue Chip Income and Growth Fund Class 1, in which the Fund invests. The financial statements of the American Funds Insurance Series - Blue Chip Income and Growth Fund Class 1, including the Schedule of Investments, are provided in the accompanying report and should be read in conjunction with the American Funds Blue Chip Income and Growth HLS Fund’s financial statements.
American Funds Bond HLS Fund inception 4/30/2008
(advised by HL Investment Advisors, LLC)
Investment Goal: Seeks to maximize current income and preservation of capital.
Performance Overview 4/30/08 - 6/30/10
Growth of $10,000 investment

Barclays Capital U.S. Aggregate Index represents the U.S. investment-grade fixed-rate bond market.
You cannot invest directly in an index.
The chart represents a hypothetical investment in the Fund. Performance data represents past performance and current performance could be higher or lower.
Average Annual Returns (as of 6/30/10)
| 6 | 1 | Since | ||||
| Month† | Year | Inception | ||||
| American Funds Bond HLS Fund IB | 4.49% | 10.87% | 2.41% | |||
| Barclays Capital U.S. Aggregate Index | 5.33% | 9.50% | 6.74% |
| † | Not Annualized |
PAST PERFORMANCE IS NOT INDICATIVE OF FUTURE RESULTS.
Performance information may reflect historical or current expense waivers from the investment adviser, without which performance would have been lower. For information on current expense waivers/reimbursements, please see the prospectus.
The value of the contract will fluctuate so that when redeemed, it may be worth more or less than the original investment. The chart and table do not reflect the deduction of taxes that a shareholder would pay on portfolio distributions or the redemption of portfolio shares. The figures do not include sales charges or other fees which may be applied at the variable life insurance, variable annuity or qualified retirement plan product level. Any such additional sales charges or other fees would lower the Fund’s performance.
How did the Fund perform?
The Class IB Shares of the American Funds Bond HLS Fund returned 4.49% for the six-month period ended June 30, 2010, versus the return of 5.33% for the Barclays Capital U.S. Aggregate Index. The Fund underperformed the 5.45% average return of the Lipper Corporate Debt Funds BBB-Rated VP-UF peer group, a group of funds with investment strategies similar to those of the Fund.
The performance of the American Funds Bond HLS Fund is directly related to the performance of the American Funds Insurance Series – Bond Fund Class 1, in which the Fund invests. The financial statements of the American Funds Insurance Series – Bond Fund Class 1, including the Schedule of Investments, are provided in the accompanying report and should be read in conjunction with the American Funds Bond HLS Fund’s financial statements.
American Funds Global Bond HLS Fund inception 4/30/2008
(advised by HL Investment Advisors, LLC)
Investment Goal: Seeks a high level of total return over the long term.
Performance Overview 4/30/08 - 6/30/10
Growth of $10,000 investment

Barclays Capital Global Aggregate Index represents the global investment-grade fixed-income bond markets.
You cannot invest directly in an index.
The chart represents a hypothetical investment in the Fund. Performance data represents past performance and current performance could be higher or lower.
Average Annual Returns (as of 6/30/10)
| 6 | 1 | Since | ||||
| Month† | Year | Inception | ||||
| American Funds Global Bond HLS Fund IB | -0.86% | 5.85% | 3.11% | |||
| Barclays Capital Global Aggregate Index | -0.31% | 5.00% | 3.08% |
| † | Not Annualized |
PAST PERFORMANCE IS NOT INDICATIVE OF FUTURE RESULTS.
Performance information may reflect historical or current expense waivers from the investment adviser, without which performance would have been lower. For information on current expense waivers/reimbursements, please see the prospectus.
The value of the contract will fluctuate so that when redeemed, it may be worth more or less than the original investment. The chart and table do not reflect the deduction of taxes that a shareholder would pay on portfolio distributions or the redemption of portfolio shares. The figures do not include sales charges or other fees which may be applied at the variable life insurance, variable annuity or qualified retirement plan product level. Any such additional sales charges or other fees would lower the Fund’s performance.
How did the Fund perform?
The Class IB Shares of the American Funds Global Bond HLS Fund returned -0.86% for the six-month period ended June 30, 2010, versus the return of -0.31% for the Barclays Capital Global Aggregate Index. The Fund underperformed the 2.10% average return of the Lipper Global Income Funds VP-UF peer group, a group of funds with investment strategies similar to those of the Fund.
The performance of the American Funds Global Bond HLS Fund is directly related to the performance of the American Funds Insurance Series – Global Bond Fund Class 1, in which the Fund invests. The financial statements of the American Funds Insurance Series – Global Bond Fund Class 1, including the Schedule of Investments, are provided in the accompanying report and should be read in conjunction with the American Funds Global Bond HLS Fund’s financial statements.
American Funds Global Growth and Income HLS Fund inception 4/30/2008
(advised by HL Investment Advisors, LLC)
Investment Goal: Seeks growth of capital over time and current income.
Performance Overview 4/30/08 - 6/30/10
Growth of $10,000 investment

MSCI All Country World Index is a free float-adjusted market capitalization-weighted index that measures equity market performance in the global developed and emerging markets, consisting of 48 developed and emerging market country indices.
MSCI World Index is a free float-adjusted market capitalization-weighted index that is designed to measure global-developed market equity performance. The index consists of 23 developed-market country indices, including the United States.
You cannot invest directly in an index.
The chart represents a hypothetical investment in the Fund. Performance data represents past performance and current performance could be higher or lower.
Average Annual Returns (as of 6/30/10)
| 6 | 1 | Since | ||||
| Month† | Year | Inception | ||||
American Funds Global Growth and Income HLS Fund IB | -8.98% | 14.87% | -11.45% | |||
| MSCI All Country World Index | -9.11% | 12.30% | -12.65% | |||
| MSCI World Index | -9.56% | 10.77% | -13.20% |
| † | Not Annualized |
PAST PERFORMANCE IS NOT INDICATIVE OF FUTURE RESULTS.
Performance information may reflect historical or current expense waivers from the investment adviser, without which performance would have been lower. For information on current expense waivers/reimbursements, please see the prospectus.
The value of the contract will fluctuate so that when redeemed, it may be worth more or less than the original investment. The chart and table do not reflect the deduction of taxes that a shareholder would pay on portfolio distributions or the redemption of portfolio shares. The figures do not include sales charges or other fees which may be applied at the variable life insurance, variable annuity or qualified retirement plan product level. Any such additional sales charges or other fees would lower the Fund’s performance.
How did the Fund perform?
The Class IB Shares of the American Funds Global Growth and Income HLS Fund returned - -8.98% for the six-month period ended June 30, 2010, versus the return of -9.11% for the MSCI All Country World Index and -9.56% for the MSCI World Index. The Fund outperformed the -9.38% average return of the Lipper Global Core Funds VP-UF peer group, a group of funds with investment strategies similar to those of the Fund.
The performance of the American Funds Global Growth and Income HLS Fund is directly related to the performance of the American Funds Insurance Series – Global Growth and Income Fund Class 1, in which the Fund invests. The financial statements of the American Funds Insurance Series – Global Growth and Income Fund Class 1, including the Schedule of Investments, are provided in the accompanying report and should be read in conjunction with the American Funds Global Growth and Income HLS Fund’s financial statements.
American Funds Global Growth HLS Fund inception 4/30/2008
(advised by HL Investment Advisors, LLC)
Investment Goal: Seeks growth of capital.
Performance Overview 4/30/08 - 6/30/10
Growth of $10,000 investment

MSCI World Index is a free float-adjusted market capitalization-weighted index that is designed to measure global-developed market equity performance. The index consists of 23 developed-market country indices, including the United States.
You cannot invest directly in an index.
The chart represents a hypothetical investment in the Fund. Performance data represents past performance and current performance could be higher or lower.
Average Annual Returns (as of 6/30/10)
| 6 | 1 | Since | ||||
| Month† | Year | Inception | ||||
| American Funds Global Growth HLS Fund IB | -10.46% | 11.55% | -9.11% | |||
| MSCI World Index | -9.56% | 10.77% | -13.20% |
† �� Not Annualized
PAST PERFORMANCE IS NOT INDICATIVE OF FUTURE RESULTS.
Performance information may reflect historical or current expense waivers from the investment adviser, without which performance would have been lower. For information on current expense waivers/reimbursements, please see the prospectus.
The value of the contract will fluctuate so that when redeemed, it may be worth more or less than the original investment. The chart and table do not reflect the deduction of taxes that a shareholder would pay on portfolio distributions or the redemption of portfolio shares. The figures do not include sales charges or other fees which may be applied at the variable life insurance, variable annuity or qualified retirement plan product level. Any such additional sales charges or other fees would lower the Fund’s performance.
How did the Fund perform?
The Class IB Shares of the American Funds Global Growth HLS Fund returned -10.46% for the six-month period ended June 30, 2010, versus the return of -9.56% for the MSCI World Index. The Fund underperformed the -6.85% average return of the Lipper Global Growth Funds VP-UF peer group, a group of funds with investment strategies similar to those of the Fund.
The performance of the American Funds Global Growth HLS Fund is directly related to the performance of the American Funds Insurance Series – Global Growth Fund Class 1, in which the Fund invests. The financial statements of the American Funds Insurance Series – Global Growth Fund Class 1, including the Schedule of Investments, are provided in the accompanying report and should be read in conjunction with the American Funds Global Growth HLS Fund’s financial statements.
American Funds Global Small Capitalization HLS Fund inception 4/30/2008
(advised by HL Investment Advisors, LLC)
Investment Goal: Seeks growth of capital over time.
Performance Overview 4/30/08 - 6/30/10
Growth of $10,000 investment

MSCI All Country World Small Cap Index is a free float-adjusted market capitalization-weighted index that is designed to measure equity market performance of smaller capitalization companies in both developed and emerging markets.
S&P Global < $3 Billion Index has been used since April 2008. The S&P Global indices better reflect the Fund's investment universe because they include both developed and developing countries.
You cannot invest directly in an index.
The chart represents a hypothetical investment in the Fund. Performance data represents past performance and current performance could be higher or lower.
Average Annual Returns (as of 6/30/10)
| 6 | 1 | Since | ||||
| Month† | Year | Inception | ||||
American Funds Global Small Capitalization HLS Fund IB | -4.57% | 20.94% | -10.73% | |||
| MSCI All Country World Small Cap Index | -3.36% | 23.05% | -6.33% | |||
| S&P Global < $3 Billion Index | -3.19% | 21.41% | -7.15% |
| † | Not Annualized |
PAST PERFORMANCE IS NOT INDICATIVE OF FUTURE RESULTS.
Performance information may reflect historical or current expense waivers from the investment adviser, without which performance would have been lower. For information on current expense waivers/reimbursements, please see the prospectus.
The value of the contract will fluctuate so that when redeemed, it may be worth more or less than the original investment. The chart and table do not reflect the deduction of taxes that a shareholder would pay on portfolio distributions or the redemption of portfolio shares. The figures do not include sales charges or other fees which may be applied at the variable life insurance, variable annuity or qualified retirement plan product level. Any such additional sales charges or other fees would lower the Fund’s performance.
How did the Fund perform?
The Class IB Shares of the American Funds Global Small Capitalization HLS Fund returned - -4.57% for the six-month period ended June 30, 2010, versus the returns of - -3.19% for the S&P Global < $3 Billion Index and -3.36% for the MSCI All Country World Small Cap Index. The Fund outperformed the -6.85% average return of the Lipper Global Growth Funds VP-UF peer group, a group of funds with investment strategies similar to those of the Fund.
The performance of the American Funds Global Small Capitalization HLS Fund is directly related to the performance of the American Funds Insurance Series – Global Small Capitalization Fund Class 1, in which the Fund invests. The financial statements of the American Funds Insurance Series – Global Small Capitalization Fund Class 1, including the Schedule of Investments, are provided in the accompanying report and should be read in conjunction with the American Funds Global Small Capitalization HLS Fund’s financial statements.
American Funds Growth HLS Fund inception 4/30/2008
(advised by HL Investment Advisors, LLC)
Investment Goal: Seeks growth of capital.
Performance Overview 4/30/08 - 6/30/10
Growth of $10,000 investment

S&P 500 Index is a market capitalization-weighted price index composed of 500 widely held common stocks.
You cannot invest directly in an index.
The chart represents a hypothetical investment in the Fund. Performance data represents past performance and current performance could be higher or lower.
Average Annual Returns (as of 6/30/10)
| 6 | 1 | Since | ||||
| Month† | Year | Inception | ||||
| American Funds Growth HLS Fund IB | -5.60% | 16.37% | -11.26% | |||
| S&P 500 Index | -6.64% | 14.43% | -10.66% |
| † | Not Annualized |
PAST PERFORMANCE IS NOT INDICATIVE OF FUTURE RESULTS.
Performance information may reflect historical or current expense waivers from the investment adviser, without which performance would have been lower. For information on current expense waivers/reimbursements, please see the prospectus.
The value of the contract will fluctuate so that when redeemed, it may be worth more or less than the original investment. The chart and table do not reflect the deduction of taxes that a shareholder would pay on portfolio distributions or the redemption of portfolio shares. The figures do not include sales charges or other fees which may be applied at the variable life insurance, variable annuity or qualified retirement plan product level. Any such additional sales charges or other fees would lower the Fund’s performance.
How did the Fund perform?
The Class IB Shares of the American Funds Growth HLS Fund returned -5.60% for the six-month period ended June 30, 2010, versus the return of -6.64% for the S&P 500 Index. The Fund outperformed the -6.48% average return of the Lipper Multi-Cap Growth Funds VP-UF peer group, a group of funds with investment strategies similar to those of the Fund.
The performance of the American Funds Growth HLS Fund is directly related to the performance of the American Funds Insurance Series – Growth Fund Class 1, in which the Fund invests. The financial statements of the American Funds Insurance Series – Growth Fund Class 1, including the Schedule of Investments, are provided in the accompanying report and should be read in conjunction with the American Funds Growth HLS Fund’s financial statements.
American Funds Growth-Income HLS Fund inception 4/30/2008
(advised by HL Investment Advisors, LLC)
Investment Goal: Seeks growth of capital and income over time.
Performance Overview 4/30/08 - 6/30/10
Growth of $10,000 investment

S&P 500 Index is a market capitalization-weighted price index composed of 500 widely held common stocks.
You cannot invest directly in an index.
The chart represents a hypothetical investment in the Fund. Performance data represents past performance and current performance could be higher or lower.
Average Annual Returns (as of 6/30/10)
| 6 | 1 | Since | ||||
| Month† | Year | Inception | ||||
| American Funds Growth-Income HLS Fund IB | -9.17% | 10.38% | -11.21% | |||
| S&P 500 Index | -6.64% | 14.43% | -10.66% |
| † | Not Annualized |
PAST PERFORMANCE IS NOT INDICATIVE OF FUTURE RESULTS.
Performance information may reflect historical or current expense waivers from the investment adviser, without which performance would have been lower. For information on current expense waivers/reimbursements, please see the prospectus.
The value of the contract will fluctuate so that when redeemed, it may be worth more or less than the original investment. The chart and table do not reflect the deduction of taxes that a shareholder would pay on portfolio distributions or the redemption of portfolio shares. The figures do not include sales charges or other fees which may be applied at the variable life insurance, variable annuity or qualified retirement plan product level. Any such additional sales charges or other fees would lower the Fund’s performance.
How did the Fund perform?
The Class IB Shares of the American Funds Growth-Income HLS Fund returned -9.17% for the six-month period ended June 30, 2010, versus the return of -6.64% for the S&P 500 Index. The Fund underperformed the -6.10% average return of the Lipper Multi-Cap Core Funds VP-UF peer group, a group of funds with investment strategies similar to those of the Fund.
The performance of the American Funds Growth-Income HLS Fund is directly related to the performance of the American Funds Insurance Series – Growth-Income Fund Class 1, in which the Fund invests. The financial statements of the American Funds Insurance Series – Growth-Income Fund Class 1, including the Schedule of Investments, are provided in the accompanying report and should be read in conjunction with the American Funds Growth-Income HLS Fund’s financial statements.
American Funds International HLS Fund inception 4/30/2008
(advised by HL Investment Advisors, LLC)
Investment Goal: Seeks growth of capital over time.
Performance Overview 4/30/08 - 6/30/10
Growth of $10,000 investment

MSCI All Country World Free ex U.S. Index is a broad-based, unmanaged, market capitalization-weighted, total return index that measures the performance of both developed and emerging stock markets, excluding the U.S. The index is calculated to exclude companies and share classes which cannot be freely purchased by foreigners.
You cannot invest directly in an index.
The chart represents a hypothetical investment in the Fund. Performance data represents past performance and current performance could be higher or lower.
Average Annual Returns (as of 6/30/10)
| 6 | 1 | Since | ||||
| Month† | Year | Inception | ||||
| American Funds International HLS Fund IB | -13.42% | 7.43% | -12.29% | |||
| MSCI All Country World Free ex U.S. Index | -10.80% | 10.87% | -14.11% |
| † | Not Annualized |
PAST PERFORMANCE IS NOT INDICATIVE OF FUTURE RESULTS.
Performance information may reflect historical or current expense waivers from the investment adviser, without which performance would have been lower. For information on current expense waivers/reimbursements, please see the prospectus.
The value of the contract will fluctuate so that when redeemed, it may be worth more or less than the original investment. The chart and table do not reflect the deduction of taxes that a shareholder would pay on portfolio distributions or the redemption of portfolio shares. The figures do not include sales charges or other fees which may be applied at the variable life insurance, variable annuity or qualified retirement plan product level. Any such additional sales charges or other fees would lower the Fund’s performance.
How did the Fund perform?
The Class IB Shares of the American Funds International HLS Fund returned -13.42% for the six-month period ended June 30, 2010, versus the return of -10.80% for the MSCI All Country World Free ex U.S. Index. The Fund underperformed the -12.51% average return of the Lipper International Core Funds VP-UF peer group, a group of funds with investment strategies similar to those of the Fund.
The performance of the American Funds International HLS Fund is directly related to the performance of the American Funds Insurance Series – International Fund Class 1, in which the Fund invests. The financial statements of the American Funds Insurance Series – International Fund Class 1, including the Schedule of Investments, are provided in the accompanying report and should be read in conjunction with the American Funds International HLS Fund’s financial statements.
American Funds New World HLS Fund inception 4/30/2008
(advised by HL Investment Advisors, LLC)
Investment Goal: Seeks growth of capital over time.
Performance Overview 4/30/08 - 6/30/10
Growth of $10,000 investment

MSCI All Country World Index is a free float-adjusted market capitalization-weighted index that measures equity market performance in the global developed and emerging markets, consisting of 48 developed and emerging market country indices.
MSCI Emerging Markets Index is a free float adjusted market capitalization-weighted index that is designed to measure equity market performance in the global emerging markets, consisting of 24 emerging market country indices.
You cannot invest directly in an index.
The chart represents a hypothetical investment in the Fund. Performance data represents past performance and current performance could be higher or lower.
Average Annual Returns (as of 6/30/10)
| 6 | 1 | Since | ||||
| Month† | Year | Inception | ||||
| American Funds New World HLS Fund IB | -5.40% | 17.82% | -7.37% | |||
| MSCI All Country World Index | -9.11% | 12.30% | -12.65% | |||
| MSCI Emerging Markets Index | -6.04% | 23.48% | -8.87% |
† Not Annualized
PAST PERFORMANCE IS NOT INDICATIVE OF FUTURE RESULTS.
Performance information may reflect historical or current expense waivers from the investment adviser, without which performance would have been lower. For information on current expense waivers/reimbursements, please see the prospectus.
The value of the contract will fluctuate so that when redeemed, it may be worth more or less than the original investment. The chart and table do not reflect the deduction of taxes that a shareholder would pay on portfolio distributions or the redemption of portfolio shares. The figures do not include sales charges or other fees which may be applied at the variable life insurance, variable annuity or qualified retirement plan product level. Any such additional sales charges or other fees would lower the Fund’s performance.
How did the Fund perform?
The Class IB Shares of the American Funds New World HLS Fund returned -5.40% for the six-month period ended June 30, 2010, versus the returns of -9.11% for the MSCI All Country World Index and -6.04% for the MSCI Emerging Markets Index. The Fund outperformed the -6.44% average return of the Lipper Emerging Markets Funds VP-UF peer group, a group of funds with investment strategies similar to those of the Fund.
The performance of the American Funds New World HLS Fund is directly related to the performance of the American Funds Insurance Series – New World Fund Class 1, in which the Fund invests. The financial statements of the American Funds Insurance Series – New World Fund Class 1, including the Schedule of Investments, are provided in the accompanying report and should be read in conjunction with the American Funds New World HLS Fund’s financial statements.
Schedule of Investments
June 30, 2010 (Unaudited)
| (000’s Omitted) |
| Shares | Market Value ╪ | ||||||||
| INVESTMENT COMPANIES - 100.0% | |||||||||
| 3,321 | American Funds Insurance Series - Asset | ||||||||
| Allocation Fund Class I | $ | 46,324 | |||||||
| Total investment companies | |||||||||
| (cost $44,897) | $ | 46,324 | |||||||
| Total investments | |||||||||
| (cost $44,897) ▲ | 100.0 | % | $ | 46,324 | |||||
| Other assets and liabilities | – | % | (6 | ) | |||||
| Total net assets | 100.0 | % | $ | 46,318 | |||||
| Note: | Percentage of investments as shown is the ratio of the total market value to total net assets. |
| ▲ | At June 30, 2010, the cost of securities for federal income tax purposes was $46,105 and the aggregate gross unrealized appreciation and depreciation based on that cost were: |
| Unrealized Appreciation | $ | 219 | ||
| Unrealized Depreciation | — | |||
| Net Unrealized Appreciation | $ | 219 |
| ╪ | See Significant Accounting Policies of accompanying Notes to Financial Statements regarding valuation of securities. |
At June 30, 2010, the investment valuation hierarchy levels were:
| Assets: | ||||
| Investment in Securities - Level 1 | $ | 46,324 | ||
| Total | $ | 46,324 | ||
Schedule of Investments
June 30, 2010 (Unaudited)
| (000’s Omitted) |
| Shares | Market Value ╪ | |||||||||
| INVESTMENT COMPANIES - 100.0% | ||||||||||
| 3,394 | American Funds Insurance Series - Blue | |||||||||
| Chip Income and Growth Fund Class 1 | $ | 26,304 | ||||||||
| Total investment companies | ||||||||||
| (cost $24,398) | $ | 26,304 | ||||||||
| Total investments | ||||||||||
| (cost $24,398) ▲ | 100.0 | % | $ | 26,304 | ||||||
| Other assets and liabilities | – | % | (4 | ) | ||||||
| Total net assets | 100.0 | % | $ | 26,300 | ||||||
| Note: | Percentage of investments as shown is the ratio of the total market value to total net assets. |
| ▲ | At June 30, 2010, the cost of securities for federal income tax purposes was $25,137 and the aggregate gross unrealized appreciation and depreciation based on that cost were: |
| Unrealized Appreciation | $ | 1,167 | ||
| Unrealized Depreciation | — | |||
| Net Unrealized Appreciation | $ | 1,167 |
| ╪ | See Significant Accounting Policies of accompanying Notes to Financial Statements regarding valuation of securities. |
At June 30, 2010, the investment valuation hierarchy levels were:
| Assets: | ||||
| Investment in Securities - Level 1 | $ | 26,304 | ||
| Total | $ | 26,304 | ||
The accompanying notes are an integral part of these financial statements.
Schedule of Investments
June 30, 2010 (Unaudited)
| (000’s Omitted) |
| Shares | Market Value ╪ | |||||||||
| INVESTMENT COMPANIES - 100.0% | ||||||||||
| 19,436 | American Funds Insurance Series - Bond | |||||||||
| Fund Class 1 | $ | 209,128 | ||||||||
| Total investment companies | ||||||||||
| (cost $196,822) | $ | 209,128 | ||||||||
| Total investments | ||||||||||
| (cost $196,822) ▲ | 100.0 | % | $ | 209,128 | ||||||
| Other assets and liabilities | – | % | (17 | ) | ||||||
| Total net assets | 100.0 | % | $ | 209,111 | ||||||
| Note: | Percentage of investments as shown is the ratio of the total market value to total net assets. |
| ▲ | At June 30, 2010, the cost of securities for federal income tax purposes was $197,396 and the aggregate gross unrealized appreciation and depreciation based on that cost were: |
| Unrealized Appreciation | $ | 11,732 | ||
| Unrealized Depreciation | — | |||
| Net Unrealized Appreciation | $ | 11,732 |
| ╪ | See Significant Accounting Policies of accompanying Notes to Financial Statements regarding valuation of securities. |
At June 30, 2010, the investment valuation hierarchy levels were:
| Assets: | ||||
| Investment in Securities - Level 1 | $ | 209,128 | ||
| Total | $ | 209,128 | ||
| Shares | Market Value ╪ | |||||||||
| INVESTMENT COMPANIES - 100.0% | ||||||||||
| 3,258 | American Funds Insurance Series - Global | |||||||||
| Bond Fund Class 1 | $ | 37,269 | ||||||||
| Total investment companies | ||||||||||
| (cost $35,335) | $ | 37,269 | ||||||||
| Total investments | ||||||||||
| (cost $35,335) ▲ | 100.0 | % | $ | 37,269 | ||||||
| Other assets and liabilities | – | % | (4 | ) | ||||||
| Total net assets | 100.0 | % | $ | 37,265 | ||||||
| Note: | Percentage of investments as shown is the ratio of the total market value to total net assets. |
| ▲ | At June 30, 2010, the cost of securities for federal income tax purposes was $35,772 and the aggregate gross unrealized appreciation and depreciation based on that cost were: |
| Unrealized Appreciation | $ | 1,497 | ||
| Unrealized Depreciation | — | |||
| Net Unrealized Appreciation | $ | 1,497 |
| ╪ | See Significant Accounting Policies of accompanying Notes to Financial Statements regarding valuation of securities. |
At June 30, 2010, the investment valuation hierarchy levels were:
| Assets: | ||||
| Investment in Securities - Level 1 | $ | 37,269 | ||
| Total | $ | 37,269 | ||
The accompanying notes are an integral part of these financial statements.
Schedule of Investments
June 30, 2010 (Unaudited)
| (000’s Omitted) |
| Shares | Market Value ╪ | |||||||||
| INVESTMENT COMPANIES - 100.0% | ||||||||||
| 9,394 | American Funds Insurance Series - Global | |||||||||
| Growth and Income Fund Class 1 | $ | 77,687 | ||||||||
| Total investment companies | ||||||||||
| (cost $73,674) | $ | 77,687 | ||||||||
| Total investments | ||||||||||
| (cost $73,674) ▲ | 100.0 | % | $ | 77,687 | ||||||
| Other assets and liabilities | – | % | (5 | ) | ||||||
| Total net assets | 100.0 | % | $ | 77,682 | ||||||
| Note: | Percentage of investments as shown is the ratio of the total market value to total net assets. |
| ▲ | At June 30, 2010, the cost of securities for federal income tax purposes was $74,627 and the aggregate gross unrealized appreciation and depreciation based on that cost were: |
| Unrealized Appreciation | $ | 3,060 | ||
| Unrealized Depreciation | — | |||
| Net Unrealized Appreciation | $ | 3,060 |
| ╪ | See Significant Accounting Policies of accompanying Notes to Financial Statements regarding valuation of securities. |
At June 30, 2010, the investment valuation hierarchy levels were:
| Assets: | ||||
| Investment in Securities - Level 1 | $ | 77,687 | ||
| Total | $ | 77,687 | ||
Schedule of Investments
June 30, 2010 (Unaudited)
| (000’s Omitted) |
| Shares | Market Value ╪ | |||||||||
| INVESTMENT COMPANIES - 100.0% | ||||||||||
| 1,578 | American Funds Insurance Series - Global | |||||||||
| Growth Fund Class 1 | $ | 27,668 | ||||||||
| Total investment companies | ||||||||||
| (cost $26,615) | $ | 27,668 | ||||||||
| Total investments | ||||||||||
| (cost $26,615) ▲ | 100.0 | % | $ | 27,668 | ||||||
| Other assets and liabilities | – | % | (6 | ) | ||||||
| Total net assets | 100.0 | % | $ | 27,662 | ||||||
| Note: | Percentage of investments as shown is the ratio of the total market value to total net assets. |
| ▲ | At June 30, 2010, the cost of securities for federal income tax purposes was $27,764 and the aggregate gross unrealized appreciation and depreciation based on that cost were: |
| Unrealized Appreciation | $ | — | ||
| Unrealized Depreciation | (96 | ) | ||
| Net Unrealized Depreciation | $ | (96 | ) |
| ╪ | See Significant Accounting Policies of accompanying Notes to Financial Statements regarding valuation of securities. |
At June 30, 2010, the investment valuation hierarchy levels were:
| Assets: | ||||
| Investment in Securities - Level 1 | $ | 27,668 | ||
| Total | $ | 27,668 | ||
The accompanying notes are an integral part of these financial statements.
Schedule of Investments
June 30, 2010 (Unaudited)
| (000’s Omitted) |
| Shares | Market Value ╪ | |||||||||
| INVESTMENT COMPANIES - 100.0% | ||||||||||
| 3,334 | American Funds Insurance Series - Global | |||||||||
| Small Capitalization Fund Class 1 | $ | 56,640 | ||||||||
| Total investment companies | ||||||||||
| (cost $46,132) | $ | 56,640 | ||||||||
| Total investments | ||||||||||
| (cost $46,132) ▲ | 100.0 | % | $ | 56,640 | ||||||
| Other assets and liabilities | – | % | (6 | ) | ||||||
| Total net assets | 100.0 | % | $ | 56,634 | ||||||
| Note: | Percentage of investments as shown is the ratio of the total market value to total net assets. |
| ▲ | At June 30, 2010, the cost of securities for federal income tax purposes was $48,202 and the aggregate gross unrealized appreciation and depreciation based on that cost were: |
| Unrealized Appreciation | $ | 8,438 | ||
| Unrealized Depreciation | — | |||
| Net Unrealized Appreciation | $ | 8,438 |
| ╪ | See Significant Accounting Policies of accompanying Notes to Financial Statements regarding valuation of securities. |
At June 30, 2010, the investment valuation hierarchy levels were:
| Assets: | ||||
| Investment in Securities - Level 1 | $ | 56,640 | ||
| Total | $ | 56,640 | ||
| Shares | Market Value ╪ | |||||||||
| INVESTMENT COMPANIES - 100.0% | ||||||||||
| 6,506 | American Funds Insurance Series - Growth | |||||||||
| Fund Class 1 | $ | 285,431 | ||||||||
| Total investment companies | ||||||||||
| (cost $263,902) | $ | 285,431 | ||||||||
| Total investments | ||||||||||
| (cost $263,902) ▲ | 100.0 | % | $ | 285,431 | ||||||
| Other assets and liabilities | – | % | (15 | ) | ||||||
| Total net assets | 100.0 | % | $ | 285,416 | ||||||
| Note: | Percentage of investments as shown is the ratio of the total market value to total net assets. |
| ▲ | At June 30, 2010, the cost of securities for federal income tax purposes was $267,572 and the aggregate gross unrealized appreciation and depreciation based on that cost were: |
| Unrealized Appreciation | $ | 17,859 | ||
| Unrealized Depreciation | — | |||
| Net Unrealized Appreciation | $ | 17,859 |
| ╪ | See Significant Accounting Policies of accompanying Notes to Financial Statements regarding valuation of securities. |
At June 30, 2010, the investment valuation hierarchy levels were:
| Assets: | ||||
| Investment in Securities - Level 1 | $ | 285,431 | ||
| Total | $ | 285,431 | ||
The accompanying notes are an integral part of these financial statements.
Schedule of Investments
June 30, 2010 (Unaudited)
| (000’s Omitted) |
| Shares | Market Value ╪ | |||||||||
| INVESTMENT COMPANIES - 100.0% | ||||||||||
| 5,362 | American Funds Insurance Series - | |||||||||
| Growth-Income Fund Class 1 | $ | 152,719 | ||||||||
| Total investment companies | ||||||||||
| (cost $150,012) | $ | 152,719 | ||||||||
| Total investments | ||||||||||
| (cost $150,012) ▲ | 100.0 | % | $ | 152,719 | ||||||
| Other assets and liabilities | – | % | (14 | ) | ||||||
| Total net assets | 100.0 | % | $ | 152,705 | ||||||
| Note: | Percentage of investments as shown is the ratio of the total market value to total net assets. |
| ▲ | At June 30, 2010, the cost of securities for federal income tax purposes was $150,715 and the aggregate gross unrealized appreciation and depreciation based on that cost were: |
| Unrealized Appreciation | $ | 2,004 | ||
| Unrealized Depreciation | — | |||
| Net Unrealized Appreciation | $ | 2,004 |
| ╪ | See Significant Accounting Policies of accompanying Notes to Financial Statements regarding valuation of securities. |
At June 30, 2010, the investment valuation hierarchy levels were:
| Assets: | ||||
| Investment in Securities - Level 1 | $ | 152,719 | ||
| Total | $ | 152,719 | ||
Schedule of Investments
June 30, 2010 (Unaudited)
| (000’s Omitted) |
| Shares | Market Value ╪ | |||||||||
| INVESTMENT COMPANIES - 100.0% | ||||||||||
| 12,940 | American Funds Insurance Series - | |||||||||
| International Fund Class 1 | $ | 191,382 | ||||||||
| Total investment companies | ||||||||||
| (cost $189,631) | $ | 191,382 | ||||||||
| Total investments | ||||||||||
| (cost $189,631) ▲ | 100.0 | % | $ | 191,382 | ||||||
| Other assets and liabilities | – | % | (9 | ) | ||||||
| Total net assets | 100.0 | % | $ | 191,373 | ||||||
| Note: | Percentage of investments as shown is the ratio of the total market value to total net assets. |
| ▲ | At June 30, 2010, the cost of securities for federal income tax purposes was $193,576 and the aggregate gross unrealized appreciation and depreciation based on that cost were: |
| Unrealized Appreciation | $ | — | ||
| Unrealized Depreciation | (2,194 | ) | ||
| Net Unrealized Depreciation | $ | (2,194 | ) |
| ╪ | See Significant Accounting Policies of accompanying Notes to Financial Statements regarding valuation of securities. |
At June 30, 2010, the investment valuation hierarchy levels were:
| Assets: | ||||
| Investment in Securities - Level 1 | $ | 191,382 | ||
| Total | $ | 191,382 | ||
The accompanying notes are an integral part of these financial statements.
Schedule of Investments
June 30, 2010 (Unaudited)
| (000’s Omitted) |
| Shares | Market Value ╪ | |||||||||
| INVESTMENT COMPANIES - 100.0% | ||||||||||
| 2,823 | American Funds Insurance Series - New | |||||||||
| World Fund Class 1 | $ | 53,377 | ||||||||
| Total investment companies | ||||||||||
| (cost $46,629) | $ | 53,377 | ||||||||
| Total investments | ||||||||||
| (cost $46,629) ▲ | 100.0 | % | $ | 53,377 | ||||||
| Other assets and liabilities | – | % | (3 | ) | ||||||
| Total net assets | 100.0 | % | $ | 53,374 | ||||||
| Note: | Percentage of investments as shown is the ratio of the total market value to total net assets. |
| ▲ | At June 30, 2010, the cost of securities for federal income tax purposes was $48,384 and the aggregate gross unrealized appreciation and depreciation based on that cost were: |
| Unrealized Appreciation | $ | 4,993 | ||
| Unrealized Depreciation | — | |||
| Net Unrealized Appreciation | $ | 4,993 |
| ╪ | See Significant Accounting Policies of accompanying Notes to Financial Statements regarding valuation of securities. |
At June 30, 2010, the investment valuation hierarchy levels were:
| Assets: | ||||
| Investment in Securities - Level 1 | $ | 53,377 | ||
| Total | $ | 53,377 | ||
The accompanying notes are an integral part of these financial statements.
[This page is intentionally left blank]
Hartford Series Fund, Inc. |
June 30, 2010 (Unaudited)
(000’s Omitted) |
| American Funds | ||||||||||||
| Blue Chip | ||||||||||||
| American Funds | Income and | American Funds | ||||||||||
| Asset Allocation | Growth | Bond | ||||||||||
HLS Fund | HLS Fund | HLS Fund | ||||||||||
| Assets: | ||||||||||||
| Investments in securities, at market value @ | $ | 46,324 | $ | 26,304 | $ | 209,128 | ||||||
| Receivables: | ||||||||||||
| Investment securities sold | 34 | — | — | |||||||||
| Fund shares sold | 15 | 13 | 503 | |||||||||
| Other assets | 7 | 5 | 20 | |||||||||
| Total assets | 46,380 | 26,322 | 209,651 | |||||||||
| Liabilities: | ||||||||||||
| Payables: | ||||||||||||
| Investment securities purchased | — | 11 | 477 | |||||||||
| Fund shares redeemed | 49 | 2 | 26 | |||||||||
| Investment management fees | 7 | 4 | 23 | |||||||||
| Distribution fees | 3 | 2 | 11 | |||||||||
| Accrued expenses | 3 | 3 | 3 | |||||||||
| Total liabilities | 62 | 22 | 540 | |||||||||
| Net assets | $ | 46,318 | $ | 26,300 | $ | 209,111 | ||||||
| Summary of Net Assets: | ||||||||||||
| Capital stock and paid-in-capital | $ | 45,499 | $ | 24,895 | $ | 192,372 | ||||||
| Accumulated undistributed net investment income | 948 | 449 | 5,284 | |||||||||
| Accumulated net realized loss on investments | (1,556 | ) | (950 | ) | (851 | ) | ||||||
| Unrealized appreciation of investments | 1,427 | 1,906 | 12,306 | |||||||||
| Net assets | $ | 46,318 | $ | 26,300 | $ | 209,111 | ||||||
| Shares authorized | 200,000 | 200,000 | 200,000 | |||||||||
| Par value | $ | 0.001 | $ | 0.001 | $ | 0.001 | ||||||
Class IB: Net asset value per share | $ | 8.38 | $ | 7.81 | $ | 10.28 | ||||||
| Shares outstanding | 5,525 | 3,365 | 20,338 | |||||||||
| Net assets | $ | 46,318 | $ | 26,300 | $ | 209,111 | ||||||
| @ Cost of securities | $ | 44,897 | $ | 24,398 | $ | 196,822 | ||||||
The accompanying notes are an integral part of these financial statements.
| American Funds | American Funds | |||||||||||||||||||||||||||||
| American Funds | Global Growth | American Funds | Global Small | American Funds | American Funds | American Funds | American Funds | |||||||||||||||||||||||
| Global Bond | and Income | Global Growth | Capitalization | Growth | Growth-Income | International | New World | |||||||||||||||||||||||
HLS Fund | HLS Fund | HLS Fund | HLS Fund | HLS Fund | HLS Fund | HLS Fund | HLS Fund | |||||||||||||||||||||||
| $ | 37,269 | $ | 77,687 | $ | 27,668 | $ | 56,640 | $ | 285,431 | $ | 152,719 | $ | 191,382 | $ | 53,377 | |||||||||||||||
| — | — | — | — | — | — | 161 | — | |||||||||||||||||||||||
| 16 | 57 | 16 | 89 | 208 | 172 | 105 | 95 | |||||||||||||||||||||||
| 8 | 17 | 6 | 11 | 55 | 23 | 43 | 17 | |||||||||||||||||||||||
| 37,293 | 77,761 | 27,690 | 56,740 | 285,694 | 152,914 | 191,691 | 53,489 | |||||||||||||||||||||||
| 11 | 53 | 13 | 80 | 140 | 151 | — | 83 | |||||||||||||||||||||||
| 5 | 4 | 3 | 10 | 68 | 21 | 266 | 13 | |||||||||||||||||||||||
| 6 | 14 | 6 | 10 | 49 | 24 | 37 | 13 | |||||||||||||||||||||||
| 2 | 4 | 2 | 3 | 17 | 9 | 11 | 3 | |||||||||||||||||||||||
| 4 | 4 | 4 | 3 | 4 | 4 | 4 | 3 | |||||||||||||||||||||||
| 28 | 79 | 28 | 106 | 278 | 209 | 318 | 115 | |||||||||||||||||||||||
| $ | 37,265 | $ | 77,682 | $ | 27,662 | $ | 56,634 | $ | 285,416 | $ | 152,705 | $ | 191,373 | $ | 53,374 | |||||||||||||||
| $ | 35,100 | $ | 74,176 | $ | 27,799 | $ | 47,889 | $ | 270,816 | $ | 152,551 | $ | 190,323 | $ | 48,216 | |||||||||||||||
| 496 | 2,075 | 332 | 651 | 58 | 221 | 3,145 | 720 | |||||||||||||||||||||||
| (265 | ) | (2,582 | ) | (1,522 | ) | (2,414 | ) | (6,987 | ) | (2,774 | ) | (3,846 | ) | (2,310 | ) | |||||||||||||||
| 1,934 | 4,013 | 1,053 | 10,508 | 21,529 | 2,707 | 1,751 | 6,748 | |||||||||||||||||||||||
| $ | 37,265 | $ | 77,682 | $ | 27,662 | $ | 56,634 | $ | 285,416 | $ | 152,705 | $ | 191,373 | $ | 53,374 | |||||||||||||||
| 200,000 | 200,000 | 200,000 | 200,000 | 200,000 | 200,000 | 200,000 | 200,000 | |||||||||||||||||||||||
| $ | 0.001 | $ | 0.001 | $ | 0.001 | $ | 0.001 | $ | 0.001 | $ | 0.001 | $ | 0.001 | $ | 0.001 | |||||||||||||||
| $ | 10.38 | $ | 7.55 | $ | 7.90 | $ | 7.76 | $ | 7.51 | $ | 7.45 | $ | 7.36 | $ | 8.32 | |||||||||||||||
| 3,590 | 10,285 | 3,499 | 7,300 | 37,993 | 20,500 | 26,018 | 6,413 | |||||||||||||||||||||||
| $ | 37,265 | $ | 77,682 | $ | 27,662 | $ | 56,634 | $ | 285,416 | $ | 152,705 | $ | 191,373 | $ | 53,374 | |||||||||||||||
| $ | 35,335 | $ | 73,674 | $ | 26,615 | $ | 46,132 | $ | 263,902 | $ | 150,012 | $ | 189,631 | $ | 46,629 | |||||||||||||||
The accompanying notes are an integral part of these financial statements.
| Hartford Series Fund, Inc. |
For the Six-Month Period Ended June 30, 2010 (Unaudited)
(000’s Omitted) |
| American Funds | ||||||||||||
| Blue Chip | ||||||||||||
| American Funds | Income and | American Funds | ||||||||||
| Asset Allocation | Growth | Bond | ||||||||||
HLS Fund | HLS Fund | HLS Fund | ||||||||||
| Investment Income: | ||||||||||||
| Dividends from underlying funds | $ | 199 | $ | 88 | $ | 1,193 | ||||||
| Total investment income | 199 | 88 | 1,193 | |||||||||
| Expenses: | ||||||||||||
| Investment management fees | 158 | 107 | 492 | |||||||||
| Distribution fees - Class IB | 61 | 36 | 246 | |||||||||
| Custodian fees | — | — | 1 | |||||||||
| Accounting services fees | 3 | 1 | 10 | |||||||||
| Board of Directors' fees | 1 | 1 | 2 | |||||||||
| Audit fees | 3 | 3 | 3 | |||||||||
| Other expenses | 2 | 3 | 25 | |||||||||
| Total expenses (before waivers) | 228 | 151 | 779 | |||||||||
| Expense waivers | (97 | ) | (71 | ) | (246 | ) | ||||||
| Total waivers | (97 | ) | (71 | ) | (246 | ) | ||||||
| Total expenses, net | 131 | 80 | 533 | |||||||||
| Net investment income (loss) | 68 | 8 | 660 | |||||||||
| Net Realized Gain (Loss) on Investments: | ||||||||||||
| Net realized gain (loss) on investments in underlying funds | (348 | ) | (211 | ) | (276 | ) | ||||||
| Net Changes in Unrealized Appreciation of Investments: | ||||||||||||
| Net unrealized appreciation (depreciation) of investments | (2,286 | ) | (1,906 | ) | 8,304 | |||||||
| Net Gain (Loss) on Investments | (2,634 | ) | (2,117 | ) | 8,028 | |||||||
| Net Increase (Decrease) in Net Assets Resulting from Operations | $ | (2,566 | ) | $ | (2,109 | ) | $ | 8,688 | ||||
The accompanying notes are an integral part of these financial statements.
| American Funds | American Funds | |||||||||||||||||||||||||||||
| American Funds | Global Growth | American Funds | Global Small | American Funds | American Funds | American Funds | American Funds | |||||||||||||||||||||||
| Global Bond | and Income | Global Growth | Capitalization | Growth | Growth-Income | International | New World | |||||||||||||||||||||||
HLS Fund | HLS Fund | HLS Fund | HLS Fund | HLS Fund | HLS Fund | HLS Fund | HLS Fund | |||||||||||||||||||||||
| $ | 198 | $ | 707 | $ | 130 | $ | 813 | $ | 681 | $ | 517 | $ | 1,589 | $ | 291 | |||||||||||||||
| 198 | 707 | 130 | 813 | 681 | 517 | 1,589 | 291 | |||||||||||||||||||||||
| 143 | 342 | 151 | 246 | 1,140 | 588 | 847 | 316 | |||||||||||||||||||||||
| 48 | 107 | 38 | 77 | 380 | 210 | 249 | 72 | |||||||||||||||||||||||
| — | — | — | — | — | 1 | — | 1 | |||||||||||||||||||||||
| 2 | 4 | 1 | 3 | 15 | 9 | 10 | 3 | |||||||||||||||||||||||
| 1 | 2 | 1 | 1 | 3 | 2 | 2 | 1 | |||||||||||||||||||||||
| 3 | 3 | 3 | 3 | 4 | 3 | 3 | 3 | |||||||||||||||||||||||
| 3 | 3 | 2 | 10 | 29 | 13 | 27 | 2 | |||||||||||||||||||||||
| 200 | 461 | 196 | 340 | 1,571 | 826 | 1,138 | 398 | |||||||||||||||||||||||
| (95 | ) | (235 | ) | (113 | ) | (169 | ) | (760 | ) | (378 | ) | (597 | ) | (245 | ) | |||||||||||||||
| (95 | ) | (235 | ) | (113 | ) | (169 | ) | (760 | ) | (378 | ) | (597 | ) | (245 | ) | |||||||||||||||
| 105 | 226 | 83 | 171 | 811 | 448 | 541 | 153 | |||||||||||||||||||||||
| 93 | 481 | 47 | 642 | (130 | ) | 69 | 1,048 | 138 | ||||||||||||||||||||||
| 141 | (1,630 | ) | (373 | ) | (344 | ) | (3,318 | ) | (2,071 | ) | (615 | ) | (554 | ) | ||||||||||||||||
| (586 | ) | (6,784 | ) | (2,928 | ) | (2,937 | ) | (13,523 | ) | (13,424 | ) | (29,743 | ) | (2,716 | ) | |||||||||||||||
| (445 | ) | (8,414 | ) | (3,301 | ) | (3,281 | ) | (16,841 | ) | (15,495 | ) | (30,358 | ) | (3,270 | ) | |||||||||||||||
| $ | (352 | ) | $ | (7,933 | ) | $ | (3,254 | ) | $ | (2,639 | ) | $ | (16,971 | ) | $ | (15,426 | ) | $ | (29,310 | ) | $ | (3,132 | ) | |||||||
The accompanying notes are an integral part of these financial statements.
| Hartford Series Fund, Inc. |
(000's Omitted) |
| American Funds | American Funds | |||||||||||||||
| Asset Allocation | Blue Chip Income and Growth | |||||||||||||||
| HLS Fund | HLS Fund | |||||||||||||||
| For the | For the | |||||||||||||||
| Six-Month | For the | Six-Month | For the | |||||||||||||
| Period Ended | Year Ended | Period Ended | Year Ended | |||||||||||||
| June 30, 2010 | December 31, | June 30, 2010 | December 31, | |||||||||||||
| (Unaudited) | 2009 | (Unaudited) | 2009 | |||||||||||||
| Operations: | ||||||||||||||||
| Net investment income | $ | 68 | $ | 880 | $ | 8 | $ | 441 | ||||||||
| Net realized gain (loss) on investments | (348 | ) | (1,208 | ) | (211 | ) | (629 | ) | ||||||||
| Net unrealized appreciation (depreciation) of investments | (2,286 | ) | 9,237 | (1,906 | ) | 6,730 | ||||||||||
| Net increase (decrease) in net assets resulting from operations | (2,566 | ) | 8,909 | (2,109 | ) | 6,542 | ||||||||||
| Distributions to Shareholders: | ||||||||||||||||
| From net investment income | ||||||||||||||||
| Class IB | — | (708 | ) | — | (304 | ) | ||||||||||
| From net realized gain on investments | ||||||||||||||||
| Class IB | — | (172 | ) | — | (134 | ) | ||||||||||
| Total distributions | — | (880 | ) | — | (438 | ) | ||||||||||
| Capital Share Transactions: | ||||||||||||||||
| Class IB | ||||||||||||||||
| Sold | 4,033 | 19,805 | 2,357 | 12,256 | ||||||||||||
| Issued on reinvestment of distributions | — | 880 | — | 438 | ||||||||||||
| Redeemed | (3,717 | ) | (6,458 | ) | (2,978 | ) | (2,950 | ) | ||||||||
| Net increase (decrease) from capital share transactions | 316 | 14,227 | (621 | ) | 9,744 | |||||||||||
| Net increase (decrease) in net assets | (2,250 | ) | 22,256 | (2,730 | ) | 15,848 | ||||||||||
| Net Assets: | ||||||||||||||||
| Beginning of period | 48,568 | 26,312 | 29,030 | 13,182 | ||||||||||||
| End of period | $ | 46,318 | $ | 48,568 | $ | 26,300 | $ | 29,030 | ||||||||
| Accumulated undistributed (distribution in excess of) net investment income | $ | 948 | $ | 880 | $ | 449 | $ | 441 | ||||||||
| Shares: | ||||||||||||||||
| Class IB | ||||||||||||||||
| Sold | 457 | 2,619 | 278 | 1,842 | ||||||||||||
| Issued on reinvestment of distributions | — | 107 | — | 57 | ||||||||||||
| Redeemed | (419 | ) | (838 | ) | (354 | ) | (415 | ) | ||||||||
| Total share activity | 38 | 1,888 | (76 | ) | 1,484 | |||||||||||
The accompanying notes are an integral part of these financial statements.
| American Funds | American Funds | American Funds | American Funds | |||||||||||||||||||||||||||
| Bond | Global Bond | Global Growth and Income | Global Growth | |||||||||||||||||||||||||||
| HLS Fund | HLS Fund | HLS Fund | HLS Fund | |||||||||||||||||||||||||||
| For the | For the | For the | For the | |||||||||||||||||||||||||||
| Six-Month | For the | Six-Month | For the | Six-Month | For the | Six-Month | For the | |||||||||||||||||||||||
| Period Ended | Year Ended | Period Ended | Year Ended | Period Ended | Year Ended | Period Ended | Year Ended | |||||||||||||||||||||||
| June 30, 2010 | December 31, | June 30, 2010 | December 31, | June 30, 2010 | December 31, | June 30, 2010 | December 31, | |||||||||||||||||||||||
| (Unaudited) | 2009 | (Unaudited) | 2009 | (Unaudited) | 2009 | (Unaudited) | 2009 | |||||||||||||||||||||||
| $ | 660 | $ | 4,624 | $ | 93 | $ | 403 | $ | 481 | $ | 1,594 | $ | 47 | $ | 285 | |||||||||||||||
| (276 | ) | (328 | ) | 141 | (15 | ) | (1,630 | ) | (935 | ) | (373 | ) | (1,113 | ) | ||||||||||||||||
| 8,304 | 9,960 | (586 | ) | 2,709 | (6,784 | ) | 24,092 | (2,928 | ) | 9,500 | ||||||||||||||||||||
| 8,688 | 14,256 | (352 | ) | 3,097 | (7,933 | ) | 24,751 | (3,254 | ) | 8,672 | ||||||||||||||||||||
| — | (3,303 | ) | — | (966 | ) | — | (1,283 | ) | — | (408 | ) | |||||||||||||||||||
| — | (8 | ) | — | — | — | (23 | ) | — | (349 | ) | ||||||||||||||||||||
| — | (3,311 | ) | — | (966 | ) | — | (1,306 | ) | — | (757 | ) | |||||||||||||||||||
| 30,688 | 109,784 | 4,923 | 17,624 | 4,908 | 25,994 | 3,166 | 11,058 | |||||||||||||||||||||||
| — | 3,311 | — | 966 | — | 1,306 | — | 757 | |||||||||||||||||||||||
| (11,815 | ) | (10,087 | ) | (5,839 | ) | (4,574 | ) | (8,055 | ) | (6,048 | ) | (2,707 | ) | (4,763 | ) | |||||||||||||||
| 18,873 | 103,008 | (916 | ) | 14,016 | (3,147 | ) | 21,252 | 459 | 7,052 | |||||||||||||||||||||
| 27,561 | 113,953 | (1,268 | ) | 16,147 | (11,080 | ) | 44,697 | (2,795 | ) | 14,967 | ||||||||||||||||||||
| 181,550 | 67,597 | 38,533 | 22,386 | 88,762 | 44,065 | 30,457 | 15,490 | |||||||||||||||||||||||
| $ | 209,111 | $ | 181,550 | $ | 37,265 | $ | 38,533 | $ | 77,682 | $ | 88,762 | $ | 27,662 | $ | 30,457 | |||||||||||||||
| $ | 5,284 | $ | 4,624 | $ | 496 | $ | 403 | $ | 2,075 | $ | 1,594 | $ | 332 | $ | 285 | |||||||||||||||
| 3,062 | 11,643 | 469 | 1,765 | 597 | 4,119 | 367 | 1,566 | |||||||||||||||||||||||
| — | 346 | — | 95 | — | 177 | — | 94 | |||||||||||||||||||||||
| (1,174 | ) | (1,067 | ) | (559 | ) | (453 | ) | (1,009 | ) | (874 | ) | (318 | ) | (629 | ) | |||||||||||||||
| 1,888 | 10,922 | (90 | ) | 1,407 | (412 | ) | 3,422 | 49 | 1,031 | |||||||||||||||||||||
The accompanying notes are an integral part of these financial statements
| Hartford Series Fund, Inc. |
Statements of Changes in Net Assets – (continued)
| (000's Omitted) |
| American Funds | American Funds | |||||||||||||||
| Global Small Capitalization | Growth | |||||||||||||||
| HLS Fund | HLS Fund | |||||||||||||||
| For the | For the | |||||||||||||||
| Six-Month | For the | Six-Month | For the | |||||||||||||
| Period Ended | Year Ended | Period Ended | Year Ended | |||||||||||||
| June 30, 2010 | December 31, | June 30, 2010 | December 31, | |||||||||||||
| (Unaudited) | 2009 | (Unaudited) | 2009 | |||||||||||||
| Operations: | ||||||||||||||||
| Net investment income (loss) | $ | 642 | $ | 9 | $ | (130 | ) | $ | 988 | |||||||
| Net realized loss on investments | (344 | ) | (2,053 | ) | (3,318 | ) | (3,610 | ) | ||||||||
| Net unrealized appreciation (depreciation) of investments | (2,937 | ) | 21,509 | (13,523 | ) | 78,080 | ||||||||||
| Net increase (decrease) in net assets resulting from operations | (2,639 | ) | 19,465 | (16,971 | ) | 75,458 | ||||||||||
| Distributions to Shareholders: | ||||||||||||||||
| From net investment income | ||||||||||||||||
| Class IB | — | (27 | ) | — | (1,044 | ) | ||||||||||
| From net realized gain on investments | ||||||||||||||||
| Class IB | — | (355 | ) | — | (2,508 | ) | ||||||||||
| Total distributions | — | (382 | ) | — | (3,552 | ) | ||||||||||
| Capital Share Transactions: | ||||||||||||||||
| Class IB | ||||||||||||||||
| Sold | 6,916 | 29,463 | 22,228 | 115,449 | ||||||||||||
| Issued on reinvestment of distributions | — | 382 | — | 3,552 | ||||||||||||
| Redeemed | (9,162 | ) | (7,216 | ) | (16,500 | ) | (17,136 | ) | ||||||||
| Net increase (decrease) from capital share transactions | (2,246 | ) | 22,629 | 5,728 | 101,865 | |||||||||||
| Net increase (decrease) in net assets | (4,885 | ) | 41,712 | (11,243 | ) | 173,771 | ||||||||||
| Net Assets: | ||||||||||||||||
| Beginning of period | 61,519 | 19,807 | 296,659 | 122,888 | ||||||||||||
| End of period | $ | 56,634 | $ | 61,519 | $ | 285,416 | $ | 296,659 | ||||||||
| Accumulated undistributed (distribution in excess of) net investment income | $ | 651 | $ | 9 | $ | 58 | $ | 188 | ||||||||
| Shares: | ||||||||||||||||
| Class IB | ||||||||||||||||
| Sold | 838 | 4,682 | 2,753 | 18,078 | ||||||||||||
| Issued on reinvestment of distributions | — | 53 | — | 483 | ||||||||||||
| Redeemed | (1,105 | ) | (1,055 | ) | (2,040 | ) | (2,450 | ) | ||||||||
| Total share activity | (267 | ) | 3,680 | 713 | 16,111 | |||||||||||
The accompanying notes are an integral part of these financial statements
| American Funds | American Funds | American Funds | ||||||||||||||||||||
| Growth-Income | International | New World | ||||||||||||||||||||
| HLS Fund | HLS Fund | HLS Fund | ||||||||||||||||||||
| For the | For the | For the | ||||||||||||||||||||
| Six-Month | For the | Six-Month | For the | Six-Month | For the | |||||||||||||||||
| Period Ended | Year Ended | Period Ended | Year Ended | Period Ended | Year Ended | |||||||||||||||||
| June 30, 2010 | December 31, | June 30, 2010 | December 31, | June 30, 2010 | December 31, | |||||||||||||||||
| (Unaudited) | 2009 | (Unaudited) | 2009 | (Unaudited) | 2009 | |||||||||||||||||
| $ | 69 | $ | 1,902 | $ | 1,048 | $ | 2,097 | $ | 138 | $ | 582 | |||||||||||
| (2,071 | ) | (660 | ) | (615 | ) | (3,055 | ) | (554 | ) | (1,702 | ) | |||||||||||
| (13,424 | ) | 36,393 | (29,743 | ) | 53,947 | (2,716 | ) | 17,641 | ||||||||||||||
| (15,426 | ) | 37,635 | (29,310 | ) | 52,989 | (3,132 | ) | 16,521 | ||||||||||||||
| — | (2,102 | ) | — | (2,217 | ) | — | (495 | ) | ||||||||||||||
| — | (849 | ) | — | (1,535 | ) | — | (336 | ) | ||||||||||||||
| — | (2,951 | ) | — | (3,752 | ) | — | (831 | ) | ||||||||||||||
| 11,180 | 66,615 | 29,412 | 80,354 | 6,404 | 24,600 | |||||||||||||||||
| — | 2,951 | — | 3,752 | — | 831 | |||||||||||||||||
| (11,739 | ) | (9,599 | ) | (5,987 | ) | (14,910 | ) | (8,476 | ) | (6,476 | ) | |||||||||||
| (559 | ) | 59,967 | 23,425 | 69,196 | (2,072 | ) | 18,955 | |||||||||||||||
| (15,985 | ) | 94,651 | (5,885 | ) | 118,433 | (5,204 | ) | 34,645 | ||||||||||||||
| 168,690 | 74,039 | 197,258 | 78,825 | 58,578 | 23,933 | |||||||||||||||||
| $ | 152,705 | $ | 168,690 | $ | 191,373 | $ | 197,258 | $ | 53,374 | $ | 58,578 | |||||||||||
| $ | 221 | $ | 152 | $ | 3,145 | $ | 2,097 | $ | 720 | $ | 582 | |||||||||||
| 1,364 | 9,935 | 3,565 | 11,739 | 733 | 3,453 | |||||||||||||||||
| — | 375 | — | 483 | — | 106 | |||||||||||||||||
| (1,434 | ) | (1,329 | ) | (766 | ) | (1,946 | ) | (978 | ) | (888 | ) | |||||||||||
| (70 | ) | 8,981 | 2,799 | 10,276 | (245 | ) | 2,671 | |||||||||||||||
The accompanying notes are an integral part of these financial statements
| Hartford Series Fund, Inc. |
June 30, 2010 (Unaudited)
| (000’s Omitted) |
| 1. | Organization: |
The Hartford HLS Funds serve as underlying investment options for certain variable annuity and variable life insurance separate accounts of Hartford Life Insurance Company (“HLIC”) and its affiliates and certain qualified retirement plans. Certain Hartford HLS Funds may also serve as underlying investment options for certain variable annuity and variable life separate accounts of other insurance companies. Owners of variable annuity contracts and policyholders of variable life insurance contracts may choose the funds permitted in the variable insurance contract prospectus. In addition, participants in certain qualified retirement plans may choose the funds permitted by their plans.
Hartford Series Fund, Inc. (the “Company”) is an open-end management investment company comprised of twenty-nine portfolios, eleven portfolios of which are included in these financial statements (each a “Fund” or together the “Funds”). They are American Funds Asset Allocation HLS Fund, American Funds Blue Chip Income and Growth HLS Fund, American Funds Bond HLS Fund, American Funds Global Bond HLS Fund, American Funds Global Growth and Income HLS Fund, American Funds Global Growth HLS Fund, American Funds Global Small Capitalization HLS Fund, American Funds Growth HLS Fund, American Funds Growth-Income HLS Fund, American Funds International HLS Fund and American Funds New World HLS Fund.
The Company is organized under the laws of the State of Maryland and is registered with the Securities and Exchange Commission (“SEC”) under the Investment Company Act of 1940, as amended (“1940 Act”). Each Fund is organized as a diversified open-end management investment company, except for American Funds Global Bond HLS Fund, which is non-diversified.
The Funds operate in the manner of fund of funds, investing in shares of underlying mutual funds (the “Underlying Funds”). Each Underlying Fund is offered by American Funds Insurance Series, and is a registered open-end investment company. The Funds and their related Underlying Funds are listed below:
| Fund | Underlying Fund | |
| American Funds Asset Allocation HLS Fund | Asset Allocation Fund Class 1 | |
| American Funds Blue Chip Income and Growth HLS Fund | Blue Chip Income and Growth Fund Class 1 | |
| American Funds Bond HLS Fund | Bond Fund Class 1 | |
| American Funds Global Bond HLS Fund | Global Bond Fund Class 1 | |
| American Funds Global Growth and Income HLS Fund | Global Growth and Income Fund Class 1 | |
| American Funds Global Growth HLS Fund | Global Growth Fund Class 1 | |
| American Funds Global Small Capitalization HLS Fund | Global Small Capitalization Fund Class 1 | |
| American Funds Growth HLS Fund | Growth Fund Class 1 | |
| American Funds Growth-Income HLS Fund | Growth-Income Fund Class 1 | |
| American Funds International HLS Fund | International Fund Class 1 | |
| American Funds New World HLS Fund | New World Fund Class 1 |
The Underlying Funds’ accounting policies are outlined in the Underlying Funds’ most current annual or semiannual report, which accompanies this report.
Class IB shares of the Funds are offered at the per share net asset value (“NAV”) without a sales charge and are subject to distribution fees charged pursuant to a Distribution and Service Plan. The Distribution and Service Plan has been adopted in accordance with Rule 12b-1 under the 1940 Act.
| 2. | Significant Accounting Policies: |
The following is a summary of significant accounting policies of the Funds, which are in accordance with U.S. Generally Accepted Accounting Principles (“GAAP”).
| a) | Security Transactions and Investment Income – Security transactions are recorded on the trade date (the date the order to buy or sell is executed). Security gains and losses are determined on the basis of identified cost. |
Income and capital gain distributions from Underlying Funds are recorded on the ex-dividend date.
| b) | Security Valuation – Investments in the Underlying Funds are valued at the respective NAV of each Underlying Fund at the close of the New York Stock Exchange (the “Exchange”) (generally 4:00 p.m., Eastern Time, referred to as the “Valuation Time”) on the valuation date. Valuation of securities held by the Underlying Funds is discussed in Notes to Financial Statements of the Underlying Funds, which are included in the Underlying Funds’ annual or semi-annual report, accompanying this report. |
Various inputs can be used in determining the value of the Fund’s investments. These inputs are summarized into three broad hierarchy levels. This hierarchy is based on whether the valuation inputs are observable or unobservable. These levels are:
| • | Level 1 – Quoted prices in active markets for identical securities. Level 1 may include exchange-traded instruments such as domestic equities, some foreign equities, options, futures, mutual funds, ETF’s, and rights and warrants. |
| • | Level 2 – Observable inputs other than Level 1 prices, such as quoted prices for similar securities; quoted prices in markets that are not active; or other inputs that are observable or can be corroborated by observable market data for substantially the full term of the security. Level 2 may include debt securities that are traded less frequently than exchange-traded instruments and that are valued using third party pricing services; foreign equities, whose value is determined using a multi-factor regression model with inputs that are observable in the market; and money market instruments, which are carried at amortized cost. |
| • | Level 3 – Significant unobservable inputs that are supported by little or no market activity. Level 3 may include financial instruments whose values are determined using broker quotes or require significant management judgment or estimation. These unobservable valuation inputs may include estimates for current yields, maturity/duration, prepayment speed, and broker quotes for comparable securities along with other assumptions relating to credit quality, collateral value, complexity of the security structure, general market conditions and liquidity. This category may include securities where trading has been halted or there are certain restrictions on trading. While these securities are priced using unobservable inputs, the valuation of these securities reflects the best available data and management believes the prices are a reasonable representation of exit price. |
Individual securities within any of the above mentioned asset classes may be assigned a different hierarchical level than those presented above, as individual circumstances dictate.
During the six-month period ended June 30, 2010, the Funds held no Level 3 securities, therefore no reconciliation of Level 3 securities is presented.
Refer to the Investment Valuation Hierarchy Level Summary found following the Schedule of Investments of each Fund.
c) | Fund Share Valuation and Dividend Distributions to Shareholders – Orders for the Funds’ shares are executed in accordance with the investment instructions of the contract holders. The NAV of each Fund’s shares is determined as of |
| Hartford Series Fund, Inc. |
Notes to Financial Statements – (continued)
June 30, 2010 (Unaudited)
| (000’s Omitted) |
| the close of each business day of the Exchange. The NAV is determined for each Fund by dividing the Fund’s net assets by the number of shares outstanding. Orders for the purchase of a Fund’s shares received by an insurance company prior to the close of the Exchange on any day on which the Exchange is open for business are priced at the NAV determined as of the close of the Exchange. Orders received by an insurance company after the close of the Exchange, or on a day on which the Exchange and/or the Fund is not open for business, are priced at the next determined NAV. |
Dividends are declared pursuant to a policy adopted by the Funds’ Board of Directors based upon the investment performance of the Funds. The policy of all Funds is to pay dividends from net investment income and distribute realized capital gains, if any, at least once a year.
Distributions from net investment income, realized capital gains and capital are determined in accordance with federal income tax regulations, which may differ from U.S. GAAP with respect to character and timing. These differences may include but are not limited to losses deferred due to wash sale adjustments and short-term capital gain adjustments. Permanent book and federal income tax basis differences relating to shareholder distributions will result in reclassifications to certain of the Funds’ capital accounts (see Federal Income Taxes: Reclassification of Capital Accounts note).
| d) | Use of Estimates – The preparation of financial statements in conformity with U.S. GAAP requires management to make estimates and assumptions that affect the reported amounts of assets and liabilities as of the date of the financial statements and the reported amounts of income and expenses during the period. Operating results in the future could vary from the amounts derived from management’s estimates. |
| e) | Indemnifications – Under the Company’s organizational documents, the Company shall indemnify its officers and directors to the full extent required or permitted under Maryland General Corporate Law and the federal securities laws. In addition, the Company, on behalf of the Funds, may enter into contracts that contain a variety of indemnifications. The Company’s maximum exposure under these arrangements is unknown. However, the Company has not had prior claims or losses pursuant to these contracts and expects the risk of loss to be remote. |
| 3. | Federal Income Taxes: |
| a) | Federal Income Taxes – For federal income tax purposes, the Funds intend to qualify as regulated investment companies (“RICs”) under Subchapter M of the Internal Revenue Code (“IRC”) by distributing substantially all of their taxable net investment income and net realized capital gains to their shareholders and otherwise complying with the requirements of RICs. The Funds have distributed substantially all of their income and capital gains in the prior year and each Fund intends to distribute substantially all of its income and gains prior to the next fiscal year end. Accordingly, no provision for federal income or excise taxes has been made in the accompanying financial statements. Distributions from short-term capital gains are treated as ordinary income distributions for federal income tax purposes. |
| b) | Net Investment Income (Loss), Net Realized Gains (Losses) – Net investment income (loss) and net realized gains (losses) may differ for financial statement and tax purposes primarily because of losses deferred due to wash sale adjustments and short-term capital gain adjustments. The character of distributions made during the year from net investment income or net realized gains may differ from their ultimate characterization for federal income tax purposes. Also, due to the timing of dividend distributions, the fiscal year in which amounts are distributed may differ from the year that the net investment income (loss) or net realized gains (losses) were recorded by a Fund. |
| c) | Distributions and Components of Distributable Earnings – The tax character of distributions paid by the Funds for the periods indicated is as follows (as adjusted for dividends payable): |
| For the Period April 30, | ||||||||||||||||||||||||
| 2008 (Commencement of | ||||||||||||||||||||||||
| For the Year Ended | Operations) through | |||||||||||||||||||||||
| December 31, 2009 | December 31, 2008 | |||||||||||||||||||||||
| Long- | Tax | Long- | Tax | |||||||||||||||||||||
| Term | return | Term | return | |||||||||||||||||||||
| Ordinary | Capital | of | Ordinary | Capital | of | |||||||||||||||||||
| Income | Gains(a) | capital | Income | Gains(a) | capital | |||||||||||||||||||
| American Funds Asset Allocation HLS Fund | $ | 708 | $ | 172 | $ | — | $ | — | $ | — | $ | — | ||||||||||||
| American Funds Blue Chip Income and Growth HLS Fund | 304 | 134 | — | — | — | — | ||||||||||||||||||
| American Funds Bond HLS Fund | 3,303 | 8 | — | — | — | — | ||||||||||||||||||
| American Funds Global Bond HLS Fund | 966 | — | — | — | — | — | ||||||||||||||||||
| American Funds Global Growth and Income HLS Fund | 1,283 | 23 | — | — | — | — | ||||||||||||||||||
| American Funds Global Growth HLS Fund | 408 | 349 | — | — | — | — | ||||||||||||||||||
| American Funds Global Small Capitalization HLS Fund | 27 | 355 | — | — | — | — | ||||||||||||||||||
| American Funds Growth HLS Fund | 1,044 | 2,508 | — | 1,500 | — | — | ||||||||||||||||||
| American Funds Growth-Income HLS Fund | 2,102 | 849 | — | 1,200 | — | — | ||||||||||||||||||
| American Funds International HLS Fund | 2,217 | 1,535 | — | — | — | — | ||||||||||||||||||
| American Funds New World HLS Fund | 495 | 336 | — | — | — | — | ||||||||||||||||||
| (a) | The Funds designate these distributions as long-term capital dividends per IRC code Sec. 852(b) (3) (C). |
As of December 31, 2009, the components of distributable earnings (deficit) on tax basis were as follows:
| Total | ||||||||||||||||||||
| Undistributed | Undistributed | Accumulated | Unrealized | Accumulated | ||||||||||||||||
| Ordinary | Long-Term | Capital and Other | Appreciation | Earnings | ||||||||||||||||
Income | Capital Gain | Losses | (Depreciation)@ | (Deficit) | ||||||||||||||||
| American Funds Asset Allocation HLS Fund | $ | 880 | $ | – | $ | – | $ | 2,505 | $ | 3,385 | ||||||||||
American Funds Blue Chip Income and Growth HLS Fund | 441 | – | – | 3,073 | 3,514 | |||||||||||||||
| American Funds Bond HLS Fund | 4,623 | – | – | 3,428 | 8,051 | |||||||||||||||
| American Funds Global Bond HLS Fund | 403 | 31 | – | 2,083 | 2,517 | |||||||||||||||
| American Funds Global Growth and Income HLS Fund | 1,595 | – | – | 9,844 | 11,439 | |||||||||||||||
| American Funds Global Growth HLS Fund | 285 | – | – | 2,832 | 3,117 | |||||||||||||||
| American Funds Global Small Capitalization HLS Fund | 9 | – | – | 11,375 | 11,384 | |||||||||||||||
| American Funds Growth HLS Fund | 189 | – | – | 31,382 | 31,571 | |||||||||||||||
| American Funds Growth-Income HLS Fund | 152 | – | – | 15,428 | 15,580 | |||||||||||||||
| American Funds International HLS Fund | 2,097 | 714 | – | 27,549 | 30,360 | |||||||||||||||
| American Funds New World HLS Fund | 581 | – | – | 7,709 | 8,290 | |||||||||||||||
@ | The difference between book-basis and tax-basis unrealized appreciation (depreciation) is attributable primarily to the tax deferral of wash sale losses. |
| Hartford Series Fund, Inc. |
Notes to Financial Statements – (continued)
June 30, 2010 (Unaudited)
(000’s Omitted) |
| d) | Reclassification of Capital Accounts – The Funds may record reclassifications in their capital accounts. These reclassifications have no impact on the total net assets of the Funds. The reclassifications are a result of permanent differences between GAAP and tax accounting for such items as net operating losses that reduce distribution requirements. Adjustments are made to reflect the impact these items have on current and future distributions to shareholders. Therefore, the source of a Fund’s distributions may be shown in the accompanying Statement of Changes in Net Assets as from net investment income, from net realized gains on investments or from capital depending on the type of book and tax differences that exist. For the year ended December 31, 2009, the Funds recorded no reclassifications. |
| e) | Capital Loss Carryforward – The Funds had no capital loss carryforwards for U.S. federal income tax purposes as of December 31, 2009. |
| f) | Accounting for Uncertainty in Income Taxes – Management has evaluated all open tax years and has determined there is no impact to the Fund’s financial statements related to uncertain tax positions. Generally, tax authorities can examine all tax returns filed for the last three years. |
| 4. | Expenses: |
| a) | Investment Management Agreement – HL Investment Advisors, LLC (“HL Advisors”), an indirect wholly owned subsidiary of The Hartford Financial Services Group, Inc. (“The Hartford”), serves as investment manager to the Funds pursuant to an Investment Management Agreement with the Company. As investment manager, HL Advisors has overall investment supervisory responsibility for each Fund. In addition, HL Advisors provides administrative personnel, services, equipment, facilities and office space for proper operation of the Funds. |
The schedule below reflects the rates of compensation as a percentage of each Fund’s average daily net assets paid to HL Advisors for investment management services rendered during the six-month period ended June 30, 2010. The rates are accrued daily and paid monthly:
| Fund | Annual Rate* | |||
| American Funds Asset Allocation HLS Fund | 0.65 | % | ||
| American Funds Blue Chip Income and Growth HLS Fund | 0.75 | % | ||
| American Funds Bond HLS Fund | 0.50 | % | ||
| American Funds Global Bond HLS Fund | 0.75 | % | ||
| American Funds Global Growth and Income HLS Fund | 0.80 | % | ||
| American Funds Global Growth HLS Fund | 1.00 | % | ||
| American Funds Global Small Capitalization HLS Fund | 0.80 | % | ||
| American Funds Growth HLS Fund | 0.75 | % | ||
| American Funds Growth-Income HLS Fund | 0.70 | % | ||
| American Funds International HLS Fund | 0.85 | % | ||
| American Funds New World HLS Fund | 1.10 | % | ||
| * | HL Advisors has entered into an agreement under which it will waive a portion of its investment management fee with respect to each Fund for as long as that Fund is invested in its corresponding Underlying Fund. The net investment management fee under the agreement with HL Advisors, after giving effect to the waiver, is 0.25% of the average daily net assets for each Fund. |
| b) | Accounting Services Agreement – Pursuant to the Fund Accounting Agreement between HLIC and the Company, on behalf of the Funds, HLIC provides accounting services to the Funds and receives monthly compensation of 0.01% of each Fund’s average daily net assets. These fees are accrued daily and paid monthly. |
| c) | Other Related Party Transactions – Certain officers of the Funds are directors and/or officers of HL Advisors, and/or The Hartford or its subsidiaries. For the six-month period ended June 30, 2010, a portion of the Funds’ chief compliance officer’s salary was paid by all the investment companies in the Hartford fund complex. The portion allocated to the Funds in aggregate was in the amount of $3. These fees are accrued daily and paid monthly. |
| d) | Operating Expenses – Allocable expenses incurred by the Company are allocated to each Fund in proportion to the average daily net assets of each Fund, except where allocation of certain expenses is more fairly made directly to the Fund. |
| e) | Distribution Plan for Class IB shares – The Company, on behalf of the Funds, has adopted a Distribution Plan pursuant to Rule 12b-1 under the 1940 Act for the Class IB shares. Pursuant to the Distribution Plan, each Fund is authorized to compensate the Distributor, Hartford Securities Distribution Company, Inc. (a wholly owned, ultimate subsidiary of The Hartford), from assets attributable to the Class IB shares for services rendered and expenses borne in connection with activities primarily intended to result in the sale of the Class IB shares, subject to the Fund Board’s review and approval. |
The Distribution Plan provides that each Fund may pay annually up to 0.25% of the average daily net assets of a Fund attributable to its Class IB shares for activities primarily intended to result in the sale of Class IB shares. The Board has the authority to suspend or reduce these payments at any point in time. Under the terms of the Distribution Plan and the principal underwriting agreement, each Fund is authorized to make payments monthly to the Distributor which may be used to pay or compensate entities providing distribution and shareholder servicing with respect to the Class IB shares for such entities’ fees or expenses incurred or paid in that regard. These fees are accrued daily and paid monthly.
| 5. | Investment Transactions: |
For the six-month period ended June 30, 2010, aggregate purchases and sales of investment securities (excluding short-term investments) were as follows:
| Cost of Purchases | Sales Proceeds | |||||||
| Excluding U.S. | Excluding U.S. | |||||||
| Government | Government | |||||||
| Obligations | Obligations | |||||||
| American Funds Asset Allocation HLS Fund | $ | 2,968 | $ | 2,592 | ||||
| American Funds Blue Chip Income and Growth HLS Fund | 1,527 | 2,147 | ||||||
| American Funds Bond HLS Fund | 25,413 | 5,900 | ||||||
| American Funds Global Bond HLS Fund | 3,454 | 4,285 | ||||||
| American Funds Global Growth and Income HLS Fund | 3,366 | 6,048 | ||||||
| American Funds Global Growth HLS Fund | 2,260 | 1,761 | ||||||
| American Funds Global Small Capitalization HLS Fund | 4,909 | 6,523 | ||||||
| American Funds Growth HLS Fund | 14,245 | 8,690 | ||||||
| American Funds Growth-Income HLS Fund | 6,179 | 6,692 | ||||||
| American Funds International HLS Fund | 25,836 | 1,394 | ||||||
| American Funds New World HLS Fund | 3,846 | 5,793 | ||||||
| Hartford Series Fund, Inc. |
Notes to Financial Statements – (continued)
June 30, 2010 (Unaudited)
(000’s Omitted) |
| 6. | Line of Credit: |
The Funds participate in a $500 million committed revolving line of credit facility. The facility is to be used for temporary or emergency purposes. Under the arrangement, the Funds are required to own securities having a market value in excess of 300% of the total bank borrowings. The interest rate on borrowings varies depending on the nature of the loan. The facility also requires a fee to be paid based on the amount of the commitment. This fee is allocated to all Funds participating in the line of credit based on average net assets of the Funds. During the six-month period ended June 30, 2010, the Funds did not have any borrowings under this facility.
[This page is intentionally left blank]
| Hartford Series Fund, Inc. |
| ─ Selected Per-Share Data(A) ─ | ─ Ratios and Supplemental Data ─ | |||||||||||||||||||||||||||||||||||||||||||||||||||||||||||
| Net | ||||||||||||||||||||||||||||||||||||||||||||||||||||||||||||
| Realized | ||||||||||||||||||||||||||||||||||||||||||||||||||||||||||||
| and Un- | Distrib- | Net | Ratio of | Ratio of | ||||||||||||||||||||||||||||||||||||||||||||||||||||||||
| Net | realized | Dividends | utions | Increase | Expenses to | Expenses to | Ratio of Net | |||||||||||||||||||||||||||||||||||||||||||||||||||||
| Net Asset | Invest- | Gain | from Net | from | (Decrease) | Net Asset | Average | Average | Investment | |||||||||||||||||||||||||||||||||||||||||||||||||||
| Value at | ment | (Loss) on | Total from | Invest- | Realized | Total | in Net | Value at | Net Assets | Net Assets | Net Assets | Income to | Portfolio | |||||||||||||||||||||||||||||||||||||||||||||||
| Beginning | Income | Invest- | Investment | ment | Capital | Distri- | Asset | End of | Total | at End of | Before | After | Average Net | Turnover | ||||||||||||||||||||||||||||||||||||||||||||||
| Class | of Period | (Loss) | ments | Operations | Income | Gains | butions | Value | Period | Return(B) | Period | Waivers(C) | Waivers(C) | Assets | Rate | |||||||||||||||||||||||||||||||||||||||||||||
| American Funds Asset Allocation HLS Fund | ||||||||||||||||||||||||||||||||||||||||||||||||||||||||||||
For the Six-Month Period Ended June 30, 2010(D) (Unaudited) | ||||||||||||||||||||||||||||||||||||||||||||||||||||||||||||
| IB | $ | 8.85 | $ | 0.01 | $ | (0.48 | ) | $ | (0.47 | ) | $ | – | $ | – | $ | – | $ | (0.47 | ) | $ | 8.38 | (5.29 | )%(E) | $ | 46,318 | 0.94 | %(F) | 0.54 | %(F) | 0.28 | %(F) | 5 | % | |||||||||||||||||||||||||||
| For the Year Ended December 31, 2009(D) | ||||||||||||||||||||||||||||||||||||||||||||||||||||||||||||
| IB | 7.31 | 0.18 | 1.53 | 1.71 | (0.14 | ) | (0.03 | ) | (0.17 | ) | 1.54 | 8.85 | 23.59 | 48,568 | 0.95 | 0.55 | 2.33 | 8 | ||||||||||||||||||||||||||||||||||||||||||
| From (commencement of operations) April 30, 2008 through December 31, 2008 | ||||||||||||||||||||||||||||||||||||||||||||||||||||||||||||
| IB(G) | 10.00 | 0.19 | (2.88 | ) | (2.69 | ) | – | – | – | (2.69 | ) | 7.31 | (26.88 | )(E) | 26,312 | 0.99 | (F) | 0.59 | (F) | 8.02 | (F) | – | ||||||||||||||||||||||||||||||||||||||
| American Funds Blue Chip Income and Growth HLS Fund | ||||||||||||||||||||||||||||||||||||||||||||||||||||||||||||
| For the Six-Month Period Ended June 30, 2010(D) (Unaudited) | ||||||||||||||||||||||||||||||||||||||||||||||||||||||||||||
| IB | 8.44 | – | (0.63 | ) | (0.63 | ) | – | – | – | (0.63 | ) | 7.81 | (7.37 | )(E) | 26,300 | 1.05 | (F) | 0.55 | (F) | 0.06 | (F) | 5 | ||||||||||||||||||||||||||||||||||||||
| For the Year Ended December 31, 2009(D) | ||||||||||||||||||||||||||||||||||||||||||||||||||||||||||||
| IB | 6.74 | 0.15 | 1.68 | 1.83 | (0.09 | ) | (0.04 | ) | (0.13 | ) | 1.70 | 8.44 | 27.46 | 29,030 | 1.07 | 0.57 | 2.06 | 6 | ||||||||||||||||||||||||||||||||||||||||||
| From (commencement of operations) April 30, 2008 through December 31, 2008 | ||||||||||||||||||||||||||||||||||||||||||||||||||||||||||||
| IB(G) | 10.00 | 0.14 | (3.40 | ) | (3.26 | ) | – | – | – | (3.26 | ) | 6.74 | (32.64 | )(E) | 13,182 | 1.17 | (F) | 0.67 | (F) | 6.79 | (F) | 3 | ||||||||||||||||||||||||||||||||||||||
| American Funds Bond HLS Fund | ||||||||||||||||||||||||||||||||||||||||||||||||||||||||||||
| For the Six-Month Period Ended June 30, 2010(D) (Unaudited) | ||||||||||||||||||||||||||||||||||||||||||||||||||||||||||||
| IB | 9.84 | 0.03 | 0.41 | 0.44 | – | – | – | 0.44 | 10.28 | 4.49 | (E) | 209,111 | 0.79 | (F) | 0.54 | (F) | 0.67 | (F) | 3 | |||||||||||||||||||||||||||||||||||||||||
| For the Year Ended December 31, 2009(D) | ||||||||||||||||||||||||||||||||||||||||||||||||||||||||||||
| IB | 8.98 | 0.35 | 0.74 | 1.09 | (0.23 | ) | – | (0.23 | ) | 0.86 | 9.84 | 12.23 | 181,550 | 0.78 | 0.53 | 3.75 | 2 | |||||||||||||||||||||||||||||||||||||||||||
| From (commencement of operations) April 30, 2008 through December 31, 2008 | ||||||||||||||||||||||||||||||||||||||||||||||||||||||||||||
| IB(G) | 10.00 | 0.44 | (1.46 | ) | (1.02 | ) | – | – | – | (1.02 | ) | 8.98 | (10.21 | )(E) | 67,597 | 0.80 | (F) | 0.55 | (F) | 16.32 | (F) | 5 | ||||||||||||||||||||||||||||||||||||||
| American Funds Global Bond HLS Fund | ||||||||||||||||||||||||||||||||||||||||||||||||||||||||||||
| For the Six-Month Period Ended June 30, 2010(D) (Unaudited) | ||||||||||||||||||||||||||||||||||||||||||||||||||||||||||||
| IB | 10.47 | 0.03 | (0.12 | ) | (0.09 | ) | – | – | – | (0.09 | ) | 10.38 | (0.86 | )(E) | 37,265 | 1.04 | (F) | 0.54 | (F) | 0.49 | (F) | 9 | ||||||||||||||||||||||||||||||||||||||
| For the Year Ended December 31, 2009(D) | ||||||||||||||||||||||||||||||||||||||||||||||||||||||||||||
| IB | 9.85 | 0.13 | 0.79 | 0.92 | (0.30 | ) | – | (0.30 | ) | 0.62 | 10.47 | 9.43 | 38,533 | 1.06 | 0.56 | 1.29 | 5 | |||||||||||||||||||||||||||||||||||||||||||
| From (commencement of operations) April 30, 2008 through December 31, 2008 | ||||||||||||||||||||||||||||||||||||||||||||||||||||||||||||
| IB(G) | 10.00 | 0.42 | (0.57 | ) | (0.15 | ) | – | – | – | (0.15 | ) | 9.85 | (1.51 | )(E) | 22,386 | 1.10 | (F) | 0.60 | (F) | 13.11 | (F) | 42 | ||||||||||||||||||||||||||||||||||||||
| American Funds Global Growth and Income HLS Fund | ||||||||||||||||||||||||||||||||||||||||||||||||||||||||||||
| For the Six-Month Period Ended June 30, 2010(D) (Unaudited) | ||||||||||||||||||||||||||||||||||||||||||||||||||||||||||||
| IB | 8.30 | 0.05 | (0.80 | ) | (0.75 | ) | – | – | – | (0.75 | ) | 7.55 | (8.98 | )(E) | 77,682 | 1.08 | (F) | 0.53 | (F) | 1.12 | (F) | 4 | ||||||||||||||||||||||||||||||||||||||
| For the Year Ended December 31, 2009(D) | ||||||||||||||||||||||||||||||||||||||||||||||||||||||||||||
| IB | 6.06 | 0.16 | 2.21 | 2.37 | (0.13 | ) | – | (0.13 | ) | 2.24 | 8.30 | 39.37 | 88,762 | 1.09 | 0.54 | 2.39 | 3 | |||||||||||||||||||||||||||||||||||||||||||
| From (commencement of operations) April 30, 2008 through December 31, 2008 | ||||||||||||||||||||||||||||||||||||||||||||||||||||||||||||
| IB(G) | 10.00 | 0.17 | (4.11 | ) | (3.94 | ) | – | – | – | (3.94 | ) | 6.06 | (39.43 | )(E) | 44,065 | 1.11 | (F) | 0.56 | (F) | 8.24 | (F) | – | ||||||||||||||||||||||||||||||||||||||
| American Funds Global Growth HLS Fund | ||||||||||||||||||||||||||||||||||||||||||||||||||||||||||||
| For the Six-Month Period Ended June 30, 2010(D) (Unaudited) | ||||||||||||||||||||||||||||||||||||||||||||||||||||||||||||
| IB | 8.83 | 0.01 | (0.94 | ) | (0.93 | ) | – | – | – | (0.93 | ) | 7.90 | (10.46 | )(E) | 27,662 | 1.30 | (F) | 0.55 | (F) | 0.32 | (F) | 6 | ||||||||||||||||||||||||||||||||||||||
| For the Year Ended December 31, 2009(D) | ||||||||||||||||||||||||||||||||||||||||||||||||||||||||||||
| IB | 6.40 | 0.09 | 2.57 | 2.66 | (0.12 | ) | (0.11 | ) | (0.23 | ) | 2.43 | 8.83 | 41.78 | 30,457 | 1.32 | 0.57 | 1.24 | 12 | ||||||||||||||||||||||||||||||||||||||||||
| From (commencement of operations) April 30, 2008 through December 31, 2008 | ||||||||||||||||||||||||||||||||||||||||||||||||||||||||||||
| IB(G) | 10.00 | 0.15 | (3.75 | ) | (3.60 | ) | – | – | – | (3.60 | ) | 6.40 | (35.95 | )(E) | 15,490 | 1.37 | (F) | 0.62 | (F) | 5.68 | (F) | – | ||||||||||||||||||||||||||||||||||||||
| American Funds Global Small Capitalization HLS Fund | ||||||||||||||||||||||||||||||||||||||||||||||||||||||||||||
| For the Six-Month Period Ended June 30, 2010(D) (Unaudited) | ||||||||||||||||||||||||||||||||||||||||||||||||||||||||||||
| IB | 8.13 | 0.09 | (0.46 | ) | (0.37 | ) | – | – | – | (0.37 | ) | 7.76 | (4.57 | )(E) | 56,634 | 1.10 | (F) | 0.55 | (F) | 2.09 | (F) | 8 | ||||||||||||||||||||||||||||||||||||||
| For the Year Ended December 31, 2009(D) | ||||||||||||||||||||||||||||||||||||||||||||||||||||||||||||
| IB | 5.10 | – | 3.08 | 3.08 | – | (0.05 | ) | (0.05 | ) | 3.03 | 8.13 | 60.77 | 61,519 | 1.10 | 0.55 | 0.02 | 10 | |||||||||||||||||||||||||||||||||||||||||||
| From (commencement of operations) April 30, 2008 through December 31, 2008 | ||||||||||||||||||||||||||||||||||||||||||||||||||||||||||||
| IB(G) | 10.00 | (0.01 | ) | (4.89 | ) | (4.90 | ) | – | – | – | (4.90 | ) | 5.10 | (49.04 | )(E) | 19,807 | 1.16 | (F) | 0.61 | (F) | (0.62 | )(F) | – | |||||||||||||||||||||||||||||||||||||
─ Selected Per-Share Data(A) ─ | ─Ratios and Supplemental Data ─ | |||||||||||||||||||||||||||||||||||||||||||||||||||||||||||
| Net | ||||||||||||||||||||||||||||||||||||||||||||||||||||||||||||
| Realized | ||||||||||||||||||||||||||||||||||||||||||||||||||||||||||||
| and Un- | Distrib- | Net | Ratio of | Ratio of | ||||||||||||||||||||||||||||||||||||||||||||||||||||||||
| Net | realized | Dividends | utions | Increase | Expenses to | Expenses to | Ratio of Net | |||||||||||||||||||||||||||||||||||||||||||||||||||||
| Net Asset | Invest- | Gain | from Net | from | (Decrease) | Net Asset | Average | Average | Investment | |||||||||||||||||||||||||||||||||||||||||||||||||||
| Value at | ment | (Loss) on | Total from | Invest- | Realized | Total | in Net | Value at | Net Assets at | Net Assets | Net Assets | Income to | Portfolio | |||||||||||||||||||||||||||||||||||||||||||||||
| Beginning | Income | Invest- | Investment | ment | Capital | Distri- | Asset | End of | Total | End of | Before | After | Average Net | Turnover | ||||||||||||||||||||||||||||||||||||||||||||||
| Class | of Period | (Loss) | ments | Operations | Income | Gains | butions | Value | Period | Return(B) | Period | Waivers(C) | Waivers(C) | Assets | Rate | |||||||||||||||||||||||||||||||||||||||||||||
| American Funds Growth HLS Fund | ||||||||||||||||||||||||||||||||||||||||||||||||||||||||||||
For the Six-Month Period Ended June 30, 2010(D) (Unaudited) | ||||||||||||||||||||||||||||||||||||||||||||||||||||||||||||
| IB | $ | 7.96 | $ | – | $ | (0.45 | ) | $ | (0.45 | ) | $ | – | $ | – | $ | – | $ | (0.45 | ) | $ | 7.51 | (5.60 | )%(E) | $ | 285,416 | 1.03 | %(F) | 0.53 | %(F) | (0.09 | )%(F) | 3 | % | |||||||||||||||||||||||||||
| For the Year Ended December 31, 2009(D) | ||||||||||||||||||||||||||||||||||||||||||||||||||||||||||||
| IB | 5.81 | 0.03 | 2.22 | 2.25 | (0.03 | ) | (0.07 | ) | (0.10 | ) | 2.15 | 7.96 | 39.02 | 296,659 | 1.03 | 0.53 | 0.47 | 3 | ||||||||||||||||||||||||||||||||||||||||||
| From (commencement of operations) April 30, 2008 through December 31, 2008 | ||||||||||||||||||||||||||||||||||||||||||||||||||||||||||||
| IB(G) | 10.00 | 0.07 | (4.18 | ) | (4.11 | ) | (0.08 | ) | – | (0.08 | ) | (4.19 | ) | 5.81 | (41.18 | )(E) | 122,888 | 1.03 | (F) | 0.53 | (F) | 3.39 | (F) | – | ||||||||||||||||||||||||||||||||||||
| American Funds Growth-Income HLS Fund | ||||||||||||||||||||||||||||||||||||||||||||||||||||||||||||
| For the Six-Month Period Ended June 30, 2010(D) (Unaudited) | ||||||||||||||||||||||||||||||||||||||||||||||||||||||||||||
| IB | 8.20 | – | (0.75 | ) | (0.75 | ) | – | – | – | (0.75 | ) | 7.45 | (9.17 | )(E) | 152,705 | 0.98 | (F) | 0.53 | (F) | 0.08 | (F) | 4 | ||||||||||||||||||||||||||||||||||||||
| For the Year Ended December 31, 2009(D) | ||||||||||||||||||||||||||||||||||||||||||||||||||||||||||||
| IB | 6.39 | 0.11 | 1.86 | 1.97 | (0.11 | ) | (0.05 | ) | (0.16 | ) | 1.81 | 8.20 | 30.85 | 168,690 | 0.98 | 0.53 | 1.56 | 1 | ||||||||||||||||||||||||||||||||||||||||||
| From (commencement of operations) April 30, 2008 through December 31, 2008 | ||||||||||||||||||||||||||||||||||||||||||||||||||||||||||||
| IB(G) | 10.00 | 0.13 | (3.63 | ) | (3.50 | ) | (0.11 | ) | – | (0.11 | ) | (3.61 | ) | 6.39 | (34.98 | )(E) | 74,039 | 0.99 | (F) | 0.54 | (F) | 5.87 | (F) | – | ||||||||||||||||||||||||||||||||||||
| American Funds International HLS Fund | ||||||||||||||||||||||||||||||||||||||||||||||||||||||||||||
| For the Six-Month Period Ended June 30, 2010(D) (Unaudited) | ||||||||||||||||||||||||||||||||||||||||||||||||||||||||||||
| IB | 8.50 | 0.04 | (1.18 | ) | (1.14 | ) | – | – | – | (1.14 | ) | 7.36 | (13.42 | )(E) | 191,373 | 1.14 | (F) | 0.54 | (F) | 1.05 | (F) | 1 | ||||||||||||||||||||||||||||||||||||||
| For the Year Ended December 31, 2009(D) | ||||||||||||||||||||||||||||||||||||||||||||||||||||||||||||
| IB | 6.09 | 0.11 | 2.48 | 2.59 | (0.11 | ) | (0.07 | ) | (0.18 | ) | 2.41 | 8.50 | 42.75 | 197,258 | 1.13 | 0.53 | 1.53 | 7 | ||||||||||||||||||||||||||||||||||||||||||
| From (commencement of operations) April 30, 2008 through December 31, 2008 | ||||||||||||||||||||||||||||||||||||||||||||||||||||||||||||
| IB(G) | 10.00 | 0.16 | (4.07 | ) | (3.91 | ) | – | – | – | (3.91 | ) | 6.09 | (39.10 | )(E) | 78,825 | 1.14 | (F) | 0.54 | (F) | 8.05 | (F) | – | ||||||||||||||||||||||||||||||||||||||
| American Funds New World HLS Fund | ||||||||||||||||||||||||||||||||||||||||||||||||||||||||||||
| For the Six-Month Period Ended June 30, 2010(D) (Unaudited) | ||||||||||||||||||||||||||||||||||||||||||||||||||||||||||||
| IB | 8.80 | 0.02 | (0.50 | ) | (0.48 | ) | – | – | – | (0.48 | ) | 8.32 | (5.40 | )(E) | 53,374 | 1.38 | (F) | 0.53 | (F) | 0.48 | (F) | 7 | ||||||||||||||||||||||||||||||||||||||
| For the Year Ended December 31, 2009(D) | ||||||||||||||||||||||||||||||||||||||||||||||||||||||||||||
| IB | 6.00 | 0.10 | 2.84 | 2.94 | (0.08 | ) | (0.06 | ) | (0.14 | ) | 2.80 | 8.80 | 49.14 | 58,578 | 1.40 | 0.55 | 1.44 | 8 | ||||||||||||||||||||||||||||||||||||||||||
| From (commencement of operations) April 30, 2008 through December 31, 2008 | ||||||||||||||||||||||||||||||||||||||||||||||||||||||||||||
| IB(G) | 10.00 | 0.11 | (4.11 | ) | (4.00 | ) | – | – | – | (4.00 | ) | 6.00 | (39.97 | )(E) | 23,933 | 1.44 | (F) | 0.59 | (F) | 5.06 | (F) | 1 | ||||||||||||||||||||||||||||||||||||||
| (A) | Information presented relates to a share outstanding throughout the indicated period. |
| (B) | The figures do not include sales charges or other fees which may be applied at the variable life insurance, variable annuity or qualified retirement plan product level. Any such additional sales charges or other fees would lower the Fund's performance. |
| (C) | Expense ratios do not include expenses of the underlying funds. |
| (D) | Per share amounts have been calculated using the average shares method. |
| (E) | Not annualized. |
| (F) | Annualized. |
| (G) | Commenced operations on April 30, 2008. |
| Hartford Series Fund, Inc. |
The Board of Directors appoints officers who are responsible for the day-to-day operations of the Fund and who execute policies formulated by the Directors. Each director serves until his or her death, resignation, or retirement or until the next annual meeting of shareholders is held or until his or her successor is elected and qualifies.
Directors and officers who are employed by or who have a financial interest in The Hartford are considered “interested” persons of the Funds pursuant to the Investment Company Act of 1940, as amended. Each officer and two of the Company’s directors, as noted in the chart below, are “interested” persons of the Funds. Each director serves as a director for The Hartford Mutual Funds, Inc., The Hartford Mutual Funds II, Inc., The Hartford Income Shares Fund, Inc., Hartford Series Fund, Inc., and Hartford HLS Series Fund II, Inc., which, as of June 30, 2010, collectively consist of 88 funds. Correspondence may be sent to directors and officers c/o Hartford Mutual Funds, P.O. Box 2999, Hartford, Connecticut 06104-2999, except that correspondence to Ms. Fagely may be sent to 500 Bielenberg Drive, Woodbury, Minnesota 55125.
The table below sets forth, for each director and officer, his or her name, year of birth, current position with the Company and date first elected or appointed to Hartford Series Fund, Inc. (“HSF”), and Hartford HLS Series Fund II, Inc. (“HSF2”), principal occupation, and, for directors, other directorships held. The Funds’ statement of additional information contains further information on the directors and is available free of charge by calling 1-800-862-6668 or writing to Hartford HLS Funds, c/o Individual Annuity Services, P.O. Box 5085, Hartford, CT 06102-5085.
Information on the aggregate remuneration paid to the directors of the Company can be found in the Statement of Operations herein. The Funds pay to The Hartford a portion of the chief compliance officer’s compensation, but do not pay salaries or compensation to any of their other officers or directors who are employed by The Hartford.
Non-Interested Directors
Lynn S. Birdsong (1946) Director since 2003, Co-Chairman of the Investment Committee
Mr. Birdsong is a private investor. Since 2003, Mr. Birdsong has been an independent director of The Japan Fund and has served as a Director of the Sovereign High Yield Fund since April 2010. From 2003 to March 2005, Mr. Birdsong was an independent director of the Atlantic Whitehall Funds. From 1979 to 2002, Mr. Birdsong was a managing director of Zurich Scudder Investments, an investment management firm. During his employment with Scudder, Mr. Birdsong was an interested director of The Japan Fund. Since 1981, Mr. Birdsong has been a partner in Birdsong Company, an advertising specialty firm.
Robert M. Gavin, Jr. (1940) Director since 2002 (SF) and 1986 (SF2), Chairman of the Board since 2004
Dr. Gavin is an educational consultant. Prior to September 1, 2001, he was President of Cranbrook Education Community and prior to July 1996, he was President of Macalester College, St. Paul, Minnesota.
Duane E. Hill (1945) Director since 2001 (SF) and 2002 (SF2), Chairman of the Nominating Committee
Mr. Hill is Partner of TSG Ventures L.P., a private equity investment company. Mr. Hill is a former partner of TSG Capital Group, a private equity investment firm that served as sponsor and lead investor in leveraged buyouts of middle market companies.
Sandra S. Jaffee (1941) Director since 2005
Ms. Jaffee served as Chairman (2008 to 2009) and Chief Executive Officer of Fortent (formerly Searchspace Group), a leading provider of compliance/regulatory technology to financial institutions from August 2005 to August 2009. From August 2004 to August 2005, Ms. Jaffee served as an Entrepreneur in Residence with Warburg Pincus, a private equity firm. From September 1995 to July 2004, Ms. Jaffee served as Executive Vice President at Citigroup, where she was President and Chief Executive Officer of Citibank’s Global Securities Services (1995 to 2003).
William P. Johnston (1944) Director since 2005, Chairman of the Compliance Committee
In June 2006, Mr. Johnston was appointed as Senior Advisor to The Carlyle Group, a global private equity investment firm. In July 2006, Mr. Johnston was elected to the Board of Directors of MultiPlan, Inc. In August 2007, Mr. Johnston was elected to the Board of Directors of LifeCare Holdings, Inc. In February 2008, Mr. Johnston was elected to the Board of Directors of HCR-ManorCare, Inc. In May 2006, Mr. Johnston was elected to the Supervisory Board of Fresenius Medical Care AG & Co. KGaA, after its acquisition of Renal Care Group, Inc. in March 2006. Mr. Johnston joined Renal Care Group in November 2002 as a member of the Board of Directors and served as Chairman of the Board from March 2003 through March 2006. From September 1987 to December 2002, Mr. Johnston was with Equitable Securities Corporation (and its successors, SunTrust Equitable Securities and SunTrust Robinson Humphrey) serving in various investment banking and managerial positions, including Managing Director and Head of Investment Banking, Chief Executive Officer and Vice Chairman.
| Hartford Series Fund, Inc. |
Directors and Officers (Unaudited) – (continued) |
Phillip O. Peterson (1944) Director since 2002 (SF) and 2000 (SF2), Chairman of the Audit Committee
Mr. Peterson is a mutual fund industry consultant. He was a partner of KPMG LLP (an accounting firm) until July 1999. Mr. Peterson joined William Blair Funds in February 2007 as a member of the Board of Trustees. From January 2004 to April 2005, Mr. Peterson served as Independent President of the Strong Mutual Funds.
Lemma W. Senbet (1946) Director since 2005
Dr. Senbet is the William E. Mayer Chair Professor of Finance and Director, Center for Financial Policy, at the University of Maryland, Robert H. Smith School of Business. He was chair of the Finance Department during 1998 to 2006. Previously he was a chaired professor of finance at the University of Wisconsin-Madison. Also, he was director of the Fortis Funds from March 2000 to July 2002. Dr. Senbet served the finance profession in various capacities, including as director of the American Finance Association and President of the Western Finance Association. In 2006, Dr. Senbet was inducted Fellow of Financial Management Association International for his career-long distinguished scholarship and professional service.
Interested Directors and Officers
Lowndes A. Smith (1939) Director since 1996 (SF) and 2002 (SF2), Co-Chairman of the Investment Committee
Mr. Smith served as Vice Chairman of The Hartford from February 1997 to January 2002, as President and Chief Executive Officer of Hartford Life, Inc. from February 1997 to January 2002, and as President and Chief Operating Officer of The Hartford Life Insurance Companies from January 1989 to January 2002. Mr. Smith serves as a Director of White Mountains Insurance Group, Ltd., One Beacon Insurance, Symetra Financial and as a Managing Director of Whittington Gray Associates.
John C. Walters 1, 2 (1962) Director since 2008
Mr. Walters currently serves as President, Chief Executive Officer and Director for Hartford Life, Inc. (“HL, Inc.”). Mr. Walters also serves as President, Chairman of the Board, Chief Executive Officer and Director for Hartford Life Insurance Company (“Hartford Life”), and as Executive Vice President of The Hartford. In addition, Mr. Walters is a Manager of HL Investment Advisors, LLC (“HL Advisors”). Mr. Walters previously served as President of the U.S. Wealth Management Division of HL, Inc. (2006-2007) and as Co-Chief Operating Officer of Hartford Life (2007-2008).
1 Mr. Walters previously served as President and Chief Executive Officer (2007 to 2009).
2 Effective July 31, 2010, Mr. Walters retired from The Hartford. Mr. Walters resigned his position as a Director of the Funds effective July 30, 2010.
Other Officers
Robert M. Arena, Jr. (1968) President and Chief Executive Officer since 2009 (served as Vice President of the Fund (2006-2009))
Mr. Arena serves as Executive Vice President of Hartford Life. Additionally, Mr. Arena is Senior Vice President and Director of Hartford Administrative Services Company, (“HASCO”), President, Chief Executive Officer and Manager of Hartford Investment Financial Services, LLC (“HIFSCO”) and President, Chief Executive Officer and Manager of HL Advisors. Mr. Arena joined The Hartford in 2004.
Tamara L. Fagely (1958) Vice President, Treasurer and Controller since 2002 (SF) 1993 (SF2)
Ms. Fagely has been a Vice President of HASCO since 1998 and Chief Financial Officer since 2006. Currently Ms. Fagely is a Vice President of Hartford Life. She served as Assistant Vice President of Hartford Life from December 2001 through March 2005. In addition, Ms. Fagely is Controller and Chief Financial Officer of HIFSCO.
Brian Ferrell (1962) AML Compliance Officer since 2008
Mr. Ferrell has served as Assistant Vice President and AML Compliance Officer for The Hartford since 2006, and as AML Compliance Officer for HASCO and Hartford Investor Services Company, LLC (“HISC”) since 2008. Prior to joining The Hartford in 2006, Mr. Ferrell held various positions at the U.S. Department of the Treasury (the “Treasury”) from 2001 to 2006, where he served as Chief Counsel for the Treasury’s Financial Crimes Enforcement Network from 2005-2006.
Dr. Robert J. Froehlich (1953) Senior Managing Director since 2009
Dr. Froehlich joined The Hartford as Senior Managing Director in September 2009. Prior to joining The Hartford, Dr. Froehlich served as Vice Chairman of Deutsche Asset Management from 1997-2009.
| Hartford Series Fund, Inc. |
Directors and Officers (Unaudited)- (continued) |
Thomas D. Jones, III (1965) Vice President and Chief Compliance Officer since 2006
Mr. Jones serves as Chief Compliance Officer for the Hartford Mutual Funds and Vice President and Director of Securities Compliance for The Hartford. Mr. Jones joined The Hartford in 2006 from SEI Investments, where he served as Chief Compliance Officer for its mutual funds and investment advisers. Prior to joining SEI, Mr. Jones was First Vice President and Compliance Director for Merrill Lynch Investment Managers (Americas) (“MLIM”), where he worked from 1992-2004.
Edward P. Macdonald (1967) Vice President, Secretary and Chief Legal Officer since 2005
Mr. Macdonald serves as Assistant Vice President of Hartford Life and Chief Legal Officer and Vice President of HIFSCO. He also serves as Vice President and Secretary of HASCO, and Chief Legal Officer, Secretary and Vice President of HL Advisors. Mr. Macdonald joined The Hartford in 2005.
Vernon J. Meyer (1964) Vice President since 2006
Mr. Meyer serves as Senior Vice President of Hartford Life. He also serves as Senior Vice President of HIFSCO and HL Advisors. Mr. Meyer joined The Hartford in 2004.
D. Keith Sloane (1960) Vice President since 2009
Mr. Sloane is a Senior Vice President of Hartford Life. Additionally, Mr. Sloane currently serves as Senior Vice President of HIFSCO, HL Advisors, and HASCO. Prior to joining The Hartford in 2007, Mr. Sloane was Director of product marketing and led the mutual fund business for Wachovia Securities (“Wachovia”) in their investment products group. Mr. Sloane joined Wachovia in 1995.
Jane Wolak (1961) Vice President since 2009
Ms. Wolak currently serves as Vice President of Hartford Life. Ms. Wolak joined Hartford Life as Vice President, Retail Product Services in May 2007. She is also Vice President of HASCO. Previously, Ms. Wolak was with Sun Life Financial where she held the position of Vice President, Service Center Operations from 2001-2007.
A description of the policies and procedures that the Funds use to determine how to vote proxies relating to portfolio securities and a record of how the Funds voted any proxies for the twelve-month period ended June 30, 2010 is available (1) without charge, upon request, by calling 800-862-6668 and (2) on the Securities and Exchange Commission’s website at http://www.sec.gov.
The Funds file a complete schedule of portfolio holdings with the Commission for the first and third quarters of each fiscal year on Form N-Qs. The Funds’ Forms are available (1) without charge, upon request, by calling 800-862-6668 and (2) on the Securities and Exchange Commission’s website at http://www.sec.gov. The Form N-Q may be reviewed and copied at the Commission’s Public Reference Room in Washington, DC. Information on the operation of the Public Reference Room may be obtained by calling 1-800-SEC-0330.
| Hartford Series Fund, Inc. |
The following proposal was addressed and approved at a Special Meeting of Shareholders held on February 12, 2010.
Proposal to elect Lemma Senbet and John Walters, each currently a Director, as Directors of Hartford Series Fund, Inc.
Lemma W. Senbet
| Funds | For | Withheld | ||||
| Hartford Series Fund, Inc. | 5,079,578,022.902 | 241,839,974.106 |
John C. Walters
| Funds | For | Withheld | ||||
| Hartford Series Fund, Inc. | 5,081,138,302.186 | 240,279,694.822 |
| Hartford Series Fund, Inc. |
Your Fund's Expenses
As a shareholder of the Fund, you incur two types of costs: (1) transaction costs, including sales charges (loads) on purchase payments and contingent deferred sales charges (CDSC) (2) ongoing costs including management fees; distribution fees; and other fund expenses. This example is intended to help you understand your ongoing costs (in dollars) of investing in the Fund and to compare these costs with the ongoing costs of investing in other mutual funds. The example is based on an investment of $1,000 invested at the beginning of the period and held for the period of December 31, 2009 through June 30, 2010.
Actual Expenses
The first set of columns of the table below provides information about actual account values and actual expenses. You may use the information in this column, together with the amount you invested, to estimate the expenses that you paid over the period. Simply divide your account value by $1,000 (for example, an $8,600 account value divided by $1,000 = 8.6), then multiply the result by the number in the line under the heading entitled "Expenses Paid During Period" to estimate the expenses you paid on your account during this period.
Hypothetical Example for Comparison Purposes
The second set of columns of the table below provides information about hypothetical account values and hypothetical expenses based on the Fund's actual expense ratio and an assumed rate of return of 5% per year before expenses, which is not the Fund's actual return. The hypothetical account values and expenses may not be used to estimate the actual ending account balance or expenses you paid for the period. You may use this information to compare the ongoing costs of investing in the Fund and other funds. To do so, compare this 5% hypothetical example with the 5% hypothetical examples that appear in the shareholder reports of the other funds.
Please note that the expenses shown in the table are meant to highlight your ongoing costs only and do not reflect any transactional costs, such as sales charges (loads) and CDSC. Therefore, the second set of columns of the table is useful in comparing ongoing costs only, and will not help you determine the relative total costs of owning different funds. In addition, if these transactional costs were included, your costs would be higher. Expenses are equal to the Fund's annualized expense ratios multiplied by average account value over the period, multiplied by 181/365 (to reflect the one-half year period).
| Expenses paid | Expenses paid | Days in | ||||||||||||||||||||||||||||||||
| during the period | during the period | the | Days | |||||||||||||||||||||||||||||||
| Beginning | Ending | December 31, 2009 | Beginning Account | Ending | December 31, | Annualized | current | in the | ||||||||||||||||||||||||||
| Account Value | Account Value | through | Value December | Account Value | 2009 through | expense | 1/2 | full | ||||||||||||||||||||||||||
December 31, 2009 | June 30, 2010 | June 30, 2010 | 31, 2009 | June 30, 2010 | June 30, 2010 | ratio | year | year | ||||||||||||||||||||||||||
| American Funds Asset Allocation HLS Fund | ||||||||||||||||||||||||||||||||||
| Class IB | $ | 1,000.00 | $ | 947.08 | $ | 2.61 | $ | 1,000.00 | $ | 1,022.12 | $ | 2.71 | 0.54 | % | 181 | 365 | ||||||||||||||||||
| American Funds Blue Chip Income and Growth HLS Fund | ||||||||||||||||||||||||||||||||||
| Class IB | $ | 1,000.00 | $ | 926.25 | $ | 2.63 | $ | 1,000.00 | $ | 1,022.07 | $ | 2.76 | 0.55 | % | 181 | 365 | ||||||||||||||||||
| American Funds Bond HLS Fund | ||||||||||||||||||||||||||||||||||
| Class IB | $ | 1,000.00 | $ | 1,044.88 | $ | 2.74 | $ | 1,000.00 | $ | 1,022.12 | $ | 2.71 | 0.54 | % | 181 | 365 | ||||||||||||||||||
| American Funds Global Bond HLS Fund | ||||||||||||||||||||||||||||||||||
| Class IB | $ | 1,000.00 | $ | 991.36 | $ | 2.67 | $ | 1,000.00 | $ | 1,022.12 | $ | 2.71 | 0.54 | % | 181 | 365 | ||||||||||||||||||
| American Funds Global Growth and Income HLS Fund | ||||||||||||||||||||||||||||||||||
| Class IB | $ | 1,000.00 | $ | 910.23 | $ | 2.51 | $ | 1,000.00 | $ | 1,022.17 | $ | 2.66 | 0.53 | % | 181 | 365 | ||||||||||||||||||
| American Funds Global Growth HLS Fund | ||||||||||||||||||||||||||||||||||
| Class IB | $ | 1,000.00 | $ | 895.41 | $ | 2.58 | $ | 1,000.00 | $ | 1,022.07 | $ | 2.76 | 0.55 | % | 181 | 365 | ||||||||||||||||||
| American Funds Global Small Capitalization HLS Fund | ||||||||||||||||||||||||||||||||||
| Class IB | $ | 1,000.00 | $ | 954.26 | $ | 2.67 | $ | 1,000.00 | $ | 1,022.07 | $ | 2.76 | 0.55 | % | 181 | 365 | ||||||||||||||||||
| American Funds Growth HLS Fund | ||||||||||||||||||||||||||||||||||
| Class IB | $ | 1,000.00 | $ | 944.04 | $ | 2.55 | $ | 1,000.00 | $ | 1,022.17 | $ | 2.66 | 0.53 | % | 181 | 365 | ||||||||||||||||||
| American Funds Growth-Income HLS Fund | ||||||||||||||||||||||||||||||||||
| Class IB | $ | 1,000.00 | $ | 908.31 | $ | 2.51 | $ | 1,000.00 | $ | 1,022.17 | $ | 2.66 | 0.53 | % | 181 | 365 | ||||||||||||||||||
| American Funds International HLS Fund | ||||||||||||||||||||||||||||||||||
| Class IB | $ | 1,000.00 | $ | 865.81 | $ | 2.50 | $ | 1,000.00 | $ | 1,022.12 | $ | 2.71 | 0.54 | % | 181 | 365 | ||||||||||||||||||
| American Funds New World HLS Fund | ||||||||||||||||||||||||||||||||||
| Class IB | $ | 1,000.00 | $ | 946.01 | $ | 2.56 | $ | 1,000.00 | $ | 1,022.17 | $ | 2.66 | 0.53 | % | 181 | 365 | ||||||||||||||||||
42
The Hartford
P.O. Box 5085
Hartford, CT 06102–5085
Hartford Series Fund, Inc. is underwritten and distributed by Hartford Securities Distribution Company, Inc.
“The Hartford” is The Hartford Financial Services Group, Inc. and its subsidiaries.
Hartford Series Fund, Inc. inception dates range from 1977 to date. Hartford Series Fund, Inc. is not a subsidiary of The Hartford but is underwritten, distributed by and advised by subsidiaries of The Hartford. Investments in Hartford Series Fund, Inc. are not guaranteed by The Hartford or any other entity.
This material is authorized for distribution only when preceded or accompanied by a current prospectus. The prospectus contains detailed information about the Funds, including investment objectives, risks and charges and expenses. Please read it carefully before you invest or send money.
AFHLSSAR-10 Printed in U.S.A ©2010 The Hartford, Hartford, CT 06115 |
| Hartford Advisers HLS Fund |
|
Hartford Advisers HLS Fund
| Manager Discussions (Unaudited) | 2 | ||
| Financial Statements | |||
| 5 | |||
| 12 | |||
| 13 | |||
| 14 | |||
| 15 | |||
| 16 | |||
| 30 | |||
| 32 | |||
| 34 | |||
| 34 | |||
| 35 | |||
| 36 | |||
| 37 | |||
This report is prepared for the general information of contract owners and qualified retirement plan participants. It is not an offer of contracts or of qualified retirement plans. It should not be used in connection with any offer, except in conjunction with the appropriate prospectus which contains all pertinent information including the applicable sales, administrative and other charges.
The views expressed in the Fund’s Manager Discussion under ‘‘Why did the Fund perform this way?’’ and ‘‘What is the outlook?’’ are views of the Fund’s subadvisers and portfolio management team through the end of the period and is subject to change based on market and other conditions.
Hartford Advisers HLS Fund inception 03/31/1983 |
| (subadvised by Wellington Management Company, LLP) |
| Investment objective – Seeks long-term total return. |
Performance Overview(1) 6/30/00 - 6/30/10
Growth of $10,000 investment

Barclays Capital Government/Credit Bond Index is an unmanaged, market-value-weighted index of all debt obligations of the U.S. Treasury and U.S. Government agencies (excluding mortgage-backed securities) and of all publicly-issued fixed-rate, nonconvertible, investment grade domestic corporate debt.
S&P 500 Index is a market capitalization-weighted price index composed of 500 widely held common stocks.
You cannot invest directly in an index.
The chart represents a hypothetical investment in the Fund. Performance data represents past performance and current performance could be higher or lower.
Average Annual Returns (as of 6/30/10) | ||||||||||||||||
| 6 | 1 | 5 | 10 | |||||||||||||
| Month† | Year | Year | Year | |||||||||||||
| Advisers IA | -4.04 | % | 14.08 | % | 1.45 | % | 0.77 | % | ||||||||
| Advisers IB | -4.16 | % | 13.79 | % | 1.20 | % | 0.53 | % | ||||||||
| Barclays Capital Government/ | ||||||||||||||||
| Credit Bond Index | 5.49 | % | 9.65 | % | 5.26 | % | 6.47 | % | ||||||||
| S&P 500 Index | -6.64 | % | 14.43 | % | -0.80 | % | -1.59 | % | ||||||||
| † | Not Annualized |
PAST PERFORMANCE IS NOT INDICATIVE OF FUTURE RESULTS.
| (1) | Growth of a $10,000 investment in Class IB shares will vary from the results seen on this page due to differences in the expense charged to this share class. |
Performance information may reflect historical or current expense waivers from the investment adviser, without which performance would have been lower. For information on current expense waivers/reimbursements, please see the prospectus.
The value of the contract will fluctuate so that when redeemed, it may be worth more or less than the original investment. The chart and table do not reflect the deduction of taxes that a shareholder would pay on portfolio distributions or the redemption of portfolio shares. The figures do not include sales charges or other fees which may be applied at the variable life insurance, variable annuity or qualified retirement plan product level. Any such additional sales charges or other fees would lower the Fund’s performance.
| Portfolio Managers | ||||||
| Steve T. Irons, CFA | John C. Keogh | Peter I. Higgins, CFA | Christopher L. Gootkind, CFA | |||
| Senior Vice President, Partner | Senior Vice President, Partner | Senior Vice President, Partner | Vice President |
How did the Fund perform?
The Class IA shares of the Hartford Advisers HLS Fund returned -4.04% for the six-month period ended June 30, 2010, versus the returns of -6.64% for the S&P 500 Index and 5.49% for the Barclays Capital Government/Credit Bond Index. The Fund outperformed the -4.37% return of the average fund in the Lipper Mixed-Asset Target Allocation Growth Funds VP-UF peer group, a group of funds with investment strategies similar to the Fund that hold between 60%-80% in equity securities, with the remainder invested in bonds, cash, and cash equivalents.
Why did the Fund perform this way?
After posting positive results early in the period, U.S. equities came under pressure during the latter part of the period amid rising risk aversion and concerns that the global economy will slip back into recession. The S&P 500 Index fell 6.64% for the period. At the forefront of investors’ minds were sovereign debt and solvency troubles in the Eurozone, slowing economic growth in China and the U.S., and uncertainty about the sustainability of corporate earnings growth. During the six-month period, all ten sectors within the S&P 500 Index fell, led by Materials (-13%), Energy (-12%), and Information Technology (-11%). Industrials (-1%), Consumer Discretionary (-2%) and Consumer Staples (-3%) declined the least on a relative basis.
The bond market, as measured by the Barclays Capital Government/Credit Bond Index, returned +5.49% during the period. During the second half of the period, yield spreads on risk
assets widened due to rising risk aversion, causing Treasury bonds to outperform non-Treasury bonds in credit sensitive sectors such as corporate bonds and asset backed securities.
The Fund has three primary levers to generate investment performance: equity investments, fixed income investments, and asset allocation among stocks, bonds, and cash. During the period, the equity portion of the Fund underperformed its benchmark while the fixed income portion of the Fund outperformed its benchmark. Asset allocation detracted from benchmark-relative (i.e. performance of the Fund as measured against the benchmark) results as the Fund was generally overweight (i.e. the Fund’s sector position was greater than the benchmark position) equities relative to the benchmark.
Equity underperformance versus its benchmark was driven by security selection, which was weakest in Information Technology, Health Care, and Consumer Discretionary. This was partially offset by stronger selection in Industrials and Utilities. Sector positioning, which is a result of bottom-up (i.e. stock by stock fundamental research) security selection, contributed positively to relative performance with overweight exposures to Industrials and Consumer Discretionary and underweight (i.e. the Fund’s sector position was less than the benchmark position) exposures to Materials and Energy.
Stocks that detracted the most from relative returns during the period were QUALCOMM (Information Technology), UCB (Health Care), and Western Union (Information Technology). Shares of QUALCOMM, a wireless telecommunications products and services company, fell during the period. It issued disappointing revenue and earnings guidance due to falling average selling prices for handsets associated with increased price competition. UCB, a biopharmaceutical company, was notified by the Food and Drug Administration that the patch version of its Parkinson's disease drug Neupro would not be approved for sale in the U.S. soon. With the company facing a delay in sales of roughly 2 years, shares fell. Shares of global money transfer company Western Union fell as the firm’s exposure to countries, including Spain and the Middle East, and sectors with high unemployment are expected to create headwinds. Microsoft (Information Technology) and Google (Information Technology) also detracted from absolute returns.
Top contributors to relative performance during the period were Buck Holdings-Dollar General (Consumer Discretionary), Cummins (Industrials), and PNC Financial (Financials). Retailer Dollar General continues to execute strongly on comparable store sales, square footage growth, and margin improvement plans. Dollar General has also been increasingly successful attracting more discretionary purchases through improved merchandising and revamped store format, helping drive the company’s share price higher. Shares of Cummins, a manufacturer of engine and power generation systems, moved higher after the company reported strong quarterly revenue and earnings and raised its revenue and earnings guidance for the 2010 fiscal year as end-demand recovers. Shares of aircraft manufacturer Boeing rose after the company conducted a successful test flight of its key new product, the 787 Dreamliner. Pittsburgh-based PNC Financial Services strengthened its loan loss reserves and announced better-than-expected accretion from the acquisition of National City, both of which helped the stock price increase in the period. The Fund’s holdings in Apple (Information Technology) also contributed positively to the Fund’s returns on an absolute basis.
The fixed income portion of the Fund outperformed its benchmark during the period. The Fund’s strong security selection within the corporate bond sector was the primary driver of the relative outperformance. Security selection within consumer asset-backed securities (ABS) and our exposure to agency mortgage-backed securities (MBS) were also additive to relative performance, while yield curve and duration positioning modestly detracted. Within the corporate bond sector, fundamentals continued to strengthen as companies have shored up balance sheets by accumulating cash and reducing refinancing risk by increasing the term of their debt. The agency MBS sector continued to benefit from the support of the Federal Reserve’s purchase program, where purchases exceeded supply and drove valuations higher. The consumer ABS market continued to benefit from technical factors, including demand from short-duration fixed income investors.
What is the outlook?
In the midst of this uncertainty, we continue to focus our efforts in the equity portion of the Fund on stock-by-stock fundamental research to construct a diversified large-cap core portfolio. We look for companies that exhibit the following qualities: industry leadership, strong balance sheets, solid management, high return on equity, and accelerating earnings. At the end of the period, our bottom-up investment approach resulted in overweight exposures in Health Care, Consumer Discretionary, and Information Technology. The Fund’s largest underweights relative to the S&P 500 Index were in the more defensive Consumer Staples, Utilities, and Telecommunication Services sectors.
We believe that fixed income volatility in the current environment is likely to remain elevated for the foreseeable future. We believe that the Federal Reserve will keep the policy rate low longer than market expectations and that inflation pressures will continue to be subdued. Treasury yields are likely to remain within a tight range in this scenario and, as a result, we are tactically managing the Fund’s duration (i.e. sensitivity to changes in interest rates) around neutral within the fixed income sleeve. Overall we maintain a constructive view on risk assets amid an improving economic backdrop and attractive valuations.
In the fixed income portion of the Fund we ended the period with a relative underweight to the government sector, as we believe that there are more compelling opportunities in other sectors. Within
the credit sector, valuations are attractive. Corporate earnings continue to improve and we believe that demand for the sector remains strong. We therefore ended the period with an overweight to the sector. Agency pass-through spreads over Treasuries are narrow, however, we continue to find value in select higher coupon pass-throughs given our benign outlook for prepayment risk. Lastly, we maintained modest exposures to asset-backed securities and commercial mortgage-backed securities at the end of the period.
The equity and fixed income managers will continue to work collaboratively to make decisions regarding portfolio weights in stocks, bonds, and cash. As of June 30, 2010, the Fund’s equity exposure was at 65% compared to 60% in its benchmark and at the upper end of the Fund’s 50-70% range.
| Diversification by Industry | ||||
| as of June 30, 2010 | ||||
| Percentage of | ||||
| Industry (Sector) | Net Assets | |||
| Equity Securities | ||||
| Automobiles & Components (Consumer Discretionary) | 1.5 | % | ||
| Banks (Financials) | 2.1 | |||
| Capital Goods (Industrials) | 4.8 | |||
| Consumer Durables & Apparel (Consumer Discretionary) | 0.5 | |||
| Diversified Financials (Financials) | 6.7 | |||
| Energy (Energy) | 7.0 | |||
| Food & Staples Retailing (Consumer Staples) | 0.8 | |||
| Food, Beverage & Tobacco (Consumer Staples) | 3.7 | |||
| Health Care Equipment & Services (Health Care) | 2.8 | |||
| Household & Personal Products (Consumer Staples) | 0.2 | |||
| Insurance (Financials) | 1.9 | |||
| Materials (Materials) | 1.4 | |||
| Media (Consumer Discretionary) | 1.4 | |||
| Pharmaceuticals, Biotechnology & Life Sciences (Health Care) | 7.9 | |||
| Retailing (Consumer Discretionary) | 4.8 | |||
| Semiconductors & Semiconductor Equipment (Information Technology) | 0.9 | |||
| Software & Services (Information Technology) | 6.3 | |||
| Technology Hardware & Equipment (Information Technology) | 6.5 | |||
| Telecommunication Services (Services) | 0.5 | |||
| Transportation (Industrials) | 2.5 | |||
| Utilities (Utilities) | 0.9 | |||
| Total | 65.1 | % | ||
| Fixed Income Securities | ||||
| Air Transportation (Transportation) | 0.3 | |||
| Arts, Entertainment and Recreation (Services) | 0.3 | |||
| Beverage and Tobacco Product Manufacturing (Consumer Staples) | 0.2 | |||
| Chemical Manufacturing (Basic Materials) | 0.0 | |||
| Computer and Electronic Product Manufacturing (Technology) | 0.1 | |||
| Electrical Equipment, Appliance Manufacturing (Technology) | 0.2 | |||
| Finance and Insurance (Finance) | 10.1 | |||
| Food Manufacturing (Consumer Staples) | 0.2 | |||
| Foreign Governments (Foreign Governments) | 0.0 | |||
| General Obligations (General Obligations) | 0.3 | |||
| Health Care and Social Assistance (Health Care) | 0.6 | |||
| Higher Education (Univ., Dorms, etc.) (Higher Education (Univ., Dorms, etc.)) | 0.2 | |||
| Housing (HFA'S, etc.) (Housing (HFA'S, etc.)) | 0.0 | |||
| Information (Technology) | 1.1 | |||
| Machinery Manufacturing (Capital Goods) | 0.2 | |||
| Mining (Basic Materials) | 0.0 | |||
| Miscellaneous Manufacturing (Capital Goods) | 0.0 | |||
| Motor Vehicle & Parts Manufacturing (Consumer Cyclical) | 0.3 | |||
| Petroleum and Coal Products Manufacturing (Energy) | 0.5 | |||
| Pipeline Transportation (Utilities) | 0.1 | |||
| Real Estate and Rental and Leasing (Finance) | 0.3 | |||
| Retail Trade (Consumer Cyclical) | 0.2 | |||
| Soap, Cleaning Compound and Toilet Manufacturing (Consumer Staples) | 0.4 | |||
| Tax Allocation (Tax Allocation) | 0.1 | |||
| Transportation (Transportation) | 0.3 | |||
| U.S. Government Agencies (U.S. Government Agencies) | 1.0 | |||
| U.S. Government Securities (U.S. Government Agencies) | 15.6 | |||
| Utilities (Utilities) | 1.1 | |||
| Utilities - Water and Sewer (Utilities - Water and Sewer) | 0.1 | |||
| Total | 33.8 | % | ||
| Short-Term Investments | 0.4 | |||
| Other Assets and Liabilities | 0.7 | |||
| Total | 100.0 | % | ||
| Diversification by Security Type | ||||
| as of June 30, 2010 | ||||
| Percentage of | ||||
| Category | Net Assets | |||
| Equity Securities | ||||
| Common Stocks | 65.1 | % | ||
| Warrants | 0.0 | |||
| Total | 65.1 | % | ||
| Fixed Income Securities | ||||
| Asset & Commercial Mortgage Backed Securities | 1.0 | % | ||
| Corporate Bonds: Investment Grade | 14.3 | |||
| Corporate Bonds: Non-Investment Grade | 0.9 | |||
| Municipal Bonds | 1.0 | |||
| U.S. Government Agencies | 1.0 | |||
| U.S. Government Securities | 15.6 | |||
| Total | 33.8 | % | ||
| Short-Term Investments | 0.4 | % | ||
| Other Assets and Liabilities | 0.7 | |||
| Total | 100.0 | % | ||
| Hartford Advisers HLS Fund |
| June 30, 2010 (Unaudited) |
| (000’s Omitted) |
| Shares or Principal Amount | Market Value ╪ | ||||||
| COMMON STOCKS - 65.1% | |||||||
| Automobiles & Components - 1.5% | |||||||
| 1,955 | Ford Motor Co. · | $ | 19,701 | ||||
| 1,135 | Harley-Davidson, Inc. | 25,225 | |||||
| 491 | Johnson Controls, Inc. | 13,199 | |||||
| 58,125 | |||||||
| Banks - 2.1% | |||||||
| 364 | PNC Financial Services Group, Inc. | 20,589 | |||||
| 6 | Standard Chartered plc | 158 | |||||
| 2,302 | Wells Fargo & Co. | 58,940 | |||||
| 79,687 | |||||||
| Capital Goods - 4.8% | |||||||
| 170 | 3M Co. | 13,413 | |||||
| 160 | Cummins, Inc. | 10,394 | |||||
| 609 | European Aeronautic Defence and Space Co. N.V. | 12,436 | |||||
| 1,792 | General Electric Co. | 25,846 | |||||
| 976 | Ingersoll-Rand plc | 33,659 | |||||
| 987 | Masco Corp. | 10,615 | |||||
| 677 | PACCAR, Inc. | 27,000 | |||||
| 284 | Rockwell Collins, Inc. | 15,073 | |||||
| 7 | Siemens AG | 606 | |||||
| 116 | Siemens AG ADR | 10,341 | |||||
| 1,635 | Textron, Inc. | 27,742 | |||||
| 187,125 | |||||||
| Consumer Durables & Apparel - 0.5% | |||||||
| 398 | Stanley Black & Decker, Inc. | 20,082 | |||||
| Diversified Financials - 6.7% | |||||||
| 604 | Ameriprise Financial, Inc. | 21,808 | |||||
| 3,920 | Bank of America Corp. | 56,335 | |||||
| 1,833 | Discover Financial Services, Inc. | 25,625 | |||||
| 261 | Goldman Sachs Group, Inc. | 34,314 | |||||
| 1,359 | Invesco Ltd. | 22,870 | |||||
| 1,203 | JP Morgan Chase & Co. | 44,034 | |||||
| 134 | Northern Trust Corp. | 6,263 | |||||
| 642 | SEI Investments Co. | 13,067 | |||||
| 112 | UBS AG | 1,478 | |||||
| 2,523 | UBS AG ADR | 33,349 | |||||
| 259,143 | |||||||
| Energy - 7.0% | |||||||
| 525 | Anadarko Petroleum Corp. | 18,962 | |||||
| 293 | Chevron Corp. | 19,870 | |||||
| 923 | ConocoPhillips Holding Co. | 45,320 | |||||
| 1,022 | Exxon Mobil Corp. | 58,348 | |||||
| 425 | Hess Corp. | 21,369 | |||||
| 545 | National Oilwell Varco, Inc. | 18,013 | |||||
| 391 | Occidental Petroleum Corp. | 30,181 | |||||
| 229 | Southwestern Energy Co. · | 8,848 | |||||
| 692 | Suncor Energy, Inc. | 20,383 | |||||
| 170 | Ultra Petroleum Corp. · | 7,536 | |||||
| 1,040 | Williams Cos., Inc. | 19,019 | |||||
| 267,849 | |||||||
| Food & Staples Retailing - 0.8% | |||||||
| 1,006 | CVS/Caremark Corp. | 29,487 | |||||
| Food, Beverage & Tobacco - 3.7% | |||||||
| 908 | General Mills, Inc. | 32,266 | |||||
| 1,441 | Kraft Foods, Inc. | 40,337 | |||||
| 1,133 | PepsiCo, Inc. | 69,069 | |||||
| 141,672 | |||||||
| Health Care Equipment & Services - 2.8% | |||||||
| 2,127 | Boston Scientific Corp. · | 12,338 | |||||
| 33 | Intuitive Surgical, Inc. · | 10,321 | |||||
| 843 | Medtronic, Inc. | 30,579 | |||||
| 407 | St. Jude Medical, Inc. · | 14,674 | |||||
| 892 | UnitedHealth Group, Inc. | 25,333 | |||||
| 309 | Zimmer Holdings, Inc. · | 16,680 | |||||
| 109,925 | |||||||
| Household & Personal Products - 0.2% | |||||||
| 130 | Energizer Holdings, Inc. · | 6,531 | |||||
| Insurance - 1.9% | |||||||
| 283 | ACE Ltd. | 14,587 | |||||
| 713 | Marsh & McLennan Cos., Inc. | 16,083 | |||||
| 608 | Principal Financial Group, Inc. | 14,261 | |||||
| 2,042 | Prudential plc | 15,401 | |||||
| 657 | Unum Group | 14,248 | |||||
| 74,580 | |||||||
| Materials - 1.4% | |||||||
| 688 | Dow Chemical Co. | 16,326 | |||||
| 795 | Monsanto Co. | 36,745 | |||||
| 53,071 | |||||||
| Media - 1.4% | |||||||
| 3,122 | Comcast Corp. Class A | 54,229 | |||||
| Pharmaceuticals, Biotechnology & Life Sciences - 7.9% | |||||||
| 411 | Amgen, Inc. · | 21,624 | |||||
| 252 | Celgene Corp. · | 12,811 | |||||
| 1,332 | Daiichi Sankyo Co., Ltd. | 23,794 | |||||
| 1,849 | Elan Corp. plc ADR · | 8,320 | |||||
| 582 | Eli Lilly & Co. | 19,480 | |||||
| 110 | Forest Laboratories, Inc. · | 3,028 | |||||
| 199 | Genzyme Corp. · | 10,078 | |||||
| 357 | Gilead Sciences, Inc. · | 12,221 | |||||
| 164 | Johnson & Johnson | 9,656 | |||||
| 1,132 | Merck & Co., Inc. | 39,596 | |||||
| 3,125 | Pfizer, Inc. | 44,557 | |||||
| 574 | Qiagen N.V. · | 11,038 | |||||
| 144 | Roche Holding AG | 19,826 | |||||
| 1,181 | Shionogi & Co., Ltd. | 24,478 | |||||
| 947 | UCB S.A. | 29,738 | |||||
| 460 | Vertex Pharmaceuticals, Inc. · | 15,144 | |||||
| 305,389 | |||||||
| Retailing - 4.8% | |||||||
| 11,241 | Buck Holdings L.P. ⌂·† | 25,345 | |||||
| 684 | Home Depot, Inc. | 19,197 | |||||
| 377 | Kohl's Corp. · | 17,898 | |||||
| 2,294 | Lowe's Co., Inc. | 46,840 | |||||
| 683 | Nordstrom, Inc. | 21,986 | |||||
| 762 | Staples, Inc. | 14,516 | |||||
| 767 | Target Corp. | 37,689 | |||||
| 183,471 | |||||||
| Semiconductors & Semiconductor Equipment - 0.9% | |||||||
| 339 | Broadcom Corp. Class A | 11,190 | |||||
| 1,367 | Maxim Integrated Products, Inc. | 22,872 | |||||
| 34,062 | |||||||
The accompanying notes are an integral part of these financial statements.
| Hartford Advisers HLS Fund |
| Schedule of Investments – (continued) |
| June 30, 2010 (Unaudited) |
| (000’s Omitted) |
| Shares or Principal Amount | Market Value ╪ | ||||||
| COMMON STOCKS - 65.1% - (continued) | |||||||
| Software & Services - 6.3% | |||||||
| 867 | Accenture plc | $ | 33,521 | ||||
| 440 | Adobe Systems, Inc. · | 11,619 | |||||
| 654 | Automatic Data Processing, Inc. | 26,322 | |||||
| 1,249 | eBay, Inc. · | 24,483 | |||||
| 90 | Google, Inc. · | 39,956 | |||||
| 2,377 | Microsoft Corp. | 54,692 | |||||
| 2,585 | Western Union Co. | 38,545 | |||||
| 1,138 | Yahoo!, Inc. · | 15,732 | |||||
| 244,870 | |||||||
| Technology Hardware & Equipment - 6.5% | |||||||
| 280 | Apple, Inc. · | 70,303 | |||||
| 2,746 | Cisco Systems, Inc. · | 58,522 | |||||
| 1,253 | Dell, Inc. · | 15,114 | |||||
| 1,437 | EMC Corp. · | 26,297 | |||||
| 406 | Hewlett-Packard Co. | 17,554 | |||||
| 1,720 | Qualcomm, Inc. | 56,498 | |||||
| 193 | Research In Motion Ltd. · | 9,497 | |||||
| 253,785 | |||||||
| Telecommunication Services - 0.5% | |||||||
| 931 | Vodafone Group plc ADR | 19,244 | |||||
| Transportation - 2.5% | |||||||
| 2,551 | Delta Air Lines, Inc. · | 29,971 | |||||
| 188 | FedEx Corp. | 13,169 | |||||
| 597 | Kansas City Southern · | 21,690 | |||||
| 606 | United Parcel Service, Inc. Class B | 34,458 | |||||
| 99,288 | |||||||
| Utilities - 0.9% | |||||||
| 956 | Companhia Energetica de Minas Gerais ADR | 14,030 | |||||
| 2,484 | National Grid plc | 18,132 | |||||
| 32,162 | |||||||
| Total common stocks | |||||||
| (cost $2,587,919) | $ | 2,513,777 | |||||
| WARRANTS - 0.0% | |||||||
| Banks - 0.0% | |||||||
| 524 | Washington Mutual, Inc. Private Placement ⌂·† | $ | – | ||||
| Total warrants | |||||||
| (cost $–) | $ | – | |||||
| ASSET & COMMERCIAL MORTGAGE BACKED SECURITIES -1.0% | |||||||
| Finance and Insurance - 1.0% | |||||||
| Bear Stearns Commercial Mortgage | |||||||
| Securities, Inc. | |||||||
| $ | 450 | 5.61%, 11/15/2033 | $ | 465 | |||
| Citibank Credit Card Issuance Trust | |||||||
| 11,945 | 5.65%, 09/20/2019 | 13,793 | |||||
| Commercial Mortgage Asset Trust | |||||||
| 107 | 6.64%, 01/17/2032 | 107 | |||||
| Crusade Global Trust | |||||||
| 23 | 0.45%, 01/16/2035 Δ | 23 | |||||
| 80 | 0.60%, 06/17/2037 Δ | 78 | |||||
| 53 | 0.73%, 09/18/2034 Δ | 53 | |||||
| 32 | 0.90%, 01/17/2034 Δ | 32 | |||||
| CS First Boston Mortgage Securities Corp. | |||||||
| 450 | 3.94%, 05/15/2038 | 464 | |||||
| Goldman Sachs Mortgage Securities Corp. II | |||||||
| 110 | 0.87%, 03/06/2020 ■Δ | 95 | |||||
| Harley-Davidson Motorcycle Trust | |||||||
| 10,605 | 5.21%, 06/17/2013 | 10,899 | |||||
| Interstar Millennium Trust | |||||||
| 103 | 0.83%, 07/07/2034 Δ | 103 | |||||
| Marriott Vacation Club Owner Trust | |||||||
| 778 | 5.36%, 10/20/2028 ■ | 791 | |||||
| Medallion Trust | |||||||
| 105 | 0.58%, 02/27/2039 Δ | 103 | |||||
| 58 | 0.63%, 05/25/2035 Δ | 57 | |||||
| 63 | 0.73%, 12/21/2033 Δ | 62 | |||||
| National RMBS Trust | |||||||
| 148 | 0.65%, 03/20/2034 Δ | 147 | |||||
| New Century Home Equity Loan Trust | |||||||
| 8 | 0.64%, 03/25/2035 Δ | 8 | |||||
| Prudential Commercial Mortgage Trust | |||||||
| 570 | 4.49%, 02/11/2036 | 597 | |||||
| USAA Automotive Owner Trust | |||||||
| 11,285 | 4.50%, 10/15/2013 | 11,710 | |||||
| Wachovia Bank Commercial Mortgage Trust | |||||||
| 100 | 0.47%, 07/15/2042 Δ | 99 | |||||
| Westpac Securitisation Trust | |||||||
| 123 | 0.61%, 03/23/2036 Δ | 120 | |||||
| 39,806 | |||||||
| Total asset & commercial mortgage backed securities | |||||||
| (cost $37,145) | $ | 39,806 | |||||
| CORPORATE BONDS: INVESTMENT GRADE - 14.3% | |||||||
| Air Transportation - 0.3% | |||||||
| Continental Airlines, Inc. | |||||||
| $ | 4,067 | 5.98%, 04/19/2022 | $ | 3,989 | |||
| Southwest Airlines Co. | |||||||
| 2,700 | 5.75%, 12/15/2016 | 2,854 | |||||
| 3,176 | 6.15%, 08/01/2022 | 3,271 | |||||
| 10,114 | |||||||
| Arts, Entertainment and Recreation - 0.3% | |||||||
| CBS Corp. | |||||||
| 575 | 5.75%, 04/15/2020 | 617 | |||||
| Comcast Corp. | |||||||
| 8,000 | 5.90%, 03/15/2016 | 9,016 | |||||
| News America Holdings, Inc. | |||||||
| 1,275 | 5.65%, 08/15/2020 | 1,408 | |||||
| 11,041 | |||||||
| Beverage and Tobacco Product Manufacturing - 0.2% | |||||||
| Anheuser-Busch Cos., Inc. | |||||||
| 170 | 5.50%, 01/15/2018 | 185 | |||||
| Anheuser-Busch InBev N.V. | |||||||
| 75 | 5.38%, 01/15/2020 | 81 | |||||
| 4,200 | 7.75%, 01/15/2019 ■ | 5,098 | |||||
| Cia Brasileira de Bebidas | |||||||
| 300 | 10.50%, 12/15/2011 | 338 | |||||
| Coca-Cola Enterprises, Inc. | |||||||
| 500 | 8.50%, 02/01/2022 | 690 | |||||
The accompanying notes are an integral part of these financial statements.
| Shares or Principal Amount | Market Value ╪ | ||||||
| CORPORATE BONDS: INVESTMENT GRADE - 14.3% - (continued) | |||||||
| Beverage and Tobacco Product Manufacturing - 0.2% - (continued) | |||||||
| Diageo Capital plc | |||||||
| $ | 430 | 5.20%, 01/30/2013 | $ | 468 | |||
| Philip Morris International, Inc. | |||||||
| 270 | 5.65%, 05/16/2018 | 295 | |||||
| 7,155 | |||||||
| Chemical Manufacturing - 0.0% | |||||||
| Yara International ASA | |||||||
| 235 | 7.88%, 06/11/2019 ■ | 281 | |||||
| Computer and Electronic Product Manufacturing - 0.1% | |||||||
| Dell, Inc. | |||||||
| 2,735 | 5.88%, 06/15/2019 | 3,073 | |||||
| Thermo Fisher Scientific, Inc. | |||||||
| 845 | 3.20%, 05/01/2015 | 872 | |||||
| 3,945 | |||||||
| Electrical Equipment, Appliance Manufacturing - 0.2% | |||||||
| General Electric Co. | |||||||
| 6,925 | 5.00%, 02/01/2013 | 7,426 | |||||
| 95 | 6.00%, 08/07/2019 | 103 | |||||
| 7,529 | |||||||
| Finance and Insurance - 8.2% | |||||||
| Ace INA Holdings, Inc. | |||||||
| 700 | 5.88%, 06/15/2014 | 775 | |||||
| Allied World Assurance | |||||||
| 260 | 7.50%, 08/01/2016 | 286 | |||||
| American Express Centurion Bank | |||||||
| 6,350 | 6.00%, 09/13/2017 | 6,978 | |||||
| ANZ National Ltd. | |||||||
| 1,360 | 2.38%, 12/21/2012 ■ | 1,377 | |||||
| Aviva plc | |||||||
| 215 | 0.88%, 06/19/2017 Δ | 183 | |||||
| AXA Financial, Inc. | |||||||
| 6,400 | 7.00%, 04/01/2028 | 6,790 | |||||
| Bank of America Corp. | |||||||
| 200 | 7.38%, 05/15/2014 | 224 | |||||
| Barclays Bank plc | |||||||
| 155 | 5.00%, 09/22/2016 | 159 | |||||
| 140 | 6.75%, 05/22/2019 | 156 | |||||
| Berkshire Hathaway Finance Corp. | |||||||
| 5,500 | 4.85%, 01/15/2015 | 6,041 | |||||
| Brandywine Operating Partnership | |||||||
| 6,235 | 6.00%, 04/01/2016 | 6,356 | |||||
| CDP Financial, Inc. | |||||||
| 3,475 | 4.40%, 11/25/2019 ■ | 3,568 | |||||
| Cincinnati Financial Corp. | |||||||
| 10,000 | 6.92%, 05/15/2028 | 10,123 | |||||
| Citibank NA | |||||||
| 26,000 | 1.88%, 06/04/2012 | 26,524 | |||||
| Citigroup, Inc. | |||||||
| 8,800 | 6.00%, 10/31/2033 | 7,872 | |||||
| 520 | 8.13%, 07/15/2039 | 620 | |||||
| Credit Agricole | |||||||
| 3,950 | 3.50%, 04/13/2015 ■ | 3,866 | |||||
| Credit Suisse New York | |||||||
| 150 | 5.00%, 05/15/2013 | 160 | |||||
| DBS Bank Ltd. | |||||||
| 250 | 0.66%, 05/16/2012 ■Δ | 236 | |||||
| Eaton Vance Corp. | |||||||
| 3,305 | 6.50%, 10/02/2017 | 3,759 | |||||
| Everest Reinsurance Holdings, Inc. | |||||||
| 4,525 | 5.40%, 10/15/2014 | 4,808 | |||||
| General Electric Capital Corp. | |||||||
| 3,750 | 2.80%, 01/08/2013 | 3,792 | |||||
| 125 | 3.75%, 11/14/2014 | 128 | |||||
| 150 | 5.50%, 01/08/2020 | 158 | |||||
| 85 | 5.63%, 05/01/2018 | 90 | |||||
| 125 | 5.90%, 05/13/2014 | 138 | |||||
| Goldman Sachs Group, Inc. | |||||||
| 20,000 | 1.63%, 07/15/2011 | 20,235 | |||||
| 6,000 | 5.63%, 01/15/2017 | 6,067 | |||||
| 5,500 | 6.00%, 05/01/2014 | 5,911 | |||||
| 300 | 6.15%, 04/01/2018 | 314 | |||||
| Health Care Properties | |||||||
| 6,530 | 6.00%, 01/30/2017 | 6,593 | |||||
| HSBC Finance Corp. | |||||||
| 12,500 | 5.50%, 01/19/2016 | 13,382 | |||||
| HSBC Holdings plc | |||||||
| 240 | 0.49%, 10/06/2016 Δ | 236 | |||||
| Jackson National Life Insurance Co. | |||||||
| 6,250 | 8.15%, 03/15/2027 ■ | 6,611 | |||||
| John Deere Capital Corp. | |||||||
| 2,390 | 2.95%, 03/09/2015 | 2,454 | |||||
| 2,175 | 4.88%, 10/15/2010 | 2,198 | |||||
| JP Morgan Chase & Co. | |||||||
| 3,500 | 3.70%, 01/20/2015 | 3,580 | |||||
| 10,375 | 5.13%, 09/15/2014 | 11,071 | |||||
| 80 | 6.30%, 04/23/2019 | 90 | |||||
| Kimco Realty Corp. | |||||||
| 7,880 | 5.78%, 03/15/2016 | 8,435 | |||||
| Kreditanstalt fuer Wiederaufbau | |||||||
| 695 | 4.00%, 01/27/2020 | 723 | |||||
| Liberty Mutual Group, Inc. | |||||||
| 8,750 | 5.75%, 03/15/2014 ■ | 9,098 | |||||
| Liberty Property L.P. | |||||||
| 1,725 | 6.63%, 10/01/2017 | 1,852 | |||||
| Merrill Lynch & Co., Inc. | |||||||
| 11,000 | 5.00%, 02/03/2014 | 11,383 | |||||
| 1,000 | 6.40%, 08/28/2017 | 1,043 | |||||
| 6,000 | 6.88%, 04/25/2018 | 6,401 | |||||
| Morgan Stanley | |||||||
| 13,000 | 5.38%, 10/15/2015 | 13,167 | |||||
| 250 | 5.63%, 09/23/2019 | 242 | |||||
| 100 | 6.63%, 04/01/2018 | 105 | |||||
| National City Corp. | |||||||
| 4,250 | 6.88%, 05/15/2019 | 4,771 | |||||
| New England Mutual Life Insurance Co. | |||||||
| 6,000 | 7.88%, 02/15/2024 ■ | 6,834 | |||||
| Nomura Holdings, Inc. | |||||||
| 1,420 | 5.00%, 03/04/2015 | 1,500 | |||||
| Nordea Bank Ab | |||||||
| 150 | 0.74%, 06/09/2016 Δ | 146 | |||||
| 1,790 | 3.70%, 11/13/2014 ■ | 1,823 | |||||
| Paccar Financial Corp. | |||||||
| 1,460 | 1.95%, 12/17/2012 | 1,475 | |||||
The accompanying notes are an integral part of these financial statements.
| Hartford Advisers HLS Fund |
| Schedule of Investments – (continued) |
| June 30, 2010 (Unaudited) |
| (000’s Omitted) |
| Shares or Principal Amount | Market Value ╪ | ||||||
| CORPORATE BONDS: INVESTMENT GRADE - 14.3% - (continued) | |||||||
| Finance and Insurance - 8.2% - (continued) | |||||||
| PNC Funding Corp. | |||||||
| $ | 105 | 5.13%, 02/08/2020 | $ | 109 | |||
| 135 | 5.40%, 06/10/2014 | 148 | |||||
| Principal Life Income Funding | |||||||
| 160 | 0.60%, 11/15/2010 Δ | 160 | |||||
| Prologis Trust | |||||||
| 6,500 | 5.63%, 11/15/2016 | 6,111 | |||||
| Prudential Financial, Inc. | |||||||
| 8,000 | 5.50%, 03/15/2016 | 8,427 | |||||
| Rabobank Nederland N.V. NY | |||||||
| 3,900 | 3.20%, 03/11/2015 ■ | 3,943 | |||||
| Realty Income Corp. | |||||||
| 4,830 | 6.75%, 08/15/2019 | 5,330 | |||||
| Republic New York Capital I | |||||||
| 500 | 7.75%, 11/15/2006 | 487 | |||||
| Royal Bank of Scotland plc | |||||||
| 2,600 | 4.88%, 03/16/2015 | 2,587 | |||||
| Simon Property Group L.P. | |||||||
| 9,065 | 6.10%, 05/01/2016 | 10,062 | |||||
| Societe Financement de l'Economie Francaise | |||||||
| 1,025 | 2.13%, 01/30/2012 ■ | 1,040 | |||||
| 760 | 3.38%, 05/05/2014 ■ | 794 | |||||
| Sovereign Bancorp, Inc. | |||||||
| 4,795 | 8.75%, 05/30/2018 | 5,497 | |||||
| Sovereign Capital Trust IV | |||||||
| 7,250 | 7.91%, 06/13/2036 | 6,715 | |||||
| Standard Chartered Bank | |||||||
| 160 | 6.40%, 09/26/2017 ■ | 172 | |||||
| Svenska Handelsbanken Ab | |||||||
| 2,900 | 4.88%, 06/10/2014 ■ | 3,062 | |||||
| Temasek Financial I Ltd. | |||||||
| 320 | 4.50%, 09/21/2015 ■ | 350 | |||||
| UBS AG Stamford | |||||||
| 235 | 5.88%, 12/20/2017 | 249 | |||||
| UnitedHealth Group, Inc. | |||||||
| 1,891 | 5.50%, 11/15/2012 | 2,031 | |||||
| Wachovia Corp. | |||||||
| 10,000 | 5.25%, 08/01/2014 | 10,590 | |||||
| WEA Finance LLC | |||||||
| 5,000 | 7.13%, 04/15/2018 ■ | 5,642 | |||||
| 316,413 | |||||||
| Food Manufacturing - 0.2% | |||||||
| Kellogg Co. | |||||||
| 430 | 4.25%, 03/06/2013 | 461 | |||||
| 325 | 5.13%, 12/03/2012 | 353 | |||||
| Kraft Foods, Inc. | |||||||
| 3,800 | 4.13%, 02/09/2016 | 4,011 | |||||
| 285 | 5.38%, 02/10/2020 | 305 | |||||
| Wrigley Jr., William Co. | |||||||
| 3,900 | 3.70%, 06/30/2014 ■ | 3,945 | |||||
| 9,075 | |||||||
| Foreign Governments - 0.0% | |||||||
| Hungary (Republic of) | |||||||
| 1,635 | 6.25%, 01/29/2020 | 1,609 | |||||
| Kommunalbanken AS | |||||||
| 350 | 3.38%, 11/15/2011 | 361 | |||||
| 1,970 | |||||||
| Health Care and Social Assistance - 0.6% | |||||||
| CVS Caremark Corp. | |||||||
| 190 | 5.75%, 06/01/2017 | 211 | |||||
| CVS Corp. | |||||||
| 7,725 | 6.13%, 08/15/2016 | 8,837 | |||||
| Express Scripts, Inc. | |||||||
| 1,020 | 6.25%, 06/15/2014 | 1,155 | |||||
| Merck & Co., Inc. | |||||||
| 2,100 | 4.00%, 06/30/2015 | 2,274 | |||||
| Schering-Plough Corp. | |||||||
| 9,000 | 5.30%, 12/01/2013 | 10,096 | |||||
| 22,573 | |||||||
| Information - 1.1% | |||||||
| AT&T, Inc. | |||||||
| 105 | 5.50%, 02/01/2018 | 116 | |||||
| 2,510 | 6.80%, 05/15/2036 | 2,879 | |||||
| BellSouth Telecommunications | |||||||
| 650 | 7.00%, 12/01/2095 | 720 | |||||
| Cellco Partnership - Verizon Wireless Capital | |||||||
| 395 | 5.55%, 02/01/2014 | 443 | |||||
| Cingular Wireless Services, Inc. | |||||||
| 475 | 7.88%, 03/01/2011 | 497 | |||||
| Deutsche Telekom International Finance | |||||||
| B.V. | |||||||
| 100 | 6.00%, 07/08/2019 | 111 | |||||
| Fiserv, Inc. | |||||||
| 6,400 | 6.13%, 11/20/2012 | 7,018 | |||||
| France Telecom S.A. | |||||||
| 1,300 | 4.38%, 07/08/2014 | 1,402 | |||||
| 175 | 5.38%, 07/08/2019 | 191 | |||||
| Intuit, Inc. | |||||||
| 7,900 | 5.40%, 03/15/2012 | 8,387 | |||||
| Oracle Corp. | |||||||
| 2,850 | 6.13%, 07/08/2039 | 3,333 | |||||
| SBA Tower Trust | |||||||
| 2,035 | 4.25%, 04/15/2015 ■ | 2,134 | |||||
| Telecom Italia Capital | |||||||
| 2,900 | 7.00%, 06/04/2018 | 3,089 | |||||
| Telemar Norte Leste S.A. | |||||||
| 205 | 9.50%, 04/23/2019 ■ | 245 | |||||
| Time Warner Cable, Inc. | |||||||
| 4,870 | 5.85%, 05/01/2017 | 5,347 | |||||
| 125 | 7.50%, 04/01/2014 | 145 | |||||
| Verizon Communications, Inc. | |||||||
| 240 | 4.35%, 02/15/2013 | 257 | |||||
| 5,000 | 5.35%, 02/15/2011 | 5,135 | |||||
| Verizon Global Funding Corp. | |||||||
| 500 | 7.25%, 12/01/2010 | 513 | |||||
| Verizon New England, Inc. | |||||||
| 375 | 6.50%, 09/15/2011 | 396 | |||||
| 42,358 | |||||||
| Machinery Manufacturing - 0.2% | |||||||
| Xerox Corp. | |||||||
| 6,000 | 8.25%, 05/15/2014 | 7,033 | |||||
| Mining - 0.0% | |||||||
| Anglo American Capital plc | |||||||
| 125 | 9.38%, 04/08/2014 ■ | 150 | |||||
The accompanying notes are an integral part of these financial statements.
| Shares or Principal Amount | Market Value ╪ | ||||||
| CORPORATE BONDS: INVESTMENT GRADE - 14.3% - (continued) | |||||||
| Miscellaneous Manufacturing - 0.0% | |||||||
| Hutchison Whampoa International Ltd. | |||||||
| $ | 215 | 7.63%, 04/09/2019 ■ | $ | 256 | |||
| Motor Vehicle & Parts Manufacturing - 0.3% | |||||||
| DaimlerChrysler NA Holdings Corp. | |||||||
| 9,550 | 6.50%, 11/15/2013 | 10,689 | |||||
| Petroleum and Coal Products Manufacturing - 0.5% | |||||||
| Atmos Energy Corp. | |||||||
| 5,875 | 6.35%, 06/15/2017 | 6,534 | |||||
| EnCana Corp. | |||||||
| 305 | 5.90%, 12/01/2017 | 343 | |||||
| Hess Corp. | |||||||
| 140 | 8.13%, 02/15/2019 | 175 | |||||
| Marathon Oil Corp. | |||||||
| 165 | 7.50%, 02/15/2019 | 198 | |||||
| Motiva Enterprises LLC | |||||||
| 420 | 5.75%, 01/15/2020 ■ | 462 | |||||
| Ras Laffan Liquefied Natural Gas Co., Ltd. | |||||||
| 1,200 | 5.50%, 09/30/2014 ■ | 1,279 | |||||
| Shell International Finance B.V. | |||||||
| 6,400 | 4.38%, 03/25/2020 | 6,616 | |||||
| Weatherford International Ltd. | |||||||
| 5,500 | 5.95%, 06/15/2012 | 5,891 | |||||
| 21,498 | |||||||
| Pipeline Transportation - 0.1% | |||||||
| Kinder Morgan Energy Partners L.P. | |||||||
| 5,000 | 6.95%, 01/15/2038 | 5,313 | |||||
| Real Estate and Rental and Leasing - 0.3% | |||||||
| COX Communications, Inc. | |||||||
| 440 | 4.63%, 06/01/2013 | 469 | |||||
| 9,000 | 5.45%, 12/15/2014 | 9,934 | |||||
| 10,403 | |||||||
| Retail Trade - 0.2% | |||||||
| Lowe's Co., Inc. | |||||||
| 3,400 | 4.63%, 04/15/2020 | 3,648 | |||||
| Staples, Inc. | |||||||
| 2,525 | 9.75%, 01/15/2014 | 3,097 | |||||
| 6,745 | |||||||
| Soap, Cleaning Compound and Toilet Manufacturing - 0.4% | |||||||
| Procter & Gamble Co. | |||||||
| 10,929 | 9.36%, 01/01/2021 | 13,826 | |||||
| Utilities - 1.1% | |||||||
| Consolidated Edison Co. of NY | |||||||
| 4,605 | 5.30%, 12/01/2016 | 5,120 | |||||
| E.On International Finance | |||||||
| 250 | 5.80%, 04/30/2018 ■ | 282 | |||||
| Enel Finance International S.A. | |||||||
| 300 | 3.88%, 10/07/2014 ■ | 302 | |||||
| 4,045 | 6.80%, 09/15/2037 ■ | 4,326 | |||||
| Indianapolis Power and Light | |||||||
| 8,000 | 6.60%, 06/01/2037 ■ | 9,149 | |||||
| MidAmerican Energy Co. | |||||||
| 6,000 | 5.65%, 07/15/2012 | 6,495 | |||||
| Niagara Mohawk Power Corp. | |||||||
| 2,510 | 3.55%, 10/01/2014 ■ | 2,575 | |||||
| Southern California Edison Co. | |||||||
| 8,000 | 5.55%, 01/15/2037 | 8,749 | |||||
| Taqa Abu Dhabi National Energy Co. | |||||||
| 2,965 | 5.88%, 10/27/2016 ■ | 3,045 | |||||
| Wisconsin Electirc Power Co. | |||||||
| 1,960 | 4.25%, 12/15/2019 | 2,037 | |||||
| 42,080 | |||||||
| Total corporate bonds: investment grade | |||||||
| (cost $519,424) | $ | 550,447 | |||||
| CORPORATE BONDS: NON-INVESTMENT GRADE - 0.9% | |||||||
| Finance and Insurance - 0.9% | |||||||
| Capital One Capital IV | |||||||
| $ | 1,625 | 6.75%, 02/17/2037 | $ | 1,357 | |||
| Discover Financial Services, Inc. | |||||||
| 7,220 | 6.45%, 06/12/2017 | 7,286 | |||||
| International Lease Finance Corp. | |||||||
| 6,350 | 5.63%, 09/15/2010 | 6,326 | |||||
| Postal Square L.P. | |||||||
| 15,252 | 8.95%, 06/15/2022 | 20,322 | |||||
| Southern Capital Corp. | |||||||
| 72 | 5.70%, 06/30/2022 ■ | 47 | |||||
| 35,338 | |||||||
| Total corporate bonds: non-investment grade | |||||||
| (cost $32,331) | $ | 35,338 | |||||
| MUNICIPAL BONDS - 1.0% | |||||||
| General Obligations - 0.3% | |||||||
| Chicago Metropolitan Water Reclamation | |||||||
| Dist Taxable, | |||||||
| $ | 685 | 5.72%, 12/01/2038 | $ | 743 | |||
| Los Angeles USD, | |||||||
| 4,300 | 5.75%, 07/01/2034 | 4,211 | |||||
| Oregon School Boards Association, Taxable | |||||||
| Pension, | |||||||
| 10,000 | 4.76%, 06/30/2028 | 9,062 | |||||
| 14,016 | |||||||
| Higher Education (Univ., Dorms, etc.) - 0.2% | |||||||
| Curators University, MO, Taxable System | |||||||
| Facs Rev, | |||||||
| 2,170 | 5.96%, 11/01/2039 | 2,349 | |||||
| Massachusetts School Building Auth, | |||||||
| 2,500 | 5.72%, 08/15/2039 | 2,685 | |||||
| University of California, | |||||||
| 1,960 | 5.77%, 05/15/2043 | 2,004 | |||||
| 7,038 | |||||||
| Housing (HFA'S, etc.) - 0.0% | |||||||
| University of California, | |||||||
| 1,935 | 6.58%, 05/15/2049 | 2,064 | |||||
| Tax Allocation - 0.1% | |||||||
| Dallas, TX, Area Rapid Transit Taxable Sales | |||||||
| Tax Rev, | |||||||
| 2,200 | 6.00%, 12/01/2044 | 2,436 | |||||
| Transportation - 0.3% | |||||||
| Bay Area Toll Auth, | |||||||
| 3,100 | 6.26%, 04/01/2049 | 3,259 | |||||
The accompanying notes are an integral part of these financial statements.
| Hartford Advisers HLS Fund |
| Schedule of Investments – (continued) |
| June 30, 2010 (Unaudited) |
| (000’s Omitted) |
| Shares or Principal Amount | Market Value ╪ | ||||||
| MUNICIPAL BONDS - 1.0% - (continued) | |||||||
| Transportation - 0.3% - (continued) | |||||||
| Illinois State Toll Highway Auth, Taxable | |||||||
| Rev, | |||||||
| $ | 1,875 | 6.18%, 01/01/2034 | $ | 1,942 | |||
| Maryland State Transit Auth, | |||||||
| 1,350 | 5.89%, 07/01/2043 | 1,461 | |||||
| New York and New Jersey PA, | |||||||
| 975 | 5.86%, 12/01/2024 | 1,072 | |||||
| 570 | 6.04%, 12/01/2029 | 612 | |||||
| North Texas Tollway Auth Rev Taxable, | |||||||
| 3,400 | 6.72%, 01/01/2049 | 3,676 | |||||
| 12,022 | |||||||
| Utilities - Water and Sewer - 0.1% | |||||||
| Irvine Ranch, CA, Water Dist, | |||||||
| 2,870 | 2.61%, 03/15/2014 | 2,931 | |||||
| Total municipal bonds | |||||||
| (cost $40,000) | $ | 40,507 | |||||
| U.S. GOVERNMENT AGENCIES - 1.0% | |||||||
| Federal Home Loan Mortgage Corporation - 0.1% | |||||||
| $ | 1,352 | 0.70%, 11/15/2036 Δ | $ | 1,348 | |||
| 213 | 2.67%, 04/01/2029 Δ | 222 | |||||
| 178 | 5.50%, 08/01/2019 - 12/01/2020 | 193 | |||||
| 1,763 | |||||||
| Federal National Mortgage Association - 0.4% | |||||||
| 280 | 0.75%, 06/25/2036 Δ | 280 | |||||
| 525 | 2.75%, 02/05/2014 | 547 | |||||
| 909 | 4.78%, 02/01/2014 ‡Δ | 969 | |||||
| 1,452 | 4.97%, 12/01/2013 ‡Δ | 1,570 | |||||
| 377 | 5.00%, 02/01/2019 - 04/01/2019 | 405 | |||||
| 13,205 | 5.50%, 02/01/2012 - 10/01/2036 ☼ | 14,260 | |||||
| 146 | 6.50%, 11/01/2013 - 07/15/2038 ☼ | 159 | |||||
| 4 | 7.00%, 02/01/2029 | 4 | |||||
| 18,194 | |||||||
| Government National Mortgage Association - 0.5% | |||||||
| 5,603 | 6.00%, 06/15/2024 - 06/15/2035 | 6,195 | |||||
| 1,871 | 6.50%, 03/15/2026 - 02/15/2035 | 2,099 | |||||
| 7,120 | 7.00%, 11/15/2031 - 11/15/2033 | 8,050 | |||||
| 336 | 7.50%, 09/16/2035 | 383 | |||||
| 1,197 | 8.00%, 09/15/2026 - 02/15/2031 | 1,390 | |||||
| 82 | 9.00%, 06/20/2016 - 06/15/2022 | 92 | |||||
| 18,209 | |||||||
| Total U.S. government agencies | |||||||
| (cost $35,844) | $ | 38,166 | |||||
| U.S. GOVERNMENT SECURITIES - 15.6% | |||||||
| Other Direct Federal Obligations - 3.7% | |||||||
| Federal Financing Corporation - 0.4% | |||||||
| $ | 6,500 | 5.24%, 12/06/2013 ○ | $ | 6,072 | |||
| 11,117 | 5.25%, 12/27/2013 ○ | 10,360 | |||||
| 16,432 | |||||||
| Tennessee Valley Authority - 3.3% | |||||||
| 64,300 | 4.38%, 06/15/2015 | 70,988 | |||||
| 50,000 | 6.00%, 03/15/2013 | 56,454 | |||||
| 127,442 | |||||||
| 143,874 | |||||||
| U.S. Treasury Securities - 11.9% | |||||||
| U.S. Treasury Bonds - 3.4% | |||||||
| 5,000 | 4.25%, 05/15/2039 | 5,287 | |||||
| 22,000 | 4.38%, 02/15/2038 | 23,787 | |||||
| 30,725 | 4.38%, 11/15/2039 | 33,169 | |||||
| 1,100 | 4.50%, 05/15/2038 | 1,213 | |||||
| 100 | 5.38%, 02/15/2031 | 123 | |||||
| 18,000 | 6.00%, 02/15/2026 | 23,195 | |||||
| 33,650 | 6.25%, 08/15/2023 | 43,619 | |||||
| 130,393 | |||||||
| U.S. Treasury Notes - 8.5% | |||||||
| 166,500 | 1.00%, 07/31/2011 - 09/30/2011 | 167,572 | |||||
| 30,000 | 1.38%, 05/15/2012 | 30,441 | |||||
| 19,000 | 2.38%, 08/31/2010 | 19,069 | |||||
| 23,000 | 2.75%, 02/15/2019 | 22,914 | |||||
| 75 | 3.13%, 04/30/2013 | 80 | |||||
| 24,000 | 3.63%, 02/15/2020 | 25,357 | |||||
| 35,000 | 3.88%, 02/15/2013 - 05/15/2018 | 38,126 | |||||
| 13,000 | 4.25%, 08/15/2013 | 14,285 | |||||
| 9,950 | 4.75%, 05/31/2012 | 10,741 | |||||
| 328,585 | |||||||
| 458,978 | |||||||
| Total U.S. government securities | |||||||
| (cost $568,249) | $ | 602,852 | |||||
| Total long-term investments | |||||||
| (cost $3,820,912) | $ | 3,820,893 | |||||
| SHORT-TERM INVESTMENTS - 0.4% | |||||||
| Repurchase Agreements - 0.4% | |||||||
| Bank of America TriParty Joint Repurchase | |||||||
| Agreement (maturing on 07/01/2010 in the | |||||||
| amount of $4,654, collateralized by | |||||||
| FHLMC 5.50%, 2039, FNMA 4.50% - | |||||||
| 5.50%, 2038 - 2040, GNMA 5.00%, 2040, | |||||||
| value of $4,747) | |||||||
| $ | 4,654 | 0.05%, 6/30/2010 | $ | 4,654 | |||
| BNP Paribas Securities Corp. TriParty Joint | |||||||
| Repurchase Agreement (maturing on | |||||||
| 07/01/2010 in the amount of $798, | |||||||
| collateralized by FNMA 4.50% - 6.50%, | |||||||
| 2024 - 2040, GNMA 5.00% - 6.50%, 2038 | |||||||
| - 2040, value of $813) | |||||||
| 797 | 0.04%, 6/30/2010 | 797 | |||||
| Deutsche Bank Securities TriParty Joint | |||||||
| Repurchase Agreement (maturing on | |||||||
| 07/01/2010 in the amount of $3,524, | |||||||
| collateralized by GNMA 3.13% - 7.00%, | |||||||
| 2023 - 2052, value of $3,594) | |||||||
| 3,524 | 0.05%, 6/30/2010 | 3,524 | |||||
| JP Morgan Chase TriParty Joint Repurchase | |||||||
| Agreement (maturing on 07/01/2010 in the | |||||||
| amount of $798, collateralized by FHLMC | |||||||
| 2.38% - 5.83%, 2033 - 2038, value of | |||||||
| $813) | |||||||
| 797 | 0.06%, 6/30/2010 | 797 | |||||
The accompanying notes are an integral part of these financial statements.
| Shares or Principal Amount | Market Value ╪ | ||||||||||
| SHORT-TERM INVESTMENTS - 0.4% - (continued) | |||||||||||
| Repurchase Agreements - 0.4% - (continued) | |||||||||||
| Morgan Stanley & Co., Inc. TriParty Joint | |||||||||||
| Repurchase Agreement (maturing on | |||||||||||
| 07/01/2010 in the amount of $3,475, | |||||||||||
| collateralized by FHLMC 5.00% - 5.50%, | |||||||||||
| 2038 - 2039, FNMA 5.00%, 2039, value | |||||||||||
| of $3,558) | |||||||||||
| $ | 3,475 | 0.03%, 6/30/2010 | $ | 3,475 | |||||||
| UBS Securities, Inc. Repurchase Agreement | |||||||||||
| (maturing on 07/01/2010 in the amount of | |||||||||||
| $41, collateralized by U.S. Treasury Bill | |||||||||||
| 0.88%, 2011, value of $42) | |||||||||||
| 41 | 0.02%, 6/30/2010 | 41 | |||||||||
| UBS Securities, Inc. TriParty Joint | |||||||||||
| Repurchase Agreement (maturing on | |||||||||||
| 07/01/2010 in the amount of $880, | |||||||||||
| collateralized by FNMA 5.00% - 6.00%, | |||||||||||
| 2033 - 2036, value of $897) | |||||||||||
| 880 | 0.09%, 6/30/2010 | 880 | |||||||||
| 14,168 | |||||||||||
| Total short-term investments | |||||||||||
| (cost $14,168) | $ | 14,168 | |||||||||
| Total investments | |||||||||||
| (cost $3,835,080) ▲ | 99.3 | % | $ | 3,835,061 | |||||||
| Other assets and liabilities | 0.7 | % | 25,963 | ||||||||
| Total net assets | 100.0 | % | $ | 3,861,024 | |||||||
| Note: | Percentage of investments as shown is the ratio of the total market value to total net assets. Market value of investments in foreign securities represents 7.9% of total net assets at June 30, 2010. |
Foreign securities that are principally traded on certain foreign markets are adjusted daily pursuant to a third party pricing service methodology approved by the Board of Directors in order to reflect an adjustment for factors occurring after the close of the foreign market but before the close of the New York Stock Exchange.
| ▲ | At June 30, 2010, the cost of securities for federal income tax purposes was $3,926,474 and the aggregate gross unrealized appreciation and depreciation based on that cost were: |
| Unrealized Appreciation | $ | 226,330 | ||
| Unrealized Depreciation | (317,743 | ) | ||
| Net Unrealized Depreciation | $ | (91,413 | ) |
| † | The aggregate value of securities valued in good faith at fair value as determined under policies and procedures established by and under the supervision of the Fund's Board of Directors at June 30, 2010, was $25,345, which represents 0.66% of total net assets. This amount excludes securities that are principally traded in certain foreign markets and whose prices are adjusted pursuant to a third party pricing service methodology approved by the Board of Directors. |
| · | Currently non-income producing. |
| ‡ | This security, or a portion of this security, has been segregated to cover funding requirements on investment transactions settling in the future. |
| Δ | Variable rate securities; the rate reported is the coupon rate in effect at June 30, 2010. |
| ■ | Securities issued within terms of a private placement memorandum, exempt from registration under Rule 144A under the Securities Act of 1933, as amended, and may be sold only to qualified institutional buyers. Pursuant to guidelines adopted by the Board of Directors, these issues are determined to be liquid. The aggregate value of these securities at June 30, 2010, was $82,878, which represents 2.15% of total net assets. |
| ☼ | The cost of securities purchased on a when-issued or delayed delivery basis at June 30, 2010 was $539. |
| ○ | The interest rate disclosed for these securities represents the effective yield on the date of the acquisition. |
| ⌂ | The following securities are considered illiquid. Illiquid securities are often purchased in private placement transactions, are often not registered under the Securities Act of 1933 and may have contractual restrictions on resale. A security may also be considered illiquid if the security lacks a readily available market or if its valuation has not changed for a certain period of time. |
| Period | Shares/ | ||||||||
| Acquired | Par | Security | Cost Basis | ||||||
| 06/2007 | 11,241 | Buck Holdings L.P. | $ | 9,611 | |||||
| 04/2008 | 524 | Washington Mutual, Inc. Private | |||||||
| Placement Warrants | – | ||||||||
The aggregate value of these securities at June 30, 2010 was $25,345 which represents 0.66% of total net assets.
PA — Port Authority
USD — United School District
| ╪ | See Significant Accounting Policies of accompanying Notes to Financial Statements regarding valuation of securities. |
The accompanying notes are an integral part of these financial statements.
| Hartford Advisers HLS Fund |
| June 30, 2010 (Unaudited) |
| (000’s Omitted) |
| Total | Level 1♦ | Level 2♦ | Level 3 | |||||||||||||
| Assets: | ||||||||||||||||
| Asset & Commercial Mortgage Backed Securities | $ | 39,806 | $ | – | $ | 39,798 | $ | 8 | ||||||||
| Common Stocks ‡ | 2,513,777 | 2,342,385 | 146,047 | 25,345 | ||||||||||||
| Corporate Bonds: Investment Grade | 550,447 | – | 543,187 | 7,260 | ||||||||||||
| Corporate Bonds: Non-Investment Grade | 35,338 | – | 35,291 | 47 | ||||||||||||
| Municipal Bonds | 40,507 | – | 40,507 | – | ||||||||||||
| U.S. Government Agencies | 38,166 | – | 38,166 | – | ||||||||||||
| U.S. Government Securities | 602,852 | – | 602,852 | – | ||||||||||||
| Warrants | – | – | – | – | ||||||||||||
| Short-Term Investments | 14,168 | – | 14,168 | – | ||||||||||||
| Total | $ | 3,835,061 | $ | 2,342,385 | $ | 1,460,016 | $ | 32,660 | ||||||||
♦ For the period ended June 30, 2010, there were no significant transfers between Level 1 and Level 2.
‡ The Fund has all or primarily all of these equity securities categorized in a single level. Refer to the Schedule of Investments for further industry breakout.
Following is a reconciliation of Level 3 assets for which significant unobservable inputs were used to determine fair value:
| Balance | Change in | |||||||||||||||||||||||||||||||||||
| as of | Realized | Unrealized | Transfers | Transfers | Balance | |||||||||||||||||||||||||||||||
| December | Gain | Appreciation | Net | Into | Out of | as of June | ||||||||||||||||||||||||||||||
| 31, 2009 | (Loss) | (Depreciation) | Amortization | Purchases* | Sales | Level 3 | Level 3 | 30, 2010 | ||||||||||||||||||||||||||||
| Assets: | ||||||||||||||||||||||||||||||||||||
| Asset & Commercial Mortgage | ||||||||||||||||||||||||||||||||||||
| Backed Securities | $ | — | $ | — | $ | — | † | $ | — | $ | 8 | $ | — | $ | — | $ | — | $ | 8 | |||||||||||||||||
| Common Stock | 23,561 | (33,449 | ) | 38,872 | ‡ | — | — | (3,639 | ) | — | — | 25,345 | ||||||||||||||||||||||||
| Corporate Bonds | 7,244 | — | 195 | § | — | 47 | (179 | ) | — | — | 7,307 | |||||||||||||||||||||||||
| Warrants | — | — | — | — | — | — | — | — | — | |||||||||||||||||||||||||||
| Total | $ | 30,805 | $ | (33,449 | ) | $ | 39,067 | $ | — | $ | 55 | $ | (3,818 | ) | $ | — | $ | — | $ | 32,660 | ||||||||||||||||
| * | Securities totaling $80 were acquired through fund merger. The market value of these securities on merger date was $55. |
| † | Change in unrealized gains or losses in the current period relating to assets still held at June 30, 2010 was $—. |
| ‡ | Change in unrealized gains or losses in the current period relating to assets still held at June 30, 2010 was $15,735. |
§ | Change in unrealized gains or losses in the current period relating to assets still held at June 30, 2010 was $195. |
The accompanying notes are an integral part of these financial statements.
| Hartford Advisers HLS Fund |
| June 30, 2010 (Unaudited) |
| (000’s Omitted) |
| Assets: | ||||
| Investments in securities, at market value (cost $3,835,080) | $ | 3,835,061 | ||
| Receivables: | ||||
| Investment securities sold | 36,443 | |||
| Fund shares sold | 59 | |||
| Dividends and interest | 15,079 | |||
| Other assets | — | |||
| Total assets | 3,886,642 | |||
| Liabilities: | ||||
| Bank overdraft | 6 | |||
| Payables: | ||||
| Investment securities purchased | 21,757 | |||
| Fund shares redeemed | 2,896 | |||
| Investment management fees | 533 | |||
| Distribution fees | 30 | |||
| Accrued expenses | 396 | |||
| Total liabilities | 25,618 | |||
| Net assets | $ | 3,861,024 | ||
| Summary of Net Assets: | ||||
| Capital stock and paid-in-capital | $ | 5,247,439 | ||
| Accumulated undistributed net investment income | 39,527 | |||
| Accumulated net realized loss on investments and foreign currency transactions | (1,425,926 | ) | ||
| Unrealized depreciation of investments and the translations of assets and liabilities denominated in foreign currency | (16 | ) | ||
| Net assets | $ | 3,861,024 | ||
| Shares authorized | 9,500,000 | |||
| Par value | $ | 0.001 | ||
Class IA: Net asset value per share | $ | 16.77 | ||
| Shares outstanding | 198,505 | |||
| Net assets | $ | 3,328,562 | ||
Class IB: Net asset value per share | $ | 16.94 | ||
| Shares outstanding | 31,426 | |||
| Net assets | $ | 532,462 | ||
The accompanying notes are an integral part of these financial statements.
| Hartford Advisers HLS Fund |
| For the Six-Month Period Ended |
| June 30, 2010 (Unaudited) |
| (000’s Omitted) |
| Investment Income: | ||||
| Dividends | $ | 23,011 | ||
| Interest | 26,220 | |||
| Less: Foreign tax withheld | (368 | ) | ||
| Total investment income, net | 48,863 | |||
| Expenses: | ||||
| Investment management fees | 11,374 | |||
| Administrative service fees | 1,337 | |||
| Distribution fees - Class IB | 720 | |||
| Custodian fees | 31 | |||
| Accounting services fees | 334 | |||
| Board of Directors' fees | 52 | |||
| Audit fees | 42 | |||
| Other expenses | 407 | |||
| Total expenses (before fees paid indirectly) | 14,297 | |||
| Commission recapture | (67 | ) | ||
| Total fees paid indirectly | (67 | ) | ||
| Total expenses, net | 14,230 | |||
| Net investment income | 34,633 | |||
| Net Realized Gain on Investments, Other Financial Instruments and Foreign Currency Transactions: | ||||
| Net realized gain on investments | 157,444 | |||
| Net realized loss on futures | (21 | ) | ||
| Net realized loss on swap contracts | (184 | ) | ||
| Net realized gain on forward foreign currency contracts | 1,365 | |||
| Net realized loss on other foreign currency transactions | (1,237 | ) | ||
| Net Realized Gain on Investments, Other Financial Instruments and Foreign Currency Transactions | 157,367 | |||
| Net Changes in Unrealized Depreciation of Investments, Other Financial Instruments and Foreign Currency Transactions: | ||||
| Net unrealized depreciation of investments | (356,474 | ) | ||
| Net unrealized depreciation of swap contracts | (115 | ) | ||
| Net unrealized appreciation on translation of other assets and liabilities in foreign currencies | 9 | |||
| Net Changes in Unrealized Depreciation of Investments, Other Financial Instruments and Foreign Currency Transactions | (356,580 | ) | ||
| Net Loss on Investments, Other Financial Instruments and Foreign Currency Transactions | (199,213 | ) | ||
| Net Decrease in Net Assets Resulting from Operations | $ | (164,580 | ) | |
The accompanying notes are an integral part of these financial statements.
| Hartford Advisers HLS Fund |
| (000’s Omitted) |
| For the | ||||||||
| Six-Month | For the | |||||||
| Period Ended | Year Ended | |||||||
| June 30, 2010 | December 31, | |||||||
| (Unaudited) | 2009 | |||||||
| Operations: | ||||||||
| Net investment income | $ | 34,633 | $ | 82,989 | ||||
| Net realized gain (loss) on investments, other financial instruments and foreign currency transactions | 157,367 | (720,503 | ) | |||||
| Net unrealized appreciation (depreciation) of investments, other financial instruments and foreign currency transactions | (356,580 | ) | 1,668,328 | |||||
| Net increase (decrease) in net assets resulting from operations | (164,580 | ) | 1,030,814 | |||||
| Distributions to Shareholders: | ||||||||
| From net investment income | ||||||||
| Class IA | — | (73,154 | ) | |||||
| Class IB | — | (10,271 | ) | |||||
| Total distributions | — | (83,425 | ) | |||||
| Capital Share Transactions: | ||||||||
| Class IA | ||||||||
| Sold | 31,246 | 62,103 | ||||||
| Issued in merger | 188,305 | — | ||||||
| Issued on reinvestment of distributions | — | 73,154 | ||||||
| Redeemed | (356,566 | ) | (749,298 | ) | ||||
| Total capital share transactions | (137,015 | ) | (614,041 | ) | ||||
| Class IB | ||||||||
| Sold | 14,475 | 19,980 | ||||||
| Issued in merger | 36,319 | — | ||||||
| Issued on reinvestment of distributions | — | 10,271 | ||||||
| Redeemed | (74,442 | ) | (130,857 | ) | ||||
| Total capital share transactions | (23,648 | ) | (100,606 | ) | ||||
| Net decrease from capital share transactions | (160,663 | ) | (714,647 | ) | ||||
| Net increase (decrease) in net assets | (325,243 | ) | 232,742 | |||||
| Net Assets: | ||||||||
| Beginning of period | 4,186,267 | 3,953,525 | ||||||
| End of period | $ | 3,861,024 | $ | 4,186,267 | ||||
| Accumulated undistributed (distribution in excess of) | ||||||||
| net investment income | $ | 39,527 | $ | 4,894 | ||||
| Shares: | ||||||||
| Class IA | ||||||||
| Sold | 1,684 | 4,010 | ||||||
| Issued in merger | 10,373 | — | ||||||
| Issued on reinvestment of distributions | — | 4,239 | ||||||
| Redeemed | (20,029 | ) | (50,470 | ) | ||||
| Total share activity | (7,972 | ) | (42,221 | ) | ||||
| Class IB | ||||||||
| Sold | 863 | 1,260 | ||||||
| Issued in merger | 1,979 | — | ||||||
| Issued on reinvestment of distributions | — | 589 | ||||||
| Redeemed | (4,131 | ) | (8,768 | ) | ||||
| Total share activity | (1,289 | ) | (6,919 | ) | ||||
The accompanying notes are an integral part of these financial statements.
| Hartford Advisers HLS Fund |
| June 30, 2010 (Unaudited) |
| (000’s Omitted) |
| 1. | Organization: |
Hartford Advisers HLS Fund (the "Fund") serves as an underlying investment option for certain variable annuity and variable life insurance separate accounts of Hartford Life Insurance Company (“HLIC”) and its affiliates and certain qualified retirement plans. The Fund may also serve as an underlying investment option for certain variable annuity and variable life separate accounts of other insurance companies. Owners of variable annuity contracts and policyholders of variable life insurance contracts may choose the funds permitted in the variable insurance contract prospectus. In addition, participants in certain qualified retirement plans may choose the fund if permitted by their plans.
Hartford Series Fund, Inc. (the “Company”) is an open-end registered management investment company comprised of twenty-nine portfolios, one portfolio of which is included in these financial statements.
The Company is organized under the laws of the State of Maryland and is registered with the Securities and Exchange Commission (“SEC”) under the Investment Company Act of 1940, as amended (“1940 Act”). The Fund is organized as a diversified open-end management investment company.
The Fund is divided into Class IA and Class IB shares. Each class is offered at the per share net asset value (“NAV”) without a sales charge and is subject to the same expenses, except that the Class IB shares are subject to distribution and service fees charged pursuant to a Distribution and Service Plan adopted in accordance with Rule 12b-1 under the 1940 Act.
| 2. | Significant Accounting Policies: |
The following is a summary of significant accounting policies of the Fund, which are in accordance with U.S. Generally Accepted Accounting Principles (“GAAP”).
| a) | Security Transactions and Investment Income – Security transactions are recorded on the trade date (the date the order to buy or sell is executed). Security gains and losses are determined on the basis of identified cost. |
Dividend income is accrued as of the ex-dividend date, except that certain dividends for foreign securities where the ex-dividend date may have passed are recorded as soon as the Fund is informed of the dividend in the exercise of reasonable diligence. Interest income, including amortization of premium and accretion of discounts, is accrued on a daily basis.
| b) | Security Valuation – The Fund generally uses market prices in valuing portfolio securities. If market prices are not readily available or are deemed unreliable, the Fund will use the fair value of the security as determined in good faith under policies and procedures established by and under the supervision of the Fund’s Board of Directors. Market prices may be deemed unreliable, for example, if a security is thinly traded or if an event has occurred after the close of the security’s primary market, but before the close of the New York Stock Exchange (the “Exchange”) (generally 4:00 p.m. Eastern Time, referred to as the “Valuation Time”) that is expected to affect the value of the portfolio security. The circumstances in which the Fund may use fair value pricing include, among others: (i) the occurrence of events that are significant to a particular issuer, such as mergers, restructuring or defaults; (ii) the occurrence of events that are significant to an entire market, such as natural disasters in a particular region or governmental actions; (iii) trading restrictions on securities; (iv) thinly traded securities and (v) market events such as trading halts and early market closings. In addition, with respect to the valuation of stocks primarily traded on foreign markets, the Fund uses a fair value pricing service approved by the Fund’s Board of Directors, which employs quantitative models that evaluate changes in the value of foreign market proxies (e.g., futures contracts, American Depositary Receipts (“ADRs”), exchange traded funds (“ETFs”)) after the close of the foreign markets but before the Valuation Time. Securities that are primarily traded on foreign markets may trade on days that are not business days of the Fund. The value of the foreign securities in which the Fund invests may change on days when a shareholder will not be able to purchase or redeem shares of the Fund. Fair value pricing is subjective in nature and the use of fair value pricing by the Fund may cause the NAV of its shares to differ significantly from the NAV that would have been calculated using market prices at the close of the exchange on which a portfolio security is primarily traded but before the Valuation Time. There can be no |
assurance that the Fund could obtain the fair value assigned to a security if the Fund were to sell the security at approximately the time at which the Fund determines its NAV.
Exchange-traded equity securities are valued at the last reported sale price or official close price on the exchange or market on which the security is primarily traded (the “Primary Market”) at the Valuation Time. If the security did not trade on the Primary Market, it may be valued at the Valuation Time at the last reported sale price on another exchange where it trades. The value of an equity security not traded on any exchange but traded on the Nasdaq Stock Market, Inc. or another over-the-counter market shall be valued at the last reported sale price or official closing price on the exchange or market on which the security is traded as of the Valuation Time.
Debt securities (other than short-term obligations) held by the Fund are valued using bid prices or using valuations based on a matrix system (which considers factors such as security prices, yield, maturity and ratings) as provided by independent pricing services. Securities for which prices are not available from an independent pricing service may be valued using market quotations obtained from one or more dealers that make markets in the securities in accordance with procedures established by the Fund’s Board of Directors. Generally, the Fund may use fair valuation in regard to debt securities when the Fund holds defaulted or distressed securities or securities in a company in which a reorganization is pending. Short-term investments with a maturity of more than 60 days when purchased are valued based on market quotations until the remaining days to maturity become less than 61 days. Investments that mature in 60 days or less are generally valued at amortized cost, which approximates market value.
Foreign-denominated assets, including investment securities, and liabilities are translated from the local currency into U.S. dollars using exchange rates obtained from an independent third party as of the Fund’s Valuation Time.
Financial instruments for which prices are not available from an independent pricing service may be valued using market quotations obtained from one or more dealers that make markets in securities in accordance with procedures established by the Fund’s Board of Directors.
Futures contracts are valued at the most recent settlement price reported by an exchange on which, over time, they are traded most extensively. If a settlement price is not available, futures contracts will be valued at the most recent trade price as of the Valuation Time. If there were no trades, the contract shall be valued at the mean of the closing bid and asked prices as of the Valuation Time.
Forward foreign currency contracts represent agreements to exchange currencies on specific future dates at predetermined rates. Forward foreign currency contracts are valued using foreign currency exchange rates and forward rates on the Valuation Date from an independent pricing service.
Swaps are valued based on custom valuations furnished by an independent pricing service. Swaps for which prices are not available from an independent pricing service are valued in accordance with procedures established by the Fund’s Board of Directors.
Other derivative or contractual type instruments shall be valued using market prices if such instruments trade on an exchange or market. If such instruments do not trade on an exchange or market, such instruments shall be valued at a price at which the counterparty to such contract would repurchase the instrument. In the event that the counterparty cannot provide a price, such valuation may be determined in accordance with procedures established by the Fund’s Board of Directors.
| Hartford Advisers HLS Fund |
| Notes to Financial Statements – (continued) |
| June 30, 2010 (Unaudited) |
| (000’s Omitted) |
Various inputs are used in determining the value of the Fund’s investments. These inputs are summarized into three broad hierarchy levels. This hierarchy is based on whether the valuation inputs are observable or unobservable. These levels are:
| · | Level 1 – Quoted prices in active markets for identical securities. Level 1 may include exchange-traded instruments such as domestic equities, some foreign equities, options, futures, mutual funds, ETFs, and rights and warrants. |
| · | Level 2 – Observable inputs other than Level 1 prices, such as quoted prices for similar securities; quoted prices in markets that are not active; or other inputs that are observable or can be corroborated by observable market data. Level 2 may include debt securities that are traded less frequently than exchange-traded instruments and which are valued using third party pricing services. Prices for most level 2 securities are based on prices received from an independent pricing service. The following asset classes generally use valuation techniques and inputs as noted below: |
Asset Backed Securities and Collateralized Mortgage Obligations – Multi-dimensional spread/prepayment speed tables, with consideration of yield or price of bonds of comparable quality, coupon and maturity, attributes of the collateral, new issue data and monthly payment information.
Corporate Bonds – Multi-dimensional relational model based on observable market information such as yields, spreads, sector analysis, etc.
Foreign Currency – Based on rates determined at the close of the Exchange, provided by an independent pricing service.
Forward Currency Contracts – Valued based on the price of the underlying currency at the prevailing interpolated exchange rate, which is a combination of the spot currency rate and the forward currency rate, provided by an independent pricing service.
Foreign Equities – Certain foreign equities are priced using a multi-factor regression model with market observable inputs of a correlative nature (ADRs, futures contracts, ETFs, and currency exchange rates).
International Fixed Income – Multi-dimensional relational model based on observable market information such as benchmark yields, reported trades, bids and offers.
Money Market Instruments – Amortized cost.
Mortgage Backed Securities (“MBS”) – Matrix pricing using inputs of To-Be-Announced (“TBA”) prices, new issue data and monthly payment information, with consideration of yield or price of bonds of comparable quality, coupon and maturity, and attributes of the collateral.
Municipal Bonds – Multi-dimensional relational model and series of matrices based on observable market information such as Municipal Securities Rulemaking Board reported trades, comparable bonds, yields, spreads and credit analysis.
Preferred Stocks – Close mean of bid/ask or bid.
Repurchase Agreements – Priced at par.
Senior Floating Rate Interests – Composite of quotes from one or more contributing dealers.
Swaps – Price based upon observable market information from an independent pricing service.
U.S. Government Securities – Treasuries exclusively traded in the secondary market.
| · | Level 3 – Significant unobservable inputs that are supported by limited or no market activity. Level 3 may include financial instruments whose values are determined using broker quotes or require significant management judgment or estimation. While these securities are priced using unobservable inputs, the valuation of these securities reflects the best available data and management believes the prices are a reasonable representation of exit price. The following asset classes generally use valuation techniques and inputs as noted below: |
Asset Backed Securities & Commercial Mortgage Backed Securities – Certain other MBS with limited liquidity priced from an independent pricing service.
Common Stocks – Trading has been halted or there are restrictions on trading. Valuation is based on last trade with the application of a discount or premium, if applicable.
Long Dated Over-the-Counter Options – Terms greater than 10 years from current date, expected volatility is not observable. Prices are from an independent pricing service.
Long Term Debt Securities, including Senior Floating Rate Interests – Unobservable valuation inputs may include estimates for current yields, maturity/duration, prepayment speed, and broker quotes for comparable securities along with other assumptions relating to credit quality, collateral value, complexity of the security structure, general market conditions and liquidity.
Swaps – Terms greater than 10 years from current date, expected volatility is not observable. Prices are from an independent pricing service.
Individual securities within any of the above mentioned asset classes may be assigned a different hierarchical level than those that are presented above, as individual circumstances dictate.
For purposes of reporting transfers between different hierarchy levels, both transfers in and out of each level are shown as if they occurred at the beginning of the period.
Refer to the Investment Valuation Hierarchy Levels Summary and the Level 3 roll forward reconciliation found following the Schedules of Investments.
| c) | Foreign Currency Transactions – Assets and liabilities denominated in currencies other than U.S. dollars are translated into U.S. dollars at the exchange rates in effect on the valuation date. Purchases and sales of investment securities, income and expenses are translated into U.S. dollars at the exchange rates on the dates of such transactions. |
The Fund does not isolate that portion of portfolio security valuation resulting from fluctuations in the foreign currency exchange rates from the fluctuations arising from changes in the market prices of securities held. Exchange rate fluctuations are included with the net realized and unrealized gain or loss on investments in the accompanying financial statements.
Net realized foreign exchange gains or losses arise from sales of foreign currencies and the difference between asset and liability amounts initially stated in foreign currencies and the U.S. dollar value of the amounts actually received or paid. Net unrealized foreign exchange gains or losses arise from changes in the value of other assets and liabilities at the end of the reporting period, resulting from changes in the exchange rates.
| Hartford Advisers HLS Fund |
| Notes to Financial Statements –(continued) |
| June 30, 2010 (Unaudited) |
| (000’s Omitted) |
| d) | Joint Trading Account – Pursuant to an exemptive order issued by the SEC, the Fund may transfer uninvested cash balances into a joint trading account managed by Wellington Management Company, LLP (“Wellington Management”). These balances may be invested in one or more repurchase agreements and/or short-term money market instruments. |
| e) | Repurchase Agreements – A repurchase agreement is an agreement by which a counterparty agrees to sell a security and agrees to repurchase the security sold at a mutually agreed upon time and price. At the time the Fund enters into a repurchase agreement, the value of the underlying collateral security(ies), including accrued interest, will be equal to or exceed the value of the repurchase agreement. To minimize counterparty risk, the securities that serve to collateralize the repurchase agreement are held by the Fund's custodian in book entry or physical form in the custodial account of the Fund or in a third party custodial account. Repurchase agreements are valued at cost plus accrued interest. The Fund, as shown on the Schedule of Investments, had outstanding repurchase agreements as of June 30, 2010. |
| f) | Forward Foreign Currency Contracts – The Fund may enter into forward foreign currency contracts that obligate the Fund to purchase or sell currencies at specified future dates. Forward foreign currency contracts may be used to hedge against adverse fluctuations in exchange rates between currencies. |
Forward foreign currency contracts involve elements of market risk in excess of the amounts reflected in the Statement of Assets and Liabilities. In addition, risks may arise upon entering into these contracts from the potential inability of the counterparties to meet the terms of the contracts and from unanticipated movements in the value of the foreign currencies relative to the U.S. dollar. The Fund had no outstanding forward foreign currency contracts as of June 30, 2010.
| g) | Fund Share Valuation and Dividend Distributions to Shareholders – Orders for the Fund’s shares are executed in accordance with the investment instructions of the contract holders or plan participants. The NAV of the Fund’s shares is determined as of the close of each business day of the Exchange. The NAV is determined separately for each class of the Fund by dividing the Fund’s net assets attributable to that class by the number of outstanding shares of the class. Orders for the purchase of the Fund’s shares received by an insurance company or plan prior to the close of the Exchange on any day on which the Exchange is open for business are priced at the NAV determined as of the close of the Exchange. Orders received by an insurance company or plan after the close of the Exchange, or on a day on which the Exchange and/or the Fund is not open for business, are priced at the next determined NAV. |
Dividends are declared pursuant to a policy adopted by the Fund’s Board of Directors based upon the investment performance of the Fund. The policy of the Fund is to pay dividends from net investment income and distribute realized capital gains, if any, at least once a year.
Distributions from net investment income, realized capital gains and capital are determined in accordance with federal income tax regulations, which may differ from U.S. GAAP with respect to character and timing. These differences may include but are not limited to losses deferred due to wash sale adjustments, foreign currency gains and losses, adjustments related to Passive Foreign Investment Companies (“PFICs”), Real Estate Investment Trusts (“REITs”), Regulated Investment Companies (“RICs”), certain derivatives and partnerships. Permanent book and federal income tax basis differences relating to shareholder distributions will result in reclassifications to certain of the Fund’s capital accounts (see Federal Income Taxes: Reclassification of Capital Accounts note).
| h) | Illiquid and Restricted Securities – The Fund is permitted to invest up to 15% of its net assets in illiquid securities. “Illiquid Securities” are those that may not be sold or disposed of in the ordinary course of business within seven days, at approximately the price used to determine the Fund’s NAV. The Fund may not be able to sell illiquid securities or other investments when its sub-adviser considers it desirable to do so or may have to sell such securities or investments at a price that is lower than the price that could be obtained if the securities or investments were more liquid. A sale of illiquid securities or other investments may require more time and may result in higher dealer discounts and other selling expenses than does the sale of those that are liquid. Illiquid securities and investments also may be more difficult to value, due to the unavailability of reliable market quotations for such securities or investments, and an investment in them may have an adverse impact on the Fund’s NAV. The Fund may also purchase certain restricted securities, |
commonly known as Rule 144A securities, that can be resold to institutions and which may be determined to be liquid pursuant to policies and guidelines established by the Fund’s Board of Directors. The Fund, as shown on the Schedule of Investments, had illiquid and/or restricted securities as of June 30, 2010.
| i) | Securities Purchased on a When-Issued or Delayed-Delivery Basis – Delivery and payment for securities that have been purchased by the Fund on a forward commitment, or when-issued or delayed-delivery basis, take place beyond the customary settlement period. During this period, such securities are subject to market fluctuations, and the Fund identifies securities segregated in its records with value at least equal to the amount of the commitment. The Fund, as shown on the Schedule of Investments, had when-issued or delayed delivery securities as of June 30, 2010. |
| j) | Credit Risk – Credit risk depends largely on the perceived financial health of bond issuers. In general, the credit rating is inversely related to the credit risk of the issuer. Higher rated bonds generally are deemed to have less credit risk, while lower or unrated bonds are deemed to have higher risk of default. The share price, yield and total return of a Fund which holds securities with higher credit risk may be more volatile than funds holding bonds with lower credit risk. |
| k) | Prepayment/Interest Rate Risks – Certain debt securities allow for prepayment of principal without penalty. Securities subject to prepayment risk generally offer less potential for gains when interest rates decline. In addition, with respect to securities, rising interest rates may cause prepayments to occur at a slower than expected rate, thereby effectively lengthening the maturity of the security and making the security more sensitive to interest rate changes. Prepayment risk is a major risk of mortgage backed securities and certain asset backed securities. Accordingly, the potential for the value of a debt security to increase in response to interest rate declines is limited. For certain securities, the actual maturity may be less than the stated maturity shown in the Schedule of Investments. As a result, the timing of income recognition relating to these securities may vary based upon the actual maturity. |
The market value of debt securities held by the Fund may be affected by fluctuations in market interest rates. The market value of these investments tends to decline when interest rates rise and tends to increase when interest rates fall.
| l) | Credit Default Swaps – The Fund is subject to credit risk in the normal course of pursuing its investment objectives. The Fund may enter into event linked swaps, including credit default swap contracts. The credit default swap market allows the Fund to manage its exposure to the market or certain sectors of the market, to reduce its risk exposure to defaults of corporate and sovereign issuers, or to create exposure to corporate or sovereign issuers to which it is not otherwise exposed. Certain credit default swaps involve the exchange of a fixed rate premium for protection against the loss in value of an underlying security in the event of a credit event, such as payment default or bankruptcy. |
Under a credit default swap agreement, one party acts as guarantor by receiving the fixed periodic payment in exchange for the commitment to purchase the underlying security at par if the defined credit event occurs. Upon the occurrence of a defined credit event, the difference between the value of the reference obligation and the swap’s notional amount is recorded as realized gain or loss on swap transactions in the Statement of Operations. A “buyer” of credit protection agrees to pay a counterparty to assume the credit risk of an issuer upon the occurrence of certain events. The “seller” of the protection receives periodic payments and agrees to assume the credit risk of an issuer upon the occurrence of certain events. Although specified events are contract specific, credit events are generally defined as bankruptcy, failure to pay, restructuring, obligation acceleration, obligation default, or repudiation/moratorium. A “seller’s” exposure is limited to the total notional amount of the credit default swap contract. These potential amounts would be partially offset by any recovery values of the respective referenced obligations or upfront payments received upon entering into the agreement. For credit default swap contracts on credit indices at June 30, 2010, the quoted market prices and resulting values serve as the indicator of the current status of the payment/performance risk. Increasing market values, in absolute terms when compared to the notional amount of the swap, represent a deterioration of the referenced entity’s credit soundness and a greater likelihood or risk of default or other credit event occurring as defined under the terms of the agreement. The Fund is also subject to counterparty credit risk. Both credit and counterparty risks are mitigated by having a master netting arrangement between the Fund and the counterparty (although such amounts are presented on a gross basis within the Statement of Assets and Liabilities, as applicable) or by the posting of collateral by the counterparty to the Fund to cover
| Hartford Advisers HLS Fund |
| Notes to Financial Statements – (continued) |
| June 30, 2010 (Unaudited) |
| (000’s Omitted) |
the Fund’s exposure to the counterparty. The Fund will generally not buy protection on issuers that are not currently held by the Fund. The Fund had no outstanding credit default swaps as of June 30, 2010.
| m) | Use of Estimates – The preparation of financial statements in conformity with U.S. GAAP requires management to make estimates and assumptions that affect the reported amounts of assets and liabilities as of the date of the financial statements and the reported amounts of income and expenses during the period. Operating results in the future could vary from the amounts derived from management’s estimates. |
| n) | Additional Derivative Instrument(s) Information |
The volume of derivative activity was minimal during the six-month period ended June 30, 2010.
Realized Gain/Loss and Change in Unrealized Appreciation (Depreciation) on Derivative Instruments for the six-month period ended June 30, 2010:
| Amount of Realized Gain or (Loss) on Derivatives Recognized in Income | ||||||||||||||||||||||||
| Forward | ||||||||||||||||||||||||
| Purchased | Currency | |||||||||||||||||||||||
| Risk Exposure Category | Written Options | Options | Futures | Contracts | Swaps | Total | ||||||||||||||||||
| Interest rate contracts | $ | — | $ | — | $ | 2 | $ | — | $ | — | $ | 2 | ||||||||||||
| Foreign exchange contracts | — | — | — | 1,365 | — | 1,365 | ||||||||||||||||||
| Credit contracts | — | — | — | — | (184 | ) | (184 | ) | ||||||||||||||||
| Equity contracts | — | — | (23 | ) | — | — | (23 | ) | ||||||||||||||||
| Total | $ | — | $ | — | $ | (21 | ) | $ | 1,365 | $ | (184 | ) | $ | 1,160 | ||||||||||
| Change in Unrealized Appreciation or (Depreciation) on Derivatives Recognized in Income | ||||||||||||||||||||||||
| Forward | ||||||||||||||||||||||||
| Purchased | Currency | |||||||||||||||||||||||
| Risk Exposure Category | Written Options | Options | Futures | Contracts | Swaps | Total | ||||||||||||||||||
| Credit contracts | — | — | — | — | (115 | ) | $ | (115 | ) | |||||||||||||||
| Total | $ | — | $ | — | $ | — | $ | — | $ | (115 | ) | $ | (115 | ) | ||||||||||
| o) | Indemnifications – Under the Company’s organizational documents, the Company shall indemnify its officers and directors to the full extent required or permitted under Maryland General Corporation Law and the federal securities laws. In addition, the Company, on behalf of the Fund, may enter into contracts that contain a variety of indemnifications. The Company’s maximum exposure under these arrangements is unknown. However, the Company has not had prior claims or losses pursuant to these contracts and expects the risk of loss to be remote. |
| 3. | Futures and Options: |
The Fund is subject to equity price risk, interest rate risk and foreign currency exchange rate risk in the normal course of pursuing its investment objectives. The Fund may invest in futures and options contracts in order to gain exposure to or hedge against changes in the value of equities, interest rates or foreign currencies. A futures contract is an agreement between two parties to buy and sell an asset at a set price on a future date. When the Fund enters into such futures contracts, it is required to deposit with a futures commission merchant an amount of “initial margin” of cash, commercial paper or U.S. Treasury Bills. Subsequent payments, called variation margin, to and from the broker, are made on a daily basis as the price of the underlying asset fluctuates, making the long and short positions in the futures contract more or less valuable (i.e., mark-to-market), which results in an unrealized gain or loss to the Fund.
At any time prior to the expiration of the futures contract, the Fund may close the position by taking an opposite position, which would effectively terminate the position in the futures contract. A final determination of variation margin is then made, additional cash is required to be paid by or released to the Fund and the Fund realizes a gain or loss.
The use of futures contracts involves elements of market risk, which may exceed the amounts recognized in the Statement of Assets and Liabilities. Changes in the value of the futures contracts may decrease the effectiveness of the Fund’s strategy and potentially result in loss. With futures, there is minimal counterparty risk to the Fund since futures are exchange traded through a clearing house. The clearing house requires sufficient collateral to cover margins. As of June 30, 2010, there were no outstanding futures contracts.
An option contract is a contract sold by one party to another party that offers the buyer the right, but not the obligation, to buy (call) or sell (put) a security or other financial asset at an agreed-upon price during a specific period of time or on a specific date. The premium paid by the Fund for the purchase of a call or put option is included in the Fund’s Statement of Assets and Liabilities as an investment and subsequently “marked-to-market” through net unrealized appreciation (depreciation) of options to reflect the current market value of the option as of the end of the reporting period.
The Fund may write (sell) covered options. “Covered” means that so long as the Fund is obligated as the writer of an option, it will own either the underlying securities or currency or an option to purchase the same underlying securities or currency having an expiration date of the covered option and an exercise price equal to or less than the exercise price of the covered option, or will pledge cash or other liquid securities having a value equal to or greater than the fluctuating market value of the option securities or currencies. The Fund receives a premium for writing a call or put option, which is recorded on the Fund’s Statement of Assets and Liabilities and subsequently “marked-to-market” through net unrealized appreciation (depreciation) of options. There is a risk of loss from a change in the value of such options, which may exceed the related premiums received. The maximum amount of loss with respect to the Fund’s written put option is the cost of buying the underlying security or currency. The maximum loss may be offset by proceeds received from selling the underlying securities or currency. As of June 30, 2010, there were no outstanding option contracts.
| 4. | Federal Income Taxes: |
| a) | Federal Income Taxes – For federal income tax purposes, the Fund intends to continue to qualify as a RIC under Subchapter M of the Internal Revenue Code (“IRC”) by distributing substantially all of its taxable net investment income and net realized capital gains to its shareholders and otherwise complying with the requirements of RICs. The Fund has distributed substantially all of its income and capital gains in prior years and intends to distribute substantially all of its income and capital gains prior to the next fiscal year end. Accordingly, no provision for federal income or excise taxes has been made in the accompanying financial statements. Distributions from short-term capital gains are treated as ordinary income distributions for federal income tax purposes. |
| b) | Net Investment Income (Loss), Net Realized Gains (Losses) – Net investment income (loss) and net realized gains (losses) may differ for financial statement and tax purposes primarily because of losses deferred due to wash sale adjustments, foreign currency gains and losses, adjustments related to PFICs, REITs, RICs, certain derivatives and partnerships. The character of distributions made during the year from net investment income or net realized gains may differ from their ultimate characterization for federal income tax purposes. Also, due to the timing of dividend distributions, the fiscal year in which amounts are distributed may differ from the year that the income or realized gains (losses) were recorded by the Fund. |
| c) | Distributions and Components of Distributable Earnings – The tax character of distributions paid by the Fund for the periods indicated is as follows (as adjusted for dividends payable): |
| For the Year Ended | For the Year Ended | |||||||
December 31, 2009 | December 31, 2008 | |||||||
| Ordinary Income | $ | 83,425 | $ | 165,176 | ||||
| Long-Term Capital Gains* | — | 30,856 | ||||||
* The Fund designates these distributions as long-term capital dividends pursuant to IRC code Sec. 852(b)(3)(C).
| Hartford Advisers HLS Fund |
| Notes to Financial Statements – (continued) |
| June 30, 2010 (Unaudited) |
| (000’s Omitted) |
As of December 31, 2009, the Fund’s components of distributable earnings (deficit) on a tax basis were as follows:
Amount | ||||
| Undistributed Ordinary Income | $ | 4,894 | ||
| Accumulated Capital and Other Losses* | (1,437,552 | ) | ||
| Unrealized Appreciation† | 237,461 | |||
| Total Accumulated Deficit | $ | (1,195,197 | ) | |
| * | The Fund has capital loss carryforwards that are identified in the Capital Loss Carryforward note that follows. |
| † | The difference between book-basis and tax-basis unrealized appreciation (depreciation) may be attributable to the losses deferred due to wash sale adjustments, foreign currency gains and losses, adjustments related to PFICs, REITs, RICs, certain derivatives and partnerships. |
| d) | Reclassification of Capital Accounts – The Fund may record reclassifications in its capital accounts. These reclassifications have no impact on the total net assets of the Fund. The reclassifications are a result of permanent differences between GAAP and tax accounting for such items as net operating losses that reduce distribution requirements. Adjustments are made to reflect the impact these items have on current and future distributions to shareholders. Therefore, the source of the Fund’s distributions may be shown in the accompanying Statement of Changes in Net Assets as from net investment income, from net realized gains on investments or from capital depending on the type of book and tax differences that exist. For the year ended December 31, 2009, the Fund recorded reclassifications to increase (decrease) the accounts listed below: |
Amount | ||||
| Accumulated Undistributed Net Investment Income | $ | (466 | ) | |
| Accumulated Net Realized Gain (Loss) on Investments | 469 | |||
| Paid-in-Capital | (3 | ) | ||
| e) | Capital Loss Carryforward – At December 31, 2009 (tax-year-end), the Fund had capital loss carryforwards for U.S. federal income tax purposes of approximately: |
| Year of Expiration | Amount | |||
| 2016 | $ | 455,474 | ||
| 2017 | 957,662 | |||
| Total | $ | 1,413,136 | ||
As of December 31, 2009, the Fund elected to defer the following post October losses.
Amount | ||||
| Long-Term Capital Gain | $ | 24,416 | ||
| f) | Accounting for Uncertainty in Income Taxes – Management has evaluated all open tax years and has determined there is no impact to the Fund’s financial statements related to uncertain tax positions. Generally, tax authorities can examine all tax returns filed for the last three years. |
| 5. | Expenses: |
| a) | Investment Management Agreements – HL Investment Advisors, LLC (“HL Advisors”), an indirect wholly-owned subsidiary of The Hartford Financial Services Group, Inc. (“The Hartford”), serves as investment manager to the Fund pursuant to an Investment Management Agreement with the Company. As investment manager, HL Advisors has overall |
investment supervisory responsibility for the Fund. In addition, HL Advisors provides administrative personnel, services, equipment, facilities and office space for proper operation of the Fund.
HL Advisors has contracted with Wellington Management for the provision of day-to-day investment management services to the Fund in accordance with the Fund’s investment objective and policies. The Fund pays a fee to HL Advisors, a portion of which may be used to compensate Wellington Management.
| b) | Administrative Services Agreement – For the two-month period January 1, 2010 through February 28, 2010, under the Administrative Services Agreement between HLIC and the Company, on behalf of the Fund, HLIC provided administrative services to the Fund and received monthly compensation at the annual rate of 0.20% of the Fund’s average daily net assets. The Fund assumed and paid certain other expenses (including, but not limited to, accounting, custodian, state taxes and Directors’ fees). Effective March 1, 2010, the Investment Management Agreement was amended to include the administrative services for the Fund and the separate administrative services agreement was terminated. |
The schedule below reflects the rates of compensation paid to HL Advisors for investment management services and to HLIC for administrative services rendered from January 1, 2010 through February 28, 2010, and the rates of compensation paid to the HL Advisors for the combined services from March 1, 2010 through June 30, 2010; the rates are accrued daily and paid monthly.
Average Daily Net Assets | Annual Fee | |||
| On first $250 million | 0.6800 | % | ||
| On next $250 million | 0.6550 | % | ||
| On next $500 million | 0.6450 | % | ||
| On next $4 billion | 0.5950 | % | ||
| On next $5 billion | 0.5925 | % | ||
| Over $10 billion | 0.5900 | % | ||
| c) | Accounting Services Agreement – Pursuant to the Fund Accounting Agreement between HLIC and the Company, on behalf of the Fund, HLIC provides accounting services to the Fund and receives monthly compensation on the Fund’s average net assets. The Fund’s accounting services fees are accrued daily and paid monthly. |
| Average Daily Net Assets | Annual Fee | |||
| On first $5 billion | 0.016 | % | ||
| On next $5 billion | 0.014 | % | ||
| Over $10 billion | 0.012 | % | ||
| d) | Operating Expenses – Allocable expenses incurred by the Company are allocated to each Fund and allocated to classes within the Fund in proportion to the average daily net assets of the Fund and each class, except where allocation of certain expenses is more fairly made directly to the Fund or to specific classes within a Fund. |
| e) | Fees Paid Indirectly – The Company, on behalf of the Fund has entered into agreements with State Street Global Advisers, LLC and Russell Implementation Securities, Inc. to partially recapture non-discounted trade commissions. Such rebates are used to pay a portion of the Fund’s expenses. In addition, the Fund’s custodian bank has also agreed to reduce its fees when the Fund maintains cash on deposit in a non-interest-bearing custody account. For the six-month period ended June 30, 2010, these amounts are included in the Statement of Operations. |
| Hartford Advisers HLS Fund |
| Notes to Financial Statements – (continued) |
| June 30, 2010 (Unaudited) |
| (000’s Omitted) |
The ratio of expenses to average net assets in the accompanying financial highlights excludes the reduction in expenses related to fees paid indirectly. Had the fees paid indirectly been included, the annualized expense ratio for the periods listed below would have been as follows:
| Annualized | ||||||||||||||||||||||||
| Six-Month | Year Ended | Year Ended | Year Ended | Year Ended | Year Ended | |||||||||||||||||||
| Period Ended | December 31, | December 31, | December 31, | December 31, | December 31, | |||||||||||||||||||
June 30, 2010 | 2009 | 2008 | 2007 | 2006 | 2005 | |||||||||||||||||||
| Class IA | 0.65 | % | 0.65 | % | 0.63 | % | 0.63 | % | 0.62 | % | 0.64 | % | ||||||||||||
| Class IB | 0.90 | 0.90 | 0.88 | 0.88 | 0.87 | 0.89 | ||||||||||||||||||
| f) | Distribution Plan for Class IB shares – The Company, on behalf of the Fund, has adopted a Distribution Plan pursuant to Rule 12b-1 under the 1940 Act for the Class IB shares. Pursuant to the Distribution Plan, the Fund is authorized to compensate the Distributor, Hartford Securities Distribution Company, Inc. (a wholly owned, ultimate subsidiary of The Hartford), from assets attributable to the Class IB shares for services rendered and expenses borne in connection with activities primarily intended to result in the sale of the Class IB shares, subject to the Fund Board’s review and approval. |
| The Distribution Plan provides that the Fund may pay annually up to 0.25% of the average daily net assets of the Fund attributable to its Class IB shares for activities primarily intended to result in the sale of Class IB shares. The Board has the authority to suspend or reduce these payments at any point in time. Under the terms of the Distribution Plan and the principal underwriting agreement, the Fund is authorized to make payments monthly to the Distributor which may be used to pay or compensate entities providing distribution and shareholder servicing with respect to the Class IB shares for such entities’ fees or expenses incurred or paid in that regard. These fees are accrued daily and paid monthly. |
| g) | Other Related Party Transactions – Certain officers of the Fund are directors and/or officers of HL Advisors, and/or The Hartford or its subsidiaries. For the six-month period ended June 30, 2010, a portion of the Fund’s chief compliance officer’s salary was paid by all the investment companies in the Hartford fund complex. The portion allocated to the Fund was in the amount of $9. These fees are accrued daily and paid monthly. |
| h) | Payment from Affiliate – On November 8, 2006, the SEC issued an order setting forth the terms of a settlement reached with three subsidiaries of The Hartford that resolves the SEC’s Division of Enforcement’s investigation of aspects of The Hartford’s variable annuity and mutual fund operations related to directed brokerage and revenue sharing. The Hartford settled this matter without admitting or denying the findings of the SEC. |
The Fund is available for purchase by the separate accounts of different variable universal life policies, variable annuity products, and funding agreements and it is offered directly to certain qualified retirement plans (collectively “Products”). Although existing Products contain transfer restrictions, some Products, particularly older variable annuity products, do not contain restrictions on the frequency of transfers. In addition, as the result of the settlement of litigation against Hartford Life, Inc. (“Hartford Life”) (the issuers of such variable annuity products), the Fund’s ability to restrict transfers by certain owners of older variable annuity products was limited. During 2006, these annuity owners surrendered the older variable annuity contracts that were the subject of prior litigation. In February 2005, Hartford Life agreed with the Board of Directors of the Fund to indemnify the Fund for any material harm caused to the Fund from frequent trading by these contracts owners. |
| The total return in the accompanying financial highlights includes payment from affiliates. Had the payment from affiliates been excluded, the total return for the periods listed below would have been as follows: |
For the Year Ended December 31, 2006 | ||||||||
Class IA | Class IB | |||||||
| Impact from Payment from Affiliate for SEC Settlement | 0.09 | % | 0.09 | % | ||||
| Total Return Excluding Payments from Affiliate | 10.61 | 10.34 | ||||||
| 6. | Investment Transactions: |
For the six-month period ended June 30, 2010, the cost of purchases and proceeds from sales of investment securities (excluding short-term investments) were as follows:
Amount | ||||
| Cost of Purchases Excluding U.S. Government Obligations | $ | 1,430,989 | ||
| Sales Proceeds Excluding U.S. Government Obligations | 1,494,768 | |||
| Cost of Purchases for U.S. Government Obligations | 55,063 | |||
| Sales Proceeds for U.S. Government Obligations | 53,553 | |||
| 7. | Line of Credit: |
The Fund is one of several Hartford funds that participate in a $500 million committed revolving line of credit facility. The facility is to be used for temporary or emergency purposes. Under the arrangement, a fund is required to own securities having a market value in excess of 300% of the total bank borrowings. The interest rate on borrowings varies depending on the nature of the loan. The facility also requires a fee to be paid based on the amount of the commitment. This fee is allocated to all the funds participating in the line of credit based on the average net assets of the funds. During the six-month period ended June 30, 2010, the Fund did not have any borrowings under this facility.
| 8. | Fund Merger: |
Reorganization of Hartford Global Advisers HLS Fund into Hartford Advisers HLS Fund: At a meeting held on August 5, 2009, the Board of Directors of the Company approved a Form of Agreement and Plan of Reorganization (“Reorganization Agreement”) that provided for the reorganization of a series of the Company, Hartford Global Advisers HLS Fund (“Target Fund”), into another series of the Company, Hartford Advisers Fund (“Acquiring Fund”) (the “Reorganization”). The reorganization did not require shareholder approval by the shareholders of Hartford Global Advisers HLS Fund or Hartford Advisers HLS Fund.
Pursuant to the Reorganization Agreement, on March 19, 2010, each holder of Class IA and Class IB shares of Hartford Global Advisers HLS Fund became the owner of full and fractional shares of the corresponding class in Hartford Advisers HLS Fund having an equal aggregate value.
The merger was accomplished by tax free exchange as detailed below:
| Net assets of | ||||||||||||||||||||
| Acquiring Fund | Net assets of | Acquiring | ||||||||||||||||||
Net assets of Target | shares issued to the | Acquiring Fund | Fund | |||||||||||||||||
| Fund on Merger | Target Fund shares | Target Fund's | immediately before | immediately | ||||||||||||||||
Date | exchanged | shareholders | merger | after merger | ||||||||||||||||
| Class IA | $ | 188,305 | 17,995 | 10,373 | $ | 3,614,641 | $ | 3,802,946 | ||||||||||||
| Class IB | 36,319 | 3,489 | 1,979 | 575,481 | 611,800 | |||||||||||||||
| Total | $ | 224,624 | 21,484 | 12,352 | $ | 4,190,122 | $ | 4,414,746 | ||||||||||||
The Hartford Global Advisers Fund had the following unrealized appreciation, accumulated net realized losses and capital stock as of March 19, 2010.
| Hartford Advisers HLS Fund |
| Notes to Financial Statements – (continued) |
| June 30, 2010 (Unaudited) |
| (000’s Omitted) |
| Unrealized | Accumulated Net | |||||||||||||||
| Appreciation | Realized Gains | |||||||||||||||
Fund | (Depreciation) | (Losses) | Capital Stock | Total | ||||||||||||
| Target Fund | $ | 27,709 | $ | (54,347 | ) | $ | 251,262 | $ | 224,624 | |||||||
Assuming the acquisition had been completed on January 1, 2010, the beginning of the semi-annual reporting period of the Fund, Hartford Advisers HLS Fund’s pro forma results of operations for the six-month period ended June 30, 2010, are as follows:
| Net Decrease in Net Assets | ||||||||||||
Fund | Net Investment Income | Net Gain on Investments | Resulting from Operations | |||||||||
| Acquiring Fund | $ | 35,147 | $ | 163,947 | $ | (162,750 | ) | |||||
Because the combined investment portfolios have been managed as a single integrated portfolio since the acquisition was completed, it is not practical to separate the amounts of revenue and earnings of Hartford Global Advisers HLS Fund that have been included in Hartford Adviser’s HLS Fund’s statement of operations since March 19, 2010.
| 9. | Industry Classifications: |
Other than the industry classifications “Other Investment Pools and Funds” and “Exchange Traded Funds”, equity industry classifications used in this report are the Global Industry Classification Standard, which was developed by and is the exclusive property and service mark of MSCI, Inc. and Standard & Poor’s.
[This page is intentionally left blank]
| Hartford Advisers HLS Fund |
| - Selected Per-Share Date (A) - - |
| Net Asset | Net Realized | Net Increase | ||||||||||||||||||||||||||||||||||||||||||
| Value at | Payments | and Unrealized | Total from | Dividends from | Distributions | (Decrease) in | Net Asset | |||||||||||||||||||||||||||||||||||||
| Beginning of | Net Investment | from (to) | Gain (Loss) on | Investment | Net Investment | from Realized | Distributions | Total | Net Asset | Value at End | ||||||||||||||||||||||||||||||||||
Class | Period | Income (Loss) | Affiliate | Investments | Operations | Income | Capital Gains | from Capital | Distributions | Value | of Period | |||||||||||||||||||||||||||||||||
| For the Six-Month Period Ended June 30, 2010 (Unaudited) | ||||||||||||||||||||||||||||||||||||||||||||
| IA | $ | 17.47 | $ | 0.16 | $ | – | $ | (0.86 | ) | $ | (0.70 | ) | $ | – | $ | – | $ | – | $ | – | $ | (0.70 | ) | $ | 16.77 | |||||||||||||||||||
| IB | 17.68 | 0.13 | – | (0.87 | ) | (0.74 | ) | – | – | – | – | (0.74 | ) | 16.94 | ||||||||||||||||||||||||||||||
| For the Year Ended December 31, 2009 | ||||||||||||||||||||||||||||||||||||||||||||
| IA | 13.69 | 0.36 | – | 3.78 | 4.14 | (0.36 | ) | – | – | (0.36 | ) | 3.78 | 17.47 | |||||||||||||||||||||||||||||||
| IB | 13.85 | 0.32 | – | 3.83 | 4.15 | (0.32 | ) | – | – | (0.32 | ) | 3.83 | 17.68 | |||||||||||||||||||||||||||||||
| For the Year Ended December 31, 2008 | ||||||||||||||||||||||||||||||||||||||||||||
| IA | 20.97 | 0.50 | – | (7.09 | ) | (6.59 | ) | (0.58 | ) | (0.11 | ) | – | (0.69 | ) | (7.28 | ) | 13.69 | |||||||||||||||||||||||||||
| IB | 21.18 | 0.47 | – | (7.17 | ) | (6.70 | ) | (0.52 | ) | (0.11 | ) | – | (0.63 | ) | (7.33 | ) | 13.85 | |||||||||||||||||||||||||||
| For the Year Ended December 31, 2007 | ||||||||||||||||||||||||||||||||||||||||||||
| IA | 22.60 | 0.55 | – | 0.90 | 1.45 | (0.53 | ) | (2.55 | ) | – | (3.08 | ) | (1.63 | ) | 20.97 | |||||||||||||||||||||||||||||
| IB | 22.78 | 0.49 | – | 0.92 | 1.41 | (0.46 | ) | (2.55 | ) | – | (3.01 | ) | (1.60 | ) | 21.18 | |||||||||||||||||||||||||||||
| For the Year Ended December 31, 2006 | ||||||||||||||||||||||||||||||||||||||||||||
| IA | 22.53 | 0.58 | 0.02 | 1.81 | 2.41 | (0.57 | ) | (1.77 | ) | – | (2.34 | ) | 0.07 | 22.60 | ||||||||||||||||||||||||||||||
| IB | 22.70 | 0.51 | 0.02 | 1.83 | 2.36 | (0.51 | ) | (1.77 | ) | – | (2.28 | ) | 0.08 | 22.78 | ||||||||||||||||||||||||||||||
| For the Year Ended December 31, 2005 | ||||||||||||||||||||||||||||||||||||||||||||
| IA | 23.04 | 0.54 | – | 1.12 | 1.66 | (0.77 | ) | (1.04 | ) | (0.36 | ) | (2.17 | ) | (0.51 | ) | 22.53 | ||||||||||||||||||||||||||||
| IB | 23.17 | 0.47 | – | 1.15 | 1.62 | (0.69 | ) | (1.04 | ) | (0.36 | ) | (2.09 | ) | (0.47 | ) | 22.70 | ||||||||||||||||||||||||||||
| (A) | Information presented relates to a share outstanding throughout the indicated period. |
| (B) | The figures do not include sales charges or other fees which may be applied at the variable life insurance, variable annuity or qualified retirement plan product level. Any such additional sales charges or other fees would lower the Fund's performance. |
| (C) | Ratios do not reflect reductions for fees paid indirectly. Please see Fees Paid Indirectly in the Notes to Financial Statements. |
| (D) | Portfolio turnover rate is calculated on the basis of the Fund as a whole without distinguishing between the classes of shares issued. |
| (E) | Not annualized. |
| (F) | Annualized. |
| (G) | During the six-month period ended June 30, 2010, the Fund incurred $204.5 million in purchases associated with the transition of assets from Hartford Global Advisers HLS Fund, which merged into the Fund on March 19, 2010. These purchases were excluded from the portfolio turnover calculation. |
| (H) | Total return without the inclusion of the Payment from (to) Affiliate can be found in Expenses in the accompanying Notes to Financial Statements. |
- Ratios and Supplemental Data -
Net Assets at | Ratio of Expenses to Average Net | Ratio of Expenses to Average Net | Ratio of Net Investment Income to | Portfolio Turnover | ||||||||||||||||||
Total Return(B) | End of Period | Assets Before Waivers(C) | Assets After Waivers(C) | Average Net Assets | Rate(D) | |||||||||||||||||
| (4.04 | )%(E) | $ | 3,328,562 | 0.65 | %(F) | 0.65 | %(F) | 1.70 | %(F) | 32 | %(G) | |||||||||||
| (4.16 | )(E) | 532,462 | 0.90 | (F) | 0.90 | (F) | 1.45 | (F) | – | |||||||||||||
| 30.29 | 3,607,929 | 0.65 | 0.65 | 2.15 | 73 | |||||||||||||||||
| 29.96 | 578,338 | 0.90 | 0.90 | 1.90 | – | |||||||||||||||||
| (31.64 | ) | 3,404,626 | 0.63 | 0.63 | 2.43 | 76 | ||||||||||||||||
| (31.81 | ) | 548,899 | 0.88 | 0.88 | 2.18 | – | ||||||||||||||||
| 6.64 | 6,291,220 | 0.63 | 0.63 | 2.13 | 47 | |||||||||||||||||
| 6.37 | 1,080,254 | 0.88 | 0.88 | 1.88 | – | |||||||||||||||||
| 10.70 | (H) | 7,207,926 | 0.64 | 0.64 | 2.24 | 87 | ||||||||||||||||
| 10.43 | (H) | 1,252,293 | 0.89 | 0.89 | 1.99 | – | ||||||||||||||||
| 7.24 | 8,157,354 | 0.66 | 0.65 | 1.96 | 89 | |||||||||||||||||
| 6.97 | 1,366,216 | 0.91 | 0.90 | 1.72 | – | |||||||||||||||||
| Hartford Advisers HLS Fund |
The Board of Directors appoints officers who are responsible for the day-to-day operations of the Fund and who execute policies formulated by the Directors. Each director serves until his or her death, resignation, or retirement or until the next annual meeting of shareholders is held or until his or her successor is elected and qualifies.
Directors and officers who are employed by or who have a financial interest in The Hartford are considered “interested” persons of the Fund pursuant to the Investment Company Act of 1940, as amended. Each officer and two of the Company’s directors, as noted in the chart below, are “interested” persons of the Fund. Each director serves as a director for The Hartford Mutual Funds, Inc., The Hartford Mutual Funds II, Inc., The Hartford Income Shares Fund, Inc., Hartford Series Fund, Inc., and Hartford HLS Series Fund II, Inc., which, as of June 30, 2010, collectively consist of 88 funds. Correspondence may be sent to directors and officers c/o Hartford Mutual Funds, P.O. Box 2999, Hartford, Connecticut 06104-2999, except that correspondence to Ms. Fagely may be sent to 500 Bielenberg Drive, Woodbury, Minnesota 55125.
The table below sets forth, for each director and officer, his or her name, year of birth, current position with the Company and date first elected or appointed to Hartford Series Fund, Inc. (“HSF”), and Hartford HLS Series Fund II, Inc. (“HSF2”), principal occupation, and, for directors, other directorships held. The Fund’s statement of additional information contains further information on the directors and is available free of charge by calling 1-800-862-6668 or writing to Hartford HLS Funds, c/o Individual Annuity Services, P.O. Box 5085, Hartford, CT 06102-5085.
Information on the aggregate remuneration paid to the directors of the Company can be found in the Statement of Operations herein. The Fund pays to The Hartford a portion of the chief compliance officer’s compensation, but does not pay salaries or compensation to any of their other officers or directors who are employed by The Hartford.
Non-Interested Directors
Lynn S. Birdsong (1946) Director since 2003, Co-Chairman of the Investment Committee
Mr. Birdsong is a private investor. Since 2003, Mr. Birdsong has been an independent director of The Japan Fund and has served as a Director of the Sovereign High Yield Fund since April 2010. From 2003 to March 2005, Mr. Birdsong was an independent director of the Atlantic Whitehall Funds. From 1979 to 2002, Mr. Birdsong was a managing director of Zurich Scudder Investments, an investment management firm. During his employment with Scudder, Mr. Birdsong was an interested director of The Japan Fund. Since 1981, Mr. Birdsong has been a partner in Birdsong Company, an advertising specialty firm.
Robert M. Gavin, Jr. (1940) Director since 2002 (HSF) and 1986 (HSF2), Chairman of the Board since 2004
Dr. Gavin is an educational consultant. Prior to September 1, 2001, he was President of Cranbrook Education Community and prior to July 1996, he was President of Macalester College, St. Paul, Minnesota.
Duane E. Hill (1945) Director since 2001 (HSF) and 2002 (HSF2), Chairman of the Nominating Committee
Mr. Hill is Partner of TSG Ventures L.P., a private equity investment company. Mr. Hill is a former partner of TSG Capital Group, a private equity investment firm that served as sponsor and lead investor in leveraged buyouts of middle market companies.
Sandra S. Jaffee (1941) Director since 2005
Ms. Jaffee served as Chairman (2008 to 2009) and Chief Executive Officer of Fortent (formerly Searchspace Group), a leading provider of compliance/regulatory technology to financial institutions from August 2005 to August 2009. From August 2004 to August 2005, Ms. Jaffee served as an Entrepreneur in Residence with Warburg Pincus, a private equity firm. From September 1995 to July 2004, Ms. Jaffee served as Executive Vice President at Citigroup, where she was President and Chief Executive Officer of Citibank’s Global Securities Services (1995 to 2003).
William P. Johnston (1944) Director since 2005, Chairman of the Compliance Committee
In June 2006, Mr. Johnston was appointed as Senior Advisor to The Carlyle Group, a global private equity investment firm. In July 2006, Mr. Johnston was elected to the Board of Directors of MultiPlan, Inc. In August 2007, Mr. Johnston was elected to the Board of Directors of LifeCare Holdings, Inc. In February 2008, Mr. Johnston was elected to the Board of Directors of HCR-ManorCare, Inc. In May 2006, Mr. Johnston was elected to the Supervisory Board of Fresenius Medical Care AG & Co. KGaA, after its acquisition of Renal Care Group, Inc. in March 2006. Mr. Johnston joined Renal Care Group in November 2002 as a member of the Board of Directors and served as Chairman of the Board from March 2003 through March 2006. From September 1987 to December 2002, Mr. Johnston was with Equitable Securities Corporation (and its successors, SunTrust Equitable Securities and SunTrust Robinson Humphrey) serving in various investment banking and managerial positions, including Managing Director and Head of Investment Banking, Chief Executive Officer and Vice Chairman.
Phillip O. Peterson (1944) Director since 2002 (HSF) and 2000 (HSF2), Chairman of the Audit Committee
Mr. Peterson is a mutual fund industry consultant. He was a partner of KPMG LLP (an accounting firm) until July 1999. Mr. Peterson joined William Blair Funds in February 2007 as a member of the Board of Trustees. From January 2004 to April 2005, Mr. Peterson served as Independent President of the Strong Mutual Funds.
Lemma W. Senbet (1946) Director since 2005
Dr. Senbet is the William E. Mayer Chair Professor of Finance and Director, Center for Financial Policy, at the University of Maryland, Robert H. Smith School of Business. He was chair of the Finance Department during 1998 to 2006. Previously he was a chaired professor of finance at the University of Wisconsin-Madison. Also, he was director of the Fortis Funds from March 2000 to July 2002. Dr. Senbet served the finance profession in various capacities, including as director of the American Finance Association and President of the Western Finance Association. In 2006, Dr. Senbet was inducted Fellow of Financial Management Association International for his career-long distinguished scholarship and professional service.
Interested Directors and Officers
Lowndes A. Smith (1939) Director since 1996 (HSF) and 2002 (HSF2), Co-Chairman of the Investment Committee
Mr. Smith served as Vice Chairman of The Hartford from February 1997 to January 2002, as President and Chief Executive Officer of Hartford Life, Inc. from February 1997 to January 2002, and as President and Chief Operating Officer of The Hartford Life Insurance Companies from January 1989 to January 2002. Mr. Smith serves as a Director of White Mountains Insurance Group, Ltd., One Beacon Insurance, Symetra Financial and as a Managing Director of Whittington Gray Associates.
John C. Walters 1, 2 (1962) Director since 2008
Mr. Walters currently serves as President, Chief Executive Officer and Director for Hartford Life, Inc. (“HL, Inc.”). Mr. Walters also serves as President, Chairman of the Board, Chief Executive Officer and Director for Hartford Life Insurance Company (“Hartford Life”), and as Executive Vice President of The Hartford. In addition, Mr. Walters is a Manager of HL Investment Advisors, LLC (“HL Advisors”). Mr. Walters previously served as President of the U.S. Wealth Management Division of HL, Inc. (2006-2007) and as Co-Chief Operating Officer of Hartford Life (2007-2008).
1 Mr. Walters previously served as President and Chief Executive Officer (2007 to 2009).
2 Effective July 31, 2010, Mr. Walters retired from The Hartford. Mr. Walters resigned his position as a Director of the Fund effective July 30, 2010.
Other Officers
Robert M. Arena, Jr. (1968) President and Chief Executive Officer since 2009 (served as Vice President of the Fund (2006-2009))
Mr. Arena serves as Executive Vice President of Hartford Life. Additionally, Mr. Arena is Senior Vice President and Director of Hartford Administrative Services Company, (“HASCO”), President, Chief Executive Officer and Manager of Hartford Investment Financial Services, LLC (“HIFSCO”) and President, Chief Executive Officer and Manager of HL Advisors. Mr. Arena joined The Hartford in 2004.
Tamara L. Fagely (1958) Vice President, Treasurer and Controller since 2002 (HSF) 1993 (HSF2)
Ms. Fagely has been a Vice President of HASCO since 1998 and Chief Financial Officer since 2006. Currently Ms. Fagely is a Vice President of Hartford Life. She served as Assistant Vice President of Hartford Life from December 2001 through March 2005. In addition, Ms. Fagely is Controller and Chief Financial Officer of HIFSCO.
Brian Ferrell (1962) AML Compliance Officer since 2008
Mr. Ferrell has served as Assistant Vice President and AML Compliance Officer for The Hartford since 2006, and as AML Compliance Officer for HASCO and Hartford Investor Services Company, LLC (“HISC”) since 2008. Prior to joining The Hartford in 2006, Mr. Ferrell held various positions at the U.S. Department of the Treasury (the “Treasury”) from 2001 to 2006, where he served as Chief Counsel for the Treasury’s Financial Crimes Enforcement Network from 2005-2006.
Dr. Robert J. Froehlich (1953) Senior Managing Director since 2009
Dr. Froehlich joined The Hartford as Senior Managing Director in September 2009. Prior to joining The Hartford, Dr. Froehlich served as Vice Chairman of Deutsche Asset Management from 1997-2009.
| Hartford Advisers HLS Fund |
| Directors and Officers (Unaudited) – (continued) |
Thomas D. Jones, III (1965) Vice President and Chief Compliance Officer since 2006
Mr. Jones serves as Chief Compliance Officer for the Hartford Mutual Funds and Vice President and Director of Securities Compliance for The Hartford. Mr. Jones joined The Hartford in 2006 from SEI Investments, where he served as Chief Compliance Officer for its mutual funds and investment advisers. Prior to joining SEI, Mr. Jones was First Vice President and Compliance Director for Merrill Lynch Investment Managers (Americas) (“MLIM”), where he worked from 1992-2004.
Edward P. Macdonald (1967) Vice President, Secretary and Chief Legal Officer since 2005
Mr. Macdonald serves as Assistant Vice President of Hartford Life and Chief Legal Officer and Vice President of HIFSCO. He also serves as Vice President and Secretary of HASCO, and Chief Legal Officer, Secretary and Vice President of HL Advisors. Mr. Macdonald joined The Hartford in 2005.
Vernon J. Meyer (1964) Vice President since 2006
Mr. Meyer serves as Senior Vice President of Hartford Life. He also serves as Senior Vice President of HIFSCO and HL Advisors. Mr. Meyer joined The Hartford in 2004.
D. Keith Sloane (1960) Vice President since 2009
Mr. Sloane is a Senior Vice President of Hartford Life. Additionally, Mr. Sloane currently serves as Senior Vice President of HIFSCO, HL Advisors, and HASCO. Prior to joining The Hartford in 2007, Mr. Sloane was Director of product marketing and led the mutual fund business for Wachovia Securities (“Wachovia”) in their investment products group. Mr. Sloane joined Wachovia in 1995.
Jane Wolak (1961) Vice President since 2009
Ms. Wolak currently serves as Vice President of Hartford Life. Ms. Wolak joined Hartford Life as Vice President, Retail Product Services in May 2007. She is also Vice President of HASCO. Previously, Ms. Wolak was with Sun Life Financial where she held the position of Vice President, Service Center Operations from 2001-2007.
A description of the policies and procedures that the Fund uses to determine how to vote proxies relating to portfolio securities and a record of how the Fund voted any proxies for the twelve-month period ended June 30, 2010 is available (1) without charge, upon request, by calling 800-862-6668 and (2) on the Securities and Exchange Commission’s website at http://www.sec.gov.
The Fund files a complete schedule of portfolio holdings with the Commission for the first and third quarters of each fiscal year on Form N-Q. The Fund’s Forms are available (1) without charge, upon request, by calling 800-862-6668 and (2) on the Securities and Exchange Commission’s website at http://www.sec.gov. The Form N-Q may be reviewed and copied at the Commission’s Public Reference Room in Washington, DC. Information on the operation of the Public Reference Room may be obtained by calling 1-800-SEC-0330.
| Hartford Advisers HLS Fund |
The following proposals were addressed and approved at a Special Meeting of Shareholders held on February 12, 2010.
Proposal to approve amendments to the Investment Management Agreement between the Fund and HL Investment Advisors, the purpose of which are to combine the administrative services for the Fund with the management services for the Fund under a single agreement.
| Fund | For | Against | Abstain | ||||||
| Hartford Advisers HLS Fund | 223,067,011.189 | 6,363,297.030 | 7,410,467.233 |
Proposal to elect Lemma Senbet and John Walters, each currently a Director, as Directors of Hartford Series Fund Inc.
Lemma W. Senbet
| Funds | For | Withheld | ||||
| Hartford Series Fund, Inc. | 5,079,578,022.902 | 241,839,974.106 |
John C. Walters
| Funds | For | Withheld | ||||
| Hartford Series Fund, Inc. | 5,081,138,302.186 | 240,279,694.822 |
| Hartford Advisers HLS Fund |
Your Fund's Expenses
As a shareholder of the Fund, you incur two types of costs: (1) transaction costs, including sales charges (loads) on purchase payments and contingent deferred sales charges (CDSC) (2) ongoing costs including management fees; distribution fees; and other fund expenses. This example is intended to help you understand your ongoing costs (in dollars) of investing in the Fund and to compare these costs with the ongoing costs of investing in other mutual funds. The example is based on an investment of $1,000 invested at the beginning of the period and held for the period of December 31, 2009 through June 30, 2010.
Actual Expenses
The first set of columns of the table below provides information about actual account values and actual expenses. You may use the information in this column, together with the amount you invested, to estimate the expenses that you paid over the period. Simply divide your account value by $1,000 (for example, an $8,600 account value divided by $1,000 = 8.6), then multiply the result by the number in the line under the heading entitled "Expenses Paid During Period" to estimate the expenses you paid on your account during this period.
Hypothetical Example for Comparison Purposes
The second set of columns of the table below provides information about hypothetical account values and hypothetical expenses based on the Fund's actual expense ratio and an assumed rate of return of 5% per year before expenses, which is not the Fund's actual return. The hypothetical account values and expenses may not be used to estimate the actual ending account balance or expenses you paid for the period. You may use this information to compare the ongoing costs of investing in the Fund and other funds. To do so, compare this 5% hypothetical example with the 5% hypothetical examples that appear in the shareholder reports of the other funds.
Please note that the expenses shown in the table are meant to highlight your ongoing costs only and do not reflect any transactional costs, such as sales charges (loads) and CDSC. Therefore, the second set of columns of the table is useful in comparing ongoing costs only, and will not help you determine the relative total costs of owning different funds. In addition, if these transactional costs were included, your costs would be higher. Expenses are equal to the Fund's annualized expense ratios multiplied by average account value over the period, multiplied by 181/365 (to reflect the one-half year period).
| Actual return | Hypothetical (5% return before expenses) | |||||||||||||||||||||||||||||||||||
| Expenses paid | Expenses paid | Days in | ||||||||||||||||||||||||||||||||||
| during the period | during the period | the | Days | |||||||||||||||||||||||||||||||||
| Beginning | Ending | December 31, 2009 | Beginning | Ending | December 31, 2009 | Annualized | current | in the | ||||||||||||||||||||||||||||
| Account Value | Account Value | through | Account Value | Account Value | through | expense | 1/2 | full | ||||||||||||||||||||||||||||
December 31, 2009 | June 30, 2010 | June 30, 2010 | December 31, 2009 | June 30, 2010 | June 30, 2010 | ratio | year | year | ||||||||||||||||||||||||||||
| Class IA | $ | 1,000.00 | $ | 959.62 | $ | 3.16 | $ | 1,000.00 | $ | 1,021.57 | $ | 3.26 | 0.65 | % | 181 | 365 | ||||||||||||||||||||
Class IB | $ | 1,000.00 | $ | 958.43 | $ | 4.37 | $ | 1,000.00 | $ | 1,020.33 | $ | 4.51 | 0.90 | % | 181 | 365 | ||||||||||||||||||||
| Hartford Advisers HLS Fund |
The Board approved the annual continuation of the Investment Management Agreement (the “Agreement”) between Hartford Series Fund, Inc. (“HSF”) and HL Investment Advisors, LLC (“HL Advisors”) with respect to the Fund at its meeting on August 4-5, 2009. The Board’s considerations in approving the renewal of the Agreement are disclosed in the December 31, 2009 Annual Report for HSF.
At the November 4-5, 2009 meeting, the Board considered and approved amendments to the Agreement to include administrative services, which had been provided pursuant to a separate agreement, and investment management services under one agreement. The Board, including all of the Independent Directors, approved the amendments to the Agreement with respect to the Fund.
In approving the amendments, in addition to the information presented at the August meeting in connection with the annual review of the Agreement and the additional information provided throughout the year, the Board also considered the fact that the amendments did not result in an overall increase in fees to shareholders. The Board took note of the fact that the management of HL Advisors believes that the proposal to combine the administrative services with the investment management services under a single agreement will produce streamlined fee disclosure, resulting in greater transparency and clarity in the Fund’s prospectuses and financial reports. The Board further noted management's belief that the change would result in consistency across all of the Hartford Funds in the complex in that the funds of HSF are the only funds in the complex (other than the R share classes of the Hartford retail funds) that are subject to a separate administrative services fee. Finally, the Board noted management's view that the proposed changes to the Agreement should also serve to simplify the Board's annual consideration of the investment management arrangements for the Fund in that the investment management and administrative fees would be presented as a single fee for fee comparison purposes, which should facilitate the Board's analysis.
The shareholders of the Fund approved the amendments at a Special Meeting of Shareholders held on February 12, 2010. The amendments were effective as of March 1, 2010.
37
The Hartford
P.O. Box 5085
Hartford, CT 06102–5085
Hartford Series Fund, Inc. is underwritten and distributed by Hartford Securities Distribution Company, Inc.
“The Hartford” is The Hartford Financial Services Group, Inc. and its subsidiaries.
Hartford Series Fund, Inc. inception dates range from 1977 to date. Hartford Series Fund, Inc. is not a subsidiary of The Hartford but is underwritten, distributed by and advised by subsidiaries of The Hartford. Investments in Hartford Series Fund, Inc. are not guaranteed by The Hartford or any other entity.
This material is authorized for distribution only when preceded or accompanied by a current prospectus. The prospectus contains detailed information about the Funds, including investment objectives, risks and charges and expenses. Please read it carefully before you invest or send money.
HLSSAR-AD10 Printed in U.S.A ©2010 The Hartford, Hartford, CT 06115 |
| Hartford Capital Appreciation HLS Fund |
|
Hartford Capital Appreciation HLS Fund
| Manager Discussions (Unaudited) | 2 |
| Financial Statements | |
| 4 | |
| 10 | |
| 11 | |
| 12 | |
| 13 | |
| 14 | |
| 26 | |
| 28 | |
| 30 | |
| 30 | |
| 31 | |
| 32 | |
| 33 |
This report is prepared for the general information of contract owners and qualified retirement plan participants. It is not an offer of contracts or of qualified retirement plans. It should not be used in connection with any offer, except in conjunction with the appropriate prospectus which contains all pertinent information including the applicable sales, administrative and other charges.
The views expressed in the Fund’s Manager Discussion under ‘‘Why did the Fund perform this way?’’ and ‘‘What is the outlook?’’ are views of the Fund’s subadvisers and portfolio management team through the end of the period and is subject to change based on market and other conditions.
Hartford Capital Appreciation HLS Fund inception 4/2/1984
(subadvised by Wellington Management Company, LLP)
Investment objective – Seeks growth of capital.
Performance Overview(1) 6/30/00 - 6/30/10
Growth of $10,000 investment

Russell 3000 Index is an unmanaged index which measures the performance of the 3,000 largest U.S. companies based on total market capitalization.
S&P 500 Index is a market capitalization-weighted price index composed of 500 widely held common stocks.
You cannot invest directly in an index.
The chart represents a hypothetical investment in the Fund. Performance data represents past performance and current performance could be higher or lower.
Average Annual Returns (as of 6/30/10) | ||||||||
| 6 | 1 | 5 | 10 | |||||
| Month† | Year | Year | Year | |||||
| Capital Appreciation IA | -8.91% | 14.89% | 2.80% | 3.78% | ||||
| Capital Appreciation IB | -9.02% | 14.61% | 2.54% | 3.54% | ||||
| Russell 3000 Index | -6.05% | 15.72% | -0.48% | -0.92% | ||||
| S&P 500 Index | -6.64% | 14.43% | -0.80% | -1.59% | ||||
| † | Not Annualized |
PAST PERFORMANCE IS NOT INDICATIVE OF FUTURE RESULTS.
| (1) | Growth of a $10,000 investment in Class IB shares will vary from the results seen on this page due to differences in the expense charged to this share class. |
Performance information may reflect historical or current expense waivers from the investment adviser, without which performance would have been lower. For information on current expense waivers/reimbursements, please see the prospectus.
The value of the contract will fluctuate so that when redeemed, it may be worth more or less than the original investment. The chart and table do not reflect the deduction of taxes that a shareholder would pay on portfolio distributions or the redemption of portfolio shares. The figures do not include sales charges or other fees which may be applied at the variable life insurance, variable annuity or qualified retirement plan product level. Any such additional sales charges or other fees would lower the Fund’s performance.
| Portfolio Managers | ||
| Saul J. Pannell, CFA | Kent M. Stahl, CFA | Peter I. Higgins, CFA |
| Senior Vice President, Partner | Senior Vice President, Director | Senior Vice President, Partner |
| Paul E. Marrkand, CFA | Nicolas M. Choumenkovitch | Donald Kilbride |
| Senior Vice President, Partner | Senior Vice President, Partner | Senior Vice President |
| Stephen Mortimer | David W. Palmer, CFA | Jeffrey L. Kripke |
| Senior Vice President | Vice President | Vice President |
How did the Fund perform?
The Class IA shares of the Hartford Capital Appreciation HLS Fund returned -8.91% for the six-month period ended June 30, 2010, underperforming its benchmarks, the Russell 3000 Index, which returned -6.05% and the S&P 500 Index, which returned -6.64% for the same period. The Fund also underperformed the -6.10% return of the average fund in the Lipper Multi- Cap Core Funds VP-UF peer group, a group of funds with investment strategies similar to those of the Fund.
Why did the Fund perform this way?
Global equities had a tumultuous start to 2010. Through late April, U.S. equities rose as investor confidence grew amid better-than-expected corporate earnings, accommodative monetary policy, and improving economic conditions. From late April until the end of the period, risk aversion rose and equities fell on concerns that the global economy could slip back into recession. Investors worried about how burgeoning fiscal deficits across much of Europe, tightening credit conditions in China, and a disinflationary environment would affect the economic recovery and corporate earnings growth. Equity markets as measured by the Russell 3000 returned (-6%) during the period, with all sectors within the index
posting negative returns. Energy (-12%), Materials (-11%), and Information Technology (-10%) lagged the most. Consumer Discretionary (-1%) and Industrials (-2%) performed the best.
The Fund underperformed its benchmark primarily due to stock selection. Selection was weakest in Information Technology, Health Care, and Financials, and strongest in Industrials. Allocation among sectors, a result of the bottom-up (i.e. stock by stock fundamental research) stock selection process, contributed positively to relative (i.e. performance of the Fund as measured against the benchmark) performance, largely due to an underweight (i.e. the Fund’s sector position was less than the benchmark position) position in Energy and an overweight (i.e. the Fund’s sector position was greater than the benchmark position) to Consumer Discretionary. A modest allocation to cash during the period contributed positively in a declining market.
The largest detractors from relative returns were Cameco (Energy), Hon Hai Precision (Information Technology), and British Petroleum (BP) (Energy). Shares of Canadian uranium producer Cameco performed poorly as uranium spot prices declined. Electronic components manufacturer Hon Hai Precision’s stock fell as investors worried about the company's gross margin trends, which were influenced by the addition of new-lower margin projects. Toward the end of the period, shares of Hon Hai Precision also declined on news of multiple suicides at their manufacturing campus in Shenzhen. Shares of BP fell in the aftermath of the catastrophic oil spill at its Deepwater Horizon oil rig in the Gulf of Mexico. Pharmaceutical company Pfizer (Health Care) and investment bank and bank holding company Goldman Sachs (Financials) were also top detractors from absolute performance.
Ford Motor Company (Consumer Discretionary), Exxon Mobil (Energy), and ACE (Financials) were among the top contributors to relative returns. Shares of automobile and truck manufacturer Ford Motor rose toward the beginning of the period as earnings exceeded expectations due to the firm's strong product line-up as well as continued improvements in prices and margins. Shares of large diversified energy company Exxon Mobil fell as investors were concerned about potential dilution from the firm's acquisition of XTO and Exxon's exclusion from the Russell Value Index. Our underweight relative to the benchmark contributed positively to relative results. Shares of ACE, a global property and casualty insurance company, benefited from better-than-consensus quarterly results due primarily to favorable property and casualty underwriting. Consumer electronics company Apple (Information Technology) and mining company Barrick Gold (Materials) were top contributors to absolute returns.
What is the outlook?
Global equity markets have come under pressure as credit fears have resurfaced, especially in Europe. We believe there are also early indications of a coming global growth slowdown. With inflation generally absent, we expect no rate hikes from any of the major central banks in the near future. The sovereign debt crisis in Europe is likely only a precursor to the fiscal challenges many developed countries may face in the coming years. Emerging countries continue to have superior macroeconomic fundamentals and are expected to provide some offset in an otherwise slowing global growth environment.
In this environment we continue to focus our efforts on stock-by-stock fundamental research. At the end of the period, the Fund was most overweight the Consumer Discretionary, Health Care, and Materials sectors and most underweight Consumer Staples, Utilities, and Energy. The Fund’s largest absolute sector weights were in the Information Technology, Financials, and Consumer Discretionary sectors. As of June 30, 2010, Team 1 (Saul Pannell) managed approximately 51% of the Fund’s net assets.
| Diversification by Industry | ||||
| as of June 30, 2010 | ||||
| Percentage of | ||||
| Industry (Sector) | Net Assets | |||
| Equity Securities | ||||
Automobiles & Components (Consumer Discretionary) | 5.6 | % | ||
| Banks (Financials) | 5.9 | |||
| Capital Goods (Industrials) | 7.3 | |||
Commercial & Professional Services (Industrials) | 0.2 | |||
Consumer Durables & Apparel (Consumer Discretionary) | 1.8 | |||
| Consumer Services (Consumer Discretionary) | 0.9 | |||
| Diversified Financials (Financials) | 4.2 | |||
| Energy (Energy) | 7.5 | |||
| Food & Staples Retailing (Consumer Staples) | 2.6 | |||
Food, Beverage & Tobacco (Consumer Staples) | 2.9 | |||
Health Care Equipment & Services (Health Care) | 4.6 | |||
Household & Personal Products (Consumer Staples) | 0.5 | |||
| Insurance (Financials) | 5.7 | |||
| Materials (Materials) | 6.2 | |||
| Media (Consumer Discretionary) | 2.3 | |||
| Other Investment Pools and Funds (Financials) | 0.5 | |||
Pharmaceuticals, Biotechnology & Life Sciences (Health Care) | 10.2 | |||
| Real Estate (Financials) | 0.2 | |||
| Retailing (Consumer Discretionary) | 4.8 | |||
Semiconductors & Semiconductor Equipment (Information Technology) | 2.6 | |||
| Software & Services (Information Technology) | 8.7 | |||
Technology Hardware & Equipment (Information Technology) | 7.6 | |||
| Telecommunication Services (Services) | 0.7 | |||
| Transportation (Industrials) | 4.1 | |||
| Utilities (Utilities) | 0.4 | |||
| Total | 98.0 | % | ||
| Fixed Income Securities | ||||
| Finance and Insurance (Finance) | 0.3 | |||
| Total | 0.3 | % | ||
| Short-Term Investments | 1.1 | |||
| Other Assets and Liabilities | 0.6 | |||
| Total | 100.0 | % | ||
| Hartford Capital Appreciation HLS Fund |
June 30, 2010 (Unaudited)
(000’s Omitted)
| Shares or Principal Amount | Market Value ╪ | |||||
| COMMON STOCKS - 96.8% | ||||||
| Automobiles & Components - 4.9% | ||||||
| 960 | Daimler AG | $ | 48,542 | |||
| 22,618 | Ford Motor Co. · | 227,992 | ||||
| 239 | Gentex Corp. | 4,290 | ||||
| 1,100 | Johnson Controls, Inc. | 29,554 | ||||
| 168 | Magna International, Inc. Class A | 11,081 | ||||
| 3,844 | Modine Manufacturing Co. · | 29,522 | ||||
| 517 | Tenneco Automotive, Inc. · | 10,889 | ||||
| 2,295 | TRW Automotive Holdings Corp. · | 63,270 | ||||
| 425,140 | ||||||
| Banks - 5.9% | ||||||
| 96 | Bancolombia S.A. ADR | 4,803 | ||||
| 9,781 | Bank Central Asia PT | 6,364 | ||||
| 9,241 | Barclays Bank plc | 36,884 | ||||
| 4,952 | China Merchants Bank Co., Ltd. | 11,847 | ||||
| 3,270 | Intesa Sanpaolo | 8,613 | ||||
| 418 | Itau Unibanco Banco Multiplo S.A. ADR | 7,526 | ||||
| 81 | Itau Unibanco Holding S.A. ADR ■ | 1,453 | ||||
| 12,784 | Lloyds Banking Group plc | 10,092 | ||||
| 847 | MGIC Investment Corp. · | 5,834 | ||||
| 20,772 | Mitsubishi UFJ Financial Group, Inc. | 94,321 | ||||
| 1,129 | PMI Group, Inc. · | 3,262 | ||||
| 508 | Radian Group, Inc. | 3,675 | ||||
| 2,008 | Standard Chartered plc | 48,900 | ||||
| 130 | Sumitomo Mitsui Financial Group, Inc. | 3,682 | ||||
| 14,506 | Turkiye Garanti Bankasi A.S. | 60,369 | ||||
| 8,092 | Wells Fargo & Co. | 207,160 | ||||
| 514,785 | ||||||
| Capital Goods - 7.3% | ||||||
| 252 | AMETEK, Inc. | 10,106 | ||||
| 1,568 | ArvinMeritor, Inc. · | 20,544 | ||||
| 854 | Atlas Copco Ab | 12,483 | ||||
| 381 | Barnes Group, Inc. | 6,248 | ||||
| 231 | Boeing Co. | 14,492 | ||||
| 325 | Caterpillar, Inc. | 19,500 | ||||
| 69 | Cummins, Inc. | 4,509 | ||||
| 181 | Dover Corp. | 7,559 | ||||
| 153 | Emerson Electric Co. | 6,668 | ||||
| 239 | Flowserve Corp. | 20,284 | ||||
| 395 | General Dynamics Corp. | 23,149 | ||||
| 9,715 | General Electric Co. | 140,084 | ||||
| 528 | Honeywell International, Inc. | 20,599 | ||||
| 305 | Illinois Tool Works, Inc. | 12,610 | ||||
| 728 | Ingersoll-Rand plc | 25,094 | ||||
| 5,647 | Itochu Corp. | 44,143 | ||||
| 105 | Jacobs Engineering Group, Inc. · | 3,826 | ||||
| 97 | Joy Global, Inc. | 4,846 | ||||
| 148 | Kone Oyj Class B | 5,889 | ||||
| 140 | Lockheed Martin Corp. | 10,460 | ||||
| 161 | Mitsui & Co., Ltd. | 1,880 | ||||
| 167 | Moog, Inc. Class A · | 5,382 | ||||
| 219 | Navistar International Corp. · | 10,751 | ||||
| 183 | Parker-Hannifin Corp. | 10,154 | ||||
| 297 | Pentair, Inc. | 9,567 | ||||
| 177 | Precision Castparts Corp. | 18,243 | ||||
| 2,003 | Raytheon Co. | 96,931 | ||||
| 60 | Regal-Beloit Corp. | 3,347 | ||||
| 84 | Rockwell Collins, Inc. | 4,436 | ||||
| 967 | Safran S.A. | 26,963 | ||||
| 109 | Schneider Electric S.A. | 10,964 | ||||
| 275 | Terex Corp. · | 5,154 | ||||
| 104 | W.W. Grainger, Inc. | 10,333 | ||||
| 1 | WESCO International, Inc. · | 49 | ||||
| 627,247 | ||||||
| Commercial & Professional Services - 0.2% | ||||||
| 651 | Capital Group plc | 7,170 | ||||
| 254 | Herman Miller, Inc. | 4,797 | ||||
| 66 | Manpower, Inc. | 2,845 | ||||
| 744 | Steelcase, Inc. | 5,769 | ||||
| 20,581 | ||||||
| Consumer Durables & Apparel - 1.8% | ||||||
| 908 | Brunswick Corp. | 11,292 | ||||
| 280 | CIE Financiere Richemont S.A. | 9,765 | ||||
| 233 | Coach, Inc. | 8,521 | ||||
| 3,549 | Eastman Kodak Co. · | 15,402 | ||||
| 226 | Hanesbrands, Inc. · | 5,438 | ||||
| 752 | Harman International Industries, Inc. · | 22,480 | ||||
| 516 | MRV Engenharia e Participacoes S.A. | 3,643 | ||||
| 138 | Nikon Corp. | 2,383 | ||||
| 49 | NVR, Inc. · | 32,079 | ||||
| 14,268 | Skyworth Digital Holdings Ltd. | 9,403 | ||||
| 581 | Stanley Black & Decker, Inc. | 29,337 | ||||
| 139 | Tempur-Pedic International, Inc. · | 4,262 | ||||
| 154,005 | ||||||
| Consumer Services - 0.9% | ||||||
| 365 | Apollo Group, Inc. Class A · | 15,512 | ||||
| 43 | Carnival Corp. | 1,295 | ||||
| 1,306 | Educomp Solutions Ltd. | 14,841 | ||||
| 62 | ITT Educational Services, Inc. · | 5,178 | ||||
| 688 | Las Vegas Sands Corp. · | 15,234 | ||||
| 82 | McDonald's Corp. | 5,416 | ||||
| 272 | MGM Resorts International · | 2,620 | ||||
| 34,635 | Rexlot Holdings Ltd. | 3,170 | ||||
| 301 | Starbucks Corp. | 7,312 | ||||
| 1,541 | Thomas Cook Group plc | 4,080 | ||||
| 74,658 | ||||||
| Diversified Financials - 4.2% | ||||||
| 997 | Ameriprise Financial, Inc. | 36,011 | ||||
| 3,508 | Bank of America Corp. | 50,410 | ||||
| 148 | Bank of New York Mellon Corp. | 3,664 | ||||
| 1,125 | Goldman Sachs Group, Inc. | 147,635 | ||||
| 278 | Invesco Ltd. | 4,674 | ||||
| 216 | JP Morgan Chase & Co. | 7,911 | ||||
| 135 | Morgan Stanley | 3,131 | ||||
| 452 | Oaktree Capital ■· | 15,481 | ||||
| 31 | Solar Capital Ltd. | 587 | ||||
| 75 | Solar Cayman Ltd. ⌂·† | 29 | ||||
| 392 | TD Ameritrade Holding Corp. · | 6,001 | ||||
| 4,267 | UBS AG | 56,526 | ||||
| 1,784 | UBS AG ADR | 23,584 | ||||
| 355,644 | ||||||
| Energy - 7.5% | ||||||
| 77 | Alpha Natural Resources, Inc. · | 2,595 | ||||
| 1,145 | Anadarko Petroleum Corp. | 41,335 | ||||
| 142 | Apache Corp. | 11,938 | ||||
| 1,223 | Baker Hughes, Inc. | 50,821 | ||||
| 2,218 | BG Group plc | 32,981 | ||||
| 1,780 | BP plc ADR | 51,401 | ||||
| 127 | Cabot Oil & Gas Corp. | 3,962 | ||||
The accompanying notes are an integral part of these financial statements.
| Shares or Principal Amount | Market Value ╪ | |||||
| COMMON STOCKS - 96.8% - (continued) | ||||||
| Energy - 7.5% - (continued) | ||||||
| 2,788 | Cameco Corp. | $ | 59,337 | |||
| 378 | Cameron International Corp. · | 12,299 | ||||
| 446 | Canadian Natural Resources Ltd. ADR | 14,807 | ||||
| 184 | Chesapeake Energy Corp. | 3,847 | ||||
| 211 | Chevron Corp. | 14,298 | ||||
| 1,224 | Cobalt International Energy · | 9,117 | ||||
| 1,604 | Consol Energy, Inc. | 54,164 | ||||
| 145 | EOG Resources, Inc. | 14,214 | ||||
| 1,868 | Essar Energy plc · | 13,264 | ||||
| 301 | Exxon Mobil Corp. | 17,157 | ||||
| 1,588 | Karoon Gas Australia Ltd. · | 7,876 | ||||
| 250 | Massey Energy Co. | 6,828 | ||||
| 1,062 | National Oilwell Varco, Inc. | 35,127 | ||||
| 195 | Noble Corp. | 6,040 | ||||
| 259 | Noble Energy, Inc. | 15,650 | ||||
| 64 | Occidental Petroleum Corp. | 4,911 | ||||
| 118 | Oceaneering International, Inc. · | 5,280 | ||||
| 163 | Overseas Shipholding Group, Inc. | 6,024 | ||||
| 61 | Peabody Energy Corp. | 2,387 | ||||
| 344 | Repsol YPF S.A. | 6,936 | ||||
| 326 | SBM Offshore N.V. | 4,667 | ||||
| 317 | Schlumberger Ltd. | 17,515 | ||||
| 24 | Smith International, Inc. | 902 | ||||
| 431 | Southwestern Energy Co. · | 16,654 | ||||
| 2,256 | Suncor Energy, Inc. | 66,415 | ||||
| 463 | Tsakos Energy Navigation Ltd. | 6,565 | ||||
| 513 | Valero Energy Corp. | 9,222 | ||||
| 805 | Weatherford International Ltd. · | 10,573 | ||||
| 95 | Whiting Petroleum Corp. · | 7,442 | ||||
| 644,551 | ||||||
| Food & Staples Retailing - 2.6% | ||||||
| 4,998 | CVS/Caremark Corp. | 146,553 | ||||
| 24,070 | Olam International Ltd. | 44,179 | ||||
| 185 | Sysco Corp. | 5,277 | ||||
| 511 | Wal-Mart Stores, Inc. | 24,555 | ||||
| 220,564 | ||||||
| Food, Beverage & Tobacco - 2.9% | ||||||
| 69 | Anheuser-Busch InBev N.V. | 3,319 | ||||
| 622 | Archer Daniels Midland Co. | 16,065 | ||||
| 173 | General Mills, Inc. | 6,130 | ||||
| 370 | Green Mountain Coffee Roasters · | 9,506 | ||||
| 225 | Groupe Danone | 12,081 | ||||
| 452 | Imperial Tobacco Group plc | 12,620 | ||||
| 2 | Japan Tobacco, Inc. | 5,404 | ||||
| 4,742 | Kraft Foods, Inc. | 132,770 | ||||
| 354 | Molson Coors Brewing Co. | 14,987 | ||||
| 659 | PepsiCo, Inc. | 40,160 | ||||
| 253,042 | ||||||
| Health Care Equipment & Services - 4.6% | ||||||
| 42 | Accretive Health, Inc. · | 554 | ||||
| 160 | Aetna, Inc. | 4,216 | ||||
| 82 | Bard (C.R.), Inc. | 6,381 | ||||
| 458 | Cardinal Health, Inc. | 15,410 | ||||
| 294 | CIGNA Corp. | 9,116 | ||||
| 1,444 | Covidien plc | 58,022 | ||||
| 85 | Edwards Lifesciences Corp. · | 4,765 | ||||
| 560 | Hologic, Inc. · | 7,803 | ||||
| 66 | Hospira, Inc. · | 3,794 | ||||
| 10 | Intuitive Surgical, Inc. · | 3,261 | ||||
| 122 | Laboratory Corp. of America Holdings · | 9,188 | ||||
| 506 | McKesson Corp. | 34,009 | ||||
| 2,161 | Medtronic, Inc. | 78,366 | ||||
| 197 | St. Jude Medical, Inc. · | 7,103 | ||||
| 54 | Stryker Corp. | 2,678 | ||||
| 89 | SXC Health Solutions Corp. · | 6,497 | ||||
| 4,999 | UnitedHealth Group, Inc. | 141,976 | ||||
| 96 | Wellpoint, Inc. · | 4,709 | ||||
| 397,848 | ||||||
| Household & Personal Products - 0.5% | ||||||
| 44 | Clorox Co. | 2,732 | ||||
| 130 | Energizer Holdings, Inc. · | 6,521 | ||||
| 568 | Procter & Gamble Co. | 34,059 | ||||
| 43,312 | ||||||
| Insurance - 5.7% | ||||||
| 3,714 | ACE Ltd. | 191,180 | ||||
| 621 | Assured Guaranty Ltd. | 8,246 | ||||
| 355 | Chubb Corp. | 17,761 | ||||
| 173 | Everest Re Group Ltd. | 12,220 | ||||
| 643 | Fidelity National Financial, Inc. | 8,354 | ||||
| 2,724 | Genworth Financial, Inc. · | 35,599 | ||||
| 458 | Lincoln National Corp. | 11,136 | ||||
| 2,889 | Marsh & McLennan Cos., Inc. | 65,146 | ||||
| 286 | MetLife, Inc. | 10,796 | ||||
| 276 | Ping An Insurance (Group) Co. ⌂† | 2,277 | ||||
| 273 | Platinum Underwriters Holdings Ltd. | 9,914 | ||||
| 669 | Principal Financial Group, Inc. | 15,674 | ||||
| 8,519 | Prudential plc | 64,258 | ||||
| 371 | Reinsurance Group of America, Inc. | 16,945 | ||||
| 99 | Tokio Marine Holdings, Inc. | 2,598 | ||||
| 855 | Unum Group | 18,545 | ||||
| 13 | White Mountains Insurance Group Ltd. | 4,118 | ||||
| 494,767 | ||||||
| Materials - 6.2% | ||||||
| 367 | A. Schulman, Inc. | 6,965 | ||||
| 593 | African Barrick Gold Ltd. · | 5,626 | ||||
| 1,377 | AngloGold Ltd. ADR | 59,467 | ||||
| 1,211 | Barrick Gold Corp. | 54,978 | ||||
| 54 | Cliff's Natural Resources, Inc. | 2,556 | ||||
| 479 | CRH plc | 9,873 | ||||
| 4,215 | Dow Chemical Co. | 99,973 | ||||
| 81 | Freeport-McMoRan Copper & Gold, Inc. | 4,802 | ||||
| 166 | Georgia Gulf Corp. · | 2,213 | ||||
| 570 | HeidelbergCement AG | 26,935 | ||||
| 14,761 | Huabao International Holdings Ltd. | 18,868 | ||||
| 221 | Impala Platinum Holdings Ltd. | 5,145 | ||||
| 32 | Martin Marietta Materials, Inc. | 2,692 | ||||
| 419 | Methanex Corp. | 8,257 | ||||
| 116 | Monsanto Co. | 5,362 | ||||
| 1,098 | Mosaic Co. | 42,800 | ||||
| 245 | Nucor Corp. | 9,396 | ||||
| 917 | Owens-Illinois, Inc. · | 24,262 | ||||
| 104 | Potash Corp. of Saskatchewan, Inc. ADR | 8,940 | ||||
| 3,315 | Rexam plc | 14,911 | ||||
| 287 | Rio Tinto plc | 12,592 | ||||
| 265 | Rio Tinto plc ADR | 11,554 | ||||
| 2,458 | Sino Forest Corp. Class A · | 34,937 | ||||
| 104 | Teck Cominco Ltd. Class B | 3,082 | ||||
| 532 | Titanium Metals Corp. · | 9,349 | ||||
The accompanying notes are an integral part of these financial statements.
| Hartford Capital Appreciation HLS Fund |
Schedule of Investments – (continued)
June 30, 2010 (Unaudited)
(000’s Omitted)
| Shares or Principal Amount | Market Value ╪ | |||||
| COMMON STOCKS - 96.8% - (continued) | ||||||
| Materials - 6.2% - (continued) | ||||||
| 938 | Vedanta Resources plc | $ | 29,482 | |||
| 275 | Vulcan Materials Co. | 12,049 | ||||
| 486 | Xstrata plc | 6,365 | ||||
| 533,431 | ||||||
| Media - 2.3% | ||||||
| 1,918 | CBS Corp. Class B | 24,800 | ||||
| 1,536 | Comcast Corp. Class A | 26,681 | ||||
| 407 | Comcast Corp. Special Class A | 6,685 | ||||
| 1,106 | DirecTV Class A · | 37,513 | ||||
| 189 | DreamWorks Animation SKG, Inc. · | 5,391 | ||||
| 184 | Focus Media Holding Ltd. ADR · | 2,856 | ||||
| 30 | Harvey. Weinstein Co Holdings Class A-1 ⌂·† | – | ||||
| 4,944 | News Corp. Class A | 59,125 | ||||
| 285 | Omnicom Group, Inc. | 9,785 | ||||
| 412 | Supermedia, Inc. · | 7,532 | ||||
| 377 | Virgin Media, Inc. | 6,294 | ||||
| 803 | WPP plc | 7,567 | ||||
| 194,229 | ||||||
| Pharmaceuticals, Biotechnology & Life Sciences - 10.2% | ||||||
| 574 | Alkermes, Inc. · | 7,142 | ||||
| 636 | Amgen, Inc. · | 33,464 | ||||
| 172 | Amylin Pharmaceuticals, Inc. · | 3,239 | ||||
| 571 | Arena Pharmaceuticals, Inc. · | 1,752 | ||||
| 219 | Auxilium Pharmaceuticals, Inc. · | 5,151 | ||||
| 893 | Bristol-Myers Squibb Co. | 22,283 | ||||
| 1,011 | Celgene Corp. · | 51,399 | ||||
| 3,524 | Daiichi Sankyo Co., Ltd. | 62,965 | ||||
| 3,735 | Elan Corp. plc ADR · | 16,806 | ||||
| 1,055 | Eli Lilly & Co. | 35,355 | ||||
| 478 | Gilead Sciences, Inc. · | 16,371 | ||||
| 321 | Johnson & Johnson | 18,941 | ||||
| 901 | King Pharmaceuticals, Inc. · | 6,841 | ||||
| 73 | Life Technologies Corp. · | 3,436 | ||||
| 196 | Map Pharmaceuticals, Inc. · | 2,571 | ||||
| 2,627 | Merck & Co., Inc. | 91,856 | ||||
| 225 | Mylan, Inc. · | 3,833 | ||||
| 6,266 | Novavax, Inc. · | 13,598 | ||||
| 11,300 | Pfizer, Inc. | 161,135 | ||||
| 326 | Pharmaceutical Product Development, Inc. | 8,292 | ||||
| 889 | Roche Holding AG | 122,418 | ||||
| 824 | Shionogi & Co., Ltd. | 17,079 | ||||
| 2,047 | Teva Pharmaceutical Industries Ltd. ADR | 106,429 | ||||
| 522 | Thermo Fisher Scientific, Inc. · | 25,614 | ||||
| 783 | UCB S.A. | 24,586 | ||||
| 138 | Waters Corp. · | 8,937 | ||||
| 120 | Watson Pharmaceuticals, Inc. · | 4,856 | ||||
| 876,349 | ||||||
| Real Estate - 0.2% | ||||||
| 1,929 | Hang Lung Properties Ltd. | 7,378 | ||||
| 348 | Iguatemi Emp de Shopping | 6,085 | ||||
| 540 | Sun Hung Kai Properties Ltd. | 7,385 | ||||
| 20,848 | ||||||
| Retailing - 4.8% | ||||||
| 153 | Advance Automotive Parts, Inc. | 7,693 | ||||
| 167 | Amazon.com, Inc. · | 18,193 | ||||
| 29,055 | Buck Holdings L.P. ⌂·† | 65,512 | ||||
| 159 | Children's Place Retail Stores, Inc. · | 7,017 | ||||
| 189 | Dick's Sporting Goods, Inc. · | 4,714 | ||||
| 322 | Expedia, Inc. | 6,044 | ||||
| 118 | Family Dollar Stores, Inc. | 4,447 | ||||
| 1,352 | Gap, Inc. | 26,302 | ||||
| 93 | Guess?, Inc. | 2,916 | ||||
| 1,295 | Lowe's Co., Inc. | 26,454 | ||||
| 466 | Nordstrom, Inc. | 15,007 | ||||
| 183 | Priceline.com, Inc. · | 32,356 | ||||
| 283 | Ross Stores, Inc. | 15,089 | ||||
| 1,267 | Staples, Inc. | 24,134 | ||||
| 1,310 | Target Corp. | 64,392 | ||||
| 189 | The Buckle, Inc. | 6,138 | ||||
| 1,723 | TJX Cos., Inc. | 72,273 | ||||
| 317 | Urban Outfitters, Inc. · | 10,887 | ||||
| 219 | Williams-Sonoma, Inc. | 5,423 | ||||
| 414,991 | ||||||
| Semiconductors & Semiconductor Equipment - 2.6% | ||||||
| 649 | Altera Corp. | 16,100 | ||||
| 772 | Analog Devices, Inc. | 21,517 | ||||
| 1,053 | ASML Holding N.V. ADR | 28,912 | ||||
| 224 | Atheros Communications, Inc. · | 6,159 | ||||
| 233 | Broadcom Corp. Class A | 7,672 | ||||
| 334 | Cypress Semiconductor Corp. · | 3,351 | ||||
| 792 | Intel Corp. | 15,405 | ||||
| 888 | Intersil Corp. | 10,759 | ||||
| 234 | Marvell Technology Group Ltd. · | 3,683 | ||||
| 293 | Maxim Integrated Products, Inc. | 4,904 | ||||
| 705 | Micron Technology, Inc. · | 5,990 | ||||
| 318 | NVIDIA Corp. · | 3,250 | ||||
| 336 | Skyworks Solutions, Inc. · | 5,634 | ||||
| 6,810 | Taiwan Semiconductor Manufacturing Co., Ltd. ADR | 66,461 | ||||
| 177 | Texas Instruments, Inc. | 4,112 | ||||
| 146 | Varian Semiconductor Equipment Associates, Inc. · | 4,182 | ||||
| 709 | Xilinx, Inc. | 17,909 | ||||
| 226,000 | ||||||
| Software & Services - 8.7% | ||||||
| 4,443 | Activision Blizzard, Inc. | 46,609 | ||||
| 347 | Adobe Systems, Inc. · | 9,171 | ||||
| 176 | Alliance Data Systems Corp. · | 10,499 | ||||
| 580 | Automatic Data Processing, Inc. | 23,350 | ||||
| 804 | BMC Software, Inc. · | 27,857 | ||||
| 176 | CACI International, Inc. Class A · | 7,472 | ||||
| 544 | Cadence Design Systems, Inc. · | 3,152 | ||||
| 256 | Check Point Software Technologies Ltd. ADR · | 7,557 | ||||
| 156 | Citrix Systems, Inc. · | 6,572 | ||||
| 98 | Cognizant Technology Solutions Corp. · | 4,881 | ||||
| 142 | Concur Technologies, Inc. · | 6,052 | ||||
| 6,995 | eBay, Inc. · | 137,164 | ||||
| 69 | Equinix, Inc. · | 5,563 | ||||
| 91 | Google, Inc. · | 40,541 | ||||
| 1,107 | IBM Corp. | 136,735 | ||||
| 81 | Longtop Financial Technologies Ltd. · | 2,612 | ||||
| 2,414 | Microsoft Corp. | 55,537 | ||||
| 753 | Monster Worldwide, Inc. · | 8,770 | ||||
| 6,756 | Oracle Corp. | 144,986 | ||||
| 169 | Paychex, Inc. | 4,387 | ||||
| 76 | Rovi Corp. · | 2,884 | ||||
The accompanying notes are an integral part of these financial statements.
| Shares or Principal Amount | Market Value ╪ | ||||||
| COMMON STOCKS - 96.8% - (continued) | |||||||
| Software & Services - 8.7% - (continued) | |||||||
| 421 | Tencent Holdings Ltd. | $ | 6,981 | ||||
| 24 | Visa, Inc. | 1,691 | |||||
| 93 | Vistaprint N.V. · | 4,412 | |||||
| 107 | VMware, Inc. · | 6,706 | |||||
| 2,478 | Western Union Co. | 36,952 | |||||
| 749,093 | |||||||
| Technology Hardware & Equipment - 7.6% | |||||||
| 473 | Apple, Inc. · | 118,883 | |||||
| 481 | Arrow Electronics, Inc. · | 10,739 | |||||
| 153 | Avnet, Inc. · | 3,696 | |||||
| 7,792 | Cisco Systems, Inc. · | 166,057 | |||||
| 2,534 | Corning, Inc. | 40,930 | |||||
| 1,356 | Dell, Inc. · | 16,348 | |||||
| 3,359 | EMC Corp. · | 61,476 | |||||
| 708 | Emulex Corp. · | 6,500 | |||||
| 1,804 | Flextronics International Ltd. · | 10,102 | |||||
| 219 | Hewlett-Packard Co. | 9,484 | |||||
| 3,083 | Hitachi Ltd. | 11,199 | |||||
| 23,961 | Hon Hai Precision Industry Co., Ltd. · | 83,986 | |||||
| 328 | Jabil Circuit, Inc. | 4,366 | |||||
| 427 | Juniper Networks, Inc. · | 9,742 | |||||
| 498 | NetApp, Inc. · | 18,590 | |||||
| 194 | Polycom, Inc. · | 5,782 | |||||
| 948 | QLogic Corp. · | 15,756 | |||||
| 721 | Qualcomm, Inc. | 23,689 | |||||
| 175 | Research In Motion Ltd. · | 8,607 | |||||
| 377 | Riverbed Technology, Inc. · | 10,408 | |||||
| 303 | SanDisk Corp. · | 12,730 | |||||
| 161 | Trimble Navigation Ltd. · | 4,505 | |||||
| 653,575 | |||||||
| Telecommunication Services - 0.7% | |||||||
| 121 | American Tower Corp. Class A · | 5,367 | |||||
| 432 | AT&T, Inc. | 10,443 | |||||
| 84 | Brasil Telecom S.A. ADR · | 1,692 | |||||
| 36 | Iridium Communications, Inc. · | 360 | |||||
| 1,277 | MTN Group Ltd. | 16,729 | |||||
| 1,568 | Vodafone Group plc ADR | 32,415 | |||||
| 67,006 | |||||||
| Transportation - 4.1% | |||||||
| 10,163 | AirAsia Berhad · | 3,903 | |||||
| 661 | All America Latina Logistica S.A. | 5,167 | |||||
| 827 | AMR Corp. · | 5,610 | |||||
| 2,130 | British Airways plc | 6,189 | |||||
| 227 | C.H. Robinson Worldwide, Inc. | 12,657 | |||||
| 513 | Continental Airlines, Inc. · | 11,295 | |||||
| 6,239 | Delta Air Lines, Inc. · | 73,305 | |||||
| 148 | Expeditors International of Washington, Inc.. | 5,124 | |||||
| 96 | FedEx Corp. | 6,699 | |||||
| 695 | JetBlue Airways Corp. · | 3,818 | |||||
| 132 | Kansas City Southern · | 4,780 | |||||
| 102 | Kuehne & Nagel International AG | 10,532 | |||||
| 486 | Localiza Rent a Car S.A. | 5,590 | |||||
| 15,270 | Nippon Yusen | 55,647 | |||||
| 513 | Southwest Airlines Co. | 5,700 | |||||
| 3,208 | UAL Corp. · | 65,961 | |||||
| 1,013 | United Parcel Service, Inc. Class B | 57,656 | |||||
| 477 | US Airways Group, Inc. · | 4,106 | |||||
| 343,739 | |||||||
| Utilities - 0.4% | |||||||
| 273 | Entergy Corp. | 19,523 | |||||
| 463 | N.V. Energy, Inc. | 5,466 | |||||
| 480 | Northeast Utilities | 12,223 | |||||
| 37,212 | |||||||
Total common stocks (cost $8,641,898) | $ | 8,342,617 | |||||
| PREFERRED STOCKS - 0.7% | |||||||
| Automobiles & Components - 0.7% | |||||||
| 710 | Volkswagen AG N.V. | $ | 62,307 | ||||
| 62,307 | |||||||
| Total preferred stocks | |||||||
| (cost $67,096) | $ | 62,307 | |||||
| WARRANTS - 0.0% | |||||||
| Banks - 0.0% | |||||||
| 59 | Washington Mutual, Inc Private Placement ⌂·† | $ | – | ||||
| Pharmaceuticals, Biotechnology & Life Sciences - 0.0% | |||||||
| 510 | Novavax, Inc. ⌂· | – | |||||
Total warrants (cost $–) | $ | – | |||||
| EXCHANGE TRADED FUNDS - 0.5% | |||||||
| Other Investment Pools and Funds - 0.5% | |||||||
| 316 | SPDR S&P MidCap 400 ETF Trust | $ | 40,815 | ||||
Total exchange traded funds (cost $36,415) | $ | 40,815 | |||||
| CORPORATE BONDS: NON-INVESTMENT GRADE - 0.3% | |||||||
| Finance and Insurance - 0.3% | |||||||
| MBIA Insurance Co. | |||||||
| $ | 53,500 | 14.00%, 01/15/2033 ■Δ | $ | 24,075 | |||
Total corporate bonds: non-investment grade (cost $53,136) | $ | 24,075 | |||||
Total long-term investments (cost $8,798,545) | $ | 8,469,814 | |||||
| SHORT-TERM INVESTMENTS - 1.1% | |||||||
| Repurchase Agreements - 1.1% | |||||||
| $ | 32,386 | Bank of America TriParty Joint Repurchase Agreement (maturing on 07/01/2010 in the amount of $32,386, collateralized by FHLMC 5.50%, 2039, FNMA 4.50% - 5.50%, 2038 - 2040, GNMA 5.00%, 2040, value of $33,034) 0.05%, 6/30/2010 | $ | 32,386 | |||
The accompanying notes are an integral part of these financial statements.
| Hartford Capital Appreciation HLS Fund |
Schedule of Investments – (continued)
June 30, 2010 (Unaudited)
(000’s Omitted)
| Shares or Principal Amount | Market Value ╪ | ||||||||||
| SHORT-TERM INVESTMENTS - 1.1% - (continued) | |||||||||||
| Repurchase Agreements - 1.1% - (continued) | |||||||||||
| $ | 5,549 | BNP Paribas Securities Corp. TriParty Joint Repurchase Agreement (maturing on 07/01/2010 in the amount of $5,549, collateralized by FNMA 4.50% - 6.50%, 2024 - 2040, GNMA 5.00% - 6.50%, 2038 - 2040, value of $5,661) 0.04%, 6/30/2010 | $ | 5,549 | |||||||
| 24,521 | Deutsche Bank Securities TriParty Joint Repurchase Agreement (maturing on 07/01/2010 in the amount of $24,521, collateralized by GNMA 3.13% - 7.00%, 2023 - 2052, value of $25,012) 0.05%, 6/30/2010 | 24,521 | |||||||||
| 5,550 | JP Morgan Chase TriParty Joint Repurchase Agreement (maturing on 07/01/2010 in the amount of $5,550, collateralized by FHLMC 2.38% - 5.83%, 2033 - 2038, value of $5,661) 0.06%, 6/30/2010 | 5,550 | |||||||||
| 24,181 | Morgan Stanley & Co., Inc. TriParty Joint Repurchase Agreement (maturing on 07/01/2010 in the amount of $24,181, collateralized by FHLMC 5.00% - 5.50%, 2038 - 2039, FNMA 5.00%, 2039, value of $24,762) 0.03%, 6/30/2010 | 24,181 | |||||||||
| 283 | UBS Securities, Inc. Repurchase Agreement (maturing on 07/01/2010 in the amount of $283, collateralized by U.S. Treasury Bill 0.88%, 2011, value of $290) 0.02%, 6/30/2010 | 283 | |||||||||
| 6,120 | UBS Securities, Inc. TriParty Joint Repurchase Agreement (maturing on 07/01/2010 in the amount of $6,120, collateralized by FNMA 5.00% - 6.00%, 2033 - 2036, value of $6,243) 0.09%, 6/30/2010 | 6,120 | |||||||||
| 98,590 | |||||||||||
Total short-term investments (cost $98,590) | $ | 98,590 | |||||||||
Total investments (cost $8,897,135) ▲ | 99.4 | % | $ | 8,568,404 | |||||||
| Other assets and liabilities | 0.6 | % | 51,629 | ||||||||
| Total net assets | 100.0 | % | $ | 8,620,033 | |||||||
| Note: | Percentage of investments as shown is the ratio of the total market value to total net assets. Market value of investments in foreign securities represents 24.5% of total net assets at June 30, 2010. |
Foreign securities that are principally traded on certain foreign markets are adjusted daily pursuant to a third party pricing service methodology approved by the Board of Directors in order to reflect an adjustment for factors occurring after the close of the foreign market but before the close of the New York Stock Exchange.
| ▲ | At June 30, 2010, the cost of securities for federal income tax purposes was $9,264,713 and the aggregate gross unrealized appreciation and depreciation based on that cost were: |
| Unrealized Appreciation | $ | 505,292 | ||
| Unrealized Depreciation | (1,201,601 | ) | ||
| Net Unrealized Depreciation | $ | (696,309 | ) |
| † | The aggregate value of securities valued in good faith at fair value as determined under policies and procedures established by and under the supervision of the Fund's Board of Directors at June 30, 2010, was $67,818, which represents 0.79% of total net assets. This amount excludes securities that are principally traded in certain foreign markets and whose prices are adjusted pursuant to a third party pricing service methodology approved by the Board of Directors. |
· | Currently non-income producing. |
| Δ | Variable rate securities; the rate reported is the coupon rate in effect at June 30, 2010. |
| ■ | Securities issued within terms of a private placement memorandum, exempt from registration under Rule 144A under the Securities Act of 1933, as amended, and may be sold only to qualified institutional buyers. Pursuant to guidelines adopted by the Board of Directors, these issues are determined to be liquid. The aggregate value of these securities at June 30, 2010, was $41,009, which represents 0.48% of total net assets. |
| ⌂ | The following securities are considered illiquid. Illiquid securities are often purchased in private placement transactions, are often not registered under the Securities Act of 1933 and may have contractual restrictions on resale. A security may also be considered illiquid if the security lacks a readily available market or if its valuation has not changed for a certain period of time. |
| Period | Shares/ | ||||||||
| Acquired | Par | Security | Cost Basis | ||||||
| 06/2007 | 29,055 | Buck Holdings L.P. | $ | 24,841 | |||||
| 10/2005 | 30 | Harvey Weinstein Co. Holdings | |||||||
Class A-1 - Reg D | 27,951 | ||||||||
| 07/2008 | 510 | Novavax, Inc. Warrants | – | ||||||
| 05/2010 | 276 | Ping An Insurance (Group) Co. | 2,153 | ||||||
| 03/2007 | 75 | Solar Cayman Ltd. - 144A | 55 | ||||||
| 04/2008 | 59 | Washington Mutual, Inc. Private | |||||||
Placement Warrants | – | ||||||||
The aggregate value of these securities at June 30, 2010 was $67,818 which represents 0.79% of total net assets.
The accompanying notes are an integral part of these financial statements.
| Forward Foreign Currency Contracts Outstanding at June 30, 2010 |
| Description | Market Value ╪ | Contract Amount | Delivery Date | Unrealized Appreciation/ (Depreciation) | |||||||||
| British Pound (Sell) | $ | 467 | $ | 472 | 07/01/10 | $ | 5 | ||||||
| British Pound (Sell) | 4,249 | 4,291 | 07/02/10 | 42 | |||||||||
| British Pound (Sell) | 1,306 | 1,307 | 07/06/10 | 1 | |||||||||
| Euro (Sell) | 787 | 788 | 07/02/10 | 1 | |||||||||
| Euro (Sell) | 2,196 | 2,224 | 07/13/10 | 28 | |||||||||
| Euro (Sell) | 385,839 | 420,156 | 12/15/10 | 34,317 | |||||||||
| Japanese Yen (Sell) | 1,561 | 1,545 | 07/01/10 | (16 | ) | ||||||||
| Japanese Yen (Sell) | 2,168 | 2,036 | 07/13/10 | (132 | ) | ||||||||
| Japanese Yen (Sell) | 9,994 | 9,704 | 09/15/10 | (290 | ) | ||||||||
| Japanese Yen (Sell) | 255,886 | 246,294 | 12/15/10 | (9,592 | ) | ||||||||
| Japanese Yen (Buy) | 310 | 309 | 07/02/10 | 1 | |||||||||
| Japanese Yen (Buy) | 215 | 204 | 07/13/10 | 11 | |||||||||
| South African Rand (Sell) | 14,319 | 14,497 | 07/01/10 | 178 | |||||||||
| Swiss Franc (Buy) | 18 | 18 | 07/02/10 | – | |||||||||
| $ | 24,554 | ||||||||||||
| ╪ | See Significant Accounting Policies of accompanying Notes to Financial Statements regarding valuation of securities. |
The accompanying notes are an integral part of these financial statements.
| Hartford Capital Appreciation HLS Fund |
June 30, 2010 (Unaudited)
(000’s Omitted)
| Total | Level 1 ♦ | Level 2♦ | Level 3 | |||||||||||||
| Assets: | ||||||||||||||||
| Common Stocks | ||||||||||||||||
| Automobiles & Components | $ | 425,140 | $ | 376,598 | $ | 48,542 | $ | – | ||||||||
| Banks | 514,785 | 233,713 | 281,072 | – | ||||||||||||
| Capital Goods | 627,247 | 524,925 | 102,322 | – | ||||||||||||
| Commercial & Professional Services | 20,581 | 13,411 | 7,170 | – | ||||||||||||
| Consumer Durables & Apparel | 154,005 | 132,454 | 21,551 | – | ||||||||||||
| Consumer Services | 74,658 | 52,567 | 22,091 | – | ||||||||||||
| Diversified Financials | 355,644 | 283,608 | 56,526 | 15,510 | ||||||||||||
| Energy | 644,551 | 592,091 | 52,460 | – | ||||||||||||
| Food & Staples Retailing | 220,564 | 176,385 | 44,179 | – | ||||||||||||
| Food, Beverage & Tobacco | 253,042 | 222,937 | 30,105 | – | ||||||||||||
| Health Care Equipment & Services | 397,848 | 397,848 | – | – | ||||||||||||
| Household & Personal Products | 43,312 | 43,312 | – | – | ||||||||||||
| Insurance | 494,767 | 425,634 | 66,856 | 2,277 | ||||||||||||
| Materials | 533,431 | 409,260 | 124,171 | – | ||||||||||||
| Media | 194,229 | 186,662 | 7,567 | – | ||||||||||||
| Pharmaceuticals, Biotechnology & Life Sciences | 876,349 | 649,301 | 227,048 | – | ||||||||||||
| Real Estate | 20,848 | 6,085 | 14,763 | – | ||||||||||||
| Retailing | 414,991 | 349,479 | – | 65,512 | ||||||||||||
| Semiconductors & Semiconductor Equipment | 226,000 | 226,000 | – | – | ||||||||||||
| Software & Services | 749,093 | 742,112 | 6,981 | – | ||||||||||||
| Technology Hardware & Equipment | 653,575 | 558,390 | 95,185 | – | ||||||||||||
| Telecommunication Services | 67,006 | 50,277 | 16,729 | – | ||||||||||||
| Transportation | 343,739 | 267,468 | 76,271 | – | ||||||||||||
| Utilities | 37,212 | 37,212 | – | – | ||||||||||||
| Total | 8,342,617 | 6,957,729 | 1,301,589 | 83,299 | ||||||||||||
| Corporate Bonds: Non-Investment Grade | 24,075 | – | 24,075 | – | ||||||||||||
| Exchange Traded Funds | 40,815 | 40,815 | – | – | ||||||||||||
| Preferred Stocks | 62,307 | – | 62,307 | – | ||||||||||||
| Warrants | – | – | – | – | ||||||||||||
| Short-Term Investments | 98,590 | – | 98,590 | – | ||||||||||||
| Total | $ | 8,568,404 | $ | 6,998,544 | $ | 1,486,561 | $ | 83,299 | ||||||||
| Forward Foreign Currency Contracts* | 34,584 | – | 34,584 | – | ||||||||||||
| Total | $ | 34,584 | $ | – | $ | 34,584 | $ | – | ||||||||
| Liabilities: | ||||||||||||||||
| Forward Foreign Currency Contracts* | 10,030 | – | 10,030 | – | ||||||||||||
| Total | $ | 10,030 | $ | – | $ | 10,030 | $ | – | ||||||||
| ♦ | For the period ended June 30, 2010, there were no significant transfers between Level 1 and Level 2. |
| * | Derivative instruments not reflected in the Schedule of Investments are valued at the unrealized appreciation/depreciation on the investments. |
Following is a reconciliation of Level 3 assets for which significant unobservable inputs were used to determine fair value:
Balance as of December 31, 2009 | Realized Gain (Loss) | Change in Unrealized Appreciation (Depreciation) | Net Amortization | Purchases | Sales | Transfers Into Level 3 | Transfers Out of Level 3 | Balance as of June 30, 2010 | ||||||||||||||||||||||||||||
| Assets: | ||||||||||||||||||||||||||||||||||||
| Common Stock | $ | 75,356 | $ | 2,514 | $ | 11,832 | * | $ | — | $ | 2,153 | $ | (8,556 | ) | $ | — | $ | — | $ | 83,299 | ||||||||||||||||
| Warrants | — | — | — | — | — | — | — | — | — | |||||||||||||||||||||||||||
| Total | $ | 75,356 | $ | 2,514 | $ | 11,832 | $ | — | $ | 2,153 | $ | (8,556 | ) | $ | — | $ | — | $ | 83,299 | |||||||||||||||||
| * | Change in unrealized gains or losses in the current period relating to assets still held at June 30, 2010 was $7,793. |
The accompanying notes are an integral part of these financial statements.
| Hartford Capital Appreciation HLS Fund |
June 30, 2010 (Unaudited)
(000’s Omitted)
| Assets: | ||||
| Investments in securities, at market value (cost $8,897,135) | $ | 8,568,404 | ||
| Cash | 1 | |||
| Foreign currency on deposit with custodian (cost $102) | 121 | |||
| Unrealized appreciation on forward foreign currency contracts | 34,584 | |||
| Receivables: | ||||
| Investment securities sold | 63,794 | |||
| Fund shares sold | 864 | |||
| Dividends and interest | 13,181 | |||
| Other assets | 20 | |||
| Total assets | 8,680,969 | |||
| Liabilities: | ||||
| Unrealized depreciation on forward foreign currency contracts | 10,030 | |||
| Payables: | ||||
| Investment securities purchased | 35,448 | |||
| Fund shares redeemed | 13,558 | |||
| Investment management fees | 1,258 | |||
| Distribution fees | 76 | |||
| Accrued expenses | 566 | |||
| Total liabilities | 60,936 | |||
| Net assets | $ | 8,620,033 | ||
| Summary of Net Assets: | ||||
| Capital stock and paid-in-capital | $ | 11,251,849 | ||
| Accumulated undistributed net investment income | 43,182 | |||
| Accumulated net realized loss on investments and foreign currency transactions | (2,370,677 | ) | ||
| Unrealized depreciation of investments and the translations of assets and liabilities denominated in foreign currency | (304,321 | ) | ||
| Net assets | $ | 8,620,033 | ||
| Shares authorized | 5,000,000 | |||
| Par value | $ | 0.001 | ||
Class IA: Net asset value per share | $ | 33.36 | ||
| Shares outstanding | 218,666 | |||
| Net assets | $ | 7,295,207 | ||
Class IB: Net asset value per share | $ | 33.04 | ||
| Shares outstanding | 40,094 | |||
| Net assets | $ | 1,324,826 | ||
The accompanying notes are an integral part of these financial statements.
| Hartford Capital Appreciation HLS Fund |
For the Six-Month Period Ended June 30, 2010 (Unaudited)
(000’s Omitted)
| Investment Income: | ||||
| Dividends | $ | 71,168 | ||
| Interest | 3,615 | |||
| Less: Foreign tax withheld | (2,633 | ) | ||
| Total investment income, net | 72,150 | |||
| Expenses: | ||||
| Investment management fees | 27,828 | |||
| Administrative service fees | 3,194 | |||
| Transfer agent fees | 3 | |||
| Distribution fees - Class IB | 1,919 | |||
| Custodian fees | 108 | |||
| Accounting services fees | 833 | |||
| Board of Directors' fees | 99 | |||
| Audit fees | 78 | |||
| Other expenses | 897 | |||
| Total expenses (before fees paid indirectly) | 34,959 | |||
| Commission recapture | (147 | ) | ||
| Total fees paid indirectly | (147 | ) | ||
| Total expenses, net | 34,812 | |||
| Net investment income | 37,338 | |||
| Net Realized Gain on Investments and Foreign Currency Transactions: | ||||
| Net realized gain on investments | 497,756 | |||
| Net realized gain on forward foreign currency contracts | 3,351 | |||
| Net realized loss on other foreign currency transactions | (2,049 | ) | ||
| Net Realized Gain on Investments and Foreign Currency Transactions | 499,058 | |||
| Net Changes in Unrealized Depreciation of Investments and Foreign Currency Transactions: | ||||
| Net unrealized depreciation of investments | (1,405,309 | ) | ||
| Net unrealized appreciation of forward foreign currency contracts | 22,238 | |||
| Net unrealized depreciation on translation of other assets and liabilities in foreign currencies | (289 | ) | ||
| Net Changes in Unrealized Depreciation of Investments and Foreign Currency Transactions | (1,383,360 | ) | ||
| Net Loss on Investments and Foreign Currency Transactions | (884,302 | ) | ||
| Net Decrease in Net Assets Resulting from Operations | $ | (846,964 | ) | |
The accompanying notes are an integral part of these financial statements.
| Hartford Capital Appreciation HLS Fund |
(000’s Omitted)
For the Six-Month Period Ended June 30, 2010 (Unaudited) | For the Year Ended December 31, 2009 | |||||||
| Operations: | ||||||||
| Net investment income | $ | 37,338 | $ | 81,830 | ||||
| Net realized gain (loss) on investments, other financial instruments and foreign currency transactions | 499,058 | (785,331 | ) | |||||
Net unrealized appreciation (depreciation) of investments, other financial instruments and foreign currency transactions | (1,383,360 | ) | 3,881,583 | |||||
| Payment from affiliate | — | 273 | ||||||
| Net increase (decrease) in net assets resulting from operations | (846,964 | ) | 3,178,355 | |||||
| Distributions to Shareholders: | ||||||||
| From net investment income | ||||||||
| Class IA | — | (65,595 | ) | |||||
| Class IB | — | (9,405 | ) | |||||
| From net realized gain on investments | ||||||||
| Class IA | — | — | ||||||
| Class IB | — | — | ||||||
| Total distributions | — | (75,000 | ) | |||||
| Capital Share Transactions: | ||||||||
| Class IA | ||||||||
| Sold | 308,009 | 795,821 | ||||||
| Issued on reinvestment of distributions | — | 65,595 | ||||||
| Redeemed | (707,279 | ) | (1,052,608 | ) | ||||
| Total capital share transactions | (399,270 | ) | (191,192 | ) | ||||
| Class IB | ||||||||
| Sold | 68,437 | 116,122 | ||||||
| Issued on reinvestment of distributions | — | 9,405 | ||||||
| Redeemed | (208,296 | ) | (344,613 | ) | ||||
| Total capital share transactions | (139,859 | ) | (219,086 | ) | ||||
| Net decrease from capital share transactions | (539,129 | ) | (410,278 | ) | ||||
| Net increase (decrease) in net assets | (1,386,093 | ) | 2,693,077 | |||||
| Net Assets: | ||||||||
| Beginning of period | 10,006,126 | 7,313,049 | ||||||
| End of period | $ | 8,620,033 | $ | 10,006,126 | ||||
Accumulated undistributed (distribution in excess of) net investment income | $ | 43,182 | $ | 5,844 | ||||
| Shares: | ||||||||
| Class IA | ||||||||
| Sold | 8,303 | 27,376 | ||||||
| Issued on reinvestment of distributions | — | 1,786 | ||||||
| Redeemed | (19,265 | ) | (37,023 | ) | ||||
| Total share activity | (10,962 | ) | (7,861 | ) | ||||
| Class IB | ||||||||
| Sold | 1,856 | 3,965 | ||||||
| Issued on reinvestment of distributions | — | 257 | ||||||
| Redeemed | (5,703 | ) | (11,789 | ) | ||||
| Total share activity | (3,847 | ) | (7,567 | ) | ||||
The accompanying notes are an integral part of these financial statements.
| Hartford Capital Appreciation HLS Fund |
June 30, 2010 (Unaudited)
(000’s Omitted)
| 1. | Organization: |
Hartford Capital Appreciation HLS Fund (the "Fund") serves as an underlying investment option for certain variable annuity and variable life insurance separate accounts of Hartford Life Insurance Company (“HLIC”) and its affiliates and certain qualified retirement plans. The Fund may also serve as an underlying investment option for certain variable annuity and variable life separate accounts of other insurance companies. Owners of variable annuity contracts and policyholders of variable life insurance contracts may choose the funds permitted in the variable insurance contract prospectus. In addition, participants in certain qualified retirement plans may choose the fund if permitted by their plans.
Hartford Series Fund, Inc. (the “Company”) is an open-end registered management investment company comprised of twenty-nine portfolios, one portfolio of which is included in these financial statements.
The Company is organized under the laws of the State of Maryland and is registered with the Securities and Exchange Commission (“SEC”) under the Investment Company Act of 1940, as amended (“1940 Act”). The Fund is organized as a diversified open-end management investment company.
The Fund is divided into Class IA and Class IB shares. Each class is offered at the per share net asset value (“NAV”) without a sales charge and is subject to the same expenses, except that the Class IB shares are subject to distribution and service fees charged pursuant to a Distribution and Service Plan adopted in accordance with Rule 12b-1 under the 1940 Act.
| 2. | Significant Accounting Policies: |
The following is a summary of significant accounting policies of the Fund, which are in accordance with U.S. Generally Accepted Accounting Principles (“GAAP”).
| a) | Security Transactions and Investment Income – Security transactions are recorded on the trade date (the date the order to buy or sell is executed). Security gains and losses are determined on the basis of identified cost. |
Dividend income is accrued as of the ex-dividend date, except that certain dividends for foreign securities where the ex-dividend date may have passed are recorded as soon as the Fund is informed of the dividend in the exercise of reasonable diligence. Interest income, including amortization of premium and accretion of discounts, is accrued on a daily basis.
| b) | Security Valuation – The Fund generally uses market prices in valuing portfolio securities. If market prices are not readily available or are deemed unreliable, the Fund will use the fair value of the security as determined in good faith under policies and procedures established by and under the supervision of the Fund’s Board of Directors. Market prices may be deemed unreliable, for example, if a security is thinly traded or if an event has occurred after the close of the security’s primary market, but before the close of the New York Stock Exchange (the “Exchange”) (generally 4:00 p.m. Eastern Time, referred to as the “Valuation Time”) that is expected to affect the value of the portfolio security. The circumstances in which the Fund may use fair value pricing include, among others: (i) the occurrence of events that are significant to a particular issuer, such as mergers, restructuring or defaults; (ii) the occurrence of events that are significant to an entire market, such as natural disasters in a particular region or governmental actions; (iii) trading restrictions on securities; (iv) thinly traded securities and (v) market events such as trading halts and early market closings. In addition, with respect to the valuation of stocks primarily traded on foreign markets, the Fund uses a fair value pricing service approved by the Fund’s Board of Directors, which employs quantitative models that evaluate changes in the value of foreign market proxies (e.g., futures contracts, American Depositary Receipts (“ADRs”), exchange traded funds (“ETFs”)) after the close of the foreign markets but before the Valuation Time. Securities that are primarily traded on foreign markets may trade on days that are not business days of the Fund. The value of the foreign securities in which the Fund invests may change on days when a shareholder will not be able to purchase or redeem shares of the Fund. Fair value pricing is subjective in nature and the use of fair value pricing by the Fund may cause the NAV of its shares to differ significantly from the NAV that would have been calculated using market prices at the close of the exchange on which a portfolio security is primarily traded but before the Valuation Time. There can be no |
assurance that the Fund could obtain the fair value assigned to a security if the Fund were to sell the security at approximately the time at which the Fund determines its NAV.
Exchange-traded equity securities are valued at the last reported sale price or official close price on the exchange or market on which the security is primarily traded (the “Primary Market”) at the Valuation Time. If the security did not trade on the Primary Market, it may be valued at the Valuation Time at the last reported sale price on another exchange where it trades. The value of an equity security not traded on any exchange but traded on the Nasdaq Stock Market, Inc. or another over-the-counter market shall be valued at the last reported sale price or official closing price on the exchange or market on which the security is traded as of the Valuation Time.
Debt securities (other than short-term obligations) held by the Fund are valued using bid prices or using valuations based on a matrix system (which considers factors such as security prices, yield, maturity and ratings) as provided by independent pricing services. Securities for which prices are not available from an independent pricing service may be valued using market quotations obtained from one or more dealers that make markets in the securities in accordance with procedures established by the Fund’s Board of Directors. Generally, the Fund may use fair valuation in regard to debt securities when the Fund holds defaulted or distressed securities or securities in a company in which a reorganization is pending. Short-term investments with a maturity of more than 60 days when purchased are valued based on market quotations until the remaining days to maturity become less than 61 days. Investments that mature in 60 days or less are generally valued at amortized cost, which approximates market value.
Foreign-denominated assets, including investment securities, and liabilities are translated from the local currency into U.S. dollars using exchange rates obtained from an independent third party as of the Fund’s Valuation Time.
Financial instruments for which prices are not available from an independent pricing service may be valued using market quotations obtained from one or more dealers that make markets in securities in accordance with procedures established by the Fund’s Board of Directors.
Forward foreign currency contracts represent agreements to exchange currencies on specific future dates at predetermined rates. Forward foreign currency contracts are valued using foreign currency exchange rates and forward rates on the Valuation Date from an independent pricing service.
Other derivative or contractual type instruments shall be valued using market prices if such instruments trade on an exchange or market. If such instruments do not trade on an exchange or market, such instruments shall be valued at a price at which the counterparty to such contract would repurchase the instrument. In the event that the counterparty cannot provide a price, such valuation may be determined in accordance with procedures established by the Fund’s Board of Directors.
Various inputs are used in determining the value of the Fund’s investments. These inputs are summarized into three broad hierarchy levels. This hierarchy is based on whether the valuation inputs are observable or unobservable. These levels are:
· | Level 1 – Quoted prices in active markets for identical securities. Level 1 may include exchange-traded instruments such as domestic equities, some foreign equities, options, futures, mutual funds, ETFs, and rights and warrants. |
· | Level 2 – Observable inputs other than Level 1 prices, such as quoted prices for similar securities; quoted prices in markets that are not active; or other inputs that are observable or can be corroborated by observable market data. Level 2 may include debt securities that are traded less frequently than exchange-traded instruments and which are valued using third party pricing services. Prices for most level 2 securities are based on prices |
| Hartford Capital Appreciation HLS Fund |
Notes to Financial Statements – (continued)
June 30, 2010 (Unaudited)
(000’s Omitted)
received from an independent pricing service. The following asset classes generally use valuation techniques and inputs as noted below:
Asset Backed Securities and Collateralized Mortgage Obligations – Multi-dimensional spread/prepayment speed tables, with consideration of yield or price of bonds of comparable quality, coupon and maturity, attributes of the collateral, new issue data and monthly payment information.
Corporate Bonds – Multi-dimensional relational model based on observable market information such as yields, spreads, sector analysis, etc.
Foreign Currency – Based on rates determined at the close of the Exchange, provided by an independent pricing service.
Forward Currency Contracts – Valued based on the price of the underlying currency at the prevailing interpolated exchange rate, which is a combination of the spot currency rate and the forward currency rate, provided by an independent pricing service.
Foreign Equities – Certain foreign equities are priced using a multi-factor regression model with market observable inputs of a correlative nature (ADRs, futures contracts, ETFs, and currency exchange rates).
International Fixed Income – Multi-dimensional relational model based on observable market information such as benchmark yields, reported trades, bids and offers.
Money Market Instruments – Amortized cost.
Mortgage Backed Securities (“MBS”) – Matrix pricing using inputs of To-Be-Announced (“TBA”) prices, new issue data and monthly payment information, with consideration of yield or price of bonds of comparable quality, coupon and maturity, and attributes of the collateral.
Municipal Bonds – Multi-dimensional relational model and series of matrices based on observable market information such as Municipal Securities Rulemaking Board reported trades, comparable bonds, yields, spreads and credit analysis.
Preferred Stocks – Close mean of bid/ask or bid.
Repurchase Agreements – Priced at par.
Senior Floating Rate Interests – Composite of quotes from one or more contributing dealers.
Swaps – Price based upon observable market information from an independent pricing service.
U.S. Government Securities – Treasuries exclusively traded in the secondary market.
| · | Level 3 – Significant unobservable inputs that are supported by limited or no market activity. Level 3 may include financial instruments whose values are determined using broker quotes or require significant management judgment or estimation. While these securities are priced using unobservable inputs, the valuation of these securities reflects the best available data and management believes the prices are a reasonable representation of exit price. The following asset classes generally use valuation techniques and inputs as noted below: |
Asset Backed Securities & Commercial Mortgage Backed Securities – Certain other MBS with limited liquidity priced from an independent pricing service.
Common Stocks – Trading has been halted or there are restrictions on trading. Valuation is based on last trade with the application of a discount or premium, if applicable.
Long Dated Over-the-Counter Options – Terms greater than 10 years from current date, expected volatility is not observable. Prices are from an independent pricing service.
Long Term Debt Securities, including Senior Floating Rate Interests – Unobservable valuation inputs may include estimates for current yields, maturity/duration, prepayment speed, and broker quotes for comparable securities along with other assumptions relating to credit quality, collateral value, complexity of the security structure, general market conditions and liquidity.
Swaps – Terms greater than 10 years from current date, expected volatility is not observable. Prices are from an independent pricing service.
Individual securities within any of the above mentioned asset classes may be assigned a different hierarchical level than those that are presented above, as individual circumstances dictate.
For purposes of reporting transfers between different hierarchy levels, both transfers in and out of each level are shown as if they occurred at the beginning of the period.
Refer to the Investment Valuation Hierarchy Levels Summary and the Level 3 roll forward reconciliation found following the Schedules of Investments.
| c) | Foreign Currency Transactions – Assets and liabilities denominated in currencies other than U.S. dollars are translated into U.S. dollars at the exchange rates in effect on the valuation date. Purchases and sales of investment securities, income and expenses are translated into U.S. dollars at the exchange rates on the dates of such transactions. |
The Fund does not isolate that portion of portfolio security valuation resulting from fluctuations in the foreign currency exchange rates from the fluctuations arising from changes in the market prices of securities held. Exchange rate fluctuations are included with the net realized and unrealized gain or loss on investments in the accompanying financial statements.
Net realized foreign exchange gains or losses arise from sales of foreign currencies and the difference between asset and liability amounts initially stated in foreign currencies and the U.S. dollar value of the amounts actually received or paid. Net unrealized foreign exchange gains or losses arise from changes in the value of other assets and liabilities at the end of the reporting period, resulting from changes in the exchange rates.
| d) | Joint Trading Account – Pursuant to an exemptive order issued by the SEC, the Fund may transfer uninvested cash balances into a joint trading account managed by Wellington Management Company, LLP (“Wellington Management”). These balances may be invested in one or more repurchase agreements and/or short-term money market instruments. |
| e) | Repurchase Agreements – A repurchase agreement is an agreement by which a counterparty agrees to sell a security and agrees to repurchase the security sold at a mutually agreed upon time and price. At the time the Fund enters into a repurchase agreement, the value of the underlying collateral security(ies), including accrued interest, will be equal to or exceed the value of the repurchase agreement. To minimize counterparty risk, the securities that serve to collateralize the repurchase agreement are held by the Fund's custodian in book entry or physical form in the custodial account of the Fund or in a third party custodial account. Repurchase agreements are valued at cost plus accrued interest. The Fund, as shown on the Schedule of Investments, had outstanding repurchase agreements as of June 30, 2010. |
| Hartford Capital Appreciation HLS Fund |
| Notes to Financial Statements – (continued) |
| June 30, 2010 (Unaudited) |
| (000’s Omitted) |
| f) | Forward Foreign Currency Contracts – The Fund may enter into forward foreign currency contracts that obligate the Fund to purchase or sell currencies at specified future dates. Forward foreign currency contracts may be used to hedge against adverse fluctuations in exchange rates between currencies. |
Forward foreign currency contracts involve elements of market risk in excess of the amounts reflected in the Statement of Assets and Liabilities. In addition, risks may arise upon entering into these contracts from the potential inability of the counterparties to meet the terms of the contracts and from unanticipated movements in the value of the foreign currencies relative to the U.S. dollar. The Fund had outstanding forward foreign currency contracts as shown on the Schedule of Investments as of June 30, 2010.
| g) | Indexed Securities – The Fund may invest in indexed securities whose values are linked to changes in interest rates, indices, or other underlying instruments. The Fund may use these securities to increase or decrease its exposure to different underlying instruments and to gain exposure to markets that might be difficult to invest in using conventional securities. Indexed securities may be more volatile than their underlying instruments, but any loss is limited to the amount of the original investment and there may be a limit to the potential appreciation of the investment. The Fund, as shown in the Schedule of Investments under Exchange Traded Funds, had investments in indexed securities as of June 30, 2010. |
| h) | Fund Share Valuation and Dividend Distributions to Shareholders – Orders for the Fund’s shares are executed in accordance with the investment instructions of the contract holders or plan participants. The NAV of the Fund’s shares is determined as of the close of each business day of the Exchange. The NAV is determined separately for each class of the Fund by dividing the Fund’s net assets attributable to that class by the number of outstanding shares of the class. Orders for the purchase of the Fund’s shares received by an insurance company or plan prior to the close of the Exchange on any day on which the Exchange is open for business are priced at the NAV determined as of the close of the Exchange. Orders received by an insurance company or plan after the close of the Exchange, or on a day on which the Exchange and/or the Fund is not open for business, are priced at the next determined NAV. |
Dividends are declared pursuant to a policy adopted by the Fund’s Board of Directors based upon the investment performance of the Fund. The policy of the Fund is to pay dividends from net investment income and distribute realized capital gains, if any, at least once a year.
Distributions from net investment income, realized capital gains and capital are determined in accordance with federal income tax regulations, which may differ from U.S. GAAP with respect to character and timing. These differences may include but are not limited to losses deferred due to wash sale adjustments, foreign currency gains and losses, adjustments related to Passive Foreign Investment Companies (“PFICs”), Real Estate Investment Trusts (“REITs”), Regulated Investment Companies (“RICs”), certain derivatives and partnerships. Permanent book and federal income tax basis differences relating to shareholder distributions will result in reclassifications to certain of the Fund’s capital accounts (see Federal Income Taxes: Reclassification of Capital Accounts note).
| i) | Illiquid and Restricted Securities – The Fund is permitted to invest up to 15% of its net assets in illiquid securities. “Illiquid Securities” are those that may not be sold or disposed of in the ordinary course of business within seven days, at approximately the price used to determine the Fund’s NAV. The Fund may not be able to sell illiquid securities or other investments when its sub-adviser considers it desirable to do so or may have to sell such securities or investments at a price that is lower than the price that could be obtained if the securities or investments were more liquid. A sale of illiquid securities or other investments may require more time and may result in higher dealer discounts and other selling expenses than does the sale of those that are liquid. Illiquid securities and investments also may be more difficult to value, due to the unavailability of reliable market quotations for such securities or investments, and an investment in them may have an adverse impact on the Fund’s NAV. The Fund may also purchase certain restricted securities, commonly known as Rule 144A securities, that can be resold to institutions and which may be determined to be liquid pursuant to policies and guidelines established by the Fund’s Board of Directors. The Fund, as shown on the Schedule of Investments, had illiquid and/or restricted securities as of June 30, 2010. |
| j) | Securities Purchased on a When-Issued or Delayed-Delivery Basis – Delivery and payment for securities that have been purchased by the Fund on a forward commitment, or when-issued or delayed-delivery basis, take place beyond the customary settlement period. During this period, such securities are subject to market fluctuations, and the Fund identifies securities segregated in its records with value at least equal to the amount of the commitment. As of June 30, 2010, the Fund had no outstanding when-issued or delayed delivery securities. |
| k) | Credit Risk – Credit risk depends largely on the perceived financial health of bond issuers. In general, the credit rating is inversely related to the credit risk of the issuer. Higher rated bonds generally are deemed to have less credit risk, while lower or unrated bonds are deemed to have higher risk of default. The share price, yield and total return of a Fund which holds securities with higher credit risk may be more volatile than funds holding bonds with lower credit risk. |
| l) | Prepayment/Interest Rate Risks – Certain debt securities allow for prepayment of principal without penalty. Securities subject to prepayment risk generally offer less potential for gains when interest rates decline. In addition, with respect to securities, rising interest rates may cause prepayments to occur at a slower than expected rate, thereby effectively lengthening the maturity of the security and making the security more sensitive to interest rate changes. Prepayment risk is a major risk of mortgage backed securities and certain asset backed securities. Accordingly, the potential for the value of a debt security to increase in response to interest rate declines is limited. For certain securities, the actual maturity may be less than the stated maturity shown in the Schedule of Investments. As a result, the timing of income recognition relating to these securities may vary based upon the actual maturity. |
| The market value of debt securities held by the Fund may be affected by fluctuations in market interest rates. The market value of these investments tends to decline when interest rates rise and tends to increase when interest rates fall. |
| m) | Use of Estimates – The preparation of financial statements in conformity with U.S. GAAP requires management to make estimates and assumptions that affect the reported amounts of assets and liabilities as of the date of the financial statements and the reported amounts of income and expenses during the period. Operating results in the future could vary from the amounts derived from management’s estimates. |
| n) | Additional Derivative Instrument(s) Information |
| Derivative Instrument(s) as of June 30, 2010. |
| Statement of Assets and Liabilities Location | |||||||||||
| Risk Exposure Category | Asset Derivatives | Liability Derivatives | |||||||||
| Foreign exchange contracts | Unrealized appreciation on forward foreign currency contracts | $ | 34,584 | Unrealized depreciation on forward foreign currency contracts | $ | 10,030 | |||||
The volume of derivatives that is presented in the Schedule of Investments is consistent with the derivative activity during the six-month period ended June 30, 2010.
| Hartford Capital Appreciation HLS Fund |
| Notes to Financial Statements – (continued) |
| June 30, 2010 (Unaudited) |
| (000’s Omitted) |
Realized Gain/Loss and Change in Unrealized Appreciation (Depreciation) on Derivative Instruments for the six-month period ended June 30, 2010:
| Amount of Realized Gain or (Loss) on Derivatives Recognized in Income | ||||||||||||||||||||||||
| Forward | ||||||||||||||||||||||||
| Purchased | Currency | |||||||||||||||||||||||
| Risk Exposure Category | Written Options | Options | Futures | Contracts | Swaps | Total | ||||||||||||||||||
| Foreign exchange contracts | $ | — | $ | — | $ | — | $ | 3,351 | $ | — | $ | 3,351 | ||||||||||||
| Total | $ | — | $ | — | $ | — | $ | 3,351 | $ | — | $ | 3,351 | ||||||||||||
| Change in Unrealized Appreciation or (Depreciation) on Derivatives Recognized in Income | ||||||||||||||||||||||||
| Forward | ||||||||||||||||||||||||
| Purchased | Currency | |||||||||||||||||||||||
| Risk Exposure Category | Written Options | Options | Futures | Contracts | Swaps | Total | ||||||||||||||||||
| Foreign exchange contracts | — | — | — | 22,238 | — | $ | 22,238 | |||||||||||||||||
| Total | $ | — | $ | — | $ | — | $ | 22,238 | $ | — | $ | 22,238 | ||||||||||||
| o) | Indemnifications – Under the Company’s organizational documents, the Company shall indemnify its officers and directors to the full extent required or permitted under Maryland General Corporation Law and the federal securities laws. In addition, the Company, on behalf of the Fund, may enter into contracts that contain a variety of indemnifications. The Company’s maximum exposure under these arrangements is unknown. However, the Company has not had prior claims or losses pursuant to these contracts and expects the risk of loss to be remote. | |
| 3. | Federal Income Taxes: |
| a) | Federal Income Taxes – For federal income tax purposes, the Fund intends to continue to qualify as a RIC under Subchapter M of the Internal Revenue Code (“IRC”) by distributing substantially all of its taxable net investment income and net realized capital gains to its shareholders and otherwise complying with the requirements of RICs. The Fund has distributed substantially all of its income and capital gains in prior years and intends to distribute substantially all of its income and capital gains prior to the next fiscal year end. Accordingly, no provision for federal income or excise taxes has been made in the accompanying financial statements. Distributions from short-term capital gains are treated as ordinary income distributions for federal income tax purposes. | |
| b) | Net Investment Income (Loss), Net Realized Gains (Losses) – Net investment income (loss) and net realized gains (losses) may differ for financial statement and tax purposes primarily because of losses deferred due to wash sale adjustments, foreign currency gains and losses, adjustments related to PFICs, REITs, RICs, certain derivatives and partnerships. The character of distributions made during the year from net investment income or net realized gains may differ from their ultimate characterization for federal income tax purposes. Also, due to the timing of dividend distributions, the fiscal year in which amounts are distributed may differ from the year that the income or realized gains (losses) were recorded by the Fund. | |
| c) | Distributions and Components of Distributable Earnings – The tax character of distributions paid by the Fund for the periods indicated is as follows (as adjusted for dividends payable): |
| For the Year Ended | For the Year Ended | |||||||
| December 31, 2009 | December 31, 2008 | |||||||
| Ordinary Income | $ | 75,000 | $ | 421,639 | ||||
| Long-Term Capital Gains* | — | 871,324 | ||||||
| Tax Return of Capital | — | 63,254 | ||||||
| * | The Fund designates these distributions as long-term capital dividends pursuant to IRC code Sec. 852(b)(3)(C). |
In 2009, the Fund decided to amend its 2008 federal tax return in order to change an election relating to the recognition and classification of certain net realized losses and ordinary income items. As a result, a portion of the distributions that were made by the Fund during 2008 were reclassified as return of capital. This reclassification had no impact on the total net assets or net asset value of the Fund.
As of December 31, 2009, the Fund’s components of distributable earnings (deficit) on a tax basis were as follows:
| Amount | ||||
| Undistributed Ordinary Income | $ | 8,246 | ||
| Accumulated Capital and Other Losses* | (2,502,243 | ) | ||
Unrealized Appreciation† | 709,145 | |||
| Total Accumulated Deficit | $ | (1,784,852 | ) | |
| * | The Fund has capital loss carryforwards that are identified in the Capital Loss Carryforward note that follows. |
| † | The difference between book-basis and tax-basis unrealized appreciation (depreciation) may be attributable to the losses deferred due to wash sale adjustments, foreign currency gains and losses, adjustments related to PFICs, REITs, RICs, certain derivatives and partnerships. |
| d) | Reclassification of Capital Accounts – The Fund may record reclassifications in its capital accounts. These reclassifications have no impact on the total net assets of the Fund. The reclassifications are a result of permanent differences between GAAP and tax accounting for such items as net operating losses that reduce distribution requirements. Adjustments are made to reflect the impact these items have on current and future distributions to shareholders. Therefore, the source of the Fund’s distributions may be shown in the accompanying Statement of Changes in Net Assets as from net investment income, from net realized gains on investments or from capital depending on the type of book and tax differences that exist. For the year ended December 31, 2009, the Fund recorded reclassifications to increase (decrease) the accounts listed below: |
| Amount | ||||
| Accumulated Undistributed Net Investment Income | $ | (1,366 | ) | |
| Accumulated Net Realized Gain (Loss) on Investments | 1,366 | |||
| e) | Capital Loss Carryforward – At December 31, 2009 (tax-year-end), the Fund had capital loss carryforwards for U.S. federal income tax purposes of approximately: |
| Year of Expiration | Amount | |||
| 2016 | $ | 735,471 | ||
| 2017 | 1,766,772 | |||
| Total | $ | 2,502,243 | ||
| f) | Accounting for Uncertainty in Income Taxes – Management has evaluated all open tax years and has determined there is no impact to the Fund’s financial statements related to uncertain tax positions. Generally, tax authorities can examine all tax returns filed for the last three years. |
| 4. | Expenses: |
| a) | Investment Management Agreements – HL Investment Advisors, LLC (“HL Advisors”), an indirect wholly-owned subsidiary of The Hartford Financial Services Group, Inc. (“The Hartford”), serves as investment manager to the Fund pursuant to an Investment Management Agreement with the Company. As investment manager, HL Advisors has overall |
| Hartford Capital Appreciation HLS Fund |
| Notes to Financial Statements – (continued) |
| June 30, 2010 (Unaudited) |
| (000’s Omitted) |
investment supervisory responsibility for the Fund. In addition, HL Advisors provides administrative personnel, services, equipment, facilities and office space for proper operation of the Fund.
HL Advisors has contracted with Wellington Management for the provision of day-to-day investment management services to the Fund in accordance with the Fund’s investment objective and policies. The Fund pays a fee to HL Advisors, a portion of which may be used to compensate Wellington Management.
| b) | Administrative Services Agreement – For the two-month period January 1, 2010 through February 28, 2010, under the Administrative Services Agreement between HLIC and the Company, on behalf of the Fund, HLIC provided administrative services to the Fund and received monthly compensation at the annual rate of 0.20% of the Fund’s average daily net assets. The Fund assumed and paid certain other expenses (including, but not limited to, accounting, custodian, state taxes and Directors’ fees). Effective March 1, 2010, the Investment Management Agreement was amended to include the administrative services for the Fund and the separate administrative services agreement was terminated. |
The schedule below reflects the rates of compensation paid to HL Advisors for investment management services and to HLIC for administrative services rendered from January 1, 2010 through February 28, 2010, and the rates of compensation paid to the HL Advisors for the combined services from March 1, 2010 through June 30, 2010; the rates are accrued daily and paid monthly.
| Average Daily Net Assets | Annual Fee | |||
| On first $250 million | 0.7750 | % | ||
| On next $250 million | 0.7250 | % | ||
| On next $500 million | 0.6750 | % | ||
| On next $4 billion | 0.6250 | % | ||
| On next $5 billion | 0.6225 | % | ||
| Over $10 billion | 0.6200 | % | ||
| c) | Accounting Services Agreement – Pursuant to the Fund Accounting Agreement between HLIC and the Company, on behalf of the Fund, HLIC provides accounting services to the Fund and receives monthly compensation on the Fund’s average net assets. The Fund’s accounting services fees are accrued daily and paid monthly. |
| Average Daily Net Assets | Annual Fee | |||
| On first $5 billion | 0.018 | % | ||
| On next $5 billion | 0.016 | % | ||
| Over $10 billion | 0.014 | % | ||
| d) | Operating Expenses – Allocable expenses incurred by the Company are allocated to each Fund and allocated to classes within the Fund in proportion to the average daily net assets of the Fund and each class, except where allocation of certain expenses is more fairly made directly to the Fund or to specific classes within a Fund. |
| e) | Fees Paid Indirectly – The Company, on behalf of the Fund has entered into agreements with State Street Global Advisers, LLC and Russell Implementation Securities, Inc. to partially recapture non-discounted trade commissions. Such rebates are used to pay a portion of the Fund’s expenses. In addition, the Fund’s custodian bank has also agreed to reduce its fees when the Fund maintains cash on deposit in a non-interest-bearing custody account. For the six-month period ended June 30, 2010, these amounts are included in the Statement of Operations. |
The ratio of expenses to average net assets in the accompanying financial highlights excludes the reduction in expenses related to fees paid indirectly. Had the fees paid indirectly been included, the annualized expense ratio for the periods listed below would have been as follows:
| Annualized | ||||||||||||||||||||||||
| Six-Month | Year Ended | Year Ended | Year Ended | Year Ended | Year Ended | |||||||||||||||||||
| Period Ended | December 31, | December 31, | December 31, | December 31, | December 31, | |||||||||||||||||||
| June 30, 2010 | 2009 | 2008 | 2007 | 2006 | 2005 | |||||||||||||||||||
| Class IA | 0.67 | % | 0.67 | % | 0.66 | % | 0.67 | % | 0.66 | % | 0.67 | % | ||||||||||||
| Class IB | 0.92 | 0.92 | 0.91 | 0.92 | 0.91 | 0.92 | ||||||||||||||||||
| f) | Distribution Plan for Class IB shares – The Company, on behalf of the Fund, has adopted a Distribution Plan pursuant to Rule 12b-1 under the 1940 Act for the Class IB shares. Pursuant to the Distribution Plan, the Fund is authorized to compensate the Distributor, Hartford Securities Distribution Company, Inc. (a wholly owned, ultimate subsidiary of The Hartford), from assets attributable to the Class IB shares for services rendered and expenses borne in connection with activities primarily intended to result in the sale of the Class IB shares, subject to the Fund Board’s review and approval. |
| The Distribution Plan provides that the Fund may pay annually up to 0.25% of the average daily net assets of the Fund attributable to its Class IB shares for activities primarily intended to result in the sale of Class IB shares. The Board has the authority to suspend or reduce these payments at any point in time. Under the terms of the Distribution Plan and the principal underwriting agreement, the Fund is authorized to make payments monthly to the Distributor which may be used to pay or compensate entities providing distribution and shareholder servicing with respect to the Class IB shares for such entities’ fees or expenses incurred or paid in that regard. These fees are accrued daily and paid monthly. |
| g) | Other Related Party Transactions – Certain officers of the Fund are directors and/or officers of HL Advisors, and/or The Hartford or its subsidiaries. For the six-month period ended June 30, 2010, a portion of the Fund’s chief compliance officer’s salary was paid by all the investment companies in the Hartford fund complex. The portion allocated to the Fund was in the amount of $22. Hartford Investor Services Company LLC ("HISC"), a wholly owned subsidiary of The Hartford, provides transfer agent services to the Fund. The amount HISC was compensated for providing such services can be found on the Statement of Operations. These fees are accrued daily and paid monthly. |
| h) | Payment from Affiliate – In July of 2007, The Hartford entered into a settlement with the Attorneys General of the states of New York, Connecticut and Illinois relating to market timing and the company's individual variable annuity contracts in which certain payments would be made directly to the variable annuity contract holders. The distribution plan provides that unclaimed money from the settlement would be distributed to certain HLS Funds that are investment options through a Hartford individual variable annuity contract. The unclaimed money was distributed to the Fund on September 18, 2009, as follows: |
| Amount | ||||
| Reimbursement | $ | 273 | ||
On November 8, 2006, the SEC issued an order setting forth the terms of a settlement reached with three subsidiaries of The Hartford that resolves the SEC’s Division of Enforcement’s investigation of aspects of The Hartford’s variable annuity and mutual fund operations related to directed brokerage and revenue sharing. The Hartford settled this matter without admitting or denying the findings of the SEC.
The Fund is available for purchase by the separate accounts of different variable universal life policies, variable annuity products, and funding agreements and it is offered directly to certain qualified retirement plans (collectively “Products”). Although existing Products contain transfer restrictions, some Products, particularly older variable annuity products, do not contain restrictions on the frequency of transfers. In addition, as the result of the settlement of litigation against
| Hartford Capital Appreciation HLS Fund |
| Notes to Financial Statements – (continued) |
| June 30, 2010 (Unaudited) |
| (000’s Omitted) |
Hartford Life, Inc. (“Hartford Life”) (the issuers of such variable annuity products), the Fund’s ability to restrict transfers by certain owners of older variable annuity products was limited. During 2006, these annuity owners surrendered the older variable annuity contracts that were the subject of prior litigation. In February 2005, Hartford Life agreed with the Board of Directors of the Fund to indemnify the Fund for any material harm caused to the Fund from frequent trading by these contracts owners.
The total return in the accompanying financial highlights includes payment from affiliates. Had the payment from affiliates been excluded, the total return for the periods listed below would have been as follows:
| For the Year Ended December 31, 2009 | ||||||||
| Class IA | Class IB | |||||||
| Impact from Payment from Affiliate for Attorneys General Settlement | — | % | — | % | ||||
| Total Return Excluding Payments from Affiliate | 45.66 | 45.30 | ||||||
| For the Year Ended December 31, 2006 | ||||||||
| Class IA | Class IB | |||||||
| Impact from Payment from Affiliate for SEC Settlement | 0.09 | % | 0.09 | % | ||||
| Total Return Excluding Payments from Affiliate | 16.52 | 16.23 | ||||||
| 5. | Investment Transactions: |
For the six-month period ended June 30, 2010, the cost of purchases and proceeds from sales of investment securities (excluding short-term investments) were as follows:
| Amount | ||||
| Cost of Purchases Excluding U.S. Government Obligations | $ | 4,948,856 | ||
| Sales Proceeds Excluding U.S. Government Obligations | 5,495,674 | |||
| 6. | Line of Credit: |
The Fund is one of several Hartford funds that participate in a $500 million committed revolving line of credit facility. The facility is to be used for temporary or emergency purposes. Under the arrangement, a fund is required to own securities having a market value in excess of 300% of the total bank borrowings. The interest rate on borrowings varies depending on the nature of the loan. The facility also requires a fee to be paid based on the amount of the commitment. This fee is allocated to all the funds participating in the line of credit based on the average net assets of the funds. During the six-month period ended June 30, 2010, the Fund did not have any borrowings under this facility.
| 7. | Industry Classifications: |
Other than the industry classifications “Other Investment Pools and Funds” and “Exchange Traded Funds”, equity industry classifications used in this report are the Global Industry Classification Standard, which was developed by and is the exclusive property and service mark of MSCI, Inc. and Standard & Poor’s.
[This page left intentionally blank]
| Hartford Capital Appreciation HLS Fund |
| - Selected Per-Share Date (A) - - |
| Net Asset | Net Realized | Net Increase | ||||||||||||||||||||||||||||||||||||||||||
| Value at | Payments | and Unrealized | Total from | Dividends from | Distributions | (Decrease) in | Net Asset | |||||||||||||||||||||||||||||||||||||
| Beginning of | Net Investment | from (to) | Gain (Loss) on | Investment | Net Investment | from Realized | Distributions | Total | Net Asset | Value at End | ||||||||||||||||||||||||||||||||||
Class | Period | Income (Loss) | Affiliate | Investments | Operations | Income | Capital Gains | from Capital | Distributions | Value | of Period | |||||||||||||||||||||||||||||||||
| For the Six-Month Period Ended June 30, 2010 (Unaudited) | ||||||||||||||||||||||||||||||||||||||||||||
| IA | $ | 36.63 | $ | 0.15 | $ | – | $ | (3.42 | ) | $ | (3.27 | ) | $ | – | $ | – | $ | – | $ | – | $ | (3.27 | ) | $ | 33.36 | |||||||||||||||||||
| IB | 36.32 | 0.11 | – | (3.39 | ) | (3.28 | ) | – | – | – | – | (3.28 | ) | 33.04 | ||||||||||||||||||||||||||||||
| For the Year Ended December 31, 2009 | ||||||||||||||||||||||||||||||||||||||||||||
| IA | 25.34 | 0.31 | – | 11.27 | 11.58 | (0.29 | ) | – | – | (0.29 | ) | 11.29 | 36.63 | |||||||||||||||||||||||||||||||
| IB | 25.14 | 0.25 | – | 11.14 | 11.39 | (0.21 | ) | – | – | (0.21 | ) | 11.18 | 36.32 | |||||||||||||||||||||||||||||||
| For the Year Ended December 31, 2008 | ||||||||||||||||||||||||||||||||||||||||||||
| IA | 52.46 | 0.46 | – | (22.58 | ) | (22.12 | ) | (0.50 | )(H) | (4.28 | ) | (0.22 | )(H) | (5.00 | ) | (27.12 | ) | 25.34 | ||||||||||||||||||||||||||
| IB | 52.01 | 0.39 | – | (22.37 | ) | (21.98 | ) | (0.39 | )(H) | (4.28 | ) | (0.22 | )(H) | (4.89 | ) | (26.87 | ) | 25.14 | ||||||||||||||||||||||||||
| For the Year Ended December 31, 2007 | ||||||||||||||||||||||||||||||||||||||||||||
| IA | 53.49 | 0.35 | – | 8.36 | 8.71 | (0.07 | ) | (9.67 | ) | – | (9.74 | ) | (1.03 | ) | 52.46 | |||||||||||||||||||||||||||||
| IB | 53.21 | 0.22 | – | 8.28 | 8.50 | (0.03 | ) | (9.67 | ) | – | (9.70 | ) | (1.20 | ) | 52.01 | |||||||||||||||||||||||||||||
| For the Year Ended December 31, 2006 | ||||||||||||||||||||||||||||||||||||||||||||
| IA | 52.99 | 0.50 | 0.04 | 7.88 | 8.42 | (0.76 | ) | (7.16 | ) | – | (7.92 | ) | 0.50 | 53.49 | ||||||||||||||||||||||||||||||
| IB | 52.75 | 0.36 | 0.04 | 7.83 | 8.23 | (0.61 | ) | (7.16 | ) | – | (7.77 | ) | 0.46 | 53.21 | ||||||||||||||||||||||||||||||
| For the Year Ended December 31, 2005 | ||||||||||||||||||||||||||||||||||||||||||||
| IA | 53.43 | 0.45 | – | 7.57 | 8.02 | (0.52 | ) | (7.94 | ) | – | (8.46 | ) | (0.44 | ) | 52.99 | |||||||||||||||||||||||||||||
| IB | 53.18 | 0.25 | – | 7.59 | 7.84 | (0.33 | ) | (7.94 | ) | – | (8.27 | ) | (0.43 | ) | 52.75 | |||||||||||||||||||||||||||||
| (A) | Information presented relates to a share outstanding throughout the indicated period. |
| (B) | The figures do not include sales charges or other fees which may be applied at the variable life insurance, variable annuity or qualified retirement plan product level. Any such additional sales charges or other fees would lower the Fund's performance. |
| (C) | Ratios do not reflect reductions for fees paid indirectly. Please see Fees Paid Indirectly in the Notes to Financial Statements. |
| (D) | Portfolio turnover rate is calculated on the basis of the Fund as a whole without distinguishing between the classes of shares issued. |
| (E) | Not annualized. |
| (F) | Annualized. |
| (G) | Total return without the inclusion of the Payment from (to) Affiliate can be found in Expenses in the accompanying Notes to Financial Statements. |
| (H) | See Federal Income Taxes in the Notes to Financial Statements regarding the restated 2008 Distribution to Shareholder amounts. |
| - Ratios and Supplemental Data - - |
Ratio of Expenses to Average Net | Ratio of Expenses to Average Net | Ratio of Net Investment Income to | Portfolio | |||||||||||||||||
| Total Return(B) | Net Assets at End of Period | Assets Before Waivers(C) | Assets After Waivers(C) | Average Net Assets | Turnover Rate(D) | |||||||||||||||
| (8.91 | )%(E) | $ | 7,295,207 | 0.67 | %(F) | 0.67 | %(F) | 0.80 | %(F) | 52 | % | |||||||||
| (9.02 | )(E) | 1,324,826 | 0.92 | (F) | 0.92 | (F) | 0.55 | (F) | – | |||||||||||
| 45.67 | (G) | 8,410,214 | 0.68 | 0.68 | 1.03 | 128 | ||||||||||||||
| 45.30 | (G) | 1,595,912 | 0.93 | 0.93 | 0.79 | – | ||||||||||||||
| (45.59 | ) | 6,017,984 | 0.67 | 0.67 | 1.12 | 131 | ||||||||||||||
| (45.73 | ) | 1,295,065 | 0.92 | 0.92 | 0.87 | – | ||||||||||||||
| 16.83 | 12,123,834 | 0.67 | 0.67 | 0.68 | 101 | |||||||||||||||
| 16.53 | 2,933,905 | 0.92 | 0.92 | 0.42 | – | |||||||||||||||
| 16.61 | (G) | 11,746,831 | 0.67 | 0.67 | 0.82 | 73 | ||||||||||||||
| 16.32 | (G) | 2,810,587 | 0.92 | 0.92 | 0.57 | – | ||||||||||||||
| 15.55 | 11,317,561 | 0.70 | 0.70 | 0.78 | 97 | |||||||||||||||
| 15.26 | 2,793,612 | 0.95 | 0.95 | 0.53 | – | |||||||||||||||
| Hartford Capital Appreciation HLS Fund |
The Board of Directors appoints officers who are responsible for the day-to-day operations of the Fund and who execute policies formulated by the Directors. Each director serves until his or her death, resignation, or retirement or until the next annual meeting of shareholders is held or until his or her successor is elected and qualifies.
Directors and officers who are employed by or who have a financial interest in The Hartford are considered “interested” persons of the Fund pursuant to the Investment Company Act of 1940, as amended. Each officer and two of the Company’s directors, as noted in the chart below, are “interested” persons of the Fund. Each director serves as a director for The Hartford Mutual Funds, Inc., The Hartford Mutual Funds II, Inc., The Hartford Income Shares Fund, Inc., Hartford Series Fund, Inc., and Hartford HLS Series Fund II, Inc., which, as of June 30, 2010, collectively consist of 88 funds. Correspondence may be sent to directors and officers c/o Hartford Mutual Funds, P.O. Box 2999, Hartford, Connecticut 06104-2999, except that correspondence to Ms. Fagely may be sent to 500 Bielenberg Drive, Woodbury, Minnesota 55125.
The table below sets forth, for each director and officer, his or her name, year of birth, current position with the Company and date first elected or appointed to Hartford Series Fund, Inc. (“HSF”), and Hartford HLS Series Fund II, Inc. (“HSF2”), principal occupation, and, for directors, other directorships held. The Fund’s statement of additional information contains further information on the directors and is available free of charge by calling 1-800-862-6668 or writing to Hartford HLS Funds, c/o Individual Annuity Services, P.O. Box 5085, Hartford, CT 06102-5085.
Information on the aggregate remuneration paid to the directors of the Company can be found in the Statement of Operations herein. The Fund pays to The Hartford a portion of the chief compliance officer’s compensation, but does not pay salaries or compensation to any of their other officers or directors who are employed by The Hartford.
Non-Interested Directors
Lynn S. Birdsong (1946) Director since 2003, Co-Chairman of the Investment Committee
Mr. Birdsong is a private investor. Since 2003, Mr. Birdsong has been an independent director of The Japan Fund and has served as a Director of the Sovereign High Yield Fund since April 2010. From 2003 to March 2005, Mr. Birdsong was an independent director of the Atlantic Whitehall Funds. From 1979 to 2002, Mr. Birdsong was a managing director of Zurich Scudder Investments, an investment management firm. During his employment with Scudder, Mr. Birdsong was an interested director of The Japan Fund. Since 1981, Mr. Birdsong has been a partner in Birdsong Company, an advertising specialty firm.
Robert M. Gavin, Jr. (1940) Director since 2002 (HSF) and 1986 (HSF2), Chairman of the Board since 2004
Dr. Gavin is an educational consultant. Prior to September 1, 2001, he was President of Cranbrook Education Community and prior to July 1996, he was President of Macalester College, St. Paul, Minnesota.
Duane E. Hill (1945) Director since 2001 (HSF) and 2002 (HSF2), Chairman of the Nominating Committee
Mr. Hill is Partner of TSG Ventures L.P., a private equity investment company. Mr. Hill is a former partner of TSG Capital Group, a private equity investment firm that served as sponsor and lead investor in leveraged buyouts of middle market companies.
Sandra S. Jaffee (1941) Director since 2005
Ms. Jaffee served as Chairman (2008 to 2009) and Chief Executive Officer of Fortent (formerly Searchspace Group), a leading provider of compliance/regulatory technology to financial institutions from August 2005 to August 2009. From August 2004 to August 2005, Ms. Jaffee served as an Entrepreneur in Residence with Warburg Pincus, a private equity firm. From September 1995 to July 2004, Ms. Jaffee served as Executive Vice President at Citigroup, where she was President and Chief Executive Officer of Citibank’s Global Securities Services (1995 to 2003).
William P. Johnston (1944) Director since 2005, Chairman of the Compliance Committee
In June 2006, Mr. Johnston was appointed as Senior Advisor to The Carlyle Group, a global private equity investment firm. In July 2006, Mr. Johnston was elected to the Board of Directors of MultiPlan, Inc. In August 2007, Mr. Johnston was elected to the Board of Directors of LifeCare Holdings, Inc. In February 2008, Mr. Johnston was elected to the Board of Directors of HCR-ManorCare, Inc. In May 2006, Mr. Johnston was elected to the Supervisory Board of Fresenius Medical Care AG & Co. KGaA, after its acquisition of Renal Care Group, Inc. in March 2006. Mr. Johnston joined Renal Care Group in November 2002 as a member of the Board of Directors and served as Chairman of the Board from March 2003 through March 2006. From September 1987 to December 2002, Mr. Johnston was with Equitable Securities Corporation (and its successors, SunTrust Equitable Securities and SunTrust Robinson Humphrey) serving in various investment banking and managerial positions, including Managing Director and Head of Investment Banking, Chief Executive Officer and Vice Chairman.
Phillip O. Peterson (1944) Director since 2002 (HSF) and 2000 (HSF2), Chairman of the Audit Committee
Mr. Peterson is a mutual fund industry consultant. He was a partner of KPMG LLP (an accounting firm) until July 1999. Mr. Peterson joined William Blair Funds in February 2007 as a member of the Board of Trustees. From January 2004 to April 2005, Mr. Peterson served as Independent President of the Strong Mutual Funds.
Lemma W. Senbet (1946) Director since 2005
Dr. Senbet is the William E. Mayer Chair Professor of Finance and Director, Center for Financial Policy, at the University of Maryland, Robert H. Smith School of Business. He was chair of the Finance Department during 1998 to 2006. Previously he was a chaired professor of finance at the University of Wisconsin-Madison. Also, he was director of the Fortis Funds from March 2000 to July 2002. Dr. Senbet served the finance profession in various capacities, including as director of the American Finance Association and President of the Western Finance Association. In 2006, Dr. Senbet was inducted Fellow of Financial Management Association International for his career-long distinguished scholarship and professional service.
Interested Directors and Officers
Lowndes A. Smith (1939) Director since 1996 (HSF) and 2002 (HSF2), Co-Chairman of the Investment Committee
Mr. Smith served as Vice Chairman of The Hartford from February 1997 to January 2002, as President and Chief Executive Officer of Hartford Life, Inc. from February 1997 to January 2002, and as President and Chief Operating Officer of The Hartford Life Insurance Companies from January 1989 to January 2002. Mr. Smith serves as a Director of White Mountains Insurance Group, Ltd., One Beacon Insurance, Symetra Financial and as a Managing Director of Whittington Gray Associates.
John C. Walters 1, 2 (1962) Director since 2008
Mr. Walters currently serves as President, Chief Executive Officer and Director for Hartford Life, Inc. (“HL, Inc.”). Mr. Walters also serves as President, Chairman of the Board, Chief Executive Officer and Director for Hartford Life Insurance Company (“Hartford Life”), and as Executive Vice President of The Hartford. In addition, Mr. Walters is a Manager of HL Investment Advisors, LLC (“HL Advisors”). Mr. Walters previously served as President of the U.S. Wealth Management Division of HL, Inc. (2006-2007) and as Co-Chief Operating Officer of Hartford Life (2007-2008).
1 Mr. Walters previously served as President and Chief Executive Officer (2007 to 2009).
2 Effective July 31, 2010, Mr. Walters retired from The Hartford. Mr. Walters resigned his position as a Director of the Fund effective July 30, 2010.
Other Officers
Robert M. Arena, Jr. (1968) President and Chief Executive Officer since 2009 (served as Vice President of the Fund (2006-2009))
Mr. Arena serves as Executive Vice President of Hartford Life. Additionally, Mr. Arena is Senior Vice President and Director of Hartford Administrative Services Company, (“HASCO”), President, Chief Executive Officer and Manager of Hartford Investment Financial Services, LLC (“HIFSCO”) and President, Chief Executive Officer and Manager of HL Advisors. Mr. Arena joined The Hartford in 2004.
Tamara L. Fagely (1958) Vice President, Treasurer and Controller since 2002 (HSF) 1993 (HSF2)
Ms. Fagely has been a Vice President of HASCO since 1998 and Chief Financial Officer since 2006. Currently Ms. Fagely is a Vice President of Hartford Life. She served as Assistant Vice President of Hartford Life from December 2001 through March 2005. In addition, Ms. Fagely is Controller and Chief Financial Officer of HIFSCO.
Brian Ferrell (1962) AML Compliance Officer since 2008
Mr. Ferrell has served as Assistant Vice President and AML Compliance Officer for The Hartford since 2006, and as AML Compliance Officer for HASCO and Hartford Investor Services Company, LLC (“HISC”) since 2008. Prior to joining The Hartford in 2006, Mr. Ferrell held various positions at the U.S. Department of the Treasury (the “Treasury”) from 2001 to 2006, where he served as Chief Counsel for the Treasury’s Financial Crimes Enforcement Network from 2005-2006.
Dr. Robert J. Froehlich (1953) Senior Managing Director since 2009
Dr. Froehlich joined The Hartford as Senior Managing Director in September 2009. Prior to joining The Hartford, Dr. Froehlich served as Vice Chairman of Deutsche Asset Management from 1997-2009.
| Hartford Capital Appreciation HLS Fund |
| Directors and Officers (Unaudited) – (continued) |
Thomas D. Jones, III (1965) Vice President and Chief Compliance Officer since 2006
Mr. Jones serves as Chief Compliance Officer for the Hartford Mutual Funds and Vice President and Director of Securities Compliance for The Hartford. Mr. Jones joined The Hartford in 2006 from SEI Investments, where he served as Chief Compliance Officer for its mutual funds and investment advisers. Prior to joining SEI, Mr. Jones was First Vice President and Compliance Director for Merrill Lynch Investment Managers (Americas) (“MLIM”), where he worked from 1992-2004.
Edward P. Macdonald (1967) Vice President, Secretary and Chief Legal Officer since 2005
Mr. Macdonald serves as Assistant Vice President of Hartford Life and Chief Legal Officer and Vice President of HIFSCO. He also serves as Vice President and Secretary of HASCO, and Chief Legal Officer, Secretary and Vice President of HL Advisors. Mr. Macdonald joined The Hartford in 2005.
Vernon J. Meyer (1964) Vice President since 2006
Mr. Meyer serves as Senior Vice President of Hartford Life. He also serves as Senior Vice President of HIFSCO and HL Advisors. Mr. Meyer joined The Hartford in 2004.
D. Keith Sloane (1960) Vice President since 2009
Mr. Sloane is a Senior Vice President of Hartford Life. Additionally, Mr. Sloane currently serves as Senior Vice President of HIFSCO, HL Advisors, and HASCO. Prior to joining The Hartford in 2007, Mr. Sloane was Director of product marketing and led the mutual fund business for Wachovia Securities (“Wachovia”) in their investment products group. Mr. Sloane joined Wachovia in 1995.
Jane Wolak (1961) Vice President since 2009
Ms. Wolak currently serves as Vice President of Hartford Life. Ms. Wolak joined Hartford Life as Vice President, Retail Product Services in May 2007. She is also Vice President of HASCO. Previously, Ms. Wolak was with Sun Life Financial where she held the position of Vice President, Service Center Operations from 2001-2007.
A description of the policies and procedures that the Fund uses to determine how to vote proxies relating to portfolio securities and a record of how the Fund voted any proxies for the twelve-month period ended June 30, 2010 is available (1) without charge, upon request, by calling 800-862-6668 and (2) on the Securities and Exchange Commission’s website at http://www.sec.gov.
The Fund files a complete schedule of portfolio holdings with the Commission for the first and third quarters of each fiscal year on Form N-Q. The Fund’s Forms are available (1) without charge, upon request, by calling 800-862-6668 and (2) on the Securities and Exchange Commission’s website at http://www.sec.gov. The Form N-Q may be reviewed and copied at the Commission’s Public Reference Room in Washington, DC. Information on the operation of the Public Reference Room may be obtained by calling 1-800-SEC-0330.
| Hartford Capital Appreciation HLS Fund |
The following proposals were addressed and approved at a Special Meeting of Shareholders held on February 12, 2010.
Proposal to approve amendments to the Investment Management Agreement between the Fund and HL Investment Advisors, the purpose of which were to combine the administrative services for the Fund with the management services for the Fund under a single agreement.
| Fund | For | Against | Abstain | |||
| Hartford Capital Appreciation HLS Fund | 210,113,816.509 | 9,162,319.671 | 5,837,860.371 |
Proposal to elect Lemma Senbet and John Walters, each currently a Director, as Directors of Hartford Series Fund, Inc.
Lemma W. Senbet
| Funds | For | Withheld | ||
| Hartford Series Fund, Inc. | 5,079,578,022.902 | 241,839,974.106 |
John C. Walters
| Funds | For | Withheld | ||
| Hartford Series Fund, Inc. | 5,081,138,302.186 | 240,279,694.822 |
| Hartford Capital Appreciation HLS Fund |
Your Fund's Expenses
As a shareholder of the Fund, you incur two types of costs: (1) transaction costs, including sales charges (loads) on purchase payments and contingent deferred sales charges (CDSC) (2) ongoing costs including management fees; distribution fees; and other fund expenses. This example is intended to help you understand your ongoing costs (in dollars) of investing in the Fund and to compare these costs with the ongoing costs of investing in other mutual funds. The example is based on an investment of $1,000 invested at the beginning of the period and held for the period of December 31, 2009 through June 30, 2010.
Actual Expenses
The first set of columns of the table below provides information about actual account values and actual expenses. You may use the information in this column, together with the amount you invested, to estimate the expenses that you paid over the period. Simply divide your account value by $1,000 (for example, an $8,600 account value divided by $1,000 = 8.6), then multiply the result by the number in the line under the heading entitled "Expenses Paid During Period" to estimate the expenses you paid on your account during this period.
Hypothetical Example for Comparison Purposes
The second set of columns of the table below provides information about hypothetical account values and hypothetical expenses based on the Fund's actual expense ratio and an assumed rate of return of 5% per year before expenses, which is not the Fund's actual return. The hypothetical account values and expenses may not be used to estimate the actual ending account balance or expenses you paid for the period. You may use this information to compare the ongoing costs of investing in the Fund and other funds. To do so, compare this 5% hypothetical example with the 5% hypothetical examples that appear in the shareholder reports of the other funds.
Please note that the expenses shown in the table are meant to highlight your ongoing costs only and do not reflect any transactional costs, such as sales charges (loads) and CDSC. Therefore, the second set of columns of the table is useful in comparing ongoing costs only, and will not help you determine the relative total costs of owning different funds. In addition, if these transactional costs were included, your costs would be higher. Expenses are equal to the Fund's annualized expense ratios multiplied by average account value over the period, multiplied by 181/365 (to reflect the one-half year period).
| Actual return | Hypothetical (5% return before expenses) | |||||||||||||||||||||||||||||||||||
| Expenses paid | Expenses paid | Days in | ||||||||||||||||||||||||||||||||||
| during the period | during the period | the | Days | |||||||||||||||||||||||||||||||||
| Beginning | Ending | December 31, 2009 | Beginning | Ending | December 31, 2009 | Annualized | current | in the | ||||||||||||||||||||||||||||
| Account Value | Account Value | through | Account Value | Account Value | through | expense | 1/2 | full | ||||||||||||||||||||||||||||
| December 31, 2009 | June 30, 2010 | June 30, 2010 | December 31, 2009 | June 30, 2010 | June 30, 2010 | ratio | year | year | ||||||||||||||||||||||||||||
| Class IA | $ | 1,000.00 | $ | 910.00 | $ | 3.17 | $ | 1,000.00 | $ | 1,020.45 | $ | 3.35 | 0.67 | % | 181 | 365 | ||||||||||||||||||||
Class IB | $ | 1,000.00 | $ | 909.78 | $ | 4.36 | $ | 1,000.00 | $ | 1,020.23 | $ | 4.61 | 0.92 | % | 181 | 365 | ||||||||||||||||||||
| Hartford Capital Appreciation HLS Fund |
The Board approved the annual continuation of the Investment Management Agreement (the “Agreement”) between Hartford Series Fund, Inc. (“HSF”) and HL Investment Advisors, LLC (“HL Advisors”) with respect to the Fund at its meeting on August 4-5, 2009. The Board’s considerations in approving the renewal of the Agreement are disclosed in the December 31, 2009 Annual Report for HSF.
At the November 4-5, 2009 meeting, the Board considered and approved amendments to the Agreement to include administrative services, which had been provided pursuant to a separate agreement, and investment management services under one agreement. The Board, including all of the Independent Directors, approved the amendments to the Agreement with respect to the Fund.
In approving the amendments, in addition to the information presented at the August meeting in connection with the annual review of the Agreement and the additional information provided throughout the year, the Board also considered the fact that the amendments did not result in an overall increase in fees to shareholders. The Board took note of the fact that the management of HL Advisors believes that the proposal to combine the administrative services with the investment management services under a single agreement will produce streamlined fee disclosure, resulting in greater transparency and clarity in the Fund’s prospectuses and financial reports. The Board further noted management's belief that the change would result in consistency across all of the Hartford Funds in the complex in that the funds of HSF are the only funds in the complex (other than the R share classes of the Hartford retail funds) that are subject to a separate administrative services fee. Finally, the Board noted management's view that the proposed changes to the Agreement should also serve to simplify the Board's annual consideration of the investment management arrangements for the Fund in that the investment management and administrative fees would be presented as a single fee for fee comparison purposes, which should facilitate the Board's analysis.
The shareholders of the Fund approved the amendments at a Special Meeting of Shareholders held on February 12, 2010. The amendments were effective as of March 1, 2010.
33
The Hartford
P.O. Box 5085
Hartford, CT 06102–5085
Hartford Series Fund, Inc. is underwritten and distributed by Hartford Securities Distribution Company, Inc.
“The Hartford” is The Hartford Financial Services Group, Inc. and its subsidiaries.
Hartford Series Fund, Inc. inception dates range from 1977 to date. Hartford Series Fund, Inc. is not a subsidiary of The Hartford but is underwritten, distributed by and advised by subsidiaries of The Hartford. Investments in Hartford Series Fund, Inc. are not guaranteed by The Hartford or any other entity.
This material is authorized for distribution only when preceded or accompanied by a current prospectus. The prospectus contains detailed information about the Funds, including investment objectives, risks and charges and expenses. Please read it carefully before you invest or send money.
HLSSAR-CA10 Printed in U.S.A ©2010 The Hartford, Hartford, CT 06115 |
| Hartford Disciplined Equity HLS Fund |
|
Hartford Disciplined Equity HLS Fund
| Manager Discussions (Unaudited) | 2 |
| Financial Statements | |
| 4 | |
| 7 | |
| 8 | |
| 9 | |
| 10 | |
| 11 | |
| 22 | |
| 24 | |
| 26 | |
| 26 | |
| 27 | |
| 28 | |
| 29 |
This report is prepared for the general information of contract owners and qualified retirement plan participants. It is not an offer of contracts or of qualified retirement plans. It should not be used in connection with any offer, except in conjunction with the appropriate prospectus which contains all pertinent information including the applicable sales, administrative and other charges.
The views expressed in the Fund’s Manager Discussion under “Why did the Fund perform this way?” and “What is the outlook?” are views of the Fund’s subadvisers and portfolio management team through the end of the period and is subject to change based on market and other conditions.
Hartford Disciplined Equity HLS Fund inception 05/29/1998
(subadvised by Wellington Management Company, LLP)
Investment objective – Seeks growth of capital.
Performance Overview(1) 6/30/00 - 6/30/10
Growth of $10,000 investment

S&P 500 Index is a market capitalization-weighted price index composed of 500 widely held common stocks.
You cannot invest directly in an index.
The chart represents a hypothetical investment in the Fund. Performance data represents past performance and current performance could be higher or lower.
Average Annual Returns (as of 6/30/10)
| 6 | 1 | 5 | 10 | ||||||
| Month† | Year | Year | Year | ||||||
| Disciplined Equity IA | -7.85% | 10.47% | -1.39% | -1.65% | |||||
| Disciplined Equity IB | -7.97% | 10.19% | -1.64% | -1.88% | |||||
| S&P 500 Index | -6.64% | 14.43% | -0.80% | -1.59% |
† Not Annualized
PAST PERFORMANCE IS NOT INDICATIVE OF FUTURE RESULTS.
| (1) | Growth of a $10,000 investment in Class IB shares will vary from the results seen on this page due to differences in the expense charged to this share class. |
Performance information may reflect historical or current expense waivers from the investment adviser, without which performance would have been lower. For information on current expense waivers/reimbursements, please see the prospectus.
The value of the contract will fluctuate so that when redeemed, it may be worth more or less than the original investment. The chart and table do not reflect the deduction of taxes that a shareholder would pay on portfolio distributions or the redemption of portfolio shares. The figures do not include sales charges or other fees which may be applied at the variable life insurance, variable annuity or qualified retirement plan product level. Any such additional sales charges or other fees would lower the Fund’s performance.
Portfolio Manager
Mammen Chally, CFA
| Vice President |
How did the Fund perform?
The Class IA shares of The Hartford Disciplined Equity HLS Fund returned -7.85% for the six-month period ended June 30, 2010, underperforming its benchmark, the S&P 500 Index, which returned -6.64% for the same period. The Fund performed in line with the -7.67% return of the average fund in the Lipper Large-Cap Core Funds VP-UF peer group, a group of funds with investment strategies similar to those of the Fund.
Why did the Fund perform this way?
The six-month period ended June 30, 2010 was a volatile period. Through late April, U.S. equities rose as investor confidence grew amid better-than-expected corporate earnings, accommodative monetary policy, and improving economic conditions. From late April until the end of the period, equities fell on concerns that the global economy could slip back into a recession. Sovereign debt, solvency issues in the Euro-zone, and slowing economic growth in the U.S. and around the globe pressured markets as the sustainability of corporate earnings growth came into question.
Overall equity market performance was negative for the period across all market capitalizations: large cap equities (-7%), mid caps equities (-1%), and small caps equities (-2%) all declined as represented by the S&P 500, S&P 400 MidCap, and Russell 2000 indices, respectively. During the six-month period all ten sectors within the S&P 500 Index fell. The Materials (-13%), Energy (-12%), and Information Technology (-11%) sectors declined the most on a relative basis while Industrials (-1%), Consumer Discretionary (-2%) and Consumer Staples (-3%) declined the least.
The Fund underperformed the benchmark due to weak stock selection in the Consumer Discretionary, Industrials, and Information Technology sectors. This more than offset positive stock selection in the Consumer Staples sector. Our sector positioning, which is a fallout of the bottom up (i.e. stock by stock fundamental research) stock selection process, added modestly to relative (i.e. performance of the Fund as measured against the benchmark) performance. In particular, our below-benchmark allocation to Energy and Materials helped relative performance.
The largest detractors from performance relative to the benchmark were Forest Labs (Health Care), Office Depot (Consumer Discretionary), and Goldman Sachs (Financials). Shares of Forest
Labs fell as Daxas, a key drug under development for the respiratory condition COPD, failed to gain approval from the Food and Drug Administration. Forest also discontinued development of Dutagliptin, a diabetes drug with the same mechanism as Merck's Januvia that was in Phase 3 trials. Office Depot’s shares came under pressure as investors started to recognize the unfavorable potential impact of economic slowing in the second half of 2010 on revenues and profits. Goldman Sachs’ shares underperformed due to concerns over the news of a criminal investigation by U.S. federal prosecutors. Uncertainty around the impact of financial reform also weighed on shares. Other detractors from absolute performance included Microsoft (Information Technology) and Google (Information Technology).
The largest contributors to relative performance were Exxon Mobil (Energy), Apple (Information Technology), and PNC Financial Services (Financials). Not owning benchmark component Exxon Mobil for most of the period helped relative performance as the company's lower leverage to rising energy prices and large refining exposure weighed on the stock. Shares also declined as a result of the British Petroleum Gulf of Mexico oil spill disaster. Shares of Apple rose due to the continued success of the iPhone and the launch of the iPad during the period. Pittsburgh-based PNC Financial Services strengthened its loan loss reserves and announced better-than-expected accretion from the acquisition of National City, both of which helped the stock price increase during the period. Our position in Dr Pepper Snapple Group (Consumer Staples) was among the top contributors to absolute performance.
What is the outlook?
The second quarter of 2010 saw a resurgence of risk aversion. During the quarter, investors were forced to confront the impacts of negative news on several fronts: sovereign debt and solvency issues in Europe, concerns about a double-dip global recession and an open-ended oil spill in the Gulf of Mexico. Following on the heels of strong appreciation in risk assets, these events served to reintroduce fear into the investment lexicon.
The Fund focuses on stock selection as the key driver of returns and uses proprietary fundamental and quantitative research in a disciplined framework to build a portfolio of the most attractive stocks. Sector exposures are residuals from this bottom-up stock selection process and are not explicit management decisions. Based on individual stock decisions, the Fund ended the period most overweight (i.e. the Fund’s sector position was greater than the benchmark position) the Health Care, Utilities, and Information Technology sectors and most underweight (i.e. the Fund’s sector position was less than the benchmark position) Consumer Staples, Energy, and Materials relative to the Fund’s benchmark.
Diversification by Industry
as of June 30, 2010
| Percentage of | ||||
| Industry (Sector) | Net Assets | |||
| Automobiles & Components (Consumer Discretionary) | 1.2 | % | ||
| Banks (Financials) | 4.3 | |||
| Capital Goods (Industrials) | 10.2 | |||
| Consumer Durables & Apparel (Consumer Discretionary) | 0.6 | |||
| Consumer Services (Consumer Discretionary) | 0.6 | |||
| Diversified Financials (Financials) | 4.0 | |||
| Energy (Energy) | 7.9 | |||
| Food & Staples Retailing (Consumer Staples) | 1.6 | |||
| Food, Beverage & Tobacco (Consumer Staples) | 6.8 | |||
| Health Care Equipment & Services (Health Care) | 6.5 | |||
| Insurance (Financials) | 4.7 | |||
| Materials (Materials) | 0.7 | |||
| Media (Consumer Discretionary) | 0.5 | |||
| Pharmaceuticals, Biotechnology & Life Sciences (Health Care) | 13.7 | |||
| Real Estate (Financials) | 1.0 | |||
| Retailing (Consumer Discretionary) | 6.7 | |||
| Semiconductors & Semiconductor Equipment (Information Technology) | 1.7 | |||
| Software & Services (Information Technology) | 11.4 | |||
| Technology Hardware & Equipment (Information Technology) | 6.2 | |||
| Telecommunication Services (Services) | 2.1 | |||
| Transportation (Industrials) | 0.4 | |||
| Utilities (Utilities) | 6.2 | |||
| Short-Term Investments | 0.5 | |||
| Other Assets and Liabilities | 0.5 | |||
| Total | 100.0 | % | ||
| Hartford Disciplined Equity HLS Fund |
June 30, 2010 (Unaudited)
| (000’s Omitted) |
| Shares or Principal Amount | Market Value ╪ | ||||||
| COMMON STOCKS - 99.0% | |||||||
| Automobiles & Components - 1.2% | |||||||
| 832 | Ford Motor Co. · | $ | 8,391 | ||||
| 156 | Johnson Controls, Inc. | 4,202 | |||||
| 12,593 | |||||||
| Banks - 4.3% | |||||||
| 287 | PNC Financial Services Group, Inc. | 16,216 | |||||
| 1,040 | Wells Fargo & Co. | 26,624 | |||||
| 42,840 | |||||||
| Capital Goods - 10.2% | |||||||
| 192 | 3M Co. | 15,174 | |||||
| 102 | Caterpillar, Inc. Θ | 6,115 | |||||
| 154 | Cooper Industries plc Class A | 6,780 | |||||
| 330 | Dover Corp. | 13,803 | |||||
| 262 | General Dynamics Corp. | 15,354 | |||||
| 242 | Northrop Grumman Corp. | �� | 13,191 | ||||
| 100 | Parker-Hannifin Corp. | 5,557 | |||||
| 55 | Precision Castparts Corp. Θ | 5,661 | |||||
| 77 | Raytheon Co. | 3,721 | |||||
| 264 | United Technologies Corp. | 17,110 | |||||
| 102,466 | |||||||
| Consumer Durables & Apparel - 0.6% | |||||||
| 259 | Mattel, Inc. | 5,474 | |||||
| Consumer Services - 0.6% | |||||||
| 70 | ITT Educational Services, Inc. ● | 5,787 | |||||
| Diversified Financials - 4.0% | |||||||
| 184 | Ameriprise Financial, Inc. | 6,648 | |||||
| 1,146 | Bank of America Corp. | 16,464 | |||||
| 136 | Goldman Sachs Group, Inc. | 17,879 | |||||
| 40,991 | |||||||
| Energy - 7.9% | |||||||
| 138 | Baker Hughes, Inc. Θ | 5,716 | |||||
| 140 | Chevron Corp. | 9,473 | |||||
| 221 | ConocoPhillips Holding Co. | 10,839 | |||||
| 85 | Exxon Mobil Corp. | 4,851 | |||||
| 231 | Hess Corp. | 11,629 | |||||
| 543 | Marathon Oil Corp. | 16,869 | |||||
| 215 | National Oilwell Varco, Inc. | 7,107 | |||||
| 168 | Occidental Petroleum Corp. | 12,923 | |||||
| 79,407 | |||||||
| Food & Staples Retailing - 1.6% | |||||||
| 159 | CVS/Caremark Corp. | 4,659 | |||||
| 404 | Sysco Corp. | 11,551 | |||||
| 16,210 | |||||||
| Food, Beverage & Tobacco - 6.8% | |||||||
| 931 | Altria Group, Inc. | 18,651 | |||||
| 207 | Archer Daniels Midland Co. | 5,347 | |||||
| 138 | Dr. Pepper Snapple Group | 5,175 | |||||
| 145 | Lorillard, Inc. | 10,459 | |||||
| 219 | PepsiCo, Inc. | 13,372 | |||||
| 346 | Philip Morris International, Inc. | 15,860 | |||||
| 68,864 | |||||||
| Health Care Equipment & Services - 6.5% | |||||||
| 247 | McKesson Corp. | 16,562 | |||||
| 345 | Medtronic, Inc. | 12,502 | |||||
| 402 | St. Jude Medical, Inc. ● | 14,498 | |||||
| 480 | UnitedHealth Group, Inc. | 13,621 | |||||
| 173 | Wellpoint, Inc. ● | 8,484 | |||||
| 65,667 | |||||||
| Insurance - 4.7% | |||||||
| 294 | Allied World Assurance Holdings Ltd. | 13,351 | |||||
| 249 | Axis Capital Holdings Ltd. | 7,412 | |||||
| 171 | Everest Re Group Ltd. | 12,100 | |||||
| 442 | Genworth Financial, Inc. ● | 5,772 | |||||
| 378 | Unum Group | 8,200 | |||||
| 46,835 | |||||||
| Materials - 0.7% | |||||||
| 126 | Freeport-McMoRan Copper & Gold, Inc. | 7,450 | |||||
| Media - 0.5% | |||||||
| 383 | CBS Corp. Class B Θ | 4,956 | |||||
| Pharmaceuticals, Biotechnology & Life Sciences - 13.7% | |||||||
| 257 | Abbott Laboratories | 12,041 | |||||
| 404 | Amgen, Inc. ● | 21,271 | |||||
| 598 | Eli Lilly & Co. | 20,036 | |||||
| 322 | Forest Laboratories, Inc. ● | 8,827 | |||||
| 339 | Gilead Sciences, Inc. ● | 11,618 | |||||
| 182 | Johnson & Johnson | 10,720 | |||||
| 756 | Merck & Co., Inc. | 26,444 | |||||
| 1,143 | Pfizer, Inc. | 16,303 | |||||
| 240 | Watson Pharmaceuticals, Inc. ● | 9,741 | |||||
| 137,001 | |||||||
| Real Estate - 1.0% | |||||||
| 587 | Annaly Capital Management, Inc. | 10,071 | |||||
| Retailing - 6.7% | |||||||
| 221 | Big Lots, Inc. ● | 7,105 | |||||
| 812 | Gap, Inc. | 15,798 | |||||
| 151 | Kohl's Corp. ● | 7,149 | |||||
| 36 | Netflix, Inc. ● | 3,868 | |||||
| 235 | Nordstrom, Inc. | 7,558 | |||||
| 1,064 | Office Depot, Inc. ●Θ | 4,298 | |||||
| 31 | Priceline.com, Inc. ● | 5,384 | |||||
| 107 | Target Corp. | 5,256 | |||||
| 268 | TJX Cos., Inc. | 11,255 | |||||
| 67,671 | |||||||
| Semiconductors & Semiconductor Equipment - 1.7% | |||||||
| 715 | Texas Instruments, Inc. | 16,648 | |||||
| Software & Services - 11.4% | |||||||
| 289 | Accenture plc | 11,185 | |||||
| 244 | BMC Software, Inc. ● | 8,457 | |||||
| 597 | eBay, Inc. ●Θ | 11,703 | |||||
| 30 | Google, Inc. ● | 13,304 | |||||
| 137 | IBM Corp. | 16,892 | |||||
| 22 | Mastercard, Inc. | 4,450 | |||||
| 1,078 | Microsoft Corp. | 24,814 | |||||
| 815 | Oracle Corp. | 17,483 | |||||
| 288 | VeriSign, Inc. ●Θ | 7,633 | |||||
| 115,921 | |||||||
| Technology Hardware & Equipment - 6.2% | |||||||
| 144 | Apple, Inc. ● | 36,120 | |||||
| 546 | Cisco Systems, Inc. ● | 11,635 | |||||
| 616 | Dell, Inc. ● | 7,424 | |||||
The accompanying notes are an integral part of these financial statements.
Shares or Principal Amount | Market Value ╪ | ||||||||
| COMMON STOCKS - 99.0% - (continued) | |||||||||
| Technology Hardware & Equipment - 6.2% - (continued) | |||||||||
| 157 | Hewlett-Packard Co. | $ | 6,773 | ||||||
| 61,952 | |||||||||
| Telecommunication Services - 2.1% | |||||||||
| 881 | AT&T, Inc. | 21,322 | |||||||
| Transportation - 0.4% | |||||||||
| 341 | Delta Air Lines, Inc. ●Θ | 4,002 | |||||||
| Utilities - 6.2% | |||||||||
| 248 | Entergy Corp. | 17,754 | |||||||
| 120 | NextEra Energy, Inc. | 5,827 | |||||||
| 281 | PG&E Corp. | 11,541 | |||||||
| 627 | UGI Corp. | 15,941 | |||||||
| 564 | Xcel Energy, Inc. | 11,614 | |||||||
| 62,677 | |||||||||
| Total common stocks | |||||||||
| (cost $1,011,661) | $ | 996,805 | |||||||
| Total long-term investments | |||||||||
| (cost $1,011,661) | $ | 996,805 | |||||||
| SHORT-TERM INVESTMENTS - 0.5% | |||||||||
| Repurchase Agreements - 0.5% | |||||||||
| Bank of America TriParty Joint Repurchase | |||||||||
| Agreement (maturing on 07/01/2010 in the | |||||||||
| amount of $1,550, collateralized by | |||||||||
| FHLMC 5.50%, 2039, FNMA 4.50% - | |||||||||
| 5.50%, 2038 - 2040, GNMA 5.00%, 2040, | |||||||||
| value of $1,581) | |||||||||
| $ | 1,550 | 0.05%, 6/30/2010 | $ | 1,550 | |||||
| BNP Paribas Securities Corp. TriParty Joint | |||||||||
| Repurchase Agreement (maturing on | |||||||||
| 07/01/2010 in the amount of $266, | |||||||||
| collateralized by FNMA 4.50% - 6.50%, | |||||||||
| 2024 - 2040, GNMA 5.00% - 6.50%, 2038 | |||||||||
| - 2040, value of $271) | |||||||||
| 266 | 0.04%, 6/30/2010 | 266 | |||||||
| Deutsche Bank Securities TriParty Joint | |||||||||
| Repurchase Agreement (maturing on | |||||||||
| 07/01/2010 in the amount of $1,174, | |||||||||
| collateralized by GNMA 3.13% - 7.00%, | |||||||||
| 2023 - 2052, value of $1,197) | |||||||||
| 1,174 | 0.05%, 6/30/2010 | 1,174 | |||||||
| JP Morgan Chase TriParty Joint Repurchase | |||||||||
| Agreement (maturing on 07/01/2010 in the | |||||||||
| amount of $266, collateralized by FHLMC | |||||||||
| 2.38% - 5.83%, 2033 - 2038, value of | |||||||||
$271) | |||||||||
| 266 | 0.06%, 6/30/2010 | 266 | |||||||
Morgan Stanley & Co., Inc. TriParty Joint Repurchase Agreement (maturing on | |||||||||
| 07/01/2010 in the amount of $1,158, | |||||||||
| collateralized by FHLMC 5.00% - 5.50%, | |||||||||
| 2038 - 2039, FNMA 5.00%, 2039, value of | |||||||||
$1,185) | |||||||||
| 1,158 | 0.03%, 6/30/2010 | 1,158 | |||||||
| 13 | UBS Securities, Inc. Repurchase Agreement (maturing on 07/01/2010 in the amount of $14, collateralized by U.S. Treasury Bill 0.88%, 2011, value of $14) 0.02%, 6/30/2010 | 13 | |||||||
UBS Securities, Inc. TriParty Joint Repurchase Agreement (maturing on 07/01/2010 in the amount of $293, collateralized by FNMA 5.00% - 6.00%, 2033 - 2036, value of $299) | |||||||||
| 293 | 0.09%, 6/30/2010 | 293 | |||||||
| 4,720 | |||||||||
| Total short-term investments | |||||||||
| (cost $4,720) | $ | 4,720 | |||||||
| Total investments | |||||||||
| (cost $1,016,381) ▲ | 99.5 | % | $ | 1,001,525 | |||||
| Other assets and liabilities | 0.5 | % | 5,088 | ||||||
Total net assets | 100.0 | % | $ | 1,006,613 | |||||
| Note: | Percentage of investments as shown is the ratio of the total market value to total net assets. |
| ▲ | At June 30, 2010, the cost of securities for federal income tax purposes was $1,016,461 and the aggregate gross unrealized appreciation and depreciation based on that cost were: |
| Unrealized Appreciation | $ | 94,315 | ||
| Unrealized Depreciation | (109,251 | ) | ||
| Net Unrealized Depreciation | $ | (14,936 | ) |
| ● | Currently non-income producing. |
The accompanying notes are an integral part of these financial statements.
| Hartford Disciplined Equity HLS Fund |
Schedule of Investments – (continued)
June 30, 2010 (Unaudited)
| (000’s Omitted) |
| Θ | At June 30, 2010, these securities were designated to cover open call options written as follows: |
| Issuer/ Exercise | Unrealized | |||||||||||||||
| Price/ Expiration | Number of | Market | Premiums | Appreciation | ||||||||||||
| Date | Contracts* | Value ╪ | Received | (Depreciation) | ||||||||||||
| Baker Hughes, Inc., | ||||||||||||||||
| $49.00, Aug, | ||||||||||||||||
| 2010 | 50 | $ | 4 | $ | 4 | $ | – | |||||||||
| Caterpillar, Inc., | ||||||||||||||||
| $70.00, Aug, | ||||||||||||||||
| 2010 | 165 | 12 | 15 | 3 | ||||||||||||
| CBS Corp., $15.00, | ||||||||||||||||
| Aug, 2010 | 763 | 23 | 23 | – | ||||||||||||
| Delta Air Lines, | ||||||||||||||||
| Inc., $15.00, | ||||||||||||||||
| Jul, 2010 | 781 | – | 18 | 18 | ||||||||||||
| eBay, Inc., $23.00, | ||||||||||||||||
| Aug, 2010 | 763 | 17 | 18 | 1 | ||||||||||||
| Office Depot, Inc., | ||||||||||||||||
| $6.00, Jul, | ||||||||||||||||
| 2010 | 1,000 | – | 10 | 10 | ||||||||||||
| Precision Castparts | ||||||||||||||||
| Corp., | ||||||||||||||||
| $120.00, Jul, | ||||||||||||||||
| 2010 | 134 | – | 15 | 15 | ||||||||||||
| VeriSign, Inc., | ||||||||||||||||
| $31.00, Jul, | ||||||||||||||||
| 2010 | 367 | – | 13 | 13 | ||||||||||||
| $ | 56 | $ | 116 | $ | 60 | |||||||||||
* The number of contracts does not omit 000's.
At June 30, 2010, the maximum delivery obligation of the open put options written is $6,160. Cash of $2,844 collateralized the open put options written as follows:
| Unrealized | ||||||||||||||||
| Issuer/ Exercise Price/ | Number of | Market | Premiums | Appreciation | ||||||||||||
| Expiration Date | Contracts* | Value ╪ | Received | (Depreciation) | ||||||||||||
| Big Lots, Inc., $27.50, | ||||||||||||||||
| Aug, 2010 | 3 | $ | – | $ | – | $ | – | |||||||||
| Ford Motor Co., $8.00, | ||||||||||||||||
| Aug, 2010 | 973 | 19 | 19 | – | ||||||||||||
| Freeport-McMoRan | ||||||||||||||||
| Copper & Gold, | ||||||||||||||||
| Inc., $47.50, Aug, | ||||||||||||||||
| 2010 | 167 | 18 | 18 | – | ||||||||||||
| Goldman Sachs Group, | ||||||||||||||||
| Inc., $125.00, Jul, | ||||||||||||||||
| 2010 | 75 | 16 | 23 | 7 | ||||||||||||
| ITT Educational | ||||||||||||||||
| Services, Inc., | ||||||||||||||||
| $85.00, Jul, 2010 | 98 | 45 | 31 | (14 | ) | |||||||||||
| Mastercard, Inc., | ||||||||||||||||
| $170.00, Aug, | ||||||||||||||||
| 2010 | 50 | 19 | 18 | (1 | ) | |||||||||||
| National Oilwell Varco, | ||||||||||||||||
| Inc., $34.00, Jul, | ||||||||||||||||
| 2010 | 288 | 56 | 14 | (42 | ) | |||||||||||
| PNC Financial Services | ||||||||||||||||
| Group, Inc., | ||||||||||||||||
| $57.00, Jul, 2010 | 172 | 45 | 10 | (35 | ) | |||||||||||
| $ | 218 | $ | 133 | $ | (85 | ) | ||||||||||
* The number of contracts does not omit 000's.
Futures Contracts Outstanding at June 30, 2010
| Unrealized | |||||||||||
| Number of | Expiration | Appreciation/ | |||||||||
| Description | Contracts* | Position | Month | (Depreciation) | |||||||
| S&P Mini | 97 | Long | Sep 2010 | $ | (137 | ) | |||||
* The number of contracts does not omit 000's.
Cash of $437 was pledged as initial margin deposit for open futures contracts at June 30, 2010.
| ╪ | See Significant Accounting Policies of accompanying Notes to Financial Statements regarding valuation of securities. |
The accompanying notes are an integral part of these financial statements.
| Hartford Disciplined Equity HLS Fund |
June 30, 2010 (Unaudited)
| (000’s Omitted) |
| Total | Level 1♦ | Level 2♦ | Level 3 | |||||||||||||
| Assets: | ||||||||||||||||
| Common Stocks ‡ | $ | 996,805 | $ | 996,805 | $ | – | $ | – | ||||||||
| Short-Term Investments | 4,720 | – | 4,720 | – | ||||||||||||
| Total | $ | 1,001,525 | $ | 996,805 | $ | 4,720 | $ | – | ||||||||
| Written Options * | 67 | 67 | – | – | ||||||||||||
| Total | $ | 67 | $ | 67 | $ | – | $ | – | ||||||||
| Liabilities: | ||||||||||||||||
| Futures * | 137 | 137 | – | – | ||||||||||||
| Written Options * | 92 | 92 | – | – | ||||||||||||
| Total | $ | 229 | $ | 229 | $ | – | $ | – | ||||||||
♦ | For the period ended June 30, 2010, there were no significant transfers between Level 1 and Level 2. |
| ‡ | The Fund has all or primarily all of these equity securities categorized in a single level. Refer to the Schedule of Investments for further industry breakout. |
* | Derivative instruments not reflected in the Schedule of Investments are valued at the unrealized appreciation/depreciation on the investments. |
The accompanying notes are an integral part of these financial statements.
| Hartford Disciplined Equity HLS Fund |
June 30, 2010 (Unaudited)
| (000’s Omitted) |
| Assets: | ||||
| Investments in securities, at market value (cost $1,016,381) | $ | 1,001,525 | ||
| Cash | 3,281 | *,† | ||
| Receivables: | ||||
| Investment securities sold | 11,423 | |||
| Fund shares sold | 64 | |||
| Dividends and interest | 2,127 | |||
| Other assets | 1 | |||
| Total assets | 1,018,421 | |||
| Liabilities: | ||||
| Payables: | ||||
| Investment securities purchased | 10,709 | |||
| Fund shares redeemed | 515 | |||
| Variation margin | 42 | |||
| Investment management fees | 163 | |||
| Distribution fees | 8 | |||
| Accrued expenses | 97 | |||
| Written options (proceeds $249) | 274 | |||
| Total liabilities | 11,808 | |||
| Net assets | $ | 1,006,613 | ||
| Summary of Net Assets: | ||||
| Capital stock and paid-in-capital | $ | 1,337,908 | ||
| Accumulated undistributed net investment income | 8,487 | |||
| Accumulated net realized loss on investments | (324,764 | ) | ||
| Unrealized depreciation of investments | (15,018 | ) | ||
| Net assets | $ | 1,006,613 | ||
| Shares authorized | 3,500,000 | |||
| Par value | $ | 0.001 | ||
Class IA: Net asset value per share | $ | 9.65 | ||
| Shares outstanding | 89,728 | |||
| Net assets | $ | 866,023 | ||
Class IB: Net asset value per share | $ | 9.59 | ||
| Shares outstanding | 14,658 | |||
| Net assets | $ | 140,590 | ||
* Cash of $2,844 is pledged as collateral for open put options.
† Cash of $437 is pledged as collateral for open futures contracts.
The accompanying notes are an integral part of these financial statements.
| Hartford Disciplined Equity HLS Fund |
For the Six-Month Period Ended June 30, 2010 (Unaudited)
| (000’s Omitted) |
| Investment Income: | ||||
| Dividends | $ | 11,327 | ||
| Interest | 9 | |||
| Total investment income, net | 11,336 | |||
| Expenses: | ||||
| Investment management fees | 3,604 | |||
| Administrative service fees | 372 | |||
| Distribution fees - Class IB | 203 | |||
| Custodian fees | 4 | |||
| Accounting services fees | 68 | |||
| Board of Directors' fees | 15 | |||
| Audit fees | 13 | |||
| Other expenses | 166 | |||
| Total expenses (before fees paid indirectly) | 4,445 | |||
| Commission recapture | (13 | ) | ||
| Custodian fee offset | — | |||
| Total fees paid indirectly | (13 | ) | ||
| Total expenses, net | 4,432 | |||
| Net investment income | 6,904 | |||
| Net Realized Gain on Investments and Other Financial Instruments: | ||||
| Net realized gain on investments | 9,713 | |||
| Net realized gain on futures | 135 | |||
| Net realized gain on written options | 401 | |||
| Net Realized Gain on Investments and Other Financial Instruments | 10,249 | |||
| Net Changes in Unrealized Depreciation of Investments and Other Financial Instruments: | ||||
| Net unrealized depreciation of investments | (101,724 | ) | ||
| Net unrealized depreciation of futures | (219 | ) | ||
| Net unrealized depreciation of written options | (107 | ) | ||
| Net Changes in Unrealized Depreciation of Investments and Other Financial Instruments | (102,050 | ) | ||
| Net Loss on Investments and Other Financial Instruments | (91,801 | ) | ||
| Net Decrease in Net Assets Resulting from Operations | $ | (84,897 | ) | |
The accompanying notes are an integral part of these financial statements.
| Hartford Disciplined Equity HLS Fund |
| (000’s Omitted) |
| For the | ||||||||
| Six-Month | For the | |||||||
| Period Ended | Year Ended | |||||||
| June 30, 2010 | December 31, | |||||||
| (Unaudited) | 2009 | |||||||
| Operations: | ||||||||
| Net investment income | $ | 6,904 | $ | 16,005 | ||||
| Net realized gain (loss) on investments and other financial instruments | 10,249 | (114,315 | ) | |||||
| Net unrealized appreciation (depreciation) of investments and other financial instruments | (102,050 | ) | 343,163 | |||||
| Payment from affiliate | — | 76 | ||||||
| Net increase (decrease) in net assets resulting from operations | (84,897 | ) | 244,929 | |||||
| Distributions to Shareholders: | ||||||||
| From net investment income | ||||||||
| Class IA | — | (14,011 | ) | |||||
| Class IB | — | (2,043 | ) | |||||
| Total distributions | — | (16,054 | ) | |||||
| Capital Share Transactions: | ||||||||
| Class IA | ||||||||
| Sold | 23,933 | 72,631 | ||||||
| Issued on reinvestment of distributions | — | 14,011 | ||||||
| Redeemed | (93,899 | ) | (141,168 | ) | ||||
| Total capital share transactions | (69,966 | ) | (54,526 | ) | ||||
| Class IB | ||||||||
| Sold | 5,467 | 10,251 | ||||||
| Issued on reinvestment of distributions | — | 2,043 | ||||||
| Redeemed | (25,929 | ) | (39,352 | ) | ||||
| Total capital share transactions | (20,462 | ) | (27,058 | ) | ||||
| Net decrease from capital share transactions | (90,428 | ) | (81,584 | ) | ||||
| Net increase (decrease) in net assets | (175,325 | ) | 147,291 | |||||
| Net Assets: | ||||||||
| Beginning of period | 1,181,938 | 1,034,647 | ||||||
| End of period | $ | 1,006,613 | $ | 1,181,938 | ||||
| Accumulated undistributed (distribution in excess of) net investment income | $ | 8,487 | $ | 1,583 | ||||
| Shares: | ||||||||
| Class IA | ||||||||
| Sold | 2,249 | 8,156 | ||||||
| Issued on reinvestment of distributions | — | 1,368 | ||||||
| Redeemed | (8,843 | ) | (15,951 | ) | ||||
| Total share activity | (6,594 | ) | (6,427 | ) | ||||
| Class IB | ||||||||
| Sold | 513 | 1,172 | ||||||
| Issued on reinvestment of distributions | — | 201 | ||||||
| Redeemed | (2,462 | ) | (4,475 | ) | ||||
| Total share activity | (1,949 | ) | (3,102 | ) | ||||
The accompanying notes are an integral part of these financial statements.
| Hartford Disciplined Equity HLS Fund |
June 30, 2010 (Unaudited)
| (000’s Omitted) |
1. Organization:
Hartford Disciplined Equity HLS Fund (the "Fund") serves as an underlying investment option for certain variable annuity and variable life insurance separate accounts of Hartford Life Insurance Company (“HLIC”) and its affiliates and certain qualified retirement plans. The Fund may also serve as an underlying investment option for certain variable annuity and variable life separate accounts of other insurance companies. Owners of variable annuity contracts and policyholders of variable life insurance contracts may choose the funds permitted in the variable insurance contract prospectus. In addition, participants in certain qualified retirement plans may choose the fund if permitted by their plans.
Hartford Series Fund, Inc. (the “Company”) is an open-end registered management investment company comprised of twenty-nine portfolios, one portfolio of which is included in these financial statements.
The Company is organized under the laws of the State of Maryland and is registered with the Securities and Exchange Commission (“SEC”) under the Investment Company Act of 1940, as amended (“1940 Act”). The Fund is organized as a diversified open-end management investment company.
The Fund is divided into Class IA and Class IB shares. Each class is offered at the per share net asset value (“NAV”) without a sales charge and is subject to the same expenses, except that the Class IB shares are subject to distribution and service fees charged pursuant to a Distribution and Service Plan adopted in accordance with Rule 12b-1 under the 1940 Act.
2. Significant Accounting Policies:
The following is a summary of significant accounting policies of the Fund, which are in accordance with U.S. Generally Accepted Accounting Principles (“GAAP”).
| a) | Security Transactions and Investment Income – Security transactions are recorded on the trade date (the date the order to buy or sell is executed). Security gains and losses are determined on the basis of identified cost. |
Dividend income is accrued as of the ex-dividend date, except that certain dividends for foreign securities where the ex-dividend date may have passed are recorded as soon as the Fund is informed of the dividend in the exercise of reasonable diligence. Interest income, including amortization of premium and accretion of discounts, is accrued on a daily basis.
| b) | Security Valuation – The Fund generally uses market prices in valuing portfolio securities. If market prices are not readily available or are deemed unreliable, the Fund will use the fair value of the security as determined in good faith under policies and procedures established by and under the supervision of the Fund’s Board of Directors. Market prices may be deemed unreliable, for example, if a security is thinly traded or if an event has occurred after the close of the security’s primary market, but before the close of the New York Stock Exchange (the “Exchange”) (generally 4:00 p.m. Eastern Time, referred to as the “Valuation Time”) that is expected to affect the value of the portfolio security. The circumstances in which the Fund may use fair value pricing include, among others: (i) the occurrence of events that are significant to a particular issuer, such as mergers, restructuring or defaults; (ii) the occurrence of events that are significant to an entire market, such as natural disasters in a particular region or governmental actions; (iii) trading restrictions on securities; (iv) thinly traded securities and (v) market events such as trading halts and early market closings. In addition, with respect to the valuation of stocks primarily traded on foreign markets, the Fund uses a fair value pricing service approved by the Fund’s Board of Directors, which employs quantitative models that evaluate changes in the value of foreign market proxies (e.g., futures contracts, American Depositary Receipts (“ADRs”), exchange traded funds (“ETFs”)) after the close of the foreign markets but before the Valuation Time. Securities that are primarily traded on foreign markets may trade on days that are not business days of the Fund. The value of the foreign securities in which the Fund invests may change on days when a shareholder will not be able to purchase or redeem shares of the Fund. Fair value pricing is subjective in nature and the use of fair value pricing by the Fund may cause the NAV of its shares to differ significantly from the NAV that would have been calculated using market prices at the close of the exchange on which a portfolio security is primarily traded but before the Valuation Time. There can be no |
| Hartford Disciplined Equity HLS Fund |
Notes to Financial Statements – (continued)
June 30, 2010 (Unaudited)
| (000’s Omitted) |
assurance that the Fund could obtain the fair value assigned to a security if the Fund were to sell the security at approximately the time at which the Fund determines its NAV.
Exchange-traded equity securities are valued at the last reported sale price or official close price on the exchange or market on which the security is primarily traded (the “Primary Market”) at the Valuation Time. If the security did not trade on the Primary Market, it may be valued at the Valuation Time at the last reported sale price on another exchange where it trades. The value of an equity security not traded on any exchange but traded on the Nasdaq Stock Market, Inc. or another over-the-counter market shall be valued at the last reported sale price or official closing price on the exchange or market on which the security is traded as of the Valuation Time.
Options contracts on securities, currencies, indices, futures contracts, commodities and other instruments shall be valued at their last reported sale price at the Valuation Time on the Primary Market on which the instrument is traded. If the instrument did not trade on the Primary Market, it may be valued at the most recent sale price at the Valuation Time on another exchange or market where it did trade. If it is not possible to determine the last reported sale price on the Primary Market or another exchange or market at the Valuation Time, the value of the security shall be taken to be the most recent mean between bid and asked prices on such exchange or market at the Valuation Time. Absent both bid and asked prices on such exchange, the bid price may be used.
Financial instruments for which prices are not available from an independent pricing service may be valued using market quotations obtained from one or more dealers that make markets in securities in accordance with procedures established by the Fund’s Board of Directors.
Futures contracts are valued at the most recent settlement price reported by an exchange on which, over time, they are traded most extensively. If a settlement price is not available, futures contracts will be valued at the most recent trade price as of the Valuation Time. If there were no trades, the contract shall be valued at the mean of the closing bid and asked prices as of the Valuation Time.
Other derivative or contractual type instruments shall be valued using market prices if such instruments trade on an exchange or market. If such instruments do not trade on an exchange or market, such instruments shall be valued at a price at which the counterparty to such contract would repurchase the instrument. In the event that the counterparty cannot provide a price, such valuation may be determined in accordance with procedures established by the Fund’s Board of Directors.
Various inputs are used in determining the value of the Fund’s investments. These inputs are summarized into three broad hierarchy levels. This hierarchy is based on whether the valuation inputs are observable or unobservable. These levels are:
| · | Level 1 – Quoted prices in active markets for identical securities. Level 1 may include exchange-traded instruments such as domestic equities, some foreign equities, options, futures, mutual funds, ETFs, and rights and warrants. |
| · | Level 2 – Observable inputs other than Level 1 prices, such as quoted prices for similar securities; quoted prices in markets that are not active; or other inputs that are observable or can be corroborated by observable market data. Level 2 may include debt securities that are traded less frequently than exchange-traded instruments and which are valued using third party pricing services. Prices for most level 2 securities are based on prices received from an independent pricing service. The following asset classes generally use valuation techniques and inputs as noted below: |
Asset Backed Securities and Collateralized Mortgage Obligations – Multi-dimensional spread/prepayment speed tables, with consideration of yield or price of bonds of comparable quality, coupon and maturity, attributes of the collateral, new issue data and monthly payment information.
Corporate Bonds – Multi-dimensional relational model based on observable market information such as yields, spreads, sector analysis, etc.
Foreign Currency – Based on rates determined at the close of the Exchange, provided by an independent pricing service.
Forward Currency Contracts – Valued based on the price of the underlying currency at the prevailing interpolated exchange rate, which is a combination of the spot currency rate and the forward currency rate, provided by an independent pricing service.
Foreign Equities – Certain foreign equities are priced using a multi-factor regression model with market observable inputs of a correlative nature (ADRs, futures contracts, ETFs, and currency exchange rates).
International Fixed Income – Multi-dimensional relational model based on observable market information such as benchmark yields, reported trades, bids and offers.
Money Market Instruments – Amortized cost.
Mortgage Backed Securities (“MBS”) – Matrix pricing using inputs of To-Be-Announced (“TBA”) prices, new issue data and monthly payment information, with consideration of yield or price of bonds of comparable quality, coupon and maturity, and attributes of the collateral.
Municipal Bonds – Multi-dimensional relational model and series of matrices based on observable market information such as Municipal Securities Rulemaking Board reported trades, comparable bonds, yields, spreads and credit analysis.
Preferred Stocks – Close mean of bid/ask or bid.
Repurchase Agreements – Priced at par.
Senior Floating Rate Interests – Composite of quotes from one or more contributing dealers.
Swaps – Price based upon observable market information from an independent pricing service.
U.S. Government Securities – Treasuries exclusively traded in the secondary market.
· | Level 3 – Significant unobservable inputs that are supported by limited or no market activity. Level 3 may include financial instruments whose values are determined using broker quotes or require significant management judgment or estimation. While these securities are priced using unobservable inputs, the valuation of these securities reflects the best available data and management believes the prices are a reasonable representation of exit price. The following asset classes generally use valuation techniques and inputs as noted below: |
Asset Backed Securities & Commercial Mortgage Backed Securities – Certain other MBS with limited liquidity priced from an independent pricing service.
Common Stocks – Trading has been halted or there are restrictions on trading. Valuation is based on last trade with the application of a discount or premium, if applicable.
Long Dated Over-the-Counter Options – Terms greater than 10 years from current date, expected volatility is not observable. Prices are from an independent pricing service.
| Hartford Disciplined Equity HLS Fund |
Notes to Financial Statements – (continued)
June 30, 2010 (Unaudited)
| (000’s Omitted) |
Long Term Debt Securities, including Senior Floating Rate Interests – Unobservable valuation inputs may include estimates for current yields, maturity/duration, prepayment speed, and broker quotes for comparable securities along with other assumptions relating to credit quality, collateral value, complexity of the security structure, general market conditions and liquidity.
Swaps – Terms greater than 10 years from current date, expected volatility is not observable. Prices are from an independent pricing service.
Individual securities within any of the above mentioned asset classes may be assigned a different hierarchical level than those that are presented above, as individual circumstances dictate.
During the six-month period ended June 30, 2010, the Fund held no Level 3 securities, therefore no reconciliation of Level 3 securities is presented.
Refer to the Investment Valuation Hierarchy Level Summary found following the Schedule of Investments.
| c) | Joint Trading Account – Pursuant to an exemptive order issued by the SEC, the Fund may transfer uninvested cash balances into a joint trading account managed by Wellington Management Company, LLP (“Wellington Management”). |
These balances may be invested in one or more repurchase agreements and/or short-term money market instruments.
| d) | Repurchase Agreements – A repurchase agreement is an agreement by which a counterparty agrees to sell a security and agrees to repurchase the security sold at a mutually agreed upon time and price. At the time the Fund enters into a repurchase agreement, the value of the underlying collateral security(ies), including accrued interest, will be equal to or exceed the value of the repurchase agreement. To minimize counterparty risk, the securities that serve to collateralize the repurchase agreement are held by the Fund's custodian in book entry or physical form in the custodial account of the Fund or in a third party custodial account. Repurchase agreements are valued at cost plus accrued interest. The Fund, as shown on the Schedule of Investments, had outstanding repurchase agreements as of June 30, 2010. |
| e) | Fund Share Valuation and Dividend Distributions to Shareholders – Orders for the Fund’s shares are executed in accordance with the investment instructions of the contract holders or plan participants. The NAV of the Fund’s shares is determined as of the close of each business day of the Exchange. The NAV is determined separately for each class of the Fund by dividing the Fund’s net assets attributable to that class by the number of outstanding shares of the class. Orders for the purchase of the Fund’s shares received by an insurance company or plan prior to the close of the Exchange on any day on which the Exchange is open for business are priced at the NAV determined as of the close of the Exchange. Orders received by an insurance company or plan after the close of the Exchange, or on a day on which the Exchange and/or the Fund is not open for business, are priced at the next determined NAV. |
Dividends are declared pursuant to a policy adopted by the Fund’s Board of Directors based upon the investment performance of the Fund. The policy of the Fund is to pay dividends from net investment income and distribute realized capital gains, if any, at least once a year.
Distributions from net investment income, realized capital gains and capital are determined in accordance with federal income tax regulations, which may differ from U.S. GAAP with respect to character and timing. These differences may include but are not limited to losses deferred due to wash sale adjustments, foreign currency gains and losses, adjustments related to Passive Foreign Investment Companies (“PFICs”), Real Estate Investment Trusts (“REITs”), Regulated Investment Companies (“RICs”), certain derivatives and partnerships. Permanent book and federal income tax basis differences relating to shareholder distributions will result in reclassifications to certain of the Fund’s capital accounts (see Federal Income Taxes: Reclassification of Capital Accounts note).
| f) | Use of Estimates – The preparation of financial statements in conformity with U.S. GAAP requires management to make estimates and assumptions that affect the reported amounts of assets and liabilities as of the date of the financial |
statements and the reported amounts of income and expenses during the period. Operating results in the future could vary from the amounts derived from management’s estimates.
| g) | Additional Derivative Instrument(s) Information |
Derivative Instrument(s) as of June 30, 2010.
| Statement of Assets and Liabilities Location | ||||||||
| Risk Exposure Category | Asset Derivatives | Liability Derivatives | ||||||
| Equity contracts | Summary of Net Assets - Unrealized depreciation | 137 | ||||||
| Equity contracts | Written Options, Market Value | 274 | ||||||
The volume of derivatives that is presented in the Schedule of Investments is consistent with the derivative activity during the six-month period ended June 30, 2010.
Realized Gain/Loss and Change in Unrealized Appreciation (Depreciation) on Derivative Instruments for the six-month period ended June 30, 2010:
| Amount of Realized Gain or (Loss) on Derivatives Recognized in Income | ||||||||||||||||||||||||
| Forward | ||||||||||||||||||||||||
| Purchased | Currency | |||||||||||||||||||||||
Risk Exposure Category | Written Options | Options | Futures | Contracts | Swaps | Total | ||||||||||||||||||
| Equity contracts | $ | 401 | $ | — | $ | 135 | $ | — | $ | — | $ | 536 | ||||||||||||
| Total | $ | 401 | $ | — | $ | 135 | $ | — | $ | — | $ | 536 | ||||||||||||
| Change in Unrealized Appreciation or (Depreciation) on Derivatives Recognized in Income | ||||||||||||||||||||||||
| Forward | ||||||||||||||||||||||||
| Purchased | Currency | |||||||||||||||||||||||
Risk Exposure Category | Written Options | Options | Futures | Contracts | Swaps | Total | ||||||||||||||||||
| Equity contracts | (107 | ) | — | (219 | ) | — | — | $ | (326 | ) | ||||||||||||||
| Total | $ | (107 | ) | $ | — | $ | (219 | ) | $ | — | $ | — | $ | (326 | ) | |||||||||
| h) | Indemnifications – Under the Company’s organizational documents, the Company shall indemnify its officers and directors to the full extent required or permitted under Maryland General Corporation Law and the federal securities laws. In addition, the Company, on behalf of the Fund, may enter into contracts that contain a variety of indemnifications. The Company’s maximum exposure under these arrangements is unknown. However, the Company has not had prior claims or losses pursuant to these contracts and expects the risk of loss to be remote. |
3. Futures and Options:
The Fund is subject to equity price risk, interest rate risk and foreign currency exchange rate risk in the normal course of pursuing its investment objectives. The Fund may invest in futures and options contracts in order to gain exposure to or hedge against changes in the value of equities, interest rates or foreign currencies. A futures contract is an agreement between two parties to buy and sell an asset at a set price on a future date. When the Fund enters into such futures contracts, it is required to deposit with a futures commission merchant an amount of “initial margin” of cash, commercial paper or U.S. Treasury Bills. Subsequent payments, called variation margin, to and from the broker, are made on a daily basis as the price of the underlying asset fluctuates, making the long and short positions in the futures contract more or less valuable (i.e., mark-to-market), which results in an unrealized gain or loss to the Fund.
| Hartford Disciplined Equity HLS Fund |
Notes to Financial Statements – (continued)
June 30, 2010 (Unaudited)
(000’s Omitted)
At any time prior to the expiration of the futures contract, the Fund may close the position by taking an opposite position, which would effectively terminate the position in the futures contract. A final determination of variation margin is then made, additional cash is required to be paid by or released to the Fund and the Fund realizes a gain or loss.
The use of futures contracts involves elements of market risk, which may exceed the amounts recognized in the Statement of Assets and Liabilities. Changes in the value of the futures contracts may decrease the effectiveness of the Fund’s strategy and potentially result in loss. With futures, there is minimal counterparty risk to the Fund since futures are exchange traded through a clearing house. The clearing house requires sufficient collateral to cover margins. The Fund, as shown on the Schedule of Investments, had outstanding futures contracts as of June 30, 2010.
An option contract is a contract sold by one party to another party that offers the buyer the right, but not the obligation, to buy (call) or sell (put) a security or other financial asset at an agreed-upon price during a specific period of time or on a specific date. The premium paid by the Fund for the purchase of a call or put option is included in the Fund’s Statement of Assets and Liabilities as an investment and subsequently “marked-to-market” through net unrealized appreciation (depreciation) of options to reflect the current market value of the option as of the end of the reporting period.
The Fund may write (sell) covered options. “Covered” means that so long as the Fund is obligated as the writer of an option, it will own either the underlying securities or currency or an option to purchase the same underlying securities or currency having an expiration date of the covered option and an exercise price equal to or less than the exercise price of the covered option, or will pledge cash or other liquid securities having a value equal to or greater than the fluctuating market value of the option securities or currencies. The Fund receives a premium for writing a call or put option, which is recorded on the Fund’s Statement of Assets and Liabilities and subsequently “marked-to-market” through net unrealized appreciation (depreciation) of options. There is a risk of loss from a change in the value of such options, which may exceed the related premiums received. The maximum amount of loss with respect to the Fund’s written put option is the cost of buying the underlying security or currency. The maximum loss may be offset by proceeds received from selling the underlying securities or currency. The Fund had no outstanding purchased option contracts as of June 30, 2010. Transactions involving written option contracts for the Fund during the six-month period ended June 30, 2010, are summarized below:
| Options Contract Activity During the | ||||||||
| Six-Month Period Ended June 30, 2010 | ||||||||
| Call Options Written During the Period | Number of Contracts* | Premium Amounts | ||||||
| Beginning of the period | 676 | $ | 62 | |||||
| Written | 8,392 | 537 | ||||||
| Expired | (2,628 | ) | (226 | ) | ||||
| Closed | (1,100 | ) | (210 | ) | ||||
| Exercised | (1,317 | ) | (47 | ) | ||||
| End of Period | 4,023 | $ | 116 | |||||
| Put Options Written During the Period | Number of Contracts* | Premium Amounts | ||||||
| Beginning of the period | 754 | 77 | ||||||
| Written | 8,896 | 459 | ||||||
| Expired | (6,327 | ) | (256 | ) | ||||
| Closed | (1,497 | ) | (147 | ) | ||||
| Exercised | — | — | ||||||
| End of Period | 1,826 | 133 | ||||||
* The number of contracts does not omit 000's.
| 4. | Federal Income Taxes: |
| a) | Federal Income Taxes – For federal income tax purposes, the Fund intends to continue to qualify as a RIC under Subchapter M of the Internal Revenue Code (“IRC”) by distributing substantially all of its taxable net investment income and net realized capital gains to its shareholders and otherwise complying with the requirements of RICs. The Fund has distributed substantially all of its income and capital gains in prior years and intends to distribute substantially all of its income and capital gains prior to the next fiscal year end. Accordingly, no provision for federal income or excise taxes |
| has been made in the accompanying financial statements. Distributions from short-term capital gains are treated as ordinary income distributions for federal income tax purposes. |
| b) | Net Investment Income (Loss), Net Realized Gains (Losses) – Net investment income (loss) and net realized gains (losses) may differ for financial statement and tax purposes primarily because of losses deferred due to wash sale adjustments, foreign currency gains and losses, adjustments related to PFICs, REITs, RICs, certain derivatives and partnerships. The character of distributions made during the year from net investment income or net realized gains may differ from their ultimate characterization for federal income tax purposes. Also, due to the timing of dividend distributions, the fiscal year in which amounts are distributed may differ from the year that the income or realized gains (losses) were recorded by the Fund. |
| c) | Distributions and Components of Distributable Earnings – The tax character of distributions paid by the Fund for the periods indicated is as follows (as adjusted for dividends payable): |
| For the Year Ended | For the Year Ended | |||||||
| December 31, 2009 | December 31, 2008 | |||||||
| Ordinary Income | $ | 16,054 | $ | 34,131 | ||||
| Long-Term Capital Gains* | — | 127,447 | ||||||
| * | The Fund designates these distributions as long-term capital dividends pursuant to IRC code Sec. 852(b)(3)(C). |
As of December 31, 2009, the Fund’s components of distributable earnings (deficit) on a tax basis were as follows:
| Amount | ||||
| Undistributed Ordinary Income | $ | 1,583 | ||
| Accumulated Capital and Other Losses* | (334,851 | ) | ||
Unrealized Appreciation† | 86,870 | |||
| Total Accumulated Deficit | $ | (246,398 | ) | |
| * | The Fund has capital loss carryforwards that are identified in the Capital Loss Carryforward note that follows. |
| † | The difference between book-basis and tax-basis unrealized appreciation (depreciation) may be attributable to the losses deferred due to wash sale adjustments, foreign currency gains and losses, adjustments related to PFICs, REITs, RICs, certain derivatives and partnerships. |
| d) | Reclassification of Capital Accounts – The Fund may record reclassifications in its capital accounts. These reclassifications have no impact on the total net assets of the Fund. The reclassifications are a result of permanent differences between GAAP and tax accounting for such items as net operating losses that reduce distribution requirements. Adjustments are made to reflect the impact these items have on current and future distributions to shareholders. Therefore, the source of the Fund’s distributions may be shown in the accompanying Statement of Changes in Net Assets as from net investment income, from net realized gains on investments or from capital depending on the type of book and tax differences that exist. For the year ended December 31, 2009, the Fund recorded reclassifications to increase (decrease) the accounts listed below: |
| Amount | ||||
| Accumulated Undistributed Net Investment Income | $ | 2 | ||
| Accumulated Net Realized Gain (Loss) on Investments | 8,428 | |||
| Paid-in-Capital | (8,430 | ) | ||
| e) | Capital Loss Carryforward – At December 31, 2009 (tax-year-end), the Fund had capital loss carryforwards for U.S. federal income tax purposes of approximately: |
| Hartford Disciplined Equity HLS Fund |
Notes to Financial Statements – (continued)
June 30, 2010 (Unaudited)
(000’s Omitted)
| Year of Expiration | Amount | |||
| 2010 | $ | 758 | ||
| 2016 | 146,580 | |||
| 2017 | 187,513 | |||
| Total | $ | 334,851 | ||
As of December 31, 2009, the Fund had $8,430 in expired capital loss carryforwards.
| f) | Accounting for Uncertainty in Income Taxes – Management has evaluated all open tax years and has determined there is no impact to the Fund’s financial statements related to uncertain tax positions. Generally, tax authorities can examine all tax returns filed for the last three years. |
| 5. | Expenses: |
| a) | Investment Management Agreements – HL Investment Advisors, LLC (“HL Advisors”), an indirect wholly-owned subsidiary of The Hartford Financial Services Group, Inc. (“The Hartford”), serves as investment manager to the Fund pursuant to an Investment Management Agreement with the Company. As investment manager, HL Advisors has overall investment supervisory responsibility for the Fund. In addition, HL Advisors provides administrative personnel, services, equipment, facilities and office space for proper operation of the Fund. |
HL Advisors has contracted with Wellington Management for the provision of day-to-day investment management services to the Fund in accordance with the Fund’s investment objective and policies. The Fund pays a fee to HL Advisors, a portion of which may be used to compensate Wellington Management.
| b) | Administrative Services Agreement – For the two-month period January 1, 2010 through February 28, 2010, under the Administrative Services Agreement between HLIC and the Company, on behalf of the Fund, HLIC provided administrative services to the Fund and received monthly compensation at the annual rate of 0.20% of the Fund’s average daily net assets. The Fund assumed and paid certain other expenses (including, but not limited to, accounting, custodian, state taxes and Directors’ fees). Effective March 1, 2010, the Investment Management Agreement was amended to include the administrative services for the Fund and the separate administrative services agreement was terminated. |
The schedule below reflects the rates of compensation paid to HL Advisors for investment management services and to HLIC for administrative services rendered from January 1, 2010 through February 28, 2010, and the rates of compensation paid to the HL Advisors for the combined services from March 1, 2010 through June 30, 2010; the rates are accrued daily and paid monthly.
| Average Daily Net Assets | Annual Fee | |||
| On first $250 million | 0.7750 | % | ||
| On next $250 million | 0.7250 | % | ||
| On next $500 million | 0.6750 | % | ||
| On next $4 billion | 0.6250 | % | ||
| On next $5 billion | 0.6225 | % | ||
| Over $10 billion | 0.6200 | % | ||
| c) | Accounting Services Agreement – Pursuant to the Fund Accounting Agreement between HLIC and the Company, on behalf of the Fund, HLIC provides accounting services to the Fund and receives monthly compensation on the Fund’s average net assets. The Fund’s accounting services fees are accrued daily and paid monthly. |
| Average Daily Net Assets | Annual Fee | |||
| On first $5 billion | 0.012 | % | ||
| Over $5 billion | 0.010 | % | ||
| d) | Operating Expenses – Allocable expenses incurred by the Company are allocated to each Fund and allocated to classes within the Fund in proportion to the average daily net assets of the Fund and each class, except where allocation of certain expenses is more fairly made directly to the Fund or to specific classes within a Fund. |
| e) | Fees Paid Indirectly – The Company, on behalf of the Fund has entered into agreements with State Street Global Advisers, LLC and Russell Implementation Securities, Inc. to partially recapture non-discounted trade commissions. Such rebates are used to pay a portion of the Fund’s expenses. In addition, the Fund’s custodian bank has also agreed to reduce its fees when the Fund maintains cash on deposit in a non-interest-bearing custody account. For the six-month period ended June 30, 2010, these amounts are included in the Statement of Operations. |
The ratio of expenses to average net assets in the accompanying financial highlights excludes the reduction in expenses related to fees paid indirectly. Had the fees paid indirectly been included, the annualized expense ratio for the periods listed below would have been as follows:
| Annualized | ||||||||||||||||||||||||
| Six-Month | Year Ended | Year Ended | Year Ended | Year Ended | Year Ended | |||||||||||||||||||
| Period Ended | December 31, | December 31, | December 31, | December 31, | December 31, | |||||||||||||||||||
| June 30, 2010 | 2009 | 2008 | 2007 | 2006 | 2005 | |||||||||||||||||||
| Class IA | 0.75 | % | 0.75 | % | 0.71 | % | 0.70 | % | 0.71 | % | 0.72 | % | ||||||||||||
| Class IB | 1.00 | 1.00 | 0.96 | 0.95 | 0.96 | 0.97 | ||||||||||||||||||
| f) | Distribution Plan for Class IB shares – The Company, on behalf of the Fund, has adopted a Distribution Plan pursuant to Rule 12b-1 under the 1940 Act for the Class IB shares. Pursuant to the Distribution Plan, the Fund is authorized to compensate the Distributor, Hartford Securities Distribution Company, Inc. (a wholly owned, ultimate subsidiary of The Hartford), from assets attributable to the Class IB shares for services rendered and expenses borne in connection with activities primarily intended to result in the sale of the Class IB shares, subject to the Fund Board’s review and approval. |
| The Distribution Plan provides that the Fund may pay annually up to 0.25% of the average daily net assets of the Fund attributable to its Class IB shares for activities primarily intended to result in the sale of Class IB shares. The Board has the authority to suspend or reduce these payments at any point in time. Under the terms of the Distribution Plan and the principal underwriting agreement, the Fund is authorized to make payments monthly to the Distributor which may be used to pay or compensate entities providing distribution and shareholder servicing with respect to the Class IB shares for such entities’ fees or expenses incurred or paid in that regard. These fees are accrued daily and paid monthly. |
| g) | Other Related Party Transactions – Certain officers of the Fund are directors and/or officers of HL Advisors, and/or The Hartford or its subsidiaries. For the six-month period ended June 30, 2010, a portion of the Fund’s chief compliance officer’s salary was paid by all the investment companies in the Hartford fund complex. The portion allocated to the Fund was in the amount of $2. These fees are accrued daily and paid monthly. |
| Hartford Disciplined Equity HLS Fund |
Notes to Financial Statements – (continued)
June 30, 2010 (Unaudited)
(000’s Omitted)
| h) | Payment from Affiliate – In July of 2007, The Hartford entered into a settlement with the Attorneys General of the states of New York, Connecticut and Illinois relating to market timing and the company's individual variable annuity contracts in which certain payments would be made directly to the variable annuity contract holders. The distribution plan provides that unclaimed money from the settlement would be distributed to certain HLS Funds that are investment options through a Hartford individual variable annuity contract. The unclaimed money was distributed to the Fund on September 18, 2009, as follows: |
| Amount | ||||
| Reimbursement | $ | 76 | ||
On November 8, 2006, the SEC issued an order setting forth the terms of a settlement reached with three subsidiaries of The Hartford that resolves the SEC’s Division of Enforcement’s investigation of aspects of The Hartford’s variable annuity and mutual fund operations related to directed brokerage and revenue sharing. The Hartford settled this matter without admitting or denying the findings of the SEC.
The Fund is available for purchase by the separate accounts of different variable universal life policies, variable annuity products, and funding agreements and it is offered directly to certain qualified retirement plans (collectively “Products”). Although existing Products contain transfer restrictions, some Products, particularly older variable annuity products, do not contain restrictions on the frequency of transfers. In addition, as the result of the settlement of litigation against Hartford Life, Inc. (“Hartford Life”) (the issuers of such variable annuity products), the Fund’s ability to restrict transfers by certain owners of older variable annuity products was limited. During 2006, these annuity owners surrendered the older variable annuity contracts that were the subject of prior litigation. In February 2005, Hartford Life agreed with the Board of Directors of the Fund to indemnify the Fund for any material harm caused to the Fund from frequent trading by these contracts owners.
The total return in the accompanying financial highlights includes payment from affiliates. Had the payment from affiliates been excluded, the total return for the periods listed below would have been as follows:
| For the Year Ended December 31, 2009 | ||||||||
| Class IA | Class IB | |||||||
| Impact from Payment from Affiliate for Attorneys General Settlement | 0.01 | % | 0.01 | % | ||||
| Total Return Excluding Payments from Affiliate | 25.64 | 25.32 | ||||||
| For the Year Ended December 31, 2006 | ||||||||
| Class IA | Class IB | |||||||
| Impact from Payment from Affiliate for SEC Settlement | 0.03 | % | 0.03 | % | ||||
| Impact from Payment from Affiliate for Unrestricted Transfers | 0.01 | 0.01 | ||||||
| Total Return Excluding Payments from Affiliate | 12.41 | 12.13 | ||||||
| 6. | Investment Transactions: |
For the six-month period ended June 30, 2010, the cost of purchases and proceeds from sales of investment securities (excluding short-term investments) were as follows:
| Amount | ||||
| Cost of Purchases Excluding U.S. Government Obligations | $ | 228,026 | ||
| Sales Proceeds Excluding U.S. Government Obligations | 298,929 | |||
| 7. | Line of Credit: |
The Fund is one of several Hartford funds that participate in a $500 million committed revolving line of credit facility. The facility is to be used for temporary or emergency purposes. Under the arrangement, a fund is required to own securities having a market value in excess of 300% of the total bank borrowings. The interest rate on borrowings varies depending on the nature of the loan. The facility also requires a fee to be paid based on the amount of the commitment. This fee is allocated to all the funds participating in the line of credit based on the average net assets of the funds. During the six-month period ended June 30, 2010, the Fund did not have any borrowings under this facility.
| 8. | Industry Classifications: |
Other than the industry classifications “Other Investment Pools and Funds” and “Exchange Traded Funds”, equity industry classifications used in this report are the Global Industry Classification Standard, which was developed by and is the exclusive property and service mark of MSCI, Inc. and Standard & Poor’s.
| Hartford Disciplined Equity HLS Fund |
- Selected Per-Share Date (A) -
| Net Asset | Net Realized | Net Increase | ||||||||||||||||||||||||||||||||||||||||||
| Value at | Payments | and Unrealized | Total from | Dividends from | Distributions | (Decrease) in | Net Asset | |||||||||||||||||||||||||||||||||||||
| Beginning of | Net Investment | from (to) | Gain (Loss) on | Investment | Net Investment | from Realized | Distributions | Total | Net Asset | Value at End | ||||||||||||||||||||||||||||||||||
| Class | Period | Income (Loss) | Affiliate | Investments | Operations | Income | Capital Gains | from Capital | Distributions | Value | of Period | |||||||||||||||||||||||||||||||||
| For the Six-Month Period Ended June 30, 2010 (Unaudited) | ||||||||||||||||||||||||||||||||||||||||||||
| IA | $ | 10.47 | $ | 0.07 | $ | – | $ | (0.89 | ) | $ | (0.82 | ) | $ | – | $ | – | $ | – | $ | – | $ | (0.82 | ) | $ | 9.65 | |||||||||||||||||||
| IB | 10.42 | 0.06 | – | (0.89 | ) | (0.83 | ) | – | – | – | – | (0.83 | ) | 9.59 | ||||||||||||||||||||||||||||||
| For the Year Ended December 31, 2009 | ||||||||||||||||||||||||||||||||||||||||||||
| IA | 8.46 | 0.15 | – | 2.01 | 2.16 | (0.15 | ) | – | – | (0.15 | ) | 2.01 | 10.47 | |||||||||||||||||||||||||||||||
| IB | 8.41 | 0.13 | – | 2.00 | 2.13 | (0.12 | ) | – | – | (0.12 | ) | 2.01 | 10.42 | |||||||||||||||||||||||||||||||
| For the Year Ended December 31, 2008 | ||||||||||||||||||||||||||||||||||||||||||||
| IA | 15.05 | 0.14 | – | (5.37 | ) | (5.23 | ) | (0.14 | ) | (1.22 | ) | – | (1.36 | ) | (6.59 | ) | 8.46 | |||||||||||||||||||||||||||
| IB | 14.97 | 0.12 | – | (5.35 | ) | (5.23 | ) | (0.11 | ) | (1.22 | ) | – | (1.33 | ) | (6.56 | ) | 8.41 | |||||||||||||||||||||||||||
| For the Year Ended December 31, 2007 | ||||||||||||||||||||||||||||||||||||||||||||
| IA | 14.08 | 0.16 | – | 1.01 | 1.17 | (0.15 | ) | (0.05 | ) | – | (0.20 | ) | 0.97 | 15.05 | ||||||||||||||||||||||||||||||
| IB | 14.01 | 0.13 | – | 1.00 | 1.13 | (0.12 | ) | (0.05 | ) | – | (0.17 | ) | 0.96 | 14.97 | ||||||||||||||||||||||||||||||
| For the Year Ended December 31, 2006 | ||||||||||||||||||||||||||||||||||||||||||||
| IA | 12.66 | 0.14 | 0.01 | 1.42 | 1.57 | (0.15 | ) | – | – | (0.15 | ) | 1.42 | 14.08 | |||||||||||||||||||||||||||||||
| IB | 12.58 | 0.13 | 0.01 | 1.39 | 1.53 | (0.10 | ) | – | – | (0.10 | ) | 1.43 | 14.01 | |||||||||||||||||||||||||||||||
| For the Year Ended December 31, 2005 | ||||||||||||||||||||||||||||||||||||||||||||
| IA | 12.02 | 0.12 | – | 0.67 | 0.79 | (0.15 | ) | – | – | (0.15 | ) | 0.64 | 12.66 | |||||||||||||||||||||||||||||||
| IB | 11.93 | 0.08 | – | 0.68 | 0.76 | (0.11 | ) | – | – | (0.11 | ) | 0.65 | 12.58 | |||||||||||||||||||||||||||||||
| (A) | Information presented relates to a share outstanding throughout the indicated period. |
| (B) | The figures do not include sales charges or other fees which may be applied at the variable life insurance, variable annuity or qualified retirement plan product level. Any such additional sales charges or other fees would lower the Fund's performance. |
| (C) | Ratios do not reflect reductions for fees paid indirectly. Please see Fees Paid Indirectly in the Notes to Financial Statements. |
| (D) | Portfolio turnover rate is calculated on the basis of the Fund as a whole without distinguishing between the classes of shares issued. |
| (E) | Not annualized. |
| (F) | Annualized. |
| (G) | Total return without the inclusion of the Payment from (to) Affiliate can be found in Expenses in the accompanying Notes to Financial Statements. |
- Ratios and Supplemental Data -
Ratio of Expenses to Average Net | Ratio of Expenses to Average Net | Ratio of Net Investment Income | Portfolio Turnover | ||||||||||||||||||||
Total Return(B) | Net Assets at End of Period | Assets Before Waivers(C) | Assets After Waivers(C) | to Average Net Assets | Rate(D) | ||||||||||||||||||
| (7.85 | )%(E) | $ | 866,023 | 0.75 | %(F) | 0.75 | %(F) | 1.26 | %(F) | 21 | % | ||||||||||||
| (7.97 | )(E) | 140,590 | 1.00 | (F) | 1.00 | (F) | 1.00 | (F) | – | ||||||||||||||
| 25.65 | (G) | 1,008,875 | 0.75 | 0.75 | 1.56 | 59 | |||||||||||||||||
| 25.33 | (G) | 173,063 | 1.00 | 1.00 | 1.31 | – | |||||||||||||||||
| (37.27 | ) | 868,799 | 0.71 | 0.71 | 1.14 | 73 | |||||||||||||||||
| (37.43 | ) | 165,848 | 0.96 | 0.96 | 0.89 | – | |||||||||||||||||
| 8.34 | 1,566,652 | 0.70 | 0.70 | 1.04 | 75 | ||||||||||||||||||
| 8.07 | 339,877 | 0.95 | 0.95 | 0.79 | – | ||||||||||||||||||
| 12.45 | (G) | 1,401,619 | 0.72 | 0.72 | 1.19 | 63 | |||||||||||||||||
| 12.17 | (G) | 354,559 | 0.97 | 0.97 | 0.93 | – | |||||||||||||||||
| 6.58 | 1,019,703 | 0.74 | 0.74 | 1.07 | 58 | ||||||||||||||||||
| 6.31 | 340,108 | 0.99 | 0.99 | 0.82 | – | ||||||||||||||||||
| Hartford Disciplined Equity HLS Fund |
The Board of Directors appoints officers who are responsible for the day-to-day operations of the Fund and who execute policies formulated by the Directors. Each director serves until his or her death, resignation, or retirement or until the next annual meeting of shareholders is held or until his or her successor is elected and qualifies.
Directors and officers who are employed by or who have a financial interest in The Hartford are considered “interested” persons of the Fund pursuant to the Investment Company Act of 1940, as amended. Each officer and two of the Company’s directors, as noted in the chart below, are “interested” persons of the Fund. Each director serves as a director for The Hartford Mutual Funds, Inc., The Hartford Mutual Funds II, Inc., The Hartford Income Shares Fund, Inc., Hartford Series Fund, Inc., and Hartford HLS Series Fund II, Inc., which, as of June 30, 2010, collectively consist of 88 funds. Correspondence may be sent to directors and officers c/o Hartford Mutual Funds, P.O. Box 2999, Hartford, Connecticut 06104-2999, except that correspondence to Ms. Fagely may be sent to 500 Bielenberg Drive, Woodbury, Minnesota 55125.
The table below sets forth, for each director and officer, his or her name, year of birth, current position with the Company and date first elected or appointed to Hartford Series Fund, Inc. (“HSF”), and Hartford HLS Series Fund II, Inc. (“HSF2”), principal occupation, and, for directors, other directorships held. The Fund’s statement of additional information contains further information on the directors and is available free of charge by calling 1-800-862-6668 or writing to Hartford HLS Funds, c/o Individual Annuity Services, P.O. Box 5085, Hartford, CT 06102-5085.
Information on the aggregate remuneration paid to the directors of the Company can be found in the Statement of Operations herein. The Fund pays to The Hartford a portion of the chief compliance officer’s compensation, but does not pay salaries or compensation to any of their other officers or directors who are employed by The Hartford.
Non-Interested Directors
Lynn S. Birdsong (1946) Director since 2003, Co-Chairman of the Investment Committee
Mr. Birdsong is a private investor. Since 2003, Mr. Birdsong has been an independent director of The Japan Fund and has served as a Director of the Sovereign High Yield Fund since April 2010. From 2003 to March 2005, Mr. Birdsong was an independent director of the Atlantic Whitehall Funds. From 1979 to 2002, Mr. Birdsong was a managing director of Zurich Scudder Investments, an investment management firm. During his employment with Scudder, Mr. Birdsong was an interested director of The Japan Fund. Since 1981, Mr. Birdsong has been a partner in Birdsong Company, an advertising specialty firm.
Robert M. Gavin, Jr. (1940) Director since 2002 (HSF) and 1986 (HSF2), Chairman of the Board since 2004
Dr. Gavin is an educational consultant. Prior to September 1, 2001, he was President of Cranbrook Education Community and prior to July 1996, he was President of Macalester College, St. Paul, Minnesota.
Duane E. Hill (1945) Director since 2001 (HSF) and 2002 (HSF2), Chairman of the Nominating Committee
Mr. Hill is Partner of TSG Ventures L.P., a private equity investment company. Mr. Hill is a former partner of TSG Capital Group, a private equity investment firm that served as sponsor and lead investor in leveraged buyouts of middle market companies.
Sandra S. Jaffee (1941) Director since 2005
Ms. Jaffee served as Chairman (2008 to 2009) and Chief Executive Officer of Fortent (formerly Searchspace Group), a leading provider of compliance/regulatory technology to financial institutions from August 2005 to August 2009. From August 2004 to August 2005, Ms. Jaffee served as an Entrepreneur in Residence with Warburg Pincus, a private equity firm. From September 1995 to July 2004, Ms. Jaffee served as Executive Vice President at Citigroup, where she was President and Chief Executive Officer of Citibank’s Global Securities Services (1995 to 2003).
William P. Johnston (1944) Director since 2005, Chairman of the Compliance Committee
In June 2006, Mr. Johnston was appointed as Senior Advisor to The Carlyle Group, a global private equity investment firm. In July 2006, Mr. Johnston was elected to the Board of Directors of MultiPlan, Inc. In August 2007, Mr. Johnston was elected to the Board of Directors of LifeCare Holdings, Inc. In February 2008, Mr. Johnston was elected to the Board of Directors of HCR-ManorCare, Inc. In May 2006, Mr. Johnston was elected to the Supervisory Board of Fresenius Medical Care AG & Co. KGaA, after its acquisition of Renal Care Group, Inc. in March 2006. Mr. Johnston joined Renal Care Group in November 2002 as a member of the Board of Directors and served as Chairman of the Board from March 2003 through March 2006. From September 1987 to December 2002, Mr. Johnston was with Equitable Securities Corporation (and its successors, SunTrust Equitable Securities and SunTrust Robinson Humphrey) serving in various investment banking and managerial positions, including Managing Director and Head of Investment Banking, Chief Executive Officer and Vice Chairman.
Phillip O. Peterson (1944) Director since 2002 (HSF) and 2000 (HSF2), Chairman of the Audit Committee
Mr. Peterson is a mutual fund industry consultant. He was a partner of KPMG LLP (an accounting firm) until July 1999. Mr. Peterson joined William Blair Funds in February 2007 as a member of the Board of Trustees. From January 2004 to April 2005, Mr. Peterson served as Independent President of the Strong Mutual Funds.
Lemma W. Senbet (1946) Director since 2005
Dr. Senbet is the William E. Mayer Chair Professor of Finance and Director, Center for Financial Policy, at the University of Maryland, Robert H. Smith School of Business. He was chair of the Finance Department during 1998 to 2006. Previously he was a chaired professor of finance at the University of Wisconsin-Madison. Also, he was director of the Fortis Funds from March 2000 to July 2002. Dr. Senbet served the finance profession in various capacities, including as director of the American Finance Association and President of the Western Finance Association. In 2006, Dr. Senbet was inducted Fellow of Financial Management Association International for his career-long distinguished scholarship and professional service.
Interested Directors and Officers
Lowndes A. Smith (1939) Director since 1996 (HSF) and 2002 (HSF2), Co-Chairman of the Investment Committee
Mr. Smith served as Vice Chairman of The Hartford from February 1997 to January 2002, as President and Chief Executive Officer of Hartford Life, Inc. from February 1997 to January 2002, and as President and Chief Operating Officer of The Hartford Life Insurance Companies from January 1989 to January 2002. Mr. Smith serves as a Director of White Mountains Insurance Group, Ltd., One Beacon Insurance, Symetra Financial and as a Managing Director of Whittington Gray Associates.
John C. Walters 1, 2 (1962) Director since 2008
Mr. Walters currently serves as President, Chief Executive Officer and Director for Hartford Life, Inc. (“HL, Inc.”). Mr. Walters also serves as President, Chairman of the Board, Chief Executive Officer and Director for Hartford Life Insurance Company (“Hartford Life”), and as Executive Vice President of The Hartford. In addition, Mr. Walters is a Manager of HL Investment Advisors, LLC (“HL Advisors”). Mr. Walters previously served as President of the U.S. Wealth Management Division of HL, Inc. (2006-2007) and as Co-Chief Operating Officer of Hartford Life (2007-2008).
| 1 | Mr. Walters previously served as President and Chief Executive Officer (2007 to 2009). |
| 2 | Effective July 31, 2010, Mr. Walters retired from The Hartford. Mr. Walters resigned his position as a Director of the Fund effective July 30, 2010. |
Other Officers
Robert M. Arena, Jr. (1968) President and Chief Executive Officer since 2009 (served as Vice President of the Fund (2006-2009))
Mr. Arena serves as Executive Vice President of Hartford Life. Additionally, Mr. Arena is Senior Vice President and Director of Hartford Administrative Services Company, (“HASCO”), President, Chief Executive Officer and Manager of Hartford Investment Financial Services, LLC (“HIFSCO”) and President, Chief Executive Officer and Manager of HL Advisors. Mr. Arena joined The Hartford in 2004.
Tamara L. Fagely (1958) Vice President, Treasurer and Controller since 2002 (HSF) 1993 (HSF2)
Ms. Fagely has been a Vice President of HASCO since 1998 and Chief Financial Officer since 2006. Currently Ms. Fagely is a Vice President of Hartford Life. She served as Assistant Vice President of Hartford Life from December 2001 through March 2005. In addition, Ms. Fagely is Controller and Chief Financial Officer of HIFSCO.
Brian Ferrell (1962) AML Compliance Officer since 2008
Mr. Ferrell has served as Assistant Vice President and AML Compliance Officer for The Hartford since 2006, and as AML Compliance Officer for HASCO and Hartford Investor Services Company, LLC (“HISC”) since 2008. Prior to joining The Hartford in 2006, Mr. Ferrell held various positions at the U.S. Department of the Treasury (the “Treasury”) from 2001 to 2006, where he served as Chief Counsel for the Treasury’s Financial Crimes Enforcement Network from 2005-2006.
Dr. Robert J. Froehlich (1953) Senior Managing Director since 2009
Dr. Froehlich joined The Hartford as Senior Managing Director in September 2009. Prior to joining The Hartford, Dr. Froehlich served as Vice Chairman of Deutsche Asset Management from 1997-2009.
| Hartford Disciplined Equity HLS Fund |
Directors and Officers (Unaudited) – (continued)
Thomas D. Jones, III (1965) Vice President and Chief Compliance Officer since 2006
Mr. Jones serves as Chief Compliance Officer for the Hartford Mutual Funds and Vice President and Director of Securities Compliance for The Hartford. Mr. Jones joined The Hartford in 2006 from SEI Investments, where he served as Chief Compliance Officer for its mutual funds and investment advisers. Prior to joining SEI, Mr. Jones was First Vice President and Compliance Director for Merrill Lynch Investment Managers (Americas) (“MLIM”), where he worked from 1992-2004.
Edward P. Macdonald (1967) Vice President, Secretary and Chief Legal Officer since 2005
Mr. Macdonald serves as Assistant Vice President of Hartford Life and Chief Legal Officer and Vice President of HIFSCO. He also serves as Vice President and Secretary of HASCO, and Chief Legal Officer, Secretary and Vice President of HL Advisors. Mr. Macdonald joined The Hartford in 2005.
Vernon J. Meyer (1964) Vice President since 2006
Mr. Meyer serves as Senior Vice President of Hartford Life. He also serves as Senior Vice President of HIFSCO and HL Advisors. Mr. Meyer joined The Hartford in 2004.
D. Keith Sloane (1960) Vice President since 2009
Mr. Sloane is a Senior Vice President of Hartford Life. Additionally, Mr. Sloane currently serves as Senior Vice President of HIFSCO, HL Advisors, and HASCO. Prior to joining The Hartford in 2007, Mr. Sloane was Director of product marketing and led the mutual fund business for Wachovia Securities (“Wachovia”) in their investment products group. Mr. Sloane joined Wachovia in 1995.
Jane Wolak (1961) Vice President since 2009
Ms. Wolak currently serves as Vice President of Hartford Life. Ms. Wolak joined Hartford Life as Vice President, Retail Product Services in May 2007. She is also Vice President of HASCO. Previously, Ms. Wolak was with Sun Life Financial where she held the position of Vice President, Service Center Operations from 2001-2007.
A description of the policies and procedures that the Fund uses to determine how to vote proxies relating to portfolio securities and a record of how the Fund voted any proxies for the twelve-month period ended June 30, 2010 is available (1) without charge, upon request, by calling 800-862-6668 and (2) on the Securities and Exchange Commission’s website at http://www.sec.gov.
The Fund files a complete schedule of portfolio holdings with the Commission for the first and third quarters of each fiscal year on Form N-Q. The Fund’s Forms are available (1) without charge, upon request, by calling 800-862-6668 and (2) on the Securities and Exchange Commission’s website at http://www.sec.gov. The Form N-Q may be reviewed and copied at the Commission’s Public Reference Room in Washington, DC. Information on the operation of the Public Reference Room may be obtained by calling 1-800-SEC-0330.
| Hartford Disciplined Equity HLS Fund |
The following proposals were addressed and approved at a Special Meeting of Shareholders held on February 12, 2010.
Proposal to approve amendments to the Investment Management Agreement between the Fund and HL Investment Advisors, the purpose of which were to combine the administrative services for the Fund with the management services for the Fund under a single agreement.
| Fund | For | Against | Abstain | |||
| Hartford Disciplined Equity HLS Fund | 106,930,535.503 | 2,502,306.588 | 3,027,981.284 |
Proposal to elect Lemma Senbet and John Walters, each currently a Director, as Directors of Hartford Series Fund Inc.
Lemma W. Senbet
| Funds | For | Withheld | ||
| Hartford Series Fund, Inc. | 5,079,578,022.902 | 241,839,974.106 |
John C. Walters
| Funds | For | Withheld | ||
| Hartford Series Fund, Inc. | 5,081,138,302.186 | 240,279,694.822 |
| Hartford Disciplined Equity HLS Fund |
Your Fund's Expenses
As a shareholder of the Fund, you incur two types of costs: (1) transaction costs, including sales charges (loads) on purchase payments and contingent deferred sales charges (CDSC) (2) ongoing costs including management fees; distribution fees; and other fund expenses. This example is intended to help you understand your ongoing costs (in dollars) of investing in the Fund and to compare these costs with the ongoing costs of investing in other mutual funds. The example is based on an investment of $1,000 invested at the beginning of the period and held for the period of December 31, 2009 through June 30, 2010.
Actual Expenses
The first set of columns of the table below provides information about actual account values and actual expenses. You may use the information in this column, together with the amount you invested, to estimate the expenses that you paid over the period. Simply divide your account value by $1,000 (for example, an $8,600 account value divided by $1,000 = 8.6), then multiply the result by the number in the line under the heading entitled "Expenses Paid During Period" to estimate the expenses you paid on your account during this period.
Hypothetical Example for Comparison Purposes
The second set of columns of the table below provides information about hypothetical account values and hypothetical expenses based on the Fund's actual expense ratio and an assumed rate of return of 5% per year before expenses, which is not the Fund's actual return. The hypothetical account values and expenses may not be used to estimate the actual ending account balance or expenses you paid for the period. You may use this information to compare the ongoing costs of investing in the Fund and other funds. To do so, compare this 5% hypothetical example with the 5% hypothetical examples that appear in the shareholder reports of the other funds.
Please note that the expenses shown in the table are meant to highlight your ongoing costs only and do not reflect any transactional costs, such as sales charges (loads) and CDSC. Therefore, the second set of columns of the table is useful in comparing ongoing costs only, and will not help you determine the relative total costs of owning different funds. In addition, if these transactional costs were included, your costs would be higher. Expenses are equal to the Fund's annualized expense ratios multiplied by average account value over the period, multiplied by 181/365 (to reflect the one-half year period).
| Actual return | Hypothetical (5% return before expenses) | |||||||||||||||||||||||||||||||||||
| Expenses paid | Expenses paid | Days in | ||||||||||||||||||||||||||||||||||
| during the period | during the period | the | Days | |||||||||||||||||||||||||||||||||
| Beginning | Ending | December 31, 2009 | Beginning | Ending | December 31, 2009 | Annualized | current | in the | ||||||||||||||||||||||||||||
| Account Value | Account Value | through | Account Value | Account Value | through | expense | 1/2 | full | ||||||||||||||||||||||||||||
December 31, 2009 | June 30, 2010 | June 30, 2010 | December 31, 2009 | June 30, 2010 | June 30, 2010 | ratio | year | year | ||||||||||||||||||||||||||||
| Class IA | $ | 1,000.00 | $ | 921.48 | $ | 3.57 | $ | 1,000.00 | $ | 1,021.08 | $ | 3.76 | 0.75 | % | 181 | 365 | ||||||||||||||||||||
| Class IB | $ | 1,000.00 | $ | 920.34 | $ | 4.76 | $ | 1,000.00 | $ | 1,019.84 | $ | 5.01 | 1.00 | % | 181 | 365 | ||||||||||||||||||||
| Hartford Disciplined Equity HLS Fund |
The Board approved the annual continuation of the Investment Management Agreement (the “Agreement”) between Hartford Series Fund, Inc. (“HSF”) and HL Investment Advisors, LLC (“HL Advisors”) with respect to the Fund at its meeting on August 4-5, 2009. The Board’s considerations in approving the renewal of the Agreement are disclosed in the December 31, 2009 Annual Report for HSF.
At the November 4-5, 2009 meeting, the Board considered and approved amendments to the Agreement to include administrative services, which had been provided pursuant to a separate agreement, and investment management services under one agreement. The Board, including all of the Independent Directors, approved the amendments to the Agreement with respect to the Fund.
In approving the amendments, in addition to the information presented at the August meeting in connection with the annual review of the Agreement and the additional information provided throughout the year, the Board also considered the fact that the amendments did not result in an overall increase in fees to shareholders. The Board took note of the fact that the management of HL Advisors believes that the proposal to combine the administrative services with the investment management services under a single agreement will produce streamlined fee disclosure, resulting in greater transparency and clarity in the Fund’s prospectuses and financial reports. The Board further noted management's belief that the change would result in consistency across all of the Hartford Funds in the complex in that the funds of HSF are the only funds in the complex (other than the R share classes of the Hartford retail funds) that are subject to a separate administrative services fee. Finally, the Board noted management's view that the proposed changes to the Agreement should also serve to simplify the Board's annual consideration of the investment management arrangements for the Fund in that the investment management and administrative fees would be presented as a single fee for fee comparison purposes, which should facilitate the Board's analysis.
The shareholders of the Fund approved the amendments at a Special Meeting of Shareholders held on February 12, 2010. The amendments were effective as of March 1, 2010.
29
The Hartford
P.O. Box 5085
Hartford, CT 06102–5085
Hartford Series Fund, Inc. is underwritten and distributed by Hartford Securities Distribution Company, Inc.
“The Hartford” is The Hartford Financial Services Group, Inc. and its subsidiaries.
Hartford Series Fund, Inc. inception dates range from 1977 to date. Hartford Series Fund, Inc. is not a subsidiary of The Hartford but is underwritten, distributed by and advised by subsidiaries of The Hartford. Investments in Hartford Series Fund, Inc. are not guaranteed by The Hartford or any other entity.
This material is authorized for distribution only when preceded or accompanied by a current prospectus. The prospectus contains detailed information about the Funds, including investment objectives, risks and charges and expenses. Please read it carefully before you invest or send money.
HLSSAR-DE10 Printed in U.S.A ©2010 The Hartford, Hartford, CT 06115 |
| Hartford Dividend & Growth HLS Fund |
|
Hartford Dividend and Growth HLS Fund
| Manager Discussions (Unaudited) | 2 |
| Financial Statements | |
| 4 | |
| 7 | |
| 8 | |
| 9 | |
| 10 | |
| 11 | |
| 22 | |
| 24 | |
| 26 | |
| 26 | |
| 27 | |
| 28 | |
| 29 |
This report is prepared for the general information of contract owners and qualified retirement plan participants. It is not an offer of contracts or of qualified retirement plans. It should not be used in connection with any offer, except in conjunction with the appropriate prospectus which contains all pertinent information including the applicable sales, administrative and other charges.
The views expressed in the Fund’s Manager Discussion under ‘‘Why did the Fund perform this way?’’ and ‘‘What is the outlook?’’ are views of the Fund’s subadvisers and portfolio management team through the end of the period and is subject to change based on market and other conditions.
Hartford Dividend and Growth HLS Fund inception 03/09/1994
(subadvised by Wellington Management Company, LLP)
Investment objective – Seeks a high level of current income consistent with growth of capital.
Performance Overview(1) 6/30/00 - 6/30/10
Growth of $10,000 investment

Russell 1000 Value Index is an unmanaged index measuring the performance of those Russell 1000 Index companies with lower price-to-book ratios and lower forecasted growth values.
S&P 500 Index is a market capitalization-weighted price index composed of 500 widely held common stocks.
You cannot invest directly in an index.
The chart represents a hypothetical investment in the Fund. Performance data represents past performance and current performance could be higher or lower.
Average Annual Returns (as of 6/30/10)
6 Month† | 1 Year | 5 Year | 10 Year | |
| Dividend and Growth IA | -7.27% | 12.57% | 1.67% | 3.61% |
| Dividend and Growth IB | -7.38% | 12.31% | 1.42% | 3.37% |
| Russell 1000 Value Index | -5.12% | 16.92% | -1.64% | 2.38% |
| S&P 500 Index | -6.64% | 14.43% | -0.80% | -1.59% |
| † | Not Annualized |
PAST PERFORMANCE IS NOT INDICATIVE OF FUTURE RESULTS.
| (1) | Growth of a $10,000 investment in Class IB shares will vary from the results seen on this page due to differences in the expense charged to this share class. |
Performance information may reflect historical or current expense waivers from the investment adviser, without which performance would have been lower. For information on current expense waivers/reimbursements, please see the prospectus.
The value of the contract will fluctuate so that when redeemed, it may be worth more or less than the original investment. The chart and table do not reflect the deduction of taxes that a shareholder would pay on portfolio distributions or the redemption of portfolio shares. The figures do not include sales charges or other fees which may be applied at the variable life insurance, variable annuity or qualified retirement plan product level. Any such additional sales charges or other fees would lower the Fund’s performance.
| Portfolio Managers | ||
| Edward P. Bousa, CFA | Donald J. Kilbride | Matthew G. Baker |
| Senior Vice President, Partner | Senior Vice President | Vice President |
How did the Fund perform?
The Class IA shares of the Hartford Dividend and Growth HLS Fund returned -7.27% for the six-month period ended June 30, 2010, underperforming its benchmark, the S&P 500 Index, which returned -6.64% for the same period. The Fund underperformed the -5.68% return of the average fund in the Lipper Equity Income VP-UF Funds peer group, a group of funds with investment strategies similar to those of the Fund.
Why did the Fund perform this way?
During the period, global equity markets came under pressure as credit fears resurfaced, especially in Europe. There were also early indications of a coming global growth slowdown. With inflation generally absent, we expect no rate hikes from any of the major central banks in the near future. The sovereign debt crisis in Europe is likely only a precursor of the fiscal challenges many developed countries may face in coming years.
Overall equity market performance was negative for the period across all market capitalizations: large cap equities (-7%), mid cap equities (-1%), and small cap equities (-2%) all declined as represented by the S&P 500, S&P 400 MidCap, and Russell 2000 indices, respectively. During the six-month period all ten sectors within the S&P 500 Index fell, led by Materials (-13%), Energy (-12%), and Information Technology (-11%). Industrials (-1%), Consumer Discretionary (-2%) and Consumer Staples (-3%) declined the least, on a relative basis.
The Fund’s underperformance relative to the S&P 500 index was due to negative stock selection across seven of the ten broad economic sectors of the market. Stock selection was weakest
within Energy, Industrials, and Consumer Discretionary and strongest within Health Care, Materials, and Utilities. Overall sector allocation was modestly positive driven primarily by our overweight (i.e. the Fund’s sector position was greater than the benchmark position) to Industrials and our underweight (i.e. the Fund’s sector position was less than the benchmark position) to Information Technology.
The Fund’s top three detractors from benchmark-relative returns were Energy stocks Total, British Petroleum (BP), and Anadarko Petroleum. The BP oil spill in the Gulf of Mexico and potential impacts from heightened regulation have weighed on the Energy industry leading to sharp declines in many oil-related stocks. Shares of multinational integrated oil company Total declined due to disappointing oil refining margins and a weaker Euro. We eliminated our position in UK-based integrated oil company BP as the company’s shares continued to fall in the aftermath of the catastrophic oil spill at its Deepwater Horizon oil rig in the Gulf of Mexico. Shares of Anadarko Petroleum, an oil exploration company, declined in part due to its exposure to the oil spill cleanup costs given Anadarko’s 25% ownership stake in BP. In addition, our position in Pfizer was among the top detractors from absolute returns, and not owning Apple, a strong-performer during the period, detracted from relative returns.
The Fund’s top contributors to benchmark-relative performance during the period were Barrick Gold (Materials), Microsoft (Information Technology) and MetLife (Financials). Shares of Barrick Gold rose in conjunction with a rise in gold prices during the period and due to a positive reaction to a new CEO who is focused on improving the return on invested capital (ROIC) by investing in low cost mining projects and increasing productivity. Shares of global technology leader Microsoft fell on concerns about sluggish enterprise spending and a slow uptake of the new Windows 7 operating system. Our underweight in the benchmark-component helped relative returns. Shares of life insurance company MetLife rose following their acquisition of Alico, a subsidiary of AIG, expanding MetLife’s geographic footprint. Parker Hannifin (Industrials) and Limited Brands (Consumer Discretionary) were among the top contributors to absolute returns. In addition, not owning internet search engine provider Google, whose stock price declined by nearly 30% during the period, helped relative returns.
What is the outlook?
We believe the U.S. will transition to a slower growth path in the second half of the year, continuing into 2011. The unwinding of fiscal stimulus, a moderating inventory cycle, state and local government retrenchment and renewed weakness in home sales and prices will likely keep the lid on growth. After increasing at an annual rate of 3% in the first half of 2010, we expect real GDP growth to settle back into a 2%-2.5 % growth path. In light of the recent financial market fragility, it seems that the risks are to the downside. We believe a key requirement for continued recovery is ongoing improvement in the jobs market. So far in 2010, the private sector has shown employment gains averaging 100,000 per month. Over time, we expect to see gradual acceleration in the pace of job creation - enough to get the unemployment rate down from the current level of near 10% towards 8%-8.5% by end of 2011.
Our investment discipline is focused on investing in areas of strong demand and avoiding areas of oversupply. At the end of the period, our largest overweight positions relative to the benchmark were to the Health Care, Energy, and Industrials sectors, while we remained underweight in the Information Technology, Consumer Staples, and Consumer Discretionary sectors.
Diversification by Industry
as of June 30, 2010
| Percentage of | ||||
| Industry (Sector) | Net Assets | |||
| Automobiles & Components (Consumer Discretionary) | 1.9 | % | ||
| Banks (Financials) | 5.0 | |||
| Capital Goods (Industrials) | 9.5 | |||
| Commercial & Professional Services (Industrials) | 0.9 | |||
| Diversified Financials (Financials) | 6.6 | |||
| Energy (Energy) | 12.8 | |||
| Food & Staples Retailing (Consumer Staples) | 1.9 | |||
| Food, Beverage & Tobacco (Consumer Staples) | 4.3 | |||
| Health Care Equipment & Services (Health Care) | 3.1 | |||
| Household & Personal Products (Consumer Staples) | 2.1 | |||
| Insurance (Financials) | 5.5 | |||
| Materials (Materials) | 3.8 | |||
| Media (Consumer Discretionary) | 3.1 | |||
| Pharmaceuticals, Biotechnology & Life Sciences (Health Care) | 11.8 | |||
| Retailing (Consumer Discretionary) | 2.5 | |||
| Semiconductors & Semiconductor Equipment (Information Technology) | 1.2 | |||
| Software & Services (Information Technology) | 6.6 | |||
| Technology Hardware & Equipment (Information Technology) | 4.1 | |||
| Telecommunication Services (Services) | 3.8 | |||
| Transportation (Industrials) | 2.0 | |||
| Utilities (Utilities) | 5.9 | |||
| Short-Term Investments | 1.3 | |||
| Other Assets and Liabilities | 0.3 | |||
| Total | 100.0 | % | ||
| Hartford Dividend and Growth HLS Fund |
| June 30, 2010 (Unaudited) |
| (000’s Omitted) |
| Shares or Principal Amount | Market Value ╪ | |||||
| COMMON STOCKS - 98.4% | ||||||
| Automobiles & Components - 1.9% | ||||||
| 739 | Daimler AG | $ | 37,381 | |||
| 600 | Honda Motor Co., Ltd. ADR | 17,253 | ||||
| 1,106 | Johnson Controls, Inc. | 29,726 | ||||
| 84,360 | ||||||
| Banks - 5.0% | ||||||
| 946 | PNC Financial Services Group, Inc. | 53,455 | ||||
| 1,611 | US Bancorp | 36,006 | ||||
| 5,184 | Wells Fargo & Co. | 132,718 | ||||
| 222,179 | ||||||
| Capital Goods - 9.5% | ||||||
| 352 | Caterpillar, Inc. | 21,151 | ||||
| 1,052 | Cooper Industries plc Class A | 46,292 | ||||
| 1,260 | Deere & Co. | 70,179 | ||||
| 611 | General Dynamics Corp. | 35,774 | ||||
| 3,572 | General Electric Co. | 51,503 | ||||
| 407 | Illinois Tool Works, Inc. | 16,817 | ||||
| 720 | Lockheed Martin Corp. | 53,655 | ||||
| 650 | Northrop Grumman Corp. | 35,381 | ||||
| 1,231 | Pentair, Inc. | 39,645 | ||||
| 628 | Siemens AG ADR | 56,234 | ||||
| 426,631 | ||||||
| Commercial & Professional Services - 0.9% | ||||||
| 1,252 | Waste Management, Inc. | 39,178 | ||||
| Diversified Financials - 6.6% | ||||||
| 1,075 | Ameriprise Financial, Inc. | 38,826 | ||||
| 5,222 | Bank of America Corp. | 75,036 | ||||
| 172 | Goldman Sachs Group, Inc. | 22,539 | ||||
| 2,538 | JP Morgan Chase & Co. | 92,901 | ||||
| 761 | Morgan Stanley | 17,665 | ||||
| 343 | State Street Corp. | 11,607 | ||||
| 2,959 | UBS AG ADR | 39,119 | ||||
| 297,693 | ||||||
| Energy - 12.8% | ||||||
| 1,136 | Anadarko Petroleum Corp. | 40,980 | ||||
| 1,276 | Baker Hughes, Inc. | 53,027 | ||||
| 991 | Cenovus Energy, Inc. | 25,570 | ||||
| 2,279 | Chevron Corp. | 154,653 | ||||
| 1,039 | ConocoPhillips Holding Co. | 51,019 | ||||
| 892 | EnCana Corp. ADR | 27,050 | ||||
| 1,997 | Exxon Mobil Corp. | 113,976 | ||||
| 1,767 | Marathon Oil Corp. | 54,930 | ||||
| 1,151 | Total S.A. ADR | 51,363 | ||||
| 572,568 | ||||||
| Food & Staples Retailing - 1.9% | ||||||
| 1,061 | CVS/Caremark Corp. | 31,094 | ||||
| 1,098 | Wal-Mart Stores, Inc. | 52,757 | ||||
| 83,851 | ||||||
| Food, Beverage & Tobacco - 4.3% | ||||||
| 909 | Nestle S.A. ADR | 43,870 | ||||
| 1,015 | PepsiCo, Inc. | 61,882 | ||||
| 1,409 | Philip Morris International, Inc. | 64,593 | ||||
| 824 | Unilever N.V. Class NY ADR | 22,506 | ||||
| 192,851 | ||||||
| Health Care Equipment & Services - 3.1% | ||||||
| 1,157 | Cardinal Health, Inc. | 38,900 | ||||
| 350 | Covidien plc | 14,075 | ||||
| 1,813 | Medtronic, Inc. | 65,743 | ||||
| 748 | UnitedHealth Group, Inc. | 21,243 | ||||
| 139,961 | ||||||
| Household & Personal Products - 2.1% | ||||||
| 580 | Kimberly-Clark Corp. | 35,190 | ||||
| 960 | Procter & Gamble Co. | 57,575 | ||||
| 92,765 | ||||||
| Insurance - 5.5% | ||||||
| 1,321 | ACE Ltd. | 68,015 | ||||
| 368 | Allstate Corp. | 10,561 | ||||
| 1,052 | Chubb Corp. | 52,586 | ||||
| 810 | Marsh & McLennan Cos., Inc. | 18,270 | ||||
| 1,842 | MetLife, Inc. | 69,558 | ||||
| 580 | Transatlantic Holdings, Inc. | 27,821 | ||||
| 246,811 | ||||||
| Materials - 3.8% | ||||||
| 717 | Agrium U.S., Inc. | 35,095 | ||||
| 1,048 | Barrick Gold Corp. | 47,581 | ||||
| 915 | Dow Chemical Co. | 21,699 | ||||
| 832 | Owens-Illinois, Inc. ● | 21,998 | ||||
| 943 | Rio Tinto plc ADR | 41,093 | ||||
| 167,466 | ||||||
| Media - 3.1% | ||||||
| 3,280 | Comcast Corp. Class A | 56,966 | ||||
| 3,770 | News Corp. Class A | 45,093 | ||||
| 1,229 | Time Warner, Inc. | 35,529 | ||||
| 137,588 | ||||||
| Pharmaceuticals, Biotechnology & Life Sciences - 11.8% | ||||||
| 1,359 | AstraZeneca plc ADR | 64,050 | ||||
| 2,146 | Bristol-Myers Squibb Co. | 53,524 | ||||
| 2,806 | Eli Lilly & Co. | 94,011 | ||||
| 1,463 | Johnson & Johnson | 86,428 | ||||
| 2,950 | Merck & Co., Inc. | 103,151 | ||||
| 7,120 | Pfizer, Inc. | 101,525 | ||||
| 468 | Teva Pharmaceutical Industries Ltd. ADR | 24,337 | ||||
| 527,026 | ||||||
| Retailing - 2.5% | ||||||
| 873 | Gap, Inc. | 16,996 | ||||
| 2,101 | Lowe's Co., Inc. | 42,898 | ||||
| 2,677 | Staples, Inc. | 51,001 | ||||
| 110,895 | ||||||
| Semiconductors & Semiconductor Equipment - 1.2% | ||||||
| 846 | Analog Devices, Inc. | 23,575 | ||||
| 1,352 | Texas Instruments, Inc. | 31,475 | ||||
| 55,050 | ||||||
| Software & Services - 6.6% | ||||||
| 1,431 | Accenture plc | 55,320 | ||||
| 1,056 | Automatic Data Processing, Inc. | 42,531 | ||||
| 951 | eBay, Inc. ● | 18,649 | ||||
| 1,135 | IBM Corp. | 140,137 | ||||
| 1,815 | Microsoft Corp. | 41,768 | ||||
| 298,405 | ||||||
| Technology Hardware & Equipment - 4.1% | ||||||
| 751 | Avnet, Inc. ● | 18,099 | ||||
| 2,046 | Cisco Systems, Inc. ● | 43,596 | ||||
| 2,222 | Corning, Inc. | 35,882 | ||||
| 1,158 | Hewlett-Packard Co. | 50,101 | ||||
| 1,075 | Qualcomm, Inc. | 35,310 | ||||
| 182,988 | ||||||
The accompanying notes are an integral part of these financial statements.
| Shares or Principal Amount | Market Value ╪ | ||||||
| COMMON STOCKS - 98.4% - (continued) | |||||||
| Telecommunication Services - 3.8% | |||||||
| 7,080 | AT&T, Inc. | $ | 171,277 | ||||
| Transportation - 2.0% | |||||||
| 441 | FedEx Corp. | 30,947 | |||||
| 1,055 | United Parcel Service, Inc. Class B | 59,996 | |||||
| 90,943 | |||||||
| Utilities - 5.9% | |||||||
| 1,580 | Dominion Resources, Inc. | 61,217 | |||||
| 1,370 | Exelon Corp. | 52,024 | |||||
| 1,115 | NextEra Energy, Inc. | 54,372 | |||||
| 1,080 | PG&E Corp. | 44,372 | |||||
| 1,113 | PPL Corp. | 27,772 | |||||
| 1,230 | Xcel Energy, Inc. | 25,348 | |||||
| 265,105 | |||||||
| Total common stocks | |||||||
| (cost $4,340,021) | $ | 4,405,591 | |||||
| WARRANTS - 0.0% | |||||||
| Banks - 0.0% | |||||||
| 194 | Washington Mutual, Inc. Private Placement | ||||||
| ⌂●† | $ | – | |||||
| Total warrants | |||||||
| (cost $–) | $ | – | |||||
| Total long-term investments | |||||||
| (cost $4,340,021) | $ | 4,405,591 | |||||
| SHORT-TERM INVESTMENTS - 1.3% | |||||||
| Repurchase Agreements - 1.3% | |||||||
| Bank of America TriParty Joint Repurchase | |||||||
| Agreement (maturing on 07/01/2010 in the | |||||||
| amount of $18,937, collateralized by | |||||||
| FHLMC 5.50%, 2039, FNMA 4.50% - | |||||||
| 5.50%, 2038 - 2040, GNMA 5.00%, 2040, | |||||||
| value of $19,316) | |||||||
| $ | 18,937 | 0.05%, 6/30/2010 | $ | 18,937 | |||
| BNP Paribas Securities Corp. TriParty Joint | |||||||
| Repurchase Agreement (maturing on | |||||||
| 07/01/2010 in the amount of $3,245, | |||||||
| collateralized by FNMA 4.50% - 6.50%, | |||||||
| 2024 - 2040, GNMA 5.00% - 6.50%, 2038 | |||||||
| - 2040, value of $3,310) | |||||||
| 3,245 | 0.04%, 6/30/2010 | 3,245 | |||||
| Deutsche Bank Securities TriParty Joint | |||||||
| Repurchase Agreement (maturing on | |||||||
| 07/01/2010 in the amount of $14,338, | |||||||
| collateralized by GNMA 3.13% - 7.00%, | |||||||
| 2023 - 2052, value of $14,625) | |||||||
| 14,338 | 0.05%, 6/30/2010 | 14,338 | |||||
| JP Morgan Chase TriParty Joint Repurchase | |||||||
| Agreement (maturing on 07/01/2010 in the | |||||||
| amount of $3,245, collateralized by | |||||||
| FHLMC 2.38% - 5.83%, 2033 - 2038, | |||||||
| value of $3,310) | |||||||
| 3,245 | 0.06%, 6/30/2010 | 3,245 | |||||
| Morgan Stanley & Co., Inc. TriParty Joint | |||||||
| Repurchase Agreement (maturing on | |||||||
| 07/01/2010 in the amount of $14,139, | |||||||
| collateralized by FHLMC 5.00% - 5.50%, | |||||||
| 2038 - 2039, FNMA 5.00%, 2039, value of | |||||||
| $14,479) | |||||||
| 14,139 | 0.03%, 6/30/2010 | 14,139 | |||||
| UBS Securities, Inc. Repurchase Agreement | |||||||
| (maturing on 07/01/2010 in the amount of | |||||||
| $165, collateralized by U.S. Treasury Bill | |||||||
| 0.88%, 2011, value of $169) | |||||||
| 165 | 0.02%, 6/30/2010 | 165 | |||||
| UBS Securities, Inc. TriParty Joint | |||||||
| Repurchase Agreement (maturing on | |||||||
| 07/01/2010 in the amount of $3,579, | |||||||
| collateralized by FNMA 5.00% - 6.00%, | |||||||
| 2033 - 2036, value of $3,650) | |||||||
| 3,579 | 0.09%, 6/30/2010 | 3,579 | |||||
| 57,648 | |||||||
| Total short-term investments | |||||||
| (cost $57,648) | $ | 57,648 | |||||
| Total investments | ||||||||||
| (cost $4,397,669) ▲ | 99.7 | % | $ | 4,463,239 | ||||||
| Other assets and liabilities | 0.3 | % | 12,049 | |||||||
| Total net assets | 100.0 | % | $ | 4,475,288 | ||||||
| Note: | Percentage of investments as shown is the ratio of the total market value to total net assets. Market value of investments in foreign securities represents 12.1% of total net assets at June 30, 2010. |
Foreign securities that are principally traded on certain foreign markets are adjusted daily pursuant to a third party pricing service methodology approved by the Board of Directors in order to reflect an adjustment for factors occurring after the close of the foreign market but before the close of the New York Stock Exchange.
| ▲ | At June 30, 2010, the cost of securities for federal income tax purposes was $4,413,756 and the aggregate gross unrealized appreciation and depreciation based on that cost were: |
| Unrealized Appreciation | $ | 377,896 | ||
| Unrealized Depreciation | (328,413 | ) | ||
| Net Unrealized Appreciation | $ | 49,483 |
| † | The aggregate value of securities valued in good faith at fair value as determined under policies and procedures established by and under the supervision of the Fund's Board of Directors at June 30, 2010, was $–, which represents –% of total net assets. This amount excludes securities that are principally traded in certain foreign markets and whose prices are adjusted pursuant to a third party pricing service methodology approved by the Board of Directors. |
| ● | Currently non-income producing. |
The accompanying notes are an integral part of these financial statements.
| Hartford Dividend and Growth HLS Fund |
| Schedule of Investments – (continued) |
| June 30, 2010 (Unaudited) |
| (000’s Omitted) |
| ⌂ | The following securities are considered illiquid. Illiquid securities are often purchased in private placement transactions, are often not registered under the Securities Act of 1933 and may have contractual restrictions on resale. A security may also be considered illiquid if the security lacks a readily available market or if its valuation has not changed for a certain period of time. |
| Period | Shares/ | ||||||||
| Acquired | Par | Security | Cost Basis | ||||||
| 04/2008 | 194 | Washington Mutual, Inc. Private Placement Warrants | $ | – | |||||
The aggregate value of these securities at June 30, 2010 was $– which represents –% of total net assets.
| ╪ | See Significant Accounting Policies of accompanying Notes to Financial Statements regarding valuation of securities. |
The accompanying notes are an integral part of these financial statements.
| Hartford Dividend and Growth HLS Fund |
| June 30, 2010 (Unaudited) |
| (000’s Omitted) |
| Total | Level 1♦ | Level 2♦ | Level 3 | |||||||||||||
| Assets: | ||||||||||||||||
| Common Stocks ‡ | $ | 4,405,591 | $ | 4,368,210 | $ | 37,381 | $ | – | ||||||||
| Warrants | – | – | – | – | ||||||||||||
| Short-Term Investments | 57,648 | – | 57,648 | – | ||||||||||||
| Total | $ | 4,463,239 | $ | 4,368,210 | $ | 95,029 | $ | – | ||||||||
| ♦ | For the period ended June 30, 2010, there were no significant transfers between Level 1 and Level 2. |
| ‡ | The Fund has all or primarily all of these equity securities categorized in a single level. Refer to the Schedule of Investments for further industry breakout. |
Following is a reconciliation of Level 3 assets for which significant unobservable inputs were used to determine fair value:
| Balance as | Change in | Balance | ||||||||||||||||||||||||||||||||||
| of | Realized | Unrealized | Transfers | Transfers | as of | |||||||||||||||||||||||||||||||
| December | Gain | Appreciation | Net | Into | Out of | June 30, | ||||||||||||||||||||||||||||||
| 31, 2009 | (Loss) | (Depreciation) | Amortization | Purchases | Sales | Level 3 | Level 3 | 2010 | ||||||||||||||||||||||||||||
| Assets: | ||||||||||||||||||||||||||||||||||||
| Common Stock | $ | 195 | $ | (13,369 | ) | $ | 13,405 | $ | — | $ | — | $ | (231 | ) | $ | — | $ | — | $ | — | ||||||||||||||||
| Warrants | — | — | — | — | — | — | — | — | — | |||||||||||||||||||||||||||
| Total | $ | 195 | $ | (13,369 | ) | $ | 13,405 | $ | — | $ | — | $ | (231 | ) | $ | — | $ | — | $ | — | ||||||||||||||||
The accompanying notes are an integral part of these financial statements.
| Hartford Dividend and Growth HLS Fund |
| June 30, 2010 (Unaudited) |
| (000’s Omitted) |
| Assets: | ||||
| Investments in securities, at market value (cost $4,397,669) | $ | 4,463,239 | ||
| Cash | 179 | |||
| Receivables: | ||||
| Investment securities sold | 17,303 | |||
| Fund shares sold | 759 | |||
| Dividends and interest | 7,545 | |||
| Total assets | 4,489,025 | |||
| Liabilities: | ||||
| Payables: | ||||
| Investment securities purchased | 9,744 | |||
| Fund shares redeemed | 2,926 | |||
| Investment management fees | 657 | |||
| Distribution fees | 39 | |||
| Accrued expenses | 371 | |||
| Total liabilities | 13,737 | |||
| Net assets | $ | 4,475,288 | ||
| Summary of Net Assets: | ||||
| Capital stock and paid-in-capital | $ | 4,928,865 | ||
| Accumulated undistributed net investment income | 53,407 | |||
| Accumulated net realized loss on investments | (572,554 | ) | ||
| Unrealized appreciation of investments | 65,570 | |||
| Net assets | $ | 4,475,288 | ||
| Shares authorized | 4,000,000 | |||
| Par value | $ | 0.001 | ||
Class IA: Net asset value per share | $ | 16.27 | ||
| Shares outstanding | 233,352 | |||
| Net assets | $ | 3,797,595 | ||
Class IB: Net asset value per share | $ | 16.22 | ||
| Shares outstanding | 41,786 | |||
| Net assets | $ | 677,693 | ||
The accompanying notes are an integral part of these financial statements.
| Hartford Dividend and Growth HLS Fund |
| For the Six-Month Period Ended June 30, 2010 (Unaudited) |
| (000’s Omitted) |
| Investment Income: | ||||
| Dividends | $ | 66,594 | ||
| Interest | 66 | |||
| Less: Foreign tax withheld | (595 | ) | ||
| Total investment income, net | 66,065 | |||
| Expenses: | ||||
| Investment management fees | 14,361 | |||
| Administrative service fees | 1,619 | |||
| Transfer agent fees | 2 | |||
| Distribution fees - Class IB | 971 | |||
| Custodian fees | 6 | |||
| Accounting services fees | 347 | |||
| Board of Directors' fees | 56 | |||
| Audit fees | 46 | |||
| Other expenses | 486 | |||
| Total expenses (before fees paid indirectly) | 17,894 | |||
| Commission recapture | (33 | ) | ||
| Total fees paid indirectly | (33 | ) | ||
| Total expenses, net | 17,861 | |||
| Net investment income | 48,204 | |||
| Net Realized Gain on Investments: | ||||
| Net realized gain on investments | 123,659 | |||
| Net realized gain on forward foreign currency contracts | — | |||
| Net Realized Gain on Investments | 123,659 | |||
| Net Changes in Unrealized Depreciation of Investments: | ||||
| Net unrealized depreciation of investments | (520,982 | ) | ||
| Net Changes in Unrealized Depreciation of Investments | (520,982 | ) | ||
| Net Loss on Investments | (397,323 | ) | ||
| Net Decrease in Net Assets Resulting from Operations | $ | (349,119 | ) | |
The accompanying notes are an integral part of these financial statements.
| Hartford Dividend and Growth HLS Fund |
| (000’s Omitted) |
| For the | ||||||||
| Six-Month | For the | |||||||
| Period Ended | Year Ended | |||||||
| June 30, 2010 | December 31, | |||||||
| (Unaudited) | 2009 | |||||||
| Operations: | ||||||||
| Net investment income | $ | 48,204 | $ | 97,336 | ||||
| Net realized gain (loss) on investments | 123,659 | (424,171 | ) | |||||
| Net unrealized appreciation (depreciation) of investments | (520,982 | ) | 1,323,822 | |||||
| Payment from affiliate | — | 106 | ||||||
| Net increase (decrease) in net assets resulting from operations | (349,119 | ) | 997,093 | |||||
| Distributions to Shareholders: | ||||||||
| From net investment income | ||||||||
| Class IA | — | (84,260 | ) | |||||
| Class IB | — | (14,651 | ) | |||||
| Total distributions | — | (98,911 | ) | |||||
| Capital Share Transactions: | ||||||||
| Class IA | ||||||||
| Sold | 175,659 | 388,239 | ||||||
| Issued on reinvestment of distributions | — | 84,260 | ||||||
| Redeemed | (329,180 | ) | (604,731 | ) | ||||
| Total capital share transactions | (153,521 | ) | (132,232 | ) | ||||
| Class IB | ||||||||
| Sold | 36,716 | 53,352 | ||||||
| Issued on reinvestment of distributions | — | 14,651 | ||||||
| Redeemed | (121,571 | ) | (176,922 | ) | ||||
| Total capital share transactions | (84,855 | ) | (108,919 | ) | ||||
| Net decrease from capital share transactions | (238,376 | ) | (241,151 | ) | ||||
| Net increase (decrease) in net assets | (587,495 | ) | 657,031 | |||||
| Net Assets: | ||||||||
| Beginning of period | 5,062,783 | 4,405,752 | ||||||
| End of period | $ | 4,475,288 | $ | 5,062,783 | ||||
| Accumulated undistributed (distribution in excess of) net investment income | $ | 53,407 | $ | 5,203 | ||||
| Shares: | ||||||||
| Class IA | ||||||||
| Sold | 9,956 | 25,713 | ||||||
| Issued on reinvestment of distributions | — | 4,873 | ||||||
| Redeemed | (18,599 | ) | (41,155 | ) | ||||
| Total share activity | (8,643 | ) | (10,569 | ) | ||||
| Class IB | ||||||||
| Sold | 2,057 | 3,519 | ||||||
| Issued on reinvestment of distributions | — | 850 | ||||||
| Redeemed | (6,860 | ) | (11,967 | ) | ||||
| Total share activity | (4,803 | ) | (7,598 | ) | ||||
The accompanying notes are an integral part of these financial statements.
| Hartford Dividend and Growth HLS Fund |
| June 30, 2010 (Unaudited) |
| (000’s Omitted) |
| 1. | Organization: |
Hartford Dividend and Growth HLS Fund (the "Fund") serves as an underlying investment option for certain variable annuity and variable life insurance separate accounts of Hartford Life Insurance Company (“HLIC”) and its affiliates and certain qualified retirement plans. The Fund may also serve as an underlying investment option for certain variable annuity and variable life separate accounts of other insurance companies. Owners of variable annuity contracts and policyholders of variable life insurance contracts may choose the funds permitted in the variable insurance contract prospectus. In addition, participants in certain qualified retirement plans may choose the fund if permitted by their plans.
Hartford Series Fund, Inc. (the “Company”) is an open-end registered management investment company comprised of twenty-nine portfolios, one portfolio of which is included in these financial statements.
The Company is organized under the laws of the State of Maryland and is registered with the Securities and Exchange Commission (“SEC”) under the Investment Company Act of 1940, as amended (“1940 Act”). The Fund is organized as a diversified open-end management investment company.
The Fund is divided into Class IA and Class IB shares. Each class is offered at the per share net asset value (“NAV”) without a sales charge and is subject to the same expenses, except that the Class IB shares are subject to distribution and service fees charged pursuant to a Distribution and Service Plan adopted in accordance with Rule 12b-1 under the 1940 Act.
| 2. | Significant Accounting Policies: |
The following is a summary of significant accounting policies of the Fund, which are in accordance with U.S. Generally Accepted Accounting Principles (“GAAP”).
| a) | Security Transactions and Investment Income – Security transactions are recorded on the trade date (the date the order to buy or sell is executed). Security gains and losses are determined on the basis of identified cost. |
Dividend income is accrued as of the ex-dividend date, except that certain dividends for foreign securities where the ex-dividend date may have passed are recorded as soon as the Fund is informed of the dividend in the exercise of reasonable diligence. Interest income, including amortization of premium and accretion of discounts, is accrued on a daily basis.
| b) | Security Valuation – The Fund generally uses market prices in valuing portfolio securities. If market prices are not readily available or are deemed unreliable, the Fund will use the fair value of the security as determined in good faith under policies and procedures established by and under the supervision of the Fund’s Board of Directors. Market prices may be deemed unreliable, for example, if a security is thinly traded or if an event has occurred after the close of the security’s primary market, but before the close of the New York Stock Exchange (the “Exchange”) (generally 4:00 p.m. Eastern Time, referred to as the “Valuation Time”) that is expected to affect the value of the portfolio security. The circumstances in which the Fund may use fair value pricing include, among others: (i) the occurrence of events that are significant to a particular issuer, such as mergers, restructuring or defaults; (ii) the occurrence of events that are significant to an entire market, such as natural disasters in a particular region or governmental actions; (iii) trading restrictions on securities; (iv) thinly traded securities and (v) market events such as trading halts and early market closings. In addition, with respect to the valuation of stocks primarily traded on foreign markets, the Fund uses a fair value pricing service approved by the Fund’s Board of Directors, which employs quantitative models that evaluate changes in the value of foreign market proxies (e.g., futures contracts, American Depositary Receipts (“ADRs”), exchange traded funds (“ETFs”)) after the close of the foreign markets but before the Valuation Time. Securities that are primarily traded on foreign markets may trade on days that are not business days of the Fund. The value of the foreign securities in which the Fund invests may change on days when a shareholder will not be able to purchase or redeem shares of the Fund. Fair value pricing is subjective in nature and the use of fair value pricing by the Fund may cause the NAV of its shares to differ significantly from the NAV that would have been calculated using market prices at the close of the exchange on which a portfolio security is primarily traded but before the Valuation Time. There can be no |
| Hartford Dividend and Growth HLS Fund |
| Notes to Financial Statements – (continued) |
| June 30, 2010 (Unaudited) |
| (000’s Omitted) |
assurance that the Fund could obtain the fair value assigned to a security if the Fund were to sell the security at approximately the time at which the Fund determines its NAV.
Foreign-denominated assets, including investment securities, and liabilities are translated from the local currency into U.S. dollars using exchange rates obtained from an independent third party as of the Fund’s Valuation Time.
Financial instruments for which prices are not available from an independent pricing service may be valued using market quotations obtained from one or more dealers that make markets in securities in accordance with procedures established by the Fund’s Board of Directors.
Forward foreign currency contracts represent agreements to exchange currencies on specific future dates at predetermined rates. Forward foreign currency contracts are valued using foreign currency exchange rates and forward rates on the Valuation Date from an independent pricing service.
Other derivative or contractual type instruments shall be valued using market prices if such instruments trade on an exchange or market. If such instruments do not trade on an exchange or market, such instruments shall be valued at a price at which the counterparty to such contract would repurchase the instrument. In the event that the counterparty cannot provide a price, such valuation may be determined in accordance with procedures established by the Fund’s Board of Directors.
Various inputs are used in determining the value of the Fund’s investments. These inputs are summarized into three broad hierarchy levels. This hierarchy is based on whether the valuation inputs are observable or unobservable. These levels are:
| · | Level 1 – Quoted prices in active markets for identical securities. Level 1 may include exchange-traded instruments such as domestic equities, some foreign equities, options, futures, mutual funds, ETFs, and rights and warrants. |
| · | Level 2 – Observable inputs other than Level 1 prices, such as quoted prices for similar securities; quoted prices in markets that are not active; or other inputs that are observable or can be corroborated by observable market data. Level 2 may include debt securities that are traded less frequently than exchange-traded instruments and which are valued using third party pricing services. Prices for most level 2 securities are based on prices received from an independent pricing service. The following asset classes generally use valuation techniques and inputs as noted below: |
Asset Backed Securities and Collateralized Mortgage Obligations – Multi-dimensional spread/prepayment speed tables, with consideration of yield or price of bonds of comparable quality, coupon and maturity, attributes of the collateral, new issue data and monthly payment information.
Corporate Bonds – Multi-dimensional relational model based on observable market information such as yields, spreads, sector analysis, etc.
Foreign Currency – based on rates determined at the close of the Exchange, provided by an independent pricing service.
Forward Currency Contracts – valued based on the price of the underlying currency at the prevailing interpolated exchange rate, which is a combination of the spot currency rate and the forward currency rate, provided by an independent pricing service.
Foreign Equities – Certain foreign equities are priced using a multi-factor regression model with market observable inputs of a correlative nature (ADRs, futures contracts, ETFs, and currency exchange rates).
International Fixed Income – Multi-dimensional relational model based on observable market information such as benchmark yields, reported trades, bids and offers.
Money Market Instruments – Amortized cost.
Mortgage Backed Securities (“MBS”) – Matrix pricing using inputs of To-Be-Announced (“TBA”) prices, new issue data and monthly payment information, with consideration of yield or price of bonds of comparable quality, coupon and maturity, and attributes of the collateral.
Municipal Bonds – Multi-dimensional relational model and series of matrices based on observable market information such as Municipal Securities Rulemaking Board reported trades, comparable bonds, yields, spreads and credit analysis.
Preferred Stocks – Close mean of bid/ask or bid.
Repurchase Agreements – Priced at par.
Senior Floating Rate Interests – Composite of quotes from one or more contributing dealers.
Swaps – Price based upon observable market information from an independent pricing service.
U.S. Government Securities – Treasuries exclusively traded in the secondary market.
| · | Level 3 – Significant unobservable inputs that are supported by limited or no market activity. Level 3 may include financial instruments whose values are determined using broker quotes or require significant management judgment or estimation. While these securities are priced using unobservable inputs, the valuation of these securities reflects the best available data and management believes the prices are a reasonable representation of exit price. The following asset classes generally use valuation techniques and inputs as noted below: |
Asset Backed Securities & Commercial Mortgage Backed Securities – Certain other MBS with limited liquidity priced from an independent pricing service.
Common Stocks – Trading has been halted or there are restrictions on trading. Valuation is based on last trade with the application of a discount or premium, if applicable.
Long Dated Over-the-Counter Options – Terms greater than 10 years from current date, expected volatility is not observable. Prices are from an independent pricing service.
Long Term Debt Securities, including Senior Floating Rate Interests – Unobservable valuation inputs may include estimates for current yields, maturity/duration, prepayment speed, and broker quotes for comparable securities along with other assumptions relating to credit quality, collateral value, complexity of the security structure, general market conditions and liquidity.
Swaps – Terms greater than 10 years from current date, expected volatility is not observable. Prices are from an independent pricing service.
Individual securities within any of the above mentioned asset classes may be assigned a different hierarchical level than those that are presented above, as individual circumstances dictate.
For purposes of reporting transfers between different hierarchy levels, both transfers in and out of each level are shown as if they occurred at the beginning of the period.
| Hartford Dividend and Growth HLS Fund |
| Notes to Financial Statements – (continued) |
| June 30, 2010 (Unaudited) |
| (000’s Omitted) |
Refer to the Investment Valuation Hierarchy Levels Summary and the Level 3 roll forward reconciliation found following the Schedules of Investments.
| c) | Foreign Currency Transactions – Assets and liabilities denominated in currencies other than U.S. dollars are translated into U.S. dollars at the exchange rates in effect on the valuation date. Purchases and sales of investment securities, income and expenses are translated into U.S. dollars at the exchange rates on the dates of such transactions. |
The Fund does not isolate that portion of portfolio security valuation resulting from fluctuations in the foreign currency exchange rates from the fluctuations arising from changes in the market prices of securities held. Exchange rate fluctuations are included with the net realized and unrealized gain or loss on investments in the accompanying financial statements.
Net realized foreign exchange gains or losses arise from sales of foreign currencies and the difference between asset and liability amounts initially stated in foreign currencies and the U.S. dollar value of the amounts actually received or paid. Net unrealized foreign exchange gains or losses arise from changes in the value of other assets and liabilities at the end of the reporting period, resulting from changes in the exchange rates.
| d) | Joint Trading Account – Pursuant to an exemptive order issued by the SEC, the Fund may transfer uninvested cash balances into a joint trading account managed by Wellington Management Company, LLP (“Wellington Management”). These balances may be invested in one or more repurchase agreements and/or short-term money market instruments. |
| e) | Repurchase Agreements – A repurchase agreement is an agreement by which a counterparty agrees to sell a security and agrees to repurchase the security sold at a mutually agreed upon time and price. At the time the Fund enters into a repurchase agreement, the value of the underlying collateral security(ies), including accrued interest, will be equal to or exceed the value of the repurchase agreement. To minimize counterparty risk, the securities that serve to collateralize the repurchase agreement are held by the Fund's custodian in book entry or physical form in the custodial account of the Fund or in a third party custodial account. Repurchase agreements are valued at cost plus accrued interest. The Fund, as shown on the Schedule of Investments, had outstanding repurchase agreements as of June 30, 2010. |
| f) | Forward Foreign Currency Contracts – The Fund may enter into forward foreign currency contracts that obligate the Fund to purchase or sell currencies at specified future dates. Forward foreign currency contracts may be used to hedge against adverse fluctuations in exchange rates between currencies. |
Forward foreign currency contracts involve elements of market risk in excess of the amounts reflected in the Statement of Assets and Liabilities. In addition, risks may arise upon entering into these contracts from the potential inability of the counterparties to meet the terms of the contracts and from unanticipated movements in the value of the foreign currencies relative to the U.S. dollar. The Fund had no outstanding forward foreign currency contracts as of June 30, 2010.
| g) | Fund Share Valuation and Dividend Distributions to Shareholders – Orders for the Fund’s shares are executed in accordance with the investment instructions of the contract holders or plan participants. The NAV of the Fund’s shares is determined as of the close of each business day of the Exchange. The NAV is determined separately for each class of the Fund by dividing the Fund’s net assets attributable to that class by the number of outstanding shares of the class. Orders for the purchase of the Fund’s shares received by an insurance company or plan prior to the close of the Exchange on any day on which the Exchange is open for business are priced at the NAV determined as of the close of the Exchange. Orders received by an insurance company or plan after the close of the Exchange, or on a day on which the Exchange and/or the Fund is not open for business, are priced at the next determined NAV. |
Dividends are declared pursuant to a policy adopted by the Fund’s Board of Directors based upon the investment performance of the Fund. The policy of the Fund is to pay dividends from net investment income and distribute realized capital gains, if any, at least once a year.
Distributions from net investment income, realized capital gains and capital are determined in accordance with federal income tax regulations, which may differ from U.S. GAAP with respect to character and timing. These differences may include but are not limited to losses deferred due to wash sale adjustments, foreign currency gains and losses, adjustments related to Passive Foreign Investment Companies (“PFICs”), Real Estate Investment Trusts (“REITs”), Regulated Investment Companies (“RICs”), certain derivatives and partnerships. Permanent book and federal income tax basis differences relating to shareholder distributions will result in reclassifications to certain of the Fund’s capital accounts (see Federal Income Taxes: Reclassification of Capital Accounts note).
| h) | Illiquid and Restricted Securities – The Fund is permitted to invest up to 15% of its net assets in illiquid securities. “Illiquid Securities” are those that may not be sold or disposed of in the ordinary course of business within seven days, at approximately the price used to determine the Fund’s NAV. The Fund may not be able to sell illiquid securities or other investments when its sub-adviser considers it desirable to do so or may have to sell such securities or investments at a price that is lower than the price that could be obtained if the securities or investments were more liquid. A sale of illiquid securities or other investments may require more time and may result in higher dealer discounts and other selling expenses than does the sale of those that are liquid. Illiquid securities and investments also may be more difficult to value, due to the unavailability of reliable market quotations for such securities or investments, and an investment in them may have an adverse impact on the Fund’s NAV. The Fund may also purchase certain restricted securities, commonly known as Rule 144A securities, that can be resold to institutions and which may be determined to be liquid pursuant to policies and guidelines established by the Fund’s Board of Directors. The Fund, as shown on the Schedule of Investments, had illiquid or restricted securities as of June 30, 2010. |
| i) | Use of Estimates – The preparation of financial statements in conformity with U.S. GAAP requires management to make estimates and assumptions that affect the reported amounts of assets and liabilities as of the date of the financial statements and the reported amounts of income and expenses during the period. Operating results in the future could vary from the amounts derived from management’s estimates. |
| j) | Additional Derivative Instrument(s) Information |
The volume of derivative activity was minimal during the six-month period ended June 30, 2010.
Realized Gain/Loss on Derivative Instruments for the six-month period ended June 30, 2010:
| Amount of Realized Gain or (Loss) on Derivatives Recognized in Income | ||||||||||||||||||||||||
| Forward | ||||||||||||||||||||||||
| Purchased | Currency | |||||||||||||||||||||||
| Risk Exposure Category | Written Options | Options | Futures | Contracts | Swaps | Total | ||||||||||||||||||
| Foreign exchange contracts | $ | — | $ | — | $ | — | $ | — | $ | — | $ | — | ||||||||||||
| Total | $ | — | $ | — | $ | — | $ | — | $ | — | $ | — | ||||||||||||
| k) | Indemnifications – Under the Company’s organizational documents, the Company shall indemnify its officers and directors to the full extent required or permitted under Maryland General Corporation Law and the federal securities laws. In addition, the Company, on behalf of the Fund, may enter into contracts that contain a variety of indemnifications. The Company’s maximum exposure under these arrangements is unknown. However, the Company has not had prior claims or losses pursuant to these contracts and expects the risk of loss to be remote. |
| Hartford Dividend and Growth HLS Fund |
| Notes to Financial Statements – (continued) |
| June 30, 2010 (Unaudited) |
| (000’s Omitted) |
| 3. | Federal Income Taxes: |
| a) | Federal Income Taxes – For federal income tax purposes, the Fund intends to continue to qualify as a RIC under Subchapter M of the Internal Revenue Code (“IRC”) by distributing substantially all of its taxable net investment income and net realized capital gains to its shareholders and otherwise complying with the requirements of RICs. The Fund has distributed substantially all of its income and capital gains in prior years and intends to distribute substantially all of its income and capital gains prior to the next fiscal year end. Accordingly, no provision for federal income or excise taxes has been made in the accompanying financial statements. Distributions from short-term capital gains are treated as ordinary income distributions for federal income tax purposes. |
| b) | Net Investment Income (Loss), Net Realized Gains (Losses) – Net investment income (loss) and net realized gains (losses) may differ for financial statement and tax purposes primarily because of losses deferred due to wash sale adjustments, foreign currency gains and losses, adjustments related to PFICs, REITs, RICs, certain derivatives and partnerships. The character of distributions made during the year from net investment income or net realized gains may differ from their ultimate characterization for federal income tax purposes. Also, due to the timing of dividend distributions, the fiscal year in which amounts are distributed may differ from the year that the income or realized gains (losses) were recorded by the Fund. |
| c) | Distributions and Components of Distributable Earnings – The tax character of distributions paid by the Fund for the periods indicated is as follows (as adjusted for dividends payable): |
| For the Year Ended | For the Year Ended | |||||||
| December 31, 2009 | December 31, 2008 | |||||||
| Ordinary Income | $ | 98,911 | $ | 148,624 | ||||
| Long-Term Capital Gains* | — | 107,986 | ||||||
| * | The Fund designates these distributions as long-term capital dividends pursuant to IRC code Sec. 852(b)(3)(C). |
As of December 31, 2009, the Fund’s components of distributable earnings (deficit) on a tax basis were as follows:
| Amount | ||||
| Undistributed Ordinary Income | $ | 5,203 | ||
| Accumulated Capital and Other Losses* | (680,126 | ) | ||
Unrealized Appreciation† | 570,465 | |||
| Total Accumulated Deficit | $ | (104,458 | ) | |
| * | The Fund has capital loss carryforwards that are identified in the Capital Loss Carryforward note that follows. |
| † | The difference between book-basis and tax-basis unrealized appreciation (depreciation) may be attributable to the losses deferred due to wash sale adjustments, foreign currency gains and losses, adjustments related to PFICs, REITs, RICs, certain derivatives and partnerships. |
| d) | Reclassification of Capital Accounts – The Fund may record reclassifications in its capital accounts. These reclassifications have no impact on the total net assets of the Fund. The reclassifications are a result of permanent differences between GAAP and tax accounting for such items as net operating losses that reduce distribution requirements. Adjustments are made to reflect the impact these items have on current and future distributions to shareholders. Therefore, the source of the Fund’s distributions may be shown in the accompanying Statement of Changes in Net Assets as from net investment income, from net realized gains on investments or from capital depending on the type of book and tax differences that exist. For the year ended December 31, 2009, the Fund recorded reclassifications to increase (decrease) the accounts listed below: |
| Amount | ||||
| Accumulated Undistributed Net Investment Income | $ | (185 | ) | |
| Accumulated Net Realized Gain on Investments | 189 | |||
| Paid-in-Capital | (4 | ) | ||
| e) | Capital Loss Carryforward – At December 31, 2009 (tax-year-end), the Fund had capital loss carryforwards for U.S. federal income tax purposes of approximately: |
| Year of Expiration | Amount | |||
| 2016 | $ | 39,088 | ||
| 2017 | 641,038 | |||
| Total | $ | 680,126 | ||
| f) | Accounting for Uncertainty in Income Taxes – Management has evaluated all open tax years and has determined there is no impact to the Fund’s financial statements related to uncertain tax positions. Generally, tax authorities can examine all tax returns filed for the last three years. |
| 5. | Expenses: |
| a) | Investment Management Agreements – HL Investment Advisors, LLC (“HL Advisors”), an indirect wholly-owned subsidiary of The Hartford Financial Services Group, Inc. (“The Hartford”), serves as investment manager to the Fund pursuant to an Investment Management Agreement with the Company. As investment manager, HL Advisors has overall investment supervisory responsibility for the Fund. In addition, HL Advisors provides administrative personnel, services, equipment, facilities and office space for proper operation of the Fund. |
HL Advisors has contracted with Wellington Management for the provision of day-to-day investment management services to the Fund in accordance with the Fund’s investment objective and policies. The Fund pays a fee to HL Advisors, a portion of which may be used to compensate Wellington Management.
| b) | Administrative Services Agreement – For the two-month period January 1, 2010 through February 28, 2010, under the Administrative Services Agreement between HLIC and the Company, on behalf of the Fund, HLIC provided administrative services to the Fund and received monthly compensation at the annual rate of 0.20% of the Fund’s average daily net assets. The Fund assumed and paid certain other expenses (including, but not limited to, accounting, custodian, state taxes and Directors’ fees). Effective March 1, 2010, the Investment Management Agreement was amended to include the administrative services for the Fund and the separate administrative services agreement was terminated. |
The schedule below reflects the rates of compensation paid to HL Advisors for investment management services and to HLIC for administrative services rendered from January 1, 2010 through February 28, 2010, and the rates of
| Hartford Dividend and Growth HLS Fund |
| Notes to Financial Statements – (continued) |
| June 30, 2010 (Unaudited) |
| (000’s Omitted) |
compensation paid to the HL Advisors for the combined services from March 1, 2010 through June 30, 2010; the rates are accrued daily and paid monthly.
| Average Daily Net Assets | Annual Fee | |||
| On first $250 million | 0.7750 | % | ||
| On next $250 million | 0.7250 | % | ||
| On next $500 million | 0.6750 | % | ||
| On next $4 billion | 0.6250 | % | ||
| On next $5 billion | 0.6225 | % | ||
| Over $10 billion | 0.6200 | % | ||
| c) | Accounting Services Agreement – Pursuant to the Fund Accounting Agreement between HLIC and the Company, on behalf of the Fund, HLIC provides accounting services to the Fund and receives monthly compensation on the Fund’s average net assets. The Fund’s accounting services fees are accrued daily and paid monthly. |
| Average Daily Net Assets | Annual Fee | |||
| On first $5 billion | 0.014 | % | ||
| On next $5 billion | 0.012 | % | ||
| Over $10 billion | 0.010 | % | ||
| d) | Operating Expenses – Allocable expenses incurred by the Company are allocated to each Fund and allocated to classes within the Fund in proportion to the average daily net assets of the Fund and each class, except where allocation of certain expenses is more fairly made directly to the Fund or to specific classes within a Fund. |
| e) | Fees Paid Indirectly – The Company, on behalf of the Fund has entered into agreements with State Street Global Advisers, LLC and Russell Implementation Securities, Inc. to partially recapture non-discounted trade commissions. Such rebates are used to pay a portion of the Fund’s expenses. In addition, the Fund’s custodian bank has also agreed to reduce its fees when the Fund maintains cash on deposit in a non-interest-bearing custody account. For the six-month period ended June 30, 2010, these amounts are included in the Statement of Operations. |
The ratio of expenses to average net assets in the accompanying financial highlights excludes the reduction in expenses related to fees paid indirectly. Had the fees paid indirectly been included, the annualized expense ratio for the periods listed below would have been as follows:
| Annualized | ||||||||||||||||||||||||
| Six-Month | Year Ended | Year Ended | Year Ended | Year Ended | Year Ended | |||||||||||||||||||
| Period Ended | December 31, | December 31, | December 31, | December 31, | December 31, | |||||||||||||||||||
| June 30, 2010 | 2009 | 2008 | 2007 | 2006 | 2005 | |||||||||||||||||||
| Class IA | 0.68 | % | 0.68 | % | 0.66 | % | 0.67 | % | 0.66 | % | 0.66 | % | ||||||||||||
| Class IB | 0.93 | 0.93 | 0.91 | 0.92 | 0.91 | 0.91 | ||||||||||||||||||
| f) | Distribution Plan for Class IB shares – The Company, on behalf of the Fund, has adopted a Distribution Plan pursuant to Rule 12b-1 under the 1940 Act for the Class IB shares. Pursuant to the Distribution Plan, the Fund is authorized to compensate the Distributor, Hartford Securities Distribution Company, Inc. (a wholly owned, ultimate subsidiary of The Hartford), from assets attributable to the Class IB shares for services rendered and expenses borne in connection with activities primarily intended to result in the sale of the Class IB shares, subject to the Fund Board’s review and approval. |
| The Distribution Plan provides that the Fund may pay annually up to 0.25% of the average daily net assets of the Fund attributable to its Class IB shares for activities primarily intended to result in the sale of Class IB shares. The Board has the authority to suspend or reduce these payments at any point in time. Under the terms of the Distribution Plan and the principal underwriting agreement, the Fund is authorized to make payments monthly to the Distributor which may be used to pay or compensate entities providing distribution and shareholder servicing with respect to the Class IB shares for such entities’ fees or expenses incurred or paid in that regard. These fees are accrued daily and paid monthly. |
| g) | Other Related Party Transactions – Certain officers of the Fund are directors and/or officers of HL Advisors, and/or The Hartford or its subsidiaries. For the six-month period ended June 30, 2010, a portion of the Fund’s chief compliance officer’s salary was paid by all the investment companies in the Hartford fund complex. The portion allocated to the Fund was in the amount of $11. Hartford Investor Services Company, LLC ("HISC"), a wholly owned subsidiary of The Hartford, provides transfer agent services to the Fund. The amount HISC was compensated for providing such services can be found on the Statement of Operations. These fees are accrued daily and paid monthly. |
| h) | Payment from Affiliate – In July of 2007, The Hartford entered into a settlement with the Attorneys General of the states of New York, Connecticut and Illinois relating to market timing and the company's individual variable annuity contracts in which certain payments would be made directly to the variable annuity contract holders. The distribution plan provides that unclaimed money from the settlement would be distributed to certain HLS Funds that are investment options through a Hartford individual variable annuity contract. The unclaimed money was distributed to the Fund on September 18, 2009, as follows: |
| Amount | ||||
| Reimbursement | $ | 106 | ||
On November 8, 2006, the SEC issued an order setting forth the terms of a settlement reached with three subsidiaries of The Hartford that resolves the SEC’s Division of Enforcement’s investigation of aspects of The Hartford’s variable annuity and mutual fund operations related to directed brokerage and revenue sharing. The Hartford settled this matter without admitting or denying the findings of the SEC.
The Fund is available for purchase by the separate accounts of different variable universal life policies, variable annuity products, and funding agreements and it is offered directly to certain qualified retirement plans (collectively “Products”). Although existing Products contain transfer restrictions, some Products, particularly older variable annuity products, do not contain restrictions on the frequency of transfers. In addition, as the result of the settlement of litigation against Hartford Life, Inc. (“Hartford Life”) (the issuers of such variable annuity products), the Fund’s ability to restrict transfers by certain owners of older variable annuity products was limited. During 2006, these annuity owners surrendered the older variable annuity contracts that were the subject of prior litigation. In February 2005, Hartford Life agreed with the Board of Directors of the Fund to indemnify the Fund for any material harm caused to the Fund from frequent trading by these contracts owners.
| Hartford Dividend and Growth HLS Fund |
| Notes to Financial Statements – (continued) |
| June 30, 2010 (Unaudited) |
| (000’s Omitted) |
The total return in the accompanying financial highlights includes payment from affiliates. Had the payment from affiliates been excluded, the total return for the periods listed below would have been as follows:
| For the Year Ended December 31, 2009 | ||||||||
| Class IA | Class IB | |||||||
| Impact from Payment from Affiliate for Attorneys General Settlement | — | % | — | % | ||||
| Total Return Excluding Payments from Affiliate | 24.67 | 24.36 | ||||||
| For the Year Ended December 31, 2006 | ||||||||
| Class IA | Class IB | |||||||
| Impact from Payment from Affiliate for SEC Settlement | 0.06 | % | 0.06 | % | ||||
| Impact from Payment from Affiliate for Unrestricted Transfers | 0.01 | 0.01 | ||||||
| Total Return Excluding Payments from Affiliate | 20.29 | 19.99 | ||||||
| 6. | Investment Transactions: |
For the six-month period ended June 30, 2010, the cost of purchases and proceeds from sales of investment securities (excluding short-term investments) were as follows:
| Amount | ||||
| Cost of Purchases Excluding U.S. Government Obligations | $ | 957,900 | ||
| Sales Proceeds Excluding U.S. Government Obligations | 1,054,844 | |||
| 7. | Line of Credit: |
| The Fund is one of several Hartford funds that participate in a $500 million committed revolving line of credit facility. The facility is to be used for temporary or emergency purposes. Under the arrangement, a fund is required to own securities having a market value in excess of 300% of the total bank borrowings. The interest rate on borrowings varies depending on the nature of the loan. The facility also requires a fee to be paid based on the amount of the commitment. This fee is allocated to all the funds participating in the line of credit based on the average net assets of the funds. During the six-month period ended June 30, 2010, the Fund did not have any borrowings under this facility. |
| 8. | Industry Classifications: |
| Other than the industry classifications “Other Investment Pools and Funds” and “Exchange Traded Funds”, equity industry classifications used in this report are the Global Industry Classification Standard, which was developed by and is the exclusive property and service mark of MSCI, Inc. and Standard & Poor’s. |
[This page left intentionally blank]
| Hartford Dividend and Growth HLS Fund |
- Selected Per-Share Date (A) - |
| Net Asset | Net Realized | Net Increase | ||||||||||||||||||||||||||||||||||||||||||
| Value at | Payments | and Unrealized | Total from | Dividends from | Distributions | (Decrease) in | Net Asset | |||||||||||||||||||||||||||||||||||||
| Beginning of | Net Investment | from (to) | Gain (Loss) on | Investment | Net Investment | from Realized | Distributions | Total | Net Asset | Value at End | ||||||||||||||||||||||||||||||||||
Class | Period | Income (Loss) | Affiliate | Investments | Operations | Income | Capital Gains | from Capital | Distributions | Value | of Period | |||||||||||||||||||||||||||||||||
| For the Six-Month Period Ended June 30, 2010 (Unaudited) | ||||||||||||||||||||||||||||||||||||||||||||
| IA | $ | 17.55 | $ | 0.18 | $ | – | $ | (1.46 | ) | $ | (1.28 | ) | $ | – | $ | – | $ | – | $ | – | $ | (1.28 | ) | $ | 16.27 | |||||||||||||||||||
| IB | 17.51 | 0.16 | – | (1.45 | ) | (1.29 | ) | – | – | – | – | (1.29 | ) | 16.22 | ||||||||||||||||||||||||||||||
| For the Year Ended December 31, 2009 | ||||||||||||||||||||||||||||||||||||||||||||
| IA | 14.37 | 0.35 | – | 3.19 | 3.54 | (0.36 | ) | – | – | (0.36 | ) | 3.18 | 17.55 | |||||||||||||||||||||||||||||||
| IB | 14.34 | 0.33 | – | 3.16 | 3.49 | (0.32 | ) | – | – | (0.32 | ) | 3.17 | 17.51 | |||||||||||||||||||||||||||||||
| For the Year Ended December 31, 2008 | ||||||||||||||||||||||||||||||||||||||||||||
| IA | 22.35 | 0.44 | – | (7.57 | ) | (7.13 | ) | (0.44 | ) | (0.41 | ) | – | (0.85 | ) | (7.98 | ) | 14.37 | |||||||||||||||||||||||||||
| IB | 22.28 | 0.42 | – | (7.56 | ) | (7.14 | ) | (0.39 | ) | (0.41 | ) | – | (0.80 | ) | (7.94 | ) | 14.34 | |||||||||||||||||||||||||||
| For the Year Ended December 31, 2007 | ||||||||||||||||||||||||||||||||||||||||||||
| IA | 22.79 | 0.42 | – | 1.44 | 1.86 | (0.41 | ) | (1.89 | ) | – | (2.30 | ) | (0.44 | ) | 22.35 | |||||||||||||||||||||||||||||
| IB | 22.72 | 0.37 | – | 1.42 | 1.79 | (0.34 | ) | (1.89 | ) | – | (2.23 | ) | (0.44 | ) | 22.28 | |||||||||||||||||||||||||||||
| For the Year Ended December 31, 2006 | ||||||||||||||||||||||||||||||||||||||||||||
| IA | 20.74 | 0.40 | 0.01 | 3.77 | 4.18 | (0.41 | ) | (1.72 | ) | – | (2.13 | ) | 2.05 | 22.79 | ||||||||||||||||||||||||||||||
| IB | 20.68 | 0.35 | 0.01 | 3.74 | 4.10 | (0.34 | ) | (1.72 | ) | – | (2.06 | ) | 2.04 | 22.72 | ||||||||||||||||||||||||||||||
| For the Year Ended December 31, 2005 | ||||||||||||||||||||||||||||||||||||||||||||
| IA | 20.83 | 0.36 | – | 0.87 | 1.23 | (0.40 | ) | (0.92 | ) | – | (1.32 | ) | (0.09 | ) | 20.74 | |||||||||||||||||||||||||||||
| IB | 20.76 | 0.29 | – | 0.89 | 1.18 | (0.34 | ) | (0.92 | ) | – | (1.26 | ) | (0.08 | ) | 20.68 | |||||||||||||||||||||||||||||
| (A) | Information presented relates to a share outstanding throughout the indicated period. |
| (B) | The figures do not include sales charges or other fees which may be applied at the variable life insurance, variable annuity or qualified retirement plan product level. Any such additional sales charges or other fees would lower the Fund's performance. |
| (C) | Ratios do not reflect reductions for fees paid indirectly. Please see Fees Paid Indirectly in the Notes to Financial Statements. |
| (D) | Portfolio turnover rate is calculated on the basis of the Fund as a whole without distinguishing between the classes of shares issued. |
| (E) | Not annualized. |
| (F) | Annualized. |
| (G) | Total return without the inclusion of the Payment from (to) Affiliate can be found in Expenses in the accompanying Notes to Financial Statements. |
| - Ratios and Supplemental Data - |
Ratio of Expenses to Average Net | Ratio of Expenses to Average Net | Ratio of Net Investment Income to | Portfolio | |||||||||||||||||||
Total Return(B) | Net Assets at End of Period | Assets Before Waivers(C) | Assets After Waivers(C) | Average Net Assets | Turnover Rate(D) | |||||||||||||||||
| (7.27 | )%(E) | $ | 3,797,595 | 0.68 | %(F) | 0.68 | %(F) | 1.98 | %(F) | 20 | % | |||||||||||
| (7.38 | )(E) | 677,693 | 0.93 | (F) | 0.93 | (F) | 1.72 | (F) | – | |||||||||||||
| 24.68 | (G) | 4,247,031 | 0.69 | 0.69 | 2.24 | 34 | ||||||||||||||||
| 24.36 | (G) | 815,752 | 0.94 | 0.94 | 2.00 | – | ||||||||||||||||
| (32.43 | ) | 3,628,793 | 0.67 | 0.67 | 2.20 | 41 | ||||||||||||||||
| (32.60 | ) | 776,959 | 0.92 | 0.92 | 1.95 | – | ||||||||||||||||
| 8.26 | 5,842,788 | 0.67 | 0.67 | 1.70 | 27 | |||||||||||||||||
| 7.98 | 1,501,363 | 0.92 | 0.92 | 1.45 | – | |||||||||||||||||
| 20.36 | (G) | 5,671,552 | 0.67 | 0.67 | 1.77 | 27 | ||||||||||||||||
| 20.06 | (G) | 1,603,952 | 0.92 | 0.92 | 1.52 | – | ||||||||||||||||
| 5.96 | 4,978,773 | 0.67 | 0.67 | 1.70 | 26 | |||||||||||||||||
| 5.70 | 1,506,556 | 0.92 | 0.92 | 1.45 | – | |||||||||||||||||
| Hartford Dividend and Growth HLS Fund |
The Board of Directors appoints officers who are responsible for the day-to-day operations of the Fund and who execute policies formulated by the Directors. Each director serves until his or her death, resignation, or retirement or until the next annual meeting of shareholders is held or until his or her successor is elected and qualifies.
Directors and officers who are employed by or who have a financial interest in The Hartford are considered “interested” persons of the Fund pursuant to the Investment Company Act of 1940, as amended. Each officer and two of the Company’s directors, as noted in the chart below, are “interested” persons of the Fund. Each director serves as a director for The Hartford Mutual Funds, Inc., The Hartford Mutual Funds II, Inc., The Hartford Income Shares Fund, Inc., Hartford Series Fund, Inc., and Hartford HLS Series Fund II, Inc., which, as of June 30, 2010, collectively consist of 88 funds. Correspondence may be sent to directors and officers c/o Hartford Mutual Funds, P.O. Box 2999, Hartford, Connecticut 06104-2999, except that correspondence to Ms. Fagely may be sent to 500 Bielenberg Drive, Woodbury, Minnesota 55125.
The table below sets forth, for each director and officer, his or her name, year of birth, current position with the Company and date first elected or appointed to Hartford Series Fund, Inc. (“HSF”), and Hartford HLS Series Fund II, Inc. (“HSF2”), principal occupation, and, for directors, other directorships held. The Fund’s statement of additional information contains further information on the directors and is available free of charge by calling 1-800-862-6668 or writing to Hartford HLS Funds, c/o Individual Annuity Services, P.O. Box 5085, Hartford, CT 06102-5085.
Information on the aggregate remuneration paid to the directors of the Company can be found in the Statement of Operations herein. The Fund pays to The Hartford a portion of the chief compliance officer’s compensation, but does not pay salaries or compensation to any of their other officers or directors who are employed by The Hartford.
Non-Interested Directors
Lynn S. Birdsong (1946) Director since 2003, Co-Chairman of the Investment Committee
Mr. Birdsong is a private investor. Since 2003, Mr. Birdsong has been an independent director of The Japan Fund and has served as a Director of the Sovereign High Yield Fund since April 2010. From 2003 to March 2005, Mr. Birdsong was an independent director of the Atlantic Whitehall Funds. From 1979 to 2002, Mr. Birdsong was a managing director of Zurich Scudder Investments, an investment management firm. During his employment with Scudder, Mr. Birdsong was an interested director of The Japan Fund. Since 1981, Mr. Birdsong has been a partner in Birdsong Company, an advertising specialty firm.
Robert M. Gavin, Jr. (1940) Director since 2002 (HSF) and 1986 (HSF2), Chairman of the Board since 2004
Dr. Gavin is an educational consultant. Prior to September 1, 2001, he was President of Cranbrook Education Community and prior to July 1996, he was President of Macalester College, St. Paul, Minnesota.
Duane E. Hill (1945) Director since 2001 (HSF) and 2002 (HSF2), Chairman of the Nominating Committee
Mr. Hill is Partner of TSG Ventures L.P., a private equity investment company. Mr. Hill is a former partner of TSG Capital Group, a private equity investment firm that served as sponsor and lead investor in leveraged buyouts of middle market companies.
Sandra S. Jaffee (1941) Director since 2005
Ms. Jaffee served as Chairman (2008 to 2009) and Chief Executive Officer of Fortent (formerly Searchspace Group), a leading provider of compliance/regulatory technology to financial institutions from August 2005 to August 2009. From August 2004 to August 2005, Ms. Jaffee served as an Entrepreneur in Residence with Warburg Pincus, a private equity firm. From September 1995 to July 2004, Ms. Jaffee served as Executive Vice President at Citigroup, where she was President and Chief Executive Officer of Citibank’s Global Securities Services (1995 to 2003).
William P. Johnston (1944) Director since 2005, Chairman of the Compliance Committee
In June 2006, Mr. Johnston was appointed as Senior Advisor to The Carlyle Group, a global private equity investment firm. In July 2006, Mr. Johnston was elected to the Board of Directors of MultiPlan, Inc. In August 2007, Mr. Johnston was elected to the Board of Directors of LifeCare Holdings, Inc. In February 2008, Mr. Johnston was elected to the Board of Directors of HCR-ManorCare, Inc. In May 2006, Mr. Johnston was elected to the Supervisory Board of Fresenius Medical Care AG & Co. KGaA, after its acquisition of Renal Care Group, Inc. in March 2006. Mr. Johnston joined Renal Care Group in November 2002 as a member of the Board of Directors and served as Chairman of the Board from March 2003 through March 2006. From September 1987 to December 2002, Mr. Johnston was with Equitable Securities Corporation (and its successors, SunTrust Equitable Securities and SunTrust Robinson Humphrey) serving in various investment banking and managerial positions, including Managing Director and Head of Investment Banking, Chief Executive Officer and Vice Chairman.
Phillip O. Peterson (1944) Director since 2002 (HSF) and 2000 (HSF2), Chairman of the Audit Committee
Mr. Peterson is a mutual fund industry consultant. He was a partner of KPMG LLP (an accounting firm) until July 1999. Mr. Peterson joined William Blair Funds in February 2007 as a member of the Board of Trustees. From January 2004 to April 2005, Mr. Peterson served as Independent President of the Strong Mutual Funds.
Lemma W. Senbet (1946) Director since 2005
Dr. Senbet is the William E. Mayer Chair Professor of Finance and Director, Center for Financial Policy, at the University of Maryland, Robert H. Smith School of Business. He was chair of the Finance Department during 1998 to 2006. Previously he was a chaired professor of finance at the University of Wisconsin-Madison. Also, he was director of the Fortis Funds from March 2000 to July 2002. Dr. Senbet served the finance profession in various capacities, including as director of the American Finance Association and President of the Western Finance Association. In 2006, Dr. Senbet was inducted Fellow of Financial Management Association International for his career-long distinguished scholarship and professional service.
Interested Directors and Officers
Lowndes A. Smith (1939) Director since 1996 (HSF) and 2002 (HSF2), Co-Chairman of the Investment Committee
Mr. Smith served as Vice Chairman of The Hartford from February 1997 to January 2002, as President and Chief Executive Officer of Hartford Life, Inc. from February 1997 to January 2002, and as President and Chief Operating Officer of The Hartford Life Insurance Companies from January 1989 to January 2002. Mr. Smith serves as a Director of White Mountains Insurance Group, Ltd., One Beacon Insurance, Symetra Financial and as a Managing Director of Whittington Gray Associates.
John C. Walters 1, 2 (1962) Director since 2008
Mr. Walters currently serves as President, Chief Executive Officer and Director for Hartford Life, Inc. (“HL, Inc.”). Mr. Walters also serves as President, Chairman of the Board, Chief Executive Officer and Director for Hartford Life Insurance Company (“Hartford Life”), and as Executive Vice President of The Hartford. In addition, Mr. Walters is a Manager of HL Investment Advisors, LLC (“HL Advisors”). Mr. Walters previously served as President of the U.S. Wealth Management Division of HL, Inc. (2006-2007) and as Co-Chief Operating Officer of Hartford Life (2007-2008).
1 Mr. Walters previously served as President and Chief Executive Officer (2007 to 2009).
2 Effective July 31, 2010, Mr. Walters retired from The Hartford. Mr. Walters resigned his position as a Director of the Fund effective July 30, 2010.
Other Officers
Robert M. Arena, Jr. (1968) President and Chief Executive Officer since 2009 (served as Vice President of the Fund (2006-2009))
Mr. Arena serves as Executive Vice President of Hartford Life. Additionally, Mr. Arena is Senior Vice President and Director of Hartford Administrative Services Company, (“HASCO”), President, Chief Executive Officer and Manager of Hartford Investment Financial Services, LLC (“HIFSCO”) and President, Chief Executive Officer and Manager of HL Advisors. Mr. Arena joined The Hartford in 2004.
Tamara L. Fagely (1958) Vice President, Treasurer and Controller since 2002 (HSF) 1993 (HSF2)
Ms. Fagely has been a Vice President of HASCO since 1998 and Chief Financial Officer since 2006. Currently Ms. Fagely is a Vice President of Hartford Life. She served as Assistant Vice President of Hartford Life from December 2001 through March 2005. In addition, Ms. Fagely is Controller and Chief Financial Officer of HIFSCO.
Brian Ferrell (1962) AML Compliance Officer since 2008
Mr. Ferrell has served as Assistant Vice President and AML Compliance Officer for The Hartford since 2006, and as AML Compliance Officer for HASCO and Hartford Investor Services Company, LLC (“HISC”) since 2008. Prior to joining The Hartford in 2006, Mr. Ferrell held various positions at the U.S. Department of the Treasury (the “Treasury”) from 2001 to 2006, where he served as Chief Counsel for the Treasury’s Financial Crimes Enforcement Network from 2005-2006.
Dr. Robert J. Froehlich (1953) Senior Managing Director since 2009
Dr. Froehlich joined The Hartford as Senior Managing Director in September 2009. Prior to joining The Hartford, Dr. Froehlich served as Vice Chairman of Deutsche Asset Management from 1997-2009.
| Hartford Dividend and Growth HLS Fund |
| Directors and Officers (Unaudited) – (continued) |
Thomas D. Jones, III (1965) Vice President and Chief Compliance Officer since 2006
Mr. Jones serves as Chief Compliance Officer for the Hartford Mutual Funds and Vice President and Director of Securities Compliance for The Hartford. Mr. Jones joined The Hartford in 2006 from SEI Investments, where he served as Chief Compliance Officer for its mutual funds and investment advisers. Prior to joining SEI, Mr. Jones was First Vice President and Compliance Director for Merrill Lynch Investment Managers (Americas) (“MLIM”), where he worked from 1992-2004.
Edward P. Macdonald (1967) Vice President, Secretary and Chief Legal Officer since 2005
Mr. Macdonald serves as Assistant Vice President of Hartford Life and Chief Legal Officer and Vice President of HIFSCO. He also serves as Vice President and Secretary of HASCO, and Chief Legal Officer, Secretary and Vice President of HL Advisors. Mr. Macdonald joined The Hartford in 2005.
Vernon J. Meyer (1964) Vice President since 2006
Mr. Meyer serves as Senior Vice President of Hartford Life. He also serves as Senior Vice President of HIFSCO and HL Advisors. Mr. Meyer joined The Hartford in 2004.
D. Keith Sloane (1960) Vice President since 2009
Mr. Sloane is a Senior Vice President of Hartford Life. Additionally, Mr. Sloane currently serves as Senior Vice President of HIFSCO, HL Advisors, and HASCO. Prior to joining The Hartford in 2007, Mr. Sloane was Director of product marketing and led the mutual fund business for Wachovia Securities (“Wachovia”) in their investment products group. Mr. Sloane joined Wachovia in 1995.
Jane Wolak (1961) Vice President since 2009
Ms. Wolak currently serves as Vice President of Hartford Life. Ms. Wolak joined Hartford Life as Vice President, Retail Product Services in May 2007. She is also Vice President of HASCO. Previously, Ms. Wolak was with Sun Life Financial where she held the position of Vice President, Service Center Operations from 2001-2007.
A description of the policies and procedures that the Fund uses to determine how to vote proxies relating to portfolio securities and a record of how the Fund voted any proxies for the twelve-month period ended June 30, 2010 is available (1) without charge, upon request, by calling 800-862-6668 and (2) on the Securities and Exchange Commission’s website at http://www.sec.gov.
The Fund files a complete schedule of portfolio holdings with the Commission for the first and third quarters of each fiscal year on Form N-Q. The Fund’s Forms are available (1) without charge, upon request, by calling 800-862-6668 and (2) on the Securities and Exchange Commission’s website at http://www.sec.gov. The Form N-Q may be reviewed and copied at the Commission’s Public Reference Room in Washington, DC. Information on the operation of the Public Reference Room may be obtained by calling 1-800-SEC-0330.
| Hartford Dividend and Growth HLS Fund |
The following proposals were addressed and approved at a Special Meeting of Shareholders held on February 12, 2010.
Proposal to approve amendments to the Investment Management Agreement between the Fund and HL Investment Advisors, the purpose of which were to combine the administrative services for the Fund with the management services for the Fund under a single agreement.
| Fund | For | Against | Abstain | |||
| Hartford Dividend and Growth HLS Fund | 254,586,182.927 | 6,930,369.549 | 8,412,384.107 |
Proposal to elect Lemma Senbet and John Walters, each currently a Director, as Directors of Hartford Series Fund Inc.
Lemma W. Senbet
| Funds | For | Withheld | ||
| Hartford Series Fund, Inc. | 5,079,578,022.902 | 241,839,974.106 |
John C. Walters
| Funds | For | Withheld | ||
| Hartford Series Fund, Inc. | 5,081,138,302.186 | 240,279,694.822 |
| Hartford Dividend and Growth HLS Fund |
Your Fund's Expenses
As a shareholder of the Fund, you incur two types of costs: (1) transaction costs, including sales charges (loads) on purchase payments and contingent deferred sales charges (CDSC) (2) ongoing costs including management fees; distribution fees; and other fund expenses. This example is intended to help you understand your ongoing costs (in dollars) of investing in the Fund and to compare these costs with the ongoing costs of investing in other mutual funds. The example is based on an investment of $1,000 invested at the beginning of the period and held for the period of December 31, 2009 through June 30, 2010.
Actual Expenses
The first set of columns of the table below provides information about actual account values and actual expenses. You may use the information in this column, together with the amount you invested, to estimate the expenses that you paid over the period. Simply divide your account value by $1,000 (for example, an $8,600 account value divided by $1,000 = 8.6), then multiply the result by the number in the line under the heading entitled "Expenses Paid During Period" to estimate the expenses you paid on your account during this period.
Hypothetical Example for Comparison Purposes
The second set of columns of the table below provides information about hypothetical account values and hypothetical expenses based on the Fund's actual expense ratio and an assumed rate of return of 5% per year before expenses, which is not the Fund's actual return. The hypothetical account values and expenses may not be used to estimate the actual ending account balance or expenses you paid for the period. You may use this information to compare the ongoing costs of investing in the Fund and other funds. To do so, compare this 5% hypothetical example with the 5% hypothetical examples that appear in the shareholder reports of the other funds.
Please note that the expenses shown in the table are meant to highlight your ongoing costs only and do not reflect any transactional costs, such as sales charges (loads) and CDSC. Therefore, the second set of columns of the table is useful in comparing ongoing costs only, and will not help you determine the relative total costs of owning different funds. In addition, if these transactional costs were included, your costs would be higher. Expenses are equal to the Fund's annualized expense ratios multiplied by average account value over the period, multiplied by 181/365 (to reflect the one-half year period).
| Actual return | Hypothetical (5% return before expenses) | |||||||||||||||||||||||||||||||||||
| Expenses paid | Expenses paid | Days in | ||||||||||||||||||||||||||||||||||
| during the period | during the period | the | Days | |||||||||||||||||||||||||||||||||
| Beginning | Ending | December 31, 2009 | Beginning | Ending | December 31, 2009 | Annualized | current | in the | ||||||||||||||||||||||||||||
| Account Value | Account Value | through | Account Value | Account Value | through | expense | 1/2 | full | ||||||||||||||||||||||||||||
December 31, 2009 | June 30, 2010 | June 30, 2010 | December 31, 2009 | June 30, 2010 | June 30, 2010 | ratio | year | year | ||||||||||||||||||||||||||||
| Class IA | $ | 1,000.00 | $ | 927.30 | $ | 3.25 | $ | 1,000.00 | $ | 1,021.42 | $ | 3.41 | 0.68 | % | 181 | 365 | ||||||||||||||||||||
| Class IB | $ | 1,000.00 | $ | 926.24 | $ | 4.44 | $ | 1,000.00 | $ | 1,020.18 | $ | 4.66 | 0.93 | % | 181 | 365 | ||||||||||||||||||||
| Hartford Dividend and Growth HLS Fund |
The Board approved the annual continuation of the Investment Management Agreement (the “Agreement”) between Hartford Series Fund, Inc. (“HSF”) and HL Investment Advisors, LLC (“HL Advisors”) with respect to the Fund at its meeting on August 4-5, 2009. The Board’s considerations in approving the renewal of the Agreement are disclosed in the December 31, 2009 Annual Report for HSF.
At the November 4-5, 2009 meeting, the Board considered and approved amendments to the Agreement to include administrative services, which had been provided pursuant to a separate agreement, and investment management services under one agreement. The Board, including all of the Independent Directors, approved the amendments to the Agreement with respect to the Fund.
In approving the amendments, in addition to the information presented at the August meeting in connection with the annual review of the Agreement and the additional information provided throughout the year, the Board also considered the fact that the amendments did not result in an overall increase in fees to shareholders. The Board took note of the fact that the management of HL Advisors believes that the proposal to combine the administrative services with the investment management services under a single agreement will produce streamlined fee disclosure, resulting in greater transparency and clarity in the Fund’s prospectuses and financial reports. The Board further noted management's belief that the change would result in consistency across all of the Hartford Funds in the complex in that the funds of HSF are the only funds in the complex (other than the R share classes of the Hartford retail funds) that are subject to a separate administrative services fee. Finally, the Board noted management's view that the proposed changes to the Agreement should also serve to simplify the Board's annual consideration of the investment management arrangements for the Fund in that the investment management and administrative fees would be presented as a single fee for fee comparison purposes, which should facilitate the Board's analysis.
The shareholders of the Fund approved the amendments at a Special Meeting of Shareholders held on February 12, 2010. The amendments were effective as of March 1, 2010.
29
The Hartford
P.O. Box 5085
Hartford, CT 06102–5085
Hartford Series Fund, Inc. is underwritten and distributed by Hartford Securities Distribution Company, Inc.
“The Hartford” is The Hartford Financial Services Group, Inc. and its subsidiaries.
Hartford Series Fund, Inc. inception dates range from 1977 to date. Hartford Series Fund, Inc. is not a subsidiary of The Hartford but is underwritten, distributed by and advised by subsidiaries of The Hartford. Investments in Hartford Series Fund, Inc. are not guaranteed by The Hartford or any other entity.
This material is authorized for distribution only when preceded or accompanied by a current prospectus. The prospectus contains detailed information about the Funds, including investment objectives, risks and charges and expenses. Please read it carefully before you invest or send money.
HLSSAR-DG10 Printed in U.S.A ©2010 The Hartford, Hartford, CT 06115 |
| Hartford Global Growth HLS Fund |
|
Hartford Global Growth HLS Fund
| Manager Discussions (Unaudited) | 2 |
| Financial Statements | |
| 4 | |
| 7 | |
| 8 | |
| 9 | |
| 10 | |
| 11 | |
| 22 | |
| 24 | |
26 | |
| 26 | |
| 27 | |
| 28 | |
| 29 |
This report is prepared for the general information of contract owners and qualified retirement plan participants. It is not an offer of contracts or of qualified retirement plans. It should not be used in connection with any offer, except in conjunction with the appropriate prospectus which contains all pertinent information including the applicable sales, administrative and other charges.
The views expressed in the Fund’s Manager Discussion under ‘‘Why did the Fund perform this way?’’ and ‘‘What is the outlook?’’ are views of the Fund’s subadvisers and portfolio management team through the end of the period and is subject to change based on market and other conditions.
Hartford Global Growth HLS Fund inception 09/30/1998
(subadvised by Wellington Management Company, LLP)
Investment objective – Seeks growth of capital.
Performance Overview(1) 6/30/00 - 6/30/10
Growth of $10,000 investment

MSCI World Growth Index is a broad-based unmanaged market capitalization-weighted total return index which measures the performance of growth securities in 23 developed-country global equity markets including the U.S., Canada, Europe, Australia, New Zealand and the Far East.
You cannot invest directly in an index.
The chart represents a hypothetical investment in the Fund. Performance data represents past performance and current performance could be higher or lower.
Average Annual Returns (as of 6/30/10)
| 6 | 1 | 5 | 10 | |
| Month† | Year | Year | Year | |
| Global Growth IA | -12.15% | 9.03% | -2.26% | -2.06% |
| Global Growth IB | -12.26% | 8.76% | -2.50% | -2.30% |
| MSCI World Growth Index | -9.21% | 11.04% | 1.17% | -2.75% |
| † | Not Annualized |
PAST PERFORMANCE IS NOT INDICATIVE OF FUTURE RESULTS.
| (1) | Growth of a $10,000 investment in Class IB shares will vary from the results seen on this page due to differences in the expense charged to this share class. |
Performance information may reflect historical or current expense waivers from the investment adviser, without which performance would have been lower. For information on current expense waivers/reimbursements, please see the prospectus.
The value of the contract will fluctuate so that when redeemed, it may be worth more or less than the original investment. The chart and table do not reflect the deduction of taxes that a shareholder would pay on portfolio distributions or the redemption of portfolio shares. The figures do not include sales charges or other fees which may be applied at the variable life insurance, variable annuity or qualified retirement plan product level. Any such additional sales charges or other fees would lower the Fund’s performance.
| Portfolio Managers | |
| Matthew D. Hudson, CFA | Jean-Marc Berteaux |
| Vice President | Senior Vice President, Partner |
How did the Fund perform?
The Class IA shares of the Hartford Global Growth HLS Fund returned -12.15% for the six-month period ended June 30, 2010, underperforming its benchmark, the MSCI World Growth Index, which returned - -9.21% for the same period. The Fund also underperformed the -6.85% return of the average fund in the Lipper Global Growth Funds VP-UF peer group, a group of funds with investment strategies similar to those of the Fund.
Why did the Fund perform this way?
Global equities had a tumultuous start to 2010. Through late April, U.S. equities rose as investor confidence grew amid better-than-expected corporate earnings, accommodative monetary policy, and improving economic conditions. From late April until the end of the period, risk aversion rose and equities fell on concerns that the global economy could slip back into a recession. Investors worried about how burgeoning fiscal deficits across much of Europe, tightening credit conditions in China, and a disinflationary environment would affect the economic recovery and corporate earnings growth.
For the period, Growth stocks (-9%) slightly outperformed Value stocks (-10%) as measured by the MSCI World Growth Index and the MSCI World Value Indexes, respectively. Within the MSCI World Growth Index, all ten sectors posted negative returns. Energy (-15%), Telecommunication Services (-15%), and Financials (-14%) lagged, while the Industrials (-3%), Consumer Discretionary (-3%), and Consumer Staples (-5%) sectors performed the best on a relative basis.
The Fund’s underperformance versus its benchmark was primarily due to security selection, particularly within the Information Technology and Industrials sectors. This was partially offset by stronger selection in Financials and Telecommunication Services. Relative (i.e. performance of the Fund as measured against the benchmark) performance also was hurt by the Fund’s underweight (i.e. the Fund’s sector position was less than the benchmark position) to Consumer Staples and an overweight (i.e. the Fund’s sector position was greater than the benchmark position) to Financials; however, the Fund’s overweight exposures to Consumer Discretionary and Industrials aided relative results.
The top detractors from the Fund’s relative performance were NVIDIA (Information Technology), SunPower (Information Technology), and Mosaic (Materials). Shares of NVIDIA, a leading provider of chips for interactive graphics on consumer and professional computing devices, fell as inventory levels rose amid an environment of softening demand. Shares of solar panel manufacturer SunPower declined as an oversupply of solar panels hurt industry pricing. Near-term earnings guidance lagged investor estimates as some business revenues will be recognized later in the year, which also weighed down the stock. Shares of Mosaic, a North American producer of potash and phosphate fertilizers, fell as softening global crop prices and macroeconomic concerns weighed on the stock. Google (Information Technology) also detracted from absolute and relative returns.
MGM Resorts International (Consumer Discretionary), Microsoft (Information Technology), and SMC (Industrials) were positive contributors to benchmark-relative performance. Shares of gaming and casino operator MGM Resorts International moved higher as investor sentiment shifted toward a recovery outlook for its Las Vegas operations and more positive valuation on the firm’s joint venture in Macau. Shares of Microsoft fell on concerns about sluggish enterprise spending and a slow uptake of the new Windows 7 operating system. Not owning benchmark component Microsoft during the period aided relative returns. Japan-based pneumatic equipment manufacturer SMC’s shares rose as the company released fiscal year end earnings that were better than initially expected and announced a favorable outlook for the first half of the next fiscal year. Top absolute contributors included Apple (Information Technology) and Barrick Gold (Materials).
What is the outlook?
At the end of the period, investors had grown concerned that fiscal austerity could choke off a nascent recovery, feeding concerns of a double-dip recession. Meanwhile, the April 2010 sinking of the Deepwater Horizon oil rig in the Gulf of Mexico and the prospect of ongoing cleanup and compensation costs increased investor skittishness, particularly around Energy companies. Almost as background to these headline events, economic data indicated growing divergence in the global economy. In the U.S., unemployment has leveled off but is not showing signs of meaningful improvement, while industrial production rose 1.2% in May as global demand for U.S. goods continued to grow. Germany and the U.K. announced fiscal austerity measures, while China posted strong trade data.
Despite these mixed signals, our overall positioning is consistent with an improving economic outlook: overweight cyclically oriented sectors that should outperform in an improving economy such as the Consumer Discretionary and Information Technology sectors; underweight the defensive Consumer Staples and Health Care sectors.
Portfolio construction is a bottom-up (i.e. stock by stock fundamental research) process based on intensive company research. Allocations among sectors are the result of individual stock decisions. At the end of the period, our stock-by-stock investment process resulted in greater-than-benchmark weights in Consumer Discretionary, Financials, and Information Technology. The Fund held below-benchmark weights in the Consumer Staples, Health Care and Materials sectors. Top positions in Consumer Discretionary relative to the benchmark at the end of June included Daimler, Sands China, and Urban Outfitters. Our below-benchmark weight in Consumer Staples reflects the fact that we are finding limited opportunities for growth in that sector relative to companies in other sectors.
Diversification by Industry
as of June 30, 2010
| Percentage of | ||||
| Industry (Sector) | Net Assets | |||
Automobiles & Components (Consumer Discretionary) | 2.8 | % | ||
| Banks (Financials) | 6.4 | |||
| Capital Goods (Industrials) | 12.8 | |||
Consumer Durables & Apparel (Consumer Discretionary) | 2.2 | |||
| Consumer Services (Consumer Discretionary) | 3.0 | |||
| Diversified Financials (Financials) | 4.8 | |||
| Energy (Energy) | 6.0 | |||
| Food & Staples Retailing (Consumer Staples) | 1.0 | |||
| Food, Beverage & Tobacco (Consumer Staples) | 2.5 | |||
| Health Care Equipment & Services (Health Care) | 1.3 | |||
| Household & Personal Products (Consumer Staples) | 1.1 | |||
| Insurance (Financials) | 1.9 | |||
| Materials (Materials) | 7.0 | |||
| Media (Consumer Discretionary) | 1.6 | |||
Pharmaceuticals, Biotechnology & Life Sciences (Health Care) | 5.4 | |||
| Real Estate (Financials) | 1.2 | |||
| Retailing (Consumer Discretionary) | 10.4 | |||
Semiconductors & Semiconductor Equipment (Information Technology) | 3.5 | |||
| Software & Services (Information Technology) | 8.6 | |||
Technology Hardware & Equipment (Information Technology) | 11.6 | |||
| Telecommunication Services (Services) | 1.1 | |||
| Transportation (Industrials) | 2.5 | |||
| Short-Term Investments | 1.6 | |||
| Other Assets and Liabilities | (0.3 | ) | ||
| Total | 100.0 | % | ||
Diversification by Country
as of June 30, 2010
| Percentage of | ||||
| Country | Net Assets | |||
| Brazil | 1.1 | % | ||
| Canada | 1.6 | |||
| China | 0.9 | |||
| Denmark | 0.9 | |||
| France | 2.1 | |||
| Germany | 5.1 | |||
| Hong Kong | 5.8 | |||
| Israel | 1.5 | |||
| Japan | 7.6 | |||
| Netherlands | 1.3 | |||
| South Korea | 1.3 | |||
| Spain | 1.2 | |||
| Switzerland | 2.6 | |||
| Taiwan | 1.2 | |||
| United Kingdom | 11.5 | |||
| United States | 53.0 | |||
| Short-Term Investments | 1.6 | |||
| Other Assets and Liabilities | (0.3 | ) | ||
| Total | 100.0 | % | ||
| Hartford Global Growth HLS Fund |
| June 30, 2010 (Unaudited) |
| (000’s Omitted) |
| Shares or Principal Amount | Market Value ╪ | |||||
| COMMON STOCKS - 98.7% | ||||||
| Automobiles & Components - 2.8% | ||||||
| 165 | Daimler AG | $ | 8,371 | |||
| 820 | Nissan Motor Co., Ltd. | 5,711 | ||||
| 14,082 | ||||||
| Banks - 6.4% | ||||||
| 545 | Banco Santander Central Hispano S.A. | 5,714 | ||||
| 1,626 | Barclays Bank plc | 6,489 | ||||
| 2,555 | BOC Hong Kong Holdings Ltd. | 5,818 | ||||
| 316 | Itau Unibanco Banco Multiplo S.A. ADR | 5,683 | ||||
| 337 | Standard Chartered plc | 8,206 | ||||
| 31,910 | ||||||
| Capital Goods - 12.8% | ||||||
| 517 | General Electric Co. | 7,458 | ||||
| 134 | Honeywell International, Inc. | 5,241 | ||||
| 169 | Illinois Tool Works, Inc. | 6,983 | ||||
| 254 | Ingersoll-Rand plc | 8,777 | ||||
| 410 | Masco Corp. | 4,414 | ||||
| 89 | Parker-Hannifin Corp. | 4,939 | ||||
| 47 | Precision Castparts Corp. | 4,855 | ||||
| 50 | Schneider Electric S.A. | 5,052 | ||||
| 67 | Siemens AG | 5,988 | ||||
| 42 | SMC Corp. | 5,664 | ||||
| 104 | Vestas Wind Systems A/S ● | 4,333 | ||||
| 63,704 | ||||||
| Consumer Durables & Apparel - 2.2% | ||||||
| 122 | Adidas-Salomon AG | 5,889 | ||||
| 495 | Sharp Corp. | 5,224 | ||||
| 11,113 | ||||||
| Consumer Services - 3.0% | ||||||
| 463 | MGM Resorts International ● | 4,459 | ||||
| 4,429 | Sands China Ltd. ●§ | 6,547 | ||||
| 153 | Starbucks Corp. | 3,723 | ||||
| 14,729 | ||||||
| Diversified Financials - 4.8% | ||||||
| 415 | Bank of America Corp. | 5,957 | ||||
| 45 | Goldman Sachs Group, Inc. | 5,866 | ||||
| 171 | JP Morgan Chase & Co. | 6,256 | ||||
| 476 | UBS AG | 6,300 | ||||
| 24,379 | ||||||
| Energy - 6.0% | ||||||
| 335 | BG Group plc | 4,987 | ||||
| 170 | Consol Energy, Inc. | 5,746 | ||||
| 74 | EOG Resources, Inc. | 7,316 | ||||
| 174 | National Oilwell Varco, Inc. | 5,760 | ||||
| 110 | Schlumberger Ltd. | 6,097 | ||||
| 29,906 | ||||||
| Food & Staples Retailing - 1.0% | ||||||
| 99 | Metro AG | 5,031 | ||||
| Food, Beverage & Tobacco - 2.5% | ||||||
| 193 | British American Tobacco plc | 6,136 | ||||
| 156 | Heineken N.V. | 6,627 | ||||
| 12,763 | ||||||
| Health Care Equipment & Services - 1.3% | ||||||
| 242 | Aetna, Inc. | 6,388 | ||||
| Household & Personal Products - 1.1% | ||||||
| 113 | Reckitt Benckiser Group plc | 5,248 | ||||
| Insurance - 1.9% | ||||||
| 544 | Ping An Insurance (Group) Co. ⌂† | 4,497 | ||||
| 97 | Prudential Financial, Inc. | 5,215 | ||||
| 9,712 | ||||||
| Materials - 7.0% | ||||||
| 151 | Anglo American plc ● | 5,261 | ||||
| 172 | Barrick Gold Corp. | 7,822 | ||||
| 218 | BHP Billiton plc | 5,643 | ||||
| 169 | JFE Holdings, Inc. | 5,217 | ||||
| 122 | Shin-Etsu Chemical Co., Ltd. | 5,671 | ||||
| 415 | Xstrata plc | 5,429 | ||||
| 35,043 | ||||||
| Media - 1.6% | ||||||
| 249 | News Corp. Class A | 2,972 | ||||
| 524 | WPP plc | 4,941 | ||||
| 7,913 | ||||||
| Pharmaceuticals, Biotechnology & Life Sciences - 5.4% | ||||||
| 130 | Amgen, Inc. ● | 6,825 | ||||
| 116 | Celgene Corp. ● | 5,872 | ||||
| 50 | Roche Holding AG | 6,867 | ||||
| 142 | Teva Pharmaceutical Industries Ltd. ADR | 7,395 | ||||
| 26,959 | ||||||
| Real Estate - 1.2% | ||||||
| 1,608 | Hang Lung Properties Ltd. | 6,151 | ||||
| Retailing - 10.4% | ||||||
| 45 | Amazon.com, Inc. ● | 4,917 | ||||
| 16,976 | GOME Electrical Appliances Holdings Ltd. | 5,123 | ||||
| 1,606 | Kingfisher plc | 5,032 | ||||
| 133 | Kohl's Corp. ● | 6,308 | ||||
| 1,204 | Li & Fung Ltd. | 5,389 | ||||
| 362 | Lowe's Co., Inc. | 7,382 | ||||
| 46 | Pinault-Printemps-Redoute S.A. | 5,706 | ||||
| 32 | Priceline.com, Inc. ● | 5,631 | ||||
| 190 | Urban Outfitters, Inc. ● | 6,524 | ||||
| 52,012 | ||||||
| Semiconductors & Semiconductor Equipment - 3.5% | ||||||
| 336 | Marvell Technology Group Ltd. ● | 5,303 | ||||
| 536 | NVIDIA Corp. ● | 5,471 | ||||
| 10 | Samsung Electronics Co., Ltd. | 6,499 | ||||
| 17,273 | ||||||
| Software & Services - 8.6% | ||||||
| 168 | Accenture plc | 6,503 | ||||
| 288 | Activision Blizzard, Inc. | 3,025 | ||||
| 221 | Adobe Systems, Inc. ● | 5,849 | ||||
| 347 | eBay, Inc. ● | 6,795 | ||||
| 17 | Google, Inc. ● | 7,422 | ||||
| 599 | Oracle Corp. | 12,863 | ||||
| 42,457 | ||||||
| Technology Hardware & Equipment - 11.6% | ||||||
| 67 | Apple, Inc. ● | 16,842 | ||||
| 580 | Cisco Systems, Inc. ● | 12,368 | ||||
| 212 | Dell, Inc. ● | 2,557 | ||||
| 426 | EMC Corp. ● | 7,789 | ||||
| 1,658 | Hon Hai Precision Industry Co., Ltd. ● | 5,812 | ||||
| 190 | NetApp, Inc. ● | 7,073 | ||||
| 159 | Qualcomm, Inc. | 5,235 | ||||
| 57,676 | ||||||
The accompanying notes are an integral part of these financial statements.
| Shares or Principal Amount | Market Value ╪ | ||||||
| COMMON STOCKS - 98.7% - (continued) | |||||||
| Telecommunication Services - 1.1% | |||||||
| 205 | Softbank Corp. | $ | 5,440 | ||||
| Transportation - 2.5% | |||||||
| 535 | Delta Air Lines, Inc. ● | 6,290 | |||||
| 875 | Mitsui O.S.K. Lines Ltd. | 5,782 | |||||
| 12,072 | |||||||
| Total common stocks | |||||||
| (cost $468,627) | $ | 491,961 | |||||
| Total long-term investments | |||||||
| (cost $468,627) | $ | 491,961 | |||||
| SHORT-TERM INVESTMENTS - 1.6% | |||||||
| Repurchase Agreements - 1.6% | |||||||
| Bank of America TriParty Joint Repurchase | |||||||
| Agreement (maturing on 07/01/2010 in the | |||||||
| amount of $2,692, collateralized by | |||||||
| FHLMC 5.50%, 2039, FNMA 4.50% - | |||||||
| 5.50%, 2038 - 2040, GNMA 5.00%, 2040, | |||||||
| value of $2,746) | |||||||
| $ | 2,692 | 0.05%, 6/30/2010 | $ | 2,692 | |||
| BNP Paribas Securities Corp. TriParty Joint | |||||||
| Repurchase Agreement (maturing on | |||||||
| 07/01/2010 in the amount of $461, | |||||||
| collateralized by FNMA 4.50% - 6.50%, | |||||||
| 2024 - 2040, GNMA 5.00% - 6.50%, 2038 - | |||||||
| 2040, value of $471) | |||||||
| 461 | 0.04%, 6/30/2010 | 461 | |||||
| Deutsche Bank Securities TriParty Joint | |||||||
| Repurchase Agreement (maturing on | |||||||
| 07/01/2010 in the amount of $2,039, | |||||||
| collateralized by GNMA 3.13% - 7.00%, | |||||||
| 2023 - 2052, value of $2,079) | |||||||
| 2,039 | 0.05%, 6/30/2010 | 2,039 | |||||
| JP Morgan Chase TriParty Joint Repurchase | |||||||
| Agreement (maturing on 07/01/2010 in the | |||||||
| amount of $461, collateralized by FHLMC | |||||||
| 2.38% - 5.83%, 2033 - 2038, value of $471) | |||||||
| 461 | 0.06%, 6/30/2010 | 461 | |||||
| Morgan Stanley & Co., Inc. TriParty Joint | |||||||
| Repurchase Agreement (maturing on | |||||||
| 07/01/2010 in the amount of $2,010, | |||||||
| collateralized by FHLMC 5.00% - 5.50%, | |||||||
| 2038 - 2039, FNMA 5.00%, 2039, value of | |||||||
| $2,059) | |||||||
| 2,010 | 0.03%, 6/30/2010 | 2,010 | |||||
| UBS Securities, Inc. Repurchase Agreement | |||||||
| (maturing on 07/01/2010 in the amount of | |||||||
| $24, collateralized by U.S. Treasury Bill | |||||||
| 0.88%, 2011, value of $24) | |||||||
| 24 | 0.02%, 6/30/2010 | 24 | |||||
| UBS Securities, Inc. TriParty Joint Repurchase | |||||||
| Agreement (maturing on 07/01/2010 in the | |||||||
| amount of $509, collateralized by FNMA | |||||||
| 5.00% - 6.00%, 2033 - 2036, value of $519) | |||||||
| 509 | 0.09%, 6/30/2010 | 509 | |||||
| 8,196 | |||||||
| Total short-term investments | |||||||
| (cost $8,196) | $ | 8,196 | |||||
| Total investments | |||||||||
| (cost $476,823) ▲ | 100.3 | % | $ | 500,157 | |||||
| Other assets and liabilities | (0.3 | )% | (1,671 | ) | |||||
| Total net assets | 100.0 | % | $ | 498,486 | |||||
| Note: | Percentage of investments as shown is the ratio of the total market value to total net assets. Market value of investments in foreign securities represents 45.7% of total net assets at June 30, 2010. Foreign securities that are principally traded on certain foreign markets are adjusted daily pursuant to a third party pricing service methodology approved by the Board of Directors in order to reflect an adjustment for factors occurring after the close of the foreign market but before the close of the New York Stock Exchange. |
| ▲ | At June 30, 2010, the cost of securities for federal income tax purposes was $481,048 and the aggregate gross unrealized appreciation and depreciation based on that cost were: |
| Unrealized Appreciation | $ | 58,200 | ||
| Unrealized Depreciation | (39,091 | ) | ||
| Net Unrealized Appreciation | $ | 19,109 |
| † | The aggregate value of securities valued in good faith at fair value as determined under policies and procedures established by and under the supervision of the Fund's Board of Directors at June 30, 2010, was $4,497, which represents 0.90% of total net assets. This amount excludes securities that are principally traded in certain foreign markets and whose prices are adjusted pursuant to a third party pricing service methodology approved by the Board of Directors. |
| ● | Currently non-income producing. |
| § | These securities were sold to the Fund under Regulation S, rules governing offers and sales made outside the United States without registration under the Securities Act of 1933. The Fund may only be able to resell these securities in the United States if an exemption from registration under the federal and state securities laws is available, or the Fund may only be able to sell these securities outside of the United States (such as on a foreign exchange) to a non-U.S. person. Unless otherwise indicated, these holdings are determined to be liquid. At June 30, 2010, these securities amounted to $6,547 or 1.31% of total net assets. |
The accompanying notes are an integral part of these financial statements.
| Hartford Global Growth HLS Fund |
| Schedule of Investments – (continued) |
| June 30, 2010 (Unaudited) |
| (000’s Omitted) |
| ⌂ | The following securities are considered illiquid. Illiquid securities are often purchased in private placement transactions, are often not registered under the Securities Act of 1933 and may have contractual restrictions on resale. A security may also be considered illiquid if the security lacks a readily available market or if its valuation has not changed for a certain period of time. |
| Period | Shares/ | ||||||||
| Acquired | Par | Security | Cost Basis | ||||||
11/2008 - 03/2010 | 544 | Ping An Insurance (Group) Co. | $ | 2,711 | |||||
The aggregate value of these securities at June 30, 2010 was $4,497 which represents 0.90% of total net assets.
| ╪ | See Significant Accounting Policies of accompanying Notes to Financial Statements regarding valuation of securities. |
The accompanying notes are an integral part of these financial statements.
| Hartford Global Growth HLS Fund |
| June 30, 2010 (Unaudited) |
| (000’s Omitted) |
| Total | Level 1 ♦ | Level 2♦ | Level 3 | |||||||||||||
| Assets: | ||||||||||||||||
| Common Stocks | ||||||||||||||||
| Automobiles & Components | $ | 14,082 | $ | – | $ | 14,082 | $ | – | ||||||||
| Banks | 31,910 | 5,683 | 26,227 | – | ||||||||||||
| Capital Goods | 63,704 | 42,667 | 21,037 | – | ||||||||||||
| Consumer Durables & Apparel | 11,113 | – | 11,113 | – | ||||||||||||
| Consumer Services | 14,729 | 8,182 | 6,547 | – | ||||||||||||
| Diversified Financials | 24,379 | 18,079 | 6,300 | – | ||||||||||||
| Energy | 29,906 | 24,919 | 4,987 | – | ||||||||||||
| Food & Staples Retailing | 5,031 | – | 5,031 | – | ||||||||||||
| Food, Beverage & Tobacco | 12,763 | – | 12,763 | – | ||||||||||||
| Health Care Equipment & Services | 6,388 | 6,388 | – | – | ||||||||||||
| Household & Personal Products | 5,248 | – | 5,248 | – | ||||||||||||
| Insurance | 9,712 | 5,215 | – | 4,497 | ||||||||||||
| Materials | 35,043 | 7,822 | 27,221 | – | ||||||||||||
| Media | 7,913 | 2,972 | 4,941 | – | ||||||||||||
| Pharmaceuticals, Biotechnology & Life Sciences | 26,959 | 20,092 | 6,867 | – | ||||||||||||
| Real Estate | 6,151 | – | 6,151 | – | ||||||||||||
| Retailing | 52,012 | 30,762 | 21,250 | – | ||||||||||||
| Semiconductors & Semiconductor Equipment | 17,273 | 10,774 | 6,499 | – | ||||||||||||
| Software & Services | 42,457 | 42,457 | – | – | ||||||||||||
| Technology Hardware & Equipment | 57,676 | 51,864 | 5,812 | – | ||||||||||||
| Telecommunication Services | 5,440 | – | 5,440 | – | ||||||||||||
| Transportation | 12,072 | 6,290 | 5,782 | – | ||||||||||||
| Total | 491,961 | 284,166 | 203,298 | 4,497 | ||||||||||||
| Short-Term Investments | 8,196 | – | 8,196 | – | ||||||||||||
| Total | $ | 500,157 | $ | 284,166 | $ | 211,494 | $ | 4,497 | ||||||||
♦ For the period ended June 30, 2010, there were no significant transfers between Level 1 and Level 2.
Following is a reconciliation of Level 3 assets for which significant unobservable inputs were used to determine fair value:
Balance as | Change in | |||||||||||||||||||||||||||||||||||
of | Realized | Unrealized | Transfers | Transfers | Balance | |||||||||||||||||||||||||||||||
December | Gain | Appreciation | Net | Into | Out of | as of June | ||||||||||||||||||||||||||||||
31, 2009 | (Loss) | (Depreciation) | Amortization | Purchases | Sales | Level 3 * | Level 3* | 30, 2010 | ||||||||||||||||||||||||||||
Assets: | ||||||||||||||||||||||||||||||||||||
Common Stock | $ | — | $ | 62 | $ | (260 | )† | $ | — | $ | 842 | $ | (138 | ) | $ | 3,991 | $ | — | $ | 4,497 | ||||||||||||||||
Total | $ | — | $ | 62 | $ | (260 | ) | $ | — | $ | 842 | $ | (138 | ) | $ | 3,991 | $ | — | $ | 4,497 | ||||||||||||||||
| * | Securities are transferred into and out of Level 3 for a variety of reasons including, but not limited to: |
1) | Securities where trading has been halted- transfer into Level 3 versus securities where trading has resumed - transfer out of Level 3. |
2) | Broker quoted securities - transfer into Level 3 versus quoted prices in active markets - transfer out of Level 3. |
3) | Securities that have certain restrictions on trading - transfer into Level 3 versus securities where trading restrictions have expired - transfer out of Level 3. |
| † | Change in unrealized gains or losses in the current period relating to assets still held at June 30, 2010 was $(260). |
The accompanying notes are an integral part of these financial statements.
| Hartford Global Growth HLS Fund |
| June 30, 2010 (Unaudited) |
| (000’s Omitted) |
| Assets: | ||||
| Investments in securities, at market value (cost $476,823) | $ | 500,157 | ||
| Cash | — | |||
| Foreign currency on deposit with custodian (cost $—) | — | |||
| Receivables: | ||||
| Investment securities sold | 8,095 | |||
| Fund shares sold | 264 | |||
| Dividends and interest | 434 | |||
| Other assets | 2 | |||
| Total assets | 508,952 | |||
| Liabilities: | ||||
| Payables: | ||||
| Investment securities purchased | 10,006 | |||
| Fund shares redeemed | 295 | |||
| Investment management fees | 86 | |||
| Distribution fees | 6 | |||
| Accrued expenses | 73 | |||
| Total liabilities | 10,466 | |||
| Net assets | $ | 498,486 | ||
| Summary of Net Assets: | ||||
| Capital stock and paid-in-capital | $ | 719,540 | ||
| Accumulated undistributed net investment income | 1,219 | |||
| Accumulated net realized loss on investments and foreign currency transactions | (245,617 | ) | ||
| Unrealized appreciation of investments and the translations of assets and liabilities denominated in foreign currency | 23,344 | |||
| Net assets | $ | 498,486 | ||
| Shares authorized | 3,400,000 | |||
| Par value | $ | 0.001 | ||
Class IA: Net asset value per share | $ | 12.04 | ||
| Shares outstanding | 33,128 | |||
| Net assets | $ | 398,963 | ||
Class IB: Net asset value per share | $ | 11.96 | ||
| Shares outstanding | 8,319 | |||
| Net assets | $ | 99,523 | ||
The accompanying notes are an integral part of these financial statements.
| Hartford Global Growth HLS Fund |
| For the Six-Month Period Ended June 30, 2010 (Unaudited) |
| (000’s Omitted) |
| Investment Income: | ||||
| Dividends | $ | 3,862 | ||
| Interest | 14 | |||
| Less: Foreign tax withheld | (333 | ) | ||
| Total investment income, net | 3,543 | |||
| Expenses: | ||||
| Investment management fees | 1,937 | |||
| Administrative service fees | 191 | |||
| Transfer agent fees | 1 | |||
| Distribution fees - Class IB | 146 | |||
| Custodian fees | 17 | |||
| Accounting services fees | 40 | |||
| Board of Directors' fees | 8 | |||
| Audit fees | 8 | |||
| Other expenses | 125 | |||
| Total expenses (before fees paid indirectly) | 2,473 | |||
| Commission recapture | (7 | ) | ||
| Total fees paid indirectly | (7 | ) | ||
| Total expenses, net | 2,466 | |||
| Net investment income | 1,077 | |||
| Net Realized Gain on Investments and Foreign Currency Transactions: | ||||
| Net realized gain on investments | 14,569 | |||
| Net realized loss on forward foreign currency contracts | (71 | ) | ||
| Net realized gain on other foreign currency transactions | 51 | |||
| Net Realized Gain on Investments and Foreign Currency Transactions | 14,549 | |||
| Net Changes in Unrealized Depreciation of Investments and Foreign Currency Transactions: | ||||
| Net unrealized depreciation of investments | (86,076 | ) | ||
| Net unrealized appreciation of forward foreign currency contracts | 3 | |||
| Net unrealized depreciation on translation of other assets and liabilities in foreign currencies | (8 | ) | ||
| Net Changes in Unrealized Depreciation of Investments and Foreign Currency Transactions | (86,081 | ) | ||
| Net Loss on Investments and Foreign Currency Transactions | (71,532 | ) | ||
| Net Decrease in Net Assets Resulting from Operations | $ | (70,455 | ) | |
The accompanying notes are an integral part of these financial statements.
| Hartford Global Growth HLS Fund |
| (000’s Omitted) |
| For the | ||||||||
| Six-Month | For the | |||||||
| Period Ended | Year Ended | |||||||
| June 30, 2010 | December 31, | |||||||
| (Unaudited) | 2009 | |||||||
| Operations: | ||||||||
| Net investment income | $ | 1,077 | $ | 3,404 | ||||
| Net realized gain (loss) on investments and foreign currency transactions | 14,549 | (107,103 | ) | |||||
| Net unrealized appreciation (depreciation) of investments and foreign currency transactions | (86,081 | ) | 272,335 | |||||
| Payment from affiliate | — | 220 | ||||||
| Net increase (decrease) in net assets resulting from operations | (70,455 | ) | 168,856 | |||||
| Distributions to Shareholders: | ||||||||
| From net investment income | ||||||||
| Class IA | — | (3,156 | ) | |||||
| Class IB | — | (537 | ) | |||||
| Total distributions | — | (3,693 | ) | |||||
| Capital Share Transactions: | ||||||||
| Class IA | ||||||||
| Sold | 13,944 | 28,045 | ||||||
| Issued on reinvestment of distributions | — | 3,156 | ||||||
| Redeemed | (47,469 | ) | (92,620 | ) | ||||
| Total capital share transactions | (33,525 | ) | (61,419 | ) | ||||
| Class IB | ||||||||
| Sold | 6,367 | 11,377 | ||||||
| Issued on reinvestment of distributions | — | 537 | ||||||
| Redeemed | (18,941 | ) | (32,027 | ) | ||||
| Total capital share transactions | (12,574 | ) | (20,113 | ) | ||||
| Net decrease from capital share transactions | (46,099 | ) | (81,532 | ) | ||||
| Net increase (decrease) in net assets | (116,554 | ) | 83,631 | |||||
| Net Assets: | ||||||||
| Beginning of period | 615,040 | 531,409 | ||||||
| End of period | $ | 498,486 | $ | 615,040 | ||||
Accumulated undistributed (distribution in excess of) net investment income | $ | 1,219 | $ | 142 | ||||
| Shares: | ||||||||
| Class IA | ||||||||
| Sold | 1,012 | 2,451 | ||||||
| Issued on reinvestment of distributions | — | 237 | ||||||
| Redeemed | (3,534 | ) | (8,240 | ) | ||||
| Total share activity | (2,522 | ) | (5,552 | ) | ||||
| Class IB | ||||||||
| Sold | 468 | 1,001 | ||||||
| Issued on reinvestment of distributions | — | 41 | ||||||
| Redeemed | (1,413 | ) | (2,865 | ) | ||||
| Total share activity | (945 | ) | (1,823 | ) | ||||
The accompanying notes are an integral part of these financial statements.
| Hartford Global Growth HLS Fund |
June 30, 2010 (Unaudited) |
| (000’s Omitted) |
| 1. | Organization: |
Hartford Global Growth HLS Fund (the "Fund") serves as an underlying investment option for certain variable annuity and variable life insurance separate accounts of Hartford Life Insurance Company (“HLIC”) and its affiliates and certain qualified retirement plans. The Fund may also serve as an underlying investment option for certain variable annuity and variable life separate accounts of other insurance companies. Owners of variable annuity contracts and policyholders of variable life insurance contracts may choose the funds permitted in the variable insurance contract prospectus. In addition, participants in certain qualified retirement plans may choose the fund if permitted by their plans.
Hartford Series Fund, Inc. (the “Company”) is an open-end registered management investment company comprised of twenty-nine portfolios, one portfolio of which is included in these financial statements.
The Company is organized under the laws of the State of Maryland and is registered with the Securities and Exchange Commission (“SEC”) under the Investment Company Act of 1940, as amended (“1940 Act”). The Fund is organized as a diversified open-end management investment company.
The Fund is divided into Class IA and Class IB shares. Each class is offered at the per share net asset value (“NAV”) without a sales charge and is subject to the same expenses, except that the Class IB shares are subject to distribution and service fees charged pursuant to a Distribution and Service Plan adopted in accordance with Rule 12b-1 under the 1940 Act.
| 2. | Significant Accounting Policies: |
The following is a summary of significant accounting policies of the Fund, which are in accordance with U.S. Generally Accepted Accounting Principles (“GAAP”).
| a) | Security Transactions and Investment Income – Security transactions are recorded on the trade date (the date the order to buy or sell is executed). Security gains and losses are determined on the basis of identified cost. |
Dividend income is accrued as of the ex-dividend date, except that certain dividends for foreign securities where the ex-dividend date may have passed are recorded as soon as the Fund is informed of the dividend in the exercise of reasonable diligence. Interest income, including amortization of premium and accretion of discounts, is accrued on a daily basis.
| b) | Security Valuation – The Fund generally uses market prices in valuing portfolio securities. If market prices are not readily available or are deemed unreliable, the Fund will use the fair value of the security as determined in good faith under policies and procedures established by and under the supervision of the Fund’s Board of Directors. Market prices may be deemed unreliable, for example, if a security is thinly traded or if an event has occurred after the close of the security’s primary market, but before the close of the New York Stock Exchange (the “Exchange”) (generally 4:00 p.m. Eastern Time, referred to as the “Valuation Time”) that is expected to affect the value of the portfolio security. The circumstances in which the Fund may use fair value pricing include, among others: (i) the occurrence of events that are significant to a particular issuer, such as mergers, restructuring or defaults; (ii) the occurrence of events that are significant to an entire market, such as natural disasters in a particular region or governmental actions; (iii) trading restrictions on securities; (iv) thinly traded securities and (v) market events such as trading halts and early market closings. In addition, with respect to the valuation of stocks primarily traded on foreign markets, the Fund uses a fair value pricing service approved by the Fund’s Board of Directors, which employs quantitative models that evaluate changes in the value of foreign market proxies (e.g., futures contracts, American Depositary Receipts (“ADRs”), exchange traded funds (“ETFs”)) after the close of the foreign markets but before the Valuation Time. Securities that are primarily traded on foreign markets may trade on days that are not business days of the Fund. The value of the foreign securities in which the Fund invests may change on days when a shareholder will not be able to purchase or redeem shares of the Fund. Fair value pricing is subjective in nature and the use of fair value pricing by the Fund may cause the NAV of its shares to differ significantly from the NAV that would have been calculated using market prices at the close of the exchange on which a portfolio security is primarily traded but before the Valuation Time. There can be no |
| Hartford Global Growth HLS Fund |
| Notes to Financial Statements – (continued) |
| June 30, 2010 (Unaudited) |
| (000’s Omitted) |
assurance that the Fund could obtain the fair value assigned to a security if the Fund were to sell the security at approximately the time at which the Fund determines its NAV.
Exchange-traded equity securities are valued at the last reported sale price or official close price on the exchange or market on which the security is primarily traded (the “Primary Market”) at the Valuation Time. If the security did not trade on the Primary Market, it may be valued at the Valuation Time at the last reported sale price on another exchange where it trades. The value of an equity security not traded on any exchange but traded on the Nasdaq Stock Market, Inc. or another over-the-counter market shall be valued at the last reported sale price or official closing price on the exchange or market on which the security is traded as of the Valuation Time.
Foreign-denominated assets, including investment securities, and liabilities are translated from the local currency into U.S. dollars using exchange rates obtained from an independent third party as of the Fund’s Valuation Time.
Financial instruments for which prices are not available from an independent pricing service may be valued using market quotations obtained from one or more dealers that make markets in securities in accordance with procedures established by the Fund’s Board of Directors.
Forward foreign currency contracts represent agreements to exchange currencies on specific future dates at predetermined rates. Forward foreign currency contracts are valued using foreign currency exchange rates and forward rates on the Valuation Date from an independent pricing service.
Other derivative or contractual type instruments shall be valued using market prices if such instruments trade on an exchange or market. If such instruments do not trade on an exchange or market, such instruments shall be valued at a price at which the counterparty to such contract would repurchase the instrument. In the event that the counterparty cannot provide a price, such valuation may be determined in accordance with procedures established by the Fund’s Board of Directors.
Various inputs are used in determining the value of the Fund’s investments. These inputs are summarized into three broad hierarchy levels. This hierarchy is based on whether the valuation inputs are observable or unobservable. These levels are:
| · | Level 1 – Quoted prices in active markets for identical securities. Level 1 may include exchange-traded instruments such as domestic equities, some foreign equities, options, futures, mutual funds, ETFs, and rights and warrants. |
| · | Level 2 – Observable inputs other than Level 1 prices, such as quoted prices for similar securities; quoted prices in markets that are not active; or other inputs that are observable or can be corroborated by observable market data. Level 2 may include debt securities that are traded less frequently than exchange-traded instruments and which are valued using third party pricing services. Prices for most level 2 securities are based on prices received from an independent pricing service. The following asset classes generally use valuation techniques and inputs as noted below: |
Asset Backed Securities and Collateralized Mortgage Obligations – Multi-dimensional spread/prepayment speed tables, with consideration of yield or price of bonds of comparable quality, coupon and maturity, attributes of the collateral, new issue data and monthly payment information.
Corporate Bonds – Multi-dimensional relational model based on observable market information such as yields, spreads, sector analysis, etc.
Foreign Currency – Based on rates determined at the close of the Exchange, provided by an independent pricing service.
Forward Currency Contracts – Valued based on the price of the underlying currency at the prevailing interpolated exchange rate, which is a combination of the spot currency rate and the forward currency rate, provided by an independent pricing service.
Foreign Equities – Certain foreign equities are priced using a multi-factor regression model with market observable inputs of a correlative nature (ADRs, futures contracts, ETFs, and currency exchange rates).
International Fixed Income – Multi-dimensional relational model based on observable market information such as benchmark yields, reported trades, bids and offers.
Money Market Instruments – Amortized cost.
Mortgage Backed Securities (“MBS”) – Matrix pricing using inputs of To-Be-Announced (“TBA”) prices, new issue data and monthly payment information, with consideration of yield or price of bonds of comparable quality, coupon and maturity, and attributes of the collateral.
Municipal Bonds – Multi-dimensional relational model and series of matrices based on observable market information such as Municipal Securities Rulemaking Board reported trades, comparable bonds, yields, spreads and credit analysis.
Preferred Stocks – Close mean of bid/ask or bid.
Repurchase Agreements – Priced at par.
Senior Floating Rate Interests – Composite of quotes from one or more contributing dealers.
Swaps – Price based upon observable market information from an independent pricing service.
U.S. Government Securities – Treasuries exclusively traded in the secondary market.
| • | Level 3 – Significant unobservable inputs that are supported by limited or no market activity. Level 3 may include financial instruments whose values are determined using broker quotes or require significant management judgment or estimation. While these securities are priced using unobservable inputs, the valuation of these securities reflects the best available data and management believes the prices are a reasonable representation of exit price. The following asset classes generally use valuation techniques and inputs as noted below: |
Asset Backed Securities & Commercial Mortgage Backed Securities – Certain other MBS with limited liquidity priced from an independent pricing service.
Common Stocks – Trading has been halted or there are restrictions on trading. Valuation is based on last trade with the application of a discount or premium, if applicable.
Long Dated Over-the-Counter Options – Terms greater than 10 years from current date, expected volatility is not observable. Prices are from an independent pricing service.
Long Term Debt Securities, including Senior Floating Rate Interests – Unobservable valuation inputs may include estimates for current yields, maturity/duration, prepayment speed, and broker quotes for comparable securities along with other assumptions relating to credit quality, collateral value, complexity of the security structure, general market conditions and liquidity.
| Hartford Global Growth HLS Fund |
| Notes to Financial Statements – (continued) |
| June 30, 2010 (Unaudited) |
| (000’s Omitted) |
Swaps – Terms greater than 10 years from current date, expected volatility is not observable. Prices are from an independent pricing service.
Individual securities within any of the above mentioned asset classes may be assigned a different hierarchical level than those that are presented above, as individual circumstances dictate.
For purposes of reporting transfers between different hierarchy levels, both transfers in and out of each level are shown as if they occurred at the beginning of the period.
Refer to the Investment Valuation Hierarchy Levels Summary and the Level 3 roll forward reconciliation found following the Schedules of Investments.
| c) | Foreign Currency Transactions – Assets and liabilities denominated in currencies other than U.S. dollars are translated into U.S. dollars at the exchange rates in effect on the valuation date. Purchases and sales of investment securities, income and expenses are translated into U.S. dollars at the exchange rates on the dates of such transactions. |
The Fund does not isolate that portion of portfolio security valuation resulting from fluctuations in the foreign currency exchange rates from the fluctuations arising from changes in the market prices of securities held. Exchange rate fluctuations are included with the net realized and unrealized gain or loss on investments in the accompanying financial statements.
Net realized foreign exchange gains or losses arise from sales of foreign currencies and the difference between asset and liability amounts initially stated in foreign currencies and the U.S. dollar value of the amounts actually received or paid. Net unrealized foreign exchange gains or losses arise from changes in the value of other assets and liabilities at the end of the reporting period, resulting from changes in the exchange rates.
| d) | Joint Trading Account – Pursuant to an exemptive order issued by the SEC, the Fund may transfer uninvested cash balances into a joint trading account managed by Wellington Management Company, LLP (“Wellington Management”). These balances may be invested in one or more repurchase agreements and/or short-term money market instruments. |
| e) | Repurchase Agreements – A repurchase agreement is an agreement by which a counterparty agrees to sell a security and agrees to repurchase the security sold at a mutually agreed upon time and price. At the time the Fund enters into a repurchase agreement, the value of the underlying collateral security(ies), including accrued interest, will be equal to or exceed the value of the repurchase agreement. To minimize counterparty risk, the securities that serve to collateralize the repurchase agreement are held by the Fund's custodian in book entry or physical form in the custodial account of the Fund or in a third party custodial account. Repurchase agreements are valued at cost plus accrued interest. The Fund, as shown on the Schedule of Investments, had outstanding repurchase agreements as of June 30, 2010. |
| f) | Forward Foreign Currency Contracts – The Fund may enter into forward foreign currency contracts that obligate the Fund to purchase or sell currencies at specified future dates. Forward foreign currency contracts may be used to hedge against adverse fluctuations in exchange rates between currencies. |
Forward foreign currency contracts involve elements of market risk in excess of the amounts reflected in the Statement of Assets and Liabilities. In addition, risks may arise upon entering into these contracts from the potential inability of the counterparties to meet the terms of the contracts and from unanticipated movements in the value of the foreign currencies relative to the U.S. dollar. The Fund had no outstanding forward foreign currency contracts as of June 30, 2010.
| g) | Fund Share Valuation and Dividend Distributions to Shareholders – Orders for the Fund’s shares are executed in accordance with the investment instructions of the contract holders or plan participants. The NAV of the Fund’s shares is determined as of the close of each business day of the Exchange. The NAV is determined separately for each class of the Fund by dividing the Fund’s net assets attributable to that class by the number of outstanding shares of the class. Orders for the purchase of the Fund’s shares received by an insurance company or plan prior to the close of the Exchange on any |
day on which the Exchange is open for business are priced at the NAV determined as of the close of the Exchange. Orders received by an insurance company or plan after the close of the Exchange, or on a day on which the Exchange and/or the Fund is not open for business, are priced at the next determined NAV.
Dividends are declared pursuant to a policy adopted by the Fund’s Board of Directors based upon the investment performance of the Fund. The policy of the Fund is to pay dividends from net investment income and distribute realized capital gains, if any, at least once a year.
Distributions from net investment income, realized capital gains and capital are determined in accordance with federal income tax regulations, which may differ from U.S. GAAP with respect to character and timing. These differences may include but are not limited to losses deferred due to wash sale adjustments, foreign currency gains and losses, adjustments related to Passive Foreign Investment Companies (“PFICs”), Real Estate Investment Trusts (“REITs”), Regulated Investment Companies (“RICs”), certain derivatives and partnerships. Permanent book and federal income tax basis differences relating to shareholder distributions will result in reclassifications to certain of the Fund’s capital accounts (see Federal Income Taxes: Reclassification of Capital Accounts note).
| h) | Illiquid and Restricted Securities – The Fund is permitted to invest up to 15% of its net assets in illiquid securities. “Illiquid Securities” are those that may not be sold or disposed of in the ordinary course of business within seven days, at approximately the price used to determine the Fund’s NAV. The Fund may not be able to sell illiquid securities or other investments when its sub-adviser considers it desirable to do so or may have to sell such securities or investments at a price that is lower than the price that could be obtained if the securities or investments were more liquid. A sale of illiquid securities or other investments may require more time and may result in higher dealer discounts and other selling expenses than does the sale of those that are liquid. Illiquid securities and investments also may be more difficult to value, due to the unavailability of reliable market quotations for such securities or investments, and an investment in them may have an adverse impact on the Fund’s NAV. The Fund may also purchase certain restricted securities, commonly known as Rule 144A securities, that can be resold to institutions and which may be determined to be liquid pursuant to policies and guidelines established by the Fund’s Board of Directors. The Fund, as shown on the Schedule of Investments, had illiquid and/or restricted securities as of June 30, 2010. |
| i) | Securities Purchased on a When-Issued or Delayed-Delivery Basis – Delivery and payment for securities that have been purchased by the Fund on a forward commitment, or when-issued or delayed-delivery basis, take place beyond the customary settlement period. During this period, such securities are subject to market fluctuations, and the Fund identifies securities segregated in its records with value at least equal to the amount of the commitment. As of June 30, 2010, the Fund had no outstanding when-issued or delayed delivery securities. |
| j) | Use of Estimates – The preparation of financial statements in conformity with U.S. GAAP requires management to make estimates and assumptions that affect the reported amounts of assets and liabilities as of the date of the financial statements and the reported amounts of income and expenses during the period. Operating results in the future could vary from the amounts derived from management’s estimates. |
| k) | Additional Derivative Instrument(s) Information |
The volume of derivative activity was minimal during the six-month period ended June 30, 2010.
| Hartford Global Growth HLS Fund |
| Notes to Financial Statements – (continued) |
| June 30, 2010 (Unaudited) |
| (000’s Omitted) |
Realized Gain/Loss and Change in Unrealized Appreciation (Depreciation) on Derivative Instruments for the six-month period ended June 30, 2010:
| Amount of Realized Gain or (Loss) on Derivatives Recognized in Income | ||||||||||||||||||||||||
| Forward | ||||||||||||||||||||||||
| Purchased | Currency | |||||||||||||||||||||||
| Risk Exposure Category | Written Options | Options | Futures | Contracts | Swaps | Total | ||||||||||||||||||
| Foreign exchange contracts | $ | — | $ | — | $ | — | $ | (71 | ) | $ | — | $ | (71 | ) | ||||||||||
| Total | $ | — | $ | — | $ | — | $ | (71 | ) | $ | — | $ | (71 | ) | ||||||||||
| Change in Unrealized Appreciation or (Depreciation) on Derivatives Recognized in Income | ||||||||||||||||||||||||
| Forward | ||||||||||||||||||||||||
| Purchased | Currency | |||||||||||||||||||||||
| Risk Exposure Category | Written Options | Options | Futures | Contracts | Swaps | Total | ||||||||||||||||||
| Foreign exchange contracts | — | — | — | 3 | — | $ | 3 | |||||||||||||||||
| Total | $ | — | $ | — | $ | — | $ | 3 | $ | — | $ | 3 | ||||||||||||
| l) | Indemnifications – Under the Company’s organizational documents, the Company shall indemnify its officers and directors to the full extent required or permitted under Maryland General Corporation Law and the federal securities laws. In addition, the Company, on behalf of the Fund, may enter into contracts that contain a variety of indemnifications. The Company’s maximum exposure under these arrangements is unknown. However, the Company has not had prior claims or losses pursuant to these contracts and expects the risk of loss to be remote. |
| 3. | Federal Income Taxes: |
| a) | Federal Income Taxes – For federal income tax purposes, the Fund intends to continue to qualify as a RIC under Subchapter M of the Internal Revenue Code (“IRC”) by distributing substantially all of its taxable net investment income and net realized capital gains to its shareholders and otherwise complying with the requirements of RICs. The Fund has distributed substantially all of its income and capital gains in prior years and intends to distribute substantially all of its income and capital gains prior to the next fiscal year end. Accordingly, no provision for federal income or excise taxes has been made in the accompanying financial statements. Distributions from short-term capital gains are treated as ordinary income distributions for federal income tax purposes. |
| b) | Net Investment Income (Loss), Net Realized Gains (Losses) – Net investment income (loss) and net realized gains (losses) may differ for financial statement and tax purposes primarily because of losses deferred due to wash sale adjustments, foreign currency gains and losses, adjustments related to PFICs, REITs, RICs, certain derivatives and partnerships. The character of distributions made during the year from net investment income or net realized gains may differ from their ultimate characterization for federal income tax purposes. Also, due to the timing of dividend distributions, the fiscal year in which amounts are distributed may differ from the year that the income or realized gains (losses) were recorded by the Fund. |
| c) | Distributions and Components of Distributable Earnings – The tax character of distributions paid by the Fund for the periods indicated is as follows (as adjusted for dividends payable): |
| For the Year Ended | For the Year Ended | |||||||
| December 31, 2009 | December 31, 2008 | |||||||
| Ordinary Income | $ | 3,693 | $ | 9,441 | ||||
| Long-Term Capital Gains* | — | 34,060 | ||||||
| * | The Fund designates these distributions as long-term capital dividends pursuant to IRC code Sec. 852(b)(3)(C). |
As of December 31, 2009, the Fund’s components of distributable earnings (deficit) on a tax basis were as follows:
| Amount | ||||
| Undistributed Ordinary Income | $ | 139 | ||
| Accumulated Capital and Other Losses* | (255,942 | ) | ||
Unrealized Appreciation† | 105,204 | |||
| Total Accumulated Deficit | $ | (150,599 | ) | |
| * | The Fund has capital loss carryforwards that are identified in the Capital Loss Carryforward note that follows. |
| † | The difference between book-basis and tax-basis unrealized appreciation (depreciation) may be attributable to the losses deferred due to wash sale adjustments, foreign currency gains and losses, adjustments related to PFICs, REITs, RICs, certain derivatives and partnerships. |
| d) | Reclassification of Capital Accounts – The Fund may record reclassifications in its capital accounts. These reclassifications have no impact on the total net assets of the Fund. The reclassifications are a result of permanent differences between GAAP and tax accounting for such items as net operating losses that reduce distribution requirements. Adjustments are made to reflect the impact these items have on current and future distributions to shareholders. Therefore, the source of the Fund’s distributions may be shown in the accompanying Statement of Changes in Net Assets as from net investment income, from net realized gains on investments or from capital depending on the type of book and tax differences that exist. For the year ended December 31, 2009, the Fund recorded reclassifications to increase (decrease) the accounts listed below: |
| Amount | ||||
| Accumulated Undistributed Net Investment Income | $ | (59 | ) | |
| Accumulated Net Realized Gain (Loss) on Investments | 59 | |||
| e) | Capital Loss Carryforward – At December 31, 2009 (tax-year-end), the Fund had capital loss carryforwards for U.S. federal income tax purposes of approximately: |
| Year of Expiration | Amount | |||
| 2016 | $ | 92,362 | ||
| 2017 | 162,380 | |||
| Total | $ | 254,742 | ||
| As of December 31, 2009, the Fund elected to defer the following post October losses. | ||||
| Amount | ||||
| Long-Term Capital Gain | $ | 1,200 | ||
| f) | Accounting for Uncertainty in Income Taxes – Management has evaluated all open tax years and has determined there is no impact to the Fund’s financial statements related to uncertain tax positions. Generally, tax authorities can examine all tax returns filed for the last three years. |
| Hartford Global Growth HLS Fund |
| Notes to Financial Statements – (continued) |
| June 30, 2010 (Unaudited) |
| (000’s Omitted) |
| 4. | Expenses: |
| a) | Investment Management Agreements – HL Investment Advisors, LLC (“HL Advisors”), an indirect wholly-owned subsidiary of The Hartford Financial Services Group, Inc. (“The Hartford”), serves as investment manager to the Fund pursuant to an Investment Management Agreement with the Company. As investment manager, HL Advisors has overall investment supervisory responsibility for the Fund. In addition, HL Advisors provides administrative personnel, services, equipment, facilities and office space for proper operation of the Fund. |
HL Advisors has contracted with Wellington Management for the provision of day-to-day investment management services to the Fund in accordance with the Fund’s investment objective and policies. The Fund pays a fee to HL Advisors, a portion of which may be used to compensate Wellington Management.
| b) | Administrative Services Agreement – For the two-month period January 1, 2010 through February 28, 2010, under the Administrative Services Agreement between HLIC and the Company, on behalf of the Fund, HLIC provided administrative services to the Fund and received monthly compensation at the annual rate of 0.20% of the Fund’s average daily net assets. The Fund assumed and paid certain other expenses (including, but not limited to, accounting, custodian, state taxes and Directors’ fees). Effective March 1, 2010, the Investment Management Agreement was amended to include the administrative services for the Fund and the separate administrative services agreement was terminated. |
The schedule below reflects the rates of compensation paid to HL Advisors for investment management services and to HLIC for administrative services rendered from January 1, 2010 through February 28, 2010, and the rates of compensation paid to the HL Advisors for the combined services from March 1, 2010 through June 30, 2010; the rates are accrued daily and paid monthly.
| Average Daily Net Assets | Annual Fee | |||
| On first $250 million | 0.7750 | % | ||
| On next $250 million | 0.7250 | % | ||
| On next $500 million | 0.6750 | % | ||
| On next $4 billion | 0.6250 | % | ||
| On next $5 billion | 0.6225 | % | ||
| Over $10 billion | 0.6200 | % | ||
| c) | Accounting Services Agreement – Pursuant to the Fund Accounting Agreement between HLIC and the Company, on behalf of the Fund, HLIC provides accounting services to the Fund and receives monthly compensation on the Fund’s average net assets. The Fund’s accounting services fees are accrued daily and paid monthly. |
| Average Daily Net Assets | Annual Fee | |||
| On first $5 billion | 0.014 | % | ||
| On next $5 billion | 0.012 | % | ||
| Over $10 billion | 0.010 | % | ||
| d) | Operating Expenses – Allocable expenses incurred by the Company are allocated to each Fund and allocated to classes within the Fund in proportion to the average daily net assets of the Fund and each class, except where allocation of certain expenses is more fairly made directly to the Fund or to specific classes within a Fund. |
| e) | Fees Paid Indirectly – The Company, on behalf of the Fund has entered into agreements with State Street Global Advisers, LLC and Russell Implementation Securities, Inc. to partially recapture non-discounted trade commissions. Such rebates are used to pay a portion of the Fund’s expenses. In addition, the Fund’s custodian bank has also agreed to reduce its fees when the Fund maintains cash on deposit in a non-interest-bearing custody account. For the six-month period ended June 30, 2010, these amounts are included in the Statement of Operations. |
The ratio of expenses to average net assets in the accompanying financial highlights excludes the reduction in expenses related to fees paid indirectly. Had the fees paid indirectly been included, the annualized expense ratio for the periods listed below would have been as follows:
| Annualized | ||||||||||||||||||||||||
| Six-Month | Year Ended | Year Ended | Year Ended | Year Ended | Year Ended | |||||||||||||||||||
| Period Ended | December 31, | December 31, | December 31, | December 31, | December 31, | |||||||||||||||||||
| June 30, 2010 | 2009 | 2008 | 2007 | 2006 | 2005 | |||||||||||||||||||
| Class IA | 0.81 | % | 0.81 | % | 0.74 | % | 0.73 | % | 0.74 | % | 0.68 | % | ||||||||||||
| Class IB | 1.06 | 1.06 | 0.99 | 0.98 | 0.99 | 0.93 | ||||||||||||||||||
| f) | Distribution Plan for Class IB shares – The Company, on behalf of the Fund, has adopted a Distribution Plan pursuant to Rule 12b-1 under the 1940 Act for the Class IB shares. Pursuant to the Distribution Plan, the Fund is authorized to compensate the Distributor, Hartford Securities Distribution Company, Inc. (a wholly owned, ultimate subsidiary of The Hartford), from assets attributable to the Class IB shares for services rendered and expenses borne in connection with activities primarily intended to result in the sale of the Class IB shares, subject to the Fund Board’s review and approval. |
The Distribution Plan provides that the Fund may pay annually up to 0.25% of the average daily net assets of the Fund attributable to its Class IB shares for activities primarily intended to result in the sale of Class IB shares. The Board has the authority to suspend or reduce these payments at any point in time. Under the terms of the Distribution Plan and the principal underwriting agreement, the Fund is authorized to make payments monthly to the Distributor which may be used to pay or compensate entities providing distribution and shareholder servicing with respect to the Class IB shares for such entities’ fees or expenses incurred or paid in that regard. These fees are accrued daily and paid monthly.
| g) | Other Related Party Transactions – Certain officers of the Fund are directors and/or officers of HL Advisors, and/or The Hartford or its subsidiaries. For the six-month period ended June 30, 2010, a portion of the Fund’s chief compliance officer’s salary was paid by all the investment companies in the Hartford fund complex. The portion allocated to the Fund was in the amount of $1. Hartford Investor Services Company, LLC ("HISC"), a wholly owned subsidiary of The Hartford, provides transfer agent services to the Fund. The amount HISC was compensated for providing such services can be found on the Statement of Operations. These fees are accrued daily and paid monthly. |
| h) | Payment from Affiliate – In July of 2007, The Hartford entered into a settlement with the Attorneys General of the states of New York, Connecticut and Illinois relating to market timing and the company's individual variable annuity contracts in which certain payments would be made directly to the variable annuity contract holders. The distribution plan provides that unclaimed money from the settlement would be distributed to certain HLS Funds that are investment options through a Hartford individual variable annuity contract. The unclaimed money was distributed to the Fund on September 18, 2009, as follows: |
| Amount | ||||
| Reimbursement | $ | 220 | ||
On November 8, 2006, the SEC issued an order setting forth the terms of a settlement reached with three subsidiaries of The Hartford that resolves the SEC’s Division of Enforcement’s investigation of aspects of The Hartford’s variable
| Hartford Global Growth HLS Fund |
| Notes to Financial Statements – (continued) |
| June 30, 2010 (Unaudited) |
| (000’s Omitted) |
annuity and mutual fund operations related to directed brokerage and revenue sharing. The Hartford settled this matter without admitting or denying the findings of the SEC.
The Fund is available for purchase by the separate accounts of different variable universal life policies, variable annuity products, and funding agreements and it is offered directly to certain qualified retirement plans (collectively “Products”). Although existing Products contain transfer restrictions, some Products, particularly older variable annuity products, do not contain restrictions on the frequency of transfers. In addition, as the result of the settlement of litigation against Hartford Life, Inc. (“Hartford Life”) (the issuers of such variable annuity products), the Fund’s ability to restrict transfers by certain owners of older variable annuity products was limited. During 2006, these annuity owners surrendered the older variable annuity contracts that were the subject of prior litigation. In February 2005, Hartford Life agreed with the Board of Directors of the Fund to indemnify the Fund for any material harm caused to the Fund from frequent trading by these contracts owners.
The total return in the accompanying financial highlights includes payment from affiliates. Had the payment from affiliates been excluded, the total return for the periods listed below would have been as follows:
| For the Year Ended December 31, 2009 | ||||||||
| Class IA | Class IB | |||||||
| Impact from Payment from Affiliate for Attorneys General Settlement | 0.04 | % | 0.04 | % | ||||
| Total Return Excluding Payments from Affiliate | 35.59 | 35.26 | ||||||
| For the Year Ended December 31, 2006 | ||||||||
| Class IA | Class IB | |||||||
| Impact from Payment from Affiliate for SEC Settlement | 0.31 | % | 0.32 | % | ||||
| Total Return Excluding Payments from Affiliate | 13.83 | 13.54 | ||||||
| 5. | Investment Transactions: |
For the six-month period ended June 30, 2010, the cost of purchases and proceeds from sales of investment securities (excluding short-term investments) were as follows:
| Amount | ||||
| Cost of Purchases Excluding U.S. Government Obligations | $ | 174,687 | ||
| Sales Proceeds Excluding U.S. Government Obligations | 221,895 | |||
| 6. | Line of Credit: |
The Fund is one of several Hartford funds that participate in a $500 million committed revolving line of credit facility. The facility is to be used for temporary or emergency purposes. Under the arrangement, a fund is required to own securities having a market value in excess of 300% of the total bank borrowings. The interest rate on borrowings varies depending on the nature of the loan. The facility also requires a fee to be paid based on the amount of the commitment. This fee is allocated to all the funds participating in the line of credit based on the average net assets of the funds. During the six-month period ended June 30, 2010, the Fund did not have any borrowings under this facility.
| 7. | Industry Classifications: |
Other than the industry classifications “Other Investment Pools and Funds” and “Exchange Traded Funds”, equity industry classifications used in this report are the Global Industry Classification Standard, which was developed by and is the exclusive property and service mark of MSCI, Inc. and Standard & Poor’s.
[This page is intentionally left blank]
| Hartford Global Growth HLS Fund |
| - Selected Per-Share Date (A) - |
Net Asset | Net Realized | |||||||||||||||||||||||||||||||||||||||||||
Value at | Payments | and Unrealized | Total from | Dividends from | Distributions | Net Increase | Net Asset | |||||||||||||||||||||||||||||||||||||
Beginning of | Net Investment | from (to) | Gain (Loss) on | Investment | Net Investment | from Realized | Distributions | Total | (Decrease) in | Value at End | ||||||||||||||||||||||||||||||||||
Class | Period | Income (Loss) | Affiliate | Investments | Operations | Income | Capital Gains | from Capital | Distributions | Net Asset Value | of Period | |||||||||||||||||||||||||||||||||
For the Six-Month Period Ended June 30, 2010 (Unaudited) | ||||||||||||||||||||||||||||||||||||||||||||
IA | $ | 13.71 | $ | 0.03 | $ | – | $ | (1.70 | ) | $ | (1.67 | ) | $ | – | $ | – | $ | – | $ | – | $ | (1.67 | ) | $ | 12.04 | |||||||||||||||||||
IB | 13.64 | 0.01 | – | (1.69 | ) | (1.68 | ) | – | – | – | – | (1.68 | ) | 11.96 | ||||||||||||||||||||||||||||||
For the Year Ended December 31, 2009 | ||||||||||||||||||||||||||||||||||||||||||||
IA | 10.17 | 0.08 | – | 3.55 | 3.63 | (0.09 | ) | – | – | (0.09 | ) | 3.54 | 13.71 | |||||||||||||||||||||||||||||||
IB | 10.12 | 0.05 | – | 3.53 | 3.58 | (0.06 | ) | – | – | (0.06 | ) | 3.52 | 13.64 | |||||||||||||||||||||||||||||||
For the Year Ended December 31, 2008 | ||||||||||||||||||||||||||||||||||||||||||||
IA | 22.42 | 0.12 | – | (11.56 | ) | (11.44 | ) | (0.12 | ) | (0.69 | ) | – | (0.81 | ) | (12.25 | ) | 10.17 | |||||||||||||||||||||||||||
IB | 22.27 | 0.08 | – | (11.47 | ) | (11.39 | ) | (0.07 | ) | (0.69 | ) | – | (0.76 | ) | (12.15 | ) | 10.12 | |||||||||||||||||||||||||||
For the Year Ended December 31, 2007 | ||||||||||||||||||||||||||||||||||||||||||||
IA | 20.09 | 0.03 | – | 4.84 | 4.87 | (0.01 | ) | (2.53 | ) | – | (2.54 | ) | 2.33 | 22.42 | ||||||||||||||||||||||||||||||
IB | 20.02 | (0.02 | ) | – | 4.81 | 4.79 | (0.01 | ) | (2.53 | ) | – | (2.54 | ) | 2.25 | 22.27 | |||||||||||||||||||||||||||||
For the Year Ended December 31, 2006 | ||||||||||||||||||||||||||||||||||||||||||||
IA | 18.74 | 0.10 | 0.05 | 2.48 | 2.63 | (0.16 | ) | (1.12 | ) | – | (1.28 | ) | 1.35 | 20.09 | ||||||||||||||||||||||||||||||
IB | 18.66 | 0.05 | 0.05 | 2.47 | 2.57 | (0.09 | ) | (1.12 | ) | – | (1.21 | ) | 1.36 | 20.02 | ||||||||||||||||||||||||||||||
For the Year Ended December 31, 2005 | ||||||||||||||||||||||||||||||||||||||||||||
IA | 18.41 | 0.14 | – | 0.33 | 0.47 | (0.14 | ) | – | – | (0.14 | ) | 0.33 | 18.74 | |||||||||||||||||||||||||||||||
IB | 18.32 | 0.07 | – | 0.35 | 0.42 | (0.08 | ) | – | – | (0.08 | ) | 0.34 | 18.66 | |||||||||||||||||||||||||||||||
| (A) | Information presented relates to a share outstanding throughout the indicated period. |
| (B) | The figures do not include sales charges or other fees which may be applied at the variable life insurance, variable annuity or qualified retirement plan product level. Any such additional sales charges or other fees would lower the Fund's performance. |
| (C) | Ratios do not reflect reductions for fees paid indirectly. Please see Fees Paid Indirectly in the Notes to Financial Statements. |
| (D) | Portfolio turnover rate is calculated on the basis of the Fund as a whole without distinguishing between the classes of shares issued. |
| (E) | Not annualized. |
| (F) | Annualized. |
| (G) | Total return without the inclusion of the Payment from (to) Affiliate can be found in Expenses in the accompanying Notes to Financial Statements. |
| - Ratios and Supplemental Data - |
Ratio of Expenses to Average Net | Ratio of Expenses to Average Net | Ratio of Net Investment Income to | Portfolio Turnover | |||||||||||||||||||
Total Return(B) | Net Assets at End of Period | Assets Before Waivers(C) | Assets After Waivers(C) | Average Net Assets | Rate(D) | |||||||||||||||||
| (12.15 | )%(E) | $ | 398,963 | 0.81 | %(F) | 0.81 | %(F) | 0.43 | %(F) | 31 | % | |||||||||||
| (12.26 | )(E) | 99,523 | 1.06 | (F) | 1.06 | (F) | 0.18 | (F) | – | |||||||||||||
| 35.64 | (G) | 488,720 | 0.81 | 0.81 | 0.67 | 70 | ||||||||||||||||
| 35.31 | (G) | 126,320 | 1.06 | 1.06 | 0.42 | – | ||||||||||||||||
| (52.46 | ) | 419,183 | 0.75 | 0.75 | 0.67 | 76 | ||||||||||||||||
| (52.58 | ) | 112,226 | 1.00 | 1.00 | 0.42 | – | ||||||||||||||||
| 25.05 | 1,028,843 | 0.73 | 0.73 | 0.13 | 75 | |||||||||||||||||
| 24.74 | 299,788 | 0.98 | 0.98 | (0.11 | ) | – | ||||||||||||||||
| 14.14 | (G) | 942,258 | 0.76 | 0.76 | 0.48 | 116 | ||||||||||||||||
| 13.86 | (G) | 280,283 | 1.01 | 1.01 | 0.23 | – | ||||||||||||||||
| 2.59 | 935,539 | 0.77 | 0.77 | 0.74 | 262 | |||||||||||||||||
| 2.33 | 280,050 | 1.02 | 1.02 | 0.48 | – | |||||||||||||||||
| Hartford Global Growth HLS Fund |
The Board of Directors appoints officers who are responsible for the day-to-day operations of the Fund and who execute policies formulated by the Directors. Each director serves until his or her death, resignation, or retirement or until the next annual meeting of shareholders is held or until his or her successor is elected and qualifies.
Directors and officers who are employed by or who have a financial interest in The Hartford are considered “interested” persons of the Fund pursuant to the Investment Company Act of 1940, as amended. Each officer and two of the Company’s directors, as noted in the chart below, are “interested” persons of the Fund. Each director serves as a director for The Hartford Mutual Funds, Inc., The Hartford Mutual Funds II, Inc., The Hartford Income Shares Fund, Inc., Hartford Series Fund, Inc., and Hartford HLS Series Fund II, Inc., which, as of June 30, 2010, collectively consist of 88 funds. Correspondence may be sent to directors and officers c/o Hartford Mutual Funds, P.O. Box 2999, Hartford, Connecticut 06104-2999, except that correspondence to Ms. Fagely may be sent to 500 Bielenberg Drive, Woodbury, Minnesota 55125.
The table below sets forth, for each director and officer, his or her name, year of birth, current position with the Company and date first elected or appointed to Hartford Series Fund, Inc. (“HSF”), and Hartford HLS Series Fund II, Inc. (“HSF2”), principal occupation, and, for directors, other directorships held. The Fund’s statement of additional information contains further information on the directors and is available free of charge by calling 1-800-862-6668 or writing to Hartford HLS Funds, c/o Individual Annuity Services, P.O. Box 5085, Hartford, CT 06102-5085.
Information on the aggregate remuneration paid to the directors of the Company can be found in the Statement of Operations herein. The Fund pays to The Hartford a portion of the chief compliance officer’s compensation, but does not pay salaries or compensation to any of their other officers or directors who are employed by The Hartford.
Non-Interested Directors
Lynn S. Birdsong (1946) Director since 2003, Co-Chairman of the Investment Committee
Mr. Birdsong is a private investor. Since 2003, Mr. Birdsong has been an independent director of The Japan Fund and has served as a Director of the Sovereign High Yield Fund since April 2010. From 2003 to March 2005, Mr. Birdsong was an independent director of the Atlantic Whitehall Funds. From 1979 to 2002, Mr. Birdsong was a managing director of Zurich Scudder Investments, an investment management firm. During his employment with Scudder, Mr. Birdsong was an interested director of The Japan Fund. Since 1981, Mr. Birdsong has been a partner in Birdsong Company, an advertising specialty firm.
Robert M. Gavin, Jr. (1940) Director since 2002 (HSF) and 1986 (HSF2), Chairman of the Board since 2004
Dr. Gavin is an educational consultant. Prior to September 1, 2001, he was President of Cranbrook Education Community and prior to July 1996, he was President of Macalester College, St. Paul, Minnesota.
Duane E. Hill (1945) Director since 2001 (HSF) and 2002 (HSF2), Chairman of the Nominating Committee
Mr. Hill is Partner of TSG Ventures L.P., a private equity investment company. Mr. Hill is a former partner of TSG Capital Group, a private equity investment firm that served as sponsor and lead investor in leveraged buyouts of middle market companies.
Sandra S. Jaffee (1941) Director since 2005
Ms. Jaffee served as Chairman (2008 to 2009) and Chief Executive Officer of Fortent (formerly Searchspace Group), a leading provider of compliance/regulatory technology to financial institutions from August 2005 to August 2009. From August 2004 to August 2005, Ms. Jaffee served as an Entrepreneur in Residence with Warburg Pincus, a private equity firm. From September 1995 to July 2004, Ms. Jaffee served as Executive Vice President at Citigroup, where she was President and Chief Executive Officer of Citibank’s Global Securities Services (1995 to 2003).
William P. Johnston (1944) Director since 2005, Chairman of the Compliance Committee
In June 2006, Mr. Johnston was appointed as Senior Advisor to The Carlyle Group, a global private equity investment firm. In July 2006, Mr. Johnston was elected to the Board of Directors of MultiPlan, Inc. In August 2007, Mr. Johnston was elected to the Board of Directors of LifeCare Holdings, Inc. In February 2008, Mr. Johnston was elected to the Board of Directors of HCR-ManorCare, Inc. In May 2006, Mr. Johnston was elected to the Supervisory Board of Fresenius Medical Care AG & Co. KGaA, after its acquisition of Renal Care Group, Inc. in March 2006. Mr. Johnston joined Renal Care Group in November 2002 as a member of the Board of Directors and served as Chairman of the Board from March 2003 through March 2006. From September 1987 to December 2002, Mr. Johnston was with Equitable Securities Corporation (and its successors, SunTrust Equitable Securities and SunTrust Robinson Humphrey) serving in various investment banking and managerial positions, including Managing Director and Head of Investment Banking, Chief Executive Officer and Vice Chairman.
Phillip O. Peterson (1944) Director since 2002 (HSF) and 2000 (HSF2), Chairman of the Audit Committee
Mr. Peterson is a mutual fund industry consultant. He was a partner of KPMG LLP (an accounting firm) until July 1999. Mr. Peterson joined William Blair Funds in February 2007 as a member of the Board of Trustees. From January 2004 to April 2005, Mr. Peterson served as Independent President of the Strong Mutual Funds.
Lemma W. Senbet (1946) Director since 2005
Dr. Senbet is the William E. Mayer Chair Professor of Finance and Director, Center for Financial Policy, at the University of Maryland, Robert H. Smith School of Business. He was chair of the Finance Department during 1998 to 2006. Previously he was a chaired professor of finance at the University of Wisconsin-Madison. Also, he was director of the Fortis Funds from March 2000 to July 2002. Dr. Senbet served the finance profession in various capacities, including as director of the American Finance Association and President of the Western Finance Association. In 2006, Dr. Senbet was inducted Fellow of Financial Management Association International for his career-long distinguished scholarship and professional service.
Interested Directors and Officers
Lowndes A. Smith (1939) Director since 1996 (HSF) and 2002 (HSF2), Co-Chairman of the Investment Committee
Mr. Smith served as Vice Chairman of The Hartford from February 1997 to January 2002, as President and Chief Executive Officer of Hartford Life, Inc. from February 1997 to January 2002, and as President and Chief Operating Officer of The Hartford Life Insurance Companies from January 1989 to January 2002. Mr. Smith serves as a Director of White Mountains Insurance Group, Ltd., One Beacon Insurance, Symetra Financial and as a Managing Director of Whittington Gray Associates.
John C. Walters 1, 2 (1962) Director since 2008
Mr. Walters currently serves as President, Chief Executive Officer and Director for Hartford Life, Inc. (“HL, Inc.”). Mr. Walters also serves as President, Chairman of the Board, Chief Executive Officer and Director for Hartford Life Insurance Company (“Hartford Life”), and as Executive Vice President of The Hartford. In addition, Mr. Walters is a Manager of HL Investment Advisors, LLC (“HL Advisors”). Mr. Walters previously served as President of the U.S. Wealth Management Division of HL, Inc. (2006-2007) and as Co-Chief Operating Officer of Hartford Life (2007-2008).
1 Mr. Walters previously served as President and Chief Executive Officer (2007 to 2009).
2 Effective July 31, 2010, Mr. Walters retired from The Hartford. Mr. Walters resigned his position as a Director of the Fund effective July 30, 2010.
Other Officers
Robert M. Arena, Jr. (1968) President and Chief Executive Officer since 2009 (served as Vice President of the Fund (2006-2009))
Mr. Arena serves as Executive Vice President of Hartford Life. Additionally, Mr. Arena is Senior Vice President and Director of Hartford Administrative Services Company, (“HASCO”), President, Chief Executive Officer and Manager of Hartford Investment Financial Services, LLC (“HIFSCO”) and President, Chief Executive Officer and Manager of HL Advisors. Mr. Arena joined The Hartford in 2004.
Tamara L. Fagely (1958) Vice President, Treasurer and Controller since 2002 (HSF) 1993 (HSF2)
Ms. Fagely has been a Vice President of HASCO since 1998 and Chief Financial Officer since 2006. Currently Ms. Fagely is a Vice President of Hartford Life. She served as Assistant Vice President of Hartford Life from December 2001 through March 2005. In addition, Ms. Fagely is Controller and Chief Financial Officer of HIFSCO.
Brian Ferrell (1962) AML Compliance Officer since 2008
Mr. Ferrell has served as Assistant Vice President and AML Compliance Officer for The Hartford since 2006, and as AML Compliance Officer for HASCO and Hartford Investor Services Company, LLC (“HISC”) since 2008. Prior to joining The Hartford in 2006, Mr. Ferrell held various positions at the U.S. Department of the Treasury (the “Treasury”) from 2001 to 2006, where he served as Chief Counsel for the Treasury’s Financial Crimes Enforcement Network from 2005-2006.
Dr. Robert J. Froehlich (1953) Senior Managing Director since 2009
Dr. Froehlich joined The Hartford as Senior Managing Director in September 2009. Prior to joining The Hartford, Dr. Froehlich served as Vice Chairman of Deutsche Asset Management from 1997-2009.
| Hartford Global Growth HLS Fund |
| Directors and Officers (Unaudited) – (continued) |
Thomas D. Jones, III (1965) Vice President and Chief Compliance Officer since 2006
Mr. Jones serves as Chief Compliance Officer for the Hartford Mutual Funds and Vice President and Director of Securities Compliance for The Hartford. Mr. Jones joined The Hartford in 2006 from SEI Investments, where he served as Chief Compliance Officer for its mutual funds and investment advisers. Prior to joining SEI, Mr. Jones was First Vice President and Compliance Director for Merrill Lynch Investment Managers (Americas) (“MLIM”), where he worked from 1992-2004.
Edward P. Macdonald (1967) Vice President, Secretary and Chief Legal Officer since 2005
Mr. Macdonald serves as Assistant Vice President of Hartford Life and Chief Legal Officer and Vice President of HIFSCO. He also serves as Vice President and Secretary of HASCO, and Chief Legal Officer, Secretary and Vice President of HL Advisors. Mr. Macdonald joined The Hartford in 2005.
Vernon J. Meyer (1964) Vice President since 2006
Mr. Meyer serves as Senior Vice President of Hartford Life. He also serves as Senior Vice President of HIFSCO and HL Advisors. Mr. Meyer joined The Hartford in 2004.
D. Keith Sloane (1960) Vice President since 2009
Mr. Sloane is a Senior Vice President of Hartford Life. Additionally, Mr. Sloane currently serves as Senior Vice President of HIFSCO, HL Advisors, and HASCO. Prior to joining The Hartford in 2007, Mr. Sloane was Director of product marketing and led the mutual fund business for Wachovia Securities (“Wachovia”) in their investment products group. Mr. Sloane joined Wachovia in 1995.
Jane Wolak (1961) Vice President since 2009
Ms. Wolak currently serves as Vice President of Hartford Life. Ms. Wolak joined Hartford Life as Vice President, Retail Product Services in May 2007. She is also Vice President of HASCO. Previously, Ms. Wolak was with Sun Life Financial where she held the position of Vice President, Service Center Operations from 2001-2007.
A description of the policies and procedures that the Fund uses to determine how to vote proxies relating to portfolio securities and a record of how the Fund voted any proxies for the twelve-month period ended June 30, 2010 is available (1) without charge, upon request, by calling 800-862-6668 and (2) on the Securities and Exchange Commission’s website at http://www.sec.gov.
The Fund files a complete schedule of portfolio holdings with the Commission for the first and third quarters of each fiscal year on Form N-Q. The Fund’s Forms are available (1) without charge, upon request, by calling 800-862-6668 and (2) on the Securities and Exchange Commission’s website at http://www.sec.gov. The Form N-Q may be reviewed and copied at the Commission’s Public Reference Room in Washington, DC. Information on the operation of the Public Reference Room may be obtained by calling 1-800-SEC-0330.
| Hartford Global Growth HLS Fund |
The following proposals were addressed and approved at a Special Meeting of Shareholders held on February 12, 2010.
Proposal to approve amendments to the Investment Management Agreement between the Fund and HL Investment Advisors, the purpose of which were to combine the administrative services for the Fund with the management services for the Fund under a single agreement.
| Fund | For | Against | Abstain | ||||||
| Hartford Global Growth HLS Fund | 38,457,876.826 | 1,116,595.036 | 1,018,136.567 |
Proposal to elect Lemma Senbet and John Walters, each currently a Director, as Directors of Hartford Series Fund Inc.
Lemma W. Senbet
| Funds | For | Withheld | ||||
| Hartford Series Fund, Inc. | 5,079,578,022.902 | 241,839,974.106 |
John C. Walters
| Funds | For | Withheld | ||||
| Hartford Series Fund, Inc. | 5,081,138,302.186 | 240,279,694.822 |
| Hartford Global Growth HLS Fund |
Your Fund's Expenses
As a shareholder of the Fund, you incur two types of costs: (1) transaction costs, including sales charges (loads) on purchase payments and contingent deferred sales charges (CDSC) (2) ongoing costs including management fees; distribution fees; and other fund expenses. This example is intended to help you understand your ongoing costs (in dollars) of investing in the Fund and to compare these costs with the ongoing costs of investing in other mutual funds. The example is based on an investment of $1,000 invested at the beginning of the period and held for the period of December 31, 2009 through June 30, 2010.
Actual Expenses
The first set of columns of the table below provides information about actual account values and actual expenses. You may use the information in this column, together with the amount you invested, to estimate the expenses that you paid over the period. Simply divide your account value by $1,000 (for example, an $8,600 account value divided by $1,000 = 8.6), then multiply the result by the number in the line under the heading entitled "Expenses Paid During Period" to estimate the expenses you paid on your account during this period.
Hypothetical Example for Comparison Purposes
The second set of columns of the table below provides information about hypothetical account values and hypothetical expenses based on the Fund's actual expense ratio and an assumed rate of return of 5% per year before expenses, which is not the Fund's actual return. The hypothetical account values and expenses may not be used to estimate the actual ending account balance or expenses you paid for the period. You may use this information to compare the ongoing costs of investing in the Fund and other funds. To do so, compare this 5% hypothetical example with the 5% hypothetical examples that appear in the shareholder reports of the other funds.
Please note that the expenses shown in the table are meant to highlight your ongoing costs only and do not reflect any transactional costs, such as sales charges (loads) and CDSC. Therefore, the second set of columns of the table is useful in comparing ongoing costs only, and will not help you determine the relative total costs of owning different funds. In addition, if these transactional costs were included, your costs would be higher. Expenses are equal to the Fund's annualized expense ratios multiplied by average account value over the period, multiplied by 181/365 (to reflect the one-half year period).
Actual return | Hypothetical (5% return before expenses) | |||||||||||||||||||||||||||||||||||
Expenses paid | Expenses paid | Days in | ||||||||||||||||||||||||||||||||||
during the period | during the period | the | Days | |||||||||||||||||||||||||||||||||
Beginning | Ending | December 31, 2009 | Beginning | Ending | December 31, 2009 | Annualized | current | in the | ||||||||||||||||||||||||||||
Account Value | Account Value | through | Account Value | Account Value | through | expense | 1/2 | full | ||||||||||||||||||||||||||||
December 31, 2009 | June 30, 2010 | June 30, 2010 | December 31, 2009 | June 30, 2010 | June 30, 2010 | ratio | year | year | ||||||||||||||||||||||||||||
Class IA | $ | 1,000.00 | $ | 878.48 | $ | 3.77 | $ | 1,000.00 | $ | 1,020.78 | $ | 4.06 | 0.81 | % | 181 | 365 | ||||||||||||||||||||
Class IB | $ | 1,000.00 | $ | 877.39 | $ | 4.93 | $ | 1,000.00 | $ | 1,019.54 | $ | 5.31 | 1.06 | % | 181 | 365 | ||||||||||||||||||||
| Hartford Global Growth HLS Fund |
The Board approved the annual continuation of the Investment Management Agreement (the “Agreement”) between Hartford Series Fund, Inc. (“HSF”) and HL Investment Advisors, LLC (“HL Advisors”) with respect to the Fund at its meeting on August 4-5, 2009. The Board’s considerations in approving the renewal of the Agreement are disclosed in the December 31, 2009 Annual Report for HSF.
At the November 4-5, 2009 meeting, the Board considered and approved amendments to the Agreement to include administrative services, which had been provided pursuant to a separate agreement, and investment management services under one agreement. The Board, including all of the Independent Directors, approved the amendments to the Agreement with respect to the Fund.
In approving the amendments, in addition to the information presented at the August meeting in connection with the annual review of the Agreement and the additional information provided throughout the year, the Board also considered the fact that the amendments did not result in an overall increase in fees to shareholders. The Board took note of the fact that the management of HL Advisors believes that the proposal to combine the administrative services with the investment management services under a single agreement will produce streamlined fee disclosure, resulting in greater transparency and clarity in the Fund’s prospectuses and financial reports. The Board further noted management's belief that the change would result in consistency across all of the Hartford Funds in the complex in that the funds of HSF are the only funds in the complex (other than the R share classes of the Hartford retail funds) that are subject to a separate administrative services fee. Finally, the Board noted management's view that the proposed changes to the Agreement should also serve to simplify the Board's annual consideration of the investment management arrangements for the Fund in that the investment management and administrative fees would be presented as a single fee for fee comparison purposes, which should facilitate the Board's analysis.
The shareholders of the Fund approved the amendments at a Special Meeting of Shareholders held on February 12, 2010. The amendments were effective as of March 1, 2010.
29
The Hartford
P.O. Box 5085
Hartford, CT 06102–5085
Hartford Series Fund, Inc. is underwritten and distributed by Hartford Securities Distribution Company, Inc.
“The Hartford” is The Hartford Financial Services Group, Inc. and its subsidiaries.
Hartford Series Fund, Inc. inception dates range from 1977 to date. Hartford Series Fund, Inc. is not a subsidiary of The Hartford but is underwritten, distributed by and advised by subsidiaries of The Hartford. Investments in Hartford Series Fund, Inc. are not guaranteed by The Hartford or any other entity.
This material is authorized for distribution only when preceded or accompanied by a current prospectus. The prospectus contains detailed information about the Funds, including investment objectives, risks and charges and expenses. Please read it carefully before you invest or send money.
HLSSAR-GG10 Printed in U.S.A ©2010 The Hartford, Hartford, CT 06115 |
| Hartford Global Health HLS Fund |
|
Hartford Global Health HLS Fund
| Manager Discussions (Unaudited) | 2 |
| Financial Statements | |
| 4 | |
| 6 | |
| 7 | |
| 8 | |
| 9 | |
| 10 | |
| 20 | |
| 22 | |
| 24 | |
| 24 | |
| 25 | |
| 26 | |
| 27 |
This report is prepared for the general information of contract owners and qualified retirement plan participants. It is not an offer of contracts or of qualified retirement plans. It should not be used in connection with any offer, except in conjunction with the appropriate prospectus which contains all pertinent information including the applicable sales, administrative and other charges.
The views expressed in the Fund’s Manager Discussion under “Why did the Fund perform this way?” and “What is the outlook?” are views of the Fund’s subadvisers and portfolio management team through the end of the period and is subject to change based on market and other conditions.
Hartford Global Health HLS Fund inception 05/01/2000
(subadvised by Wellington Management Company, LLP)
Investment objective – Seeks long-term capital appreciation.
Performance Overview(1) 6/30/00 - 6/30/10
Growth of $10,000 investment

S&P 500 Index is a market capitalization-weighted price index composed of 500 widely held common stocks.
S&P North American Health Care Sector Index is a modified capitalization-weighted index based on United States headquartered health care companies. Stocks in the index are weighted such that each stock is no more than 7.5% of the market capitalization as of the most recent reconstitution date. The companies included in the index must be common stocks and be traded on the American Stock Exchange, Nasdaq or the New York Stock Exchange and meet certain established market capitalization levels.
You cannot invest directly in an index.
The chart represents a hypothetical investment in the Fund. Performance data represents past performance and current performance could be higher or lower.
Average Annual Returns (as of 6/30/10)
| 6 | 1 | 5 | 10 | |
| Month† | Year | Year | Year | |
| Global Health IA | -6.27% | 13.44% | 2.84% | 5.98% |
| Global Health IB | -6.38% | 13.16% | 2.59% | 5.73% |
| S&P 500 Index | -6.64% | 14.43% | -0.80% | -1.59% |
| S&P North American Health Care Sector Index | -6.82% | 11.38% | 1.04% | 1.33% |
| † | Not Annualized |
PAST PERFORMANCE IS NOT INDICATIVE OF FUTURE RESULTS.
| (1) | Growth of a $10,000 investment in Class IB shares will vary from the results seen on this page due to differences in the expense charged to this share class. |
Performance information may reflect historical or current expense waivers from the investment adviser, without which performance would have been lower. For information on current expense waivers/reimbursements, please see the prospectus.
The value of the contract will fluctuate so that when redeemed, it may be worth more or less than the original investment. The chart and table do not reflect the deduction of taxes that a shareholder would pay on portfolio distributions or the redemption of portfolio shares. The figures do not include sales charges or other fees which may be applied at the variable life insurance, variable annuity or qualified retirement plan product level. Any such additional sales charges or other fees would lower the Fund’s performance.
| Portfolio Managers | |||
| Jean M. Hynes, CFA | Ann C. Gallo | Kirk J. Mayer, CFA | Robert L. Deresiewicz |
| Senior Vice President, Partner | Senior Vice President, Partner | Senior Vice President | Senior Vice President |
How did the Fund perform?
The Class IA shares of the Hartford Global Health HLS Fund returned -6.27% for the six-month period ended June 30, 2010, outperforming its benchmark, the S&P North American Health Care Sector Index, which returned -6.82% for the same period. The Fund underperformed the -6.07% return of the average fund in the Lipper Health and Biotechnology VP-UF peer group, a group of funds with investment strategies similar to those of the Fund.
Why did the Fund perform this way?
Global equities tumbled in the second quarter of 2010 amid rising risk aversion and concerns that the global economy could slip back into a recession. At the forefront of investors’ minds were sovereign debt and solvency troubles in the Euro zone, slowing economic growth in China and the U.S., and uncertainty in the sustainability of corporate earnings growth.
Health Care stocks (-7%) performed in-line with the broader U.S. market (-7%), but outperformed the world market (-10%), as measured by the S&P North American Health Care Sector Index, S&P 500 Index, and MSCI World Index, respectively. Within the S&P North American Health Care Sector Index, all four sub-sectors posted negative returns. Medical Technology (-10%) and Major Pharmaceuticals (-8%) declined the most while Specialty Pharmaceuticals/Biotechnology (-5%) and Health Services (-4%) fell the least.
During the period, stock selection, particularly in Medical Technology and Health Services, was additive to relative results. Sector allocation was also positive; our overweight (i.e. the Fund’s sector position was greater than the benchmark position) position in Specialty Pharmaceuticals/Biotechnology improved relative (i.e. performance of the Fund as measured against the benchmark) performance.
Holdings of Incyte, Volcano, and OSI Pharmaceuticals were among the top contributors to benchmark-relative performance during the period. U.S.-based drug discovery and development company Incyte’s shares gained on improving financial results and significant collaboration and license agreements with Novartis for two hematology-oncology programs. Volcano’s shares increased during the period as the company continued to beat consensus earnings expectations due to strong capital equipment sales in the U.S. and E.U., as well as strong Japanese revenues as it shifted to a direct sales approach. Shares of biotechnology company OSI Pharmaceuticals surged in March 2010 when Japan-based Astellas Pharmaceuticals offered to acquire the company for $52 per share. The two companies eventually agreed to a sale price of $57.50 per share.
Bristol-Myers Squibb, Covidien, and Express Scripts were the largest detractors from benchmark-relative performance. Bristol-Myers Squibb’s shares ended the period up slightly as the index fell. Consequently, not holding this benchmark stock hurt the Fund’s relative performance. U.S.-based medical products company Covidien reported disappointing second quarter revenues and lowered its overall revenue guidance due to a stronger U.S. dollar and some weakness in its pharmaceutical and supplies segments. Express Scripts, a provider of pharmacy benefit management services, reported better-than-expected fourth quarter earnings and raised guidance for 2010, driving its stock price higher. Not owning this benchmark component stock detracted from performance. Top detractors from absolute performance included biotechnology company Elan and Baxter International.
What is the outlook?
Given our bottom-up (i.e. stock by stock fundamental research), longer-term approach to investing and the fact that the implementation of health care reform will be gradual, starting primarily in 2014, we believe that the health care reform bill signed earlier this year does not materially impact our long-term outlook for health care stocks.
Within healthcare services, we continue to believe the HMOs offer the greatest upside. In addition to benefiting from clarity on reform, we believe the commercial underwriting cycle is approaching a bottom, setting 2011 up to be a strong year fundamentally. We also favor drug distribution stocks that are poised to benefit from a resurgence in pharmaceutical spending and the pending wave of generic conversions, which begins in 2011. Although the late-stage contract research organizations (CROs) have outperformed year to date, we remain positive on the sector due to accelerating growth prospects.
The pharmaceutical and large cap biotechnology sectors have remained relatively weak in 2010, in great part due to investor concerns about adverse consequences of U.S. healthcare reform on the one hand, and about drug pricing pressures from fiscally-stressed European governments on the other. We view the impact of both these issues as quite manageable. The industry’s financial contribution to the U.S. healthcare reform package begins in 2010, prior to the benefits of offsetting revenue from enrollees newly insured under the legislation. In Europe, while pricing pressures are ever-present, they are likely to be broader and more substantial than usual this year. This is likely to cause a one-time step-down in European pricing. We expect that with time, however, the negative impact of reform and of European financial stress will mitigate.
Given their extended period of underperformance and their low valuations, stocks of the major pharmaceutical companies appear attractive to us, as new product pipelines, cost cutting measures, strong growth in the emerging markets, and an improving Food and Drug Administration posture provide upside potential beyond the 2011-2012 period of patent expiries. Significant Phase 3 data flow in late 2010 and 2011 will clarify the magnitude of certain new product opportunities. Japanese pharmaceutical companies remain attractive given their strong balance sheets and the value of their interesting pipelines relative to their modest market capitalizations. Likewise, we believe several of the large biotechnology companies now have valuations that are quite attractive. Among the many smaller biotechnology companies are pockets of substantial opportunity based on the promise of innovative programs and drugs to address medical needs currently poorly served.
Within the Medical Technologies sub-sector, most stocks have become attractively valued so we continue to look for companies with underappreciated franchises or promising Research & Development projects. It remains our view that cardiovascular treatments represents one of the strongest prospects for growth, with a large, under-penetrated market particularly for atrial fibrillation procedures. Europe remains somewhat of a wild card as government spending is pressured due to the economic issues and austerity measures, resulting in less funding for health care.
Diversification by Industry
as of June 30, 2010
| Percentage of | ||||
| Industry | Net Assets | |||
| Biotechnology | 21.7 | % | ||
| Drug Retail | 2.4 | |||
| Health Care Distributors | 9.3 | |||
| Health Care Equipment | 23.8 | |||
| Health Care Services | 0.9 | |||
| Health Care Technology | 0.3 | |||
| Life Sciences Tools & Services | 2.3 | |||
| Managed Health Care | 7.9 | |||
| Pharmaceuticals | 31.2 | |||
| Short-Term Investments | 0.0 | |||
| Other Assets and Liabilities | 0.2 | |||
| Total | 100.0 | % | ||
Diversification by Country
as of June 30, 2010
| Percentage of | ||||
| Country | Net Assets | |||
| Belgium | 1.0 | % | ||
| China | 0.8 | |||
| Denmark | 0.3 | |||
| France | 0.3 | |||
| Hong Kong | 0.1 | |||
| Ireland | 1.7 | |||
| Israel | 2.7 | |||
| Italy | 1.2 | |||
| Japan | 6.2 | |||
| Switzerland | 0.8 | |||
| United Kingdom | 1.0 | |||
| United States | 83.7 | |||
| Short-Term Investments | 0.0 | |||
| Other Assets and Liabilities | 0.2 | |||
| Total | 100.0 | % | ||
| Hartford Global Health HLS Fund |
| June 30, 2010 (Unaudited) |
| (000’s Omitted) |
| Shares or Principal Amount | Market Value ╪ | ||||||
| COMMON STOCKS - 99.8% | |||||||
| Biotechnology - 21.7% | |||||||
| 121 | 3SBio, Inc. ADR ● | $ | 1,412 | ||||
| 51 | Affymax, Inc. ● | 304 | |||||
| 32 | AMAG Pharmaceuticals, Inc. ● | 1,105 | |||||
| 86 | Amgen, Inc. ● | 4,508 | |||||
| 185 | Amylin Pharmaceuticals, Inc. ● | 3,482 | |||||
| 356 | Celera Corp. ● | 2,333 | |||||
| 97 | Celgene Corp. ● | 4,909 | |||||
| 76 | Celldex Therapeutics, Inc. ● | 345 | |||||
| 34 | Cephalon, Inc. ● | 1,901 | |||||
| 375 | Cytokinetics, Inc. ● | 889 | |||||
| 2 | Genzyme Corp. ● | 122 | |||||
| 98 | Gilead Sciences, Inc. ● | 3,359 | |||||
| 60 | Immunogen, Inc. ● | 552 | |||||
| 582 | Incyte Corp. ● | 6,445 | |||||
| 31 | Ironwood Pharmaceuticals, Inc. ● | 367 | |||||
| 431 | Ligand Pharmaceuticals Class B ● | 629 | |||||
| 87 | Regeneron Pharmaceuticals, Inc. ● | 1,942 | |||||
| 33 | Rigel Pharmaceuticals, Inc. ● | 241 | |||||
| 173 | Seattle Genetics, Inc. ● | 2,074 | |||||
| 231 | Siga Technologies, Inc. ● | 1,780 | |||||
| 58 | Vertex Pharmaceuticals, Inc. ● | 1,895 | |||||
| 40,594 | |||||||
| Drug Retail - 2.4% | |||||||
| 153 | CVS/Caremark Corp. | 4,482 | |||||
| Health Care Distributors - 9.3% | |||||||
| 132 | Amerisource Bergen Corp. | 4,185 | |||||
| 149 | Cardinal Health, Inc. | 5,018 | |||||
| 122 | McKesson Corp. | 8,220 | |||||
| 17,423 | |||||||
| Health Care Equipment - 23.8% | |||||||
| 126 | Abiomed, Inc. ● | 1,220 | |||||
| 52 | Bard (C.R.), Inc. | 4,017 | |||||
| 91 | Baxter International, Inc. | 3,708 | |||||
| 46 | Beckman Coulter, Inc. | 2,767 | |||||
| 174 | China Medical Technologies, Inc. ADR | 1,827 | |||||
| 155 | Covidien plc | 6,228 | |||||
| 62 | DiaSorin S.p.A. | 2,274 | |||||
| 57 | Hospira, Inc. ● | 3,279 | |||||
| 23 | Masimo Corp. | 543 | |||||
| 218 | Medtronic, Inc. | 7,910 | |||||
| 128 | St. Jude Medical, Inc. ● | 4,630 | |||||
| 270 | Trauson Holdings Co., Ltd. ● | 125 | |||||
| 227 | Volcano Corp. ● | 4,958 | |||||
| 62 | Wright Medical Group, Inc. ● | 1,036 | |||||
| 44,522 | |||||||
| Health Care Services - 0.9% | |||||||
| 31 | Accretive Health, Inc. ● | 410 | |||||
| 56 | Rehabcare Group, Inc. ● | 1,218 | |||||
| 1,628 | |||||||
| Health Care Technology - 0.3% | |||||||
| 27 | Eclipsys Corp. ● | 480 | |||||
| Life Sciences Tools & Services - 2.3% | |||||||
| 62 | PAREXEL International Corp. ● | 1,336 | |||||
| 61 | Thermo Fisher Scientific, Inc. ● | 2,982 | |||||
| 4,318 | |||||||
| Managed Health Care - 7.9% | |||||||
| 100 | Aetna, Inc. | 2,625 | |||||
| 120 | CIGNA Corp. | 3,724 | |||||
| 265 | UnitedHealth Group, Inc. | 7,518 | |||||
| 18 | Wellpoint, Inc. ● | 876 | |||||
| 14,743 | |||||||
| Pharmaceuticals - 31.2% | |||||||
| 10 | Alk-Abello A/S | 577 | |||||
| 46 | Ardea Biosciences, Inc. ● | 938 | |||||
| 39 | AstraZeneca plc ADR | 1,829 | |||||
| 192 | Daiichi Sankyo Co., Ltd. | 3,436 | |||||
| 98 | Eisai Co., Ltd. | 3,235 | |||||
| 704 | Elan Corp. plc ADR ● | 3,168 | |||||
| 38 | Eli Lilly & Co. | 1,276 | |||||
| 211 | Forest Laboratories, Inc. ● | 5,777 | |||||
| 16 | Ipsen | 499 | |||||
| 97 | King Pharmaceuticals, Inc. ● | 735 | |||||
| 200 | Medicines Co. ● | 1,521 | |||||
| 249 | Merck & Co., Inc. | 8,701 | |||||
| 615 | Pfizer, Inc. | 8,774 | |||||
| 10 | Roche Holding AG | 1,434 | |||||
| 247 | Shionogi & Co., Ltd. | 5,112 | |||||
| 36 | Simcere Pharmaceutical Group ● | 296 | |||||
| 96 | Teva Pharmaceutical Industries Ltd. ADR | 5,011 | |||||
| 59 | UCB S.A. | 1,852 | |||||
| 59 | Warner Chilcott plc ● | 1,350 | |||||
| 60 | Watson Pharmaceuticals, Inc. ● | 2,414 | |||||
| 48 | Xenoport, Inc. ● | 474 | |||||
| 58,409 | |||||||
| Total common stocks | |||||||
| (cost $194,808) | $ | 186,599 | |||||
| WARRANTS - 0.0% | |||||||
| Biotechnology - 0.0% | |||||||
| 48 | Cytokinetics, Inc. ⌂ | $ | – | ||||
| Total warrants | |||||||
| (cost $–) | $ | – | |||||
| Total long-term investments | |||||||
| (cost $194,808) | $ | 186,599 | |||||
| SHORT-TERM INVESTMENTS - 0.0% | |||||||
| Repurchase Agreements - 0.0% | |||||||
| Bank of America TriParty Joint Repurchase | |||||||
| Agreement (maturing on 07/01/2010 in the | |||||||
| amount of $5, collateralized by FHLMC | |||||||
| 5.50%, 2039, FNMA 4.50% - 5.50%, 2038 - | |||||||
| 2040, GNMA 5.00%, 2040, value of $5) | |||||||
| $ | 5 | 0.05%, 6/30/2010 | $ | 5 | |||
| BNP Paribas Securities Corp. TriParty Joint | |||||||
| Repurchase Agreement (maturing on | |||||||
| 07/01/2010 in the amount of $1, | |||||||
| collateralized by FNMA 4.50% - 6.50%, | |||||||
| 2024 - 2040, GNMA 5.00% - 6.50%, 2038 - | |||||||
| 2040, value of $1) | |||||||
| 1 | 0.04%, 6/30/2010 | 1 | |||||
The accompanying notes are an integral part of these financial statements.
| Shares or Principal Amount | Market Value ╪ | |||||||||
| SHORT-TERM INVESTMENTS - 0.0% - (continued) | ||||||||||
| Repurchase Agreements - 0.0% - (continued) | ||||||||||
| Deutsche Bank Securities TriParty Joint | ||||||||||
| Repurchase Agreement (maturing on | ||||||||||
| 07/01/2010 in the amount of $3, | ||||||||||
| collateralized by GNMA 3.13% - 7.00%, | ||||||||||
| 2023 - 2052, value of $4) | ||||||||||
| $ | 3 | 0.05%, 6/30/2010 | $ | 3 | ||||||
| JP Morgan Chase TriParty Joint Repurchase | ||||||||||
| Agreement (maturing on 07/01/2010 in the | ||||||||||
| amount of $1, collateralized by FHLMC | ||||||||||
| 2.38% - 5.83%, 2033 - 2038, value of $1) | ||||||||||
| 1 | 0.06%, 6/30/2010 | 1 | ||||||||
| Morgan Stanley & Co., Inc. TriParty Joint | ||||||||||
| Repurchase Agreement (maturing on | ||||||||||
| 07/01/2010 in the amount of $3, | ||||||||||
| collateralized by FHLMC 5.00% - 5.50%, | ||||||||||
| 2038 - 2039, FNMA 5.00%, 2039, value of | ||||||||||
| $4) | ||||||||||
| 3 | 0.03%, 6/30/2010 | 3 | ||||||||
| UBS Securities, Inc. Repurchase Agreement | ||||||||||
| (maturing on 07/01/2010 in the amount of | ||||||||||
| $0, collateralized by U.S. Treasury Bill | ||||||||||
| 0.88%, 2011, value of $0) | ||||||||||
| – | 0.02%, 6/30/2010 | – | ||||||||
| UBS Securities, Inc. TriParty Joint Repurchase | ||||||||||
| Agreement (maturing on 07/01/2010 in the | ||||||||||
| amount of $1, collateralized by FNMA | ||||||||||
| 5.00% - 6.00%, 2033 - 2036, value of $1) | ||||||||||
| 1 | 0.09%, 6/30/2010 | 1 | ||||||||
| 14 | ||||||||||
| Total short-term investments | ||||||||||
| (cost $14) | $ | 14 | ||||||||
| Total investments | ||||||||||
| (cost $194,822) ▲ | 99.8 | % | $ | 186,613 | ||||||
| Other assets and liabilities | 0.2 | % | 294 | |||||||
| Total net assets | 100.0 | % | $ | 186,907 | ||||||
| Note: | Percentage of investments as shown is the ratio of the total market value to total net assets. Market value of investments in foreign securities represents 16.1% of total net assets at June 30, 2010. |
Foreign securities that are principally traded on certain foreign markets are adjusted daily pursuant to a third party pricing service methodology approved by the Board of Directors in order to reflect an adjustment for factors occurring after the close of the foreign market but before the close of the New York Stock Exchange.
| ▲ | At June 30, 2010, the cost of securities for federal income tax purposes was $198,371 and the aggregate gross unrealized appreciation and depreciation based on that cost were: |
| Unrealized Appreciation | $ | 23,084 | ||
| Unrealized Depreciation | (34,842 | ) | ||
| Net Unrealized Depreciation | $ | (11,758 | ) |
| ● | Currently non-income producing. |
| ⌂ | The following securities are considered illiquid. Illiquid securities are often purchased in private placement transactions, are often not registered under the Securities Act of 1933 and may have contractual restrictions on resale. A security may also be considered illiquid if the security lacks a readily available market or if its valuation has not changed for a certain period of time. |
| Period | Shares/ | ||||||||
| Acquired | Par | Security | Cost Basis | ||||||
| 05/2009 | 48 | Cytokinetics, Inc. Warrants | $ | – | |||||
The aggregate value of these securities at June 30, 2010 was $– which represents –% of total net assets.
Forward Foreign Currency Contracts Outstanding at June 30, 2010
| Unrealized | |||||||||||||
| Market | Contract | Delivery | Appreciation/ | ||||||||||
| Description | Value ╪ | Amount | Date | (Depreciation) | |||||||||
| Japanese Yen (Sell) | $ | 6,558 | $ | 6,445 | 02/04/11 | $ | (113 | ) | |||||
| $ | (113 | ) | |||||||||||
| ╪ | See Significant Accounting Policies of accompanying Notes to Financial Statements regarding valuation of securities. |
The accompanying notes are an integral part of these financial statements.
| Hartford Global Health HLS Fund |
| June 30, 2010 (Unaudited) |
| (000’s Omitted) |
| Total | Level 1♦ | Level 2♦ | Level 3 | |||||||||||||
| Assets: | ||||||||||||||||
| Common Stocks ‡ | $ | 186,599 | $ | 168,180 | $ | 18,419 | $ | – | ||||||||
| Warrants | – | – | – | – | ||||||||||||
| Short-Term Investments | 14 | – | 14 | – | ||||||||||||
| Total | $ | 186,613 | $ | 168,180 | $ | 18,433 | $ | – | ||||||||
| Liabilities: | ||||||||||||||||
| Forward Foreign Currency Contracts * | 113 | – | 113 | – | ||||||||||||
| Total | $ | 113 | $ | – | $ | 113 | $ | – | ||||||||
| ♦ | For the period ended June 30, 2010, there were no significant transfers between Level 1 and Level 2. |
| ‡ | The Fund has all or primarily all of these equity securities categorized in a single level. Refer to the Schedule of Investments for further industry breakout. |
| * | Derivative instruments not reflected in the Schedule of Investments are valued at the unrealized appreciation/depreciation on the investments. |
The accompanying notes are an integral part of these financial statements.
| Hartford Global Health HLS Fund |
| June 30, 2010 (Unaudited) |
| (000’s Omitted) |
| Assets: | ||||
| Investments in securities, at market value (cost $194,822) | $ | 186,613 | ||
| Cash | — | |||
| Receivables: | ||||
| Investment securities sold | 460 | |||
| Fund shares sold | 37 | |||
| Dividends and interest | 188 | |||
| Other assets | — | |||
| Total assets | 187,298 | |||
| Liabilities: | ||||
| Unrealized depreciation on forward foreign currency contracts | 113 | |||
| Payables: | ||||
| Fund shares redeemed | 201 | |||
| Investment management fees | 36 | |||
| Distribution fees | 3 | |||
| Accrued expenses | 38 | |||
| Total liabilities | 391 | |||
| Net assets | $ | 186,907 | ||
| Summary of Net Assets: | ||||
| Capital stock and paid-in-capital | $ | 223,658 | ||
| Accumulated undistributed net investment income | 337 | |||
| Accumulated net realized loss on investments and foreign currency transactions | (28,766 | ) | ||
| Unrealized depreciation of investments and the translations of assets and liabilities denominated in foreign currency | (8,322 | ) | ||
| Net assets | $ | 186,907 | ||
| Shares authorized | 800,000 | |||
| Par value | $ | 0.001 | ||
Class IA: Net asset value per share | $ | 12.18 | ||
| Shares outstanding | 10,923 | |||
| Net assets | $ | 133,026 | ||
Class IB: Net asset value per share | $ | 11.93 | ||
| Shares outstanding | 4,516 | |||
| Net assets | $ | 53,881 | ||
The accompanying notes are an integral part of these financial statements.
| Hartford Global Health HLS Fund |
| For the Six-Month Period Ended June 30, 2010 (Unaudited) |
| (000’s Omitted) |
| Investment Income: | ||||
| Dividends | $ | 1,392 | ||
| Interest | 1 | |||
| Less: Foreign tax withheld | (43 | ) | ||
| Total investment income, net | 1,350 | |||
| Expenses: | ||||
| Investment management fees | 830 | |||
| Administrative service fees | 71 | |||
| Transfer agent fees | 2 | |||
| Distribution fees - Class IB | 77 | |||
| Custodian fees | 5 | |||
| Accounting services fees | 11 | |||
| Board of Directors' fees | 4 | |||
| Audit fees | 5 | |||
| Other expenses | 37 | |||
| Total expenses | 1,042 | |||
| Commission recapture | — | |||
| Total | — | |||
| Total expenses, net | 1,042 | |||
| Net investment income | 308 | |||
| Net Realized Gain on Investments and Foreign Currency Transactions: | ||||
| Net realized gain on investments | 6,747 | |||
| Net realized loss on forward foreign currency contracts | (5 | ) | ||
| Net realized gain on other foreign currency transactions | 3 | |||
| Net Realized Gain on Investments and Foreign Currency Transactions | 6,745 | |||
| Net Changes in Unrealized Depreciation of Investments and Foreign Currency Transactions: | ||||
| Net unrealized depreciation of investments | (19,100 | ) | ||
| Net unrealized depreciation of forward foreign currency contracts | (117 | ) | ||
| Net unrealized appreciation on translation of other assets and liabilities in foreign currencies | 3 | |||
| Net Changes in Unrealized Depreciation of Investments and Foreign Currency Transactions | (19,214 | ) | ||
| Net Loss on Investments and Foreign Currency Transactions | (12,469 | ) | ||
| Net Decrease in Net Assets Resulting from Operations | $ | (12,161 | ) | |
The accompanying notes are an integral part of these financial statements.
| Hartford Global Health HLS Fund |
| (000’s Omitted) |
| For the | ||||||||
| Six-Month | For the | |||||||
| Period Ended | Year Ended | |||||||
| June 30, 2010 | December 31, | |||||||
| (Unaudited) | 2009 | |||||||
| Operations: | ||||||||
| Net investment income | $ | 308 | $ | 907 | ||||
| Net realized gain (loss) on investments and foreign currency transactions | 6,745 | (30,241 | ) | |||||
| Net unrealized appreciation (depreciation) of investments and foreign currency transactions | (19,214 | ) | 67,417 | |||||
| Payment from affiliate | — | 23 | ||||||
| Net increase (decrease) in net assets resulting from operations | (12,161 | ) | 38,106 | |||||
| Distributions to Shareholders: | ||||||||
| From net investment income | ||||||||
| Class IA | — | (787 | ) | |||||
| Class IB | — | (184 | ) | |||||
| From net realized gain on investments | ||||||||
| Class IA | — | (193 | ) | |||||
| Class IB | — | (82 | ) | |||||
| Total distributions | — | (1,246 | ) | |||||
| Capital Share Transactions: | ||||||||
| Class IA | ||||||||
| Sold | 9,986 | 15,566 | ||||||
| Issued on reinvestment of distributions | — | 980 | ||||||
| Redeemed | (22,558 | ) | (66,790 | ) | ||||
| Total capital share transactions | (12,572 | ) | (50,244 | ) | ||||
| Class IB | ||||||||
| Sold | 5,036 | 6,785 | ||||||
| Issued on reinvestment of distributions | — | 266 | ||||||
| Redeemed | (10,677 | ) | (17,553 | ) | ||||
| Total capital share transactions | (5,641 | ) | (10,502 | ) | ||||
| Net decrease from capital share transactions | (18,213 | ) | (60,746 | ) | ||||
| Net decrease in net assets | (30,374 | ) | (23,886 | ) | ||||
| Net Assets: | ||||||||
| Beginning of period | 217,281 | 241,167 | ||||||
| End of period | $ | 186,907 | $ | 217,281 | ||||
| Accumulated undistributed (distribution in excess of) net investment income | $ | 337 | $ | 29 | ||||
| Shares: | ||||||||
| Class IA | ||||||||
| Sold | 744 | 1,431 | ||||||
| Issued on reinvestment of distributions | — | 78 | ||||||
| Redeemed | (1,690 | ) | (6,446 | ) | ||||
| Total share activity | (946 | ) | (4,937 | ) | ||||
| Class IB | ||||||||
| Sold | 383 | 633 | ||||||
| Issued on reinvestment of distributions | — | 22 | ||||||
| Redeemed | (815 | ) | (1,644 | ) | ||||
| Total share activity | (432 | ) | (989 | ) | ||||
The accompanying notes are an integral part of these financial statements.
| Hartford Global Health HLS Fund |
| June 30, 2010 (Unaudited) |
| (000’s Omitted) |
| 1. | Organization: |
Hartford Global Health HLS Fund (the "Fund") serves as an underlying investment option for certain variable annuity and variable life insurance separate accounts of Hartford Life Insurance Company (“HLIC”) and its affiliates and certain qualified retirement plans. The Fund may also serve as an underlying investment option for certain variable annuity and variable life separate accounts of other insurance companies. Owners of variable annuity contracts and policyholders of variable life insurance contracts may choose the funds permitted in the variable insurance contract prospectus. In addition, participants in certain qualified retirement plans may choose the fund if permitted by their plans.
Hartford Series Fund, Inc. (the “Company”) is an open-end registered management investment company comprised of twenty-nine portfolios, one portfolio of which is included in these financial statements.
The Company is organized under the laws of the State of Maryland and is registered with the Securities and Exchange Commission (“SEC”) under the Investment Company Act of 1940, as amended (“1940 Act”). The Fund is organized as a non-diversified open-end management investment company.
The Fund is divided into Class IA and Class IB shares. Each class is offered at the per share net asset value (“NAV”) without a sales charge and is subject to the same expenses, except that the Class IB shares are subject to distribution and service fees charged pursuant to a Distribution and Service Plan adopted in accordance with Rule 12b-1 under the 1940 Act.
| 2. | Significant Accounting Policies: |
The following is a summary of significant accounting policies of the Fund, which are in accordance with U.S. Generally Accepted Accounting Principles (“GAAP”).
| a) | Security Transactions and Investment Income – Security transactions are recorded on the trade date (the date the order to buy or sell is executed). Security gains and losses are determined on the basis of identified cost. |
Dividend income is accrued as of the ex-dividend date, except that certain dividends for foreign securities where the ex-dividend date may have passed are recorded as soon as the Fund is informed of the dividend in the exercise of reasonable diligence. Interest income, including amortization of premium and accretion of discounts, is accrued on a daily basis.
| b) | Security Valuation – The Fund generally uses market prices in valuing portfolio securities. If market prices are not readily available or are deemed unreliable, the Fund will use the fair value of the security as determined in good faith under policies and procedures established by and under the supervision of the Fund’s Board of Directors. Market prices may be deemed unreliable, for example, if a security is thinly traded or if an event has occurred after the close of the security’s primary market, but before the close of the New York Stock Exchange (the “Exchange”) (generally 4:00 p.m. Eastern Time, referred to as the “Valuation Time”) that is expected to affect the value of the portfolio security. The circumstances in which the Fund may use fair value pricing include, among others: (i) the occurrence of events that are significant to a particular issuer, such as mergers, restructuring or defaults; (ii) the occurrence of events that are significant to an entire market, such as natural disasters in a particular region or governmental actions; (iii) trading restrictions on securities; (iv) thinly traded securities and (v) market events such as trading halts and early market closings. In addition, with respect to the valuation of stocks primarily traded on foreign markets, the Fund uses a fair value pricing service approved by the Fund’s Board of Directors, which employs quantitative models that evaluate changes in the value of foreign market proxies (e.g., futures contracts, American Depositary Receipts (“ADRs”), exchange traded funds (“ETFs”)) after the close of the foreign markets but before the Valuation Time. Securities that are primarily traded on foreign markets may trade on days that are not business days of the Fund. The value of the foreign securities in which the Fund invests may change on days when a shareholder will not be able to purchase or redeem shares of the Fund. Fair value pricing is subjective in nature and the use of fair value pricing by the Fund may cause the NAV of its shares to differ significantly from the NAV that would have been calculated using market prices at the close of the exchange on which a portfolio security is primarily traded but before the Valuation Time. There can be no |
assurance that the Fund could obtain the fair value assigned to a security if the Fund were to sell the security at approximately the time at which the Fund determines its NAV.
Exchange-traded equity securities are valued at the last reported sale price or official close price on the exchange or market on which the security is primarily traded (the “Primary Market”) at the Valuation Time. If the security did not trade on the Primary Market, it may be valued at the Valuation Time at the last reported sale price on another exchange where it trades. The value of an equity security not traded on any exchange but traded on the Nasdaq Stock Market, Inc. or another over-the-counter market shall be valued at the last reported sale price or official closing price on the exchange or market on which the security is traded as of the Valuation Time.
Foreign-denominated assets, including investment securities, and liabilities are translated from the local currency into U.S. dollars using exchange rates obtained from an independent third party as of the Fund’s Valuation Time.
Financial instruments for which prices are not available from an independent pricing service may be valued using market quotations obtained from one or more dealers that make markets in securities in accordance with procedures established by the Fund’s Board of Directors.
Forward foreign currency contracts represent agreements to exchange currencies on specific future dates at predetermined rates. Forward foreign currency contracts are valued using foreign currency exchange rates and forward rates on the Valuation Date from an independent pricing service.
Other derivative or contractual type instruments shall be valued using market prices if such instruments trade on an exchange or market. If such instruments do not trade on an exchange or market, such instruments shall be valued at a price at which the counterparty to such contract would repurchase the instrument. In the event that the counterparty cannot provide a price, such valuation may be determined in accordance with procedures established by the Fund’s Board of Directors.
Various inputs are used in determining the value of the Fund’s investments. These inputs are summarized into three broad hierarchy levels. This hierarchy is based on whether the valuation inputs are observable or unobservable. These levels are:
| · | Level 1 – Quoted prices in active markets for identical securities. Level 1 may include exchange-traded instruments such as domestic equities, some foreign equities, options, futures, mutual funds, ETFs, and rights and warrants. |
| · | Level 2 – Observable inputs other than Level 1 prices, such as quoted prices for similar securities; quoted prices in markets that are not active; or other inputs that are observable or can be corroborated by observable market data. Level 2 may include debt securities that are traded less frequently than exchange-traded instruments and which are valued using third party pricing services. Prices for most level 2 securities are based on prices received from an independent pricing service. The following asset classes generally use valuation techniques and inputs as noted below: |
Asset Backed Securities and Collateralized Mortgage Obligations – Multi-dimensional spread/prepayment speed tables, with consideration of yield or price of bonds of comparable quality, coupon and maturity, attributes of the collateral, new issue data and monthly payment information.
Corporate Bonds – Multi-dimensional relational model based on observable market information such as yields, spreads, sector analysis, etc.
| Hartford Global Health HLS Fund |
| Notes to Financial Statements – (continued) |
| June 30, 2010 (Unaudited) |
| (000’s Omitted) |
Foreign Currency – Based on rates determined at the close of the Exchange, provided by an independent pricing service.
Forward Currency Contracts – Valued based on the price of the underlying currency at the prevailing interpolated exchange rate, which is a combination of the spot currency rate and the forward currency rate, provided by an independent pricing service.
Foreign Equities – Certain foreign equities are priced using a multi-factor regression model with market observable inputs of a correlative nature (ADRs, futures contracts, ETFs, and currency exchange rates).
International Fixed Income – Multi-dimensional relational model based on observable market information such as benchmark yields, reported trades, bids and offers.
Money Market Instruments – Amortized cost.
Mortgage Backed Securities (“MBS”) – Matrix pricing using inputs of To-Be-Announced (“TBA”) prices, new issue data and monthly payment information, with consideration of yield or price of bonds of comparable quality, coupon and maturity, and attributes of the collateral.
Municipal Bonds – Multi-dimensional relational model and series of matrices based on observable market information such as Municipal Securities Rulemaking Board reported trades, comparable bonds, yields, spreads and credit analysis.
Preferred Stocks – Close mean of bid/ask or bid.
Repurchase Agreements – Priced at par.
Senior Floating Rate Interests – Composite of quotes from one or more contributing dealers.
Swaps – Price based upon observable market information from an independent pricing service.
U.S. Government Securities – Treasuries exclusively traded in the secondary market.
| · | Level 3 – Significant unobservable inputs that are supported by limited or no market activity. Level 3 may include financial instruments whose values are determined using broker quotes or require significant management judgment or estimation. While these securities are priced using unobservable inputs, the valuation of these securities reflects the best available data and management believes the prices are a reasonable representation of exit price. The following asset classes generally use valuation techniques and inputs as noted below: |
Asset Backed Securities & Commercial Mortgage Backed Securities – Certain other MBS with limited liquidity priced from an independent pricing service.
Common Stocks – Trading has been halted or there are restrictions on trading. Valuation is based on last trade with the application of a discount or premium, if applicable.
Long Dated Over-the-Counter Options – Terms greater than 10 years from current date, expected volatility is not observable. Prices are from an independent pricing service.
Long Term Debt Securities, including Senior Floating Rate Interests – Unobservable valuation inputs may include estimates for current yields, maturity/duration, prepayment speed, and broker quotes for comparable securities along with other assumptions relating to credit quality, collateral value, complexity of the security structure, general market conditions and liquidity.
Swaps – Terms greater than 10 years from current date, expected volatility is not observable. Prices are from an independent pricing service.
Individual securities within any of the above mentioned asset classes may be assigned a different hierarchical level than those that are presented above, as individual circumstances dictate.
During the six-month period ended June 30, 2010, the Fund held no Level 3 securities, therefore no reconciliation of Level 3 securities is presented.
Refer to the Investment Valuation Hierarchy Level Summary found following the Schedule of Investments.
| c) | Foreign Currency Transactions – Assets and liabilities denominated in currencies other than U.S. dollars are translated into U.S. dollars at the exchange rates in effect on the valuation date. Purchases and sales of investment securities, income and expenses are translated into U.S. dollars at the exchange rates on the dates of such transactions. |
The Fund does not isolate that portion of portfolio security valuation resulting from fluctuations in the foreign currency exchange rates from the fluctuations arising from changes in the market prices of securities held. Exchange rate fluctuations are included with the net realized and unrealized gain or loss on investments in the accompanying financial statements.
Net realized foreign exchange gains or losses arise from sales of foreign currencies and the difference between asset and liability amounts initially stated in foreign currencies and the U.S. dollar value of the amounts actually received or paid. Net unrealized foreign exchange gains or losses arise from changes in the value of other assets and liabilities at the end of the reporting period, resulting from changes in the exchange rates.
| d) | Joint Trading Account – Pursuant to an exemptive order issued by the SEC, the Fund may transfer uninvested cash balances into a joint trading account managed by Wellington Management Company, LLP (“Wellington Management”). These balances may be invested in one or more repurchase agreements and/or short-term money market instruments. |
| e) | Repurchase Agreements – A repurchase agreement is an agreement by which a counterparty agrees to sell a security and agrees to repurchase the security sold at a mutually agreed upon time and price. At the time the Fund enters into a repurchase agreement, the value of the underlying collateral security(ies), including accrued interest, will be equal to or exceed the value of the repurchase agreement. To minimize counterparty risk, the securities that serve to collateralize the repurchase agreement are held by the Fund's custodian in book entry or physical form in the custodial account of the Fund or in a third party custodial account. Repurchase agreements are valued at cost plus accrued interest. The Fund, as shown on the Schedule of Investments, had outstanding repurchase agreements as of June 30, 2010. |
| f) | Forward Foreign Currency Contracts – The Fund may enter into forward foreign currency contracts that obligate the Fund to purchase or sell currencies at specified future dates. Forward foreign currency contracts may be used to hedge against adverse fluctuations in exchange rates between currencies. |
Forward foreign currency contracts involve elements of market risk in excess of the amounts reflected in the Statement of Assets and Liabilities. In addition, risks may arise upon entering into these contracts from the potential inability of the counterparties to meet the terms of the contracts and from unanticipated movements in the value of the foreign currencies relative to the U.S. dollar. The Fund had outstanding forward foreign currency contracts as shown on the Schedule of Investments as of June 30, 2010.
| Hartford Global Health HLS Fund |
| Notes to Financial Statements – (continued) |
| June 30, 2010 (Unaudited) |
| (000’s Omitted) |
| g) | Fund Share Valuation and Dividend Distributions to Shareholders – Orders for the Fund’s shares are executed in accordance with the investment instructions of the contract holders or plan participants. The NAV of the Fund’s shares is determined as of the close of each business day of the Exchange. The NAV is determined separately for each class of the Fund by dividing the Fund’s net assets attributable to that class by the number of outstanding shares of the class. Orders for the purchase of the Fund’s shares received by an insurance company or plan prior to the close of the Exchange on any day on which the Exchange is open for business are priced at the NAV determined as of the close of the Exchange. Orders received by an insurance company or plan after the close of the Exchange, or on a day on which the Exchange and/or the Fund is not open for business, are priced at the next determined NAV. |
Dividends are declared pursuant to a policy adopted by the Fund’s Board of Directors based upon the investment performance of the Fund. The policy of the Fund is to pay dividends from net investment income and distribute realized capital gains, if any, at least once a year.
Distributions from net investment income, realized capital gains and capital are determined in accordance with federal income tax regulations, which may differ from U.S. GAAP with respect to character and timing. These differences may include but are not limited to losses deferred due to wash sale adjustments, foreign currency gains and losses, adjustments related to Passive Foreign Investment Companies (“PFICs”), Real Estate Investment Trusts (“REITs”), Regulated Investment Companies (“RICs”), certain derivatives and partnerships. Permanent book and federal income tax basis differences relating to shareholder distributions will result in reclassifications to certain of the Fund’s capital accounts (see Federal Income Taxes: Reclassification of Capital Accounts note).
| h) | Illiquid and Restricted Securities – The Fund is permitted to invest up to 15% of its net assets in illiquid securities. “Illiquid Securities” are those that may not be sold or disposed of in the ordinary course of business within seven days, at approximately the price used to determine the Fund’s NAV. The Fund may not be able to sell illiquid securities or other investments when its sub-adviser considers it desirable to do so or may have to sell such securities or investments at a price that is lower than the price that could be obtained if the securities or investments were more liquid. A sale of illiquid securities or other investments may require more time and may result in higher dealer discounts and other selling expenses than does the sale of those that are liquid. Illiquid securities and investments also may be more difficult to value, due to the unavailability of reliable market quotations for such securities or investments, and an investment in them may have an adverse impact on the Fund’s NAV. The Fund may also purchase certain restricted securities, commonly known as Rule 144A securities, that can be resold to institutions and which may be determined to be liquid pursuant to policies and guidelines established by the Fund’s Board of Directors. The Fund, as shown on the Schedule of Investments, had illiquid or restricted securities as of June 30, 2010. |
| i) | Securities Purchased on a When-Issued or Delayed-Delivery Basis – Delivery and payment for securities that have been purchased by the Fund on a forward commitment, or when-issued or delayed-delivery basis, take place beyond the customary settlement period. During this period, such securities are subject to market fluctuations, and the Fund identifies securities segregated in its records with value at least equal to the amount of the commitment. As of June 30, 2010, the Fund had no outstanding when-issued or delayed delivery securities. |
| j) | Use of Estimates – The preparation of financial statements in conformity with U.S. GAAP requires management to make estimates and assumptions that affect the reported amounts of assets and liabilities as of the date of the financial statements and the reported amounts of income and expenses during the period. Operating results in the future could vary from the amounts derived from management’s estimates. |
| k) | Additional Derivative Instrument(s) Information |
Derivative Instrument(s) as of June 30, 2010.
| Statement of Assets and Liabilities Location | |||||||||
| Risk Exposure Category | Asset Derivatives | Liability Derivatives | |||||||
| Foreign exchange contracts | Unrealized depreciation on forward | 113 | |||||||
| foreign currency contracts | |||||||||
The volume of derivatives that is presented in the Schedule of Investments is consistent with the derivative activity during the six-month period ended June 30, 2010.
Realized Gain/Loss and Change in Unrealized Appreciation (Depreciation) on Derivative Instruments for the six-month period ended June 30, 2010:
| Amount of Realized Gain or (Loss) on Derivatives Recognized in Income | ||||||||||||||||||||||||
| Forward | ||||||||||||||||||||||||
| Purchased | Currency | |||||||||||||||||||||||
| Risk Exposure Category | Written Options | Options | Futures | Contracts | Swaps | Total | ||||||||||||||||||
| Foreign exchange contracts | $ | — | $ | — | $ | — | $ | (5 | ) | $ | — | $ | (5 | ) | ||||||||||
| Total | $ | — | $ | — | $ | — | $ | (5 | ) | $ | — | $ | (5 | ) | ||||||||||
| Change in Unrealized Appreciation or (Depreciation) on Derivatives Recognized Income | ||||||||||||||||||||||||
| Forward | ||||||||||||||||||||||||
| Purchased | Currency | |||||||||||||||||||||||
| Risk Exposure Category | Written Options | Options | Futures | Contracts | Swaps | Total | ||||||||||||||||||
| Foreign exchange contracts | — | — | — | (117 | ) | — | $ | (117 | ) | |||||||||||||||
| Total | $ | — | $ | — | $ | — | $ | (117 | ) | $ | — | $ | (117 | ) | ||||||||||
| l) | Indemnifications – Under the Company’s organizational documents, the Company shall indemnify its officers and directors to the full extent required or permitted under Maryland General Corporation Law and the federal securities laws. In addition, the Company, on behalf of the Fund, may enter into contracts that contain a variety of indemnifications. The Company’s maximum exposure under these arrangements is unknown. However, the Company has not had prior claims or losses pursuant to these contracts and expects the risk of loss to be remote. |
| 3. | Federal Income Taxes: |
| a) | Federal Income Taxes – For federal income tax purposes, the Fund intends to continue to qualify as a RIC under Subchapter M of the Internal Revenue Code (“IRC”) by distributing substantially all of its taxable net investment income and net realized capital gains to its shareholders and otherwise complying with the requirements of RICs. The Fund has distributed substantially all of its income and capital gains in prior years and intends to distribute substantially all of its income and capital gains prior to the next fiscal year end. Accordingly, no provision for federal income or excise taxes has been made in the accompanying financial statements. Distributions from short-term capital gains are treated as ordinary income distributions for federal income tax purposes. |
| b) | Net Investment Income (Loss), Net Realized Gains (Losses) – Net investment income (loss) and net realized gains (losses) may differ for financial statement and tax purposes primarily because of losses deferred due to wash sale adjustments, foreign currency gains and losses, adjustments related to PFICs, REITs, RICs, certain derivatives and partnerships. The character of distributions made during the year from net investment income or net realized gains may differ from their ultimate characterization for federal income tax purposes. Also, due to the timing of dividend |
| Hartford Global Health HLS Fund |
| Notes to Financial Statements – (continued) |
| June 30, 2010 (Unaudited) |
| (000’s Omitted) |
distributions, the fiscal year in which amounts are distributed may differ from the year that the income or realized gains (losses) were recorded by the Fund.
| c) | Distributions and Components of Distributable Earnings – The tax character of distributions paid by the Fund for the periods indicated is as follows (as adjusted for dividends payable): |
| For the Year Ended | For the Year Ended | |||||||
| December 31, 2009 | December 31, 2008 | |||||||
| Ordinary Income | $ | 971 | $ | 3,278 | ||||
| Long-Term Capital Gains* | 275 | 13,861 | ||||||
| * | The Fund designates these distributions as long-term capital dividends pursuant to IRC code Sec. 852(b)(3)(C). |
As of December 31, 2009, the Fund’s components of distributable earnings (deficit) on a tax basis were as follows:
| Amount | ||||
| Undistributed Ordinary Income | $ | 34 | ||
| Accumulated Capital and Other Losses* | (31,962 | ) | ||
| Unrealized Appreciation† | 7,338 | |||
| Total Accumulated Deficit | $ | (24,590 | ) | |
| * | The Fund has capital loss carryforwards that are identified in the Capital Loss Carryforward note that follows. |
| † | The difference between book-basis and tax-basis unrealized appreciation (depreciation) may be attributable to the losses deferred due to wash sale adjustments, foreign currency gains and losses, adjustments related to PFICs, REITs, RICs, certain derivatives and partnerships. |
| d) | Reclassification of Capital Accounts – The Fund may record reclassifications in its capital accounts. These reclassifications have no impact on the total net assets of the Fund. The reclassifications are a result of permanent differences between GAAP and tax accounting for such items as net operating losses that reduce distribution requirements. Adjustments are made to reflect the impact these items have on current and future distributions to shareholders. Therefore, the source of the Fund’s distributions may be shown in the accompanying Statement of Changes in Net Assets as from net investment income, from net realized gains on investments or from capital depending on the type of book and tax differences that exist. For the year ended December 31, 2009, the Fund recorded reclassifications to increase (decrease) the accounts listed below: |
| Amount | ||||
| Accumulated Undistributed Net Investment Income | $ | (6 | ) | |
| Accumulated Net Realized Gain (Loss) on Investments | 6 | |||
| e) | Capital Loss Carryforward – At December 31, 2009 (tax-year-end), the Fund had capital loss carryforwards for U.S. federal income tax purposes of approximately: |
| Year of Expiration | Amount | |||
| 2017 | $ | 28,383 | ||
| Total | $ | 28,383 | ||
As of December 31, 2009, the Fund elected to defer the following post October losses.
| Amount | ||||
| Long-Term Capital Gain | $ | 3,579 | ||
| f) | Accounting for Uncertainty in Income Taxes – Management has evaluated all open tax years and has determined there is no impact to the Fund’s financial statements related to uncertain tax positions. Generally, tax authorities can examine all tax returns filed for the last three years. |
| 4. | Expenses: |
| a) | Investment Management Agreements – HL Investment Advisors, LLC (“HL Advisors”), an indirect wholly-owned subsidiary of The Hartford Financial Services Group, Inc. (“The Hartford”), serves as investment manager to the Fund pursuant to an Investment Management Agreement with the Company. As investment manager, HL Advisors has overall investment supervisory responsibility for the Fund. In addition, HL Advisors provides administrative personnel, services, equipment, facilities and office space for proper operation of the Fund. |
HL Advisors has contracted with Wellington Management for the provision of day-to-day investment management services to the Fund in accordance with the Fund’s investment objective and policies. The Fund pays a fee to HL Advisors, a portion of which may be used to compensate Wellington Management.
| b) | Administrative Services Agreement – For the two-month period January 1, 2010 through February 28, 2010, under the Administrative Services Agreement between HLIC and the Company, on behalf of the Fund, HLIC provided administrative services to the Fund and received monthly compensation at the annual rate of 0.20% of the Fund’s average daily net assets. The Fund assumed and paid certain other expenses (including, but not limited to, accounting, custodian, state taxes and Directors’ fees). Effective March 1, 2010, the Investment Management Agreement was amended to include the administrative services for the Fund and the separate administrative services agreement was terminated. |
The schedule below reflects the rates of compensation paid to HL Advisors for investment management services and to HLIC for administrative services rendered from January 1, 2010 through February 28, 2010, and the rates of compensation paid to the HL Advisors for the combined services from March 1, 2010 through June 30, 2010; the rates are accrued daily and paid monthly.
| Average Daily Net Assets | Annual Fee | |||
| On first $250 million | 0.8500 | % | ||
| On next $250 million | 0.8000 | % | ||
| On next $4.5 billion | 0.7500 | % | ||
| On next $5 billion | 0.7475 | % | ||
| Over $10 billion | 0.7450 | % | ||
| c) | Accounting Services Agreement – Pursuant to the Fund Accounting Agreement between HLIC and the Company, on behalf of the Fund, HLIC provides accounting services to the Fund and receives monthly compensation on the Fund’s average net assets. The Fund’s accounting services fees are accrued daily and paid monthly. |
| Average Daily Net Assets | Annual Fee | |||
| All Assets | 0.010 | % | ||
| d) | Operating Expenses – Allocable expenses incurred by the Company are allocated to each Fund and allocated to classes within the Fund in proportion to the average daily net assets of the Fund and each class, except where allocation of certain expenses is more fairly made directly to the Fund or to specific classes within a Fund. |
| Hartford Global Health HLS Fund |
| Notes to Financial Statements – (continued) |
| June 30, 2010 (Unaudited) |
| (000’s Omitted) |
| e) | Fees Paid Indirectly – The Company, on behalf of the Fund has entered into agreements with State Street Global Advisers, LLC and Russell Implementation Securities, Inc. to partially recapture non-discounted trade commissions. Such rebates are used to pay a portion of the Fund’s expenses. In addition, the Fund’s custodian bank has also agreed to reduce its fees when the Fund maintains cash on deposit in a non-interest-bearing custody account. For the six-month period ended June 30, 2010, these amounts are included in the Statement of Operations. |
The ratio of expenses to average net assets in the accompanying financial highlights excludes the reduction in expenses related to fees paid indirectly. Had the fees paid indirectly been included, the annualized expense ratio for the periods listed below would have been as follows:
| Annualized | ||||||||||||||||||||||||
| Six-Month | Year Ended | Year Ended | Year Ended | Year Ended | Year Ended | |||||||||||||||||||
| Period Ended | December 31, | December 31, | December 31, | December 31, | December 31, | |||||||||||||||||||
| June 30, 2010 | 2009 | 2008 | 2007 | 2006 | 2005 | |||||||||||||||||||
| Class IA | 0.91 | % | 0.90 | % | 0.88 | % | 0.87 | % | 0.87 | % | 0.86 | % | ||||||||||||
| Class IB | 1.16 | 1.15 | 1.13 | 1.12 | 1.12 | 1.11 | ||||||||||||||||||
| f) | Distribution Plan for Class IB shares – The Company, on behalf of the Fund, has adopted a Distribution Plan pursuant to Rule 12b-1 under the 1940 Act for the Class IB shares. Pursuant to the Distribution Plan, the Fund is authorized to compensate the Distributor, Hartford Securities Distribution Company, Inc. (a wholly owned, ultimate subsidiary of The Hartford), from assets attributable to the Class IB shares for services rendered and expenses borne in connection with activities primarily intended to result in the sale of the Class IB shares, subject to the Fund Board’s review and approval. |
The Distribution Plan provides that the Fund may pay annually up to 0.25% of the average daily net assets of the Fund attributable to its Class IB shares for activities primarily intended to result in the sale of Class IB shares. The Board has the authority to suspend or reduce these payments at any point in time. Under the terms of the Distribution Plan and the principal underwriting agreement, the Fund is authorized to make payments monthly to the Distributor which may be used to pay or compensate entities providing distribution and shareholder servicing with respect to the Class IB shares for such entities’ fees or expenses incurred or paid in that regard. These fees are accrued daily and paid monthly.
| g) | Other Related Party Transactions – Certain officers of the Fund are directors and/or officers of HL Advisors, and/or The Hartford or its subsidiaries. For the six-month period ended June 30, 2010, a portion of the Fund’s chief compliance officer’s salary was paid by all the investment companies in the Hartford fund complex. The portion allocated to the Fund rounds to zero. Hartford Investor Services Company, LLC ("HISC"), a wholly owned subsidiary of The Hartford, provides transfer agent services to the Fund. The amount HISC was compensated for providing such services can be found on the Statement of Operations. These fees are accrued daily and paid monthly. |
| h) | Payment from Affiliate – In July of 2007, The Hartford entered into a settlement with the Attorneys General of the states of New York, Connecticut and Illinois relating to market timing and the company's individual variable annuity contracts in which certain payments would be made directly to the variable annuity contract holders. The distribution plan provides that unclaimed money from the settlement would be distributed to certain HLS Funds that are investment options through a Hartford individual variable annuity contract. The unclaimed money was distributed to the Fund on September 18, 2009, as follows: |
| Amount | ||||
| Reimbursement | $ | 23 | ||
On November 8, 2006, the SEC issued an order setting forth the terms of a settlement reached with three subsidiaries of The Hartford that resolves the SEC’s Division of Enforcement’s investigation of aspects of The Hartford’s variable annuity and mutual fund operations related to directed brokerage and revenue sharing. The Hartford settled this matter without admitting or denying the findings of the SEC.
The Fund is available for purchase by the separate accounts of different variable universal life policies, variable annuity products, and funding agreements and it is offered directly to certain qualified retirement plans (collectively “Products”). Although existing Products contain transfer restrictions, some Products, particularly older variable annuity products, do not contain restrictions on the frequency of transfers. In addition, as the result of the settlement of litigation against Hartford Life, Inc. (“Hartford Life”) (the issuers of such variable annuity products), the Fund’s ability to restrict transfers by certain owners of older variable annuity products was limited. During 2006, these annuity owners surrendered the older variable annuity contracts that were the subject of prior litigation. In February 2005, Hartford Life agreed with the Board of Directors of the Fund to indemnify the Fund for any material harm caused to the Fund from frequent trading by these contracts owners.
The total return in the accompanying financial highlights includes payment from affiliates. Had the payment from affiliates been excluded, the total return for the periods listed below would have been as follows:
| For the Year Ended December 31, 2009 | ||||||||
| Class IA | Class IB | |||||||
| Impact from Payment from Affiliate for Attorneys General Settlement | 0.01 | % | 0.01 | % | ||||
| Total Return Excluding Payments from Affiliate | 22.70 | 22.39 | ||||||
| For the Year Ended December 31, 2006 | ||||||||
| Class IA | Class IB | |||||||
| Impact from Payment from Affiliate for SEC Settlement | 0.03 | % | 0.03 | % | ||||
| Total Return Excluding Payments from Affiliate | 10.16 | 10.88 | ||||||
| 5. | Investment Transactions: |
For the six-month period ended June 30, 2010, the cost of purchases and proceeds from sales of investment securities (excluding short-term investments) were as follows:
| Amount | ||||
| Cost of Purchases Excluding U.S. Government Obligations | $ | 34,843 | ||
| Sales Proceeds Excluding U.S. Government Obligations | 52,165 | |||
| 6. | Line of Credit: |
The Fund is one of several Hartford funds that participate in a $500 million committed revolving line of credit facility. The facility is to be used for temporary or emergency purposes. Under the arrangement, a fund is required to own securities having a market value in excess of 300% of the total bank borrowings. The interest rate on borrowings varies depending on the nature of the loan. The facility also requires a fee to be paid based on the amount of the commitment. This fee is allocated to all the funds participating in the line of credit based on the average net assets of the funds. During the six-month period ended June 30, 2010, the Fund did not have any borrowings under this facility.
| 7. | Industry Classifications: |
Other than the industry classifications “Other Investment Pools and Funds” and “Exchange Traded Funds”, equity industry classifications used in this report are the Global Industry Classification Standard, which was developed by and is the exclusive property and service mark of MSCI, Inc. and Standard & Poor’s.
| Hartford Global Health HLS Fund |
| - Selected Per-Share Date (A) - |
| Net Asset | Net Realized | Net Increase | ||||||||||||||||||||||||||||||||||||||||||
| Value at | Payments | and Unrealized | Total from | Dividends from | Distributions | (Decrease) in | Net Asset | |||||||||||||||||||||||||||||||||||||
| Beginning of | Net Investment | from (to) | Gain (Loss) on | Investment | Net Investment | from Realized | Distributions | Total | Net Asset | Value at End | ||||||||||||||||||||||||||||||||||
| Class | Period | Income (Loss) | Affiliate | Investments | Operations | Income | Capital Gains | from Capital | Distributions | Value | of Period | |||||||||||||||||||||||||||||||||
| For the Six-Month Period Ended June 30, 2010 (Unaudited) | ||||||||||||||||||||||||||||||||||||||||||||
| IA | $ | 12.99 | $ | 0.03 | $ | – | $ | (0.84 | ) | $ | (0.81 | ) | $ | – | $ | – | $ | – | $ | – | $ | (0.81 | ) | $ | 12.18 | |||||||||||||||||||
| IB | 12.74 | 0.01 | – | (0.82 | ) | (0.81 | ) | – | – | – | – | (0.81 | ) | 11.93 | ||||||||||||||||||||||||||||||
| For the Year Ended December 31, 2009 | ||||||||||||||||||||||||||||||||||||||||||||
| IA | 10.66 | 0.07 | – | 2.35 | 2.42 | (0.07 | ) | (0.02 | ) | – | (0.09 | ) | 2.33 | 12.99 | ||||||||||||||||||||||||||||||
| IB | 10.46 | 0.03 | – | 2.31 | 2.34 | (0.04 | ) | (0.02 | ) | – | (0.06 | ) | 2.28 | 12.74 | ||||||||||||||||||||||||||||||
| For the Year Ended December 31, 2008 | ||||||||||||||||||||||||||||||||||||||||||||
| IA | 15.39 | 0.06 | – | (3.99 | ) | (3.93 | ) | (0.06 | ) | (0.74 | ) | – | (0.80 | ) | (4.73 | ) | 10.66 | |||||||||||||||||||||||||||
| IB | 15.11 | 0.02 | – | (3.91 | ) | (3.89 | ) | (0.02 | ) | (0.74 | ) | – | (0.76 | ) | (4.65 | ) | 10.46 | |||||||||||||||||||||||||||
| For the Year Ended December 31, 2007 | ||||||||||||||||||||||||||||||||||||||||||||
| IA | 16.84 | 0.03 | – | 0.99 | 1.02 | (0.02 | ) | (2.45 | ) | – | (2.47 | ) | (1.45 | ) | 15.39 | |||||||||||||||||||||||||||||
| IB | 16.59 | (0.02 | ) | – | 0.99 | 0.97 | – | (2.45 | ) | – | (2.45 | ) | (1.48 | ) | 15.11 | |||||||||||||||||||||||||||||
| For the Year Ended December 31, 2006 | ||||||||||||||||||||||||||||||||||||||||||||
| IA | 17.66 | 0.02 | – | 1.75 | 1.77 | (0.01 | ) | (2.58 | ) | – | (2.59 | ) | (0.82 | ) | 16.84 | |||||||||||||||||||||||||||||
| IB | 17.47 | (0.02 | ) | – | 1.72 | 1.70 | – | (2.58 | ) | – | (2.58 | ) | (0.88 | ) | 16.59 | |||||||||||||||||||||||||||||
| For the Year Ended December 31, 2005 | ||||||||||||||||||||||||||||||||||||||||||||
| IA | 16.92 | 0.01 | – | 1.94 | 1.95 | (0.01 | ) | (1.20 | ) | – | (1.21 | ) | 0.74 | 17.66 | ||||||||||||||||||||||||||||||
| IB | 16.78 | (0.01 | ) | – | 1.90 | 1.89 | – | (1.20 | ) | – | (1.20 | ) | 0.69 | 17.47 | ||||||||||||||||||||||||||||||
| (A) | Information presented relates to a share outstanding throughout the indicated period. |
| (B) | The figures do not include sales charges or other fees which may be applied at the variable life insurance, variable annuity or qualified retirement plan product level. Any such additional sales charges or other fees would lower the Fund's performance. |
| (C) | Ratios do not reflect reductions for fees paid indirectly. Please see Fees Paid Indirectly in the Notes to Financial Statements. |
| (D) | Portfolio turnover rate is calculated on the basis of the Fund as a whole without distinguishing between the classes of shares issued. |
| (E) | Not annualized. |
| (F) | Annualized. |
| (G) | Total return without the inclusion of the Payment from (to) Affiliate can be found in Expenses in the accompanying Notes to Financial Statements. |
| - Ratios and Supplemental Data - - |
Ratio of Expenses to Average Net | Ratio of Expenses to Average Net | Ratio of Net Investment Income | Portfolio Turnover | |||||||||||||||||||
| Total Return(B) | Net Assets at End of Period | Assets Before Waivers(C) | Assets After Waivers(C) | to Average Net Assets | Rate(D) | |||||||||||||||||
| (6.27 | )%(E) | $ | 133,026 | 0.91 | %(F) | 0.91 | %(F) | 0.36 | %(F) | 17 | % | |||||||||||
| (6.38 | )(E) | 53,881 | 1.16 | (F) | 1.16 | (F) | 0.11 | (F) | – | |||||||||||||
| 22.72 | (G) | 154,216 | 0.91 | 0.91 | 0.51 | 73 | ||||||||||||||||
| 22.41 | (G) | 63,065 | 1.16 | 1.16 | 0.26 | – | ||||||||||||||||
| (25.56 | ) | 179,087 | 0.88 | 0.88 | 0.42 | 57 | ||||||||||||||||
| (25.75 | ) | 62,080 | 1.13 | 1.13 | 0.17 | – | ||||||||||||||||
| 6.12 | 289,561 | 0.87 | 0.87 | 0.16 | 39 | |||||||||||||||||
| 5.86 | 105,898 | 1.12 | 1.12 | (0.09 | ) | – | ||||||||||||||||
| 11.19 | (G) | 319,896 | 0.88 | 0.88 | 0.11 | 34 | ||||||||||||||||
| 10.91 | (G) | 119,000 | 1.13 | 1.13 | (0.13 | ) | – | |||||||||||||||
| 12.43 | 309,235 | 0.87 | 0.87 | 0.12 | 46 | |||||||||||||||||
| 12.15 | 123,593 | 1.12 | 1.12 | (0.13 | ) | – | ||||||||||||||||
| Hartford Global Health HLS Fund |
The Board of Directors appoints officers who are responsible for the day-to-day operations of the Fund and who execute policies formulated by the Directors. Each director serves until his or her death, resignation, or retirement or until the next annual meeting of shareholders is held or until his or her successor is elected and qualifies.
Directors and officers who are employed by or who have a financial interest in The Hartford are considered “interested” persons of the Fund pursuant to the Investment Company Act of 1940, as amended. Each officer and two of the Company’s directors, as noted in the chart below, are “interested” persons of the Fund. Each director serves as a director for The Hartford Mutual Funds, Inc., The Hartford Mutual Funds II, Inc., The Hartford Income Shares Fund, Inc., Hartford Series Fund, Inc., and Hartford HLS Series Fund II, Inc., which, as of June 30, 2010, collectively consist of 88 funds. Correspondence may be sent to directors and officers c/o Hartford Mutual Funds, P.O. Box 2999, Hartford, Connecticut 06104-2999, except that correspondence to Ms. Fagely may be sent to 500 Bielenberg Drive, Woodbury, Minnesota 55125.
The table below sets forth, for each director and officer, his or her name, year of birth, current position with the Company and date first elected or appointed to Hartford Series Fund, Inc. (“HSF”), and Hartford HLS Series Fund II, Inc. (“HSF2”), principal occupation, and, for directors, other directorships held. The Fund’s statement of additional information contains further information on the directors and is available free of charge by calling 1-800-862-6668 or writing to Hartford HLS Funds, c/o Individual Annuity Services, P.O. Box 5085, Hartford, CT 06102-5085.
Information on the aggregate remuneration paid to the directors of the Company can be found in the Statement of Operations herein. The Fund pays to The Hartford a portion of the chief compliance officer’s compensation, but does not pay salaries or compensation to any of their other officers or directors who are employed by The Hartford.
Non-Interested Directors
Lynn S. Birdsong (1946) Director since 2003, Co-Chairman of the Investment Committee
Mr. Birdsong is a private investor. Since 2003, Mr. Birdsong has been an independent director of The Japan Fund and has served as a Director of the Sovereign High Yield Fund since April 2010. From 2003 to March 2005, Mr. Birdsong was an independent director of the Atlantic Whitehall Funds. From 1979 to 2002, Mr. Birdsong was a managing director of Zurich Scudder Investments, an investment management firm. During his employment with Scudder, Mr. Birdsong was an interested director of The Japan Fund. Since 1981, Mr. Birdsong has been a partner in Birdsong Company, an advertising specialty firm.
Robert M. Gavin, Jr. (1940) Director since 2002 (HSF) and 1986 (HSF2), Chairman of the Board since 2004
Dr. Gavin is an educational consultant. Prior to September 1, 2001, he was President of Cranbrook Education Community and prior to July 1996, he was President of Macalester College, St. Paul, Minnesota.
Duane E. Hill (1945) Director since 2001 (HSF) and 2002 (HSF2), Chairman of the Nominating Committee
Mr. Hill is Partner of TSG Ventures L.P., a private equity investment company. Mr. Hill is a former partner of TSG Capital Group, a private equity investment firm that served as sponsor and lead investor in leveraged buyouts of middle market companies.
Sandra S. Jaffee (1941) Director since 2005
Ms. Jaffee served as Chairman (2008 to 2009) and Chief Executive Officer of Fortent (formerly Searchspace Group), a leading provider of compliance/regulatory technology to financial institutions from August 2005 to August 2009. From August 2004 to August 2005, Ms. Jaffee served as an Entrepreneur in Residence with Warburg Pincus, a private equity firm. From September 1995 to July 2004, Ms. Jaffee served as Executive Vice President at Citigroup, where she was President and Chief Executive Officer of Citibank’s Global Securities Services (1995 to 2003).
William P. Johnston (1944) Director since 2005, Chairman of the Compliance Committee
In June 2006, Mr. Johnston was appointed as Senior Advisor to The Carlyle Group, a global private equity investment firm. In July 2006, Mr. Johnston was elected to the Board of Directors of MultiPlan, Inc. In August 2007, Mr. Johnston was elected to the Board of Directors of LifeCare Holdings, Inc. In February 2008, Mr. Johnston was elected to the Board of Directors of HCR-ManorCare, Inc. In May 2006, Mr. Johnston was elected to the Supervisory Board of Fresenius Medical Care AG & Co. KGaA, after its acquisition of Renal Care Group, Inc. in March 2006. Mr. Johnston joined Renal Care Group in November 2002 as a member of the Board of Directors and served as Chairman of the Board from March 2003 through March 2006. From September 1987 to December 2002, Mr. Johnston was with Equitable Securities Corporation (and its successors, SunTrust Equitable Securities and SunTrust Robinson Humphrey) serving in various investment banking and managerial positions, including Managing Director and Head of Investment Banking, Chief Executive Officer and Vice Chairman.
Phillip O. Peterson (1944) Director since 2002 (HSF) and 2000 (HSF2), Chairman of the Audit Committee
Mr. Peterson is a mutual fund industry consultant. He was a partner of KPMG LLP (an accounting firm) until July 1999. Mr. Peterson joined William Blair Funds in February 2007 as a member of the Board of Trustees. From January 2004 to April 2005, Mr. Peterson served as Independent President of the Strong Mutual Funds.
Lemma W. Senbet (1946) Director since 2005
Dr. Senbet is the William E. Mayer Chair Professor of Finance and Director, Center for Financial Policy, at the University of Maryland, Robert H. Smith School of Business. He was chair of the Finance Department during 1998 to 2006. Previously he was a chaired professor of finance at the University of Wisconsin-Madison. Also, he was director of the Fortis Funds from March 2000 to July 2002. Dr. Senbet served the finance profession in various capacities, including as director of the American Finance Association and President of the Western Finance Association. In 2006, Dr. Senbet was inducted Fellow of Financial Management Association International for his career-long distinguished scholarship and professional service.
Interested Directors and Officers
Lowndes A. Smith (1939) Director since 1996 (HSF) and 2002 (HSF2), Co-Chairman of the Investment Committee
Mr. Smith served as Vice Chairman of The Hartford from February 1997 to January 2002, as President and Chief Executive Officer of Hartford Life, Inc. from February 1997 to January 2002, and as President and Chief Operating Officer of The Hartford Life Insurance Companies from January 1989 to January 2002. Mr. Smith serves as a Director of White Mountains Insurance Group, Ltd., One Beacon Insurance, Symetra Financial and as a Managing Director of Whittington Gray Associates.
John C. Walters 1, 2 (1962) Director since 2008
Mr. Walters currently serves as President, Chief Executive Officer and Director for Hartford Life, Inc. (“HL, Inc.”). Mr. Walters also serves as President, Chairman of the Board, Chief Executive Officer and Director for Hartford Life Insurance Company (“Hartford Life”), and as Executive Vice President of The Hartford. In addition, Mr. Walters is a Manager of HL Investment Advisors, LLC (“HL Advisors”). Mr. Walters previously served as President of the U.S. Wealth Management Division of HL, Inc. (2006-2007) and as Co-Chief Operating Officer of Hartford Life (2007-2008).
1 Mr. Walters previously served as President and Chief Executive Officer (2007 to 2009).
2 Effective July 31, 2010, Mr. Walters retired from The Hartford. Mr. Walters resigned his position as a Director of the Fund effective July 30, 2010.
Other Officers
Robert M. Arena, Jr. (1968) President and Chief Executive Officer since 2009 (served as Vice President of the Fund (2006-2009))
Mr. Arena serves as Executive Vice President of Hartford Life. Additionally, Mr. Arena is Senior Vice President and Director of Hartford Administrative Services Company, (“HASCO”), President, Chief Executive Officer and Manager of Hartford Investment Financial Services, LLC (“HIFSCO”) and President, Chief Executive Officer and Manager of HL Advisors. Mr. Arena joined The Hartford in 2004.
Tamara L. Fagely (1958) Vice President, Treasurer and Controller since 2002 (HSF) 1993 (HSF2)
Ms. Fagely has been a Vice President of HASCO since 1998 and Chief Financial Officer since 2006. Currently Ms. Fagely is a Vice President of Hartford Life. She served as Assistant Vice President of Hartford Life from December 2001 through March 2005. In addition, Ms. Fagely is Controller and Chief Financial Officer of HIFSCO.
Brian Ferrell (1962) AML Compliance Officer since 2008
Mr. Ferrell has served as Assistant Vice President and AML Compliance Officer for The Hartford since 2006, and as AML Compliance Officer for HASCO and Hartford Investor Services Company, LLC (“HISC”) since 2008. Prior to joining The Hartford in 2006, Mr. Ferrell held various positions at the U.S. Department of the Treasury (the “Treasury”) from 2001 to 2006, where he served as Chief Counsel for the Treasury’s Financial Crimes Enforcement Network from 2005-2006.
Dr. Robert J. Froehlich (1953) Senior Managing Director since 2009
Dr. Froehlich joined The Hartford as Senior Managing Director in September 2009. Prior to joining The Hartford, Dr. Froehlich served as Vice Chairman of Deutsche Asset Management from 1997-2009.
| Hartford Global Health HLS Fund |
| Directors and Officers (Unaudited) – (continued) |
Thomas D. Jones, III (1965) Vice President and Chief Compliance Officer since 2006
Mr. Jones serves as Chief Compliance Officer for the Hartford Mutual Funds and Vice President and Director of Securities Compliance for The Hartford. Mr. Jones joined The Hartford in 2006 from SEI Investments, where he served as Chief Compliance Officer for its mutual funds and investment advisers. Prior to joining SEI, Mr. Jones was First Vice President and Compliance Director for Merrill Lynch Investment Managers (Americas) (“MLIM”), where he worked from 1992-2004.
Edward P. Macdonald (1967) Vice President, Secretary and Chief Legal Officer since 2005
Mr. Macdonald serves as Assistant Vice President of Hartford Life and Chief Legal Officer and Vice President of HIFSCO. He also serves as Vice President and Secretary of HASCO, and Chief Legal Officer, Secretary and Vice President of HL Advisors. Mr. Macdonald joined The Hartford in 2005.
Vernon J. Meyer (1964) Vice President since 2006
Mr. Meyer serves as Senior Vice President of Hartford Life. He also serves as Senior Vice President of HIFSCO and HL Advisors. Mr. Meyer joined The Hartford in 2004.
D. Keith Sloane (1960) Vice President since 2009
Mr. Sloane is a Senior Vice President of Hartford Life. Additionally, Mr. Sloane currently serves as Senior Vice President of HIFSCO, HL Advisors, and HASCO. Prior to joining The Hartford in 2007, Mr. Sloane was Director of product marketing and led the mutual fund business for Wachovia Securities (“Wachovia”) in their investment products group. Mr. Sloane joined Wachovia in 1995.
Jane Wolak (1961) Vice President since 2009
Ms. Wolak currently serves as Vice President of Hartford Life. Ms. Wolak joined Hartford Life as Vice President, Retail Product Services in May 2007. She is also Vice President of HASCO. Previously, Ms. Wolak was with Sun Life Financial where she held the position of Vice President, Service Center Operations from 2001-2007.
A description of the policies and procedures that the Fund uses to determine how to vote proxies relating to portfolio securities and a record of how the Fund voted any proxies for the twelve-month period ended June 30, 2010 is available (1) without charge, upon request, by calling 800-862-6668 and (2) on the Securities and Exchange Commission’s website at http://www.sec.gov.
The Fund files a complete schedule of portfolio holdings with the Commission for the first and third quarters of each fiscal year on Form N-Q. The Fund’s Forms are available (1) without charge, upon request, by calling 800-862-6668 and (2) on the Securities and Exchange Commission’s website at http://www.sec.gov. The Form N-Q may be reviewed and copied at the Commission’s Public Reference Room in Washington, DC. Information on the operation of the Public Reference Room may be obtained by calling 1-800-SEC-0330.
| Hartford Global Health HLS Fund |
The following proposal was addressed and approved at a Special Meeting of Shareholders held on February 12, 2010.
Proposal to approve amendments to the Investment Management Agreement between the Fund and HL Investment Advisors, the purpose of which were to combine the administrative services for the Fund with the management services for the Fund under a single agreement.
| Fund | For | Against | Abstain | |||
| Hartford Global Health HLS Fund | 12,598,730.054 | 333,711.364 | 376,516.536 |
Proposal to elect Lemma Senbet and John Walters, each currently a Director, as Directors of Hartford Series Fund Inc.
Lemma W. Senbet
| Funds | For | Withheld | ||
| Hartford Series Fund, Inc. | 5,079,578,022.902 | 241,839,974.106 |
John C. Walters
| Funds | For | Withheld | ||
| Hartford Series Fund, Inc. | 5,081,138,302.186 | 240,279,694.822 |
| Hartford Global Health HLS Fund |
Your Fund's Expenses
As a shareholder of the Fund, you incur two types of costs: (1) transaction costs, including sales charges (loads) on purchase payments and contingent deferred sales charges (CDSC) (2) ongoing costs including management fees; distribution fees; and other fund expenses. This example is intended to help you understand your ongoing costs (in dollars) of investing in the Fund and to compare these costs with the ongoing costs of investing in other mutual funds. The example is based on an investment of $1,000 invested at the beginning of the period and held for the period of December 31, 2009 through June 30, 2010.
Actual Expenses
The first set of columns of the table below provides information about actual account values and actual expenses. You may use the information in this column, together with the amount you invested, to estimate the expenses that you paid over the period. Simply divide your account value by $1,000 (for example, an $8,600 account value divided by $1,000 = 8.6), then multiply the result by the number in the line under the heading entitled "Expenses Paid During Period" to estimate the expenses you paid on your account during this period.
Hypothetical Example for Comparison Purposes
The second set of columns of the table below provides information about hypothetical account values and hypothetical expenses based on the Fund's actual expense ratio and an assumed rate of return of 5% per year before expenses, which is not the Fund's actual return. The hypothetical account values and expenses may not be used to estimate the actual ending account balance or expenses you paid for the period. You may use this information to compare the ongoing costs of investing in the Fund and other funds. To do so, compare this 5% hypothetical example with the 5% hypothetical examples that appear in the shareholder reports of the other funds.
Please note that the expenses shown in the table are meant to highlight your ongoing costs only and do not reflect any transactional costs, such as sales charges (loads) and CDSC. Therefore, the second set of columns of the table is useful in comparing ongoing costs only, and will not help you determine the relative total costs of owning different funds. In addition, if these transactional costs were included, your costs would be higher. Expenses are equal to the Fund's annualized expense ratios multiplied by average account value over the period, multiplied by 181/365 (to reflect the one-half year period).
| Actual return | Hypothetical (5% return before expenses) | |||||||||||||||||||||||||||||||||||
| Expenses paid | Expenses paid | Days in | ||||||||||||||||||||||||||||||||||
| during the period | during the period | the | Days | |||||||||||||||||||||||||||||||||
| Beginning | Ending | December 31, 2009 | Beginning | Ending | December 31, 2009 | Annualized | current | in the | ||||||||||||||||||||||||||||
| Account Value | Account Value | through | Account Value | Account Value | through | expense | 1/2 | full | ||||||||||||||||||||||||||||
December 31, 2009 | June 30, 2010 | June 30, 2010 | December 31, 2009 | June 30, 2010 | June 30, 2010 | ratio | year | year | ||||||||||||||||||||||||||||
| Class IA | $ | 1,000.00 | $ | 937.34 | $ | 4.37 | $ | 1,000.00 | $ | 1,020.28 | $ | 4.56 | 0.91 | % | 181 | 365 | ||||||||||||||||||||
| Class IB | $ | 1,000.00 | $ | 936.18 | $ | 5.57 | $ | 1,000.00 | $ | 1,019.04 | $ | 5.81 | 1.16 | % | 181 | 365 | ||||||||||||||||||||
| Hartford Global Health HLS Fund |
The Board approved the annual continuation of the Investment Management Agreement (the “Agreement”) between Hartford Series Fund, Inc. (“HSF”) and HL Investment Advisors, LLC (“HL Advisors”) with respect to the Fund at its meeting on August 4-5, 2009. The Board’s considerations in approving the renewal of the Agreement are disclosed in the December 31, 2009 Annual Report for HSF.
At the November 4-5, 2009 meeting, the Board considered and approved amendments to the Agreement to include administrative services, which had been provided pursuant to a separate agreement, and investment management services under one agreement. The Board, including all of the Independent Directors, approved the amendments to the Agreement with respect to the Fund.
In approving the amendments, in addition to the information presented at the August meeting in connection with the annual review of the Agreement and the additional information provided throughout the year, the Board also considered the fact that the amendments did not result in an overall increase in fees to shareholders. The Board took note of the fact that the management of HL Advisors believes that the proposal to combine the administrative services with the investment management services under a single agreement will produce streamlined fee disclosure, resulting in greater transparency and clarity in the Fund’s prospectuses and financial reports. The Board further noted management's belief that the change would result in consistency across all of the Hartford Funds in the complex in that the funds of HSF are the only funds in the complex (other than the R share classes of the Hartford retail funds) that are subject to a separate administrative services fee. Finally, the Board noted management's view that the proposed changes to the Agreement should also serve to simplify the Board's annual consideration of the investment management arrangements for the Fund in that the investment management and administrative fees would be presented as a single fee for fee comparison purposes, which should facilitate the Board's analysis.
The shareholders of the Fund approved the amendments at a Special Meeting of Shareholders held on February 12, 2010. The amendments were effective as of March 1, 2010.
27
The Hartford
P.O. Box 5085
Hartford, CT 06102–5085
Hartford Series Fund, Inc. is underwritten and distributed by Hartford Securities Distribution Company, Inc.
“The Hartford” is The Hartford Financial Services Group, Inc. and its subsidiaries.
Hartford Series Fund, Inc. inception dates range from 1977 to date. Hartford Series Fund, Inc. is not a subsidiary of The Hartford but is underwritten, distributed by and advised by subsidiaries of The Hartford. Investments in Hartford Series Fund, Inc. are not guaranteed by The Hartford or any other entity.
This material is authorized for distribution only when preceded or accompanied by a current prospectus. The prospectus contains detailed information about the Funds, including investment objectives, risks and charges and expenses. Please read it carefully before you invest or send money.
HLSSAR-GH10 Printed in U.S.A ©2010 The Hartford, Hartford, CT 06115 |
| Hartford Global Research HLS Fund |
|
Hartford Global Research HLS Fund
(formerly Hartford Global Equity HLS Fund)
| Manager Discussions (Unaudited) | 2 |
| Financial Statements | |
| 4 | |
| 11 | |
| 13 | |
| 14 | |
| 15 | |
| 16 | |
| 28 | |
| 30 | |
| 32 | |
| 32 | |
| 33 | |
| 34 | |
| 35 |
This report is prepared for the general information of contract owners and qualified retirement plan participants. It is not an offer of contracts or of qualified retirement plans. It should not be used in connection with any offer, except in conjunction with the appropriate prospectus which contains all pertinent information including the applicable sales, administrative and other charges.
The views expressed in the Fund’s Manager Discussion under ‘‘Why did the Fund perform this way?’’ and ‘‘What is the outlook?’’ are views of the Fund’s subadvisers and portfolio management team through the end of the period and is subject to change based on market and other conditions.
Hartford Global Research HLS Fund inception 01/31/2008
(formerly Hartford Global Equity HLS Fund)
(subadvised by Wellington Management Company, LLP)
Investment objective – Seeks long-term capital appreciation.
Performance Overview(1) 1/31/08 - 6/30/10
Growth of $10,000 investment

MSCI All Country World Index is a free float-adjusted market capitalization-weighted index that measures equity market performance in the global developed and emerging markets, consisting of 48 developed and emerging market country indices.
You cannot invest directly in an index.
The chart represents a hypothetical investment in the Fund. Performance data represents past performance and current performance could be higher or lower.
Average Annual Returns (as of 6/30/10)
| 6 | 1 | Since | |
| Month† | Year | Inception | |
| Global Research IA | -9.32% | 14.25% | -8.80% |
| Global Research IB | -9.43% | 13.97% | -9.02% |
| MSCI All Country World Index | -9.11% | 12.30% | -9.81% |
| † | Not Annualized |
PAST PERFORMANCE IS NOT INDICATIVE OF FUTURE RESULTS.
| (1) | Growth of a $10,000 investment in Class IB shares will vary from the results seen on this page due to differences in the expense charged to this share class. |
Performance information may reflect historical or current expense waivers from the investment adviser, without which performance would have been lower. For information on current expense waivers/reimbursements, please see the prospectus.
The value of the contract will fluctuate so that when redeemed, it may be worth more or less than the original investment. The chart and table do not reflect the deduction of taxes that a shareholder would pay on portfolio distributions or the redemption of portfolio shares. The figures do not include sales charges or other fees which may be applied at the variable life insurance, variable annuity or qualified retirement plan product level. Any such additional sales charges or other fees would lower the Fund’s performance.
| Portfolio Managers | |
| Mark D. Mandel, CFA | Cheryl M. Duckworth, CFA |
| Senior Vice President | Senior Vice President |
How did the Fund perform?
The Class IA shares of the Hartford Global Research HLS Fund returned -9.32% for the six-month period ended June 30, 2010, performing roughly in-line with its benchmark, the MSCI All Country World Index, which returned -9.11% for the same period. The Fund also performed in-line with the -9.38% return of the average fund in the Lipper Global Core Funds VP-UF peer group, a group of funds with investment strategies similar to those of the Fund.
Why did the Fund perform this way?
Global equities had a tumultuous start to 2010. Through late April, U.S. equities rose as investor confidence grew amid better-than-expected corporate earnings, accommodative monetary policy, and improving economic conditions. From late April 2010 until the end of the period, risk aversion rose and equities fell on concerns that the global economy could slip back into a recession. Investors worried about how burgeoning fiscal deficits across much of Europe, tightening credit conditions in China, and a disinflationary environment would affect the economic recovery and corporate earnings growth. In this environment, all ten sectors within the MSCI All Country World Index declined during the period. Energy (-16%), Materials (-13%), and Utilities (-11%) fell the most while returns in Consumer Staples (-3%), Industrials (-4%), and Consumer Discretionary (-4%) held up best on a relative basis.
Stock selection was weakest relative to the benchmark in Energy, Consumer Discretionary, and Telecommunication Services, offsetting positive stock selection in Financials, Materials, and Industrials. Sector allocation did not have a large impact on returns. A modest allocation to cash in a declining market contributed slightly to relative performance.
The largest detractors from relative returns were Mosaic (Materials), British Petroleum (BP) (Energy), and Peugeot (Consumer Discretionary). Shares of Mosaic, a North American producer of potash and phosphate fertilizers, fell as softening global crop prices and macroeconomic concerns weighed on the stock. Shares of BP fell in the aftermath of the catastrophic oil spill at its Deepwater Horizon oil rig in the Gulf of Mexico. Shares of Peugeot, a France-based manufacturer of passenger cars and light commercial vehicles, fell as the company issued cautious guidance driven by expected weak European auto sales following the end of government subsidies. Microsoft (Information Technology) was also among the top detractors from absolute performance.
Top contributors to relative (i.e. performance of the Fund as measured against the benchmark) performance during the period included Apple (Information Technology), Huabao International (Materials), and Bangkok Bank (Financials). Shares of consumer electronics company Apple rose after the company reported better-than-expected fiscal second quarter earnings driven by high iPhone sales. The company also benefited from the successful roll out of the iPad. Shares of Huabao International, a Hong Kong-based producer of flavors and fragrances, rose as the company posted strong earnings due to the company’s ability to grow market share in the Chinese market. Despite recent political turmoil in Thailand, Bangkok Bank’s shares benefited as the Thailand-based bank reported strong earnings partly due to continuing economic recovery. Dr Pepper Snapple Group (Consumer Discretionary) was a top contributor to absolute performance.
What is the outlook?
Global equity markets have come under pressure as credit fears have resurfaced, especially in Europe. We believe that there are also early indications of a potential global growth slowdown. With inflation generally absent, we expect no rate hikes from any of the major central banks in the near future. The emerging countries continue to have superior macroeconomic fundamentals and are expected to provide some offset in an otherwise slowing global growth environment.
In this environment, the Fund ended the period most overweight (i.e. the Fund’s sector position was greater than the benchmark position) the Health Care, Information Technology, and Consumer Discretionary sectors and most underweight (i.e. the Fund’s sector position was less than the benchmark position) the Industrials, Financials, and Consumer Staples sectors. The Fund’s largest absolute weightings were in the Financials, Information Technology, and Health Care sectors.
Diversification by Industry
as of June 30, 2010
| Percentage of | ||||
| Industry (Sector) | Net Assets | |||
| Automobiles & Components (Consumer Discretionary) | 2.3 | % | ||
| Banks (Financials) | 11.3 | |||
| Capital Goods (Industrials) | 5.6 | |||
| Consumer Durables & Apparel (Consumer Discretionary) | 1.1 | |||
| Consumer Services (Consumer Discretionary) | 1.0 | |||
| Diversified Financials (Financials) | 4.2 | |||
| Energy (Energy) | 10.6 | |||
| Food & Staples Retailing (Consumer Staples) | 0.9 | |||
| Food, Beverage & Tobacco (Consumer Staples) | 7.6 | |||
| Health Care Equipment & Services (Health Care) | 2.9 | |||
| Household & Personal Products (Consumer Staples) | 0.3 | |||
| Insurance (Financials) | 3.2 | |||
| Materials (Materials) | 8.5 | |||
| Media (Consumer Discretionary) | 1.6 | |||
| Other Investment Pools and Funds (Financials) | 0.2 | |||
| Pharmaceuticals, Biotechnology & Life Sciences (Health Care) | 7.8 | |||
| Real Estate (Financials) | 0.6 | |||
| Retailing (Consumer Discretionary) | 4.4 | |||
| Semiconductors & Semiconductor Equipment (Information Technology) | 1.6 | |||
| Software & Services (Information Technology) | 6.7 | |||
| Technology Hardware & Equipment (Information Technology) | 5.1 | |||
| Telecommunication Services (Services) | 4.1 | |||
| Utilities (Utilities) | 5.2 | |||
| Short-Term Investments | 1.1 | |||
| Other Assets and Liabilities | – | |||
| Total | 100.0 | % | ||
Diversification by Country
as of June 30, 2010
| Percentage of | ||||
| Country | Net Assets | |||
| Australia | 0.7 | % | ||
| Austria | 0.2 | |||
| Belgium | 0.5 | |||
| Brazil | 2.7 | |||
| Canada | 5.9 | |||
| China | 1.1 | |||
| Denmark | 0.7 | |||
| France | 4.8 | |||
| Germany | 2.0 | |||
| Hong Kong | 3.4 | |||
| India | 2.1 | |||
| Indonesia | 0.1 | |||
| Ireland | 0.4 | |||
| Israel | 0.9 | |||
| Italy | 1.5 | |||
| Japan | 5.0 | |||
| Jersey | 0.2 | |||
| Liechtenstein | 0.1 | |||
| Luxembourg | 0.6 | |||
| Malaysia | 0.1 | |||
| Mexico | 0.3 | |||
| Netherlands | 0.9 | |||
| Norway | 0.4 | |||
| Philippines | 0.2 | |||
| Russia | 1.1 | |||
| Singapore | 0.6 | |||
| South Africa | 0.3 | |||
| South Korea | 0.5 | |||
| Spain | 0.9 | |||
| Sweden | 0.1 | |||
| Switzerland | 2.1 | |||
| Taiwan | 0.7 | |||
| Thailand | 0.7 | |||
| Turkey | 0.1 | |||
| United Kingdom | 8.5 | |||
| United States | 48.5 | |||
| Short-Term Investments | 1.1 | |||
| Other Assets and Liabilities | – | |||
| Total | 100.0 | % | ||
Hartford Global Research HLS Fund (formerly Hartford Global Equity HLS Fund) |
| June 30, 2010 (Unaudited) |
(000’s Omitted) |
| Shares or Principal Amount | Market Value ╪ | |||||
| COMMON STOCKS - 98.3% | ||||||
| Australia - 0.7% | ||||||
| 8 | Aquarius Platinum Ltd. | $ | 39 | |||
| 45 | Karoon Gas Australia Ltd. ● | 224 | ||||
| 2 | Newcrest Mining Ltd. | 67 | ||||
| 3 | Rio Tinto Ltd. | 138 | ||||
| 6 | Toll Holdings Ltd. | 29 | ||||
| 10 | Westfield Group | 97 | ||||
| 594 | ||||||
| Austria - 0.2% | ||||||
| 6 | OMV AG | 194 | ||||
| Belgium - 0.5% | ||||||
| 67 | Ageas ● | 150 | ||||
| 76 | Hansen Transmissions ● | 84 | ||||
| 5 | UCB S.A. | 152 | ||||
| 386 | ||||||
| Brazil - 2.3% | ||||||
| 6 | Brasil Telecom S.A. ADR ● | 113 | ||||
| 4 | Cetip S.A. - Balcao Organizado | 32 | ||||
| – | Cetip S.A. - Balcao Organizado - Receipt Shares ● | – | ||||
| 30 | Companhia Energetica de Minas Gerais ADR | 434 | ||||
| 10 | Hypermarcas S.A. ● | 127 | ||||
| 24 | Itau Unibanco Banco Multiplo S.A. ADR | 425 | ||||
| 5 | Itau Unibanco Holding S.A. ADR ■ | 83 | ||||
| 29 | PDG Realty S.A. | 242 | ||||
| 2 | Petroleo Brasileiro S.A. ADR | 85 | ||||
| 4 | Tele Norte Leste Participacoes S.A. ADR | 58 | ||||
| 2 | Tim Participacoes S.A. ADR | 57 | ||||
| 5 | Tivit Terceirizacao De Tecno | 54 | ||||
| 19 | Tractebel Energia S.A. | 216 | ||||
| 7 | Vale S.A. SP ADR | 158 | ||||
| 2,084 | ||||||
| Canada - 5.9% | ||||||
| 1 | Agrium, Inc. | 30 | ||||
| 15 | Bank of Nova Scotia | 680 | ||||
| 8 | Barrick Gold Corp. | 368 | ||||
| 4 | Brookfield Asset Management, Inc. | 93 | ||||
| 4 | Cameco Corp. | 87 | ||||
| 13 | Canadian Natural Resources Ltd. ADR | 445 | ||||
| 2 | Canadian Oil SandsTrust | 47 | ||||
| 14 | Cott Corp. ● | 81 | ||||
| 4 | EnCana Corp. ADR | 130 | ||||
| 1 | First Quantum Minerals Ltd. | 55 | ||||
| 1 | Fortress Paper, Ltd. ● | 20 | ||||
| 8 | Ivanhoe Mines Ltd. ● | 107 | ||||
| 7 | Magna International, Inc. | 470 | ||||
| 9 | Methanex Corp. | 187 | ||||
| 9 | National Bank of Canada | 460 | ||||
| 7 | Research In Motion Ltd. ● | 332 | ||||
| 2 | Sino Forest Corp. ■● | 23 | ||||
| 9 | Sino Forest Corp. Class A ● | 124 | ||||
| 7 | Suncor Energy, Inc. | 203 | ||||
| 5 | Teck Cominco Ltd. Class B | 134 | ||||
| 1 | Thomson Reuters Corp. | 42 | ||||
| 5 | Toronto-Dominion Bank | 343 | ||||
| 6 | Toronto-Dominion Bank ADR | 360 | ||||
| 29 | Uranium Participation Corp. ● | 156 | ||||
| 5 | Vitran Corp., Inc. ● | 67 | ||||
| 5,044 | ||||||
| China - 1.1% | ||||||
| 4 | AsiaInfo Holdings, Inc. ● | 79 | ||||
| 1 | Baidu, Inc. ADR ● | 34 | ||||
| 7 | BYD Co., Ltd. | 52 | ||||
| 51 | Jiangsu Express Co., Ltd. | 46 | ||||
| 2 | Longtop Financial Technologies Ltd. ● | 49 | ||||
| 4 | PetroChina Co., Ltd. ADR | 386 | ||||
| 1 | Shanda Interactive Entertainment Ltd. ADR ● | 34 | ||||
| 7 | Tencent Holdings Ltd. | 109 | ||||
| 11 | Tingyi Holding Corp. | 27 | ||||
| 9 | Zhongpin, Inc. ● | 108 | ||||
| 11 | ZTE Corp. | 33 | ||||
| 957 | ||||||
| Denmark - 0.7% | ||||||
| – | Alk-Abello A/S | 20 | ||||
| 4 | Bank Nordik P/F | 91 | ||||
| 14 | DSV A/S | 204 | ||||
| 2 | Gronlandsbanken | 108 | ||||
| 2 | H. Lundbeck A/S | 21 | ||||
| – | Ringkjoebing Landbobank | 31 | ||||
| 3 | Trygvesta A/S | 165 | ||||
| 5 | Vestjysk Bank A/S | 59 | ||||
| 699 | ||||||
| France - 4.8% | ||||||
| 9 | BNP Paribas | 492 | ||||
| 2 | Carrefour S.A. | 80 | ||||
| 2 | CFAO | 41 | ||||
| 1 | Electricite de France | 53 | ||||
| 4 | France Telecom S.A. | 77 | ||||
| 11 | Gaz de France | 308 | ||||
| 13 | Groupe Danone | 722 | ||||
| 1 | Ipsen | 30 | ||||
| 18 | Peugeot S.A. | 464 | ||||
| 5 | Pinault-Printemps-Redoute S.A. | 639 | ||||
| 1 | Publicis Groupe | 37 | ||||
| 9 | Renault S.A. | 333 | ||||
| 4 | Rhodia S.A. | 70 | ||||
| 2 | Safran S.A. | 43 | ||||
| 3 | Sanofi-Aventis S.A. ADR | 84 | ||||
| 5 | Societe Generale Class A | 221 | ||||
| 6 | Societe Industrielle D'Aviations Latecoere S.A. ● | 46 | ||||
| 5 | Total S.A. ADR | 232 | ||||
| 1 | Unibail-Rodamco SE | 115 | ||||
| 2 | Vinci S.A. | 86 | ||||
| 3 | Vivendi S.A. | 60 | ||||
| 4,233 | ||||||
| Germany - 2.0% | ||||||
| 6 | BASF SE | 349 | ||||
| 1 | Brenntag AG ● | 64 | ||||
| 8 | Daimler AG | 424 | ||||
| 3 | Deutsche Boerse AG | 183 | ||||
| 1 | E.On AG | 24 | ||||
| 2 | HeidelbergCement AG | 83 | ||||
| 1 | Hochtief AG | 54 | ||||
| 5 | Siemens AG | 474 | ||||
| 1,655 | ||||||
| Hong Kong - 3.4% | ||||||
| 68 | AAC Acoustic Technologies | 97 | ||||
| 29 | Agile Property Holdings Ltd. | 30 | ||||
The accompanying notes are an integral part of these financial statements.
| Shares or Principal Amount | Market Value ╪ | |||||
| COMMON STOCKS - 98.3% - (continued) | ||||||
| Hong Kong - 3.4% - (continued) | ||||||
| 33 | Alibaba.com Ltd. | $ | 65 | |||
| 126 | Anta Sports Products Ltd. | 227 | ||||
| 13 | ASM Pacific Technology | 100 | ||||
| 58 | BOC Hong Kong Holdings Ltd. | 131 | ||||
| 67 | China Green Holdings Ltd. | 67 | ||||
| 54 | China Mengniu Dairy Co. | 176 | ||||
| 16 | China Overseas Land & Investment Ltd. | 29 | ||||
| 27 | China Resources Power Holdings Co., Ltd. | 61 | ||||
| 94 | China Shanshui Cement Group | 42 | ||||
| 83 | China State Construction International Holdings Ltd. | 25 | ||||
| 38 | China Yurun Food Group Ltd. | 119 | ||||
| 221 | Dah Sing Banking Group Ltd. | 281 | ||||
| 28 | Digital China Holdings Ltd. | 43 | ||||
| 133 | Guangdong Investment Ltd. | 63 | ||||
| 80 | Hi Sun Technology China Ltd. ● | 36 | ||||
| 564 | Huabao International Holdings Ltd. | 721 | ||||
| 140 | Ontime Department Store | 140 | ||||
| 889 | Oriental Watch Holdings | 227 | ||||
| 88 | Skyworth Digital Holdings Ltd. | 58 | ||||
| – | SouthGobi Resources Ltd. ● | 1 | ||||
| 64 | Want Want China Holdings Ltd. | 53 | ||||
| 9 | Xinao Gas Holdings Ltd. | 20 | ||||
| 259 | Xtep International Holdings Ltd. | 213 | ||||
| 34 | Zhongsheng Group Holdings ● | 42 | ||||
| 3,067 | ||||||
| India - 2.1% | ||||||
| 10 | Bajaj Hindusthan Ltd. | 24 | ||||
| 9 | Bank of Baroda | 142 | ||||
| 12 | Bank of India | 87 | ||||
| 11 | Corp. Bank | 120 | ||||
| 2 | HDFC Bank Ltd. ADR | 267 | ||||
| 28 | Indian Overseas Bank | 62 | ||||
| 36 | Karnataka Bank Ltd. | 136 | ||||
| 21 | Oriental Bank of Commerce | 144 | ||||
| 1 | Punjab National Bank Ltd. | 17 | ||||
| 5 | Reliance Industries Ltd. | 119 | ||||
| 8 | Reliance Industries Ltd. GDR ■ | 394 | ||||
| 2 | State Bank of India | 105 | ||||
| 33 | UCO Bank ● | 54 | ||||
| 14 | Union Bank of India | 93 | ||||
| 1,764 | ||||||
| Indonesia - 0.1% | ||||||
| 4 | P.T. Telekomunikasi Indonesia ADR | 123 | ||||
| Ireland - 0.4% | ||||||
| 3 | CRH plc | 62 | ||||
| 54 | Elan Corp. plc ADR ● | 242 | ||||
| – | Ryanair Holdings plc ADR ● | 4 | ||||
| 308 | ||||||
| Israel - 0.9% | ||||||
| 2 | Cellcom Israel Ltd. | 46 | ||||
| 2 | Check Point Software Technologies Ltd ADR ● | 61 | ||||
| 6 | Partner Communications Co., Ltd. ADR | 93 | ||||
| 13 | Teva Pharmaceutical Industries Ltd. ADR | 685 | ||||
| 885 | ||||||
| Italy - 1.5% | ||||||
| 27 | Credito Emiliano S.p.A. | 150 | ||||
| 30 | Enel S.p.A. | 129 | ||||
| 14 | Eni S.p.A. ADR | 515 | ||||
| 44 | Saras S.p.A. | 91 | ||||
| 16 | Snam Rete Gas S.p.A. | 65 | ||||
| 368 | Telecom Italia S.p.A. | 336 | ||||
| 1,286 | ||||||
| Japan - 5.0% | ||||||
| 2 | ABC Mart, Inc. | 82 | ||||
| 25 | AEON Co., Ltd. | 260 | ||||
| 13 | Asahi Kasei Corp. | 69 | ||||
| 1 | Astellas Pharma, Inc. | 49 | ||||
| 15 | Daiichi Sankyo Co., Ltd. | 260 | ||||
| 1 | Disco Corp. | 32 | ||||
| 8 | Don Quijote Co. | 207 | ||||
| 13 | Eisai Co., Ltd. | 434 | ||||
| – | Fanuc Ltd. | 45 | ||||
| 9 | J Front Retailing Co., Ltd. | 44 | ||||
| 7 | Komatsu Ltd. | 129 | ||||
| 136 | Mitsubishi UFJ Financial Group, Inc. | 618 | ||||
| 18 | Mitsui & Co., Ltd. | 209 | ||||
| 2 | Mitsui O.S.K. Lines Ltd. | 13 | ||||
| 62 | Nippon Steel Corp. | 206 | ||||
| 4 | Nippon Yusen | 15 | ||||
| 13 | Nok Corp. | 201 | ||||
| – | Osaka Securities Exchange Co., Ltd. | 208 | ||||
| 7 | Shin-Etsu Chemical Co., Ltd. | 304 | ||||
| 15 | Shionogi & Co., Ltd. | 311 | ||||
| 35 | Showa Denko K.K. | 62 | ||||
| – | SMC Corp. | 37 | ||||
| 12 | Tokyo Electric Power Co., Inc. | 318 | ||||
| 23 | Tokyo Gas Co., Ltd. | 107 | ||||
| 2 | Toyota Motor Corp. | 52 | ||||
| 7 | Yusen Air & Sea Service Co., Ltd. | 102 | ||||
| 4,374 | ||||||
| Jersey - 0.2% | ||||||
| 2 | Randgold Resources Ltd. ADR | 208 | ||||
| Liechtenstein - 0.1% | ||||||
| 1 | Verwalt & Privat-Bank AG | 86 | ||||
| Luxembourg - 0.6% | ||||||
| 4 | Evraz Group S.A. § | 100 | ||||
| 6 | Millicom International Cellular S.A. | 464 | ||||
| 1 | SES Global S.A. | 26 | ||||
| 590 | ||||||
| Malaysia - 0.1% | ||||||
| 201 | AirAsia Berhad ● | 77 | ||||
| Mexico - 0.3% | ||||||
| 2 | Coca Cola Femsa S.A.B-SP ADR | 153 | ||||
| 5 | Grupo Modelo S.A.B. | 25 | ||||
| 178 | ||||||
| Netherlands - 0.9% | ||||||
| 3 | Elsevier N.V. | 37 | ||||
| 1 | European Aeronautic Defence and Space Co. N.V. | 30 | ||||
| 2 | Heineken N.V. | 100 | ||||
| 19 | ING Groep N.V. | 141 | ||||
| 11 | ING Groep N.V. ADR | 80 | ||||
The accompanying notes are an integral part of these financial statements.
Hartford Global Research HLS Fund (formerly Hartford Global Equity HLS Fund) |
| Schedule of Investments – (continued) |
| June 30, 2010 (Unaudited) |
(000’s Omitted) |
| Shares or Principal Amount | Market Value ╪ | |||||
| COMMON STOCKS - 98.3% - (continued) | ||||||
| Netherlands - 0.9% - (continued) | ||||||
| 5 | Qiagen N.V. ● | $ | 88 | |||
| 8 | SBM Offshore N.V. | 117 | ||||
| 1 | TNT N.V. | 16 | ||||
| 8 | Unilever N.V. CVA | 232 | ||||
| 1 | Wolters Kluwer N.V. | 20 | ||||
| 861 | ||||||
| Norway - 0.4% | ||||||
| 27 | DNB Nor ASA | 264 | ||||
| 35 | Marine Harvest | 23 | ||||
| 9 | Telenor ASA | 118 | ||||
| 405 | ||||||
| Philippines - 0.2% | ||||||
| 99 | Metropolitan Bank and Trust | 130 | ||||
| 95 | Security Bank Corp. | 135 | ||||
| 265 | ||||||
| Russia - 1.1% | ||||||
| 31 | Mobile Telesystems OJSC ADR | 588 | ||||
| 19 | OAO Gazprom Class S ADR | 357 | ||||
| – | Vimpel-Communications ADR ⌂† | 4 | ||||
| 949 | ||||||
| Singapore - 0.6% | ||||||
| 38 | Ezra Holdings Ltd. | 49 | ||||
| 23 | Olam International Ltd. | 41 | ||||
| 74 | Oversea-Chinese Banking Corp., Ltd. | 467 | ||||
| 557 | ||||||
| South Africa - 0.3% | ||||||
| 19 | MTN Group Ltd. | 245 | ||||
| South Korea - 0.5% | ||||||
| 4 | KT Corp. ADR | 77 | ||||
| – | LG Household & Health Care Ltd. | 63 | ||||
| – | Samsung Electronics Co., Ltd. | 178 | ||||
| 3 | SK Telecom Co., Ltd. ADR | 48 | ||||
| 366 | ||||||
| Spain - 0.9% | ||||||
| 2 | Abertis Infraestructuras S.A. | 35 | ||||
| 2 | Almirall S.A. | 16 | ||||
| 2 | Amadeus IT Holding S.A. ● | 26 | ||||
| 7 | Red Electrica Corporacion S.A. | 252 | ||||
| 6 | Repsol YPF S.A. | 130 | ||||
| 7 | Telefonica S.A. | 135 | ||||
| 3 | Telefonica S.A. ADR | 187 | ||||
| 781 | ||||||
| Sweden - 0.1% | ||||||
| 2 | Swedish Match Ab | 49 | ||||
| Switzerland - 2.1% | ||||||
| 2 | Bank Sarasin & Cie AG | 86 | ||||
| 1 | Banque Cantonale Vaudoise | 212 | ||||
| 14 | Julius Baer Group Ltd. | 398 | ||||
| 1 | Kuehne & Nagel International AG | 121 | ||||
| 1 | Roche Holding AG | 197 | ||||
| 2 | Swiss Re (with rights) | 92 | ||||
| – | Synthes, Inc. | 24 | ||||
| 52 | UBS AG | 689 | ||||
| 1,819 | ||||||
| Taiwan - 0.7% | ||||||
| 52 | Acer, Inc. | 121 | ||||
| 37 | Delta Electronics, Inc. | 120 | ||||
| 5 | High Technology Computer Corp. | 66 | ||||
| 35 | Hon Hai Precision Industry Co., Ltd. ● | 124 | ||||
| 3 | Hon Hai Precision Industry Co., Ltd. GDR ●§ | 25 | ||||
| 8 | MediaTek, Inc. | 116 | ||||
| 12 | RichTek Technology Corp. | 98 | ||||
| 27 | Synnex Technology International Corp. | 58 | ||||
| 18 | WPG Holdings Co., Ltd. | 33 | ||||
| 761 | ||||||
| Thailand - 0.7% | ||||||
| 152 | Bangkok Bank plc | 596 | ||||
| Turkey - 0.1% | ||||||
| 25 | Turkiye Garanti Bankasi A.S. | 104 | ||||
| United Kingdom - 8.5% | ||||||
| 82 | Aberdeen Asset Management plc | 157 | ||||
| 8 | African Barrick Gold Ltd. ● | 75 | ||||
| 6 | AstraZeneca plc | 273 | ||||
| 5 | AstraZeneca plc ADR | 219 | ||||
| 12 | BAE Systems plc | 54 | ||||
| 62 | Barclays Bank plc | 248 | ||||
| 86 | Barratt Developments plc | 120 | ||||
| 50 | BG Group plc | 740 | ||||
| 11 | BHP Billiton plc | 278 | ||||
| 6 | BlueBay Asset Management plc | 24 | ||||
| 71 | BP plc | 342 | ||||
| 6 | BP plc ADR | 184 | ||||
| 18 | British American Tobacco plc | 575 | ||||
| 5 | Croda International plc | 76 | ||||
| 52 | Ferrexpo plc | 192 | ||||
| 40 | HSBC Holdings plc | 364 | ||||
| 5 | ICAP plc | 32 | ||||
| 19 | Imperial Tobacco Group plc | 532 | ||||
| 9 | International Power plc | 40 | ||||
| 53 | Man Group plc | 175 | ||||
| 16 | National Grid plc | 116 | ||||
| 4 | Pearson plc | 47 | ||||
| 12 | Persimmon plc | 61 | ||||
| 56 | Prudential plc | 423 | ||||
| 28 | PureCircle Ltd. ● | 102 | ||||
| 28 | Rexam plc | 127 | ||||
| 9 | Rio Tinto plc | 391 | ||||
| 19 | Rolls-Royce Group plc | 156 | ||||
| – | Royal Dutch Shell plc ADR | 12 | ||||
| 5 | Severn Trent plc | 100 | ||||
| 32 | Standard Chartered plc | 782 | ||||
| 2 | Vedanta Resources plc | 73 | ||||
| 4 | WPP plc | 40 | ||||
| 30 | Xstrata plc | 394 | ||||
| 7,524 | ||||||
| United States - 48.3% | ||||||
| 9 | Accenture plc | 350 | ||||
| 2 | Accretive Health, Inc. ● | 28 | ||||
| 10 | ACE Ltd. | 509 | ||||
| 3 | Activision Blizzard, Inc. | 27 | ||||
| 8 | Adobe Systems, Inc. ● | 198 | ||||
| 5 | Advance Automotive Parts, Inc. | 243 | ||||
| 3 | Aetna, Inc. | 83 | ||||
The accompanying notes are an integral part of these financial statements.
| Shares or Principal Amount | Market Value ╪ | |||||
| COMMON STOCKS - 98.3% - (continued) | ||||||
| United States - 48.3% - (continued) | ||||||
| 1 | Air Products and Chemicals, Inc. | $ | 90 | |||
| 2 | Alliance Data Systems Corp. ● | 145 | ||||
| 11 | Allstate Corp. | 301 | ||||
| 8 | Altria Group, Inc. | 161 | ||||
| 2 | Amazon.com, Inc. ● | 231 | ||||
| – | American Tower Corp. Class A ● | 13 | ||||
| 13 | Ameriprise Financial, Inc. | 476 | ||||
| 2 | Amerisource Bergen Corp. | 75 | ||||
| 1 | AMETEK, Inc. | 51 | ||||
| 2 | Amgen, Inc. ● | 129 | ||||
| 10 | Amylin Pharmaceuticals, Inc. ● | 180 | ||||
| 10 | Anadarko Petroleum Corp. | 346 | ||||
| 4 | Analog Devices, Inc. | 98 | ||||
| 3 | Apollo Group, Inc. Class A ● | 125 | ||||
| 6 | Apple, Inc. ● | 1,511 | ||||
| 5 | Applied Materials, Inc. | 57 | ||||
| 12 | Applied Micro Circuits Corp. ● | 122 | ||||
| 1 | Archer Daniels Midland Co. | 37 | ||||
| 6 | Automatic Data Processing, Inc. | 259 | ||||
| 31 | Bank of America Corp. | 443 | ||||
| 1 | Bard (C.R.), Inc. | 64 | ||||
| 2 | Baxter International, Inc. | 69 | ||||
| 1 | BE Aerospace, Inc. ● | 34 | ||||
| 1 | Beckman Coulter, Inc. | 81 | ||||
| 1 | Best Buy Co., Inc. | 34 | ||||
| 5 | BMC Software, Inc. ● | 159 | ||||
| 4 | Boeing Co. | 281 | ||||
| 9 | Broadcom Corp. Class A | 295 | ||||
| 3 | Cabot Oil & Gas Corp. | 91 | ||||
| 4 | Cardinal Health, Inc. | 118 | ||||
| 1 | Carlisle Cos., Inc. | 28 | ||||
| 2 | Caterpillar, Inc. | 127 | ||||
| 9 | CBS Corp. Class B | 122 | ||||
| 3 | Celgene Corp. ● | 145 | ||||
| 5 | Cental Euro Distribution Corp. ● | 115 | ||||
| 5 | CenterPoint Energy, Inc. | 70 | ||||
| 3 | Cephalon, Inc. ● | 164 | ||||
| 1 | Charm Communications, Inc. ● | 10 | ||||
| 4 | Chevron Corp. | 255 | ||||
| 3 | CIGNA Corp. | 83 | ||||
| 27 | Cisco Systems, Inc. ● | 580 | ||||
| 2 | Citizens & Northern Corp. | 20 | ||||
| 58 | Citizens Republic Bancorp, Inc. ● | 49 | ||||
| 1 | Citrix Systems, Inc. ● | 53 | ||||
| 4 | Cliff's Natural Resources, Inc. | 201 | ||||
| 22 | Cobalt International Energy ● | 162 | ||||
| 7 | Comcast Corp. Class A | 114 | ||||
| 1 | Compass Minerals Group, Inc. | 40 | ||||
| 6 | ConocoPhillips Holding Co. | 296 | ||||
| 11 | Consol Energy, Inc. | 357 | ||||
| 6 | Constellation Brands, Inc. Class A ● | 97 | ||||
| 4 | Cooper Industries plc Class A | 170 | ||||
| 5 | Covenant Transport ● | 32 | ||||
| 11 | Covidien plc | 454 | ||||
| 3 | Crown Castle International Corp. ● | 117 | ||||
| 1 | Cubic Corp. | 45 | ||||
| 15 | CVS/Caremark Corp. | 453 | ||||
| 2 | Cytec Industries, Inc. | 76 | ||||
| 5 | Danaher Corp. | 180 | ||||
| 5 | Dell, Inc. ● | 60 | ||||
| 7 | Delta Air Lines, Inc. ● | 80 | ||||
| 4 | Devon Energy Corp. | 233 | ||||
| 1 | DirecTV Class A ● | 39 | ||||
| 1 | Discovery Communications, Inc. ● | 40 | ||||
| 1 | Dover Corp. | 31 | ||||
| 5 | Dow Chemical Co. | 112 | ||||
| 1 | DreamWorks Animation SKG, Inc. ● | 35 | ||||
| 16 | eBay, Inc. ● | 305 | ||||
| 1 | Eclipsys Corp. ● | 14 | ||||
| 14 | Eli Lilly & Co. | 454 | ||||
| 4 | Emerson Electric Co. | 157 | ||||
| 1 | Energizer Holdings, Inc. ● | 48 | ||||
| 3 | EOG Resources, Inc. | 301 | ||||
| 5 | EQT Corp. | 176 | ||||
| 5 | Equinix, Inc. ● | 414 | ||||
| 7 | Euronet Worldwide, Inc. ● | 91 | ||||
| 1 | Exlservice Holdings, Inc. ● | 15 | ||||
| 1 | Expeditors International of Washington, Inc. | 17 | ||||
| 13 | Exxon Mobil Corp. | 732 | ||||
| 2 | FedEx Corp. | 152 | ||||
| 4 | FMC Corp. | 243 | ||||
| 7 | Forest City Enterprises, Inc. Class A ● | 83 | ||||
| 9 | Forest Laboratories, Inc. ● | 256 | ||||
| 1 | Freeport-McMoRan Copper & Gold, Inc. | 68 | ||||
| 34 | Gap, Inc. | 664 | ||||
| 2 | Gartner, Inc. Class A ● | 37 | ||||
| – | General Dynamics Corp. | 19 | ||||
| 30 | General Electric Co. | 431 | ||||
| 10 | General Mills, Inc. | 357 | ||||
| 2 | Genesee & Wyoming, Inc. Class A ● | 61 | ||||
| 2 | Genpact Ltd. ● | 29 | ||||
| – | Genzyme Corp. ● | 9 | ||||
| 4 | Gilead Sciences, Inc. ● | 140 | ||||
| 2 | Goldman Sachs Group, Inc. | 277 | ||||
| 1 | Google, Inc. ● | 226 | ||||
| 6 | Green Plains Renewable Energy ● | 64 | ||||
| 1 | Herbalife Ltd. | 44 | ||||
| 2 | Hess Corp. | 95 | ||||
| 7 | Hewlett-Packard Co. | 311 | ||||
| 2 | Hisoft Technology International, Ltd. ● | 17 | ||||
| 12 | Home Depot, Inc. | 328 | ||||
| 5 | Home Inns & Hotels Management, Inc. ● | 182 | ||||
| 4 | Honeywell International, Inc. | 149 | ||||
| 1 | Hospira, Inc. ● | 71 | ||||
| 9 | Hudson Pacific Properties, Inc. ● | 153 | ||||
| 2 | IBM Corp. | 306 | ||||
| 2 | IDEX Corp. | 55 | ||||
| 5 | Illinois Tool Works, Inc. | 213 | ||||
| 8 | Ingersoll-Rand plc | 268 | ||||
| 6 | Invesco Ltd. | 106 | ||||
| 1 | Ironwood Pharmaceuticals, Inc. ● | 11 | ||||
| 9 | J.B. Hunt Transport Services, Inc. | 286 | ||||
| 2 | Johnson & Johnson | 141 | ||||
| 3 | Kansas City Southern ● | 123 | ||||
| 4 | King Pharmaceuticals, Inc. ● | 27 | ||||
| 3 | Kohl's Corp. ● | 119 | ||||
| 23 | Kraft Foods, Inc. | 650 | ||||
| 12 | Leap Wireless International, Inc. ● | 153 | ||||
The accompanying notes are an integral part of these financial statements.
Hartford Global Research HLS Fund (formerly Hartford Global Equity HLS Fund) |
| Schedule of Investments – (continued) |
| June 30, 2010 (Unaudited) |
(000’s Omitted) |
Shares or Principal Amount | Market Value ╪ | |||||
| COMMON STOCKS - 98.3% - (continued) | ||||||
| United States - 48.3% - (continued) | ||||||
| 3 | Lender Processing Services | $ | 89 | |||
| 1 | Liberty Global, Inc. ● | 29 | ||||
| 3 | Lockheed Martin Corp. | 210 | ||||
| 2 | Lorillard, Inc. | 121 | ||||
| 9 | Lowe's Co., Inc. | 188 | ||||
| 4 | Macy's, Inc. | 79 | ||||
| 6 | Marathon Oil Corp. | 201 | ||||
| 6 | Marsh & McLennan Cos., Inc. | 131 | ||||
| 1 | Martin Marietta Materials, Inc. | 53 | ||||
| 13 | Maxim Integrated Products, Inc. | 226 | ||||
| 5 | McDonald's Corp. | 329 | ||||
| 5 | McKesson Corp. | 331 | ||||
| 4 | Medicines Co. ● | 33 | ||||
| 10 | Medtronic, Inc. | 359 | ||||
| 21 | Merck & Co., Inc. | 743 | ||||
| 3 | MetroPCS Communications, Inc. ● | 21 | ||||
| 31 | Microsoft Corp. | 703 | ||||
| 1 | Moog, Inc. Class A ● | 41 | ||||
| 13 | Mosaic Co. | 505 | ||||
| 30 | Motorola, Inc. ● | 195 | ||||
| 4 | Mylan, Inc. ● | 72 | ||||
| 4 | N.V. Energy, Inc. | 47 | ||||
| 3 | National Oilwell Varco, Inc. | 112 | ||||
| 2 | NetApp, Inc. ● | 84 | ||||
| 1 | New Oriental Education & Technology Group, Inc. ADR ● | 110 | ||||
| 8 | News Corp. Class A | 97 | ||||
| 15 | NextEra Energy, Inc. | 716 | ||||
| 4 | NII Holdings, Inc. Class B ● | 136 | ||||
| 2 | Noble Energy, Inc. | 124 | ||||
| 12 | Northeast Utilities | 295 | ||||
| 3 | Northrop Grumman Corp. | 183 | ||||
| 2 | Occidental Petroleum Corp. | 168 | ||||
| 12 | Omega Protein Corp. ● | 47 | ||||
| 1 | Omnicom Group, Inc. | 18 | ||||
| 1 | Onyx Pharmaceuticals, Inc. ● | 26 | ||||
| 40 | Oracle Corp. | 864 | ||||
| 1 | Overseas Shipholding Group, Inc. | 37 | ||||
| 2 | Owens-Illinois, Inc. ● | 56 | ||||
| 4 | Pactiv Corp. ● | 104 | ||||
| 2 | PAREXEL International Corp. ● | 49 | ||||
| 1 | Parker-Hannifin Corp. | 56 | ||||
| 3 | Peabody Energy Corp. | 110 | ||||
| 3 | Penn National Gaming, Inc. ● | 79 | ||||
| 5 | Pentair, Inc. | 160 | ||||
| 16 | PepsiCo, Inc. | 985 | ||||
| 50 | Pfizer, Inc. | 713 | ||||
| 5 | PG&E Corp. | 214 | ||||
| 15 | Philip Morris International, Inc. | 698 | ||||
| 2 | Pinnacle West Capital Corp. | 62 | ||||
| 1 | PNC Financial Services Group, Inc. | 49 | ||||
| 1 | Polycom, Inc. ● | 41 | ||||
| 12 | PPL Corp. | 307 | ||||
| 2 | Praxair, Inc. | 124 | ||||
| 1 | Precision Castparts Corp. | 58 | ||||
| 13 | Principal Financial Group, Inc. | 295 | ||||
| 11 | Progressive Corp. | 197 | ||||
| 2 | Public Service Enterprise Group, Inc. | 67 | ||||
| 4 | QLogic Corp. ● | 65 | ||||
| 18 | Qualcomm, Inc. | 606 | ||||
| 2 | Questar Corp. | 76 | ||||
| 14 | Qwest Communications International, Inc. | 73 | ||||
| 3 | Regeneron Pharmaceuticals, Inc. ● | 68 | ||||
| 1 | Rigel Pharmaceuticals, Inc. ● | 7 | ||||
| 1 | Rock Tenn Co. Class A | 47 | ||||
| 2 | Rockwood Holdings, Inc. ● | 39 | ||||
| 5 | RTI International Metals, Inc. ● | 112 | ||||
| – | Salesforce.com, Inc. ● | 34 | ||||
| 2 | Salix Pharmaceuticals Ltd. ● | 74 | ||||
| 13 | Sapient Corp. | 135 | ||||
| – | SBA Communications Corp. ● | 15 | ||||
| 4 | Schlumberger Ltd. | 207 | ||||
| 2 | Sempra Energy | 75 | ||||
| 2 | Sherwin-Williams Co. | 159 | ||||
| 6 | Skyworks Solutions, Inc. ● | 101 | ||||
| 19 | Smithfield Foods, Inc. ● | 277 | ||||
| 12 | Solutia, Inc. ● | 157 | ||||
| 4 | Southwestern Energy Co. ● | 139 | ||||
| 4 | St. Jude Medical, Inc. ● | 156 | ||||
| 1 | Stanley Black & Decker, Inc. | 37 | ||||
| 15 | Staples, Inc. | 295 | ||||
| 4 | Sterling Bancorp NY | 33 | ||||
| – | Strayer Education, Inc. | 58 | ||||
| 5 | Target Corp. | 265 | ||||
| 3 | Thermo Fisher Scientific, Inc. ● | 137 | ||||
| 2 | Time Warner Cable, Inc. | 94 | ||||
| 2 | Time Warner, Inc. | 58 | ||||
| 4 | Transatlantic Holdings, Inc. | 187 | ||||
| 7 | TW Telecom, Inc. ● | 118 | ||||
| 7 | UAL Corp. ● | 135 | ||||
| 1 | UGI Corp. | 27 | ||||
| 3 | Ultra Petroleum Corp. ● | 114 | ||||
| 4 | United Parcel Service, Inc. Class B | 208 | ||||
| 5 | United Technologies Corp. | 341 | ||||
| 20 | UnitedHealth Group, Inc. | 575 | ||||
| 16 | Unum Group | 354 | ||||
| 1 | Valeant Pharmaceuticals International ● | 37 | ||||
| 7 | Valero Energy Corp. | 127 | ||||
| 5 | Vanceinfo Technologies ADR ● | 106 | ||||
| 5 | VeriSign, Inc. ● | 146 | ||||
| 2 | Vertex Pharmaceuticals, Inc. ● | 54 | ||||
| 1 | Viacom, Inc. Class B | 20 | ||||
| 8 | VimpelCom Ltd ADR ● | 122 | ||||
| 2 | Visa, Inc. | 151 | ||||
| 13 | Walt Disney Co. | 416 | ||||
| 2 | Warner Chilcott plc ● | 47 | ||||
| 1 | Watson Pharmaceuticals, Inc. ● | 60 | ||||
| – | Wellpoint, Inc. ● | 14 | ||||
| 20 | Wells Fargo & Co. | 519 | ||||
| 1 | WESCO International, Inc. ● | 49 | ||||
| 34 | Western Union Co. | 511 | ||||
| 5 | Xcel Energy, Inc. | 94 | ||||
| 42,685 | ||||||
| Total common stocks | ||||||
| (cost $88,055) | $ | 86,759 | ||||
The accompanying notes are an integral part of these financial statements.
| Shares or Principal Amount | Market Value ╪ | ||||||
| PREFERRED STOCKS - 0.4% | |||||||
| Brazil - 0.4% | |||||||
| 14 | Banco Itau Holding | $ | 247 | ||||
| 3 | Telemar Norte Leste S.A. | 90 | |||||
| 337 | |||||||
| Total preferred stocks | |||||||
| (cost $279) | $ | 337 | |||||
| WARRANTS - 0.0% | |||||||
| United States - 0.0% | |||||||
| 6 | Washington Mutual, Inc. Private Placement ⌂●† | $ | – | ||||
| Total warrants | |||||||
| (cost $–) | $ | – | |||||
| EXCHANGE TRADED FUNDS - 0.2% | |||||||
| United States - 0.2% | |||||||
| 3 | iShares MSCI EAFE Index Fund | $ | 140 | ||||
| 2 | SPDR S&P Retail ETF | 57 | |||||
| Total exchange traded funds | |||||||
| (cost $205) | $ | 197 | |||||
| Total long-term investments | |||||||
| (cost $88,539) | $ | 87,293 | |||||
| SHORT-TERM INVESTMENTS - 1.1% | |||||||
| Repurchase Agreements - 1.1% | |||||||
| Bank of America TriParty Joint Repurchase | |||||||
| Agreement (maturing on 07/01/2010 in the | |||||||
| amount of $307, collateralized by FHLMC | |||||||
| 5.50%, 2039, FNMA 4.50% - 5.50%, 2038 - | |||||||
| 2040, GNMA 5.00%, 2040, value of $313) | |||||||
| $ | 307 | 0.05%, 6/30/2010 | $ | 307 | |||
| BNP Paribas Securities Corp. TriParty Joint | |||||||
| Repurchase Agreement (maturing on | |||||||
| 07/01/2010 in the amount of $53, | |||||||
| collateralized by FNMA 4.50% - 6.50%, | |||||||
| 2024 - 2040, GNMA 5.00% - 6.50%, 2038 - | |||||||
| 2040, value of $54) | |||||||
| 53 | 0.04%, 6/30/2010 | 53 | |||||
| Deutsche Bank Securities TriParty Joint | |||||||
| Repurchase Agreement (maturing on | |||||||
| 07/01/2010 in the amount of $232, | |||||||
| collateralized by GNMA 3.13% - 7.00%, | |||||||
| 2023 - 2052, value of $237) | |||||||
| 232 | 0.05%, 6/30/2010 | 232 | |||||
| JP Morgan Chase TriParty Joint Repurchase | |||||||
| Agreement (maturing on 07/01/2010 in the | |||||||
| amount of $53, collateralized by FHLMC | |||||||
| 2.38% - 5.83%, 2033 - 2038, value of $54) | |||||||
| 53 | 0.06%, 6/30/2010 | 53 | |||||
| Morgan Stanley & Co., Inc. TriParty Joint | |||||||
| Repurchase Agreement (maturing on | |||||||
| 07/01/2010 in the amount of $229, | |||||||
| collateralized by FHLMC 5.00% - 5.50%, | |||||||
| 2038 - 2039, FNMA 5.00%, 2039, value of $235) | |||||||
| 229 | 0.03%, 6/30/2010 | 229 | |||||
| UBS Securities, Inc. Repurchase Agreement | |||||||||||
| (maturing on 07/01/2010 in the amount of | |||||||||||
| $3, collateralized by U.S. Treasury Bill | |||||||||||
| 0.88%, 2011, value of $3) | |||||||||||
| 3 | 0.02%, 6/30/2010 | 3 | |||||||||
| UBS Securities, Inc. TriParty Joint Repurchase | |||||||||||
| Agreement (maturing on 07/01/2010 in the | |||||||||||
| amount of $58, collateralized by FNMA | |||||||||||
| 5.00% - 6.00%, 2033 - 2036, value of $59) | |||||||||||
| 58 | 0.09%, 6/30/2010 | 58 | |||||||||
| 935 | |||||||||||
| Total short-term investments | |||||||||||
| (cost $935) | $ | 935 | |||||||||
| Total investments | |||||||||||
| (cost $89,474) ▲ | 100.0 | % | $ | 88,228 | |||||||
| Other assets and liabilities | – | % | 44 | ||||||||
| Total net assets | 100.0 | % | $ | 88,272 |
| Note: | Percentage of investments as shown is the ratio of the total market value to total net assets. Market value of investments in foreign securities represents 50.4% of total net assets at June 30, 2010. |
Foreign securities that are principally traded on certain foreign markets are adjusted daily pursuant to a third party pricing service methodology approved by the Board of Directors in order to reflect an adjustment for factors occurring after the close of the foreign market but before the close of the New York Stock Exchange.
| ▲ | At June 30, 2010, the cost of securities for federal income tax purposes was $93,196 and the aggregate gross unrealized appreciation and depreciation based on that cost were: |
| Unrealized Appreciation | $ | 7,072 | ||
| Unrealized Depreciation | (12,040 | ) | ||
| Net Unrealized Depreciation | $ | (4,968 | ) |
| † | The aggregate value of securities valued in good faith at fair value as determined under policies and procedures established by and under the supervision of the Fund's Board of Directors at June 30, 2010, was $4, which represents –% of total net assets. This amount excludes securities that are principally traded in certain foreign markets and whose prices are adjusted pursuant to a third party pricing service methodology approved by the Board of Directors. |
| · | Currently non-income producing. |
The accompanying notes are an integral part of these financial statements.
Hartford Global Research HLS Fund (formerly Hartford Global Equity HLS Fund) |
| Schedule of Investments – (continued) |
| June 30, 2010 (Unaudited) |
(000’s Omitted) |
| ■ | Securities issued within terms of a private placement memorandum, exempt from registration under Rule 144A under the Securities Act of 1933, as amended, and may be sold only to qualified institutional buyers. Pursuant to guidelines adopted by the Board of Directors, these issues are determined to be liquid. The aggregate value of these securities at June 30, 2010, was $500, which represents 0.57% of total net assets. |
| § | These securities were sold to the Fund under Regulation S, rules governing offers and sales made outside the United States without registration under the Securities Act of 1933. The Fund may only be able to resell these securities in the United States if an exemption from registration under the federal and state securities laws is available, or the Fund may only be able to sell these securities outside of the United States (such as on a foreign exchange) to a non-U.S. person. Unless otherwise indicated, these holdings are determined to be liquid. At June 30, 2010, these securities amounted to $125 or 0.14% of total net assets. |
| ⌂ | The following securities are considered illiquid. Illiquid securities are often purchased in private placement transactions, are often not registered under the Securities Act of 1933 and may have contractual restrictions on resale. A security may also be considered illiquid if the security lacks a readily available market or if its valuation has not changed for a certain period of time. |
| Period | Shares/ | ||||||||
| Acquired | Par | Security | Cost Basis | ||||||
| 04/2010 | – | Vimpel-Communications ADR | $ | 4 | |||||
| 04/2008 | 6 | Washington Mutual, Inc. Private | |||||||
| Placement Warrants | – | ||||||||
The aggregate value of these securities at June 30, 2010 was $4 which represents –% of total net assets.
Futures Contracts Outstanding at June 30, 2010
| Unrealized | |||||||||||
| Number of | Expiration | Appreciation/ | |||||||||
| Description | Contracts* | Position | Month | (Depreciation) | |||||||
| S&P Mini | 2 | Long | Sep 2010 | $ | – | ||||||
* The number of contracts does not omit 000's.
Cash of $9 was pledged as initial margin deposit for open futures contracts at June 30, 2010.
Forward Foreign Currency Contracts Outstanding at June 30, 2010
| Unrealized | |||||||||||||
| Market | Contract | Delivery | Appreciation/ | ||||||||||
| Description | Value ╪ | Amount | Date | (Depreciation) | |||||||||
| British Pound (Buy) | $ | 16 | $ | 16 | 07/02/10 | $ | – | ||||||
| British Pound (Sell) | 10 | 10 | 07/01/10 | – | |||||||||
| Canadian Dollar (Buy) | 20 | 20 | 07/07/10 | – | |||||||||
| Euro (Sell) | 22 | 22 | 07/01/10 | – | |||||||||
| Euro (Buy) | 16 | 16 | 07/01/10 | – | |||||||||
| Hong Kong Dollar (Buy) | 58 | 58 | 07/02/10 | – | |||||||||
| Japanese Yen (Buy) | 33 | 33 | 07/02/10 | – | |||||||||
| Japanese Yen (Buy) | 180 | 175 | 02/04/11 | 5 | |||||||||
| Japanese Yen (Sell) | 1,038 | 1,017 | 02/04/11 | (21 | ) | ||||||||
| Swiss Franc (Buy) | 11 | 11 | 07/02/10 | – | |||||||||
| Swiss Franc (Buy) | 29 | 29 | 07/02/10 | – | |||||||||
| $ | (16 | ) | |||||||||||
| ╪ | See Significant Accounting Policies of accompanying Notes to Financial Statements regarding valuation of securities. |
The accompanying notes are an integral part of these financial statements.
Hartford Global Research HLS Fund (formerly Hartford Global Equity HLS Fund) |
| June 30, 2010 (Unaudited) |
(000’s Omitted) |
| Total | Level 1 ♦ | Level 2♦ | Level 3 | |||||||||||||
| Assets: | ||||||||||||||||
| Common Stocks | ||||||||||||||||
| Australia | $ | 594 | $ | – | $ | 594 | $ | – | ||||||||
| Austria | 194 | – | 194 | – | ||||||||||||
| Belgium | 386 | 84 | 302 | – | ||||||||||||
| Brazil | 2,084 | 2,084 | – | – | ||||||||||||
| Canada | 5,044 | 5,024 | – | 20 | ||||||||||||
| China | 957 | 690 | 267 | – | ||||||||||||
| Denmark | 699 | 139 | 560 | – | ||||||||||||
| France | 4,233 | 362 | 3,871 | – | ||||||||||||
| Germany | 1,655 | 64 | 1,591 | – | ||||||||||||
| Hong Kong | 3,067 | 42 | 3,025 | – | ||||||||||||
| India | 1,764 | 661 | 1,103 | – | ||||||||||||
| Indonesia | 123 | 123 | – | – | ||||||||||||
| Ireland | 308 | 246 | 62 | – | ||||||||||||
| Israel | 885 | 885 | – | – | ||||||||||||
| Italy | 1,286 | 515 | 771 | – | ||||||||||||
| Japan | 4,374 | – | 4,374 | – | ||||||||||||
| Jersey | 208 | 208 | – | – | ||||||||||||
| Liechtenstein | 86 | – | 86 | – | ||||||||||||
| Luxembourg | 590 | 564 | 26 | �� | – | |||||||||||
| Malaysia | 77 | – | 77 | – | ||||||||||||
| Mexico | 178 | 178 | – | – | ||||||||||||
| Netherlands | 861 | 80 | 781 | – | ||||||||||||
| Norway | 405 | – | 405 | – | ||||||||||||
| Philippines | 265 | – | 265 | – | ||||||||||||
| Russia | 949 | 945 | – | 4 | ||||||||||||
| Singapore | 557 | – | 557 | – | ||||||||||||
| South Africa | 245 | – | 245 | – | ||||||||||||
| South Korea | 366 | 125 | 241 | – | ||||||||||||
| Spain | 781 | 213 | 568 | – | ||||||||||||
| Sweden | 49 | – | 49 | – | ||||||||||||
| Switzerland | 1,819 | 86 | 1,733 | – | ||||||||||||
| Taiwan | 761 | 25 | 736 | – | ||||||||||||
| Thailand | 596 | – | 596 | – | ||||||||||||
| Turkey | 104 | – | 104 | – | ||||||||||||
| United Kingdom | 7,524 | 592 | 6,932 | – | ||||||||||||
| United States | 42,685 | 42,685 | – | – | ||||||||||||
| Total | 86,759 | 56,620 | 30,115 | 24 | ||||||||||||
| Exchange Traded Funds | 197 | 197 | – | – | ||||||||||||
| Preferred Stocks | 337 | 337 | – | – | ||||||||||||
| Warrants | – | – | – | – | ||||||||||||
| Short-Term Investments | 935 | – | 935 | – | ||||||||||||
| Total | $ | 88,228 | $ | 57,154 | $ | 31,050 | $ | 24 | ||||||||
| Forward Foreign Currency Contracts* | 5 | – | 5 | – | ||||||||||||
| Futures* | – | – | – | – | ||||||||||||
| Total | $ | 5 | $ | – | $ | 5 | $ | – | ||||||||
| Liabilities: | ||||||||||||||||
| Forward Foreign Currency Contracts* | 21 | – | 21 | – | ||||||||||||
| Total | $ | 21 | $ | – | $ | 21 | $ | – | ||||||||
| ♦ | For the period ended June 30, 2010, there were no significant transfers between Level 1 and Level 2. |
| * | Derivative instruments not reflected in the Schedule of Investments are valued at the unrealized appreciation/depreciation on the investments. |
The accompanying notes are an integral part of these financial statements.
Hartford Global Research HLS Fund (formerly Hartford Global Equity HLS Fund) |
Investment Valuation Hierarchy Level Summary – (continued) |
| June 30, 2010 (Unaudited) |
(000’s Omitted) |
Following is a reconciliation of Level 3 assets for which significant unobservable inputs were used to determine fair value:
| Balance as | Change in | |||||||||||||||||||||||||||||||||||
| of | Realized | Unrealized | Transfers | Transfers | Balance | |||||||||||||||||||||||||||||||
| December | Gain | Appreciation | Net | Into | Out of | as of June | ||||||||||||||||||||||||||||||
31, 2009 | (Loss) | (Depreciation) | Amortization | Purchases | Sales | Level 3 * | Level 3* | 30, 2010 | ||||||||||||||||||||||||||||
| Assets: | ||||||||||||||||||||||||||||||||||||
| Common Stock | $ | 6 | $ | (386 | ) | $ | 335 | † | $ | — | $ | 150 | $ | (251 | ) | $ | 170 | $ | — | $ | 24 | |||||||||||||||
| Warrants | — | — | — | — | — | — | — | — | — | |||||||||||||||||||||||||||
| Total | $ | 6 | $ | (386 | ) | $ | 335 | $ | — | $ | 150 | $ | (251 | ) | $ | 170 | $ | — | $ | 24 | ||||||||||||||||
| * | Securities are transferred into and out of Level 3 for a variety of reasons including, but not limited to: |
| 1) | Securities where trading has been halted- transfer into Level 3 versus securities where trading has resumed - transfer out of Level 3. |
| 2) | Broker quoted securities - transfer into Level 3 versus quoted prices in active markets - transfer out of Level 3. |
| 3) | Securities that have certain restrictions on trading - transfer into Level 3 versus securities where trading restrictions have expired - transfer out of Level 3. |
| † | Change in unrealized gains or losses in the current period relating to assets still held at June 30, 2010 was $(75). |
The accompanying notes are an integral part of these financial statements.
Hartford Global Research HLS Fund (formerly Hartford Global Equity HLS Fund) |
| June 30, 2010 (Unaudited) |
(000’s Omitted) |
| Assets: | ||||
| Investments in securities, at market value (cost $89,474) | $ | 88,228 | ||
| Cash | 9 | * | ||
| Foreign currency on deposit with custodian (cost $47) | 47 | |||
| Unrealized appreciation on forward foreign currency contracts | 5 | |||
| Receivables: | ||||
| Investment securities sold | 759 | |||
| Fund shares sold | 45 | |||
| Dividends and interest | 171 | |||
| Variation margin | — | |||
| Other assets | 12 | |||
| Total assets | 89,276 | |||
| Liabilities: | ||||
| Unrealized depreciation on forward foreign currency contracts | 21 | |||
| Bank overdraft — U.S. Dollars | 13 | |||
| Payables: | ||||
| Investment securities purchased | 812 | |||
| Fund shares redeemed | 84 | |||
| Investment management fees | 18 | |||
| Distribution fees | 2 | |||
| Accrued expenses | 54 | |||
| Total liabilities | 1,004 | |||
| Net assets | $ | 88,272 | ||
| Summary of Net Assets: | ||||
| Capital stock and paid-in-capital | $ | 121,446 | ||
| Accumulated undistributed net investment income | 702 | |||
| Accumulated net realized loss on investments and foreign currency transactions | (32,614 | ) | ||
| Unrealized depreciation of investments and the translations of assets and liabilities denominated in foreign currency | (1,262 | ) | ||
| Net assets | $ | 88,272 | ||
| Shares authorized | 800,000 | |||
| Par value | $ | 0 .001 | ||
Class IA: Net asset value per share | $ | 7 .86 | ||
| Shares outstanding | 7,281 | |||
| Net assets | $ | 57,258 | ||
Class IB: Net asset value per share | $ | 7 .84 | ||
| Shares outstanding | 3,955 | |||
| Net assets | $ | 31,014 | ||
| * | Cash of $9 is pledged as collateral for open futures contracts. Additionally, the Fund has an overdraft of $13. |
The accompanying notes are an integral part of these financial statements.
Hartford Global Research HLS Fund (formerly Hartford Global Equity HLS Fund) |
| For the Six-Month Period Ended June 30, 2010 (Unaudited) |
(000’s Omitted) |
| Investment Income: | ||||
| Dividends | $ | 1,241 | ||
| Interest | 1 | |||
| Less: Foreign tax withheld | (97 | ) | ||
| Total investment income, net | 1,145 | |||
| Expenses: | ||||
| Investment management fees | 420 | |||
| Administrative service fees | 33 | |||
| Transfer agent fees | — | |||
| Distribution fees - Class IB | 45 | |||
| Custodian fees | 27 | |||
| Accounting services fees | 8 | |||
| Board of Directors' fees | 2 | |||
| Audit fees | 6 | |||
| Other expenses | 39 | |||
| Total expenses (before waivers and fees paid indirectly) | 580 | |||
| Expense waivers | (34 | ) | ||
| Commission recapture | (2 | ) | ||
| Total waivers and fees paid indirectly | (36 | ) | ||
| Total expenses, net | 544 | |||
| Net investment income | 601 | |||
| Net Realized Gain on Investments, Other Financial Instruments and Foreign Currency Transactions: | ||||
| Net realized gain on investments | 4,096 | |||
| Net realized gain on futures | 1 | |||
| Net realized gain on forward foreign currency contracts | 40 | |||
| Net realized loss on other foreign currency transactions | (57 | ) | ||
| Net Realized Gain on Investments, Other Financial Instruments and Foreign Currency Transactions | 4,080 | |||
| Net Changes in Unrealized Depreciation of Investments: | ||||
| Net unrealized depreciation of investments | (14,115 | ) | ||
| Net unrealized appreciation of futures | — | |||
| Net unrealized depreciation of forward foreign currency contracts | (16 | ) | ||
| Net unrealized appreciation on translation of other assets and liabilities in foreign currencies | — | |||
| Net Changes in Unrealized Depreciation of Investments | (14,131 | ) | ||
| Net Loss on Investments, Other Financial Instruments and Foreign Currency Transactions | (10,051 | ) | ||
| Net Decrease in Net Assets Resulting from Operations | $ | (9,450 | ) | |
The accompanying notes are an integral part of these financial statements.
Hartford Global Research HLS Fund (formerly Hartford Global Equity HLS Fund) |
(000’s Omitted) |
| For the | ||||||||
| Six-Month | For the | |||||||
| Period Ended | Year Ended | |||||||
| June 30, 2010 | December 31, | |||||||
| (Unaudited) | 2009 | |||||||
| Operations: | ||||||||
| Net investment income | $ | 601 | $ | 913 | ||||
| Net realized gain (loss) on investments, other financial instruments and foreign currency transactions | 4,080 | (14,594 | ) | |||||
| Net unrealized appreciation (depreciation) of investments and foreign currency transactions | (14,131 | ) | 43,400 | |||||
| Payment from affiliate | — | 15 | ||||||
| Net increase (decrease) in net assets resulting from operations | (9,450 | ) | 29,734 | |||||
| Distributions to Shareholders: | ||||||||
| From net investment income | ||||||||
| Class IA | — | (575 | ) | |||||
| Class IB | — | (256 | ) | |||||
| Total distributions | — | (831 | ) | |||||
| Capital Share Transactions: | ||||||||
| Class IA | ||||||||
| Sold | 10,391 | 17,630 | ||||||
| Issued on reinvestment of distributions | — | 575 | ||||||
| Redeemed | (13,961 | ) | (18,067 | ) | ||||
| Total capital share transactions | (3,570 | ) | 138 | |||||
| Class IB | ||||||||
| Sold | 5,262 | 8,198 | ||||||
| Issued on reinvestment of distributions | — | 256 | ||||||
| Redeemed | (8,677 | ) | (12,423 | ) | ||||
| Total capital share transactions | (3,415 | ) | (3,969 | ) | ||||
| Net decrease from capital share transactions | (6,985 | ) | (3,831 | ) | ||||
| Net increase (decrease) in net assets | (16,435 | ) | 25,072 | |||||
| Net Assets: | ||||||||
| Beginning of period | 104,707 | 79,635 | ||||||
| End of period | $ | 88,272 | $ | 104,707 | ||||
| Accumulated undistributed (distribution in excess of) net investment income | $ | 702 | $ | 101 | ||||
| Shares: | ||||||||
| Class IA | ||||||||
| Sold | 1,198 | 2,376 | ||||||
| Issued on reinvestment of distributions | — | 68 | ||||||
| Redeemed | (1,644 | ) | (2,616 | ) | ||||
| Total share activity | (446 | ) | (172 | ) | ||||
| Class IB | ||||||||
| Sold | 614 | 1,130 | ||||||
| Issued on reinvestment of distributions | — | 30 | ||||||
| Redeemed | (1,013 | ) | (1,850 | ) | ||||
| Total share activity | (399 | ) | (690 | ) | ||||
The accompanying notes are an integral part of these financial statements.
Hartford Global Research HLS Fund (formerly Hartford Global Equity HLS Fund) |
| June 30, 2010 (Unaudited) |
(000’s Omitted) |
| 1. | Organization: |
Hartford Global Research HLS Fund (the "Fund") serves as an underlying investment option for certain variable annuity and variable life insurance separate accounts of Hartford Life Insurance Company (“HLIC”) and its affiliates and certain qualified retirement plans. The Fund may also serve as an underlying investment option for certain variable annuity and variable life separate accounts of other insurance companies. Owners of variable annuity contracts and policyholders of variable life insurance contracts may choose the funds permitted in the variable insurance contract prospectus. In addition, participants in certain qualified retirement plans may choose the fund if permitted by their plans.
Hartford Series Fund, Inc. (the “Company”) is an open-end registered management investment company comprised of twenty-nine portfolios, one portfolio of which is included in these financial statements.
The Company is organized under the laws of the State of Maryland and is registered with the Securities and Exchange Commission (“SEC”) under the Investment Company Act of 1940, as amended (“1940 Act”). The Fund is organized as a diversified open-end management investment company.
The Fund is divided into Class IA and Class IB shares. Each class is offered at the per share net asset value (“NAV”) without a sales charge and is subject to the same expenses, except that the Class IB shares are subject to distribution and service fees charged pursuant to a Distribution and Service Plan adopted in accordance with Rule 12b-1 under the 1940 Act.
| 2. | Significant Accounting Policies: |
The following is a summary of significant accounting policies of the Fund, which are in accordance with U.S. Generally Accepted Accounting Principles (“GAAP”).
| a) | Security Transactions and Investment Income – Security transactions are recorded on the trade date (the date the order to buy or sell is executed). Security gains and losses are determined on the basis of identified cost. |
Dividend income is accrued as of the ex-dividend date, except that certain dividends for foreign securities where the ex-dividend date may have passed are recorded as soon as the Fund is informed of the dividend in the exercise of reasonable diligence. Interest income, including amortization of premium and accretion of discounts, is accrued on a daily basis.
| b) | Security Valuation – The Fund generally uses market prices in valuing portfolio securities. If market prices are not readily available or are deemed unreliable, the Fund will use the fair value of the security as determined in good faith under policies and procedures established by and under the supervision of the Fund’s Board of Directors. Market prices may be deemed unreliable, for example, if a security is thinly traded or if an event has occurred after the close of the security’s primary market, but before the close of the New York Stock Exchange (the “Exchange”) (generally 4:00 p.m. Eastern Time, referred to as the “Valuation Time”) that is expected to affect the value of the portfolio security. The circumstances in which the Fund may use fair value pricing include, among others: (i) the occurrence of events that are significant to a particular issuer, such as mergers, restructuring or defaults; (ii) the occurrence of events that are significant to an entire market, such as natural disasters in a particular region or governmental actions; (iii) trading restrictions on securities; (iv) thinly traded securities and (v) market events such as trading halts and early market closings. In addition, with respect to the valuation of stocks primarily traded on foreign markets, the Fund uses a fair value pricing service approved by the Fund’s Board of Directors, which employs quantitative models that evaluate changes in the value of foreign market proxies (e.g., futures contracts, American Depositary Receipts (“ADRs”), exchange traded funds (“ETFs”)) after the close of the foreign markets but before the Valuation Time. Securities that are primarily traded on foreign markets may trade on days that are not business days of the Fund. The value of the foreign securities in which the Fund invests may change on days when a shareholder will not be able to purchase or redeem shares of the Fund. Fair value pricing is subjective in nature and the use of fair value pricing by the Fund may cause the NAV of its shares to differ significantly from the NAV that would have been calculated using market prices at the close of the exchange on which a portfolio security is primarily traded but before the Valuation Time. There can be no |
assurance that the Fund could obtain the fair value assigned to a security if the Fund were to sell the security at approximately the time at which the Fund determines its NAV.
Exchange-traded equity securities are valued at the last reported sale price or official close price on the exchange or market on which the security is primarily traded (the “Primary Market”) at the Valuation Time. If the security did not trade on the Primary Market, it may be valued at the Valuation Time at the last reported sale price on another exchange where it trades. The value of an equity security not traded on any exchange but traded on the Nasdaq Stock Market, Inc. or another over-the-counter market shall be valued at the last reported sale price or official closing price on the exchange or market on which the security is traded as of the Valuation Time.
Foreign-denominated assets, including investment securities, and liabilities are translated from the local currency into U.S. dollars using exchange rates obtained from an independent third party as of the Fund’s Valuation Time.
Financial instruments for which prices are not available from an independent pricing service may be valued using market quotations obtained from one or more dealers that make markets in securities in accordance with procedures established by the Fund’s Board of Directors.
Futures contracts are valued at the most recent settlement price reported by an exchange on which, over time, they are traded most extensively. If a settlement price is not available, futures contracts will be valued at the most recent trade price as of the Valuation Time. If there were no trades, the contract shall be valued at the mean of the closing bid and asked prices as of the Valuation Time.
Forward foreign currency contracts represent agreements to exchange currencies on specific future dates at predetermined rates. Forward foreign currency contracts are valued using foreign currency exchange rates and forward rates on the Valuation Date from an independent pricing service.
Other derivative or contractual type instruments shall be valued using market prices if such instruments trade on an exchange or market. If such instruments do not trade on an exchange or market, such instruments shall be valued at a price at which the counterparty to such contract would repurchase the instrument. In the event that the counterparty cannot provide a price, such valuation may be determined in accordance with procedures established by the Fund’s Board of Directors.
Various inputs are used in determining the value of the Fund’s investments. These inputs are summarized into three broad hierarchy levels. This hierarchy is based on whether the valuation inputs are observable or unobservable. These levels are:
| · | Level 1 – Quoted prices in active markets for identical securities. Level 1 may include exchange-traded instruments such as domestic equities, some foreign equities, options, futures, mutual funds, ETFs, and rights and warrants. |
| · | Level 2 – Observable inputs other than Level 1 prices, such as quoted prices for similar securities; quoted prices in markets that are not active; or other inputs that are observable or can be corroborated by observable market data. Level 2 may include debt securities that are traded less frequently than exchange-traded instruments and which are valued using third party pricing services. Prices for most level 2 securities are based on prices received from an independent pricing service. The following asset classes generally use valuation techniques and inputs as noted below: |
Asset Backed Securities and Collateralized Mortgage Obligations – Multi-dimensional spread/prepayment speed tables, with consideration of yield or price of bonds of comparable quality, coupon and maturity, attributes of the collateral, new issue data and monthly payment information.
Hartford Global Research HLS Fund (formerly Hartford Global Equity HLS Fund) |
Notes to Financial Statements – (continued) |
| June 30, 2010 (Unaudited) |
(000’s Omitted) |
Corporate Bonds – Multi-dimensional relational model based on observable market information such as yields, spreads, sector analysis, etc.
Foreign Currency – Based on rates determined at the close of the Exchange, provided by an independent pricing service.
Forward Currency Contracts – Valued based on the price of the underlying currency at the prevailing interpolated exchange rate, which is a combination of the spot currency rate and the forward currency rate, provided by an independent pricing service.
Foreign Equities – Certain foreign equities are priced using a multi-factor regression model with market observable inputs of a correlative nature (ADRs, futures contracts, ETFs, and currency exchange rates).
International Fixed Income – Multi-dimensional relational model based on observable market information such as benchmark yields, reported trades, bids and offers.
Money Market Instruments – Amortized cost.
Mortgage Backed Securities (“MBS”) – Matrix pricing using inputs of To-Be-Announced (“TBA”) prices, new issue data and monthly payment information, with consideration of yield or price of bonds of comparable quality, coupon and maturity, and attributes of the collateral.
Municipal Bonds – Multi-dimensional relational model and series of matrices based on observable market information such as Municipal Securities Rulemaking Board reported trades, comparable bonds, yields, spreads and credit analysis.
Preferred Stocks – Close mean of bid/ask or bid.
Repurchase Agreements – Priced at par.
Senior Floating Rate Interests – Composite of quotes from one or more contributing dealers.
Swaps – Price based upon observable market information from an independent pricing service.
U.S. Government Securities – Treasuries exclusively traded in the secondary market.
| · | Level 3 – Significant unobservable inputs that are supported by limited or no market activity. Level 3 may include financial instruments whose values are determined using broker quotes or require significant management judgment or estimation. While these securities are priced using unobservable inputs, the valuation of these securities reflects the best available data and management believes the prices are a reasonable representation of exit price. The following asset classes generally use valuation techniques and inputs as noted below: |
Asset Backed Securities & Commercial Mortgage Backed Securities – Certain other MBS with limited liquidity priced from an independent pricing service.
Common Stocks – Trading has been halted or there are restrictions on trading. Valuation is based on last trade with the application of a discount or premium, if applicable.
Long Dated Over-the-Counter Options – Terms greater than 10 years from current date, expected volatility is not observable. Prices are from an independent pricing service.
Long Term Debt Securities, including Senior Floating Rate Interests – Unobservable valuation inputs may include estimates for current yields, maturity/duration, prepayment speed, and broker quotes for comparable securities along with other assumptions relating to credit quality, collateral value, complexity of the security structure, general market conditions and liquidity.
Swaps – Terms greater than 10 years from current date, expected volatility is not observable. Prices are from an independent pricing service.
Individual securities within any of the above mentioned asset classes may be assigned a different hierarchical level than those that are presented above, as individual circumstances dictate.
For purposes of reporting transfers between different hierarchy levels, both transfers in and out of each level are shown as if they occurred at the beginning of the period.
Refer to the Investment Valuation Hierarchy Levels Summary and the Level 3 roll forward reconciliation found following the Schedules of Investments.
| c) | Foreign Currency Transactions – Assets and liabilities denominated in currencies other than U.S. dollars are translated into U.S. dollars at the exchange rates in effect on the valuation date. Purchases and sales of investment securities, income and expenses are translated into U.S. dollars at the exchange rates on the dates of such transactions. |
The Fund does not isolate that portion of portfolio security valuation resulting from fluctuations in the foreign currency exchange rates from the fluctuations arising from changes in the market prices of securities held. Exchange rate fluctuations are included with the net realized and unrealized gain or loss on investments in the accompanying financial statements.
Net realized foreign exchange gains or losses arise from sales of foreign currencies and the difference between asset and liability amounts initially stated in foreign currencies and the U.S. dollar value of the amounts actually received or paid. Net unrealized foreign exchange gains or losses arise from changes in the value of other assets and liabilities at the end of the reporting period, resulting from changes in the exchange rates.
| d) | Joint Trading Account – Pursuant to an exemptive order issued by the SEC, the Fund may transfer uninvested cash balances into a joint trading account managed by Wellington Management Company, LLP (“Wellington Management”). These balances may be invested in one or more repurchase agreements and/or short-term money market instruments. |
| e) | Repurchase Agreements – A repurchase agreement is an agreement by which a counterparty agrees to sell a security and agrees to repurchase the security sold at a mutually agreed upon time and price. At the time the Fund enters into a repurchase agreement, the value of the underlying collateral security(ies), including accrued interest, will be equal to or exceed the value of the repurchase agreement. To minimize counterparty risk, the securities that serve to collateralize the repurchase agreement are held by the Fund's custodian in book entry or physical form in the custodial account of the Fund or in a third party custodial account. Repurchase agreements are valued at cost plus accrued interest. The Fund, as shown on the Schedule of Investments, had outstanding repurchase agreements as of June 30, 2010. |
| f) | Forward Foreign Currency Contracts – The Fund may enter into forward foreign currency contracts that obligate the Fund to purchase or sell currencies at specified future dates. Forward foreign currency contracts may be used to hedge against adverse fluctuations in exchange rates between currencies. |
Forward foreign currency contracts involve elements of market risk in excess of the amounts reflected in the Statement of Assets and Liabilities. In addition, risks may arise upon entering into these contracts from the potential inability of the counterparties to meet the terms of the contracts and from unanticipated movements in the value of the foreign currencies
Hartford Global Research HLS Fund (formerly Hartford Global Equity HLS Fund) |
Notes to Financial Statements – (continued) |
| June 30, 2010 (Unaudited) |
(000’s Omitted) |
relative to the U.S. dollar. The Fund had outstanding forward foreign currency contracts as shown on the Schedule of Investments as of June 30, 2010.
| g) | Indexed Securities – The Fund may invest in indexed securities whose values are linked to changes in interest rates, indices, or other underlying instruments. The Fund may use these securities to increase or decrease its exposure to different underlying instruments and to gain exposure to markets that might be difficult to invest in using conventional securities. Indexed securities may be more volatile than their underlying instruments, but any loss is limited to the amount of the original investment and there may be a limit to the potential appreciation of the investment. The Fund, as shown in the Schedule of Investments under Exchange Traded Funds, had investments in indexed securities as of June 30, 2010. |
| h) | Fund Share Valuation and Dividend Distributions to Shareholders – Orders for the Fund’s shares are executed in accordance with the investment instructions of the contract holders or plan participants. The NAV of the Fund’s shares is determined as of the close of each business day of the Exchange. The NAV is determined separately for each class of the Fund by dividing the Fund’s net assets attributable to that class by the number of outstanding shares of the class. Orders for the purchase of the Fund’s shares received by an insurance company or plan prior to the close of the Exchange on any day on which the Exchange is open for business are priced at the NAV determined as of the close of the Exchange. Orders received by an insurance company or plan after the close of the Exchange, or on a day on which the Exchange and/or the Fund is not open for business, are priced at the next determined NAV. |
Dividends are declared pursuant to a policy adopted by the Fund’s Board of Directors based upon the investment performance of the Fund. The policy of the Fund is to pay dividends from net investment income and distribute realized capital gains, if any, at least once a year.
Distributions from net investment income, realized capital gains and capital are determined in accordance with federal income tax regulations, which may differ from U.S. GAAP with respect to character and timing. These differences may include but are not limited to losses deferred due to wash sale adjustments, foreign currency gains and losses, adjustments related to Passive Foreign Investment Companies (“PFICs”), Real Estate Investment Trusts (“REITs”), Regulated Investment Companies (“RICs”), certain derivatives and partnerships. Permanent book and federal income tax basis differences relating to shareholder distributions will result in reclassifications to certain of the Fund’s capital accounts (see Federal Income Taxes: Reclassification of Capital Accounts note).
| i) | Illiquid and Restricted Securities – The Fund is permitted to invest up to 15% of its net assets in illiquid securities. “Illiquid Securities” are those that may not be sold or disposed of in the ordinary course of business within seven days, at approximately the price used to determine the Fund’s NAV. The Fund may not be able to sell illiquid securities or other investments when its sub-adviser considers it desirable to do so or may have to sell such securities or investments at a price that is lower than the price that could be obtained if the securities or investments were more liquid. A sale of illiquid securities or other investments may require more time and may result in higher dealer discounts and other selling expenses than does the sale of those that are liquid. Illiquid securities and investments also may be more difficult to value, due to the unavailability of reliable market quotations for such securities or investments, and an investment in them may have an adverse impact on the Fund’s NAV. The Fund may also purchase certain restricted securities, commonly known as Rule 144A securities, that can be resold to institutions and which may be determined to be liquid pursuant to policies and guidelines established by the Fund’s Board of Directors. The Fund, as shown on the Schedule of Investments, had illiquid and/or restricted securities as of June 30, 2010. |
| j) | Securities Purchased on a When-Issued or Delayed-Delivery Basis – Delivery and payment for securities that have been purchased by the Fund on a forward commitment, or when-issued or delayed-delivery basis, take place beyond the customary settlement period. During this period, such securities are subject to market fluctuations, and the Fund identifies securities segregated in its records with value at least equal to the amount of the commitment. As of June 30, 2010, the Fund had no outstanding when-issued or delayed delivery securities. |
| k) | Use of Estimates – The preparation of financial statements in conformity with U.S. GAAP requires management to make estimates and assumptions that affect the reported amounts of assets and liabilities as of the date of the financial statements and the reported amounts of income and expenses during the period. Operating results in the future could vary from the amounts derived from management’s estimates. |
| l) | Additional Derivative Instrument(s) Information |
Derivative Instrument(s) as of June 30, 2010.
| Statement of Assets and Liabilities Location | |||||||||||
| Risk Exposure Category | Asset Derivatives | Liability Derivatives | |||||||||
| Foreign exchange contracts | Unrealized appreciation on forward foreign currency contracts | $ | 5 | Unrealized depreciation on forward foreign currency contracts | $ | 21 | |||||
| Equity contracts | Summary of Net Assets - Unrealized appreciation | – | |||||||||
The volume of derivatives that is presented in the Schedule of Investments is consistent with the derivative activity during the six-month period ended June 30, 2010.
Realized Gain/Loss and Change in Unrealized Appreciation (Depreciation) on Derivative Instruments for the six-month period ended June 30, 2010:
| Amount of Realized Gain or (Loss) on Derivatives Recognized in Income | ||||||||||||||||||||||||
| Forward | ||||||||||||||||||||||||
| Purchased | Currency | |||||||||||||||||||||||
| Risk Exposure Category | Written Options | Options | Futures | Contracts | Swaps | Total | ||||||||||||||||||
| Foreign exchange contracts | $ | — | $ | — | $ | — | $ | 40 | $ | — | $ | 40 | ||||||||||||
| Equity contracts | — | — | 1 | — | — | 1 | ||||||||||||||||||
| Total | $ | — | $ | — | $ | 1 | $ | 40 | $ | — | $ | 41 | ||||||||||||
| Change in Unrealized Appreciation or (Depreciation) on Derivatives Recognized in Income | ||||||||||||||||||||||||
| Forward | ||||||||||||||||||||||||
| Purchased | Currency | |||||||||||||||||||||||
| Risk Exposure Category | Written Options | Options | Futures | Contracts | Swaps | Total | ||||||||||||||||||
| Foreign exchange contracts | — | — | — | (16 | ) | — | $ | (16 | ) | |||||||||||||||
| Equity contracts | — | — | — | — | — | — | ||||||||||||||||||
| Total | $ | — | $ | — | $ | — | $ | (16 | ) | $ | — | $ | (16 | ) | ||||||||||
| m) | Indemnifications – Under the Company’s organizational documents, the Company shall indemnify its officers and directors to the full extent required or permitted under Maryland General Corporation Law and the federal securities laws. In addition, the Company, on behalf of the Fund, may enter into contracts that contain a variety of indemnifications. The Company’s maximum exposure under these arrangements is unknown. However, the Company has not had prior claims or losses pursuant to these contracts and expects the risk of loss to be remote. |
| 3. | Futures and Options: |
The Fund is subject to equity price risk, interest rate risk and foreign currency exchange rate risk in the normal course of pursuing its investment objectives. The Fund may invest in futures and options contracts in order to gain exposure to or hedge against changes in the value of equities, interest rates or foreign currencies. A futures contract is an agreement between two parties to buy and sell an asset at a set price on a future date. When the Fund enters into such futures contracts, it is required to deposit with a futures commission merchant an amount of “initial margin” of cash, commercial
Hartford Global Research HLS Fund (formerly Hartford Global Equity HLS Fund) |
Notes to Financial Statements – (continued) |
| June 30, 2010 (Unaudited) |
(000’s Omitted) |
paper or U.S. Treasury Bills. Subsequent payments, called variation margin, to and from the broker, are made on a daily basis as the price of the underlying asset fluctuates, making the long and short positions in the futures contract more or less valuable (i.e., mark-to-market), which results in an unrealized gain or loss to the Fund.
At any time prior to the expiration of the futures contract, the Fund may close the position by taking an opposite position, which would effectively terminate the position in the futures contract. A final determination of variation margin is then made, additional cash is required to be paid by or released to the Fund and the Fund realizes a gain or loss.
The use of futures contracts involves elements of market risk, which may exceed the amounts recognized in the Statement of Assets and Liabilities. Changes in the value of the futures contracts may decrease the effectiveness of the Fund’s strategy and potentially result in loss. With futures, there is minimal counterparty risk to the Fund since futures are exchange traded through a clearing house. The clearing house requires sufficient collateral to cover margins. The Fund, as shown on the Schedule of Investments, had outstanding futures contracts as of June 30, 2010.
An option contract is a contract sold by one party to another party that offers the buyer the right, but not the obligation, to buy (call) or sell (put) a security or other financial asset at an agreed-upon price during a specific period of time or on a specific date. The premium paid by the Fund for the purchase of a call or put option is included in the Fund’s Statement of Assets and Liabilities as an investment and subsequently “marked-to-market” through net unrealized appreciation (depreciation) of options to reflect the current market value of the option as of the end of the reporting period.
The Fund may write (sell) covered options. “Covered” means that so long as the Fund is obligated as the writer of an option, it will own either the underlying securities or currency or an option to purchase the same underlying securities or currency having an expiration date of the covered option and an exercise price equal to or less than the exercise price of the covered option, or will pledge cash or other liquid securities having a value equal to or greater than the fluctuating market value of the option securities or currencies. The Fund receives a premium for writing a call or put option, which is recorded on the Fund’s Statement of Assets and Liabilities and subsequently “marked-to-market” through net unrealized appreciation (depreciation) of options. There is a risk of loss from a change in the value of such options, which may exceed the related premiums received. The maximum amount of loss with respect to the Fund’s written put option is the cost of buying the underlying security or currency. The maximum loss may be offset by proceeds received from selling the underlying securities or currency. As of June 30, 2010, there were no outstanding option contracts.
| 4. | Federal Income Taxes: |
| a) | Federal Income Taxes – For federal income tax purposes, the Fund intends to continue to qualify as a RIC under Subchapter M of the Internal Revenue Code (“IRC”) by distributing substantially all of its taxable net investment income and net realized capital gains to its shareholders and otherwise complying with the requirements of RICs. The Fund has distributed substantially all of its income and capital gains in prior years and intends to distribute substantially all of its income and capital gains prior to the next fiscal year end. Accordingly, no provision for federal income or excise taxes has been made in the accompanying financial statements. Distributions from short-term capital gains are treated as ordinary income distributions for federal income tax purposes. |
| b) | Net Investment Income (Loss), Net Realized Gains (Losses) – Net investment income (loss) and net realized gains (losses) may differ for financial statement and tax purposes primarily because of losses deferred due to wash sale adjustments, foreign currency gains and losses, adjustments related to PFICs, REITs, RICs, certain derivatives and partnerships. The character of distributions made during the year from net investment income or net realized gains may differ from their ultimate characterization for federal income tax purposes. Also, due to the timing of dividend distributions, the fiscal year in which amounts are distributed may differ from the year that the income or realized gains (losses) were recorded by the Fund. |
| c) | Distributions and Components of Distributable Earnings – The tax character of distributions paid by the Fund for the periods indicated is as follows (as adjusted for dividends payable): |
| For the Period | ||||||||
| January 31, 2008 | ||||||||
| (Commencement of | ||||||||
| For the Year Ended | Operations) through | |||||||
| December 31, 2009 | December 31, 2008 | |||||||
| Ordinary Income | $ | 831 | $ | 548 | ||||
| Tax Return of Capital | — | 162 | ||||||
As of December 31, 2009, the Fund’s components of distributable earnings (deficit) on a tax basis were as follows:
| Amount | ||||
| Undistributed Ordinary Income | $ | 143 | ||
| Accumulated Capital and Other Losses* | (33,013 | ) | ||
Unrealized Appreciation† | 9,146 | |||
| Total Accumulated Deficit | $ | (23,724 | ) | |
| * | The Fund has capital loss carryforwards that are identified in the Capital Loss Carryforward note that follows. |
| † | The difference between book-basis and tax-basis unrealized appreciation (depreciation) may be attributable to the losses deferred due to wash sale adjustments, foreign currency gains and losses, adjustments related to PFICs, REITs, RICs, certain derivatives and partnerships. |
| d) | Reclassification of Capital Accounts – The Fund may record reclassifications in its capital accounts. These reclassifications have no impact on the total net assets of the Fund. The reclassifications are a result of permanent differences between GAAP and tax accounting for such items as net operating losses that reduce distribution requirements. Adjustments are made to reflect the impact these items have on current and future distributions to shareholders. Therefore, the source of the Fund’s distributions may be shown in the accompanying Statement of Changes in Net Assets as from net investment income, from net realized gains on investments or from capital depending on the type of book and tax differences that exist. For the year ended December 31, 2009, the Fund recorded reclassifications to increase (decrease) the accounts listed below: |
| Amount | ||||
| Accumulated Undistributed Net Investment Income | $ | 14 | ||
| Accumulated Net Realized Gain (Loss) on Investments | 23,129 | |||
| Paid-in-Capital | (23,143 | ) | ||
Hartford Global Research HLS Fund (formerly Hartford Global Equity HLS Fund) |
Notes to Financial Statements – (continued) |
| June 30, 2010 (Unaudited) |
(000’s Omitted) |
| e) | Capital Loss Carryforward – At December 31, 2009 (tax-year-end), the Fund had capital loss carryforwards for U.S. federal income tax purposes of approximately: |
| Year of Expiration | Amount | |||
| 2015 | $ | 1,879 | ||
| 2016 | 8,899 | |||
| 2017 | 21,620 | |||
| Total | $ | 32,398 | ||
As of December 31, 2009, the Fund had $23,115 in expired capital loss carryforwards.
As of December 31, 2009, the Fund elected to defer the following post October losses.
| Amount | ||||
| Long-Term Capital Gain | $ | 615 | ||
| f) | Accounting for Uncertainty in Income Taxes – Management has evaluated all open tax years and has determined there is no impact to the Fund’s financial statements related to uncertain tax positions. Generally, tax authorities can examine all tax returns filed for the last three years. |
| 5. | Expenses: |
| a) | Investment Management Agreements – HL Investment Advisors, LLC (“HL Advisors”), an indirect wholly-owned subsidiary of The Hartford Financial Services Group, Inc. (“The Hartford”), serves as investment manager to the Fund pursuant to an Investment Management Agreement with the Company. As investment manager, HL Advisors has overall investment supervisory responsibility for the Fund. In addition, HL Advisors provides administrative personnel, services, equipment, facilities and office space for proper operation of the Fund. |
HL Advisors has contracted with Wellington Management for the provision of day-to-day investment management services to the Fund in accordance with the Fund’s investment objective and policies. The Fund pays a fee to HL Advisors, a portion of which may be used to compensate Wellington Management.
| b) | Administrative Services Agreement – For the two-month period January 1, 2010 through February 28, 2010, under the Administrative Services Agreement between HLIC and the Company, on behalf of the Fund, HLIC provided administrative services to the Fund and received monthly compensation at the annual rate of 0.20% of the Fund’s average daily net assets. The Fund assumed and paid certain other expenses (including, but not limited to, accounting, custodian, state taxes and Directors’ fees). Effective March 1, 2010, the Investment Management Agreement was amended to include the administrative services for the Fund and the separate administrative services agreement was terminated. |
The schedule below reflects the rates of compensation paid to HL Advisors for investment management services and to HLIC for administrative services rendered from January 1, 2010 through February 28, 2010, and the rates of compensation paid to the HL Advisors for the combined services from March 1, 2010 through June 30, 2010; the rates are accrued daily and paid monthly.
| Average Daily Net Assets | Annual Fee | |||
| On first $500 million | 0.9000 | % | ||
| On next $500 million | 0.8750 | % | ||
| On next $4 billion | 0.8500 | % | ||
| On next $5 billion | 0.8475 | % | ||
| Over $10 billion | 0.8450 | % | ||
HL Advisors had contractually agreed to waive management fees of 0.10% of average daily net assets until May 1, 2010.
| c) | Accounting Services Agreement – Pursuant to the Fund Accounting Agreement between HLIC and the Company, on behalf of the Fund, HLIC provides accounting services to the Fund and receives monthly compensation on the Fund’s average net assets. The Fund’s accounting services fees are accrued daily and paid monthly. |
| Average Daily Net Assets | Annual Fee | |||
| On first $5 billion | 0.016 | % | ||
| On next $5 billion | 0.014 | % | ||
| Over $10 billion | 0.012 | % | ||
| d) | Operating Expenses – Allocable expenses incurred by the Company are allocated to each Fund and allocated to classes within the Fund in proportion to the average daily net assets of the Fund and each class, except where allocation of certain expenses is more fairly made directly to the Fund or to specific classes within a Fund. |
| e) | Fees Paid Indirectly – The Company, on behalf of the Fund has entered into agreements with State Street Global Advisers, LLC and Russell Implementation Securities, Inc. to partially recapture non-discounted trade commissions. Such rebates are used to pay a portion of the Fund’s expenses. In addition, the Fund’s custodian bank has also agreed to reduce its fees when the Fund maintains cash on deposit in a non-interest-bearing custody account. For the six-month period ended June 30, 2010, these amounts are included in the Statement of Operations. |
The ratio of expenses to average net assets in the accompanying financial highlights excludes the reduction in expenses related to fees paid indirectly. Had the fees paid indirectly been included, the annualized expense ratio for the periods listed below would have been as follows:
| Annualized | ||||||||||||
| Six-Month | Year Ended | Year Ended | ||||||||||
| Period Ended | December 31, | December 31, | ||||||||||
| June 30, 2010 | 2009 | 2008 | ||||||||||
| Class IA | 0.99 | % | 1.05 | % | 0.93 | %* | ||||||
| Class IB | 1.24 | 1.30 | 1.18 | * | ||||||||
* From January 31, 2008 (commencement of operations), through December 31, 2008.
| f) | Distribution Plan for Class IB shares – The Company, on behalf of the Fund, has adopted a Distribution Plan pursuant to Rule 12b-1 under the 1940 Act for the Class IB shares. Pursuant to the Distribution Plan, the Fund is authorized to compensate the Distributor, Hartford Securities Distribution Company, Inc. (a wholly owned, ultimate subsidiary of The Hartford), from assets attributable to the Class IB shares for services rendered and expenses borne in connection with activities primarily intended to result in the sale of the Class IB shares, subject to the Fund Board’s review and approval. |
The Distribution Plan provides that the Fund may pay annually up to 0.25% of the average daily net assets of the Fund attributable to its Class IB shares for activities primarily intended to result in the sale of Class IB shares. The Board has the authority to suspend or reduce these payments at any point in time. Under the terms of the Distribution Plan and the principal underwriting agreement, the Fund is authorized to make payments monthly to the Distributor which may be used to pay or compensate entities providing distribution and shareholder servicing with respect to the Class IB shares for such entities’ fees or expenses incurred or paid in that regard. These fees are accrued daily and paid monthly.
Hartford Global Research HLS Fund (formerly Hartford Global Equity HLS Fund) |
Notes to Financial Statements – (continued) |
| June 30, 2010 (Unaudited) |
(000’s Omitted) |
| g) | Other Related Party Transactions – Certain officers of the Fund are directors and/or officers of HL Advisors, and/or The Hartford or its subsidiaries. For the six-month period ended June 30, 2010, a portion of the Fund’s chief compliance officer’s salary was paid by all the investment companies in the Hartford fund complex. The portion allocated to the Fund rounds to zero. Hartford Investor Services Company, LLC ("HISC"), a wholly owned subsidiary of The Hartford, provides transfer agent services to the Fund. The amount HISC was compensated for providing such services can be found on the Statement of Operations. These fees are accrued daily and paid monthly. |
| h) | Payment from Affiliate – In July of 2007, The Hartford entered into a settlement with the Attorneys General of the states of New York, Connecticut and Illinois relating to market timing and the company's individual variable annuity contracts in which certain payments would be made directly to the variable annuity contract holders. The distribution plan provides that unclaimed money from the settlement would be distributed to certain HLS Funds that are investment options through a Hartford individual variable annuity contract. The unclaimed money was distributed to the Fund on September 18, 2009, as follows: |
| Amount | ||||
| Reimbursement | $ | 15 | ||
On November 8, 2006, the SEC issued an order setting forth the terms of a settlement reached with three subsidiaries of The Hartford that resolves the SEC’s Division of Enforcement’s investigation of aspects of The Hartford’s variable annuity and mutual fund operations related to directed brokerage and revenue sharing. The Hartford settled this matter without admitting or denying the findings of the SEC.
The Fund is available for purchase by the separate accounts of different variable universal life policies, variable annuity products, and funding agreements and it is offered directly to certain qualified retirement plans (collectively “Products”). Although existing Products contain transfer restrictions, some Products, particularly older variable annuity products, do not contain restrictions on the frequency of transfers. In addition, as the result of the settlement of litigation against Hartford Life, Inc. (“Hartford Life”) (the issuers of such variable annuity products), the Fund’s ability to restrict transfers by certain owners of older variable annuity products was limited. During 2006, these annuity owners surrendered the older variable annuity contracts that were the subject of prior litigation. In February 2005, Hartford Life agreed with the Board of Directors of the Fund to indemnify the Fund for any material harm caused to the Fund from frequent trading by these contracts owners.
The total return in the accompanying financial highlights includes payment from affiliates. Had the payment from affiliates been excluded, the total return for the periods listed below would have been as follows:
| For the Year Ended December 31, 2009 | ||||||||
| Class IA | Class IB | |||||||
| Impact from Payment from Affiliate for Attorneys General Settlement | 0.02 | % | 0.02 | % | ||||
| Total Return Excluding Payments from Affiliate | 42.10 | 41.76 | ||||||
| 6. | Investment Transactions: |
For the six-month period ended June 30, 2010, the cost of purchases and proceeds from sales of investment securities (excluding short-term investments) were as follows:
| Amount | ||||
| Cost of Purchases Excluding U.S. Government Obligations | $ | 44,800 | ||
| Sales Proceeds Excluding U.S. Government Obligations | 50,718 | |||
| 7. | Line of Credit: |
The Fund is one of several Hartford funds that participate in a $500 million committed revolving line of credit facility. The facility is to be used for temporary or emergency purposes. Under the arrangement, a fund is required to own securities having a market value in excess of 300% of the total bank borrowings. The interest rate on borrowings varies depending on the nature of the loan. The facility also requires a fee to be paid based on the amount of the commitment. This fee is allocated to all the funds participating in the line of credit based on the average net assets of the funds. During the six-month period ended June 30, 2010, the Fund did not have any borrowings under this facility.
| 8. | Industry Classifications: |
Other than the industry classifications “Other Investment Pools and Funds” and “Exchange Traded Funds”, equity industry classifications used in this report are the Global Industry Classification Standard, which was developed by and is the exclusive property and service mark of MSCI, Inc. and Standard & Poor’s.
Hartford Global Research HLS Fund (formerly Hartford Global Equity HLS Fund) |
| - Selected Per-Share Date (A) - - |
| Net Asset | Net Realized | Net Increase | ||||||||||||||||||||||||||||||||||||||||||
| Value at | Payments | and Unrealized | Total from | Dividends from | Distributions | (Decrease) in | Net Asset | |||||||||||||||||||||||||||||||||||||
| Beginning of | Net Investment | from (to) | Gain (Loss) on | Investment | Net Investment | from Realized | Distributions | Total | Net Asset | Value at End | ||||||||||||||||||||||||||||||||||
| Class | Period | Income (Loss) | Affiliate | Investments | Operations | Income | Capital Gains | from Capital | Distributions | Value | of Period | |||||||||||||||||||||||||||||||||
| For the Six-Month Period Ended June 30, 2010 (Unaudited) | ||||||||||||||||||||||||||||||||||||||||||||
| IA | $ | 8.67 | $ | 0.06 | $ | – | $ | (0.87 | ) | $ | (0.81 | ) | $ | – | $ | – | $ | – | $ | – | $ | (0.81 | ) | $ | 7.86 | |||||||||||||||||||
| IB | 8.66 | 0.05 | – | (0.87 | ) | (0.82 | ) | – | – | – | – | (0.82 | ) | 7.84 | ||||||||||||||||||||||||||||||
| For the Year Ended December 31, 2009 | ||||||||||||||||||||||||||||||||||||||||||||
| IA | 6.16 | 0.08 | – | 2.51 | 2.59 | (0.08 | ) | – | – | (0.08 | ) | 2.51 | 8.67 | |||||||||||||||||||||||||||||||
| IB | 6.15 | 0.07 | – | 2.50 | 2.57 | (0.06 | ) | – | – | (0.06 | ) | 2.51 | 8.66 | |||||||||||||||||||||||||||||||
| From (commencement of operations) January 31, 2008 through December 31, 2008 | ||||||||||||||||||||||||||||||||||||||||||||
| IA(H) | 10.00 | – | – | (3.78 | ) | (3.78 | ) | (0.05 | ) | – | 0.01 | (0.06 | ) | (3.84 | ) | 6.16 | ||||||||||||||||||||||||||||
| IB(H) | 10.00 | (0.08 | ) | – | (3.72 | ) | (3.80 | ) | (0.04 | ) | – | 0.01 | (0.05 | ) | (3.85 | ) | 6.15 | |||||||||||||||||||||||||||
| (A) | Information presented relates to a share outstanding throughout the indicated period. |
| (B) | The figures do not include sales charges or other fees which may be applied at the variable life insurance, variable annuity or qualified retirement plan product level. Any such additional sales charges or other fees would lower the Fund's performance. |
| (C) | Ratios do not reflect reductions for fees paid indirectly. Please see Fees Paid Indirectly in the Notes to Financial Statements. |
| (D) | Portfolio turnover rate is calculated on the basis of the Fund as a whole without distinguishing between the classes of shares issued. |
| (E) | Not annualized. |
| (F) | Annualized. |
| (G) | Total return without the inclusion of the Payment from (to) Affiliate can be found in Expenses in the accompanying Notes to Financial Statements. |
| (H) | Commenced operations on January 31, 2008. |
| (I) | During the year ended December 31, 2008, the Fund incurred $95.4 million in sales associated with the transition of assets from Hartford Global Communications HLS Fund, Hartford Global Financial Services HLS Fund and Hartford Global Technology HLS Fund, which merged into the Fund on August 22, 2008. These sales were excluded from the portfolio turnover rate calculation. |
| - Ratios and Supplemental Data - - |
Ratio of Expenses to Average Net | Ratio of Expenses to Average Net | Ratio of Net Investment Income to | Portfolio | |||||||||||||||||
| Total Return(B) | Net Assets at End of Period | Assets Before Waivers(C) | Assets After Waivers(C) | Average Net Assets | Turnover Rate(D) | |||||||||||||||
| (9.32 | )%(E) | $ | 57,258 | 1.06 | %(F) | 0.99 | %(F) | 1.29 | %(F) | 46 | % | |||||||||
| (9.43 | )(E) | 31,014 | 1.31 | (F) | 1.24 | (F) | 1.03 | (F) | – | |||||||||||
| 42.13 | (G) | 67,012 | 1.16 | 1.06 | 1.17 | 124 | ||||||||||||||
| 41.79 | (G) | 37,695 | 1.41 | 1.31 | 0.93 | – | ||||||||||||||
| (37.87 | )(E) | 48,627 | 1.02 | (F) | 0.94 | (F) | 1.29 | (F) | 335 | (I) | ||||||||||
| (38.01 | )(E) | 31,008 | 1.27 | (F) | 1.19 | (F) | 0.99 | (F) | – | |||||||||||
Hartford Global Research HLS Fund (formerly Hartford Global Equity HLS Fund) |
The Board of Directors appoints officers who are responsible for the day-to-day operations of the Fund and who execute policies formulated by the Directors. Each director serves until his or her death, resignation, or retirement or until the next annual meeting of shareholders is held or until his or her successor is elected and qualifies.
Directors and officers who are employed by or who have a financial interest in The Hartford are considered “interested” persons of the Fund pursuant to the Investment Company Act of 1940, as amended. Each officer and two of the Company’s directors, as noted in the chart below, are “interested” persons of the Fund. Each director serves as a director for The Hartford Mutual Funds, Inc., The Hartford Mutual Funds II, Inc., The Hartford Income Shares Fund, Inc., Hartford Series Fund, Inc., and Hartford HLS Series Fund II, Inc., which, as of June 30, 2010, collectively consist of 88 funds. Correspondence may be sent to directors and officers c/o Hartford Mutual Funds, P.O. Box 2999, Hartford, Connecticut 06104-2999, except that correspondence to Ms. Fagely may be sent to 500 Bielenberg Drive, Woodbury, Minnesota 55125.
The table below sets forth, for each director and officer, his or her name, year of birth, current position with the Company and date first elected or appointed to Hartford Series Fund, Inc. (“HSF”), and Hartford HLS Series Fund II, Inc. (“HSF2”), principal occupation, and, for directors, other directorships held. The Fund’s statement of additional information contains further information on the directors and is available free of charge by calling 1-800-862-6668 or writing to Hartford HLS Funds, c/o Individual Annuity Services, P.O. Box 5085, Hartford, CT 06102-5085.
Information on the aggregate remuneration paid to the directors of the Company can be found in the Statement of Operations herein. The Fund pays to The Hartford a portion of the chief compliance officer’s compensation, but does not pay salaries or compensation to any of their other officers or directors who are employed by The Hartford.
Non-Interested Directors
Lynn S. Birdsong (1946) Director since 2003, Co-Chairman of the Investment Committee
Mr. Birdsong is a private investor. Since 2003, Mr. Birdsong has been an independent director of The Japan Fund and has served as a Director of the Sovereign High Yield Fund since April 2010. From 2003 to March 2005, Mr. Birdsong was an independent director of the Atlantic Whitehall Funds. From 1979 to 2002, Mr. Birdsong was a managing director of Zurich Scudder Investments, an investment management firm. During his employment with Scudder, Mr. Birdsong was an interested director of The Japan Fund. Since 1981, Mr. Birdsong has been a partner in Birdsong Company, an advertising specialty firm.
Robert M. Gavin, Jr. (1940) Director since 2002 (HSF) and 1986 (HSF2), Chairman of the Board since 2004
Dr. Gavin is an educational consultant. Prior to September 1, 2001, he was President of Cranbrook Education Community and prior to July 1996, he was President of Macalester College, St. Paul, Minnesota.
Duane E. Hill (1945) Director since 2001 (HSF) and 2002 (HSF2), Chairman of the Nominating Committee
Mr. Hill is Partner of TSG Ventures L.P., a private equity investment company. Mr. Hill is a former partner of TSG Capital Group, a private equity investment firm that served as sponsor and lead investor in leveraged buyouts of middle market companies.
Sandra S. Jaffee (1941) Director since 2005
Ms. Jaffee served as Chairman (2008 to 2009) and Chief Executive Officer of Fortent (formerly Searchspace Group), a leading provider of compliance/regulatory technology to financial institutions from August 2005 to August 2009. From August 2004 to August 2005, Ms. Jaffee served as an Entrepreneur in Residence with Warburg Pincus, a private equity firm. From September 1995 to July 2004, Ms. Jaffee served as Executive Vice President at Citigroup, where she was President and Chief Executive Officer of Citibank’s Global Securities Services (1995 to 2003).
William P. Johnston (1944) Director since 2005, Chairman of the Compliance Committee
In June 2006, Mr. Johnston was appointed as Senior Advisor to The Carlyle Group, a global private equity investment firm. In July 2006, Mr. Johnston was elected to the Board of Directors of MultiPlan, Inc. In August 2007, Mr. Johnston was elected to the Board of Directors of LifeCare Holdings, Inc. In February 2008, Mr. Johnston was elected to the Board of Directors of HCR-ManorCare, Inc. In May 2006, Mr. Johnston was elected to the Supervisory Board of Fresenius Medical Care AG & Co. KGaA, after its acquisition of Renal Care Group, Inc. in March 2006. Mr. Johnston joined Renal Care Group in November 2002 as a member of the Board of Directors and served as Chairman of the Board from March 2003 through March 2006. From September 1987 to December 2002, Mr. Johnston was with Equitable Securities Corporation (and its successors, SunTrust Equitable Securities and SunTrust Robinson Humphrey) serving in various investment banking and managerial positions, including Managing Director and Head of Investment Banking, Chief Executive Officer and Vice Chairman.
Phillip O. Peterson (1944) Director since 2002 (HSF) and 2000 (HSF2), Chairman of the Audit Committee
Mr. Peterson is a mutual fund industry consultant. He was a partner of KPMG LLP (an accounting firm) until July 1999. Mr. Peterson joined William Blair Funds in February 2007 as a member of the Board of Trustees. From January 2004 to April 2005, Mr. Peterson served as Independent President of the Strong Mutual Funds.
Lemma W. Senbet (1946) Director since 2005
Dr. Senbet is the William E. Mayer Chair Professor of Finance and Director, Center for Financial Policy, at the University of Maryland, Robert H. Smith School of Business. He was chair of the Finance Department during 1998 to 2006. Previously he was a chaired professor of finance at the University of Wisconsin-Madison. Also, he was director of the Fortis Funds from March 2000 to July 2002. Dr. Senbet served the finance profession in various capacities, including as director of the American Finance Association and President of the Western Finance Association. In 2006, Dr. Senbet was inducted Fellow of Financial Management Association International for his career-long distinguished scholarship and professional service.
Interested Directors and Officers
Lowndes A. Smith (1939) Director since 1996 (HSF) and 2002 (HSF2), Co-Chairman of the Investment Committee
Mr. Smith served as Vice Chairman of The Hartford from February 1997 to January 2002, as President and Chief Executive Officer of Hartford Life, Inc. from February 1997 to January 2002, and as President and Chief Operating Officer of The Hartford Life Insurance Companies from January 1989 to January 2002. Mr. Smith serves as a Director of White Mountains Insurance Group, Ltd., One Beacon Insurance, Symetra Financial and as a Managing Director of Whittington Gray Associates.
John C. Walters 1, 2 (1962) Director since 2008
Mr. Walters currently serves as President, Chief Executive Officer and Director for Hartford Life, Inc. (“HL, Inc.”). Mr. Walters also serves as President, Chairman of the Board, Chief Executive Officer and Director for Hartford Life Insurance Company (“Hartford Life”), and as Executive Vice President of The Hartford. In addition, Mr. Walters is a Manager of HL Investment Advisors, LLC (“HL Advisors”). Mr. Walters previously served as President of the U.S. Wealth Management Division of HL, Inc. (2006-2007) and as Co-Chief Operating Officer of Hartford Life (2007-2008).
1 Mr. Walters previously served as President and Chief Executive Officer (2007 to 2009).
2 Effective July 31, 2010, Mr. Walters retired from The Hartford. Mr. Walters resigned his position as a Director of the Fund effective July 30, 2010.
Other Officers
Robert M. Arena, Jr. (1968) President and Chief Executive Officer since 2009 (served as Vice President of the Fund (2006-2009))
Mr. Arena serves as Executive Vice President of Hartford Life. Additionally, Mr. Arena is Senior Vice President and Director of Hartford Administrative Services Company, (“HASCO”), President, Chief Executive Officer and Manager of Hartford Investment Financial Services, LLC (“HIFSCO”) and President, Chief Executive Officer and Manager of HL Advisors. Mr. Arena joined The Hartford in 2004.
Tamara L. Fagely (1958) Vice President, Treasurer and Controller since 2002 (HSF) 1993 (HSF2)
Ms. Fagely has been a Vice President of HASCO since 1998 and Chief Financial Officer since 2006. Currently Ms. Fagely is a Vice President of Hartford Life. She served as Assistant Vice President of Hartford Life from December 2001 through March 2005. In addition, Ms. Fagely is Controller and Chief Financial Officer of HIFSCO.
Brian Ferrell (1962) AML Compliance Officer since 2008
Mr. Ferrell has served as Assistant Vice President and AML Compliance Officer for The Hartford since 2006, and as AML Compliance Officer for HASCO and Hartford Investor Services Company, LLC (“HISC”) since 2008. Prior to joining The Hartford in 2006, Mr. Ferrell held various positions at the U.S. Department of the Treasury (the “Treasury”) from 2001 to 2006, where he served as Chief Counsel for the Treasury’s Financial Crimes Enforcement Network from 2005-2006.
Dr. Robert J. Froehlich (1953) Senior Managing Director since 2009
Dr. Froehlich joined The Hartford as Senior Managing Director in September 2009. Prior to joining The Hartford, Dr. Froehlich served as Vice Chairman of Deutsche Asset Management from 1997-2009.
Hartford Global Research HLS Fund (formerly Hartford Global Equity HLS Fund) |
Directors and Officers (Unaudited) – (continued) |
Thomas D. Jones, III (1965) Vice President and Chief Compliance Officer since 2006
Mr. Jones serves as Chief Compliance Officer for the Hartford Mutual Funds and Vice President and Director of Securities Compliance for The Hartford. Mr. Jones joined The Hartford in 2006 from SEI Investments, where he served as Chief Compliance Officer for its mutual funds and investment advisers. Prior to joining SEI, Mr. Jones was First Vice President and Compliance Director for Merrill Lynch Investment Managers (Americas) (“MLIM”), where he worked from 1992-2004.
Edward P. Macdonald (1967) Vice President, Secretary and Chief Legal Officer since 2005
Mr. Macdonald serves as Assistant Vice President of Hartford Life and Chief Legal Officer and Vice President of HIFSCO. He also serves as Vice President and Secretary of HASCO, and Chief Legal Officer, Secretary and Vice President of HL Advisors. Mr. Macdonald joined The Hartford in 2005.
Vernon J. Meyer (1964) Vice President since 2006
Mr. Meyer serves as Senior Vice President of Hartford Life. He also serves as Senior Vice President of HIFSCO and HL Advisors. Mr. Meyer joined The Hartford in 2004.
D. Keith Sloane (1960) Vice President since 2009
Mr. Sloane is a Senior Vice President of Hartford Life. Additionally, Mr. Sloane currently serves as Senior Vice President of HIFSCO, HL Advisors, and HASCO. Prior to joining The Hartford in 2007, Mr. Sloane was Director of product marketing and led the mutual fund business for Wachovia Securities (“Wachovia”) in their investment products group. Mr. Sloane joined Wachovia in 1995.
Jane Wolak (1961) Vice President since 2009
Ms. Wolak currently serves as Vice President of Hartford Life. Ms. Wolak joined Hartford Life as Vice President, Retail Product Services in May 2007. She is also Vice President of HASCO. Previously, Ms. Wolak was with Sun Life Financial where she held the position of Vice President, Service Center Operations from 2001-2007.
A description of the policies and procedures that the Fund uses to determine how to vote proxies relating to portfolio securities and a record of how the Fund voted any proxies for the twelve-month period ended June 30, 2010 is available (1) without charge, upon request, by calling 800-862-6668 and (2) on the Securities and Exchange Commission’s website at http://www.sec.gov.
The Fund files a complete schedule of portfolio holdings with the Commission for the first and third quarters of each fiscal year on Form N-Q. The Fund’s Forms are available (1) without charge, upon request, by calling 800-862-6668 and (2) on the Securities and Exchange Commission’s website at http://www.sec.gov. The Form N-Q may be reviewed and copied at the Commission’s Public Reference Room in Washington, DC. Information on the operation of the Public Reference Room may be obtained by calling 1-800-SEC-0330.
Hartford Global Research HLS Fund (formerly Hartford Global Equity HLS Fund) |
The following proposals were addressed and approved at a Special Meeting of Shareholders held on February 12, 2010.
Proposal to approve amendments to the Investment Management Agreement between the Fund and HL Investment Advisors, the purpose of which were to combine the administrative services for the Fund with the management services for the Fund under a single agreement.
| Fund | For | Against | Abstain | |||
| Hartford Global Research HLS Fund | 9,832,297.436 | 204,613.642 | 303,783.446 |
Proposal to elect Lemma Senbet and John Walters, each currently a Director, as Directors of Hartford Series Fund Inc.
Lemma W. Senbet
| Funds | For | Withheld | ||
| Hartford Series Fund, Inc. | 5,079,578,022.902 | 241,839,974.106 |
John C. Walters
| Funds | For | Withheld | ||
| Hartford Series Fund, Inc. | 5,081,138,302.186 | 240,279,694.822 |
Hartford Global Research HLS Fund (formerly Hartford Global Equity HLS Fund) |
Your Fund's Expenses
As a shareholder of the Fund, you incur two types of costs: (1) transaction costs, including sales charges (loads) on purchase payments and contingent deferred sales charges (CDSC) (2) ongoing costs including management fees; distribution fees; and other fund expenses. This example is intended to help you understand your ongoing costs (in dollars) of investing in the Fund and to compare these costs with the ongoing costs of investing in other mutual funds. The example is based on an investment of $1,000 invested at the beginning of the period and held for the period of December 31, 2009 through June 30, 2010.
Actual Expenses
The first set of columns of the table below provides information about actual account values and actual expenses. You may use the information in this column, together with the amount you invested, to estimate the expenses that you paid over the period. Simply divide your account value by $1,000 (for example, an $8,600 account value divided by $1,000 = 8.6), then multiply the result by the number in the line under the heading entitled "Expenses Paid During Period" to estimate the expenses you paid on your account during this period.
Hypothetical Example for Comparison Purposes
The second set of columns of the table below provides information about hypothetical account values and hypothetical expenses based on the Fund's actual expense ratio and an assumed rate of return of 5% per year before expenses, which is not the Fund's actual return. The hypothetical account values and expenses may not be used to estimate the actual ending account balance or expenses you paid for the period. You may use this information to compare the ongoing costs of investing in the Fund and other funds. To do so, compare this 5% hypothetical example with the 5% hypothetical examples that appear in the shareholder reports of the other funds.
Please note that the expenses shown in the table are meant to highlight your ongoing costs only and do not reflect any transactional costs, such as sales charges (loads) and CDSC. Therefore, the second set of columns of the table is useful in comparing ongoing costs only, and will not help you determine the relative total costs of owning different funds. In addition, if these transactional costs were included, your costs would be higher. Expenses are equal to the Fund's annualized expense ratios multiplied by average account value over the period, multiplied by 181/365 (to reflect the one-half year period).
| Actual return | Hypothetical (5% return before expenses) | |||||||||||||||||||||||||||||||||||
| Expenses paid | Expenses paid | Days in | ||||||||||||||||||||||||||||||||||
| during the period | during the period | the | Days | |||||||||||||||||||||||||||||||||
| Beginning | Ending | December 31, 2009 | Beginning | Ending | December 31, 2009 | Annualized | current | in the | ||||||||||||||||||||||||||||
| Account Value | Account Value | through | Account Value | Account Value | through | expense | 1/2 | full | ||||||||||||||||||||||||||||
December 31, 2009 | June 30, 2010 | June 30, 2010 | December 31, 2009 | June 30, 2010 | June 30, 2010 | ratio | year | year | ||||||||||||||||||||||||||||
| Class IA | $ | 1,000.00 | $ | 906.79 | $ | 4.68 | $ | 1,000.00 | $ | 1,019.89 | $ | 4.96 | 0.99 | % | 181 | 365 | ||||||||||||||||||||
| Class IB | $ | 1,000.00 | $ | 905.69 | $ | 5.86 | $ | 1,000.00 | $ | 1,018.65 | $ | 6.21 | 1.24 | % | 181 | 365 | ||||||||||||||||||||
Hartford Global Research HLS Fund (formerly Hartford Global Equity HLS Fund) |
The Board approved the annual continuation of the Investment Management Agreement (the “Agreement”) between Hartford Series Fund, Inc. (“HSF”) and HL Investment Advisors, LLC (“HL Advisors”) with respect to the Fund at its meeting on August 4-5, 2009. The Board’s considerations in approving the renewal of the Agreement are disclosed in the December 31, 2009 Annual Report for HSF.
At the November 4-5, 2009 meeting, the Board considered and approved amendments to the Agreement to include administrative services, which had been provided pursuant to a separate agreement, and investment management services under one agreement. The Board, including all of the Independent Directors, approved the amendments to the Agreement with respect to the Fund.
In approving the amendments, in addition to the information presented at the August meeting in connection with the annual review of the Agreement and the additional information provided throughout the year, the Board also considered the fact that the amendments did not result in an overall increase in fees to shareholders. The Board took note of the fact that the management of HL Advisors believes that the proposal to combine the administrative services with the investment management services under a single agreement will produce streamlined fee disclosure, resulting in greater transparency and clarity in the Fund’s prospectuses and financial reports. The Board further noted management's belief that the change would result in consistency across all of the Hartford Funds in the complex in that the funds of HSF are the only funds in the complex (other than the R share classes of the Hartford retail funds) that are subject to a separate administrative services fee. Finally, the Board noted management's view that the proposed changes to the Agreement should also serve to simplify the Board's annual consideration of the investment management arrangements for the Fund in that the investment management and administrative fees would be presented as a single fee for fee comparison purposes, which should facilitate the Board's analysis.
The shareholders of the Fund approved the amendments at a Special Meeting of Shareholders held on February 12, 2010. The amendments were effective as of March 1, 2010.
At the November 5, 2009 meeting, the Board approved amendments to the Investment Management Agreement between Hartford Series Fund, Inc. (“HSF”) and HL Investment Advisors, LLC (“HL Advisors”) and the Investment Sub-Advisory Agreement between HL Advisors and Wellington Management Company, LLP (the “sub-adviser”), both on behalf of Hartford Global Research HLS Fund (the “Fund”). The amendments would lower certain advisory and sub-advisory fee rates at various breakpoint levels without impacting the level and quality of services provided by HL Advisors and the sub-adviser to the Fund and its shareholders. In considering the amendments, the Board considered the comparative information with respect to the investment management fees paid by the Fund to HL Advisors and its affiliates, the investment sub-advisory fees paid to the sub-adviser, and the total expense ratio of the Fund provided in connection with the annual review of the agreements in August 2009 and information provided throughout the year. At the August 2009 meeting, the Board had requested and reviewed information from HL Advisors relating to the management fees, sub-advisory fees, and total operating expenses for the Fund. The Board also reviewed at the August meeting written materials from Lipper providing comparative information about the Fund's management fees, sub-advisory fees, and total expense ratios and the components thereof, relative to those of peer funds. While the Board recognized that comparisons between the Funds and peer funds are imprecise, given the differing service levels and characteristics of mutual funds, and the different business models and cost structures of advisers, the comparative information provided by Lipper had assisted the Board in evaluating the reasonableness of the Fund's management and sub-advisory fees and total operating expenses. The Board’s considerations in approving the renewal of the agreements are disclosed in the December 31, 2009 Annual Report for HSF.
35
The Hartford
P.O. Box 5085
Hartford, CT 06102–5085
Hartford Series Fund, Inc. is underwritten and distributed by Hartford Securities Distribution Company, Inc.
“The Hartford” is The Hartford Financial Services Group, Inc. and its subsidiaries.
Hartford Series Fund, Inc. inception dates range from 1977 to date. Hartford Series Fund, Inc. is not a subsidiary of The Hartford but is underwritten, distributed by and advised by subsidiaries of The Hartford. Investments in Hartford Series Fund, Inc. are not guaranteed by The Hartford or any other entity.
This material is authorized for distribution only when preceded or accompanied by a current prospectus. The prospectus contains detailed information about the Funds, including investment objectives, risks and charges and expenses. Please read it carefully before you invest or send money.
HLSSAR-GR10 Printed in U.S.A ©2010 The Hartford, Hartford, CT 06115 |
| Hartford Growth HLS Fund |
|
Hartford Growth HLS Fund
| Manager Discussions (Unaudited) | 2 |
| Financial Statements | |
| 4 | |
| 6 | |
| 7 | |
| 8 | |
| 9 | |
| 10 | |
| 22 | |
| 24 | |
| 26 | |
| 26 | |
| 27 | |
| 28 | |
| 29 |
This report is prepared for the general information of contract owners and qualified retirement plan participants. It is not an offer of contracts or of qualified retirement plans. It should not be used in connection with any offer, except in conjunction with the appropriate prospectus which contains all pertinent information including the applicable sales, administrative and other charges.
The views expressed in the Fund’s Manager Discussion under ‘‘Why did the Fund perform this way?’’ and ‘‘What is the outlook?’’ are views of the Fund’s subadvisers and portfolio management team through the end of the period and is subject to change based on market and other conditions.
Hartford Growth HLS Fund inception 04/30/2002
(subadvised by Wellington Management Company, LLP)
Investment objective – Seeks long-term capital appreciation.
Performance Overview(1) 4/30/02 - 6/30/10
Growth of $10,000 investment

Russell 1000 Growth Index is an unmanaged index which measures the performance of those Russell 1000 Index companies with higher price-to-book ratios and higher forecasted growth values.
You cannot invest directly in an index.
The chart represents a hypothetical investment in the Fund. Performance data represents past performance and current performance could be higher or lower.
Average Annual Returns (as of 6/30/10)
| 6 | 1 | 5 | Since | |||||
| Month† | Year | Year | Inception | |||||
| Growth IA | -10.37% | 8.76% | -1.87% | 1.82% | ||||
| Growth IB | -10.48% | 8.49% | -2.11% | 1.56% | ||||
| Russell 1000 Growth Index | -7.65% | 13.62% | 0.38% | 1.32% |
| † | Not Annualized |
PAST PERFORMANCE IS NOT INDICATIVE OF FUTURE RESULTS.
| (1) | Growth of a $10,000 investment in Class IB shares will vary from the results seen on this page due to differences in the expense charged to this share class. |
Performance information may reflect historical or current expense waivers from the investment adviser, without which performance would have been lower. For information on current expense waivers/reimbursements, please see the prospectus.
The value of the contract will fluctuate so that when redeemed, it may be worth more or less than the original investment. The chart and table do not reflect the deduction of taxes that a shareholder would pay on portfolio distributions or the redemption of portfolio shares. The figures do not include sales charges or other fees which may be applied at the variable life insurance, variable annuity or qualified retirement plan product level. Any such additional sales charges or other fees would lower the Fund’s performance.
| Portfolio Manager |
| Andrew J. Shilling, CFA |
| Senior Vice President, Partner |
How did the Fund perform?
The Class IA shares of the Hartford Growth HLS Fund returned -10.37% for the six-month period ended June 30, 2010 underperforming its benchmark, the Russell 1000 Growth Index, which returned -7.65% for the same period. The Fund also underperformed the -8.70% return of the average fund in the Lipper Large-Cap Growth Funds VP-UF peer group, a group of funds with investment strategies similar to those of the Fund.
Why did the Fund perform this way?
After posting positive results early in the period, U.S. equities came under pressure during the later part of the period amid rising risk aversion and concerns that the global economy could slip back into a recession. At the forefront of investors’ minds were sovereign debt and solvency troubles in the Eurozone, slowing economic growth in China and the U.S., and uncertainty about the sustainability of corporate earnings growth.
Overall equity market performance was negative for the period across all market capitalizations: large cap equities (-7%), mid cap equities (-1%), and small cap equities (-2%) all declined as represented by the S&P 500, S&P 400 MidCap, and Russell 2000 indices, respectively. During the six-month period, all ten sectors within the Russell 1000 Growth Index fell, led by Energy (-15%), Utilities (-15%), and Materials (-15%). Telecommunication Services (-1%), Consumer Discretionary (-2%), and Industrials (-2%) declined the least, on a relative basis.
The Fund’s underperformance versus its benchmark was primarily due to negative security selection, which was weakest in Consumer Discretionary, Energy, and Financials. This was partially offset by stronger stock selection in Industrials and Information Technology. Sector allocation, which is a fallout of the bottom-up (i.e. stock by stock fundamental research) stock selection process, also detracted from relative results. In particular, an underweight (i.e. the Fund’s sector position was less than the benchmark position) position in Consumer Staples and overweight (i.e. the Fund’s sector position was greater than the benchmark position) positions in Information Technology and Energy hurt relative results.
Goldman Sachs (Financials), Mosaic (Materials), and CONSOL Energy (Energy) were the top detractors from relative (i.e. performance of the Fund as measured against the benchmark) performance during the period. Shares of investment bank Goldman Sachs came under pressure amid financial reform and the news of an investigation by U.S. federal prosecutors. Softening global crop prices and macroeconomic concerns weighed on the stock price of Mosaic, a provider of phosphate and potash nutrients to the global agriculture industry. Shares of coal and natural gas producer CONSOL Energy fell during the period on concerns about an increasing shift from coal to gas and potential earnings dilution from the company’s plans to buy natural gas assets in the Marcellus shale region from Dominion. Microsoft (Information Technology), Google (Information Technology), and QUALCOMM (Information Technology) were top detractors from absolute returns.
Top contributors to benchmark-relative returns were NetApp (Information Technology), Cummins (Industrials), and Boeing (Industrials). Shares of data storage equipment and services company NetApp surged after the company forecasted better-than-expected sales for the upcoming quarter. The company is benefiting from an improving economy as businesses begin to spend on upgrading their computer and data storage networks. Strength in emerging markets businesses and signs of recovery in the U.S. drove shares of global manufacturer of low emission and energy efficient trucks Cummins higher. Chicago-based aircraft supplier and defense contractor Boeing continued to successfully move forward with its flight tests of the new Dreamliner airplane, driving shares higher. Apple (Information Technology) and SunTrust Banks (Financials) were top contributors to absolute returns.
What is the outlook?
Despite some signs of a slowdown, we believe that global growth remains positive, led by emerging markets. The U.S. recovery, particularly in terms of jobs creation, may be slower than some would like, but the trend remains positive. While we remain mindful of additional factors that may impact the pace of the recovery, including sovereign debt issues in Europe, the impact of any resulting fiscal restraint on growth, increased government regulation, and continued pressure on housing, we believe the economy will continue to expand.
In this environment we continue to focus our efforts on stock-by-stock fundamental research, picking one stock at a time based upon the attractiveness of each company’s fundamentals and valuation. As a result of this bottom-up stock selection, at the end of the period our largest overweight positions versus the benchmark were Information Technology, Financials, and Consumer Discretionary. Consumer Staples, Health Care, and Energy were the Fund’s largest underweight positions at the end of the period.
Diversification by Industry
as of June 30, 2010
| Percentage of | ||||
| Industry (Sector) | Net Assets | |||
Automobiles & Components (Consumer Discretionary) | 4.6 | % | ||
| Banks (Financials) | 3.8 | |||
| Capital Goods (Industrials) | 14.3 | |||
Consumer Durables & Apparel (Consumer Discretionary) | 2.3 | |||
| Consumer Services (Consumer Discretionary) | 2.6 | |||
| Diversified Financials (Financials) | 4.9 | |||
| Energy (Energy) | 4.6 | |||
| Health Care Equipment & Services (Health Care) | 1.0 | |||
| Insurance (Financials) | 3.8 | |||
| Materials (Materials) | 3.1 | |||
| Media (Consumer Discretionary) | 1.4 | |||
Pharmaceuticals, Biotechnology & Life Sciences (Health Care) | 1.8 | |||
| Retailing (Consumer Discretionary) | 6.0 | |||
Semiconductors & Semiconductor Equipment (Information Technology) | 6.7 | |||
| Software & Services (Information Technology) | 17.6 | |||
Technology Hardware & Equipment (Information Technology) | 19.7 | |||
| Transportation (Industrials) | 0.6 | |||
| Short-Term Investments | 0.7 | |||
| Other Assets and Liabilities | 0.5 | |||
| Total | 100.0 | % | ||
| Hartford Growth HLS Fund |
June 30, 2010 (Unaudited) |
| (000’s Omitted) |
| Shares or Principal Amount | Market Value ╪ | |||||
| COMMON STOCKS - 98.8% | ||||||
| Automobiles & Components - 4.6% | ||||||
| 474 | Ford Motor Co. ● | $ | 4,776 | |||
| 230 | Harley-Davidson, Inc. | 5,110 | ||||
| 212 | Johnson Controls, Inc. | 5,699 | ||||
| 15,585 | ||||||
| Banks - 3.8% | ||||||
| 165 | Itau Unibanco Banco Multiplo S.A. ADR | 2,964 | ||||
| 34 | SunTrust Banks, Inc. | 792 | ||||
| 369 | Wells Fargo & Co. | 9,436 | ||||
| 13,192 | ||||||
| Capital Goods - 14.3% | ||||||
| 65 | 3M Co. | 5,103 | ||||
| 92 | Boeing Co. | 5,773 | ||||
| 27 | Caterpillar, Inc. | 1,595 | ||||
| 63 | Cummins, Inc. | 4,075 | ||||
| 52 | Eaton Corp. | 3,377 | ||||
| 90 | Honeywell International, Inc. | 3,514 | ||||
| 110 | Illinois Tool Works, Inc. | 4,559 | ||||
| 159 | Ingersoll-Rand plc | 5,499 | ||||
| 310 | Masco Corp. | 3,337 | ||||
| 181 | PACCAR, Inc. | 7,225 | ||||
| 27 | Precision Castparts Corp. | 2,781 | ||||
| 29 | Siemens AG ADR | 2,583 | ||||
| 49,421 | ||||||
| Consumer Durables & Apparel - 2.3% | ||||||
| 100 | Coach, Inc. | 3,651 | ||||
| 53 | D.R. Horton, Inc. | 518 | ||||
| 54 | Polo Ralph Lauren Corp. | 3,975 | ||||
| 8,144 | ||||||
| Consumer Services - 2.6% | ||||||
| 218 | International Game Technology | 3,427 | ||||
| 295 | MGM Resorts International ● | 2,841 | ||||
| 111 | Starbucks Corp. | 2,689 | ||||
| 8,957 | ||||||
| Diversified Financials - 4.9% | ||||||
| 133 | Ameriprise Financial, Inc. | 4,803 | ||||
| 63 | Goldman Sachs Group, Inc. | 8,267 | ||||
| 288 | UBS AG | 3,817 | ||||
| 16,887 | ||||||
| Energy - 4.6% | ||||||
| 93 | Consol Energy, Inc. | 3,126 | ||||
| 35 | EOG Resources, Inc. | 3,407 | ||||
| 74 | National Oilwell Varco, Inc. | 2,445 | ||||
| 121 | Schlumberger Ltd. | 6,719 | ||||
| 15,697 | ||||||
| Health Care Equipment & Services - 1.0% | ||||||
| 88 | Covidien plc | 3,532 | ||||
| Insurance - 3.8% | ||||||
| 481 | Lincoln National Corp. | 11,684 | ||||
| 72 | Progressive Corp. | 1,357 | ||||
| 13,041 | ||||||
| Materials - 3.1% | ||||||
| 87 | Barrick Gold Corp. | 3,950 | ||||
| 51 | BHP Billiton Ltd. ADR | 3,137 | ||||
| 37 | Freeport-McMoRan Copper & Gold, Inc. | 2,167 | ||||
| 34 | Mosaic Co. | 1,339 | ||||
| 10,593 | ||||||
| Media - 1.4% | ||||||
| 390 | News Corp. Class A | 4,661 | ||||
| Pharmaceuticals, Biotechnology & Life Sciences - 1.8% | ||||||
| 69 | Celgene Corp. ● | 3,485 | ||||
| 55 | Teva Pharmaceutical Industries Ltd. ADR | 2,869 | ||||
| 6,354 | ||||||
| Retailing - 6.0% | ||||||
| 6 | Amazon.com, Inc. ● | 686 | ||||
| 94 | Kohl's Corp. ● | 4,487 | ||||
| 212 | Lowe's Co., Inc. | 4,334 | ||||
| 19 | Priceline.com, Inc. ● | 3,418 | ||||
| 199 | Staples, Inc. | 3,798 | ||||
| 80 | Target Corp. | 3,918 | ||||
| 20,641 | ||||||
| Semiconductors & Semiconductor Equipment - 6.7% | ||||||
| 191 | Altera Corp. | 4,734 | ||||
| 162 | Analog Devices, Inc. | 4,504 | ||||
| 469 | Intel Corp. | 9,129 | ||||
| 210 | Texas Instruments, Inc. | 4,883 | ||||
| 23,250 | ||||||
| Software & Services - 17.6% | ||||||
| 76 | Accenture plc | 2,951 | ||||
| 163 | BMC Software, Inc. ● | 5,654 | ||||
| 68 | Citrix Systems, Inc. ● | 2,873 | ||||
| 74 | Cognizant Technology Solutions Corp. ● | 3,706 | ||||
| 358 | eBay, Inc. ● | 7,016 | ||||
| 19 | Google, Inc. ● | 8,249 | ||||
| 503 | Microsoft Corp. | 11,582 | ||||
| 526 | Oracle Corp. | 11,290 | ||||
| 59 | Rovi Corp. ● | 2,242 | ||||
| 80 | VeriSign, Inc. ● | 2,115 | ||||
| 198 | Western Union Co. | 2,953 | ||||
| 60,631 | ||||||
| Technology Hardware & Equipment - 19.7% | ||||||
| 77 | Apple, Inc. ● | 19,395 | ||||
| 701 | Cisco Systems, Inc. ● | 14,947 | ||||
| 364 | Dell, Inc. ● | 4,393 | ||||
| 488 | EMC Corp. ● | 8,921 | ||||
| 227 | Juniper Networks, Inc. ● | 5,182 | ||||
| 318 | NetApp, Inc. ● | 11,882 | ||||
| 96 | Qualcomm, Inc. | 3,146 | ||||
| 67,866 | ||||||
| Transportation - 0.6% | ||||||
| 28 | FedEx Corp. | 1,957 | ||||
| Total common stocks | ||||||
| (cost $344,659) | $ | 340,409 | ||||
| Total long-term investments | ||||||
| (cost $344,659) | $ | 340,409 | ||||
The accompanying notes are an integral part of these financial statements.
| Shares or Principal Amount | Market Value ╪ | |||||||||
| SHORT-TERM INVESTMENTS - 0.7% | ||||||||||
| Repurchase Agreements - 0.7% | ||||||||||
Bank of America TriParty Joint Repurchase Agreement (maturing on 07/01/2010 in the amount of $805, collateralized by FHLMC 5.50%, 2039, FNMA 4.50% - 5.50%, 2038 - 2040, GNMA 5.00%, 2040, value of $821) | ||||||||||
| $ | 805 | 0.05%, 6/30/2010 | $ | 805 | ||||||
BNP Paribas Securities Corp. TriParty Joint Repurchase Agreement (maturing on 07/01/2010 in the amount of $138, collateralized by FNMA 4.50% - 6.50%, 2024 - 2040, GNMA 5.00% - 6.50%, 2038 - 2040, value of $141) | ||||||||||
| 138 | 0.04%, 6/30/2010 | 138 | ||||||||
Deutsche Bank Securities TriParty Joint Repurchase Agreement (maturing on 07/01/2010 in the amount of $610, collateralized by GNMA 3.13% - 7.00%, 2023 - 2052, value of $622) | ||||||||||
| 610 | 0.05%, 6/30/2010 | 610 | ||||||||
JP Morgan Chase TriParty Joint Repurchase Agreement (maturing on 07/01/2010 in the amount of $138, collateralized by FHLMC 2.38% - 5.83%, 2033 - 2038, value of $141) | ||||||||||
| 138 | 0.06%, 6/30/2010 | 138 | ||||||||
Morgan Stanley & Co., Inc. TriParty Joint Repurchase Agreement (maturing on 07/01/2010 in the amount of $601, collateralized by FHLMC 5.00% - 5.50%, 2038 - 2039, FNMA 5.00%, 2039, value of $616) | ||||||||||
| 601 | 0.03%, 6/30/2010 | 601 | ||||||||
UBS Securities, Inc. Repurchase Agreement (maturing on 07/01/2010 in the amount of $7, collateralized by U.S. Treasury Bill 0.88%, 2011, value of $7) | ||||||||||
| 7 | 0.02%, 6/30/2010 | 7 | ||||||||
UBS Securities, Inc. TriParty Joint Repurchase Agreement (maturing on 07/01/2010 in the amount of $152, collateralized by FNMA 5.00% - 6.00%, 2033 - 2036, value of $155) | ||||||||||
| 152 | 0.09%, 6/30/2010 | 152 | ||||||||
| 2,451 | ||||||||||
| Total short-term investments | ||||||||||
| (cost $2,451) | $ | 2,451 | ||||||||
| Total investments | ||||||||||
| (cost $347,110) ▲ | 99.5 | % | $ | 342,860 | ||||||
| Other assets and liabilities | 0.5 | % | 1,801 | |||||||
| Total net assets | 100.0 | % | $ | 344,661 | ||||||
| Note: | Percentage of investments as shown is the ratio of the total market value to total net assets. Market value of investments in foreign securities represents 5.6% of total net assets at June 30, 2010. |
Foreign securities that are principally traded on certain foreign markets are adjusted daily pursuant to a third party pricing service methodology approved by the Board of Directors in order to reflect an adjustment for factors occurring after the close of the foreign market but before the close of the New York Stock Exchange.
| ▲ | At June 30, 2010, the cost of securities for federal income tax purposes was $353,092 and the aggregate gross unrealized appreciation and depreciation based on that cost were: |
| Unrealized Appreciation | $ | 24,729 | ||
| Unrealized Depreciation | (34,961 | ) | ||
| Net Unrealized Depreciation | $ | (10,232 | ) |
| ● | Currently non-income producing. |
| ╪ | See Significant Accounting Policies of accompanying Notes to Financial Statements regarding valuation of securities. |
The accompanying notes are an integral part of these financial statements.
| Hartford Growth HLS Fund |
June 30, 2010 (Unaudited) |
| (000’s Omitted) |
| Total | Level 1♦ | Level 2♦ | Level 3 | |||||||||||||
| Assets: | ||||||||||||||||
| Common Stocks ‡ | $ | 340,409 | $ | 336,592 | $ | 3,817 | $ | – | ||||||||
| Short-Term Investments | 2,451 | – | 2,451 | – | ||||||||||||
| Total | $ | 342,860 | $ | 336,592 | $ | 6,268 | $ | – | ||||||||
| ♦ | For the period ended June 30, 2010, there were no significant transfers between Level 1 and Level 2. |
| ‡ | The Fund has all or primarily all of these equity securities categorized in a single level. Refer to the Schedule of Investments for further industry breakout. |
The accompanying notes are an integral part of these financial statements.
| Hartford Growth HLS Fund |
June 30, 2010 (Unaudited) |
| (000’s Omitted) |
| Assets: | ||||
| Investments in securities, at market value (cost $347,110) | $ | 342,860 | ||
| Cash | — | |||
| Receivables: | ||||
| Investment securities sold | 5,880 | |||
| Fund shares sold | 222 | |||
| Dividends and interest | 191 | |||
| Other assets | 2 | |||
| Total assets | 349,155 | |||
| Liabilities: | ||||
| Payables: | ||||
| Investment securities purchased | 3,265 | |||
| Fund shares redeemed | 1,116 | |||
| Investment management fees | 63 | |||
| Distribution fees | 5 | |||
| Accrued expenses | 45 | |||
| Total liabilities | 4,494 | |||
| Net assets | $ | 344,661 | ||
| Summary of Net Assets: | ||||
| Capital stock and paid-in-capital | $ | 451,844 | ||
| Accumulated undistributed net investment income | 76 | |||
| Accumulated net realized loss on investments and foreign currency transactions | (103,011 | ) | ||
| Unrealized depreciation of investments and the translations of assets and liabilities denominated in foreign currency | (4,248 | ) | ||
| Net assets | $ | 344,661 | ||
| Shares authorized | 800,000 | |||
| Par value | $ | 0.001 | ||
Class IA: Net asset value per share | $ | 9.03 | ||
| Shares outstanding | 28,084 | |||
| Net assets | $ | 253,475 | ||
Class IB: Net asset value per share | $ | 8.88 | ||
| Shares outstanding | 10,267 | |||
| Net assets | $ | 91,186 | ||
The accompanying notes are an integral part of these financial statements.
| Hartford Growth HLS Fund |
| For the Six-Month Period Ended June 30, 2010 (Unaudited) |
| (000’s Omitted) |
| Investment Income: | ||||
| Dividends | $ | 1,608 | ||
| Interest | 4 | |||
| Less: Foreign tax withheld | (24 | ) | ||
| Total investment income, net | 1,588 | |||
| Expenses: | ||||
| Investment management fees | 1,301 | |||
| Administrative service fees | 104 | |||
| Transfer agent fees | 2 | |||
| Distribution fees - Class IB | 116 | |||
| Custodian fees | 7 | |||
| Accounting services fees | 17 | |||
| Board of Directors' fees | 5 | |||
| Audit fees | 6 | |||
| Other expenses | 47 | |||
| Total expenses (before fees paid indirectly) | 1,605 | |||
| Commission recapture | (5 | ) | ||
| Total fees paid indirectly | (5 | ) | ||
| Total expenses, net | 1,600 | |||
| Net investment loss | (12 | ) | ||
| Net Realized Gain on Investments and Foreign Currency Transactions: | ||||
| Net realized gain on investments | 18,747 | |||
| Net realized loss on forward foreign currency contracts | (9 | ) | ||
| Net realized gain on other foreign currency transactions | 9 | |||
| Net Realized Gain on Investments and Foreign Currency Transactions | 18,747 | |||
| Net Changes in Unrealized Depreciation of Investments and Foreign Currency Transactions: | ||||
| Net unrealized depreciation of investments | (65,663 | ) | ||
| Net unrealized depreciation on translation of other assets and liabilities in foreign currencies | (2 | ) | ||
| Net Changes in Unrealized Depreciation of Investments and Foreign Currency Transactions | (65,665 | ) | ||
| Net Loss on Investments and Foreign Currency Transactions | (46,918 | ) | ||
| Net Decrease in Net Assets Resulting from Operations | $ | (46,930 | ) | |
The accompanying notes are an integral part of these financial statements.
| Hartford Growth HLS Fund |
| (000’s Omitted) |
| For the | ||||||||
| Six-Month | For the | |||||||
| Period Ended | Year Ended | |||||||
| June 30, 2010 | December 31, | |||||||
| (Unaudited) | 2009 | |||||||
| Operations: | ||||||||
| Net investment income (loss) | $ | (12 | ) | $ | 1,100 | |||
| Net realized gain (loss) on investments and foreign currency transactions | 18,747 | (57,576 | ) | |||||
| Net unrealized appreciation (depreciation) of investments and foreign currency transactions | (65,665 | ) | 143,777 | |||||
| Net increase (decrease) in net assets resulting from operations | (46,930 | ) | 87,301 | |||||
| Distributions to Shareholders: | ||||||||
| From net investment income | ||||||||
| Class IA | — | (1,004 | ) | |||||
| Class IB | — | (114 | ) | |||||
| Total distributions | — | (1,118 | ) | |||||
| Capital Share Transactions: | ||||||||
| Class IA | ||||||||
| Sold | 23,772 | 28,997 | ||||||
| Issued in merger | 54,822 | — | ||||||
| Issued on reinvestment of distributions | — | 1,004 | ||||||
| Redeemed | (33,307 | ) | (54,546 | ) | ||||
| Total capital share transactions | 45,287 | (24,545 | ) | |||||
| Class IB | ||||||||
| Sold | 9,131 | 8,535 | ||||||
| Issued in merger | 23,402 | — | ||||||
| Issued on reinvestment of distributions | — | 114 | ||||||
| Redeemed | (15,191 | ) | (27,038 | ) | ||||
| Total capital share transactions | 17,342 | (18,389 | ) | |||||
| Net increase (decrease) from capital share transactions | 62,629 | (42,934 | ) | |||||
| Net increase in net assets | 15,699 | 43,249 | ||||||
| Net Assets: | ||||||||
| Beginning of period | 328,962 | 285,713 | ||||||
| End of period | $ | 344,661 | $ | 328,962 | ||||
Accumulated undistributed (distribution in excess of) net investment income | $ | 76 | $ | 88 | ||||
| Shares: | ||||||||
| Class IA | ||||||||
| Sold | 2,277 | 3,483 | ||||||
| Issued in merger | 5,038 | — | ||||||
| Issued on reinvestment of distributions | — | 103 | ||||||
| Redeemed | (3,304 | ) | (6,593 | ) | ||||
| Total share activity | 4,011 | (3,007 | ) | |||||
| Class IB | ||||||||
| Sold | 881 | 1,020 | ||||||
| Issued in merger | 2,184 | — | ||||||
| Issued on reinvestment of distributions | — | 12 | ||||||
| Redeemed | (1,523 | ) | (3,321 | ) | ||||
| Total share activity | 1,542 | (2,289 | ) | |||||
The accompanying notes are an integral part of these financial statements.
| Hartford Growth HLS Fund |
June 30, 2010 (Unaudited) |
| (000’s Omitted) |
| 1. | Organization: |
Hartford Growth HLS Fund (the "Fund") serves as an underlying investment option for certain variable annuity and variable life insurance separate accounts of Hartford Life Insurance Company (“HLIC”) and its affiliates and certain qualified retirement plans. The Fund may also serve as an underlying investment option for certain variable annuity and variable life separate accounts of other insurance companies. Owners of variable annuity contracts and policyholders of variable life insurance contracts may choose the funds permitted in the variable insurance contract prospectus. In addition, participants in certain qualified retirement plans may choose the fund if permitted by their plans.
Hartford Series Fund, Inc. (the “Company”) is an open-end registered management investment company comprised of twenty-nine portfolios, one portfolio of which is included in these financial statements.
The Company is organized under the laws of the State of Maryland and is registered with the Securities and Exchange Commission (“SEC”) under the Investment Company Act of 1940, as amended (“1940 Act”). The Fund is organized as a diversified open-end management investment company.
The Fund is divided into Class IA and Class IB shares. Each class is offered at the per share net asset value (“NAV”) without a sales charge and is subject to the same expenses, except that the Class IB shares are subject to distribution and service fees charged pursuant to a Distribution and Service Plan adopted in accordance with Rule 12b-1 under the 1940 Act.
| 2. | Significant Accounting Policies: |
The following is a summary of significant accounting policies of the Fund, which are in accordance with U.S. Generally Accepted Accounting Principles (“GAAP”).
| a) | Security Transactions and Investment Income – Security transactions are recorded on the trade date (the date the order to buy or sell is executed). Security gains and losses are determined on the basis of identified cost. |
Dividend income is accrued as of the ex-dividend date, except that certain dividends for foreign securities where the ex-dividend date may have passed are recorded as soon as the Fund is informed of the dividend in the exercise of reasonable diligence. Interest income, including amortization of premium and accretion of discounts, is accrued on a daily basis.
| b) | Security Valuation – The Fund generally uses market prices in valuing portfolio securities. If market prices are not readily available or are deemed unreliable, the Fund will use the fair value of the security as determined in good faith under policies and procedures established by and under the supervision of the Fund’s Board of Directors. Market prices may be deemed unreliable, for example, if a security is thinly traded or if an event has occurred after the close of the security’s primary market, but before the close of the New York Stock Exchange (the “Exchange”) (generally 4:00 p.m. Eastern Time, referred to as the “Valuation Time”) that is expected to affect the value of the portfolio security. The circumstances in which the Fund may use fair value pricing include, among others: (i) the occurrence of events that are significant to a particular issuer, such as mergers, restructuring or defaults; (ii) the occurrence of events that are significant to an entire market, such as natural disasters in a particular region or governmental actions; (iii) trading restrictions on securities; (iv) thinly traded securities and (v) market events such as trading halts and early market closings. In addition, with respect to the valuation of stocks primarily traded on foreign markets, the Fund uses a fair value pricing service approved by the Fund’s Board of Directors, which employs quantitative models that evaluate changes in the value of foreign market proxies (e.g., futures contracts, American Depositary Receipts (“ADRs”), exchange traded funds (“ETFs”)) after the close of the foreign markets but before the Valuation Time. Securities that are primarily traded on foreign markets may trade on days that are not business days of the Fund. The value of the foreign securities in which the Fund invests may change on days when a shareholder will not be able to purchase or redeem shares of the Fund. Fair value pricing is subjective in nature and the use of fair value pricing by the Fund may cause the NAV of its shares to differ significantly from the NAV that would have been calculated using market prices at the close of the exchange on which a portfolio security is primarily traded but before the Valuation Time. There can be no |
assurance that the Fund could obtain the fair value assigned to a security if the Fund were to sell the security at approximately the time at which the Fund determines its NAV.
Exchange-traded equity securities are valued at the last reported sale price or official close price on the exchange or market on which the security is primarily traded (the “Primary Market”) at the Valuation Time. If the security did not trade on the Primary Market, it may be valued at the Valuation Time at the last reported sale price on another exchange where it trades. The value of an equity security not traded on any exchange but traded on the Nasdaq Stock Market, Inc. or another over-the-counter market shall be valued at the last reported sale price or official closing price on the exchange or market on which the security is traded as of the Valuation Time.
Foreign-denominated assets, including investment securities, and liabilities are translated from the local currency into U.S. dollars using exchange rates obtained from an independent third party as of the Fund’s Valuation Time.
Financial instruments for which prices are not available from an independent pricing service may be valued using market quotations obtained from one or more dealers that make markets in securities in accordance with procedures established by the Fund’s Board of Directors.
Forward foreign currency contracts represent agreements to exchange currencies on specific future dates at predetermined rates. Forward foreign currency contracts are valued using foreign currency exchange rates and forward rates on the Valuation Date from an independent pricing service.
Other derivative or contractual type instruments shall be valued using market prices if such instruments trade on an exchange or market. If such instruments do not trade on an exchange or market, such instruments shall be valued at a price at which the counterparty to such contract would repurchase the instrument. In the event that the counterparty cannot provide a price, such valuation may be determined in accordance with procedures established by the Fund’s Board of Directors.
Various inputs are used in determining the value of the Fund’s investments. These inputs are summarized into three broad hierarchy levels. This hierarchy is based on whether the valuation inputs are observable or unobservable. These levels are:
| · | Level 1 – Quoted prices in active markets for identical securities. Level 1 may include exchange-traded instruments such as domestic equities, some foreign equities, options, futures, mutual funds, ETFs, and rights and warrants. |
| · | Level 2 – Observable inputs other than Level 1 prices, such as quoted prices for similar securities; quoted prices in markets that are not active; or other inputs that are observable or can be corroborated by observable market data. Level 2 may include debt securities that are traded less frequently than exchange-traded instruments and which are valued using third party pricing services. Prices for most level 2 securities are based on prices received from an independent pricing service. The following asset classes generally use valuation techniques and inputs as noted below: |
Asset Backed Securities and Collateralized Mortgage Obligations –Multi-dimensional spread/prepayment speed tables, with consideration of yield or price of bonds of comparable quality, coupon and maturity, attributes of the collateral, new issue data and monthly payment information.
Corporate Bonds – Multi-dimensional relational model based on observable market information such as yields, spreads, sector analysis, etc.
| Hartford Growth HLS Fund |
Notes to Financial Statements – (continued) June 30, 2010 (Unaudited) |
| (000’s Omitted) |
Foreign Currency – Based on rates determined at the close of the Exchange, provided by an independent pricing service.
Forward Currency Contracts – Valued based on the price of the underlying currency at the prevailing interpolated exchange rate, which is a combination of the spot currency rate and the forward currency rate, provided by an independent pricing service.
Foreign Equities – Certain foreign equities are priced using a multi-factor regression model with market observable inputs of a correlative nature (ADRs, futures contracts, ETFs, and currency exchange rates).
International Fixed Income – Multi-dimensional relational model based on observable market information such as benchmark yields, reported trades, bids and offers.
Money Market Instruments – Amortized cost.
Mortgage Backed Securities (“MBS”) – Matrix pricing using inputs of To-Be-Announced (“TBA”) prices, new issue data and monthly payment information, with consideration of yield or price of bonds of comparable quality, coupon and maturity, and attributes of the collateral.
Municipal Bonds – Multi-dimensional relational model and series of matrices based on observable market information such as Municipal Securities Rulemaking Board reported trades, comparable bonds, yields, spreads and credit analysis.
Preferred Stocks – Close mean of bid/ask or bid.
Repurchase Agreements – Priced at par.
Senior Floating Rate Interests – Composite of quotes from one or more contributing dealers.
Swaps – Price based upon observable market information from an independent pricing service.
U.S. Government Securities – Treasuries exclusively traded in the secondary market.
| · | Level 3 – Significant unobservable inputs that are supported by limited or no market activity. Level 3 may include financial instruments whose values are determined using broker quotes or require significant management judgment or estimation. While these securities are priced using unobservable inputs, the valuation of these securities reflects the best available data and management believes the prices are a reasonable representation of exit price. The following asset classes generally use valuation techniques and inputs as noted below: |
Asset Backed Securities & Commercial Mortgage Backed Securities – Certain other MBS with limited liquidity priced from an independent pricing service.
Common Stocks – Trading has been halted or there are restrictions on trading. Valuation is based on last trade with the application of a discount or premium, if applicable.
Long Dated Over-the-Counter Options – Terms greater than 10 years from current date, expected volatility is not observable. Prices are from an independent pricing service.
Long Term Debt Securities, including Senior Floating Rate Interests – Unobservable valuation inputs may include estimates for current yields, maturity/duration, prepayment speed, and broker quotes for comparable securities along with other assumptions relating to credit quality, collateral value, complexity of the security structure, general market conditions and liquidity.
Swaps – Terms greater than 10 years from current date, expected volatility is not observable. Prices are from an independent pricing service.
Individual securities within any of the above mentioned asset classes may be assigned a different hierarchical level than those that are presented above, as individual circumstances dictate.
During the six-month period ended June 30, 2010, the Fund held no Level 3 securities, therefore no reconciliation of Level 3 securities is presented.
Refer to the Investment Valuation Hierarchy Level Summary found following the Schedule of Investments.
| c) | Foreign Currency Transactions – Assets and liabilities denominated in currencies other than U.S. dollars are translated into U.S. dollars at the exchange rates in effect on the valuation date. Purchases and sales of investment securities, income and expenses are translated into U.S. dollars at the exchange rates on the dates of such transactions. |
The Fund does not isolate that portion of portfolio security valuation resulting from fluctuations in the foreign currency exchange rates from the fluctuations arising from changes in the market prices of securities held. Exchange rate fluctuations are included with the net realized and unrealized gain or loss on investments in the accompanying financial statements.
Net realized foreign exchange gains or losses arise from sales of foreign currencies and the difference between asset and liability amounts initially stated in foreign currencies and the U.S. dollar value of the amounts actually received or paid. Net unrealized foreign exchange gains or losses arise from changes in the value of other assets and liabilities at the end of the reporting period, resulting from changes in the exchange rates.
| d) | Joint Trading Account – Pursuant to an exemptive order issued by the SEC, the Fund may transfer uninvested cash balances into a joint trading account managed by Wellington Management Company, LLP (“Wellington Management”). These balances may be invested in one or more repurchase agreements and/or short-term money market instruments. |
| e) | Repurchase Agreements – A repurchase agreement is an agreement by which a counterparty agrees to sell a security and agrees to repurchase the security sold at a mutually agreed upon time and price. At the time the Fund enters into a repurchase agreement, the value of the underlying collateral security(ies), including accrued interest, will be equal to or exceed the value of the repurchase agreement. To minimize counterparty risk, the securities that serve to collateralize the repurchase agreement are held by the Fund's custodian in book entry or physical form in the custodial account of the Fund or in a third party custodial account. Repurchase agreements are valued at cost plus accrued interest. The Fund, as shown on the Schedule of Investments, had outstanding repurchase agreements as of June 30, 2010. |
| f) | Forward Foreign Currency Contracts – The Fund may enter into forward foreign currency contracts that obligate the Fund to purchase or sell currencies at specified future dates. Forward foreign currency contracts may be used to hedge against adverse fluctuations in exchange rates between currencies. |
Forward foreign currency contracts involve elements of market risk in excess of the amounts reflected in the Statement of Assets and Liabilities. In addition, risks may arise upon entering into these contracts from the potential inability of the counterparties to meet the terms of the contracts and from unanticipated movements in the value of the foreign currencies relative to the U.S. dollar. The Fund had no outstanding forward foreign currency contracts as of June 30, 2010.
| g) | Fund Share Valuation and Dividend Distributions to Shareholders – Orders for the Fund’s shares are executed in accordance with the investment instructions of the contract holders or plan participants. The NAV of the Fund’s shares is determined as of the close of each business day of the Exchange. The NAV is determined separately for each class of the Fund by dividing the Fund’s net assets attributable to that class by the number of outstanding shares of the class. Orders |
| Hartford Growth HLS Fund |
Notes to Financial Statements – (continued) June 30, 2010 (Unaudited) |
| (000’s Omitted) |
for the purchase of the Fund’s shares received by an insurance company or plan prior to the close of the Exchange on any day on which the Exchange is open for business are priced at the NAV determined as of the close of the Exchange. Orders received by an insurance company or plan after the close of the Exchange, or on a day on which the Exchange and/or the Fund is not open for business, are priced at the next determined NAV.
Dividends are declared pursuant to a policy adopted by the Fund’s Board of Directors based upon the investment performance of the Fund. The policy of the Fund is to pay dividends from net investment income and distribute realized capital gains, if any, at least once a year.
Distributions from net investment income, realized capital gains and capital are determined in accordance with federal income tax regulations, which may differ from U.S. GAAP with respect to character and timing. These differences may include but are not limited to losses deferred due to wash sale adjustments, foreign currency gains and losses, adjustments related to Passive Foreign Investment Companies (“PFICs”), Real Estate Investment Trusts (“REITs”), Regulated Investment Companies (“RICs”), certain derivatives and partnerships. Permanent book and federal income tax basis differences relating to shareholder distributions will result in reclassifications to certain of the Fund’s capital accounts (see Federal Income Taxes: Reclassification of Capital Accounts note).
| h) | Securities Purchased on a When-Issued or Delayed-Delivery Basis – Delivery and payment for securities that have been purchased by the Fund on a forward commitment, or when-issued or delayed-delivery basis, take place beyond the customary settlement period. During this period, such securities are subject to market fluctuations, and the Fund identifies securities segregated in its records with value at least equal to the amount of the commitment. As of June 30, 2010, the Fund had no outstanding when-issued or delayed delivery securities. |
| i) | Use of Estimates – The preparation of financial statements in conformity with U.S. GAAP requires management to make estimates and assumptions that affect the reported amounts of assets and liabilities as of the date of the financial statements and the reported amounts of income and expenses during the period. Operating results in the future could vary from the amounts derived from management’s estimates. |
| j) | Additional Derivative Instrument(s) Information |
The volume of derivative activity was minimal during the six-month period ended June 30, 2010.
Realized Gain/Loss and Change in Unrealized Appreciation (Depreciation) on Derivative Instruments for the six-month period ended June 30, 2010:
Amount of Realized Gain or (Loss) on Derivatives Recognized in Income | ||||||||||||||||||||||||
| Forward | ||||||||||||||||||||||||
| Purchased | Currency | |||||||||||||||||||||||
Risk Exposure Category | Written Options | Options | Futures | Contracts | Swaps | Total | ||||||||||||||||||
| Foreign exchange contracts | $ | — | $ | — | $ | — | $ | (9 | ) | $ | — | $ | (9 | ) | ||||||||||
| Total | $ | — | $ | — | $ | — | $ | (9 | ) | $ | — | $ | (9 | ) | ||||||||||
| k) | Indemnifications – Under the Company’s organizational documents, the Company shall indemnify its officers and directors to the full extent required or permitted under Maryland General Corporation Law and the federal securities laws. In addition, the Company, on behalf of the Fund, may enter into contracts that contain a variety of indemnifications. The Company’s maximum exposure under these arrangements is unknown. However, the Company has not had prior claims or losses pursuant to these contracts and expects the risk of loss to be remote. |
| 3. | Federal Income Taxes: |
| a) | Federal Income Taxes – For federal income tax purposes, the Fund intends to continue to qualify as a RIC under Subchapter M of the Internal Revenue Code (“IRC”) by distributing substantially all of its taxable net investment income and net realized capital gains to its shareholders and otherwise complying with the requirements of RICs. The Fund has distributed substantially all of its income and capital gains in prior years and intends to distribute substantially all of its income and capital gains prior to the next fiscal year end. Accordingly, no provision for federal income or excise taxes has been made in the accompanying financial statements. Distributions from short-term capital gains are treated as ordinary income distributions for federal income tax purposes. |
| b) | Net Investment Income (Loss), Net Realized Gains (Losses) – Net investment income (loss) and net realized gains (losses) may differ for financial statement and tax purposes primarily because of losses deferred due to wash sale adjustments, foreign currency gains and losses, adjustments related to PFICs, REITs, RICs, certain derivatives and partnerships. The character of distributions made during the year from net investment income or net realized gains may differ from their ultimate characterization for federal income tax purposes. Also, due to the timing of dividend distributions, the fiscal year in which amounts are distributed may differ from the year that the income or realized gains (losses) were recorded by the Fund. | |
| c) | Distributions and Components of Distributable Earnings – The tax character of distributions paid by the Fund for the periods indicated is as follows (as adjusted for dividends payable): |
| For the Year Ended | For the Year Ended | |||||||
| December 31, 2009 | December 31, 2008 | |||||||
| Ordinary Income | $ | 1,118 | $ | 3,714 | ||||
| Long-Term Capital Gains* | — | 12,569 | ||||||
| * | The Fund designates these distributions as long-term capital dividends pursuant to IRC code Sec. 852(b)(3)(C). |
As of December 31, 2009, the Fund’s components of distributable earnings (deficit) on a tax basis were as follows:
| Amount | ||||
| Undistributed Ordinary Income | $ | 88 | ||
| Accumulated Capital and Other Losses* | (92,093 | ) | ||
Unrealized Appreciation† | 42,838 | |||
| Total Accumulated Deficit | $ | (49,167 | ) | |
| * | The Fund has capital loss carryforwards that are identified in the Capital Loss Carryforward note that follows. |
| † | The difference between book-basis and tax-basis unrealized appreciation (depreciation) may be attributable to the losses deferred due to wash sale adjustments, foreign currency gains and losses, adjustments related to PFICs, REITs, RICs, certain derivatives and partnerships. |
| Hartford Growth HLS Fund |
Notes to Financial Statements – (continued) June 30, 2010 (Unaudited) |
| (000’s Omitted) |
| d) | Reclassification of Capital Accounts – The Fund may record reclassifications in its capital accounts. These reclassifications have no impact on the total net assets of the Fund. The reclassifications are a result of permanent differences between GAAP and tax accounting for such items as net operating losses that reduce distribution requirements. Adjustments are made to reflect the impact these items have on current and future distributions to shareholders. Therefore, the source of the Fund’s distributions may be shown in the accompanying Statement of Changes in Net Assets as from net investment income, from net realized gains on investments or from capital depending on the type of book and tax differences that exist. For the year ended December 31, 2009, the Fund recorded reclassifications to increase (decrease) the accounts listed below: |
| Amount | ||||
| Accumulated Undistributed Net Investment Income | $ | (37 | ) | |
| Accumulated Net Realized Gain (Loss) on Investments | 37 | |||
| e) | Capital Loss Carryforward – At December 31, 2009 (tax-year-end), the Fund had capital loss carryforwards for U.S. federal income tax purposes of approximately: |
| Year of Expiration | Amount | |||
| 2016 | $ | 23,721 | ||
| 2017 | 66,808 | |||
| Total | $ | 90,529 | ||
As of December 31, 2009, the Fund elected to defer the following post October losses.
| Amount | ||||
| Long-Term Capital Gain | $ | 1,564 | ||
| f) | Accounting for Uncertainty in Income Taxes – Management has evaluated all open tax years and has determined there is no impact to the Fund’s financial statements related to uncertain tax positions. Generally, tax authorities can examine all tax returns filed for the last three years. |
| 4. | Expenses: |
| a) | Investment Management Agreements – HL Investment Advisors, LLC (“HL Advisors”), an indirect wholly-owned subsidiary of The Hartford Financial Services Group, Inc. (“The Hartford”), serves as investment manager to the Fund pursuant to an Investment Management Agreement with the Company. As investment manager, HL Advisors has overall investment supervisory responsibility for the Fund. In addition, HL Advisors provides administrative personnel, services, equipment, facilities and office space for proper operation of the Fund. |
HL Advisors has contracted with Wellington Management for the provision of day-to-day investment management services to the Fund in accordance with the Fund’s investment objective and policies. The Fund pays a fee to HL Advisors, a portion of which may be used to compensate Wellington Management. |
| b) | Administrative Services Agreement – For the two-month period January 1, 2010 through February 28, 2010, under the Administrative Services Agreement between HLIC and the Company, on behalf of the Fund, HLIC provided administrative services to the Fund and received monthly compensation at the annual rate of 0.20% of the Fund’s average daily net assets. The Fund assumed and paid certain other expenses (including, but not limited to, accounting, custodian, state taxes and Directors’ fees). Effective March 1, 2010, the Investment Management Agreement was amended to include the administrative services for the Fund and the separate administrative services agreement was terminated. |
| The schedule below reflects the rates of compensation paid to HL Advisors for investment management services and to HLIC for administrative services rendered from January 1, 2010 through February 28, 2010, and the rates of |
compensation paid to the HL Advisors for the combined services from March 1, 2010 through June 30, 2010; the rates are accrued daily and paid monthly.
| Average Daily Net Assets | Annual Fee | |||
| On first $250 million | 0.8000 | % | ||
| On next $250 million | 0.7500 | % | ||
| On next $500 million | 0.7000 | % | ||
| On next $4 billion | 0.6750 | % | ||
| On next $5 billion | 0.6725 | % | ||
| Over $10 billion | 0.6700 | % | ||
Effective April 17, 2010, HL Advisers agreed to permanently reduce management fees of 0.0250% at the first three breakpoints. Prior to April 17, 2010, the management fee breakpoints were as follows:
| Average Daily Net Assets | Annual Fee | |||
| On first $250 million | 0.8250 | % | ||
| On next $250 million | 0.7750 | % | ||
| On next $500 million | 0.7250 | % | ||
| On next $4 billion | 0.6750 | % | ||
| On next $5 billion | 0.6725 | % | ||
| Over $10 billion | 0.6700 | % | ||
| c) | Accounting Services Agreement – Pursuant to the Fund Accounting Agreement between HLIC and the Company, on behalf of the Fund, HLIC provides accounting services to the Fund and receives monthly compensation on the Fund’s average net assets. The Fund’s accounting services fees are accrued daily and paid monthly. |
| Average Daily Net Assets | Annual Fee | |||
| All Assets | 0.010 | % | ||
| d) | Operating Expenses – Allocable expenses incurred by the Company are allocated to each Fund and allocated to classes within the Fund in proportion to the average daily net assets of the Fund and each class, except where allocation of certain expenses is more fairly made directly to the Fund or to specific classes within a Fund. |
| e) | Fees Paid Indirectly – The Company, on behalf of the Fund has entered into agreements with State Street Global Advisers, LLC and Russell Implementation Securities, Inc. to partially recapture non-discounted trade commissions. Such rebates are used to pay a portion of the Fund’s expenses. In addition, the Fund’s custodian bank has also agreed to reduce its fees when the Fund maintains cash on deposit in a non-interest-bearing custody account. For the six-month period ended June 30, 2010, these amounts are included in the Statement of Operations. |
| The ratio of expenses to average net assets in the accompanying financial highlights excludes the reduction in expenses related to fees paid indirectly. Had the fees paid indirectly been included, the annualized expense ratio for the periods listed below would have been as follows: |
| Annualized | ||||||||||||||||||||||||
| Six-Month | Year Ended | Year Ended | Year Ended | Year Ended | Year Ended | |||||||||||||||||||
| Period Ended | December 31, | December 31, | December 31, | December 31, | December 31, | |||||||||||||||||||
| June 30, 2010 | 2009 | 2008 | 2007 | 2006 | 2005 | |||||||||||||||||||
| Class IA | 0.85 | % | 0.87 | % | 0.84 | % | 0.83 | % | 0.82 | % | 0.82 | % | ||||||||||||
| Class IB | 1.10 | 1.12 | 1.09 | 1.08 | 1.07 | 1.07 | ||||||||||||||||||
| Hartford Growth HLS Fund |
Notes to Financial Statements – (continued) June 30, 2010 (Unaudited) |
| (000’s Omitted) |
| f) | Distribution Plan for Class IB shares – The Company, on behalf of the Fund, has adopted a Distribution Plan pursuant to Rule 12b-1 under the 1940 Act for the Class IB shares. Pursuant to the Distribution Plan, the Fund is authorized to compensate the Distributor, Hartford Securities Distribution Company, Inc. (a wholly owned, ultimate subsidiary of The Hartford), from assets attributable to the Class IB shares for services rendered and expenses borne in connection with activities primarily intended to result in the sale of the Class IB shares, subject to the Fund Board’s review and approval. |
The Distribution Plan provides that the Fund may pay annually up to 0.25% of the average daily net assets of the Fund attributable to its Class IB shares for activities primarily intended to result in the sale of Class IB shares. The Board has the authority to suspend or reduce these payments at any point in time. Under the terms of the Distribution Plan and the principal underwriting agreement, the Fund is authorized to make payments monthly to the Distributor which may be used to pay or compensate entities providing distribution and shareholder servicing with respect to the Class IB shares for such entities’ fees or expenses incurred or paid in that regard. These fees are accrued daily and paid monthly.
| g) | Other Related Party Transactions – Certain officers of the Fund are directors and/or officers of HL Advisors, and/or The Hartford or its subsidiaries. For the six-month period ended June 30, 2010, a portion of the Fund’s chief compliance officer’s salary was paid by all the investment companies in the Hartford fund complex. The portion allocated to the Fund was in the amount of $1. Hartford Investor Services Company, LLC ("HISC"), a wholly owned subsidiary of The Hartford, provides transfer agent services to the Fund. The amount HISC was compensated for providing such services can be found on the Statement of Operations. These fees are accrued daily and paid monthly. |
| h) | Payment from Affiliate – On November 8, 2006, the SEC issued an order setting forth the terms of a settlement reached with three subsidiaries of The Hartford that resolves the SEC’s Division of Enforcement’s investigation of aspects of The Hartford’s variable annuity and mutual fund operations related to directed brokerage and revenue sharing. The Hartford settled this matter without admitting or denying the findings of the SEC. |
The Fund is available for purchase by the separate accounts of different variable universal life policies, variable annuity products, and funding agreements and it is offered directly to certain qualified retirement plans (collectively “Products”). Although existing Products contain transfer restrictions, some Products, particularly older variable annuity products, do not contain restrictions on the frequency of transfers. In addition, as the result of the settlement of litigation against Hartford Life, Inc. (“Hartford Life”) (the issuers of such variable annuity products), the Fund’s ability to restrict transfers by certain owners of older variable annuity products was limited. During 2006, these annuity owners surrendered the older variable annuity contracts that were the subject of prior litigation. In February 2005, Hartford Life agreed with the Board of Directors of the Fund to indemnify the Fund for any material harm caused to the Fund from frequent trading by these contracts owners.
The total return in the accompanying financial highlights includes payment from affiliates. Had the payment from affiliates been excluded, the total return for the periods listed below would have been as follows:
| For the Year Ended December 31, 2006 | ||||||||
| Class IA | Class IB | |||||||
| Impact from Payment from Affiliate for SEC Settlement | 0.01 | % | 0.01 | % | ||||
| Impact from Payment from Affiliate for Unrestricted Transfers | 0.04 | 0.04 | ||||||
| Total Return Excluding Payments from Affiliate | 4.56 | 4.30 | ||||||
| For the Year Ended December 31, 2005 | ||||||||
| Class IA | Class IB | |||||||
| Impact from Payment from Affiliate for Unrestricted Transfers | 0.09 | % | 0.09 | % | ||||
| Total Return Excluding Payments from Affiliate | 4.58 | 4.33 | ||||||
| 5. | Investment Transactions: |
For the six-month period ended June 30, 2010, the cost of purchases and proceeds from sales of investment securities (excluding short-term investments) were as follows:
| Amount | ||||
| Cost of Purchases Excluding U.S. Government Obligations | $ | 229,374 | ||
| Sales Proceeds Excluding U.S. Government Obligations | 181,821 | |||
| 6. | Line of Credit: |
| The Fund is one of several Hartford funds that participate in a $500 million committed revolving line of credit facility. The facility is to be used for temporary or emergency purposes. Under the arrangement, a fund is required to own securities having a market value in excess of 300% of the total bank borrowings. The interest rate on borrowings varies depending on the nature of the loan. The facility also requires a fee to be paid based on the amount of the commitment. This fee is allocated to all the funds participating in the line of credit based on the average net assets of the funds. During the six-month period ended June 30, 2010, the Fund did not have any borrowings under this facility. |
| 7. | Fund Merger: |
Reorganization of Hartford Fundamental Growth HLS Fund into Hartford Growth HLS Fund: At a meeting held on August 5, 2009, the Board of Directors of the Company approved a Form of Agreement and Plan of Reorganization (“Reorganization Agreement”) that provided for the reorganization of a series of the Company, Hartford Fundamental Growth HLS Fund (“Target Fund”), into another series of the Company, Hartford Growth HLS Fund (“Acquiring Fund”) (the “Reorganization”). The reorganization did not require shareholder approval by the shareholders of Hartford Fundamental Growth HLS Fund or Hartford Growth HLS Fund. |
| Pursuant to the Reorganization Agreement, on April 16, 2010, each holder of Class IA and Class IB shares of Hartford Fundamental Growth HLS Fund became the owner of full and fractional shares of the corresponding class in Hartford Growth HLS Fund having an equal aggregate value. |
| The merger was accomplished by tax free exchange as detailed below: |
Net assets of Target Fund on Merger Date | Target Fund shares exchanged | Acquiring Fund shares issued to the Target Fund's shareholders | Net assets of Acquiring Fund immediately before merger | Net assets of Acquiring Fund immediately after merger | ||||||||||||||||
| Class IA | $ | 54,822 | 6,125 | 5,038 | $ | 254,913 | $ | 309,735 | ||||||||||||
| Class IB | 23,402 | 2,627 | 2,184 | 90,981 | 114,383 | |||||||||||||||
| Total | $ | 78,224 | 8,752 | 7,222 | $ | 345,894 | $ | 424,118 | ||||||||||||
| Hartford Growth HLS Fund |
Notes to Financial Statements – (continued) June 30, 2010 (Unaudited) |
| (000’s Omitted) |
The Hartford Fundamental Growth HLS Fund had the following unrealized appreciation (depreciation), accumulated net realized losses and capital stock as of April 16, 2010.
| Unrealized | Accumulated Net | |||||||||||||||
| Appreciation | Realized Gains | |||||||||||||||
| Fund | (Depreciation) | (Losses) | Capital Stock | Total | ||||||||||||
| Target Fund | $ | 12,596 | $ | (23,682 | ) | $ | 89,310 | $ | 78,224 | |||||||
Assuming the acquisition had been completed on January 1, 2010, the beginning of the semi-annual reporting period of the Funds, Hartford Growth HLS Fund’s pro forma results of operations for the six-month period ended June 30, 2010, are as follows:
| Net Gain (Loss) on | Net Decrease in Net Assets | |||||||||||
| Fund | Net Investment Income | Investments | Resulting from Operations | |||||||||
| Acquiring Fund | $ | 84 | $ | (41,347 | ) | $ | (41,263 | ) | ||||
Because the combined investment portfolios have been managed as a single integrated portfolio since the acquisition was completed, it is not practical to separate the amounts of revenue and earnings of Hartford Fundamental Growth HLS Fund that have been included in Hartford Growth HLS Fund’s statement of operations since April 16, 2010.
| 8. | Industry Classifications: |
Other than the industry classifications “Other Investment Pools and Funds” and “Exchange Traded Funds”, equity industry classifications used in this report are the Global Industry Classification Standard, which was developed by and is the exclusive property and service mark of MSCI, Inc. and Standard & Poor’s.
[This page is intentionally left blank]
| Hartford Growth HLS Fund |
| - Selected Per-Share Date (A) - - |
| Class | Net Asset Value at Beginning of Period | Net Investment Income (Loss) | Payments from (to) Affiliate | Net Realized and Unrealized Gain (Loss) on Investments | Total from Investment Operations | Dividends from Net Investment Income | Distributions from Realized Capital Gains | Distributions from Capital | Total Distributions | Net Increase (Decrease) in Net Asset Value | Net Asset Value at End of Period | |||||||||||||||||||||||||||||||||
| For the Six-Month Period Ended June 30, 2010 (Unaudited) | ||||||||||||||||||||||||||||||||||||||||||||
| IA | $ | 10.07 | $ | – | $ | – | $ | (1.04 | ) | $ | (1.04 | ) | $ | – | $ | – | $ | – | $ | – | $ | (1.04 | ) | $ | 9.03 | |||||||||||||||||||
| IB | 9.92 | (0.01 | ) | – | (1.03 | ) | (1.04 | ) | – | – | – | – | (1.04 | ) | 8.88 | |||||||||||||||||||||||||||||
| For the Year Ended December 31, 2009 | ||||||||||||||||||||||||||||||||||||||||||||
| IA | 7.53 | 0.04 | – | 2.54 | 2.58 | (0.04 | ) | – | – | (0.04 | ) | 2.54 | 10.07 | |||||||||||||||||||||||||||||||
| IB | 7.42 | 0.02 | – | 2.49 | 2.51 | (0.01 | ) | – | – | (0.01 | ) | 2.50 | 9.92 | |||||||||||||||||||||||||||||||
| For the Year Ended December 31, 2008 | ||||||||||||||||||||||||||||||||||||||||||||
| IA | 13.39 | 0.03 | – | (5.47 | ) | (5.44 | ) | (0.03 | ) | (0.39 | ) | – | (0.42 | ) | (5.86 | ) | 7.53 | |||||||||||||||||||||||||||
| IB | 13.18 | – | – | (5.37 | ) | (5.37 | ) | – | (0.39 | ) | – | (0.39 | ) | (5.76 | ) | 7.42 | ||||||||||||||||||||||||||||
| For the Year Ended December 31, 2007 | ||||||||||||||||||||||||||||||||||||||||||||
| IA | 12.32 | 0.01 | – | 2.01 | 2.02 | – | (0.95 | ) | – | (0.95 | ) | 1.07 | 13.39 | |||||||||||||||||||||||||||||||
| IB | 12.17 | (0.02 | ) | – | 1.98 | 1.96 | – | (0.95 | ) | – | (0.95 | ) | 1.01 | 13.18 | ||||||||||||||||||||||||||||||
| For the Year Ended December 31, 2006 | ||||||||||||||||||||||||||||||||||||||||||||
| IA | 12.54 | 0.01 | 0.01 | 0.56 | 0.58 | (0.01 | ) | (0.79 | ) | – | (0.80 | ) | (0.22 | ) | 12.32 | |||||||||||||||||||||||||||||
| IB | 12.42 | (0.02 | ) | 0.01 | 0.55 | 0.54 | – | (0.79 | ) | – | (0.79 | ) | (0.25 | ) | 12.17 | |||||||||||||||||||||||||||||
| For the Year Ended December 31, 2005 | ||||||||||||||||||||||||||||||||||||||||||||
| IA | 12.47 | 0.01 | 0.01 | 0.53 | 0.55 | – | (0.48 | ) | – | (0.48 | ) | 0.07 | 12.54 | |||||||||||||||||||||||||||||||
| IB | 12.38 | (0.04 | ) | 0.01 | 0.55 | 0.52 | – | (0.48 | ) | – | (0.48 | ) | 0.04 | 12.42 | ||||||||||||||||||||||||||||||
| (A) | Information presented relates to a share outstanding throughout the indicated period. |
| (B) | The figures do not include sales charges or other fees which may be applied at the variable life insurance, variable annuity or qualified retirement plan product level. Any such additional sales charges or other fees would lower the Fund's performance. |
| (C) | Ratios do not reflect reductions for fees paid indirectly. Please see Fees Paid Indirectly in the Notes to Financial Statements. |
| (D) | Portfolio turnover rate is calculated on the basis of the Fund as a whole without distinguishing between the classes of shares issued. |
| (E) | Not annualized. |
| (F) | Annualized. |
| (G) | During the six-month period ended June 30, 2010, the Fund incurred $49.9 million in sales associated with the transition of assets from Hartford Fundamental Growth HLS Fund, which merged into the Fund on April 16, 2010. These sales were excluded from the portfolio turnover calculation. |
| (H) | Total return without the inclusion of the Payment from (to) Affiliate can be found in Expenses in the accompanying Notes to Financial Statements. |
| - Ratios and Supplemental Data - - |
Net Assets at | Ratio of Expenses to Average Net | Ratio of Expenses to Average Net | Ratio of Net Investment Income to | Portfolio | |||||||||||||||||
| Total Return(B) | End of Period | Assets Before Waivers(C) | Assets After Waivers(C) | Average Net Assets | Turnover Rate(D) | ||||||||||||||||
(10.37 | )%(E) | $ | 253,475 | 0.85 | %(F) | 0.85 | %(F) | 0.06 | %(F) | 42 | %(G) | ||||||||||
(10.48 | )(E) | 91,186 | 1.10 | (F) | 1.10 | (F) | (0.19 | )(F) | – | ||||||||||||
34.24 | 242,406 | 0.88 | 0.88 | 0.44 | 85 | ||||||||||||||||
33.90 | 86,556 | 1.13 | 1.13 | 0.20 | – | ||||||||||||||||
(41.79 | ) | 203,993 | 0.84 | 0.84 | 0.27 | 93 | |||||||||||||||
(41.93 | ) | 81,720 | 1.09 | 1.09 | 0.02 | – | |||||||||||||||
16.78 | 388,985 | 0.83 | 0.83 | 0.11 | 101 | ||||||||||||||||
16.49 | 189,987 | 1.08 | 1.08 | (0.14 | ) | – | |||||||||||||||
4.61 | (H) | 379,601 | 0.84 | 0.84 | 0.10 | 95 | |||||||||||||||
4.35 | (H) | 190,063 | 1.09 | 1.09 | (0.14 | ) | – | ||||||||||||||
4.67 | (H) | 345,558 | 0.84 | 0.84 | 0.02 | 76 | |||||||||||||||
4.42 | (H) | 206,105 | 1.09 | 1.09 | (0.23 | ) | – | ||||||||||||||
| Hartford Growth HLS Fund |
The Board of Directors appoints officers who are responsible for the day-to-day operations of the Fund and who execute policies formulated by the Directors. Each director serves until his or her death, resignation, or retirement or until the next annual meeting of shareholders is held or until his or her successor is elected and qualifies.
Directors and officers who are employed by or who have a financial interest in The Hartford are considered “interested” persons of the Fund pursuant to the Investment Company Act of 1940, as amended. Each officer and two of the Company’s directors, as noted in the chart below, are “interested” persons of the Fund. Each director serves as a director for The Hartford Mutual Funds, Inc., The Hartford Mutual Funds II, Inc., The Hartford Income Shares Fund, Inc., Hartford Series Fund, Inc., and Hartford HLS Series Fund II, Inc., which, as of June 30, 2010, collectively consist of 88 funds. Correspondence may be sent to directors and officers c/o Hartford Mutual Funds, P.O. Box 2999, Hartford, Connecticut 06104-2999, except that correspondence to Ms. Fagely may be sent to 500 Bielenberg Drive, Woodbury, Minnesota 55125.
The table below sets forth, for each director and officer, his or her name, year of birth, current position with the Company and date first elected or appointed to Hartford Series Fund, Inc. (“HSF”), and Hartford HLS Series Fund II, Inc. (“HSF2”), principal occupation, and, for directors, other directorships held. The Fund’s statement of additional information contains further information on the directors and is available free of charge by calling 1-800-862-6668 or writing to Hartford HLS Funds, c/o Individual Annuity Services, P.O. Box 5085, Hartford, CT 06102-5085.
Information on the aggregate remuneration paid to the directors of the Company can be found in the Statement of Operations herein. The Fund pays to The Hartford a portion of the chief compliance officer’s compensation, but does not pay salaries or compensation to any of their other officers or directors who are employed by The Hartford.
Non-Interested Directors
Lynn S. Birdsong (1946) Director since 2003, Co-Chairman of the Investment Committee
Mr. Birdsong is a private investor. Since 2003, Mr. Birdsong has been an independent director of The Japan Fund and has served as a Director of the Sovereign High Yield Fund since April 2010. From 2003 to March 2005, Mr. Birdsong was an independent director of the Atlantic Whitehall Funds. From 1979 to 2002, Mr. Birdsong was a managing director of Zurich Scudder Investments, an investment management firm. During his employment with Scudder, Mr. Birdsong was an interested director of The Japan Fund. Since 1981, Mr. Birdsong has been a partner in Birdsong Company, an advertising specialty firm.
Robert M. Gavin, Jr. (1940) Director since 2002 (HSF) and 1986 (HSF2), Chairman of the Board since 2004
Dr. Gavin is an educational consultant. Prior to September 1, 2001, he was President of Cranbrook Education Community and prior to July 1996, he was President of Macalester College, St. Paul, Minnesota.
Duane E. Hill (1945) Director since 2001 (HSF) and 2002 (HSF2), Chairman of the Nominating Committee
Mr. Hill is Partner of TSG Ventures L.P., a private equity investment company. Mr. Hill is a former partner of TSG Capital Group, a private equity investment firm that served as sponsor and lead investor in leveraged buyouts of middle market companies.
Sandra S. Jaffee (1941) Director since 2005
Ms. Jaffee served as Chairman (2008 to 2009) and Chief Executive Officer of Fortent (formerly Searchspace Group), a leading provider of compliance/regulatory technology to financial institutions from August 2005 to August 2009. From August 2004 to August 2005, Ms. Jaffee served as an Entrepreneur in Residence with Warburg Pincus, a private equity firm. From September 1995 to July 2004, Ms. Jaffee served as Executive Vice President at Citigroup, where she was President and Chief Executive Officer of Citibank’s Global Securities Services (1995 to 2003).
William P. Johnston (1944) Director since 2005, Chairman of the Compliance Committee
In June 2006, Mr. Johnston was appointed as Senior Advisor to The Carlyle Group, a global private equity investment firm. In July 2006, Mr. Johnston was elected to the Board of Directors of MultiPlan, Inc. In August 2007, Mr. Johnston was elected to the Board of Directors of LifeCare Holdings, Inc. In February 2008, Mr. Johnston was elected to the Board of Directors of HCR-ManorCare, Inc. In May 2006, Mr. Johnston was elected to the Supervisory Board of Fresenius Medical Care AG & Co. KGaA, after its acquisition of Renal Care Group, Inc. in March 2006. Mr. Johnston joined Renal Care Group in November 2002 as a member of the Board of Directors and served as Chairman of the Board from March 2003 through March 2006. From September 1987 to December 2002, Mr. Johnston was with Equitable Securities Corporation (and its successors, SunTrust Equitable Securities and SunTrust Robinson Humphrey) serving in various investment banking and managerial positions, including Managing Director and Head of Investment Banking, Chief Executive Officer and Vice Chairman.
Phillip O. Peterson (1944) Director since 2002 (HSF) and 2000 (HSF2), Chairman of the Audit Committee
Mr. Peterson is a mutual fund industry consultant. He was a partner of KPMG LLP (an accounting firm) until July 1999. Mr. Peterson joined William Blair Funds in February 2007 as a member of the Board of Trustees. From January 2004 to April 2005, Mr. Peterson served as Independent President of the Strong Mutual Funds.
Lemma W. Senbet (1946) Director since 2005
Dr. Senbet is the William E. Mayer Chair Professor of Finance and Director, Center for Financial Policy, at the University of Maryland, Robert H. Smith School of Business. He was chair of the Finance Department during 1998 to 2006. Previously he was a chaired professor of finance at the University of Wisconsin-Madison. Also, he was director of the Fortis Funds from March 2000 to July 2002. Dr. Senbet served the finance profession in various capacities, including as director of the American Finance Association and President of the Western Finance Association. In 2006, Dr. Senbet was inducted Fellow of Financial Management Association International for his career-long distinguished scholarship and professional service.
Interested Directors and Officers
Lowndes A. Smith (1939) Director since 1996 (HSF) and 2002 (HSF2), Co-Chairman of the Investment Committee
Mr. Smith served as Vice Chairman of The Hartford from February 1997 to January 2002, as President and Chief Executive Officer of Hartford Life, Inc. from February 1997 to January 2002, and as President and Chief Operating Officer of The Hartford Life Insurance Companies from January 1989 to January 2002. Mr. Smith serves as a Director of White Mountains Insurance Group, Ltd., One Beacon Insurance, Symetra Financial and as a Managing Director of Whittington Gray Associates.
John C. Walters 1, 2 (1962) Director since 2008
Mr. Walters currently serves as President, Chief Executive Officer and Director for Hartford Life, Inc. (“HL, Inc.”). Mr. Walters also serves as President, Chairman of the Board, Chief Executive Officer and Director for Hartford Life Insurance Company (“Hartford Life”), and as Executive Vice President of The Hartford. In addition, Mr. Walters is a Manager of HL Investment Advisors, LLC (“HL Advisors”). Mr. Walters previously served as President of the U.S. Wealth Management Division of HL, Inc. (2006-2007) and as Co-Chief Operating Officer of Hartford Life (2007-2008).
| 1 | Mr. Walters previously served as President and Chief Executive Officer (2007 to 2009). |
| 2 | Effective July 31, 2010, Mr. Walters retired from The Hartford. Mr. Walters resigned his position as a Director of the Fund effective July 30, 2010. |
Other Officers
Robert M. Arena, Jr. (1968) President and Chief Executive Officer since 2009 (served as Vice President of the Fund (2006-2009))
Mr. Arena serves as Executive Vice President of Hartford Life. Additionally, Mr. Arena is Senior Vice President and Director of Hartford Administrative Services Company, (“HASCO”), President, Chief Executive Officer and Manager of Hartford Investment Financial Services, LLC (“HIFSCO”) and President, Chief Executive Officer and Manager of HL Advisors. Mr. Arena joined The Hartford in 2004.
Tamara L. Fagely (1958) Vice President, Treasurer and Controller since 2002 (HSF) 1993 (HSF2)
Ms. Fagely has been a Vice President of HASCO since 1998 and Chief Financial Officer since 2006. Currently Ms. Fagely is a Vice President of Hartford Life. She served as Assistant Vice President of Hartford Life from December 2001 through March 2005. In addition, Ms. Fagely is Controller and Chief Financial Officer of HIFSCO.
Brian Ferrell (1962) AML Compliance Officer since 2008
Mr. Ferrell has served as Assistant Vice President and AML Compliance Officer for The Hartford since 2006, and as AML Compliance Officer for HASCO and Hartford Investor Services Company, LLC (“HISC”) since 2008. Prior to joining The Hartford in 2006, Mr. Ferrell held various positions at the U.S. Department of the Treasury (the “Treasury”) from 2001 to 2006, where he served as Chief Counsel for the Treasury’s Financial Crimes Enforcement Network from 2005-2006.
Dr. Robert J. Froehlich (1953) Senior Managing Director since 2009
Dr. Froehlich joined The Hartford as Senior Managing Director in September 2009. Prior to joining The Hartford, Dr. Froehlich served as Vice Chairman of Deutsche Asset Management from 1997-2009.
| Hartford Growth HLS Fund |
| Directors and Officers (Unaudited) – (continued) |
Thomas D. Jones, III (1965) Vice President and Chief Compliance Officer since 2006
Mr. Jones serves as Chief Compliance Officer for the Hartford Mutual Funds and Vice President and Director of Securities Compliance for The Hartford. Mr. Jones joined The Hartford in 2006 from SEI Investments, where he served as Chief Compliance Officer for its mutual funds and investment advisers. Prior to joining SEI, Mr. Jones was First Vice President and Compliance Director for Merrill Lynch Investment Managers (Americas) (“MLIM”), where he worked from 1992-2004.
Edward P. Macdonald (1967) Vice President, Secretary and Chief Legal Officer since 2005
Mr. Macdonald serves as Assistant Vice President of Hartford Life and Chief Legal Officer and Vice President of HIFSCO. He also serves as Vice President and Secretary of HASCO, and Chief Legal Officer, Secretary and Vice President of HL Advisors. Mr. Macdonald joined The Hartford in 2005.
Vernon J. Meyer (1964) Vice President since 2006
Mr. Meyer serves as Senior Vice President of Hartford Life. He also serves as Senior Vice President of HIFSCO and HL Advisors. Mr. Meyer joined The Hartford in 2004.
D. Keith Sloane (1960) Vice President since 2009
Mr. Sloane is a Senior Vice President of Hartford Life. Additionally, Mr. Sloane currently serves as Senior Vice President of HIFSCO, HL Advisors, and HASCO. Prior to joining The Hartford in 2007, Mr. Sloane was Director of product marketing and led the mutual fund business for Wachovia Securities (“Wachovia”) in their investment products group. Mr. Sloane joined Wachovia in 1995.
Jane Wolak (1961) Vice President since 2009
Ms. Wolak currently serves as Vice President of Hartford Life. Ms. Wolak joined Hartford Life as Vice President, Retail Product Services in May 2007. She is also Vice President of HASCO. Previously, Ms. Wolak was with Sun Life Financial where she held the position of Vice President, Service Center Operations from 2001-2007.
A description of the policies and procedures that the Fund uses to determine how to vote proxies relating to portfolio securities and a record of how the Fund voted any proxies for the twelve-month period ended June 30, 2010 is available (1) without charge, upon request, by calling 800-862-6668 and (2) on the Securities and Exchange Commission’s website at http://www.sec.gov.
The Fund files a complete schedule of portfolio holdings with the Commission for the first and third quarters of each fiscal year on Form N-Q. The Fund’s Forms are available (1) without charge, upon request, by calling 800-862-6668 and (2) on the Securities and Exchange Commission’s website at http://www.sec.gov. The Form N-Q may be reviewed and copied at the Commission’s Public Reference Room in Washington, DC. Information on the operation of the Public Reference Room may be obtained by calling 1-800-SEC-0330.
| Hartford Growth HLS Fund |
The following proposals were addressed and approved at a Special Meeting of Shareholders held on February 12, 2010.
Proposal to approve amendments to the Investment Management Agreement between the Fund and HL Investment Advisors, the purpose of which were to combine the administrative services for the Fund with the management services for the Fund under a single agreement.
| Fund | For | Against | Abstain | |||||||||
| Hartford Growth HLS Fund | 26,880,498.747 | 609,731.058 | 868,656.261 | |||||||||
Proposal to elect Lemma Senbet and John Walters, each currently a Director, as Directors of Hartford Series Fund Inc.
Lemma W. Senbet
| Funds | For | Withheld | ||||||
| Hartford Series Fund, Inc. | 5,079,578,022.902 | 241,839,974.106 | ||||||
John C. Walters
| Funds | For | Withheld | ||||||
| Hartford Series Fund, Inc. | 5,081,138,302.186 | 240,279,694.822 | ||||||
| Hartford Growth HLS Fund |
Your Fund's Expenses
As a shareholder of the Fund, you incur two types of costs: (1) transaction costs, including sales charges (loads) on purchase payments and contingent deferred sales charges (CDSC) (2) ongoing costs including management fees; distribution fees; and other fund expenses. This example is intended to help you understand your ongoing costs (in dollars) of investing in the Fund and to compare these costs with the ongoing costs of investing in other mutual funds. The example is based on an investment of $1,000 invested at the beginning of the period and held for the period of December 31, 2009 through June 30, 2010.
Actual Expenses
The first set of columns of the table below provides information about actual account values and actual expenses. You may use the information in this column, together with the amount you invested, to estimate the expenses that you paid over the period. Simply divide your account value by $1,000 (for example, an $8,600 account value divided by $1,000 = 8.6), then multiply the result by the number in the line under the heading entitled "Expenses Paid During Period" to estimate the expenses you paid on your account during this period.
Hypothetical Example for Comparison Purposes
The second set of columns of the table below provides information about hypothetical account values and hypothetical expenses based on the Fund's actual expense ratio and an assumed rate of return of 5% per year before expenses, which is not the Fund's actual return. The hypothetical account values and expenses may not be used to estimate the actual ending account balance or expenses you paid for the period. You may use this information to compare the ongoing costs of investing in the Fund and other funds. To do so, compare this 5% hypothetical example with the 5% hypothetical examples that appear in the shareholder reports of the other funds.
Please note that the expenses shown in the table are meant to highlight your ongoing costs only and do not reflect any transactional costs, such as sales charges (loads) and CDSC. Therefore, the second set of columns of the table is useful in comparing ongoing costs only, and will not help you determine the relative total costs of owning different funds. In addition, if these transactional costs were included, your costs would be higher. Expenses are equal to the Fund's annualized expense ratios multiplied by average account value over the period, multiplied by 181/365 (to reflect the one-half year period).
Actual return | Hypothetical (5% return before expenses) | |||||||||||||||||||||||||||||||||||
Beginning Account Value December 31, 2009 | Ending Account Value June 30, 2010 | Expenses paid during the period December 31, 2009 through June 30, 2010 | Beginning Account Value December 31, 2009 | Ending Account Value June 30, 2010 | Expenses paid during the period December 31, 2009 through June 30, 2010 | Annualized expense ratio | Days in the current 1/2 year | Days in the full year | ||||||||||||||||||||||||||||
| Class IA | $ | 1,000.00 | $ | 896.33 | $ | 4.00 | $ | 1,000.00 | $ | 1,020.58 | $ | 4.26 | 0.85 | % | 181 | 365 | ||||||||||||||||||||
| Class IB | $ | 1,000.00 | $ | 895.23 | $ | 5.17 | $ | 1,000.00 | $ | 1,019.34 | $ | 5.51 | 1.10 | % | 181 | 365 | ||||||||||||||||||||
| Hartford Growth HLS Fund |
The Board approved the annual continuation of the Investment Management Agreement (the “Agreement”) between Hartford Series Fund, Inc. (“HSF”) and HL Investment Advisors, LLC (“HL Advisors”) with respect to the Fund at its meeting on August 4-5, 2009. The Board’s considerations in approving the renewal of the Agreement are disclosed in the December 31, 2009 Annual Report for HSF.
At the November 4-5, 2009 meeting, the Board considered and approved amendments to the Agreement to include administrative services, which had been provided pursuant to a separate agreement, and investment management services under one agreement. The Board, including all of the Independent Directors, approved the amendments to the Agreement with respect to the Fund.
In approving the amendments, in addition to the information presented at the August meeting in connection with the annual review of the Agreement and the additional information provided throughout the year, the Board also considered the fact that the amendments did not result in an overall increase in fees to shareholders. The Board took note of the fact that the management of HL Advisors believes that the proposal to combine the administrative services with the investment management services under a single agreement will produce streamlined fee disclosure, resulting in greater transparency and clarity in the Fund’s prospectuses and financial reports. The Board further noted management's belief that the change would result in consistency across all of the Hartford Funds in the complex in that the funds of HSF are the only funds in the complex (other than the R share classes of the Hartford retail funds) that are subject to a separate administrative services fee. Finally, the Board noted management's view that the proposed changes to the Agreement should also serve to simplify the Board's annual consideration of the investment management arrangements for the Fund in that the investment management and administrative fees would be presented as a single fee for fee comparison purposes, which should facilitate the Board's analysis.
The shareholders of the Fund approved the amendments at a Special Meeting of Shareholders held on February 12, 2010. The amendments were effective as of March 1, 2010.
29
The Hartford
P.O. Box 5085
Hartford, CT 06102–5085
Hartford Series Fund, Inc. is underwritten and distributed by Hartford Securities Distribution Company, Inc.
“The Hartford” is The Hartford Financial Services Group, Inc. and its subsidiaries.
Hartford Series Fund, Inc. inception dates range from 1977 to date. Hartford Series Fund, Inc. is not a subsidiary of The Hartford but is underwritten, distributed by and advised by subsidiaries of The Hartford. Investments in Hartford Series Fund, Inc. are not guaranteed by The Hartford or any other entity.
This material is authorized for distribution only when preceded or accompanied by a current prospectus. The prospectus contains detailed information about the Funds, including investment objectives, risks and charges and expenses. Please read it carefully before you invest or send money.
HLSSAR-G10 Printed in U.S.A ©2010 The Hartford, Hartford, CT 06115 |
| Hartford High Yield HLS Fund |
|
Hartford High Yield HLS Fund
| Manager Discussions (Unaudited) | 2 |
| Financial Statements | |
| 5 | |
| 11 | |
| 12 | |
| 13 | |
| 14 | |
| 15 | |
| 28 | |
| 30 | |
| 32 | |
| 32 | |
| 33 | |
| 34 | |
| 35 |
This report is prepared for the general information of contract owners and qualified retirement plan participants. It is not an offer of contracts or of qualified retirement plans. It should not be used in connection with any offer, except in conjunction with the appropriate prospectus which contains all pertinent information including the applicable sales, administrative and other charges.
The views expressed in the Fund’s Manager Discussion under “Why did the Fund perform this way?” and “What is the outlook?” are views of the Fund’s subadvisers and portfolio management team through the end of the period and is subject to change based on market and other conditions.
Hartford High Yield HLS Fund inception 09/30/1998 |
| (subadvised by Hartford Investment Management Company) |
| Investment objective – Seeks high current income. Growth of capital is a secondary objective. |
Performance Overview(1) 6/30/00 - 6/30/10
Growth of $10,000 investment

Barclays Capital U.S. Corporate High-Yield Bond Index is an unmanaged broad-based market-value-weighted index that tracks the total return performance of non-investment grade, fixed-rate, publicly placed, dollar denominated and nonconvertible debt registered with the SEC.
You cannot invest directly in an index.
The chart represents a hypothetical investment in the Fund. Performance data represents past performance and current performance could be higher or lower.
Average Annual Returns (as of 6/30/10)
| 6 | 1 | 5 | 10 | |||||||||
| Month† | Year | Year | Year | |||||||||
| High Yield IA | 4.96% | 29.82% | 6.56% | 5.84% | ||||||||
| High Yield IB | 4.83% | 29.50% | 6.29% | 5.59% | ||||||||
| Barclays Capital U.S. Corporate | ||||||||||||
| High-Yield Bond Index | 4.51% | 26.65% | 7.15% | 7.31% |
| † | Not Annualized |
PAST PERFORMANCE IS NOT INDICATIVE OF FUTURE RESULTS.
| (1) | Growth of a $10,000 investment in Class IB shares will vary from the results seen on this page due to differences in the expense charged to this share class. |
Performance information may reflect historical or current expense waivers from the investment adviser, without which performance would have been lower. For information on current expense waivers/reimbursements, please see the prospectus.
The value of the contract will fluctuate so that when redeemed, it may be worth more or less than the original investment. The chart and table do not reflect the deduction of taxes that a shareholder would pay on portfolio distributions or the redemption of portfolio shares. The figures do not include sales charges or other fees which may be applied at the variable life insurance, variable annuity or qualified retirement plan product level. Any such additional sales charges or other fees would lower the Fund’s performance.
| Portfolio Managers | |
| James Serhant, CFA | Carlos Feged, CFA |
| Senior Vice President | Senior Vice President |
How did the Fund perform?
The Class IA Shares of the Hartford High Yield HLS Fund returned 4.96% for the six-month period ended June 30, 2010, slightly ahead of its benchmark, the Barclay’s Capital U.S. Corporate High-Yield Bond Index, which returned 4.51%. The Fund outperformed the Lipper High Current Yield VP-UF Funds category, a group of funds with investment strategies similar to those of the Fund, which returned 3.38%.
Why did the Fund perform this way?
Year-to-date through June 2010, security selection has been the primary driver of Fund performance. On average, the Fund has held underweight (i.e. the Fund’s sector position was less than the benchmark position) allocations to a number of the best performing industries within the benchmark, most notably Financials. While from a weighting standpoint we were underweight versus the benchmark in six out of ten of the major industry sectors, our picks within each sector beat the benchmark in seven out of ten of the major industry sector categories.
Key drivers of performance over the period were AIG subsidiary American General Finance, which was up 18.17%, the after-market auto parts supplier United Components, up 17.19%, gaming concern MGM Resorts International up 6.52% and branded apparel manufacturer Quicksilver, Inc., up 15.84%. These securities are all high conviction names that the Fund has been invested in since last year, and that we still believe have upside potential from current levels. As these positions have grown through capital appreciation, we have taken, and will continue to take, profits in these securities, but we may also look to add if there are additional periods of weakness and our investment thesis remains intact.
The most significant drag on performance over the period was our participation in the new issue of Sorenson Communications. Sorenson provides communications services to the hearing impaired. While underwriting this first time High Yield bond issuer, we noted the strong financial profile of the business model that had high margins and strong free cash flow. The primary risk
to this company’s credit profile is that its per-minute charges are subject to review and set by the Federal Communications Commission (FCC) every three years. We factored in a 13.5% reduction in pricing when we underwrote the deal, but misjudged the risk of more draconian measures being taken by the FCC in the current budget constrained environment. The bond traded poorly amidst market volatility in late-January and early-February, but things got worse in May when the FCC sought comment on a new pricing methodology that implied a roughly 40% price reduction, much worse than the 13.5% decline we expected. This prompted another sell off of the bonds. On June 28th, the FCC announced the pricing rate for the 2011 fiscal year that was approximately 18% below the previous fiscal year. While this was worse than our original expectation, it was a measure better than the FCC’s original proposal. We have taken measures to adjust our position in the company and expect to work constructively with the company, other bondholders and the FCC to arrive at an outcome that maximizes value for bondholders.
What is the outlook?
Year-to-date High Yield market performance is on track to meet our beginning of the year expectations of 8%-10%, but the path is not what we expected. Instead of spreads tightening modestly as Treasury yields rose, spreads have actually widened because of a strong rally in Treasury bonds. We view this Treasury rally as a signal of a slower than normal economic recovery, which has put us on heightened alert for defaults. The key driver of negative High Yield returns is defaults. If the market begins to price in significant defaults for 2011 or 2012, we will see further spread widening.
For the moment, we continue to see a low default environment. Indeed, defaults year-to-date for the High Yield market remain very low at just 0.51% of par amount outstanding and 1.1% of issuers. Positive catalysts such as rising stars (bonds being upgraded to Investment Grade from High Yield by the ratings agencies), calls and tenders have dwarfed default figures and have buoyed the market. We expect this trend to continue as companies seek to extend out debt maturities. While we speculate that there may be a few specific defaults on the horizon and that the default rate may tick-up slightly, we do not at this point foresee a wave of defaults anywhere near what we saw in 2009.
With yields so low in other asset classes and defaults appearing to remain well below the historical average of 4%, we continue to see a firm bid to High Yield assets. For now, our return expectation remains 8%-10% for the High Yield market in 2010.
Diversification by Industry
as of June 30, 2010
| Percentage of | ||||
| Industry | Net Assets | |||
| Fixed Income Securities | ||||
| Accommodation and Food Services | 4.3 | % | ||
| Administrative Waste Management and Remediation | 0.6 | |||
| Agriculture, Forestry, Fishing and Hunting | 0.9 | |||
| Air Transportation | 0.7 | |||
| Apparel Manufacturing | 0.5 | |||
| Arts, Entertainment and Recreation | 10.2 | |||
| Chemical Manufacturing | 2.8 | |||
| Computer and Electronic Product Manufacturing | 3.4 | |||
| Construction | 1.0 | |||
| Educational Services | 1.0 | |||
| Fabricated Metal Product Manufacturing | 0.9 | |||
| Finance and Insurance | 14.3 | |||
| Food Manufacturing | 1.2 | |||
| Food Services | 0.4 | |||
| Health Care and Social Assistance | 7.2 | |||
| Information | 14.4 | |||
| Machinery Manufacturing | 0.7 | |||
| Mining | 1.2 | |||
| Miscellaneous Manufacturing | 1.2 | |||
| Motor Vehicle & Parts Manufacturing | 2.4 | |||
| Paper Manufacturing | 1.9 | |||
| Petroleum and Coal Products Manufacturing | 8.2 | |||
| Pipeline Transportation | 0.8 | |||
| Plastics and Rubber Products Manufacturing | 0.5 | |||
| Primary Metal Manufacturing | 0.7 | |||
| Printing and Related Support Activities | 0.4 | |||
| Professional, Scientific and Technical Services | 2.6 | |||
| Real Estate and Rental and Leasing | 1.4 | |||
| Retail Trade | 4.9 | |||
| Textile Product Mills | 0.4 | |||
| Truck Transportation | 1.2 | |||
| Utilities | 3.7 | |||
| Water Transportation | 0.9 | |||
| Wholesale Trade | 1.4 | |||
| Other Securities | ||||
| Food, Beverage & Tobacco | 0.0 | |||
| Long Call Foreign Currency Option Contract | 0.0 | |||
| Long Put Foreign Currency Option Contract | 0.0 | |||
| Software & Services | 0.0 | |||
| Short-Term Investments | 2.8 | |||
| Other Assets and Liabilities | (1.1 | ) | ||
| Total | 100.0 | % | ||
| Diversification by Security Type | ||||
| as of June 30, 2010 | ||||
| Percentage of | ||||
| Category | Net Assets | |||
| Asset & Commercial Mortgage Backed Securities | 0.0 | % | ||
| Call Options Purchased | 0.0 | |||
| Common Stocks | 0.0 | |||
| Corporate Bonds: Non-Investment Grade | 92.5 | |||
| Preferred Stocks | 0.0 | |||
| Put Options Purchased | 0.0 | |||
| Senior Floating Rate Interests: Non-Investment Grade | 5.8 | |||
| Warrants | 0.0 | |||
| Short-Term Investments | 2.8 | |||
| Other Assets and Liabilities | (1.1 | ) | ||
| Total | 100.0 | % | ||
| Distribution by Credit Quality | ||||
| as of June 30, 2010 | ||||
| Percentage of | ||||
| Credit Rating * | Net Assets | |||
| Ba / BB | 15.9 | |||
| B | 50.4 | |||
| Caa / CCC or Lower | 31.0 | |||
| Unrated | 1.0 | |||
| Cash | 2.8 | |||
| Other Assets and Liabilities | (1.1 | ) | ||
| Total | 100.0 | % | ||
| * | Does not apply to the fund itself. Based upon Moody’s and S&P long- term credit ratings for the fund’s holdings as of date noted. If Moody's and S&P assign different ratings to a holding, the lower rating is used. "Unrated" includes fixed-income securities (other than cash-like short- term instruments and U.S. Government securities) for which Moody’s and S&P have not issued long-term credit ratings. “Cash” includes cash- like instruments and other short-term instruments. |
| Hartford High Yield HLS Fund |
June 30, 2010 (Unaudited) |
| (000’s Omitted) |
| Shares or Principal Amount | Market Value ╪ | ||||||
ASSET & COMMERCIAL MORTGAGE BACKED SECURITIES - 0.0% | |||||||
| Finance and Insurance - 0.0% | |||||||
| Soundview NIM Trust | |||||||
| $ | 2,490 | 0.00%, 12/25/2036 ⌂● | $ | – | |||
| Total asset & commercial mortgage backed securities (cost $2,478) | $ | – | |||||
| CORPORATE BONDS: NON-INVESTMENT GRADE - 92.5% | |||||||
| Accommodation and Food Services - 4.3% | |||||||
| Harrah's Operating Co., Inc. | |||||||
| $ | 2,120 | 10.75%, 02/01/2016 | $ | 1,691 | |||
| 2,610 | 11.25%, 06/01/2017 | 2,747 | |||||
| MGM Mirage, Inc. | |||||||
| 11,335 | 11.13%, 11/15/2017 | 12,497 | |||||
| 13,690 | 11.38%, 03/01/2018 ■ | 12,868 | |||||
| 29,803 | |||||||
| Administrative Waste Management and Remediation - 0.6% | |||||||
| Bankrate, Inc. | |||||||
| 1,805 | 11.75%, 07/15/2015 ■☼ | 1,796 | |||||
| West Corp. | |||||||
| 2,760 | 9.50%, 10/15/2014 | 2,774 | |||||
| 4,570 | |||||||
| Agriculture, Forestry, Fishing and Hunting - 0.9% | |||||||
| American Seafood Group LLC | |||||||
| 2,390 | 10.75%, 05/15/2016 ■ | 2,456 | |||||
| 1,465 | 15.00%, 05/15/2017 ■‡ | 1,322 | |||||
| Weyerhaeuser Co. | |||||||
| 2,835 | 7.38%, 03/15/2032 | 2,801 | |||||
| 6,579 | |||||||
| Air Transportation - 0.7% | |||||||
| Continental Airlines, Inc. | |||||||
| 3,051 | 7.37%, 12/15/2015 | 2,868 | |||||
| United Air Lines, Inc. | |||||||
| 1,975 | 9.88%, 08/01/2013 ■ | 2,024 | |||||
| 4,892 | |||||||
| Apparel Manufacturing - 0.5% | |||||||
| Quiksilver, Inc. | |||||||
| 3,850 | 6.88%, 04/15/2015 | 3,499 | |||||
| Arts, Entertainment and Recreation - 8.4% | |||||||
| Cenveo, Inc. | |||||||
| 2,160 | 10.50%, 08/15/2016 ■ | 2,198 | |||||
| Clear Channel Worldwide Holdings, Inc. | |||||||
| 2,740 | 9.25%, 12/15/2017 ■ | 2,754 | |||||
| Downstream Development Authority | |||||||
| 2,200 | 12.00%, 10/15/2015 ■ | 2,068 | |||||
| Equinix, Inc. | |||||||
| 2,685 | 8.13%, 03/01/2018 | 2,745 | |||||
| FireKeepers Development Authority | |||||||
| 6,635 | 13.88%, 05/01/2015 ■ | 7,664 | |||||
| First Data Corp. | |||||||
| 11,012 | 10.55%, 09/24/2015 | 8,067 | |||||
| Knight Ridder, Inc. | |||||||
| 7,460 | 5.75%, 09/01/2017 | 4,588 | |||||
| 6,125 | 6.88%, 03/15/2029 | 3,369 | |||||
| Marquee Holdings, Inc. | |||||||
| 2,985 | 9.51%, 08/15/2014 | 2,455 | |||||
| McClatchy Co. | |||||||
| 3,305 | 11.50%, 02/15/2017 ■ | 3,354 | |||||
| Sinclair Broadcasting Group, Inc. | |||||||
| 2,959 | 6.00%, 09/15/2012 ۞ | 2,744 | |||||
| Sirius Satellite Radio, Inc. | |||||||
| 1,450 | 7.00%, 12/01/2014 ۞■ | 1,374 | |||||
| TL Acquisitions, Inc. | |||||||
| 3,815 | 13.25%, 07/15/2015 ■ | 3,548 | |||||
| UPC Germany GMBH | |||||||
| 2,895 | 8.13%, 12/01/2017 ■ | 2,837 | |||||
| Virgin Media Finance plc | |||||||
| 2,855 | 9.50%, 08/15/2016 | 3,016 | |||||
| XM Satellite Radio, Inc. | |||||||
| 5,235 | 13.00%, 08/01/2013 ■ | 5,719 | |||||
| 58,500 | |||||||
| Chemical Manufacturing - 2.4% | |||||||
| Eastman Kodak Co. | |||||||
| 2,805 | 9.75%, 03/01/2018 ■ | 2,763 | |||||
| Huntsman International LLC | |||||||
| 3,910 | 5.50%, 06/30/2016 ■ | 3,421 | |||||
| JohnsonDiversey Holdings, Inc. | |||||||
| 1,995 | 8.25%, 11/15/2019 ■ | 2,055 | |||||
| Lyondell Chemical Co. | |||||||
| 5,850 | 11.00%, 05/01/2018 | 6,274 | |||||
| Nalco Co. | |||||||
| 2,075 | 8.88%, 11/15/2013 | 2,127 | |||||
| 16,640 | |||||||
| Computer and Electronic Product Manufacturing - 3.4% | |||||||
| Advanced Micro Devices, Inc. | |||||||
| 2,885 | 8.13%, 12/15/2017 ■‡ | 2,871 | |||||
| Magnachip Semiconductor | |||||||
| 2,715 | 10.50%, 04/15/2018 ■ | 2,762 | |||||
| Nextel Communications, Inc. | |||||||
| 2,140 | 7.38%, 08/01/2015 | 2,033 | |||||
| Seagate Technology International | |||||||
| 4,305 | 10.00%, 05/01/2014 ■ | 4,908 | |||||
| Sorenson Communications | |||||||
| 6,425 | 10.50%, 02/01/2015 ■ | 4,048 | |||||
| Stratus Technologies, Inc. | |||||||
| 2,575 | 12.00%, 03/29/2015 ■ | 2,243 | |||||
| Triumph Group, Inc. | |||||||
| 2,760 | 8.63%, 07/15/2018 ■ | 2,815 | |||||
| Viasystems, Inc. | |||||||
| 2,150 | 12.00%, 01/15/2015 ■ | 2,322 | |||||
| 24,002 | |||||||
| Construction - 1.0% | |||||||
| D.R. Horton, Inc. | |||||||
| 2,130 | 6.50%, 04/15/2016 | 2,055 | |||||
| KB Home & Broad Home Corp. | |||||||
| 2,325 | 6.25%, 06/15/2015 | 2,069 | |||||
| Pulte Homes, Inc. | |||||||
| 3,150 | 7.88%, 06/15/2032 | 2,733 | |||||
| 6,857 | |||||||
| Educational Services - 1.0% | |||||||
| Laureate Education, Inc. | |||||||
| 2,355 | 10.00%, 08/15/2015 ■ | 2,343 | |||||
The accompanying notes are an integral part of these financial statements.
| Hartford High Yield HLS Fund |
Schedule of Investments – (continued) June 30, 2010 (Unaudited) |
| (000’s Omitted) |
| Shares or Principal Amount | Market Value ╪ | ||||||
CORPORATE BONDS: NON-INVESTMENT GRADE - 92.5% - (continued) | |||||||
| Educational Services - 1.0% - (continued) | |||||||
| Viant Holdings, Inc. | |||||||
| $ | 4,379 | 10.13%, 07/15/2017 ■ | $ | 4,461 | |||
| 6,804 | |||||||
| Fabricated Metal Product Manufacturing - 0.9% | |||||||
| BWAY Holding Co. | |||||||
| 1,725 | 10.00%, 06/15/2018 ■ | 1,799 | |||||
| Crown Americas, Inc. | |||||||
| 2,380 | 7.63%, 05/15/2017 ■ | 2,463 | |||||
| Hillman Group, Inc. | |||||||
| 2,035 | 10.88%, 06/01/2018 ■ | 2,096 | |||||
| 6,358 | |||||||
| Finance and Insurance - 13.6% | |||||||
| American General Finance Corp. | |||||||
| 29,068 | 6.90%, 12/15/2017 | 23,145 | |||||
| Bank of America Capital II | |||||||
| 5,140 | 8.00%, 12/15/2026 | 4,986 | |||||
| CB Richard Ellis Service | |||||||
| 2,535 | 11.63%, 06/15/2017 | 2,839 | |||||
| CIT Group, Inc. | |||||||
| 28,365 | 7.00%, 05/01/2017 | 25,528 | |||||
| Ford Motor Credit Co. | |||||||
| 7,850 | 12.00%, 05/15/2015 | 9,087 | |||||
| GMAC LLC | |||||||
| 4,100 | 7.00%, 02/01/2012 | 4,126 | |||||
| 3,655 | 8.00%, 11/01/2031 | 3,372 | |||||
| Host Hotels & Resorts L.P. | |||||||
| 2,865 | 9.00%, 05/15/2017 | 3,066 | |||||
| Hub International Holdings, Inc. | |||||||
| 3,060 | 9.00%, 12/15/2014 ■ | 2,899 | |||||
| Icahn Enterprises L.P. | |||||||
| 3,525 | 7.75%, 01/15/2016 ■ | 3,428 | |||||
| LBI Escrow Corp. | |||||||
| 1,730 | 8.00%, 11/01/2017 ■ | 1,782 | |||||
| Leucadia National Corp. | |||||||
| 2,850 | 7.13%, 03/15/2017 | 2,750 | |||||
| Liberty Mutual Group, Inc. | |||||||
| 3,555 | 10.75%, 06/15/2058 ■ | 3,839 | |||||
| Provident Funding Associates | |||||||
| 3,460 | 10.25%, 04/15/2017 ■ | 3,495 | |||||
| Reynolds Group Issuer, Inc. | |||||||
| 965 | 8.50%, 05/15/2018 ■ | 947 | |||||
| 95,289 | |||||||
| Food Manufacturing - 1.2% | |||||||
| Dole Food Co., Inc. | |||||||
| 4,319 | 13.88%, 03/15/2014 | 5,064 | |||||
| Smithfield Foods, Inc. | |||||||
| 3,065 | 10.00%, 07/15/2014 ■ | 3,394 | |||||
| 8,458 | |||||||
| Food Services - 0.4% | |||||||
| Landry's Restaurants, Inc. | |||||||
| 2,675 | 11.63%, 12/01/2015 | 2,769 | |||||
| Health Care and Social Assistance - 6.9% | |||||||
| Biomet, Inc. | |||||||
| 2,620 | 10.38%, 10/15/2017 | 2,816 | |||||
| HCA, Inc. | |||||||
| 7,360 | 7.50%, 11/15/2095 | 5,483 | |||||
| 1,470 | 8.36%, 04/15/2024 | 1,367 | |||||
| 2,620 | 8.50%, 04/15/2019 | 2,778 | |||||
| 7,235 | 9.25%, 11/15/2016 | 7,669 | |||||
| HealthSouth Corp. | |||||||
| 2,615 | 10.75%, 06/15/2016 | 2,824 | |||||
| IASIS Healthcare Capital Corp. | |||||||
| 3,365 | 8.75%, 06/15/2014 ‡ | 3,348 | |||||
| Inverness Medical Innovation, Inc. | |||||||
| 2,775 | 9.00%, 05/15/2016 | 2,782 | |||||
| Multiplan Corp. | |||||||
| 3,230 | 10.38%, 04/15/2016 ■ | 3,311 | |||||
| Rite Aid Corp. | |||||||
| 10,415 | 7.70%, 02/15/2027 | 5,859 | |||||
| 3,420 | 10.25%, 10/15/2019 | 3,407 | |||||
| Select Medical Corp. | |||||||
| 3,700 | 7.63%, 02/01/2015 | 3,478 | |||||
| Valeant Pharmaceuticals | |||||||
| 2,760 | 7.63%, 03/15/2020 ■ | 3,257 | |||||
| 48,379 | |||||||
| Information - 12.6% | |||||||
| Charter Communications Holdings II LLC | |||||||
| 3,680 | 13.50%, 11/30/2016 | 4,287 | |||||
| Charter Communications Operating LLC | |||||||
| 4,945 | 10.88%, 09/15/2014 ■ | 5,489 | |||||
| Citizens Communications Co. | |||||||
| 8,575 | 7.88%, 01/15/2027 | 7,739 | |||||
| Clearwire Corp. | |||||||
| 2,825 | 12.00%, 12/01/2015 ■ | 2,800 | |||||
| CSC Holdings, Inc. | |||||||
| 2,945 | 8.50%, 04/15/2014 ■ | 3,070 | |||||
| GXS Worldwide, Inc. | |||||||
| 2,955 | 9.75%, 06/15/2015 ■ | 2,822 | |||||
| Intelsat Bermuda Ltd. | |||||||
| 2,635 | 11.50%, 02/04/2017 | 2,629 | |||||
| Intelsat Intermediate Holdings Ltd. | |||||||
| 7,655 | 9.50%, 02/01/2015 | 7,789 | |||||
| Intelsat Jackson Holdings Ltd. | |||||||
| 8,940 | 11.50%, 06/15/2016 | 9,476 | |||||
| Level 3 Financing, Inc. | |||||||
| 8,995 | 10.00%, 02/01/2018 ■ | 7,960 | |||||
| MetroPCS Wireless, Inc. | |||||||
| 2,645 | 9.25%, 11/01/2014 | 2,724 | |||||
| New Communications Holdings | |||||||
| 2,775 | 8.25%, 04/15/2017 ■ | 2,786 | |||||
| Qwest Corp. | |||||||
| 3,010 | 7.25%, 10/15/2035 | 2,762 | |||||
| Sprint Capital Corp. | |||||||
| 8,560 | 8.38%, 03/15/2012 | 8,977 | |||||
| 5,025 | 8.75%, 03/15/2032 | 4,799 | |||||
| Videotron Ltee | |||||||
| 3,356 | 9.13%, 04/15/2018 | 3,641 | |||||
| Wind Acquisition Finance S.A. | |||||||
| 2,910 | 11.75%, 07/15/2017 ■ | 2,983 | |||||
| 1,938 | 12.00%, 12/01/2015 ■ | 2,006 | |||||
The accompanying notes are an integral part of these financial statements.
| Shares or Principal Amount | Market Value ╪ | ||||||
CORPORATE BONDS: NON-INVESTMENT GRADE - 92.5% - (continued) | |||||||
| Information - 12.6% - (continued) | |||||||
| Windstream Corp. | |||||||
| $ | 3,390 | 8.63%, 08/01/2016 | $ | 3,416 | |||
| 88,155 | |||||||
| Machinery Manufacturing - 0.7% | |||||||
| Case New Holland, Inc. | |||||||
| 2,175 | 7.75%, 09/01/2013 | 2,224 | |||||
| Goodman Global, Inc. | |||||||
| 2,470 | 13.50%, 02/15/2016 | 2,717 | |||||
| 4,941 | |||||||
| Mining - 1.2% | |||||||
| Consol Energy, Inc. | |||||||
| 2,670 | 8.00%, 04/01/2017 ■ | 2,757 | |||||
| International Coal Group, Inc. | |||||||
| 2,685 | 9.13%, 04/01/2018 | 2,685 | |||||
| James River Coal Co. | |||||||
| 2,835 | 9.38%, 06/01/2012 | 2,870 | |||||
| 8,312 | |||||||
| Miscellaneous Manufacturing - 1.2% | |||||||
| Easton-Bell Sports, Inc. | |||||||
| 2,705 | 9.75%, 12/01/2016 ■ | 2,800 | |||||
| Reddy Ice Corp. | |||||||
| 2,295 | 11.25%, 03/15/2015 ■ | 2,364 | |||||
| Transdigm, Inc. | |||||||
| 3,430 | 7.75%, 07/15/2014 ■ | 3,430 | |||||
| 8,594 | |||||||
| Motor Vehicle & Parts Manufacturing - 2.4% | |||||||
| Cooper-Standard Automotive, Inc. | |||||||
| 3,125 | 8.50%, 05/01/2018 ■ | 3,149 | |||||
| ESCO Corp. | |||||||
| 2,830 | 8.63%, 12/15/2013 ■ | 2,809 | |||||
| Ford Motor Co. | |||||||
| 4,730 | 9.22%, 09/15/2021 | 4,706 | |||||
| UCI Holdco, Inc. | |||||||
| 6,558 | 8.54%, 12/15/2013 Δ | 6,361 | |||||
| 17,025 | |||||||
| Paper Manufacturing - 1.9% | |||||||
| Appleton Papers, Inc. | |||||||
| 3,173 | 11.25%, 12/15/2015 ■ | 2,697 | |||||
| Domtar Corp. | |||||||
| 2,900 | 10.75%, 06/01/2017 | 3,480 | |||||
| Georgia-Pacific LLC | |||||||
| 3,975 | 8.25%, 05/01/2016 ■ | 4,239 | |||||
| Westvaco Corp. | |||||||
| 2,486 | 8.20%, 01/15/2030 | 2,623 | |||||
| 13,039 | |||||||
| Petroleum and Coal Products Manufacturing - 7.9% | |||||||
| Alon Refinancing Krotz Springs, Inc. | |||||||
| 2,840 | 13.50%, 10/15/2014 | 2,741 | |||||
| Bill Barrett Corp. | |||||||
| 2,590 | 9.88%, 07/15/2016 | 2,745 | |||||
| Chesapeake Energy Corp. | |||||||
| 4,325 | 9.50%, 02/15/2015 | 4,779 | |||||
| Crosstex Energy, Inc. | |||||||
| 2,790 | 8.88%, 02/15/2018 | 2,787 | |||||
| Denbury Resources, Inc. | |||||||
| 2,530 | 9.75%, 03/01/2016 | 2,733 | |||||
| Drummond Co., Inc. | |||||||
| 2,735 | 9.00%, 10/15/2014 ■ | 2,749 | |||||
| Ferrellgas Partners L.P. | |||||||
| 1,980 | 9.13%, 10/01/2017 ■ | 2,064 | |||||
| Gibson Energy | |||||||
| 2,055 | 10.00%, 01/15/2018 | 1,952 | |||||
| Headwaters, Inc. | |||||||
| 2,675 | 11.38%, 11/01/2014 | 2,702 | |||||
| Key Energy Services, Inc. | |||||||
| 2,835 | 8.38%, 12/01/2014 | 2,817 | |||||
| Linn Energy LLC | |||||||
| 3,775 | 11.75%, 05/15/2017 | 4,285 | |||||
| Opti Canada, Inc. | |||||||
| 1,385 | 8.25%, 12/15/2014 | 1,205 | |||||
| 680 | 9.00%, 12/15/2012 ■ | 687 | |||||
| Petrohawk Energy Corp. | |||||||
| 2,945 | 9.13%, 07/15/2013 | 3,070 | |||||
| Plains Exploration & Production Co. | |||||||
| 3,975 | 10.00%, 03/01/2016 | 4,253 | |||||
| Rosetta Resources, Inc. | |||||||
| 2,775 | 9.50%, 04/15/2018 ■ | 2,761 | |||||
| Sandridge Energy, Inc. | |||||||
| 2,890 | 8.63%, 04/01/2015 | 2,807 | |||||
| Star Gas Partners L.P. | |||||||
| 1,233 | 10.25%, 02/15/2013 | 1,242 | |||||
| Targa Resources Partners | |||||||
| 2,790 | 11.25%, 07/15/2017 ■ | 3,055 | |||||
| Western Refining, Inc. | |||||||
| 3,915 | 11.25%, 06/15/2017 ■‡ | 3,562 | |||||
| 54,996 | |||||||
| Pipeline Transportation - 0.8% | |||||||
| Dynegy Holdings, Inc. | |||||||
| 3,900 | 7.75%, 06/01/2019 | 2,696 | |||||
| El Paso Corp. | |||||||
| 3,165 | 7.80%, 08/01/2031 | 3,128 | |||||
| 5,824 | |||||||
| Plastics and Rubber Products Manufacturing - 0.5% | |||||||
| Plastipak Holdings, Inc. | |||||||
| 2,170 | 10.63%, 08/15/2019 ■ | 2,409 | |||||
| Solo Cup Co. | |||||||
| 1,510 | 8.50%, 02/15/2014 | 1,355 | |||||
| 3,764 | |||||||
| Primary Metal Manufacturing - 0.7% | |||||||
| Novelis, Inc. | |||||||
| 2,525 | 11.50%, 02/15/2015 | 2,639 | |||||
| Steel Dynamics, Inc. | |||||||
| 2,040 | 7.75%, 04/15/2016 | 2,050 | |||||
| 4,689 | |||||||
| Printing and Related Support Activities - 0.4% | |||||||
| Harland Clarke Holdings | |||||||
| 3,090 | 9.50%, 05/15/2015 | 2,812 | |||||
| Professional, Scientific and Technical Services - 2.6% | |||||||
| Affinion Group, Inc. | |||||||
| 2,670 | 10.13%, 10/15/2013 | 2,737 | |||||
| 11,870 | 11.50%, 10/15/2015 | 12,463 | |||||
| Global Geopysical Services, Inc. | |||||||
| 2,870 | 10.50%, 05/01/2017 ■ | 2,755 | |||||
| 17,955 | |||||||
The accompanying notes are an integral part of these financial statements.
| Hartford High Yield HLS Fund |
Schedule of Investments – (continued) June 30, 2010 (Unaudited) |
| (000’s Omitted) |
| Shares or Principal Amount | Market Value ╪ | ||||||
CORPORATE BONDS: NON-INVESTMENT GRADE - 92.5% - (continued) | |||||||
| Real Estate and Rental and Leasing - 1.4% | |||||||
| Ashtead Capital, Inc. | |||||||
| $ | 3,495 | 9.00%, 08/15/2016 ■ | $ | 3,425 | |||
| Hertz Corp. | |||||||
| 1,685 | 8.88%, 01/01/2014 | 1,706 | |||||
| Maxim Crane Works L.P. | |||||||
| 2,805 | 12.25%, 04/15/2015 ■ | 2,745 | |||||
| Realogy Corp. | |||||||
| 2,008 | 11.75%, 04/15/2014 | 1,677 | |||||
| 9,553 | |||||||
| Retail Trade - 4.9% | |||||||
| Building Materials Corp. | |||||||
| 2,835 | 7.50%, 03/15/2020 ■ | 2,785 | |||||
| Dollar General Corp. | |||||||
| 6,489 | 11.88%, 07/15/2017 | 7,373 | |||||
| Great Atlantic & Pacific Tea Co., Inc. | |||||||
| 1,460 | 11.38%, 08/01/2015 ■ | 1,216 | |||||
| J.C. Penney Co., Inc. | |||||||
| 2,820 | 7.63%, 03/01/2097 | 2,623 | |||||
| Macys, Inc. | |||||||
| 2,895 | 6.90%, 04/01/2029 | 2,786 | |||||
| Michaels Stores, Inc. | |||||||
| 4,275 | 11.38%, 11/01/2016 | 4,446 | |||||
| Nebraska Book Co. | |||||||
| 4,230 | 10.00%, 12/01/2011 | 4,230 | |||||
| Supervalu, Inc. | |||||||
| 3,870 | 8.00%, 05/01/2016 | 3,831 | |||||
| United Components, Inc. | |||||||
| 2,105 | 9.38%, 06/15/2013 | 2,115 | |||||
| Yankee Acquisition Corp. | |||||||
| 3,080 | 8.50%, 02/15/2015 | 3,115 | |||||
| 34,520 | |||||||
| Textile Product Mills - 0.4% | |||||||
| Interface, Inc. | |||||||
| 2,440 | 11.38%, 11/01/2013 | 2,733 | |||||
| Truck Transportation - 0.7% | |||||||
| Swift Transportation Co., Inc. | |||||||
| 5,080 | 12.50%, 05/15/2017 ■ | 4,801 | |||||
| Utilities - 3.7% | |||||||
| AES Corp. | |||||||
| 2,595 | 9.75%, 04/15/2016 ■‡ | 2,790 | |||||
| Calpine Corp. | |||||||
| 3,680 | 7.25%, 10/15/2017 ■ | 3,533 | |||||
| Edison Mission Energy | |||||||
| 5,235 | 7.00%, 05/15/2017 | 3,350 | |||||
| Energy Future Holdings Corp. | |||||||
| 7,665 | 11.25%, 11/01/2017 | 4,982 | |||||
| Mirant North America LLC | |||||||
| 2,020 | 7.38%, 12/31/2013 | 2,065 | |||||
| NRG Energy, Inc. | |||||||
| 6,305 | 8.50%, 06/15/2019 | 6,407 | |||||
| Reliant Energy, Inc. | |||||||
| 2,634 | 9.24%, 07/02/2017 | 2,740 | |||||
| 25,867 | |||||||
| Water Transportation - 0.9% | |||||||
| Royal Caribbean Cruises Ltd. | |||||||
| 2,915 | 11.88%, 07/15/2015 | 3,352 | |||||
| Ship Finance International Ltd. | |||||||
| 2,875 | 8.50%, 12/15/2013 | 2,832 | |||||
| 6,184 | |||||||
| Wholesale Trade – 1.4% | |||||||
| McJunkin Red Man Corp. | |||||||
| 3,060 | 9.50%, 12/15/2016 ■ | 2,968 | |||||
| Michael Foods, Inc. | |||||||
| 1,350 | 9.75%, 07/15/2018 ■ | 1,387 | |||||
| Spectrum Brands, Inc. | |||||||
| 1,305 | 9.50%, 06/15/2018 ■ | 1,346 | |||||
| 3,545 | 12.00%, 08/28/2019 | 3,864 | |||||
| 9,565 | |||||||
| Total corporate bonds: non-investment grade (cost $625,041) | $ | 646,728 | |||||
SENIOR FLOATING RATE INTERESTS: NON-INVESTMENT GRADE♦ - 5.8% | |||||||
| Arts, Entertainment and Recreation - 1.8% | |||||||
| AMC Entertainment Holdings, Inc. | |||||||
| $ | 6,389 | 5.54%, 06/13/2012 ± | $ | 5,878 | |||
| Canwest MediaWorks L.P. | |||||||
| 2,760 | 7.00%, 06/05/2016 ◊☼ | 2,686 | |||||
| Chester Downs and Marina LLC | |||||||
| 1,346 | 12.38%, 07/31/2016 ± | 1,338 | |||||
| Six Flags, Inc. | |||||||
| 2,769 | 9.25%, 12/31/2016 ±☼ | 2,764 | |||||
| 12,666 | |||||||
| Chemical Manufacturing - 0.4% | |||||||
| Ineos Group | |||||||
| 1,368 | 7.50%, 12/16/2013 ◊☼ | 1,310 | |||||
| 1,554 | 8.00%, 12/16/2014 ◊☼ | 1,488 | |||||
| 2,798 | |||||||
| Finance and Insurance - 0.7% | |||||||
| Nuveen Investments, Inc. | |||||||
| 4,848 | 12.50%, 07/31/2015 ±☼ | 5,032 | |||||
| Health Care and Social Assistance - 0.3% | |||||||
| IASIS Healthcare Capital Corp. | |||||||
| 2,554 | 5.59%, 06/13/2014 ± | 2,273 | |||||
| Information – 1.8% | |||||||
| Level 3 Communications Corp. | |||||||
| 7,372 | 11.50%, 03/13/2014 ± | 7,906 | |||||
| WideOpenWest Finance LLC | |||||||
| 5,326 | 6.61%, 06/29/2015 ± | 4,646 | |||||
| 12,552 | |||||||
| Petroleum and Coal Products Manufacturing - 0.3% | |||||||
| Turbo Beta Ltd. | |||||||
| 2,586 | 14.50%, 03/12/2018 ±⌂ | 2,082 | |||||
| Truck Transportation - 0.5% | |||||||
| Swift Transportation Co., Inc. | |||||||
| 3,725 | 8.25%, 05/10/2014 ± | 3,441 | |||||
| Total senior floating rate interests: non-investment grade (cost $41,328) | $ | 40,844 | |||||
The accompanying notes are an integral part of these financial statements.
| Contracts | Market Value ╪ | |||||
| CALL OPTIONS PURCHASED - 0.0% | ||||||
| Long Call Foreign Currency Option Contract - 0.0% | ||||||
| AUD/USD/MXN Binary | ||||||
| 810 | Expiration: December, 2010 и | $ | 23 | |||
| Total call options purchased (cost $81) | $ | 23 | ||||
| Contracts | Market Value ╪ | |||||
| PUT OPTIONS PURCHASED - 0.0% | ||||||
| Long Put Foreign Currency Option Contract - 0.0% | ||||||
| AUD/MXN Currency Swap | ||||||
| 9,240 | Expiration: December, 2010, Exercise Price: | |||||
| $10.50 | $ | 175 | ||||
| Total put options purchased (cost $179) | $ | 175 | ||||
| Shares or Principal Amount | Market Value ╪ | |||||
| COMMON STOCKS - 0.0% | ||||||
| Software & Services - 0.0% | ||||||
| 43 | Stratus Technologies, Inc. † | $ | – | |||
| Total common stocks (cost $–) | $ | – | ||||
| PREFERRED STOCKS - 0.0% | ||||||
| Software & Services - 0.0% | ||||||
| 10 | Stratus Technologies, Inc. † | $ | – | |||
| Total preferred stocks (cost $–) | $ | – | ||||
| WARRANTS - 0.0% | ||||||
| Food, Beverage & Tobacco - 0.0% | ||||||
| 1 | ASG ■ | $ | 111 | |||
| Total warrants (cost $–) | $ | 111 | ||||
| Total long-term investments (cost $669,107) | $ | 687,881 | ||||
| Shares or Principal Amount | Market Value ╪ | ||||||||||
| SHORT-TERM INVESTMENTS - 2.8% | |||||||||||
| Investment Pools and Funds - 2.8% | |||||||||||
| 19,335 | JP Morgan U.S. Government Money Market Fund | $ | 19,335 | ||||||||
| – | State Street Bank U.S. Government Money Market Fund | – | |||||||||
| 19,335 | |||||||||||
| Total short-term investments (cost $19,335) | $ | 19,335 | |||||||||
| Total investments (cost $688,442) ▲ | 101.1 | % | $ | 707,216 | |||||||
| Other assets and liabilities | (1.1 | )% | (7,740 | ) | |||||||
| Total net assets | 100.0 | % | $ | 699,476 | |||||||
| Note: | Percentage of investments as shown is the ratio of the total market value to total net assets. Market value of investments in foreign securities represents 4.1% of total net assets at June 30, 2010. |
| ▲ | At June 30, 2010, the cost of securities for federal income tax purposes was $690,253 and the aggregate gross unrealized appreciation and depreciation based on that cost were: |
| Unrealized Appreciation | $ | 28,771 | ||
| Unrealized Depreciation | (11,808 | ) | ||
| Net Unrealized Appreciation | $ | 16,963 |
| † | The aggregate value of securities valued in good faith at fair value as determined under policies and procedures established by and under the supervision of the Fund's Board of Directors at June 30, 2010, was $–, which represents –% of total net assets. |
| ● | Currently non-income producing. For long-term debt securities, items identified are in default as to payment of interest and/or principal. |
| ‡ | This security, or a portion of this security, has been segregated to cover funding requirements on investment transactions settling in the future. |
| Δ | Variable rate securities; the rate reported is the coupon rate in effect at June 30, 2010. |
| ■ | Securities issued within terms of a private placement memorandum, exempt from registration under Rule 144A under the Securities Act of 1933, as amended, and may be sold only to qualified institutional buyers. Pursuant to guidelines adopted by the Board of Directors, these issues are determined to be liquid. The aggregate value of these securities at June 30, 2010, was $223,014, which represents 31.88% of total net assets. |
| ۞ | Convertible security. |
| ☼ | The cost of securities purchased on a when-issued, delayed delivery or delayed draw basis at June 30, 2010 was $9,490. |
| ± | The interest rate disclosed for these securities represents the average coupon as of June 30, 2010. |
The accompanying notes are an integral part of these financial statements.
| Hartford High Yield HLS Fund |
Schedule of Investments – (continued) June 30, 2010 (Unaudited) |
| (000’s Omitted) |
| ◊ | The interest rate disclosed for these securities represents an estimated average coupon as of June 30, 2010. |
| ♦ | Senior loans in which the Fund invests generally pay interest rates which are periodically adjusted by reference to a base short-term, floating lending rate plus a premium. These base lending rates are generally (i) the lending rate offered by one or more major European banks, such as the London Inter-Bank Offered Rate (LIBOR), (ii) the prime rate offered by one or more major United States Banks, or (iii) the bank's certificate of deposit rate. Senior floating rate interests often require prepayments from excess cash flows or permit the borrower to repay at its election. The rate at which the borrower repays cannot be predicted with accuracy. As a result, the actual remaining maturity may be substantially less than the stated maturities shown. |
| и | This security has exercise limitations. It can only be exercised on expiration date, provided that two conditions are met: the Australian Dollar exchange rate is less than 0.805 and the Mexican Peso exchange rate is less than 12.55. If these conditions are not met, the option can not be exercised and premium paid is forfeited. |
| ⌂ | The following securities are considered illiquid. Illiquid securities are often purchased in private placement transactions, are often not registered under the Securities Act of 1933 and may have contractual restrictions on resale. A security may also be considered illiquid if the security lacks a readily available market or if its valuation has not changed for a certain period of time. |
| Period | Shares/ | ||||||||
| Acquired | Par | Security | Cost Basis | ||||||
| 02/2007 | $ | 2,490 | Soundview NIM Trust, 0.00%, | ||||||
| 12/25/2036 - 144A | $ | 2,478 | |||||||
| 06/2008 - | $ | 2,586 | Turbo Beta Ltd., 14.50%, | ||||||
| 05/2010 | 03/12/2018 | 2,586 | |||||||
The aggregate value of these securities at June 30, 2010 was $2,082 which represents 0.30% of total net assets.
| ╪ | See Significant Accounting Policies of accompanying Notes to Financial Statements regarding valuation of securities. |
The accompanying notes are an integral part of these financial statements.
| Hartford High Yield HLS Fund |
June 30, 2010 (Unaudited) |
| (000’s Omitted) |
| Total | Level 1♦ | Level 2♦ | Level 3 | |||||||||||||
| Assets: | ||||||||||||||||
| Asset & Commercial Mortgage Backed Securities | $ | – | $ | – | $ | – | $ | – | ||||||||
| Call Options Purchased | 23 | – | – | 23 | ||||||||||||
| Common Stocks ‡ | – | – | – | – | ||||||||||||
| Corporate Bonds: Non-Investment Grade | 646,728 | – | 634,841 | 11,887 | ||||||||||||
| Preferred Stocks | – | – | – | – | ||||||||||||
| Put Options Purchased | 175 | 175 | – | – | ||||||||||||
| Senior Floating Rate Interests: Non-Investment Grade | 40,844 | – | 40,844 | – | ||||||||||||
| Warrants | 111 | 111 | – | – | ||||||||||||
| Short-Term Investments | 19,335 | 19,335 | – | – | ||||||||||||
| Total | $ | 707,216 | $ | 19,621 | $ | 675,685 | $ | 11,910 | ||||||||
♦ For the period ended June 30, 2010, there were no significant transfers between Level 1 and Level 2.
† The Fund has all or primarily all of these equity securities categorized in a single level. Refer to the Schedule of Investments for further industry breakout.
Following is a reconciliation of Level 3 assets for which significant unobservable inputs were used to determine fair value:
| Balance as | Change in | |||||||||||||||||||||||||||||||||||
| of | Realized | Unrealized | Transfers | Transfers | Balance as | |||||||||||||||||||||||||||||||
| December | Gain | Appreciation | Net | Into | Out of | of June | ||||||||||||||||||||||||||||||
31, 2009 | (Loss) | (Depreciation) | Amortization | Purchases | Sales | Level 3 * | Level 3* | 30, 2010 | ||||||||||||||||||||||||||||
| Assets: | ||||||||||||||||||||||||||||||||||||
| Asset & Commercial Mortgage Backed Securities | $ | — | $ | — | $ | (2 | )† | $ | 2 | $ | — | $ | — | $ | — | $ | — | $ | — | |||||||||||||||||
| Common Stock | — | — | — | ‡ | — | — | — | — | — | — | ||||||||||||||||||||||||||
| Corporate Bonds and Senior Floating Rate Interests | 4,970 | 14 | 103 | § | 3 | 9,965 | (749 | ) | — | (2,419 | ) | 11,887 | ||||||||||||||||||||||||
| Preferred Stock | — | — | — | ‡ | — | — | — | — | — | — | ||||||||||||||||||||||||||
| Options Purchased | — | — | (58 | )** | — | 81 | — | — | — | 23 | ||||||||||||||||||||||||||
| Total | $ | 4,970 | $ | 14 | $ | 43 | $ | 5 | $ | 10,046 | $ | (749 | ) | $ | — | $ | (2,419 | ) | $ | 11,910 | ||||||||||||||||
| * | Securities are transferred into and out of Level 3 for a variety of reasons including, but not limited to: |
1) Securities where trading has been halted- transfer into Level 3 versus securities where trading has resumed - transfer out of Level 3.
2) Broker quoted securities - transfer into Level 3 versus quoted prices in active markets - - transfer out of Level 3.
3) Securities that have certain restrictions on trading - transfer into Level 3 versus securities where trading restrictions have expired - transfer out of Level 3.
| † | Change in unrealized gains or losses in the current period relating to assets still held at June 30, 2010 was $(2). |
| ‡ | Change in unrealized gains or losses in the current period relating to assets still held at June 30, 2010 was $—. |
| § | Change in unrealized gains or losses in the current period relating to assets still held at June 30, 2010 was $103. |
| ** | Change in unrealized gains or losses in the current period relating to assets still held at June 30, 2010 was $(58). |
The accompanying notes are an integral part of these financial statements.
| Hartford High Yield HLS Fund |
June 30, 2010 (Unaudited) |
| (000’s Omitted) |
| Assets: | ||||
| Investments in securities, at market value (cost $688,442) | $ | 707,216 | ||
| Cash | 104 | |||
| Foreign currency on deposit with custodian (cost $—) | — | |||
| Receivables: | ||||
| Investment securities sold | 5,050 | |||
| Fund shares sold | 394 | |||
| Dividends and interest | 14,774 | |||
| Other assets | 1 | |||
| Total assets | 727,539 | |||
| Liabilities: | ||||
| Payables: | ||||
| Investment securities purchased | 23,622 | |||
| Fund shares redeemed | 4,287 | |||
| Investment management fees | 107 | |||
| Distribution fees | 9 | |||
| Accrued expenses | 38 | |||
| Total liabilities | 28,063 | |||
| Net assets | $ | 699,476 | ||
| Summary of Net Assets: | ||||
| Capital stock and paid-in-capital | $ | 738,721 | ||
| Accumulated undistributed net investment income | 36,033 | |||
| Accumulated net realized loss on investments and foreign currency transactions | (94,052 | ) | ||
| Unrealized appreciation of investments and the translations of assets and liabilities denominated in foreign currency | 18,774 | |||
| Net assets | $ | 699,476 | ||
| Shares authorized | 2,800,000 | |||
| Par value | $ | 0.001 | ||
Class IA: Net asset value per share | $ | 8.33 | ||
| Shares outstanding | 63,093 | |||
| Net assets | $ | 525,512 | ||
Class IB: Net asset value per share | $ | 8.24 | ||
| Shares outstanding | 21,122 | |||
| Net assets | $ | 173,964 | ||
The accompanying notes are an integral part of these financial statements.
| Hartford High Yield HLS Fund |
| For the Six-Month Period Ended June 30, 2010 (Unaudited) |
| (000’s Omitted) |
| Investment Income: | ||||
| Dividends | $ | 4 | ||
| Interest | 34,937 | |||
| Total investment income, net | 34,941 | |||
| Expenses: | ||||
| Investment management fees | 2,235 | |||
| Administrative service fees | 232 | |||
| Transfer agent fees | 1 | |||
| Distribution fees - Class IB | 227 | |||
| Custodian fees | 15 | |||
| Accounting services fees | 64 | |||
| Board of Directors' fees | 7 | |||
| Audit fees | 7 | |||
| Other expenses | 86 | |||
| Total expenses | 2,874 | |||
| Net investment income | 32,067 | |||
| Net Realized Gain on Investments and Foreign Currency Transactions: | ||||
| Net realized gain on investments | 38,210 | |||
| Net realized gain on forward foreign currency contracts | 2 | |||
| Net realized loss on other foreign currency transactions | (1 | ) | ||
| Net Realized Gain on Investments and Foreign Currency Transactions | 38,211 | |||
| Net Changes in Unrealized Depreciation of Investments and Foreign Currency Transactions: | ||||
| Net unrealized depreciation of investments | (36,169 | ) | ||
| Net unrealized appreciation on translation of other assets and liabilities in foreign currencies | 1 | |||
| Net Changes in Unrealized Depreciation of Investments and Foreign Currency Transactions | (36,168 | ) | ||
| Net Gain on Investments and Foreign Currency Transactions | 2,043 | |||
| Net Increase in Net Assets Resulting from Operations | $ | 34,110 | ||
The accompanying notes are an integral part of these financial statements.
| Hartford High Yield HLS Fund |
| (000’s Omitted) |
| For the | ||||||||
| Six-Month | For the | |||||||
| Period Ended | Year Ended | |||||||
| June 30, 2010 | December 31, | |||||||
| (Unaudited) | 2009 | |||||||
| Operations: | ||||||||
| Net investment income | $ | 32,067 | $ | 58,862 | ||||
| Net realized gain (loss) on investments and foreign currency transactions | 38,211 | (6,160 | ) | |||||
| Net unrealized appreciation (depreciation) of investments and foreign currency transactions | (36,168 | ) | 179,380 | |||||
| Payment from affiliate | — | 201 | ||||||
| Net increase in net assets resulting from operations | 34,110 | 232,283 | ||||||
| Distributions to Shareholders: | ||||||||
| From net investment income | ||||||||
| Class IA | — | (41,516 | ) | |||||
| Class IB | — | (14,722 | ) | |||||
| Total distributions | — | (56,238 | ) | |||||
| Capital Share Transactions: | ||||||||
| Class IA | ||||||||
| Sold | 91,552 | 177,624 | ||||||
| Issued on reinvestment of distributions | — | 41,516 | ||||||
| Redeemed | (118,578 | ) | (112,917 | ) | ||||
| Total capital share transactions | (27,026 | ) | 106,223 | |||||
| Class IB | ||||||||
| Sold | 20,894 | 55,710 | ||||||
| Issued on reinvestment of distributions | — | 14,722 | ||||||
| Redeemed | (44,334 | ) | (55,312 | ) | ||||
| Total capital share transactions | (23,440 | ) | 15,120 | |||||
| Net increase (decrease) from capital share transactions | (50,466 | ) | 121,343 | |||||
| Net increase (decrease) in net assets | (16,356 | ) | 297,388 | |||||
| Net Assets: | ||||||||
| Beginning of period | 715,832 | 418,444 | ||||||
| End of period | $ | 699,476 | $ | 715,832 | ||||
| Accumulated undistributed (distribution in excess of) net investment income | $ | 36,033 | $ | 3,966 | ||||
| Shares: | ||||||||
| Class IA | ||||||||
| Sold | 11,143 | 25,906 | ||||||
| Issued on reinvestment of distributions | — | 5,288 | ||||||
| Redeemed | (14,461 | ) | (16,052 | ) | ||||
| Total share activity | (3,318 | ) | 15,142 | |||||
| Class IB | ||||||||
| Sold | 2,560 | 8,244 | ||||||
| Issued on reinvestment of distributions | — | 1,894 | ||||||
| Redeemed | (5,474 | ) | (8,053 | ) | ||||
| Total share activity | (2,914 | ) | 2,085 | |||||
The accompanying notes are an integral part of these financial statements.
| Hartford High Yield HLS Fund |
June 30, 2010 (Unaudited) |
| (000’s Omitted) |
| 1. | Organization: |
Hartford High Yield HLS Fund (the "Fund") serves as an underlying investment option for certain variable annuity and variable life insurance separate accounts of Hartford Life Insurance Company (“HLIC”) and its affiliates and certain qualified retirement plans. The Fund may also serve as an underlying investment option for certain variable annuity and variable life separate accounts of other insurance companies. Owners of variable annuity contracts and policyholders of variable life insurance contracts may choose the funds permitted in the variable insurance contract prospectus. In addition, participants in certain qualified retirement plans may choose the fund if permitted by their plans.
Hartford Series Fund, Inc. (the “Company”) is an open-end registered management investment company comprised of twenty-nine portfolios, one portfolio of which is included in these financial statements.
The Company is organized under the laws of the State of Maryland and is registered with the Securities and Exchange Commission (“SEC”) under the Investment Company Act of 1940, as amended (“1940 Act”). The Fund is organized as a diversified open-end management investment company.
The Fund is divided into Class IA and Class IB shares. Each class is offered at the per share net asset value (“NAV”) without a sales charge and is subject to the same expenses, except that the Class IB shares are subject to distribution and service fees charged pursuant to a Distribution and Service Plan adopted in accordance with Rule 12b-1 under the 1940 Act.
| 2. | Significant Accounting Policies: |
The following is a summary of significant accounting policies of the Fund, which are in accordance with U.S. Generally Accepted Accounting Principles (“GAAP”).
| a) | Security Transactions and Investment Income – Security transactions are recorded on the trade date (the date the order to buy or sell is executed). Security gains and losses are determined on the basis of identified cost. |
Trade date for senior floating rate interests purchased in the primary market is considered the date on which the loan allocations are determined. Trade date for senior floating rate interests purchased in the secondary market is the date on which the transaction is entered into.
Dividend income is accrued as of the ex-dividend date, except that certain dividends for foreign securities where the ex-dividend date may have passed are recorded as soon as the Fund is informed of the dividend in the exercise of reasonable diligence. Interest income, including amortization of premium and accretion of discounts, is accrued on a daily basis.
| b) | Security Valuation – The Fund generally uses market prices in valuing portfolio securities. If market prices are not readily available or are deemed unreliable, the Fund will use the fair value of the security as determined in good faith under policies and procedures established by and under the supervision of the Fund’s Board of Directors. Market prices may be deemed unreliable, for example, if a security is thinly traded or if an event has occurred after the close of the security’s primary market, but before the close of the New York Stock Exchange (the “Exchange”) (generally 4:00 p.m. Eastern Time, referred to as the “Valuation Time”) that is expected to affect the value of the portfolio security. The circumstances in which the Fund may use fair value pricing include, among others: (i) the occurrence of events that are significant to a particular issuer, such as mergers, restructuring or defaults; (ii) the occurrence of events that are significant to an entire market, such as natural disasters in a particular region or governmental actions; (iii) trading restrictions on securities; (iv) thinly traded securities and (v) market events such as trading halts and early market closings. In addition, with respect to the valuation of stocks primarily traded on foreign markets, the Fund uses a fair value pricing service approved by the Fund’s Board of Directors, which employs quantitative models that evaluate changes in the value of foreign market proxies (e.g., futures contracts, American Depositary Receipts (“ADRs”), exchange traded funds (“ETFs”)) after the close of the foreign markets but before the Valuation Time. Securities that are |
| Hartford High Yield HLS Fund |
Notes to Financial Statements – (continued) June 30, 2010 (Unaudited) |
| (000’s Omitted) |
primarily traded on foreign markets may trade on days that are not business days of the Fund. The value of the foreign securities in which the Fund invests may change on days when a shareholder will not be able to purchase or redeem shares of the Fund. Fair value pricing is subjective in nature and the use of fair value pricing by the Fund may cause the NAV of its shares to differ significantly from the NAV that would have been calculated using market prices at the close of the exchange on which a portfolio security is primarily traded but before the Valuation Time. There can be no assurance that the Fund could obtain the fair value assigned to a security if the Fund were to sell the security at approximately the time at which the Fund determines its NAV.
Exchange-traded equity securities are valued at the last reported sale price or official close price on the exchange or market on which the security is primarily traded (the “Primary Market”) at the Valuation Time. If the security did not trade on the Primary Market, it may be valued at the Valuation Time at the last reported sale price on another exchange where it trades. The value of an equity security not traded on any exchange but traded on the Nasdaq Stock Market, Inc. or another over-the-counter market shall be valued at the last reported sale price or official closing price on the exchange or market on which the security is traded as of the Valuation Time.
Debt securities (other than short-term obligations and senior floating rate interests) held by the Fund are valued using bid prices or using valuations based on a matrix system (which considers factors such as security prices, yield, maturity and ratings) as provided by independent pricing services. Senior floating rate interests generally trade in over-the-counter markets and are priced through an independent pricing service utilizing market quotations from loan dealers or financial institutions. Securities for which prices are not available from an independent pricing service may be valued using market quotations obtained from one or more dealers that make markets in the securities in accordance with procedures established by the Fund’s Board of Directors. Generally, the Fund may use fair valuation in regard to debt securities when the Fund holds defaulted or distressed securities or securities in a company in which a reorganization is pending. Short-term investments with a maturity of more than 60 days when purchased are valued based on market quotations until the remaining days to maturity become less than 61 days. Investments that mature in 60 days or less are generally valued at amortized cost, which approximates market value.
Foreign-denominated assets, including investment securities, and liabilities are translated from the local currency into U.S. dollars using exchange rates obtained from an independent third party as of the Fund’s Valuation Time.
Options contracts on securities, currencies, indices, futures contracts, commodities and other instruments shall be valued at their last reported sale price at the Valuation Time on the Primary Market on which the instrument is traded. If the instrument did not trade on the Primary Market, it may be valued at the most recent sale price at the Valuation Time on another exchange or market where it did trade. If it is not possible to determine the last reported sale price on the Primary Market or another exchange or market at the Valuation Time, the value of the security shall be taken to be the most recent mean between bid and asked prices on such exchange or market at the Valuation Time. Absent both bid and asked prices on such exchange, the bid price may be used.
Financial instruments for which prices are not available from an independent pricing service may be valued using market quotations obtained from one or more dealers that make markets in securities in accordance with procedures established by the Fund’s Board of Directors.
Futures contracts are valued at the most recent settlement price reported by an exchange on which, over time, they are traded most extensively. If a settlement price is not available, futures contracts will be valued at the most recent trade price as of the Valuation Time. If there were no trades, the contract shall be valued at the mean of the closing bid and asked prices as of the Valuation Time.
Forward foreign currency contracts represent agreements to exchange currencies on specific future dates at predetermined rates. Forward foreign currency contracts are valued using foreign currency exchange rates and forward rates on the Valuation Date from an independent pricing service.
Other derivative or contractual type instruments shall be valued using market prices if such instruments trade on an exchange or market. If such instruments do not trade on an exchange or market, such instruments shall be valued at a price at which the counterparty to such contract would repurchase the instrument. In the event that the counterparty cannot provide a price, such valuation may be determined in accordance with procedures established by the Fund’s Board of Directors.
Investments in open-end mutual funds are valued at the respective NAV of each open-end mutual fund on the valuation date.
Various inputs are used in determining the value of the Fund’s investments. These inputs are summarized into three broad hierarchy levels. This hierarchy is based on whether the valuation inputs are observable or unobservable. These levels are:
| · | Level 1 – Quoted prices in active markets for identical securities. Level 1 may include exchange-traded instruments such as domestic equities, some foreign equities, options, futures, mutual funds, ETFs, and rights and warrants. |
| · | Level 2 – Observable inputs other than Level 1 prices, such as quoted prices for similar securities; quoted prices in markets that are not active; or other inputs that are observable or can be corroborated by observable market data. Level 2 may include debt securities that are traded less frequently than exchange-traded instruments and which are valued using third party pricing services. Prices for most level 2 securities are based on prices received from an independent pricing service. The following asset classes generally use valuation techniques and inputs as noted below: |
Asset Backed Securities and Collateralized Mortgage Obligations – Multi-dimensional spread/prepayment speed tables, with consideration of yield or price of bonds of comparable quality, coupon and maturity, attributes of the collateral, new issue data and monthly payment information.
Corporate Bonds – Multi-dimensional relational model based on observable market information such as yields, spreads, sector analysis, etc.
Foreign Currency – Based on rates determined at the close of the Exchange, provided by an independent pricing service.
Forward Currency Contracts – Valued based on the price of the underlying currency at the prevailing interpolated exchange rate, which is a combination of the spot currency rate and the forward currency rate, provided by an independent pricing service.
Foreign Equities – Certain foreign equities are priced using a multi-factor regression model with market observable inputs of a correlative nature (ADRs, futures contracts, ETFs, and currency exchange rates).
International Fixed Income – Multi-dimensional relational model based on observable market information such as benchmark yields, reported trades, bids and offers.
Money Market Instruments – Amortized cost.
Mortgage Backed Securities (“MBS”) – Matrix pricing using inputs of To-Be-Announced (“TBA”) prices, new issue data and monthly payment information, with consideration of yield or price of bonds of comparable quality, coupon and maturity, and attributes of the collateral.
| Hartford High Yield HLS Fund |
Notes to Financial Statements – (continued) June 30, 2010 (Unaudited) |
| (000’s Omitted) |
Municipal Bonds – Multi-dimensional relational model and series of matrices based on observable market information such as Municipal Securities Rulemaking Board reported trades, comparable bonds, yields, spreads and credit analysis.
Preferred Stocks – Close mean of bid/ask or bid.
Repurchase Agreements – Priced at par.
Senior Floating Rate Interests – Composite of quotes from one or more contributing dealers.
Swaps – Price based upon observable market information from an independent pricing service.
U.S. Government Securities – Treasuries exclusively traded in the secondary market.
| · | Level 3 – Significant unobservable inputs that are supported by limited or no market activity. Level 3 may include financial instruments whose values are determined using broker quotes or require significant management judgment or estimation. While these securities are priced using unobservable inputs, the valuation of these securities reflects the best available data and management believes the prices are a reasonable representation of exit price. The following asset classes generally use valuation techniques and inputs as noted below: |
Asset Backed Securities & Commercial Mortgage Backed Securities – Certain other MBS with limited liquidity priced from an independent pricing service.
Common Stocks – Trading has been halted or there are restrictions on trading. Valuation is based on last trade with the application of a discount or premium, if applicable.
Long Dated Over-the-Counter Options – Terms greater than 10 years from current date, expected volatility is not observable. Prices are from an independent pricing service.
Long Term Debt Securities, including Senior Floating Rate Interests – Unobservable valuation inputs may include estimates for current yields, maturity/duration, prepayment speed, and broker quotes for comparable securities along with other assumptions relating to credit quality, collateral value, complexity of the security structure, general market conditions and liquidity.
Swaps – Terms greater than 10 years from current date, expected volatility is not observable. Prices are from an independent pricing service.
Individual securities within any of the above mentioned asset classes may be assigned a different hierarchical level than those that are presented above, as individual circumstances dictate.
For purposes of reporting transfers between different hierarchy levels, both transfers in and out of each level are shown as if they occurred at the beginning of the period.
Refer to the Investment Valuation Hierarchy Levels Summary and the Level 3 roll forward reconciliation found following the Schedules of Investments.
| c) | Foreign Currency Transactions – Assets and liabilities denominated in currencies other than U.S. dollars are translated into U.S. dollars at the exchange rates in effect on the valuation date. Purchases and sales of investment securities, income and expenses are translated into U.S. dollars at the exchange rates on the dates of such transactions. |
The Fund does not isolate that portion of portfolio security valuation resulting from fluctuations in the foreign currency exchange rates from the fluctuations arising from changes in the market prices of securities held. Exchange rate
fluctuations are included with the net realized and unrealized gain or loss on investments in the accompanying financial statements.
Net realized foreign exchange gains or losses arise from sales of foreign currencies and the difference between asset and liability amounts initially stated in foreign currencies and the U.S. dollar value of the amounts actually received or paid. Net unrealized foreign exchange gains or losses arise from changes in the value of other assets and liabilities at the end of the reporting period, resulting from changes in the exchange rates.
| d) | Joint Trading Account – Pursuant to an exemptive order issued by the SEC, the Fund may transfer uninvested cash balances into a joint trading account managed by Hartford Investment Management Company (“Hartford Investment Management”), a wholly-owned indirect subsidiary of The Hartford Financial Services Group, Inc. (“The Hartford”). These balances may be invested in one or more repurchase agreements and/or short-term money market instruments. |
| e) | Forward Foreign Currency Contracts – The Fund may enter into forward foreign currency contracts that obligate the Fund to purchase or sell currencies at specified future dates. Forward foreign currency contracts may be used to hedge against adverse fluctuations in exchange rates between currencies. |
Forward foreign currency contracts involve elements of market risk in excess of the amounts reflected in the Statement of Assets and Liabilities. In addition, risks may arise upon entering into these contracts from the potential inability of the counterparties to meet the terms of the contracts and from unanticipated movements in the value of the foreign currencies relative to the U.S. dollar. The Fund had no outstanding forward foreign currency contracts as of June 30, 2010.
| f) | Fund Share Valuation and Dividend Distributions to Shareholders – Orders for the Fund’s shares are executed in accordance with the investment instructions of the contract holders or plan participants. The NAV of the Fund’s shares is determined as of the close of each business day of the Exchange. The NAV is determined separately for each class of the Fund by dividing the Fund’s net assets attributable to that class by the number of outstanding shares of the class. Orders for the purchase of the Fund’s shares received by an insurance company or plan prior to the close of the Exchange on any day on which the Exchange is open for business are priced at the NAV determined as of the close of the Exchange. Orders received by an insurance company or plan after the close of the Exchange, or on a day on which the Exchange and/or the Fund is not open for business, are priced at the next determined NAV. |
Dividends are declared pursuant to a policy adopted by the Fund’s Board of Directors based upon the investment performance of the Fund. The policy of the Fund is to pay dividends from net investment income and distribute realized capital gains, if any, at least once a year.
Distributions from net investment income, realized capital gains and capital are determined in accordance with federal income tax regulations, which may differ from U.S. GAAP with respect to character and timing. These differences may include but are not limited to losses deferred due to wash sale adjustments, foreign currency gains and losses, adjustments related to Passive Foreign Investment Companies (“PFICs”), Real Estate Investment Trusts (“REITs”), Regulated Investment Companies (“RICs”), certain derivatives and partnerships. Permanent book and federal income tax basis differences relating to shareholder distributions will result in reclassifications to certain of the Fund’s capital accounts (see Federal Income Taxes: Reclassification of Capital Accounts note).
| g) | Illiquid and Restricted Securities – The Fund is permitted to invest up to 15% of its net assets in illiquid securities. “Illiquid Securities” are those that may not be sold or disposed of in the ordinary course of business within seven days, at approximately the price used to determine the Fund’s NAV. The Fund may not be able to sell illiquid securities or other investments when its sub-adviser considers it desirable to do so or may have to sell such securities or investments at a price that is lower than the price that could be obtained if the securities or investments were more liquid. A sale of illiquid securities or other investments may require more time and may result in higher dealer discounts and other selling expenses than does the sale of those that are liquid. Illiquid securities and investments also may be more difficult to |
| Hartford High Yield HLS Fund |
Notes to Financial Statements – (continued) June 30, 2010 (Unaudited) |
| (000’s Omitted) |
value, due to the unavailability of reliable market quotations for such securities or investments, and an investment in them may have an adverse impact on the Fund’s NAV. The Fund may also purchase certain restricted securities, commonly known as Rule 144A securities, that can be resold to institutions and which may be determined to be liquid pursuant to policies and guidelines established by the Fund’s Board of Directors. The Fund, as shown on the Schedule of Investments, had illiquid and/or restricted securities as of June 30, 2010.
| h) | Securities Purchased on a When-Issued or Delayed-Delivery Basis – Delivery and payment for securities that have been purchased by the Fund on a forward commitment, or when-issued or delayed-delivery basis, take place beyond the customary settlement period. During this period, such securities are subject to market fluctuations, and the Fund identifies securities segregated in its records with value at least equal to the amount of the commitment. The Fund, as shown on the Schedule of Investments, had when-issued or delayed delivery securities as of June 30, 2010. |
| i) | Credit Risk – Credit risk depends largely on the perceived financial health of bond issuers. In general, the credit rating is inversely related to the credit risk of the issuer. Higher rated bonds generally are deemed to have less credit risk, while lower or unrated bonds are deemed to have higher risk of default. The share price, yield and total return of a Fund which holds securities with higher credit risk may be more volatile than funds holding bonds with lower credit risk. |
| j) | Senior Floating Rate Interests – The Fund, as shown in the Schedule of Investments, may invest in senior floating rate interests. Senior floating rate interests hold the most senior position in the capital structure of a business entity (the “Borrower”), are typically secured by specific collateral and have a claim on the assets and/or stock of the Borrower that is senior to that held by subordinated debtholders and stockholders of the Borrower. Senior floating rate interests are typically structured and administered by a financial institution that acts as the agent of the lenders participating in the senior floating rate interest. Senior floating rate interests are typically rated below-investment-grade, which suggests they are more likely to default and generally pay higher interest rates than investment-grade loans. A default could lead to non-payment of income which would result in a reduction of income to the Fund and there can be no assurance that the liquidation of any collateral would satisfy the Borrower’s obligation in the event of non-payment of scheduled interest or principal payments, or that such collateral could be readily liquidated. |
| k) | Prepayment/Interest Rate Risks – Most senior floating rate interests and certain debt securities allow for prepayment of principal without penalty. Senior floating rate interests and securities subject to prepayment risk generally offer less potential for gains when interest rates decline. In addition, with respect to securities, rising interest rates may cause prepayments to occur at a slower than expected rate, thereby effectively lengthening the maturity of the security and making the security more sensitive to interest rate changes. Prepayment risk is a major risk of mortgage backed securities and certain asset backed securities. Accordingly, the potential for the value of a senior floating rate interest or debt security to increase in response to interest rate declines is limited. For certain asset backed securities, the actual maturity may be less than the stated maturity shown in the Schedule of Investments. As a result, the timing of income recognition relating to these securities may vary based upon the actual maturity. |
Senior floating rate interests or debt securities purchased to replace a prepaid loan or a debt security may have lower yields than the yield on the prepaid loan or debt security. Senior floating rate interests generally are subject to mandatory and/or optional prepayment. These mandatory prepayment conditions and the possibility of significant economic incentives for the Borrower to repay, may cause prepayments of senior floating rate interests. As a result, the actual remaining maturity of senior floating rate interests held may be substantially less than the stated maturities shown in the Schedule of Investments.
The market value of senior floating rate interests and debt securities held by the Fund may be affected by fluctuations in market interest rates. The market value of these investments tends to decline when interest rates rise and tends to increase when interest rates fall.
| i) | Use of Estimates – The preparation of financial statements in conformity with U.S. GAAP requires management to make estimates and assumptions that affect the reported amounts of assets and liabilities as of the date of the financial statements and the reported amounts of income and expenses during the period. Operating results in the future could vary from the amounts derived from management’s estimates. |
| i) | Additional Derivative Instrument(s) Information |
Derivative Instrument(s) as of June 30, 2010.
| Statement of Assets and Liabilities Location | ||||||
| Risk Exposure Category | Asset Derivatives | Liability Derivatives | ||||
| Foreign exchange contracts | Investments in securities, at value (Purchased Options), Market Value | $ | 198 | |||
The volume of derivatives that is presented in the Schedule of Investments is consistent with the derivative activity during the six-month period ended June 30, 2010.
Realized Gain/Loss and Change in Unrealized Appreciation (Depreciation) on Derivative Instruments for the six-month period ended June 30, 2010:
| Amount of Realized Gain or (Loss) on Derivatives Recognized in Income | ||||||||||||||||||||||||
| Forward | ||||||||||||||||||||||||
| Purchased | Currency | |||||||||||||||||||||||
| Risk Exposure Category | Written Options | Options | Futures | Contracts | Swaps | Total | ||||||||||||||||||
| Foreign exchange contracts | $ | — | $ | — | $ | — | $ | 2 | $ | — | $ | 2 | ||||||||||||
| Total | $ | — | $ | — | $ | — | $ | 2 | $ | — | $ | 2 | ||||||||||||
| Change in Unrealized Appreciation or (Depreciation) on Derivatives Recognized in Income | ||||||||||||||||||||||||
| Forward | ||||||||||||||||||||||||
| Purchased | Currency | |||||||||||||||||||||||
| Risk Exposure Category | Written Options | Options | Futures | Contracts | Swaps | Total | ||||||||||||||||||
| Foreign exchange contracts | — | (62 | ) | — | — | — | $ | (62 | ) | |||||||||||||||
| Total | $ | — | $ | (62 | ) | $ | — | $ | — | $ | — | $ | (62 | ) | ||||||||||
| n) | Indemnifications – Under the Company’s organizational documents, the Company shall indemnify its officers and directors to the full extent required or permitted under Maryland General Corporation Law and the federal securities laws. In addition, the Company, on behalf of the Fund, may enter into contracts that contain a variety of indemnifications. The Company’s maximum exposure under these arrangements is unknown. However, the Company has not had prior claims or losses pursuant to these contracts and expects the risk of loss to be remote. |
| 3. | Futures and Options: |
The Fund is subject to equity price risk, interest rate risk and foreign currency exchange rate risk in the normal course of pursuing its investment objectives. The Fund may invest in futures and options contracts in order to gain exposure to or hedge against changes in the value of equities, interest rates or foreign currencies. A futures contract is an agreement between two parties to buy and sell an asset at a set price on a future date. When the Fund enters into such futures contracts, it is required to deposit with a futures commission merchant an amount of “initial margin” of cash, commercial paper or U.S. Treasury Bills. Subsequent payments, called variation margin, to and from the broker, are made on a daily basis as the price of the underlying asset fluctuates, making the long and short positions in the futures contract more or less valuable (i.e., mark-to-market), which results in an unrealized gain or loss to the Fund.
| Hartford High Yield HLS Fund |
Notes to Financial Statements – (continued) June 30, 2010 (Unaudited) |
| (000’s Omitted) |
At any time prior to the expiration of the futures contract, the Fund may close the position by taking an opposite position, which would effectively terminate the position in the futures contract. A final determination of variation margin is then made, additional cash is required to be paid by or released to the Fund and the Fund realizes a gain or loss.
The use of futures contracts involves elements of market risk, which may exceed the amounts recognized in the Statement of Assets and Liabilities. Changes in the value of the futures contracts may decrease the effectiveness of the Fund’s strategy and potentially result in loss. With futures, there is minimal counterparty risk to the Fund since futures are exchange traded through a clearing house. The clearing house requires sufficient collateral to cover margins. As of June 30, 2010, there were no outstanding futures contracts.
An option contract is a contract sold by one party to another party that offers the buyer the right, but not the obligation, to buy (call) or sell (put) a security or other financial asset at an agreed-upon price during a specific period of time or on a specific date. The premium paid by the Fund for the purchase of a call or put option is included in the Fund’s Statement of Assets and Liabilities as an investment and subsequently “marked-to-market” through net unrealized appreciation (depreciation) of options to reflect the current market value of the option as of the end of the reporting period.
The Fund may write (sell) covered options. “Covered” means that so long as the Fund is obligated as the writer of an option, it will own either the underlying securities or currency or an option to purchase the same underlying securities or currency having an expiration date of the covered option and an exercise price equal to or less than the exercise price of the covered option, or will pledge cash or other liquid securities having a value equal to or greater than the fluctuating market value of the option securities or currencies. The Fund receives a premium for writing a call or put option, which is recorded on the Fund’s Statement of Assets and Liabilities and subsequently “marked-to-market” through net unrealized appreciation (depreciation) of options. There is a risk of loss from a change in the value of such options, which may exceed the related premiums received. The maximum amount of loss with respect to the Fund’s written put option is the cost of buying the underlying security or currency. The maximum loss may be offset by proceeds received from selling the underlying securities or currency. The Fund, as shown on the Schedule of Investments, had outstanding purchased option contracts as of June 30, 2010. There were no transactions involving written option contracts during the six-month period ended June 30, 2010.
| 4. | Federal Income Taxes: |
| a) | Federal Income Taxes – For federal income tax purposes, the Fund intends to continue to qualify as a RIC under Subchapter M of the Internal Revenue Code (“IRC”) by distributing substantially all of its taxable net investment income and net realized capital gains to its shareholders and otherwise complying with the requirements of RICs. The Fund has distributed substantially all of its income and capital gains in prior years and intends to distribute substantially all of its income and capital gains prior to the next fiscal year end. Accordingly, no provision for federal income or excise taxes has been made in the accompanying financial statements. Distributions from short-term capital gains are treated as ordinary income distributions for federal income tax purposes. |
| b) | Net Investment Income (Loss), Net Realized Gains (Losses) – Net investment income (loss) and net realized gains (losses) may differ for financial statement and tax purposes primarily because of losses deferred due to wash sale adjustments, foreign currency gains and losses, adjustments related to PFICs, REITs, RICs, certain derivatives and partnerships. The character of distributions made during the year from net investment income or net realized gains may differ from their ultimate characterization for federal income tax purposes. Also, due to the timing of dividend distributions, the fiscal year in which amounts are distributed may differ from the year that the income or realized gains (losses) were recorded by the Fund. |
| c) | Distributions and Components of Distributable Earnings – The tax character of distributions paid by the Fund for the periods indicated is as follows (as adjusted for dividends payable): |
| For the Year Ended | For the Year Ended | |||||||
| December 31, 2009 | December 31, 2008 | |||||||
| Ordinary Income | $ | 56,238 | $ | 52,407 | ||||
As of December 31, 2009, the Fund’s components of distributable earnings (deficit) on a tax basis were as follows:
| Amount | ||||
| Undistributed Ordinary Income | $ | 4,249 | ||
| Accumulated Capital and Other Losses* | (130,452 | ) | ||
Unrealized Appreciation† | 53,132 | |||
| Total Accumulated Deficit | $ | (73,071 | ) | |
| * | The Fund has capital loss carryforwards that are identified in the Capital Loss Carryforward note that follows. |
| † | The difference between book-basis and tax-basis unrealized appreciation (depreciation) may be attributable to the losses deferred due to wash sale adjustments, foreign currency gains and losses, adjustments related to PFICs, REITs, RICs, certain derivatives and partnerships. |
| d) | Reclassification of Capital Accounts – The Fund may record reclassifications in its capital accounts. These reclassifications have no impact on the total net assets of the Fund. The reclassifications are a result of permanent differences between GAAP and tax accounting for such items as net operating losses that reduce distribution requirements. Adjustments are made to reflect the impact these items have on current and future distributions to shareholders. Therefore, the source of the Fund’s distributions may be shown in the accompanying Statement of Changes in Net Assets as from net investment income, from net realized gains on investments or from capital depending on the type of book and tax differences that exist. For the year ended December 31, 2009, the Fund recorded reclassifications to increase (decrease) the accounts listed below: |
| Amount | ||||
| Accumulated Undistributed Net Investment Income | $ | (128 | ) | |
| Accumulated Net Realized Gain (Loss) on Investments | 1,002 | |||
| Paid-in-Capital | (874 | ) | ||
| e) | Capital Loss Carryforward – At December 31, 2009 (tax-year-end), the Fund had capital loss carryforwards for U.S. federal income tax purposes of approximately: |
| Year of Expiration | Amount | |||
| 2011 | $ | 13,116 | ||
| 2014 | 2,846 | |||
| 2016 | 62,492 | |||
| 2017 | 51,998 | |||
| Total | $ | 130,452 | ||
As of December 31, 2009, the Fund had $875 in expired capital loss carryforwards.
| f) | Accounting for Uncertainty in Income Taxes – Management has evaluated all open tax years and has determined there is no impact to the Fund’s financial statements related to uncertain tax positions. Generally, tax authorities can examine all tax returns filed for the last three years. |
| Hartford High Yield HLS Fund |
Notes to Financial Statements – (continued) June 30, 2010 (Unaudited) |
| (000’s Omitted) |
| 5. | Expenses: |
| a) | Investment Management Agreement – HL Investment Advisors, LLC (“HL Advisors”), an indirect wholly-owned subsidiary of The Hartford, serves as investment manager to the Fund pursuant to an Investment Management Agreement with the Company. As investment manager, HL Advisors has overall investment supervisory responsibility for the Fund. In addition, HL Advisors provides administrative personnel, services, equipment, facilities and office space for proper operation of the Fund. |
HL Advisors has contracted with Hartford Investment Management for the provision of day-to-day investment management services to the Fund in accordance with the Fund’s investment objective and policies. The Fund pays a fee to HL Advisors, a portion of which may be used to compensate Hartford Investment Management.
| b) | Administrative Services Agreement – For the two-month period January 1, 2010 through February 28, 2010, under the Administrative Services Agreement between HLIC and the Company, on behalf of the Fund, HLIC provided administrative services to the Fund and received monthly compensation at the annual rate of 0.20% of the Fund’s average daily net assets. The Fund assumed and paid certain other expenses (including, but not limited to, accounting, custodian, state taxes and Directors’ fees). Effective March 1, 2010, the Investment Management Agreement was amended to include the administrative services for the Fund and the separate administrative services agreement was terminated. |
The schedule below reflects the rates of compensation paid to HL Advisors for investment management services and to HLIC for administrative services rendered from January 1, 2010 through February 28, 2010, and the rates of compensation paid to the HL Advisors for the combined services from March 1, 2010 through June 30, 2010; the rates are accrued daily and paid monthly.
| Average Daily Net Assets | Annual Fee | |||
| On first $500 million | 0.7000 | % | ||
| On next $500 million | 0.6750 | % | ||
| On next $4 billion | 0.6250 | % | ||
| On next $5 billion | 0.6050 | % | ||
| Over $10 billion | 0.5950 | % | ||
| c) | Accounting Services Agreement – Pursuant to the Fund Accounting Agreement between HLIC and the Company, on behalf of the Fund, HLIC provides accounting services to the Fund and receives monthly compensation on the Fund’s average net assets. The Fund’s accounting services fees are accrued daily and paid monthly. |
| Average Daily Net Assets | Annual Fee | |||
| On first $5 billion | 0.018 | % | ||
| On next $5 billion | 0.016 | % | ||
| Over $10 billion | 0.014 | % | ||
| d) | Operating Expenses – Allocable expenses incurred by the Company are allocated to each Fund and allocated to classes within the Fund in proportion to the average daily net assets of the Fund and each class, except where allocation of certain expenses is more fairly made directly to the Fund or to specific classes within a Fund. |
| e) | Fees Paid Indirectly – The Fund’s custodian bank has agreed to reduce its fees when the Fund maintains cash on deposit in a non-interest-bearing custody account. For the six-month period ended June 30, 2010, the Fund had no fee reductions. |
The ratio of expenses to average net assets in the accompanying financial highlights excludes the reduction in expenses related to fees paid indirectly. Had the fees paid indirectly been included, the annualized expense ratio for the periods listed below would have been as follows:
| Annualized | ||||||||||||||||||||||||
| Six-Month | Year Ended | Year Ended | Year Ended | Year Ended | Year Ended | |||||||||||||||||||
| Period Ended | December 31, | December 31, | December 31, | December 31, | December 31, | |||||||||||||||||||
| June 30, 2010 | 2009 | 2008 | 2007 | 2006 | 2005 | |||||||||||||||||||
| Class IA | 0.74 | % | 0.75 | % | 0.74 | % | 0.72 | % | 0.72 | % | 0.76 | % | ||||||||||||
| Class IB | 0.99 | 1.00 | 0.99 | 0.97 | 0.97 | 1.01 | ||||||||||||||||||
| f) | Distribution Plan for Class IB shares – The Company, on behalf of the Fund, has adopted a Distribution Plan pursuant to Rule 12b-1 under the 1940 Act for the Class IB shares. Pursuant to the Distribution Plan, the Fund is authorized to compensate the Distributor, Hartford Securities Distribution Company, Inc. (a wholly owned, ultimate subsidiary of The Hartford), from assets attributable to the Class IB shares for services rendered and expenses borne in connection with activities primarily intended to result in the sale of the Class IB shares, subject to the Fund Board’s review and approval. |
The Distribution Plan provides that the Fund may pay annually up to 0.25% of the average daily net assets of the Fund attributable to its Class IB shares for activities primarily intended to result in the sale of Class IB shares. The Board has the authority to suspend or reduce these payments at any point in time. Under the terms of the Distribution Plan and the principal underwriting agreement, the Fund is authorized to make payments monthly to the Distributor which may be used to pay or compensate entities providing distribution and shareholder servicing with respect to the Class IB shares for such entities’ fees or expenses incurred or paid in that regard. These fees are accrued daily and paid monthly.
| g) | Other Related Party Transactions – Certain officers of the Fund are directors and/or officers of HL Advisors, and/or The Hartford or its subsidiaries. For the six-month period ended June 30, 2010, a portion of the Fund’s chief compliance officer’s salary was paid by all the investment companies in the Hartford fund complex. The portion allocated to the Fund was in the amount of $2. Hartford Investor Services Company, LLC ("HISC"), a wholly owned subsidiary of The Hartford, provides transfer agent services to the Fund. The amount HISC was compensated for providing such services can be found on the Statement of Operations. These fees are accrued daily and paid monthly. |
| h) | Payment from Affiliate – In July of 2007, The Hartford entered into a settlement with the Attorneys General of the states of New York, Connecticut and Illinois relating to market timing and the company's individual variable annuity contracts in which certain payments would be made directly to the variable annuity contract holders. The distribution plan provides that unclaimed money from the settlement would be distributed to certain HLS Funds that are investment options through a Hartford individual variable annuity contract. The unclaimed money was distributed to the Fund on September 18, 2009, as follows: |
| Amount | ||||
| Reimbursement | $ | 201 | ||
On November 8, 2006, the SEC issued an order setting forth the terms of a settlement reached with three subsidiaries of The Hartford that resolves the SEC’s Division of Enforcement’s investigation of aspects of The Hartford’s variable annuity and mutual fund operations related to directed brokerage and revenue sharing. The Hartford settled this matter without admitting or denying the findings of the SEC.
The Fund is available for purchase by the separate accounts of different variable universal life policies, variable annuity products, and funding agreements and it is offered directly to certain qualified retirement plans (collectively “Products”). Although existing Products contain transfer restrictions, some Products, particularly older variable annuity products, do not contain restrictions on the frequency of transfers. In addition, as the result of the settlement of litigation against Hartford Life, Inc. (“Hartford Life”) (the issuers of such variable annuity products), the Fund’s ability to restrict transfers by certain owners of older variable annuity products was limited. During 2006, these annuity owners surrendered the older variable annuity contracts that were the subject of prior litigation. In February 2005, Hartford Life agreed with the
| Hartford High Yield HLS Fund |
Notes to Financial Statements – (continued) June 30, 2010 (Unaudited) |
| (000’s Omitted) |
Board of Directors of the Fund to indemnify the Fund for any material harm caused to the Fund from frequent trading by these contracts owners.
The total return in the accompanying financial highlights includes payment from affiliates. Had the payment from affiliates been excluded, the total return for the periods listed below would have been as follows:
| For the Year Ended December 31, 2009 | ||||||||
| Class IA | Class IB | |||||||
| Impact from Payment from Affiliate for Attorneys General Settlement | 0.03 | % | 0.03 | % | ||||
| Total Return Excluding Payments from Affiliate | 50.41 | 50.04 | ||||||
| For the Year Ended December 31, 2006 | ||||||||
| Class IA | Class IB | |||||||
| Impact from Payment from Affiliate for Unrestricted Transfers | 0.02 | % | 0.02 | % | ||||
| Total Return Excluding Payments from Affiliate | 11.15 | 10.87 | ||||||
| For the Year Ended December 31, 2005 | ||||||||
| Class IA | Class IB | |||||||
| Impact from Payment from Affiliate for Unrestricted Transfers | 0.57 | % | 0.56 | % | ||||
| Total Return Excluding Payments from Affiliate | 1.56 | 1.29 | ||||||
| 6. | Investment Transactions: |
For the six-month period ended June 30, 2010, the cost of purchases and proceeds from sales of investment securities (excluding short-term investments) were as follows:
| Amount | ||||
| Cost of Purchases Excluding U.S. Government Obligations | $ | 518,741 | ||
| Sales Proceeds Excluding U.S. Government Obligations | 533,241 | |||
| 7. | Line of Credit: |
The Fund is one of several Hartford funds that participate in a $500 million committed revolving line of credit facility. The facility is to be used for temporary or emergency purposes. Under the arrangement, a fund is required to own securities having a market value in excess of 300% of the total bank borrowings. The interest rate on borrowings varies depending on the nature of the loan. The facility also requires a fee to be paid based on the amount of the commitment. This fee is allocated to all the funds participating in the line of credit based on the average net assets of the funds. During the six-month period ended June 30, 2010, the Fund did not have any borrowings under this facility.
| 8. | Industry Classifications: |
Other than the industry classifications “Other Investment Pools and Funds” and “Exchange Traded Funds”, equity industry classifications used in this report are the Global Industry Classification Standard, which was developed by and is the exclusive property and service mark of MSCI, Inc. and Standard & Poor’s.
[This page is intentionally left blank]
| Hartford High Yield HLS Fund |
| - Selected Per-Share Date (A) - | ||||||||||||||||||||||||||||||||||||||||||||
| Net Asset | Net Realized | Net Increase | ||||||||||||||||||||||||||||||||||||||||||
| Value at | Payments | and Unrealized | Total from | Dividends from | Distributions | (Decrease) in | Net Asset | |||||||||||||||||||||||||||||||||||||
| Beginning of | Net Investment | from (to) | Gain (Loss) on | Investment | Net Investment | from Realized | Distributions | Total | Net Asset | Value at End | ||||||||||||||||||||||||||||||||||
| Class | Period | Income (Loss) | Affiliate | Investments | Operations | Income | Capital Gains | from Capital | Distributions | Value | of Period | |||||||||||||||||||||||||||||||||
| For the Six-Month Period Ended June 30, 2010(E) (Unaudited) | ||||||||||||||||||||||||||||||||||||||||||||
| IA | $ | 7.94 | $ | 0.37 | $ | – | $ | 0.02 | $ | 0.39 | $ | – | $ | – | $ | – | $ | – | $ | 0.39 | $ | 8.33 | ||||||||||||||||||||||
| IB | 7.86 | 0.35 | – | 0.03 | 0.38 | – | – | – | – | 0.38 | 8.24 | |||||||||||||||||||||||||||||||||
| For the Year Ended December 31, 2009(E) | ||||||||||||||||||||||||||||||||||||||||||||
| IA | 5.73 | 0.73 | – | 2.16 | 2.89 | (0.68 | ) | – | – | (0.68 | ) | 2.21 | 7.94 | |||||||||||||||||||||||||||||||
| IB | 5.68 | 0.70 | – | 2.14 | 2.84 | (0.66 | ) | – | – | (0.66 | ) | 2.18 | 7.86 | |||||||||||||||||||||||||||||||
| For the Year Ended December 31, 2008 | ||||||||||||||||||||||||||||||||||||||||||||
| IA | 8.87 | 0.83 | – | (3.12 | ) | (2.29 | ) | (0.85 | ) | – | – | (0.85 | ) | (3.14 | ) | 5.73 | ||||||||||||||||||||||||||||
| IB | 8.78 | 0.83 | – | (3.11 | ) | (2.28 | ) | (0.82 | ) | – | – | (0.82 | ) | (3.10 | ) | 5.68 | ||||||||||||||||||||||||||||
| For the Year Ended December 31, 2007(E) | ||||||||||||||||||||||||||||||||||||||||||||
| IA | 9.35 | 0.71 | – | (0.45 | ) | 0.26 | (0.74 | ) | – | – | (0.74 | ) | (0.48 | ) | 8.87 | |||||||||||||||||||||||||||||
| IB | 9.27 | 0.68 | – | (0.45 | ) | 0.23 | (0.72 | ) | – | – | (0.72 | ) | (0.49 | ) | 8.78 | |||||||||||||||||||||||||||||
| For the Year Ended December 31, 2006(E) | ||||||||||||||||||||||||||||||||||||||||||||
| IA | 9.80 | 0.72 | – | 0.31 | 1.03 | (1.48 | ) | – | – | (1.48 | ) | (0.45 | ) | 9.35 | ||||||||||||||||||||||||||||||
| IB | 9.70 | 0.69 | – | 0.30 | 0.99 | (1.42 | ) | – | – | (1.42 | ) | (0.43 | ) | 9.27 | ||||||||||||||||||||||||||||||
| For the Year Ended December 31, 2005 | ||||||||||||||||||||||||||||||||||||||||||||
| IA | 10.26 | 0.74 | 0.05 | (0.58 | ) | 0.21 | (0.67 | ) | – | – | (0.67 | ) | (0.46 | ) | 9.80 | |||||||||||||||||||||||||||||
| IB | 10.17 | 0.71 | 0.05 | (0.59 | ) | 0.17 | (0.64 | ) | – | – | (0.64 | ) | (0.47 | ) | 9.70 | |||||||||||||||||||||||||||||
| (A) | Information presented relates to a share outstanding throughout the indicated period. |
| (B) | The figures do not include sales charges or other fees which may be applied at the variable life insurance, variable annuity or qualified retirement plan product level. Any such additional sales charges or other fees would lower the Fund's performance. |
| (C) | Ratios do not reflect reductions for fees paid indirectly. Please see Fees Paid Indirectly in the Notes to Financial Statements. |
| (D) | Portfolio turnover rate is calculated on the basis of the Fund as a whole without distinguishing between the classes of shares issued. |
| (E) | Per share amounts have been calculated using the average shares method. |
| (F) | Not annualized. |
| (G) | Annualized. |
| (H) | Total return without the inclusion of the Payment from (to) Affiliate can be found in Expenses in the accompanying Notes to Financial Statements. |
| - Ratios and Supplemental Data - | ||||||||||||||||||||||
Ratio of Expenses to Average Net | Ratio of Expenses to Average Net | Ratio of Net Investment Income to | Portfolio Turnover | |||||||||||||||||||
| Total Return(B) | Net Assets at End of Period | Assets Before Waivers(C) | Assets After Waivers(C) | Average Net Assets | Rate(D) | |||||||||||||||||
| 4.96 | %(F) | $ | 525,512 | 0.74 | %(G) | 0.74 | %(G) | 9.06 | %(G) | 74 | % | |||||||||||
| 4.83 | (F) | 173,964 | 0.99 | (G) | 0.99 | (G) | 8.81 | (G) | – | |||||||||||||
| 50.46 | (H) | 527,000 | 0.75 | 0.75 | 10.32 | 173 | ||||||||||||||||
| 50.08 | (H) | 188,832 | 1.00 | 1.00 | 10.08 | – | ||||||||||||||||
| (25.23 | ) | 293,839 | 0.74 | 0.74 | 9.05 | 101 | ||||||||||||||||
| (25.42 | ) | 124,701 | 0.99 | 0.99 | 8.76 | – | ||||||||||||||||
| 2.79 | 460,243 | 0.77 | 0.72 | 7.47 | 148 | |||||||||||||||||
| 2.53 | 222,712 | 1.02 | 0.97 | 7.20 | – | |||||||||||||||||
| 11.17 | (H) | 471,327 | 0.77 | 0.72 | 7.39 | 160 | ||||||||||||||||
| 10.89 | (H) | 264,525 | 1.02 | 0.97 | 7.14 | – | ||||||||||||||||
| 2.13 | (H) | 443,859 | 0.77 | 0.76 | 6.51 | 138 | ||||||||||||||||
| 1.85 | (H) | 272,538 | 1.02 | 1.01 | 6.25 | – | ||||||||||||||||
| Hartford High Yield HLS Fund |
The Board of Directors appoints officers who are responsible for the day-to-day operations of the Fund and who execute policies formulated by the Directors. Each director serves until his or her death, resignation, or retirement or until the next annual meeting of shareholders is held or until his or her successor is elected and qualifies.
Directors and officers who are employed by or who have a financial interest in The Hartford are considered “interested” persons of the Fund pursuant to the Investment Company Act of 1940, as amended. Each officer and two of the Company’s directors, as noted in the chart below, are “interested” persons of the Fund. Each director serves as a director for The Hartford Mutual Funds, Inc., The Hartford Mutual Funds II, Inc., The Hartford Income Shares Fund, Inc., Hartford Series Fund, Inc., and Hartford HLS Series Fund II, Inc., which, as of June 30, 2010, collectively consist of 88 funds. Correspondence may be sent to directors and officers c/o Hartford Mutual Funds, P.O. Box 2999, Hartford, Connecticut 06104-2999, except that correspondence to Ms. Fagely may be sent to 500 Bielenberg Drive, Woodbury, Minnesota 55125.
The table below sets forth, for each director and officer, his or her name, year of birth, current position with the Company and date first elected or appointed to Hartford Series Fund, Inc. (“HSF”), and Hartford HLS Series Fund II, Inc. (“HSF2”), principal occupation, and, for directors, other directorships held. The Fund’s statement of additional information contains further information on the directors and is available free of charge by calling 1-800-862-6668 or writing to Hartford HLS Funds, c/o Individual Annuity Services, P.O. Box 5085, Hartford, CT 06102-5085.
Information on the aggregate remuneration paid to the directors of the Company can be found in the Statement of Operations herein. The Fund pays to The Hartford a portion of the chief compliance officer’s compensation, but does not pay salaries or compensation to any of their other officers or directors who are employed by The Hartford.
Non-Interested Directors
Lynn S. Birdsong (1946) Director since 2003, Co-Chairman of the Investment Committee
Mr. Birdsong is a private investor. Since 2003, Mr. Birdsong has been an independent director of The Japan Fund and has served as a Director of the Sovereign High Yield Fund since April 2010. From 2003 to March 2005, Mr. Birdsong was an independent director of the Atlantic Whitehall Funds. From 1979 to 2002, Mr. Birdsong was a managing director of Zurich Scudder Investments, an investment management firm. During his employment with Scudder, Mr. Birdsong was an interested director of The Japan Fund. Since 1981, Mr. Birdsong has been a partner in Birdsong Company, an advertising specialty firm.
Robert M. Gavin, Jr. (1940) Director since 2002 (HSF) and 1986 (HSF2), Chairman of the Board since 2004
Dr. Gavin is an educational consultant. Prior to September 1, 2001, he was President of Cranbrook Education Community and prior to July 1996, he was President of Macalester College, St. Paul, Minnesota.
Duane E. Hill (1945) Director since 2001 (HSF) and 2002 (HSF2), Chairman of the Nominating Committee
Mr. Hill is Partner of TSG Ventures L.P., a private equity investment company. Mr. Hill is a former partner of TSG Capital Group, a private equity investment firm that served as sponsor and lead investor in leveraged buyouts of middle market companies.
Sandra S. Jaffee (1941) Director since 2005
Ms. Jaffee served as Chairman (2008 to 2009) and Chief Executive Officer of Fortent (formerly Searchspace Group), a leading provider of compliance/regulatory technology to financial institutions from August 2005 to August 2009. From August 2004 to August 2005, Ms. Jaffee served as an Entrepreneur in Residence with Warburg Pincus, a private equity firm. From September 1995 to July 2004, Ms. Jaffee served as Executive Vice President at Citigroup, where she was President and Chief Executive Officer of Citibank’s Global Securities Services (1995 to 2003).
William P. Johnston (1944) Director since 2005, Chairman of the Compliance Committee
In June 2006, Mr. Johnston was appointed as Senior Advisor to The Carlyle Group, a global private equity investment firm. In July 2006, Mr. Johnston was elected to the Board of Directors of MultiPlan, Inc. In August 2007, Mr. Johnston was elected to the Board of Directors of LifeCare Holdings, Inc. In February 2008, Mr. Johnston was elected to the Board of Directors of HCR-ManorCare, Inc. In May 2006, Mr. Johnston was elected to the Supervisory Board of Fresenius Medical Care AG & Co. KGaA, after its acquisition of Renal Care Group, Inc. in March 2006. Mr. Johnston joined Renal Care Group in November 2002 as a member of the Board of Directors and served as Chairman of the Board from March 2003 through March 2006. From September 1987 to December 2002, Mr. Johnston was with Equitable Securities Corporation (and its successors, SunTrust Equitable Securities and SunTrust Robinson Humphrey) serving in various investment banking and managerial positions, including Managing Director and Head of Investment Banking, Chief Executive Officer and Vice Chairman.
Phillip O. Peterson (1944) Director since 2002 (HSF) and 2000 (HSF2), Chairman of the Audit Committee
Mr. Peterson is a mutual fund industry consultant. He was a partner of KPMG LLP (an accounting firm) until July 1999. Mr. Peterson joined William Blair Funds in February 2007 as a member of the Board of Trustees. From January 2004 to April 2005, Mr. Peterson served as Independent President of the Strong Mutual Funds.
Lemma W. Senbet (1946) Director since 2005
Dr. Senbet is the William E. Mayer Chair Professor of Finance and Director, Center for Financial Policy, at the University of Maryland, Robert H. Smith School of Business. He was chair of the Finance Department during 1998 to 2006. Previously he was a chaired professor of finance at the University of Wisconsin-Madison. Also, he was director of the Fortis Funds from March 2000 to July 2002. Dr. Senbet served the finance profession in various capacities, including as director of the American Finance Association and President of the Western Finance Association. In 2006, Dr. Senbet was inducted Fellow of Financial Management Association International for his career-long distinguished scholarship and professional service.
Interested Directors and Officers
Lowndes A. Smith (1939) Director since 1996 (HSF) and 2002 (HSF2), Co-Chairman of the Investment Committee
Mr. Smith served as Vice Chairman of The Hartford from February 1997 to January 2002, as President and Chief Executive Officer of Hartford Life, Inc. from February 1997 to January 2002, and as President and Chief Operating Officer of The Hartford Life Insurance Companies from January 1989 to January 2002. Mr. Smith serves as a Director of White Mountains Insurance Group, Ltd., One Beacon Insurance, Symetra Financial and as a Managing Director of Whittington Gray Associates.
John C. Walters 1, 2 (1962) Director since 2008
Mr. Walters currently serves as President, Chief Executive Officer and Director for Hartford Life, Inc. (“HL, Inc.”). Mr. Walters also serves as President, Chairman of the Board, Chief Executive Officer and Director for Hartford Life Insurance Company (“Hartford Life”), and as Executive Vice President of The Hartford. In addition, Mr. Walters is a Manager of HL Investment Advisors, LLC (“HL Advisors”). Mr. Walters previously served as President of the U.S. Wealth Management Division of HL, Inc. (2006-2007) and as Co-Chief Operating Officer of Hartford Life (2007-2008).
1 Mr. Walters previously served as President and Chief Executive Officer (2007 to 2009).
2 Effective July 31, 2010, Mr. Walters retired from The Hartford. Mr. Walters resigned his position as a Director of the Fund effective July 30, 2010.
Other Officers
Robert M. Arena, Jr. (1968) President and Chief Executive Officer since 2009 (served as Vice President of the Fund (2006-2009)) Mr. Arena serves as Executive Vice President of Hartford Life. Additionally, Mr. Arena is Senior Vice President and Director of Hartford Administrative Services Company, (“HASCO”), President, Chief Executive Officer and Manager of Hartford Investment Financial Services, LLC (“HIFSCO”) and President, Chief Executive Officer and Manager of HL Advisors. Mr. Arena joined The Hartford in 2004.
Tamara L. Fagely (1958) Vice President, Treasurer and Controller since 2002 (HSF) 1993 (HSF2)
Ms. Fagely has been a Vice President of HASCO since 1998 and Chief Financial Officer since 2006. Currently Ms. Fagely is a Vice President of Hartford Life. She served as Assistant Vice President of Hartford Life from December 2001 through March 2005. In addition, Ms. Fagely is Controller and Chief Financial Officer of HIFSCO.
Brian Ferrell (1962) AML Compliance Officer since 2008
Mr. Ferrell has served as Assistant Vice President and AML Compliance Officer for The Hartford since 2006, and as AML Compliance Officer for HASCO and Hartford Investor Services Company, LLC (“HISC”) since 2008. Prior to joining The Hartford in 2006, Mr. Ferrell held various positions at the U.S. Department of the Treasury (the “Treasury”) from 2001 to 2006, where he served as Chief Counsel for the Treasury’s Financial Crimes Enforcement Network from 2005-2006.
Dr. Robert J. Froehlich (1953) Senior Managing Director since 2009
Dr. Froehlich joined The Hartford as Senior Managing Director in September 2009. Prior to joining The Hartford, Dr. Froehlich served as Vice Chairman of Deutsche Asset Management from 1997-2009.
| Hartford High Yield HLS Fund |
| Directors and Officers (Unaudited) – (continued) |
Thomas D. Jones, III (1965) Vice President and Chief Compliance Officer since 2006
Mr. Jones serves as Chief Compliance Officer for the Hartford Mutual Funds and Vice President and Director of Securities Compliance for The Hartford. Mr. Jones joined The Hartford in 2006 from SEI Investments, where he served as Chief Compliance Officer for its mutual funds and investment advisers. Prior to joining SEI, Mr. Jones was First Vice President and Compliance Director for Merrill Lynch Investment Managers (Americas) (“MLIM”), where he worked from 1992-2004.
Edward P. Macdonald (1967) Vice President, Secretary and Chief Legal Officer since 2005
Mr. Macdonald serves as Assistant Vice President of Hartford Life and Chief Legal Officer and Vice President of HIFSCO. He also serves as Vice President and Secretary of HASCO, and Chief Legal Officer, Secretary and Vice President of HL Advisors. Mr. Macdonald joined The Hartford in 2005.
Vernon J. Meyer (1964) Vice President since 2006
Mr. Meyer serves as Senior Vice President of Hartford Life. He also serves as Senior Vice President of HIFSCO and HL Advisors. Mr. Meyer joined The Hartford in 2004.
D. Keith Sloane (1960) Vice President since 2009
Mr. Sloane is a Senior Vice President of Hartford Life. Additionally, Mr. Sloane currently serves as Senior Vice President of HIFSCO, HL Advisors, and HASCO. Prior to joining The Hartford in 2007, Mr. Sloane was Director of product marketing and led the mutual fund business for Wachovia Securities (“Wachovia”) in their investment products group. Mr. Sloane joined Wachovia in 1995.
Jane Wolak (1961) Vice President since 2009
Ms. Wolak currently serves as Vice President of Hartford Life. Ms. Wolak joined Hartford Life as Vice President, Retail Product Services in May 2007. She is also Vice President of HASCO. Previously, Ms. Wolak was with Sun Life Financial where she held the position of Vice President, Service Center Operations from 2001-2007.
A description of the policies and procedures that the Fund uses to determine how to vote proxies relating to portfolio securities and a record of how the Fund voted any proxies for the twelve-month period ended June 30, 2010 is available (1) without charge, upon request, by calling 800-862-6668 and (2) on the Securities and Exchange Commission’s website at http://www.sec.gov.
The Fund files a complete schedule of portfolio holdings with the Commission for the first and third quarters of each fiscal year on Form N-Q. The Fund’s Forms are available (1) without charge, upon request, by calling 800-862-6668 and (2) on the Securities and Exchange Commission’s website at http://www.sec.gov. The Form N-Q may be reviewed and copied at the Commission’s Public Reference Room in Washington, DC. Information on the operation of the Public Reference Room may be obtained by calling 1-800-SEC-0330.
| Hartford High Yield HLS Fund |
The following proposal was addressed and approved at a Special Meeting of Shareholders held on February 12, 2010.
Proposal to approve amendments to the Investment Management Agreement between the Fund and HL Investment Advisors, the purpose of which were to combine the administrative services for the Fund with the management services for the Fund under a single agreement.
| Fund | For | Against | Abstain | |||||||||
| Hartford High Yield HLS Fund | 71,849,029.344 | 1,994,128.998 | 2,286,514.929 | |||||||||
Proposal to elect Lemma Senbet and John Walters, each currently a Director, as Directors of Hartford Series Fund Inc.
Lemma W. Senbet
| Funds | For | Withheld | ||||||
| Hartford Series Fund, Inc. | 5,079,578,022.902 | 241,839,974.106 | ||||||
John C. Walters
| Funds | For | Withheld | ||||||
| Hartford Series Fund, Inc. | 5,081,138,302.186 | 240,279,694.822 | ||||||
| Hartford High Yield HLS Fund |
Your Fund's Expenses
As a shareholder of the Fund, you incur two types of costs: (1) transaction costs, including sales charges (loads) on purchase payments and contingent deferred sales charges (CDSC) (2) ongoing costs including management fees; distribution fees; and other fund expenses. This example is intended to help you understand your ongoing costs (in dollars) of investing in the Fund and to compare these costs with the ongoing costs of investing in other mutual funds. The example is based on an investment of $1,000 invested at the beginning of the period and held for the period of December 31, 2009 through June 30, 2010.
Actual Expenses
The first set of columns of the table below provides information about actual account values and actual expenses. You may use the information in this column, together with the amount you invested, to estimate the expenses that you paid over the period. Simply divide your account value by $1,000 (for example, an $8,600 account value divided by $1,000 = 8.6), then multiply the result by the number in the line under the heading entitled "Expenses Paid During Period" to estimate the expenses you paid on your account during this period.
Hypothetical Example for Comparison Purposes
The second set of columns of the table below provides information about hypothetical account values and hypothetical expenses based on the Fund's actual expense ratio and an assumed rate of return of 5% per year before expenses, which is not the Fund's actual return. The hypothetical account values and expenses may not be used to estimate the actual ending account balance or expenses you paid for the period. You may use this information to compare the ongoing costs of investing in the Fund and other funds. To do so, compare this 5% hypothetical example with the 5% hypothetical examples that appear in the shareholder reports of the other funds.
Please note that the expenses shown in the table are meant to highlight your ongoing costs only and do not reflect any transactional costs, such as sales charges (loads) and CDSC. Therefore, the second set of columns of the table is useful in comparing ongoing costs only, and will not help you determine the relative total costs of owning different funds. In addition, if these transactional costs were included, your costs would be higher. Expenses are equal to the Fund's annualized expense ratios multiplied by average account value over the period, multiplied by 181/365 (to reflect the one-half year period).
Actual return | Hypothetical (5% return before expenses) | |||||||||||||||||||||||||||||||||||
| Expenses paid | Expenses paid | Days in | ||||||||||||||||||||||||||||||||||
| during the period | during the period | the | Days | |||||||||||||||||||||||||||||||||
| Beginning | Ending | December 31, 2009 | Beginning | Ending | December 31, 2009 | Annualized | current | in the | ||||||||||||||||||||||||||||
| Account Value | Account Value | through | Account Value | Account Value | through | expense | 1/2 | full | ||||||||||||||||||||||||||||
| December 31, 2009 | June 30, 2010 | June 30, 2010 | December 31, 2009 | June 30, 2010 | June 30, 2010 | ratio | year | year | ||||||||||||||||||||||||||||
| Class IA | $ | 1,000.00 | $ | 1,049.62 | $ | 3.76 | $ | 1,000.00 | $ | 1,021.12 | $ | 3.71 | 0.74 | % | 181 | 365 | ||||||||||||||||||||
| Class IB | $ | 1,000.00 | $ | 1,048.34 | $ | 5.03 | $ | 1,000.00 | $ | 1,019.89 | $ | 4.96 | 0.99 | % | 181 | 365 | ||||||||||||||||||||
| Hartford High Yield HLS Fund |
The Board approved the annual continuation of the Investment Management Agreement (the “Agreement”) between Hartford Series Fund, Inc. (“HSF”) and HL Investment Advisors, LLC (“HL Advisors”) with respect to the Fund at its meeting on August 4-5, 2009. The Board’s considerations in approving the renewal of the Agreement are disclosed in the December 31, 2009 Annual Report for HSF.
At the November 4-5, 2009 meeting, the Board considered and approved amendments to the Agreement to include administrative services, which had been provided pursuant to a separate agreement, and investment management services under one agreement. The Board, including all of the Independent Directors, approved the amendments to the Agreement with respect to the Fund.
In approving the amendments, in addition to the information presented at the August meeting in connection with the annual review of the Agreement and the additional information provided throughout the year, the Board also considered the fact that the amendments did not result in an overall increase in fees to shareholders. The Board took note of the fact that the management of HL Advisors believes that the proposal to combine the administrative services with the investment management services under a single agreement will produce streamlined fee disclosure, resulting in greater transparency and clarity in the Fund’s prospectuses and financial reports. The Board further noted management's belief that the change would result in consistency across all of the Hartford Funds in the complex in that the funds of HSF are the only funds in the complex (other than the R share classes of the Hartford retail funds) that are subject to a separate administrative services fee. Finally, the Board noted management's view that the proposed changes to the Agreement should also serve to simplify the Board's annual consideration of the investment management arrangements for the Fund in that the investment management and administrative fees would be presented as a single fee for fee comparison purposes, which should facilitate the Board's analysis.
The shareholders of the Fund approved the amendments at a Special Meeting of Shareholders held on February 12, 2010. The amendments were effective as of March 1, 2010.
35
The Hartford
P.O. Box 5085
Hartford, CT 06102–5085
Hartford Series Fund, Inc. is underwritten and distributed by Hartford Securities Distribution Company, Inc.
“The Hartford” is The Hartford Financial Services Group, Inc. and its subsidiaries.
Hartford Series Fund, Inc. inception dates range from 1977 to date. Hartford Series Fund, Inc. is not a subsidiary of The Hartford but is underwritten, distributed by and advised by subsidiaries of The Hartford. Investments in Hartford Series Fund, Inc. are not guaranteed by The Hartford or any other entity.
This material is authorized for distribution only when preceded or accompanied by a current prospectus. The prospectus contains detailed information about the Funds, including investment objectives, risks and charges and expenses. Please read it carefully before you invest or send money.
HLSSAR-HY10 Printed in U.S.A ©2010 The Hartford, Hartford, CT 06115 |
| Hartford Index HLS Fund |
|
Hartford Index HLS Fund
| Manager Discussions (Unaudited) | 2 |
| Financial Statements | |
| 4 | |
| 10 | |
| 11 | |
| 12 | |
| 13 | |
| 14 | |
| 24 | |
| 26 | |
| 28 | |
| 28 | |
| 29 | |
| 30 | |
| 31 |
This report is prepared for the general information of contract owners and qualified retirement plan participants. It is not an offer of contracts or of qualified retirement plans. It should not be used in connection with any offer, except in conjunction with the appropriate prospectus which contains all pertinent information including the applicable sales, administrative and other charges.
The views expressed in the Fund’s Manager Discussion under ‘‘Why did the Fund perform this way?’’ and ‘‘What is the outlook?’’ are views of the Fund’s subadvisers and portfolio management team through the end of the period and is subject to change based on market and other conditions.
Hartford Index HLS Fund inception 05/01/1987
(subadvised by Hartford Investment Management Company)
Investment objective – Seeks to provide investment results which approximate the price and yield performance of publicly traded common stocks in the aggregate.
Performance Overview(1) 6/30/00 - - 6/30/10
Growth of $10,000 investment
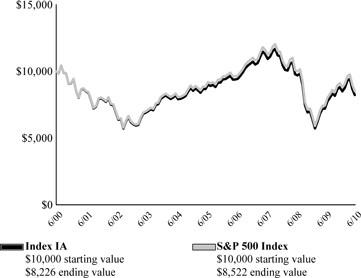
S&P 500 Index is a market capitalization-weighted price index composed of 500 widely held common stocks.
You cannot invest directly in an index.
The chart represents a hypothetical investment in the Fund. Performance data represents past performance and current performance could be higher or lower.
Average Annual Returns (as of 6/30/10)
| 6 | 1 | 5 | 10 | |||||
| Month† | Year | Year | Year | |||||
| Index IA | -6.78% | 14.07% | -1.06% | -1.93% | ||||
| Index IB | -6.90% | 13.79% | -1.31% | -2.17% | ||||
| S&P 500 Index | -6.64% | 14.43% | -0.80% | -1.59% |
| † | Not Annualized |
PAST PERFORMANCE IS NOT INDICATIVE OF FUTURE RESULTS.
| (1) | Growth of a $10,000 investment in Class IB shares will vary from the results seen on this page due to differences in the expense charged to this share class. |
Performance information may reflect historical or current expense waivers from the investment adviser, without which performance would have been lower. For information on current expense waivers/reimbursements, please see the prospectus.
The value of the contract will fluctuate so that when redeemed, it may be worth more or less than the original investment. The chart and table do not reflect the deduction of taxes that a shareholder would pay on portfolio distributions or the redemption of portfolio shares. The figures do not include sales charges or other fees which may be applied at the variable life insurance, variable annuity or qualified retirement plan product level. Any such additional sales charges or other fees would lower the Fund’s performance.
| Portfolio Manager |
| Deane Gyllenhaal |
| Vice President |
How did the Fund perform?
The Class IA shares of the Hartford Index HLS Fund returned -6.78% for the six-month period ended June 30, 2010, underperforming its benchmark, the S&P 500 Index, which returned -6.64%, and outperforming the Lipper S&P 500 Index VP-UF Funds category, a group of funds with investment strategies similar to those of the Fund, which returned -6.80%.
Why did the Fund perform this way?
For the period, the Fund slightly underperformed the index. Much of the performance variance is attributable to day to day frictions within the Fund, such as investing cash flows and the impact of having a cash allocation. Roughly one basis point of return was due to the lack of the Hartford Financial Services Group (HIG) stock exposure within the Fund. The Fund carried an index relative underweight (i.e. the Fund’s sector position was less than the benchmark position) to HIG, which underperformed in June. Because of internal Hartford Investment Management Company (HIMCO) requirements, the Fund does not purchase stock of HIMCO's parent, HIG. This exposure is reallocated across the Life/Health Insurance and Property/Casualty Insurance and Multiline Insurance industries.
After positive returns in the first quarter and through April, the S&P 500 Index slid in May and June bringing the index returns for the period into negative territory. All ten of the sectors in the benchmark had negative returns for the first six months of the year. The Materials sector declined the most, dropping 12.8%. Energy declined 12.1% and Information Technology fell 10.6%. Industrials and Consumer Discretionary both retreated, 0.9% and 1.5%, respectively, and were the best performing sectors.
Looking at individual stocks within the benchmark, the following three constituents led the way: Zions Bancorp returned 68.2% for the first six months, Akamai Technology rose 61.2% and Huntington Bancshares gained 52.3%. The stocks that lagged for the period included, NVIDIA Corp. which fell 45.3%, Dean Foods gave up 44.2%, followed by AK Steel Holdings Corp. which dropped 43.9%.
What is the outlook?
2010 had a promising start with the S&P 500 Index up 5.4% in the first quarter. However, weakness in the second quarter has brought the index into negative territory, as the S&P 500 Index fell 11.4%. The performance of international markets has been volatile, driven by uncertainty surrounding the Eurozone’s long-term economic stability. We believe that equities can appreciate further, but the current risk factors must stay contained and corporate revenues need to grow in order to support the forecasted earnings over the next two years.
We believe volatility in the equity markets will likely be elevated for some time. Although the risk of a double-dip recession still exists, we feel an extended period of low growth seems more likely at this point. Given continued weak consumer consumption and high unemployment, we do not anticipate significant inflation in the short term. High unemployment and low inflation continue to imply that the Federal Funds Rate will remain unchanged, thus, we expect that short-term U.S. interest rates will remain low for the foreseeable future.
Diversification by Industry
as of June 30, 2010
| Percentage of | ||||
| Industry (Sector) | Net Assets | |||
Automobiles & Components (Consumer Discretionary) | 0.6 | % | ||
| Banks (Financials) | 3.2 | |||
| Capital Goods (Industrials) | 7.6 | |||
| Commercial & Professional Services (Industrials) | 0.6 | |||
Consumer Durables & Apparel (Consumer Discretionary) | 1.1 | |||
| Consumer Services (Consumer Discretionary) | 1.8 | |||
| Diversified Financials (Financials) | 7.7 | |||
| Energy (Energy) | 10.6 | |||
| Food & Staples Retailing (Consumer Staples) | 2.5 | |||
| Food, Beverage & Tobacco (Consumer Staples) | 6.1 | |||
| Health Care Equipment & Services (Health Care) | 4.0 | |||
| Household & Personal Products (Consumer Staples) | 2.8 | |||
| Insurance (Financials) | 3.9 | |||
| Materials (Materials) | 3.5 | |||
| Media (Consumer Discretionary) | 3.1 | |||
Pharmaceuticals, Biotechnology & Life Sciences (Health Care) | 8.0 | |||
| Real Estate (Financials) | 1.3 | |||
| Retailing (Consumer Discretionary) | 3.4 | |||
Semiconductors & Semiconductor Equipment (Information Technology) | 2.6 | |||
| Software & Services (Information Technology) | 8.5 | |||
Technology Hardware & Equipment (Information Technology) | 7.4 | |||
| Telecommunication Services (Services) | 3.0 | |||
| Transportation (Industrials) | 1.9 | |||
| Utilities (Utilities) | 3.7 | |||
| Short-Term Investments | 1.0 | |||
| Other Assets and Liabilities | 0.1 | |||
| Total | 100.0 | % | ||
| Hartford Index HLS Fund |
| June 30, 2010 (Unaudited) |
| (000’s Omitted) |
| Shares or Principal Amount | Market Value ╪ | ||||||
| COMMON STOCKS - 98.9% | |||||||
| Automobiles & Components - 0.6% | |||||||
| 316 | Ford Motor Co. · | $ | 3,185 | ||||
| 22 | Goodyear Tire & Rubber Co. · | 224 | |||||
| 22 | Harley-Davidson, Inc. | 485 | |||||
| 62 | Johnson Controls, Inc. | 1,676 | |||||
| 5,570 | |||||||
| Banks - 3.2% | |||||||
| 64 | BB&T Corp. | 1,690 | |||||
| 16 | Comerica, Inc. | 603 | |||||
| 74 | Fifth Third Bankcorp | 906 | |||||
| 21 | First Horizon National Corp. · | 243 | |||||
| 44 | Hudson City Bancorp, Inc. | 538 | |||||
| 66 | Huntington Bancshares, Inc. | 368 | |||||
| 82 | Keycorp | 627 | |||||
| 8 | M&T Bank Corp. | 660 | |||||
| 49 | Marshall & Ilsley Corp. | 351 | |||||
| 35 | People's United Financial, Inc. | 470 | |||||
| 49 | PNC Financial Services Group, Inc. | 2,758 | |||||
| 111 | Regions Financial Corp. | 728 | |||||
| 46 | SunTrust Banks, Inc. | 1,080 | |||||
| 178 | US Bancorp | 3,974 | |||||
| 483 | Wells Fargo & Co. | 12,372 | |||||
| 15 | Zion Bancorp | 321 | |||||
| 27,689 | |||||||
| Capital Goods - 7.6% | |||||||
| 66 | 3M Co. | 5,223 | |||||
| 70 | Boeing Co. | 4,420 | |||||
| 58 | Caterpillar, Inc. | 3,495 | |||||
| 19 | Cummins, Inc. | 1,213 | |||||
| 49 | Danaher Corp. | 1,810 | |||||
| 39 | Deere & Co. | 2,195 | |||||
| 17 | Dover Corp. | 723 | |||||
| 16 | Eaton Corp. | 1,018 | |||||
| 70 | Emerson Electric Co. | 3,050 | |||||
| 12 | Fastenal Co. | 610 | |||||
| 5 | Flowserve Corp. | 443 | |||||
| 17 | Fluor Corp. | 706 | |||||
| 36 | General Dynamics Corp. | 2,093 | |||||
| 990 | General Electric Co. | 14,279 | |||||
| 12 | Goodrich Corp. | 768 | |||||
| 71 | Honeywell International, Inc. | 2,773 | |||||
| 36 | Illinois Tool Works, Inc. | 1,480 | |||||
| 17 | ITT Corp. | 763 | |||||
| 12 | Jacobs Engineering Group, Inc. · | 424 | |||||
| 11 | L-3 Communications Holdings, Inc. | 758 | |||||
| 29 | Lockheed Martin Corp. | 2,151 | |||||
| 33 | Masco Corp. | 358 | |||||
| 28 | Northrop Grumman Corp. | 1,519 | |||||
| 34 | PACCAR, Inc. | 1,349 | |||||
| 11 | Pall Corp. | 374 | |||||
| 15 | Parker-Hannifin Corp. | 828 | |||||
| 13 | Precision Castparts Corp. | 1,353 | |||||
| 20 | Quanta Services, Inc. · | 403 | |||||
| 35 | Raytheon Co. | 1,710 | |||||
| 13 | Rockwell Automation, Inc. | 650 | |||||
| 15 | Rockwell Collins, Inc. | 775 | |||||
| 9 | Roper Industries, Inc. | 490 | |||||
| 5 | Snap-On, Inc. | 221 | |||||
| 25 | Textron, Inc. | 431 | |||||
| 87 | United Technologies Corp. | 5,615 | |||||
| 6 | W.W. Grainger, Inc. | 572 | |||||
| 67,043 | |||||||
| Commercial & Professional Services - 0.6% | |||||||
| 10 | Avery Dennison Corp. | 330 | |||||
| 12 | Cintas Corp. | 292 | |||||
| 5 | Dun & Bradstreet Corp. | 313 | |||||
| 12 | Equifax, Inc. · | 329 | |||||
| 17 | Iron Mountain, Inc. | 377 | |||||
| 19 | Pitney Bowes, Inc. | 424 | |||||
| 19 | R.R. Donnelley & Sons Co. | 313 | |||||
| 30 | Republic Services, Inc. | 894 | |||||
| 14 | Robert Half International, Inc. | 327 | |||||
| 8 | Stericycle, Inc. · | 513 | |||||
| 45 | Waste Management, Inc. | 1,402 | |||||
| 5,514 | |||||||
| Consumer Durables & Apparel - 1.1% | |||||||
| 28 | Coach, Inc. | 1,033 | |||||
| 26 | D.R. Horton, Inc. | 252 | |||||
| 25 | Eastman Kodak Co. · | 108 | |||||
| 14 | Fortune Brands, Inc. | 553 | |||||
| 6 | Harman International Industries, Inc. · | 194 | |||||
| 12 | Hasbro, Inc. | 501 | |||||
| 14 | Leggett & Platt, Inc. | 276 | |||||
| 15 | Lennar Corp. | 210 | |||||
| 34 | Mattel, Inc. | 715 | |||||
| 26 | Newell Rubbermaid, Inc. | 377 | |||||
| 36 | NIKE, Inc. Class B | 2,435 | |||||
| 6 | Polo Ralph Lauren Corp. | 440 | |||||
| 29 | Pulte Group, Inc. · | 244 | |||||
| 15 | Stanley Black & Decker, Inc. | 753 | |||||
| 8 | V.F. Corp. | 581 | |||||
| 7 | Whirlpool Corp. | 614 | |||||
| 9,286 | |||||||
| Consumer Services - 1.8% | |||||||
| 12 | Apollo Group, Inc. Class A · | 497 | |||||
| 40 | Carnival Corp. | 1,214 | |||||
| 13 | Darden Restaurants, Inc. | 507 | |||||
| 6 | DeVry, Inc. | 304 | |||||
| 31 | H & R Block, Inc. | 480 | |||||
| 28 | International Game Technology | 434 | |||||
| 24 | Marriott International, Inc. Class A | 712 | |||||
| 100 | McDonald's Corp. | 6,571 | |||||
| 69 | Starbucks Corp. | 1,679 | |||||
| 18 | Starwood Hotels & Resorts | 727 | |||||
| 17 | Wyndham Worldwide Corp. | 337 | |||||
| 6 | Wynn Resorts Ltd. | 491 | |||||
| 43 | Yum! Brands, Inc. | 1,693 | |||||
| 15,646 | |||||||
| Diversified Financials - 7.7% | |||||||
| 111 | American Express Co. | 4,424 | |||||
| 24 | Ameriprise Financial, Inc. | 855 | |||||
| 931 | Bank of America Corp. | 13,372 | |||||
| 113 | Bank of New York Mellon Corp. | 2,778 | |||||
| 42 | Capital One Financial Corp. | 1,706 | |||||
| 91 | Charles Schwab Corp. | 1,287 | |||||
| 2,097 | Citigroup, Inc. · | 7,883 | |||||
| 6 | CME Group, Inc. | 1,726 | |||||
| 50 | Discover Financial Services, Inc. | 705 | |||||
| 18 | E*Trade Financial Corp. · | 217 | |||||
The accompanying notes are an integral part of these financial statements.
| Shares or Principal Amount | Market Value ╪ | ||||||
| COMMON STOCKS - 98.9% - (continued) | |||||||
Diversified Financials - 7.7% - (continued) | |||||||
| 8 | Federated Investors, Inc. | $ | 171 | ||||
| 14 | Franklin Resources, Inc. | 1,178 | |||||
| 48 | Goldman Sachs Group, Inc. | 6,273 | |||||
| 7 | IntercontinentalExchange, Inc. · | 778 | |||||
| 43 | Invesco Ltd. | 730 | |||||
| 17 | Janus Capital Group, Inc. | 152 | |||||
| 369 | JP Morgan Chase & Co. | 13,509 | |||||
| 15 | Legg Mason, Inc. | 429 | |||||
| 18 | Leucadia National Corp. · | 344 | |||||
| 18 | Moody's Corp. | 364 | |||||
| 130 | Morgan Stanley | 3,009 | |||||
| 13 | Nasdaq OMX Group, Inc. · | 240 | |||||
| 22 | Northern Trust Corp. | 1,045 | |||||
| 24 | NYSE Euronext | 668 | |||||
| 45 | SLM Corp. · | 468 | |||||
| 46 | State Street Corp. | 1,572 | |||||
| 24 | T. Rowe Price Group, Inc. | 1,070 | |||||
| 66,953 | |||||||
Energy - 10.6% | |||||||
| 46 | Anadarko Petroleum Corp. | 1,658 | |||||
| 31 | Apache Corp. | 2,631 | |||||
| 40 | Baker Hughes, Inc. | 1,656 | |||||
| 10 | Cabot Oil & Gas Corp. | 300 | |||||
| 23 | Cameron International Corp. · | 736 | |||||
| 60 | Chesapeake Energy Corp. | 1,266 | |||||
| 186 | Chevron Corp. | 12,642 | |||||
| 138 | ConocoPhillips Holding Co. | 6,777 | |||||
| 21 | Consol Energy, Inc. | 707 | |||||
| 37 | Denbury Resources, Inc. · | 542 | |||||
| 41 | Devon Energy Corp. | 2,526 | |||||
| 6 | Diamond Offshore Drilling, Inc. | 404 | |||||
| 65 | El Paso Corp. | 725 | |||||
| 24 | EOG Resources, Inc. | 2,312 | |||||
| 474 | Exxon Mobil Corp. | 27,059 | |||||
| 11 | FMC Technologies, Inc. · | 595 | |||||
| 84 | Halliburton Co. | 2,062 | |||||
| 10 | Helmerich & Payne, Inc. | 358 | |||||
| 27 | Hess Corp. | 1,365 | |||||
| 66 | Marathon Oil Corp. | 2,045 | |||||
| 10 | Massey Energy Co. | 262 | |||||
| 18 | Murphy Oil Corp. | 880 | |||||
| 26 | Nabors Industries Ltd. · | 465 | |||||
| 39 | National Oilwell Varco, Inc. | 1,287 | |||||
| 16 | Noble Energy, Inc. | 978 | |||||
| 75 | Occidental Petroleum Corp. | 5,808 | |||||
| 25 | Peabody Energy Corp. | 975 | |||||
| 11 | Pioneer Natural Resources Co. | 637 | |||||
| 15 | Range Resources Corp. | 593 | |||||
| 11 | Rowan Companies, Inc. · | 233 | |||||
| 111 | Schlumberger Ltd. | 6,122 | |||||
| 23 | Smith International, Inc. | 867 | |||||
| 32 | Southwestern Energy Co. · | 1,242 | |||||
| 60 | Spectra Energy Corp. | 1,206 | |||||
| 11 | Sunoco, Inc. | 390 | |||||
| 13 | Tesoro Corp. | 153 | |||||
| 52 | Valero Energy Corp. | 944 | |||||
| 54 | Williams Cos., Inc. | 992 | |||||
| 92,400 | |||||||
| Food & Staples Retailing - 2.5% | |||||||
| 41 | Costco Wholesale Corp. | 2,240 | |||||
| 126 | CVS/Caremark Corp. | 3,702 | |||||
| 60 | Kroger Co. | 1,180 | |||||
| 36 | Safeway, Inc. | 708 | |||||
| 20 | Supervalu, Inc. | 214 | |||||
| 55 | Sysco Corp. | 1,568 | |||||
| 91 | Walgreen Co. | 2,423 | |||||
| 193 | Wal-Mart Stores, Inc. | 9,264 | |||||
| 16 | Whole Foods Market, Inc. · | 573 | |||||
| 21,872 | |||||||
| Food, Beverage & Tobacco - 6.1% | |||||||
| 193 | Altria Group, Inc. | 3,870 | |||||
| 60 | Archer Daniels Midland Co. | 1,540 | |||||
| 10 | Brown-Forman Corp. | 576 | |||||
| 17 | Campbell Soup Co. | 621 | |||||
| 214 | Coca-Cola Co. | 10,727 | |||||
| 30 | Coca-Cola Enterprises, Inc. | 780 | |||||
| 41 | ConAgra Foods, Inc. | 964 | |||||
| 18 | Constellation Brands, Inc. Class A · | 278 | |||||
| 17 | Dean Foods Co. · | 170 | |||||
| 23 | Dr. Pepper Snapple Group | 851 | |||||
| 62 | General Mills, Inc. | 2,188 | |||||
| 29 | H.J. Heinz Co. | 1,269 | |||||
| 15 | Hershey Co. | 736 | |||||
| 6 | Hormel Foods Corp. | 259 | |||||
| 11 | J.M. Smucker Co. | 663 | |||||
| 24 | Kellogg Co. | 1,189 | |||||
| 162 | Kraft Foods, Inc. | 4,527 | |||||
| 14 | Lorillard, Inc. | 1,020 | |||||
| 12 | McCormick & Co., Inc. | 465 | |||||
| 19 | Mead Johnson Nutrition Co. | 953 | |||||
| 15 | Molson Coors Brewing Co. | 618 | |||||
| 150 | PepsiCo, Inc. | 9,114 | |||||
| 172 | Philip Morris International, Inc. | 7,875 | |||||
| 16 | Reynolds American, Inc. | 818 | |||||
| 61 | Sara Lee Corp. | 865 | |||||
| 28 | Tyson Foods, Inc. Class A | 464 | |||||
| 53,400 | |||||||
| Health Care Equipment & Services - 4.0% | |||||||
| 39 | Aetna, Inc. | 1,039 | |||||
| 26 | Amerisource Bergen Corp. | 832 | |||||
| 9 | Bard (C.R.), Inc. | 685 | |||||
| 55 | Baxter International, Inc. | 2,248 | |||||
| 22 | Becton, Dickinson & Co. | 1,463 | |||||
| 141 | Boston Scientific Corp. · | 816 | |||||
| 34 | Cardinal Health, Inc. | 1,129 | |||||
| 16 | CareFusion Corp. · | 374 | |||||
| 6 | Cerner Corp. · | 482 | |||||
| 26 | CIGNA Corp. | 798 | |||||
| 14 | Coventry Health Care, Inc. · | 243 | |||||
| 10 | DaVita, Inc. · | 602 | |||||
| 14 | Dentsply International, Inc. | 405 | |||||
| 51 | Express Scripts, Inc. · | 2,391 | |||||
| 15 | Hospira, Inc. · | 885 | |||||
| 16 | Humana, Inc. · | 722 | |||||
| 4 | Intuitive Surgical, Inc. · | 1,149 | |||||
| 10 | Laboratory Corp. of America Holdings · | 730 | |||||
| 25 | McKesson Corp. | 1,690 | |||||
| 42 | Medco Health Solutions, Inc. · | 2,334 | |||||
The accompanying notes are an integral part of these financial statements.
| Hartford Index HLS Fund |
| Schedule of Investments – (continued) |
| June 30, 2010 (Unaudited) |
| (000’s Omitted) |
| Shares or Principal Amount | Market Value ╪ | ||||||
| COMMON STOCKS - 98.9% - (continued) | |||||||
| Health Care Equipment & Services - 4.0% - (continued) | |||||||
| 102 | Medtronic, Inc. | $ | 3,705 | ||||
| 9 | Patterson Cos., Inc. | 246 | |||||
| 14 | Quest Diagnostics, Inc. | 699 | |||||
| 30 | St. Jude Medical, Inc. · | 1,094 | |||||
| 26 | Stryker Corp. | 1,307 | |||||
| 40 | Tenet Healthcare Corp. · | 175 | |||||
| 105 | UnitedHealth Group, Inc. | 2,995 | |||||
| 11 | Varian Medical Systems, Inc. · | 600 | |||||
| 40 | Wellpoint, Inc. · | 1,937 | |||||
| 19 | Zimmer Holdings, Inc. · | 1,016 | |||||
| 34,791 | |||||||
| Household & Personal Products - 2.8% | |||||||
| 40 | Avon Products, Inc. | 1,054 | |||||
| 13 | Clorox Co. | 814 | |||||
| 45 | Colgate-Palmolive Co. | 3,579 | |||||
| 11 | Estee Lauder Co., Inc. | 621 | |||||
| 38 | Kimberly-Clark Corp. | 2,329 | |||||
| 267 | Procter & Gamble Co. | 16,024 | |||||
| 24,421 | |||||||
| Insurance - 3.9% | |||||||
| 46 | Aflac, Inc. | 1,959 | |||||
| 51 | Allstate Corp. | 1,463 | |||||
| 13 | American International Group, Inc. · | 440 | |||||
| 25 | AON Corp. | 929 | |||||
| 11 | Assurant, Inc. | 369 | |||||
| 157 | Berkshire Hathaway, Inc. Class B · | 12,488 | |||||
| 31 | Chubb Corp. | 1,549 | |||||
| 15 | Cincinnati Financial Corp. | 400 | |||||
| 46 | Genworth Financial, Inc. · | 605 | |||||
| 30 | Lincoln National Corp. | 720 | |||||
| 33 | Loews Corp. | 1,108 | |||||
| 50 | Marsh & McLennan Cos., Inc. | 1,133 | |||||
| 80 | MetLife, Inc. | 3,031 | |||||
| 31 | Principal Financial Group, Inc. | 732 | |||||
| 63 | Progressive Corp. | 1,187 | |||||
| 46 | Prudential Financial, Inc. | 2,447 | |||||
| 8 | Torchmark Corp. | 400 | |||||
| 47 | Travelers Cos., Inc. | 2,311 | |||||
| 33 | Unum Group | 708 | |||||
| 32 | XL Capital Ltd. Class A | 518 | |||||
| 34,497 | |||||||
| Materials - 3.5% | |||||||
| 20 | Air Products and Chemicals, Inc. | 1,278 | |||||
| 8 | Airgas, Inc. | 481 | |||||
| 10 | AK Steel Holding Corp. | 122 | |||||
| 95 | Alcoa, Inc. | 953 | |||||
| 9 | Allegheny Technologies, Inc. | 405 | |||||
| 9 | Ball Corp. | 454 | |||||
| 10 | Bemis Co., Inc. | 273 | |||||
| 7 | CF Industries Holdings, Inc. | 417 | |||||
| 13 | Cliff's Natural Resources, Inc. | 591 | |||||
| 107 | Dow Chemical Co. | 2,541 | |||||
| 84 | E.I. DuPont de Nemours & Co. | 2,908 | |||||
| 7 | Eastman Chemical Co. | 358 | |||||
| 22 | Ecolab, Inc. | 973 | |||||
| 7 | FMC Corp. | 389 | |||||
| 44 | Freeport-McMoRan Copper & Gold, Inc. | 2,586 | |||||
| 7 | International Flavors & Fragrances, Inc. | 314 | |||||
| 40 | International Paper Co. | 916 | |||||
| 16 | MeadWestvaco Corp. | 351 | |||||
| 51 | Monsanto Co. | 2,339 | |||||
| 46 | Newmont Mining Corp. | 2,815 | |||||
| 29 | Nucor Corp. | 1,119 | |||||
| 15 | Owens-Illinois, Inc. · | 404 | |||||
| 12 | Pactiv Corp. · | 342 | |||||
| 15 | PPG Industries, Inc. | 930 | |||||
| 28 | Praxair, Inc. | 2,153 | |||||
| 15 | Sealed Air Corp. | 291 | |||||
| 9 | Sherwin-Williams Co. | 595 | |||||
| 11 | Sigma-Aldrich Corp. | 562 | |||||
| 8 | Titanium Metals Corp. · | 137 | |||||
| 13 | United States Steel Corp. | 513 | |||||
| 12 | Vulcan Materials Co. | 517 | |||||
| 20 | Weyerhaeuser Co. | 691 | |||||
| 29,718 | |||||||
| Media - 3.1% | |||||||
| 63 | CBS Corp. Class B | 815 | |||||
| 262 | Comcast Corp. Class A | 4,545 | |||||
| 84 | DirecTV Class A · | 2,859 | |||||
| 26 | Discovery Communications, Inc. · | 943 | |||||
| 22 | Gannett Co., Inc. | 297 | |||||
| 45 | Interpublic Group of Cos., Inc. · | 324 | |||||
| 29 | McGraw-Hill Cos., Inc. | 825 | |||||
| 3 | Meredith Corp. | 106 | |||||
| 11 | New York Times Co. Class A · | 93 | |||||
| 209 | News Corp. Class A | 2,500 | |||||
| 29 | Omnicom Group, Inc. | 978 | |||||
| 8 | Scripps Networks Interactive Class A | 338 | |||||
| 33 | Time Warner Cable, Inc. | 1,711 | |||||
| 106 | Time Warner, Inc. | 3,056 | |||||
| 56 | Viacom, Inc. Class B | 1,768 | |||||
| 182 | Walt Disney Co. | 5,722 | |||||
| 1 | Washington Post Co. Class B | 234 | |||||
| 27,114 | |||||||
| Pharmaceuticals, Biotechnology & Life Sciences - 8.0% | |||||||
| 143 | Abbott Laboratories | 6,699 | |||||
| 29 | Allergan, Inc. | 1,663 | |||||
| 89 | Amgen, Inc. · | 4,672 | |||||
| 25 | Biogen Idec, Inc. · | 1,176 | |||||
| 160 | Bristol-Myers Squibb Co. | 3,978 | |||||
| 43 | Celgene Corp. · | 2,173 | |||||
| 7 | Cephalon, Inc. · | 397 | |||||
| 94 | Eli Lilly & Co. | 3,154 | |||||
| 28 | Forest Laboratories, Inc. · | 770 | |||||
| 25 | Genzyme Corp. · | 1,258 | |||||
| 83 | Gilead Sciences, Inc. · | 2,829 | |||||
| 256 | Johnson & Johnson | 15,106 | |||||
| 23 | King Pharmaceuticals, Inc. · | 175 | |||||
| 17 | Life Technologies Corp. · | 799 | |||||
| 289 | Merck & Co., Inc. | 10,115 | |||||
| 5 | Millipore Corp. · | 559 | |||||
| 29 | Mylan, Inc. · | 489 | |||||
| 11 | PerkinElmer, Inc. | 225 | |||||
| 748 | Pfizer, Inc. | 10,668 | |||||
| 38 | Thermo Fisher Scientific, Inc. · | 1,867 | |||||
| 9 | Waters Corp. · | 559 | |||||
| 10 | Watson Pharmaceuticals, Inc. · | 404 | |||||
| 69,735 | |||||||
The accompanying notes are an integral part of these financial statements.
| Shares or Principal Amount | Market Value ╪ | ||||||
| COMMON STOCKS - 98.9% - (continued) | |||||||
| Real Estate - 1.3% | |||||||
| 11 | Apartment Investment & Management Co. | $ | 210 | ||||
| 8 | Avalonbay Communities, Inc. | 721 | |||||
| 13 | Boston Properties, Inc. | 919 | |||||
| 25 | CB Richard Ellis Group, Inc. Class A · | 341 | |||||
| 26 | Equity Residential Properties Trust | 1,093 | |||||
| 27 | HCP, Inc. | 879 | |||||
| 12 | Health Care, Inc. | 487 | |||||
| 61 | Host Hotels & Resorts, Inc. | 823 | |||||
| 38 | Kimco Realty Corp. | 506 | |||||
| 15 | Plum Creek Timber Co., Inc. | 522 | |||||
| 44 | ProLogis | 448 | |||||
| 13 | Public Storage | 1,106 | |||||
| 27 | Simon Property Group, Inc. | 2,188 | |||||
| 15 | Ventas, Inc. | 683 | |||||
| 15 | Vornado Realty Trust | 1,068 | |||||
| �� | 11,994 | ||||||
| Retailing - 3.4% | |||||||
| 8 | Abercrombie & Fitch Co. Class A | 253 | |||||
| 32 | Amazon.com, Inc. · | 3,474 | |||||
| 8 | AutoNation, Inc. · | 161 | |||||
| 3 | AutoZone, Inc. · | 518 | |||||
| 24 | Bed Bath & Beyond, Inc. · | 904 | |||||
| 32 | Best Buy Co., Inc. | 1,088 | |||||
| 7 | Big Lots, Inc. · | 238 | |||||
| 21 | CarMax, Inc. · | 412 | |||||
| 19 | Expedia, Inc. | 361 | |||||
| 13 | Family Dollar Stores, Inc. | 472 | |||||
| 14 | GameStop Corp. Class A · | 266 | |||||
| 42 | Gap, Inc. | 809 | |||||
| 15 | Genuine Parts Co. | 581 | |||||
| 156 | Home Depot, Inc. | 4,374 | |||||
| 22 | J.C. Penney Co., Inc. | 472 | |||||
| 29 | Kohl's Corp. · | 1,356 | |||||
| 25 | Limited Brands, Inc. | 552 | |||||
| 133 | Lowe's Co., Inc. | 2,707 | |||||
| 39 | Macy's, Inc. | 701 | |||||
| 15 | Nordstrom, Inc. | 497 | |||||
| 26 | Office Depot, Inc. · | 104 | |||||
| 13 | O'Reilly Automotive, Inc. · | 607 | |||||
| 4 | Priceline.com, Inc. · | 770 | |||||
| 12 | RadioShack Corp. | 227 | |||||
| 11 | Ross Stores, Inc. | 606 | |||||
| 4 | Sears Holdings Corp. · | 287 | |||||
| 68 | Staples, Inc. | 1,290 | |||||
| 68 | Target Corp. | 3,359 | |||||
| 12 | Tiffany & Co. | 448 | |||||
| 38 | TJX Cos., Inc. | 1,587 | |||||
| 12 | Urban Outfitters, Inc. · | 417 | |||||
| 29,898 | |||||||
| Semiconductors & Semiconductor Equipment - 2.6% | |||||||
| 52 | Advanced Micro Devices, Inc. · | 384 | |||||
| 28 | Altera Corp. | 695 | |||||
| 28 | Analog Devices, Inc. | 769 | |||||
| 125 | Applied Materials, Inc. | 1,498 | |||||
| 40 | Broadcom Corp. Class A | 1,322 | |||||
| 5 | First Solar, Inc. · | 517 | |||||
| 516 | Intel Corp. | 10,037 | |||||
| 16 | KLA-Tencor Corp. | 440 | |||||
| 21 | Linear Technology Corp. | 578 | |||||
| 61 | LSI Corp. · | 279 | |||||
| 21 | MEMC Electronic Materials, Inc. · | 208 | |||||
| 17 | Microchip Technology, Inc. | 479 | |||||
| 79 | Micron Technology, Inc. · | 672 | |||||
| 22 | National Semiconductor Corp. | 298 | |||||
| 9 | Novellus Systems, Inc. · | 225 | |||||
| 53 | NVIDIA Corp. · | 542 | |||||
| 17 | Teradyne, Inc. · | 163 | |||||
| 113 | Texas Instruments, Inc. | 2,639 | |||||
| 25 | Xilinx, Inc. | 640 | |||||
| 22,385 | |||||||
| Software & Services - 8.5% | |||||||
| 49 | Adobe Systems, Inc. · | 1,289 | |||||
| 16 | Akamai Technologies, Inc. · | 648 | |||||
| 21 | Autodesk, Inc. · | 518 | |||||
| 47 | Automatic Data Processing, Inc. | 1,879 | |||||
| 17 | BMC Software, Inc. · | 584 | |||||
| 36 | CA, Inc. | 667 | |||||
| 17 | Citrix Systems, Inc. · | 726 | |||||
| 28 | Cognizant Technology Solutions Corp. · | 1,392 | |||||
| 14 | Computer Sciences Corp. | 650 | |||||
| 21 | Compuware Corp. · | 166 | |||||
| 105 | eBay, Inc. · | 2,067 | |||||
| 30 | Electronic Arts, Inc. · | 438 | |||||
| 31 | Fidelity National Information Services, Inc. | 824 | |||||
| 14 | Fiserv, Inc. · | 646 | |||||
| 22 | Google, Inc. · | 10,004 | |||||
| 119 | IBM Corp. | 14,681 | |||||
| 29 | Intuit, Inc. · | 1,013 | |||||
| 9 | Mastercard, Inc. | 1,800 | |||||
| 14 | McAfee, Inc. · | 443 | |||||
| 707 | Microsoft Corp. | 16,273 | |||||
| 12 | Monster Worldwide, Inc. · | 136 | |||||
| 32 | Novell, Inc. · | 184 | |||||
| 363 | Oracle Corp. | 7,792 | |||||
| 30 | Paychex, Inc. | 775 | |||||
| 18 | Red Hat, Inc. · | 508 | |||||
| 27 | SAIC, Inc. · | 454 | |||||
| 10 | Salesforce.com, Inc. · | 899 | |||||
| 74 | Symantec Corp. · | 1,028 | |||||
| 18 | Total System Services, Inc. | 249 | |||||
| 17 | VeriSign, Inc. · | 450 | |||||
| 42 | Visa, Inc. | 2,973 | |||||
| 62 | Western Union Co. | 929 | |||||
| 109 | Yahoo!, Inc. · | 1,511 | |||||
| 74,596 | |||||||
| Technology Hardware & Equipment - 7.4% | |||||||
| 32 | Agilent Technologies, Inc. · | 918 | |||||
| 16 | Amphenol Corp. Class A | 632 | |||||
| 84 | Apple, Inc. · | 21,216 | |||||
| 530 | Cisco Systems, Inc. · | 11,288 | |||||
| 145 | Corning, Inc. | 2,339 | |||||
| 160 | Dell, Inc. · | 1,927 | |||||
| 191 | EMC Corp. · | 3,489 | |||||
| 14 | FLIR Systems, Inc. · | 413 | |||||
| 12 | Harris Corp. | 501 | |||||
| 216 | Hewlett-Packard Co. | 9,370 | |||||
| 18 | Jabil Circuit, Inc. | 239 | |||||
The accompanying notes are an integral part of these financial statements.
| Hartford Index HLS Fund |
| Schedule of Investments – (continued) |
| June 30, 2010 (Unaudited) |
| (000’s Omitted) |
| Shares or Principal Amount | Market Value ╪ | ||||||
| COMMON STOCKS - 98.9% - (continued) | |||||||
| Technology Hardware & Equipment - 7.4% - (continued) | |||||||
| 21 | JDS Uniphase Corp. · | $ | 205 | ||||
| 49 | Juniper Networks, Inc. · | 1,114 | |||||
| 7 | Lexmark International, Inc. ADR · | 241 | |||||
| 13 | Molex, Inc. | 229 | |||||
| 216 | Motorola, Inc. · | 1,405 | |||||
| 32 | NetApp, Inc. · | 1,194 | |||||
| 10 | QLogic Corp. · | 172 | |||||
| 152 | Qualcomm, Inc. | 4,997 | |||||
| 21 | SanDisk Corp. · | 899 | |||||
| 36 | Tellabs, Inc. | 228 | |||||
| 15 | Teradata Corp. · | 472 | |||||
| 21 | Western Digital Corp. · | 642 | |||||
| 128 | Xerox Corp. | 1,029 | |||||
| 65,159 | |||||||
| Telecommunication Services - 3.0% | |||||||
| 37 | American Tower Corp. Class A · | 1,666 | |||||
| 548 | AT&T, Inc. | 13,258 | |||||
| 28 | CenturyLink, Inc. | 929 | |||||
| 29 | Frontier Communications Corp. | 206 | |||||
| 24 | MetroPCS Communications, Inc. · | 199 | |||||
| 138 | Qwest Communications International, Inc. | 727 | |||||
| 276 | Sprint Nextel Corp. · | 1,172 | |||||
| 262 | Verizon Communications, Inc. | 7,348 | |||||
| 45 | Windstream Corp. | 473 | |||||
| 25,978 | |||||||
| Transportation - 1.9% | |||||||
| 15 | C.H. Robinson Worldwide, Inc. | 855 | |||||
| 36 | CSX Corp. | 1,789 | |||||
| 20 | Expeditors International of Washington, Inc. | 681 | |||||
| 29 | FedEx Corp. | 2,037 | |||||
| 34 | Norfolk Southern Corp. | 1,822 | |||||
| 5 | Ryder System, Inc. | 197 | |||||
| 69 | Southwest Airlines Co. | 767 | |||||
| 47 | Union Pacific Corp. | 3,261 | |||||
| 92 | United Parcel Service, Inc. Class B | 5,227 | |||||
| 16,636 | |||||||
| Utilities - 3.7% | |||||||
| 62 | AES Corp. · | 573 | |||||
| 16 | Allegheny Energy, Inc. | 326 | |||||
| 22 | Ameren Corp. | 526 | |||||
| 44 | American Electric Power Co., Inc. | 1,433 | |||||
| 39 | CenterPoint Energy, Inc. | 508 | |||||
| 21 | CMS Energy Corp. | 313 | |||||
| 26 | Consolidated Edison, Inc. | 1,129 | |||||
| 19 | Constellation Energy Group, Inc. | 603 | |||||
| 55 | Dominion Resources, Inc. | 2,142 | |||||
| 16 | DTE Energy Co. | 712 | |||||
| 122 | Duke Energy Corp. | 1,948 | |||||
| 30 | Edison International | 960 | |||||
| 18 | Entergy Corp. | 1,259 | |||||
| 13 | EQT Corp. | 482 | |||||
| 61 | Exelon Corp. | 2,326 | |||||
| 28 | FirstEnergy Corp. | 997 | |||||
| 7 | Integrys Energy Group, Inc. | 313 | |||||
| 38 | NextEra Energy, Inc. | 1,874 | |||||
| 4 | Nicor, Inc. | 171 | |||||
| 26 | NiSource, Inc. | 374 | |||||
| 16 | Northeast Utilities | 415 | |||||
| 24 | NRG Energy, Inc. · | 502 | |||||
| 10 | Oneok, Inc. | 426 | |||||
| 21 | Pepco Holdings, Inc. | 324 | |||||
| 34 | PG&E Corp. | 1,418 | |||||
| 10 | Pinnacle West Capital Corp. | 365 | |||||
| 43 | PPL Corp. | 1,084 | |||||
| 27 | Progress Energy, Inc. | 1,043 | |||||
| 47 | Public Service Enterprise Group, Inc. | 1,469 | |||||
| 16 | QEP Resources, Inc. · | 499 | |||||
| 11 | SCANA Corp. | 377 | |||||
| 23 | Sempra Energy | 1,076 | |||||
| 76 | Southern Co. | 2,545 | |||||
| 20 | TECO Energy, Inc. | 299 | |||||
| 11 | Wisconsin Energy Corp. | 549 | |||||
| 43 | Xcel Energy, Inc. | 879 | |||||
| 32,239 | |||||||
| Total common stocks | |||||||
| (cost $963,116) | $ | 864,534 | |||||
| �� | Total long-term investments | ||||||
| (cost $963,116) | $ | 864,534 | |||||
| SHORT-TERM INVESTMENTS - 1.0% | |||||||
| Repurchase Agreements - 0.9% | |||||||
| BNP Paribas Securities Corp. Repurchase | |||||||
| Agreement (maturing on 07/01/2010 in the | |||||||
| amount of $3,216, collateralized by U.S. | |||||||
| Treasury Bond 6.25%, 2030, U.S. Treasury | |||||||
| Note 1.00%, 2011, value of $3,299) | |||||||
| $ | 3,216 | 0.01%, 6/30/2010 | $ | 3,216 | |||
| RBS Greenwich Capital Markets TriParty Joint | |||||||
| Repurchase Agreement (maturing on | |||||||
| 07/01/2010 in the amount of $1,301, | |||||||
| collateralized by U.S. Treasury Bill 0.88%, | |||||||
| 2011, value of $1,327) | |||||||
| 1,301 | 0.01%, 6/30/2010 | 1,301 | |||||
| UBS Securities, Inc. TriParty Joint | |||||||
| Repurchase Agreement (maturing on | |||||||
| 07/01/2010 in the amount of $2,964, | |||||||
| collateralized by U.S. Treasury Note 2.13%, | |||||||
| 2015, value of $3,024) | |||||||
| 2,964 | 0.04%, 6/30/2010 | 2,964 | |||||
| 7,481 | |||||||
| U.S. Treasury Bills - 0.1% | |||||||
| 1,500 | 0.15%, 7/15/2010□○ | 1,500 | |||||
| Total short-term investments | |||||||
| (cost $8,981) | $ | 8,981 | |||||
| Total investments | |||||||||||
| (cost $972,097) ▲ | 99.9 | % | $ | 873,515 | |||||||
| Other assets and liabilities | 0.1 | % | 714 | ||||||||
| Total net assets | 100.0 | % | $ | 874,229 | |||||||
| Note: | Percentage of investments as shown is the ratio of the total market value to total net assets. |
The accompanying notes are an integral part of these financial statements.
| ▲ | At June 30, 2010, the cost of securities for federal income tax purposes was $1,000,303 and the aggregate gross unrealized appreciation and depreciation based on that cost were: |
| Unrealized Appreciation | $ | 160,135 | ||
| Unrealized Depreciation | (286,923 | ) | ||
| Net Unrealized Depreciation | $ | (126,788 | ) |
· | Currently non-income producing. |
| ○ | The interest rate disclosed for these securities represents the effective yield on the date of the acquisition. |
| □ | Security pledged as initial margin deposit for open futures contracts at June 30, 2010 |
Futures Contracts Outstanding at June 30, 2010
| Unrealized | |||||||||||
| Number of | Expiration | Appreciation/ | |||||||||
| Description | Contracts* | Position | Month | (Depreciation) | |||||||
| S&P 500 Index | 39 | Long | Sep 2010 | $ | (572 | ) | |||||
| * | The number of contracts does not omit 000's. |
| ╪ | See Significant Accounting Policies of accompanying Notes to Financial Statements regarding valuation of securities. |
The accompanying notes are an integral part of these financial statements.
| Hartford Index HLS Fund |
| June 30, 2010 (Unaudited) |
| (000’s Omitted) |
| Total | Level 1♦ | Level 2♦ | Level 3 | |||||||||||||
| Assets: | ||||||||||||||||
| Common Stocks ‡ | $ | 864,534 | $ | 864,534 | $ | – | $ | – | ||||||||
| Short-Term Investments | 8,981 | – | 8,981 | – | ||||||||||||
| Total | $ | 873,515 | $ | 864,534 | $ | 8,981 | $ | – | ||||||||
| Liabilities: | ||||||||||||||||
| Futures * | 572 | 572 | – | – | ||||||||||||
| Total | $ | 572 | $ | 572 | $ | – | $ | – | ||||||||
♦ | For the period ended June 30, 2010, there were no significant transfers between Level 1 and Level 2. |
‡ | The Fund has all or primarily all of these equity securities categorized in a single level. Refer to the Schedule of Investments for further industry breakout. |
| * | Derivative instruments not reflected in the Schedule of Investments are valued at the unrealized appreciation/depreciation on the investments. |
The accompanying notes are an integral part of these financial statements.
| Hartford Index HLS Fund |
| June 30, 2010 (Unaudited) |
| (000’s Omitted) |
| Assets: | ||||
| Investments in securities, at market value (cost $972,097) | $ | 873,515 | ||
| Cash | 1 | |||
| Receivables: | ||||
| Investment securities sold | 741 | |||
| Fund shares sold | 278 | |||
| Dividends and interest | 1,181 | |||
| Variation margin | — | |||
| Other assets | 2 | |||
| Total assets | 875,718 | |||
| Liabilities: | ||||
| Payables: | ||||
| Investment securities purchased | 499 | |||
| Fund shares redeemed | 750 | |||
| Variation margin | 83 | |||
| Investment management fees | 60 | |||
| Distribution fees | 10 | |||
| Accrued expenses | 87 | |||
| Total liabilities | 1,489 | |||
| Net assets | $ | 874,229 | ||
| Summary of Net Assets: | ||||
| Capital stock and paid-in-capital | $ | 1,022,947 | ||
| Accumulated undistributed net investment income | 8,357 | |||
| Accumulated net realized loss on investments | (57,921 | ) | ||
| Unrealized depreciation of investments | (99,154 | ) | ||
| Net assets | $ | 874,229 | ||
| Shares authorized | 4,000,000 | |||
| Par value | $ | 0.001 | ||
Class IA: Net asset value per share | $ | 21.64 | ||
| Shares outstanding | 32,672 | |||
| Net assets | $ | 707,026 | ||
Class IB: Net asset value per share | $ | 21.53 | ||
| Shares outstanding | 7,768 | |||
| Net assets | $ | 167,203 | ||
The accompanying notes are an integral part of these financial statements.
| Hartford Index HLS Fund |
| For the Six-Month Period Ended June 30, 2010 (Unaudited) |
| (000’s Omitted) |
| Investment Income: | ||||
| Dividends | $ | 9,436 | ||
| Interest | 6 | |||
| Total investment income, net | 9,442 | |||
| Expenses: | ||||
| Investment management fees | 1,135 | |||
| Administrative service fees | 312 | |||
| Distribution fees - Class IB | 217 | |||
| Custodian fees | 11 | |||
| Accounting services fees | 48 | |||
| Board of Directors' fees | 12 | |||
| Audit fees | 11 | |||
| Other expenses | 132 | |||
| Total expenses | 1,878 | |||
| Net investment income | 7,564 | |||
| Net Realized Gain on Investments and Other Financial Instruments: | ||||
| Net realized gain on investments | 243 | |||
| Net realized loss on futures | (107 | ) | ||
| Net Realized Gain on Investments and Other Financial Instruments | 136 | |||
| Net Changes in Unrealized Depreciation of Investments and Other Financial Instruments: | ||||
| Net unrealized depreciation of investments | (70,003 | ) | ||
| Net unrealized depreciation of futures | (776 | ) | ||
| Net Changes in Unrealized Depreciation of Investments and Other Financial Instruments | (70,779 | ) | ||
| Net Loss on Investments and Other Financial Instruments | (70,643 | ) | ||
| Net Decrease in Net Assets Resulting from Operations | $ | (63,079 | ) | |
The accompanying notes are an integral part of these financial statements.
| Hartford Index HLS Fund |
| (000’s Omitted) |
| For the | ||||||||
| Six-Month | For the | |||||||
| Period Ended | Year Ended | |||||||
| June 30, 2010 | December 31, | |||||||
| (Unaudited) | 2009 | |||||||
| Operations: | ||||||||
| Net investment income | $ | 7,564 | $ | 16,855 | ||||
| Net realized gain (loss) on investments and other financial instruments | 136 | (24,598 | ) | |||||
| Net unrealized appreciation (depreciation) of investments and other financial instruments | (70,779 | ) | 211,697 | |||||
| Net increase (decrease) in net assets resulting from operations | (63,079 | ) | 203,954 | |||||
| Distributions to Shareholders: | ||||||||
| From net investment income | ||||||||
| Class IA | — | (14,604 | ) | |||||
| Class IB | — | (2,610 | ) | |||||
| From net realized gain on investments | ||||||||
| Class IA | — | (345 | ) | |||||
| Class IB | — | (68 | ) | |||||
| Total distributions | — | (17,627 | ) | |||||
| Capital Share Transactions: | ||||||||
| Class IA | ||||||||
| Sold | 33,493 | 87,718 | ||||||
| Issued on reinvestment of distributions | — | 14,949 | ||||||
| Redeemed | (87,698 | ) | (164,810 | ) | ||||
| Total capital share transactions | (54,205 | ) | (62,143 | ) | ||||
| Class IB | ||||||||
| Sold | 51,210 | 41,042 | ||||||
| Issued on reinvestment of distributions | — | 2,678 | ||||||
| Redeemed | (37,493 | ) | (46,203 | ) | ||||
| Total capital share transactions | 13,717 | (2,483 | ) | |||||
| Net decrease from capital share transactions | (40,488 | ) | (64,626 | ) | ||||
| Net increase (decrease) in net assets | (103,567 | ) | 121,701 | |||||
| Net Assets: | ||||||||
| Beginning of period | 977,796 | 856,095 | ||||||
| End of period | $ | 874,229 | $ | 977,796 | ||||
Accumulated undistributed (distribution in excess of) net investment income | $ | 8,357 | $ | 793 | ||||
| Shares: | ||||||||
| Class IA | ||||||||
| Sold | 1,434 | 4,675 | ||||||
| Issued on reinvestment of distributions | — | 658 | ||||||
| Redeemed | (3,723 | ) | (8,662 | ) | ||||
| Total share activity | (2,289 | ) | (3,329 | ) | ||||
| Class IB | ||||||||
| Sold | 2,190 | 2,013 | ||||||
| Issued on reinvestment of distributions | — | 119 | ||||||
| Redeemed | (1,609 | ) | (2,330 | ) | ||||
| Total share activity | 581 | (198 | ) | |||||
The accompanying notes are an integral part of these financial statements.
| Hartford Index HLS Fund |
| June 30, 2010 (Unaudited) |
| (000’s Omitted) |
| 1. | Organization: |
Hartford Index HLS Fund (the "Fund") serves as an underlying investment option for certain variable annuity and variable life insurance separate accounts of Hartford Life Insurance Company (“HLIC”) and its affiliates and certain qualified retirement plans. The Fund may also serve as an underlying investment option for certain variable annuity and variable life separate accounts of other insurance companies. Owners of variable annuity contracts and policyholders of variable life insurance contracts may choose the funds permitted in the variable insurance contract prospectus. In addition, participants in certain qualified retirement plans may choose the fund if permitted by their plans.
Hartford Series Fund, Inc. (the “Company”) is an open-end registered management investment company comprised of twenty-nine portfolios, one portfolio of which is included in these financial statements.
The Company is organized under the laws of the State of Maryland and is registered with the Securities and Exchange Commission (“SEC”) under the Investment Company Act of 1940, as amended (“1940 Act”). The Fund is organized as a diversified open-end management investment company.
The Fund is divided into Class IA and Class IB shares. Each class is offered at the per share net asset value (“NAV”) without a sales charge and is subject to the same expenses, except that the Class IB shares are subject to distribution and service fees charged pursuant to a Distribution and Service Plan adopted in accordance with Rule 12b-1 under the 1940 Act.
| 2. | Significant Accounting Policies: |
The following is a summary of significant accounting policies of the Fund, which are in accordance with U.S. Generally Accepted Accounting Principles (“GAAP”).
| a) | Security Transactions and Investment Income – Security transactions are recorded on the trade date (the date the order to buy or sell is executed). Security gains and losses are determined on the basis of identified cost. |
Dividend income is accrued as of the ex-dividend date, except that certain dividends for foreign securities where the ex-dividend date may have passed are recorded as soon as the Fund is informed of the dividend in the exercise of reasonable diligence. Interest income, including amortization of premium and accretion of discounts, is accrued on a daily basis.
| b) | Security Valuation – The Fund generally uses market prices in valuing portfolio securities. If market prices are not readily available or are deemed unreliable, the Fund will use the fair value of the security as determined in good faith under policies and procedures established by and under the supervision of the Fund’s Board of Directors. Market prices may be deemed unreliable, for example, if a security is thinly traded or if an event has occurred after the close of the security’s primary market, but before the close of the New York Stock Exchange (the “Exchange”) (generally 4:00 p.m. Eastern Time, referred to as the “Valuation Time”) that is expected to affect the value of the portfolio security. The circumstances in which the Fund may use fair value pricing include, among others: (i) the occurrence of events that are significant to a particular issuer, such as mergers, restructuring or defaults; (ii) the occurrence of events that are significant to an entire market, such as natural disasters in a particular region or governmental actions; (iii) trading restrictions on securities; (iv) thinly traded securities and (v) market events such as trading halts and early market closings. In addition, with respect to the valuation of stocks primarily traded on foreign markets, the Fund uses a fair value pricing service approved by the Fund’s Board of Directors, which employs quantitative models that evaluate changes in the value of foreign market proxies (e.g., futures contracts, American Depositary Receipts (“ADRs”), exchange traded funds (“ETFs”)) after the close of the foreign markets but before the Valuation Time. Securities that are primarily traded on foreign markets may trade on days that are not business days of the Fund. The value of the foreign securities in which the Fund invests may change on days when a shareholder will not be able to purchase or redeem shares of the Fund. Fair value pricing is subjective in nature and the use of fair value pricing by the Fund may cause the NAV of its shares to differ significantly from the NAV that would have been calculated using market prices at the close of the exchange on which a portfolio security is primarily traded but before the Valuation Time. There can be no |
assurance that the Fund could obtain the fair value assigned to a security if the Fund were to sell the security at approximately the time at which the Fund determines its NAV.
Exchange-traded equity securities are valued at the last reported sale price or official close price on the exchange or market on which the security is primarily traded (the “Primary Market”) at the Valuation Time. If the security did not trade on the Primary Market, it may be valued at the Valuation Time at the last reported sale price on another exchange where it trades. The value of an equity security not traded on any exchange but traded on the Nasdaq Stock Market, Inc. or another over-the-counter market shall be valued at the last reported sale price or official closing price on the exchange or market on which the security is traded as of the Valuation Time.
Short-term investments with a maturity of more than 60 days when purchased are valued based on market quotations until the remaining days to maturity become less than 61 days. Investments that mature in 60 days or less are generally valued at amortized cost, which approximates market value.
Financial instruments for which prices are not available from an independent pricing service may be valued using market quotations obtained from one or more dealers that make markets in securities in accordance with procedures established by the Fund’s Board of Directors.
Futures contracts are valued at the most recent settlement price reported by an exchange on which, over time, they are traded most extensively. If a settlement price is not available, futures contracts will be valued at the most recent trade price as of the Valuation Time. If there were no trades, the contract shall be valued at the mean of the closing bid and asked prices as of the Valuation Time.
Other derivative or contractual type instruments shall be valued using market prices if such instruments trade on an exchange or market. If such instruments do not trade on an exchange or market, such instruments shall be valued at a price at which the counterparty to such contract would repurchase the instrument. In the event that the counterparty cannot provide a price, such valuation may be determined in accordance with procedures established by the Fund’s Board of Directors.
Various inputs are used in determining the value of the Fund’s investments. These inputs are summarized into three broad hierarchy levels. This hierarchy is based on whether the valuation inputs are observable or unobservable. These levels are:
| · | Level 1 – Quoted prices in active markets for identical securities. Level 1 may include exchange-traded instruments such as domestic equities, some foreign equities, options, futures, mutual funds, ETFs, and rights and warrants. | |
| · | Level 2 – Observable inputs other than Level 1 prices, such as quoted prices for similar securities; quoted prices in markets that are not active; or other inputs that are observable or can be corroborated by observable market data. Level 2 may include debt securities that are traded less frequently than exchange-traded instruments and which are valued using third party pricing services. Prices for most level 2 securities are based on prices received from an independent pricing service. The following asset classes generally use valuation techniques and inputs as noted below: |
Asset Backed Securities and Collateralized Mortgage Obligations – Multi-dimensional spread/prepayment speed tables, with consideration of yield or price of bonds of comparable quality, coupon and maturity, attributes of the collateral, new issue data and monthly payment information.
Corporate Bonds – Multi-dimensional relational model based on observable market information such as yields, spreads, sector analysis, etc.
| Hartford Index HLS Fund |
| Notes to Financial Statements – (continued) |
| June 30, 2010 (Unaudited) |
| (000’s Omitted) |
Foreign Currency – Based on rates determined at the close of the Exchange, provided by an independent pricing service.
Forward Currency Contracts – Valued based on the price of the underlying currency at the prevailing interpolated exchange rate, which is a combination of the spot currency rate and the forward currency rate, provided by an independent pricing service.
Foreign Equities – Certain foreign equities are priced using a multi-factor regression model with market observable inputs of a correlative nature (ADRs, futures contracts, ETFs, and currency exchange rates).
International Fixed Income – Multi-dimensional relational model based on observable market information such as benchmark yields, reported trades, bids and offers.
Money Market Instruments – Amortized cost.
Mortgage Backed Securities (“MBS”) – Matrix pricing using inputs of To-Be-Announced (“TBA”) prices, new issue data and monthly payment information, with consideration of yield or price of bonds of comparable quality, coupon and maturity, and attributes of the collateral.
Municipal Bonds – Multi-dimensional relational model and series of matrices based on observable market information such as Municipal Securities Rulemaking Board reported trades, comparable bonds, yields, spreads and credit analysis.
Preferred Stocks – Close mean of bid/ask or bid.
Repurchase Agreements – Priced at par.
Senior Floating Rate Interests – Composite of quotes from one or more contributing dealers.
Swaps – Price based upon observable market information from an independent pricing service.
U.S. Government Securities – Treasuries exclusively traded in the secondary market.
| · | Level 3 – Significant unobservable inputs that are supported by limited or no market activity. Level 3 may include financial instruments whose values are determined using broker quotes or require significant management judgment or estimation. While these securities are priced using unobservable inputs, the valuation of these securities reflects the best available data and management believes the prices are a reasonable representation of exit price. The following asset classes generally use valuation techniques and inputs as noted below: |
Asset Backed Securities & Commercial Mortgage Backed Securities – Certain other MBS with limited liquidity priced from an independent pricing service.
Common Stocks – Trading has been halted or there are restrictions on trading. Valuation is based on last trade with the application of a discount or premium, if applicable.
Long Dated Over-the-Counter Options – Terms greater than 10 years from current date, expected volatility is not observable. Prices are from an independent pricing service.
Long Term Debt Securities, including Senior Floating Rate Interests – Unobservable valuation inputs may include estimates for current yields, maturity/duration, prepayment speed, and broker quotes for comparable
securities along with other assumptions relating to credit quality, collateral value, complexity of the security structure, general market conditions and liquidity.
Swaps – Terms greater than 10 years from current date, expected volatility is not observable. Prices are from an independent pricing service.
Individual securities within any of the above mentioned asset classes may be assigned a different hierarchical level than those that are presented above, as individual circumstances dictate.
During the six-month period ended June 30, 2010, the Fund held no Level 3 securities, therefore no reconciliation of Level 3 securities is presented.
Refer to the Investment Valuation Hierarchy Level Summary found following the Schedule of Investments.
| c) | Joint Trading Account – Pursuant to an exemptive order issued by the SEC, the Fund may transfer uninvested cash balances into a joint trading account managed by Hartford Investment Management Company (“Hartford Investment Management”), a wholly-owned indirect subsidiary of The Hartford Financial Services Group, Inc. (“The Hartford”). These balances may be invested in one or more repurchase agreements and/or short-term money market instruments. |
| d) | Repurchase Agreements – A repurchase agreement is an agreement by which a counterparty agrees to sell a security and agrees to repurchase the security sold at a mutually agreed upon time and price. At the time the Fund enters into a repurchase agreement, the value of the underlying collateral security(ies), including accrued interest, will be equal to or exceed the value of the repurchase agreement. To minimize counterparty risk, the securities that serve to collateralize the repurchase agreement are held by the Fund's custodian in book entry or physical form in the custodial account of the Fund or in a third party custodial account. Repurchase agreements are valued at cost plus accrued interest. The Fund, as shown on the Schedule of Investments, had outstanding repurchase agreements as of June 30, 2010. |
| e) | Fund Share Valuation and Dividend Distributions to Shareholders – Orders for the Fund’s shares are executed in accordance with the investment instructions of the contract holders or plan participants. The NAV of the Fund’s shares is determined as of the close of each business day of the Exchange. The NAV is determined separately for each class of the Fund by dividing the Fund’s net assets attributable to that class by the number of outstanding shares of the class. Orders for the purchase of the Fund’s shares received by an insurance company or plan prior to the close of the Exchange on any day on which the Exchange is open for business are priced at the NAV determined as of the close of the Exchange. Orders received by an insurance company or plan after the close of the Exchange, or on a day on which the Exchange and/or the Fund is not open for business, are priced at the next determined NAV. |
Dividends are declared pursuant to a policy adopted by the Fund’s Board of Directors based upon the investment performance of the Fund. The policy of the Fund is to pay dividends from net investment income and distribute realized capital gains, if any, at least once a year.
Distributions from net investment income, realized capital gains and capital are determined in accordance with federal income tax regulations, which may differ from U.S. GAAP with respect to character and timing. These differences may include but are not limited to losses deferred due to wash sale adjustments, foreign currency gains and losses, adjustments related to Passive Foreign Investment Companies (“PFICs”), Real Estate Investment Trusts (“REITs”), Regulated Investment Companies (“RICs”), certain derivatives and partnerships. Permanent book and federal income tax basis differences relating to shareholder distributions will result in reclassifications to certain of the Fund’s capital accounts (see Federal Income Taxes: Reclassification of Capital Accounts note).
| f) | Use of Estimates – The preparation of financial statements in conformity with U.S. GAAP requires management to make estimates and assumptions that affect the reported amounts of assets and liabilities as of the date of the financial |
| Hartford Index HLS Fund |
| Notes to Financial Statements – (continued) |
| June 30, 2010 (Unaudited) |
| (000’s Omitted) |
statements and the reported amounts of income and expenses during the period. Operating results in the future could vary from the amounts derived from management’s estimates.
| g) | Additional Derivative Instrument(s) Information |
Derivative Instrument(s) as of June 30, 2010.
| Statement of Assets and Liabilities Location | ||||||||
| Risk Exposure Category | Asset Derivatives | Liability Derivatives | ||||||
| Equity contracts | Summary of Net Assets - Unrealized depreciation | 572 | ||||||
The volume of derivatives that is presented in the Schedule of Investments is consistent with the derivative activity during the six-month period ended June 30, 2010.
Realized Gain/Loss and Change in Unrealized Appreciation (Depreciation) on Derivative Instruments for the six-month period ended June 30, 2010:
| Amount of Realized Gain or (Loss) on Derivatives Recognized in Income | ||||||||||||||||||||||||
| Forward | ||||||||||||||||||||||||
| Purchased | Currency | |||||||||||||||||||||||
| Risk Exposure Category | Written Options | Options | Futures | Contracts | Swaps | Total | ||||||||||||||||||
| Equity contracts | $ | — | $ | — | $ | (107 | ) | $ | — | $ | — | $ | (107 | ) | ||||||||||
| Total | $ | — | $ | — | $ | (107 | ) | $ | — | $ | — | $ | (107 | ) | ||||||||||
| Change in Unrealized Appreciation or (Depreciation) on Derivatives Recognized in Income | ||||||||||||||||||||||||
| Forward | ||||||||||||||||||||||||
| Purchased | Currency | |||||||||||||||||||||||
| Risk Exposure Category | Written Options | Options | Futures | Contracts | Swaps | Total | ||||||||||||||||||
| Equity contracts | — | — | (776 | ) | — | — | $ | (776 | ) | |||||||||||||||
| Total | $ | — | $ | — | $ | (776 | ) | $ | — | $ | — | $ | (776 | ) | ||||||||||
| h) | Indemnifications – Under the Company’s organizational documents, the Company shall indemnify its officers and directors to the full extent required or permitted under Maryland General Corporation Law and the federal securities laws. In addition, the Company, on behalf of the Fund, may enter into contracts that contain a variety of indemnifications. The Company’s maximum exposure under these arrangements is unknown. However, the Company has not had prior claims or losses pursuant to these contracts and expects the risk of loss to be remote. |
| 3. | Futures and Options: |
The Fund is subject to equity price risk, interest rate risk and foreign currency exchange rate risk in the normal course of pursuing its investment objectives. The Fund may invest in futures and options contracts in order to gain exposure to or hedge against changes in the value of equities, interest rates or foreign currencies. A futures contract is an agreement between two parties to buy and sell an asset at a set price on a future date. When the Fund enters into such futures contracts, it is required to deposit with a futures commission merchant an amount of “initial margin” of cash, commercial paper or U.S. Treasury Bills. Subsequent payments, called variation margin, to and from the broker, are made on a daily basis as the price of the underlying asset fluctuates, making the long and short positions in the futures contract more or less valuable (i.e., mark-to-market), which results in an unrealized gain or loss to the Fund.
At any time prior to the expiration of the futures contract, the Fund may close the position by taking an opposite position, which would effectively terminate the position in the futures contract. A final determination of variation margin is then made, additional cash is required to be paid by or released to the Fund and the Fund realizes a gain or loss.
The use of futures contracts involves elements of market risk, which may exceed the amounts recognized in the Statement of Assets and Liabilities. Changes in the value of the futures contracts may decrease the effectiveness of the Fund’s strategy and potentially result in loss. With futures, there is minimal counterparty risk to the Fund since futures are exchange traded through a clearing house. The clearing house requires sufficient collateral to cover margins. The Fund, as shown on the Schedule of Investments, had outstanding futures contracts as of June 30, 2010.
An option contract is a contract sold by one party to another party that offers the buyer the right, but not the obligation, to buy (call) or sell (put) a security or other financial asset at an agreed-upon price during a specific period of time or on a specific date. The premium paid by the Fund for the purchase of a call or put option is included in the Fund’s Statement of Assets and Liabilities as an investment and subsequently “marked-to-market” through net unrealized appreciation (depreciation) of options to reflect the current market value of the option as of the end of the reporting period.
The Fund may write (sell) covered options. “Covered” means that so long as the Fund is obligated as the writer of an option, it will own either the underlying securities or currency or an option to purchase the same underlying securities or currency having an expiration date of the covered option and an exercise price equal to or less than the exercise price of the covered option, or will pledge cash or other liquid securities having a value equal to or greater than the fluctuating market value of the option securities or currencies. The Fund receives a premium for writing a call or put option, which is recorded on the Fund’s Statement of Assets and Liabilities and subsequently “marked-to-market” through net unrealized appreciation (depreciation) of options. There is a risk of loss from a change in the value of such options, which may exceed the related premiums received. The maximum amount of loss with respect to the Fund’s written put option is the cost of buying the underlying security or currency. The maximum loss may be offset by proceeds received from selling the underlying securities or currency. As of June 30, 2010, there were no outstanding option contracts.
| 4. | Federal Income Taxes: |
| a) | Federal Income Taxes – For federal income tax purposes, the Fund intends to continue to qualify as a RIC under Subchapter M of the Internal Revenue Code (“IRC”) by distributing substantially all of its taxable net investment income and net realized capital gains to its shareholders and otherwise complying with the requirements of RICs. The Fund has distributed substantially all of its income and capital gains in prior years and intends to distribute substantially all of its income and capital gains prior to the next fiscal year end. Accordingly, no provision for federal income or excise taxes has been made in the accompanying financial statements. Distributions from short-term capital gains are treated as ordinary income distributions for federal income tax purposes. |
| b) | Net Investment Income (Loss), Net Realized Gains (Losses) – Net investment income (loss) and net realized gains (losses) may differ for financial statement and tax purposes primarily because of losses deferred due to wash sale adjustments, foreign currency gains and losses, adjustments related to PFICs, REITs, RICs, certain derivatives and partnerships. The character of distributions made during the year from net investment income or net realized gains may differ from their ultimate characterization for federal income tax purposes. Also, due to the timing of dividend distributions, the fiscal year in which amounts are distributed may differ from the year that the income or realized gains (losses) were recorded by the Fund. |
| c) | Distributions and Components of Distributable Earnings – The tax character of distributions paid by the Fund for the periods indicated is as follows (as adjusted for dividends payable): |
| For the Year Ended | For the Year Ended | |||||||
| December 31, 2009 | December 31, 2008 | |||||||
| Ordinary Income | $ | 17,214 | $ | 25,681 | ||||
| Long-Term Capital Gains* | 413 | 29,106 | ||||||
| * | The Fund designates these distributions as long-term capital dividends pursuant to IRC code Sec. 852(b)(3)(C). |
| Hartford Index HLS Fund |
| Notes to Financial Statements – (continued) |
| June 30, 2010 (Unaudited) |
| (000’s Omitted) |
As of December 31, 2009, the Fund’s components of distributable earnings (deficit) on a tax basis were as follows:
| Amount | ||||
| Undistributed Ordinary Income | $ | 793 | ||
| Accumulated Capital and Other Losses* | (29,647 | ) | ||
Unrealized Depreciation† | (56,785 | ) | ||
| Total Accumulated Deficit | $ | (85,639 | ) | |
| * | The Fund has capital loss carryforwards that are identified in the Capital Loss Carryforward note that follows. |
| † | The difference between book-basis and tax-basis unrealized appreciation (depreciation) may be attributable to the losses deferred due to wash sale adjustments, foreign currency gains and losses, adjustments related to PFICs, REITs, RICs, certain derivatives and partnerships. |
| d) | Reclassification of Capital Accounts – The Fund may record reclassifications in its capital accounts. These reclassifications have no impact on the total net assets of the Fund. The reclassifications are a result of permanent differences between GAAP and tax accounting for such items as net operating losses that reduce distribution requirements. Adjustments are made to reflect the impact these items have on current and future distributions to shareholders. Therefore, the source of the Fund’s distributions may be shown in the accompanying Statement of Changes in Net Assets as from net investment income, from net realized gains on investments or from capital depending on the type of book and tax differences that exist. For the year ended December 31, 2009, the Fund recorded reclassifications to increase (decrease) the accounts listed below: |
| Amount | ||||
| Accumulated Undistributed Net Investment Income | $ | (290 | ) | |
| Accumulated Net Realized Gain (Loss) on Investments | 290 | |||
| e) | Capital Loss Carryforward – At December 31, 2009 (tax-year-end), the Fund had capital loss carryforwards for U.S. federal income tax purposes of approximately: |
| Year of Expiration | Amount | |||
| 2017 | $ | 26,720 | ||
| Total | $ | 26,720 | ||
| As of December 31, 2009, the Fund elected to defer the following post October losses. | ||||
| Amount | ||||
| Long-Term Capital Gain | $ | 2,927 | ||
| f) | Accounting for Uncertainty in Income Taxes – Management has evaluated all open tax years and has determined there is no impact to the Fund’s financial statements related to uncertain tax positions. Generally, tax authorities can examine all tax returns filed for the last three years. | |
| 5. | Expenses: |
| a) | Investment Management Agreement – HL Investment Advisors, LLC (“HL Advisors”), an indirect wholly-owned subsidiary of The Hartford, serves as investment manager to the Fund pursuant to an Investment Management Agreement with the Company. As investment manager, HL Advisors has overall investment supervisory responsibility for the Fund. In addition, HL Advisors provides administrative personnel, services, equipment, facilities and office space for proper operation of the Fund. |
HL Advisors has contracted with Hartford Investment Management for the provision of day-to-day investment management services to the Fund in accordance with the Fund’s investment objective and policies. The Fund pays a fee to HL Advisors, a portion of which may be used to compensate Hartford Investment Management.
| b) | Administrative Services Agreement – For the two-month period January 1, 2010 through February 28, 2010, under an Administrative Services Agreement between HLIC and the Company, on behalf of the Fund, HLIC provided administrative services to the Fund and received monthly compensation at the annual rate of 0.20% for the first $5 billion in average net assets, 0.18% of average net assets for the next $5 billion and 0.17% for average net assets over $10 billion. The Fund assumed and paid certain other expenses (including, but not limited to, accounting, custodian, state taxes and directors’ fees). Effective March 1, 2010, the Investment Management Agreement was amended to include the administrative services for the Fund and the separate administrative services agreement was terminated. |
The schedule below reflects the rates of compensation paid to HL Advisors for investment management services and to HLIC for administrative services rendered from January 1, 2010 through February 28, 2010, and the rates of compensation paid to HL Advisers for the combined services from March 1, 2010 through June 30, 2010; the rates are accrued daily and paid monthly.
| Average Daily Net Assets | Annual Fee | |||
| On first $2 billion | 0.3000 | % | ||
| On next $3 billion | 0.2000 | % | ||
| On next $5 billion | 0.1800 | % | ||
| Over $10 billion | 0.1700 | % | ||
| c) | Accounting Services Agreement – Pursuant to the Fund Accounting Agreement between HLIC and the Company, on behalf of the Fund, HLIC provides accounting services to the Fund and receives monthly compensation on the Fund’s average net assets. The Fund’s accounting services fees are accrued daily and paid monthly. |
| Average Daily Net Assets | Annual Fee | |||
| All Assets | 0.010 | % | ||
| d) | Operating Expenses – Allocable expenses incurred by the Company are allocated to each Fund and allocated to classes within the Fund in proportion to the average daily net assets of the Fund and each class, except where allocation of certain expenses is more fairly made directly to the Fund or to specific classes within a Fund. |
| e) | Fees Paid Indirectly – The Fund’s custodian bank has agreed to reduce its fees when the Fund maintains cash on deposit in a non-interest-bearing custody account. For the six-month period ended June 30, 2010, the Fund had no fee reductions. |
The ratio of expenses to average net assets in the accompanying financial highlights excludes the reduction in expenses related to fees paid indirectly. Had the fees paid indirectly been included, the annualized expense ratio for the periods listed below would have been as follows:
| Annualized | ||||||||||||||||||||||||
| Six-Month | Year Ended | Year Ended | Year Ended | Year Ended | Year Ended | |||||||||||||||||||
| Period Ended | December 31, | December 31, | December 31, | December 31, | December 31, | |||||||||||||||||||
| June 30, 2010 | 2009 | 2008 | 2007 | 2006 | 2005 | |||||||||||||||||||
| Class IA | 0.34 | % | 0.35 | % | 0.32 | % | 0.33 | % | 0.33 | % | 0.42 | % | ||||||||||||
| Class IB | 0.59 | 0.60 | 0.57 | 0.58 | 0.58 | 0.67 | ||||||||||||||||||
| f) | Distribution Plan for Class IB shares – The Company, on behalf of the Fund, has adopted a Distribution Plan pursuant to Rule 12b-1 under the 1940 Act for the Class IB shares. Pursuant to the Distribution Plan, the Fund is authorized to compensate the Distributor, Hartford Securities Distribution Company, Inc. (a wholly owned, ultimate subsidiary of The |
| Hartford Index HLS Fund |
| Notes to Financial Statements – (continued) |
| June 30, 2010 (Unaudited) |
| (000’s Omitted) |
Hartford), from assets attributable to the Class IB shares for services rendered and expenses borne in connection with activities primarily intended to result in the sale of the Class IB shares, subject to the Fund Board’s review and approval.
The Distribution Plan provides that the Fund may pay annually up to 0.25% of the average daily net assets of the Fund attributable to its Class IB shares for activities primarily intended to result in the sale of Class IB shares. The Board has the authority to suspend or reduce these payments at any point in time. Under the terms of the Distribution Plan and the principal underwriting agreement, the Fund is authorized to make payments monthly to the Distributor which may be used to pay or compensate entities providing distribution and shareholder servicing with respect to the Class IB shares for such entities’ fees or expenses incurred or paid in that regard. These fees are accrued daily and paid monthly.
| g) | Other Related Party Transactions – Certain officers of the Fund are directors and/or officers of HL Advisors, and/or The Hartford or its subsidiaries. For the six-month period ended June 30, 2010, a portion of the Fund’s chief compliance officer’s salary was paid by all the investment companies in the Hartford fund complex. The portion allocated to the Fund was in the amount of $2. These fees are accrued daily and paid monthly. |
| h) | Payment from Affiliate – On November 8, 2006, the SEC issued an order setting forth the terms of a settlement reached with three subsidiaries of The Hartford that resolves the SEC’s Division of Enforcement’s investigation of aspects of The Hartford’s variable annuity and mutual fund operations related to directed brokerage and revenue sharing. The Hartford settled this matter without admitting or denying the findings of the SEC. |
The Fund is available for purchase by the separate accounts of different variable universal life policies, variable annuity products, and funding agreements and it is offered directly to certain qualified retirement plans (collectively “Products”). Although existing Products contain transfer restrictions, some Products, particularly older variable annuity products, do not contain restrictions on the frequency of transfers. In addition, as the result of the settlement of litigation against Hartford Life, Inc. (“Hartford Life”) (the issuers of such variable annuity products), the Fund’s ability to restrict transfers by certain owners of older variable annuity products was limited. During 2006, these annuity owners surrendered the older variable annuity contracts that were the subject of prior litigation. In February 2005, Hartford Life agreed with the Board of Directors of the Fund to indemnify the Fund for any material harm caused to the Fund from frequent trading by these contracts owners.
The total return in the accompanying financial highlights includes payment from affiliates. Had the payment from affiliates been excluded, the total return for the periods listed below would have been as follows:
| For the Year Ended December 31, 2006 | ||||||||
| Class IA | Class IB | |||||||
| Impact from Payment from Affiliate for Unrestricted Transfers | 0.01 | % | 0.01 | % | ||||
| Total Return Excluding Payments from Affiliate | 15.45 | 15.16 | ||||||
| 6. | Investment Transactions: |
For the six-month period ended June 30, 2010, the cost of purchases and proceeds from sales of investment securities (excluding short-term investments) were as follows:
| Amount | ||||
| Cost of Purchases Excluding U.S. Government Obligations | $ | 23,144 | ||
| Sales Proceeds Excluding U.S. Government Obligations | 52,927 | |||
| 7. | Line of Credit: |
The Fund is one of several Hartford funds that participate in a $500 million committed revolving line of credit facility. The facility is to be used for temporary or emergency purposes. Under the arrangement, a fund is required to own securities having a market value in excess of 300% of the total bank borrowings. The interest rate on borrowings varies depending on the nature of the loan. The facility also requires a fee to be paid based on the amount of the commitment. This fee is allocated to all the funds participating in the line of credit based on the average net assets of the funds. During the six-month period ended June 30, 2010, the Fund did not have any borrowings under this facility.
| 8. | Industry Classifications: |
Other than the industry classifications “Other Investment Pools and Funds” and “Exchange Traded Funds”, equity industry classifications used in this report are the Global Industry Classification Standard, which was developed by and is the exclusive property and service mark of MSCI, Inc. and Standard & Poor’s.
| Hartford Index HLS Fund |
| - Selected Per-Share Date (A) - |
| Net Asset | Net Realized | |||||||||||||||||||||||||||||||||||||||||||
| Value at | Payments | and Unrealized | Total from | Dividends from | Distributions | Net Increase | Net Asset | |||||||||||||||||||||||||||||||||||||
| Beginning of | Net Investment | from (to) | Gain (Loss) on | Investment | Net Investment | from Realized | Distributions | Total | (Decrease) in | Value at End | ||||||||||||||||||||||||||||||||||
| Class | Period | Income (Loss) | Affiliate | Investments | Operations | Income | Capital Gains | from Capital | Distributions | Net Asset Value | of Period | |||||||||||||||||||||||||||||||||
| For the Six-Month Period Ended June 30, 2010 (Unaudited) | ||||||||||||||||||||||||||||||||||||||||||||
| IA | $ | 23.22 | $ | 0.20 | $ | – | $ | (1.78 | ) | $ | (1.58 | ) | $ | – | $ | – | $ | – | $ | – | $ | (1.58 | ) | $ | 21.64 | |||||||||||||||||||
| IB | 23.12 | 0.15 | – | (1.74 | ) | (1.59 | ) | – | – | – | – | (1.59 | ) | 21.53 | ||||||||||||||||||||||||||||||
| For the Year Ended December 31, 2009 | ||||||||||||||||||||||||||||||||||||||||||||
| IA | 18.75 | 0.42 | – | 4.48 | 4.90 | (0.42 | ) | (0.01 | ) | – | (0.43 | ) | 4.47 | 23.22 | ||||||||||||||||||||||||||||||
| IB | 18.69 | 0.35 | – | 4.46 | 4.81 | (0.37 | ) | (0.01 | ) | – | (0.38 | ) | 4.43 | 23.12 | ||||||||||||||||||||||||||||||
| For the Year Ended December 31, 2008 | ||||||||||||||||||||||||||||||||||||||||||||
| IA | 31.54 | 0.59 | – | (12.16 | ) | (11.57 | ) | (0.58 | ) | (0.64 | ) | – | (1.22 | ) | (12.79 | ) | 18.75 | |||||||||||||||||||||||||||
| IB | 31.40 | 0.51 | – | (12.07 | ) | (11.56 | ) | (0.51 | ) | (0.64 | ) | – | (1.15 | ) | (12.71 | ) | 18.69 | |||||||||||||||||||||||||||
| For the Year Ended December 31, 2007 | ||||||||||||||||||||||||||||||||||||||||||||
| IA | 32.36 | 0.59 | – | 1.07 | 1.66 | (0.57 | ) | (1.91 | ) | – | (2.48 | ) | (0.82 | ) | 31.54 | |||||||||||||||||||||||||||||
| IB | 32.22 | 0.48 | – | 1.09 | 1.57 | (0.48 | ) | (1.91 | ) | – | (2.39 | ) | (0.82 | ) | 31.40 | |||||||||||||||||||||||||||||
| For the Year Ended December 31, 2006 | ||||||||||||||||||||||||||||||||||||||||||||
| IA | 31.97 | 0.56 | – | 4.05 | 4.61 | (0.56 | ) | (3.66 | ) | – | (4.22 | ) | 0.39 | 32.36 | ||||||||||||||||||||||||||||||
| IB | 31.84 | 0.44 | – | 4.06 | 4.50 | (0.46 | ) | (3.66 | ) | – | (4.12 | ) | 0.38 | 32.22 | ||||||||||||||||||||||||||||||
| For the Year Ended December 31, 2005 | ||||||||||||||||||||||||||||||||||||||||||||
| IA | 32.17 | 0.51 | – | 0.90 | 1.41 | (0.61 | ) | (1.00 | ) | – | (1.61 | ) | (0.20 | ) | 31.97 | |||||||||||||||||||||||||||||
| IB | 32.02 | 0.40 | – | 0.93 | 1.33 | (0.51 | ) | (1.00 | ) | – | (1.51 | ) | (0.18 | ) | 31.84 | |||||||||||||||||||||||||||||
| (A) | Information presented relates to a share outstanding throughout the indicated period. |
| (B) | The figures do not include sales charges or other fees which may be applied at the variable life insurance, variable annuity or qualified retirement plan product level. Any such additional sales charges or other fees would lower the Fund's performance. |
| (C) | Ratios do not reflect reductions for fees paid indirectly. Please see Fees Paid Indirectly in the Notes to Financial Statements. |
| (D) | Portfolio turnover rate is calculated on the basis of the Fund as a whole without distinguishing between the classes of shares issued. |
| (E) | Not annualized. |
| (F) | Annualized. |
| (G) | Total return without the inclusion of the Payment from (to) Affiliate can be found in Expenses in the accompanying Notes to Financial Statements. |
| - Ratios and Supplemental Data - - |
Ratio of Expenses to Average Net | Ratio of Expenses to Average Net | Ratio of Net Investment Income | Portfolio Turnover | |||||||||||||||||
| Total Return(B) | Net Assets at End of Period | Assets Before Waivers(C) | Assets After Waivers(C) | to Average Net Assets | Rate(D) | |||||||||||||||
| (6.78 | )%(E) | $ | 707,026 | 0.34 | %(F) | 0.34 | %(F) | 1.61 | %(F) | 2 | % | |||||||||
| (6.90 | )(E) | 167,203 | 0.59 | (F) | 0.59 | (F) | 1.37 | (F) | – | |||||||||||
| 26.15 | 811,634 | 0.35 | 0.35 | 2.00 | 6 | |||||||||||||||
| 25.81 | 166,162 | 0.60 | 0.60 | 1.75 | – | |||||||||||||||
| (37.11 | ) | 718,081 | 0.32 | 0.32 | 2.02 | 4 | ||||||||||||||
| (37.27 | ) | 138,014 | 0.57 | 0.57 | 1.77 | – | ||||||||||||||
| 5.20 | 1,390,827 | 0.33 | 0.33 | 1.61 | 4 | |||||||||||||||
| 4.94 | 271,967 | 0.58 | 0.58 | 1.36 | – | |||||||||||||||
| 15.46 | (G) | 1,598,176 | 0.42 | 0.33 | 1.60 | 4 | ||||||||||||||
| 15.17 | (G) | 276,850 | 0.67 | 0.58 | 1.36 | – | ||||||||||||||
| 4.50 | 1,701,424 | 0.42 | 0.42 | 1.46 | 5 | |||||||||||||||
4.24 | 263,579 | 0.67 | 0.67 | 1.21 | – | |||||||||||||||
| Hartford Index HLS Fund |
The Board of Directors appoints officers who are responsible for the day-to-day operations of the Fund and who execute policies formulated by the Directors. Each director serves until his or her death, resignation, or retirement or until the next annual meeting of shareholders is held or until his or her successor is elected and qualifies.
Directors and officers who are employed by or who have a financial interest in The Hartford are considered “interested” persons of the Fund pursuant to the Investment Company Act of 1940, as amended. Each officer and two of the Company’s directors, as noted in the chart below, are “interested” persons of the Fund. Each director serves as a director for The Hartford Mutual Funds, Inc., The Hartford Mutual Funds II, Inc., The Hartford Income Shares Fund, Inc., Hartford Series Fund, Inc., and Hartford HLS Series Fund II, Inc., which, as of June 30, 2010, collectively consist of 88 funds. Correspondence may be sent to directors and officers c/o Hartford Mutual Funds, P.O. Box 2999, Hartford, Connecticut 06104-2999, except that correspondence to Ms. Fagely may be sent to 500 Bielenberg Drive, Woodbury, Minnesota 55125.
The table below sets forth, for each director and officer, his or her name, year of birth, current position with the Company and date first elected or appointed to Hartford Series Fund, Inc. (“HSF”), and Hartford HLS Series Fund II, Inc. (“HSF2”), principal occupation, and, for directors, other directorships held. The Fund’s statement of additional information contains further information on the directors and is available free of charge by calling 1-800-862-6668 or writing to Hartford HLS Funds, c/o Individual Annuity Services, P.O. Box 5085, Hartford, CT 06102-5085.
Information on the aggregate remuneration paid to the directors of the Company can be found in the Statement of Operations herein. The Fund pays to The Hartford a portion of the chief compliance officer’s compensation, but does not pay salaries or compensation to any of their other officers or directors who are employed by The Hartford.
Non-Interested Directors
Lynn S. Birdsong (1946) Director since 2003, Co-Chairman of the Investment Committee
Mr. Birdsong is a private investor. Since 2003, Mr. Birdsong has been an independent director of The Japan Fund and has served as a Director of the Sovereign High Yield Fund since April 2010. From 2003 to March 2005, Mr. Birdsong was an independent director of the Atlantic Whitehall Funds. From 1979 to 2002, Mr. Birdsong was a managing director of Zurich Scudder Investments, an investment management firm. During his employment with Scudder, Mr. Birdsong was an interested director of The Japan Fund. Since 1981, Mr. Birdsong has been a partner in Birdsong Company, an advertising specialty firm.
Robert M. Gavin, Jr. (1940) Director since 2002 (HSF) and 1986 (HSF2), Chairman of the Board since 2004
Dr. Gavin is an educational consultant. Prior to September 1, 2001, he was President of Cranbrook Education Community and prior to July 1996, he was President of Macalester College, St. Paul, Minnesota.
Duane E. Hill (1945) Director since 2001 (HSF) and 2002 (HSF2), Chairman of the Nominating Committee
Mr. Hill is Partner of TSG Ventures L.P., a private equity investment company. Mr. Hill is a former partner of TSG Capital Group, a private equity investment firm that served as sponsor and lead investor in leveraged buyouts of middle market companies.
Sandra S. Jaffee (1941) Director since 2005
Ms. Jaffee served as Chairman (2008 to 2009) and Chief Executive Officer of Fortent (formerly Searchspace Group), a leading provider of compliance/regulatory technology to financial institutions from August 2005 to August 2009. From August 2004 to August 2005, Ms. Jaffee served as an Entrepreneur in Residence with Warburg Pincus, a private equity firm. From September 1995 to July 2004, Ms. Jaffee served as Executive Vice President at Citigroup, where she was President and Chief Executive Officer of Citibank’s Global Securities Services (1995 to 2003).
William P. Johnston (1944) Director since 2005, Chairman of the Compliance Committee
In June 2006, Mr. Johnston was appointed as Senior Advisor to The Carlyle Group, a global private equity investment firm. In July 2006, Mr. Johnston was elected to the Board of Directors of MultiPlan, Inc. In August 2007, Mr. Johnston was elected to the Board of Directors of LifeCare Holdings, Inc. In February 2008, Mr. Johnston was elected to the Board of Directors of HCR-ManorCare, Inc. In May 2006, Mr. Johnston was elected to the Supervisory Board of Fresenius Medical Care AG & Co. KGaA, after its acquisition of Renal Care Group, Inc. in March 2006. Mr. Johnston joined Renal Care Group in November 2002 as a member of the Board of Directors and served as Chairman of the Board from March 2003 through March 2006. From September 1987 to December 2002, Mr. Johnston was with Equitable Securities Corporation (and its successors, SunTrust Equitable Securities and SunTrust Robinson Humphrey) serving in various investment banking and managerial positions, including Managing Director and Head of Investment Banking, Chief Executive Officer and Vice Chairman.
Phillip O. Peterson (1944) Director since 2002 (HSF) and 2000 (HSF2), Chairman of the Audit Committee
Mr. Peterson is a mutual fund industry consultant. He was a partner of KPMG LLP (an accounting firm) until July 1999. Mr. Peterson joined William Blair Funds in February 2007 as a member of the Board of Trustees. From January 2004 to April 2005, Mr. Peterson served as Independent President of the Strong Mutual Funds.
Lemma W. Senbet (1946) Director since 2005
Dr. Senbet is the William E. Mayer Chair Professor of Finance and Director, Center for Financial Policy, at the University of Maryland, Robert H. Smith School of Business. He was chair of the Finance Department during 1998 to 2006. Previously he was a chaired professor of finance at the University of Wisconsin-Madison. Also, he was director of the Fortis Funds from March 2000 to July 2002. Dr. Senbet served the finance profession in various capacities, including as director of the American Finance Association and President of the Western Finance Association. In 2006, Dr. Senbet was inducted Fellow of Financial Management Association International for his career-long distinguished scholarship and professional service.
Interested Directors and Officers
Lowndes A. Smith (1939) Director since 1996 (HSF) and 2002 (HSF2), Co-Chairman of the Investment Committee
Mr. Smith served as Vice Chairman of The Hartford from February 1997 to January 2002, as President and Chief Executive Officer of Hartford Life, Inc. from February 1997 to January 2002, and as President and Chief Operating Officer of The Hartford Life Insurance Companies from January 1989 to January 2002. Mr. Smith serves as a Director of White Mountains Insurance Group, Ltd., One Beacon Insurance, Symetra Financial and as a Managing Director of Whittington Gray Associates.
John C. Walters 1, 2 (1962) Director since 2008
Mr. Walters currently serves as President, Chief Executive Officer and Director for Hartford Life, Inc. (“HL, Inc.”). Mr. Walters also serves as President, Chairman of the Board, Chief Executive Officer and Director for Hartford Life Insurance Company (“Hartford Life”), and as Executive Vice President of The Hartford. In addition, Mr. Walters is a Manager of HL Investment Advisors, LLC (“HL Advisors”). Mr. Walters previously served as President of the U.S. Wealth Management Division of HL, Inc. (2006-2007) and as Co-Chief Operating Officer of Hartford Life (2007-2008).
| 1 | Mr. Walters previously served as President and Chief Executive Officer (2007 to 2009). |
| 2 | Effective July 31, 2010, Mr. Walters retired from The Hartford. Mr. Walters resigned his position as a Director of the Fund effective July 30, 2010. |
Other Officers
Robert M. Arena, Jr. (1968) President and Chief Executive Officer since 2009 (served as Vice President of the Fund (2006-2009))
Mr. Arena serves as Executive Vice President of Hartford Life. Additionally, Mr. Arena is Senior Vice President and Director of Hartford Administrative Services Company, (“HASCO”), President, Chief Executive Officer and Manager of Hartford Investment Financial Services, LLC (“HIFSCO”) and President, Chief Executive Officer and Manager of HL Advisors. Mr. Arena joined The Hartford in 2004.
Tamara L. Fagely (1958) Vice President, Treasurer and Controller since 2002 (HSF) 1993 (HSF2)
Ms. Fagely has been a Vice President of HASCO since 1998 and Chief Financial Officer since 2006. Currently Ms. Fagely is a Vice President of Hartford Life. She served as Assistant Vice President of Hartford Life from December 2001 through March 2005. In addition, Ms. Fagely is Controller and Chief Financial Officer of HIFSCO.
Brian Ferrell (1962) AML Compliance Officer since 2008
Mr. Ferrell has served as Assistant Vice President and AML Compliance Officer for The Hartford since 2006, and as AML Compliance Officer for HASCO and Hartford Investor Services Company, LLC (“HISC”) since 2008. Prior to joining The Hartford in 2006, Mr. Ferrell held various positions at the U.S. Department of the Treasury (the “Treasury”) from 2001 to 2006, where he served as Chief Counsel for the Treasury’s Financial Crimes Enforcement Network from 2005-2006.
Dr. Robert J. Froehlich (1953) Senior Managing Director since 2009
Dr. Froehlich joined The Hartford as Senior Managing Director in September 2009. Prior to joining The Hartford, Dr. Froehlich served as Vice Chairman of Deutsche Asset Management from 1997-2009.
| Hartford Index HLS Fund |
| Directors and Officers (Unaudited) – (continued) |
Thomas D. Jones, III (1965) Vice President and Chief Compliance Officer since 2006
Mr. Jones serves as Chief Compliance Officer for the Hartford Mutual Funds and Vice President and Director of Securities Compliance for The Hartford. Mr. Jones joined The Hartford in 2006 from SEI Investments, where he served as Chief Compliance Officer for its mutual funds and investment advisers. Prior to joining SEI, Mr. Jones was First Vice President and Compliance Director for Merrill Lynch Investment Managers (Americas) (“MLIM”), where he worked from 1992-2004.
Edward P. Macdonald (1967) Vice President, Secretary and Chief Legal Officer since 2005
Mr. Macdonald serves as Assistant Vice President of Hartford Life and Chief Legal Officer and Vice President of HIFSCO. He also serves as Vice President and Secretary of HASCO, and Chief Legal Officer, Secretary and Vice President of HL Advisors. Mr. Macdonald joined The Hartford in 2005.
Vernon J. Meyer (1964) Vice President since 2006
Mr. Meyer serves as Senior Vice President of Hartford Life. He also serves as Senior Vice President of HIFSCO and HL Advisors. Mr. Meyer joined The Hartford in 2004.
D. Keith Sloane (1960) Vice President since 2009
Mr. Sloane is a Senior Vice President of Hartford Life. Additionally, Mr. Sloane currently serves as Senior Vice President of HIFSCO, HL Advisors, and HASCO. Prior to joining The Hartford in 2007, Mr. Sloane was Director of product marketing and led the mutual fund business for Wachovia Securities (“Wachovia”) in their investment products group. Mr. Sloane joined Wachovia in 1995.
Jane Wolak (1961) Vice President since 2009
Ms. Wolak currently serves as Vice President of Hartford Life. Ms. Wolak joined Hartford Life as Vice President, Retail Product Services in May 2007. She is also Vice President of HASCO. Previously, Ms. Wolak was with Sun Life Financial where she held the position of Vice President, Service Center Operations from 2001-2007.
A description of the policies and procedures that the Fund uses to determine how to vote proxies relating to portfolio securities and a record of how the Fund voted any proxies for the twelve-month period ended June 30, 2010 is available (1) without charge, upon request, by calling 800-862-6668 and (2) on the Securities and Exchange Commission’s website at http://www.sec.gov.
The Fund files a complete schedule of portfolio holdings with the Commission for the first and third quarters of each fiscal year on Form N-Q. The Fund’s Forms are available (1) without charge, upon request, by calling 800-862-6668 and (2) on the Securities and Exchange Commission’s website at http://www.sec.gov. The Form N-Q may be reviewed and copied at the Commission’s Public Reference Room in Washington, DC. Information on the operation of the Public Reference Room may be obtained by calling 1-800-SEC-0330.
| Hartford Index HLS Fund |
The following proposals were addressed and approved at a Special Meeting of Shareholders held on February 12, 2010.
Proposal to approve amendments to the Investment Management Agreement between the Fund and HL Investment Advisors, the purpose of which were to combine the administrative services for the Fund with the management services for the Fund under a single agreement.
| Fund | For | Against | Abstain | |||
| Hartford Index HLS Fund | 31,589,106.659 | 1,806,411.122 | 1,358,885.199 |
Proposal to elect Lemma Senbet and John Walters, each currently a Director, as Directors of Hartford Series Fund Inc.
Lemma W. Senbet
| Funds | For | Withheld | ||
| Hartford Series Fund, Inc. | 5,079,578,022.902 | 241,839,974.106 |
John C. Walters
| Funds | For | Withheld | ||
| Hartford Series Fund, Inc. | 5,081,138,302.186 | 240,279,694.822 |
| Hartford Index HLS Fund |
Your Fund's Expenses
As a shareholder of the Fund, you incur two types of costs: (1) transaction costs, including sales charges (loads) on purchase payments and contingent deferred sales charges (CDSC) (2) ongoing costs including management fees; distribution fees; and other fund expenses. This example is intended to help you understand your ongoing costs (in dollars) of investing in the Fund and to compare these costs with the ongoing costs of investing in other mutual funds. The example is based on an investment of $1,000 invested at the beginning of the period and held for the period of December 31, 2009 through June 30, 2010.
Actual Expenses
The first set of columns of the table below provides information about actual account values and actual expenses. You may use the information in this column, together with the amount you invested, to estimate the expenses that you paid over the period. Simply divide your account value by $1,000 (for example, an $8,600 account value divided by $1,000 = 8.6), then multiply the result by the number in the line under the heading entitled "Expenses Paid During Period" to estimate the expenses you paid on your account during this period.
Hypothetical Example for Comparison Purposes
The second set of columns of the table below provides information about hypothetical account values and hypothetical expenses based on the Fund's actual expense ratio and an assumed rate of return of 5% per year before expenses, which is not the Fund's actual return. The hypothetical account values and expenses may not be used to estimate the actual ending account balance or expenses you paid for the period. You may use this information to compare the ongoing costs of investing in the Fund and other funds. To do so, compare this 5% hypothetical example with the 5% hypothetical examples that appear in the shareholder reports of the other funds.
Please note that the expenses shown in the table are meant to highlight your ongoing costs only and do not reflect any transactional costs, such as sales charges (loads) and CDSC. Therefore, the second set of columns of the table is useful in comparing ongoing costs only, and will not help you determine the relative total costs of owning different funds. In addition, if these transactional costs were included, your costs would be higher. Expenses are equal to the Fund's annualized expense ratios multiplied by average account value over the period, multiplied by 181/365 (to reflect the one-half year period).
Actual return | Hypothetical (5% return before expenses) | |||||||||||||||||||||||||||||||||||
| Expenses paid | Expenses paid | Days in | ||||||||||||||||||||||||||||||||||
| during the period | during the period | the | Days | |||||||||||||||||||||||||||||||||
| Beginning | Ending | December 31, 2009 | Beginning | Ending | December 31, 2009 | Annualized | current | in the | ||||||||||||||||||||||||||||
| Account Value | Account Value | through | Account Value | Account Value | through | expense | 1/2 | full | ||||||||||||||||||||||||||||
December 31, 2009 | June 30, 2010 | June 30, 2010 | December 31, 2009 | June 30, 2010 | June 30, 2010 | ratio | year | year | ||||||||||||||||||||||||||||
| Class IA | $ | 1,000.00 | $ | 932.17 | $ | 1.63 | $ | 1,000.00 | $ | 1,023.11 | $ | 1.71 | 0.34 | % | 181 | 365 | ||||||||||||||||||||
| Class IB | $ | 1,000.00 | $ | 931.03 | $ | 2.82 | $ | 1,000.00 | $ | 1,021.87 | $ | 2.96 | 0.59 | % | 181 | 365 | ||||||||||||||||||||
| Hartford Index HLS Fund |
The Board approved the annual continuation of the Investment Management Agreement (the “Agreement”) between Hartford Series Fund, Inc. (“HSF”) and HL Investment Advisors, LLC (“HL Advisors”) with respect to the Fund at its meeting on August 4-5, 2009. The Board’s considerations in approving the renewal of the Agreement are disclosed in the December 31, 2009 Annual Report for HSF.
At the November 4-5, 2009 meeting, the Board considered and approved amendments to the Agreement to include administrative services, which had been provided pursuant to a separate agreement, and investment management services under one agreement. The Board, including all of the Independent Directors, approved the amendments to the Agreement with respect to the Fund.
In approving the amendments, in addition to the information presented at the August meeting in connection with the annual review of the Agreement and the additional information provided throughout the year, the Board also considered the fact that the amendments did not result in an overall increase in fees to shareholders. The Board took note of the fact that the management of HL Advisors believes that the proposal to combine the administrative services with the investment management services under a single agreement will produce streamlined fee disclosure, resulting in greater transparency and clarity in the Fund’s prospectuses and financial reports. The Board further noted management's belief that the change would result in consistency across all of the Hartford Funds in the complex in that the funds of HSF are the only funds in the complex (other than the R share classes of the Hartford retail funds) that are subject to a separate administrative services fee. Finally, the Board noted management's view that the proposed changes to the Agreement should also serve to simplify the Board's annual consideration of the investment management arrangements for the Fund in that the investment management and administrative fees would be presented as a single fee for fee comparison purposes, which should facilitate the Board's analysis.
The shareholders of the Fund approved the amendments at a Special Meeting of Shareholders held on February 12, 2010. The amendments were effective as of March 1, 2010.
31
The Hartford
P.O. Box 5085
Hartford, CT 06102–5085
Hartford Series Fund, Inc. is underwritten and distributed by Hartford Securities Distribution Company, Inc.
“The Hartford” is The Hartford Financial Services Group, Inc. and its subsidiaries.
Hartford Series Fund, Inc. inception dates range from 1977 to date. Hartford Series Fund, Inc. is not a subsidiary of The Hartford but is underwritten, distributed by and advised by subsidiaries of The Hartford. Investments in Hartford Series Fund, Inc. are not guaranteed by The Hartford or any other entity.
This material is authorized for distribution only when preceded or accompanied by a current prospectus. The prospectus contains detailed information about the Funds, including investment objectives, risks and charges and expenses. Please read it carefully before you invest or send money.
HLSSAR-IX10 Printed in U.S.A ©2010 The Hartford, Hartford, CT 06115 |
| Hartford International Opportunities HLS Fund |
|
Hartford International Opportunities HLS Fund
| Manager Discussions (Unaudited) | 2 |
| Financial Statements | |
| 4 | |
| 7 | |
| 9 | |
| 10 | |
| 11 | |
| 12 | |
| 24 | |
| 26 | |
| 28 | |
| 28 | |
| 29 | |
| 30 | |
| 31 |
This report is prepared for the general information of contract owners and qualified retirement plan participants. It is not an offer of contracts or of qualified retirement plans. It should not be used in connection with any offer, except in conjunction with the appropriate prospectus which contains all pertinent information including the applicable sales, administrative and other charges.
The views expressed in the Fund’s Manager Discussion under ‘‘Why did the Fund perform this way?’’ and ‘‘What is the outlook?’’ are views of the Fund’s subadvisers and portfolio management team through the end of the period and is subject to change based on market and other conditions.
Hartford International Opportunities HLS Fund inception 07/02/1990
(subadvised by Wellington Management Company, LLP)
Investment objective – Seeks long-term growth of capital.
Performance Overview(1) 6/30/00 - 6/30/10
Growth of $10,000 investment

MSCI All Country World Free ex U.S. Index is a broad-based, unmanaged, market capitalization-weighted, total return index that measures the performance of both developed and emerging stock markets, excluding the U.S. The index is calculated to exclude companies and share classes which cannot be freely purchased by foreigners.
You cannot invest directly in an index.
The chart represents a hypothetical investment in the Fund. Performance data represents past performance and current performance could be higher or lower.
Average Annual Returns (as of 6/30/10)
6 Month† | 1 Year | 5 Year | 10 Year | |
| International Opportunities IA | -11.00% | 10.10% | 4.63% | 1.39% |
| International Opportunities IB | -11.11% | 9.83% | 4.36% | 1.15% |
| MSCI All Country World Free ex | -10.80% | 10.87% | 3.84% | 2.29% |
| U.S. Index |
| † | Not Annualized |
PAST PERFORMANCE IS NOT INDICATIVE OF FUTURE RESULTS.
| (1) | Growth of a $10,000 investment in Class IB shares will vary from the results seen on this page due to differences in the expense charged to this share class. |
Performance information may reflect historical or current expense waivers from the investment adviser, without which performance would have been lower. For information on current expense waivers/reimbursements, please see the prospectus.
The value of the contract will fluctuate so that when redeemed, it may be worth more or less than the original investment. The chart and table do not reflect the deduction of taxes that a shareholder would pay on portfolio distributions or the redemption of portfolio shares. The figures do not include sales charges or other fees which may be applied at the variable life insurance, variable annuity or qualified retirement plan product level. Any such additional sales charges or other fees would lower the Fund’s performance.
| Portfolio Managers | |
| Nicolas M. Choumenkovitch | Tara Connolly Stilwell, CFA |
| Senior Vice President, Partner | Vice President |
How did the Fund perform?
The Class IA shares of the Hartford International Opportunities HLS Fund returned -11.00% for the six-month period ended June 30, 2010, underperforming its benchmark, the MSCI All Country World Free ex U.S. Index, which returned -10.80% for the same period. The Fund outperformed the -12.51% return of the average fund in the Lipper International Core Funds VP-UF peer group, a group of funds with investment strategies similar to those of the Fund.
Why did the Fund perform this way?
The period was marked by volatility in the equity markets as concerns about a debt default in Greece, the impacts of tightening Chinese monetary policy, and stubbornly high U.S. unemployment pressured stocks early in the year. Generally, strong earnings reports and a belief that the global economy is finding its footing briefly provided a lift to equities later in the period before stocks fell to end the first half of the year.
Sector returns within the MSCI All Country World Free ex U.S. Index diverged widely during the period. Energy (-19%), Financials (-14%) and Utilities (-13%) declined the most, while Consumer Staples (-4%), Industrials (-5%) and Consumer Discretionary (-6%) declined the least on a relative basis.
Stock selection was weakest in Materials, Consumer Discretionary and Utilities. Stock selection was positive within Industrials, Financials, and Telecommunication Services. Allocation among sectors, a result of the bottom-up (i.e. stock by stock fundamental research) stock selection process, was helpful to relative returns, largely due to overweight (i.e. the Fund’s sector position was greater than the benchmark position) positions in Consumer Discretionary and Industrials, and underweight (i.e. the Fund’s sector position was less than the benchmark position) positions in Energy and Utilities.
The largest detractors from relative returns were British Petroleum (Energy), Red Electrica (Utilities), and Xstrata (Materials). Shares of UK-based global integrated oil company British Petroleum continued to decline in the aftermath of the catastrophic oil spill at its Deepwater
Horizon project in the Gulf of Mexico. Shares of Spanish electric utility Red Electrica fell on fears over Spanish sovereign risk and concerns that a potential reduction in returns allowed for wind and solar producers could slow the company's growth. Concerns about Australia’s proposed Resource Super Profit Tax and weaker commodity prices weighed on shares of diversified mining company Xstrata. In addition, our positions in UBS (Financials) and Barclays (Financials) were among the top detractors from absolute returns.
Top contributors to relative (i.e. performance of the Fund as measured against the benchmark) performance during the period included Safran (Industrials), Mitsui Osk Lines (Industrials), and Banco Santander (Financials). Shares of France-based high-technology company Safran rose as the company posted strong returns during the quarter due to a better-than-expected outlook for a rebound in air traffic. Shares of international shipping company Mitsui Osk Lines rose following company management’s upward earnings guidance and their expectations for increasing demand growth from China. Our underweight position relative to the benchmark in Spain-based bank holding company Banco Santander helped relative returns. Spain’s sovereign risk concerns have weighed on the company’s stock price despite a recent recovery in the company’s profits. Other notable contributors to absolute returns included Volvo (Industrials) and Hino Motors (Industrials).
What is the outlook?
Global equity markets have come under pressure as credit fears resurfaced, especially in Europe. We believe there are early indications of a coming global growth slowdown. With inflation generally absent, we expect no rate hikes from any of the major central banks in the near future. The sovereign debt crisis in Europe is likely only a precursor for the fiscal challenges many developed world countries have to face in coming years. We believe the emerging countries continue to have superior macroeconomic fundamentals and are expected to provide some offset in an otherwise slowing global growth environment.
Consistent with our investment philosophy, we continue to look for companies that can deliver strong or improving returns regardless of the macroeconomic backdrop. At the end of the period, we were most overweight Industrials and Consumer Discretionary, and most underweight Telecommunication Services, Materials, and Energy, relative to the benchmark. Regionally we ended the period overweight Europe, in particular the United Kingdom and Switzerland, and underweight Asia-Pacific ex-Japan and the Emerging Markets relative to the benchmark.
Diversification by Industry
as of June 30, 2010
| Percentage of | ||||
| Industry (Sector) | Net Assets | |||
| Automobiles & Components (Consumer Discretionary) | 4.4 | % | ||
| Banks (Financials) | 16.4 | |||
| Capital Goods (Industrials) | 7.3 | |||
| Commercial & Professional Services (Industrials) | 2.3 | |||
| Consumer Durables & Apparel (Consumer Discretionary) | 2.7 | |||
| Consumer Services (Consumer Discretionary) | 1.1 | |||
| Diversified Financials (Financials) | 4.6 | |||
| Food, Beverage & Tobacco (Consumer Staples) | 6.7 | |||
| Health Care Equipment & Services (Health Care) | 1.5 | |||
| Household & Personal Products (Consumer Staples) | 0.4 | |||
| Insurance (Financials) | 1.3 | |||
| Materials (Materials) | 8.9 | |||
| Media (Consumer Discretionary) | 3.4 | |||
| Pharmaceuticals, Biotechnology & Life Sciences (Health Care) | 6.5 | |||
| Real Estate (Financials) | 3.7 | |||
| Retailing (Consumer Discretionary) | 1.8 | |||
| Software & Services (Information Technology) | 0.6 | |||
| Technology Hardware & Equipment (Information Technology) | 4.0 | |||
| Telecommunication Services (Services) | 3.1 | |||
| Transportation (Industrials) | 5.8 | |||
| Utilities (Utilities) | 3.3 | |||
| Short-Term Investments | 0.7 | |||
| Other Assets and Liabilities | 1.8 | |||
| Total | 100.0 | % | ||
Diversification by Country
as of June 30, 2010
| Percentage of | ||||
| Country | Net Assets | |||
| Brazil | 2.4 | % | ||
| Canada | 1.7 | |||
| Chile | 0.9 | |||
| China | 3.7 | |||
| Colombia | 0.7 | |||
| Denmark | 0.9 | |||
| Finland | 1.2 | |||
| France | 8.0 | |||
| Germany | 5.1 | |||
| Hong Kong | 4.6 | |||
| India | 1.7 | |||
| Indonesia | 1.1 | |||
| Ireland | 2.2 | |||
| Israel | 2.6 | |||
| Italy | 2.6 | |||
| Japan | 8.5 | |||
| Malaysia | 0.1 | |||
| Mexico | 1.1 | |||
| Netherlands | 0.9 | |||
| Panama | 0.4 | |||
| Russia | 0.8 | |||
| South Africa | 0.7 | |||
| Spain | 2.4 | |||
| Sweden | 2.7 | |||
| Switzerland | 13.0 | |||
| Taiwan | 1.9 | |||
| Turkey | 1.2 | |||
| United Kingdom | 23.0 | |||
| United States | 1.4 | |||
| Short-Term Investments | 0.7 | |||
| Other Assets and Liabilities | 1.8 | |||
| Total | 100.0 | % | ||
| Hartford International Opportunities HLS Fund |
June 30, 2010 (Unaudited) (000’s Omitted) |
Shares or Principal Amount | Market Value ╪ | |||||
| COMMON STOCKS - 97.5% | ||||||
| Brazil - 2.4% | ||||||
| 240 | Cia de Concessoes Rodoviarias | $ | 4,920 | |||
| 550 | Hypermarcas S.A. ● | 7,054 | ||||
| 1,241 | Itau Unibanco Banco Multiplo S.A. ADR | 22,348 | ||||
| 218 | Itau Unibanco Holding S.A. ADR ■ | 3,919 | ||||
| 706 | Julio Simoes Logistica S.A. ● | 3,208 | ||||
| 41,449 | ||||||
| Canada - 1.7% | ||||||
| 8 | Potash Corp. of Saskatchewan, Inc. | 668 | ||||
| 329 | Potash Corp. of Saskatchewan, Inc. ADR | 28,363 | ||||
| 29,031 | ||||||
| Chile - 0.9% | ||||||
| 776 | Enersis S.A. ADS | 15,452 | ||||
| China - 3.7% | ||||||
| 891 | China Life Insurance Co., Ltd. | 3,897 | ||||
| 8,603 | China Merchants Bank Co., Ltd. | 20,581 | ||||
| 181 | Ctrip.com International Ltd. ADR ● | 6,809 | ||||
| 2,848 | Dongfeng Motor Group Co., Ltd. | 3,304 | ||||
| 19,029 | Industrial and Commercial Bank of China | 13,831 | ||||
| 46 | Perfect World Co., Ltd. ADR ● | 1,013 | ||||
| 742 | Ping An Insurance (Group) Co. ⌂† | 6,128 | ||||
| 357 | Tencent Holdings Ltd. | 5,911 | ||||
| 61,474 | ||||||
| Colombia - 0.7% | ||||||
| 241 | Bancolombia S.A. ADR | 12,071 | ||||
| Denmark - 0.9% | ||||||
| 1,128 | DSV A/S | 16,247 | ||||
| Finland - 1.2% | ||||||
| 296 | Kone Oyj Class B | 11,796 | ||||
| 244 | Outotec Oyj | 7,588 | ||||
| 19,384 | ||||||
| France - 8.0% | ||||||
| 2,952 | Alcatel S.A. | 7,518 | ||||
| 372 | BNP Paribas | 20,038 | ||||
| 759 | Groupe Danone | 40,708 | ||||
| 495 | Safran S.A. | 13,800 | ||||
| 304 | Schneider Electric S.A. | 30,687 | ||||
| 230 | Societe Generale Class A | 9,481 | ||||
| 85 | Unibail-Rodamco SE | 13,774 | ||||
| 136,006 | ||||||
| Germany - 5.1% | ||||||
| 196 | Continental AG | 10,155 | ||||
| 775 | Daimler AG | 39,213 | ||||
| 316 | HeidelbergCement AG | 14,929 | ||||
| 243 | Siemens AG | 21,753 | ||||
| 86,050 | ||||||
| Hong Kong - 4.6% | ||||||
| 3,243 | Esprit Holdings Ltd. | 17,419 | ||||
| 14,650 | Geely Automobile Holdings Ltd. | 4,439 | ||||
| 6,127 | Hang Lung Properties Ltd. | 23,436 | ||||
| 3,336 | Shangri-La Asia Ltd. | 6,157 | ||||
| 1,747 | Skyworth Digital Holdings Ltd. | 1,152 | ||||
| 1,943 | Sun Hung Kai Properties Ltd. | 26,576 | ||||
| 79,179 | ||||||
| India - 1.7% | ||||||
| 83 | HDFC Bank Ltd. ADR | 11,821 | ||||
| 726 | Reliance Industries Ltd. | 16,899 | ||||
| 28,720 | ||||||
| Indonesia - 1.1% | ||||||
| 13,046 | Bank Central Asia PT | 8,488 | ||||
| 14,525 | Bank Mandiri TBK | 9,518 | ||||
| 18,006 | ||||||
| Ireland - 2.2% | ||||||
| 1,327 | CRH plc | 27,340 | ||||
| 971 | Ryanair Holdings plc ● | 4,258 | ||||
| 178 | Ryanair Holdings plc ADR ● | 4,830 | ||||
| 36,428 | ||||||
| Israel - 2.6% | ||||||
| 839 | Teva Pharmaceutical Industries Ltd. ADR | 43,635 | ||||
| Italy - 2.6% | ||||||
| 4,592 | Intesa Sanpaolo | 12,093 | ||||
| 8,218 | Snam Rete Gas S.p.A. | 32,795 | ||||
| 44,888 | ||||||
| Japan - 8.5% | ||||||
| 1,073 | Bridgestone Corp. | 16,958 | ||||
| 286 | Eisai Co., Ltd. | 9,499 | ||||
| 7,950 | Hitachi Ltd. | 28,877 | ||||
| 2 | KDDI Corp. | 8,542 | ||||
| 3,466 | Mitsubishi UFJ Financial Group, Inc. | 15,739 | ||||
| 2,028 | Mitsui O.S.K. Lines Ltd. | 13,405 | ||||
| 329 | Nikon Corp. | 5,663 | ||||
| 151 | Osaka Titanium Technologies | 5,799 | ||||
| 826 | Sekisui House Ltd. | 7,064 | ||||
| 375 | Softbank Corp. | 9,958 | ||||
| 1 | Sony Financial Holdings, Inc. | 2,935 | ||||
| 3,364 | Sumitomo Metal Industries | 7,606 | ||||
| 264 | Toho Titanium Co., Ltd. | 6,296 | ||||
| 269 | Tokio Marine Holdings, Inc. | 7,069 | ||||
| 145,410 | ||||||
| Malaysia - 0.1% | ||||||
| 6,249 | AirAsia Berhad ● | 2,400 | ||||
| Mexico - 1.1% | ||||||
| 387 | America Movil S.A. de C.V. ADR | 18,373 | ||||
| Netherlands - 0.9% | ||||||
| 1,170 | Koninklijke (Royal) KPN N.V. | 14,911 | ||||
| Panama - 0.4% | ||||||
| 150 | Copa Holdings S.A. Class A | 6,611 | ||||
| Russia - 0.8% | ||||||
| 244 | Lukoil ADR | 12,650 | ||||
| South Africa - 0.7% | ||||||
| 510 | Impala Platinum Holdings Ltd. | 11,878 | ||||
| Spain - 2.4% | ||||||
| 232 | Red Electrica Corporacion S.A. | 8,300 | ||||
| 1,604 | Repsol YPF S.A. | 32,377 | ||||
| 40,677 | ||||||
| Sweden - 2.7% | ||||||
| 2,181 | Atlas Copco Ab | 31,894 | ||||
The accompanying notes are an integral part of these financial statements.
| Shares or Principal Amount | Market Value ╪ | ||||||||||
| COMMON STOCKS - 97.5% - (continued) | |||||||||||
| Sweden - 2.7% - (continued) | |||||||||||
| 501 | Hennes & Mauritz Ab | $ | 13,779 | ||||||||
| 90 | Volvo Ab Class B | 991 | |||||||||
| 46,664 | |||||||||||
| Switzerland - 13.0% | |||||||||||
| 674 | CIE Financiere Richemont S.A. | 23,515 | |||||||||
| 573 | Julius Baer Group Ltd. | 16,351 | |||||||||
| 215 | Kuehne & Nagel International AG | 22,114 | |||||||||
| 644 | Nestle S.A. | 31,052 | |||||||||
| 288 | Roche Holding AG | 39,629 | |||||||||
| 14 | SGS S.A. | 19,357 | |||||||||
| 66 | Synthes, Inc. | 7,608 | |||||||||
| 4,606 | UBS AG | 61,023 | |||||||||
| 220,649 | |||||||||||
| Taiwan - 1.9% | |||||||||||
| 5,029 | Hon Hai Precision Industry Co., Ltd. ● | 17,627 | |||||||||
| 3,606 | Synnex Technology International Corp. | 7,804 | |||||||||
| 3,867 | WPG Holdings Co., Ltd. | 7,128 | |||||||||
| 32,559 | |||||||||||
| Turkey - 1.2% | |||||||||||
| 4,650 | Turkiye Garanti Bankasi A.S. | 19,350 | |||||||||
| United Kingdom - 23.0% | |||||||||||
| 376 | AstraZeneca plc | 17,743 | |||||||||
| 7,956 | Barclays Bank plc | 31,758 | |||||||||
| 2,418 | BG Group plc | 35,964 | |||||||||
| 6,130 | BP plc | 29,346 | |||||||||
| 7,202 | British Airways plc | 20,924 | |||||||||
| 1,727 | Capital Group plc | 19,025 | |||||||||
| 2,209 | HSBC Holdings plc | 20,185 | |||||||||
| 1,507 | Imperial Tobacco Group plc | 42,118 | |||||||||
| 30,832 | Lloyds Banking Group plc | 24,341 | |||||||||
| 1,474 | Pearson plc | 19,385 | |||||||||
| 1,776 | Persimmon plc | 9,220 | |||||||||
| 328 | Prudential plc | 2,476 | |||||||||
| 2,349 | Reed Elsevier Capital, Inc. | 17,421 | |||||||||
| 2,442 | Rexam plc | 10,985 | |||||||||
| 873 | Rio Tinto plc | 38,345 | |||||||||
| 921 | Standard Chartered plc | 22,416 | |||||||||
| 2,382 | Thomas Cook Group plc | 6,305 | |||||||||
| 220 | Wolseley plc | 4,369 | |||||||||
| 2,197 | WPP plc | 20,694 | |||||||||
| 393,020 | |||||||||||
| United States - 1.4% | |||||||||||
| 456 | Covidien plc | 18,318 | |||||||||
| 154 | Frontline Ltd. | 4,389 | |||||||||
| 59 | Netease.com, Inc. ● | 1,871 | |||||||||
| 24,578 | |||||||||||
Total common stocks (cost $1,766,297) | $ | 1,657,750 | |||||||||
Total long-term investments (cost $1,766,297) | $ | 1,657,750 | |||||||||
| SHORT-TERM INVESTMENTS - 0.7% | |||||||||||
| Repurchase Agreements - 0.7% | |||||||||||
| Bank of America TriParty Joint Repurchase | |||||||||||
| Agreement (maturing on 07/01/2010 in the | |||||||||||
| amount of $4,013, collateralized by | |||||||||||
| FHLMC 5.50%, 2039, FNMA 4.50% - | |||||||||||
| 5.50%, 2038 - 2040, GNMA 5.00%, 2040, | |||||||||||
| value of $4,094) | |||||||||||
| $ | 4,013 | 0.05%, 6/30/2010 | $ | 4,013 | |||||||
| BNP Paribas Securities Corp. TriParty Joint | |||||||||||
| Repurchase Agreement (maturing on | |||||||||||
| 07/01/2010 in the amount of $688, | |||||||||||
| collateralized by FNMA 4.50% - 6.50%, | |||||||||||
| 2024 - 2040, GNMA 5.00% - 6.50%, 2038 | |||||||||||
| - 2040, value of $702) | |||||||||||
| 688 | 0.04%, 6/30/2010 | 688 | |||||||||
| Deutsche Bank Securities TriParty Joint | |||||||||||
| Repurchase Agreement (maturing on | |||||||||||
| 07/01/2010 in the amount of $3,039, | |||||||||||
| collateralized by GNMA 3.13% - 7.00%, | |||||||||||
| 2023 - 2052, value of $3,100) | |||||||||||
| 3,039 | 0.05%, 6/30/2010 | 3,039 | |||||||||
| JP Morgan Chase TriParty Joint Repurchase | |||||||||||
| Agreement (maturing on 07/01/2010 in the | |||||||||||
| amount of $688, collateralized by FHLMC | |||||||||||
| 2.38% - 5.83%, 2033 - 2038, value of | |||||||||||
| $702) | |||||||||||
| 688 | 0.06%, 6/30/2010 | 688 | |||||||||
| Morgan Stanley & Co., Inc. TriParty Joint | |||||||||||
| Repurchase Agreement (maturing on | |||||||||||
| 07/01/2010 in the amount of $2,997, | |||||||||||
| collateralized by FHLMC 5.00% - 5.50%, | |||||||||||
| 2038 - 2039, FNMA 5.00%, 2039, value of | |||||||||||
| $3,069) | |||||||||||
| 2,997 | 0.03%, 6/30/2010 | 2,997 | |||||||||
| UBS Securities, Inc. Repurchase Agreement | |||||||||||
| (maturing on 07/01/2010 in the amount of | |||||||||||
| $35, collateralized by U.S. Treasury Bill | |||||||||||
| 0.88%, 2011, value of $36) | |||||||||||
| 35 | 0.02%, 6/30/2010 | 35 | |||||||||
| UBS Securities, Inc. TriParty Joint | |||||||||||
| Repurchase Agreement (maturing on | |||||||||||
| 07/01/2010 in the amount of $758, | |||||||||||
| collateralized by FNMA 5.00% - 6.00%, | |||||||||||
| 2033 - 2036, value of $774) | |||||||||||
| 758 | 0.09%, 6/30/2010 | 758 | |||||||||
| 12,218 | |||||||||||
Total short-term investments (cost $12,218) | $ | 12,218 | |||||||||
Total investments (cost $1,778,515) ▲ | 98.2 | % | $ | 1,669,968 | |||||||
| Other assets and liabilities | 1.8 | % | 30,335 | ||||||||
| Total net assets | 100.0 | % | $ | 1,700,303 | |||||||
| Note: | Percentage of investments as shown is the ratio of the total market value to total net assets. Market value of investments in foreign securities represents 96.1% of total net assets at June 30, 2010. |
The accompanying notes are an integral part of these financial statements.
| Hartford International Opportunities HLS Fund |
Schedule of Investments – (continued) June 30, 2010 (Unaudited) (000’s Omitted) |
Foreign securities that are principally traded on certain foreign markets are adjusted daily pursuant to a third party pricing service methodology approved by the Board of Directors in order to reflect an adjustment for factors occurring after the close of the foreign market but before the close of the New York Stock Exchange.
| ▲ | At June 30, 2010, the cost of securities for federal income tax purposes was $1,802,466 and the aggregate gross unrealized appreciation and depreciation based on that cost were: |
| Unrealized Appreciation | $ | 50,015 | ||
| Unrealized Depreciation | (182,513 | ) | ||
| Net Unrealized Depreciation | $ | (132,498 | ) |
| † | The aggregate value of securities valued in good faith at fair value as determined under policies and procedures established by and under the supervision of the Fund's Board of Directors at June 30, 2010, was $6,128, which represents 0.36% of total net assets. This amount excludes securities that are principally traded in certain foreign markets and whose prices are adjusted pursuant to a third party pricing service methodology approved by the Board of Directors. |
| ● | Currently non-income producing. |
| ■ | Securities issued within terms of a private placement memorandum, exempt from registration under Rule 144A under the Securities Act of 1933, as amended, and may be sold only to qualified institutional buyers. Pursuant to guidelines adopted by the Board of Directors, these issues are determined to be liquid. The aggregate value of these securities at June 30, 2010, was $3,919, which represents 0.23% of total net assets. |
| ⌂ | The following securities are considered illiquid. Illiquid securities are often purchased in private placement transactions, are often not registered under the Securities Act of 1933 and may have contractual restrictions on resale. A security may also be considered illiquid if the security lacks a readily available market or if its valuation has not changed for a certain period of time. |
| Period | Shares/ | ||||||||
| Acquired | Par | Security | Cost Basis | ||||||
| 05/2010 | 742 | Ping An Insurance (Group) Co. | $ | 5,796 | |||||
The aggregate value of these securities at June 30, 2010 was $6,128 which represents 0.36% of total net assets.
Forward Foreign Currency Contracts Outstanding at June 30, 2010
| Unrealized | |||||||||||||
| Market | Contract | Delivery | Appreciation/ | ||||||||||
| Description | Value ╪ | Amount | Date | (Depreciation) | |||||||||
| British Pound (Sell) | $ | 2,933 | $ | 2,964 | 07/01/10 | $ | 31 | ||||||
| British Pound (Sell) | 15,708 | 15,862 | 07/02/10 | 154 | |||||||||
| British Pound (Sell) | 4,769 | 4,773 | 07/06/10 | 4 | |||||||||
| Euro (Sell) | 5,004 | 5,024 | 07/01/10 | 20 | |||||||||
| Japanese Yen (Sell) | 5,178 | 5,126 | 07/01/10 | (52 | ) | ||||||||
| Japanese Yen (Buy) | 2,085 | 2,078 | 07/02/10 | 7 | |||||||||
| Swedish Krona (Sell) | 1,003 | 1,004 | 07/06/10 | 1 | |||||||||
| $ | 165 | ||||||||||||
| ╪ | See Significant Accounting Policies of accompanying Notes to Financial Statements regarding valuation of securities. |
Currency Concentration on Securities at June 30, 2010
| Percentage of | ||||
| Description | Net Assets | |||
| Brazilian Real | 0.9 | % | ||
| British Pound | 23.0 | |||
| Canadian Dollar | 1.7 | |||
| Danish Kroner | 0.9 | |||
| Euro | 22.1 | |||
| Hong Kong Dollar | 7.8 | |||
| Indian Rupee | 1.0 | |||
| Indonesian New Rupiah | 1.1 | |||
| Japanese Yen | 8.5 | |||
| Malaysian Ringgit | 0.1 | |||
| South African Rand | 0.7 | |||
| Swedish Krona | 2.7 | |||
| Swiss Franc | 13.0 | |||
| Taiwanese Dollar | 1.9 | |||
| Turkish New Lira | 1.2 | |||
| United States Dollar | 11.6 | |||
| Other Assets and Liabilities | 1.8 | |||
| Total | 100.0 | % | ||
The accompanying notes are an integral part of these financial statements.
| Hartford International Opportunities HLS Fund |
June 30, 2010 (Unaudited) (000’s Omitted) |
| Total | Level 1 ♦ | Level 2♦ | Level 3 | |||||||||||||
| Assets: | ||||||||||||||||
| Common Stocks | ||||||||||||||||
| Brazil | $ | 41,449 | $ | 41,449 | $ | – | $ | – | ||||||||
| Canada | 29,031 | 29,031 | – | – | ||||||||||||
| Chile | 15,452 | 15,452 | – | – | ||||||||||||
| China | 61,474 | 7,822 | 47,524 | 6,128 | ||||||||||||
| Colombia | 12,071 | 12,071 | – | – | ||||||||||||
| Denmark | 16,247 | – | 16,247 | – | ||||||||||||
| Finland | 19,384 | – | 19,384 | – | ||||||||||||
| France | 136,006 | – | 136,006 | – | ||||||||||||
| Germany | 86,050 | – | 86,050 | – | ||||||||||||
| Hong Kong | 79,179 | – | 79,179 | – | ||||||||||||
| India | 28,720 | 11,821 | 16,899 | – | ||||||||||||
| Indonesia | 18,006 | – | 18,006 | – | ||||||||||||
| Ireland | 36,428 | 4,830 | 31,598 | – | ||||||||||||
| Israel | 43,635 | 43,635 | – | – | ||||||||||||
| Italy | 44,888 | – | 44,888 | – | ||||||||||||
| Japan | 145,410 | – | 145,410 | – | ||||||||||||
| Malaysia | 2,400 | – | 2,400 | – | ||||||||||||
| Mexico | 18,373 | 18,373 | – | – | ||||||||||||
| Netherlands | 14,911 | – | 14,911 | – | ||||||||||||
| Panama | 6,611 | 6,611 | – | – | ||||||||||||
| Russia | 12,650 | 12,650 | – | – | ||||||||||||
| South Africa | 11,878 | – | 11,878 | – | ||||||||||||
| Spain | 40,677 | – | 40,677 | – | ||||||||||||
| Sweden | 46,664 | – | 46,664 | – | ||||||||||||
| Switzerland | 220,649 | – | 220,649 | – | ||||||||||||
| Taiwan | 32,559 | – | 32,559 | – | ||||||||||||
| Turkey | 19,350 | – | 19,350 | – | ||||||||||||
| United Kingdom | 393,020 | – | 393,020 | – | ||||||||||||
| United States | 24,578 | 24,578 | – | – | ||||||||||||
| Total | 1,657,750 | 228,323 | 1,423,299 | 6,128 | ||||||||||||
| Short-Term Investments | 12,218 | – | 12,218 | – | ||||||||||||
| Total | $ | 1,669,968 | $ | 228,323 | $ | 1,435,517 | $ | 6,128 | ||||||||
| Forward Foreign Currency Contracts* | 217 | – | 217 | – | ||||||||||||
| Total | $ | 217 | $ | – | $ | 217 | $ | – | ||||||||
| Liabilities: | ||||||||||||||||
| Forward Foreign Currency Contracts* | 52 | – | 52 | – | ||||||||||||
| Total | $ | 52 | $ | – | $ | 52 | $ | – | ||||||||
| ♦ | For the period ended June 30, 2010, there were no significant transfers between Level 1 and Level 2. |
| * | Derivative instruments not reflected in the Schedule of Investments are valued at the unrealized appreciation/depreciation on the investments. |
The accompanying notes are an integral part of these financial statements.
| Hartford International Opportunities HLS Fund |
Investment Valuation Hierarchy Level Summary – (continued) June 30, 2010 (Unaudited) (000’s Omitted) |
Following is a reconciliation of Level 3 assets for which significant unobservable inputs were used to determine fair value:
| Balance as | Change in | |||||||||||||||||||||||||||||||||||
| of | Realized | Unrealized | Transfers | Transfers | Balance | |||||||||||||||||||||||||||||||
| December | Gain | Appreciation | Net | Into | Out of | as of June | ||||||||||||||||||||||||||||||
31, 2009 | (Loss) | (Depreciation) | Amortization | Purchases | Sales | Level 3 * | Level 3* | 30, 2010 | ||||||||||||||||||||||||||||
| Assets: | ||||||||||||||||||||||||||||||||||||
| Common Stock | $ | — | $ | — | $ | 332 | † | $ | — | $ | — | $ | — | $ | 5,796 | $ | — | $ | 6,128 | |||||||||||||||||
| Total | $ | — | $ | — | $ | 332 | $ | — | $ | — | $ | — | $ | 5,796 | $ | — | $ | 6,128 | ||||||||||||||||||
| * | Securities are transferred into and out of Level 3 for a variety of reasons including, but not limited to: |
| 1) | Securities where trading has been halted- transfer into Level 3 versus securities where trading has resumed - transfer out of Level 3. |
| 2) | Broker quoted securities - transfer into Level 3 versus quoted prices in active markets - transfer out of Level 3. |
| 3) | Securities that have certain restrictions on trading - transfer into Level 3 versus securities where trading restrictions have expired - transfer out of Level 3. |
| † | Change in unrealized gains or losses in the current period relating to assets still held at June 30, 2010 was $332. |
The accompanying notes are an integral part of these financial statements.
| Hartford International Opportunities HLS Fund |
June 30, 2010 (Unaudited) (000’s Omitted) |
| Assets: | ||||
| Investments in securities, at market value (cost $1,778,515) | $ | 1,669,968 | ||
| Foreign currency on deposit with custodian (cost $654) | 653 | |||
| Unrealized appreciation on forward foreign currency contracts | 217 | |||
| Receivables: | ||||
| Investment securities sold | 42,663 | |||
| Fund shares sold | 492 | |||
| Dividends and interest | 2,775 | |||
| Other assets | 2 | |||
| Total assets | 1,716,770 | |||
| Liabilities: | ||||
| Unrealized depreciation on forward foreign currency contracts | 52 | |||
| Bank overdraft — U.S. Dollars | 144 | |||
| Payables: | ||||
| Investment securities purchased | 14,629 | |||
| Fund shares redeemed | 1,188 | |||
| Investment management fees | 263 | |||
| Distribution fees | 16 | |||
| Accrued expenses | 175 | |||
| Total liabilities | 16,467 | |||
| Net assets | $ | 1,700,303 | ||
| Summary of Net Assets: | ||||
| Capital stock and paid-in-capital | $ | 2,679,120 | ||
| Accumulated undistributed net investment income | 11,800 | |||
| Accumulated net realized loss on investments and foreign currency transactions | (882,152 | ) | ||
| Unrealized depreciation of investments and the translations of assets and liabilities denominated in foreign currency | (108,465 | ) | ||
| Net assets | $ | 1,700,303 | ||
| Shares authorized | 2,625,000 | |||
| Par value | $ | 0.001 | ||
Class IA: Net asset value per share | $ | 9.80 | ||
| Shares outstanding | 144,330 | |||
| Net assets | $ | 1,414,706 | ||
Class IB: Net asset value per share | $ | 9.91 | ||
| Shares outstanding | 28,816 | |||
| Net assets | $ | 285,597 | ||
The accompanying notes are an integral part of these financial statements.
| Hartford International Opportunities HLS Fund |
For the Six-Month Period Ended June 30, 2010 (Unaudited) (000’s Omitted) |
| Investment Income: | ||||
| Dividends | $ | 20,054 | ||
| Interest | 14 | |||
| Less: Foreign tax withheld | (2,181 | ) | ||
| Total investment income, net | 17,887 | |||
| Expenses: | ||||
| Investment management fees | 4,961 | |||
| Administrative service fees | 460 | |||
| Transfer agent fees | 2 | |||
| Distribution fees - Class IB | 314 | |||
| Custodian fees | 57 | |||
| Accounting services fees | 128 | |||
| Board of Directors' fees | 16 | |||
| Audit fees | 15 | |||
| Other expenses | 212 | |||
| Total expenses (before fees paid indirectly) | 6,165 | |||
| Commission recapture | (33 | ) | ||
| Total fees paid indirectly | (33 | ) | ||
| Total expenses, net | 6,132 | |||
| Net investment income | 11,755 | |||
| Net Realized Gain on Investments and Foreign Currency Transactions: | ||||
| Net realized gain on investments | 128,747 | |||
| Net realized gain on forward foreign currency contracts | 3,453 | |||
| Net realized loss on other foreign currency transactions | (451 | ) | ||
| Net Realized Gain on Investments and Foreign Currency Transactions | 131,749 | |||
| Net Changes in Unrealized Depreciation of Investments and Foreign Currency Transactions: | ||||
| Net unrealized depreciation of investments | (384,743 | ) | ||
| Net unrealized depreciation of forward foreign currency contracts | (1,812 | ) | ||
| Net unrealized depreciation on translation of other assets and liabilities in foreign currencies | (124 | ) | ||
| Net Changes in Unrealized Depreciation of Investments and Foreign Currency Transactions | (386,679 | ) | ||
| Net Loss on Investments and Foreign Currency Transactions | (254,930 | ) | ||
| Net Decrease in Net Assets Resulting from Operations | $ | (243,175 | ) | |
The accompanying notes are an integral part of these financial statements.
| Hartford International Opportunities HLS Fund |
(000’s Omitted) |
| For the | ||||||||
| Six-Month | For the | |||||||
| Period Ended | Year Ended | |||||||
| June 30, 2010 | December 31, | |||||||
| (Unaudited) | 2009 | |||||||
| Operations: | ||||||||
| Net investment income | $ | 11,755 | $ | 20,978 | ||||
| Net realized gain (loss) on investments and foreign currency transactions | 131,749 | (73,223 | ) | |||||
| Net unrealized appreciation (depreciation) of investments and foreign currency transactions | (386,679 | ) | 420,821 | |||||
| Payment from affiliate | — | 3,351 | ||||||
| Net increase (decrease) in net assets resulting from operations | (243,175 | ) | 371,927 | |||||
| Distributions to Shareholders: | ||||||||
| From net investment income | ||||||||
| Class IA | — | (21,709 | ) | |||||
| Class IB | — | (3,275 | ) | |||||
| Total distributions | — | (24,984 | ) | |||||
| Capital Share Transactions: | ||||||||
| Class IA | ||||||||
| Sold | 53,237 | 102,964 | ||||||
| Issued in merger | 453,865 | — | ||||||
| Issued on reinvestment of distributions | — | 21,709 | ||||||
| Redeemed | (138,907 | ) | (218,597 | ) | ||||
| Total capital share transactions | 368,195 | (93,924 | ) | |||||
| Class IB | ||||||||
| Sold | 16,273 | 35,488 | ||||||
| Issued in merger | 142,673 | — | ||||||
| Issued on reinvestment of distributions | — | 3,275 | ||||||
| Redeemed | (47,724 | ) | (63,176 | ) | ||||
| Total capital share transactions | 111,222 | (24,413 | ) | |||||
| Net increase (decrease) from capital share transactions | 479,417 | (118,337 | ) | |||||
| Net increase in net assets | 236,242 | 228,606 | ||||||
| Net Assets: | ||||||||
| Beginning of period | 1,464,061 | 1,235,455 | ||||||
| End of period | $ | 1,700,303 | $ | 1,464,061 | ||||
| Accumulated undistributed (distribution in excess of) | ||||||||
| net investment income | $ | 11,800 | $ | 45 | ||||
| Shares: | ||||||||
| Class IA | ||||||||
| Sold | 4,648 | 11,051 | ||||||
| Issued in merger | 39,574 | — | ||||||
| Issued on reinvestment of distributions | — | 2,025 | ||||||
| Redeemed | (13,137 | ) | (24,361 | ) | ||||
| Total share activity | 31,085 | (11,285 | ) | |||||
| Class IB | ||||||||
| Sold | 1,507 | 3,752 | ||||||
| Issued in merger | 12,297 | — | ||||||
| Issued on reinvestment of distributions | — | 302 | ||||||
| Redeemed | (4,440 | ) | (6,848 | ) | ||||
| Total share activity | 9,364 | (2,794 | ) | |||||
The accompanying notes are an integral part of these financial statements.
| Hartford International Opportunities HLS Fund |
June 30, 2010 (Unaudited) (000’s Omitted) |
| 1. | Organization: |
Hartford International Opportunities HLS Fund (the "Fund") serves as an underlying investment option for certain variable annuity and variable life insurance separate accounts of Hartford Life Insurance Company (“HLIC”) and its affiliates and certain qualified retirement plans. The Fund may also serve as an underlying investment option for certain variable annuity and variable life separate accounts of other insurance companies. Owners of variable annuity contracts and policyholders of variable life insurance contracts may choose the funds permitted in the variable insurance contract prospectus. In addition, participants in certain qualified retirement plans may choose the fund if permitted by their plans.
Hartford Series Fund, Inc. (the “Company”) is an open-end registered management investment company comprised of twenty-nine portfolios, one portfolio of which is included in these financial statements.
The Company is organized under the laws of the State of Maryland and is registered with the Securities and Exchange Commission (“SEC”) under the Investment Company Act of 1940, as amended (“1940 Act”). The Fund is organized as a diversified open-end management investment company.
The Fund is divided into Class IA and Class IB shares. Each class is offered at the per share net asset value (“NAV”) without a sales charge and is subject to the same expenses, except that the Class IB shares are subject to distribution and service fees charged pursuant to a Distribution and Service Plan adopted in accordance with Rule 12b-1 under the 1940 Act.
| 2. | Significant Accounting Policies: |
The following is a summary of significant accounting policies of the Fund, which are in accordance with U.S. Generally Accepted Accounting Principles (“GAAP”).
| a) | Security Transactions and Investment Income – Security transactions are recorded on the trade date (the date the order to buy or sell is executed). Security gains and losses are determined on the basis of identified cost. |
Dividend income is accrued as of the ex-dividend date, except that certain dividends for foreign securities where the ex-dividend date may have passed are recorded as soon as the Fund is informed of the dividend in the exercise of reasonable diligence. Interest income, including amortization of premium and accretion of discounts, is accrued on a daily basis.
| b) | Security Valuation – The Fund generally uses market prices in valuing portfolio securities. If market prices are not readily available or are deemed unreliable, the Fund will use the fair value of the security as determined in good faith under policies and procedures established by and under the supervision of the Fund’s Board of Directors. Market prices may be deemed unreliable, for example, if a security is thinly traded or if an event has occurred after the close of the security’s primary market, but before the close of the New York Stock Exchange (the “Exchange”) (generally 4:00 p.m. Eastern Time, referred to as the “Valuation Time”) that is expected to affect the value of the portfolio security. The circumstances in which the Fund may use fair value pricing include, among others: (i) the occurrence of events that are significant to a particular issuer, such as mergers, restructuring or defaults; (ii) the occurrence of events that are significant to an entire market, such as natural disasters in a particular region or governmental actions; (iii) trading restrictions on securities; (iv) thinly traded securities and (v) market events such as trading halts and early market closings. In addition, with respect to the valuation of stocks primarily traded on foreign markets, the Fund uses a fair value pricing service approved by the Fund’s Board of Directors, which employs quantitative models that evaluate changes in the value of foreign market proxies (e.g., futures contracts, American Depositary Receipts (“ADRs”), exchange traded funds (“ETFs”)) after the close of the foreign markets but before the Valuation Time. Securities that are primarily traded on foreign markets may trade on days that are not business days of the Fund. The value of the foreign securities in which the Fund invests may change on days when a shareholder will not be able to purchase or redeem shares of the Fund. Fair value pricing is subjective in nature and the use of fair value pricing by the Fund may cause the NAV of its shares to differ significantly from the NAV that would have been calculated using market prices at the close of the exchange on which a portfolio security is primarily traded but before the Valuation Time. There can be no |
assurance that the Fund could obtain the fair value assigned to a security if the Fund were to sell the security at approximately the time at which the Fund determines its NAV.
Exchange-traded equity securities are valued at the last reported sale price or official close price on the exchange or market on which the security is primarily traded (the “Primary Market”) at the Valuation Time. If the security did not trade on the Primary Market, it may be valued at the Valuation Time at the last reported sale price on another exchange where it trades. The value of an equity security not traded on any exchange but traded on the Nasdaq Stock Market, Inc. or another over-the-counter market shall be valued at the last reported sale price or official closing price on the exchange or market on which the security is traded as of the Valuation Time.
Foreign-denominated assets, including investment securities, and liabilities are translated from the local currency into U.S. dollars using exchange rates obtained from an independent third party as of the Fund’s Valuation Time.
Financial instruments for which prices are not available from an independent pricing service may be valued using market quotations obtained from one or more dealers that make markets in securities in accordance with procedures established by the Fund’s Board of Directors.
Forward foreign currency contracts represent agreements to exchange currencies on specific future dates at predetermined rates. Forward foreign currency contracts are valued using foreign currency exchange rates and forward rates on the Valuation Date from an independent pricing service.
Other derivative or contractual type instruments shall be valued using market prices if such instruments trade on an exchange or market. If such instruments do not trade on an exchange or market, such instruments shall be valued at a price at which the counterparty to such contract would repurchase the instrument. In the event that the counterparty cannot provide a price, such valuation may be determined in accordance with procedures established by the Fund’s Board of Directors.
Various inputs are used in determining the value of the Fund’s investments. These inputs are summarized into three broad hierarchy levels. This hierarchy is based on whether the valuation inputs are observable or unobservable. These levels are:
| · | Level 1 – Quoted prices in active markets for identical securities. Level 1 may include exchange-traded instruments such as domestic equities, some foreign equities, options, futures, mutual funds, ETFs, and rights and warrants. |
| · | Level 2 – Observable inputs other than Level 1 prices, such as quoted prices for similar securities; quoted prices in markets that are not active; or other inputs that are observable or can be corroborated by observable market data. Level 2 may include debt securities that are traded less frequently than exchange-traded instruments and which are valued using third party pricing services. Prices for most level 2 securities are based on prices received from an independent pricing service. The following asset classes generally use valuation techniques and inputs as noted below: |
Asset Backed Securities and Collateralized Mortgage Obligations – Multi-dimensional spread/prepayment speed tables, with consideration of yield or price of bonds of comparable quality, coupon and maturity, attributes of the collateral, new issue data and monthly payment information.
Corporate Bonds – Multi-dimensional relational model based on observable market information such as yields, spreads, sector analysis, etc.
| Hartford International Opportunities HLS Fund |
Notes to Financial Statements – (continued) June 30, 2010 (Unaudited) (000’s Omitted) |
Foreign Currency – Based on rates determined at the close of the Exchange, provided by an independent pricing service.
Forward Currency Contracts – Valued based on the price of the underlying currency at the prevailing interpolated exchange rate, which is a combination of the spot currency rate and the forward currency rate, provided by an independent pricing service.
Foreign Equities – Certain foreign equities are priced using a multi-factor regression model with market observable inputs of a correlative nature (ADRs, futures contracts, ETFs, and currency exchange rates).
International Fixed Income – Multi-dimensional relational model based on observable market information such as benchmark yields, reported trades, bids and offers.
Money Market Instruments – Amortized cost.
Mortgage Backed Securities (“MBS”) – Matrix pricing using inputs of To-Be-Announced (“TBA”) prices, new issue data and monthly payment information, with consideration of yield or price of bonds of comparable quality, coupon and maturity, and attributes of the collateral.
Municipal Bonds – Multi-dimensional relational model and series of matrices based on observable market information such as Municipal Securities Rulemaking Board reported trades, comparable bonds, yields, spreads and credit analysis.
Preferred Stocks – Close mean of bid/ask or bid.
Repurchase Agreements – Priced at par.
Senior Floating Rate Interests – Composite of quotes from one or more contributing dealers.
Swaps – Price based upon observable market information from an independent pricing service.
U.S. Government Securities – Treasuries exclusively traded in the secondary market.
| · | Level 3 – Significant unobservable inputs that are supported by limited or no market activity. Level 3 may include financial instruments whose values are determined using broker quotes or require significant management judgment or estimation. While these securities are priced using unobservable inputs, the valuation of these securities reflects the best available data and management believes the prices are a reasonable representation of exit price. The following asset classes generally use valuation techniques and inputs as noted below: |
Asset Backed Securities & Commercial Mortgage Backed Securities – Certain other MBS with limited liquidity priced from an independent pricing service.
Common Stocks – Trading has been halted or there are restrictions on trading. Valuation is based on last trade with the application of a discount or premium, if applicable.
Long Dated Over-the-Counter Options – Terms greater than 10 years from current date, expected volatility is not observable. Prices are from an independent pricing service.
Long Term Debt Securities, including Senior Floating Rate Interests – Unobservable valuation inputs may include estimates for current yields, maturity/duration, prepayment speed, and broker quotes for comparable securities along with other assumptions relating to credit quality, collateral value, complexity of the security structure, general market conditions and liquidity.
Swaps – Terms greater than 10 years from current date, expected volatility is not observable. Prices are from an independent pricing service.
Individual securities within any of the above mentioned asset classes may be assigned a different hierarchical level than those that are presented above, as individual circumstances dictate.
For purposes of reporting transfers between different hierarchy levels, both transfers in and out of each level are shown as if they occurred at the beginning of the period.
Refer to the Investment Valuation Hierarchy Levels Summary and the Level 3 roll forward reconciliation found following the Schedules of Investments.
| c) | Foreign Currency Transactions – Assets and liabilities denominated in currencies other than U.S. dollars are translated into U.S. dollars at the exchange rates in effect on the valuation date. Purchases and sales of investment securities, income and expenses are translated into U.S. dollars at the exchange rates on the dates of such transactions. |
The Fund does not isolate that portion of portfolio security valuation resulting from fluctuations in the foreign currency exchange rates from the fluctuations arising from changes in the market prices of securities held. Exchange rate fluctuations are included with the net realized and unrealized gain or loss on investments in the accompanying financial statements.
Net realized foreign exchange gains or losses arise from sales of foreign currencies and the difference between asset and liability amounts initially stated in foreign currencies and the U.S. dollar value of the amounts actually received or paid. Net unrealized foreign exchange gains or losses arise from changes in the value of other assets and liabilities at the end of the reporting period, resulting from changes in the exchange rates.
| d) | Joint Trading Account – Pursuant to an exemptive order issued by the SEC, the Fund may transfer uninvested cash balances into a joint trading account managed by Wellington Management Company, LLP (“Wellington Management”). These balances may be invested in one or more repurchase agreements and/or short-term money market instruments. |
| e) | Repurchase Agreements – A repurchase agreement is an agreement by which a counterparty agrees to sell a security and agrees to repurchase the security sold at a mutually agreed upon time and price. At the time the Fund enters into a repurchase agreement, the value of the underlying collateral security(ies), including accrued interest, will be equal to or exceed the value of the repurchase agreement. To minimize counterparty risk, the securities that serve to collateralize the repurchase agreement are held by the Fund's custodian in book entry or physical form in the custodial account of the Fund or in a third party custodial account. Repurchase agreements are valued at cost plus accrued interest. The Fund, as shown on the Schedule of Investments, had outstanding repurchase agreements as of June 30, 2010. |
| f) | Forward Foreign Currency Contracts – The Fund may enter into forward foreign currency contracts that obligate the Fund to purchase or sell currencies at specified future dates. Forward foreign currency contracts may be used to hedge against adverse fluctuations in exchange rates between currencies. |
Forward foreign currency contracts involve elements of market risk in excess of the amounts reflected in the Statement of Assets and Liabilities. In addition, risks may arise upon entering into these contracts from the potential inability of the counterparties to meet the terms of the contracts and from unanticipated movements in the value of the foreign currencies relative to the U.S. dollar. The Fund had outstanding forward foreign currency contracts as shown on the Schedule of Investments as of June 30, 2010.
| g) | Indexed Securities – The Fund may invest in indexed securities whose values are linked to changes in interest rates, indices, or other underlying instruments. The Fund may use these securities to increase or decrease its exposure to |
| Hartford International Opportunities HLS Fund |
Notes to Financial Statements – (continued) June 30, 2010 (Unaudited) (000’s Omitted) |
different underlying instruments and to gain exposure to markets that might be difficult to invest in using conventional securities. Indexed securities may be more volatile than their underlying instruments, but any loss is limited to the amount of the original investment and there may be a limit to the potential appreciation of the investment. The Fund had no investments in indexed securities as of June 30, 2010.
| h) | Fund Share Valuation and Dividend Distributions to Shareholders – Orders for the Fund’s shares are executed in accordance with the investment instructions of the contract holders or plan participants. The NAV of the Fund’s shares is determined as of the close of each business day of the Exchange. The NAV is determined separately for each class of the Fund by dividing the Fund’s net assets attributable to that class by the number of outstanding shares of the class. Orders for the purchase of the Fund’s shares received by an insurance company or plan prior to the close of the Exchange on any day on which the Exchange is open for business are priced at the NAV determined as of the close of the Exchange. Orders received by an insurance company or plan after the close of the Exchange, or on a day on which the Exchange and/or the Fund is not open for business, are priced at the next determined NAV. |
Dividends are declared pursuant to a policy adopted by the Fund’s Board of Directors based upon the investment performance of the Fund. The policy of the Fund is to pay dividends from net investment income and distribute realized capital gains, if any, at least once a year.
Distributions from net investment income, realized capital gains and capital are determined in accordance with federal income tax regulations, which may differ from U.S. GAAP with respect to character and timing. These differences may include but are not limited to losses deferred due to wash sale adjustments, foreign currency gains and losses, adjustments related to Passive Foreign Investment Companies (“PFICs”), Real Estate Investment Trusts (“REITs”), Regulated Investment Companies (“RICs”), certain derivatives and partnerships. Permanent book and federal income tax basis differences relating to shareholder distributions will result in reclassifications to certain of the Fund’s capital accounts (see Federal Income Taxes: Reclassification of Capital Accounts note).
| i) | Illiquid and Restricted Securities – The Fund is permitted to invest up to 15% of its net assets in illiquid securities. “Illiquid Securities” are those that may not be sold or disposed of in the ordinary course of business within seven days, at approximately the price used to determine the Fund’s NAV. The Fund may not be able to sell illiquid securities or other investments when its sub-adviser considers it desirable to do so or may have to sell such securities or investments at a price that is lower than the price that could be obtained if the securities or investments were more liquid. A sale of illiquid securities or other investments may require more time and may result in higher dealer discounts and other selling expenses than does the sale of those that are liquid. Illiquid securities and investments also may be more difficult to value, due to the unavailability of reliable market quotations for such securities or investments, and an investment in them may have an adverse impact on the Fund’s NAV. The Fund may also purchase certain restricted securities, commonly known as Rule 144A securities, that can be resold to institutions and which may be determined to be liquid pursuant to policies and guidelines established by the Fund’s Board of Directors. The Fund, as shown on the Schedule of Investments, had illiquid and/or restricted securities as of June 30, 2010. |
| j) | Securities Purchased on a When-Issued or Delayed-Delivery Basis – Delivery and payment for securities that have been purchased by the Fund on a forward commitment, or when-issued or delayed-delivery basis, take place beyond the customary settlement period. During this period, such securities are subject to market fluctuations, and the Fund identifies securities segregated in its records with value at least equal to the amount of the commitment. As of June 30, 2010, the Fund had no outstanding when-issued or delayed delivery securities. |
| k) | Use of Estimates – The preparation of financial statements in conformity with U.S. GAAP requires management to make estimates and assumptions that affect the reported amounts of assets and liabilities as of the date of the financial statements and the reported amounts of income and expenses during the period. Operating results in the future could vary from the amounts derived from management’s estimates. |
| i) | Additional Derivative Instrument(s) Information |
| Derivative Instrument(s) as of June 30, 2010. |
| Statement of Assets and Liabilities Location | |||||||||||
| Risk Exposure Category | Asset Derivatives | Liability Derivatives | |||||||||
| Foreign exchange contracts | Unrealized appreciation on forward foreign currency contracts | $ | 217 | Unrealized depreciation on forward foreign currency contracts | $ | 52 | |||||
The ratio of forward foreign currency contracts market value to net assets as of June 30, 2010, was 2.07%, compared to the six-month period average ratio of 11.44%.
Realized Gain/Loss and Change in Unrealized Appreciation (Depreciation) on Derivative Instruments for the six-month period ended June 30, 2010:
| Amount of Realized Gain or (Loss) on Derivatives Recognized in Income | ||||||||||||||||||||||||
| Forward | ||||||||||||||||||||||||
| Purchased | Currency | |||||||||||||||||||||||
| Risk Exposure Category | Written Options | Options | Futures | Contracts | Swaps | Total | ||||||||||||||||||
| Foreign exchange contracts | $ | — | $ | — | $ | — | $ | 3,453 | $ | — | $ | 3,453 | ||||||||||||
| Total | $ | — | $ | — | $ | — | $ | 3,453 | $ | — | $ | 3,453 | ||||||||||||
| Change in Unrealized Appreciation or (Depreciation) on Derivatives Recognized in Income | ||||||||||||||||||||||||
| Forward | ||||||||||||||||||||||||
| Purchased | Currency | |||||||||||||||||||||||
| Risk Exposure Category | Written Options | Options | Futures | Contracts | Swaps | Total | ||||||||||||||||||
| Foreign exchange contracts | — | — | — | (1,812 | ) | — | $ | (1,812 | ) | |||||||||||||||
| Total | $ | — | $ | — | $ | — | $ | (1,812 | ) | $ | — | $ | (1,812 | ) | ||||||||||
| m) | Indemnifications – Under the Company’s organizational documents, the Company shall indemnify its officers and directors to the full extent required or permitted under Maryland General Corporation Law and the federal securities laws. In addition, the Company, on behalf of the Fund, may enter into contracts that contain a variety of indemnifications. The Company’s maximum exposure under these arrangements is unknown. However, the Company has not had prior claims or losses pursuant to these contracts and expects the risk of loss to be remote. |
| 3. | Federal Income Taxes: |
| a) | Federal Income Taxes – For federal income tax purposes, the Fund intends to continue to qualify as a RIC under Subchapter M of the Internal Revenue Code (“IRC”) by distributing substantially all of its taxable net investment income and net realized capital gains to its shareholders and otherwise complying with the requirements of RICs. The Fund has distributed substantially all of its income and capital gains in prior years and intends to distribute substantially all of its income and capital gains prior to the next fiscal year end. Accordingly, no provision for federal income or excise taxes has been made in the accompanying financial statements. Distributions from short-term capital gains are treated as ordinary income distributions for federal income tax purposes. |
| b) | Net Investment Income (Loss), Net Realized Gains (Losses) – Net investment income (loss) and net realized gains (losses) may differ for financial statement and tax purposes primarily because of losses deferred due to wash sale adjustments, foreign currency gains and losses, adjustments related to PFICs, REITs, RICs, certain derivatives and partnerships. The character of distributions made during the year from net investment income or net realized gains may differ from their ultimate characterization for federal income tax purposes. Also, due to the timing of dividend |
| Hartford International Opportunities HLS Fund |
Notes to Financial Statements – (continued) June 30, 2010 (Unaudited) (000’s Omitted) |
distributions, the fiscal year in which amounts are distributed may differ from the year that the income or realized gains (losses) were recorded by the Fund.
c) | Distributions and Components of Distributable Earnings – The tax character of distributions paid by the Fund for the periods indicated is as follows (as adjusted for dividends payable): |
| For the Year Ended | For the Year Ended | |||||||
| December 31, 2009 | December 31, 2008 | |||||||
| Ordinary Income | $ | 24,984 | $ | 97,735 | ||||
| Long-Term Capital Gains* | — | 21,880 | ||||||
| * | The Fund designates these distributions as long-term capital dividends pursuant to IRC code Sec. 852(b)(3)(C). |
As of December 31, 2009, the Fund’s components of distributable earnings (deficit) on a tax basis were as follows:
| Amount | ||||
| Undistributed Ordinary Income | $ | 2,022 | ||
| Accumulated Capital and Other Losses* | (497,714 | ) | ||
Unrealized Appreciation† | 187,604 | |||
| Total Accumulated Deficit | $ | (308,088 | ) | |
| * | The Fund has capital loss carryforwards that are identified in the Capital Loss Carryforward note that follows. |
| † | The difference between book-basis and tax-basis unrealized appreciation (depreciation) may be attributable to the losses deferred due to wash sale adjustments, foreign currency gains and losses, adjustments related to PFICs, REITs, RICs, certain derivatives and partnerships. |
| d) | Reclassification of Capital Accounts – The Fund may record reclassifications in its capital accounts. These reclassifications have no impact on the total net assets of the Fund. The reclassifications are a result of permanent differences between GAAP and tax accounting for such items as net operating losses that reduce distribution requirements. Adjustments are made to reflect the impact these items have on current and future distributions to shareholders. Therefore, the source of the Fund’s distributions may be shown in the accompanying Statement of Changes in Net Assets as from net investment income, from net realized gains on investments or from capital depending on the type of book and tax differences that exist. For the year ended December 31, 2009, the Fund recorded reclassifications to increase (decrease) the accounts listed below: |
| Amount | ||||
| Accumulated Undistributed Net Investment Income | $ | (591 | ) | |
| Accumulated Net Realized Gain (Loss) on Investments | 4,221 | |||
| Paid-in-Capital | (3,630 | ) | ||
| e) | Capital Loss Carryforward – At December 31, 2009 (tax-year-end), the Fund had capital loss carryforwards for U.S. federal income tax purposes of approximately: |
| Year of Expiration | Amount | |||
| 2010 | $ | 1,046 | ||
| 2016 | 209,068 | |||
| 2017 | 287,600 | |||
| Total | $ | 497,714 | ||
As of December 31, 2009, the Fund had $3,630 in expired capital loss carryforwards.
| f) | Accounting for Uncertainty in Income Taxes – Management has evaluated all open tax years and has determined there is no impact to the Fund’s financial statements related to uncertain tax positions. Generally, tax authorities can examine all tax returns filed for the last three years. |
| 4. | Expenses: |
| a) | Investment Management Agreements – HL Investment Advisors, LLC (“HL Advisors”), an indirect wholly-owned subsidiary of The Hartford Financial Services Group, Inc. (“The Hartford”), serves as investment manager to the Fund pursuant to an Investment Management Agreement with the Company. As investment manager, HL Advisors has overall investment supervisory responsibility for the Fund. In addition, HL Advisors provides administrative personnel, services, equipment, facilities and office space for proper operation of the Fund. |
HL Advisors has contracted with Wellington Management for the provision of day-to-day investment management services to the Fund in accordance with the Fund’s investment objective and policies. The Fund pays a fee to HL Advisors, a portion of which may be used to compensate Wellington Management.
| b) | Administrative Services Agreement – For the two-month period January 1, 2010 through February 28, 2010, under the Administrative Services Agreement between HLIC and the Company, on behalf of the Fund, HLIC provided administrative services to the Fund and received monthly compensation at the annual rate of 0.20% of the Fund’s average daily net assets. The Fund assumed and paid certain other expenses (including, but not limited to, accounting, custodian, state taxes and Directors’ fees). Effective March 1, 2010, the Investment Management Agreement was amended to include the administrative services for the Fund and the separate administrative services agreement was terminated. |
The schedule below reflects the rates of compensation paid to HL Advisors for investment management services and to HLIC for administrative services rendered from January 1, 2010 through February 28, 2010, and the rates of compensation paid to the HL Advisors for the combined services from March 1, 2010 through June 30, 2010; the rates are accrued daily and paid monthly.
| Average Daily Net Assets | Annual Fee | |||
| On first $250 million | 0.7750 | % | ||
| On next $250 million | 0.7250 | % | ||
| On next $500 million | 0.6750 | % | ||
| On next $4 billion | 0.6250 | % | ||
| On next $5 billion | 0.6225 | % | ||
| Over $10 billion | 0.6200 | % | ||
| c) | Accounting Services Agreement – Pursuant to the Fund Accounting Agreement between HLIC and the Company, on behalf of the Fund, HLIC provides accounting services to the Fund and receives monthly compensation on the Fund’s average net assets. The Fund’s accounting services fees are accrued daily and paid monthly. |
| Average Daily Net Assets | Annual Fee | |||
| On first $5 billion | 0.016 | % | ||
| On next $5 billion | 0.014 | % | ||
| Over $10 billion | 0.012 | % | ||
| d) | Operating Expenses – Allocable expenses incurred by the Company are allocated to each Fund and allocated to classes within the Fund in proportion to the average daily net assets of the Fund and each class, except where allocation of certain expenses is more fairly made directly to the Fund or to specific classes within a Fund. |
| Hartford International Opportunities HLS Fund |
Notes to Financial Statements – (continued) June 30, 2010 (Unaudited) (000’s Omitted) |
| e) | Fees Paid Indirectly – The Company, on behalf of the Fund has entered into agreements with State Street Global Advisers, LLC and Russell Implementation Securities, Inc. to partially recapture non-discounted trade commissions. Such rebates are used to pay a portion of the Fund’s expenses. In addition, the Fund’s custodian bank has also agreed to reduce its fees when the Fund maintains cash on deposit in a non-interest-bearing custody account. For the six-month period ended June 30, 2010, these amounts are included in the Statement of Operations. |
The ratio of expenses to average net assets in the accompanying financial highlights excludes the reduction in expenses related to fees paid indirectly. Had the fees paid indirectly been included, the annualized expense ratio for the periods listed below would have been as follows:
| Annualized | ||||||||||||||||||||||||
| Six-Month | Year Ended | Year Ended | Year Ended | Year Ended | Year Ended | |||||||||||||||||||
| Period Ended | December 31, | December 31, | December 31, | December 31, | December 31, | |||||||||||||||||||
| June 30, 2010 | 2009 | 2008 | 2007 | 2006 | 2005 | |||||||||||||||||||
| Class IA | 0.73 | % | 0.75 | % | 0.71 | % | 0.70 | % | 0.73 | % | 0.74 | % | ||||||||||||
| Class IB | 0.98 | 1.00 | 0.96 | 0.95 | 0.98 | 0.99 | ||||||||||||||||||
| f) | Distribution Plan for Class IB shares – The Company, on behalf of the Fund, has adopted a Distribution Plan pursuant to Rule 12b-1 under the 1940 Act for the Class IB shares. Pursuant to the Distribution Plan, the Fund is authorized to compensate the Distributor, Hartford Securities Distribution Company, Inc. (a wholly owned, ultimate subsidiary of The Hartford), from assets attributable to the Class IB shares for services rendered and expenses borne in connection with activities primarily intended to result in the sale of the Class IB shares, subject to the Fund Board’s review and approval. |
The Distribution Plan provides that the Fund may pay annually up to 0.25% of the average daily net assets of the Fund attributable to its Class IB shares for activities primarily intended to result in the sale of Class IB shares. The Board has the authority to suspend or reduce these payments at any point in time. Under the terms of the Distribution Plan and the principal underwriting agreement, the Fund is authorized to make payments monthly to the Distributor which may be used to pay or compensate entities providing distribution and shareholder servicing with respect to the Class IB shares for such entities’ fees or expenses incurred or paid in that regard. These fees are accrued daily and paid monthly.
| g) | Other Related Party Transactions – Certain officers of the Fund are directors and/or officers of HL Advisors, and/or The Hartford or its subsidiaries. For the six-month period ended June 30, 2010, a portion of the Fund’s chief compliance officer’s salary was paid by all the investment companies in the Hartford fund complex. The portion allocated to the Fund was in the amount of $3. Hartford Investor Services Company, LLC ("HISC"), a wholly owned subsidiary of The Hartford, provides transfer agent services to the Fund. The amount HISC was compensated for providing such services can be found on the Statement of Operations. These fees are accrued daily and paid monthly. |
| h) | Payment from Affiliate – In July of 2007, The Hartford entered into a settlement with the Attorneys General of the states of New York, Connecticut and Illinois relating to market timing and the company's individual variable annuity contracts in which certain payments would be made directly to the variable annuity contract holders. The distribution plan provides that unclaimed money from the settlement would be distributed to certain HLS Funds that are investment options through a Hartford individual variable annuity contract. The unclaimed money was distributed to the Fund on September 18, 2009, as follows: |
| Amount | ||||
| Reimbursement | $ | 3,351 | ||
On November 8, 2006, the SEC issued an order setting forth the terms of a settlement reached with three subsidiaries of The Hartford that resolves the SEC’s Division of Enforcement’s investigation of aspects of The Hartford’s variable annuity and mutual fund operations related to directed brokerage and revenue sharing. The Hartford settled this matter without admitting or denying the findings of the SEC.
The Fund is available for purchase by the separate accounts of different variable universal life policies, variable annuity products, and funding agreements and it is offered directly to certain qualified retirement plans (collectively “Products”). Although existing Products contain transfer restrictions, some Products, particularly older variable annuity products, do not contain restrictions on the frequency of transfers. In addition, as the result of the settlement of litigation against Hartford Life, Inc. (“Hartford Life”) (the issuers of such variable annuity products), the Fund’s ability to restrict transfers by certain owners of older variable annuity products was limited. During 2006, these annuity owners surrendered the older variable annuity contracts that were the subject of prior litigation. In February 2005, Hartford Life agreed with the Board of Directors of the Fund to indemnify the Fund for any material harm caused to the Fund from frequent trading by these contracts owners.
The total return in the accompanying financial highlights includes payment from affiliates. Had the payment from affiliates been excluded, the total return for the periods listed below would have been as follows:
| For the Year Ended December 31, 2009 | ||||||||
| Class IA | Class IB | |||||||
| Impact from Payment from Affiliate for Attorneys General Settlement | 0.23 | % | 0.23 | % | ||||
| Total Return Excluding Payments from Affiliate | 33.15 | 32.83 | ||||||
| For the Year Ended December 31, 2006 | ||||||||
| Class IA | Class IB | |||||||
| Impact from Payment from Affiliate for SEC Settlement | 0.02 | % | 0.02 | % | ||||
| Total Return Excluding Payments from Affiliate | 24.44 | 24.13 | ||||||
| 5. | Investment Transactions: |
For the six-month period ended June 30, 2010, the cost of purchases and proceeds from sales of investment securities (excluding short-term investments) were as follows:
| Amount | ||||
| Cost of Purchases Excluding U.S. Government Obligations | $ | 1,771,234 | ||
| Sales Proceeds Excluding U.S. Government Obligations | 1,383,494 | |||
| 6. | Line of Credit: |
The Fund is one of several Hartford funds that participate in a $500 million committed revolving line of credit facility. The facility is to be used for temporary or emergency purposes. Under the arrangement, a fund is required to own securities having a market value in excess of 300% of the total bank borrowings. The interest rate on borrowings varies depending on the nature of the loan. The facility also requires a fee to be paid based on the amount of the commitment. This fee is allocated to all the funds participating in the line of credit based on the average net assets of the funds. During the six-month period ended June 30, 2010, the Fund did not have any borrowings under this facility.
| Hartford International Opportunities HLS Fund |
Notes to Financial Statements – (continued) June 30, 2010 (Unaudited) (000’s Omitted) |
| 7. | Fund Merger: |
Reorganization of Hartford International Growth HLS Fund and Hartford International Small Company HLS Fund into Hartford International Opportunities HLS Fund: At a meeting held on August 5, 2009, the Board of Directors of the Company approved the Forms of Agreement and Plans of Reorganization (“Reorganization Agreements”) that provided for the reorganization of each of two series of the Company, Hartford International Growth HLS Fund (“Target Fund #1”) and Hartford International Small Company HLS Fund (“Target Fund #2), into another series of the Company, Hartford International Opportunities HLS Fund (“Acquiring Fund”) (“Reorganizations”). The reorganizations did not require shareholder approval by the shareholders of Hartford International Growth HLS Fund, Hartford International Small Company HLS Fund or Hartford International Opportunities HLS Fund.
Pursuant to the Reorganization Agreements, on April 16, 2010, each holder of Class IA and Class IB shares of Hartford International Growth HLS Fund and Hartford International Small Company HLS Fund became the owner of full and fractional shares of the corresponding class in Hartford International Opportunities HLS Fund having an equal aggregate value.
The merger was accomplished by tax free exchange as detailed below:
| Acquiring | Net assets of | |||||||||||||||||||||||||||
| Fund shares | Acquiring | Net assets of | ||||||||||||||||||||||||||
| Net assets of | Net assets of | issued to the | Fund | Acquiring | ||||||||||||||||||||||||
| Target Fund | Target Fund | Target Fund | Target Fund | Target | immediately | Fund | ||||||||||||||||||||||
| #1 on Merger | #2 on Merger | #1 shares | #2 shares | Funds' | before | immediately | ||||||||||||||||||||||
| Date | Date | exchanged | exchanged | shareholders | merger | after merger | ||||||||||||||||||||||
| Class IA | $ | 289,334 | $ | 164,531 | 37,523 | $ | 14,231 | 39,574 | $ | 1,276,569 | $ | 1,730,434 | ||||||||||||||||
| Class IB | 97,957 | 44,716 | 12,771 | 3,902 | 12,297 | 216,979 | 359,652 | |||||||||||||||||||||
| Total | $ | 387,291 | $ | 209,247 | 50,294 | $ | 18,133 | 51,871 | $ | 1,493,548 | $ | 2,090,086 | ||||||||||||||||
The Hartford International Growth HLS Fund and Hartford International Small Company HLS Fund had the following unrealized appreciation, accumulated net realized losses and capital stock as of April 16, 2010.
| Unrealized | Accumulated Net | |||||||||||||||
| Appreciation | Realized Gains | |||||||||||||||
| Fund | (Depreciation) | (Losses) | Capital Stock | Total | ||||||||||||
| Target Fund #1 | $ | 42,552 | $ | (389,616 | ) | $ | 734,355 | $ | 387,291 | |||||||
| Target Fund #2 | $ | 22,130 | $ | (102,620 | ) | $ | 289,737 | $ | 209,247 | |||||||
Assuming the acquisition had been completed on January 1, 2010, the beginning of the semi-annual reporting period of the Funds, Hartford International Opportunities HLS Fund’s pro forma results of operations for the six-month period ended June 30, 2010, are as follows:
| Net Decrease in Net Assets | ||||||||||||
| Fund | Net Investment Income | Net Gain on Investments | Resulting from Operations | |||||||||
| Acquiring Fund | $ | 14,183 | $ | (234,080 | ) | $ | (219,897 | ) | ||||
Because the combined investment portfolios have been managed as a single integrated portfolio since the acquisition was completed, it is not practical to separate the amounts of revenue and earnings of Hartford International Growth HLS Fund and Hartford International Small Company HLS Fund that have been included in Hartford International Opportunities HLS Fund’s statement of operations since April 16, 2010.
| 8. | Industry Classifications: |
Other than the industry classifications “Other Investment Pools and Funds” and “Exchange Traded Funds”, equity industry classifications used in this report are the Global Industry Classification Standard, which was developed by and is the exclusive property and service mark of MSCI, Inc. and Standard & Poor’s.
| Hartford International Opportunities HLS Fund |
| - Selected Per-Share Date (A) - |
| Net Asset | Net Realized | Net Increase | ||||||||||||||||||||||||||||||||||||||||||
| Value at | Payments | and Unrealized | Total from | Dividends from | Distributions | (Decrease) in | Net Asset | |||||||||||||||||||||||||||||||||||||
| Beginning of | Net Investment | from (to) | Gain (Loss) on | Investment | Net Investment | from Realized | Distributions | Total | Net Asset | Value at End | ||||||||||||||||||||||||||||||||||
Class | Period | Income (Loss) | Affiliate | Investments | Operations | Income | Capital Gains | from Capital | Distributions | Value | of Period | |||||||||||||||||||||||||||||||||
| For the Six-Month Period Ended June 30, 2010 (Unaudited) | ||||||||||||||||||||||||||||||||||||||||||||
| IA | $ | 11.01 | $ | 0.08 | $ | – | $ | (1.29 | ) | $ | (1.21 | ) | $ | – | $ | – | $ | – | $ | – | $ | (1.21 | ) | $ | 9.80 | |||||||||||||||||||
| IB | 11.15 | 0.06 | – | (1.30 | ) | (1.24 | ) | – | – | – | – | (1.24 | ) | 9.91 | ||||||||||||||||||||||||||||||
| For the Year Ended December 31, 2009 | ||||||||||||||||||||||||||||||||||||||||||||
| IA | 8.40 | 0.16 | 0.03 | 2.61 | 2.80 | (0.19 | ) | – | – | (0.19 | ) | 2.61 | 11.01 | |||||||||||||||||||||||||||||||
| IB | 8.51 | 0.14 | 0.03 | 2.64 | 2.81 | (0.17 | ) | – | – | (0.17 | ) | 2.64 | 11.15 | |||||||||||||||||||||||||||||||
| For the Year Ended December 31, 2008 | ||||||||||||||||||||||||||||||||||||||||||||
| IA | 15.62 | 0.28 | – | (6.68 | ) | (6.40 | ) | (0.28 | ) | (0.54 | ) | – | (0.82 | ) | (7.22 | ) | 8.40 | |||||||||||||||||||||||||||
| IB | 15.78 | 0.27 | – | (6.76 | ) | (6.49 | ) | (0.24 | ) | (0.54 | ) | – | (0.78 | ) | (7.27 | ) | 8.51 | |||||||||||||||||||||||||||
| For the Year Ended December 31, 2007 | ||||||||||||||||||||||||||||||||||||||||||||
| IA | 15.23 | 0.18 | – | 3.77 | 3.95 | (0.19 | ) | (3.37 | ) | – | (3.56 | ) | 0.39 | 15.62 | ||||||||||||||||||||||||||||||
| IB | 15.36 | 0.16 | – | 3.78 | 3.94 | (0.15 | ) | (3.37 | ) | – | (3.52 | ) | 0.42 | 15.78 | ||||||||||||||||||||||||||||||
| For the Year Ended December 31, 2006 | ||||||||||||||||||||||||||||||||||||||||||||
| IA | 13.59 | 0.22 | – | 3.05 | 3.27 | (0.40 | ) | (1.23 | ) | – | (1.63 | ) | 1.64 | 15.23 | ||||||||||||||||||||||||||||||
| IB | 13.52 | 0.18 | – | 3.07 | 3.25 | (0.18 | ) | (1.23 | ) | – | (1.41 | ) | 1.84 | 15.36 | ||||||||||||||||||||||||||||||
| For the Year Ended December 31, 2005 | ||||||||||||||||||||||||||||||||||||||||||||
| IA | 11.86 | 0.14 | – | 1.59 | 1.73 | – | – | – | – | 1.73 | 13.59 | |||||||||||||||||||||||||||||||||
| IB | 11.83 | 0.13 | – | 1.56 | 1.69 | – | – | – | – | 1.69 | 13.52 | |||||||||||||||||||||||||||||||||
| (A) | Information presented relates to a share outstanding throughout the indicated period. |
| (B) | The figures do not include sales charges or other fees which may be applied at the variable life insurance, variable annuity or qualified retirement plan product level. Any such additional sales charges or other fees would lower the Fund's performance. |
| (C) | Ratios do not reflect reductions for fees paid indirectly. Please see Fees Paid Indirectly in the Notes to Financial Statements. |
| (D) | Portfolio turnover rate is calculated on the basis of the Fund as a whole without distinguishing between the classes of shares issued. |
| (E) | Not annualized. |
| (F) | Annualized. |
| (G) | During the six-month period ended June 30, 2010, the Fund incurred $456.2 million in sales associated with the transition of assets from Hartford International Growth HLS Fund and Hartford International Small Company HLS Fund, which merged into the Fund on April 16, 2010. These sales were excluded from the portfolio turnover calculation. |
| (H) | Total return without the inclusion of the Payment from (to) Affiliate can be found in Expenses in the accompanying Notes to Financial Statements. |
| - Ratios and Supplemental Data - - |
Ratio of Expenses to Average Net | Ratio of Expenses to Average Net | Ratio of Net Investment Income to | Portfolio Turnover | |||||||||||||||||||
Total Return(B) | Net Assets at End of Period | Assets Before Waivers(C) | Assets After Waivers(C) | Average Net Assets | Rate(D) | |||||||||||||||||
| (11.00 | )%(E) | $ | 1,414,706 | 0.73 | %(F) | 0.73 | %(F) | 1.68 | %(F) | 70 | %(G) | |||||||||||
| (11.11 | ) (E) | 285,597 | 0.98 | (F) | 0.98 | (F) | 1.44 | (F) | – | |||||||||||||
| 33.46 | (H) | 1,247,179 | 0.76 | 0.76 | 1.68 | 152 | ||||||||||||||||
| 33.13 | (H) | 216,882 | 1.01 | 1.01 | 1.43 | – | ||||||||||||||||
| (42.25 | ) | 1,046,234 | 0.71 | 0.71 | 2.21 | 158 | ||||||||||||||||
| (42.39 | ) | 189,221 | 0.96 | 0.96 | 1.96 | – | ||||||||||||||||
| 27.43 | 2,027,078 | 0.71 | 0.71 | 1.13 | 135 | |||||||||||||||||
| 27.11 | 417,144 | 0.96 | 0.96 | 0.89 | – | |||||||||||||||||
| 24.46 | (H) | 1,596,055 | 0.75 | 0.75 | 1.47 | 119 | ||||||||||||||||
| 24.15 | (H) | 382,371 | 1.00 | 1.00 | 1.24 | – | ||||||||||||||||
| 14.62 | 1,251,426 | 0.78 | 0.78 | 1.22 | 120 | |||||||||||||||||
| 14.33 | 319,626 | 1.03 | 1.03 | 0.97 | – | |||||||||||||||||
| Hartford International Opportunities HLS Fund |
The Board of Directors appoints officers who are responsible for the day-to-day operations of the Fund and who execute policies formulated by the Directors. Each director serves until his or her death, resignation, or retirement or until the next annual meeting of shareholders is held or until his or her successor is elected and qualifies.
Directors and officers who are employed by or who have a financial interest in The Hartford are considered “interested” persons of the Fund pursuant to the Investment Company Act of 1940, as amended. Each officer and two of the Company’s directors, as noted in the chart below, are “interested” persons of the Fund. Each director serves as a director for The Hartford Mutual Funds, Inc., The Hartford Mutual Funds II, Inc., The Hartford Income Shares Fund, Inc., Hartford Series Fund, Inc., and Hartford HLS Series Fund II, Inc., which, as of June 30, 2010, collectively consist of 88 funds. Correspondence may be sent to directors and officers c/o Hartford Mutual Funds, P.O. Box 2999, Hartford, Connecticut 06104-2999, except that correspondence to Ms. Fagely may be sent to 500 Bielenberg Drive, Woodbury, Minnesota 55125.
The table below sets forth, for each director and officer, his or her name, year of birth, current position with the Company and date first elected or appointed to Hartford Series Fund, Inc. (“HSF”), and Hartford HLS Series Fund II, Inc. (“HSF2”), principal occupation, and, for directors, other directorships held. The Fund’s statement of additional information contains further information on the directors and is available free of charge by calling 1-800-862-6668 or writing to Hartford HLS Funds, c/o Individual Annuity Services, P.O. Box 5085, Hartford, CT 06102-5085.
Information on the aggregate remuneration paid to the directors of the Company can be found in the Statement of Operations herein. The Fund pays to The Hartford a portion of the chief compliance officer’s compensation, but does not pay salaries or compensation to any of their other officers or directors who are employed by The Hartford.
Non-Interested Directors
Lynn S. Birdsong (1946) Director since 2003, Co-Chairman of the Investment Committee
Mr. Birdsong is a private investor. Since 2003, Mr. Birdsong has been an independent director of The Japan Fund and has served as a Director of the Sovereign High Yield Fund since April 2010. From 2003 to March 2005, Mr. Birdsong was an independent director of the Atlantic Whitehall Funds. From 1979 to 2002, Mr. Birdsong was a managing director of Zurich Scudder Investments, an investment management firm. During his employment with Scudder, Mr. Birdsong was an interested director of The Japan Fund. Since 1981, Mr. Birdsong has been a partner in Birdsong Company, an advertising specialty firm.
Robert M. Gavin, Jr. (1940) Director since 2002 (HSF) and 1986 (HSF2), Chairman of the Board since 2004
Dr. Gavin is an educational consultant. Prior to September 1, 2001, he was President of Cranbrook Education Community and prior to July 1996, he was President of Macalester College, St. Paul, Minnesota.
Duane E. Hill (1945) Director since 2001 (HSF) and 2002 (HSF2), Chairman of the Nominating Committee
Mr. Hill is Partner of TSG Ventures L.P., a private equity investment company. Mr. Hill is a former partner of TSG Capital Group, a private equity investment firm that served as sponsor and lead investor in leveraged buyouts of middle market companies.
Sandra S. Jaffee (1941) Director since 2005
Ms. Jaffee served as Chairman (2008 to 2009) and Chief Executive Officer of Fortent (formerly Searchspace Group), a leading provider of compliance/regulatory technology to financial institutions from August 2005 to August 2009. From August 2004 to August 2005, Ms. Jaffee served as an Entrepreneur in Residence with Warburg Pincus, a private equity firm. From September 1995 to July 2004, Ms. Jaffee served as Executive Vice President at Citigroup, where she was President and Chief Executive Officer of Citibank’s Global Securities Services (1995 to 2003).
William P. Johnston (1944) Director since 2005, Chairman of the Compliance Committee
In June 2006, Mr. Johnston was appointed as Senior Advisor to The Carlyle Group, a global private equity investment firm. In July 2006, Mr. Johnston was elected to the Board of Directors of MultiPlan, Inc. In August 2007, Mr. Johnston was elected to the Board of Directors of LifeCare Holdings, Inc. In February 2008, Mr. Johnston was elected to the Board of Directors of HCR-ManorCare, Inc. In May 2006, Mr. Johnston was elected to the Supervisory Board of Fresenius Medical Care AG & Co. KGaA, after its acquisition of Renal Care Group, Inc. in March 2006. Mr. Johnston joined Renal Care Group in November 2002 as a member of the Board of Directors and served as Chairman of the Board from March 2003 through March 2006. From September 1987 to December 2002, Mr. Johnston was with Equitable Securities Corporation (and its successors, SunTrust Equitable Securities and SunTrust Robinson Humphrey) serving in various investment banking and managerial positions, including Managing Director and Head of Investment Banking, Chief Executive Officer and Vice Chairman.
Phillip O. Peterson (1944) Director since 2002 (HSF) and 2000 (HSF2), Chairman of the Audit Committee
Mr. Peterson is a mutual fund industry consultant. He was a partner of KPMG LLP (an accounting firm) until July 1999. Mr. Peterson joined William Blair Funds in February 2007 as a member of the Board of Trustees. From January 2004 to April 2005, Mr. Peterson served as Independent President of the Strong Mutual Funds.
Lemma W. Senbet (1946) Director since 2005
Dr. Senbet is the William E. Mayer Chair Professor of Finance and Director, Center for Financial Policy, at the University of Maryland, Robert H. Smith School of Business. He was chair of the Finance Department during 1998 to 2006. Previously he was a chaired professor of finance at the University of Wisconsin-Madison. Also, he was director of the Fortis Funds from March 2000 to July 2002. Dr. Senbet served the finance profession in various capacities, including as director of the American Finance Association and President of the Western Finance Association. In 2006, Dr. Senbet was inducted Fellow of Financial Management Association International for his career-long distinguished scholarship and professional service.
Interested Directors and Officers
Lowndes A. Smith (1939) Director since 1996 (HSF) and 2002 (HSF2), Co-Chairman of the Investment Committee
Mr. Smith served as Vice Chairman of The Hartford from February 1997 to January 2002, as President and Chief Executive Officer of Hartford Life, Inc. from February 1997 to January 2002, and as President and Chief Operating Officer of The Hartford Life Insurance Companies from January 1989 to January 2002. Mr. Smith serves as a Director of White Mountains Insurance Group, Ltd., One Beacon Insurance, Symetra Financial and as a Managing Director of Whittington Gray Associates.
John C. Walters 1, 2 (1962) Director since 2008
Mr. Walters currently serves as President, Chief Executive Officer and Director for Hartford Life, Inc. (“HL, Inc.”). Mr. Walters also serves as President, Chairman of the Board, Chief Executive Officer and Director for Hartford Life Insurance Company (“Hartford Life”), and as Executive Vice President of The Hartford. In addition, Mr. Walters is a Manager of HL Investment Advisors, LLC (“HL Advisors”). Mr. Walters previously served as President of the U.S. Wealth Management Division of HL, Inc. (2006-2007) and as Co-Chief Operating Officer of Hartford Life (2007-2008).
1 Mr. Walters previously served as President and Chief Executive Officer (2007 to 2009).
2 Effective July 31, 2010, Mr. Walters retired from The Hartford. Mr. Walters resigned his position as a Director of the Fund effective July 30, 2010.
Other Officers
Robert M. Arena, Jr. (1968) President and Chief Executive Officer since 2009 (served as Vice President of the Fund (2006-2009))
Mr. Arena serves as Executive Vice President of Hartford Life. Additionally, Mr. Arena is Senior Vice President and Director of Hartford Administrative Services Company, (“HASCO”), President, Chief Executive Officer and Manager of Hartford Investment Financial Services, LLC (“HIFSCO”) and President, Chief Executive Officer and Manager of HL Advisors. Mr. Arena joined The Hartford in 2004.
Tamara L. Fagely (1958) Vice President, Treasurer and Controller since 2002 (HSF) 1993 (HSF2)
Ms. Fagely has been a Vice President of HASCO since 1998 and Chief Financial Officer since 2006. Currently Ms. Fagely is a Vice President of Hartford Life. She served as Assistant Vice President of Hartford Life from December 2001 through March 2005. In addition, Ms. Fagely is Controller and Chief Financial Officer of HIFSCO.
Brian Ferrell (1962) AML Compliance Officer since 2008
Mr. Ferrell has served as Assistant Vice President and AML Compliance Officer for The Hartford since 2006, and as AML Compliance Officer for HASCO and Hartford Investor Services Company, LLC (“HISC”) since 2008. Prior to joining The Hartford in 2006, Mr. Ferrell held various positions at the U.S. Department of the Treasury (the “Treasury”) from 2001 to 2006, where he served as Chief Counsel for the Treasury’s Financial Crimes Enforcement Network from 2005-2006.
Dr. Robert J. Froehlich (1953) Senior Managing Director since 2009
Dr. Froehlich joined The Hartford as Senior Managing Director in September 2009. Prior to joining The Hartford, Dr. Froehlich served as Vice Chairman of Deutsche Asset Management from 1997-2009.
| Hartford International Opportunities HLS Fund |
| Directors and Officers (Unaudited) – (continued) |
Thomas D. Jones, III (1965) Vice President and Chief Compliance Officer since 2006
Mr. Jones serves as Chief Compliance Officer for the Hartford Mutual Funds and Vice President and Director of Securities Compliance for The Hartford. Mr. Jones joined The Hartford in 2006 from SEI Investments, where he served as Chief Compliance Officer for its mutual funds and investment advisers. Prior to joining SEI, Mr. Jones was First Vice President and Compliance Director for Merrill Lynch Investment Managers (Americas) (“MLIM”), where he worked from 1992-2004.
Edward P. Macdonald (1967) Vice President, Secretary and Chief Legal Officer since 2005
Mr. Macdonald serves as Assistant Vice President of Hartford Life and Chief Legal Officer and Vice President of HIFSCO. He also serves as Vice President and Secretary of HASCO, and Chief Legal Officer, Secretary and Vice President of HL Advisors. Mr. Macdonald joined The Hartford in 2005.
Vernon J. Meyer (1964) Vice President since 2006
Mr. Meyer serves as Senior Vice President of Hartford Life. He also serves as Senior Vice President of HIFSCO and HL Advisors. Mr. Meyer joined The Hartford in 2004.
D. Keith Sloane (1960) Vice President since 2009
Mr. Sloane is a Senior Vice President of Hartford Life. Additionally, Mr. Sloane currently serves as Senior Vice President of HIFSCO, HL Advisors, and HASCO. Prior to joining The Hartford in 2007, Mr. Sloane was Director of product marketing and led the mutual fund business for Wachovia Securities (“Wachovia”) in their investment products group. Mr. Sloane joined Wachovia in 1995.
Jane Wolak (1961) Vice President since 2009
Ms. Wolak currently serves as Vice President of Hartford Life. Ms. Wolak joined Hartford Life as Vice President, Retail Product Services in May 2007. She is also Vice President of HASCO. Previously, Ms. Wolak was with Sun Life Financial where she held the position of Vice President, Service Center Operations from 2001-2007.
A description of the policies and procedures that the Fund uses to determine how to vote proxies relating to portfolio securities and a record of how the Fund voted any proxies for the twelve-month period ended June 30, 2010 is available (1) without charge, upon request, by calling 800-862-6668 and (2) on the Securities and Exchange Commission’s website at http://www.sec.gov.
The Fund files a complete schedule of portfolio holdings with the Commission for the first and third quarters of each fiscal year on Form N-Q. The Fund’s Forms are available (1) without charge, upon request, by calling 800-862-6668 and (2) on the Securities and Exchange Commission’s website at http://www.sec.gov. The Form N-Q may be reviewed and copied at the Commission’s Public Reference Room in Washington, DC. Information on the operation of the Public Reference Room may be obtained by calling 1-800-SEC-0330.
| Hartford International Opportunities HLS Fund |
The following proposal was addressed and approved at a Special Meeting of Shareholders held on February 12, 2010.
Proposal to approve amendments to the Investment Management Agreement between the Fund and HL Investment Advisors, the purpose of which were to combine the administrative services for the Fund with the management services for the Fund under a single agreement.
| Fund | For | Against | Abstain | |||
| Hartford International Opportunities HLS | ||||||
| Fund | 112,320,364.058 | 4,312,282.994 | 3,698,004.148 |
Proposal to elect Lemma Senbet and John Walters, each currently a Director, as Directors of Hartford Series Fund Inc.
Lemma W. Senbet
| Funds | For | Withheld | ||
| Hartford Series Fund, Inc. | 5,079,578,022.902 | 241,839,974.106 |
John C. Walters
| Funds | For | Withheld | ||
| Hartford Series Fund, Inc. | 5,081,138,302.186 | 240,279,694.822 |
| Hartford International Opportunities HLS Fund |
Your Fund's Expenses
As a shareholder of the Fund, you incur two types of costs: (1) transaction costs, including sales charges (loads) on purchase payments and contingent deferred sales charges (CDSC) (2) ongoing costs including management fees; distribution fees; and other fund expenses. This example is intended to help you understand your ongoing costs (in dollars) of investing in the Fund and to compare these costs with the ongoing costs of investing in other mutual funds. The example is based on an investment of $1,000 invested at the beginning of the period and held for the period of December 31, 2009 through June 30, 2010.
Actual Expenses
The first set of columns of the table below provides information about actual account values and actual expenses. You may use the information in this column, together with the amount you invested, to estimate the expenses that you paid over the period. Simply divide your account value by $1,000 (for example, an $8,600 account value divided by $1,000 = 8.6), then multiply the result by the number in the line under the heading entitled "Expenses Paid During Period" to estimate the expenses you paid on your account during this period.
Hypothetical Example for Comparison Purposes
The second set of columns of the table below provides information about hypothetical account values and hypothetical expenses based on the Fund's actual expense ratio and an assumed rate of return of 5% per year before expenses, which is not the Fund's actual return. The hypothetical account values and expenses may not be used to estimate the actual ending account balance or expenses you paid for the period. You may use this information to compare the ongoing costs of investing in the Fund and other funds. To do so, compare this 5% hypothetical example with the 5% hypothetical examples that appear in the shareholder reports of the other funds.
Please note that the expenses shown in the table are meant to highlight your ongoing costs only and do not reflect any transactional costs, such as sales charges (loads) and CDSC. Therefore, the second set of columns of the table is useful in comparing ongoing costs only, and will not help you determine the relative total costs of owning different funds. In addition, if these transactional costs were included, your costs would be higher. Expenses are equal to the Fund's annualized expense ratios multiplied by average account value over the period, multiplied by 181/365 (to reflect the one-half year period).
| Actual return | Hypothetical (5% return before expenses) | |||||||||||||||||||||||||||||||||||
| Expenses paid | Expenses paid | Days in | ||||||||||||||||||||||||||||||||||
| during the period | during the period | the | Days | |||||||||||||||||||||||||||||||||
| Beginning | Ending | December 31, 2009 | Beginning | Ending | December 31, 2009 | Annualized | current | In the | ||||||||||||||||||||||||||||
| Account Value | Account Value | through | Account Value | Account Value | through | expense | 1/2 | full | ||||||||||||||||||||||||||||
December 31, 2009 | June 30, 2010 | June 30, 2010 | December 31, 2009 | June 30, 2010 | June 30, 2010 | ratio | year | year | ||||||||||||||||||||||||||||
| Class IA | $ | 1,000.00 | $ | 890.02 | $ | 3.42 | $ | 1,000.00 | $ | 1,021.17 | $ | 3.66 | 0.73 | % | 181 | 365 | ||||||||||||||||||||
Class IB | $ | 1,000.00 | $ | 888.91 | $ | 4.59 | $ | 1,000.00 | $ | 1,019.93 | $ | 4.91 | 0.98 | % | 181 | 365 | ||||||||||||||||||||
| Hartford International Opportunities HLS Fund |
The Board approved the annual continuation of the Investment Management Agreement (the “Agreement”) between Hartford Series Fund, Inc. (“HSF”) and HL Investment Advisors, LLC (“HL Advisors”) with respect to the Fund at its meeting on August 4-5, 2009. The Board’s considerations in approving the renewal of the Agreement are disclosed in the December 31, 2009 Annual Report for HSF.
At the November 4-5, 2009 meeting, the Board considered and approved amendments to the Agreement to include administrative services, which had been provided pursuant to a separate agreement, and investment management services under one agreement. The Board, including all of the Independent Directors, approved the amendments to the Agreement with respect to the Fund.
In approving the amendments, in addition to the information presented at the August meeting in connection with the annual review of the Agreement and the additional information provided throughout the year, the Board also considered the fact that the amendments did not result in an overall increase in fees to shareholders. The Board took note of the fact that the management of HL Advisors believes that the proposal to combine the administrative services with the investment management services under a single agreement will produce streamlined fee disclosure, resulting in greater transparency and clarity in the Fund’s prospectuses and financial reports. The Board further noted management's belief that the change would result in consistency across all of the Hartford Funds in the complex in that the funds of HSF are the only funds in the complex (other than the R share classes of the Hartford retail funds) that are subject to a separate administrative services fee. Finally, the Board noted management's view that the proposed changes to the Agreement should also serve to simplify the Board's annual consideration of the investment management arrangements for the Fund in that the investment management and administrative fees would be presented as a single fee for fee comparison purposes, which should facilitate the Board's analysis.
The shareholders of the Fund approved the amendments at a Special Meeting of Shareholders held on February 12, 2010. The amendments were effective as of March 1, 2010.
31
The Hartford
P.O. Box 5085
Hartford, CT 06102–5085
Hartford Series Fund, Inc. is underwritten and distributed by Hartford Securities Distribution Company, Inc.
“The Hartford” is The Hartford Financial Services Group, Inc. and its subsidiaries.
Hartford Series Fund, Inc. inception dates range from 1977 to date. Hartford Series Fund, Inc. is not a subsidiary of The Hartford but is underwritten, distributed by and advised by subsidiaries of The Hartford. Investments in Hartford Series Fund, Inc. are not guaranteed by The Hartford or any other entity.
This material is authorized for distribution only when preceded or accompanied by a current prospectus. The prospectus contains detailed information about the Funds, including investment objectives, risks and charges and expenses. Please read it carefully before you invest or send money.
HLSSAR-IO10 Printed in U.S.A ©2010 The Hartford, Hartford, CT 06115 |
| Hartford MidCap HLS Fund |
|
Hartford MidCap HLS Fund
| Manager Discussions (Unaudited) | 2 |
| Financial Statements | |
| 4 | |
| 7 | |
| 8 | |
| 9 | |
| 10 | |
| 11 | |
| 20 | |
| 22 | |
| 24 | |
| 24 | |
| 25 | |
| 26 | |
| 27 |
This report is prepared for the general information of contract owners and qualified retirement plan participants. It is not an offer of contracts or of qualified retirement plans. It should not be used in connection with any offer, except in conjunction with the appropriate prospectus which contains all pertinent information including the applicable sales, administrative and other charges.
The views expressed in the Fund’s Manager Discussion under ‘‘Why did the Fund perform this way?’’ and ‘‘What is the outlook?’’ are views of the Fund’s subadvisers and portfolio management team through the end of the period and is subject to change based on market and other conditions.
Hartford MidCap HLS Fund* inception 07/14/1997
(subadvised by Wellington Management Company, LLP)
Investment objective – Seeks long-term growth of capital.
Performance Overview(1) 6/30/00 - 6/30/10
Growth of $10,000 investment

S&P MidCap 400 Index is an unmanaged index of common stocks of companies chosen by S&P designed to represent price movements in the mid-cap U.S. equity market.
You cannot invest directly in an index.
The chart represents a hypothetical investment in the Fund. Performance data represents past performance and current performance could be higher or lower.
Average Annual Returns (as of 6/30/10)
| 6 | 1 | 5 | 10 | |
| Month† | Year | Year | Year | |
| MidCap IA | -1.01% | 21.35% | 3.71% | 5.69% |
| MidCap IB | -1.12% | 21.07% | 3.45% | 5.44% |
| S&P MidCap 400 Index | -1.36% | 24.93% | 2.21% | 5.31% |
| † | Not Annualized |
PAST PERFORMANCE IS NOT INDICATIVE OF FUTURE RESULTS.
| (1) | Growth of a $10,000 investment in Class IB shares will vary from the results seen on this page due to differences in the expense charged to this share class. |
Performance information may reflect historical or current expense waivers from the investment adviser, without which performance would have been lower. For information on current expense waivers/reimbursements, please see the prospectus.
The value of the contract will fluctuate so that when redeemed, it may be worth more or less than the original investment. The chart and table do not reflect the deduction of taxes that a shareholder would pay on portfolio distributions or the redemption of portfolio shares. The figures do not include sales charges or other fees which may be applied at the variable life insurance, variable annuity or qualified retirement plan product level. Any such additional sales charges or other fees would lower the Fund’s performance.
| * | The Fund has restrictions on the purchase of shares. A description of the restrictions can be found in the prospectus. |
| Portfolio Managers | ||
| Phillip H. Perelmuter | Philip W. Ruedi, CFA | Mark A. Whitaker, CFA |
| Senior Vice President, Partner | Vice President | Vice President |
How did the Fund perform?
The Class IA shares of the Hartford MidCap HLS Fund returned -1.01% for the six-month period ended June 30, 2010, outperforming its benchmark, the S&P MidCap 400 Index, which returned -1.36% for the same period. The Fund also outperformed the - -1.89% return of the average fund in the Lipper Mid-Cap Core Funds VP-UF peer group, a group of funds with investment strategies similar to those of the Fund.
Why did the Fund perform this way?
Global equities had a tumultuous start to 2010. Through late April, U.S. equities rose as investor confidence grew amid better-than-expected corporate earnings, accommodative monetary policy, and improving economic conditions. From late April until the end of the period, risk aversion rose and equities fell on concerns that the global economy could slip back into recession. Investors worried about how burgeoning fiscal deficits across much of Europe, tightening credit conditions in China, and a disinflationary environment would affect the economic recovery and corporate earnings growth.
Large cap stocks (-7%) trailed mid (-1%) and small (-2%) cap stocks during the period, as measured by the S&P 500, S&P MidCap 400, and Russell 2000 indices, respectively. Seven out of ten sectors within the S&P MidCap 400 Index declined during the period. Energy (-8%), Information Technology (-5%), and Industrials (-4%) declined the most, while the Health Care (+6%), Financials (+1%), and Materials (+0%) sectors performed the best.
Outperformance versus the benchmark was driven by security selection. Strong security selection in Industrials, Financials, and Information Technology more than offset weak stock selection in the Health Care and Consumer Discretionary sectors. Sector allocation, which is driven by our bottom-up (i.e. stock by stock fundamental research) stock selection process, also contributed modestly during the period. The Fund’s overweight (i.e. the Fund’s sector position was greater than the benchmark position) positions in Health Care and Consumer Discretionary were additive while the Fund’s underweight (i.e. the Fund’s sector position was less than the benchmark position) to Financials and overweight to Energy detracted.
Top relative and absolute contributors included Huntington Bancshares (Financials), M&T Bank (Financials), and Hasbro (Consumer Discretionary). Shares of Ohio-based diversified banking and financial services company Huntington Bancshares rose as investors grew more confident in new management's efforts to improve core operations, strengthen the balance sheet, and reduce risk. In April, the company also announced strong earnings along with a better-than-expected outlook for fiscal year 2010 earnings. Large mid-Atlantic bank M&T Bank’s shares benefited as the company announced stronger-than-anticipated first quarter earnings, and the company recently lowered its loan-loss provisions and increased total deposits. Shares of toy maker Hasbro rose as the company reported strong first quarter earnings driven by robust demand and announced an additional $625 million share repurchase authorization. Rumors of a private equity firm’s interest in Hasbro lifted the stock in late June.
Top detractors from relative (i.e. performance of the Fund as measured against the benchmark) performance included King Pharmaceuticals (Health Care), DreamWorks Animation (Consumer Discretionary), and Apollo Group (Consumer Discretionary). Shares of King Pharmaceuticals, a pharmaceutical company specializing in abuse-resistant pain medications, fell as new prescription trends for the company's recently-approved controlled-release morphine product, Embeda, fell short of Wall Street expectations. Computer-generated, animated feature film company DreamWorks Animation’s shares declined after the firm's new 3-D "Shrek" film disappointed at the box office. Shares of for-profit educational services provider Apollo Group fell due to regulatory concerns and fears that the firm’s shift away from associate degree customers may weigh on earnings growth. Money transfer company Western Union was also among the top detractors from absolute performance.
What is the outlook?
Global equity markets have come under pressure as credit fears have resurfaced, especially in Europe. We believe there are early indications of a coming global growth slowdown. With inflation generally absent, we expect no rate hikes from any of the major central banks in the near future. The sovereign debt crisis in Europe is likely only a precursor to the fiscal challenges many developed world countries will have to face in coming years. We believe emerging countries continue to have superior macroeconomic fundamentals and are expected to provide some offset in an otherwise slowing global growth environment.
Our efforts are focused on picking stocks based on a bottom-up review of their fundamentals. As a result of these individual stock decisions, we ended the period with our most significant overweight positions relative to the benchmark in the Industrials, Information Technology, and Health Care sectors. Our largest underweights relative to the benchmark were in Financials, Materials, and Utilities.
Diversification by Industry
as of June 30, 2010
| Percentage of | ||||
| Industry (Sector) | Net Assets | |||
Automobiles & Components (Consumer Discretionary) | 1.0 | % | ||
| Banks (Financials) | 4.5 | |||
| Capital Goods (Industrials) | 11.2 | |||
| Commercial & Professional Services (Industrials) | 3.1 | |||
Consumer Durables & Apparel (Consumer Discretionary) | 2.9 | |||
| Consumer Services (Consumer Discretionary) | 3.3 | |||
| Diversified Financials (Financials) | 3.6 | |||
| Energy (Energy) | 6.3 | |||
| Food, Beverage & Tobacco (Consumer Staples) | 1.7 | |||
| Health Care Equipment & Services (Health Care) | 7.5 | |||
| Household & Personal Products (Consumer Staples) | 0.4 | |||
| Insurance (Financials) | 4.6 | |||
| Materials (Materials) | 3.7 | |||
| Media (Consumer Discretionary) | 2.6 | |||
Pharmaceuticals, Biotechnology & Life Sciences (Health Care) | 6.0 | |||
| Real Estate (Financials) | 2.2 | |||
| Retailing (Consumer Discretionary) | 5.0 | |||
Semiconductors & Semiconductor Equipment (Information Technology) | 2.9 | |||
| Software & Services (Information Technology) | 12.0 | |||
Technology Hardware & Equipment (Information Technology) | 3.8 | |||
| Telecommunication Services (Services) | 1.3 | |||
| Transportation (Industrials) | 5.8 | |||
| Utilities (Utilities) | 4.2 | |||
| Short-Term Investments | 0.5 | |||
| Other Assets and Liabilities | (0.1 | ) | ||
| Total | 100.0 | % | ||
| Hartford MidCap HLS Fund |
June 30, 2010 (Unaudited) |
| (000’s Omitted) |
| Shares or Principal Amount | Market Value ╪ | |||||
| COMMON STOCKS - 99.6% | ||||||
| Automobiles & Components - 1.0% | ||||||
| 692 | Harley-Davidson, Inc. | $ | 15,392 | |||
| Banks - 4.5% | ||||||
| 2,721 | Huntington Bancshares, Inc. | 15,073 | ||||
| 297 | M&T Bank Corp. | 25,231 | ||||
| 644 | MGIC Investment Corp. ● | 4,437 | ||||
| 582 | People's United Financial, Inc. | 7,852 | ||||
| 1,075 | TCF Financial Corp. | 17,862 | ||||
| 70,455 | ||||||
| Capital Goods - 11.2% | ||||||
| 476 | AMETEK, Inc. | 19,111 | ||||
| 154 | BE Aerospace, Inc. ● | 3,916 | ||||
| 348 | Carlisle Cos., Inc. | 12,566 | ||||
| 517 | IDEX Corp. | 14,768 | ||||
| 454 | Ingersoll-Rand plc | 15,665 | ||||
| 290 | Jacobs Engineering Group, Inc. ● | 10,564 | ||||
| 284 | Joy Global, Inc. | 14,216 | ||||
| 633 | Lennox International, Inc. | 26,293 | ||||
| 606 | Masco Corp. | 6,518 | ||||
| 732 | PACCAR, Inc. | 29,193 | ||||
| 437 | Rockwell Collins, Inc. | 23,196 | ||||
| 176,006 | ||||||
| Commercial & Professional Services - 3.1% | ||||||
| 495 | Herman Miller, Inc. | 9,344 | ||||
| 375 | HNI Corp. | 10,333 | ||||
| 244 | Manpower, Inc. | 10,545 | ||||
| 195 | Republic Services, Inc. | 5,790 | ||||
| 550 | Robert Half International, Inc. | 12,949 | ||||
| 48,961 | ||||||
| Consumer Durables & Apparel - 2.9% | ||||||
| 504 | Hasbro, Inc. | 20,715 | ||||
| 372 | Mattel, Inc. | 7,865 | ||||
| 26 | NVR, Inc. ● | 17,086 | ||||
| 45,666 | ||||||
| Consumer Services - 3.3% | ||||||
| 262 | Apollo Group, Inc. Class A ● | 11,144 | ||||
| 152 | Cheesecake Factory, Inc. ● | 3,372 | ||||
| 172 | DeVry, Inc. | 9,018 | ||||
| 164 | ITT Educational Services, Inc. ● | 13,615 | ||||
| 71 | Strayer Education, Inc. | 14,740 | ||||
| 51,889 | ||||||
| Diversified Financials - 3.6% | ||||||
| 75 | IntercontinentalExchange, Inc. ● | 8,455 | ||||
| 1,199 | SEI Investments Co. | 24,420 | ||||
| 251 | Stifel Financial ● | 10,895 | ||||
| 572 | Waddell and Reed Financial, Inc. Class A | 12,517 | ||||
| 56,287 | ||||||
| Energy - 6.3% | ||||||
| 587 | Cobalt International Energy ● | 4,369 | ||||
| 501 | Consol Energy, Inc. | 16,920 | ||||
| 467 | Denbury Resources, Inc. ● | 6,840 | ||||
| 169 | ENSCO International plc | 6,630 | ||||
| 628 | Frontier Oil Corp. | 8,447 | ||||
| 288 | Holly Corp. | 7,654 | ||||
| 168 | Noble Energy, Inc. | 10,135 | ||||
| 334 | Overseas Shipholding Group, Inc. | 12,378 | ||||
| 246 | Peabody Energy Corp. | 9,642 | ||||
| 129 | SM Energy Co. | 5,177 | ||||
| 253 | Ultra Petroleum Corp. ● | 11,195 | ||||
| 99,387 | ||||||
| Food, Beverage & Tobacco - 1.7% | ||||||
| 1,010 | Dean Foods Co. ● | 10,172 | ||||
| 321 | Flowers Foods, Inc. | 7,847 | ||||
| 565 | Smithfield Foods, Inc. ● | 8,417 | ||||
| 26,436 | ||||||
| Health Care Equipment & Services - 7.5% | ||||||
| 443 | Beckman Coulter, Inc. | 26,733 | ||||
| 124 | Cerner Corp. ● | 9,403 | ||||
| 173 | Edwards Lifesciences Corp. ● | 9,669 | ||||
| 920 | Lincare Holdings, Inc. ● | 29,898 | ||||
| 629 | Patterson Cos., Inc. | 17,954 | ||||
| 184 | Resmed, Inc. ● | 11,177 | ||||
| 337 | Universal Health Services, Inc. Class B | 12,868 | ||||
| 117,702 | ||||||
| Household & Personal Products - 0.4% | ||||||
| 103 | Estee Lauder Co., Inc. | 5,729 | ||||
| Insurance - 4.6% | ||||||
| 871 | Brown & Brown, Inc. | 16,674 | ||||
| 1,447 | Genworth Financial, Inc. ● | 18,906 | ||||
| 1,037 | Unum Group | 22,511 | ||||
| 532 | W.R. Berkley Corp. | 14,086 | ||||
| 72,177 | ||||||
| Materials - 3.7% | ||||||
| 89 | Cliff's Natural Resources, Inc. | 4,183 | ||||
| 205 | FMC Corp. | 11,768 | ||||
| 53 | Martin Marietta Materials, Inc. | 4,520 | ||||
| 322 | Scotts Miracle-Gro Co. Class A | 14,318 | ||||
| 208 | Sherwin-Williams Co. | 14,391 | ||||
| 579 | Steel Dynamics, Inc. | 7,630 | ||||
| 56,810 | ||||||
| Media - 2.6% | ||||||
| 624 | Discovery Communications, Inc. ● | 22,267 | ||||
| 615 | DreamWorks Animation SKG, Inc. ● | 17,544 | ||||
| 39,811 | ||||||
| Pharmaceuticals, Biotechnology & Life Sciences - 6.0% | ||||||
| 923 | Amylin Pharmaceuticals, Inc. ● | 17,362 | ||||
| 1,376 | King Pharmaceuticals, Inc. ● | 10,443 | ||||
| 877 | Mylan, Inc. ● | 14,952 | ||||
| 659 | Qiagen N.V. ● | 12,673 | ||||
| 235 | Regeneron Pharmaceuticals, Inc. ● | 5,250 | ||||
| 200 | Vertex Pharmaceuticals, Inc. ● | 6,563 | ||||
| 629 | Watson Pharmaceuticals, Inc. ● | 25,502 | ||||
| 92,745 | ||||||
| Real Estate - 2.2% | ||||||
| 207 | Alexandria Real Estate Equities, Inc. | 13,124 | ||||
| 312 | AMB Property Corp. | 7,390 | ||||
| 341 | Host Hotels & Resorts, Inc. | 4,603 | ||||
| 96 | Public Storage | 8,470 | ||||
| 33,587 | ||||||
| Retailing - 5.0% | ||||||
| 248 | Advance Automotive Parts, Inc. | 12,420 | ||||
| 52 | AutoZone, Inc. ● | 10,028 | ||||
| 276 | CarMax, Inc. ● | 5,482 | ||||
| 1,291 | Office Depot, Inc. ● | 5,217 | ||||
| 273 | O'Reilly Automotive, Inc. ● | 12,970 | ||||
The accompanying notes are an integral part of these financial statements.
| Shares or Principal Amount | Market Value ╪ | |||||||||
| COMMON STOCKS - 99.6% - (continued) | ||||||||||
| Retailing - 5.0% - (continued) | ||||||||||
| 922 | Penske Automotive Group, Inc. ● | $ | 10,478 | |||||||
| 864 | Staples, Inc. | 16,463 | ||||||||
| 145 | Urban Outfitters, Inc. ● | 5,000 | ||||||||
| 78,058 | ||||||||||
| Semiconductors & Semiconductor Equipment - 2.9% | ||||||||||
| 313 | Altera Corp. | 7,768 | ||||||||
| 325 | Analog Devices, Inc. | 9,041 | ||||||||
| 319 | Lam Research Corp. ● | 12,137 | ||||||||
| 434 | Maxim Integrated Products, Inc. | 7,258 | ||||||||
| 344 | Xilinx, Inc. | 8,689 | ||||||||
| 44,893 | ||||||||||
| Software & Services - 12.0% | ||||||||||
| 427 | BMC Software, Inc. ● | 14,773 | ||||||||
| 533 | Check Point Software Technologies Ltd. | |||||||||
| ADR ● | 15,704 | |||||||||
| 369 | Citrix Systems, Inc. ● | 15,570 | ||||||||
| 90 | Equinix, Inc. ● | 7,342 | ||||||||
| 160 | Factset Research Systems, Inc. | 10,712 | ||||||||
| 483 | Gartner, Inc. Class A ● | 11,220 | ||||||||
| 941 | Genpact Ltd. ● | 14,611 | ||||||||
| 139 | Global Payments, Inc. | 5,090 | ||||||||
| 306 | GSI Commerce, Inc. ● | 8,816 | ||||||||
| 421 | Micros Systems ● | 13,401 | ||||||||
| 576 | Red Hat, Inc. ● | 16,664 | ||||||||
| 146 | Salesforce.com, Inc. ● | 12,534 | ||||||||
| 898 | VeriSign, Inc. ● | 23,829 | ||||||||
| 1,028 | Western Union Co. | 15,320 | ||||||||
| 185,586 | ||||||||||
| Technology Hardware & Equipment - 3.8% | ||||||||||
| 254 | National Instruments Corp. | 8,072 | ||||||||
| 639 | NetApp, Inc. ● | 23,848 | ||||||||
| 640 | Polycom, Inc. ● | 19,060 | ||||||||
| 287 | Teradata Corp. ● | 8,760 | ||||||||
| 59,740 | ||||||||||
| Telecommunication Services - 1.3% | ||||||||||
| 441 | American Tower Corp. Class A ● | 19,602 | ||||||||
| Transportation - 5.8% | ||||||||||
| 180 | C.H. Robinson Worldwide, Inc. | 9,991 | ||||||||
| 453 | Con-way, Inc. | 13,590 | ||||||||
| 552 | Expeditors International of Washington, Inc. | 19,049 | ||||||||
| 379 | J.B. Hunt Transport Services, Inc. | 12,379 | ||||||||
| 222 | Kansas City Southern ● | 8,086 | ||||||||
| 2,407 | Southwest Airlines Co. | 26,736 | ||||||||
| 89,831 | ||||||||||
| Utilities - 4.2% | ||||||||||
| 517 | Aqua America, Inc. | 9,142 | ||||||||
| 811 | Northeast Utilities | 20,664 | ||||||||
| 801 | UGI Corp. | 20,365 | ||||||||
| 310 | Wisconsin Energy Corp. | 15,704 | ||||||||
| 65,875 | ||||||||||
Total common stocks (cost $1,435,401) | $ | 1,552,625 | ||||||||
Total long-term investments (cost $1,435,401) | $ | 1,552,625 | ||||||||
| SHORT-TERM INVESTMENTS - 0.5% | ||||||||||
| Repurchase Agreements - 0.5% | ||||||||||
| Bank of America TriParty Joint Repurchase | ||||||||||
| Agreement (maturing on 07/01/2010 in the | ||||||||||
| amount of $2,800, collateralized by | ||||||||||
| FHLMC 5.50%, 2039, FNMA 4.50% - | ||||||||||
| 5.50%, 2038 - 2040, GNMA 5.00%, 2040, | ||||||||||
| value of $2,856) | ||||||||||
| $ | 2,800 | 0.05%, 6/30/2010 | $ | 2,800 | ||||||
| BNP Paribas Securities Corp. TriParty Joint | ||||||||||
| Repurchase Agreement (maturing on | ||||||||||
| 07/01/2010 in the amount of $480, | ||||||||||
| collateralized by FNMA 4.50% - 6.50%, | ||||||||||
| 2024 - 2040, GNMA 5.00% - 6.50%, 2038 | ||||||||||
| - 2040, value of $489) | ||||||||||
| 480 | 0.04%, 6/30/2010 | 480 | ||||||||
| Deutsche Bank Securities TriParty Joint | ||||||||||
| Repurchase Agreement (maturing on | ||||||||||
| 07/01/2010 in the amount of $2,120, | ||||||||||
| collateralized by GNMA 3.13% - 7.00%, | ||||||||||
| 2023 - 2052, value of $2,163) | ||||||||||
| 2,120 | 0.05%, 6/30/2010 | 2,120 | ||||||||
| JP Morgan Chase TriParty Joint Repurchase | ||||||||||
| Agreement (maturing on 07/01/2010 in the | ||||||||||
| amount of $480, collateralized by FHLMC | ||||||||||
| 2.38% - 5.83%, 2033 - 2038, value of | ||||||||||
| $489) | ||||||||||
| 480 | 0.06%, 6/30/2010 | 480 | ||||||||
| Morgan Stanley & Co., Inc. TriParty Joint | ||||||||||
| Repurchase Agreement (maturing on | ||||||||||
| 07/01/2010 in the amount of $2,091, | ||||||||||
| collateralized by FHLMC 5.00% - 5.50%, | ||||||||||
| 2038 - 2039, FNMA 5.00%, 2039, value of | ||||||||||
| $2,141) | ||||||||||
| 2,091 | 0.03%, 6/30/2010 | 2,091 | ||||||||
| UBS Securities, Inc. Repurchase Agreement | ||||||||||
| (maturing on 07/01/2010 in the amount of | ||||||||||
| $25, collateralized by U.S. Treasury Bill | ||||||||||
| 0.88%, 2011, value of $25) | ||||||||||
| 25 | 0.02%, 6/30/2010 | 25 | ||||||||
| UBS Securities, Inc. TriParty Joint | ||||||||||
| Repurchase Agreement (maturing on | ||||||||||
| 07/01/2010 in the amount of $529, | ||||||||||
| collateralized by FNMA 5.00% - 6.00%, | ||||||||||
| 2033 - 2036, value of $540) | ||||||||||
| 529 | 0.09%, 6/30/2010 | 529 | ||||||||
| 8,525 | ||||||||||
| Total short-term investments | ||||||||||
| (cost $8,525) | $ | 8,525 | ||||||||
| Total investments | ||||||||||
| (cost $1,443,926) ▲ | 100.1 | % | $ | 1,561,150 | ||||||
| Other assets and liabilities | (0.1 | )% | (2,119 | ) | ||||||
| Total net assets | 100.0 | % | $ | 1,559,031 | ||||||
| Note: | Percentage of investments as shown is the ratio of the total market value to total net assets. Market value of investments in foreign securities represents 2.2% of total net assets at June 30, 2010. |
The accompanying notes are an integral part of these financial statements.
| Hartford MidCap HLS Fund |
| Schedule of Investments – (continued) |
| June 30, 2010 (Unaudited) |
| (000’s Omitted) |
Foreign securities that are principally traded on certain foreign markets are adjusted daily pursuant to a third party pricing service methodology approved by the Board of Directors in order to reflect an adjustment for factors occurring after the close of the foreign market but before the close of the New York Stock Exchange.
| ▲ | At June 30, 2010, the cost of securities for federal income tax purposes was $1,456,589 and the aggregate gross unrealized appreciation and depreciation based on that cost were: |
| Unrealized Appreciation | $ | 181,936 | ||
| Unrealized Depreciation | (77,375 | ) | ||
| Net Unrealized Appreciation | $ | 104,561 |
| ● | Currently non-income producing. |
| ╪ | See Significant Accounting Policies of accompanying Notes to Financial Statements regarding valuation of securities. |
The accompanying notes are an integral part of these financial statements.
| Hartford MidCap HLS Fund |
June 30, 2010 (Unaudited) |
| (000’s Omitted) |
| Total | Level 1♦ | Level 2♦ | Level 3 | |||||||||||||
| Assets: | ||||||||||||||||
| Common Stocks ‡ | $ | 1,552,625 | $ | 1,552,625 | $ | – | $ | – | ||||||||
| Short-Term Investments | 8,525 | – | 8,525 | – | ||||||||||||
| Total | $ | 1,561,150 | $ | 1,552,625 | $ | 8,525 | $ | – | ||||||||
| ♦ | For the period ended June 30, 2010, there were no significant transfers between Level 1 and Level 2. |
| ‡ | The Fund has all or primarily all of these equity securities categorized in a single level. Refer to the Schedule of Investments for further industry breakout. |
The accompanying notes are an integral part of these financial statements.
| Hartford MidCap HLS Fund |
June 30, 2010 (Unaudited) |
| (000’s Omitted) |
| Assets: | ||||
| Investments in securities, at market value (cost $1,443,926) | $ | 1,561,150 | ||
| Cash | 1 | |||
| Receivables: | ||||
| Investment securities sold | 1,313 | |||
| Fund shares sold | 721 | |||
| Dividends and interest | 841 | |||
| Other assets | — | |||
| Total assets | 1,564,026 | |||
| Liabilities: | ||||
| Payables: | ||||
| Investment securities purchased | 3,404 | |||
| Fund shares redeemed | 1,165 | |||
| Investment management fees | 242 | |||
| Distribution fees | 6 | |||
| Accrued expenses | 178 | |||
| Total liabilities | 4,995 | |||
| Net assets | $ | 1,559,031 | ||
| Summary of Net Assets: | ||||
| Capital stock and paid-in-capital | $ | 1,820,665 | ||
| Accumulated undistributed net investment income | 2,198 | |||
| Accumulated net realized loss on investments | (381,056 | ) | ||
| Unrealized appreciation of investments | 117,224 | |||
| Net assets | $ | 1,559,031 | ||
| Shares authorized | 2,400,000 | |||
| Par value | $ | 0.001 | ||
Class IA: Net asset value per share | $ | 20.91 | ||
| Shares outstanding | 69,363 | |||
| Net assets | $ | 1,450,282 | ||
Class IB: Net asset value per share | $ | 20.68 | ||
| Shares outstanding | 5,258 | |||
| Net assets | $ | 108,749 | ||
The accompanying notes are an integral part of these financial statements.
| Hartford MidCap HLS Fund |
| For the Six-Month Period Ended June 30, 2010 (Unaudited) |
| (000’s Omitted) |
| Investment Income: | ||||
| Dividends | $ | 7,480 | ||
| Interest | 17 | |||
| Less: Foreign tax withheld | — | |||
| Total investment income, net | 7,497 | |||
| Expenses: | ||||
| Investment management fees | 5,232 | |||
| Administrative service fees | 541 | |||
| Transfer agent fees | 3 | |||
| Distribution fees - Class IB | 197 | |||
| Custodian fees | 7 | |||
| Accounting services fees | 103 | |||
| Board of Directors' fees | 23 | |||
| Audit fees | 20 | |||
| Other expenses | 169 | |||
| Total expenses (before fees paid indirectly) | 6,295 | |||
| Commission recapture | (45 | ) | ||
| Total fees paid indirectly | (45 | ) | ||
| Total expenses, net | 6,250 | |||
| Net investment income | 1,247 | |||
| Net Realized Gain on Investments: | ||||
| Net realized gain on investments | 104,367 | |||
| Net realized gain on forward foreign currency contracts | — | |||
| Net realized gain on other foreign currency transactions | — | |||
| Net Realized Gain on Investments | 104,367 | |||
| Net Changes in Unrealized Depreciation of Investments: | ||||
| Net unrealized depreciation of investments | (115,032 | ) | ||
| Net unrealized appreciation on translation of other assets and liabilities in foreign currencies | — | |||
| Net Changes in Unrealized Depreciation of Investments | (115,032 | ) | ||
| Net Loss on Investments | (10,665 | ) | ||
| Net Decrease in Net Assets Resulting from Operations | $ | (9,418 | ) | |
The accompanying notes are an integral part of these financial statements.
| Hartford MidCap HLS Fund |
| (000’s Omitted) |
| For the | ||||||||
| Six-Month | For the | |||||||
| Period Ended | Year Ended | |||||||
| June 30, 2010 | December 31, | |||||||
| (Unaudited) | 2009 | |||||||
| Operations: | ||||||||
| Net investment income | $ | 1,247 | $ | 7,801 | ||||
| Net realized gain (loss) on investments | 104,367 | (209,864 | ) | |||||
| Net unrealized appreciation (depreciation) of investments | (115,032 | ) | 677,841 | |||||
| Payment from affiliate | — | 499 | ||||||
| Net increase (decrease) in net assets resulting from operations | (9,418 | ) | 476,277 | |||||
| Distributions to Shareholders: | ||||||||
| From net investment income | ||||||||
| Class IA | — | (7,335 | ) | |||||
| Class IB | — | (455 | ) | |||||
| Total distributions | — | (7,790 | ) | |||||
| Capital Share Transactions: | ||||||||
| Class IA | ||||||||
| Sold | 89,990 | 167,249 | ||||||
| Issued on reinvestment of distributions | — | 7,335 | ||||||
| Redeemed | (116,916 | ) | (664,029 | ) | ||||
| Total capital share transactions | (26,926 | ) | (489,445 | ) | ||||
| Class IB | ||||||||
| Sold | 15,469 | 22,487 | ||||||
| Issued on reinvestment of distributions | — | 455 | ||||||
| Redeemed | (84,151 | ) | (59,996 | ) | ||||
| Total capital share transactions | (68,682 | ) | (37,054 | ) | ||||
| Net decrease from capital share transactions | (95,608 | ) | (526,499 | ) | ||||
| Net decrease in net assets | (105,026 | ) | (58,012 | ) | ||||
| Net Assets: | ||||||||
| Beginning of period | 1,664,057 | 1,722,069 | ||||||
| End of period | $ | 1,559,031 | $ | 1,664,057 | ||||
Accumulated undistributed (distribution in excess of) net investment income | $ | 2,198 | $ | 951 | ||||
| Shares: | ||||||||
| Class IA | ||||||||
| Sold | 4,079 | 9,737 | ||||||
| Issued on reinvestment of distributions | — | 355 | ||||||
| Redeemed | (5,297 | ) | (35,304 | ) | ||||
| Total share activity | (1,218 | ) | (25,212 | ) | ||||
| Class IB | ||||||||
| Sold | 695 | 1,317 | ||||||
| Issued on reinvestment of distributions | — | 22 | ||||||
| Redeemed | (3,718 | ) | (3,604 | ) | ||||
| Total share activity | (3,023 | ) | (2,265 | ) | ||||
The accompanying notes are an integral part of these financial statements.
| Hartford MidCap HLS Fund |
| June 30, 2010 (Unaudited) |
| (000’s Omitted) |
| 1. | Organization: |
Hartford MidCap HLS Fund (the "Fund") serves as an underlying investment option for certain variable annuity and variable life insurance separate accounts of Hartford Life Insurance Company (“HLIC”) and its affiliates and certain qualified retirement plans. The Fund may also serve as an underlying investment option for certain variable annuity and variable life separate accounts of other insurance companies. Owners of variable annuity contracts and policyholders of variable life insurance contracts may choose the funds permitted in the variable insurance contract prospectus. In addition, participants in certain qualified retirement plans may choose the fund if permitted by their plans.
Hartford Series Fund, Inc. (the “Company”) is an open-end registered management investment company comprised of twenty-nine portfolios, one portfolio of which is included in these financial statements.
The Company is organized under the laws of the State of Maryland and is registered with the Securities and Exchange Commission (“SEC”) under the Investment Company Act of 1940, as amended (“1940 Act”). The Fund is organized as a diversified open-end management investment company.
The Fund is divided into Class IA and Class IB shares. Each class is offered at the per share net asset value (“NAV”) without a sales charge and is subject to the same expenses, except that the Class IB shares are subject to distribution and service fees charged pursuant to a Distribution and Service Plan adopted in accordance with Rule 12b-1 under the 1940 Act.
| 2. | Significant Accounting Policies: |
The following is a summary of significant accounting policies of the Fund, which are in accordance with U.S. Generally Accepted Accounting Principles (“GAAP”).
| a) | Security Transactions and Investment Income – Security transactions are recorded on the trade date (the date the order to buy or sell is executed). Security gains and losses are determined on the basis of identified cost. |
Dividend income is accrued as of the ex-dividend date, except that certain dividends for foreign securities where the ex-dividend date may have passed are recorded as soon as the Fund is informed of the dividend in the exercise of reasonable diligence. Interest income, including amortization of premium and accretion of discounts, is accrued on a daily basis.
| b) | Security Valuation – The Fund generally uses market prices in valuing portfolio securities. If market prices are not readily available or are deemed unreliable, the Fund will use the fair value of the security as determined in good faith under policies and procedures established by and under the supervision of the Fund’s Board of Directors. Market prices may be deemed unreliable, for example, if a security is thinly traded or if an event has occurred after the close of the security’s primary market, but before the close of the New York Stock Exchange (the “Exchange”) (generally 4:00 p.m. Eastern Time, referred to as the “Valuation Time”) that is expected to affect the value of the portfolio security. The circumstances in which the Fund may use fair value pricing include, among others: (i) the occurrence of events that are significant to a particular issuer, such as mergers, restructuring or defaults; (ii) the occurrence of events that are significant to an entire market, such as natural disasters in a particular region or governmental actions; (iii) trading restrictions on securities; (iv) thinly traded securities and (v) market events such as trading halts and early market closings. In addition, with respect to the valuation of stocks primarily traded on foreign markets, the Fund uses a fair value pricing service approved by the Fund’s Board of Directors, which employs quantitative models that evaluate changes in the value of foreign market proxies (e.g., futures contracts, American Depositary Receipts (“ADRs”), exchange traded funds (“ETFs”)) after the close of the foreign markets but before the Valuation Time. Securities that are primarily traded on foreign markets may trade on days that are not business days of the Fund. The value of the foreign securities in which the Fund invests may change on days when a shareholder will not be able to purchase or redeem shares of the Fund. Fair value pricing is subjective in nature and the use of fair value pricing by the Fund may cause the NAV of its shares to differ significantly from the NAV that would have been calculated using market prices at the close of the exchange on which a portfolio security is primarily traded but before the Valuation Time. There can be no |
| Hartford MidCap HLS Fund |
| Notes to Financial Statements – (continued) |
| June 30, 2010 (Unaudited) |
| (000’s Omitted) |
assurance that the Fund could obtain the fair value assigned to a security if the Fund were to sell the security at approximately the time at which the Fund determines its NAV.
Foreign-denominated assets, including investment securities, and liabilities are translated from the local currency into U.S. dollars using exchange rates obtained from an independent third party as of the Fund’s Valuation Time.
Financial instruments for which prices are not available from an independent pricing service may be valued using market quotations obtained from one or more dealers that make markets in securities in accordance with procedures established by the Fund’s Board of Directors.
Forward foreign currency contracts represent agreements to exchange currencies on specific future dates at predetermined rates. Forward foreign currency contracts are valued using foreign currency exchange rates and forward rates on the Valuation Date from an independent pricing service.
Other derivative or contractual type instruments shall be valued using market prices if such instruments trade on an exchange or market. If such instruments do not trade on an exchange or market, such instruments shall be valued at a price at which the counterparty to such contract would repurchase the instrument. In the event that the counterparty cannot provide a price, such valuation may be determined in accordance with procedures established by the Fund’s Board of Directors.
Various inputs are used in determining the value of the Fund’s investments. These inputs are summarized into three broad hierarchy levels. This hierarchy is based on whether the valuation inputs are observable or unobservable. These levels are:
| · | Level 1 – Quoted prices in active markets for identical securities. Level 1 may include exchange-traded instruments such as domestic equities, some foreign equities, options, futures, mutual funds, ETFs, and rights and warrants. |
| · | Level 2 – Observable inputs other than Level 1 prices, such as quoted prices for similar securities; quoted prices in markets that are not active; or other inputs that are observable or can be corroborated by observable market data. Level 2 may include debt securities that are traded less frequently than exchange-traded instruments and which are valued using third party pricing services. Prices for most level 2 securities are based on prices received from an independent pricing service. The following asset classes generally use valuation techniques and inputs as noted below: |
Asset Backed Securities and Collateralized Mortgage Obligations – Multi-dimensional spread/prepayment speed tables, with consideration of yield or price of bonds of comparable quality, coupon and maturity, attributes of the collateral, new issue data and monthly payment information.
Corporate Bonds – Multi-dimensional relational model based on observable market information such as yields, spreads, sector analysis, etc.
Foreign Currency – Based on rates determined at the close of the Exchange, provided by an independent pricing service.
Forward Currency Contracts – Valued based on the price of the underlying currency at the prevailing interpolated exchange rate, which is a combination of the spot currency rate and the forward currency rate, provided by an independent pricing service.
Foreign Equities – Certain foreign equities are priced using a multi-factor regression model with market observable inputs of a correlative nature (ADRs, futures contracts, ETFs, and currency exchange rates).
International Fixed Income – Multi-dimensional relational model based on observable market information such as benchmark yields, reported trades, bids and offers.
Money Market Instruments – Amortized cost.
Mortgage Backed Securities (“MBS”) – Matrix pricing using inputs of To-Be-Announced (“TBA”) prices, new issue data and monthly payment information, with consideration of yield or price of bonds of comparable quality, coupon and maturity, and attributes of the collateral.
Municipal Bonds – Multi-dimensional relational model and series of matrices based on observable market information such as Municipal Securities Rulemaking Board reported trades, comparable bonds, yields, spreads and credit analysis.
Preferred Stocks – Close mean of bid/ask or bid.
Repurchase Agreements – Priced at par.
Senior Floating Rate Interests – Composite of quotes from one or more contributing dealers.
Swaps – Price based upon observable market information from an independent pricing service.
U.S. Government Securities – Treasuries exclusively traded in the secondary market.
| · | Level 3 – Significant unobservable inputs that are supported by limited or no market activity. Level 3 may include financial instruments whose values are determined using broker quotes or require significant management judgment or estimation. While these securities are priced using unobservable inputs, the valuation of these securities reflects the best available data and management believes the prices are a reasonable representation of exit price. The following asset classes generally use valuation techniques and inputs as noted below: |
Asset Backed Securities & Commercial Mortgage Backed Securities – Certain other MBS with limited liquidity priced from an independent pricing service.
Common Stocks – Trading has been halted or there are restrictions on trading. Valuation is based on last trade with the application of a discount or premium, if applicable.
Long Dated Over-the-Counter Options – Terms greater than 10 years from current date, expected volatility is not observable. Prices are from an independent pricing service.
Long Term Debt Securities, including Senior Floating Rate Interests – Unobservable valuation inputs may include estimates for current yields, maturity/duration, prepayment speed, and broker quotes for comparable securities along with other assumptions relating to credit quality, collateral value, complexity of the security structure, general market conditions and liquidity.
Swaps – Terms greater than 10 years from current date, expected volatility is not observable. Prices are from an independent pricing service.
Individual securities within any of the above mentioned asset classes may be assigned a different hierarchical level than those that are presented above, as individual circumstances dictate.
During the six-month period ended June 30, 2010, the Fund held no Level 3 securities, therefore no reconciliation of Level 3 securities is presented.
| Hartford MidCap HLS Fund |
| Notes to Financial Statements – (continued) |
| June 30, 2010 (Unaudited) |
| (000’s Omitted) |
Refer to the Investment Valuation Hierarchy Level Summary found following the Schedule of Investments.
| c) | Foreign Currency Transactions – Assets and liabilities denominated in currencies other than U.S. dollars are translated into U.S. dollars at the exchange rates in effect on the valuation date. Purchases and sales of investment securities, income and expenses are translated into U.S. dollars at the exchange rates on the dates of such transactions. |
The Fund does not isolate that portion of portfolio security valuation resulting from fluctuations in the foreign currency exchange rates from the fluctuations arising from changes in the market prices of securities held. Exchange rate fluctuations are included with the net realized and unrealized gain or loss on investments in the accompanying financial statements.
Net realized foreign exchange gains or losses arise from sales of foreign currencies and the difference between asset and liability amounts initially stated in foreign currencies and the U.S. dollar value of the amounts actually received or paid. Net unrealized foreign exchange gains or losses arise from changes in the value of other assets and liabilities at the end of the reporting period, resulting from changes in the exchange rates.
| d) | Joint Trading Account – Pursuant to an exemptive order issued by the SEC, the Fund may transfer uninvested cash balances into a joint trading account managed by Wellington Management Company, LLP (“Wellington Management”). These balances may be invested in one or more repurchase agreements and/or short-term money market instruments. |
| e) | Repurchase Agreements – A repurchase agreement is an agreement by which a counterparty agrees to sell a security and agrees to repurchase the security sold at a mutually agreed upon time and price. At the time the Fund enters into a repurchase agreement, the value of the underlying collateral security(ies), including accrued interest, will be equal to or exceed the value of the repurchase agreement. To minimize counterparty risk, the securities that serve to collateralize the repurchase agreement are held by the Fund's custodian in book entry or physical form in the custodial account of the Fund or in a third party custodial account. Repurchase agreements are valued at cost plus accrued interest. The Fund, as shown on the Schedule of Investments, had outstanding repurchase agreements as of June 30, 2010. |
| f) | Forward Foreign Currency Contracts – The Fund may enter into forward foreign currency contracts that obligate the Fund to purchase or sell currencies at specified future dates. Forward foreign currency contracts may be used to hedge against adverse fluctuations in exchange rates between currencies. |
Forward foreign currency contracts involve elements of market risk in excess of the amounts reflected in the Statement of Assets and Liabilities. In addition, risks may arise upon entering into these contracts from the potential inability of the counterparties to meet the terms of the contracts and from unanticipated movements in the value of the foreign currencies relative to the U.S. dollar. The Fund had no outstanding forward foreign currency contracts as of June 30, 2010.
| g) | Fund Share Valuation and Dividend Distributions to Shareholders – Orders for the Fund’s shares are executed in accordance with the investment instructions of the contract holders or plan participants. The NAV of the Fund’s shares is determined as of the close of each business day of the Exchange. The NAV is determined separately for each class of the Fund by dividing the Fund’s net assets attributable to that class by the number of outstanding shares of the class. Orders for the purchase of the Fund’s shares received by an insurance company or plan prior to the close of the Exchange on any day on which the Exchange is open for business are priced at the NAV determined as of the close of the Exchange. Orders received by an insurance company or plan after the close of the Exchange, or on a day on which the Exchange and/or the Fund is not open for business, are priced at the next determined NAV. |
Dividends are declared pursuant to a policy adopted by the Fund’s Board of Directors based upon the investment performance of the Fund. The policy of the Fund is to pay dividends from net investment income and distribute realized capital gains, if any, at least once a year.
Distributions from net investment income, realized capital gains and capital are determined in accordance with federal income tax regulations, which may differ from U.S. GAAP with respect to character and timing. These differences may include but are not limited to losses deferred due to wash sale adjustments, foreign currency gains and losses, adjustments related to Passive Foreign Investment Companies (“PFICs”), Real Estate Investment Trusts (“REITs”), Regulated Investment Companies (“RICs”), certain derivatives and partnerships. Permanent book and federal income tax basis differences relating to shareholder distributions will result in reclassifications to certain of the Fund’s capital accounts (see Federal Income Taxes: Reclassification of Capital Accounts note).
| h) | Use of Estimates – The preparation of financial statements in conformity with U.S. GAAP requires management to make estimates and assumptions that affect the reported amounts of assets and liabilities as of the date of the financial statements and the reported amounts of income and expenses during the period. Operating results in the future could vary from the amounts derived from management’s estimates. |
| i) | Additional Derivative Instrument(s) Information |
The volume of derivative activity was minimal during the six-month period ended June 30, 2010.
Realized Gain/Loss on Derivative Instruments for the six-month period ended June 30, 2010:
Amount of Realized Gain or (Loss) on Derivatives Recognized in Income | ||||||||||||||||||||||||
| Forward | ||||||||||||||||||||||||
| Purchased | Currency | |||||||||||||||||||||||
Risk Exposure Category | Written Options | Options | Futures | Contracts | Swaps | Total | ||||||||||||||||||
| Foreign exchange contracts | $ | — | $ | — | $ | — | $ | — | $ | — | $ | — | ||||||||||||
| Total | $ | — | $ | — | $ | — | $ | — | $ | — | $ | — | ||||||||||||
| j) | Indemnifications – Under the Company’s organizational documents, the Company shall indemnify its officers and directors to the full extent required or permitted under Maryland General Corporation Law and the federal securities laws. In addition, the Company, on behalf of the Fund, may enter into contracts that contain a variety of indemnifications. The Company’s maximum exposure under these arrangements is unknown. However, the Company has not had prior claims or losses pursuant to these contracts and expects the risk of loss to be remote. | |
| 3. | Federal Income Taxes: |
| a) | Federal Income Taxes – For federal income tax purposes, the Fund intends to continue to qualify as a RIC under Subchapter M of the Internal Revenue Code (“IRC”) by distributing substantially all of its taxable net investment income and net realized capital gains to its shareholders and otherwise complying with the requirements of RICs. The Fund has distributed substantially all of its income and capital gains in prior years and intends to distribute substantially all of its income and capital gains prior to the next fiscal year end. Accordingly, no provision for federal income or excise taxes has been made in the accompanying financial statements. Distributions from short-term capital gains are treated as ordinary income distributions for federal income tax purposes. | |
| b) | Net Investment Income (Loss), Net Realized Gains (Losses) – Net investment income (loss) and net realized gains (losses) may differ for financial statement and tax purposes primarily because of losses deferred due to wash sale adjustments, foreign currency gains and losses, adjustments related to PFICs, REITs, RICs, certain derivatives and partnerships. The character of distributions made during the year from net investment income or net realized gains may differ from their ultimate characterization for federal income tax purposes. Also, due to the timing of dividend distributions, the fiscal year in which amounts are distributed may differ from the year that the income or realized gains (losses) were recorded by the Fund. |
| Hartford MidCap HLS Fund |
| Notes to Financial Statements – (continued) |
| June 30, 2010 (Unaudited) |
| (000’s Omitted) |
| c) | Distributions and Components of Distributable Earnings – The tax character of distributions paid by the Fund for the periods indicated is as follows (as adjusted for dividends payable): |
| For the Year Ended | For the Year Ended | |||||||
| December 31, 2009 | December 31, 2008 | |||||||
| Ordinary Income | $ | 7,790 | $ | 61,086 | ||||
| Long-Term Capital Gains* | — | 70,346 | ||||||
| * | The Fund designates these distributions as long-term capital dividends pursuant to IRC code Sec. 852(b)(3)(C). |
As of December 31, 2009, the Fund’s components of distributable earnings (deficit) on a tax basis were as follows:
| Amount | ||||
| Undistributed Ordinary Income | $ | 951 | ||
| Accumulated Capital and Other Losses* | (472,760 | ) | ||
Unrealized Appreciation† | 219,593 | |||
| Total Accumulated Deficit | $ | (252,216 | ) | |
| * | The Fund has capital loss carryforwards that are identified in the Capital Loss Carryforward note that follows. |
| † | The difference between book-basis and tax-basis unrealized appreciation (depreciation) may be attributable to the losses deferred due to wash sale adjustments, foreign currency gains and losses, adjustments related to PFICs, REITs, RICs, certain derivatives and partnerships. | |
| d) | Reclassification of Capital Accounts – The Fund may record reclassifications in its capital accounts. These reclassifications have no impact on the total net assets of the Fund. The reclassifications are a result of permanent differences between GAAP and tax accounting for such items as net operating losses that reduce distribution requirements. Adjustments are made to reflect the impact these items have on current and future distributions to shareholders. Therefore, the source of the Fund’s distributions may be shown in the accompanying Statement of Changes in Net Assets as from net investment income, from net realized gains on investments or from capital depending on the type of book and tax differences that exist. For the year ended December 31, 2009, the Fund recorded reclassifications to increase (decrease) the accounts listed below: |
| Amount | ||||
| Accumulated Undistributed Net Investment Income | $ | (449 | ) | |
| Accumulated Net Realized Gain (Loss) on Investments | 449 | |||
| e) | Capital Loss Carryforward – At December 31, 2009 (tax-year-end), the Fund had capital loss carryforwards for U.S. federal income tax purposes of approximately: |
| Year of Expiration | Amount | |||
| 2016 | $ | 142,416 | ||
| 2017 | 330,344 | |||
| Total | $ | 472,760 | ||
| f) | Accounting for Uncertainty in Income Taxes – Management has evaluated all open tax years and has determined there is no impact to the Fund’s financial statements related to uncertain tax positions. Generally, tax authorities can examine all tax returns filed for the last three years. |
| 4. | Expenses: |
| a) | Investment Management Agreements – HL Investment Advisors, LLC (“HL Advisors”), an indirect wholly-owned subsidiary of The Hartford Financial Services Group, Inc. (“The Hartford”), serves as investment manager to the Fund pursuant to an Investment Management Agreement with the Company. As investment manager, HL Advisors has overall investment supervisory responsibility for the Fund. In addition, HL Advisors provides administrative personnel, services, equipment, facilities and office space for proper operation of the Fund. |
HL Advisors has contracted with Wellington Management for the provision of day-to-day investment management services to the Fund in accordance with the Fund’s investment objective and policies. The Fund pays a fee to HL Advisors, a portion of which may be used to compensate Wellington Management.
| b) | Administrative Services Agreement – For the two-month period January 1, 2010 through February 28, 2010, under the Administrative Services Agreement between HLIC and the Company, on behalf of the Fund, HLIC provided administrative services to the Fund and received monthly compensation at the annual rate of 0.20% of the Fund’s average daily net assets. The Fund assumed and paid certain other expenses (including, but not limited to, accounting, custodian, state taxes and Directors’ fees). Effective March 1, 2010, the Investment Management Agreement was amended to include the administrative services for the Fund and the separate administrative services agreement was terminated. |
The schedule below reflects the rates of compensation paid to HL Advisors for investment management services and to HLIC for administrative services rendered from January 1, 2010 through February 28, 2010, and the rates of compensation paid to the HL Advisors for the combined services from March 1, 2010 through June 30, 2010; the rates are accrued daily and paid monthly.
| Average Daily Net Assets | Annual Fee | |||
| On first $250 million | 0.7750 | % | ||
| On next $250 million | 0.7250 | % | ||
| On next $500 million | 0.6750 | % | ||
| On next $4 billion | 0.6250 | % | ||
| On next $5 billion | 0.6225 | % | ||
| Over $10 billion | 0.6200 | % | ||
| c) | Accounting Services Agreement – Pursuant to the Fund Accounting Agreement between HLIC and the Company, on behalf of the Fund, HLIC provides accounting services to the Fund and receives monthly compensation on the Fund’s average net assets. The Fund’s accounting services fees are accrued daily and paid monthly. |
| Average Daily Net Assets | Annual Fee | |||
| On first $5 billion | 0.012 | % | ||
| Over $5 billion | 0.010 | % | ||
| d) | Operating Expenses – Allocable expenses incurred by the Company are allocated to each Fund and allocated to classes within the Fund in proportion to the average daily net assets of the Fund and each class, except where allocation of certain expenses is more fairly made directly to the Fund or to specific classes within a Fund. | |
| e) | Fees Paid Indirectly – The Company, on behalf of the Fund has entered into agreements with State Street Global Advisers, LLC and Russell Implementation Securities, Inc. to partially recapture non-discounted trade commissions. Such rebates are used to pay a portion of the Fund’s expenses. In addition, the Fund’s custodian bank has also agreed to |
| Hartford MidCap HLS Fund |
| Notes to Financial Statements – (continued) |
| June 30, 2010 (Unaudited) |
| (000’s Omitted) |
reduce its fees when the Fund maintains cash on deposit in a non-interest-bearing custody account. For the six-month period ended June 30, 2010, these amounts are included in the Statement of Operations.
The ratio of expenses to average net assets in the accompanying financial highlights excludes the reduction in expenses related to fees paid indirectly. Had the fees paid indirectly been included, the annualized expense ratio for the periods listed below would have been as follows:
| Annualized | ||||||||||||||||||||||||
| Six-Month | Year Ended | Year Ended | Year Ended | Year Ended | Year Ended | |||||||||||||||||||
| Period Ended | December 31, | December 31, | December 31, | December 31, | December 31, | |||||||||||||||||||
| June 30, 2010 | 2009 | 2008 | 2007 | 2006 | 2005 | |||||||||||||||||||
| Class IA | 0.71 | % | 0.70 | % | 0.68 | % | 0.68 | % | 0.66 | % | 0.68 | % | ||||||||||||
| Class IB | 0.96 | 0.95 | 0.93 | 0.93 | 0.91 | 0.93 | ||||||||||||||||||
| f) | Distribution Plan for Class IB shares – The Company, on behalf of the Fund, has adopted a Distribution Plan pursuant to Rule 12b-1 under the 1940 Act for the Class IB shares. Pursuant to the Distribution Plan, the Fund is authorized to compensate the Distributor, Hartford Securities Distribution Company, Inc. (a wholly owned, ultimate subsidiary of The Hartford), from assets attributable to the Class IB shares for services rendered and expenses borne in connection with activities primarily intended to result in the sale of the Class IB shares, subject to the Fund Board’s review and approval. |
The Distribution Plan provides that the Fund may pay annually up to 0.25% of the average daily net assets of the Fund attributable to its Class IB shares for activities primarily intended to result in the sale of Class IB shares. The Board has the authority to suspend or reduce these payments at any point in time. Under the terms of the Distribution Plan and the principal underwriting agreement, the Fund is authorized to make payments monthly to the Distributor which may be used to pay or compensate entities providing distribution and shareholder servicing with respect to the Class IB shares for such entities’ fees or expenses incurred or paid in that regard. These fees are accrued daily and paid monthly.
| g) | Other Related Party Transactions – Certain officers of the Fund are directors and/or officers of HL Advisors, and/or The Hartford or its subsidiaries. For the six-month period ended June 30, 2010, a portion of the Fund’s chief compliance officer’s salary was paid by all the investment companies in the Hartford fund complex. The portion allocated to the Fund was in the amount of $4. Hartford Investor Services Company, LLC ("HISC"), a wholly owned subsidiary of The Hartford, provides transfer agent services to the Fund. The amount HISC was compensated for providing such services can be found on the Statement of Operations. These fees are accrued daily and paid monthly. | |
| h) | Payment from Affiliate – In July of 2007, The Hartford entered into a settlement with the Attorneys General of the states of New York, Connecticut and Illinois relating to market timing and the company's individual variable annuity contracts in which certain payments would be made directly to the variable annuity contract holders. The distribution plan provides that unclaimed money from the settlement would be distributed to certain HLS Funds that are investment options through a Hartford individual variable annuity contract. The unclaimed money was distributed to the Fund on September 18, 2009, as follows: |
| Amount | ||||
| Reimbursement | $ | 499 | ||
On November 8, 2006, the SEC issued an order setting forth the terms of a settlement reached with three subsidiaries of The Hartford that resolves the SEC’s Division of Enforcement’s investigation of aspects of The Hartford’s variable annuity and mutual fund operations related to directed brokerage and revenue sharing. The Hartford settled this matter without admitting or denying the findings of the SEC.
The Fund is available for purchase by the separate accounts of different variable universal life policies, variable annuity products, and funding agreements and it is offered directly to certain qualified retirement plans (collectively “Products”). Although existing Products contain transfer restrictions, some Products, particularly older variable annuity products, do not contain restrictions on the frequency of transfers. In addition, as the result of the settlement of litigation against
Hartford Life, Inc. (“Hartford Life”) (the issuers of such variable annuity products), the Fund’s ability to restrict transfers by certain owners of older variable annuity products was limited. During 2006, these annuity owners surrendered the older variable annuity contracts that were the subject of prior litigation. In February 2005, Hartford Life agreed with the Board of Directors of the Fund to indemnify the Fund for any material harm caused to the Fund from frequent trading by these contracts owners.
The total return in the accompanying financial highlights includes payment from affiliates. Had the payment from affiliates been excluded, the total return for the periods listed below would have been as follows:
| For the Year Ended December 31, 2009 | ||||||||
| Class IA | Class IB | |||||||
| Impact from Payment from Affiliate for Attorneys General Settlement | 0.03 | % | 0.03 | % | ||||
| Total Return Excluding Payments from Affiliate | 30.92 | 30.59 | ||||||
| For the Year Ended December 31, 2006 | ||||||||
| Class IA | Class IB | |||||||
| Impact from Payment from Affiliate for SEC Settlement | 0.15 | % | 0.15 | % | ||||
| Total Return Excluding Payments from Affiliate | 11.59 | 11.31 | ||||||
| For the Year Ended December 31, 2005 | ||||||||
| Class IA | Class IB | |||||||
| Impact from Payment from Affiliate for Unrestricted Transfers | 0.02 | % | 0.02 | % | ||||
| Total Return Excluding Payments from Affiliate | 16.76 | 16.47 | ||||||
| 5. | Investment Transactions: |
For the six-month period ended June 30, 2010, the cost of purchases and proceeds from sales of investment securities (excluding short-term investments) were as follows:
| Amount | ||||
| Cost of Purchases Excluding U.S. Government Obligations | $ | 578,005 | ||
| Sales Proceeds Excluding U.S. Government Obligations | 611,659 | |||
| 6. | Line of Credit: |
The Fund is one of several Hartford funds that participate in a $500 million committed revolving line of credit facility. The facility is to be used for temporary or emergency purposes. Under the arrangement, a fund is required to own securities having a market value in excess of 300% of the total bank borrowings. The interest rate on borrowings varies depending on the nature of the loan. The facility also requires a fee to be paid based on the amount of the commitment. This fee is allocated to all the funds participating in the line of credit based on the average net assets of the funds. During the six-month period ended June 30, 2010, the Fund did not have any borrowings under this facility.
| 7. | Industry Classifications: |
Other than the industry classifications “Other Investment Pools and Funds” and “Exchange Traded Funds”, equity industry classifications used in this report are the Global Industry Classification Standard, which was developed by and is the exclusive property and service mark of MSCI, Inc. and Standard & Poor’s.
| Hartford MidCap HLS Fund |
| - Selected Per-Share Date (A) - |
| Net Asset | Net Realized | |||||||||||||||||||||||||||||||||||||||||||
| Value at | Payments | and Unrealized | Total from | Dividends from | Distributions | Net Increase | Net Asset | |||||||||||||||||||||||||||||||||||||
| Beginning of | Net Investment | from (to) | Gain (Loss) on | Investment | Net Investment | from Realized | Distributions | Total | (Decrease) in | Value at End | ||||||||||||||||||||||||||||||||||
Class | Period | Income (Loss) | Affiliate | Investments | Operations | Income | Capital Gains | from Capital | Distributions | Net Asset Value | of Period | |||||||||||||||||||||||||||||||||
| For the Six-Month Period Ended June 30, 2010 (Unaudited) | ||||||||||||||||||||||||||||||||||||||||||||
| IA | $ | 21.12 | $ | 0.02 | $ | – | $ | (0.23 | ) | $ | (0.21 | ) | $ | – | $ | – | $ | – | $ | – | $ | (0.21 | ) | $ | 20.91 | |||||||||||||||||||
| IB | 20.92 | (0.01 | ) | – | (0.23 | ) | (0.24 | ) | – | – | – | – | (0.24 | ) | 20.68 | |||||||||||||||||||||||||||||
| For the Year Ended December 31, 2009 | ||||||||||||||||||||||||||||||||||||||||||||
| IA | 16.21 | 0.11 | 0.01 | 4.89 | 5.01 | (0.10 | ) | – | – | (0.10 | ) | 4.91 | 21.12 | |||||||||||||||||||||||||||||||
| IB | 16.06 | 0.04 | 0.01 | 4.86 | 4.91 | (0.05 | ) | – | – | (0.05 | ) | 4.86 | 20.92 | |||||||||||||||||||||||||||||||
| For the Year Ended December 31, 2008 | ||||||||||||||||||||||||||||||||||||||||||||
| IA | 26.34 | 0.12 | – | (9.03 | ) | (8.91 | ) | (0.12 | ) | (1.10 | ) | – | (1.22 | ) | (10.13 | ) | 16.21 | |||||||||||||||||||||||||||
| IB | 26.08 | 0.06 | – | (8.92 | ) | (8.86 | ) | (0.06 | ) | (1.10 | ) | – | (1.16 | ) | (10.02 | ) | 16.06 | |||||||||||||||||||||||||||
| For the Year Ended December 31, 2007(H) | ||||||||||||||||||||||||||||||||||||||||||||
| IA | 26.99 | 0.06 | – | 3.99 | 4.05 | (0.15 | ) | (4.55 | ) | – | (4.70 | ) | (0.65 | ) | 26.34 | |||||||||||||||||||||||||||||
| IB | 26.76 | (0.01 | ) | – | 3.95 | 3.94 | (0.07 | ) | (4.55 | ) | – | (4.62 | ) | (0.68 | ) | 26.08 | ||||||||||||||||||||||||||||
| For the Year Ended December 31, 2006 | ||||||||||||||||||||||||||||||||||||||||||||
| IA | 28.73 | 0.33 | 0.04 | 2.92 | 3.29 | (0.33 | ) | (4.70 | ) | – | (5.03 | ) | (1.74 | ) | 26.99 | |||||||||||||||||||||||||||||
| IB | 28.53 | 0.25 | 0.04 | 2.89 | 3.18 | (0.25 | ) | (4.70 | ) | – | (4.95 | ) | (1.77 | ) | 26.76 | |||||||||||||||||||||||||||||
| For the Year Ended December 31, 2005 | ||||||||||||||||||||||||||||||||||||||||||||
| IA | 28.61 | 0.11 | 0.01 | 4.60 | 4.72 | (0.12 | ) | (4.48 | ) | – | (4.60 | ) | 0.12 | 28.73 | ||||||||||||||||||||||||||||||
| IB | 28.42 | 0.01 | 0.01 | 4.59 | 4.61 | (0.02 | ) | (4.48 | ) | – | (4.50 | ) | 0.11 | 28.53 | ||||||||||||||||||||||||||||||
| (A) | Information presented relates to a share outstanding throughout the indicated period. |
| (B) | The figures do not include sales charges or other fees which may be applied at the variable life insurance, variable annuity or qualified retirement plan product level. Any such additional sales charges or other fees would lower the Fund's performance. |
| (C) | Ratios do not reflect reductions for fees paid indirectly. Please see Fees Paid Indirectly in the Notes to Financial Statements. |
| (D) | Portfolio turnover rate is calculated on the basis of the Fund as a whole without distinguishing between the classes of shares issued. |
| (E) | Not annualized. |
| (F) | Annualized. |
| (G) | Total return without the inclusion of the Payment from (to) Affiliate, as noted on the Statement of Operations, can be found in Expenses in the accompanying Notes to Financial Statements. |
| (H) | Per share amounts have been calculated using the average shares method. |
| - Ratios and Supplemental Data - - |
Net Assets at | Ratio of Expenses to Average Net | Ratio of Expenses to Average Net | Ratio of Net Investment Income to | Portfolio | ||||||||||||||||||
Total Return(B) | End of Period | Assets Before Waivers(C) | Assets After Waivers(C) | Average Net Assets | Turnover Rate(D) | |||||||||||||||||
| (1.01 | )%(E) | $ | 1,450,282 | 0.71 | %(F) | 0.71 | %(F) | 0.17 | %(F) | 35 | % | |||||||||||
| (1.12 | ) (E) | 108,749 | 0.96 | (F) | 0.96 | (F) | (0.12 | ) (F) | – | |||||||||||||
| 30.96 | (G) | 1,490,852 | 0.72 | 0.72 | 0.48 | 82 | ||||||||||||||||
| 30.62 | (G) | 173,205 | 0.97 | 0.97 | 0.23 | – | ||||||||||||||||
| (35.32 | ) | 1,552,741 | 0.69 | 0.69 | 0.51 | 92 | ||||||||||||||||
| (35.49 | ) | 169,328 | 0.94 | 0.94 | 0.26 | – | ||||||||||||||||
| 15.30 | 2,716,285 | 0.69 | 0.69 | 0.22 | 79 | |||||||||||||||||
| 15.01 | 302,151 | 0.94 | 0.94 | (0.03 | ) | – | ||||||||||||||||
| 11.74 | (G) | 2,606,275 | 0.68 | 0.68 | 1.06 | 89 | ||||||||||||||||
| 11.46 | (G) | 274,695 | 0.93 | 0.93 | 0.82 | – | ||||||||||||||||
| 16.78 | (G) | 2,529,805 | 0.70 | 0.70 | 0.39 | 70 | ||||||||||||||||
| 16.49 | (G) | 254,833 | 0.95 | 0.95 | 0.14 | – | ||||||||||||||||
| Hartford MidCap HLS Fund |
The Board of Directors appoints officers who are responsible for the day-to-day operations of the Fund and who execute policies formulated by the Directors. Each director serves until his or her death, resignation, or retirement or until the next annual meeting of shareholders is held or until his or her successor is elected and qualifies.
Directors and officers who are employed by or who have a financial interest in The Hartford are considered “interested” persons of the Fund pursuant to the Investment Company Act of 1940, as amended. Each officer and two of the Company’s directors, as noted in the chart below, are “interested” persons of the Fund. Each director serves as a director for The Hartford Mutual Funds, Inc., The Hartford Mutual Funds II, Inc., The Hartford Income Shares Fund, Inc., Hartford Series Fund, Inc., and Hartford HLS Series Fund II, Inc., which, as of June 30, 2010, collectively consist of 88 funds. Correspondence may be sent to directors and officers c/o Hartford Mutual Funds, P.O. Box 2999, Hartford, Connecticut 06104-2999, except that correspondence to Ms. Fagely may be sent to 500 Bielenberg Drive, Woodbury, Minnesota 55125.
The table below sets forth, for each director and officer, his or her name, year of birth, current position with the Company and date first elected or appointed to Hartford Series Fund, Inc. (“HSF”), and Hartford HLS Series Fund II, Inc. (“HSF2”), principal occupation, and, for directors, other directorships held. The Fund’s statement of additional information contains further information on the directors and is available free of charge by calling 1-800-862-6668 or writing to Hartford HLS Funds, c/o Individual Annuity Services, P.O. Box 5085, Hartford, CT 06102-5085.
Information on the aggregate remuneration paid to the directors of the Company can be found in the Statement of Operations herein. The Fund pays to The Hartford a portion of the chief compliance officer’s compensation, but does not pay salaries or compensation to any of their other officers or directors who are employed by The Hartford.
Non-Interested Directors
Lynn S. Birdsong (1946) Director since 2003, Co-Chairman of the Investment Committee
Mr. Birdsong is a private investor. Since 2003, Mr. Birdsong has been an independent director of The Japan Fund and has served as a Director of the Sovereign High Yield Fund since April 2010. From 2003 to March 2005, Mr. Birdsong was an independent director of the Atlantic Whitehall Funds. From 1979 to 2002, Mr. Birdsong was a managing director of Zurich Scudder Investments, an investment management firm. During his employment with Scudder, Mr. Birdsong was an interested director of The Japan Fund. Since 1981, Mr. Birdsong has been a partner in Birdsong Company, an advertising specialty firm.
Robert M. Gavin, Jr. (1940) Director since 2002 (HSF) and 1986 (HSF2), Chairman of the Board since 2004
Dr. Gavin is an educational consultant. Prior to September 1, 2001, he was President of Cranbrook Education Community and prior to July 1996, he was President of Macalester College, St. Paul, Minnesota.
Duane E. Hill (1945) Director since 2001 (HSF) and 2002 (HSF2), Chairman of the Nominating Committee
Mr. Hill is Partner of TSG Ventures L.P., a private equity investment company. Mr. Hill is a former partner of TSG Capital Group, a private equity investment firm that served as sponsor and lead investor in leveraged buyouts of middle market companies.
Sandra S. Jaffee (1941) Director since 2005
Ms. Jaffee served as Chairman (2008 to 2009) and Chief Executive Officer of Fortent (formerly Searchspace Group), a leading provider of compliance/regulatory technology to financial institutions from August 2005 to August 2009. From August 2004 to August 2005, Ms. Jaffee served as an Entrepreneur in Residence with Warburg Pincus, a private equity firm. From September 1995 to July 2004, Ms. Jaffee served as Executive Vice President at Citigroup, where she was President and Chief Executive Officer of Citibank’s Global Securities Services (1995 to 2003).
William P. Johnston (1944) Director since 2005, Chairman of the Compliance Committee
In June 2006, Mr. Johnston was appointed as Senior Advisor to The Carlyle Group, a global private equity investment firm. In July 2006, Mr. Johnston was elected to the Board of Directors of MultiPlan, Inc. In August 2007, Mr. Johnston was elected to the Board of Directors of LifeCare Holdings, Inc. In February 2008, Mr. Johnston was elected to the Board of Directors of HCR-ManorCare, Inc. In May 2006, Mr. Johnston was elected to the Supervisory Board of Fresenius Medical Care AG & Co. KGaA, after its acquisition of Renal Care Group, Inc. in March 2006. Mr. Johnston joined Renal Care Group in November 2002 as a member of the Board of Directors and served as Chairman of the Board from March 2003 through March 2006. From September 1987 to December 2002, Mr. Johnston was with Equitable Securities Corporation (and its successors, SunTrust Equitable Securities and SunTrust Robinson Humphrey) serving in various investment banking and managerial positions, including Managing Director and Head of Investment Banking, Chief Executive Officer and Vice Chairman.
Phillip O. Peterson (1944) Director since 2002 (HSF) and 2000 (HSF2), Chairman of the Audit Committee
Mr. Peterson is a mutual fund industry consultant. He was a partner of KPMG LLP (an accounting firm) until July 1999. Mr. Peterson joined William Blair Funds in February 2007 as a member of the Board of Trustees. From January 2004 to April 2005, Mr. Peterson served as Independent President of the Strong Mutual Funds.
Lemma W. Senbet (1946) Director since 2005
Dr. Senbet is the William E. Mayer Chair Professor of Finance and Director, Center for Financial Policy, at the University of Maryland, Robert H. Smith School of Business. He was chair of the Finance Department during 1998 to 2006. Previously he was a chaired professor of finance at the University of Wisconsin-Madison. Also, he was director of the Fortis Funds from March 2000 to July 2002. Dr. Senbet served the finance profession in various capacities, including as director of the American Finance Association and President of the Western Finance Association. In 2006, Dr. Senbet was inducted Fellow of Financial Management Association International for his career-long distinguished scholarship and professional service.
Interested Directors and Officers
Lowndes A. Smith (1939) Director since 1996 (HSF) and 2002 (HSF2), Co-Chairman of the Investment Committee
Mr. Smith served as Vice Chairman of The Hartford from February 1997 to January 2002, as President and Chief Executive Officer of Hartford Life, Inc. from February 1997 to January 2002, and as President and Chief Operating Officer of The Hartford Life Insurance Companies from January 1989 to January 2002. Mr. Smith serves as a Director of White Mountains Insurance Group, Ltd., One Beacon Insurance, Symetra Financial and as a Managing Director of Whittington Gray Associates.
John C. Walters 1, 2 (1962) Director since 2008
Mr. Walters currently serves as President, Chief Executive Officer and Director for Hartford Life, Inc. (“HL, Inc.”). Mr. Walters also serves as President, Chairman of the Board, Chief Executive Officer and Director for Hartford Life Insurance Company (“Hartford Life”), and as Executive Vice President of The Hartford. In addition, Mr. Walters is a Manager of HL Investment Advisors, LLC (“HL Advisors”). Mr. Walters previously served as President of the U.S. Wealth Management Division of HL, Inc. (2006-2007) and as Co-Chief Operating Officer of Hartford Life (2007-2008).
| 1 | Mr. Walters previously served as President and Chief Executive Officer (2007 to 2009). |
| 2 | Effective July 31, 2010, Mr. Walters retired from The Hartford. Mr. Walters resigned his position as a Director of the Fund effective July 30, 2010. |
Other Officers
Robert M. Arena, Jr. (1968) President and Chief Executive Officer since 2009 (served as Vice President of the Fund (2006-2009))
Mr. Arena serves as Executive Vice President of Hartford Life. Additionally, Mr. Arena is Senior Vice President and Director of Hartford Administrative Services Company, (“HASCO”), President, Chief Executive Officer and Manager of Hartford Investment Financial Services, LLC (“HIFSCO”) and President, Chief Executive Officer and Manager of HL Advisors. Mr. Arena joined The Hartford in 2004.
Tamara L. Fagely (1958) Vice President, Treasurer and Controller since 2002 (HSF) 1993 (HSF2)
Ms. Fagely has been a Vice President of HASCO since 1998 and Chief Financial Officer since 2006. Currently Ms. Fagely is a Vice President of Hartford Life. She served as Assistant Vice President of Hartford Life from December 2001 through March 2005. In addition, Ms. Fagely is Controller and Chief Financial Officer of HIFSCO.
Brian Ferrell (1962) AML Compliance Officer since 2008
Mr. Ferrell has served as Assistant Vice President and AML Compliance Officer for The Hartford since 2006, and as AML Compliance Officer for HASCO and Hartford Investor Services Company, LLC (“HISC”) since 2008. Prior to joining The Hartford in 2006, Mr. Ferrell held various positions at the U.S. Department of the Treasury (the “Treasury”) from 2001 to 2006, where he served as Chief Counsel for the Treasury’s Financial Crimes Enforcement Network from 2005-2006.
Dr. Robert J. Froehlich (1953) Senior Managing Director since 2009
Dr. Froehlich joined The Hartford as Senior Managing Director in September 2009. Prior to joining The Hartford, Dr. Froehlich served as Vice Chairman of Deutsche Asset Management from 1997-2009.
| Hartford MidCap HLS Fund |
| Directors and Officers (Unaudited) – (continued) |
Thomas D. Jones, III (1965) Vice President and Chief Compliance Officer since 2006
Mr. Jones serves as Chief Compliance Officer for the Hartford Mutual Funds and Vice President and Director of Securities Compliance for The Hartford. Mr. Jones joined The Hartford in 2006 from SEI Investments, where he served as Chief Compliance Officer for its mutual funds and investment advisers. Prior to joining SEI, Mr. Jones was First Vice President and Compliance Director for Merrill Lynch Investment Managers (Americas) (“MLIM”), where he worked from 1992-2004.
Edward P. Macdonald (1967) Vice President, Secretary and Chief Legal Officer since 2005
Mr. Macdonald serves as Assistant Vice President of Hartford Life and Chief Legal Officer and Vice President of HIFSCO. He also serves as Vice President and Secretary of HASCO, and Chief Legal Officer, Secretary and Vice President of HL Advisors. Mr. Macdonald joined The Hartford in 2005.
Vernon J. Meyer (1964) Vice President since 2006
Mr. Meyer serves as Senior Vice President of Hartford Life. He also serves as Senior Vice President of HIFSCO and HL Advisors. Mr. Meyer joined The Hartford in 2004.
D. Keith Sloane (1960) Vice President since 2009
Mr. Sloane is a Senior Vice President of Hartford Life. Additionally, Mr. Sloane currently serves as Senior Vice President of HIFSCO, HL Advisors, and HASCO. Prior to joining The Hartford in 2007, Mr. Sloane was Director of product marketing and led the mutual fund business for Wachovia Securities (“Wachovia”) in their investment products group. Mr. Sloane joined Wachovia in 1995.
Jane Wolak (1961) Vice President since 2009
Ms. Wolak currently serves as Vice President of Hartford Life. Ms. Wolak joined Hartford Life as Vice President, Retail Product Services in May 2007. She is also Vice President of HASCO. Previously, Ms. Wolak was with Sun Life Financial where she held the position of Vice President, Service Center Operations from 2001-2007.
A description of the policies and procedures that the Fund uses to determine how to vote proxies relating to portfolio securities and a record of how the Fund voted any proxies for the twelve-month period ended June 30, 2010 is available (1) without charge, upon request, by calling 800-862-6668 and (2) on the Securities and Exchange Commission’s website at http://www.sec.gov.
The Fund files a complete schedule of portfolio holdings with the Commission for the first and third quarters of each fiscal year on Form N-Q. The Fund’s Forms are available (1) without charge, upon request, by calling 800-862-6668 and (2) on the Securities and Exchange Commission’s website at http://www.sec.gov. The Form N-Q may be reviewed and copied at the Commission’s Public Reference Room in Washington, DC. Information on the operation of the Public Reference Room may be obtained by calling 1-800-SEC-0330.
��| Hartford MidCap HLS Fund |
The following proposals were addressed and approved at a Special Meeting of Shareholders held on February 12, 2010.
Proposal to approve amendments to the Investment Management Agreement between the Fund and HL Investment Advisors, the purpose of which were to combine the administrative services for the Fund with the management services for the Fund under a single agreement.
| Fund | For | Against | Abstain | |||
| Hartford MidCap HLS Fund | 44,645,604.987 | 1,046,244.728 | 881,848.032 |
Proposal to elect Lemma Senbet and John Walters, each currently a Director, as Directors of Hartford Series Fund Inc.
Lemma W. Senbet
| Funds | For | Withheld | ||
| Hartford Series Fund, Inc. | 5,079,578,022.902 | 241,839,974.106 |
John C. Walters
| Funds | For | Withheld | ||
| Hartford Series Fund, Inc. | 5,081,138,302.186 | 240,279,694.822 |
| Hartford MidCap HLS Fund |
Your Fund's Expenses
As a shareholder of the Fund, you incur two types of costs: (1) transaction costs, including sales charges (loads) on purchase payments and contingent deferred sales charges (CDSC) (2) ongoing costs including management fees; distribution fees; and other fund expenses. This example is intended to help you understand your ongoing costs (in dollars) of investing in the Fund and to compare these costs with the ongoing costs of investing in other mutual funds. The example is based on an investment of $1,000 invested at the beginning of the period and held for the period of December 31, 2009 through June 30, 2010.
Actual Expenses
The first set of columns of the table below provides information about actual account values and actual expenses. You may use the information in this column, together with the amount you invested, to estimate the expenses that you paid over the period. Simply divide your account value by $1,000 (for example, an $8,600 account value divided by $1,000 = 8.6), then multiply the result by the number in the line under the heading entitled "Expenses Paid During Period" to estimate the expenses you paid on your account during this period.
Hypothetical Example for Comparison Purposes
The second set of columns of the table below provides information about hypothetical account values and hypothetical expenses based on the Fund's actual expense ratio and an assumed rate of return of 5% per year before expenses, which is not the Fund's actual return. The hypothetical account values and expenses may not be used to estimate the actual ending account balance or expenses you paid for the period. You may use this information to compare the ongoing costs of investing in the Fund and other funds. To do so, compare this 5% hypothetical example with the 5% hypothetical examples that appear in the shareholder reports of the other funds.
Please note that the expenses shown in the table are meant to highlight your ongoing costs only and do not reflect any transactional costs, such as sales charges (loads) and CDSC. Therefore, the second set of columns of the table is useful in comparing ongoing costs only, and will not help you determine the relative total costs of owning different funds. In addition, if these transactional costs were included, your costs would be higher. Expenses are equal to the Fund's annualized expense ratios multiplied by average account value over the period, multiplied by 181/365 (to reflect the one-half year period).
Actual return | Hypothetical (5% return before expenses) | |||||||||||||||||||||||||||||||||||
| Expenses paid | Expenses paid | Days in | ||||||||||||||||||||||||||||||||||
| during the period | during the period | the | Days | |||||||||||||||||||||||||||||||||
| Beginning | Ending | December 31, 2009 | Beginning | Ending | December 31, 2009 | Annualized | current | in the | ||||||||||||||||||||||||||||
| Account Value | Account Value | through | Account Value | Account Value | through | expense | 1/2 | full | ||||||||||||||||||||||||||||
December 31, 2009 | June 30, 2010 | June 30, 2010 | December 31, 2009 | June 30, 2010 | June 30, 2010 | ratio | year | year | ||||||||||||||||||||||||||||
| Class IA | $ | 1,000.00 | $ | 989.87 | $ | 3.50 | $ | 1,000.00 | $ | 1,021.27 | $ | 3.56 | 0.71 | % | 181 | 365 | ||||||||||||||||||||
| Class IB | $ | 1,000.00 | $ | 988.76 | $ | 4.73 | $ | 1,000.00 | $ | 1,020.03 | $ | 4.81 | 0.96 | % | 181 | 365 | ||||||||||||||||||||
| Hartford MidCap HLS Fund |
The Board approved the annual continuation of the Investment Management Agreement (the “Agreement”) between Hartford Series Fund, Inc. (“HSF”) and HL Investment Advisors, LLC (“HL Advisors”) with respect to the Fund at its meeting on August 4-5, 2009. The Board’s considerations in approving the renewal of the Agreement are disclosed in the December 31, 2009 Annual Report for HSF.
At the November 4-5, 2009 meeting, the Board considered and approved amendments to the Agreement to include administrative services, which had been provided pursuant to a separate agreement, and investment management services under one agreement. The Board, including all of the Independent Directors, approved the amendments to the Agreement with respect to the Fund.
In approving the amendments, in addition to the information presented at the August meeting in connection with the annual review of the Agreement and the additional information provided throughout the year, the Board also considered the fact that the amendments did not result in an overall increase in fees to shareholders. The Board took note of the fact that the management of HL Advisors believes that the proposal to combine the administrative services with the investment management services under a single agreement will produce streamlined fee disclosure, resulting in greater transparency and clarity in the Fund’s prospectuses and financial reports. The Board further noted management's belief that the change would result in consistency across all of the Hartford Funds in the complex in that the funds of HSF are the only funds in the complex (other than the R share classes of the Hartford retail funds) that are subject to a separate administrative services fee. Finally, the Board noted management's view that the proposed changes to the Agreement should also serve to simplify the Board's annual consideration of the investment management arrangements for the Fund in that the investment management and administrative fees would be presented as a single fee for fee comparison purposes, which should facilitate the Board's analysis.
The shareholders of the Fund approved the amendments at a Special Meeting of Shareholders held on February 12, 2010. The amendments were effective as of March 1, 2010.
27
The Hartford
P.O. Box 5085
Hartford, CT 06102–5085
Hartford Series Fund, Inc. is underwritten and distributed by Hartford Securities Distribution Company, Inc.
“The Hartford” is The Hartford Financial Services Group, Inc. and its subsidiaries.
Hartford Series Fund, Inc. inception dates range from 1977 to date. Hartford Series Fund, Inc. is not a subsidiary of The Hartford but is underwritten, distributed by and advised by subsidiaries of The Hartford. Investments in Hartford Series Fund, Inc. are not guaranteed by The Hartford or any other entity.
This material is authorized for distribution only when preceded or accompanied by a current prospectus. The prospectus contains detailed information about the Funds, including investment objectives, risks and charges and expenses. Please read it carefully before you invest or send money.
HLSSAR-MC10 Printed in U.S.A ©2010 The Hartford, Hartford, CT 06115 |
| Hartford MidCap Value HLS Fund |
|
Hartford MidCap Value HLS Fund
| Manager Discussions (Unaudited) | 2 |
| Financial Statements | |
| 4 | |
| 7 | |
| 8 | |
| 9 | |
| 10 | |
| 11 | |
| 22 | |
| 24 | |
| 26 | |
| 26 | |
| 27 | |
| 28 | |
| 29 |
This report is prepared for the general information of contract owners and qualified retirement plan participants. It is not an offer of contracts or of qualified retirement plans. It should not be used in connection with any offer, except in conjunction with the appropriate prospectus which contains all pertinent information including the applicable sales, administrative and other charges.
The views expressed in the Fund’s Manager Discussion under ‘‘Why did the Fund perform this way?’’ and ‘‘What is the outlook?’’ are views of the Fund’s subadvisers and portfolio management team through the end of the period and is subject to change based on market and other conditions.
Hartford MidCap Value HLS Fund* inception 04/30/2001
(subadvised by Wellington Management Company, LLP)
Investment objective – Seeks long-term capital appreciation.
Performance Overview(1) 4/30/01 - 6/30/10
Growth of $10,000 investment

Russell 2500 Value Index is an unmanaged index measuring the performance of those Russell 2500 Index companies with lower price-to-book ratios and lower forecasted growth values.
You cannot invest directly in an index.
The chart represents a hypothetical investment in the Fund. Performance data represents past performance and current performance could be higher or lower.
Average Annual Returns (as of 6/30/10)
| 6 | 1 | 5 | Since | |
| Month† | Year | Year | Inception | |
| MidCap Value IA | -3.55% | 25.53% | 1.63% | 5.18% |
| MidCap Value IB | -3.66% | 25.22% | 1.38% | 4.93% |
| Russell 2500 Value Index | -1.57% | 26.46% | -0.09% | 6.13% |
| † | Not Annualized |
PAST PERFORMANCE IS NOT INDICATIVE OF FUTURE RESULTS.
| (1) | Growth of a $10,000 investment in Class IB shares will vary from the results seen on this page due to differences in the expense charged to this share class. |
Performance information may reflect historical or current expense waivers from the investment adviser, without which performance would have been lower. For information on current expense waivers/reimbursements, please see the prospectus.
The value of the contract will fluctuate so that when redeemed, it may be worth more or less than the original investment. The chart and table do not reflect the deduction of taxes that a shareholder would pay on portfolio distributions or the redemption of portfolio shares. The figures do not include sales charges or other fees which may be applied at the variable life insurance, variable annuity or qualified retirement plan product level. Any such additional sales charges or other fees would lower the Fund’s performance.
| * | The Fund has restrictions on the purchase of shares. A description of the restrictions can be found in the prospectus. |
Portfolio Manager
James N. Mordy
| Senior Vice President, Partner |
How did the Fund perform?
The Class IA shares of the Hartford MidCap Value HLS Fund returned -3.55% for the six-month period ended June 30, 2010, underperforming its benchmark, the Russell 2500 Value Index, which returned -1.57% for the same period. The Fund also underperformed the -2.92% return of the average fund in the Lipper Mid-Cap Value VP-UF Fund peer group, a group of funds with investment strategies similar to those of the Fund.
Why did the Fund perform this way?
Equity markets retreated during the period as the speed of the economic recovery was called into question by several global developments. Overall equity market performance was negative for the period across all market capitalizations: large cap equities (-7%), mid cap equities (-1%), and small cap equities (-2%) all declined as represented by the S&P 500, S&P 400 MidCap, and Russell 2000 indices respectively. During the six-month period, Financials (+3%) was the only sector to deliver positive returns within the Russell 2500 Value Index, while Telecommunication Services (-10%), Information Technology (-8%), and Energy (-6%) declined the most.
The Fund’s relative underperformance versus the index was primarily driven by weak stock selection within Consumer Staples, Financials, and Materials which overshadowed strong positive stock selection within Health Care, Consumer Discretionary, and Industrials. One negative factor was the Fund’s bias towards stocks with larger market caps, on average, than its benchmark during a period of relative small stock leadership. Overall sector allocation, a result of bottom-up (i.e. stock by stock fundamental research) security selection, was a modest detractor from relative returns, particularly due to the Fund’s underweight (i.e. the Fund’s sector position was less than the benchmark position) position in Financials.
The largest detractors from absolute and benchmark-relative returns included Arrow Electronics (Information Technology), Dean Foods (Consumer Staples), and Varian Semiconductor (Information Technology). Shares of both Arrow Electronic and Varian Semiconductor sold off along with the semiconductor group on investor concerns that near term business momentum is due for a pause and that semiconductor inventory has built up in the supply chain. Shares of food and beverage company Dean Foods declined
as company management revealed unanticipated margin pressure on their branded retail milk business which was caused by increased retailer discounting of private label milk in an effort to drive customer traffic.
The largest contributors to absolute and benchmark-relative performance included Impax Labs (Health Care), Buck Holdings (Consumer Discretionary), and PHH (Financials). Shares of Impax Labs, a generic and specialty pharmaceutical company, benefited from strong launches of two generic drugs (Adderall XR and Flomax). Buck Holdings is the Fund’s private investment in retailer Dollar General. The company completed a successful IPO during the period and management continues to execute its turnaround plan in a favorable environment for discounters. Shares of PHH, a U.S. residential mortgage loan originator, declined due to concerns about a renewed slowdown in the U.S. housing market.
What is the outlook?
The economic recovery has hit a soft patch in recent months. Recent U.S. employment reports have been disappointing, key indicators like the manufacturing and services ISM signal slower growth, housing has weakened again as tax credits expired, and credit availability remains tight in part due to uncertainty over financial regulatory reform. Globally, we feel that growth in China is downshifting and the fiscal tightening by European nations in response to their recent credit crisis will heavily constrain growth. Looking into 2011, we will likely encounter additional headwinds in the U.S. from more restrictive Federal, state and local fiscal policy as well as from higher tax rates. While we do not expect a double dip recession in the U.S., we do look for GDP to settle back into a 2-2.5% growth path going forward from a 3% pace during the first half of 2010.
Net purchases during the quarter were concentrated in the Industrials, Energy and Financials sectors. We were net sellers within Health Care, Technology and Utilities. Relative to three months ago, when we were slightly overweight (i.e. the Fund’s sector position was greater than the benchmark position) the more defensive sectors, we ended the period in a neutral position. This is a function of two things. We have seen some more compelling value emerge during the market downdraft. And with the annual rebalancing of the Russell indices in late June, our particular benchmark became slightly more defensive. Our largest sector overweight at the end of the period was Industrials and our largest sector underweight was Financials, relative to the benchmark.
Diversification by Industry
as of June 30, 2010
| Percentage of | ||||
| Industry (Sector) | Net Assets | |||
| Banks (Financials) | 3.0 | % | ||
| Capital Goods (Industrials) | 12.7 | |||
Consumer Durables & Apparel (Consumer Discretionary) | 4.8 | |||
| Consumer Services (Consumer Discretionary) | 0.6 | |||
| Diversified Financials (Financials) | 8.5 | |||
| Energy (Energy) | 6.4 | |||
| Food, Beverage & Tobacco (Consumer Staples) | 2.6 | |||
| Health Care Equipment & Services (Health Care) | 5.4 | |||
| Insurance (Financials) | 8.7 | |||
| Materials (Materials) | 8.1 | |||
| Media (Consumer Discretionary) | 3.4 | |||
| Pharmaceuticals, Biotechnology & Life Sciences | ||||
| (Health Care) | 3.4 | |||
| Real Estate (Financials) | 5.8 | |||
| Retailing (Consumer Discretionary) | 5.5 | |||
| Semiconductors & Semiconductor Equipment | ||||
| (Information Technology) | 2.4 | |||
| Software & Services (Information Technology) | 1.8 | |||
| Technology Hardware & Equipment (Information | ||||
| Technology) | 4.1 | |||
| Transportation (Industrials) | 4.7 | |||
| Utilities (Utilities) | 6.6 | |||
| Short-Term Investments | 0.7 | |||
| Other Assets and Liabilities | 0.8 | |||
| Total | 100.0 | % | ||
| Hartford MidCap Value HLS Fund |
June 30, 2010 (Unaudited)
| (000’s Omitted) |
| Shares or Principal Amount | Market Value ╪ | ||||||
| COMMON STOCKS - 98.5% | |||||||
Banks - 3.0% | |||||||
| 123 | Beneficial Mutual Bancorp, Inc. ● | $ | 1,218 | ||||
| 153 | Comerica, Inc. | 5,646 | |||||
| 376 | Huntington Bancshares, Inc. | 2,083 | |||||
| 859 | Popular, Inc. ● | 2,301 | |||||
| 139 | Umpqua Holdings Corp. | 1,600 | |||||
| 12,848 | |||||||
Capital Goods - 12.7% | |||||||
| 106 | AGCO Corp. ● | 2,853 | |||||
| 143 | AMETEK, Inc. | 5,737 | |||||
| 365 | Barnes Group, Inc. | 5,977 | |||||
| 67 | Dover Corp. | 2,804 | |||||
| 85 | Esterline Technologies Corp. ● | 4,032 | |||||
| 92 | Hubbell, Inc. Class B | 3,640 | |||||
| 230 | Pentair, Inc. | 7,406 | |||||
| 87 | Teledyne Technologies, Inc. ● | 3,349 | |||||
| 269 | Terex Corp. ● | 5,045 | |||||
| 273 | Textron, Inc. | 4,624 | |||||
| 161 | Thomas & Betts Corp. ● | 5,590 | |||||
| 84 | URS Corp. ● | 3,298 | |||||
| 54,355 | |||||||
Consumer Durables & Apparel - 4.8% | |||||||
| 212 | Mattel, Inc. | 4,475 | |||||
| 257 | MDC Holdings, Inc. | 6,931 | |||||
| 288 | Toll Brothers, Inc. ● | 4,712 | |||||
| 66 | V.F. Corp. | 4,698 | |||||
| 20,816 | |||||||
Consumer Services - 0.6% | |||||||
| 1,027 | Thomas Cook Group plc | 2,718 | |||||
Diversified Financials - 8.5% | |||||||
| 61 | Affiliated Managers Group, Inc. ● | 3,725 | |||||
| 223 | Ameriprise Financial, Inc. | 8,042 | |||||
| 285 | Invesco Ltd. | 4,788 | |||||
| 619 | PHH Corp. ● | 11,790 | |||||
| 185 | Solar Capital Ltd. | 3,554 | |||||
| 452 | Solar Cayman Ltd. ⌂●† | 179 | |||||
| 287 | TD Ameritrade Holding Corp. ● | 4,393 | |||||
| 36,471 | |||||||
Energy - 6.4% | |||||||
| 82 | Cabot Oil & Gas Corp. | 2,553 | |||||
| 152 | Cie Gen Geophysique SP ADR ● | 2,700 | |||||
| 181 | Cobalt International Energy ● | 1,350 | |||||
| 92 | Consol Energy, Inc. | 3,089 | |||||
| 76 | ENSCO International plc | 2,997 | |||||
| 105 | Newfield Exploration Co. ● | 5,135 | |||||
| 123 | Overseas Shipholding Group, Inc. | 4,549 | |||||
| 232 | Quicksilver Resources, Inc. ● | 2,554 | |||||
| 176 | SBM Offshore N.V. | 2,525 | |||||
| 27,452 | |||||||
Food, Beverage & Tobacco - 2.6% | |||||||
| 52 | Bunge Ltd. Finance Corp. | 2,568 | |||||
| 182 | Dean Foods Co. ● | 1,831 | |||||
| 75 | Molson Coors Brewing Co. | 3,177 | |||||
| 1,035 | PureCircle Ltd. ● | 3,834 | |||||
| 11,410 | |||||||
Health Care Equipment & Services - 5.4% | |||||||
| 91 | Amedisys, Inc. ● | 4,002 | |||||
| 265 | Amerisource Bergen Corp. | 8,423 | |||||
| 272 | CIGNA Corp. | 8,439 | |||||
| 180 | Team Health Holdings ● | 2,319 | |||||
| 23,183 | |||||||
Insurance - 8.7% | |||||||
| 84 | Everest Re Group Ltd. | 5,955 | |||||
| 136 | Fidelity National Financial, Inc. | 1,766 | |||||
| 174 | Platinum Underwriters Holdings Ltd. | 6,329 | |||||
| 225 | Principal Financial Group, Inc. | 5,276 | |||||
| 195 | Reinsurance Group of America, Inc. | 8,923 | |||||
| 420 | Unum Group | 9,123 | |||||
| 37,372 | |||||||
Materials - 8.1% | |||||||
| 74 | Agrium U.S., Inc. | 3,622 | |||||
| 123 | FMC Corp. | 7,087 | |||||
| 89 | Greif, Inc. | 4,954 | |||||
| 267 | Methanex Corp. | 5,255 | |||||
| 217 | Owens-Illinois, Inc. ● | 5,750 | |||||
| 1,006 | Rexam plc | 4,526 | |||||
| 132 | Sino Forest Corp. ■● | 1,876 | |||||
| 135 | Sino Forest Corp. Class A ● | 1,925 | |||||
| 34,995 | |||||||
Media - 3.4% | |||||||
| 416 | CBS Corp. Class B | 5,384 | |||||
| 552 | Virgin Media, Inc. | 9,213 | |||||
| 14,597 | |||||||
Pharmaceuticals, Biotechnology & Life Sciences - 3.4% | |||||||
| 399 | Alkermes, Inc. ● | 4,970 | |||||
| 117 | Endo Pharmaceuticals Holdings, Inc. ● | 2,555 | |||||
| 361 | Impax Laboratories, Inc. ● | 6,877 | |||||
| 14,402 | |||||||
Real Estate - 5.8% | |||||||
| 97 | AMB Property Corp. | 2,298 | |||||
| 242 | BR Malls Participacoes S.A. | 3,181 | |||||
| 700 | BR Properties S.A. | 4,889 | |||||
| 764 | Chimera Investment Corp. | 2,756 | |||||
| 339 | Duke Realty, Inc. | 3,852 | |||||
| 143 | Iguatemi Emp de Shopping | 2,496 | |||||
| 226 | Multiplan Empreendimentos Imobiliarios S.A. | 4,033 | |||||
| 78 | RioCan Real Estate Investment Trust | 1,402 | |||||
| 24,907 | |||||||
Retailing - 5.5% | |||||||
| 212 | American Eagle Outfitters, Inc. | 2,488 | |||||
| 122 | AnnTaylor Stores Corp. ● | 1,977 | |||||
| 5,788 | Buck Holdings L.P. ⌂●† | 13,051 | |||||
| 115 | Ross Stores, Inc. | 6,112 | |||||
| 23,628 | |||||||
Semiconductors & Semiconductor Equipment - 2.4% | |||||||
| 63 | Linear Technology Corp. | 1,738 | |||||
| 301 | Varian Semiconductor Equipment Associates, Inc. ● | 8,636 | |||||
| 10,374 | |||||||
Software & Services - 1.8% | |||||||
| 124 | BMC Software, Inc. ● | 4,277 | |||||
| 111 | Check Point Software Technologies Ltd. ADR ● | 3,278 | |||||
| 7,555 | |||||||
Technology Hardware & Equipment - 4.1% | |||||||
| 376 | Arrow Electronics, Inc. ● | 8,395 | |||||
| Shares or Principal Amount | Market Value ╪ | |||||||||
| COMMON STOCKS - 98.5% - (continued) | ||||||||||
| Technology Hardware & Equipment - 4.1% - (continued) | ||||||||||
| 455 | Flextronics International Ltd. ● | $ | 2,549 | |||||||
| 7,900 | Kingboard Laminates Holdings | 6,642 | ||||||||
| 17,586 | ||||||||||
| Transportation - 4.7% | ||||||||||
| 415 | All America Latina Logistica S.A. | 3,247 | ||||||||
| 1,013 | Delta Air Lines, Inc. ● | 11,899 | ||||||||
| 145 | J.B. Hunt Transport Services, Inc. | 4,747 | ||||||||
| 19,893 | ||||||||||
| Utilities - 6.6% | ||||||||||
| 698 | N.V. Energy, Inc. | 8,248 | ||||||||
| 261 | Northeast Utilities | 6,645 | ||||||||
| 167 | UGI Corp. | 4,241 | ||||||||
| 155 | Westar Energy, Inc. | 3,343 | ||||||||
| 107 | Wisconsin Energy Corp. | 5,450 | ||||||||
| 27,927 | ||||||||||
| Total common stocks | ||||||||||
| (cost $401,528) | $ | 422,489 | ||||||||
| Total long-term investments | ||||||||||
| (cost $401,528) | $ | 422,489 | ||||||||
| SHORT-TERM INVESTMENTS - 0.7% | ||||||||||
| Repurchase Agreements - 0.7% | ||||||||||
| Bank of America TriParty Joint Repurchase | ||||||||||
| Agreement (maturing on 07/01/2010 in the | ||||||||||
| amount of $974, collateralized by FHLMC | ||||||||||
| 5.50%, 2039, FNMA 4.50% - 5.50%, 2038 | ||||||||||
| - 2040, GNMA 5.00%, 2040, value of | ||||||||||
$994) | ||||||||||
| $ | 974 | 0.05%, 6/30/2010 | $ | 974 | ||||||
| BNP Paribas Securities Corp. TriParty Joint | ||||||||||
| Repurchase Agreement (maturing on | ||||||||||
| 07/01/2010 in the amount of $167, | ||||||||||
| collateralized by FNMA 4.50% - 6.50%, | ||||||||||
| 2024 - 2040, GNMA 5.00% - 6.50%, 2038 - | ||||||||||
| 2040, value of $170) | ||||||||||
| 167 | 0.04%, 6/30/2010 | 167 | ||||||||
| Deutsche Bank Securities TriParty Joint | ||||||||||
| Repurchase Agreement (maturing on | ||||||||||
| 07/01/2010 in the amount of $738, | ||||||||||
| collateralized by GNMA 3.13% - 7.00%, | ||||||||||
| 2023 - 2052, value of $752) | ||||||||||
| 738 | 0.05%, 6/30/2010 | 738 | ||||||||
| JP Morgan Chase TriParty Joint Repurchase | ||||||||||
| Agreement (maturing on 07/01/2010 in the | ||||||||||
| amount of $167, collateralized by FHLMC | ||||||||||
| 2.38% - 5.83%, 2033 - 2038, value of $170) | ||||||||||
| 167 | 0.06%, 6/30/2010 | 167 | ||||||||
| Morgan Stanley & Co., Inc. TriParty Joint | ||||||||||
| Repurchase Agreement (maturing on | ||||||||||
| 07/01/2010 in the amount of $727, | ||||||||||
| collateralized by FHLMC 5.00% - 5.50%, | ||||||||||
| 2038 - 2039, FNMA 5.00%, 2039, value of | ||||||||||
$745) | ||||||||||
| 727 | 0.03%, 6/30/2010 | 727 | ||||||||
| UBS Securities, Inc. Repurchase Agreement | ||||||||||
| (maturing on 07/01/2010 in the amount of | ||||||||||
| $9, collateralized by U.S. Treasury Bill | ||||||||||
| 0.88%, 2011, value of $9) | ||||||||||
| 9 | 0.02%, 6/30/2010 | 9 | ||||||||
| UBS Securities, Inc. TriParty Joint Repurchase | ||||||||||
| Agreement (maturing on 07/01/2010 in the | ||||||||||
| amount of $184, collateralized by FNMA | ||||||||||
| 5.00% - 6.00%, 2033 - 2036, value of $188) | ||||||||||
| 184 | 0.09%, 6/30/2010 | 184 | ||||||||
| 2,966 | ||||||||||
| Total short-term investments | ||||||||||
| (cost $2,966) | $ | 2,966 | ||||||||
| Total investments | ||||||||||
| (cost $404,494) ▲ | 99.2 | % | $ | 425,455 | ||||||
| Other assets and liabilities | 0.8 | % | 3,345 | |||||||
| Total net assets | 100.0 | % | $ | 428,800 | ||||||
| Note: | Percentage of investments as shown is the ratio of the total market value to total net assets. Market value of investments in foreign securities represents 14.2% of total net assets at June 30, 2010. |
Foreign securities that are principally traded on certain foreign markets are adjusted daily pursuant to a third party pricing service methodology approved by the Board of Directors in order to reflect an adjustment for factors occurring after the close of the foreign market but before the close of the New York Stock Exchange.
| ▲ | At June 30, 2010, the cost of securities for federal income tax purposes was $415,997 and the aggregate gross unrealized appreciation and depreciation based on that cost were: |
| Unrealized Appreciation | $ | 54,143 | ||
| Unrealized Depreciation | (44,685 | ) | ||
| Net Unrealized Appreciation | $ | 9,458 |
| † | The aggregate value of securities valued in good faith at fair value as determined under policies and procedures established by and under the supervision of the Fund's Board of Directors at June 30, 2010, was $13,230, which represents 3.09% of total net assets. This amount excludes securities that are principally traded in certain foreign markets and whose prices are adjusted pursuant to a third party pricing service methodology approved by the Board of Directors. |
| ● | Currently non-income producing. |
| ■ | Securities issued within terms of a private placement memorandum, exempt from registration under Rule 144A under the Securities Act of 1933, as amended, and may be sold only to qualified institutional buyers. Pursuant to guidelines adopted by the Board of Directors, these issues are determined to be liquid. The aggregate value of these securities at June 30, 2010, was $1,876, which represents 0.44% of total net assets. |
| Hartford MidCap Value HLS Fund |
Schedule of Investments – (continued)
June 30, 2010 (Unaudited)
| (000’s Omitted) |
| ⌂ | The following securities are considered illiquid. Illiquid securities are often purchased in private placement transactions, are often not registered under the Securities Act of 1933 and may have contractual restrictions on resale. A security may also be considered illiquid if the security lacks a readily available market or if its valuation has not changed for a certain period of time. |
| Period | Shares/ | ||||||||
| Acquired | Par | Security | Cost Basis | ||||||
| 06/2007 | 5,788 | Buck Holdings L.P. | $ | 4,949 | |||||
| 03/2007 | 452 | Solar Cayman Ltd. - 144A | 336 | ||||||
The aggregate value of these securities at June 30, 2010 was $13,230 which represents 3.09% of total net assets.
Forward Foreign Currency Contracts Outstanding at June 30, 2010
| Unrealized | |||||||||||||
| Market | Contract | Delivery | Appreciation/ | ||||||||||
| Description | Value ╪ | Amount | Date | (Depreciation) | |||||||||
| British Pound (Sell) | $ | 223 | $ | 225 | 07/02/10 | $ | 2 | ||||||
| ╪ | See Significant Accounting Policies of accompanying Notes to Financial Statements regarding valuation of securities. |
| Hartford MidCap Value HLS Fund |
June 30, 2010 (Unaudited)
| (000’s Omitted) |
| Total | Level 1♦ | Level 2♦ | Level 3 | |||||||||||||
| Assets: | ||||||||||||||||
| Common Stocks ‡ | $ | 422,489 | $ | 392,848 | $ | 16,411 | $ | 13,230 | ||||||||
| Short-Term Investments | 2,966 | – | 2,966 | – | ||||||||||||
| Total | $ | 425,455 | $ | 392,848 | $ | 19,377 | $ | 13,230 | ||||||||
| Forward Foreign Currency Contracts * | 2 | – | 2 | – | ||||||||||||
| Total | $ | 2 | $ | – | $ | 2 | $ | – | ||||||||
| ♦ | For the period ended June 30, 2010, there were no significant transfers between Level 1 and Level 2. |
| ‡ | The Fund has all or primarily all of these equity securities categorized in a single level. Refer to the Schedule of Investments for further industry breakout. |
| * | Derivative instruments not reflected in the Schedule of Investments are valued at the unrealized appreciation/depreciation on the investments. |
Following is a reconciliation of Level 3 assets for which significant unobservable inputs were used to determine fair value:
| Balance as | Change in | |||||||||||||||||||||||||||
| of | Realized | Unrealized | Transfers | Transfers | Balance as | |||||||||||||||||||||||
| December | Gain | Appreciation | Net | Into | Out of | of June | ||||||||||||||||||||||
| 31, 2009 | (Loss) | (Depreciation) | Amortization | Purchases | Sales | Level 3 | Level 3 | 30, 2010 | ||||||||||||||||||||
| Assets: | ||||||||||||||||||||||||||||
| Common Stock | $ | 15,586 | $ | 1,302 | $ | 3,523 | * | $ | — | $ | — | $ | (7,182 | ) | $ | — | $ | 1 | $ | 13,230 | ||||||||
| Total | $ | 15,586 | $ | 1,302 | $ | 3,523 | $ | — | $ | — | $ | (7,182 | ) | $ | — | $ | 1 | $ | 13,230 | |||||||||
| * | Change in unrealized gains or losses in the current period relating to assets still held at June 30, 2010 was $3,523. |
| Hartford MidCap Value HLS Fund |
June 30, 2010 (Unaudited)
| (000’s Omitted) |
| Assets: | ||||
| Investments in securities, at market value (cost $404,494) | $ | 425,455 | ||
| Cash | — | |||
| Unrealized appreciation on forward foreign currency contracts | 2 | |||
| Receivables: | ||||
| Investment securities sold | 3,254 | |||
| Fund shares sold | 3 | |||
| Dividends and interest | 527 | |||
| Other assets | 2 | |||
| Total assets | 429,243 | |||
| Liabilities: | ||||
| Unrealized depreciation on forward foreign currency contracts | — | |||
| Bank overdraft — foreign cash | — | |||
| Payables: | ||||
| Investment securities purchased | 21 | |||
| Fund shares redeemed | 275 | |||
| Investment management fees | 80 | |||
| Distribution fees | 7 | |||
| Accrued expenses | 60 | |||
| Total liabilities | 443 | |||
| Net assets | $ | 428,800 | ||
| Summary of Net Assets: | ||||
| Capital stock and paid-in-capital | $ | 555,494 | ||
| Accumulated undistributed net investment income | 2,070 | |||
| Accumulated net realized loss on investments | (149,725 | ) | ||
| Unrealized appreciation of investments and the translations of assets and liabilities denominated in foreign currency | 20,961 | |||
| Net assets | $ | 428,800 | ||
| Shares authorized | 1,200,000 | |||
| Par value | $ | 0.001 | ||
Class IA: Net asset value per share | $ | 8.03 | ||
| Shares outstanding | 37,807 | |||
| Net assets | $ | 303,709 | ||
Class IB: Net asset value per share | $ | 8.00 | ||
| Shares outstanding | 15,643 | |||
| Net assets | $ | 125,091 | ||
| Hartford MidCap Value HLS Fund |
For the Six-Month Period Ended June 30, 2010 (Unaudited)
| (000’s Omitted) |
| Investment Income: | ||||
| Dividends | $ | 3,478 | ||
| Interest | 3 | |||
| Less: Foreign tax withheld | (47 | ) | ||
| Total investment income, net | 3,434 | |||
| Expenses: | ||||
| Investment management fees | 1,795 | |||
| Administrative service fees | 158 | |||
| Transfer agent fees | 1 | |||
| Distribution fees - Class IB | 180 | |||
| Custodian fees | 12 | |||
| Accounting services fees | 25 | |||
| Board of Directors' fees | 7 | |||
| Audit fees | 7 | |||
| Other expenses | 66 | |||
| Total expenses (before fees paid indirectly) | 2,251 | |||
| Commission recapture | (11 | ) | ||
| Total fees paid indirectly | (11 | ) | ||
| Total expenses, net | 2,240 | |||
| Net investment income | 1,194 | |||
| Net Realized Gain on Investments and Foreign Currency Transactions: | ||||
| Net realized gain on investments | 27,166 | |||
| Net realized gain on forward foreign currency contracts | 93 | |||
| Net realized loss on other foreign currency transactions | (94 | ) | ||
| Net Realized Gain on Investments and Foreign Currency Transactions | 27,165 | |||
| Net Changes in Unrealized Depreciation of Investments and Foreign Currency Transactions: | ||||
| Net unrealized depreciation of investments | (41,849 | ) | ||
| Net unrealized depreciation of forward foreign currency contracts | (2 | ) | ||
| Net unrealized appreciation on translation of other assets and liabilities in foreign currencies | 3 | |||
| Net Changes in Unrealized Depreciation of Investments and Foreign Currency Transactions | (41,848 | ) | ||
| Net Loss on Investments and Foreign Currency Transactions | (14,683 | ) | ||
| Net Decrease in Net Assets Resulting from Operations | $ | (13,489 | ) | |
| Hartford MidCap Value HLS Fund |
| (000’s Omitted) |
| For the | ||||||||
| Six-Month | For the | |||||||
| Period Ended | Year Ended | |||||||
| June 30, 2010 | December 31, | |||||||
| (Unaudited) | 2009 | |||||||
| Operations: | ||||||||
| Net investment income | $ | 1,194 | $ | 3,430 | ||||
| Net realized gain (loss) on investments and foreign currency transactions | 27,165 | (67,598 | ) | |||||
| Net unrealized appreciation (depreciation) of investments and foreign currency transactions | (41,848 | ) | 222,705 | |||||
| Payment from affiliate | — | 29 | ||||||
| Net increase (decrease) in net assets resulting from operations | (13,489 | ) | 158,566 | |||||
| Distributions to Shareholders: | ||||||||
| From net investment income | ||||||||
| Class IA | — | (2,375 | ) | |||||
| Class IB | — | (684 | ) | |||||
| Total distributions | — | (3,059 | ) | |||||
| Capital Share Transactions: | ||||||||
| Class IA | ||||||||
| Sold | 8,291 | 9,901 | ||||||
| Issued on reinvestment of distributions | — | 2,375 | ||||||
| Redeemed | (43,735 | ) | (74,759 | ) | ||||
| Total capital share transactions | (35,444 | ) | (62,483 | ) | ||||
| Class IB | ||||||||
| Sold | 3,999 | 3,875 | ||||||
| Issued on reinvestment of distributions | — | 684 | ||||||
| Redeemed | (20,928 | ) | (33,300 | ) | ||||
| Total capital share transactions | (16,929 | ) | (28,741 | ) | ||||
| Net decrease from capital share transactions | (52,373 | ) | (91,224 | ) | ||||
| Net increase (decrease) in net assets | (65,862 | ) | 64,283 | |||||
| Net Assets: | ||||||||
| Beginning of period | 494,662 | 430,379 | ||||||
| End of period | $ | 428,800 | $ | 494,662 | ||||
Accumulated undistributed (distribution in excess of) net investment income | $ | 2,070 | $ | 876 | ||||
| Shares: | ||||||||
| Class IA | ||||||||
| Sold | 939 | 1,402 | ||||||
| Issued on reinvestment of distributions | — | 295 | ||||||
| Redeemed | (5,005 | ) | (11,726 | ) | ||||
| Total share activity | (4,066 | ) | (10,029 | ) | ||||
| Class IB | ||||||||
| Sold | 450 | 550 | ||||||
| Issued on reinvestment of distributions | — | 86 | ||||||
| Redeemed | (2,387 | ) | (5,212 | ) | ||||
| Total share activity | (1,937 | ) | (4,576 | ) | ||||
| Hartford MidCap Value HLS Fund |
June 30, 2010 (Unaudited)
| (000’s Omitted) |
| 1. | Organization: |
Hartford MidCap Value HLS Fund (the "Fund") serves as an underlying investment option for certain variable annuity and variable life insurance separate accounts of Hartford Life Insurance Company (“HLIC”) and its affiliates and certain qualified retirement plans. The Fund may also serve as an underlying investment option for certain variable annuity and variable life separate accounts of other insurance companies. Owners of variable annuity contracts and policyholders of variable life insurance contracts may choose the funds permitted in the variable insurance contract prospectus. In addition, participants in certain qualified retirement plans may choose the fund if permitted by their plans.
Hartford Series Fund, Inc. (the “Company”) is an open-end registered management investment company comprised of twenty-nine portfolios, one portfolio of which is included in these financial statements.
The Company is organized under the laws of the State of Maryland and is registered with the Securities and Exchange Commission (“SEC”) under the Investment Company Act of 1940, as amended (“1940 Act”). The Fund is organized as a diversified open-end management investment company.
The Fund is divided into Class IA and Class IB shares. Each class is offered at the per share net asset value (“NAV”) without a sales charge and is subject to the same expenses, except that the Class IB shares are subject to distribution and service fees charged pursuant to a Distribution and Service Plan adopted in accordance with Rule 12b-1 under the 1940 Act.
| 2. | Significant Accounting Policies: |
The following is a summary of significant accounting policies of the Fund, which are in accordance with U.S. Generally Accepted Accounting Principles (“GAAP”).
| a) | Security Transactions and Investment Income – Security transactions are recorded on the trade date (the date the order to buy or sell is executed). Security gains and losses are determined on the basis of identified cost. |
Dividend income is accrued as of the ex-dividend date, except that certain dividends for foreign securities where the ex-dividend date may have passed are recorded as soon as the Fund is informed of the dividend in the exercise of reasonable diligence. Interest income, including amortization of premium and accretion of discounts, is accrued on a daily basis.
| b) | Security Valuation – The Fund generally uses market prices in valuing portfolio securities. If market prices are not readily available or are deemed unreliable, the Fund will use the fair value of the security as determined in good faith under policies and procedures established by and under the supervision of the Fund’s Board of Directors. Market prices may be deemed unreliable, for example, if a security is thinly traded or if an event has occurred after the close of the security’s primary market, but before the close of the New York Stock Exchange (the “Exchange”) (generally 4:00 p.m. Eastern Time, referred to as the “Valuation Time”) that is expected to affect the value of the portfolio security. The circumstances in which the Fund may use fair value pricing include, among others: (i) the occurrence of events that are significant to a particular issuer, such as mergers, restructuring or defaults; (ii) the occurrence of events that are significant to an entire market, such as natural disasters in a particular region or governmental actions; (iii) trading restrictions on securities; (iv) thinly traded securities and (v) market events such as trading halts and early market closings. In addition, with respect to the valuation of stocks primarily traded on foreign markets, the Fund uses a fair value pricing service approved by the Fund’s Board of Directors, which employs quantitative models that evaluate changes in the value of foreign market proxies (e.g., futures contracts, American Depositary Receipts (“ADRs”), exchange traded funds (“ETFs”)) after the close of the foreign markets but before the Valuation Time. Securities that are primarily traded on foreign markets may trade on days that are not business days of the Fund. The value of the foreign securities in which the Fund invests may change on days when a shareholder will not be able to purchase or redeem shares of the Fund. Fair value pricing is subjective in nature and the use of fair value pricing by the Fund may cause the NAV of its shares to differ significantly from the NAV that would have been calculated using market prices at the close |
| Hartford MidCap Value HLS Fund |
Notes to Financial Statements – (continued)
June 30, 2010 (Unaudited)
| (000’s Omitted) |
of the exchange on which a portfolio security is primarily traded but before the Valuation Time. There can be no assurance that the Fund could obtain the fair value assigned to a security if the Fund were to sell the security at approximately the time at which the Fund determines its NAV.
Exchange-traded equity securities are valued at the last reported sale price or official close price on the exchange or market on which the security is primarily traded (the “Primary Market”) at the Valuation Time. If the security did not trade on the Primary Market, it may be valued at the Valuation Time at the last reported sale price on another exchange where it trades. The value of an equity security not traded on any exchange but traded on the Nasdaq Stock Market, Inc. or another over-the-counter market shall be valued at the last reported sale price or official closing price on the exchange or market on which the security is traded as of the Valuation Time.
Foreign-denominated assets, including investment securities, and liabilities are translated from the local currency into U.S. dollars using exchange rates obtained from an independent third party as of the Fund’s Valuation Time.
Financial instruments for which prices are not available from an independent pricing service may be valued using market quotations obtained from one or more dealers that make markets in securities in accordance with procedures established by the Fund’s Board of Directors.
Forward foreign currency contracts represent agreements to exchange currencies on specific future dates at predetermined rates. Forward foreign currency contracts are valued using foreign currency exchange rates and forward rates on the Valuation Date from an independent pricing service.
Other derivative or contractual type instruments shall be valued using market prices if such instruments trade on an exchange or market. If such instruments do not trade on an exchange or market, such instruments shall be valued at a price at which the counterparty to such contract would repurchase the instrument. In the event that the counterparty cannot provide a price, such valuation may be determined in accordance with procedures established by the Fund’s Board of Directors.
Various inputs are used in determining the value of the Fund’s investments. These inputs are summarized into three broad hierarchy levels. This hierarchy is based on whether the valuation inputs are observable or unobservable. These levels are:
· | Level 1 – Quoted prices in active markets for identical securities. Level 1 may include exchange-traded instruments such as domestic equities, some foreign equities, options, futures, mutual funds, ETFs, and rights and warrants. |
| · | Level 2 – Observable inputs other than Level 1 prices, such as quoted prices for similar securities; quoted prices in markets that are not active; or other inputs that are observable or can be corroborated by observable market data. Level 2 may include debt securities that are traded less frequently than exchange-traded instruments and which are valued using third party pricing services. Prices for most level 2 securities are based on prices received from an independent pricing service. The following asset classes generally use valuation techniques and inputs as noted below: |
Asset Backed Securities and Collateralized Mortgage Obligations – Multi-dimensional spread/prepayment speed tables, with consideration of yield or price of bonds of comparable quality, coupon and maturity, attributes of the collateral, new issue data and monthly payment information.
Corporate Bonds – Multi-dimensional relational model based on observable market information such as yields, spreads, sector analysis, etc.
Foreign Currency – Based on rates determined at the close of the Exchange, provided by an independent pricing service.
Forward Currency Contracts – Valued based on the price of the underlying currency at the prevailing interpolated exchange rate, which is a combination of the spot currency rate and the forward currency rate, provided by an independent pricing service.
Foreign Equities – Certain foreign equities are priced using a multi-factor regression model with market observable inputs of a correlative nature (ADRs, futures contracts, ETFs, and currency exchange rates).
International Fixed Income – Multi-dimensional relational model based on observable market information such as benchmark yields, reported trades, bids and offers.
Money Market Instruments – Amortized cost.
Mortgage Backed Securities (“MBS”) – Matrix pricing using inputs of To-Be-Announced (“TBA”) prices, new issue data and monthly payment information, with consideration of yield or price of bonds of comparable quality, coupon and maturity, and attributes of the collateral.
Municipal Bonds – Multi-dimensional relational model and series of matrices based on observable market information such as Municipal Securities Rulemaking Board reported trades, comparable bonds, yields, spreads and credit analysis.
Preferred Stocks – Close mean of bid/ask or bid.
Repurchase Agreements – Priced at par.
Senior Floating Rate Interests – Composite of quotes from one or more contributing dealers.
Swaps – Price based upon observable market information from an independent pricing service.
U.S. Government Securities – Treasuries exclusively traded in the secondary market.
· | Level 3 – Significant unobservable inputs that are supported by limited or no market activity. Level 3 may include financial instruments whose values are determined using broker quotes or require significant management judgment or estimation. While these securities are priced using unobservable inputs, the valuation of these securities reflects the best available data and management believes the prices are a reasonable representation of exit price. The following asset classes generally use valuation techniques and inputs as noted below: |
| Asset Backed Securities & Commercial Mortgage Backed Securities – Certain other MBS with limited liquidity priced from an independent pricing service. |
| Common Stocks – Trading has been halted or there are restrictions on trading. Valuation is based on last trade with the application of a discount or premium, if applicable. |
| Long Dated Over-the-Counter Options – Terms greater than 10 years from current date, expected volatility is not observable. Prices are from an independent pricing service. |
| Long Term Debt Securities, including Senior Floating Rate Interests – Unobservable valuation inputs may include estimates for current yields, maturity/duration, prepayment speed, and broker quotes for comparable |
| Hartford MidCap Value HLS Fund |
Notes to Financial Statements – (continued)
June 30, 2010 (Unaudited)
| (000’s Omitted) |
securities along with other assumptions relating to credit quality, collateral value, complexity of the security structure, general market conditions and liquidity.
Swaps – Terms greater than 10 years from current date, expected volatility is not observable. Prices are from an independent pricing service.
Individual securities within any of the above mentioned asset classes may be assigned a different hierarchical level than those that are presented above, as individual circumstances dictate.
For purposes of reporting transfers between different hierarchy levels, both transfers in and out of each level are shown as if they occurred at the beginning of the period.
Refer to the Investment Valuation Hierarchy Levels Summary and the Level 3 roll forward reconciliation found following the Schedules of Investments.
| c) | Foreign Currency Transactions – Assets and liabilities denominated in currencies other than U.S. dollars are translated into U.S. dollars at the exchange rates in effect on the valuation date. Purchases and sales of investment securities, income and expenses are translated into U.S. dollars at the exchange rates on the dates of such transactions. |
The Fund does not isolate that portion of portfolio security valuation resulting from fluctuations in the foreign currency exchange rates from the fluctuations arising from changes in the market prices of securities held. Exchange rate fluctuations are included with the net realized and unrealized gain or loss on investments in the accompanying financial statements.
Net realized foreign exchange gains or losses arise from sales of foreign currencies and the difference between asset and liability amounts initially stated in foreign currencies and the U.S. dollar value of the amounts actually received or paid. Net unrealized foreign exchange gains or losses arise from changes in the value of other assets and liabilities at the end of the reporting period, resulting from changes in the exchange rates.
| d) | Joint Trading Account – Pursuant to an exemptive order issued by the SEC, the Fund may transfer uninvested cash balances into a joint trading account managed by Wellington Management Company, LLP (“Wellington Management”). These balances may be invested in one or more repurchase agreements and/or short-term money market instruments. |
| e) | Repurchase Agreements – A repurchase agreement is an agreement by which a counterparty agrees to sell a security and agrees to repurchase the security sold at a mutually agreed upon time and price. At the time the Fund enters into a repurchase agreement, the value of the underlying collateral security(ies), including accrued interest, will be equal to or exceed the value of the repurchase agreement. To minimize counterparty risk, the securities that serve to collateralize the repurchase agreement are held by the Fund's custodian in book entry or physical form in the custodial account of the Fund or in a third party custodial account. Repurchase agreements are valued at cost plus accrued interest. The Fund, as shown on the Schedule of Investments, had outstanding repurchase agreements as of June 30, 2010. |
| f) | Forward Foreign Currency Contracts – The Fund may enter into forward foreign currency contracts that obligate the Fund to purchase or sell currencies at specified future dates. Forward foreign currency contracts may be used to hedge against adverse fluctuations in exchange rates between currencies. |
Forward foreign currency contracts involve elements of market risk in excess of the amounts reflected in the Statement of Assets and Liabilities. In addition, risks may arise upon entering into these contracts from the potential inability of the counterparties to meet the terms of the contracts and from unanticipated movements in the value of the foreign currencies relative to the U.S. dollar. The Fund had outstanding forward foreign currency contracts as shown on the Schedule of Investments as of June 30, 2010.
| g) | Fund Share Valuation and Dividend Distributions to Shareholders – Orders for the Fund’s shares are executed in accordance with the investment instructions of the contract holders or plan participants. The NAV of the Fund’s shares is determined as of the close of each business day of the Exchange. The NAV is determined separately for each class of the Fund by dividing the Fund’s net assets attributable to that class by the number of outstanding shares of the class. Orders for the purchase of the Fund’s shares received by an insurance company or plan prior to the close of the Exchange on any day on which the Exchange is open for business are priced at the NAV determined as of the close of the Exchange. Orders received by an insurance company or plan after the close of the Exchange, or on a day on which the Exchange and/or the Fund is not open for business, are priced at the next determined NAV. |
Dividends are declared pursuant to a policy adopted by the Fund’s Board of Directors based upon the investment performance of the Fund. The policy of the Fund is to pay dividends from net investment income and distribute realized capital gains, if any, at least once a year.
Distributions from net investment income, realized capital gains and capital are determined in accordance with federal income tax regulations, which may differ from U.S. GAAP with respect to character and timing. These differences may include but are not limited to losses deferred due to wash sale adjustments, foreign currency gains and losses, adjustments related to Passive Foreign Investment Companies (“PFICs”), Real Estate Investment Trusts (“REITs”), Regulated Investment Companies (“RICs”), certain derivatives and partnerships. Permanent book and federal income tax basis differences relating to shareholder distributions will result in reclassifications to certain of the Fund’s capital accounts (see Federal Income Taxes: Reclassification of Capital Accounts note).
| h) | Illiquid and Restricted Securities – The Fund is permitted to invest up to 15% of its net assets in illiquid securities. “Illiquid Securities” are those that may not be sold or disposed of in the ordinary course of business within seven days, at approximately the price used to determine the Fund’s NAV. The Fund may not be able to sell illiquid securities or other investments when its sub-adviser considers it desirable to do so or may have to sell such securities or investments at a price that is lower than the price that could be obtained if the securities or investments were more liquid. A sale of illiquid securities or other investments may require more time and may result in higher dealer discounts and other selling expenses than does the sale of those that are liquid. Illiquid securities and investments also may be more difficult to value, due to the unavailability of reliable market quotations for such securities or investments, and an investment in them may have an adverse impact on the Fund’s NAV. The Fund may also purchase certain restricted securities, commonly known as Rule 144A securities, that can be resold to institutions and which may be determined to be liquid pursuant to policies and guidelines established by the Fund’s Board of Directors. The Fund, as shown on the Schedule of Investments, had illiquid and/or restricted securities as of June 30, 2010. | |
| i) | Securities Purchased on a When-Issued or Delayed-Delivery Basis – Delivery and payment for securities that have been purchased by the Fund on a forward commitment, or when-issued or delayed-delivery basis, take place beyond the customary settlement period. During this period, such securities are subject to market fluctuations, and the Fund identifies securities segregated in its records with value at least equal to the amount of the commitment. As of June 30, 2010, the Fund had no outstanding when-issued or delayed delivery securities. | |
| j) | Use of Estimates – The preparation of financial statements in conformity with U.S. GAAP requires management to make estimates and assumptions that affect the reported amounts of assets and liabilities as of the date of the financial statements and the reported amounts of income and expenses during the period. Operating results in the future could vary from the amounts derived from management’s estimates. |
| Hartford MidCap Value HLS Fund |
Notes to Financial Statements – (continued)
June 30, 2010 (Unaudited)
| (000’s Omitted) |
| k) | Additional Derivative Instrument(s) Information |
Derivative Instrument(s) as of June 30, 2010.
| Statement of Assets and Liabilities Location | ||||||||||
| Risk Exposure Category | Asset Derivatives | Liability Derivatives | ||||||||
| Foreign exchange contracts | Unrealized appreciation on forward | $ | 2 | |||||||
| foreign currency contracts | ||||||||||
The volume of derivatives that is presented in the Schedule of Investments is consistent with the derivative activity during the six-month period ended June 30, 2010.
Realized Gain/Loss and Change in Unrealized Appreciation (Depreciation) on Derivative Instruments for the six-month period ended June 30, 2010:
| Amount of Realized Gain or (Loss) on Derivatives Recognized in Income | ||||||||||||||||||||||||
| Forward | ||||||||||||||||||||||||
| Purchased | Currency | |||||||||||||||||||||||
| Risk Exposure Category | Written Options | Options | Futures | Contracts | Swaps | Total | ||||||||||||||||||
| Foreign exchange contracts | $ | — | $ | — | $ | — | $ | 93 | $ | — | $ | 93 | ||||||||||||
| Total | $ | — | $ | — | $ | — | $ | 93 | $ | — | $ | 93 | ||||||||||||
Change in Unrealized Appreciation or (Depreciation) on Derivatives Recognized in Income | ||||||||||||||||||||||||
| Forward | ||||||||||||||||||||||||
| Purchased | Currency | |||||||||||||||||||||||
Risk Exposure Category | Written Options | Options | Futures | Contracts | Swaps | Total | ||||||||||||||||||
| Foreign exchange contracts | — | — | — | (2 | ) | — | $ | (2 | ) | |||||||||||||||
| Total | $ | — | $ | — | $ | — | $ | (2 | ) | $ | — | $ | (2 | ) | ||||||||||
| l) | Indemnifications – Under the Company’s organizational documents, the Company shall indemnify its officers and directors to the full extent required or permitted under Maryland General Corporation Law and the federal securities laws. In addition, the Company, on behalf of the Fund, may enter into contracts that contain a variety of indemnifications. The Company’s maximum exposure under these arrangements is unknown. However, the Company has not had prior claims or losses pursuant to these contracts and expects the risk of loss to be remote. |
3. | Federal Income Taxes: |
| a) | Federal Income Taxes – For federal income tax purposes, the Fund intends to continue to qualify as a RIC under Subchapter M of the Internal Revenue Code (“IRC”) by distributing substantially all of its taxable net investment income and net realized capital gains to its shareholders and otherwise complying with the requirements of RICs. The Fund has distributed substantially all of its income and capital gains in prior years and intends to distribute substantially all of its income and capital gains prior to the next fiscal year end. Accordingly, no provision for federal income or excise taxes has been made in the accompanying financial statements. Distributions from short-term capital gains are treated as ordinary income distributions for federal income tax purposes. |
| b) | Net Investment Income (Loss), Net Realized Gains (Losses) – Net investment income (loss) and net realized gains (losses) may differ for financial statement and tax purposes primarily because of losses deferred due to wash sale adjustments, foreign currency gains and losses, adjustments related to PFICs, REITs, RICs, certain derivatives and partnerships. The character of distributions made during the year from net investment income or net realized gains may differ from their ultimate characterization for federal income tax purposes. Also, due to the timing of dividend |
distributions, the fiscal year in which amounts are distributed may differ from the year that the income or realized gains (losses) were recorded by the Fund.
| c) | Distributions and Components of Distributable Earnings – The tax character of distributions paid by the Fund for the periods indicated is as follows (as adjusted for dividends payable): |
| For the Year Ended | For the Year Ended | |||||||
| December 31, 2009 | December 31, 2008 | |||||||
| Ordinary Income | $ | 3,059 | $ | 29,469 | ||||
| Long-Term Capital Gains* | — | 123,381 | ||||||
| * | The Fund designates these distributions as long-term capital dividends pursuant to IRC code Sec. 852(b)(3)(C). |
As of December 31, 2009, the Fund’s components of distributable earnings (deficit) on a tax basis were as follows:
| Amount | ||||
| Undistributed Ordinary Income | $ | 880 | ||
| Accumulated Capital and Other Losses* | (165,387 | ) | ||
Unrealized Appreciation† | 51,302 | |||
| Total Accumulated Deficit | $ | (113,205 | ) | |
| * | The Fund has capital loss carryforwards that are identified in the Capital Loss Carryforward note that follows. |
| † | The difference between book-basis and tax-basis unrealized appreciation (depreciation) may be attributable to the losses deferred due to wash sale adjustments, foreign currency gains and losses, adjustments related to PFICs, REITs, RICs, certain derivatives and partnerships. |
| d) | Reclassification of Capital Accounts – The Fund may record reclassifications in its capital accounts. These reclassifications have no impact on the total net assets of the Fund. The reclassifications are a result of permanent differences between GAAP and tax accounting for such items as net operating losses that reduce distribution requirements. Adjustments are made to reflect the impact these items have on current and future distributions to shareholders. Therefore, the source of the Fund’s distributions may be shown in the accompanying Statement of Changes in Net Assets as from net investment income, from net realized gains on investments or from capital depending on the type of book and tax differences that exist. For the year ended December 31, 2009, the Fund recorded reclassifications to increase (decrease) the accounts listed below: |
| Amount | ||||
| Accumulated Undistributed Net Investment Income | $ | (283 | ) | |
| Accumulated Net Realized Gain (Loss) on Investments | 284 | |||
| Paid-in-Capital | (1 | ) | ||
| e) | Capital Loss Carryforward – At December 31, 2009 (tax-year-end), the Fund had capital loss carryforwards for U.S. federal income tax purposes of approximately: |
| Year of Expiration | Amount | |||
| 2016 | $ | 72,411 | ||
| 2017 | 89,643 | |||
| Total | $ | 162,054 | ||
| Hartford MidCap Value HLS Fund |
Notes to Financial Statements – (continued)
June 30, 2010 (Unaudited)
| (000’s Omitted) |
As of December 31, 2009, the Fund elected to defer the following post October losses.
| Amount | ||||
| Long-Term Capital Gain | $ | 3,333 | ||
| f) | Accounting for Uncertainty in Income Taxes – Management has evaluated all open tax years and has determined there is no impact to the Fund’s financial statements related to uncertain tax positions. Generally, tax authorities can examine all tax returns filed for the last three years. |
4. | Expenses: |
| a) | Investment Management Agreements – HL Investment Advisors, LLC (“HL Advisors”), an indirect wholly-owned subsidiary of The Hartford Financial Services Group, Inc. (“The Hartford”), serves as investment manager to the Fund pursuant to an Investment Management Agreement with the Company. As investment manager, HL Advisors has overall investment supervisory responsibility for the Fund. In addition, HL Advisors provides administrative personnel, services, equipment, facilities and office space for proper operation of the Fund. |
HL Advisors has contracted with Wellington Management for the provision of day-to-day investment management services to the Fund in accordance with the Fund’s investment objective and policies. The Fund pays a fee to HL Advisors, a portion of which may be used to compensate Wellington Management.
| b) | Administrative Services Agreement – For the two-month period January 1, 2010 through February 28, 2010, under the Administrative Services Agreement between HLIC and the Company, on behalf of the Fund, HLIC provided administrative services to the Fund and received monthly compensation at the annual rate of 0.20% of the Fund’s average daily net assets. The Fund assumed and paid certain other expenses (including, but not limited to, accounting, custodian, state taxes and Directors’ fees). Effective March 1, 2010, the Investment Management Agreement was amended to include the administrative services for the Fund and the separate administrative services agreement was terminated. |
The schedule below reflects the rates of compensation paid to HL Advisors for investment management services and to HLIC for administrative services rendered from January 1, 2010 through February 28, 2010, and the rates of compensation paid to the HL Advisors for the combined services from March 1, 2010 through June 30, 2010; the rates are accrued daily and paid monthly.
| Average Daily Net Assets | Annual Fee | |||
| On first $250 million | 0.8250 | % | ||
| On next $250 million | 0.7750 | % | ||
| On next $500 million | 0.7250 | % | ||
| On next $4 billion | 0.6750 | % | ||
| On next $5 billion | 0.6725 | % | ||
| Over $10 billion | 0.6700 | % | ||
| c) | Accounting Services Agreement – Pursuant to the Fund Accounting Agreement between HLIC and the Company, on behalf of the Fund, HLIC provides accounting services to the Fund and receives monthly compensation on the Fund’s average net assets. The Fund’s accounting services fees are accrued daily and paid monthly. |
| Average Daily Net Assets | Annual Fee | |||
| All Assets | 0.010 | % | ||
| d) | Operating Expenses – Allocable expenses incurred by the Company are allocated to each Fund and allocated to classes within the Fund in proportion to the average daily net assets of the Fund and each class, except where allocation of certain expenses is more fairly made directly to the Fund or to specific classes within a Fund. |
| e) | Fees Paid Indirectly – The Company, on behalf of the Fund has entered into agreements with State Street Global Advisers, LLC and Russell Implementation Securities, Inc. to partially recapture non-discounted trade commissions. Such rebates are used to pay a portion of the Fund’s expenses. In addition, the Fund’s custodian bank has also agreed to reduce its fees when the Fund maintains cash on deposit in a non-interest-bearing custody account. For the six-month period ended June 30, 2010, these amounts are included in the Statement of Operations. |
The ratio of expenses to average net assets in the accompanying financial highlights excludes the reduction in expenses related to fees paid indirectly. Had the fees paid indirectly been included, the annualized expense ratio for the periods listed below would have been as follows:
| Annualized | ||||||||||||||||||||||||
| Six-Month | Year Ended | Year Ended | Year Ended | Year Ended | Year Ended | |||||||||||||||||||
| Period Ended | December 31, | December 31, | December 31, | December 31, | December 31, | |||||||||||||||||||
| June 30, 2010 | 2009 | 2008 | 2007 | 2006 | 2005 | |||||||||||||||||||
| Class IA | 0.85 | % | 0.85 | % | 0.80 | % | 0.79 | % | 0.77 | % | 0.78 | % | ||||||||||||
| Class IB | 1.10 | 1.10 | 1.05 | 1.04 | 1.02 | 1.03 | ||||||||||||||||||
| f) | Distribution Plan for Class IB shares – The Company, on behalf of the Fund, has adopted a Distribution Plan pursuant to Rule 12b-1 under the 1940 Act for the Class IB shares. Pursuant to the Distribution Plan, the Fund is authorized to compensate the Distributor, Hartford Securities Distribution Company, Inc. (a wholly owned, ultimate subsidiary of The Hartford), from assets attributable to the Class IB shares for services rendered and expenses borne in connection with activities primarily intended to result in the sale of the Class IB shares, subject to the Fund Board’s review and approval. |
The Distribution Plan provides that the Fund may pay annually up to 0.25% of the average daily net assets of the Fund attributable to its Class IB shares for activities primarily intended to result in the sale of Class IB shares. The Board has the authority to suspend or reduce these payments at any point in time. Under the terms of the Distribution Plan and the principal underwriting agreement, the Fund is authorized to make payments monthly to the Distributor which may be used to pay or compensate entities providing distribution and shareholder servicing with respect to the Class IB shares for such entities’ fees or expenses incurred or paid in that regard. These fees are accrued daily and paid monthly.
| g) | Other Related Party Transactions – Certain officers of the Fund are directors and/or officers of HL Advisors, and/or The Hartford or its subsidiaries. For the six-month period ended June 30, 2010, a portion of the Fund’s chief compliance officer’s salary was paid by all the investment companies in the Hartford fund complex. The portion allocated to the Fund was in the amount of $1. Hartford Investor Services Company, LLC ("HISC"), a wholly owned subsidiary of The Hartford, provides transfer agent services to the Fund. The amount HISC was compensated for providing such services can be found on the Statement of Operations. These fees are accrued daily and paid monthly. |
| h) | Payment from Affiliate – In July of 2007, The Hartford entered into a settlement with the Attorneys General of the states of New York, Connecticut and Illinois relating to market timing and the company's individual variable annuity contracts in which certain payments would be made directly to the variable annuity contract holders. The distribution plan provides that unclaimed money from the settlement would be distributed to certain HLS Funds that are investment options through a Hartford individual variable annuity contract. The unclaimed money was distributed to the Fund on September 18, 2009, as follows: |
| Amount | ||||
| Reimbursement | $ | 29 | ||
| Hartford MidCap Value HLS Fund |
Notes to Financial Statements – (continued)
June 30, 2010 (Unaudited)
| (000’s Omitted) |
On November 8, 2006, the SEC issued an order setting forth the terms of a settlement reached with three subsidiaries of The Hartford that resolves the SEC’s Division of Enforcement’s investigation of aspects of The Hartford’s variable annuity and mutual fund operations related to directed brokerage and revenue sharing. The Hartford settled this matter without admitting or denying the findings of the SEC.
The Fund is available for purchase by the separate accounts of different variable universal life policies, variable annuity products, and funding agreements and it is offered directly to certain qualified retirement plans (collectively “Products”). Although existing Products contain transfer restrictions, some Products, particularly older variable annuity products, do not contain restrictions on the frequency of transfers. In addition, as the result of the settlement of litigation against Hartford Life, Inc. (“Hartford Life”) (the issuers of such variable annuity products), the Fund’s ability to restrict transfers by certain owners of older variable annuity products was limited. During 2006, these annuity owners surrendered the older variable annuity contracts that were the subject of prior litigation. In February 2005, Hartford Life agreed with the Board of Directors of the Fund to indemnify the Fund for any material harm caused to the Fund from frequent trading by these contracts owners.
The total return in the accompanying financial highlights includes payment from affiliates. Had the payment from affiliates been excluded, the total return for the periods listed below would have been as follows:
| For the Year Ended December 31, 2009 | ||||||||
| Class IA | Class IB | |||||||
| Impact from Payment from Affiliate for Attorneys General Settlement | 0.01 | % | 0.01 | % | ||||
| Total Return Excluding Payments from Affiliate | 44.18 | 43.82 | ||||||
| For the Year Ended December 31, 2006 | ||||||||
| Class IA | Class IB | |||||||
| Impact from Payment from Affiliate for SEC Settlement | 0.02 | % | 0.02 | % | ||||
| Impact from Payment from Affiliate for Unrestricted Transfers | 0.08 | 0.09 | ||||||
| Total Return Excluding Payments from Affiliate | 17.78 | 17.48 | ||||||
| For the Year Ended December 31, 2005 | ||||||||
| Class IA | Class IB | |||||||
| Impact from Payment from Affiliate for Unrestricted Transfers | 0.04 | % | 0.04 | % | ||||
| Total Return Excluding Payments from Affiliate | 9.95 | 9.67 | ||||||
| 5. | Investment Transactions: |
For the six-month period ended June 30, 2010, the cost of purchases and proceeds from sales of investment securities (excluding short-term investments) were as follows:
| Amount | ||||
| Cost of Purchases Excluding U.S. Government Obligations | $ | 127,039 | ||
| Sales Proceeds Excluding U.S. Government Obligations | 181,265 | |||
6. | Line of Credit: |
The Fund is one of several Hartford funds that participate in a $500 million committed revolving line of credit facility. The facility is to be used for temporary or emergency purposes. Under the arrangement, a fund is required to own securities having a market value in excess of 300% of the total bank borrowings. The interest rate on borrowings varies depending on the nature of the loan. The facility also requires a fee to be paid based on the amount of the commitment. This fee is allocated to all the funds participating in the line of credit based on the average net assets of the funds. During the six-month period ended June 30, 2010, the Fund did not have any borrowings under this facility.
7. | Industry Classifications: |
Other than the industry classifications “Other Investment Pools and Funds” and “Exchange Traded Funds”, equity industry classifications used in this report are the Global Industry Classification Standard, which was developed by and is the exclusive property and service mark of MSCI, Inc. and Standard & Poor’s.
8. | Subsequent Events: |
Reorganization of Hartford SmallCap Value HLS Fund with and into the Fund: On May 4, 2010, the Board of Directors of Hartford HLS Series II Fund, Inc. approved on behalf of Hartford SmallCap Value HLS Fund and the Board of Directors of the Company approved on behalf of the Fund, a Form of Agreement and Plan of Reorganization that provides for the reorganization of Hartford SmallCap Value HLS Fund, a series of Hartford HLS Series Fund II, Inc. into the Fund. The reorganization did not require shareholder approval. The reorganization occurred on July 30, 2010.
| Hartford MidCap Value HLS Fund |
| - Selected Per-Share Date (A) - |
| Net Asset | Net Realized | Net Increase | ||||||||||||||||||||||||||||||||||||||||||
| Value at | Payments | and Unrealized | Total from | Dividends from | Distributions | (Decrease) in | Net Asset | |||||||||||||||||||||||||||||||||||||
| Beginning of | Net Investment | from (to) | Gain (Loss) on | Investment | Net Investment | from Realized | Distributions | Total | Net Asset | Value at End | ||||||||||||||||||||||||||||||||||
Class | Period | Income (Loss) | Affiliate | Investments | Operations | Income | Capital Gains | from Capital | Distributions | Value | of Period | |||||||||||||||||||||||||||||||||
| For the Six-Month Period Ended June 30, 2010 (Unaudited) | ||||||||||||||||||||||||||||||||||||||||||||
| IA | $ | 8.33 | $ | 0.03 | $ | – | $ | (0.33 | ) | $ | (0.30 | ) | $ | – | $ | – | $ | – | $ | – | $ | (0.30 | ) | $ | 8.03 | |||||||||||||||||||
| IB | 8.30 | 0.02 | – | (0.32 | ) | (0.30 | ) | – | – | – | – | (0.30 | ) | 8.00 | ||||||||||||||||||||||||||||||
| For the Year Ended December 31, 2009 | ||||||||||||||||||||||||||||||||||||||||||||
| IA | 5.82 | 0.07 | – | 2.50 | 2.57 | (0.06 | ) | – | – | (0.06 | ) | 2.51 | 8.33 | |||||||||||||||||||||||||||||||
| IB | 5.80 | 0.05 | – | 2.49 | 2.54 | (0.04 | ) | – | – | (0.04 | ) | 2.50 | 8.30 | |||||||||||||||||||||||||||||||
| For the Year Ended December 31, 2008 | ||||||||||||||||||||||||||||||||||||||||||||
| IA | 12.34 | 0.07 | – | (4.35 | ) | (4.28 | ) | (0.06 | ) | (2.18 | ) | – | (2.24 | ) | (6.52 | ) | 5.82 | |||||||||||||||||||||||||||
| IB | 12.30 | 0.05 | – | (4.33 | ) | (4.28 | ) | (0.04 | ) | (2.18 | ) | – | (2.22 | ) | (6.50 | ) | 5.80 | |||||||||||||||||||||||||||
| For the Year Ended December 31, 2007 | ||||||||||||||||||||||||||||||||||||||||||||
| IA | 14.18 | 0.08 | – | 0.51 | 0.59 | (0.07 | ) | (2.36 | ) | – | (2.43 | ) | (1.84 | ) | 12.34 | |||||||||||||||||||||||||||||
| IB | 14.13 | 0.04 | – | 0.53 | 0.57 | (0.04 | ) | (2.36 | ) | – | (2.40 | ) | (1.83 | ) | 12.30 | |||||||||||||||||||||||||||||
| For the Year Ended December 31, 2006 | ||||||||||||||||||||||||||||||||||||||||||||
| IA | 14.01 | 0.10 | 0.01 | 2.11 | 2.22 | (0.12 | ) | (1.93 | ) | – | (2.05 | ) | 0.17 | 14.18 | ||||||||||||||||||||||||||||||
| IB | 13.96 | 0.07 | 0.01 | 2.10 | 2.18 | (0.08 | ) | (1.93 | ) | – | (2.01 | ) | 0.17 | 14.13 | ||||||||||||||||||||||||||||||
| For the Year Ended December 31, 2005 | ||||||||||||||||||||||||||||||||||||||||||||
| IA | 14.16 | 0.06 | 0.01 | 1.23 | 1.30 | (0.08 | ) | (1.37 | ) | – | (1.45 | ) | (0.15 | ) | 14.01 | |||||||||||||||||||||||||||||
| IB | 14.08 | (0.02 | ) | 0.01 | 1.27 | 1.26 | (0.01 | ) | (1.37 | ) | – | (1.38 | ) | (0.12 | ) | 13.96 | ||||||||||||||||||||||||||||
(A) | Information presented relates to a share outstanding throughout the indicated period. |
| (B) | The figures do not include sales charges or other fees which may be applied at the variable life insurance, variable annuity or qualified retirement plan product level. Any such additional sales charges or other fees would lower the Fund's performance. |
| (C) | Ratios do not reflect reductions for fees paid indirectly. Please see Fees Paid Indirectly in the Notes to Financial Statements. |
| (D) | Portfolio turnover rate is calculated on the basis of the Fund as a whole without distinguishing between the classes of shares issued. |
| (E) | Not annualized. |
| (F) | Annualized. |
| (G) | Total return without the inclusion of the Payment from (to) Affiliate can be found in Expenses in the accompanying Notes to Financial Statements. |
| - Ratios and Supplemental Data - | ||||||||||||||||||||||
Ratio of Expenses to Average Net | Ratio of Expenses to Average Net | Ratio of Net Investment Income to | Portfolio | |||||||||||||||||||
Total Return(B) | Net Assets at End of Period | Assets Before Waivers(C) | Assets After Waivers(C) | Average Net Assets | Turnover Rate(D) | |||||||||||||||||
| (3.55 | )%(E) | $ | 303,709 | 0.85 | %(F) | 0.85 | %(F) | 0.56 | %(F) | 27 | % | |||||||||||
| (3.66 | ) (E) | 125,091 | 1.10 | (F) | 1.10 | (F) | 0.31 | (F) | – | |||||||||||||
| 44.19 | (G) | 348,742 | 0.86 | 0.86 | 0.87 | 50 | ||||||||||||||||
| 43.83 | (G) | 145,920 | 1.11 | 1.11 | 0.62 | – | ||||||||||||||||
| (40.21 | ) | 301,896 | 0.81 | 0.81 | 0.82 | 51 | ||||||||||||||||
| (40.36 | ) | 128,483 | 1.06 | 1.06 | 0.57 | – | ||||||||||||||||
| 2.13 | 615,430 | 0.79 | 0.79 | 0.53 | 50 | |||||||||||||||||
| 1.87 | 300,502 | 1.04 | 1.04 | 0.28 | – | |||||||||||||||||
| 17.88 | (G) | 721,469 | 0.78 | 0.78 | 0.73 | 41 | ||||||||||||||||
| 17.59 | (G) | 370,771 | 1.03 | 1.03 | 0.51 | – | ||||||||||||||||
| 9.99 | (G) | 721,631 | 0.79 | 0.79 | 0.35 | 49 | ||||||||||||||||
| 9.71 | (G) | 391,264 | 1.04 | 1.04 | 0.10 | – | ||||||||||||||||
| Hartford MidCap Value HLS Fund |
The Board of Directors appoints officers who are responsible for the day-to-day operations of the Fund and who execute policies formulated by the Directors. Each director serves until his or her death, resignation, or retirement or until the next annual meeting of shareholders is held or until his or her successor is elected and qualifies.
Directors and officers who are employed by or who have a financial interest in The Hartford are considered “interested” persons of the Fund pursuant to the Investment Company Act of 1940, as amended. Each officer and two of the Company’s directors, as noted in the chart below, are “interested” persons of the Fund. Each director serves as a director for The Hartford Mutual Funds, Inc., The Hartford Mutual Funds II, Inc., The Hartford Income Shares Fund, Inc., Hartford Series Fund, Inc., and Hartford HLS Series Fund II, Inc., which, as of June 30, 2010, collectively consist of 88 funds. Correspondence may be sent to directors and officers c/o Hartford Mutual Funds, P.O. Box 2999, Hartford, Connecticut 06104-2999, except that correspondence to Ms. Fagely may be sent to 500 Bielenberg Drive, Woodbury, Minnesota 55125.
The table below sets forth, for each director and officer, his or her name, year of birth, current position with the Company and date first elected or appointed to Hartford Series Fund, Inc. (“HSF”), and Hartford HLS Series Fund II, Inc. (“HSF2”), principal occupation, and, for directors, other directorships held. The Fund’s statement of additional information contains further information on the directors and is available free of charge by calling 1-800-862-6668 or writing to Hartford HLS Funds, c/o Individual Annuity Services, P.O. Box 5085, Hartford, CT 06102-5085.
Information on the aggregate remuneration paid to the directors of the Company can be found in the Statement of Operations herein. The Fund pays to The Hartford a portion of the chief compliance officer’s compensation, but does not pay salaries or compensation to any of their other officers or directors who are employed by The Hartford.
Non-Interested Directors
Lynn S. Birdsong (1946) Director since 2003, Co-Chairman of the Investment Committee
Mr. Birdsong is a private investor. Since 2003, Mr. Birdsong has been an independent director of The Japan Fund and has served as a Director of the Sovereign High Yield Fund since April 2010. From 2003 to March 2005, Mr. Birdsong was an independent director of the Atlantic Whitehall Funds. From 1979 to 2002, Mr. Birdsong was a managing director of Zurich Scudder Investments, an investment management firm. During his employment with Scudder, Mr. Birdsong was an interested director of The Japan Fund. Since 1981, Mr. Birdsong has been a partner in Birdsong Company, an advertising specialty firm.
Robert M. Gavin, Jr. (1940) Director since 2002 (HSF) and 1986 (HSF2), Chairman of the Board since 2004
Dr. Gavin is an educational consultant. Prior to September 1, 2001, he was President of Cranbrook Education Community and prior to July 1996, he was President of Macalester College, St. Paul, Minnesota.
Duane E. Hill (1945) Director since 2001 (HSF) and 2002 (HSF2), Chairman of the Nominating Committee
Mr. Hill is Partner of TSG Ventures L.P., a private equity investment company. Mr. Hill is a former partner of TSG Capital Group, a private equity investment firm that served as sponsor and lead investor in leveraged buyouts of middle market companies.
Sandra S. Jaffee (1941) Director since 2005
Ms. Jaffee served as Chairman (2008 to 2009) and Chief Executive Officer of Fortent (formerly Searchspace Group), a leading provider of compliance/regulatory technology to financial institutions from August 2005 to August 2009. From August 2004 to August 2005, Ms. Jaffee served as an Entrepreneur in Residence with Warburg Pincus, a private equity firm. From September 1995 to July 2004, Ms. Jaffee served as Executive Vice President at Citigroup, where she was President and Chief Executive Officer of Citibank’s Global Securities Services (1995 to 2003).
William P. Johnston (1944) Director since 2005, Chairman of the Compliance Committee
In June 2006, Mr. Johnston was appointed as Senior Advisor to The Carlyle Group, a global private equity investment firm. In July 2006, Mr. Johnston was elected to the Board of Directors of MultiPlan, Inc. In August 2007, Mr. Johnston was elected to the Board of Directors of LifeCare Holdings, Inc. In February 2008, Mr. Johnston was elected to the Board of Directors of HCR-ManorCare, Inc. In May 2006, Mr. Johnston was elected to the Supervisory Board of Fresenius Medical Care AG & Co. KGaA, after its acquisition of Renal Care Group, Inc. in March 2006. Mr. Johnston joined Renal Care Group in November 2002 as a member of the Board of Directors and served as Chairman of the Board from March 2003 through March 2006. From September 1987 to December 2002, Mr. Johnston was with Equitable Securities Corporation (and its successors, SunTrust Equitable Securities and SunTrust Robinson Humphrey) serving in various investment banking and managerial positions, including Managing Director and Head of Investment Banking, Chief Executive Officer and Vice Chairman.
Phillip O. Peterson (1944) Director since 2002 (HSF) and 2000 (HSF2), Chairman of the Audit Committee
Mr. Peterson is a mutual fund industry consultant. He was a partner of KPMG LLP (an accounting firm) until July 1999. Mr. Peterson joined William Blair Funds in February 2007 as a member of the Board of Trustees. From January 2004 to April 2005, Mr. Peterson served as Independent President of the Strong Mutual Funds.
Lemma W. Senbet (1946) Director since 2005
Dr. Senbet is the William E. Mayer Chair Professor of Finance and Director, Center for Financial Policy, at the University of Maryland, Robert H. Smith School of Business. He was chair of the Finance Department during 1998 to 2006. Previously he was a chaired professor of finance at the University of Wisconsin-Madison. Also, he was director of the Fortis Funds from March 2000 to July 2002. Dr. Senbet served the finance profession in various capacities, including as director of the American Finance Association and President of the Western Finance Association. In 2006, Dr. Senbet was inducted Fellow of Financial Management Association International for his career-long distinguished scholarship and professional service.
Interested Directors and Officers
Lowndes A. Smith (1939) Director since 1996 (HSF) and 2002 (HSF2), Co-Chairman of the Investment Committee
Mr. Smith served as Vice Chairman of The Hartford from February 1997 to January 2002, as President and Chief Executive Officer of Hartford Life, Inc. from February 1997 to January 2002, and as President and Chief Operating Officer of The Hartford Life Insurance Companies from January 1989 to January 2002. Mr. Smith serves as a Director of White Mountains Insurance Group, Ltd., One Beacon Insurance, Symetra Financial and as a Managing Director of Whittington Gray Associates.
John C. Walters 1, 2 (1962) Director since 2008
Mr. Walters currently serves as President, Chief Executive Officer and Director for Hartford Life, Inc. (“HL, Inc.”). Mr. Walters also serves as President, Chairman of the Board, Chief Executive Officer and Director for Hartford Life Insurance Company (“Hartford Life”), and as Executive Vice President of The Hartford. In addition, Mr. Walters is a Manager of HL Investment Advisors, LLC (“HL Advisors”). Mr. Walters previously served as President of the U.S. Wealth Management Division of HL, Inc. (2006-2007) and as Co-Chief Operating Officer of Hartford Life (2007-2008).
1 Mr. Walters previously served as President and Chief Executive Officer (2007 to 2009).
2 Effective July 31, 2010, Mr. Walters retired from The Hartford. Mr. Walters resigned his position as a Director of the Fund effective July 30, 2010.
Other Officers
Robert M. Arena, Jr. (1968) President and Chief Executive Officer since 2009 (served as Vice President of the Fund (2006-2009))
Mr. Arena serves as Executive Vice President of Hartford Life. Additionally, Mr. Arena is Senior Vice President and Director of Hartford Administrative Services Company, (“HASCO”), President, Chief Executive Officer and Manager of Hartford Investment Financial Services, LLC (“HIFSCO”) and President, Chief Executive Officer and Manager of HL Advisors. Mr. Arena joined The Hartford in 2004.
Tamara L. Fagely (1958) Vice President, Treasurer and Controller since 2002 (HSF) 1993 (HSF2)
Ms. Fagely has been a Vice President of HASCO since 1998 and Chief Financial Officer since 2006. Currently Ms. Fagely is a Vice President of Hartford Life. She served as Assistant Vice President of Hartford Life from December 2001 through March 2005. In addition, Ms. Fagely is Controller and Chief Financial Officer of HIFSCO.
Brian Ferrell (1962) AML Compliance Officer since 2008
Mr. Ferrell has served as Assistant Vice President and AML Compliance Officer for The Hartford since 2006, and as AML Compliance Officer for HASCO and Hartford Investor Services Company, LLC (“HISC”) since 2008. Prior to joining The Hartford in 2006, Mr. Ferrell held various positions at the U.S. Department of the Treasury (the “Treasury”) from 2001 to 2006, where he served as Chief Counsel for the Treasury’s Financial Crimes Enforcement Network from 2005-2006.
Dr. Robert J. Froehlich (1953) Senior Managing Director since 2009
Dr. Froehlich joined The Hartford as Senior Managing Director in September 2009. Prior to joining The Hartford, Dr. Froehlich served as Vice Chairman of Deutsche Asset Management from 1997-2009.
| Hartford MidCap Value HLS Fund |
| Directors and Officers (Unaudited) – (continued) |
Thomas D. Jones, III (1965) Vice President and Chief Compliance Officer since 2006
Mr. Jones serves as Chief Compliance Officer for the Hartford Mutual Funds and Vice President and Director of Securities Compliance for The Hartford. Mr. Jones joined The Hartford in 2006 from SEI Investments, where he served as Chief Compliance Officer for its mutual funds and investment advisers. Prior to joining SEI, Mr. Jones was First Vice President and Compliance Director for Merrill Lynch Investment Managers (Americas) (“MLIM”), where he worked from 1992-2004.
Edward P. Macdonald (1967) Vice President, Secretary and Chief Legal Officer since 2005
Mr. Macdonald serves as Assistant Vice President of Hartford Life and Chief Legal Officer and Vice President of HIFSCO. He also serves as Vice President and Secretary of HASCO, and Chief Legal Officer, Secretary and Vice President of HL Advisors. Mr. Macdonald joined The Hartford in 2005.
Vernon J. Meyer (1964) Vice President since 2006
Mr. Meyer serves as Senior Vice President of Hartford Life. He also serves as Senior Vice President of HIFSCO and HL Advisors. Mr. Meyer joined The Hartford in 2004.
D. Keith Sloane (1960) Vice President since 2009
Mr. Sloane is a Senior Vice President of Hartford Life. Additionally, Mr. Sloane currently serves as Senior Vice President of HIFSCO, HL Advisors, and HASCO. Prior to joining The Hartford in 2007, Mr. Sloane was Director of product marketing and led the mutual fund business for Wachovia Securities (“Wachovia”) in their investment products group. Mr. Sloane joined Wachovia in 1995.
Jane Wolak (1961) Vice President since 2009
Ms. Wolak currently serves as Vice President of Hartford Life. Ms. Wolak joined Hartford Life as Vice President, Retail Product Services in May 2007. She is also Vice President of HASCO. Previously, Ms. Wolak was with Sun Life Financial where she held the position of Vice President, Service Center Operations from 2001-2007.
A description of the policies and procedures that the Fund uses to determine how to vote proxies relating to portfolio securities and a record of how the Fund voted any proxies for the twelve-month period ended June 30, 2010 is available (1) without charge, upon request, by calling 800-862-6668 and (2) on the Securities and Exchange Commission’s website at http://www.sec.gov.
The Fund files a complete schedule of portfolio holdings with the Commission for the first and third quarters of each fiscal year on Form N-Q. The Fund’s Forms are available (1) without charge, upon request, by calling 800-862-6668 and (2) on the Securities and Exchange Commission’s website at http://www.sec.gov. The Form N-Q may be reviewed and copied at the Commission’s Public Reference Room in Washington, DC. Information on the operation of the Public Reference Room may be obtained by calling 1-800-SEC-0330.
| Hartford MidCap Value HLS Fund |
The following proposals were addressed and approved at a Special Meeting of Shareholders held on February 12, 2010.
Proposal to approve amendments to the Investment Management Agreement between the Fund and HL Investment Advisors, the purpose of which were to combine the administrative services for the Fund with the management services for the Fund under a single agreement.
| Fund | For | Against | Abstain | |||
| Hartford MidCap Value HLS Fund | 55,291,182.549 | 1,436,776.382 | 1,293,022.126 |
Proposal to elect Lemma Senbet and John Walters, each currently a Director, as Directors of Hartford Series Fund, Inc.
Lemma W. Senbet
| Funds | For | Withheld | |||
| Hartford Series Fund, Inc. | 5,079,578,022.902 | 241,839,974.106 |
John C. Walters
| Funds | For | Withheld | |||
| Hartford Series Fund, Inc. | 5,081,138,302.186 | 240,279,694.822 |
| Hartford MidCap Value HLS Fund |
Your Fund's Expenses
As a shareholder of the Fund, you incur two types of costs: (1) transaction costs, including sales charges (loads) on purchase payments and contingent deferred sales charges (CDSC) (2) ongoing costs including management fees; distribution fees; and other fund expenses. This example is intended to help you understand your ongoing costs (in dollars) of investing in the Fund and to compare these costs with the ongoing costs of investing in other mutual funds. The example is based on an investment of $1,000 invested at the beginning of the period and held for the period of December 31, 2009 through June 30, 2010.
Actual Expenses
The first set of columns of the table below provides information about actual account values and actual expenses. You may use the information in this column, together with the amount you invested, to estimate the expenses that you paid over the period. Simply divide your account value by $1,000 (for example, an $8,600 account value divided by $1,000 = 8.6), then multiply the result by the number in the line under the heading entitled "Expenses Paid During Period" to estimate the expenses you paid on your account during this period.
Hypothetical Example for Comparison Purposes
The second set of columns of the table below provides information about hypothetical account values and hypothetical expenses based on the Fund's actual expense ratio and an assumed rate of return of 5% per year before expenses, which is not the Fund's actual return. The hypothetical account values and expenses may not be used to estimate the actual ending account balance or expenses you paid for the period. You may use this information to compare the ongoing costs of investing in the Fund and other funds. To do so, compare this 5% hypothetical example with the 5% hypothetical examples that appear in the shareholder reports of the other funds.
Please note that the expenses shown in the table are meant to highlight your ongoing costs only and do not reflect any transactional costs, such as sales charges (loads) and CDSC. Therefore, the second set of columns of the table is useful in comparing ongoing costs only, and will not help you determine the relative total costs of owning different funds. In addition, if these transactional costs were included, your costs would be higher. Expenses are equal to the Fund's annualized expense ratios multiplied by average account value over the period, multiplied by 181/365 (to reflect the one-half year period).
| Actual return | Hypothetical (5% return before expenses) | |||||||||||||||||||||||||||||||||||
| Expenses paid | Expenses paid | Days in | ||||||||||||||||||||||||||||||||||
| during the period | during the period | the | Days | |||||||||||||||||||||||||||||||||
| Beginning | Ending | December 31, 2009 | Beginning | Ending | December 31, 2009 | Annualized | current | in the | ||||||||||||||||||||||||||||
| Account Value | Account Value | through | Account Value | Account Value | through | expense | 1/2 | full | ||||||||||||||||||||||||||||
| December 31, 2009 | June 30, 2010 | June 30, 2010 | December 31, 2009 | June 30, 2010 | June 30, 2010 | ratio | year | year | ||||||||||||||||||||||||||||
| Class IA | $ | 1,000.00 | $ | 964.55 | $ | 4.14 | $ | 1,000.00 | $ | 1,020.58 | $ | 4.26 | 0.85 | % | 181 | 365 | ||||||||||||||||||||
| Class IB | $ | 1,000.00 | $ | 963.36 | $ | 5.35 | $ | 1,000.00 | $ | 1,019.34 | $ | 5.51 | 1.10 | % | 181 | 365 | ||||||||||||||||||||
| Hartford MidCap Value HLS Fund |
The Board approved the annual continuation of the Investment Management Agreement (the “Agreement”) between Hartford Series Fund, Inc. (“HSF”) and HL Investment Advisors, LLC (“HL Advisors”) with respect to the Fund at its meeting on August 4-5, 2009. The Board’s considerations in approving the renewal of the Agreement are disclosed in the December 31, 2009 Annual Report for HSF.
At the November 4-5, 2009 meeting, the Board considered and approved amendments to the Agreement to include administrative services, which had been provided pursuant to a separate agreement, and investment management services under one agreement. The Board, including all of the Independent Directors, approved the amendments to the Agreement with respect to the Fund.
In approving the amendments, in addition to the information presented at the August meeting in connection with the annual review of the Agreement and the additional information provided throughout the year, the Board also considered the fact that the amendments did not result in an overall increase in fees to shareholders. The Board took note of the fact that the management of HL Advisors believes that the proposal to combine the administrative services with the investment management services under a single agreement will produce streamlined fee disclosure, resulting in greater transparency and clarity in the Fund’s prospectuses and financial reports. The Board further noted management's belief that the change would result in consistency across all of the Hartford Funds in the complex in that the funds of HSF are the only funds in the complex (other than the R share classes of the Hartford retail funds) that are subject to a separate administrative services fee. Finally, the Board noted management's view that the proposed changes to the Agreement should also serve to simplify the Board's annual consideration of the investment management arrangements for the Fund in that the investment management and administrative fees would be presented as a single fee for fee comparison purposes, which should facilitate the Board's analysis.
The shareholders of the Fund approved the amendments at a Special Meeting of Shareholders held on February 12, 2010. The amendments were effective as of March 1, 2010.
29
The Hartford
P.O. Box 5085
Hartford, CT 06102–5085
Hartford Series Fund, Inc. is underwritten and distributed by Hartford Securities Distribution Company, Inc.
“The Hartford” is The Hartford Financial Services Group, Inc. and its subsidiaries.
Hartford Series Fund, Inc. inception dates range from 1977 to date. Hartford Series Fund, Inc. is not a subsidiary of The Hartford but is underwritten, distributed by and advised by subsidiaries of The Hartford. Investments in Hartford Series Fund, Inc. are not guaranteed by The Hartford or any other entity.
This material is authorized for distribution only when preceded or accompanied by a current prospectus. The prospectus contains detailed information about the Funds, including investment objectives, risks and charges and expenses. Please read it carefully before you invest or send money.
HLSSAR-MCV10 Printed in U.S.A ©2010 The Hartford, Hartford, CT 06115 |
| Hartford Money Market HLS Fund |
|
Hartford Money Market HLS Fund
| Financial Statements | |
| 2 | |
| 6 | |
| 7 | |
| 8 | |
| 9 | |
| 10 | |
| 16 | |
| 18 | |
| 20 | |
| 20 | |
| 21 | |
| 22 | |
| 23 |
This report is prepared for the general information of contract owners and qualified retirement plan participants. It is not an offer of contracts or of qualified retirement plans. It should not be used in connection with any offer, except in conjunction with the appropriate prospectus which contains all pertinent information including the applicable sales, administrative and other charges.
The views expressed in the Fund’s Manager Discussion under “Why did the Fund perform this way?” and “What is the outlook?” are views of the Fund’s subadvisers and portfolio management team through the end of the period and is subject to change based on market and other conditions.
| Hartford Money Market HLS Fund |
June 30, 2010 (Unaudited) |
| (000’s Omitted) |
| Shares or Principal Amount | Market Value ╪ | ||||||
| CERTIFICATES OF DEPOSIT- 6.3% | |||||||
| Commercial Banking - 2.5% | |||||||
| Barclays Bank plc (New York Branch) | |||||||
| $ | 14,750 | 0.28%, 07/19/2010 | $ | 14,750 | |||
| 28,250 | 0.60%, 09/07/2010 Δ | 28,250 | |||||
| Svenska Handelsbanken, Inc. | |||||||
| 15,500 | 0.32%, 09/20/2010 | 15,500 | |||||
| 14,250 | 0.38%, 08/09/2010 | 14,250 | |||||
| 72,750 | |||||||
| Depository Credit - Banking - 2.7% | |||||||
| Deutsche Bank | |||||||
| 22,750 | 0.25%, 07/08/2010 | 22,750 | |||||
| 8,000 | 0.45%, 08/12/2010 | 8,000 | |||||
| Toronto-Dominion Holdings | |||||||
| 30,500 | 0.26%, 07/14/2010 | 30,500 | |||||
| 17,500 | 0.45%, 09/02/2010 | 17,500 | |||||
| 78,750 | |||||||
| Other Financial Investment Activities - 1.1% | |||||||
| BNP Paribas Finance | |||||||
| 13,750 | 0.26%, 07/16/2010 | 13,750 | |||||
| 16,750 | 0.47%, 08/23/2010 | 16,750 | |||||
| 30,500 | |||||||
Total certificates of deposit (cost $182,000) | $ | 182,000 | |||||
| COMMERCIAL PAPER - 62.7% | |||||||
| Basic Chemical Manufacturing - 2.9% | |||||||
| Export Development Canada | |||||||
| $ | 13,000 | 0.16%, 08/13/2010 ○ | $ | 12,998 | |||
| 44,250 | 0.19%, 08/09/2010 - 09/16/2010 ○ | 44,235 | |||||
| 29,250 | 0.20%, 08/10/2010 ○ | 29,243 | |||||
| 86,476 | |||||||
| Beverage Manufacturing - 2.0% | |||||||
| Coca Cola Co. | |||||||
| 40,000 | 0.24%, 07/08/2010 - 07/12/2010 ○ | 39,997 | |||||
| 19,250 | 0.33%, 10/07/2010 ○ | 19,233 | |||||
| 59,230 | |||||||
| Commercial Banking - 11.9% | |||||||
| Bank of America Corp. | |||||||
| 15,250 | 0.26%, 07/12/2010 ○ | 15,249 | |||||
| Commonwealth Bank of Australia | |||||||
| 10,250 | 0.47%, 09/21/2010 ○ | 10,240 | |||||
| 22,000 | 0.48%, 09/09/2010 ○ | 21,980 | |||||
| 13,250 | 0.51%, 08/30/2010 ○ | 13,239 | |||||
| Nordea North America | |||||||
| 13,500 | 0.30%, 07/16/2010 ○ | 13,498 | |||||
| 15,500 | 0.39%, 08/16/2010 ○ | 15,493 | |||||
| 16,500 | 0.51%, 08/24/2010 ○ | 16,488 | |||||
| Old Line Funding LLC | |||||||
| 14,500 | 0.25%, 07/20/2010 ■ ○ | 14,498 | |||||
| 14,290 | 0.28%, 07/16/2010 ■ ○ | 14,288 | |||||
| 32,850 | 0.49%, 09/02/2010 - 09/16/2010 ■ ○ | 32,820 | |||||
| Rabobank USA | |||||||
| 10,000 | 0.23%, 07/06/2010 ○ | 10,000 | |||||
| 18,000 | 0.31%, 07/21/2010 ○ | 17,997 | |||||
| 12,250 | 0.38%, 08/11/2010 ○ | 12,245 | |||||
| 21,000 | 0.49%, 09/24/2010 ○ | 20,976 | |||||
| State Street Corp. | |||||||
| 15,750 | 0.24%, 07/07/2010 ○ | 15,749 | |||||
| Svenska Handelsbanken, Inc. | |||||||
| 16,000 | 0.35%, 07/16/2010 ○ | 15,998 | |||||
| United Technology Corp. | |||||||
| 29,250 | 0.17%, 07/28/2010 ■ ○ | 29,246 | |||||
| 18,550 | 0.18%, 07/06/2010 ■ ○ | 18,550 | |||||
| Westpac Banking Corp. | |||||||
| 26,000 | 0.32%, 08/04/2010 - 10/05/2010 ■ ○ | 25,982 | |||||
| 20,000 | 0.54%, 09/17/2010 ■ Δ | 20,004 | |||||
| 354,540 | |||||||
| Computer and Peripheral Equipment Manufacturing -1.0% | |||||||
| Microsoft Corp. | |||||||
| 30,000 | 0.15%, 07/06/2010 ○ | 29,999 | |||||
| Consumer Lending - 2.5% | |||||||
| Straight-A Funding LLC | |||||||
| 11,500 | 0.25%, 07/01/2010 ■ ○ | 11,500 | |||||
| 12,500 | 0.40%, 08/16/2010 ■ ○ | 12,494 | |||||
| 33,500 | 0.41%, 08/09/2010 - 09/15/2010 ■ ○ | 33,478 | |||||
| 18,250 | 0.43%, 08/20/2010 ■ ○ | 18,239 | |||||
| 75,711 | |||||||
| Depository Credit - Banking - 2.4% | |||||||
| Bank of Nova Scotia | |||||||
| 11,000 | 0.20%, 07/29/2010 ○ | 10,998 | |||||
| 16,000 | 0.26%, 07/09/2010 ○ | 15,999 | |||||
| 32,750 | 0.30%, 07/27/2010 - 08/19/2010 ○ | 32,740 | |||||
| Toronto-Dominion Holdings | |||||||
| 12,500 | 0.25%, 07/09/2010 ■ ○ | 12,499 | |||||
| 72,236 | |||||||
| Electrical Equipment Manufacturing Household Appliances - 1.5% | |||||||
| General Electric Co. | |||||||
| 29,750 | 0.25%, 08/27/2010 ○ | 29,738 | |||||
| 15,000 | 0.36%, 09/22/2010 ○ | 14,988 | |||||
| 44,726 | |||||||
| International Trade Financing (Foreign Banks) - 10.7% | |||||||
| Australia & New Zealand Banking Group | |||||||
| Ltd. | |||||||
| 20,000 | 0.28%, 08/09/2010 ■ ○ | 19,994 | |||||
| 24,500 | 0.39%, 10/28/2010 ■ ○ | 24,470 | |||||
| Kreditanstalt fuer Wiederaufbau | |||||||
| 39,500 | 0.25%, 07/13/2010 - 07/28/2010 ■ ○ | 39,495 | |||||
| 21,250 | 0.30%, 08/10/2010 ■ ○ | 21,243 | |||||
| Queensland Treasury Corp. | |||||||
| 22,000 | 0.21%, 07/06/2010 ○ | 21,999 | |||||
| 22,250 | 0.28%, 08/11/2010 ○ | 22,243 | |||||
| 21,000 | 0.31%, 07/19/2010 ○ | 20,997 | |||||
| 9,000 | 0.40%, 09/30/2010 ○ | 8,991 | |||||
The accompanying notes are an integral part of these financial statements.
| Shares or Principal Amount | Market Value ╪ | ||||||
| COMMERCIAL PAPER - 62.7% - (continued) | |||||||
| International Trade Financing (Foreign Banks) - 10.7% - (continued) | |||||||
| Royal Bank of Canada | |||||||
| $ | 20,000 | 0.23%, 07/19/2010 ○ | $ | 19,998 | |||
| 11,000 | 0.28%, 08/30/2010 ○ | 10,995 | |||||
| Societe De Prise Participation | |||||||
| 11,750 | 0.25%, 07/26/2010 ○ | 11,748 | |||||
| 15,000 | 0.27%, 08/12/2010 ○ | 14,995 | |||||
| 16,750 | 0.37%, 07/07/2010 ○ | 16,749 | |||||
| 16,250 | 0.54%, 09/09/2010 ○ | 16,233 | |||||
| U.S. Bancorp | |||||||
| 10,500 | 0.43%, 09/13/2010 ○ | 10,491 | |||||
| U.S. Bank National Association | |||||||
| 17,500 | 0.33%, 07/27/2010 ○ | 17,496 | |||||
| 17,500 | 0.44%, 08/26/2010 ○ | 17,488 | |||||
| 315,625 | |||||||
| Motor Vehicle Parts Manufacturing - 2.1% | |||||||
| Walmart Stores, Inc. | |||||||
| 30,250 | 0.17%, 07/09/2010 ○ | 30,249 | |||||
| 14,250 | 0.18%, 07/07/2010 ○ | 14,250 | |||||
| 16,000 | 0.19%, 07/01/2010 ○ | 16,000 | |||||
| 60,499 | |||||||
| Natural Gas Distribution - 1.6% | |||||||
| Conocophillips | |||||||
| 14,250 | 0.22%, 07/09/2010 ■ ○ | 14,249 | |||||
| 21,500 | 0.24%, 08/16/2010 ■ ○ | 21,493 | |||||
| 10,250 | 0.26%, 07/19/2010 ■ ○ | 10,249 | |||||
| 45,991 | |||||||
| Other Financial Investment Activities - 1.9% | |||||||
| Sheffield Receivables Corp. | |||||||
| 15,000 | 0.26%, 07/08/2010 ○ | 14,999 | |||||
| 15,000 | 0.33%, 07/15/2010 ○ | 14,998 | |||||
| 15,000 | 0.39%, 07/26/2010 ■ ○ | 14,996 | |||||
| 15,250 | 0.41%, 08/09/2010 ○ | 15,244 | |||||
| 60,237 | |||||||
| Other Investment Pools and Funds - 5.5% | |||||||
| Alpine Securitization Corp. | |||||||
| 20,000 | 0.32%, 07/29/2010 ○ | 19,995 | |||||
| 39,250 | 0.33%, 07/16/2010 - 07/22/2010 ○ | 39,243 | |||||
| Falcon Asset Securitization Co. | |||||||
| 13,500 | 0.25%, 07/19/2010 ■ ○ | 13,498 | |||||
| 10,750 | 0.33%, 08/04/2010 ○ | 10,747 | |||||
| 18,250 | 0.46%, 09/14/2010 ■ ○ | 18,233 | |||||
| 16,500 | 0.47%, 08/23/2010 ■ ○ | 16,489 | |||||
| State Street Corp. | |||||||
| 18,000 | 0.26%, 08/03/2010 ○ | 17,996 | |||||
| 9,750 | 0.49%, 09/21/2010 ○ | 9,739 | |||||
| 17,000 | 0.57%, 10/07/2010 ○ | 16,974 | |||||
| 162,914 | |||||||
| Pharmaceutical & Medicine Manufacturing - 3.5% | |||||||
| Abbott Laboratories | |||||||
| 12,500 | 0.20%, 08/23/2010 ■ ○ | 12,496 | |||||
| 26,000 | 0.24%, 08/03/2010 ■ ○ | 25,994 | |||||
| 20,750 | 0.25%, 08/02/2010 ■ ○ | 20,745 | |||||
| Merck & Co., Inc. | |||||||
| 29,500 | 0.19%, 08/05/2010 ○ | 29,495 | |||||
| 15,750 | 0.25%, 07/23/2010 ■ ○ | 15,748 | |||||
| 104,478 | |||||||
| Securities and Commodity Contracts and Brokerage -1.6% | |||||||
| JP Morgan Chase Funding, Inc. | |||||||
| 12,750 | 0.23%, 07/14/2010 ○ | 12,749 | |||||
| 19,000 | 0.25%, 07/02/2010 ○ | 19,000 | |||||
| 16,000 | 0.26%, 07/26/2010 ○ | 15,997 | |||||
| 47,746 | |||||||
| Soap, Cleaning Compound, Toiletries Manufacturing -3.0% | |||||||
| Colgate-Palmolive Co. | |||||||
| 29,250 | 0.15%, 07/02/2010 ○ | 29,250 | |||||
| Procter & Gamble | |||||||
| 43,500 | 0.19%, 07/02/2010 - 07/15/2010 ■ ○ | 43,498 | |||||
| 17,000 | 0.23%, 07/07/2010 ■ ○ | 16,999 | |||||
| 89,747 | |||||||
| Sovereign Foreign Governments - 7.0% | |||||||
| British Columbia (Province of) | |||||||
| 13,000 | 0.26%, 09/01/2010 ○ | 12,994 | |||||
| 17,000 | 0.39%, 11/08/2010 ○ | 16,977 | |||||
| 31,700 | 0.41%, 11/24/2010 - 12/01/2010 ○ | 31,647 | |||||
| Ontario (Province of) | |||||||
| 14,000 | 0.21%, 07/19/2010 ○ | 13,998 | |||||
| 31,500 | 0.24%, 07/29/2010 - 08/09/2010 ○ | 31,493 | |||||
| 27,250 | 0.27%, 09/21/2010 ○ | 27,233 | |||||
| Quebec (Province of) | |||||||
| 23,000 | 0.24%, 07/28/2010 ○ | 22,996 | |||||
| 28,500 | 0.26%, 09/16/2010 ■ ○ | 28,484 | |||||
| 22,500 | 0.36%, 10/15/2010 ○ | 22,477 | |||||
| 208,299 | |||||||
| Telecommunications - Wired Carriers - 1.6% | |||||||
| AT&T, Inc. | |||||||
| 45,750 | 0.20%, 07/07/2010 - 07/27/2010 ■ ○ | 45,746 | |||||
Total commercial paper (cost $1,864,200) | $ | 1,864,200 | |||||
| CORPORATE NOTES - 5.8% | |||||||
| Depository Credit - Banking - 1.5% | |||||||
| Wachovia Corp. | |||||||
| $ | 20,250 | 0.39%, 07/26/2010 Δ | $ | 20,251 | |||
| Wells Fargo & Co. | |||||||
| 24,250 | 0.68%, 08/20/2010 Δ | 24,256 | |||||
| 44,507 | |||||||
| Insurance Carriers - 1.0% | |||||||
| Met Life Global Funding I | |||||||
| 28,600 | 1.14%, 09/17/2010 ■ Δ | 28,626 | |||||
The accompanying notes are an integral part of these financial statements.
| Hartford Money Market HLS Fund |
Schedule of Investments – (continued) June 30, 2010 (Unaudited) |
| (000’s Omitted) |
| Shares or Principal Amount | Market Value ╪ | ||||||||||
| CORPORATE NOTES - 5.8% - (continued) | |||||||||||
| International Trade Financing (Foreign Banks) – 3.3% | |||||||||||
| International Bank for Reconstruction & | |||||||||||
| Development | |||||||||||
| $ | 8,800 | 0.20%, 08/23/2010 ○ | $ | 8,798 | |||||||
| 23,000 | 0.23%, 07/19/2010 ○ | 22,997 | |||||||||
| 18,000 | 0.30%, 08/04/2010 ○ | 17,995 | |||||||||
| 21,250 | 0.36%, 09/03/2010 ○ | 21,237 | |||||||||
| Royal Bank of Canada | |||||||||||
| 28,000 | 0.79%, 09/28/2010 Δ | 28,022 | |||||||||
| 99,049 | |||||||||||
Total corporate notes (cost $172,182) | $ | 172,182 | |||||||||
| OTHER POOLS AND FUNDS - 0.0% | |||||||||||
| 1 | JP Morgan U.S. Government Money Market Fund | $ | 1 | ||||||||
| – | State Street Bank U.S. Government Money Market Fund | – | |||||||||
| – | Wells Fargo Advantage Government Money Market Fund | – | |||||||||
Total other pools and funds (cost $1) | $ | 1 | |||||||||
| REPURCHASE AGREEMENTS - 2.1% | |||||||||||
| BNP Paribas Securities Corp. Repurchase | |||||||||||
| Agreement (maturing on 07/01/2010 in | |||||||||||
| the amount of $27,157, collateralized by | |||||||||||
| U.S. Treasury Bond 6.25%, 2030, U.S. | |||||||||||
| Treasury Note 1.00%, 2011, value of | |||||||||||
| $27,860) | |||||||||||
| $ | 27,157 | 0.01% dated 06/30/2010 | $ | 27,157 | |||||||
| RBS Greenwich Capital Markets TriParty | |||||||||||
| Joint Repurchase Agreement (maturing | |||||||||||
| on 07/01/2010 in the amount of $10,981, | |||||||||||
| collateralized by U.S. Treasury Bill | |||||||||||
| 0.88%, 2011, value of $11,201) | |||||||||||
| 10,981 | 0.01% dated 06/30/2010 | 10,981 | |||||||||
| UBS Securities, Inc. TriParty Joint | |||||||||||
| Repurchase Agreement (maturing on | |||||||||||
| 07/01/2010 in the amount of $25,031, | |||||||||||
| collateralized by U.S. Treasury Note | |||||||||||
| 2.13%, 2015, value of $25,532) | |||||||||||
| 25,031 | 0.04% dated 06/30/2010 | 25,031 | |||||||||
Total repurchase agreements (cost $63,169) | $ | 63,169 | |||||||||
| U.S. GOVERNMENT AGENCIES - 9.3% | |||||||||||
| Federal Home Loan Mortgage Corp. - 3.7% | |||||||||||
| $ | 27,900 | 0.11%, 08/16/2010 ○ | $ | 27,896 | |||||||
| 19,000 | 0.17%, 09/20/2010 ○ | 18,993 | |||||||||
| 26,250 | 0.18%, 07/21/2010 – 07/26/2010 ○ | 26,248 | |||||||||
| 24,250 | 0.20%, 08/23/2010 ○ | 24,243 | |||||||||
| 12,000 | 0.24%, 08/10/2010 ○ | 11,997 | |||||||||
| 109,377 | |||||||||||
| Federal National Mortgage Association - 5.6% | |||||||||||
| 27,000 | 0.14%, 07/07/2010 ○ | 26,999 | |||||||||
| 107,500 | 0.19%, 07/21/2010 - 09/01/2010 ○ | 107,479 | |||||||||
| 15,250 | 0.20%, 08/25/2010 ○ | 15,245 | |||||||||
| 16,000 | 0.21%, 07/09/2010 ○ | 15,999 | |||||||||
| 165,722 | |||||||||||
Total U.S. government agencies (cost $275,099) | $ | 275,099 | |||||||||
| U.S. GOVERNMENT SECURITIES - 5.0% | |||||||||||
| Other Direct Federal Obligations - 5.0% | |||||||||||
| Federal Home Loan Bank | |||||||||||
| $ | 30,500 | 0.09%, 07/16/2010 ○ | $ | 30,499 | |||||||
| 50,250 | 0.14%, 07/02/2010 - 08/25/2010 ○ | 50,246 | |||||||||
| 22,750 | 0.18%, 07/28/2010 ○ | 22,747 | |||||||||
| 21,000 | 0.19%, 07/14/2010 ○ | 20,999 | |||||||||
| 24,250 | 0.20%, 08/04/2010 ○ | 24,245 | |||||||||
| 148,736 | |||||||||||
Total U.S. government securities (cost $148,736) | $ | 148,736 | |||||||||
| U.S. TREASURY BILLS - 8.9% | |||||||||||
| $ | 92,250 | 0.08%, 07/22/2010 ○ | $ | 92,246 | |||||||
| 100,000 | 0.09%, 07/08/2010 ○ | 99,998 | |||||||||
| 72,250 | 0.17%, 07/15/2010 ○ | 72,246 | |||||||||
Total U.S. treasury bills (cost $264,490) | $ | 264,490 | |||||||||
Total investments (cost $2,969,877) ▲ | 100.1 | % | $ | 2,969,877 | |||||||
| Other assets and liabilities | (0.1 | )% | (1,905 | ) | |||||||
| Total net assets | 100.0 | % | $ | 2,967,972 | |||||||
| Note: | Percentage of investments as shown is the ratio of the total market value to total net assets. The rates presented in this Schedule of Investments are yields, unless otherwise noted. Market value of investments in U.S. dollar denominated securities of foreign issuers represents 26.1% of total net assets at June 30, 2010. |
| ▲ | Also represents cost for tax purposes. |
| Δ | Variable rate securities; the rate reported is the coupon rate in effect at June 30, 2010. |
| ■ | Securities issued within terms of a private placement memorandum, exempt from registration under Rule 144A under the Securities Act of 1933, as amended, and may be sold only to qualified institutional buyers. Pursuant to guidelines adopted by the Board of Directors, these issues are determined to be liquid. The aggregate value of these securities at June 30, 2010, was $696,343, which represents 23.46% of total net assets. |
The accompanying notes are an integral part of these financial statements.
| ○ | The interest rate disclosed for these securities represents the effective yield on the date of the acquisition. |
| ╪ | See Significant Accounting Policies of accompanying Notes to Financial Statements regarding valuation of securities. |
The accompanying notes are an integral part of these financial statements.
| Hartford Money Market HLS Fund |
June 30, 2010 (Unaudited) |
| (000’s Omitted) |
| Total | Level 1 ♦ | Level 2♦ | Level 3 | |||||||||||||
| Assets: | ||||||||||||||||
| Certificates of Deposit | $ | 182,000 | $ | – | $ | 182,000 | $ | – | ||||||||
| Commercial Paper | 1,864,200 | – | 1,864,200 | – | ||||||||||||
| Corporate Notes | 172,182 | – | 172,182 | – | ||||||||||||
| Other Pools and Funds | 1 | 1 | – | – | ||||||||||||
| Repurchase Agreements | 63,169 | – | 63,169 | – | ||||||||||||
| U.S. Government Agencies | 275,099 | – | 275,099 | – | ||||||||||||
| U.S. Government Securities | 148,736 | – | 148,736 | – | ||||||||||||
| U.S. Treasury Bills | 264,490 | – | 264,490 | – | ||||||||||||
| Total | $ | 2,969,877 | $ | 1 | $ | 2,969,876 | $ | – | ||||||||
♦ For the period ended June 30, 2010, there were no significant transfers between Level 1 and Level 2.
The accompanying notes are an integral part of these financial statements.
| Hartford Money Market HLS Fund |
June 30, 2010 (Unaudited) |
| (000’s Omitted) |
| Assets: | ||||
| Investments in securities, at market value (cost $2,969,877) | $ | 2,969,877 | ||
| Cash | — | |||
| Receivables: | ||||
| Fund shares sold | 8,334 | |||
| Dividends and interest | 159 | |||
| Other assets | 115 | |||
| Total assets | 2,978,485 | |||
| Liabilities: | ||||
| Payables: | ||||
| Fund shares redeemed | 9,761 | |||
| Investment management fees | 261 | |||
| Accrued expenses | 491 | |||
| Total liabilities | 10,513 | |||
| Net assets | $ | 2,967,972 | ||
| Summary of Net Assets: | ||||
| Capital stock and paid-in-capital | $ | 2,977,468 | ||
| Accumulated undistributed net investment income | — | |||
| Accumulated net realized loss on investments | (9,496 | ) | ||
| Net assets | $ | 2,967,972 | ||
| Shares authorized | 14,000,000 | |||
| Par value | $ | 0.001 | ||
Class IA: Net asset value per share | $ | 1.00 | ||
| Shares outstanding | 2,495,117 | |||
| Net assets | $ | 2,487,146 | ||
Class IB: Net asset value per share | $ | 1.00 | ||
| Shares outstanding | 482,345 | |||
| Net assets | $ | 480,826 | ||
The accompanying notes are an integral part of these financial statements.
| Hartford Money Market HLS Fund |
| For the Six-Month Period Ended June 30, 2010 (Unaudited) |
| (000’s Omitted) |
| Investment Income: | ||||
| Dividends | $ | 5 | ||
| Interest | 2,958 | |||
| Total investment income, net | 2,963 | |||
| Expenses: | ||||
| Investment management fees | 5,066 | |||
| Administrative service fees | 1,053 | |||
| Transfer agent fees | 1 | |||
| Custodian fees | 3 | |||
| Accounting services fees | 153 | |||
| Board of Directors' fees | 59 | |||
| Audit fees | 57 | |||
| Other expenses | 507 | |||
| Total expenses (before waivers) | 6,899 | |||
| Expense waivers | (3,936 | ) | ||
| Custodian fee offset | — | |||
| Total waivers | (3,936 | ) | ||
| Total expenses, net | 2,963 | |||
| Net investment income | — | |||
| Net Realized Gain on Investments: | ||||
| Net realized gain on investments | 4 | |||
| Net Realized Gain on Investments | 4 | |||
| Net Gain on Investments | 4 | |||
| Net Increase in Net Assets Resulting from Operations | $ | 4 | ||
The accompanying notes are an integral part of these financial statements.
| Hartford Money Market HLS Fund |
| (000’s Omitted) |
| For the | ||||||||
| Six-Month | For the | |||||||
| Period Ended | Year Ended | |||||||
| June 30, 2010 | December 31, | |||||||
| (Unaudited) | 2009 | |||||||
| Operations: | ||||||||
| Net investment income | $ | — | $ | 861 | ||||
| Net realized gain on investments | 4 | 34 | ||||||
| Payment from affiliate | — | 3,500 | ||||||
| Net increase in net assets resulting from operations | 4 | 4,395 | ||||||
| Distributions to Shareholders: | ||||||||
| From net investment income | ||||||||
| Class IA | — | (2,502 | ) | |||||
| Class IB | — | (316 | ) | |||||
| Total distributions | — | (2,818 | ) | |||||
| Capital Share Transactions: | ||||||||
| Class IA | ||||||||
| Sold | 776,586 | 1,474,789 | ||||||
| Issued on reinvestment of distributions | — | 2,450 | ||||||
| Redeemed | (1,109,566 | ) | (3,085,660 | ) | ||||
| Total capital share transactions | (332,980 | ) | (1,608,421 | ) | ||||
| Class IB | ||||||||
| Sold | 135,127 | 311,880 | ||||||
| Issued on reinvestment of distributions | — | 313 | ||||||
| Redeemed | (202,434 | ) | (538,756 | ) | ||||
| Total capital share transactions | (67,307 | ) | (226,563 | ) | ||||
| Net decrease from capital share transactions | (400,287 | ) | (1,834,984 | ) | ||||
| Net decrease in net assets | (400,283 | ) | (1,833,407 | ) | ||||
| Net Assets: | ||||||||
| Beginning of period | 3,368,255 | 5,201,662 | ||||||
| End of period | $ | 2,967,972 | $ | 3,368,255 | ||||
| Accumulated undistributed (distribution in excess of) net investment income | $ | — | $ | — | ||||
| Shares: | ||||||||
| Class IA | ||||||||
| Sold | 776,619 | 1,474,750 | ||||||
| Issued on reinvestment of distributions | — | 2,450 | ||||||
| Redeemed | (1,109,566 | ) | (3,085,660 | ) | ||||
| Total share activity | (332,947 | ) | (1,608,460 | ) | ||||
| Class IB | ||||||||
| Sold | 135,136 | 311,872 | ||||||
| Issued on reinvestment of distributions | — | 313 | ||||||
| Redeemed | (202,435 | ) | (538,756 | ) | ||||
| Total share activity | (67,299 | ) | (226,571 | ) | ||||
The accompanying notes are an integral part of these financial statements.
| Hartford Money Market HLS Fund |
| June 30, 2010 (Unaudited) |
| (000’s Omitted) |
| 1. | Organization: |
Hartford Money Market HLS Fund (the "Fund") serves as an underlying investment option for certain variable annuity and variable life insurance separate accounts of Hartford Life Insurance Company (“HLIC”) and its affiliates and certain qualified retirement plans. The Fund may also serve as an underlying investment option for certain variable annuity and variable life separate accounts of other insurance companies. Owners of variable annuity contracts and policyholders of variable life insurance contracts may choose the funds permitted in the variable insurance contract prospectus. In addition, participants in certain qualified retirement plans may choose the fund if permitted by their plans.
Hartford Series Fund, Inc. (the “Company”) is an open-end registered management investment company comprised of twenty-nine portfolios, one portfolio of which is included in these financial statements.
The Company is organized under the laws of the State of Maryland and is registered with the Securities and Exchange Commission (“SEC”) under the Investment Company Act of 1940, as amended (“1940 Act”). The Fund is organized as a diversified open-end management investment company.
The Fund is divided into Class IA and Class IB shares. Each class is offered at the per share net asset value (“NAV”) without a sales charge and is subject to the same expenses, except that the Class IB shares are subject to distribution and service fees charged pursuant to a Distribution and Service Plan adopted in accordance with Rule 12b-1 under the 1940 Act.
| 2. | Significant Accounting Policies: |
The following is a summary of significant accounting policies of the Fund, which are in accordance with U.S. Generally Accepted Accounting Principles (“GAAP”).
| a) | Security Transactions and Investment Income – Security transactions are recorded on the trade date (the date the order to buy or sell is executed). Security gains and losses are determined on the basis of identified cost. |
Interest income, including amortization of premium and accretion of discounts, is accrued on a daily basis.
| b) | Security Valuation – The Fund’s investments are valued at amortized cost, which approximates market value. Investments in open-end mutual funds are valued at the respective NAV of each open-end mutual fund as determined as of the close of the New York Stock Exchange (the “Exchange”) (normally 4:00 p.m. Eastern Time, referred to as the “Valuation Time”) on the valuation date. |
Financial instruments for which prices are not available from an independent pricing service may be valued using market quotations obtained from one or more dealers that make markets in securities in accordance with procedures established by the Fund’s Board of Directors.
Various inputs are used in determining the value of the Fund’s investments. These inputs are summarized into three broad hierarchy levels. This hierarchy is based on whether the valuation inputs are observable or unobservable. These levels are:
| · | Level 1 – Quoted prices in active markets for identical securities. Level 1 may include exchange-traded instruments such as domestic equities, some foreign equities, options, futures, mutual funds, exchange-traded funds (ETF’s), and rights and warrants. |
| · | Level 2 – Observable inputs other than Level 1 prices, such as quoted prices for similar securities; quoted prices in markets that are not active; or other inputs that are observable or can be corroborated by observable market data for substantially the full term of the security. Level 2 may include debt securities that are traded less frequently than exchange-traded instruments and which are valued using third party pricing services; foreign |
equities, whose value is determined using a multi-factor regression model with inputs that are observable in the market; and money market instruments, which are carried at amortized cost.
| · | Level 3 – Significant unobservable inputs that are supported by little or no market activity. Level 3 may include financial instruments whose values are determined using broker quotes or require significant management judgment or estimation. These unobservable valuation inputs may include estimates for current yields, maturity/duration, prepayment speed, and broker quotes for comparable securities along with other assumptions relating to credit quality, collateral value, complexity of the security structure, general market conditions and liquidity. This category may include securities where trading has been halted or there are certain restrictions on trading. While these securities are priced using unobservable inputs, the valuation of these securities reflects the best available data and management believes the prices are a reasonable representation of exit price. |
Individual securities within any of the above mentioned asset classes may be assigned a different hierarchical level than those presented above, as individual circumstances dictate.
During the six-month period ended June 30, 2010, the Fund held no Level 3 securities, therefore no reconciliation of Level 3 securities is presented.
Refer to the Investment Valuation Hierarchy Level Summary found following the Schedule of Investments.
| c) | Joint Trading Account – Pursuant to an exemptive order issued by the SEC, the Fund may transfer uninvested cash balances into a joint trading account managed by Hartford Investment Management Company (“Hartford Investment Management”), a wholly-owned indirect subsidiary of The Hartford Financial Services Group, Inc. (“The Hartford”). These balances may be invested in one or more repurchase agreements and/or short-term money market instruments. |
| d) | Repurchase Agreements – A repurchase agreement is an agreement by which a counterparty agrees to sell a security and agrees to repurchase the security sold at a mutually agreed upon time and price. At the time the Fund enters into a repurchase agreement, the value of the underlying collateral security(ies), including accrued interest, will be equal to or exceed the value of the repurchase agreement. To minimize counterparty risk, the securities that serve to collateralize the repurchase agreement are held by the Fund's custodian in book entry or physical form in the custodial account of the Fund or in a third party custodial account. Repurchase agreements are valued at cost plus accrued interest. The Fund, as shown on the Schedule of Investments, had outstanding repurchase agreements as of June 30, 2010. |
| e) | Fund Share Valuation and Dividend Distributions to Shareholders – Orders for the Fund’s shares are executed in accordance with the investment instructions of the contract holders or plan participants. The NAV of the Fund’s shares is determined as of the close of each business day of the Exchange. The NAV is determined separately for each class of the Fund by dividing the Fund’s net assets attributable to that class by the number of outstanding shares of the class. Orders for the purchase of the Fund’s shares received by an insurance company or plan prior to the close of the Exchange on any day on which the Exchange is open for business are priced at the NAV determined as of the close of the Exchange. Orders received by an insurance company or plan after the close of the Exchange, or on a day on which the Exchange and/or the Fund is not open for business, are priced at the next determined NAV. |
The Fund seeks to maintain a stable NAV of $1.00 by declaring a daily dividend from net investment income, including net short-term capital gains and losses, and by valuing its investments using the amortized cost method, which approximates fair value. Normally, dividends are declared daily and distributed monthly.
| f) | Illiquid and Restricted Securities – The Fund is permitted to invest up to 15% of its net assets in illiquid securities. “Illiquid Securities” are those that may not be sold or disposed of in the ordinary course of business within seven days, at approximately the price used to determine the Fund’s NAV. The Fund may not be able to sell illiquid securities or other investments when its sub-adviser considers it desirable to do so or may have to sell such securities or investments at a price that is lower than the price that could be obtained if the securities or investments were more liquid. A sale of illiquid securities or other investments may require more time and may result in higher dealer discounts and other selling expenses than does the sale of those that are liquid. Illiquid securities and investments also may be more difficult to |
| Hartford Money Market HLS Fund |
| Notes to Financial Statements – (continued) |
| June 30, 2010 (Unaudited) |
| (000’s Omitted) |
value, due to the unavailability of reliable market quotations for such securities or investments, and an investment in them may have an adverse impact on the Fund’s NAV. The Fund may also purchase certain restricted securities, commonly known as Rule 144A securities, that can be resold to institutions and which may be determined to be liquid pursuant to policies and guidelines established by the Fund’s Board of Directors. The Fund, as shown on the Schedule of Investments, had illiquid and/or restricted securities as of June 30, 2010.
| g) | Credit Risk – Credit risk depends largely on the perceived financial health of bond issuers. In general, the credit rating is inversely related to the credit risk of the issuer. Higher rated bonds generally are deemed to have less credit risk, while lower or unrated bonds are deemed to have higher risk of default. The share price, yield and total return of a Fund which holds securities with higher credit risk may be more volatile than funds holding bonds with lower credit risk. |
| h) | Use of Estimates – The preparation of financial statements in conformity with U.S. GAAP requires management to make estimates and assumptions that affect the reported amounts of assets and liabilities as of the date of the financial statements and the reported amounts of income and expenses during the period. Operating results in the future could vary from the amounts derived from management’s estimates. |
| i) | Indemnifications – Under the Company’s organizational documents, the Company shall indemnify its officers and directors to the full extent required or permitted under Maryland General Corporation Law and the federal securities laws. In addition, the Company, on behalf of the Fund, may enter into contracts that contain a variety of indemnifications. The Company’s maximum exposure under these arrangements is unknown. However, the Company has not had prior claims or losses pursuant to these contracts and expects the risk of loss to be remote. |
| 3. | Federal Income Taxes: |
| a) | Federal Income Taxes – For federal income tax purposes, the Fund intends to qualify as a regulated investment company (“RIC”) under Subchapter M of the Internal Revenue Code (“IRC”) by distributing substantially all of its taxable net investment income and net realized capital gains to its shareholders and otherwise complying with the requirements of RICs. The Fund has distributed substantially all of its income and capital gains in the prior year and intends to distribute substantially all of its income and gains prior to the next fiscal year end. Accordingly, no provision for federal income or excise taxes has been made in the accompanying financial statements. Distributions from short-term capital gains are treated as ordinary income distributions for federal income tax purposes. |
| b) | Net Investment Income (Loss), Net Realized Gains (Losses) – Net investment income (loss) and net realized gains (losses) may differ for financial statement and tax purposes primarily because of losses deferred due to wash sale adjustments, adjustments related to Passive Foreign Investment Companies (“PFICs”), Real Estate Investment Trusts (“REITs”), RICs, certain derivatives and partnerships. The character of distributions made during the year from net investment income or net realized gains may differ from their ultimate characterization for federal income tax purposes. Also, due to the timing of dividend distributions, the fiscal year in which amounts are distributed may differ from the year that the net investment income (loss) or net realized gains (losses) were recorded by a Fund. |
| c) | Distributions and Components of Distributable Earnings – The tax character of distributions paid by the Fund for the periods indicated is as follows (as adjusted for dividends payable): |
| For the Year Ended | For the Year Ended | |||||||
| December 31, 2009 | December 31, 2008 | |||||||
| Ordinary Income | $ | 2,818 | $ | 76,078 | ||||
As of December 31, 2009, the Fund’s components of distributable earnings (deficit) on a tax basis were as follows:
| Amount | ||||
| Accumulated Capital and Other Losses* | $ | (9,500 | ) | |
| Total Accumulated Deficit | $ | (9,500 | ) | |
* The Fund has capital loss carryforwards that are identified in the Capital Loss Carryforward note that follows.
| d) | Reclassification of Capital Accounts – The Fund may record reclassifications in its capital accounts. These reclassifications have no impact on the total net assets of the Fund. The reclassifications are a result of permanent differences between GAAP and tax accounting for such items as net operating losses that reduce distribution requirements. Adjustments are made to reflect the impact these items have on current and future distributions to shareholders. Therefore, the source of the Fund’s distributions may be shown in the accompanying Statement of Changes in Net Assets as from net investment income, from net realized gains on investments or from capital depending on the type of book and tax differences that exist. For the year ended December 31, 2009, the Fund recorded reclassifications to increase (decrease) the accounts listed below: |
| Amount | ||||
| Accumulated Undistributed Net Investment Income | $ | 2 | ||
| Accumulated Net Realized Loss on Investments | (2 | ) | ||
| e) | Capital Loss Carryforward – At December 31, 2009 (tax-year-end), the Fund had capital loss carryforwards for U.S. federal income tax purposes of approximately: |
| Year of Expiration | Amount | |||
| 2016 | $ | 9,500 | ||
| Total | $ | 9,500 | ||
| f) | Accounting for Uncertainty in Income Taxes – Management has evaluated all open tax years and has determined there is no impact to the Fund’s financial statements related to uncertain tax positions. Generally, tax authorities can examine all tax returns filed for the last three years. |
| 4. | Expenses: |
| a) | Investment Management Agreement – HL Investment Advisors, LLC (“HL Advisors”), an indirect wholly-owned subsidiary of The Hartford, serves as investment manager to the Fund pursuant to an Investment Management Agreement with the Company. As investment manager, HL Advisors has overall investment supervisory responsibility for the Fund. In addition, HL Advisors provides administrative personnel, services, equipment, facilities and office space for proper operation of the Fund. |
HL Advisors has contracted with Hartford Investment Management for the provision of day-to-day investment management services to the Fund in accordance with the Fund’s investment objective and policies. The Fund pays a fee to HL Advisors, a portion of which may be used to compensate Hartford Investment Management.
| b) | Administrative Services Agreement – For the two-month period January 1, 2010 through February 28, 2010, under the Administrative Services Agreement between HLIC and the Company, on behalf of the Fund, HLIC provided administrative services to the Fund and received monthly compensation at the annual rate of 0.20% of the Fund’s average daily net assets. The Fund assumed and paid certain other expenses (including, but not limited to, accounting, custodian, state taxes and Directors’ fees). Effective March 1, 2010, the Investment Management Agreement was amended to include the administrative services for the Fund and the separate administrative services agreement was terminated. |
The schedule below reflects the rates of compensation paid to HL Advisors for investment management services and to HLIC for administrative services rendered from January 1, 2010 through February 28, 2010, and the rates of
| Hartford Money Market HLS Fund |
| Notes to Financial Statements – (continued) |
| June 30, 2010 (Unaudited) |
| (000’s Omitted) |
compensation paid to the HL Advisors for the combined services from March 1, 2010 through June 30, 2010; the rates are accrued daily and paid monthly.
| Average Daily Net Assets | Annual Fee | |||
| On first $5 billion | 0.4000 | % | ||
| On next $5 billion | 0.3800 | % | ||
| Over $10 billion | 0.3700 | % | ||
| c) | Accounting Services Agreement – Pursuant to the Fund Accounting Agreement between HLIC and the Company, on behalf of the Fund, HLIC provides accounting services to the Fund and receives monthly compensation on the Fund’s average net assets. The Fund’s accounting services fees are accrued daily and paid monthly. |
| Average Daily Net Assets | Annual Fee | |||
| All Assets | 0.010 | % | ||
| d) | Operating Expenses – Allocable expenses incurred by the Company are allocated to each Fund and allocated to classes within the Fund in proportion to the average daily net assets of the Fund and each class, except where allocation of certain expenses is more fairly made directly to the Fund or to specific classes within a Fund. |
| e) | Fees Paid Indirectly – The Fund’s custodian bank has agreed to reduce its fees when the Fund maintains cash on deposit in a non-interest-bearing custody account. For the six-month period ended June 30, 2010, the Fund had no fee reductions. |
The ratio of expenses to average net assets in the accompanying financial highlights excludes the reduction in expenses related to fees paid indirectly. Had the fees paid indirectly been included, the annualized expense ratio for the periods listed below would have been as follows:
| Annualized | ||||||||||||||||||||||||
| Six-Month | Year Ended | Year Ended | Year Ended | Year Ended | Year Ended | |||||||||||||||||||
| Period Ended | December 31, | December 31, | December 31, | December 31, | December 31, | |||||||||||||||||||
June 30, 2010 | 2009 | 2008 | 2007 | 2006 | 2005 | |||||||||||||||||||
| Class IA | 0.19 | % | 0.32 | % | 0.42 | % | 0.42 | % | 0.48 | % | 0.49 | % | ||||||||||||
| Class IB | 0.19 | 0.34 | 0.67 | 0.67 | 0.73 | 0.74 | ||||||||||||||||||
| f) | Distribution Plan for Class IB shares – The Company, on behalf of the Fund, has adopted a Distribution Plan pursuant to Rule 12b-1 under the 1940 Act for the Class IB shares. Pursuant to the Distribution Plan, the Fund is authorized to compensate the Distributor, Hartford Securities Distribution Company, Inc. (a wholly owned, ultimate subsidiary of The Hartford), from assets attributable to the Class IB shares for services rendered and expenses borne in connection with activities primarily intended to result in the sale of the Class IB shares, subject to the Fund Board’s review and approval. |
The Distribution Plan provides that the Fund may pay annually up to 0.25% of the average daily net assets of the Fund attributable to its Class IB shares for activities primarily intended to result in the sale of Class IB shares. The Board has the authority to suspend or reduce these payments at any point in time. Under the terms of the Distribution Plan and the principal underwriting agreement, the Fund is authorized to make payments monthly to the Distributor which may be used to pay or compensate entities providing distribution and shareholder servicing with respect to the Class IB shares for such entities’ fees or expenses incurred or paid in that regard. These fees are accrued daily and paid monthly.
At a meeting held on February 4, 2009, the Board of Directors approved the temporary reduction of payment of distribution and service fees under the Fund’s 12b-1 Plan of Distribution to zero for Class IB for a period of six months, effective March 1, 2009. Effective September 1, 2009, the Board of Directors approved a six month extension of the reduction of distribution and service fees under the Fund’s 12b-1 plan. Effective March 1, 2010, the Board of Directors approved a six month extension of the reduction of distribution and service fees under the Fund’s 12b-1 plan. The Fund’s actions will result in a corresponding temporary reduction of 12b-1 payments of amounts paid to financial intermediaries
by the Fund’s distributor to zero for Class IB during this time period. The Board of Directors’ action can be changed at any time. The Hartford may be required to pay, out of its own resources, the equivalent of the 12b-1 fees to financial intermediaries notwithstanding the reduction of 12b-1 fees.
| g) | Other Related Party Transactions – Certain officers of the Fund are directors and/or officers of HL Advisors, and/or The Hartford or its subsidiaries. For the six-month period ended June 30, 2010, a portion of the Fund’s chief compliance officer’s salary was paid by all the investment companies in the Hartford fund complex. The portion allocated to the Fund was in the amount of $7. Hartford Investor Services Company, LLC ("HISC"), a wholly owned subsidiary of The Hartford, provides transfer agent services to the Fund. The amount HISC was compensated for providing such services can be found on the Statement of Operations. These fees are accrued daily and paid monthly. |
On September 25, 2009, due to the realized losses incurred by the Fund, HL Advisers paid $3,500 to the Fund to provide support to the Fund’s $1.00 NAV. The payment had no impact on the Fund’s total return. This amount is an increase from payment from affiliate on the Statement of Changes in Net Assets.
| 5. | Investment Transactions: |
For the six-month period ended June 30, 2010, the costs of purchases and sales of securities (including U.S. Government Obligations) for the Fund were $19,764,325 and $20,178,778, respectively.
| Hartford Money Market HLS Fund |
| - Selected Per-Share Date (A) - |
| Net Asset | Net Realized | Net Increase | ||||||||||||||||||||||||||||||||||||||||||
| Value at | Payments | and Unrealized | Total from | Dividends from | Distributions | (Decrease) in | Net Asset | |||||||||||||||||||||||||||||||||||||
| Beginning of | Net Investment | from (to) | Gain (Loss) on | Investment | Net Investment | from Realized | Distributions | Total | Net Asset | Value at End | ||||||||||||||||||||||||||||||||||
Class | Period | Income (Loss) | Affiliate | Investments | Operations | Income | Capital Gains | from Capital | Distributions | Value | of Period | |||||||||||||||||||||||||||||||||
| For the Six-Month Period Ended June 30, 2010 (Unaudited) | ||||||||||||||||||||||||||||||||||||||||||||
| IA | $ | 1.00 | $ | – | $ | – | $ | – | $ | – | $ | – | $ | – | $ | – | $ | – | $ | – | $ | 1.00 | ||||||||||||||||||||||
| IB | 1.00 | – | – | – | – | – | – | – | – | – | 1.00 | |||||||||||||||||||||||||||||||||
| For the Year Ended December 31, 2009 | ||||||||||||||||||||||||||||||||||||||||||||
| IA | 1.00 | – | – | – | – | – | – | – | – | – | 1.00 | |||||||||||||||||||||||||||||||||
| IB | 1.00 | – | – | – | – | – | – | – | – | – | 1.00 | |||||||||||||||||||||||||||||||||
| For the Year Ended December 31, 2008 | ||||||||||||||||||||||||||||||||||||||||||||
| IA | 1.00 | 0.02 | – | – | 0.02 | (0.02 | ) | – | – | (0.02 | ) | – | 1.00 | |||||||||||||||||||||||||||||||
| IB | 1.00 | 0.02 | – | – | 0.02 | (0.02 | ) | – | – | (0.02 | ) | – | 1.00 | |||||||||||||||||||||||||||||||
| For the Year Ended December 31, 2007 | ||||||||||||||||||||||||||||||||||||||||||||
| IA | 1.00 | 0.05 | – | – | 0.05 | (0.05 | ) | – | – | (0.05 | ) | – | 1.00 | |||||||||||||||||||||||||||||||
| IB | 1.00 | 0.05 | – | – | 0.05 | (0.05 | ) | – | – | (0.05 | ) | – | 1.00 | |||||||||||||||||||||||||||||||
| For the Year Ended December 31, 2006 | ||||||||||||||||||||||||||||||||||||||||||||
| IA | 1.00 | 0.05 | – | – | 0.05 | (0.05 | ) | – | – | (0.05 | ) | – | 1.00 | |||||||||||||||||||||||||||||||
| IB | 1.00 | 0.04 | – | – | 0.04 | (0.04 | ) | – | – | (0.04 | ) | – | 1.00 | |||||||||||||||||||||||||||||||
| For the Year Ended December 31, 2005 | ||||||||||||||||||||||||||||||||||||||||||||
| IA | 1.00 | 0.03 | – | – | 0.03 | (0.03 | ) | – | – | (0.03 | ) | – | 1.00 | |||||||||||||||||||||||||||||||
| IB | 1.00 | 0.03 | – | – | 0.03 | (0.03 | ) | – | – | (0.03 | ) | – | 1.00 | |||||||||||||||||||||||||||||||
| (A) | Information presented relates to a share outstanding throughout the indicated period. |
| (B) | The figures do not include sales charges or other fees which may be applied at the variable life insurance, variable annuity or qualified retirement plan product level. Any such additional sales charges or other fees would lower the Fund's performance. |
| (C) | Ratios do not reflect reductions for fees paid indirectly. Please see Fees Paid Indirectly in the Notes to Financial Statements. |
| (D) | Portfolio turnover rate is calculated on the basis of the Fund as a whole without distinguishing between the classes of shares issued. |
| (E) | Not annualized. |
| (F) | Annualized. |
| - Ratios and Supplemental Data - |
Ratio of Expenses to Average Net | Ratio of Expenses to Average Net | Ratio of Net Investment Income to | Portfolio Turnover | |||||||||||||||||||
| Total Return(B) | Net Assets at End of Period | Assets Before Waivers(C) | Assets After Waivers(C) | Average Net Assets | Rate(D) | |||||||||||||||||
| – | %(E) | $ | 2,487,146 | 0.45 | %(F) | 0.19 | %(F) | – | %(F) | N/A | ||||||||||||
| – | (E) | 480,826 | 0.45 | (F) | 0.19 | (F) | – | (F) | – | |||||||||||||
| 0.06 | 2,820,121 | 0.48 | 0.32 | 0.02 | N/A | |||||||||||||||||
| 0.05 | 548,134 | 0.53 | 0.34 | 0.00 | – | |||||||||||||||||
| 2.15 | 4,427,230 | 0.47 | 0.42 | 2.01 | N/A | |||||||||||||||||
| 1.89 | 774,432 | 0.72 | 0.67 | 1.80 | – | |||||||||||||||||
| 4.95 | 2,224,124 | 0.47 | 0.42 | 4.83 | N/A | |||||||||||||||||
| 4.69 | 452,976 | 0.72 | 0.67 | 4.58 | – | |||||||||||||||||
| 4.69 | 1,558,433 | 0.48 | 0.48 | 4.63 | N/A | |||||||||||||||||
| 4.43 | 319,926 | 0.73 | 0.73 | 4.38 | – | |||||||||||||||||
| 2.84 | 1,353,836 | 0.49 | 0.49 | 2.79 | N/A | |||||||||||||||||
| 2.58 | 264,040 | 0.75 | 0.75 | 2.54 | – | |||||||||||||||||
| Hartford Money Market HLS Fund |
The Board of Directors appoints officers who are responsible for the day-to-day operations of the Fund and who execute policies formulated by the Directors. Each director serves until his or her death, resignation, or retirement or until the next annual meeting of shareholders is held or until his or her successor is elected and qualifies.
Directors and officers who are employed by or who have a financial interest in The Hartford are considered “interested” persons of the Fund pursuant to the Investment Company Act of 1940, as amended. Each officer and two of the Company’s directors, as noted in the chart below, are “interested” persons of the Fund. Each director serves as a director for The Hartford Mutual Funds, Inc., The Hartford Mutual Funds II, Inc., The Hartford Income Shares Fund, Inc., Hartford Series Fund, Inc., and Hartford HLS Series Fund II, Inc., which, as of June 30, 2010, collectively consist of 88 funds. Correspondence may be sent to directors and officers c/o Hartford Mutual Funds, P.O. Box 2999, Hartford, Connecticut 06104-2999, except that correspondence to Ms. Fagely may be sent to 500 Bielenberg Drive, Woodbury, Minnesota 55125.
The table below sets forth, for each director and officer, his or her name, year of birth, current position with the Company and date first elected or appointed to Hartford Series Fund, Inc. (“HSF”), and Hartford HLS Series Fund II, Inc. (“HSF2”), principal occupation, and, for directors, other directorships held. The Fund’s statement of additional information contains further information on the directors and is available free of charge by calling 1-800-862-6668 or writing to Hartford HLS Funds, c/o Individual Annuity Services, P.O. Box 5085, Hartford, CT 06102-5085.
Information on the aggregate remuneration paid to the directors of the Company can be found in the Statement of Operations herein. The Fund pays to The Hartford a portion of the chief compliance officer’s compensation, but does not pay salaries or compensation to any of their other officers or directors who are employed by The Hartford.
Non-Interested Directors
Lynn S. Birdsong (1946) Director since 2003, Co-Chairman of the Investment Committee
Mr. Birdsong is a private investor. Since 2003, Mr. Birdsong has been an independent director of The Japan Fund and has served as a Director of the Sovereign High Yield Fund since April 2010. From 2003 to March 2005, Mr. Birdsong was an independent director of the Atlantic Whitehall Funds. From 1979 to 2002, Mr. Birdsong was a managing director of Zurich Scudder Investments, an investment management firm. During his employment with Scudder, Mr. Birdsong was an interested director of The Japan Fund. Since 1981, Mr. Birdsong has been a partner in Birdsong Company, an advertising specialty firm.
Robert M. Gavin, Jr. (1940) Director since 2002 (HSF) and 1986 (HSF2), Chairman of the Board since 2004
Dr. Gavin is an educational consultant. Prior to September 1, 2001, he was President of Cranbrook Education Community and prior to July 1996, he was President of Macalester College, St. Paul, Minnesota.
Duane E. Hill (1945) Director since 2001 (HSF) and 2002 (HSF2), Chairman of the Nominating Committee
Mr. Hill is Partner of TSG Ventures L.P., a private equity investment company. Mr. Hill is a former partner of TSG Capital Group, a private equity investment firm that served as sponsor and lead investor in leveraged buyouts of middle market companies.
Sandra S. Jaffee (1941) Director since 2005
Ms. Jaffee served as Chairman (2008 to 2009) and Chief Executive Officer of Fortent (formerly Searchspace Group), a leading provider of compliance/regulatory technology to financial institutions from August 2005 to August 2009. From August 2004 to August 2005, Ms. Jaffee served as an Entrepreneur in Residence with Warburg Pincus, a private equity firm. From September 1995 to July 2004, Ms. Jaffee served as Executive Vice President at Citigroup, where she was President and Chief Executive Officer of Citibank’s Global Securities Services (1995 to 2003).
William P. Johnston (1944) Director since 2005, Chairman of the Compliance Committee
In June 2006, Mr. Johnston was appointed as Senior Advisor to The Carlyle Group, a global private equity investment firm. In July 2006, Mr. Johnston was elected to the Board of Directors of MultiPlan, Inc. In August 2007, Mr. Johnston was elected to the Board of Directors of LifeCare Holdings, Inc. In February 2008, Mr. Johnston was elected to the Board of Directors of HCR-ManorCare, Inc. In May 2006, Mr. Johnston was elected to the Supervisory Board of Fresenius Medical Care AG & Co. KGaA, after its acquisition of Renal Care Group, Inc. in March 2006. Mr. Johnston joined Renal Care Group in November 2002 as a member of the Board of Directors and served as Chairman of the Board from March 2003 through March 2006. From September 1987 to December 2002, Mr. Johnston was with Equitable Securities Corporation (and its successors, SunTrust Equitable Securities and SunTrust Robinson Humphrey) serving in various investment banking and managerial positions, including Managing Director and Head of Investment Banking, Chief Executive Officer and Vice Chairman.
Phillip O. Peterson (1944) Director since 2002 (HSF) and 2000 (HSF2), Chairman of the Audit Committee
Mr. Peterson is a mutual fund industry consultant. He was a partner of KPMG LLP (an accounting firm) until July 1999. Mr. Peterson joined William Blair Funds in February 2007 as a member of the Board of Trustees. From January 2004 to April 2005, Mr. Peterson served as Independent President of the Strong Mutual Funds.
Lemma W. Senbet (1946) Director since 2005
Dr. Senbet is the William E. Mayer Chair Professor of Finance and Director, Center for Financial Policy, at the University of Maryland, Robert H. Smith School of Business. He was chair of the Finance Department during 1998 to 2006. Previously he was a chaired professor of finance at the University of Wisconsin-Madison. Also, he was director of the Fortis Funds from March 2000 to July 2002. Dr. Senbet served the finance profession in various capacities, including as director of the American Finance Association and President of the Western Finance Association. In 2006, Dr. Senbet was inducted Fellow of Financial Management Association International for his career-long distinguished scholarship and professional service.
Interested Directors and Officers
Lowndes A. Smith (1939) Director since 1996 (HSF) and 2002 (HSF2), Co-Chairman of the Investment Committee
Mr. Smith served as Vice Chairman of The Hartford from February 1997 to January 2002, as President and Chief Executive Officer of Hartford Life, Inc. from February 1997 to January 2002, and as President and Chief Operating Officer of The Hartford Life Insurance Companies from January 1989 to January 2002. Mr. Smith serves as a Director of White Mountains Insurance Group, Ltd., One Beacon Insurance, Symetra Financial and as a Managing Director of Whittington Gray Associates.
John C. Walters 1, 2 (1962) Director since 2008
Mr. Walters currently serves as President, Chief Executive Officer and Director for Hartford Life, Inc. (“HL, Inc.”). Mr. Walters also serves as President, Chairman of the Board, Chief Executive Officer and Director for Hartford Life Insurance Company (“Hartford Life”), and as Executive Vice President of The Hartford. In addition, Mr. Walters is a Manager of HL Investment Advisors, LLC (“HL Advisors”). Mr. Walters previously served as President of the U.S. Wealth Management Division of HL, Inc. (2006-2007) and as Co-Chief Operating Officer of Hartford Life (2007-2008).
1 Mr. Walters previously served as President and Chief Executive Officer (2007 to 2009).
2 Effective July 31, 2010, Mr. Walters retired from The Hartford. Mr. Walters resigned his position as a Director of the Fund effective July 30, 2010.
Other Officers
Robert M. Arena, Jr. (1968) President and Chief Executive Officer since 2009 (served as Vice President of the Fund (2006-2009))
Mr. Arena serves as Executive Vice President of Hartford Life. Additionally, Mr. Arena is Senior Vice President and Director of Hartford Administrative Services Company, (“HASCO”), President, Chief Executive Officer and Manager of Hartford Investment Financial Services, LLC (“HIFSCO”) and President, Chief Executive Officer and Manager of HL Advisors. Mr. Arena joined The Hartford in 2004.
Tamara L. Fagely (1958) Vice President, Treasurer and Controller since 2002 (HSF) 1993 (HSF2)
Ms. Fagely has been a Vice President of HASCO since 1998 and Chief Financial Officer since 2006. Currently Ms. Fagely is a Vice President of Hartford Life. She served as Assistant Vice President of Hartford Life from December 2001 through March 2005. In addition, Ms. Fagely is Controller and Chief Financial Officer of HIFSCO.
Brian Ferrell (1962) AML Compliance Officer since 2008
Mr. Ferrell has served as Assistant Vice President and AML Compliance Officer for The Hartford since 2006, and as AML Compliance Officer for HASCO and Hartford Investor Services Company, LLC (“HISC”) since 2008. Prior to joining The Hartford in 2006, Mr. Ferrell held various positions at the U.S. Department of the Treasury (the “Treasury”) from 2001 to 2006, where he served as Chief Counsel for the Treasury’s Financial Crimes Enforcement Network from 2005-2006.
Dr. Robert J. Froehlich (1953) Senior Managing Director since 2009
Dr. Froehlich joined The Hartford as Senior Managing Director in September 2009. Prior to joining The Hartford, Dr. Froehlich served as Vice Chairman of Deutsche Asset Management from 1997-2009.
| Hartford Money Market HLS Fund |
| Directors and Officers (Unaudited) – (continued) |
Thomas D. Jones, III (1965) Vice President and Chief Compliance Officer since 2006
Mr. Jones serves as Chief Compliance Officer for the Hartford Mutual Funds and Vice President and Director of Securities Compliance for The Hartford. Mr. Jones joined The Hartford in 2006 from SEI Investments, where he served as Chief Compliance Officer for its mutual funds and investment advisers. Prior to joining SEI, Mr. Jones was First Vice President and Compliance Director for Merrill Lynch Investment Managers (Americas) (“MLIM”), where he worked from 1992-2004.
Edward P. Macdonald (1967) Vice President, Secretary and Chief Legal Officer since 2005
Mr. Macdonald serves as Assistant Vice President of Hartford Life and Chief Legal Officer and Vice President of HIFSCO. He also serves as Vice President and Secretary of HASCO, and Chief Legal Officer, Secretary and Vice President of HL Advisors. Mr. Macdonald joined The Hartford in 2005.
Vernon J. Meyer (1964) Vice President since 2006
Mr. Meyer serves as Senior Vice President of Hartford Life. He also serves as Senior Vice President of HIFSCO and HL Advisors. Mr. Meyer joined The Hartford in 2004.
D. Keith Sloane (1960) Vice President since 2009
Mr. Sloane is a Senior Vice President of Hartford Life. Additionally, Mr. Sloane currently serves as Senior Vice President of HIFSCO, HL Advisors, and HASCO. Prior to joining The Hartford in 2007, Mr. Sloane was Director of product marketing and led the mutual fund business for Wachovia Securities (“Wachovia”) in their investment products group. Mr. Sloane joined Wachovia in 1995.
Jane Wolak (1961) Vice President since 2009
Ms. Wolak currently serves as Vice President of Hartford Life. Ms. Wolak joined Hartford Life as Vice President, Retail Product Services in May 2007. She is also Vice President of HASCO. Previously, Ms. Wolak was with Sun Life Financial where she held the position of Vice President, Service Center Operations from 2001-2007.
A description of the policies and procedures that the Fund uses to determine how to vote proxies relating to portfolio securities and a record of how the Fund voted any proxies for the twelve-month period ended June 30, 2010 is available (1) without charge, upon request, by calling 800-862-6668 and (2) on the Securities and Exchange Commission’s website at http://www.sec.gov.
The Fund files a complete schedule of portfolio holdings with the Commission for the first and third quarters of each fiscal year on Form N-Q. The Fund’s Forms are available (1) without charge, upon request, by calling 800-862-6668 and (2) on the Securities and Exchange Commission’s website at http://www.sec.gov. The Form N-Q may be reviewed and copied at the Commission’s Public Reference Room in Washington, DC. Information on the operation of the Public Reference Room may be obtained by calling 1-800-SEC-0330.
| Hartford Money Market HLS Fund |
The following proposals were addressed and approved at a Special Meeting of Shareholders held on February 12, 2010.
Proposal to approve amendments to the Investment Management Agreement between the Fund and HL Investment Advisors, the purpose of which are to combine the administrative services for the Fund with the management services for the Fund under a single agreement.
| Fund | For | Against | Abstain | |||||||||
| Hartford Money Market HLS Fund | 2,975,291,639.238 | 121,286,076.715 | 136,617,817.837 | |||||||||
Proposal to elect Lemma Senbet and John Walters, each currently a Director, as Directors of Hartford Series Fund Inc.
Lemma W. Senbet
| Funds | For | Withheld | ||||||
| Hartford Series Fund, Inc. | 5,079,578,022.902 | 241,839,974.106 | ||||||
John C. Walters
| Funds | For | Withheld | ||||||
| Hartford Series Fund, Inc. | 5,081,138,302.186 | 240,279,694.822 | ||||||
| Hartford Money Market HLS Fund |
Your Fund's Expenses
As a shareholder of the Fund, you incur two types of costs: (1) transaction costs, including sales charges (loads) on purchase payments and contingent deferred sales charges (CDSC) (2) ongoing costs including management fees; distribution fees; and other fund expenses. This example is intended to help you understand your ongoing costs (in dollars) of investing in the Fund and to compare these costs with the ongoing costs of investing in other mutual funds. The example is based on an investment of $1,000 invested at the beginning of the period and held for the period of December 31, 2009 through June 30, 2010.
Actual Expenses
The first set of columns of the table below provides information about actual account values and actual expenses. You may use the information in this column, together with the amount you invested, to estimate the expenses that you paid over the period. Simply divide your account value by $1,000 (for example, an $8,600 account value divided by $1,000 = 8.6), then multiply the result by the number in the line under the heading entitled "Expenses Paid During Period" to estimate the expenses you paid on your account during this period.
Hypothetical Example for Comparison Purposes
The second set of columns of the table below provides information about hypothetical account values and hypothetical expenses based on the Fund's actual expense ratio and an assumed rate of return of 5% per year before expenses, which is not the Fund's actual return. The hypothetical account values and expenses may not be used to estimate the actual ending account balance or expenses you paid for the period. You may use this information to compare the ongoing costs of investing in the Fund and other funds. To do so, compare this 5% hypothetical example with the 5% hypothetical examples that appear in the shareholder reports of the other funds.
Please note that the expenses shown in the table are meant to highlight your ongoing costs only and do not reflect any transactional costs, such as sales charges (loads) and CDSC. Therefore, the second set of columns of the table is useful in comparing ongoing costs only, and will not help you determine the relative total costs of owning different funds. In addition, if these transactional costs were included, your costs would be higher. Expenses are equal to the Fund's annualized expense ratios multiplied by average account value over the period, multiplied by 181/365 (to reflect the one-half year period).
| Actual return | Hypothetical (5% return before expenses) | |||||||||||||||||||||||||||||||||||
| Expenses paid | Expenses paid | Days in | ||||||||||||||||||||||||||||||||||
| during the period | during the period | the | Days | |||||||||||||||||||||||||||||||||
| Beginning | Ending | December 31, 2009 | Beginning | Ending | December 31, 2009 | Annualized | current | in the | ||||||||||||||||||||||||||||
| Account Value | Account Value | through | Account Value | Account Value | through | expense | 1/2 | full | ||||||||||||||||||||||||||||
December 31, 2009 | June 30, 2010 | June 30, 2010 | December 31, 2009 | June 30, 2010 | June 30, 2010 | ratio | year | year | ||||||||||||||||||||||||||||
| Class IA | $ | 1,000.00 | $ | 1,000.00 | $ | 0.94 | $ | 1,000.00 | $ | 1,023.85 | $ | 0.95 | 0.19 | % | 181 | 365 | ||||||||||||||||||||
| Class IB | $ | 1,000.00 | $ | 1,000.00 | $ | 0.94 | $ | 1,000.00 | $ | 1,023.85 | $ | 0.95 | 0.19 | % | 181 | 365 | ||||||||||||||||||||
| Hartford Money Market HLS Fund |
The Board approved the annual continuation of the Investment Management Agreement (the “Agreement”) between Hartford Series Fund, Inc. (“HSF”) and HL Investment Advisors, LLC (“HL Advisors”) with respect to the Fund at its meeting on August 4-5, 2009. The Board’s considerations in approving the renewal of the Agreement are disclosed in the December 31, 2009 Annual Report for HSF.
At the November 4-5, 2009 meeting, the Board considered and approved amendments to the Agreement to include administrative services, which had been provided pursuant to a separate agreement, and investment management services under one agreement. The Board, including all of the Independent Directors, approved the amendments to the Agreement with respect to the Fund.
In approving the amendments, in addition to the information presented at the August meeting in connection with the annual review of the Agreement and the additional information provided throughout the year, the Board also considered the fact that the amendments did not result in an overall increase in fees to shareholders. The Board took note of the fact that the management of HL Advisors believes that the proposal to combine the administrative services with the investment management services under a single agreement will produce streamlined fee disclosure, resulting in greater transparency and clarity in the Fund’s prospectuses and financial reports. The Board further noted management's belief that the change would result in consistency across all of the Hartford Funds in the complex in that the funds of HSF are the only funds in the complex (other than the R share classes of the Hartford retail funds) that are subject to a separate administrative services fee. Finally, the Board noted management's view that the proposed changes to the Agreement should also serve to simplify the Board's annual consideration of the investment management arrangements for the Fund in that the investment management and administrative fees would be presented as a single fee for fee comparison purposes, which should facilitate the Board's analysis.
The shareholders of the Fund approved the amendments at a Special Meeting of Shareholders held on February 12, 2010. The amendments were effective as of March 1, 2010.
23
The Hartford
P.O. Box 5085
Hartford, CT 06102–5085
Hartford Series Fund, Inc. is underwritten and distributed by Hartford Securities Distribution Company, Inc.
“The Hartford” is The Hartford Financial Services Group, Inc. and its subsidiaries.
Hartford Series Fund, Inc. inception dates range from 1977 to date. Hartford Series Fund, Inc. is not a subsidiary of The Hartford but is underwritten, distributed by and advised by subsidiaries of The Hartford. Investments in Hartford Series Fund, Inc. are not guaranteed by The Hartford or any other entity.
This material is authorized for distribution only when preceded or accompanied by a current prospectus. The prospectus contains detailed information about the Funds, including investment objectives, risks and charges and expenses. Please read it carefully before you invest or send money.
HLSSAR-MM10 Printed in U.S.A ©2010 The Hartford, Hartford, CT 06115 |
| Hartford Small Company HLS Fund |
|
Hartford Small Company HLS Fund
| Manager Discussions (Unaudited) | 2 | |
| Financial Statements | ||
| 4 | ||
| 11 | ||
| 12 | ||
| 13 | ||
| 14 | ||
| 15 | ||
| 28 | ||
| 30 | ||
| 32 | ||
| 32 | ||
| 33 | ||
| 34 | ||
| 35 |
This report is prepared for the general information of contract owners and qualified retirement plan participants. It is not an offer of contracts or of qualified retirement plans. It should not be used in connection with any offer, except in conjunction with the appropriate prospectus which contains all pertinent information including the applicable sales, administrative and other charges.
The views expressed in the Fund’s Manager Discussion under ‘‘Why did the Fund perform this way?’’ and ‘‘What is the outlook?’’ are views of the Fund’s subadvisers and portfolio management team through the end of the period and is subject to change based on market and other conditions.
Hartford Small Company HLS Fund inception 08/09/1996
(subadvised by: Wellington Management Company, LLP Hartford Investment Management Company)
Investment objective – Seeks growth of capital.
Performance Overview(1) 6/30/00 - 6/30/10
Growth of $10,000 investment

Russell 2000 Growth Index is an unmanaged index of those Russell 2000 Index growth companies with higher price-to-book ratios and higher forecasted growth values.
You cannot invest directly in an index.
The chart represents a hypothetical investment in the Fund. Performance data represents past performance and current performance could be higher or lower.
Average Annual Returns (as of 6/30/10)
| 6 | 1 | 5 | 10 | |
| Month† | Year | Year | Year | |
| Small Company IA | -3.46% | 18.61% | 2.39% | 0.20% |
| Small Company IB | -3.57% | 18.33% | 2.16% | -0.03% |
| Russell 2000 Growth Index | -2.31% | 17.96% | 1.14% | -1.73% |
| † | Not Annualized |
PAST PERFORMANCE IS NOT INDICATIVE OF FUTURE RESULTS.
| (1) | Growth of a $10,000 investment in Class IB shares will vary from the results seen on this page due to differences in the expense charged to this share class. |
Performance information may reflect historical or current expense waivers from the investment adviser, without which performance would have been lower. For information on current expense waivers/reimbursements, please see the prospectus.
The value of the contract will fluctuate so that when redeemed, it may be worth more or less than the original investment. The chart and table do not reflect the deduction of taxes that a shareholder would pay on portfolio distributions or the redemption of portfolio shares. The figures do not include sales charges or other fees which may be applied at the variable life insurance, variable annuity or qualified retirement plan product level. Any such additional sales charges or other fees would lower the Fund’s performance.
| Portfolio Managers | ||||
| Wellington Management Company, LLP | Hartford Investment Management Company | |||
| Steven C. Angeli, CFA | Stephen Mortimer | Mario E. Abularach, CFA, CMT | Hugh Whelan, CFA | Kurt Cubbage, CFA |
| Senior Vice President, Partner | Senior Vice President | Vice President | Managing Director | Vice President |
How did the Fund perform?
The Class IA shares of the Hartford Small Company HLS Fund returned -3.46% for the six-month period ended June 30, 2010, underperforming its benchmark, the Russell 2000 Growth Index which returned -2.31% for the same period. The Fund also underperformed the -1.87% return of the average fund in the Lipper Small Cap Growth Funds VP-UF peer group, a group of funds with investment strategies similar to those of the Fund.
Why did the Fund perform this way?
The six-month period ended June 30, 2010 was a volatile period. Through late April, U.S. equities rose as investor confidence grew amid better-than-expected corporate earnings, accommodative monetary policy, and improving economic conditions. From late April until the end of the period, risk aversion rose and equities fell on concerns that the global economy could slip back into a recession. Sovereign debt, solvency issues in the Euro-zone, and slowing economic growth in the U.S. and around the globe pressured markets as the sustainability of corporate earnings growth came into question.
In this environment, small cap, mid cap, and large cap stocks all registered negative returns over the six-month period, as measured by the Russell 2000 (-2%), S&P MidCap 400 (-1%) and S&P 500 (-7%) indices, respectively. Eight of ten sectors within the Russell 2000 Growth Index declined during the period. Energy (-14%), Telecommunication Services (-13%), and Utilities (-7%) sectors declined the most while Consumer Discretionary (+3%), Consumer Staples (+2%), and Financials (-2%) performed the best.
The Fund underperformed its benchmark during the period due to weak stock selection primarily in Consumer Discretionary, Financials, and Consumer Staples. This more than offset very strong selection in Health Care. Sector allocation, which is the residual result of bottom-up (i.e. stock by stock fundamental research) stock selection, was favorable during the period. In
particular, an overweight (i.e. the Fund’s sector position was greater than the benchmark position) position in Consumer Discretionary and an underweight (i.e. the Fund’s sector position was less than the benchmark position) position in Energy were additive to relative (i.e. performance of the Fund as measured against the benchmark) performance. A modest cash position helped relative returns in a declining equity market.
Stocks that detracted the most from relative returns during the period were NutriSystem (Consumer Discretionary), Sykes Enterprises (Industrials), and Affymax (Health Care). Shares of NutriSystem, a provider of weight loss products and services, fell as the company's expansion in the retail channel fell short of expectations, negatively impacting growth prospects. We exited the position in the first half of the period. Leading customer contact center service provider Sykes Enterprises saw share price weakness due to lowered earnings guidance tied to cyclical and merger-related integration pressures. Shares of biotechnology company Affymax sold off sharply in June as the company announced disappointing phase III data for Hematide, a treatment for anemia associated with chronic renal failure, which raised concerns regarding potential regulatory approval and/or market acceptance.
Top contributors to relative performance during the period included SXC Health Solutions (Health Care), OSI Pharmaceuticals (Health Care), and Parexel International (Health Care). Pharmacy benefit management (PBM) and health care information technology (HCIT) services provider SXC Health Solutions announced earnings and guidance that exceeded expectations. The firm added new clients, converted more HCIT clients to its PBM platform, and expanded mail order volumes during the period. Shares of biotechnology company OSI Pharmaceuticals surged in March when Japan-based Astellas Pharmaceuticals offered to acquire the company. Shares of Parexel International, a biopharmaceutical services company, rose after the company raised guidance driven by revenue and gross margin upside through its Clinical Research Services and Perceptive business units.
What is the outlook?
During the period, the market reflected increased concerns that sovereign debt issues, liquidity pressures, and fiscal austerity could derail a nascent recovery, feeding concerns of a double-dip recession. Meanwhile, the April 2010 sinking of the Deepwater Horizon oil rig in the Gulf of Mexico and the prospect of ongoing cleanup and compensation costs increased investor skittishness. Uncertainty around government regulatory reform also added to uncertainty in the market as these changes have the potential to impact future growth prospects for certain sectors. Therefore, while we look for continued economic growth, these factors and other mixed macro economic data points caused us to adopt a slightly more moderate view of the pace of economic recovery. As a result, the Fund was more defensively positioned at the end of the period than at the start.
The Fund continues to focus on stocks of companies that we see as having unique business models or special market opportunities that should allow them to deliver superior growth regardless of the pace of economic recovery. The annual Russell 2000 Growth Index re-balance in June impacted our relative weightings in certain sectors. Our bottom-up, fundamental research-driven stock-by-stock investment decisions combined with the Index rebalance led to overweights in Health Care, Information Technology, and Industrials relative to the Russell 2000 Growth Index at the end of the period. The Fund ended the period most underweight Financials, Materials, and Telecommunication Services.
Effective July 21, 2010, Wellington Management Company, LLP (“Wellington Management”) became the sole subadviser for the Fund. Effective the same date, Hartford Investment Management Company (“Hartford Investment Management”) no longer served as a sub-adviser to the Fund. The portion of the Fund’s portfolio previously managed by Hartford Investment Management is now managed by Wellington Management.
Diversification by Industry
as of June 30, 2010
| Percentage of | ||||
| Industry (Sector) | Net Assets | |||
Automobiles & Components (Consumer Discretionary) | 0.8 | % | ||
| Banks (Financials) | 0.2 | |||
| Capital Goods (Industrials) | 8.9 | |||
| Commercial & Professional Services (Industrials) | 3.8 | |||
Consumer Durables & Apparel (Consumer Discretionary) | 6.2 | |||
| Consumer Services (Consumer Discretionary) | 5.5 | |||
| Diversified Financials (Financials) | 1.6 | |||
| Energy (Energy) | 4.0 | |||
| Food & Staples Retailing (Consumer Staples) | 0.3 | |||
| Food, Beverage & Tobacco (Consumer Staples) | 2.4 | |||
| Health Care Equipment & Services (Health Care) | 11.9 | |||
| Household & Personal Products (Consumer Staples) | 1.1 | |||
| Insurance (Financials) | 0.8 | |||
| Materials (Materials) | 3.0 | |||
| Media (Consumer Discretionary) | 1.1 | |||
| Other Investment Pools and Funds (Financials) | 0.4 | |||
Pharmaceuticals, Biotechnology & Life Sciences (Health Care) | 9.2 | |||
| Real Estate (Financials) | 0.3 | |||
| Retailing (Consumer Discretionary) | 4.6 | |||
Semiconductors & Semiconductor Equipment (Information Technology) | 4.3 | |||
| Software & Services (Information Technology) | 11.7 | |||
Technology Hardware & Equipment (Information Technology) | 9.0 | |||
| Telecommunication Services (Services) | 1.5 | |||
| Transportation (Industrials) | 3.8 | |||
| Utilities (Utilities) | 0.2 | |||
| Short-Term Investments | 3.1 | |||
| Other Assets and Liabilities | 0.3 | |||
| Total | 100.0 | % | ||
| Hartford Small Company HLS Fund |
| June 30, 2010 (Unaudited) |
| (000’s Omitted) |
| Shares or Principal Amount | Market Value ╪ | |||||
| COMMON STOCKS - 96.2% | ||||||
| Automobiles & Components - 0.8% | ||||||
| 105 | Cooper Tire & Rubber Co. | $ | 2,051 | |||
| 174 | Dana Holding Corp. · | 1,739 | ||||
| 5 | Drew Industries · | 94 | ||||
| 41 | Federal Mogul Corp. · | 528 | ||||
| 52 | Tenneco Automotive, Inc. · | 1,101 | ||||
| 376 | Winnebago Industries, Inc. · | 3,738 | ||||
| 9,251 | ||||||
| Banks - 0.2% | ||||||
| 4 | Cardinal Financial Corp. | 34 | ||||
| 47 | Signature Bank · | 1,800 | ||||
| 10 | TFS Financial Corp. | 129 | ||||
| 1,963 | ||||||
| Capital Goods - 8.9% | ||||||
| 40 | A.O. Smith Corp. | 1,940 | ||||
| 36 | Aaon, Inc. | 847 | ||||
| 5 | AAR Corp. · | 89 | ||||
| 82 | Actuant Corp. Class A | 1,536 | ||||
| 37 | Acuity Brands, Inc. | 1,355 | ||||
| 268 | AerCap Holdings N.V. · | 2,785 | ||||
| 18 | Alamo Group, Inc. | 391 | ||||
| 14 | Apogee Enterprises | 156 | ||||
| 82 | Applied Industrial Technologies, Inc. | 2,084 | ||||
| 760 | ArvinMeritor, Inc. · | 9,955 | ||||
| 32 | AZZ, Inc. | 1,189 | ||||
| 30 | Baldor Electric Co. | 1,068 | ||||
| 551 | Beacon Roofing Supply, Inc. · | 9,933 | ||||
| 91 | Blount International · | 935 | ||||
| 76 | Briggs & Stratton Corp. | 1,286 | ||||
| 52 | Carlisle Cos., Inc. | 1,879 | ||||
| 10 | Chart Industries, Inc. · | 155 | ||||
| 41 | Clarcor, Inc. | 1,446 | ||||
| 8 | Crane Co. | 228 | ||||
| 43 | Cubic Corp. | 1,577 | ||||
| 61 | DigitalGlobe, Inc. · | 1,616 | ||||
| 2 | EMCOR Group, Inc. · | 56 | ||||
| 29 | Franklin Electric Co., Inc. | 840 | ||||
| 269 | Gencorp, Inc. · | 1,179 | ||||
| 38 | General Cable Corp. · | 1,024 | ||||
| 62 | GeoEye, Inc. · | 1,937 | ||||
| 59 | GrafTech International Ltd. · | 864 | ||||
| 20 | Graham Corp. | 303 | ||||
| 173 | Great Lakes Dredge & Dock Co. | 1,039 | ||||
| 37 | Heico Corp. | 1,316 | ||||
| 92 | Hexcel Corp. · | 1,425 | ||||
| 22 | Hubbell, Inc. Class B | 866 | ||||
| 35 | IDEX Corp. | 1,004 | ||||
| 28 | II-VI, Inc. · | 823 | ||||
| 25 | Kadant, Inc. · | 438 | ||||
| 22 | Kaman Corp. | 476 | ||||
| 43 | Kaydon Corp. | 1,421 | ||||
| 31 | Lindsay Corp. | 987 | ||||
| 2 | LMI Aerospace, Inc. · | 36 | ||||
| 19 | MasTec, Inc. · | 177 | ||||
| 34 | Mueller Industries, Inc. | 834 | ||||
| 12 | Nacco Industries, Inc. Class A | 1,064 | ||||
| 64 | Orbital Sciences Corp. · | 1,016 | ||||
| 29 | Oshkosh Corp. · | 915 | ||||
| 28 | Owens Corning, Inc. · | 824 | ||||
| 41 | Pall Corp. | 1,420 | ||||
| 15 | Powell Industries, Inc. · | 407 | ||||
| 10 | Raven Industries | 334 | ||||
| 183 | Regal-Beloit Corp. | 10,219 | ||||
| 13 | Robbins & Myers, Inc. | 282 | ||||
| 386 | Rush Enterprises, Inc. · | 5,159 | ||||
| 71 | Simpson Manufacturing Co., Inc. | 1,752 | ||||
| 4 | Teledyne Technologies, Inc. · | 148 | ||||
| 26 | Thomas & Betts Corp. · | 897 | ||||
| 48 | Timken Co. | 1,237 | ||||
| 44 | Toro Co. | 2,161 | ||||
| 29 | Tredegar Corp. | 473 | ||||
| 78 | Trex Co., Inc. · | 1,565 | ||||
| 36 | Trimas Corp. · | 408 | ||||
| 115 | Trinity Industries, Inc. | 2,036 | ||||
| 13 | Valmont Industries, Inc. | 931 | ||||
| 657 | Wabash National Corp. · | 4,671 | ||||
| 26 | Watsco, Inc. | 1,526 | ||||
| 83 | Woodward Governor Co. | 2,116 | ||||
| 101,056 | ||||||
| Commercial & Professional Services - 3.8% | ||||||
| 52 | Acacia Research Corp. · | 746 | ||||
| 40 | Administaff, Inc. | 958 | ||||
| 29 | Advisory Board Co. · | 1,253 | ||||
| 30 | American Reprographics Co. LLC · | 258 | ||||
| 81 | APAC TeleServices, Inc. · | 462 | ||||
| 35 | ATC Technology Corp. · | 561 | ||||
| 48 | Corporate Executive Board Co. | 1,265 | ||||
| 712 | Corrections Corp. of America · | 13,583 | ||||
| 54 | Deluxe Corp. | 1,018 | ||||
| 78 | Diamond Management & Technology | 802 | ||||
| 21 | Dolan Media Co. · | 237 | ||||
| 32 | Ennis, Inc. | 483 | ||||
| 14 | Exponent, Inc. · | 466 | ||||
| 89 | Herman Miller, Inc. | 1,684 | ||||
| 9 | Huron Consulting Group, Inc. · | 165 | ||||
| 89 | Interface, Inc. | 957 | ||||
| 11 | KAR Auction Services, Inc. · | 137 | ||||
| 537 | Knoll, Inc. | 7,137 | ||||
| 19 | M & F Worldwide Corp. · | 512 | ||||
| 61 | Rollins, Inc. | 1,256 | ||||
| 400 | Sykes Enterprises, Inc. · | 5,686 | ||||
| 73 | Tetra Tech, Inc. · | 1,424 | ||||
| 10 | Towers Watson & Co. | 375 | ||||
| 16 | United Stationers, Inc. · | 863 | ||||
| 42,288 | ||||||
| Consumer Durables & Apparel - 6.2% | ||||||
| 43 | American Greetings Corp. Class A | 816 | ||||
| 30 | Blyth, Inc. | 1,022 | ||||
| 324 | Brunswick Corp. | 4,033 | ||||
| 459 | Carter's, Inc. · | 12,040 | ||||
| 806 | Crocs, Inc. · | 8,530 | ||||
| 13 | Deckers Outdoor Corp. · | 1,808 | ||||
| 263 | Eastman Kodak Co. · | 1,141 | ||||
| 33 | Fossil, Inc. · | 1,162 | ||||
| 18 | G-III Appareal Group Ltd. · | 420 | ||||
| 404 | Hanesbrands, Inc. · | 9,711 | ||||
| 297 | Jarden Corp. | 7,982 | ||||
| 18 | Kenneth Cole Productions, Inc. Class A · | 194 | ||||
| 3 | National Presto Industries, Inc. | 256 | ||||
The accompanying notes are an integral part of these financial statements.
| Shares or Principal Amount | Market Value ╪ | |||||
| COMMON STOCKS - 96.2% - (continued) | ||||||
| Consumer Durables & Apparel - 6.2% - (continued) | ||||||
| 32 | Perry Ellis International · | $ | 648 | |||
| 33 | Polaris Industries, Inc. | 1,821 | ||||
| 39 | Pool Corp. | 846 | ||||
| 29 | RC2 Corp. · | 464 | ||||
| 30 | Skechers USA, Inc. Class A · | 1,081 | ||||
| 6 | Sport Supply Group, Inc. | 79 | ||||
| 34 | Steven Madden Ltd. · | 1,079 | ||||
| 119 | Sturm Ruger & Co., Inc. | 1,710 | ||||
| 271 | Tempur-Pedic International, Inc. · | 8,347 | ||||
| 96 | Timberland Co. Class A · | 1,557 | ||||
| 31 | Under Armour, Inc. Class A · | 1,011 | ||||
| 1 | Unifirst Corp. | 32 | ||||
| 41 | Warnaco Group, Inc. · | 1,499 | ||||
| 54 | Wolverine World Wide, Inc. | 1,369 | ||||
| 70,658 | ||||||
| Consumer Services - 5.5% | ||||||
| 23 | American Public Education, Inc. · | 999 | ||||
| 60 | Bridgepoint Education, Inc. · | 956 | ||||
| 15 | Capella Education Co. · | 1,224 | ||||
| 36 | CEC Entertainment, Inc. · | 1,261 | ||||
| 324 | Cheesecake Factory, Inc. · | 7,213 | ||||
| 25 | CKE Restaurants, Inc. | 318 | ||||
| 31 | Coinstar, Inc. · | 1,319 | ||||
| 151 | Corinthian Colleges, Inc. · | 1,491 | ||||
| 24 | CPI Corp. | 540 | ||||
| 38 | Cracker Barrel Old Country Store, Inc. | 1,776 | ||||
| 138 | Denny's Corp. · | 359 | ||||
| 393 | Grand Canyon Education, Inc. · | 9,199 | ||||
| 37 | Hillenbrand, Inc. | 789 | ||||
| 87 | Home Inns & Hotels Management, Inc. · | 3,395 | ||||
| 16 | Interval Leisure Group, Inc. · | 201 | ||||
| 60 | K12, Inc. · | 1,342 | ||||
| 933 | Navitas Ltd. | 3,622 | ||||
| 23 | P.F. Chang's China Bistro, Inc. | 902 | ||||
| 8 | Peet's Coffee & Tea, Inc. · | 309 | ||||
| 236 | Penn National Gaming, Inc. · | 5,453 | ||||
| 24 | Pre-Paid Legal Services, Inc. · | 1,072 | ||||
| 151 | Ruth's Hospitality Group, Inc. · | 633 | ||||
| 335 | Sonic Corp. · | 2,599 | ||||
| 75 | Sotheby's Holdings | 1,723 | ||||
| 27 | Strayer Education, Inc. | 5,509 | ||||
| 169 | Texas Roadhouse, Inc. · | 2,139 | ||||
| 260 | Wyndham Worldwide Corp. | 5,240 | ||||
| 61,583 | ||||||
| Diversified Financials - 1.6% | ||||||
| 273 | Advance America Cash Advance Centers, Inc. | 1,130 | ||||
| 219 | BGC Partners, Inc. | 1,118 | ||||
| 38 | Calamos Asset Management, Inc. | 349 | ||||
| 29 | Cash America International, Inc. | 1,006 | ||||
| 15 | Credit Acceptance Corp. · | 735 | ||||
| 50 | Duff & Phelps Corp. | 625 | ||||
| 85 | Ezcorp, Inc. · | 1,585 | ||||
| 71 | First Cash Financial Services, Inc. · | 1,546 | ||||
| 36 | Life Partners Holdings, Inc. | 737 | ||||
| 74 | MarketAxess Holdings, Inc. | 1,026 | ||||
| 28 | MVC Capital, Inc. | 361 | ||||
| 6 | Portfolio Recovery Associate · | 385 | ||||
| 28 | Safeguard Scientifics, Inc. · | 295 | ||||
| 46 | SEI Investments Co. | 927 | ||||
| 113 | Stifel Financial · | 4,892 | ||||
| 22 | World Acceptance Corp. · | 848 | ||||
| 17,565 | ||||||
| Energy - 4.0% | ||||||
| 28 | Alpha Natural Resources, Inc. · | 944 | ||||
| 115 | Boots & Coots International Wellness Control · | 340 | ||||
| 125 | Callon Petroleum Corp. · | 787 | ||||
| 28 | Carbo Ceramics, Inc. | 2,043 | ||||
| 176 | Cloud Peak Energy, Inc. · | 2,339 | ||||
| 88 | Dresser-Rand Group, Inc. · | 2,791 | ||||
| 157 | Dril-Quip, Inc. · | 6,924 | ||||
| 87 | Energy XXI (Bermuda) Ltd. · | 1,380 | ||||
| 66 | Exco Resources, Inc. | 957 | ||||
| 7 | James River Coal Co. · | 111 | ||||
| 90 | L&L Energy, Inc. · | 774 | ||||
| 47 | Lufkin Industries, Inc. | 1,851 | ||||
| 97 | Matrix Service Co. · | 908 | ||||
| 91 | McMoRan Exploration Co. · | 1,008 | ||||
| 15 | Natural Gas Services Group · | 226 | ||||
| 91 | Oceaneering International, Inc. · | 4,066 | ||||
| 200 | Overseas Shipholding Group, Inc. | 7,398 | ||||
| 59 | Pioneer Drilling Co. · | 333 | ||||
| 47 | Rowan Companies, Inc. · | 1,031 | ||||
| 23 | SM Energy Co. | 924 | ||||
| 109 | Stone Energy Corp. · | 1,221 | ||||
| 176 | TETRA Technologies, Inc. · | 1,599 | ||||
| 108 | Vaalco Energy, Inc. | 606 | ||||
| 156 | W&T Offshore, Inc. | 1,477 | ||||
| 93 | World Fuel Services Corp. | 2,413 | ||||
| 44,451 | ||||||
| Food & Staples Retailing - 0.3% | ||||||
| 43 | Casey's General Stores, Inc. | 1,492 | ||||
| 46 | United Natural Foods, Inc. · | 1,374 | ||||
| 2,866 | ||||||
| Food, Beverage & Tobacco - 2.4% | ||||||
| 19 | American Italian Pasta Co. · | 979 | ||||
| 15 | Boston Beer Co., Inc. Class A · | 980 | ||||
| 50 | Cal-Maine Foods, Inc. | 1,611 | ||||
| 164 | Cental Euro Distribution Corp. · | 3,507 | ||||
| 207 | Darling International, Inc. · | 1,555 | ||||
| 26 | Diamond Foods, Inc. | 1,079 | ||||
| 38 | Flowers Foods, Inc. | 938 | ||||
| 413 | Green Mountain Coffee Roasters · | 10,609 | ||||
| 27 | J&J Snack Foods Corp. | 1,118 | ||||
| 30 | Lancaster Colony Corp. | 1,606 | ||||
| 38 | Sanderson Farms, Inc. | 1,938 | ||||
| 34 | Tootsie Roll Industries | 796 | ||||
| 26,716 | ||||||
| Health Care Equipment & Services - 11.9% | ||||||
| 157 | Accretive Health, Inc. · | 2,082 | ||||
| 115 | Align Technology, Inc. · | 1,703 | ||||
| 43 | Almost Family, Inc. · | 1,486 | ||||
| 32 | Amedisys, Inc. · | 1,407 | ||||
| 464 | American Medical Systems Holdings · | 10,255 | ||||
| 6 | Amerigroup Corp. · | 189 | ||||
| 98 | AMN Healthcare Services, Inc. · | 734 | ||||
| 36 | Angiodynamics, Inc. · | 525 | ||||
The accompanying notes are an integral part of these financial statements.
| Hartford Small Company HLS Fund |
| Schedule of Investments – (continued) |
| June 30, 2010 (Unaudited) |
| (000’s Omitted) |
| Shares or Principal Amount | Market Value ╪ | |||||
| COMMON STOCKS - 96.2% - (continued) | ||||||
| Health Care Equipment & Services - 11.9% - (continued) | ||||||
| 31 | ArthroCare Corp. · | $ | 945 | |||
| 49 | Bio-Reference Laboratories · | 1,095 | ||||
| 5 | Cantel Medical Corp. | 77 | ||||
| 33 | Catalyst Health Solutions · | 1,149 | ||||
| 12 | Centene Corp. · | 247 | ||||
| 29 | Chemed Corp. | 1,579 | ||||
| 142 | Coninucare Corp. · | 476 | ||||
| 154 | Cyberonics, Inc. · | 3,657 | ||||
| 76 | Eclipsys Corp. · | 1,350 | ||||
| 9 | Emergency Medical Services · | 450 | ||||
| 96 | Ev3, Inc. · | 2,146 | ||||
| 521 | Fleury S.A. · | 5,750 | ||||
| 49 | Gentiva Health Services, Inc. · | 1,327 | ||||
| 26 | Haemonetics Corp. · | 1,380 | ||||
| 365 | HealthSouth Corp. · | 6,830 | ||||
| 116 | Healthtronics, Inc. · | 559 | ||||
| 25 | HMS Holdings Corp. · | 1,340 | ||||
| 109 | Immucor, Inc. · | 2,069 | ||||
| 35 | Integra LifeSciences Holdings Corp. · | 1,292 | ||||
| 67 | Invacare Corp. | 1,379 | ||||
| 64 | inVentiv Health, Inc. · | 1,630 | ||||
| 41 | Kensey Nash Corp. · | 968 | ||||
| 355 | Lincare Holdings, Inc. · | 11,529 | ||||
| 76 | MedAssets, Inc. · | 1,744 | ||||
| 52 | Metropolitan Health Networks · | 194 | ||||
| 49 | Molina Healthcare, Inc. · | 1,419 | ||||
| 11 | MWI Veterinary Supply, Inc. · | 563 | ||||
| 73 | Natus Medical, Inc. · | 1,183 | ||||
| 39 | Neogen Corp. · | 1,024 | ||||
| 32 | NuVasive, Inc. · | 1,150 | ||||
| 104 | Odyssey HealthCare, Inc. · | 2,781 | ||||
| 86 | Omnicell, Inc. · | 1,004 | ||||
| 399 | Owens & Minor, Inc. | 11,319 | ||||
| 13 | PharMerica Corp. · | 195 | ||||
| 42 | Providence Service Corp. · | 581 | ||||
| 66 | PSS World Medical, Inc. · | 1,394 | ||||
| 41 | Psychiatric Solutions, Inc. · | 1,356 | ||||
| 2 | Quality Systems | 97 | ||||
| 253 | Rehabcare Group, Inc. · | 5,508 | ||||
| 91 | RTI Biologics, Inc. · | 267 | ||||
| 47 | Sirona Dental Systems, Inc. · | 1,627 | ||||
| 71 | STERIS Corp. | 2,219 | ||||
| 202 | SXC Health Solutions Corp. · | 14,791 | ||||
| 261 | Team Health Holdings · | 3,368 | ||||
| 6 | Thoratec Corp. · | 249 | ||||
| 4 | Triple-S Management Corp., Class B · | 67 | ||||
| 65 | Virtual Radiologic Corp. · | 1,121 | ||||
| 410 | Volcano Corp. · | 8,942 | ||||
| 32 | West Pharmaceutical Services, Inc. | 1,174 | ||||
| 27 | Wright Medical Group, Inc. · | 450 | ||||
| 133,392 | ||||||
| Household & Personal Products - 1.1% | ||||||
| 32 | Alberto-Culver Co. | 862 | ||||
| 178 | Herbalife Ltd. | 8,183 | ||||
| 50 | Inter Parfums, Inc. | 712 | ||||
| 3 | Medifast, Inc. · | 76 | ||||
| 44 | Nu Skin Enterprises, Inc. Class A | 1,098 | ||||
| 13 | Schiff Nutrition International | 91 | ||||
| 16 | Usana Health Sciences, Inc. · | 582 | ||||
| 28 | WD40 Co. | 929 | ||||
| 12,533 | ||||||
| Insurance - 0.8% | ||||||
| 290 | Assured Guaranty Ltd. | 3,850 | ||||
| 52 | Brown & Brown, Inc. | 1,003 | ||||
| 30 | Endurance Specialty Holdings Ltd. | 1,116 | ||||
| 29 | Erie Indemnity Co. | 1,323 | ||||
| 13 | FBL Financial Group Class A | 268 | ||||
| 5 | RLI Corp. | 277 | ||||
| 28 | Symetra Financial Corp. | 339 | ||||
| 36 | Validus Holdings Ltd. | 882 | ||||
| 9,058 | ||||||
| Materials - 3.0% | ||||||
| 31 | A. Schulman, Inc. | 581 | ||||
| 33 | Arch Chemicals, Inc. | 1,004 | ||||
| 21 | Ashland, Inc. | 954 | ||||
| 51 | Balchem Corp. | 1,264 | ||||
| 28 | Clearwater Paper Corp. · | 1,531 | ||||
| 358 | Golden Star Resources Ltd. · | 1,570 | ||||
| 11 | Graham Packaging Co., Inc. · | 136 | ||||
| 23 | Haynes International, Inc. | 706 | ||||
| 1,707 | Huabao International Holdings Ltd. | 2,182 | ||||
| 40 | Kraton Performance Polymers · | 745 | ||||
| 24 | Minerals Technologies, Inc. | 1,158 | ||||
| 5 | Nalco Holding Co. | 96 | ||||
| 36 | Neenah Paper, Inc. | 662 | ||||
| 11 | Newmarket Corp. | 981 | ||||
| 77 | Olin Corp. | 1,392 | ||||
| 76 | Omnova Solutions, Inc. · | 593 | ||||
| 19 | Rock Tenn Co. Class A | 968 | ||||
| 60 | Rockwood Holdings, Inc. · | 1,364 | ||||
| 18 | Schweitzer-Mauduit International, Inc. | 925 | ||||
| 334 | Silgan Holdings, Inc. | 9,488 | ||||
| 104 | Solutia, Inc. · | 1,364 | ||||
| 24 | Stepan Co. | 1,659 | ||||
| 70 | Titanium Metals Corp. · | 1,223 | ||||
| 27 | Valspar Corp. | 817 | ||||
| 56 | W.R. Grace & Co. · | 1,186 | ||||
| 34,549 | ||||||
| Media - 1.1% | ||||||
| 89 | Charm Communications, Inc. · | 676 | ||||
| 441 | Focus Media Holding Ltd. ADR · | 6,847 | ||||
| 74 | Harte-Hanks, Inc. | 775 | ||||
| 4 | John Wiley & Sons, Inc. Class A | 140 | ||||
| 124 | Sinclair Broadcast Group, Inc. Class A · | 725 | ||||
| 93 | Valassis Communications, Inc. · | 2,961 | ||||
| 22 | World Wrestling Entertainment, Inc. | 338 | ||||
| 12,462 | ||||||
| Pharmaceuticals, Biotechnology & Life Sciences - 9.2% | ||||||
| 178 | Affymax, Inc. · | 1,064 | ||||
| 24 | Alexion Pharmaceuticals, Inc. · | 1,207 | ||||
| 356 | Alkermes, Inc. · | 4,430 | ||||
| 83 | AMAG Pharmaceuticals, Inc. · | 2,854 | ||||
| 133 | Auxilium Pharmaceuticals, Inc. · | 3,122 | ||||
| 130 | Bruker Corp. · | 1,586 | ||||
| 176 | Celera Corp. · | 1,153 | ||||
| 25 | Cepheid, Inc. · | 395 | ||||
| 48 | Charles River Laboratories International, Inc. · | 1,648 | ||||
The accompanying notes are an integral part of these financial statements.
| Shares or Principal Amount | Market Value ╪ | |||||
| COMMON STOCKS - 96.2% - (continued) | ||||||
Pharmaceuticals, Biotechnology & Life Sciences - 9.2% - (continued) | ||||||
| 75 | Codexis, Inc. · | $ | 661 | |||
| 201 | Cubist Pharmaceuticals, Inc. · | 4,135 | ||||
| 17 | Dionex Corp. · | 1,290 | ||||
| 87 | Emergent Biosolutions, Inc. · | 1,417 | ||||
| 103 | Enzon, Inc. · | 1,098 | ||||
| 76 | Genomic Health, Inc. · | 989 | ||||
| 75 | Hi-Technology Pharmacal Co., Inc. · | 1,714 | ||||
| 8 | Human Genome Sciences, Inc. · | 175 | ||||
| 205 | Icon plc ADR · | 5,909 | ||||
| 234 | Immunomedics, Inc. · | 722 | ||||
| 131 | Impax Laboratories, Inc. · | 2,503 | ||||
| 378 | Incyte Corp. · | 4,180 | ||||
| 16 | Kendle International, Inc. · | 181 | ||||
| 22 | Martek Biosciences Corp. · | 531 | ||||
| 2 | Medicis Pharmaceutical Corp. Class A | 34 | ||||
| 78 | Nabi Biopharmaceuticals · | 426 | ||||
| 98 | Nektar Therapeutics · | 1,183 | ||||
| 133 | NPS Pharmaceuticals, Inc. · | 859 | ||||
| 49 | Obagi Medical Products, Inc. · | 577 | ||||
| 258 | Onyx Pharmaceuticals, Inc. · | 5,578 | ||||
| 474 | PAREXEL International Corp. · | 10,278 | ||||
| 409 | PDL Biopharma, Inc. | 2,298 | ||||
| 493 | Pharmaceutical Product Development, Inc. | 12,533 | ||||
| 113 | Pharmasset, Inc. · | 3,084 | ||||
| 109 | Questcor Pharmaceuticals · | 1,108 | ||||
| 229 | Regeneron Pharmaceuticals, Inc. · | 5,106 | ||||
| 185 | Salix Pharmaceuticals Ltd. · | 7,209 | ||||
| 484 | Santarus, Inc. · | 1,200 | ||||
| 286 | Sciclone Pharmaceuticals, Inc. · | 760 | ||||
| 405 | Seattle Genetics, Inc. · | 4,856 | ||||
| 77 | Talecris Biotherapeutics Holdings Corp. · | 1,618 | ||||
| 22 | Valeant Pharmaceuticals International · | 1,138 | ||||
| 11 | ViroPharma, Inc. · | 127 | ||||
| 102,936 | ||||||
| Real Estate - 0.3% | ||||||
| 21 | EastGroup Properties, Inc. | 736 | ||||
| 23 | Equity Lifestyle Properties, Inc. | 1,091 | ||||
| 20 | PS Business Parks, Inc. | 1,104 | ||||
| 20 | Rayonier, Inc. | 872 | ||||
| 3,803 | ||||||
| Retailing - 4.6% | ||||||
| 94 | 99 Cents Only Stores · | 1,385 | ||||
| 59 | Aaron Rents, Inc. | 1,013 | ||||
| 80 | AnnTaylor Stores Corp. · | 1,297 | ||||
| 22 | Big 5 Sporting Goods Corp. | 292 | ||||
| 55 | Brown Shoe Co., Inc. | 830 | ||||
| 74 | Cato Corp. | 1,628 | ||||
| 131 | Children's Place Retail Stores, Inc. · | 5,752 | ||||
| 140 | Christopher & Banks Corp. | 864 | ||||
| 69 | Collective Brands, Inc. · | 1,090 | ||||
| 8 | Core-Mark Holding Co., Inc. · | 223 | ||||
| 205 | Dick's Sporting Goods, Inc. · | 5,107 | ||||
| 83 | Dress Barn, Inc. · | 1,987 | ||||
| 116 | Drugstore.com, Inc. · | 357 | ||||
| 58 | DSW, Inc. · | 1,314 | ||||
| 29 | Genesco, Inc. · | 764 | ||||
| 68 | Group 1 Automotive, Inc. · | 1,599 | ||||
| 29 | Gymboree Corp. · | 1,260 | ||||
| 20 | Haverty Furniture Cos., Inc. | 252 | ||||
| 50 | Hibbett Sports, Inc. · | 1,192 | ||||
| 53 | Jo-Ann Stores, Inc. · | 1,979 | ||||
| 16 | Joseph A. Bank Clothiers, Inc. · | 848 | ||||
| 101 | Kirklands, Inc. · | 1,705 | ||||
| 88 | LKQ Corp. · | 1,700 | ||||
| 44 | Monroe Muffler, Inc. | 1,756 | ||||
| 121 | OfficeMax, Inc. · | 1,576 | ||||
| 65 | PetMed Express, Inc. | 1,165 | ||||
| 3 | PetSmart, Inc. | 92 | ||||
| 171 | Pier 1 Imports, Inc. · | 1,094 | ||||
| 84 | Retail Ventures, Inc. · | 654 | ||||
| 29 | rue21, Inc. · | 865 | ||||
| 135 | Sally Beauty Co., Inc. · | 1,109 | ||||
| 148 | Select Comfort Corp. · | 1,299 | ||||
| 20 | Shoe Carnival, Inc. · | 418 | ||||
| 91 | Stein Mart, Inc. · | 568 | ||||
| 85 | Talbots, Inc. · | 875 | ||||
| 142 | The Finish Line, Inc. | 1,972 | ||||
| 7 | Tractor Supply Co. | 399 | ||||
| 43 | Ulta Salon, Cosmetics & Fragrances, Inc. · | 1,008 | ||||
| 192 | Wet Seal, Inc. Class A · | 703 | ||||
| 53 | Williams-Sonoma, Inc. | 1,304 | ||||
| 51,295 | ||||||
| Semiconductors & Semiconductor Equipment - 4.3% | ||||||
| 247 | Amkor Technology, Inc. · | 1,362 | ||||
| 696 | Applied Micro Circuits Corp. · | 7,292 | ||||
| 107 | AXT, Inc. · | 481 | ||||
| 33 | Cabot Microelectronics Corp. · | 1,132 | ||||
| 20 | FEI Co. · | 396 | ||||
| 172 | GT Solar International, Inc. · | 961 | ||||
| 53 | Hittite Microwave Corp. · | 2,354 | ||||
| 85 | Kopin Corp. · | 287 | ||||
| 306 | Lattice Semiconductor Corp. · | 1,330 | ||||
| 100 | Micrel, Inc. | 1,017 | ||||
| 102 | Microsemi Corp. · | 1,487 | ||||
| 162 | MIPS Technologies, Inc. Class A · | 826 | ||||
| 248 | Netlogic Microsystems, Inc. · | 6,740 | ||||
| 158 | Power Integrations, Inc. | 5,092 | ||||
| 585 | RF Micro Devices, Inc. · | 2,286 | ||||
| 59 | Semtech Corp. · | 971 | ||||
| 703 | Skyworks Solutions, Inc. · | 11,800 | ||||
| 186 | TriQuint Semiconductor, Inc. · | 1,134 | ||||
| 40 | Veeco Instruments, Inc. · | 1,383 | ||||
| 48,331 | ||||||
| Software & Services - 11.7% | ||||||
| 43 | ACI Worldwide, Inc. · | 844 | ||||
| 136 | Actuate Corp. · | 606 | ||||
| 130 | Acxiom Corp. · | 1,917 | ||||
| 24 | Advent Software, Inc. · | 1,113 | ||||
| 19 | Alliance Data Systems Corp. · | 1,119 | ||||
| 79 | Ancestry.com, Inc. · | 1,400 | ||||
| 47 | ArcSight, Inc. · | 1,060 | ||||
| 69 | Ariba, Inc. · | 1,092 | ||||
| 300 | Art Technology Group, Inc. · | 1,026 | ||||
| 76 | Aspen Technology, Inc. · | 829 | ||||
| 58 | Blackbaud, Inc. | 1,255 | ||||
| 27 | Blackboard, Inc. · | 1,014 | ||||
| 37 | Bottomline Technologies, Inc. · | 476 | ||||
The accompanying notes are an integral part of these financial statements.
| Hartford Small Company HLS Fund |
| Schedule of Investments – (continued) |
| June 30, 2010 (Unaudited) |
| (000’s Omitted) |
| Shares or Principal Amount | Market Value ╪ | |||||
| COMMON STOCKS - 96.2% - (continued) | ||||||
| Software & Services - 11.7% - (continued) | ||||||
| 50 | Broadridge Financial Solutions, Inc. | $ | 944 | |||
| 51 | Commvault Systems, Inc. · | 1,150 | ||||
| 183 | Compuware Corp. · | 1,459 | ||||
| 192 | Concur Technologies, Inc. · | 8,199 | ||||
| 83 | CSG Systems International, Inc. · | 1,522 | ||||
| 43 | CyberSource Corp. · | 1,106 | ||||
| 48 | Earthlink, Inc. | 384 | ||||
| 79 | EPIQ Systems, Inc. · | 1,022 | ||||
| 63 | Equinix, Inc. · | 5,131 | ||||
| 19 | Factset Research Systems, Inc. | 1,271 | ||||
| 29 | Forrester Research, Inc. · | 886 | ||||
| 69 | Fortinet, Inc. · | 1,130 | ||||
| 16 | Gartner, Inc. Class A · | 363 | ||||
| 143 | Global Cash Access, Inc. · | 1,030 | ||||
| 42 | Global Payments, Inc. | 1,549 | ||||
| 500 | GSI Commerce, Inc. · | 14,408 | ||||
| 409 | Informatica Corp. · | 9,760 | ||||
| 119 | Infospace, Inc. · | 898 | ||||
| 85 | j2 Global Communications, Inc. · | 1,861 | ||||
| 103 | Jack Henry & Associates, Inc. | 2,460 | ||||
| 6 | JDA Software Group, Inc. · | 128 | ||||
| 282 | Lawson Software, Inc. · | 2,055 | ||||
| 37 | Lender Processing Services | 1,164 | ||||
| 43 | Logmein, Inc. · | 1,129 | ||||
| 81 | Manhattan Associates, Inc. · | 2,243 | ||||
| 25 | Mantech International Corp. Class A · | 1,073 | ||||
| 27 | MAXIMUS, Inc. | 1,560 | ||||
| 8 | Micros Systems · | 263 | ||||
| 102 | ModusLink Global Solutions, Inc. · | 613 | ||||
| 40 | Netscout Systems, Inc. · | 574 | ||||
| 16 | Opentable, Inc. · | 659 | ||||
| 42 | Opnet Technologies, Inc. | 616 | ||||
| 82 | Parametric Technology Corp. · | 1,287 | ||||
| 52 | Progress Software Corp. · | 1,571 | ||||
| 115 | Quest Software, Inc. · | 2,076 | ||||
| 63 | Rackspace Hosting, Inc. · | 1,157 | ||||
| 10 | Radiant Systems, Inc. · | 139 | ||||
| 143 | Rovi Corp. · | 5,409 | ||||
| 49 | S1 Corp. · | 293 | ||||
| 115 | Sapient Corp. | 1,169 | ||||
| 7 | Solera Holdings, Inc. | 269 | ||||
| 148 | SonicWALL, Inc. · | 1,735 | ||||
| 49 | SS&C Technologies Holdings, Inc. · | 785 | ||||
| 362 | SuccessFactors, Inc. · | 7,518 | ||||
| 45 | Synchronoss Technologies, Inc. · | 844 | ||||
| 47 | Taleo Corp. Class A · | 1,138 | ||||
| 118 | TeleCommunication Systems, Inc. Class A · . | 489 | ||||
| 174 | Tibco Software, Inc. · | 2,103 | ||||
| 223 | TiVo, Inc. · | 1,648 | ||||
| 5 | Total System Services, Inc. | 75 | ||||
| 134 | United Online, Inc. | 770 | ||||
| 83 | Valueclick, Inc. · | 892 | ||||
| 76 | VeriFone Systems, Inc. · | 1,431 | ||||
| 153 | Vistaprint N.V. · | 7,272 | ||||
| 507 | Websense, Inc. · | 9,587 | ||||
| 132,018 | ||||||
| Technology Hardware & Equipment - 9.0% | ||||||
| 47 | Acme Packet, Inc. · | 1,272 | ||||
| 63 | ADTRAN, Inc. | 1,707 | ||||
| 21 | Anixter International, Inc. · | 905 | ||||
| 212 | Arris Group, Inc. · | 2,161 | ||||
| 47 | AVX Corp. | 608 | ||||
| 54 | Blue Coat Systems, Inc. · | 1,104 | ||||
| 136 | Brightpoint, Inc. · | 951 | ||||
| 652 | Celestica, Inc. · | 5,254 | ||||
| 58 | Comtech Telecommunications Corp. · | 1,746 | ||||
| 32 | CPI International, Inc. · | 494 | ||||
| 114 | DG Fastchannel, Inc. · | 3,722 | ||||
| 10 | Digi International, Inc. · | 81 | ||||
| 6 | DTS, Inc. · | 188 | ||||
| 3 | Emulex Corp. · | 26 | ||||
| 513 | Finisar Corp. · | 7,644 | ||||
| 83 | Hypercom Corp. · | 385 | ||||
| 135 | Insight Enterprises, Inc. · | 1,773 | ||||
| 97 | Interdigital, Inc. · | 2,407 | ||||
| 40 | Keithley Instruments, Inc. | 356 | ||||
| 144 | Lexmark International, Inc. ADR · | 4,772 | ||||
| 23 | Loral Space & Communications, Inc. · | 993 | ||||
| 30 | MTS Systems Corp. | 863 | ||||
| 70 | Multi-Fineline Electronix, Inc. · | 1,747 | ||||
| 601 | Netezza Corp. · | 8,221 | ||||
| 195 | Novatel Wireless, Inc. · | 1,122 | ||||
| 50 | Osi Systems, Inc. · | 1,380 | ||||
| 66 | Plantronics, Inc. | 1,899 | ||||
| 128 | Plexus Corp. · | 3,428 | ||||
| 263 | Polycom, Inc. · | 7,838 | ||||
| 155 | Power-One, Inc. · | 1,045 | ||||
| 451 | QLogic Corp. · | 7,501 | ||||
| 186 | Quantum Corp. · | 350 | ||||
| 270 | Riverbed Technology, Inc. · | 7,451 | ||||
| 792 | Sanmina-Sci Corp. · | 10,783 | ||||
| 64 | SeaChange International, Inc. · | 530 | ||||
| 98 | Silicon Graphics International · | 692 | ||||
| 281 | Sonus Networks, Inc. · | 761 | ||||
| 7 | STEC, Inc. · | 93 | ||||
| 38 | Stratasys, Inc. · | 928 | ||||
| 34 | Synaptics, Inc. · | 925 | ||||
| 135 | Trimble Navigation Ltd. · | 3,780 | ||||
| 52 | Zebra Technologies Corp. Class A · | 1,325 | ||||
| 101,211 | ||||||
| Telecommunication Services - 1.5% | ||||||
| 189 | Alaska Communication Systems Holdings, Inc. | 1,601 | ||||
| 576 | Cincinnati Bell, Inc. · | 1,734 | ||||
| 69 | Consolidated Communications Holdings, Inc. | 1,173 | ||||
| 358 | Frontier Communications Corp. | 2,547 | ||||
| 138 | Neutral Tandem, Inc. · | 1,557 | ||||
| 94 | NTELOS Holdings Corp. | 1,623 | ||||
| 323 | PAETEC Holding Corp. · | 1,101 | ||||
| 54 | Premiere Global Services, Inc. · | 341 | ||||
| 83 | Syniverse Holdings, Inc. · | 1,702 | ||||
| 53 | TW Telecom, Inc. · | 886 | ||||
| 78 | USA Mobility, Inc. | 1,008 | ||||
| 462 | Vonage Holdings Corp. · | 1,063 | ||||
| 16,336 | ||||||
| Transportation - 3.8% | ||||||
| 138 | Allegiant Travel Co. | 5,910 | ||||
| 157 | Copa Holdings S.A. Class A | 6,945 | ||||
The accompanying notes are an integral part of these financial statements.
| Shares or Principal Amount | Market Value ╪ | ||||||||||
| COMMON STOCKS - 96.2% - (continued) | |||||||||||
| Transportation - 3.8% - (continued) | |||||||||||
| 28 | Dollar Thrifty Automotive Group, Inc. · | $ | 1,213 | ||||||||
| 27 | Genesee & Wyoming, Inc. Class A · | 991 | |||||||||
| 14 | Hawaiian Holdings, Inc. · | 72 | |||||||||
| 454 | Hertz Global Holdings, Inc. · | 4,294 | |||||||||
| 32 | Hub Group, Inc. · | 955 | |||||||||
| 173 | J.B. Hunt Transport Services, Inc. | 5,656 | |||||||||
| 534 | Localiza Rent a Car S.A. | 6,139 | |||||||||
| 261 | Old Dominion Freight Line, Inc. · | 9,156 | |||||||||
| 97 | Pacer International, Inc. · | 675 | |||||||||
| 21 | Ryder System, Inc. | 859 | |||||||||
| 17 | UAL Corp. · | 350 | |||||||||
| 43,215 | |||||||||||
| Utilities - 0.2% | |||||||||||
| 6 | New Jersey Resources Corp. | 211 | |||||||||
| 17 | Piedmont Natural Gas | 423 | |||||||||
| 30 | South Jersey Industries, Inc. | 1,306 | |||||||||
| 1,940 | |||||||||||
Total common stocks (cost $1,068,230) | $ | 1,081,476 | |||||||||
| EXCHANGE TRADED FUNDS - 0.4% | |||||||||||
| Other Investment Pools and Funds - 0.4% | |||||||||||
| 64 | iShares Russell 2000 Growth Index Fund | $ | 4,281 | ||||||||
Total exchange traded funds (cost $4,808) | $ | 4,281 | |||||||||
Total long-term investments (cost $1,073,038) | $ | 1,085,757 | |||||||||
| SHORT-TERM INVESTMENTS - 3.1% | |||||||||||
| Repurchase Agreements - 3.0% | |||||||||||
| $ | 7,932 | Bank of America TriParty Joint Repurchase Agreement (maturing on 07/01/2010 in the amount of $7,932, collateralized by FHLMC 5.50%, 2039, FNMA 4.50% - 5.50%, 2038 - 2040, GNMA 5.00%, 2040, value of $8,091) 0.05%, 6/30/2010 | $ | 7,932 | |||||||
| 3,943 | BNP Paribas Securities Corp. Repurchase Agreement (maturing on 07/01/2010 in the amount of $3,943, collateralized by U.S. Treasury Bond 6.25%, 2030, U.S. Treasury Note 1.00%, 2011, value of $4,045) 0.01%, 6/30/2010 | 3,943 | |||||||||
| 1,359 | BNP Paribas Securities Corp. TriParty Joint Repurchase Agreement (maturing on 07/01/2010 in the amount of $1,359, collateralized by FNMA 4.50% - 6.50%, 2024 - 2040, GNMA 5.00% - 6.50%, 2038 - 2040, value of $1,386) 0.04%, 6/30/2010 | 1,359 | |||||||||
| 6,006 | Deutsche Bank Securities TriParty Joint Repurchase Agreement (maturing on 07/01/2010 in the amount of $6,006, collateralized by GNMA 3.13% - 7.00%, 2023 - 2052, value of $6,126) 0.05%, 6/30/2010 | 6,006 | |||||||||
| 1,359 | JP Morgan Chase TriParty Joint Repurchase Agreement (maturing on 07/01/2010 in the amount of $1,359, collateralized by FHLMC 2.38% - 5.83%, 2033 - 2038, value of $1,386) 0.06%, 6/30/2010 | 1,359 | |||||||||
| 5,922 | Morgan Stanley & Co., Inc. TriParty Joint Repurchase Agreement (maturing on07/01/2010 in the amount of $5,922, collateralized by FHLMC 5.00% - 5.50%, 2038 - 2039, FNMA 5.00%, 2039, value of $6,065) 0.03%, 6/30/2010 | 5,922 | |||||||||
| 1,595 | RBS Greenwich Capital Markets TriParty Joint Repurchase Agreement (maturing on 07/01/2010 in the amount of $1,595, collateralized by U.S. Treasury Bill 0.88%, 2011, value of $1,626) 0.01%, 6/30/2010 | 1,595 | |||||||||
| 69 | UBS Securities, Inc. Repurchase Agreement (maturing on 07/01/2010 in the amount of $69, collateralized by U.S. Treasury Bill 0.88%, 2011, value of $71) 0.02%, 6/30/2010 | 69 | |||||||||
| 3,635 | UBS Securities, Inc. TriParty Joint Repurchase Agreement (maturing on07/01/2010 in the amount of $3,635, collateralized by U.S. Treasury Note2.13%, 2015, value of $3,707) 0.04%, 6/30/2010 | 3,635 | |||||||||
| 1,499 | UBS Securities, Inc. TriParty Joint Repurchase Agreement (maturing on07/01/2010 in the amount of $1,499,collateralized by FNMA 5.00% - 6.00%,2033 - 2036, value of $1,529) 0.09%, 6/30/2010 | 1,499 | |||||||||
| 33,319 | |||||||||||
| U.S. Treasury Bills - 0.1% | |||||||||||
| 1,250 | 0.15%, 7/15/2010□○ | 1,250 | |||||||||
Total short-term investments (cost $34,569) | $ | 34,569 | |||||||||
Total investments (cost $1,107,607) ▲ | 99.7 | % | $ | 1,120,326 | |||||||
| Other assets and liabilities | 0.3 | % | 3,187 | ||||||||
| Total net assets | 100.0 | % | $ | 1,123,513 | |||||||
| Note: | Percentage of investments as shown is the ratio of the total market value to total net assets. Market value of investments in foreign securities represents 4.0% of total net assets at June 30, 2010. |
Foreign securities that are principally traded on certain foreign markets are adjusted daily pursuant to a third party pricing service methodology approved by the Board of Directors in order to reflect an adjustment for factors occurring after the close of the foreign market but before the close of the New York Stock Exchange.
The accompanying notes are an integral part of these financial statements.
| Hartford Small Company HLS Fund |
| Schedule of Investments – (continued) |
| June 30, 2010 (Unaudited) |
| (000’s Omitted) |
| ▲ | At June 30, 2010, the cost of securities for federal income tax purposes was $1,129,238 and the aggregate gross unrealized appreciation and depreciation based on that cost were: |
| Unrealized Appreciation | $ | 78,552 | ||
| Unrealized Depreciation | (87,464 | ) | ||
| Net Unrealized Depreciation | $ | (8,912 | ) |
· | Currently non-income producing. |
| ○ | The interest rate disclosed for these securities represents the effective yield on the date of the acquisition. |
| □ | Security pledged as initial margin deposit for open futures contracts at June 30, 2010 |
Futures Contracts Outstanding at June 30, 2010
| Unrealized | |||||||||||
| Number of | Expiration | Appreciation/ | |||||||||
| Description | Contracts* | Position | Month | (Depreciation) | |||||||
| Russell 2000 Mini | 145 | Long | Sep 2010 | $ | (115 | ) | |||||
| * | The number of contracts does not omit 000's. |
Forward Foreign Currency Contracts Outstanding at June 30, 2010
| Unrealized | |||||||||||||
| Market | Contract | Delivery | Appreciation/ | ||||||||||
| Description | Value ╪ | Amount | Date | (Depreciation) | |||||||||
| Australian Dollar (Sell) | $ | 3,293 | $ | 3,283 | 10/05/10 | $ | (10 | ) | |||||
| Australian Dollar (Buy) | 171 | 174 | 10/05/10 | (3 | ) | ||||||||
| Australian Dollar (Sell) | 460 | 476 | 10/05/10 | 16 | |||||||||
| Australian Dollar (Buy) | 251 | 242 | 10/05/10 | 9 | |||||||||
| $ | 12 | ||||||||||||
| ╪ | See Significant Accounting Policies of accompanying Notes to Financial Statements regarding valuation of securities. |
The accompanying notes are an integral part of these financial statements.
| Hartford Small Company HLS Fund |
| June 30, 2010 (Unaudited) |
| (000’s Omitted) |
| Total | Level 1♦ | Level 2♦ | Level 3 | |||||||||||||
| Assets: | ||||||||||||||||
| Common Stocks ‡ | $ | 1,081,476 | $ | 1,075,672 | $ | 5,804 | $ | – | ||||||||
| Exchange Traded Funds | 4,281 | 4,281 | – | – | ||||||||||||
| Short-Term Investments | 34,569 | – | 34,569 | – | ||||||||||||
| Total | $ | 1,120,326 | $ | 1,079,953 | $ | 40,373 | $ | – | ||||||||
| Forward Foreign Currency Contracts * | 25 | – | 25 | – | ||||||||||||
| Total | $ | 25 | $ | – | $ | 25 | $ | – | ||||||||
| Liabilities: | ||||||||||||||||
| Forward Foreign Currency Contracts * | 13 | – | 13 | – | ||||||||||||
| Futures * | 115 | 115 | – | – | ||||||||||||
| Total | $ | 128 | $ | 115 | $ | 13 | $ | – | ||||||||
| ♦ | For the period ended June 30, 2010, there were no significant transfers between Level 1 and Level 2. |
| ‡ | The Fund has all or primarily all of these equity securities categorized in a single level. Refer to the Schedule of Investments for further industry breakout. |
| * | Derivative instruments not reflected in the Schedule of Investments are valued at the unrealized appreciation/depreciation on the investments. |
The accompanying notes are an integral part of these financial statements.
| Hartford Small Company HLS Fund |
| June 30, 2010 (Unaudited) |
| (000’s Omitted) |
| Assets: | ||||
| Investments in securities, at market value (cost $1,107,607) | $ | 1,120,326 | ||
| Cash | 1,895 | |||
| Foreign currency on deposit with custodian (cost $9) | 9 | |||
| Unrealized appreciation on forward foreign currency contracts | 25 | |||
| Receivables: | ||||
| Investment securities sold | 91,164 | |||
| Fund shares sold | 294 | |||
| Dividends and interest | 259 | |||
| Variation margin | 32 | |||
| Other assets | 2 | |||
| Total assets | 1,214,006 | |||
| Liabilities: | ||||
| Unrealized depreciation on forward foreign currency contracts | 13 | |||
| Payables: | ||||
| Investment securities purchased | 88,749 | |||
| Fund shares redeemed | 1,333 | |||
| Variation margin | 110 | |||
| Investment management fees | 180 | |||
| Distribution fees | 10 | |||
| Accrued expenses | 98 | |||
| Total liabilities | 90,493 | |||
| Net assets | $ | 1,123,513 | ||
| Summary of Net Assets: | ||||
| Capital stock and paid-in-capital | $ | 1,389,215 | ||
| Accumulated distributions in excess of net investment loss | (1,515 | ) | ||
| Accumulated net realized loss on investments and foreign currency transactions | (276,803 | ) | ||
| Unrealized appreciation of investments and the translations of assets and liabilities denominated in foreign currency | 12,616 | |||
| Net assets | $ | 1,123,513 | ||
| Shares authorized | 1,500,000 | |||
| Par value | $ | 0.001 | ||
Class IA: Net asset value per share | $ | 13.74 | ||
| Shares outstanding | 69,202 | |||
| Net assets | $ | 950,622 | ||
Class IB: Net asset value per share | $ | 13.38 | ||
| Shares outstanding | 12,920 | |||
| Net assets | $ | 172,891 | ||
The accompanying notes are an integral part of these financial statements.
| Hartford Small Company HLS Fund |
| For the Six-Month Period Ended |
| June 30, 2010 (Unaudited) |
| (000’s Omitted) |
| Investment Income: | ||||
| Dividends | $ | 3,743 | ||
| Interest | 26 | |||
| Less: Foreign tax withheld | (33 | ) | ||
| Total investment income, net | 3,736 | |||
| Expenses: | ||||
| Investment management fees | 3,885 | |||
| Administrative service fees | 392 | |||
| Transfer agent fees | 3 | |||
| Distribution fees - Class IB | 258 | |||
| Custodian fees | 17 | |||
| Accounting services fees | 74 | |||
| Board of Directors' fees | 13 | |||
| Audit fees | 12 | |||
| Other expenses | 132 | |||
| Total expenses (before fees paid indirectly) | 4,786 | |||
| Commission recapture | (30 | ) | ||
| Total fees paid indirectly | (30 | ) | ||
| Total expenses, net | 4,756 | |||
| Net investment loss | (1,020 | ) | ||
| Net Realized Gain on Investments, Other Financial Instruments and Foreign Currency Transactions: | ||||
| Net realized gain on investments | 132,219 | |||
| Net realized gain on futures | 380 | |||
| Net realized gain on forward foreign currency contracts | 11 | |||
| Net realized loss on other foreign currency transactions | (59 | ) | ||
| Net Realized Gain on Investments, Other Financial Instruments and Foreign Currency Transactions | 132,551 | |||
| Net Changes in Unrealized Depreciation of Investments, Other Financial Instruments and Foreign Currency Transactions: | ||||
| Net unrealized depreciation of investments | (169,775 | ) | ||
| Net unrealized depreciation of futures | (523 | ) | ||
| Net unrealized appreciation of forward foreign currency contracts | 12 | |||
| Net unrealized depreciation on translation of other assets and liabilities in foreign currencies | (2 | ) | ||
| Net Changes in Unrealized Depreciation of Investments, Other Financial Instruments and Foreign Currency Transactions | (170,288 | ) | ||
| Net Loss on Investments, Other Financial Instruments and Foreign Currency Transactions | (37,737 | ) | ||
| Net Decrease in Net Assets Resulting from Operations | $ | (38,757 | ) | |
The accompanying notes are an integral part of these financial statements.
| Hartford Small Company HLS Fund |
| (000’s Omitted) |
| For the | ||||||||
| Six-Month | For the | |||||||
| Period Ended | Year Ended | |||||||
| June 30, 2010 | December 31, | |||||||
| (Unaudited) | 2009 | |||||||
| Operations: | ||||||||
| Net investment loss | $ | (1,020 | ) | $ | (1,197 | ) | ||
| Net realized gain (loss) on investments, other financial instruments and foreign currency transactions | 132,551 | (100,961 | ) | |||||
Net unrealized appreciation (depreciation) of investments, other financial instruments and foreign currency transactions | (170,288 | ) | 392,432 | |||||
| Payment from affiliate | — | 1,017 | ||||||
| Net increase (decrease) in net assets resulting from operations | (38,757 | ) | 291,291 | |||||
| Distributions to Shareholders: | ||||||||
| From net investment income | ||||||||
| Class IA | — | (117 | ) | |||||
| Class IB | — | — | ||||||
| Total distributions | — | (117 | ) | |||||
| Capital Share Transactions: | ||||||||
| Class IA | ||||||||
| Sold | 52,792 | 183,208 | ||||||
| Issued on reinvestment of distributions | — | 117 | ||||||
| Redeemed | (94,707 | ) | (194,170 | ) | ||||
| Total capital share transactions | (41,915 | ) | (10,845 | ) | ||||
| Class IB | ||||||||
| Sold | 17,737 | 31,022 | ||||||
| Issued on reinvestment of distributions | — | — | ||||||
| Redeemed | (48,060 | ) | (49,332 | ) | ||||
| Total capital share transactions | (30,323 | ) | (18,310 | ) | ||||
| Net decrease from capital share transactions | (72,238 | ) | (29,155 | ) | ||||
| Net increase (decrease) in net assets | (110,995 | ) | 262,019 | |||||
| Net Assets: | ||||||||
| Beginning of period | 1,234,508 | 972,489 | ||||||
| End of period | $ | 1,123,513 | $ | 1,234,508 | ||||
Accumulated undistributed (distribution in excess of) net investment income | $ | (1,515 | ) | $ | (495 | ) | ||
| Shares: | ||||||||
| Class IA | ||||||||
| Sold | 3,544 | 16,106 | ||||||
| Issued on reinvestment of distributions | — | 9 | ||||||
| Redeemed | (6,458 | ) | (16,051 | ) | ||||
| Total share activity | (2,914 | ) | 64 | |||||
| Class IB | ||||||||
| Sold | 1,220 | 2,788 | ||||||
| Issued on reinvestment of distributions | — | — | ||||||
| Redeemed | (3,315 | ) | (4,453 | ) | ||||
| Total share activity | (2,095 | ) | (1,665 | ) | ||||
The accompanying notes are an integral part of these financial statements.
| Hartford Small Company HLS Fund |
| June 30, 2010 (Unaudited) |
| (000’s Omitted) |
| 1. | Organization: |
Hartford Small Company HLS Fund (the "Fund") serves as an underlying investment option for certain variable annuity and variable life insurance separate accounts of Hartford Life Insurance Company (“HLIC”) and its affiliates and certain qualified retirement plans. The Fund may also serve as an underlying investment option for certain variable annuity and variable life separate accounts of other insurance companies. Owners of variable annuity contracts and policyholders of variable life insurance contracts may choose the funds permitted in the variable insurance contract prospectus. In addition, participants in certain qualified retirement plans may choose the fund if permitted by their plans.
Hartford Series Fund, Inc. (the “Company”) is an open-end registered management investment company comprised of twenty-nine portfolios, one portfolio of which is included in these financial statements.
The Company is organized under the laws of the State of Maryland and is registered with the Securities and Exchange Commission (“SEC”) under the Investment Company Act of 1940, as amended (“1940 Act”). The Fund is organized as a diversified open-end management investment company.
The Fund is divided into Class IA and Class IB shares. Each class is offered at the per share net asset value (“NAV”) without a sales charge and is subject to the same expenses, except that the Class IB shares are subject to distribution and service fees charged pursuant to a Distribution and Service Plan adopted in accordance with Rule 12b-1 under the 1940 Act.
| 2. | Significant Accounting Policies: |
The following is a summary of significant accounting policies of the Fund, which are in accordance with U.S. Generally Accepted Accounting Principles (“GAAP”).
| a) | Security Transactions and Investment Income – Security transactions are recorded on the trade date (the date the order to buy or sell is executed). Security gains and losses are determined on the basis of identified cost. |
Dividend income is accrued as of the ex-dividend date, except that certain dividends for foreign securities where the ex-dividend date may have passed are recorded as soon as the Fund is informed of the dividend in the exercise of reasonable diligence. Interest income, including amortization of premium and accretion of discounts, is accrued on a daily basis.
| b) | Security Valuation – The Fund generally uses market prices in valuing portfolio securities. If market prices are not readily available or are deemed unreliable, the Fund will use the fair value of the security as determined in good faith under policies and procedures established by and under the supervision of the Fund’s Board of Directors. Market prices may be deemed unreliable, for example, if a security is thinly traded or if an event has occurred after the close of the security’s primary market, but before the close of the New York Stock Exchange (the “Exchange”) (generally 4:00 p.m. Eastern Time, referred to as the “Valuation Time”) that is expected to affect the value of the portfolio security. The circumstances in which the Fund may use fair value pricing include, among others: (i) the occurrence of events that are significant to a particular issuer, such as mergers, restructuring or defaults; (ii) the occurrence of events that are significant to an entire market, such as natural disasters in a particular region or governmental actions; (iii) trading restrictions on securities; (iv) thinly traded securities and (v) market events such as trading halts and early market closings. In addition, with respect to the valuation of stocks primarily traded on foreign markets, the Fund uses a fair value pricing service approved by the Fund’s Board of Directors, which employs quantitative models that evaluate changes in the value of foreign market proxies (e.g., futures contracts, American Depositary Receipts (“ADRs”), exchange traded funds (“ETFs”)) after the close of the foreign markets but before the Valuation Time. Securities that are primarily traded on foreign markets may trade on days that are not business days of the Fund. The value of the foreign securities in which the Fund invests may change on days when a shareholder will not be able to purchase or redeem shares of the Fund. Fair value pricing is subjective in nature and the use of fair value pricing by the Fund may cause the NAV of its shares to differ significantly from the NAV that would have been calculated using market prices at the close of the exchange on which a portfolio security is primarily traded but before the Valuation Time. There can be no |
| Hartford Small Company HLS Fund |
Notes to Financial Statements – (continued) |
| June 30, 2010 (Unaudited) |
| (000’s Omitted) |
assurance that the Fund could obtain the fair value assigned to a security if the Fund were to sell the security at approximately the time at which the Fund determines its NAV.
Exchange-traded equity securities are valued at the last reported sale price or official close price on the exchange or market on which the security is primarily traded (the “Primary Market”) at the Valuation Time. If the security did not trade on the Primary Market, it may be valued at the Valuation Time at the last reported sale price on another exchange where it trades. The value of an equity security not traded on any exchange but traded on the Nasdaq Stock Market, Inc. or another over-the-counter market shall be valued at the last reported sale price or official closing price on the exchange or market on which the security is traded as of the Valuation Time.
Short-term investments with a maturity of more than 60 days when purchased are valued based on market quotations until the remaining days to maturity become less than 61 days. Investments that mature in 60 days or less are generally valued at amortized cost, which approximates market value.
Foreign-denominated assets, including investment securities, and liabilities are translated from the local currency into U.S. dollars using exchange rates obtained from an independent third party as of the Fund’s Valuation Time.
Financial instruments for which prices are not available from an independent pricing service may be valued using market quotations obtained from one or more dealers that make markets in securities in accordance with procedures established by the Fund’s Board of Directors.
Futures contracts are valued at the most recent settlement price reported by an exchange on which, over time, they are traded most extensively. If a settlement price is not available, futures contracts will be valued at the most recent trade price as of the Valuation Time. If there were no trades, the contract shall be valued at the mean of the closing bid and asked prices as of the Valuation Time.
Forward foreign currency contracts represent agreements to exchange currencies on specific future dates at predetermined rates. Forward foreign currency contracts are valued using foreign currency exchange rates and forward rates on the Valuation Date from an independent pricing service.
Other derivative or contractual type instruments shall be valued using market prices if such instruments trade on an exchange or market. If such instruments do not trade on an exchange or market, such instruments shall be valued at a price at which the counterparty to such contract would repurchase the instrument. In the event that the counterparty cannot provide a price, such valuation may be determined in accordance with procedures established by the Fund’s Board of Directors.
Investments in open-end mutual funds are valued at the respective NAV of each open-end mutual fund on the valuation date.
Various inputs are used in determining the value of the Fund’s investments. These inputs are summarized into three broad hierarchy levels. This hierarchy is based on whether the valuation inputs are observable or unobservable. These levels are:
| · | Level 1 – Quoted prices in active markets for identical securities. Level 1 may include exchange-traded instruments such as domestic equities, some foreign equities, options, futures, mutual funds, ETFs, and rights and warrants. |
| · | Level 2 – Observable inputs other than Level 1 prices, such as quoted prices for similar securities; quoted prices in markets that are not active; or other inputs that are observable or can be corroborated by observable market data. Level 2 may include debt securities that are traded less frequently than exchange-traded instruments and which are valued using third party pricing services. Prices for most level 2 securities are based on prices |
received from an independent pricing service. The following asset classes generally use valuation techniques and inputs as noted below:
Asset Backed Securities and Collateralized Mortgage Obligations – Multi-dimensional spread/prepayment speed tables, with consideration of yield or price of bonds of comparable quality, coupon and maturity, attributes of the collateral, new issue data and monthly payment information.
Corporate Bonds – Multi-dimensional relational model based on observable market information such as yields, spreads, sector analysis, etc.
Foreign Currency – Based on rates determined at the close of the Exchange, provided by an independent pricing service.
Forward Currency Contracts – Valued based on the price of the underlying currency at the prevailing interpolated exchange rate, which is a combination of the spot currency rate and the forward currency rate, provided by an independent pricing service.
Foreign Equities – Certain foreign equities are priced using a multi-factor regression model with market observable inputs of a correlative nature (ADRs, futures contracts, ETFs, and currency exchange rates).
International Fixed Income – Multi-dimensional relational model based on observable market information such as benchmark yields, reported trades, bids and offers.
Money Market Instruments – Amortized cost.
Mortgage Backed Securities (“MBS”) – Matrix pricing using inputs of To-Be-Announced (“TBA”) prices, new issue data and monthly payment information, with consideration of yield or price of bonds of comparable quality, coupon and maturity, and attributes of the collateral.
Municipal Bonds – Multi-dimensional relational model and series of matrices based on observable market information such as Municipal Securities Rulemaking Board reported trades, comparable bonds, yields, spreads and credit analysis.
Preferred Stocks – Close mean of bid/ask or bid.
Repurchase Agreements – Priced at par.
Senior Floating Rate Interests – Composite of quotes from one or more contributing dealers.
Swaps – Price based upon observable market information from an independent pricing service.
U.S. Government Securities – Treasuries exclusively traded in the secondary market.
| · | Level 3 – Significant unobservable inputs that are supported by limited or no market activity. Level 3 may include financial instruments whose values are determined using broker quotes or require significant management judgment or estimation. While these securities are priced using unobservable inputs, the valuation of these securities reflects the best available data and management believes the prices are a reasonable representation of exit price. The following asset classes generally use valuation techniques and inputs as noted below: |
Asset Backed Securities & Commercial Mortgage Backed Securities – Certain other MBS with limited liquidity priced from an independent pricing service.
| Hartford Small Company HLS Fund |
Notes to Financial Statements – (continued) |
| June 30, 2010 (Unaudited) |
| (000’s Omitted) |
Common Stocks – Trading has been halted or there are restrictions on trading. Valuation is based on last trade with the application of a discount or premium, if applicable.
Long Dated Over-the-Counter Options – Terms greater than 10 years from current date, expected volatility is not observable. Prices are from an independent pricing service.
Long Term Debt Securities, including Senior Floating Rate Interests – Unobservable valuation inputs may include estimates for current yields, maturity/duration, prepayment speed, and broker quotes for comparable securities along with other assumptions relating to credit quality, collateral value, complexity of the security structure, general market conditions and liquidity.
Swaps – Terms greater than 10 years from current date, expected volatility is not observable. Prices are from an independent pricing service.
Individual securities within any of the above mentioned asset classes may be assigned a different hierarchical level than those that are presented above, as individual circumstances dictate.
During the six-month period ended June 30, 2010, the Fund held no Level 3 securities, therefore no reconciliation of Level 3 securities is presented.
Refer to the Investment Valuation Hierarchy Level Summary found following the Schedule of Investments.
| c) | Foreign Currency Transactions – Assets and liabilities denominated in currencies other than U.S. dollars are translated into U.S. dollars at the exchange rates in effect on the valuation date. Purchases and sales of investment securities, income and expenses are translated into U.S. dollars at the exchange rates on the dates of such transactions. |
The Fund does not isolate that portion of portfolio security valuation resulting from fluctuations in the foreign currency exchange rates from the fluctuations arising from changes in the market prices of securities held. Exchange rate fluctuations are included with the net realized and unrealized gain or loss on investments in the accompanying financial statements.
Net realized foreign exchange gains or losses arise from sales of foreign currencies and the difference between asset and liability amounts initially stated in foreign currencies and the U.S. dollar value of the amounts actually received or paid. Net unrealized foreign exchange gains or losses arise from changes in the value of other assets and liabilities at the end of the reporting period, resulting from changes in the exchange rates.
| d) | Joint Trading Account – Pursuant to an exemptive order issued by the SEC, the Fund may transfer uninvested cash balances into a joint trading account managed by Hartford Investment Management Company (“Hartford Investment Management”), a wholly-owned indirect subsidiary of The Hartford Financial Services Group, Inc. (“The Hartford”) or Wellington Management Company, LLP (“Wellington Management”). These balances may be invested in one or more repurchase agreements and/or short-term money market instruments. |
| e) | Repurchase Agreements – A repurchase agreement is an agreement by which a counterparty agrees to sell a security and agrees to repurchase the security sold at a mutually agreed upon time and price. At the time the Fund enters into a repurchase agreement, the value of the underlying collateral security(ies), including accrued interest, will be equal to or exceed the value of the repurchase agreement. To minimize counterparty risk, the securities that serve to collateralize the repurchase agreement are held by the Fund's custodian in book entry or physical form in the custodial account of the Fund or in a third party custodial account. Repurchase agreements are valued at cost plus accrued interest. The Fund, as shown on the Schedule of Investments, had outstanding repurchase agreements as of June 30, 2010. |
| f) | Forward Foreign Currency Contracts – The Fund may enter into forward foreign currency contracts that obligate the Fund to purchase or sell currencies at specified future dates. Forward foreign currency contracts may be used to hedge against adverse fluctuations in exchange rates between currencies. |
Forward foreign currency contracts involve elements of market risk in excess of the amounts reflected in the Statement of Assets and Liabilities. In addition, risks may arise upon entering into these contracts from the potential inability of the counterparties to meet the terms of the contracts and from unanticipated movements in the value of the foreign currencies relative to the U.S. dollar. The Fund had outstanding forward foreign currency contracts as shown on the Schedule of Investments as of June 30, 2010.
| g) | Indexed Securities – The Fund may invest in indexed securities whose values are linked to changes in interest rates, indices, or other underlying instruments. The Fund may use these securities to increase or decrease its exposure to different underlying instruments and to gain exposure to markets that might be difficult to invest in using conventional securities. Indexed securities may be more volatile than their underlying instruments, but any loss is limited to the amount of the original investment and there may be a limit to the potential appreciation of the investment. The Fund, as shown in the Schedule of Investments under Exchange Traded Funds, had investments in indexed securities as of June 30, 2010. |
| h) | Fund Share Valuation and Dividend Distributions to Shareholders – Orders for the Fund’s shares are executed in accordance with the investment instructions of the contract holders or plan participants. The NAV of the Fund’s shares is determined as of the close of each business day of the Exchange. The NAV is determined separately for each class of the Fund by dividing the Fund’s net assets attributable to that class by the number of outstanding shares of the class. Orders for the purchase of the Fund’s shares received by an insurance company or plan prior to the close of the Exchange on any day on which the Exchange is open for business are priced at the NAV determined as of the close of the Exchange. Orders received by an insurance company or plan after the close of the Exchange, or on a day on which the Exchange and/or the Fund is not open for business, are priced at the next determined NAV. |
Dividends are declared pursuant to a policy adopted by the Fund’s Board of Directors based upon the investment performance of the Fund. The policy of the Fund is to pay dividends from net investment income and distribute realized capital gains, if any, at least once a year.
Distributions from net investment income, realized capital gains and capital are determined in accordance with federal income tax regulations, which may differ from U.S. GAAP with respect to character and timing. These differences may include but are not limited to losses deferred due to wash sale adjustments, foreign currency gains and losses, adjustments related to Passive Foreign Investment Companies (“PFICs”), Real Estate Investment Trusts (“REITs”), Regulated Investment Companies (“RICs”), certain derivatives and partnerships. Permanent book and federal income tax basis differences relating to shareholder distributions will result in reclassifications to certain of the Fund’s capital accounts (see Federal Income Taxes: Reclassification of Capital Accounts note).
| i) | Securities Purchased on a When-Issued or Delayed-Delivery Basis – Delivery and payment for securities that have been purchased by the Fund on a forward commitment, or when-issued or delayed-delivery basis, take place beyond the customary settlement period. During this period, such securities are subject to market fluctuations, and the Fund identifies securities segregated in its records with value at least equal to the amount of the commitment. As of June 30, 2010, the Fund had no outstanding when-issued or delayed delivery securities. |
| j) | Use of Estimates – The preparation of financial statements in conformity with U.S. GAAP requires management to make estimates and assumptions that affect the reported amounts of assets and liabilities as of the date of the financial statements and the reported amounts of income and expenses during the period. Operating results in the future could vary from the amounts derived from management’s estimates. |
| Hartford Small Company HLS Fund |
Notes to Financial Statements – (continued) |
| June 30, 2010 (Unaudited) |
| (000’s Omitted) |
| k) | Additional Derivative Instrument(s) Information |
Derivative Instrument(s) as of June 30, 2010.
| Statement of Assets and Liabilities Location | |||||||||||
| Risk Exposure Category | Asset Derivatives | Liability Derivatives | |||||||||
| Foreign exchange contracts | Unrealized appreciation on forward | 25 | Unrealized depreciation on forward | 13 | |||||||
| foreign currency contracts | foreign currency contracts | ||||||||||
| Equity contracts | Summary of Net Assets - Unrealized | 115 | |||||||||
| depreciation | |||||||||||
The volume of derivatives that is presented in the Schedule of Investments is consistent with the derivative activity during the six-month period ended June 30, 2010.
Realized Gain/Loss and Change in Unrealized Appreciation (Depreciation) on Derivative Instruments for the six-month period ended June 30, 2010:
| Amount of Realized Gain or (Loss) on Derivatives Recognized in Income | ||||||||||||||||||||||||
| Forward | ||||||||||||||||||||||||
| Purchased | Currency | |||||||||||||||||||||||
| Risk Exposure Category | Written Options | Options | Futures | Contracts | Swaps | Total | ||||||||||||||||||
| Foreign exchange contracts | $ | — | $ | — | $ | — | $ | 11 | $ | — | $ | 11 | ||||||||||||
| Equity contracts | — | — | 380 | — | — | 380 | ||||||||||||||||||
| Total | $ | — | $ | — | $ | 380 | $ | 11 | $ | — | $ | 391 | ||||||||||||
| Change in Unrealized Appreciation or (Depreciation) on Derivatives Recognized in Income | ||||||||||||||||||||||||
| Forward | ||||||||||||||||||||||||
| Purchased | Currency | |||||||||||||||||||||||
| Risk Exposure Category | Written Options | Options | Futures | Contracts | Swaps | Total | ||||||||||||||||||
| Foreign exchange contracts | — | — | — | 12 | — | $ | 12 | |||||||||||||||||
| Equity contracts | — | — | (523 | ) | — | — | (523 | ) | ||||||||||||||||
| Total | $ | — | $ | — | $ | (523 | ) | $ | 12 | $ | — | $ | (511 | ) | ||||||||||
| l) | Indemnifications – Under the Company’s organizational documents, the Company shall indemnify its officers and directors to the full extent required or permitted under Maryland General Corporation Law and the federal securities laws. In addition, the Company, on behalf of the Fund, may enter into contracts that contain a variety of indemnifications. The Company’s maximum exposure under these arrangements is unknown. However, the Company has not had prior claims or losses pursuant to these contracts and expects the risk of loss to be remote. |
| 3. | Futures and Options: |
The Fund is subject to equity price risk, interest rate risk and foreign currency exchange rate risk in the normal course of pursuing its investment objectives. The Fund may invest in futures and options contracts in order to gain exposure to or hedge against changes in the value of equities, interest rates or foreign currencies. A futures contract is an agreement between two parties to buy and sell an asset at a set price on a future date. When the Fund enters into such futures contracts, it is required to deposit with a futures commission merchant an amount of “initial margin” of cash, commercial paper or U.S. Treasury Bills. Subsequent payments, called variation margin, to and from the broker, are made on a daily basis as the price of the underlying asset fluctuates, making the long and short positions in the futures contract more or less valuable (i.e., mark-to-market), which results in an unrealized gain or loss to the Fund.
At any time prior to the expiration of the futures contract, the Fund may close the position by taking an opposite position, which would effectively terminate the position in the futures contract. A final determination of variation margin is then made, additional cash is required to be paid by or released to the Fund and the Fund realizes a gain or loss.
The use of futures contracts involves elements of market risk, which may exceed the amounts recognized in the Statement of Assets and Liabilities. Changes in the value of the futures contracts may decrease the effectiveness of the Fund’s strategy and potentially result in loss. With futures, there is minimal counterparty risk to the Fund since futures are exchange traded through a clearing house. The clearing house requires sufficient collateral to cover margins. The Fund, as shown on the Schedule of Investments, had outstanding futures contracts as of June 30, 2010.
An option contract is a contract sold by one party to another party that offers the buyer the right, but not the obligation, to buy (call) or sell (put) a security or other financial asset at an agreed-upon price during a specific period of time or on a specific date. The premium paid by the Fund for the purchase of a call or put option is included in the Fund’s Statement of Assets and Liabilities as an investment and subsequently “marked-to-market” through net unrealized appreciation (depreciation) of options to reflect the current market value of the option as of the end of the reporting period.
The Fund may write (sell) covered options. “Covered” means that so long as the Fund is obligated as the writer of an option, it will own either the underlying securities or currency or an option to purchase the same underlying securities or currency having an expiration date of the covered option and an exercise price equal to or less than the exercise price of the covered option, or will pledge cash or other liquid securities having a value equal to or greater than the fluctuating market value of the option securities or currencies. The Fund receives a premium for writing a call or put option, which is recorded on the Fund’s Statement of Assets and Liabilities and subsequently “marked-to-market” through net unrealized appreciation (depreciation) of options. There is a risk of loss from a change in the value of such options, which may exceed the related premiums received. The maximum amount of loss with respect to the Fund’s written put option is the cost of buying the underlying security or currency. The maximum loss may be offset by proceeds received from selling the underlying securities or currency. As of June 30, 2010, there were no outstanding option contracts.
| 4. | Federal Income Taxes: |
| a) | Federal Income Taxes – For federal income tax purposes, the Fund intends to continue to qualify as a RIC under Subchapter M of the Internal Revenue Code (“IRC”) by distributing substantially all of its taxable net investment income and net realized capital gains to its shareholders and otherwise complying with the requirements of RICs. The Fund has distributed substantially all of its income and capital gains in prior years and intends to distribute substantially all of its income and capital gains prior to the next fiscal year end. Accordingly, no provision for federal income or excise taxes has been made in the accompanying financial statements. Distributions from short-term capital gains are treated as ordinary income distributions for federal income tax purposes. |
| b) | Net Investment Income (Loss), Net Realized Gains (Losses) – Net investment income (loss) and net realized gains (losses) may differ for financial statement and tax purposes primarily because of losses deferred due to wash sale adjustments, foreign currency gains and losses, adjustments related to PFICs, REITs, RICs, certain derivatives and partnerships. The character of distributions made during the year from net investment income or net realized gains may differ from their ultimate characterization for federal income tax purposes. Also, due to the timing of dividend distributions, the fiscal year in which amounts are distributed may differ from the year that the income or realized gains (losses) were recorded by the Fund. |
| c) | Distributions and Components of Distributable Earnings – The tax character of distributions paid by the Fund for the periods indicated is as follows (as adjusted for dividends payable): |
| For the Year Ended | For the Year Ended | |||||||
| December 31, 2009 | December 31, 2008 | |||||||
| Ordinary Income | $ | 117 | $ | 1,146 | ||||
| Long-Term Capital Gains* | — | 4,794 | ||||||
| * | The Fund designates these distributions as long-term capital dividends pursuant to IRC code Sec. 852(b)(3)(C). |
| Hartford Small Company HLS Fund |
Notes to Financial Statements – (continued) |
| June 30, 2010 (Unaudited) |
| (000’s Omitted) |
As of December 31, 2009, the Fund’s components of distributable earnings (deficit) on a tax basis were as follows:
| Amount | ||||
| Undistributed Ordinary Income | $ | 476 | ||
| Accumulated Capital and Other Losses* | (388,285 | ) | ||
Unrealized Appreciation† | 160,864 | |||
| Total Accumulated Deficit | $ | (226,945 | ) | |
| * | The Fund has capital loss carryforwards that are identified in the Capital Loss Carryforward note that follows. |
| † | The difference between book-basis and tax-basis unrealized appreciation (depreciation) may be attributable to the losses deferred due to wash sale adjustments, foreign currency gains and losses, adjustments related to PFICs, REITs, RICs, certain derivatives and partnerships. |
| d) | Reclassification of Capital Accounts – The Fund may record reclassifications in its capital accounts. These reclassifications have no impact on the total net assets of the Fund. The reclassifications are a result of permanent differences between GAAP and tax accounting for such items as net operating losses that reduce distribution requirements. Adjustments are made to reflect the impact these items have on current and future distributions to shareholders. Therefore, the source of the Fund’s distributions may be shown in the accompanying Statement of Changes in Net Assets as from net investment income, from net realized gains on investments or from capital depending on the type of book and tax differences that exist. For the year ended December 31, 2009, the Fund recorded reclassifications to increase (decrease) the accounts listed below: |
| Amount | ||||
| Accumulated Undistributed Net Investment Income | $ | (193 | ) | |
| Accumulated Net Realized Gain (Loss) on Investments | 193 | |||
| e) | Capital Loss Carryforward – At December 31, 2009 (tax-year-end), the Fund had capital loss carryforwards for U.S. federal income tax purposes of approximately: |
| Year of Expiration | Amount | |||
| 2016 | $ | 156,734 | ||
| 2017 | 231,551 | |||
| Total | $ | 388,285 | ||
| f) | Accounting for Uncertainty in Income Taxes – Management has evaluated all open tax years and has determined there is no impact to the Fund’s financial statements related to uncertain tax positions. Generally, tax authorities can examine all tax returns filed for the last three years. |
| 5. | Expenses: |
| a) | Investment Management Agreement – HL Investment Advisors, LLC (“HL Advisors”), an indirect wholly-owned subsidiary of The Hartford, serves as investment manager to the Fund pursuant to an Investment Management Agreement with the Company. As investment manager, HL Advisors has overall investment supervisory responsibility for the Fund. In addition, HL Advisors provides administrative personnel, services, equipment, facilities and office space for proper operation of the Fund. |
HL Advisors has contracted with Hartford Investment Management and Wellington Management for the provision of day-to-day investment management services to the Fund in accordance with the Fund’s investment objective and policies. The Fund pays a fee to HL Advisors, a portion of which may be used to compensate Hartford Investment Management and Wellington Management.
| b) | Administrative Services Agreement – For the two-month period January 1, 2010 through February 28, 2010, under the Administrative Services Agreement between HLIC and the Company, on behalf of the Fund, HLIC provided administrative services to the Fund and received monthly compensation at the annual rate of 0.20% of the Fund’s average daily net assets. The Fund assumed and paid certain other expenses (including, but not limited to, accounting, custodian, state taxes and Directors’ fees). Effective March 1, 2010, the Investment Management Agreement was amended to include the administrative services for the Fund and the separate administrative services agreement was terminated. |
The schedule below reflects the rates of compensation paid to HL Advisors for investment management services and to HLIC for administrative services rendered from January 1, 2010 through February 28, 2010, and the rates of compensation paid to the HL Advisors for the combined services from March 1, 2010 through June 30, 2010; the rates are accrued daily and paid monthly.
| Average Daily Net Assets | Annual Fee | |||
| On first $250 million | 0.7750 | % | ||
| On next $250 million | 0.7250 | % | ||
| On next $500 million | 0.6750 | % | ||
| On next $500 million | 0.6000 | % | ||
| On next $3.5 billion | 0.5500 | % | ||
| On next $5 billion | 0.5300 | % | ||
| Over $10 billion | 0.5200 | % | ||
| c) | Accounting Services Agreement – Pursuant to the Fund Accounting Agreement between HLIC and the Company, on behalf of the Fund, HLIC provides accounting services to the Fund and receives monthly compensation on the Fund’s average net assets. The Fund’s accounting services fees are accrued daily and paid monthly. |
| Average Daily Net Assets | Annual Fee | |||
| On first $5 billion | 0.012 | % | ||
| On Amount Over $5 billion | 0.010 | % | ||
| d) | Operating Expenses – Allocable expenses incurred by the Company are allocated to each Fund and allocated to classes within the Fund in proportion to the average daily net assets of the Fund and each class, except where allocation of certain expenses is more fairly made directly to the Fund or to specific classes within a Fund. |
| e) | Fees Paid Indirectly – The Company, on behalf of the Fund has entered into agreements with State Street Global Advisers, LLC and Russell Implementation Securities, Inc. to partially recapture non-discounted trade commissions. Such rebates are used to pay a portion of the Fund’s expenses. In addition, the Fund’s custodian bank has also agreed to reduce its fees when the Fund maintains cash on deposit in a non-interest-bearing custody account. For the six-month period ended June 30, 2010, these amounts are included in the Statement of Operations. |
The ratio of expenses to average net assets in the accompanying financial highlights excludes the reduction in expenses related to fees paid indirectly. Had the fees paid indirectly been included, the annualized expense ratio for the periods listed below would have been as follows:
| Annualized | ||||||||||||||||||||||||
| Six-Month | Year Ended | Year Ended | Year Ended | Year Ended | Year Ended | |||||||||||||||||||
| Period Ended | December 31, | December 31, | December 31, | December 31, | December 31, | |||||||||||||||||||
| June 30, 2010 | 2009 | 2008 | 2007 | 2006 | 2005 | |||||||||||||||||||
| Class IA | 0.73 | % | 0.73 | % | 0.71 | % | 0.70 | % | 0.70 | % | 0.71 | % | ||||||||||||
| Class IB | 0.98 | 0.98 | 0.96 | 0.95 | 0.95 | 0.96 | ||||||||||||||||||
| Hartford Small Company HLS Fund |
Notes to Financial Statements – (continued) |
| June 30, 2010 (Unaudited) |
| (000’s Omitted) |
| f) | Distribution Plan for Class IB shares – The Company, on behalf of the Fund, has adopted a Distribution Plan pursuant to Rule 12b-1 under the 1940 Act for the Class IB shares. Pursuant to the Distribution Plan, the Fund is authorized to compensate the Distributor, Hartford Securities Distribution Company, Inc. (a wholly owned, ultimate subsidiary of The Hartford), from assets attributable to the Class IB shares for services rendered and expenses borne in connection with activities primarily intended to result in the sale of the Class IB shares, subject to the Fund Board’s review and approval. |
The Distribution Plan provides that the Fund may pay annually up to 0.25% of the average daily net assets of the Fund attributable to its Class IB shares for activities primarily intended to result in the sale of Class IB shares. The Board has the authority to suspend or reduce these payments at any point in time. Under the terms of the Distribution Plan and the principal underwriting agreement, the Fund is authorized to make payments monthly to the Distributor which may be used to pay or compensate entities providing distribution and shareholder servicing with respect to the Class IB shares for such entities’ fees or expenses incurred or paid in that regard. These fees are accrued daily and paid monthly.
| g) | Other Related Party Transactions – Certain officers of the Fund are directors and/or officers of HL Advisors, and/or The Hartford or its subsidiaries. For the six-month period ended June 30, 2010, a portion of the Fund’s chief compliance officer’s salary was paid by all the investment companies in the Hartford fund complex. The portion allocated to the Fund was in the amount of $3. Hartford Investor Services Company, LLC ("HISC"), a wholly owned subsidiary of The Hartford, provides transfer agent services to the Fund. The amount HISC was compensated for providing such services can be found on the Statement of Operations. These fees are accrued daily and paid monthly. |
| h) | Payment from Affiliate – In July of 2007, The Hartford entered into a settlement with the Attorneys General of the states of New York, Connecticut and Illinois relating to market timing and the company's individual variable annuity contracts in which certain payments would be made directly to the variable annuity contract holders. The distribution plan provides that unclaimed money from the settlement would be distributed to certain HLS Funds that are investment options through a Hartford individual variable annuity contract. The unclaimed money was distributed to the Fund on September 18, 2009, as follows: |
| Amount | ||||
| Reimbursement | $ | 1,017 | ||
On June 8, 2007, the Fund was reimbursed for incorrect IPO allocations to the Fund.
On May 2, 2007, the Fund was reimbursed for trading reimbursements relating to the change in portfolio managers of the Fund.
On November 8, 2006, the SEC issued an order setting forth the terms of a settlement reached with three subsidiaries of The Hartford that resolves the SEC’s Division of Enforcement’s investigation of aspects of The Hartford’s variable annuity and mutual fund operations related to directed brokerage and revenue sharing. The Hartford settled this matter without admitting or denying the findings of the SEC.
The Fund is available for purchase by the separate accounts of different variable universal life policies, variable annuity products, and funding agreements and it is offered directly to certain qualified retirement plans (collectively “Products”). Although existing Products contain transfer restrictions, some Products, particularly older variable annuity products, do not contain restrictions on the frequency of transfers. In addition, as the result of the settlement of litigation against Hartford Life, Inc. (“Hartford Life”) (the issuers of such variable annuity products), the Fund’s ability to restrict transfers by certain owners of older variable annuity products was limited. During 2006, these annuity owners surrendered the older variable annuity contracts that were the subject of prior litigation. In February 2005, Hartford Life agreed with the Board of Directors of the Fund to indemnify the Fund for any material harm caused to the Fund from frequent trading by these contracts owners.
The total return in the accompanying financial highlights includes payment from affiliates. Had the payment from affiliates been excluded, the total return for the periods listed below would have been as follows:
| For the Year Ended December 31, 2009 | ||||||||
| Class IA | Class IB | |||||||
| Impact from Payment from Affiliate for Attorneys General Settlement | 0.08 | % | 0.09 | % | ||||
| Total Return Excluding Payments from Affiliate | 29.18 | 28.90 | ||||||
| For the Year Ended December 31, 2007 | ||||||||
| Class IA | Class IB | |||||||
| Impact from Payment from Affiliate for Trading Reimbursements | 0.16 | % | 0.16 | % | ||||
| Impact from Payment from Affiliate for Incorrect IPO Allocations | 0.03 | 0.03 | ||||||
| Total Return Excluding Payments from Affiliate | 14.01 | 13.73 | ||||||
| For the Year Ended December 31, 2006 | ||||||||
| Class IA | Class IB | |||||||
| Impact from Payment from Affiliate for SEC Settlement | 0.14 | % | 0.14 | % | ||||
| Total Return Excluding Payments from Affiliate | 14.29 | 14.00 | ||||||
| For the Year Ended December 31, 2005 | ||||||||
| Class IA | Class IB | |||||||
| Impact from Payment from Affiliate for Unrestricted Transfers | 0.10 | % | 0.10 | % | ||||
| Total Return Excluding Payments from Affiliate | 20.91 | 20.61 | ||||||
| 6. | Investment Transactions: |
For the six-month period ended June 30, 2010, the cost of purchases and proceeds from sales of investment securities (excluding short-term investments) were as follows:
| Amount | ||||
| Cost of Purchases Excluding U.S. Government Obligations | $ | 1,032,398 | ||
| Sales Proceeds Excluding U.S. Government Obligations | 1,107,363 | |||
| 7. | Line of Credit: |
The Fund is one of several Hartford funds that participate in a $500 million committed revolving line of credit facility. The facility is to be used for temporary or emergency purposes. Under the arrangement, a fund is required to own securities having a market value in excess of 300% of the total bank borrowings. The interest rate on borrowings varies depending on the nature of the loan. The facility also requires a fee to be paid based on the amount of the commitment. This fee is allocated to all the funds participating in the line of credit based on the average net assets of the funds. During the six-month period ended June 30, 2010, the Fund did not have any borrowings under this facility.
| Hartford Small Company HLS Fund |
Notes to Financial Statements – (continued) |
| June 30, 2010 (Unaudited) |
| (000’s Omitted) |
| 8. | Industry Classifications: |
Other than the industry classifications “Other Investment Pools and Funds” and “Exchange Traded Funds”, equity industry classifications used in this report are the Global Industry Classification Standard, which was developed by and is the exclusive property and service mark of MSCI, Inc. and Standard & Poor’s.
| 9. | Subsequent Events: |
Effective July 21, 2010, Wellington Management is the sole sub-adviser for the Fund. Hartford Investment Management no longer serves as a sub-adviser to the Fund. The portion of the Fund’s portfolio previously managed by Hartford Investment Management is managed by the Fund’s other sub-adviser, Wellington Management.
[This page is left intentionally blank]
| Hartford Small Company HLS Fund |
| - Selected Per-Share Date (A) - - |
Class | Net Asset Value at Beginning of Period | Net Investment Income (Loss) | Payments from (to) Affiliate | Net Realized and Unrealized Gain (Loss) on Investments | Total from Investment Operations | Dividends from Net Investment Income | Distributions from Realized Capital Gains | Distributions from Capital | Total Distributions | Net Increase (Decrease) in Net Asset Value | Net Asset Value at End of Period | |||||||||||||||||||||||||||||||||
| For the Six-Month Period Ended June 30, 2010 (Unaudited) | ||||||||||||||||||||||||||||||||||||||||||||
| IA | $ | 14.23 | $ | (0.01 | ) | $ | – | $ | (0.48 | ) | $ | (0.49 | ) | $ | – | $ | – | $ | – | $ | – | $ | (0.49 | ) | $ | 13.74 | ||||||||||||||||||
| IB | 13.88 | (0.03 | ) | – | (0.47 | ) | (0.50 | ) | – | – | – | – | (0.50 | ) | 13.38 | |||||||||||||||||||||||||||||
| For the Year Ended December 31, 2009 | ||||||||||||||||||||||||||||||||||||||||||||
| IA | 11.01 | (0.01 | ) | 0.01 | 3.22 | 3.22 | – | – | – | – | 3.22 | 14.23 | ||||||||||||||||||||||||||||||||
| IB | 10.76 | (0.04 | ) | 0.01 | 3.15 | 3.12 | – | – | – | – | 3.12 | 13.88 | ||||||||||||||||||||||||||||||||
| For the Year Ended December 31, 2008 | ||||||||||||||||||||||||||||||||||||||||||||
| IA | 18.62 | 0.02 | – | (7.56 | ) | (7.54 | ) | (0.02 | ) | (0.05 | ) | – | (0.07 | ) | (7.61 | ) | 11.01 | |||||||||||||||||||||||||||
| IB | 18.20 | (0.01 | ) | – | (7.38 | ) | (7.39 | ) | – | (0.05 | ) | – | (0.05 | ) | (7.44 | ) | 10.76 | |||||||||||||||||||||||||||
| For the Year Ended December 31, 2007(H) | ||||||||||||||||||||||||||||||||||||||||||||
| IA | 19.07 | – | 0.04 | 2.57 | 2.61 | (0.05 | ) | (3.01 | ) | – | (3.06 | ) | (0.45 | ) | 18.62 | |||||||||||||||||||||||||||||
| IB | 18.71 | (0.05 | ) | 0.04 | 2.51 | 2.50 | – | (3.01 | ) | – | (3.01 | ) | (0.51 | ) | 18.20 | |||||||||||||||||||||||||||||
| �� | ||||||||||||||||||||||||||||||||||||||||||||
| For the Year Ended December 31, 2006 | ||||||||||||||||||||||||||||||||||||||||||||
| IA | 19.66 | 0.05 | 0.02 | 2.75 | 2.82 | (0.04 | ) | (3.37 | ) | – | (3.41 | ) | (0.59 | ) | 19.07 | |||||||||||||||||||||||||||||
| IB | 19.38 | – | 0.02 | 2.70 | 2.72 | (0.02 | ) | (3.37 | ) | – | (3.39 | ) | (0.67 | ) | 18.71 | |||||||||||||||||||||||||||||
| For the Year Ended December 31, 2005 | ||||||||||||||||||||||||||||||||||||||||||||
| IA | 16.25 | (0.04 | ) | 0.02 | 3.43 | 3.41 | – | – | – | – | 3.41 | 19.66 | ||||||||||||||||||||||||||||||||
| IB | 16.06 | (0.05 | ) | 0.02 | 3.35 | 3.32 | – | – | – | – | 3.32 | 19.38 | ||||||||||||||||||||||||||||||||
| (A) | Information presented relates to a share outstanding throughout the indicated period. |
| (B) | The figures do not include sales charges or other fees which may be applied at the variable life insurance, variable annuity or qualified retirement plan product level. Any such additional sales charges or other fees would lower the Fund's performance. |
| (C) | Ratios do not reflect reductions for fees paid indirectly. Please see Fees Paid Indirectly in the Notes to Financial Statements. |
| (D) | Portfolio turnover rate is calculated on the basis of the Fund as a whole without distinguishing between the classes of shares issued. |
| (E) | Not annualized. |
| (F) | Annualized. |
| (G) | Total return without the inclusion of the Payment from (to) Affiliate can be found in Expenses in the accompanying Notes to Financial Statements. |
| (H) | Per share amounts have been calculated using the average shares method. |
| (I) | During the year ended December 31, 2007, Hartford Small Company HLS Fund received a $12.6 million in-kind subscription of securities from a shareholder in exchange for shares of this fund. This payment- in-kind was excluded from the portfolio turnover rate calculation. |
| - Ratios and Supplemental Data - |
Ratio of Expenses to Average Net | Ratio of Expenses to Average Net | Ratio of Net Investment Income to | Portfolio Turnover | |||||||||||||||||||
| Total Return(B) | Net Assets at End of Period | Assets Before Waivers(C) | Assets After Waivers(C) | Average Net Assets | Rate(D) | |||||||||||||||||
| �� | ||||||||||||||||||||||
| (3.46 | )%(E) | $ | 950,622 | 0.73 | %(F) | 0.73 | %(F) | (0.12 | )%(F) | 87 | % | |||||||||||
| (3.57 | )(E) | 172,891 | 0.98 | (F) | 0.98 | (F) | (0.37 | )(F) | – | |||||||||||||
| 29.29 | (G) | 1,026,150 | 0.75 | 0.75 | (0.07 | ) | 184 | |||||||||||||||
| 29.01 | (G) | 208,358 | 1.00 | 1.00 | (0.32 | ) | – | |||||||||||||||
| (40.60 | ) | 793,078 | 0.71 | 0.71 | 0.16 | 194 | ||||||||||||||||
| (40.73 | ) | 179,411 | 0.96 | 0.96 | (0.09 | ) | – | |||||||||||||||
| 14.23 | (G) | 1,292,444 | 0.70 | 0.70 | (0.02 | ) | 167 | (I) | ||||||||||||||
| 13.94 | (G) | 312,775 | 0.95 | 0.95 | (0.27 | ) | – | |||||||||||||||
| 14.43 | (G) | 1,138,830 | 0.73 | 0.73 | 0.21 | 177 | ||||||||||||||||
| 14.14 | (G) | 304,757 | 0.98 | 0.98 | (0.03 | ) | – | |||||||||||||||
| 21.01 | (G) | 1,017,271 | 0.75 | 0.75 | (0.08 | ) | 106 | |||||||||||||||
| 20.71 | (G) | 220,310 | 1.00 | 1.00 | (0.34 | ) | – | |||||||||||||||
| Hartford Small Company HLS Fund |
The Board of Directors appoints officers who are responsible for the day-to-day operations of the Fund and who execute policies formulated by the Directors. Each director serves until his or her death, resignation, or retirement or until the next annual meeting of shareholders is held or until his or her successor is elected and qualifies.
Directors and officers who are employed by or who have a financial interest in The Hartford are considered “interested” persons of the Fund pursuant to the Investment Company Act of 1940, as amended. Each officer and two of the Company’s directors, as noted in the chart below, are “interested” persons of the Fund. Each director serves as a director for The Hartford Mutual Funds, Inc., The Hartford Mutual Funds II, Inc., The Hartford Income Shares Fund, Inc., Hartford Series Fund, Inc., and Hartford HLS Series Fund II, Inc., which, as of June 30, 2010, collectively consist of 88 funds. Correspondence may be sent to directors and officers c/o Hartford Mutual Funds, P.O. Box 2999, Hartford, Connecticut 06104-2999, except that correspondence to Ms. Fagely may be sent to 500 Bielenberg Drive, Woodbury, Minnesota 55125.
The table below sets forth, for each director and officer, his or her name, year of birth, current position with the Company and date first elected or appointed to Hartford Series Fund, Inc. (“HSF”), and Hartford HLS Series Fund II, Inc. (“HSF2”), principal occupation, and, for directors, other directorships held. The Fund’s statement of additional information contains further information on the directors and is available free of charge by calling 1-800-862-6668 or writing to Hartford HLS Funds, c/o Individual Annuity Services, P.O. Box 5085, Hartford, CT 06102-5085.
Information on the aggregate remuneration paid to the directors of the Company can be found in the Statement of Operations herein. The Fund pays to The Hartford a portion of the chief compliance officer’s compensation, but does not pay salaries or compensation to any of their other officers or directors who are employed by The Hartford.
Non-Interested Directors
Lynn S. Birdsong (1946) Director since 2003, Co-Chairman of the Investment Committee
Mr. Birdsong is a private investor. Since 2003, Mr. Birdsong has been an independent director of The Japan Fund and has served as a Director of the Sovereign High Yield Fund since April 2010. From 2003 to March 2005, Mr. Birdsong was an independent director of the Atlantic Whitehall Funds. From 1979 to 2002, Mr. Birdsong was a managing director of Zurich Scudder Investments, an investment management firm. During his employment with Scudder, Mr. Birdsong was an interested director of The Japan Fund. Since 1981, Mr. Birdsong has been a partner in Birdsong Company, an advertising specialty firm.
Robert M. Gavin, Jr. (1940) Director since 2002 (HSF) and 1986 (HSF2), Chairman of the Board since 2004
Dr. Gavin is an educational consultant. Prior to September 1, 2001, he was President of Cranbrook Education Community and prior to July 1996, he was President of Macalester College, St. Paul, Minnesota.
Duane E. Hill (1945) Director since 2001 (HSF) and 2002 (HSF2), Chairman of the Nominating Committee
Mr. Hill is Partner of TSG Ventures L.P., a private equity investment company. Mr. Hill is a former partner of TSG Capital Group, a private equity investment firm that served as sponsor and lead investor in leveraged buyouts of middle market companies.
Sandra S. Jaffee (1941) Director since 2005
Ms. Jaffee served as Chairman (2008 to 2009) and Chief Executive Officer of Fortent (formerly Searchspace Group), a leading provider of compliance/regulatory technology to financial institutions from August 2005 to August 2009. From August 2004 to August 2005, Ms. Jaffee served as an Entrepreneur in Residence with Warburg Pincus, a private equity firm. From September 1995 to July 2004, Ms. Jaffee served as Executive Vice President at Citigroup, where she was President and Chief Executive Officer of Citibank’s Global Securities Services (1995 to 2003).
William P. Johnston (1944) Director since 2005, Chairman of the Compliance Committee
In June 2006, Mr. Johnston was appointed as Senior Advisor to The Carlyle Group, a global private equity investment firm. In July 2006, Mr. Johnston was elected to the Board of Directors of MultiPlan, Inc. In August 2007, Mr. Johnston was elected to the Board of Directors of LifeCare Holdings, Inc. In February 2008, Mr. Johnston was elected to the Board of Directors of HCR-ManorCare, Inc. In May 2006, Mr. Johnston was elected to the Supervisory Board of Fresenius Medical Care AG & Co. KGaA, after its acquisition of Renal Care Group, Inc. in March 2006. Mr. Johnston joined Renal Care Group in November 2002 as a member of the Board of Directors and served as Chairman of the Board from March 2003 through March 2006. From September 1987 to December 2002, Mr. Johnston was with Equitable Securities Corporation (and its successors, SunTrust Equitable Securities and SunTrust Robinson Humphrey) serving in various investment banking and managerial positions, including Managing Director and Head of Investment Banking, Chief Executive Officer and Vice Chairman.
Phillip O. Peterson (1944) Director since 2002 (HSF) and 2000 (HSF2), Chairman of the Audit Committee
Mr. Peterson is a mutual fund industry consultant. He was a partner of KPMG LLP (an accounting firm) until July 1999. Mr. Peterson joined William Blair Funds in February 2007 as a member of the Board of Trustees. From January 2004 to April 2005, Mr. Peterson served as Independent President of the Strong Mutual Funds.
Lemma W. Senbet (1946) Director since 2005
Dr. Senbet is the William E. Mayer Chair Professor of Finance and Director, Center for Financial Policy, at the University of Maryland, Robert H. Smith School of Business. He was chair of the Finance Department during 1998 to 2006. Previously he was a chaired professor of finance at the University of Wisconsin-Madison. Also, he was director of the Fortis Funds from March 2000 to July 2002. Dr. Senbet served the finance profession in various capacities, including as director of the American Finance Association and President of the Western Finance Association. In 2006, Dr. Senbet was inducted Fellow of Financial Management Association International for his career-long distinguished scholarship and professional service.
Interested Directors and Officers
Lowndes A. Smith (1939) Director since 1996 (HSF) and 2002 (HSF2), Co-Chairman of the Investment Committee
Mr. Smith served as Vice Chairman of The Hartford from February 1997 to January 2002, as President and Chief Executive Officer of Hartford Life, Inc. from February 1997 to January 2002, and as President and Chief Operating Officer of The Hartford Life Insurance Companies from January 1989 to January 2002. Mr. Smith serves as a Director of White Mountains Insurance Group, Ltd., One Beacon Insurance, Symetra Financial and as a Managing Director of Whittington Gray Associates.
John C. Walters 1, 2 (1962) Director since 2008
Mr. Walters currently serves as President, Chief Executive Officer and Director for Hartford Life, Inc. (“HL, Inc.”). Mr. Walters also serves as President, Chairman of the Board, Chief Executive Officer and Director for Hartford Life Insurance Company (“Hartford Life”), and as Executive Vice President of The Hartford. In addition, Mr. Walters is a Manager of HL Investment Advisors, LLC (“HL Advisors”). Mr. Walters previously served as President of the U.S. Wealth Management Division of HL, Inc. (2006-2007) and as Co-Chief Operating Officer of Hartford Life (2007-2008).
1 Mr. Walters previously served as President and Chief Executive Officer (2007 to 2009).
2 Effective July 31, 2010, Mr. Walters retired from The Hartford. Mr. Walters resigned his position as a Director of the Fund effective July 30, 2010.
Other Officers
Robert M. Arena, Jr. (1968) President and Chief Executive Officer since 2009 (served as Vice President of the Fund (2006-2009))
Mr. Arena serves as Executive Vice President of Hartford Life. Additionally, Mr. Arena is Senior Vice President and Director of Hartford Administrative Services Company, (“HASCO”), President, Chief Executive Officer and Manager of Hartford Investment Financial Services, LLC (“HIFSCO”) and President, Chief Executive Officer and Manager of HL Advisors. Mr. Arena joined The Hartford in 2004.
Tamara L. Fagely (1958) Vice President, Treasurer and Controller since 2002 (HSF) 1993 (HSF2)
Ms. Fagely has been a Vice President of HASCO since 1998 and Chief Financial Officer since 2006. Currently Ms. Fagely is a Vice President of Hartford Life. She served as Assistant Vice President of Hartford Life from December 2001 through March 2005. In addition, Ms. Fagely is Controller and Chief Financial Officer of HIFSCO.
Brian Ferrell (1962) AML Compliance Officer since 2008
Mr. Ferrell has served as Assistant Vice President and AML Compliance Officer for The Hartford since 2006, and as AML Compliance Officer for HASCO and Hartford Investor Services Company, LLC (“HISC”) since 2008. Prior to joining The Hartford in 2006, Mr. Ferrell held various positions at the U.S. Department of the Treasury (the “Treasury”) from 2001 to 2006, where he served as Chief Counsel for the Treasury’s Financial Crimes Enforcement Network from 2005-2006.
Dr. Robert J. Froehlich (1953) Senior Managing Director since 2009
Dr. Froehlich joined The Hartford as Senior Managing Director in September 2009. Prior to joining The Hartford, Dr. Froehlich served as Vice Chairman of Deutsche Asset Management from 1997-2009.
| Hartford Small Company HLS Fund |
| Directors and Officers (Unaudited) – (continued) |
Thomas D. Jones, III (1965) Vice President and Chief Compliance Officer since 2006
Mr. Jones serves as Chief Compliance Officer for the Hartford Mutual Funds and Vice President and Director of Securities Compliance for The Hartford. Mr. Jones joined The Hartford in 2006 from SEI Investments, where he served as Chief Compliance Officer for its mutual funds and investment advisers. Prior to joining SEI, Mr. Jones was First Vice President and Compliance Director for Merrill Lynch Investment Managers (Americas) (“MLIM”), where he worked from 1992-2004.
Edward P. Macdonald (1967) Vice President, Secretary and Chief Legal Officer since 2005
Mr. Macdonald serves as Assistant Vice President of Hartford Life and Chief Legal Officer and Vice President of HIFSCO. He also serves as Vice President and Secretary of HASCO, and Chief Legal Officer, Secretary and Vice President of HL Advisors. Mr. Macdonald joined The Hartford in 2005.
Vernon J. Meyer (1964) Vice President since 2006
Mr. Meyer serves as Senior Vice President of Hartford Life. He also serves as Senior Vice President of HIFSCO and HL Advisors. Mr. Meyer joined The Hartford in 2004.
D. Keith Sloane (1960) Vice President since 2009
Mr. Sloane is a Senior Vice President of Hartford Life. Additionally, Mr. Sloane currently serves as Senior Vice President of HIFSCO, HL Advisors, and HASCO. Prior to joining The Hartford in 2007, Mr. Sloane was Director of product marketing and led the mutual fund business for Wachovia Securities (“Wachovia”) in their investment products group. Mr. Sloane joined Wachovia in 1995.
Jane Wolak (1961) Vice President since 2009
Ms. Wolak currently serves as Vice President of Hartford Life. Ms. Wolak joined Hartford Life as Vice President, Retail Product Services in May 2007. She is also Vice President of HASCO. Previously, Ms. Wolak was with Sun Life Financial where she held the position of Vice President, Service Center Operations from 2001-2007.
A description of the policies and procedures that the Fund uses to determine how to vote proxies relating to portfolio securities and a record of how the Fund voted any proxies for the twelve-month period ended June 30, 2010 is available (1) without charge, upon request, by calling 800-862-6668 and (2) on the Securities and Exchange Commission’s website at http://www.sec.gov.
The Fund files a complete schedule of portfolio holdings with the Commission for the first and third quarters of each fiscal year on Form N-Q. The Fund’s Forms are available (1) without charge, upon request, by calling 800-862-6668 and (2) on the Securities and Exchange Commission’s website at http://www.sec.gov. The Form N-Q may be reviewed and copied at the Commission’s Public Reference Room in Washington, DC. Information on the operation of the Public Reference Room may be obtained by calling 1-800-SEC-0330.
| Hartford Small Company HLS Fund |
The following proposals were addressed and approved at a Special Meeting of Shareholders held on February 12, 2010.
Proposal to approve amendments to the Investment Management Agreement between the Fund and HL Investment Advisors, the purpose of which were to combine the administrative services for the Fund with the management services for the Fund under a single agreement.
| Fund | For | Against | Abstain | ||||||
| Hartford Small Company HLS Fund | 43,635,267.383 | 2,410,785.739 | 917,306.337 |
Proposal to elect Lemma Senbet and John Walters, each currently a Director, as Directors of Hartford Series Fund Inc.
Lemma W. Senbet
| Funds | For | Withheld | ||||
| Hartford Series Fund, Inc. | 5,079,578,022.902 | 241,839,974.106 |
John C. Walters
| Funds | For | Withheld | ||||
| Hartford Series Fund, Inc. | 5,081,138,302.186 | 240,279,694.822 |
| Hartford Small Company HLS Fund |
Your Fund's Expenses
As a shareholder of the Fund, you incur two types of costs: (1) transaction costs, including sales charges (loads) on purchase payments and contingent deferred sales charges (CDSC) (2) ongoing costs including management fees; distribution fees; and other fund expenses. This example is intended to help you understand your ongoing costs (in dollars) of investing in the Fund and to compare these costs with the ongoing costs of investing in other mutual funds. The example is based on an investment of $1,000 invested at the beginning of the period and held for the period of December 31, 2009 through June 30, 2010.
Actual Expenses
The first set of columns of the table below provides information about actual account values and actual expenses. You may use the information in this column, together with the amount you invested, to estimate the expenses that you paid over the period. Simply divide your account value by $1,000 (for example, an $8,600 account value divided by $1,000 = 8.6), then multiply the result by the number in the line under the heading entitled "Expenses Paid During Period" to estimate the expenses you paid on your account during this period.
Hypothetical Example for Comparison Purposes
The second set of columns of the table below provides information about hypothetical account values and hypothetical expenses based on the Fund's actual expense ratio and an assumed rate of return of 5% per year before expenses, which is not the Fund's actual return. The hypothetical account values and expenses may not be used to estimate the actual ending account balance or expenses you paid for the period. You may use this information to compare the ongoing costs of investing in the Fund and other funds. To do so, compare this 5% hypothetical example with the 5% hypothetical examples that appear in the shareholder reports of the other funds.
Please note that the expenses shown in the table are meant to highlight your ongoing costs only and do not reflect any transactional costs, such as sales charges (loads) and CDSC. Therefore, the second set of columns of the table is useful in comparing ongoing costs only, and will not help you determine the relative total costs of owning different funds. In addition, if these transactional costs were included, your costs would be higher. Expenses are equal to the Fund's annualized expense ratios multiplied by average account value over the period, multiplied by 181/365 (to reflect the one-half year period).
| Actual return | Hypothetical (5% return before expenses) | |||||||||||||||||||||||||||||||||||
| Expenses paid | Expenses paid | Days in | ||||||||||||||||||||||||||||||||||
| during the period | during the period | the | Days | |||||||||||||||||||||||||||||||||
| Beginning | Ending | December 31, 2009 | Beginning | Ending | December 31, 2009 | Annualized | current | in the | ||||||||||||||||||||||||||||
| Account Value | Account Value | through | Account Value | Account Value | through | expense | 1/2 | full | ||||||||||||||||||||||||||||
| December 31, 2009 | June 30, 2010 | June 30, 2010 | December 31, 2009 | June 30, 2010 | June 30, 2010 | ratio | year | year | ||||||||||||||||||||||||||||
| Class IA | $ | 1,000.00 | $ | 965.40 | $ | 3.56 | $ | 1,000.00 | $ | 1,021.17 | $ | 3.66 | 0.73 | % | 181 | 365 | ||||||||||||||||||||
| Class IB | $ | 1,000.00 | $ | 964.33 | $ | 4.77 | $ | 1,000.00 | $ | 1,019.93 | $ | 4.91 | 0.98 | % | 181 | 365 | ||||||||||||||||||||
| Hartford Small Company HLS Fund |
The Board approved the annual continuation of the Investment Management Agreement (the “Agreement”) between Hartford Series Fund, Inc. (“HSF”) and HL Investment Advisors, LLC (“HL Advisors”) with respect to the Fund at its meeting on August 4-5, 2009. The Board’s considerations in approving the renewal of the Agreement are disclosed in the December 31, 2009 Annual Report for HSF.
At the November 4-5, 2009 meeting, the Board considered and approved amendments to the Agreement to include administrative services, which had been provided pursuant to a separate agreement, and investment management services under one agreement. The Board, including all of the Independent Directors, approved the amendments to the Agreement with respect to the Fund.
In approving the amendments, in addition to the information presented at the August meeting in connection with the annual review of the Agreement and the additional information provided throughout the year, the Board also considered the fact that the amendments did not result in an overall increase in fees to shareholders. The Board took note of the fact that the management of HL Advisors believes that the proposal to combine the administrative services with the investment management services under a single agreement will produce streamlined fee disclosure, resulting in greater transparency and clarity in the Fund’s prospectuses and financial reports. The Board further noted management's belief that the change would result in consistency across all of the Hartford Funds in the complex in that the funds of HSF are the only funds in the complex (other than the R share classes of the Hartford retail funds) that are subject to a separate administrative services fee. Finally, the Board noted management's view that the proposed changes to the Agreement should also serve to simplify the Board's annual consideration of the investment management arrangements for the Fund in that the investment management and administrative fees would be presented as a single fee for fee comparison purposes, which should facilitate the Board's analysis.
The shareholders of the Fund approved the amendments at a Special Meeting of Shareholders held on February 12, 2010. The amendments were effective as of March 1, 2010.
35
The Hartford
P.O. Box 5085
Hartford, CT 06102–5085
Hartford Series Fund, Inc. is underwritten and distributed by Hartford Securities Distribution Company, Inc.
“The Hartford” is The Hartford Financial Services Group, Inc. and its subsidiaries.
Hartford Series Fund, Inc. inception dates range from 1977 to date. Hartford Series Fund, Inc. is not a subsidiary of The Hartford but is underwritten, distributed by and advised by subsidiaries of The Hartford. Investments in Hartford Series Fund, Inc. are not guaranteed by The Hartford or any other entity.
This material is authorized for distribution only when preceded or accompanied by a current prospectus. The prospectus contains detailed information about the Funds, including investment objectives, risks and charges and expenses. Please read it carefully before you invest or send money.
HLSSAR-SC10 Printed in U.S.A ©2010 The Hartford, Hartford, CT 06115 |
| Hartford Stock HLS Fund |
|
Hartford Stock HLS Fund
| Manager Discussions (Unaudited) | 2 |
| Financial Statements | |
| 4 | |
| 6 | |
| 7 | |
| 8 | |
| 9 | |
| 10 | |
| 20 | |
| 22 | |
| 24 | |
| 24 | |
| 25 | |
| 26 | |
| 27 |
This report is prepared for the general information of contract owners and qualified retirement plan participants. It is not an offer of contracts or of qualified retirement plans. It should not be used in connection with any offer, except in conjunction with the appropriate prospectus which contains all pertinent information including the applicable sales, administrative and other charges.
The views expressed in the Fund’s Manager Discussion under ‘‘Why did the Fund perform this way?’’ and ‘‘What is the outlook?’’ are views of the Fund’s subadvisers and portfolio management team through the end of the period and is subject to change based on market and other conditions.
Hartford Stock HLS Fund inception 08/31/1977
(subadvised by Wellington Management Company, LLP)
Investment objective – Seeks long-term growth of capital.
Performance Overview(1) 6/30/00 - - 6/30/10
Growth of $10,000 investment
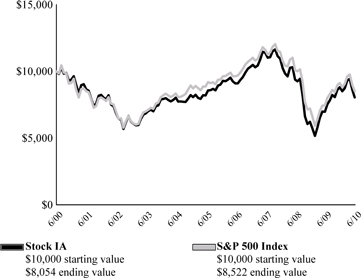
S&P 500 Index is a market capitalization-weighted price index composed of 500 widely held common stocks.
You cannot invest directly in an index.
The chart represents a hypothetical investment in the Fund. Performance data represents past performance and current performance could be higher or lower.
Average Annual Returns (as of 6/30/10)
| 6 | 1 | 5 | 10 | |||||
| Month† | Year | Year | Year | |||||
| Stock IA | -8.57% | 15.44% | -0.35% | -2.14% | ||||
| Stock IB | -8.68% | 15.15% | -0.60% | -2.37% | ||||
| S&P 500 Index | -6.64% | 14.43% | -0.80% | -1.59% |
| † | Not Annualized |
PAST PERFORMANCE IS NOT INDICATIVE OF FUTURE RESULTS.
| (1) | Growth of a $10,000 investment in Class IB shares will vary from the results seen on this page due to differences in the expense charged to this share class. |
Performance information may reflect historical or current expense waivers from the investment adviser, without which performance would have been lower. For information on current expense waivers/reimbursements, please see the prospectus.
The value of the contract will fluctuate so that when redeemed, it may be worth more or less than the original investment. The chart and table do not reflect the deduction of taxes that a shareholder would pay on portfolio distributions or the redemption of portfolio shares. The figures do not include sales charges or other fees which may be applied at the variable life insurance, variable annuity or qualified retirement plan product level. Any such additional sales charges or other fees would lower the Fund’s performance.
| Portfolio Managers | |
| Steven T. Irons, CFA | Peter I. Higgins, CFA |
| Senior Vice President, Partner | Senior Vice President, Partner |
How did the Fund perform?
The Class IA shares of the Hartford Stock HLS Fund returned -8.57% for the six-month period ended June 30, 2010, underperforming its benchmark, the S&P 500 Index, which returned -6.64% for the same period. The Fund also underperformed the -7.67% return of the average fund in the Lipper Large Cap Core Funds VP-UF peer group, a group of funds with investment strategies similar to those of the Fund.
Why did the Fund perform this way?
After posting positive results early in the period, U.S. equities came under pressure during the later part of the period amid rising risk aversion and concerns that the global economy could slip back into recession. At the forefront of investors’ minds were sovereign debt and solvency troubles in the Eurozone, slowing economic growth in China and the U.S., and uncertainty about the sustainability of corporate earnings growth.
Overall equity market performance was negative for the period across all market capitalizations: large cap equities (-7%), mid cap equities (-1%), and small cap equities (-2%) all declined as represented by the S&P 500, S&P 400 MidCap, and Russell 2000 indices, respectively. During the six-month period all ten sectors fell within the S&P 500 Index, led by Materials (-13%), Energy (-12%), and Information Technology (-11%). Industrials (-1%), Consumer Discretionary (-2%) and Consumer Staples (-3%) declined the least on a relative basis.
The Fund’s underperformance versus the benchmark was driven by security selection, which was weakest in Information Technology, Health Care, and Financials. This was partially offset by stronger selection in Industrials and Utilities. Sector positioning, which is a result of bottom-up (i.e. stock by stock fundamental research) security selection, contributed positively to relative performance due to overweight (i.e. the Fund’s sector position was greater than the benchmark position) exposures to Industrials and Consumer Discretionary and underweight (i.e. the Fund’s sector position was less than the benchmark position) exposures to Materials and Energy.
Stocks that detracted the most from relative returns during the period were QUALCOMM (Information Technology), UCB (Health Care), and Invesco (Financials). Shares of Qualcomm, a wireless telecommunications products and services company, fell
during the period. It issued disappointing revenue and earnings guidance due to falling average selling prices for handsets associated with increased price competition. UCB, a biopharmaceutical company, was notified by the Food and Drug Administration that the patch version of its Parkinson's disease drug Neupro would not be approved for sale in the U.S. soon. With the company facing a delay in sales of roughly 2 years, shares fell. Investment management company Invesco disappointed the market with expense growth guidance that exceeded expectations, driving shares lower. Microsoft (Information Technology) and Google (Information Technology) also detracted from absolute returns.
Top contributors to relative (i.e. performance of the Fund as measured against the benchmark) performance during the period were Buck Holdings-Dollar General (Consumer Discretionary), Cummins (Industrials), and PNC Financial (Financials). Retailer Dollar General continues to execute strongly on comparable store sales, square footage growth, and margin improvement plans. Dollar General has also been increasingly successful in attracting more discretionary purchases through improved merchandising and revamped store format, helping drive the company’s share price higher. Shares of Cummins, a manufacturer of engine and power generation systems, moved higher after the company reported strong quarterly revenue and earnings and raised its revenue and earnings guidance for the 2010 fiscal year as end demand recovers. Pittsburgh-based PNC Financial Services strengthened its loan loss reserves and announced better-than-expected accretion from the acquisition of National City, both of which helped the stock price increase in the period. The Fund’s holdings in Boeing (Industrials) and Apple (Information Technology) also contributed positively to the Fund’s returns on an absolute basis.
What is the outlook?
The second quarter of 2010 saw a resurgence of risk aversion. During the quarter investors were forced to confront the impacts of negative news on several fronts: sovereign debt and solvency issues in Europe, concerns about a double-dip global recession and an open-ended oil spill in the Gulf of Mexico. Following on the heels of strong appreciation in risk assets, these events served to reintroduce fear into the investment lexicon.
In the midst of this uncertainty, we continue to focus our efforts on stock-by-stock fundamental research to construct a diversified large-cap core portfolio. We look for companies that exhibit the following qualities: industry leadership, strong balance sheets, solid management, high return on equity, accelerating earnings, and/or attractive valuation with a catalyst. At the end of the period, our bottom-up investment approach resulted in overweight exposures in Health Care, Information Technology, and Consumer Discretionary, as we found a number of attractive investment opportunities in these sectors. The Fund’s largest underweights relative to the S&P 500 Index were in Consumer Staples, Utilities, and Telecommunication Services.
Diversification by Industry
as of June 30, 2010
| Percentage of | ||||
| Industry (Sector) | Net Assets | |||
Automobiles & Components (Consumer Discretionary) | 2.3 | % | ||
| Banks (Financials) | 3.3 | |||
| Capital Goods (Industrials) | 7.5 | |||
Consumer Durables & Apparel (Consumer Discretionary) | 0.8 | |||
| Diversified Financials (Financials) | 10.4 | |||
| Energy (Energy) | 10.5 | |||
| Food & Staples Retailing (Consumer Staples) | 1.1 | |||
| Food, Beverage & Tobacco (Consumer Staples) | 5.6 | |||
| Health Care Equipment & Services (Health Care) | 4.3 | |||
| Household & Personal Products (Consumer Staples) | 0.3 | |||
| Insurance (Financials) | 3.0 | |||
| Materials (Materials) | 2.1 | |||
| Media (Consumer Discretionary) | 2.1 | |||
Pharmaceuticals, Biotechnology & Life Sciences (Health Care) | 12.2 | |||
| Retailing (Consumer Discretionary) | 7.1 | |||
Semiconductors & Semiconductor Equipment (Information Technology) | 1.3 | |||
| Software & Services (Information Technology) | 9.7 | |||
Technology Hardware & Equipment (Information Technology) | 10.0 | |||
| Telecommunication Services (Services) | 0.8 | |||
| Transportation (Industrials) | 3.9 | |||
| Utilities (Utilities) | 1.3 | |||
| Other Assets and Liabilities | 0.4 | |||
| Total | 100.0 | % | ||
| Hartford Stock HLS Fund |
| June 30, 2010 (Unaudited) |
| (000’s Omitted) |
| Shares or Principal Amount | Market Value ╪ | ||||||
| COMMON STOCKS - 99.6% | |||||||
| Automobiles & Components - 2.3% | |||||||
| 1,488 | Ford Motor Co. ● | $ | 14,994 | ||||
| 918 | Harley-Davidson, Inc. | 20,409 | |||||
| 406 | Johnson Controls, Inc. | 10,909 | |||||
| 46,312 | |||||||
| Banks - 3.3% | |||||||
| 294 | PNC Financial Services Group, Inc. | 16,609 | |||||
| 4 | Standard Chartered plc | 105 | |||||
| 1,908 | Wells Fargo & Co. | 48,855 | |||||
| 65,569 | |||||||
| Capital Goods - 7.5% | |||||||
| 134 | 3M Co. | 10,601 | |||||
| 116 | Cummins, Inc. | 7,542 | |||||
| 481 | European Aeronautic Defence and Space Co. | ||||||
| N.V. | 9,819 | ||||||
| 1,505 | General Electric Co. | 21,708 | |||||
| 714 | Ingersoll-Rand plc | 24,616 | |||||
| 794 | Masco Corp. | 8,548 | |||||
| 530 | PACCAR, Inc. | 21,143 | |||||
| 235 | Rockwell Collins, Inc. | 12,486 | |||||
| 102 | Siemens AG ADR | 9,123 | |||||
| 1,356 | Textron, Inc. | 23,017 | |||||
| 148,603 | |||||||
| Consumer Durables & Apparel - 0.8% | |||||||
| 321 | Stanley Black & Decker, Inc. | 16,227 | |||||
| Diversified Financials - 10.4% | |||||||
| 521 | Ameriprise Financial, Inc. | 18,809 | |||||
| 3,168 | Bank of America Corp. | 45,520 | |||||
| 1,432 | Discover Financial Services, Inc. | 20,024 | |||||
| 196 | Goldman Sachs Group, Inc. | 25,703 | |||||
| 1,042 | Invesco Ltd. | 17,534 | |||||
| 1,018 | JP Morgan Chase & Co. | 37,261 | |||||
| 107 | Northern Trust Corp. | 4,974 | |||||
| 507 | SEI Investments Co. | 10,316 | |||||
| 1,959 | UBS AG ADR | 25,904 | |||||
| 206,045 | |||||||
| Energy - 10.5% | |||||||
| 421 | Anadarko Petroleum Corp. | 15,180 | |||||
| 230 | Chevron Corp. | 15,594 | |||||
| 711 | ConocoPhillips Holding Co. | 34,898 | |||||
| 751 | Exxon Mobil Corp. | 42,843 | |||||
| 339 | Hess Corp. | 17,070 | |||||
| 436 | National Oilwell Varco, Inc. | 14,419 | |||||
| 313 | Occidental Petroleum Corp. | 24,179 | |||||
| 185 | Southwestern Energy Co. ● | 7,129 | |||||
| 557 | Suncor Energy, Inc. | 16,412 | |||||
| 131 | Ultra Petroleum Corp. ● | 5,814 | |||||
| 836 | Williams Cos., Inc. | 15,288 | |||||
| 208,826 | |||||||
| Food & Staples Retailing - 1.1% | |||||||
| 767 | CVS/Caremark Corp. | 22,491 | |||||
| Food, Beverage & Tobacco - 5.6% | |||||||
| 700 | General Mills, Inc. | 24,864 | |||||
| 1,110 | Kraft Foods, Inc. | 31,083 | |||||
| 914 | PepsiCo, Inc. | 55,727 | |||||
| 111,674 | |||||||
| Health Care Equipment & Services - 4.3% | |||||||
| 1,711 | Boston Scientific Corp. ● | 9,921 | |||||
| 27 | Intuitive Surgical, Inc. ● | 8,490 | |||||
| 642 | Medtronic, Inc. | 23,282 | |||||
| 327 | St. Jude Medical, Inc. ● | 11,801 | |||||
| 684 | UnitedHealth Group, Inc. | 19,434 | |||||
| 237 | Zimmer Holdings, Inc. ● | 12,821 | |||||
| 85,749 | |||||||
| Household & Personal Products - 0.3% | |||||||
| 110 | Energizer Holdings, Inc. ● | 5,531 | |||||
| Insurance - 3.0% | |||||||
| 210 | ACE Ltd. | 10,832 | |||||
| 551 | Marsh & McLennan Cos., Inc. | 12,418 | |||||
| 503 | Principal Financial Group, Inc. | 11,786 | |||||
| 1,639 | Prudential plc | 12,359 | |||||
| 530 | Unum Group | 11,503 | |||||
| 58,898 | |||||||
| Materials - 2.1% | |||||||
| 554 | Dow Chemical Co. | 13,139 | |||||
| 616 | Monsanto Co. | 28,490 | |||||
| 41,629 | |||||||
| Media - 2.1% | |||||||
| 2,363 | Comcast Corp. Class A | 41,040 | |||||
| Pharmaceuticals, Biotechnology & Life Sciences - 12.2% | |||||||
| 275 | Amgen, Inc. ● | 14,470 | |||||
| 200 | Celgene Corp. ● | 10,144 | |||||
| 1,041 | Daiichi Sankyo Co., Ltd. | 18,605 | |||||
| 1,455 | Elan Corp. plc ADR ● | 6,547 | |||||
| 450 | Eli Lilly & Co. | 15,062 | |||||
| 90 | Forest Laboratories, Inc. ● | 2,480 | |||||
| 160 | Genzyme Corp. ● | 8,128 | |||||
| 282 | Gilead Sciences, Inc. ● | 9,650 | |||||
| 123 | Johnson & Johnson | 7,235 | |||||
| 987 | Merck & Co., Inc. | 34,526 | |||||
| 2,387 | Pfizer, Inc. | 34,040 | |||||
| 474 | Qiagen N.V. ● | 9,116 | |||||
| 109 | Roche Holding AG | 15,053 | |||||
| 964 | Shionogi & Co., Ltd. | 19,994 | |||||
| 741 | UCB S.A. | 23,260 | |||||
| 379 | Vertex Pharmaceuticals, Inc. ● | 12,481 | |||||
| 240,791 | |||||||
| Retailing - 7.1% | |||||||
| 10,986 | Buck Holdings L.P. ⌂●† | 24,770 | |||||
| 528 | Home Depot, Inc. | 14,810 | |||||
| 266 | Kohl's Corp. ● | 12,616 | |||||
| 1,564 | Lowe's Co., Inc. | 31,938 | |||||
| 504 | Nordstrom, Inc. | 16,227 | |||||
| 553 | Staples, Inc. | 10,540 | |||||
| 608 | Target Corp. | 29,900 | |||||
| 140,801 | |||||||
| Semiconductors & Semiconductor Equipment - 1.3% | |||||||
| 264 | Broadcom Corp. Class A | 8,717 | |||||
| 1,003 | Maxim Integrated Products, Inc. | 16,785 | |||||
| 25,502 | |||||||
| Software & Services - 9.7% | |||||||
| 592 | Accenture plc | 22,896 | |||||
| 347 | Adobe Systems, Inc. ● | 9,171 | |||||
The accompanying notes are an integral part of these financial statements.
| Shares or Principal Amount | Market Value ╪ | ||||||
| COMMON STOCKS - 99.6% - (continued) | |||||||
| Software & Services - 9.7% - (continued) | |||||||
| 518 | Automatic Data Processing, Inc. | $ | 20,867 | ||||
| 983 | eBay, Inc. ● | 19,285 | |||||
| 72 | Google, Inc. ● | 32,172 | |||||
| 2,097 | Microsoft Corp. | 48,257 | |||||
| 1,855 | Western Union Co. | 27,665 | |||||
| 918 | Yahoo!, Inc. ● | 12,693 | |||||
| 193,006 | |||||||
| Technology Hardware & Equipment - 10.0% | |||||||
| 217 | Apple, Inc. ● | 54,683 | |||||
| 2,095 | Cisco Systems, Inc. ● | 44,636 | |||||
| 944 | Dell, Inc. ● | 11,378 | |||||
| 1,120 | EMC Corp. ● | 20,494 | |||||
| 301 | Hewlett-Packard Co. | 13,006 | |||||
| 1,421 | Qualcomm, Inc. | 46,666 | |||||
| 150 | Research In Motion Ltd. ● | 7,374 | |||||
| 198,237 | |||||||
| Telecommunication Services - 0.8% | |||||||
| 734 | Vodafone Group plc ADR | 15,170 | |||||
| Transportation - 3.9% | |||||||
| 1,823 | Delta Air Lines, Inc. ● | 21,423 | |||||
| 159 | FedEx Corp. | 11,168 | |||||
| 483 | Kansas City Southern ● | 17,568 | |||||
| 452 | United Parcel Service, Inc. Class B | 25,726 | |||||
| 75,885 | |||||||
| Utilities - 1.3% | |||||||
| 758 | Companhia Energetica de Minas Gerais ADR | 11,121 | |||||
| 1,946 | National Grid plc | 14,205 | |||||
| 25,326 | |||||||
| Total common stocks | |||||||
| (cost $2,048,941) | $ | 1,973,312 | |||||
| WARRANTS - 0.0% | |||||||
| Banks - 0.0% | |||||||
| 459 | Washington Mutual, Inc. Private Placement ⌂●† | $ | – | ||||
| Total warrants | |||||||
| (cost $–) | $ | – | |||||
| Total long-term investments | |||||||
| (cost $2,048,941) | $ | 1,973,312 | |||||
| Total investments | |||||||||||
| (cost $2,048,941) ▲ | 99.6 | % | $ | 1,973,312 | |||||||
| Other assets and liabilities | 0.4 | % | 7,020 | ||||||||
| Total net assets | 100.0 | % | $ | 1,980,332 | |||||||
| Note: | Percentage of investments as shown is the ratio of the total market value to total net assets. Market value of investments in foreign securities represents 10.9% of total net assets at June 30, 2010. Foreign securities that are principally traded on certain foreign markets are adjusted daily pursuant to a third party pricing service methodology approved by the Board of Directors in order to reflect an adjustment for factors occurring after the close of the foreign market but before the close of the New York Stock Exchange. |
| ▲ | At June 30, 2010, the cost of securities for federal income tax purposes was $2,135,347 and the aggregate gross unrealized appreciation and depreciation based on that cost were: |
| Unrealized Appreciation | $ | 117,292 | ||
| Unrealized Depreciation | (279,327 | ) | ||
| Net Unrealized Depreciation | $ | (162,035 | ) |
| † | The aggregate value of securities valued in good faith at fair value as determined under policies and procedures established by and under the supervision of the Fund's Board of Directors at June 30, 2010, was $24,770, which represents 1.25% of total net assets. This amount excludes securities that are principally traded in certain foreign markets and whose prices are adjusted pursuant to a third party pricing service methodology approved by the Board of Directors. |
| ● | Currently non-income producing. |
| ⌂ | The following securities are considered illiquid. Illiquid securities are often purchased in private placement transactions, are often not registered under the Securities Act of 1933 and may have contractual restrictions on resale. A security may also be considered illiquid if the security lacks a readily available market or if its valuation has not changed for a certain period of time. |
| Period | Shares/ | ||||||||
| Acquired | Par | Security | Cost Basis | ||||||
| 06/2007 | 10,986 | Buck Holdings L.P. | $ | 9,392 | |||||
| 04/2008 | 459 | Washington Mutual, Inc. Private Placement Warrants | – | ||||||
The aggregate value of these securities at June 30, 2010 was $24,770 which represents 1.25% of total net assets.
| ╪ | See Significant Accounting Policies of accompanying Notes to Financial Statements regarding valuation of securities. |
The accompanying notes are an integral part of these financial statements.
| Hartford Stock HLS Fund |
| June 30, 2010 (Unaudited) |
| (000’s Omitted) |
| Total | Level 1♦ | Level 2♦ | Level 3 | |||||||||||||
| Assets: | ||||||||||||||||
| Common Stocks ‡ | $ | 1,973,312 | $ | 1,835,142 | $ | 113,400 | $ | 24,770 | ||||||||
| Warrants | – | – | – | – | ||||||||||||
| Total | $ | 1,973,312 | $ | 1,835,142 | $ | 113,400 | $ | 24,770 | ||||||||
| ♦ | For the period ended June 30, 2010, there were no significant transfers between Level 1 and Level 2. |
| ‡ | The Fund has all or primarily all of these equity securities categorized in a single level. Refer to the Schedule of Investments for further industry breakout. |
Following is a reconciliation of Level 3 assets for which significant unobservable inputs were used to determine fair value:
| Balance as | Change in | |||||||||||||||||||||||||||||||||||
| of | Realized | Unrealized | Transfers | Transfers | Balance | |||||||||||||||||||||||||||||||
| December | Gain | Appreciation | Net | Into | Out of | as of June | ||||||||||||||||||||||||||||||
31, 2009 | (Loss) | (Depreciation) | Amortization | Purchases | Sales | Level 3 | Level 3 | 30, 2010 | ||||||||||||||||||||||||||||
| Assets: | ||||||||||||||||||||||||||||||||||||
| Common Stock | $ | 22,973 | $ | (28,997 | ) | $ | 34,277 | * | $ | — | $ | — | $ | (3,483 | ) | $ | — | $ | — | $ | 24,770 | |||||||||||||||
| Warrants | — | — | — | — | — | — | — | — | — | |||||||||||||||||||||||||||
| Total | $ | 22,973 | $ | (28,997 | ) | $ | 34,277 | $ | — | $ | — | $ | (3,483 | ) | $ | — | $ | — | $ | 24,770 | ||||||||||||||||
| * | Change in unrealized gains or losses in the current period relating to assets still held at June 30, 2010 was $2,638. |
The accompanying notes are an integral part of these financial statements.
| Hartford Stock HLS Fund |
| June 30, 2010 (Unaudited) |
| (000’s Omitted) |
| Assets: | ||||
| Investments in securities, at market value (cost $2,048,941) | $ | 1,973,312 | ||
| Receivables: | ||||
| Investment securities sold | 28,954 | |||
| Fund shares sold | 17 | |||
| Dividends and interest | 1,561 | |||
| Total assets | 2,003,844 | |||
| Liabilities: | ||||
| Bank overdraft — U.S. Dollars | 5,324 | |||
| Payables: | ||||
| Investment securities purchased | 16,666 | |||
| Fund shares redeemed | 1,059 | |||
| Investment management fees | 215 | |||
| Distribution fees | 15 | |||
| Accrued expenses | 233 | |||
| Total liabilities | 23,512 | |||
| Net assets | $ | 1,980,332 | ||
| Summary of Net Assets: | ||||
| Capital stock and paid-in-capital | $ | 3,226,257 | ||
| Accumulated undistributed net investment income | 13,752 | |||
| Accumulated net realized loss on investments and foreign currency transactions | (1,184,048 | ) | ||
| Unrealized depreciation of investments and the translations of assets and liabilities denominated in foreign currency | (75,629 | ) | ||
| Net assets | $ | 1,980,332 | ||
| Shares authorized | 4,000,000 | |||
| Par value | $ | 0.001 | ||
Class IA: Net asset value per share | $ | 33.01 | ||
| Shares outstanding | 51,990 | |||
| Net assets | $ | 1,716,165 | ||
Class IB: Net asset value per share | $ | 32.93 | ||
| Shares outstanding | 8,021 | |||
| Net assets | $ | 264,167 | ||
The accompanying notes are an integral part of these financial statements.
| Hartford Stock HLS Fund |
| For the Six-Month Period Ended June 30, 2010 (Unaudited) |
| (000’s Omitted) |
| Investment Income: | ||||
| Dividends | $ | 18,570 | ||
| Interest | 18 | |||
| Less: Foreign tax withheld | (331 | ) | ||
| Total investment income, net | 18,257 | |||
| Expenses: | ||||
| Investment management fees | 4,612 | |||
| Administrative service fees | 753 | |||
| Distribution fees - Class IB | 387 | |||
| Custodian fees | 14 | |||
| Accounting services fees | 114 | |||
| Board of Directors' fees | 28 | |||
| Audit fees | 24 | |||
| Other expenses | 276 | |||
| Total expenses (before fees paid indirectly) | 6,208 | |||
| Commission recapture | (54 | ) | ||
| Total fees paid indirectly | (54 | ) | ||
| Total expenses, net | 6,154 | |||
| Net investment income | 12,103 | |||
| Net Realized Gain on Investments and Foreign Currency Transactions: | ||||
| Net realized gain on investments | 99,592 | |||
| Net realized loss on forward foreign currency contracts | (195 | ) | ||
| Net realized gain on other foreign currency transactions | 174 | |||
| Net Realized Gain on Investments and Foreign Currency Transactions | 99,571 | |||
| Net Changes in Unrealized Depreciation of Investments: | ||||
| Net unrealized depreciation of investments | (294,245 | ) | ||
| Net unrealized appreciation on translation of other assets and liabilities in foreign currencies | — | |||
| Net Changes in Unrealized Depreciation of Investments | (294,245 | ) | ||
| Net Loss on Investments and Foreign Currency Transactions | (194,674 | ) | ||
| Net Decrease in Net Assets Resulting from Operations | $ | (182,571 | ) | |
The accompanying notes are an integral part of these financial statements.
| Hartford Stock HLS Fund |
| (000’s Omitted) |
| For the | ||||||||
| Six-Month | For the | |||||||
| Period Ended | Year Ended | |||||||
| June 30, 2010 | December 31, | |||||||
| (Unaudited) | 2009 | |||||||
| Operations: | ||||||||
| Net investment income | $ | 12,103 | $ | 30,215 | ||||
| Net realized gain (loss) on investments and foreign currency transactions | 99,571 | (522,867 | ) | |||||
| Net unrealized appreciation (depreciation) of investments | (294,245 | ) | 1,245,784 | |||||
| Payment from affiliate | — | 90 | ||||||
| Net increase (decrease) in net assets resulting from operations | (182,571 | ) | 753,222 | |||||
| Distributions to Shareholders: | ||||||||
| From net investment income | ||||||||
| Class IA | — | (27,974 | ) | |||||
| Class IB | — | (3,748 | ) | |||||
| Total distributions | — | (31,722 | ) | |||||
| Capital Share Transactions: | ||||||||
| Class IA | ||||||||
| Sold | 21,742 | 48,050 | ||||||
| Issued on reinvestment of distributions | — | 27,974 | ||||||
| Redeemed | (202,744 | ) | (454,561 | ) | ||||
| Total capital share transactions | (181,002 | ) | (378,537 | ) | ||||
| Class IB | ||||||||
| Sold | 8,829 | 16,986 | ||||||
| Issued on reinvestment of distributions | — | 3,748 | ||||||
| Redeemed | (48,426 | ) | (78,853 | ) | ||||
| Total capital share transactions | (39,597 | ) | (58,119 | ) | ||||
| Net decrease from capital share transactions | (220,599 | ) | (436,656 | ) | ||||
| Net increase (decrease) in net assets | (403,170 | ) | 284,844 | |||||
| Net Assets: | ||||||||
| Beginning of period | 2,383,502 | 2,098,658 | ||||||
| End of period | $ | 1,980,332 | $ | 2,383,502 | ||||
Accumulated undistributed (distribution in excess of) net investment income | $ | 13,752 | $ | 1,649 | ||||
| Shares: | ||||||||
| Class IA | ||||||||
| Sold | 587 | 1,658 | ||||||
| Issued on reinvestment of distributions | — | 796 | ||||||
| Redeemed | (5,524 | ) | (15,542 | ) | ||||
| Total share activity | (4,937 | ) | (13,088 | ) | ||||
| Class IB | ||||||||
| Sold | 237 | 585 | ||||||
| Issued on reinvestment of distributions | — | 107 | ||||||
| Redeemed | (1,319 | ) | (2,726 | ) | ||||
| Total share activity | (1,082 | ) | (2,034 | ) | ||||
The accompanying notes are an integral part of these financial statements.
| Hartford Stock HLS Fund |
| June 30, 2010 (Unaudited) |
| (000’s Omitted) |
| 1. | Organization: |
Hartford Stock HLS Fund (the "Fund") serves as an underlying investment option for certain variable annuity and variable life insurance separate accounts of Hartford Life Insurance Company (“HLIC”) and its affiliates and certain qualified retirement plans. The Fund may also serve as an underlying investment option for certain variable annuity and variable life separate accounts of other insurance companies. Owners of variable annuity contracts and policyholders of variable life insurance contracts may choose the funds permitted in the variable insurance contract prospectus. In addition, participants in certain qualified retirement plans may choose the fund if permitted by their plans.
Hartford Series Fund, Inc. (the “Company”) is an open-end registered management investment company comprised of twenty-nine portfolios, one portfolio of which is included in these financial statements.
The Company is organized under the laws of the State of Maryland and is registered with the Securities and Exchange Commission (“SEC”) under the Investment Company Act of 1940, as amended (“1940 Act”). The Fund is organized as a diversified open-end management investment company.
The Fund is divided into Class IA and Class IB shares. Each class is offered at the per share net asset value (“NAV”) without a sales charge and is subject to the same expenses, except that the Class IB shares are subject to distribution and service fees charged pursuant to a Distribution and Service Plan adopted in accordance with Rule 12b-1 under the 1940 Act.
| 2. | Significant Accounting Policies: |
The following is a summary of significant accounting policies of the Fund, which are in accordance with U.S. Generally Accepted Accounting Principles (“GAAP”).
| a) | Security Transactions and Investment Income – Security transactions are recorded on the trade date (the date the order to buy or sell is executed). Security gains and losses are determined on the basis of identified cost. |
Dividend income is accrued as of the ex-dividend date, except that certain dividends for foreign securities where the ex-dividend date may have passed are recorded as soon as the Fund is informed of the dividend in the exercise of reasonable diligence. Interest income, including amortization of premium and accretion of discounts, is accrued on a daily basis.
| b) | Security Valuation – The Fund generally uses market prices in valuing portfolio securities. If market prices are not readily available or are deemed unreliable, the Fund will use the fair value of the security as determined in good faith under policies and procedures established by and under the supervision of the Fund’s Board of Directors. Market prices may be deemed unreliable, for example, if a security is thinly traded or if an event has occurred after the close of the security’s primary market, but before the close of the New York Stock Exchange (the “Exchange”) (generally 4:00 p.m. Eastern Time, referred to as the “Valuation Time”) that is expected to affect the value of the portfolio security. The circumstances in which the Fund may use fair value pricing include, among others: (i) the occurrence of events that are significant to a particular issuer, such as mergers, restructuring or defaults; (ii) the occurrence of events that are significant to an entire market, such as natural disasters in a particular region or governmental actions; (iii) trading restrictions on securities; (iv) thinly traded securities and (v) market events such as trading halts and early market closings. In addition, with respect to the valuation of stocks primarily traded on foreign markets, the Fund uses a fair value pricing service approved by the Fund’s Board of Directors, which employs quantitative models that evaluate changes in the value of foreign market proxies (e.g., futures contracts, American Depositary Receipts (“ADRs”), exchange traded funds (“ETFs”)) after the close of the foreign markets but before the Valuation Time. Securities that are primarily traded on foreign markets may trade on days that are not business days of the Fund. The value of the foreign securities in which the Fund invests may change on days when a shareholder will not be able to purchase or redeem shares of the Fund. Fair value pricing is subjective in nature and the use of fair value pricing by the Fund may cause the NAV of its shares to differ significantly from the NAV that would have been calculated using market prices at the close of the exchange on which a portfolio security is primarily traded but before the Valuation Time. There can be no |
assurance that the Fund could obtain the fair value assigned to a security if the Fund were to sell the security at approximately the time at which the Fund determines its NAV.
Exchange-traded equity securities are valued at the last reported sale price or official close price on the exchange or market on which the security is primarily traded (the “Primary Market”) at the Valuation Time. If the security did not trade on the Primary Market, it may be valued at the Valuation Time at the last reported sale price on another exchange where it trades. The value of an equity security not traded on any exchange but traded on the Nasdaq Stock Market, Inc. or another over-the-counter market shall be valued at the last reported sale price or official closing price on the exchange or market on which the security is traded as of the Valuation Time.
Foreign-denominated assets, including investment securities, and liabilities are translated from the local currency into U.S. dollars using exchange rates obtained from an independent third party as of the Fund’s Valuation Time.
Financial instruments for which prices are not available from an independent pricing service may be valued using market quotations obtained from one or more dealers that make markets in securities in accordance with procedures established by the Fund’s Board of Directors.
Forward foreign currency contracts represent agreements to exchange currencies on specific future dates at predetermined rates. Forward foreign currency contracts are valued using foreign currency exchange rates and forward rates on the Valuation Date from an independent pricing service.
Other derivative or contractual type instruments shall be valued using market prices if such instruments trade on an exchange or market. If such instruments do not trade on an exchange or market, such instruments shall be valued at a price at which the counterparty to such contract would repurchase the instrument. In the event that the counterparty cannot provide a price, such valuation may be determined in accordance with procedures established by the Fund’s Board of Directors.
Various inputs are used in determining the value of the Fund’s investments. These inputs are summarized into three broad hierarchy levels. This hierarchy is based on whether the valuation inputs are observable or unobservable. These levels are:
| · | Level 1 – Quoted prices in active markets for identical securities. Level 1 may include exchange-traded instruments such as domestic equities, some foreign equities, options, futures, mutual funds, ETFs, and rights and warrants. | |
| · | Level 2 – Observable inputs other than Level 1 prices, such as quoted prices for similar securities; quoted prices in markets that are not active; or other inputs that are observable or can be corroborated by observable market data. Level 2 may include debt securities that are traded less frequently than exchange-traded instruments and which are valued using third party pricing services. Prices for most level 2 securities are based on prices received from an independent pricing service. The following asset classes generally use valuation techniques and inputs as noted below: |
Asset Backed Securities and Collateralized Mortgage Obligations – Multi-dimensional spread/prepayment speed tables, with consideration of yield or price of bonds of comparable quality, coupon and maturity, attributes of the collateral, new issue data and monthly payment information.
Corporate Bonds – Multi-dimensional relational model based on observable market information such as yields, spreads, sector analysis, etc.
| Hartford Stock HLS Fund |
| Notes to Financial Statements – (continued) |
| June 30, 2010 (Unaudited) |
| (000’s Omitted) |
Foreign Currency – based on rates determined at the close of the Exchange, provided by an independent pricing service.
Forward Currency Contracts – valued based on the price of the underlying currency at the prevailing interpolated exchange rate, which is a combination of the spot currency rate and the forward currency rate, provided by an independent pricing service.
Foreign Equities – Certain foreign equities are priced using a multi-factor regression model with market observable inputs of a correlative nature (ADRs, futures contracts, ETFs, and currency exchange rates).
International Fixed Income – Multi-dimensional relational model based on observable market information such as benchmark yields, reported trades, bids and offers.
Money Market Instruments – Amortized cost.
Mortgage Backed Securities (“MBS”) – Matrix pricing using inputs of To-Be-Announced (“TBA”) prices, new issue data and monthly payment information, with consideration of yield or price of bonds of comparable quality, coupon and maturity, and attributes of the collateral.
Municipal Bonds – Multi-dimensional relational model and series of matrices based on observable market information such as Municipal Securities Rulemaking Board reported trades, comparable bonds, yields, spreads and credit analysis.
Preferred Stocks – Close mean of bid/ask or bid.
Repurchase Agreements – Priced at par.
Senior Floating Rate Interests – Composite of quotes from one or more contributing dealers.
Swaps – Price based upon observable market information from an independent pricing service.
U.S. Government Securities – Treasuries exclusively traded in the secondary market.
| · | Level 3 – Significant unobservable inputs that are supported by limited or no market activity. Level 3 may include financial instruments whose values are determined using broker quotes or require significant management judgment or estimation. While these securities are priced using unobservable inputs, the valuation of these securities reflects the best available data and management believes the prices are a reasonable representation of exit price. The following asset classes generally use valuation techniques and inputs as noted below: |
Asset Backed Securities & Commercial Mortgage Backed Securities – Certain other MBS with limited liquidity priced from an independent pricing service.
Common Stocks – Trading has been halted or there are restrictions on trading. Valuation is based on last trade with the application of a discount or premium, if applicable.
Long Dated Over-the-Counter Options – Terms greater than 10 years from current date, expected volatility is not observable. Prices are from an independent pricing service.
Long Term Debt Securities, including Senior Floating Rate Interests – Unobservable valuation inputs may include estimates for current yields, maturity/duration, prepayment speed, and broker quotes for comparable securities along with other assumptions relating to credit quality, collateral value, complexity of the security structure, general market conditions and liquidity.
Swaps – Terms greater than 10 years from current date, expected volatility is not observable. Prices are from an independent pricing service.
Individual securities within any of the above mentioned asset classes may be assigned a different hierarchical level than those that are presented above, as individual circumstances dictate.
For purposes of reporting transfers between different hierarchy levels, both transfers in and out of each level are shown as if they occurred at the beginning of the period.
Refer to the Investment Valuation Hierarchy Levels Summary and the Level 3 roll forward reconciliation found following the Schedules of Investments.
| c) | Foreign Currency Transactions – Assets and liabilities denominated in currencies other than U.S. dollars are translated into U.S. dollars at the exchange rates in effect on the valuation date. Purchases and sales of investment securities, income and expenses are translated into U.S. dollars at the exchange rates on the dates of such transactions. |
The Fund does not isolate that portion of portfolio security valuation resulting from fluctuations in the foreign currency exchange rates from the fluctuations arising from changes in the market prices of securities held. Exchange rate fluctuations are included with the net realized and unrealized gain or loss on investments in the accompanying financial statements.
Net realized foreign exchange gains or losses arise from sales of foreign currencies and the difference between asset and liability amounts initially stated in foreign currencies and the U.S. dollar value of the amounts actually received or paid. Net unrealized foreign exchange gains or losses arise from changes in the value of other assets and liabilities at the end of the reporting period, resulting from changes in the exchange rates.
| d) | Joint Trading Account – Pursuant to an exemptive order issued by the SEC, the Fund may transfer uninvested cash balances into a joint trading account managed by Wellington Management Company, LLP (“Wellington Management”). These balances may be invested in one or more repurchase agreements and/or short-term money market instruments. | |
| e) | Repurchase Agreements – A repurchase agreement is an agreement by which a counterparty agrees to sell a security and agrees to repurchase the security sold at a mutually agreed upon time and price. At the time the Fund enters into a repurchase agreement, the value of the underlying collateral security(ies), including accrued interest, will be equal to or exceed the value of the repurchase agreement. To minimize counterparty risk, the securities that serve to collateralize the repurchase agreement are held by the Fund's custodian in book entry or physical form in the custodial account of the Fund or in a third party custodial account. Repurchase agreements are valued at cost plus accrued interest. The Fund had no outstanding repurchase agreements as of June 30, 2010. |
| f) | Forward Foreign Currency Contracts – The Fund may enter into forward foreign currency contracts that obligate the Fund to purchase or sell currencies at specified future dates. Forward foreign currency contracts may be used to hedge against adverse fluctuations in exchange rates between currencies. |
Forward foreign currency contracts involve elements of market risk in excess of the amounts reflected in the Statement of Assets and Liabilities. In addition, risks may arise upon entering into these contracts from the potential inability of the counterparties to meet the terms of the contracts and from unanticipated movements in the value of the foreign currencies relative to the U.S. dollar. The Fund had no outstanding forward foreign currency contracts as of June 30, 2010.
| g) | Fund Share Valuation and Dividend Distributions to Shareholders – Orders for the Fund’s shares are executed in accordance with the investment instructions of the contract holders or plan participants. The NAV of the Fund’s shares is determined as of the close of each business day of the Exchange. The NAV is determined separately for each class of the |
| Hartford Stock HLS Fund |
| Notes to Financial Statements – (continued) |
| June 30, 2010 (Unaudited) |
| (000’s Omitted) |
Fund by dividing the Fund’s net assets attributable to that class by the number of outstanding shares of the class. Orders for the purchase of the Fund’s shares received by an insurance company or plan prior to the close of the Exchange on any day on which the Exchange is open for business are priced at the NAV determined as of the close of the Exchange. Orders received by an insurance company or plan after the close of the Exchange, or on a day on which the Exchange and/or the Fund is not open for business, are priced at the next determined NAV.
Dividends are declared pursuant to a policy adopted by the Fund’s Board of Directors based upon the investment performance of the Fund. The policy of the Fund is to pay dividends from net investment income and distribute realized capital gains, if any, at least once a year.
Distributions from net investment income, realized capital gains and capital are determined in accordance with federal income tax regulations, which may differ from U.S. GAAP with respect to character and timing. These differences may include but are not limited to losses deferred due to wash sale adjustments, foreign currency gains and losses, adjustments related to Passive Foreign Investment Companies (“PFICs”), Real Estate Investment Trusts (“REITs”), Regulated Investment Companies (“RICs”), certain derivatives and partnerships. Permanent book and federal income tax basis differences relating to shareholder distributions will result in reclassifications to certain of the Fund’s capital accounts (see Federal Income Taxes: Reclassification of Capital Accounts note).
| h) | Illiquid and Restricted Securities – The Fund is permitted to invest up to 15% of its net assets in illiquid securities. “Illiquid Securities” are those that may not be sold or disposed of in the ordinary course of business within seven days, at approximately the price used to determine the Fund’s NAV. The Fund may not be able to sell illiquid securities or other investments when its sub-adviser considers it desirable to do so or may have to sell such securities or investments at a price that is lower than the price that could be obtained if the securities or investments were more liquid. A sale of illiquid securities or other investments may require more time and may result in higher dealer discounts and other selling expenses than does the sale of those that are liquid. Illiquid securities and investments also may be more difficult to value, due to the unavailability of reliable market quotations for such securities or investments, and an investment in them may have an adverse impact on the Fund’s NAV. The Fund may also purchase certain restricted securities, commonly known as Rule 144A securities, that can be resold to institutions and which may be determined to be liquid pursuant to policies and guidelines established by the Fund’s Board of Directors. The Fund, as shown on the Schedule of Investments, had illiquid and/or restricted securities as of June 30, 2010. |
| i) | Use of Estimates – The preparation of financial statements in conformity with U.S. GAAP requires management to make estimates and assumptions that affect the reported amounts of assets and liabilities as of the date of the financial statements and the reported amounts of income and expenses during the period. Operating results in the future could vary from the amounts derived from management’s estimates. |
| j) | Additional Derivative Instrument(s) Information |
The volume of derivative activity was minimal during the six-month period ended June 30, 2010.
Realized Gain/Loss on Derivative Instruments for the six-month period ended June 30, 2010:
| Amount of Realized Gain or (Loss) on Derivatives Recognized in Income | ||||||||||||||||||||||||
| Forward | ||||||||||||||||||||||||
| Purchased | Currency | |||||||||||||||||||||||
| Risk Exposure Category | Written Options | Options | Futures | Contracts | Swaps | Total | ||||||||||||||||||
| Foreign exchange contracts | $ | — | $ | — | $ | — | $ | (195 | ) | $ | — | $ | (195 | ) | ||||||||||
| Total | $ | — | $ | — | $ | — | $ | (195 | ) | $ | — | $ | (195 | ) | ||||||||||
| k) | Indemnifications – Under the Company’s organizational documents, the Company shall indemnify its officers and directors to the full extent required or permitted under Maryland General Corporation Law and the federal securities laws. In addition, the Company, on behalf of the Fund, may enter into contracts that contain a variety of indemnifications. The Company’s maximum exposure under these arrangements is unknown. However, the Company has not had prior claims or losses pursuant to these contracts and expects the risk of loss to be remote. |
| 3. | Federal Income Taxes: |
| a) | Federal Income Taxes – For federal income tax purposes, the Fund intends to continue to qualify as a RIC under Subchapter M of the Internal Revenue Code (“IRC”) by distributing substantially all of its taxable net investment income and net realized capital gains to its shareholders and otherwise complying with the requirements of RICs. The Fund has distributed substantially all of its income and capital gains in prior years and intends to distribute substantially all of its income and capital gains prior to the next fiscal year end. Accordingly, no provision for federal income or excise taxes has been made in the accompanying financial statements. Distributions from short-term capital gains are treated as ordinary income distributions for federal income tax purposes. |
| b) | Net Investment Income (Loss), Net Realized Gains (Losses) – Net investment income (loss) and net realized gains (losses) may differ for financial statement and tax purposes primarily because of losses deferred due to wash sale adjustments, foreign currency gains and losses, adjustments related to PFICs, REITs, RICs, certain derivatives and partnerships. The character of distributions made during the year from net investment income or net realized gains may differ from their ultimate characterization for federal income tax purposes. Also, due to the timing of dividend distributions, the fiscal year in which amounts are distributed may differ from the year that the income or realized gains (losses) were recorded by the Fund. |
| c) | Distributions and Components of Distributable Earnings – The tax character of distributions paid by the Fund for the periods indicated is as follows (as adjusted for dividends payable): |
| For the Year Ended | For the Year Ended | |||||||
| December 31, 2009 | December 31, 2008 | |||||||
| Ordinary Income | $ | 31,722 | $ | 78,096 | ||||
| Long-Term Capital Gains* | — | 6,404 | ||||||
| * | The Fund designates these distributions as long-term capital dividends pursuant to IRC code Sec. 852(b)(3)(C). |
As of December 31, 2009, the Fund’s components of distributable earnings (deficit) on a tax basis were as follows:
| Amount | ||||
| Undistributed Ordinary Income | $ | 1,649 | ||
| Accumulated Capital and Other Losses* | (1,197,213 | ) | ||
Unrealized Appreciation† | 132,210 | |||
| Total Accumulated Deficit | $ | (1,063,354 | ) | |
| * | The Fund has capital loss carryforwards that are identified in the Capital Loss Carryforward note that follows. |
| † | The difference between book-basis and tax-basis unrealized appreciation (depreciation) may be attributable to the losses deferred due to wash sale adjustments, foreign currency gains and losses, adjustments related to PFICs, REITs, RICs, certain derivatives and partnerships. |
| Hartford Stock HLS Fund |
| Notes to Financial Statements – (continued) |
| June 30, 2010 (Unaudited) |
| (000’s Omitted) |
| d) | Reclassification of Capital Accounts – The Fund may record reclassifications in its capital accounts. These reclassifications have no impact on the total net assets of the Fund. The reclassifications are a result of permanent differences between GAAP and tax accounting for such items as net operating losses that reduce distribution requirements. Adjustments are made to reflect the impact these items have on current and future distributions to shareholders. Therefore, the source of the Fund’s distributions may be shown in the accompanying Statement of Changes in Net Assets as from net investment income, from net realized gains on investments or from capital depending on the type of book and tax differences that exist. For the year ended December 31, 2009, the Fund recorded reclassifications to increase (decrease) the accounts listed below: |
| Amount | ||||
| Accumulated Undistributed Net Investment Income | $ | (338 | ) | |
| Accumulated Net Realized Gain (Loss) on Investments | 340 | |||
| Paid-in-Capital | (2 | ) | ||
| e) | Capital Loss Carryforward – At December 31, 2009 (tax-year-end), the Fund had capital loss carryforwards for U.S. federal income tax purposes of approximately: |
| Year of Expiration | Amount | |||
| 2016 | $ | 431,980 | ||
| 2017 | 738,282 | |||
| Total | $ | 1,170,262 | ||
| As of December 31, 2009, the Fund elected to defer the following post October losses. | ||||
| Amount | ||||
| Long-Term Capital Gain | $ | 26,951 | ||
| f) | Accounting for Uncertainty in Income Taxes – Management has evaluated all open tax years and has determined there is no impact to the Fund’s financial statements related to uncertain tax positions. Generally, tax authorities can examine all tax returns filed for the last three years. |
| 4. | Expenses: |
| a) | Investment Management Agreements – HL Investment Advisors, LLC (“HL Advisors”), an indirect wholly-owned subsidiary of The Hartford Financial Services Group, Inc. (“The Hartford”), serves as investment manager to the Fund pursuant to an Investment Management Agreement with the Company. As investment manager, HL Advisors has overall investment supervisory responsibility for the Fund. In addition, HL Advisors provides administrative personnel, services, equipment, facilities and office space for proper operation of the Fund. |
HL Advisors has contracted with Wellington Management for the provision of day-to-day investment management services to the Fund in accordance with the Fund’s investment objective and policies. The Fund pays a fee to HL Advisors, a portion of which may be used to compensate Wellington Management.
| b) | Administrative Services Agreement – For the two-month period January 1, 2010 through February 28, 2010, under the Administrative Services Agreement between HLIC and the Company, on behalf of the Fund, HLIC provided administrative services to the Fund and received monthly compensation at the annual rate of 0.20% of the Fund’s average daily net assets. The Fund assumed and paid certain other expenses (including, but not limited to, accounting, custodian, state taxes and Directors’ fees). Effective March 1, 2010, the Investment Management Agreement was amended to include the administrative services for the Fund and the separate administrative services agreement was terminated. |
The schedule below reflects the rates of compensation paid to HL Advisors for investment management services and to HLIC for administrative services rendered from January 1, 2010 through February 28, 2010, and the rates of compensation paid to the HL Advisors for the combined services from March 1, 2010 through June 30, 2010; the rates are accrued daily and paid monthly.
| Average Daily Net Assets | Annual Fee | |||
| On first $250 million | 0.5250 | % | ||
| On next $250 million | 0.5000 | % | ||
| On next $500 million | 0.4750 | % | ||
| On next $4 billion | 0.4500 | % | ||
| On next $5 billion | 0.4475 | % | ||
| Over $10 billion | 0.4450 | % | ||
| c) | Accounting Services Agreement – Pursuant to the Fund Accounting Agreement between HLIC and the Company, on behalf of the Fund, HLIC provides accounting services to the Fund and receives monthly compensation on the Fund’s average net assets. The Fund’s accounting services fees are accrued daily and paid monthly. |
| Average Daily Net Assets | Annual Fee | |||
| All Assets | 0.010 | % | ||
| d) | Operating Expenses – Allocable expenses incurred by the Company are allocated to each Fund and allocated to classes within the Fund in proportion to the average daily net assets of the Fund and each class, except where allocation of certain expenses is more fairly made directly to the Fund or to specific classes within a Fund. |
| e) | Fees Paid Indirectly – The Company, on behalf of the Fund has entered into agreements with State Street Global Advisers, LLC and Russell Implementation Securities, Inc. to partially recapture non-discounted trade commissions. Such rebates are used to pay a portion of the Fund’s expenses. In addition, the Fund’s custodian bank has also agreed to reduce its fees when the Fund maintains cash on deposit in a non-interest-bearing custody account. For the six-month period ended June 30, 2010, these amounts are included in the Statement of Operations. |
The ratio of expenses to average net assets in the accompanying financial highlights excludes the reduction in expenses related to fees paid indirectly. Had the fees paid indirectly been included, the annualized expense ratio for the periods listed below would have been as follows:
| Annualized | ||||||||||||||||||||||||
| Six-Month | Year Ended | Year Ended | Year Ended | Year Ended | Year Ended | |||||||||||||||||||
| Period Ended | December 31, | December 31, | December 31, | December 31, | December 31, | |||||||||||||||||||
| June 30, 2010 | 2009 | 2008 | 2007 | 2006 | 2005 | |||||||||||||||||||
| Class IA | 0.51 | % | 0.50 | % | 0.48 | % | 0.48 | % | 0.47 | % | 0.48 | % | ||||||||||||
| Class IB | 0.76 | 0.75 | 0.73 | 0.73 | 0.72 | 0.73 | ||||||||||||||||||
| f) | Distribution Plan for Class IB shares – The Company, on behalf of the Fund, has adopted a Distribution Plan pursuant to Rule 12b-1 under the 1940 Act for the Class IB shares. Pursuant to the Distribution Plan, the Fund is authorized to compensate the Distributor, Hartford Securities Distribution Company, Inc. (a wholly owned, ultimate subsidiary of The Hartford), from assets attributable to the Class IB shares for services rendered and expenses borne in connection with activities primarily intended to result in the sale of the Class IB shares, subject to the Fund Board’s review and approval. |
The Distribution Plan provides that the Fund may pay annually up to 0.25% of the average daily net assets of the Fund attributable to its Class IB shares for activities primarily intended to result in the sale of Class IB shares. The Board has the authority to suspend or reduce these payments at any point in time. Under the terms of the Distribution Plan and the
| Hartford Stock HLS Fund |
| Notes to Financial Statements – (continued) |
| June 30, 2010 (Unaudited) |
| (000’s Omitted) |
principal underwriting agreement, the Fund is authorized to make payments monthly to the Distributor which may be used to pay or compensate entities providing distribution and shareholder servicing with respect to the Class IB shares for such entities’ fees or expenses incurred or paid in that regard. These fees are accrued daily and paid monthly.
| g) | Other Related Party Transactions – Certain officers of the Fund are directors and/or officers of HL Advisors, and/or The Hartford or its subsidiaries. For the six-month period ended June 30, 2010, a portion of the Fund’s chief compliance officer’s salary was paid by all the investment companies in the Hartford fund complex. The portion allocated to the Fund was in the amount of $5. These fees are accrued daily and paid monthly. |
| h) | Payment from Affiliate – In July of 2007, The Hartford entered into a settlement with the Attorneys General of the states of New York, Connecticut and Illinois relating to market timing and the company's individual variable annuity contracts in which certain payments would be made directly to the variable annuity contract holders. The distribution plan provides that unclaimed money from the settlement would be distributed to certain HLS Funds that are investment options through a Hartford individual variable annuity contract. The unclaimed money was distributed to the Fund on September 18, 2009, as follows: |
| Amount | ||||
| Reimbursement | $ | 90 | ||
On November 8, 2006, the SEC issued an order setting forth the terms of a settlement reached with three subsidiaries of The Hartford that resolves the SEC’s Division of Enforcement’s investigation of aspects of The Hartford’s variable annuity and mutual fund operations related to directed brokerage and revenue sharing. The Hartford settled this matter without admitting or denying the findings of the SEC.
The Fund is available for purchase by the separate accounts of different variable universal life policies, variable annuity products, and funding agreements and it is offered directly to certain qualified retirement plans (collectively “Products”). Although existing Products contain transfer restrictions, some Products, particularly older variable annuity products, do not contain restrictions on the frequency of transfers. In addition, as the result of the settlement of litigation against Hartford Life, Inc. (“Hartford Life”) (the issuers of such variable annuity products), the Fund’s ability to restrict transfers by certain owners of older variable annuity products was limited. During 2006, these annuity owners surrendered the older variable annuity contracts that were the subject of prior litigation. In February 2005, Hartford Life agreed with the Board of Directors of the Fund to indemnify the Fund for any material harm caused to the Fund from frequent trading by these contracts owners.
The total return in the accompanying financial highlights includes payment from affiliates. Had the payment from affiliates been excluded, the total return for the periods listed below would have been as follows:
| For the Year Ended December 31, 2009 | ||||||||
| Class IA | Class IB | |||||||
| Impact from Payment from Affiliate for Attorneys General Settlement | — | % | — | % | ||||
| Total Return Excluding Payments from Affiliate | 41.53 | 41.18 | ||||||
| For the Year Ended December 31, 2006 | ||||||||
| Class IA | Class IB | |||||||
| Impact from Payment from Affiliate for SEC Settlement | 0.11 | % | 0.12 | % | ||||
| Impact from Payment from Affiliate for Unrestricted Transfers | 0.01 | 0.01 | ||||||
| Total Return Excluding Payments from Affiliate | 14.53 | 14.24 | ||||||
| 5. | Investment Transactions: |
For the six-month period ended June 30, 2010, the cost of purchases and proceeds from sales of investment securities (excluding short-term investments) were as follows:
| Amount | ||||
| Cost of Purchases Excluding U.S. Government Obligations | $ | 900,864 | ||
| Sales Proceeds Excluding U.S. Government Obligations | 1,084,227 | |||
| 6. | Line of Credit: |
The Fund is one of several Hartford funds that participate in a $500 million committed revolving line of credit facility. The facility is to be used for temporary or emergency purposes. Under the arrangement, a fund is required to own securities having a market value in excess of 300% of the total bank borrowings. The interest rate on borrowings varies depending on the nature of the loan. The facility also requires a fee to be paid based on the amount of the commitment. This fee is allocated to all the funds participating in the line of credit based on the average net assets of the funds. During the six-month period ended June 30, 2010, the Fund did not have any borrowings under this facility.
| 7. | Industry Classifications: |
Other than the industry classifications “Other Investment Pools and Funds” and “Exchange Traded Funds”, equity industry classifications used in this report are the Global Industry Classification Standard, which was developed by and is the exclusive property and service mark of MSCI, Inc. and Standard & Poor’s.
| Hartford Stock HLS Fund |
| - Selected Per-Share Date (A) - |
| Net Asset | Net Realized | |||||||||||||||||||||||||||||||||||||||||||
| Value at | Payments | and Unrealized | Total from | Dividends from | Distributions | Net Increase | Net Asset | |||||||||||||||||||||||||||||||||||||
| Beginning of | Net Investment | from (to) | Gain (Loss) on | Investment | Net Investment | from Realized | Distributions | Total | (Decrease) in | Value at End | ||||||||||||||||||||||||||||||||||
Class | Period | Income (Loss) | Affiliate | Investments | Operations | Income | Capital Gains | from Capital | Distributions | Net Asset Value | of Period | |||||||||||||||||||||||||||||||||
| For the Six-Month Period Ended June 30, 2010 (Unaudited) | ||||||||||||||||||||||||||||||||||||||||||||
| IA | $ | 36.10 | $ | 0.21 | $ | – | $ | (3.30 | ) | $ | (3.09 | ) | $ | – | $ | – | $ | – | $ | – | $ | (3.09 | ) | $ | 33.01 | |||||||||||||||||||
| IB | 36.06 | 0.17 | – | (3.30 | ) | (3.13 | ) | – | – | – | – | (3.13 | ) | 32.93 | ||||||||||||||||||||||||||||||
| For the Year Ended December 31, 2009 | ||||||||||||||||||||||||||||||||||||||||||||
| IA | 25.86 | 0.48 | – | 10.25 | 10.73 | (0.49 | ) | – | – | (0.49 | ) | 10.24 | 36.10 | |||||||||||||||||||||||||||||||
| IB | 25.84 | 0.39 | – | 10.24 | 10.63 | (0.41 | ) | – | – | (0.41 | ) | 10.22 | 36.06 | |||||||||||||||||||||||||||||||
| For the Year Ended December 31, 2008 | ||||||||||||||||||||||||||||||||||||||||||||
| IA | 47.11 | 0.59 | – | (20.79 | ) | (20.20 | ) | (0.81 | ) | (0.24 | ) | – | (1.05 | ) | (21.25 | ) | 25.86 | |||||||||||||||||||||||||||
| IB | 47.00 | 0.50 | – | (20.72 | ) | (20.22 | ) | (0.70 | ) | (0.24 | ) | – | (0.94 | ) | (21.16 | ) | 25.84 | |||||||||||||||||||||||||||
| For the Year Ended December 31, 2007 | ||||||||||||||||||||||||||||||||||||||||||||
| IA | 52.57 | 0.60 | – | 2.43 | 3.03 | (0.57 | ) | (7.92 | ) | – | (8.49 | ) | (5.46 | ) | 47.11 | |||||||||||||||||||||||||||||
| IB | 52.45 | 0.45 | – | 2.44 | 2.89 | (0.42 | ) | (7.92 | ) | – | (8.34 | ) | (5.45 | ) | 47.00 | |||||||||||||||||||||||||||||
| For the Year Ended December 31, 2006 | ||||||||||||||||||||||||||||||||||||||||||||
| IA | 49.21 | 0.72 | 0.06 | 6.41 | 7.19 | (0.71 | ) | (3.12 | ) | – | (3.83 | ) | 3.36 | 52.57 | ||||||||||||||||||||||||||||||
| IB | 49.10 | 0.56 | 0.06 | 6.42 | 7.04 | (0.57 | ) | (3.12 | ) | – | (3.69 | ) | 3.35 | 52.45 | ||||||||||||||||||||||||||||||
| For the Year Ended December 31, 2005 | ||||||||||||||||||||||||||||||||||||||||||||
| IA | 45.72 | 0.66 | – | 3.72 | 4.38 | (0.89 | ) | – | – | (0.89 | ) | 3.49 | 49.21 | |||||||||||||||||||||||||||||||
| IB | 45.59 | 0.51 | – | 3.74 | 4.25 | (0.74 | ) | – | – | (0.74 | ) | 3.51 | 49.10 | |||||||||||||||||||||||||||||||
| (A) | Information presented relates to a share outstanding throughout the indicated period. |
| (B) | The figures do not include sales charges or other fees which may be applied at the variable life insurance, variable annuity or qualified retirement plan product level. Any such additional sales charges or other fees would lower the Fund's performance. |
| (C) | Ratios do not reflect reductions for fees paid indirectly. Please see Fees Paid Indirectly in the Notes to Financial Statements. |
| (D) | Portfolio turnover rate is calculated on the basis of the Fund as a whole without distinguishing between the classes of shares issued. |
| (E) | Not annualized. |
| (F) | Annualized. |
| (G) | Total return without the inclusion of the Payment from (to) Affiliate can be found in Expenses in the accompanying Notes to Financial Statements. |
| - Ratios and Supplemental Data - |
Ratio of Expenses to Average Net | Ratio of Expenses to Average Net | Ratio of Net Investment Income to | Portfolio Turnover | |||||||||||||||||
Total Return(B) | Net Assets at End of Period | Assets Before Waivers(C) | Assets After Waivers(C) | Average Net Assets | Rate(D) | |||||||||||||||
| (8.57 | )%(E) | $ | 1,716,165 | 0.51 | %(F) | 0.51 | %(F) | 1.09 | %(F) | 40 | % | |||||||||
| (8.68 | ) (E) | 264,167 | 0.76 | (F) | 0.76 | (F) | 0.84 | (F) | – | |||||||||||
| 41.54 | (G) | 2,055,227 | 0.51 | 0.51 | 1.43 | 84 | ||||||||||||||
| 41.18 | (G) | 328,275 | 0.76 | 0.76 | 1.19 | – | ||||||||||||||
| (43.13 | ) | 1,810,864 | 0.49 | 0.49 | 1.38 | 89 | ||||||||||||||
| (43.27 | ) | 287,794 | 0.74 | 0.74 | 1.13 | – | ||||||||||||||
| 5.90 | 3,909,045 | 0.49 | 0.49 | 1.01 | 96 | |||||||||||||||
| 5.64 | 652,838 | 0.74 | 0.74 | 0.76 | – | |||||||||||||||
| 14.65 | (G) | 4,498,001 | 0.49 | 0.49 | 1.27 | 97 | ||||||||||||||
| 14.37 | (G) | 758,802 | 0.74 | 0.74 | 1.02 | – | ||||||||||||||
| 9.62 | 4,787,612 | 0.50 | 0.50 | 1.21 | 91 | |||||||||||||||
9.35 | 770,163 | 0.75 | 0.75 | 0.96 | – | |||||||||||||||
| Hartford Stock HLS Fund |
The Board of Directors appoints officers who are responsible for the day-to-day operations of the Fund and who execute policies formulated by the Directors. Each director serves until his or her death, resignation, or retirement or until the next annual meeting of shareholders is held or until his or her successor is elected and qualifies.
Directors and officers who are employed by or who have a financial interest in The Hartford are considered “interested” persons of the Fund pursuant to the Investment Company Act of 1940, as amended. Each officer and two of the Company’s directors, as noted in the chart below, are “interested” persons of the Fund. Each director serves as a director for The Hartford Mutual Funds, Inc., The Hartford Mutual Funds II, Inc., The Hartford Income Shares Fund, Inc., Hartford Series Fund, Inc., and Hartford HLS Series Fund II, Inc., which, as of June 30, 2010, collectively consist of 88 funds. Correspondence may be sent to directors and officers c/o Hartford Mutual Funds, P.O. Box 2999, Hartford, Connecticut 06104-2999, except that correspondence to Ms. Fagely may be sent to 500 Bielenberg Drive, Woodbury, Minnesota 55125.
The table below sets forth, for each director and officer, his or her name, year of birth, current position with the Company and date first elected or appointed to Hartford Series Fund, Inc. (“HSF”), and Hartford HLS Series Fund II, Inc. (“HSF2”), principal occupation, and, for directors, other directorships held. The Fund’s statement of additional information contains further information on the directors and is available free of charge by calling 1-800-862-6668 or writing to Hartford HLS Funds, c/o Individual Annuity Services, P.O. Box 5085, Hartford, CT 06102-5085.
Information on the aggregate remuneration paid to the directors of the Company can be found in the Statement of Operations herein. The Fund pays to The Hartford a portion of the chief compliance officer’s compensation, but does not pay salaries or compensation to any of their other officers or directors who are employed by The Hartford.
Non-Interested Directors
Lynn S. Birdsong (1946) Director since 2003, Co-Chairman of the Investment Committee
Mr. Birdsong is a private investor. Since 2003, Mr. Birdsong has been an independent director of The Japan Fund and has served as a Director of the Sovereign High Yield Fund since April 2010. From 2003 to March 2005, Mr. Birdsong was an independent director of the Atlantic Whitehall Funds. From 1979 to 2002, Mr. Birdsong was a managing director of Zurich Scudder Investments, an investment management firm. During his employment with Scudder, Mr. Birdsong was an interested director of The Japan Fund. Since 1981, Mr. Birdsong has been a partner in Birdsong Company, an advertising specialty firm.
Robert M. Gavin, Jr. (1940) Director since 2002 (HSF) and 1986 (HSF2), Chairman of the Board since 2004
Dr. Gavin is an educational consultant. Prior to September 1, 2001, he was President of Cranbrook Education Community and prior to July 1996, he was President of Macalester College, St. Paul, Minnesota.
Duane E. Hill (1945) Director since 2001 (HSF) and 2002 (HSF2), Chairman of the Nominating Committee
Mr. Hill is Partner of TSG Ventures L.P., a private equity investment company. Mr. Hill is a former partner of TSG Capital Group, a private equity investment firm that served as sponsor and lead investor in leveraged buyouts of middle market companies.
Sandra S. Jaffee (1941) Director since 2005
Ms. Jaffee served as Chairman (2008 to 2009) and Chief Executive Officer of Fortent (formerly Searchspace Group), a leading provider of compliance/regulatory technology to financial institutions from August 2005 to August 2009. From August 2004 to August 2005, Ms. Jaffee served as an Entrepreneur in Residence with Warburg Pincus, a private equity firm. From September 1995 to July 2004, Ms. Jaffee served as Executive Vice President at Citigroup, where she was President and Chief Executive Officer of Citibank’s Global Securities Services (1995 to 2003).
William P. Johnston (1944) Director since 2005, Chairman of the Compliance Committee
In June 2006, Mr. Johnston was appointed as Senior Advisor to The Carlyle Group, a global private equity investment firm. In July 2006, Mr. Johnston was elected to the Board of Directors of MultiPlan, Inc. In August 2007, Mr. Johnston was elected to the Board of Directors of LifeCare Holdings, Inc. In February 2008, Mr. Johnston was elected to the Board of Directors of HCR-ManorCare, Inc. In May 2006, Mr. Johnston was elected to the Supervisory Board of Fresenius Medical Care AG & Co. KGaA, after its acquisition of Renal Care Group, Inc. in March 2006. Mr. Johnston joined Renal Care Group in November 2002 as a member of the Board of Directors and served as Chairman of the Board from March 2003 through March 2006. From September 1987 to December 2002, Mr. Johnston was with Equitable Securities Corporation (and its successors, SunTrust Equitable Securities and SunTrust Robinson Humphrey) serving in various investment banking and managerial positions, including Managing Director and Head of Investment Banking, Chief Executive Officer and Vice Chairman.
Phillip O. Peterson (1944) Director since 2002 (HSF) and 2000 (HSF2), Chairman of the Audit Committee
Mr. Peterson is a mutual fund industry consultant. He was a partner of KPMG LLP (an accounting firm) until July 1999. Mr. Peterson joined William Blair Funds in February 2007 as a member of the Board of Trustees. From January 2004 to April 2005, Mr. Peterson served as Independent President of the Strong Mutual Funds.
Lemma W. Senbet (1946) Director since 2005
Dr. Senbet is the William E. Mayer Chair Professor of Finance and Director, Center for Financial Policy, at the University of Maryland, Robert H. Smith School of Business. He was chair of the Finance Department during 1998 to 2006. Previously he was a chaired professor of finance at the University of Wisconsin-Madison. Also, he was director of the Fortis Funds from March 2000 to July 2002. Dr. Senbet served the finance profession in various capacities, including as director of the American Finance Association and President of the Western Finance Association. In 2006, Dr. Senbet was inducted Fellow of Financial Management Association International for his career-long distinguished scholarship and professional service.
Interested Directors and Officers
Lowndes A. Smith (1939) Director since 1996 (HSF) and 2002 (HSF2), Co-Chairman of the Investment Committee
Mr. Smith served as Vice Chairman of The Hartford from February 1997 to January 2002, as President and Chief Executive Officer of Hartford Life, Inc. from February 1997 to January 2002, and as President and Chief Operating Officer of The Hartford Life Insurance Companies from January 1989 to January 2002. Mr. Smith serves as a Director of White Mountains Insurance Group, Ltd., One Beacon Insurance, Symetra Financial and as a Managing Director of Whittington Gray Associates.
John C. Walters 1, 2 (1962) Director since 2008
Mr. Walters currently serves as President, Chief Executive Officer and Director for Hartford Life, Inc. (“HL, Inc.”). Mr. Walters also serves as President, Chairman of the Board, Chief Executive Officer and Director for Hartford Life Insurance Company (“Hartford Life”), and as Executive Vice President of The Hartford. In addition, Mr. Walters is a Manager of HL Investment Advisors, LLC (“HL Advisors”). Mr. Walters previously served as President of the U.S. Wealth Management Division of HL, Inc. (2006-2007) and as Co-Chief Operating Officer of Hartford Life (2007-2008).
1 Mr. Walters previously served as President and Chief Executive Officer (2007 to 2009).
2 Effective July 31, 2010, Mr. Walters retired from The Hartford. Mr. Walters resigned his position as a Director of the Fund effective July 30, 2010.
Other Officers
Robert M. Arena, Jr. (1968) President and Chief Executive Officer since 2009 (served as Vice President of the Fund (2006-2009))
Mr. Arena serves as Executive Vice President of Hartford Life. Additionally, Mr. Arena is Senior Vice President and Director of Hartford Administrative Services Company, (“HASCO”), President, Chief Executive Officer and Manager of Hartford Investment Financial Services, LLC (“HIFSCO”) and President, Chief Executive Officer and Manager of HL Advisors. Mr. Arena joined The Hartford in 2004.
Tamara L. Fagely (1958) Vice President, Treasurer and Controller since 2002 (HSF) 1993 (HSF2)
Ms. Fagely has been a Vice President of HASCO since 1998 and Chief Financial Officer since 2006. Currently Ms. Fagely is a Vice President of Hartford Life. She served as Assistant Vice President of Hartford Life from December 2001 through March 2005. In addition, Ms. Fagely is Controller and Chief Financial Officer of HIFSCO.
Brian Ferrell (1962) AML Compliance Officer since 2008
Mr. Ferrell has served as Assistant Vice President and AML Compliance Officer for The Hartford since 2006, and as AML Compliance Officer for HASCO and Hartford Investor Services Company, LLC (“HISC”) since 2008. Prior to joining The Hartford in 2006, Mr. Ferrell held various positions at the U.S. Department of the Treasury (the “Treasury”) from 2001 to 2006, where he served as Chief Counsel for the Treasury’s Financial Crimes Enforcement Network from 2005-2006.
Dr. Robert J. Froehlich (1953) Senior Managing Director since 2009
Dr. Froehlich joined The Hartford as Senior Managing Director in September 2009. Prior to joining The Hartford, Dr. Froehlich served as Vice Chairman of Deutsche Asset Management from 1997-2009.
| Hartford Stock HLS Fund |
Directors and Officers (Unaudited) – (continued) |
Thomas D. Jones, III (1965) Vice President and Chief Compliance Officer since 2006
Mr. Jones serves as Chief Compliance Officer for the Hartford Mutual Funds and Vice President and Director of Securities Compliance for The Hartford. Mr. Jones joined The Hartford in 2006 from SEI Investments, where he served as Chief Compliance Officer for its mutual funds and investment advisers. Prior to joining SEI, Mr. Jones was First Vice President and Compliance Director for Merrill Lynch Investment Managers (Americas) (“MLIM”), where he worked from 1992-2004.
Edward P. Macdonald (1967) Vice President, Secretary and Chief Legal Officer since 2005
Mr. Macdonald serves as Assistant Vice President of Hartford Life and Chief Legal Officer and Vice President of HIFSCO. He also serves as Vice President and Secretary of HASCO, and Chief Legal Officer, Secretary and Vice President of HL Advisors. Mr. Macdonald joined The Hartford in 2005.
Vernon J. Meyer (1964) Vice President since 2006
Mr. Meyer serves as Senior Vice President of Hartford Life. He also serves as Senior Vice President of HIFSCO and HL Advisors. Mr. Meyer joined The Hartford in 2004.
D. Keith Sloane (1960) Vice President since 2009
Mr. Sloane is a Senior Vice President of Hartford Life. Additionally, Mr. Sloane currently serves as Senior Vice President of HIFSCO, HL Advisors, and HASCO. Prior to joining The Hartford in 2007, Mr. Sloane was Director of product marketing and led the mutual fund business for Wachovia Securities (“Wachovia”) in their investment products group. Mr. Sloane joined Wachovia in 1995.
Jane Wolak (1961) Vice President since 2009
Ms. Wolak currently serves as Vice President of Hartford Life. Ms. Wolak joined Hartford Life as Vice President, Retail Product Services in May 2007. She is also Vice President of HASCO. Previously, Ms. Wolak was with Sun Life Financial where she held the position of Vice President, Service Center Operations from 2001-2007.
A description of the policies and procedures that the Fund uses to determine how to vote proxies relating to portfolio securities and a record of how the Fund voted any proxies for the twelve-month period ended June 30, 2010 is available (1) without charge, upon request, by calling 800-862-6668 and (2) on the Securities and Exchange Commission’s website at http://www.sec.gov.
The Fund files a complete schedule of portfolio holdings with the Commission for the first and third quarters of each fiscal year on Form N-Q. The Fund’s Forms are available (1) without charge, upon request, by calling 800-862-6668 and (2) on the Securities and Exchange Commission’s website at http://www.sec.gov. The Form N-Q may be reviewed and copied at the Commission’s Public Reference Room in Washington, DC. Information on the operation of the Public Reference Room may be obtained by calling 1-800-SEC-0330.
| Hartford Stock HLS Fund |
The following proposals were addressed and approved at a Special Meeting of Shareholders held on February 12, 2010.
Proposal to approve amendments to the Investment Management Agreement between the Fund and HL Investment Advisors, the purpose of which were to combine the administrative services for the Fund with the management services for the Fund under a single agreement.
| Fund | For | Against | Abstain | |||
| Hartford Stock HLS Fund | 60,519,397.033 | 1,806,292.768 | 1,759,778.568 |
Proposal to elect Lemma Senbet and John Walters, each currently a Director, as Directors of Hartford Series Fund Inc.
Lemma W. Senbet
| Funds | For | Withheld | ||
| Hartford Series Fund, Inc. | 5,079,578,022.902 | 241,839,974.106 |
John C. Walters
| Funds | For | Withheld | ||
| Hartford Series Fund, Inc. | 5,081,138,302.186 | 240,279,694.822 |
| Hartford Stock HLS Fund |
Your Fund's Expenses
As a shareholder of the Fund, you incur two types of costs: (1) transaction costs, including sales charges (loads) on purchase payments and contingent deferred sales charges (CDSC) (2) ongoing costs including management fees; distribution fees; and other fund expenses. This example is intended to help you understand your ongoing costs (in dollars) of investing in the Fund and to compare these costs with the ongoing costs of investing in other mutual funds. The example is based on an investment of $1,000 invested at the beginning of the period and held for the period of December 31, 2009 through June 30, 2010.
Actual Expenses
The first set of columns of the table below provides information about actual account values and actual expenses. You may use the information in this column, together with the amount you invested, to estimate the expenses that you paid over the period. Simply divide your account value by $1,000 (for example, an $8,600 account value divided by $1,000 = 8.6), then multiply the result by the number in the line under the heading entitled "Expenses Paid During Period" to estimate the expenses you paid on your account during this period.
Hypothetical Example for Comparison Purposes
The second set of columns of the table below provides information about hypothetical account values and hypothetical expenses based on the Fund's actual expense ratio and an assumed rate of return of 5% per year before expenses, which is not the Fund's actual return. The hypothetical account values and expenses may not be used to estimate the actual ending account balance or expenses you paid for the period. You may use this information to compare the ongoing costs of investing in the Fund and other funds. To do so, compare this 5% hypothetical example with the 5% hypothetical examples that appear in the shareholder reports of the other funds.
Please note that the expenses shown in the table are meant to highlight your ongoing costs only and do not reflect any transactional costs, such as sales charges (loads) and CDSC. Therefore, the second set of columns of the table is useful in comparing ongoing costs only, and will not help you determine the relative total costs of owning different funds. In addition, if these transactional costs were included, your costs would be higher. Expenses are equal to the Fund's annualized expense ratios multiplied by average account value over the period, multiplied by 181/365 (to reflect the one-half year period).
| Actual return | Hypothetical (5% return before expenses) | |||||||||||||||||||||||||||||||||||
| Expenses paid | Expenses paid | Days in | ||||||||||||||||||||||||||||||||||
| during the period | during the period | the | Days | |||||||||||||||||||||||||||||||||
| Beginning | Ending | December 31, 2009 | Beginning | Ending | December 31, 2009 | Annualized | current | in the | ||||||||||||||||||||||||||||
| Account Value | Account Value | through | Account Value | Account Value | through | expense | 1/2 | full | ||||||||||||||||||||||||||||
December 31, 2009 | June 30, 2010 | June 30, 2010 | December 31, 2009 | June 30, 2010 | June 30, 2010 | ratio | year | year | ||||||||||||||||||||||||||||
| Class IA | $ | 1,000.00 | $ | 914.32 | $ | 2.42 | $ | 1,000.00 | $ | 1,022.27 | $ | 2.56 | 0.51 | % | 181 | 365 | ||||||||||||||||||||
| Class IB | $ | 1,000.00 | $ | 913.19 | $ | 3.61 | $ | 1,000.00 | $ | 1,021.03 | $ | 3.81 | 0.76 | % | 181 | 365 | ||||||||||||||||||||
| Hartford Stock HLS Fund |
The Board approved the annual continuation of the Investment Management Agreement (the “Agreement”) between Hartford Series Fund, Inc. (“HSF”) and HL Investment Advisors, LLC (“HL Advisors”) with respect to the Fund at its meeting on August 4-5, 2009. The Board’s considerations in approving the renewal of the Agreement are disclosed in the December 31, 2009 Annual Report for HSF.
At the November 4-5, 2009 meeting, the Board considered and approved amendments to the Agreement to include administrative services, which had been provided pursuant to a separate agreement, and investment management services under one agreement. The Board, including all of the Independent Directors, approved the amendments to the Agreement with respect to the Fund.
In approving the amendments, in addition to the information presented at the August meeting in connection with the annual review of the Agreement and the additional information provided throughout the year, the Board also considered the fact that the amendments did not result in an overall increase in fees to shareholders. The Board took note of the fact that the management of HL Advisors believes that the proposal to combine the administrative services with the investment management services under a single agreement will produce streamlined fee disclosure, resulting in greater transparency and clarity in the Fund’s prospectuses and financial reports. The Board further noted management's belief that the change would result in consistency across all of the Hartford Funds in the complex in that the funds of HSF are the only funds in the complex (other than the R share classes of the Hartford retail funds) that are subject to a separate administrative services fee. Finally, the Board noted management's view that the proposed changes to the Agreement should also serve to simplify the Board's annual consideration of the investment management arrangements for the Fund in that the investment management and administrative fees would be presented as a single fee for fee comparison purposes, which should facilitate the Board's analysis.
The shareholders of the Fund approved the amendments at a Special Meeting of Shareholders held on February 12, 2010. The amendments were effective as of March 1, 2010.
27
The Hartford
P.O. Box 5085
Hartford, CT 06102–5085
Hartford Series Fund, Inc. is underwritten and distributed by Hartford Securities Distribution Company, Inc.
“The Hartford” is The Hartford Financial Services Group, Inc. and its subsidiaries.
Hartford Series Fund, Inc. inception dates range from 1977 to date. Hartford Series Fund, Inc. is not a subsidiary of The Hartford but is underwritten, distributed by and advised by subsidiaries of The Hartford. Investments in Hartford Series Fund, Inc. are not guaranteed by The Hartford or any other entity.
This material is authorized for distribution only when preceded or accompanied by a current prospectus. The prospectus contains detailed information about the Funds, including investment objectives, risks and charges and expenses. Please read it carefully before you invest or send money.
HLSSAR-S10 Printed in U.S.A ©2010 The Hartford, Hartford, CT 06115 |
| Hartford Total Return Bond HLS Fund |
|
Hartford Total Return Bond HLS Fund
| Manager Discussions (Unaudited) | 2 |
| Financial Statements | |
| 5 | |
| 15 | |
| 16 | |
| 17 | |
| 18 | |
| 19 | |
| 34 | |
| 36 | |
| 38 | |
| 38 | |
| 39 | |
| 40 | |
| 41 |
This report is prepared for the general information of contract owners and qualified retirement plan participants. It is not an offer of contracts or of qualified retirement plans. It should not be used in connection with any offer, except in conjunction with the appropriate prospectus which contains all pertinent information including the applicable sales, administrative and other charges.
The views expressed in the Fund’s Manager Discussion under ‘‘Why did the Fund perform this way?’’ and ‘‘What is the outlook?’’ are views of the Fund’s subadvisers and portfolio management team through the end of the period and is subject to change based on market and other conditions.
Hartford Total Return Bond HLS Fund inception 08/31/1977
(subadvised by Hartford Investment Management Company)
Investment objective – Seeks a competitive total return, with income as a secondary objective.
Performance Overview(1) 6/30/00 - 6/30/10
Growth of $10,000 investment

Barclays Capital U.S. Aggregate Bond Index is an unmanaged index and is composed of securities from the Barclays Capital Government/Credit Bond Index, Mortgage-Backed Securities Index, Asset-Backed Securities Index and Commercial Mortgage-Backed Securities Index.
You cannot invest directly in an index.
The chart represents a hypothetical investment in the Fund. Performance data represents past performance and current performance could be higher or lower.
Average Annual Returns (as of 6/30/10)
| 6 | 1 | 5 | 10 | |||||
| Month† | Year | Year | Year | |||||
| Total Return Bond IA | 5.61% | 13.48% | 4.23% | 6.16% | ||||
| Total Return Bond IB | 5.48% | 13.20% | 3.97% | 5.91% | ||||
| Barclays Capital U.S. Aggregate Bond Index | 5.33% | 9.50% | 5.54% | 6.47% |
| † | Not Annualized |
PAST PERFORMANCE IS NOT INDICATIVE OF FUTURE RESULTS.
| (1) | Growth of a $10,000 investment in Class IB shares will vary from the results seen on this page due to differences in the expense charged to this share class. |
Performance information may reflect historical or current expense waivers from the investment adviser, without which performance would have been lower. For information on current expense waivers/reimbursements, please see the prospectus.
The value of the contract will fluctuate so that when redeemed, it may be worth more or less than the original investment. The chart and table do not reflect the deduction of taxes that a shareholder would pay on portfolio distributions or the redemption of portfolio shares. The figures do not include sales charges or other fees which may be applied at the variable life insurance, variable annuity or qualified retirement plan product level. Any such additional sales charges or other fees would lower the Fund’s performance.
| Portfolio Managers | ||
| Nasri Toutoungi | Joseph Portera | Christopher J. Zeppieri, CFA |
| Managing Director | Executive Vice President | Vice President |
How did the Fund perform?
The Class IA Shares of the Hartford Total Return Bond HLS Fund returned 5.61% for the six-month period ended June 30, 2010, outperforming its benchmark, the Barclays Capital U.S. Aggregate Bond Index, which returned 5.33%, and the Lipper Intermediate Investment Grade Debt VP-UF Funds category, a group of funds with investment strategies similar to those of the Fund, which returned 5.21%.
Why did the Fund perform this way?
2010 began with the financial system and the economy on firmer footing and with what we feel was an appropriate amount of premium attached to riskier spread sectors. Although the spread above Treasuries for risk assets remained above historical norms, it had returned to more normal levels. Beginning in May, the economy and markets once again faced significant stress. Although the Fund remained overweight (i.e. the Fund’s sector position was greater than the benchmark position) in spread sectors, the Fund was repositioned throughout the period to withstand volatility. Sector rotation and security selection were the primary drivers of Fund performance in the first half of 2010.
We recognized the potential for additional market volatility early in the first quarter, and we began reducing the Fund’s overweight to credit sectors (Investment Grade Credit, High Yield Bonds and Bank Loans). Initially, the Fund reduced its allocation to the Investment Grade Corporate sector.
The Fund remained underweight (i.e. the Fund’s sector position was less than the benchmark position) Agency Mortgage Pass Throughs throughout the six-month period. The Federal Reserve was scheduled to end its $1.25 trillion purchase program in March. Demand in this sector was driven by this program and compressed the spread over Treasuries past even historical norms; we had expected this spread to widen again at the program’s conclusion. Unfortunately, we were not the only market participant with these expectations. Many asset managers found themselves underweight, and this lingering demand amidst a slow pace of mortgage originations kept spreads tight through the period. This
underweight allocation marginally detracted from Fund performance.
Commercial Mortgage Backed Securities (CMBS) remained an overweight throughout the period. Despite a less than optimistic outlook for commercial real estate, CMBS valuations, particularly senior structures, remained attractive. We continue to hold this opinion, however, the overweight in the sector detracted from Fund performance as broad market spreads widened in the second quarter.
On a historical basis, High Yield Bonds remained cheap at the beginning of the year both unto themselves as well as relative to other sectors. The Fund maintained an out of benchmark allocation to High Yield Bonds throughout the period. This allocation, as well as an out of benchmark allocation to Bank Loans detracted from overall performance as volatility re-entered the market later in the period.
Exposure to U.S. Treasuries steadily increased over the six-month period as we re-allocated from the previously mentioned spread sectors to reduce risk. The Fund’s duration (i.e. sensitivity to changes in interest rates) stayed fairly close to neutral versus the benchmark for most of the period. Smaller tactical yield curve and duration positions were actively employed but did not contribute significantly to performance.
What is the outlook?
We believe the economy will continue to face headwinds in the third quarter. We expect financial reform will likely marginally reduce the availability of credit and the profitability of banks. The prospect of tax increases can only further impair personal consumption, and weak employment may be the norm for an extended period. Meanwhile, broader global growth appears susceptible to a slowdown. Sovereign debt of developed countries could put additional downward pressure on growth and create more risk within the banks, particularly in Europe.
Given the rally in yields over the last couple of months, the U.S. yield curve is already pricing in most of these risks. We will continue to look to position duration and curve exposure tactically over the next quarter. Although we believe the yield curve will eventually flatten further, the necessary catalysts may not materialize immediately.
In the Credit sector, we expect spreads to trade near current levels through the next quarter and the potential for spread movement is skewed towards wider spreads. We reduced exposure to Investment Grade and High Yield Credit through the first half of 2010, but will likely keep allocations more stable and trade opportunistically in the third quarter. We remain optimistic on structured products, particularly CMBS, as current pricing is fundamentally cheap and technicals remain constructive. We also remain underweight the MBS sector as spreads remain well outside historical norms.
Diversification by Industry
as of June 30, 2010
| Percentage of | ||||
| Industry | Net Assets | |||
| Fixed Income Securities | ||||
| Accommodation and Food Services | 0.3 | % | ||
| Administrative Waste Management and Remediation | 0.2 | |||
| Arts, Entertainment and Recreation | 1.5 | |||
| Beverage and Tobacco Product Manufacturing | 0.5 | |||
| Chemical Manufacturing | 1.0 | |||
| Computer and Electronic Product Manufacturing | 0.1 | |||
| Construction | 0.4 | |||
| Electrical Equipment, Appliance Manufacturing | 0.2 | |||
| Finance and Insurance | 18.6 | |||
| Food Manufacturing | 1.1 | |||
| Food Services | 0.0 | |||
| Foreign Governments | 0.7 | |||
| General Obligations | 0.1 | |||
| Health Care and Social Assistance | 1.2 | |||
| Information | 3.9 | |||
| Machinery Manufacturing | 0.2 | |||
| Management of Companies and Enterprises | 0.1 | |||
| Mining | 2.0 | |||
| Miscellaneous Manufacturing | 0.5 | |||
| Paper Manufacturing | 0.1 | |||
| Petroleum and Coal Products Manufacturing | 2.5 | |||
| Pipeline Transportation | 0.6 | |||
| Primary Metal Manufacturing | 0.5 | |||
| Professional, Scientific and Technical Services | 0.3 | |||
| Rail Transportation | 0.2 | |||
| Real Estate and Rental and Leasing | 0.5 | |||
| Retail Trade | 0.6 | |||
| Tax Allocation | 0.0 | |||
| U.S. Government Agencies | 27.4 | |||
| U.S. Government Securities | 24.3 | |||
| Utilities | 2.2 | |||
| Utilities - Electric | 0.2 | |||
| Utilities - Water and Sewer | 0.2 | |||
| Wholesale Trade | 0.1 | |||
| Other Securities | ||||
| Banks | 0.0 | |||
| Finance | 0.0 | |||
| Long Call Foreign Currency Option Contract | 0.0 | |||
| Long Put Foreign Currency Option Contract | 0.1 | |||
| Long Put Interest Rate Option Contract | 0.0 | |||
| Telecommunication Services | 0.0 | |||
| Short-Term Investments | 9.5 | |||
| Other Assets and Liabilities | (1.9 | ) | ||
| Total | 100.0 | % | ||
Diversification by Security Type
as of June 30, 2010
| Percentage of | ||||
| Category | Net Assets | |||
| Asset & Commercial Mortgage Backed Securities | 9.4 | % | ||
| Call Options Purchased | 0.0 | |||
| Common Stocks | 0.0 | |||
| Corporate Bonds: Investment Grade | 23.0 | |||
| Corporate Bonds: Non-Investment Grade | 7.5 | |||
| Municipal Bonds | 0.5 | |||
| Preferred Stocks | 0.0 | |||
| Put Options Purchased | 0.1 | |||
| Senior Floating Rate Interests: Non-Investment Grade | 0.2 | |||
| U.S. Government Agencies | 27.4 | |||
| U.S. Government Securities | 24.3 | |||
| Short-Term Investments | 9.5 | |||
| Other Assets and Liabilities | (1.9 | ) | ||
| Total | 100.0 | % | ||
Distribution by Credit Quality
as of June 30, 2010
| Percentage of | ||||
| Credit Rating * | Net Assets | |||
| Aaa / AAA | 5.8 | |||
| Aa / AA | 3.0 | |||
| A | 8.3 | |||
| Baa / BBB | 14.8 | |||
| Ba / BB | 3.0 | |||
| B | 3.5 | |||
| Caa / CCC or Lower | 2.1 | |||
| Unrated | 0.1 | |||
| U.S. Government Securities | 54.8 | |||
| Cash | 6.4 | |||
| Other Assets and Liabilities | (1.8 | ) | ||
| Total | 100.0 | % | ||
| * | Does not apply to the fund itself. Based upon Moody’s and S&P long- term credit ratings for the fund’s holdings as of date noted. If Moody's and S&P assign different ratings to a holding, the lower rating is used. "Unrated" includes fixed-income securities (other than cash-like short- term instruments and U.S. Government securities) for which Moody’s and S&P have not issued long-term credit ratings. “Cash” includes cash- like instruments and other short-term instruments. |
| Hartford Total Return Bond HLS Fund |
| June 30, 2010 (Unaudited) |
| (000’s Omitted) |
| Shares or Principal Amount ╬ | Market Value ╪ | ||||||
| ASSET & COMMERCIAL MORTGAGE BACKED SECURITIES - 9.4% | |||||||
| Finance and Insurance - 9.4% | |||||||
| Ally Automotive Receivables Trust | |||||||
| $ | 1,900 | 3.00%, 10/15/2015 ■ | $ | 1,967 | |||
| 4,600 | 3.29%, 03/15/2015 ■ | 4,546 | |||||
| Bank of America Automotive Trust | |||||||
| 6,700 | 3.03%, 10/15/2016 ■ | 6,946 | |||||
| Bayview Commercial Asset Trust | |||||||
| 43,040 | 2.83%, 07/25/2037 ■► | 3,874 | |||||
| Bear Stearns Commercial Mortgage | |||||||
| Securities, Inc. | |||||||
| 52,753 | 4.07%, 07/11/2042 ⌂► | 807 | |||||
| 44,382 | 4.12%, 11/11/2041 ⌂► | 589 | |||||
| 14,400 | 4.83%, 11/11/2041 | 15,034 | |||||
| 11,820 | 5.81%, 06/12/2043 | 12,265 | |||||
| CBA Commercial Small Balance | |||||||
| Commercial Mortgage | |||||||
| 31,873 | 3.96%, 07/25/2035 ⌂†Δ | 1,574 | |||||
| 58,503 | 5.70%, 06/25/2038 ⌂†Δ | 4,525 | |||||
| Chase Issuance Trust | |||||||
| 6,920 | 5.12%, 10/15/2014 | 7,517 | |||||
| Citibank Credit Card Issuance Trust | |||||||
| 7,770 | 5.70%, 05/15/2013 | 7,992 | |||||
| Citigroup Commercial Mortgage Trust | |||||||
| 5,305 | 5.48%, 10/15/2016 | 3,485 | |||||
| 13,735 | 5.89%, 12/10/2049 Δ | 12,614 | |||||
| 9,650 | 6.30%, 12/10/2049 Δ | 6,882 | |||||
| Citigroup/Deutsche Bank Commercial | |||||||
| Mortgage Trust | |||||||
| 8,922 | 5.55%, 01/15/2046 Δ | 9,087 | |||||
| Commercial Mortgage Pass-Through | |||||||
| Certificates | |||||||
| 8,760 | 4.72%, 03/10/2039 | 9,073 | |||||
| 10,390 | 6.01%, 12/10/2049 Δ | 10,739 | |||||
| Countrywide Asset-Backed Certificates | |||||||
| 1,549 | 5.46%, 07/25/2035 | 865 | |||||
| Countrywide Home Loans, Inc. | |||||||
| 30,343 | 6.00%, 10/25/2037 ⌂ | 26,967 | |||||
| Credit Suisse Mortgage Capital Certificates | |||||||
| 12,475 | 5.31%, 12/15/2039 | 12,344 | |||||
| 6,040 | 5.34%, 12/15/2039 | 4,773 | |||||
| Credit-Based Asset Servicing and | |||||||
| Securitization | |||||||
| 2,734 | 0.62%, 05/25/2036 ■Δ | 1,586 | |||||
| Crest Clarendon Street | |||||||
| 6,235 | 1.02%, 12/28/2017 ■Δ | 5,829 | |||||
| GE Business Loan Trust | |||||||
| 130,820 | 0.44%, 05/15/2034 ⌂Δ | 196 | |||||
| 8,029 | 1.35%, 05/15/2034 ■Δ | 2,409 | |||||
| GE Capital Credit Card Master Note Trust | |||||||
| 17,050 | 2.21%, 06/15/2013 | 17,097 | |||||
| 6,220 | 3.69%, 07/15/2015 | 6,464 | |||||
| Goldman Sachs Mortgage Securities Corp. II | |||||||
| 8,570 | 5.56%, 11/10/2039 | 8,696 | |||||
| Greenwich Capital Commercial Funding | |||||||
| Corp. | |||||||
| 16,530 | 4.80%, 08/10/2042 | 17,167 | |||||
| 10,395 | 5.44%, 03/10/2039 Δ | 10,414 | |||||
| 14,948 | 6.09%, 07/10/2038 Δ | 15,624 | |||||
| JP Morgan Automotive Receivable Trust | |||||||
| 1,675 | 12.85%, 03/15/2012 ⌂† | 428 | |||||
| JP Morgan Chase Commercial Mortgage | |||||||
| Securities Corp. | |||||||
| 4,889 | 4.72%, 01/15/2038 | 5,062 | |||||
| 466,875 | 4.82%, 08/12/2037 ► | 852 | |||||
| 11,871 | 5.04%, 03/15/2046 Δ | 12,528 | |||||
| 9,970 | 5.34%, 05/15/2047 | 9,854 | |||||
| 13,990 | 5.36%, 12/15/2044 Δ | 14,881 | |||||
| 4,530 | 5.40%, 05/15/2045 | 4,769 | |||||
| 392,489 | 5.42%, 05/12/2045 ► | 5,406 | |||||
| 11,920 | 5.43%, 12/12/2043 | 12,273 | |||||
| 5,900 | 5.46%, 12/12/2043 | 4,993 | |||||
| 19,515 | 5.48%, 04/15/2043 - 12/15/2044 Δ | 19,956 | |||||
| 3,925 | 5.86%, 06/12/2043 Δ | 3,312 | |||||
| 5,857 | 5.94%, 02/12/2049 Δ | 4,724 | |||||
| Lehman Brothers Small Balance | |||||||
| Commercial | |||||||
| 4,276 | 5.52%, 09/25/2030 ■ | 3,073 | |||||
| 2,178 | 5.62%, 09/25/2036 ■ | 1,947 | |||||
| Marlin Leasing Receivables LLC | |||||||
| 159 | 5.33%, 09/16/2013 ■ | 159 | |||||
| Merrill Lynch Mortgage Trust | |||||||
| 42,648 | 3.96%, 10/12/2041 ⌂► | 537 | |||||
| 3,700 | 5.83%, 06/12/2050 Δ | 3,787 | |||||
| 4,249 | 6.02%, 06/12/2050 Δ | 3,586 | |||||
| Merrill Lynch/Countrywide Commercial | |||||||
| Mortgage Trust | |||||||
| 7,300 | 5.20%, 12/12/2049 | 6,054 | |||||
| 3,430 | 5.24%, 12/12/2049 | 2,182 | |||||
| 8,970 | 5.38%, 08/12/2048 | 8,267 | |||||
| 6,435 | 5.49%, 03/12/2051 Δ | 6,157 | |||||
| 8,065 | 5.81%, 06/12/2050 Δ | 7,887 | |||||
| Morgan Stanley Capital I | |||||||
| 9,840 | 4.70%, 07/15/2056 | 10,274 | |||||
| 3,690 | 5.33%, 12/15/2043 | 3,777 | |||||
| Morgan Stanley Dean Witter Capital I | |||||||
| 15,286 | 0.00%, 08/25/2032 ⌂►† | – | |||||
| Morgan Stanley Reremic Trust | |||||||
| 6,400 | 6.00%, 08/12/2045 ■Δ | 5,414 | |||||
| Nationstar Home Equity Loan Trust | |||||||
| 211 | 0.00%, 03/25/2037 ⌂●Δ | – | |||||
| North Street Referenced Linked Notes | |||||||
| 3,900 | 1.39%, 04/28/2011 ■Δ | 3,391 | |||||
| Popular ABS Mortgage Pass-Through Trust | |||||||
| 3,305 | 4.75%, 12/25/2034 | 3,244 | |||||
| 2,573 | 5.42%, 04/25/2035 | 1,819 | |||||
| Renaissance Home Equity Loan Trust | |||||||
| 3,566 | 5.36%, 05/25/2035 | 1,573 | |||||
| 2,860 | 5.58%, 11/25/2036 Δ | 2,221 | |||||
| Residential Funding Mortgage Securities, | |||||||
| Inc. | |||||||
| 2,581 | 6.00%, 07/25/2037 ⌂ | 2,202 | |||||
| Sovereign Commercial Mortgage Securities | |||||||
| 12,665 | 5.84%, 07/22/2030 ■Δ | 13,114 | |||||
| Swift Master Automotive Receivables Trust | |||||||
| 7,010 | 1.00%, 10/15/2012 Δ | 6,992 | |||||
The accompanying notes are an integral part of these financial statements.
| Hartford Total Return Bond HLS Fund |
| Schedule of Investments – (continued) |
| June 30, 2010 (Unaudited) |
| (000’s Omitted) |
| Shares or Principal Amount ╬ | Market Value ╪ | ||||||
| ASSET & COMMERCIAL MORTGAGE BACKED SECURITIES - | |||||||
| 9.4% - (continued) | |||||||
| Finance and Insurance - 9.4% - (continued) | |||||||
| Wachovia Bank Commercial Mortgage Trust | |||||||
| $ | 4,960 | 5.34%, 11/15/2048 | $ | 4,221 | |||
| 820 | 5.37%, 11/15/2048 | 598 | |||||
| Wamu Commercial Mortgage Securities | |||||||
| Trust | |||||||
| 19,570 | 6.31%, 03/23/2045 ■ΔΨ | 7,187 | |||||
| Wells Fargo Alternative Loan Trust | |||||||
| 11,391 | 6.25%, 11/25/2037 ⌂ | 8,630 | |||||
| 467,278 | |||||||
| Total asset & commercial mortgage backed | |||||||
| securities | |||||||
| (cost $459,849) | $ | 467,278 | |||||
| CORPORATE BONDS: INVESTMENT GRADE - 23.0% | |||||||
| Administrative Waste Management and Remediation - | |||||||
| 0.2% | |||||||
| Brambles USA, Inc. | |||||||
| $ | 5,478 | 3.95%, 04/01/2015 ■ | $ | 5,563 | |||
| Browning-Ferris Industries, Inc. | |||||||
| 2,118 | 7.40%, 09/15/2035 | 2,527 | |||||
| 8,090 | |||||||
| Arts, Entertainment and Recreation - 1.0% | |||||||
| Comcast Corp. | |||||||
| 100 | 10.63%, 07/15/2012 | 117 | |||||
| DirecTV Holdings LLC | |||||||
| 5,615 | 7.63%, 05/15/2016 | 6,099 | |||||
| Grupo Televisa S.A. | |||||||
| 9,548 | 6.63%, 01/15/2040 | 9,948 | |||||
| NBC Universal, Inc. | |||||||
| 8,410 | 3.65%, 04/30/2015 ■ | 8,600 | |||||
| 8,750 | 5.15%, 04/30/2020 ■ | 9,126 | |||||
| 7,280 | 6.40%, 04/30/2040 ■ | 7,777 | |||||
| Time Warner Entertainment Co., L.P. | |||||||
| 8,175 | 8.38%, 07/15/2033 | 10,147 | |||||
| 51,814 | |||||||
| Beverage and Tobacco Product Manufacturing - 0.5% | |||||||
| Altria Group, Inc. | |||||||
| 7,418 | 10.20%, 02/06/2039 | 9,950 | |||||
| Anheuser-Busch Cos., Inc. | |||||||
| 1,281 | 8.20%, 01/15/2039 ■ | 1,685 | |||||
| Anheuser-Busch InBev N.V. | |||||||
| 8,890 | 7.75%, 01/15/2019 ■ | 10,791 | |||||
| 22,426 | |||||||
| Chemical Manufacturing - 0.8% | |||||||
| Dow Chemical Co. | |||||||
| 13,580 | 8.55%, 05/15/2019 | 16,624 | |||||
| Incitec Pivot Finance LLC | |||||||
| 16,285 | 6.00%, 12/10/2019 ■ | 16,681 | |||||
| Yara International ASA | |||||||
| 6,770 | 7.88%, 06/11/2019 ■ | 8,102 | |||||
| 41,407 | |||||||
| Construction - 0.3% | |||||||
| CRH America, Inc. | |||||||
| 3,590 | 5.30%, 10/15/2013 | 3,859 | |||||
| 7,075 | 8.13%, 07/15/2018 | 8,532 | |||||
| 12,391 | |||||||
| Electrical Equipment, Appliance Manufacturing - 0.2% | |||||||
| General Electric Co. | |||||||
| 10,740 | 5.00%, 02/01/2013 | 11,517 | |||||
| Finance and Insurance - 7.7% | |||||||
| American Express Co. | |||||||
| 8,385 | 5.50%, 04/16/2013 | 9,060 | |||||
| 8,587 | 5.55%, 10/17/2012 | 9,231 | |||||
| Americo Life, Inc. | |||||||
| 75 | 7.88%, 05/01/2013 ⌂ | 74 | |||||
| Amvescap plc | |||||||
| 2,939 | 5.38%, 02/27/2013 | 3,066 | |||||
| Army Hawaii Family Housing Trust | |||||||
| Certificates | |||||||
| 5,370 | 5.52%, 06/15/2050 ■ | 4,761 | |||||
| BAE Systems Holdings, Inc. | |||||||
| 10,204 | 5.20%, 08/15/2015 ■ | 10,943 | |||||
| Bank of America Corp. | |||||||
| 15,790 | 5.63%, 07/01/2020 | 15,916 | |||||
| 6,560 | 7.38%, 05/15/2014 | 7,352 | |||||
| Bank of New York Institutional Capital | |||||||
| Trust | |||||||
| 200 | 7.78%, 12/01/2026 ■ | 200 | |||||
| Barclays Bank plc | |||||||
| 6,050 | 5.00%, 09/22/2016 | 6,206 | |||||
| BB&T Corp. | |||||||
| 7,290 | 3.95%, 04/29/2016 | 7,480 | |||||
| CDP Financial, Inc. | |||||||
| 10,860 | 3.00%, 11/25/2014 ■ | 10,960 | |||||
| 8,915 | 4.40%, 11/25/2019 ■ | 9,154 | |||||
| Citigroup, Inc. | |||||||
| 10,185 | 2.13%, 04/30/2012 | 10,435 | |||||
| 8,887 | 6.38%, 08/12/2014 | 9,439 | |||||
| 3,747 | 8.13%, 07/15/2039 | 4,470 | |||||
| 4,839 | 8.50%, 05/22/2019 | 5,769 | |||||
| Comerica Capital Trust II | |||||||
| 5,858 | 6.58%, 02/20/2037 Δ | �� | 4,921 | ||||
| Corpoacion Andina De Fomento | |||||||
| 530 | 8.13%, 06/04/2019 | 651 | |||||
| First Union Capital I | |||||||
| 2,584 | 7.94%, 01/15/2027 | 2,620 | |||||
| General Electric Capital Corp. | |||||||
| 8,785 | 5.63%, 05/01/2018 | 9,336 | |||||
| Guardian Life Insurance Co. | |||||||
| 6,291 | 7.38%, 09/30/2039 ■ | 6,960 | |||||
| HSBC Holdings plc | |||||||
| 7,790 | 3.50%, 06/28/2015 ■ | 7,865 | |||||
| Jefferies Group, Inc. | |||||||
| 7,713 | 8.50%, 07/15/2019 | 8,664 | |||||
| JP Morgan Chase & Co. | |||||||
| 6,375 | 6.00%, 01/15/2018 | 7,039 | |||||
| JP Morgan Chase Capital II | |||||||
| 3,880 | 0.84%, 02/01/2027 Δ | 2,915 | |||||
| JP Morgan Chase Capital XXV | |||||||
| 4,288 | 6.80%, 10/01/2037 | 4,238 | |||||
| Lloyds Banking Group plc | |||||||
| 15,635 | 4.38%, 01/12/2015 ■ | 15,064 | |||||
| Massachusetts Mutual Life Insurance Co. | |||||||
| 4,148 | 8.88%, 06/01/2039 ■ | 5,519 | |||||
The accompanying notes are an integral part of these financial statements.
| Shares or Principal Amount ╬ | Market Value ╪ | ||||||
| CORPORATE BONDS: INVESTMENT GRADE - 23.0% - (continued) | |||||||
| Finance and Insurance - 7.7% - (continued) | |||||||
| MBNA America Bank N.A. | |||||||
| $ | 7,200 | 7.13%, 11/15/2012 | $ | 7,840 | |||
| Mellon Capital IV | |||||||
| 7,801 | 6.24%, 06/20/2012 ♠Δ | 6,572 | |||||
| Merrill Lynch & Co., Inc. | |||||||
| 16,355 | 6.05%, 05/16/2016 | 16,900 | |||||
| Metropolitan Life Global Funding I | |||||||
| 6,515 | 0.79%, 03/15/2012 ■Δ | 6,436 | |||||
| 3,400 | 5.13%, 06/10/2014 ■ | 3,693 | |||||
| Morgan Stanley | |||||||
| 10,070 | 5.38%, 10/15/2015 | 10,200 | |||||
| Nationwide Mutual Insurance Co. | |||||||
| 6,425 | 9.38%, 08/15/2039 ■ | 7,531 | |||||
| New York Life Global Funding | |||||||
| 12,295 | 3.00%, 05/04/2015 ■ | 12,391 | |||||
| New York Life Insurance Co. | |||||||
| 9,046 | 6.75%, 11/15/2039 ■ | 10,567 | |||||
| Northgroup Preferred Capital Corp. | |||||||
| 11,208 | 6.38%, 10/15/2017 ■♠Δ | 10,052 | |||||
| Ohio National Financial Services, Inc. | |||||||
| 6,672 | 6.38%, 04/30/2020 ■ | 7,022 | |||||
| PNC Preferred Funding Trust II | |||||||
| 16,900 | 6.11%, 03/15/2012 ■♠Δ | 12,396 | |||||
| Prudential Holdings LLC | |||||||
| 200 | 7.25%, 12/18/2023 ■ | 224 | |||||
| Rabobank Netherlands | |||||||
| 3,993 | 11.00%, 06/30/2019 ■♠ | 4,932 | |||||
| Santander U.S. Debt S.A. | |||||||
| 10,500 | 3.72%, 01/20/2015 ■ | 10,087 | |||||
| Teachers Insurance & Annuity Association | |||||||
| 6,248 | 6.85%, 12/16/2039 ■ | 7,277 | |||||
| Temasek Financial I Ltd. | |||||||
| 8,850 | 4.30%, 10/25/2019 ■ | 9,191 | |||||
| 7,456 | 5.38%, 11/23/2039 ■ | 7,987 | |||||
| Wells Fargo & Co. | |||||||
| 3,140 | 3.63%, 04/15/2015 | 3,208 | |||||
| Wells Fargo Bank NA | |||||||
| 8,015 | 0.65%, 05/16/2016 Δ | 7,359 | |||||
| 12,775 | 4.75%, 02/09/2015 | 13,371 | |||||
| ZFS Finance USA Trust I | |||||||
| 3,193 | 6.50%, 05/09/2037 ■Δ | 2,858 | |||||
| 378,402 | |||||||
| Food Manufacturing - 1.0% | |||||||
| Kraft Foods, Inc. | |||||||
| 24,340 | 4.13%, 02/09/2016 | 25,690 | |||||
| 14,190 | 5.38%, 02/10/2020 | 15,206 | |||||
| Wrigley Jr., William Co. | |||||||
| 10,070 | 3.70%, 06/30/2014 ■ | 10,185 | |||||
| 51,081 | |||||||
| Foreign Governments - 0.3% | |||||||
| Banco Nacional De Desenvolvimento | |||||||
| 4,800 | 5.50%, 07/12/2020 ■ | 4,812 | |||||
| Brazil (Republic of) | |||||||
| 2,966 | 8.00%, 01/15/2018 | 3,441 | |||||
| South Africa (Republic of) | |||||||
| 4,295 | 5.88%, 05/30/2022 | 4,542 | |||||
| 12,795 | |||||||
| Health Care and Social Assistance - 0.8% | |||||||
| Covidien International Finance S.A. | |||||||
| 4,660 | 4.20%, 06/15/2020 | 4,769 | |||||
| CVS Caremark Corp. | |||||||
| 2,742 | 6.30%, 06/01/2037 Δ | 2,454 | |||||
| CVS Corp. | |||||||
| 9,448 | 8.35%, 07/10/2031 ■ | 11,455 | |||||
| Pfizer, Inc. | |||||||
| 9,695 | 6.20%, 03/15/2019 | 11,522 | |||||
| 7,565 | 7.20%, 03/15/2039 | 9,945 | |||||
| 40,145 | |||||||
| Information - 2.1% | |||||||
| America Movil S.A. de C.V. | |||||||
| 5,600 | 5.00%, 03/30/2020 ■ | 5,786 | |||||
| 10,700 | 6.13%, 03/30/2040 ■ | 11,173 | |||||
| Cellco Partnership - Verizon Wireless | |||||||
| Capital | |||||||
| 7,500 | 8.50%, 11/15/2018 | 9,751 | |||||
| Cingular Wireless Services, Inc. | |||||||
| 12,600 | 8.75%, 03/01/2031 | 17,298 | |||||
| GTE Corp. | |||||||
| 165 | 8.75%, 11/01/2021 | 216 | |||||
| Rogers Cable, Inc. | |||||||
| 2,675 | 8.75%, 05/01/2032 | 3,479 | |||||
| TCI Communications, Inc. | |||||||
| 4,025 | 8.75%, 08/01/2015 | 4,953 | |||||
| Telecom Italia Capital | |||||||
| 5,000 | 7.18%, 06/18/2019 | 5,383 | |||||
| 214 | 7.72%, 06/04/2038 | 219 | |||||
| Telefonica Emisiones SAU | |||||||
| 5,295 | 4.95%, 01/15/2015 | 5,547 | |||||
| 7,510 | 5.13%, 04/27/2020 | 7,527 | |||||
| Time Warner Cable, Inc. | |||||||
| 9,509 | 3.50%, 02/01/2015 | 9,721 | |||||
| 6,061 | 8.25%, 04/01/2019 | 7,454 | |||||
| Verizon Maryland, Inc. | |||||||
| 1,500 | 8.30%, 08/01/2031 | 1,776 | |||||
| Verizon Virginia, Inc. | |||||||
| 13,805 | 4.63%, 03/15/2013 | 14,568 | |||||
| 104,851 | |||||||
| Management of Companies and Enterprises - 0.1% | |||||||
| Votorantim Participacoes | |||||||
| 6,300 | 6.75%, 04/05/2021 ■ | 6,363 | |||||
| Mining - 1.9% | |||||||
| Anglo American Capital plc | |||||||
| 16,188 | 9.38%, 04/08/2014 - 04/08/2019 ■ | 19,543 | |||||
| Anglogold Holdings plc | |||||||
| 8,905 | 5.38%, 04/15/2020 | 9,041 | |||||
| 2,170 | 6.50%, 04/15/2040 | 2,238 | |||||
| Barrick Australia Finance | |||||||
| 4,325 | 5.95%, 10/15/2039 | 4,609 | |||||
| Barrick Gold Corp. | |||||||
| 3,280 | 6.95%, 04/01/2019 | 3,933 | |||||
| Cliff's Natural Resources, Inc. | |||||||
| 10,055 | 5.90%, 03/15/2020 | 10,783 | |||||
| Rio Tinto Finance USA Ltd. | |||||||
| 14,810 | 5.88%, 07/15/2013 | 16,227 | |||||
| 4,965 | 9.00%, 05/01/2019 | 6,515 | |||||
The accompanying notes are an integral part of these financial statements.
| Hartford Total Return Bond HLS Fund |
| Schedule of Investments – (continued) |
| June 30, 2010 (Unaudited) |
| (000’s Omitted) |
| Shares or Principal Amount ╬ | Market Value ╪ | ||||||
| CORPORATE BONDS: INVESTMENT GRADE - 23.0% - (continued) | |||||||
| Mining - 1.9% - (continued) | |||||||
| Southern Copper Corp. | |||||||
| $ | 4,800 | 5.38%, 04/16/2020 | $ | 4,811 | |||
| 8,400 | 6.75%, 04/16/2040 | 8,303 | |||||
| Teck Resources Ltd. | |||||||
| 7,515 | 10.75%, 05/15/2019 | 9,208 | |||||
| 95,211 | |||||||
| Miscellaneous Manufacturing - 0.5% | |||||||
| Meccanica Holdings USA, Inc. | |||||||
| 14,494 | 6.25%, 07/15/2019 - 01/15/2040 ■ | 14,337 | |||||
| Tyco International Ltd. | |||||||
| 7,791 | 8.50%, 01/15/2019 | 10,071 | |||||
| 24,408 | |||||||
| Petroleum and Coal Products Manufacturing - 2.2% | |||||||
| Canadian Natural Resources Ltd. | |||||||
| 1,689 | 6.25%, 03/15/2038 | 1,846 | |||||
| 6,340 | 6.50%, 02/15/2037 | 7,082 | |||||
| Consumers Energy Co. | |||||||
| 4,000 | 5.15%, 02/15/2017 | 4,336 | |||||
| 4,620 | 6.70%, 09/15/2019 | 5,527 | |||||
| Gazprom International S.A. | |||||||
| 4,281 | 7.20%, 02/01/2020 § | 4,442 | |||||
| Motiva Enterprises LLC | |||||||
| 7,534 | 5.75%, 01/15/2020 ■ | 8,290 | |||||
| 7,271 | 6.85%, 01/15/2040 ■ | 8,310 | |||||
| Nabors Industries, Inc. | |||||||
| 7,183 | 9.25%, 01/15/2019 | 8,831 | |||||
| Petrobras International Finance Co. | |||||||
| 5,185 | 5.75%, 01/20/2020 | 5,222 | |||||
| 5,140 | 6.88%, 01/20/2040 | 5,182 | |||||
| Rowan Companies, Inc. | |||||||
| 5,548 | 7.88%, 08/01/2019 | 6,112 | |||||
| Sempra Energy | |||||||
| 5,218 | 6.50%, 06/01/2016 | 5,988 | |||||
| 9,495 | 9.80%, 02/15/2019 | 12,609 | |||||
| TNK-BP Finance S.A. | |||||||
| 4,800 | 6.63%, 03/20/2017 § | 4,728 | |||||
| Transocean, Inc. | |||||||
| 11,630 | 1.50%, 12/15/2037 ۞ | 9,624 | |||||
| Valero Energy Corp. | |||||||
| 9,686 | 9.38%, 03/15/2019 | 11,732 | |||||
| 109,861 | |||||||
| Pipeline Transportation - 0.5% | |||||||
| Enbridge Energy Partners | |||||||
| 6,654 | 6.50%, 04/15/2018 | 7,448 | |||||
| Enterprise Products Operating L.P. | |||||||
| 7,805 | 5.20%, 09/01/2020 | 8,016 | |||||
| TransCanada Pipelines Ltd. | |||||||
| 5,616 | 7.25%, 08/15/2038 | 6,815 | |||||
| 22,279 | |||||||
| Primary Metal Manufacturing - 0.5% | |||||||
| Alcoa, Inc. | |||||||
| 14,471 | 5.95%, 02/01/2037 | 12,326 | |||||
| ArcelorMittal | |||||||
| 1,975 | 6.13%, 06/01/2018 | 2,066 | |||||
| 1,455 | 7.00%, 10/15/2039 | 1,537 | |||||
| 6,025 | 9.00%, 02/15/2015 | 7,088 | |||||
| 23,017 | |||||||
| Rail Transportation - 0.2% | |||||||
| Norfolk Southern Corp. | |||||||
| 10,230 | 5.75%, 04/01/2018 | 11,564 | |||||
| Real Estate and Rental and Leasing - 0.4% | |||||||
| COX Communications, Inc. | |||||||
| 4,510 | 6.25%, 06/01/2018 ■ | 5,029 | |||||
| 5,485 | 8.38%, 03/01/2039 ■ | 7,456 | |||||
| ERAC USA Finance Co. | |||||||
| 3,145 | 5.25%, 10/01/2020 ■ | 3,178 | |||||
| US Bank Realty Corp. | |||||||
| 5,300 | 6.09%, 01/15/2012 ■♠Δ | 3,683 | |||||
| 19,346 | |||||||
| Retail Trade - 0.2% | |||||||
| Ahold Lease USA, Inc. | |||||||
| 8,148 | 8.62%, 01/02/2025 | 9,451 | |||||
| Utilities - 1.6% | |||||||
| Colbun S.A. | |||||||
| 2,500 | 6.00%, 01/21/2020 ■ | 2,610 | |||||
| Commonwealth Edison Co. | |||||||
| 5,836 | 5.80%, 03/15/2018 | 6,594 | |||||
| Detroit Edison Co. | |||||||
| 3,875 | 6.13%, 10/01/2010 | 3,924 | |||||
| Duke Energy Corp. | |||||||
| 4,726 | 5.25%, 01/15/2018 | 5,301 | |||||
| 3,960 | 7.00%, 11/15/2018 | 4,923 | |||||
| Electricite de France | |||||||
| 5,505 | 6.95%, 01/26/2039 ■ | 6,635 | |||||
| Enel Finance International S.A. | |||||||
| 4,439 | 6.00%, 10/07/2039 ■ | 4,271 | |||||
| Georgia Power Co. | |||||||
| 6,555 | 5.40%, 06/01/2040 | 6,738 | |||||
| Northeast Utilities | |||||||
| 4,375 | 5.65%, 06/01/2013 | 4,709 | |||||
| Northern States Power Co. | |||||||
| 5,735 | 6.25%, 06/01/2036 | 6,756 | |||||
| Pacific Gas & Electric Co. | |||||||
| 5,711 | 5.63%, 11/30/2017 | 6,435 | |||||
| Pacific Gas & Electric Energy Recovery | |||||||
| Funding LLC | |||||||
| 6,208 | 8.25%, 10/15/2018 | 7,943 | |||||
| PSEG Power | |||||||
| 4,534 | 5.00%, 04/01/2014 | 4,845 | |||||
| Public Service Co. of Colorado | |||||||
| 2,142 | 6.50%, 08/01/2038 | 2,619 | |||||
| Virginia Electric & Power Co. | |||||||
| 6,327 | 5.10%, 11/30/2012 | 6,866 | |||||
| 81,169 | |||||||
| Total corporate bonds: investment grade | |||||||
| (cost $1,055,170) | $ | 1,137,588 | |||||
| CORPORATE BONDS: NON-INVESTMENT GRADE - 7.5% | |||||||
| Accommodation and Food Services - 0.3% | |||||||
| Harrah's Operating Co., Inc. | |||||||
| $ | 4,430 | 11.25%, 06/01/2017 | $ | 4,662 | |||
| MGM Mirage, Inc. | |||||||
| 6,458 | 11.13%, 11/15/2017 | 7,120 | |||||
| 3,372 | 11.38%, 03/01/2018 ■ | 3,170 | |||||
| 14,952 | |||||||
The accompanying notes are an integral part of these financial statements.
| Shares or Principal Amount ╬ | Market Value ╪ | ||||||
| CORPORATE BONDS: NON-INVESTMENT GRADE - 7.5% - | |||||||
| (continued) | |||||||
| Arts, Entertainment and Recreation - 0.5% | |||||||
| AMC Entertainment, Inc. | |||||||
| $ | 5,380 | 8.75%, 06/01/2019 | $ | 5,407 | |||
| First Data Corp. | |||||||
| 3,702 | 10.55%, 09/24/2015 | 2,712 | |||||
| McClatchy Co. | |||||||
| 2,475 | 11.50%, 02/15/2017 ■ | 2,512 | |||||
| TL Acquisitions, Inc. | |||||||
| 5,350 | 10.50%, 01/15/2015 ■ | 4,976 | |||||
| Universal City Development Partners Ltd. | |||||||
| 3,233 | 8.88%, 11/15/2015 ■ | 3,249 | |||||
| Virgin Media Finance plc | |||||||
| 5,760 | 9.50%, 08/15/2016 | 6,084 | |||||
| XM Satellite Radio, Inc. | |||||||
| 1,430 | 13.00%, 08/01/2013 ■ | 1,562 | |||||
| 26,502 | |||||||
| Chemical Manufacturing - 0.2% | |||||||
| Lyondell Chemical Co. | |||||||
| 7,530 | 11.00%, 05/01/2018 | 8,076 | |||||
| Computer and Electronic Product Manufacturing - 0.1% | |||||||
| Seagate Technology International | |||||||
| 3,100 | 10.00%, 05/01/2014 ■ | 3,534 | |||||
| Sorenson Communications | |||||||
| 3,160 | 10.50%, 02/01/2015 ■ | 1,991 | |||||
| 5,525 | |||||||
| Construction - 0.1% | |||||||
| Desarrolladora Homes S.A. | |||||||
| 642 | 7.50%, 09/28/2015 | 631 | |||||
| 2,900 | 9.50%, 12/11/2019 ■ | 2,972 | |||||
| 3,603 | |||||||
| Finance and Insurance - 1.5% | |||||||
| American General Finance Corp. | |||||||
| 15,960 | 6.90%, 12/15/2017 | 12,708 | |||||
| BAC Capital Trust XI | |||||||
| 1,960 | 6.63%, 05/23/2036 | 1,792 | |||||
| Bank of America Capital II | |||||||
| 2,610 | 8.00%, 12/15/2026 | 2,532 | |||||
| CIT Group, Inc. | |||||||
| 13,165 | 7.00%, 05/01/2017 | 11,849 | |||||
| Discover Financial Services, Inc. | |||||||
| 5,970 | 10.25%, 07/15/2019 | 7,105 | |||||
| Ford Motor Credit Co. | |||||||
| 9,070 | 7.50%, 08/01/2012 | 9,275 | |||||
| GMAC, Inc. | |||||||
| 12,520 | 6.88%, 09/15/2011 | 12,692 | |||||
| Liberty Mutual Group, Inc. | |||||||
| 4,230 | 10.75%, 06/15/2058 ■ | 4,568 | |||||
| SLM Corp. | |||||||
| 10,220 | 8.00%, 03/25/2020 | 8,975 | |||||
| 71,496 | |||||||
| Food Manufacturing - 0.1% | |||||||
| Smithfield Foods, Inc. | |||||||
| 5,530 | 10.00%, 07/15/2014 ■ | 6,124 | |||||
| Food Services - 0.0% | |||||||
| Arcos Dorados S.A. | |||||||
| 1,800 | 7.50%, 10/01/2019 ■ | 1,881 | |||||
| Foreign Governments - 0.4% | |||||||
| Colombia (Republic of) | |||||||
| 3,800 | 7.38%, 03/18/2019 | 4,446 | |||||
| El Salvador (Republic of) | |||||||
| 2,465 | 7.65%, 06/15/2035 § | 2,613 | |||||
| 2,300 | 8.25%, 04/10/2032 § | 2,530 | |||||
| Indonesia (Republic of) | |||||||
| 6,177 | 6.88%, 01/17/2018 § | 6,964 | |||||
| Philippines (Republic of) | |||||||
| 1,440 | 6.38%, 10/23/2034 | 1,442 | |||||
| 17,995 | |||||||
| Health Care and Social Assistance - 0.4% | |||||||
| Biomet, Inc. | |||||||
| 3,085 | 10.38%, 10/15/2017 | 3,317 | |||||
| HCA, Inc. | |||||||
| 11,650 | 9.25%, 11/15/2016 | 12,349 | |||||
| Rite Aid Corp. | |||||||
| 6,890 | 9.50%, 06/15/2017 | 5,460 | |||||
| 21,126 | |||||||
| Information - 1.7% | |||||||
| Charter Communications Holdings II LLC | |||||||
| 6,710 | 13.50%, 11/30/2016 | 7,817 | |||||
| Clearwire Corp. | |||||||
| 4,260 | 12.00%, 12/01/2015 ■ | 4,223 | |||||
| CSC Holdings, Inc. | |||||||
| 3,930 | 8.50%, 04/15/2014 ■ | 4,097 | |||||
| Frontier Communications Corp. | |||||||
| 4,670 | 8.25%, 05/01/2014 | 4,845 | |||||
| GXS Worldwide, Inc. | |||||||
| 2,460 | 9.75%, 06/15/2015 ■ | 2,350 | |||||
| Intelsat Bermuda Ltd. | |||||||
| 8,670 | 9.25%, 06/15/2016 ⌂ | 8,605 | |||||
| Intelsat Corp. | |||||||
| 3,180 | 9.25%, 06/15/2016 | 3,339 | |||||
| Intelsat Intermediate Holdings Ltd. | |||||||
| 2,400 | 9.50%, 02/01/2015 | 2,442 | |||||
| Level 3 Financing, Inc. | |||||||
| 7,150 | 10.00%, 02/01/2018 ■ | 6,328 | |||||
| Mobile Telesystems Finance S.A. | |||||||
| 4,360 | 8.00%, 01/28/2012 § | 4,545 | |||||
| New Communications Holdings | |||||||
| 3,110 | 8.25%, 04/15/2017 ■ | 3,122 | |||||
| Qwest Corp. | |||||||
| 4,835 | 7.20%, 11/10/2026 | 4,521 | |||||
| 3,656 | 7.25%, 10/15/2035 | 3,354 | |||||
| Sprint Capital Corp. | |||||||
| 11,110 | 8.75%, 03/15/2032 | 10,610 | |||||
| Videotron Ltee | |||||||
| 3,650 | 9.13%, 04/15/2018 | 3,960 | |||||
| Wind Acquisition Finance S.A. | |||||||
| 4,330 | 11.75%, 07/15/2017 ■ | 4,438 | |||||
| Windstream Corp. | |||||||
| 4,120 | 8.63%, 08/01/2016 | 4,151 | |||||
| 82,747 | |||||||
| Machinery Manufacturing - 0.2% | |||||||
| Case New Holland, Inc. | |||||||
| 4,301 | 7.75%, 09/01/2013 | 4,398 | |||||
The accompanying notes are an integral part of these financial statements.
| Hartford Total Return Bond HLS Fund |
| Schedule of Investments – (continued) |
| June 30, 2010 (Unaudited) |
| (000’s Omitted) |
| Shares or Principal Amount ╬ | Market Value ╪ | ||||||
| CORPORATE BONDS: NON-INVESTMENT GRADE - 7.5% - | |||||||
| (continued) | |||||||
| Machinery Manufacturing - 0.2% - (continued) | |||||||
| Goodman Global, Inc. | |||||||
| $ | 2,330 | 13.50%, 02/15/2016 | $ | 2,563 | |||
| 6,961 | |||||||
| Mining - 0.1% | |||||||
| Consol Energy, Inc. | |||||||
| 3,725 | 8.00%, 04/01/2017 ■ | 3,846 | |||||
| Vedanta Resources plc | |||||||
| 2,300 | 9.50%, 07/18/2018 § | 2,450 | |||||
| 6,296 | |||||||
| Paper Manufacturing - 0.1% | |||||||
| Georgia-Pacific LLC | |||||||
| 3,500 | 8.25%, 05/01/2016 ■ | 3,732 | |||||
| Petroleum and Coal Products Manufacturing - 0.3% | |||||||
| Chesapeake Energy Corp. | |||||||
| 4,590 | 9.50%, 02/15/2015 | 5,072 | |||||
| Drummond Co., Inc. | |||||||
| 2,000 | 7.38%, 02/15/2016 | 1,880 | |||||
| Kazmunaigaz Finance Sub B.V. | |||||||
| 3,650 | 8.38%, 07/02/2013 § | 3,924 | |||||
| Petrohawk Energy Corp. | |||||||
| 3,730 | 7.88%, 06/01/2015 | 3,739 | |||||
| 14,615 | |||||||
| Pipeline Transportation - 0.1% | |||||||
| Dynegy Holdings, Inc. | |||||||
| 3,520 | 7.75%, 06/01/2019 | 2,433 | |||||
| El Paso Corp. | |||||||
| 4,070 | 7.00%, 06/15/2017 | 4,047 | |||||
| 6,480 | |||||||
| Professional, Scientific and Technical Services - 0.3% | |||||||
| Affinion Group, Inc. | |||||||
| 14,279 | 11.50%, 10/15/2015 | 14,993 | |||||
| Real Estate and Rental and Leasing - 0.1% | |||||||
| Hertz Corp. | |||||||
| 6,115 | 8.88%, 01/01/2014 | 6,191 | |||||
| Retail Trade - 0.4% | |||||||
| Dollar General Corp. | |||||||
| 3,426 | 10.63%, 07/15/2015 | 3,747 | |||||
| Federated Retail Holdings, Inc. | |||||||
| 5,130 | 5.90%, 12/01/2016 | 5,143 | |||||
| Parkson Retail Group Ltd. | |||||||
| 5,105 | 7.88%, 11/14/2011 | 5,105 | |||||
| Supervalu, Inc. | |||||||
| 4,665 | 8.00%, 05/01/2016 | 4,619 | |||||
| 18,614 | |||||||
| Utilities - 0.5% | |||||||
| AES Corp. | |||||||
| 5,270 | 8.00%, 10/15/2017 | 5,323 | |||||
| AES El Salvador Trust | |||||||
| 2,300 | 6.75%, 02/01/2016 § | 2,150 | |||||
| Calpine Corp. | |||||||
| 3,879 | 7.25%, 10/15/2017 ■ | 3,724 | |||||
| CenterPoint Energy, Inc. | |||||||
| 7,475 | 6.85%, 06/01/2015 | 8,488 | |||||
| Energy Future Holdings Corp. | |||||||
| 1,179 | 10.88%, 11/01/2017 | 872 | |||||
| NRG Energy, Inc. | |||||||
| 4,695 | 8.50%, 06/15/2019 | 4,771 | |||||
| 25,328 | |||||||
| Wholesale Trade - 0.1% | |||||||
| McJunkin Red Man Corp. | |||||||
| 3,350 | 9.50%, 12/15/2016 ■ | 3,249 | |||||
| Spectrum Brands, Inc. | |||||||
| 1,845 | 9.50%, 06/15/2018 ■ | 1,903 | |||||
| 5,152 | |||||||
| Total corporate bonds: non-investment grade | |||||||
| (cost $359,006) | $ | 368,389 | |||||
| MUNICIPAL BONDS - 0.5% | |||||||
| General Obligations - 0.1% | |||||||
| Oregon School Boards Association, Taxable | |||||||
| Pension | |||||||
| $ | 7,325 | 4.76%, 06/30/2028 | $ | 6,638 | |||
| Tax Allocation - 0.0% | |||||||
| California Urban IDA Taxable | |||||||
| 275 | 6.10%, 05/01/2024 | 230 | |||||
| Utilities - Electric - 0.2% | |||||||
| Georgia Municipal Elec Auth | |||||||
| 10,565 | 6.64%, 04/01/2057 | 10,231 | |||||
| Utilities - Water and Sewer - 0.2% | |||||||
| San Francisco City & County Public Utilities | |||||||
| Commission | |||||||
| 8,520 | 6.00%, 11/01/2040 | 8,664 | |||||
| Total municipal bonds | |||||||
| (cost $26,758) | $ | 25,763 | |||||
| SENIOR FLOATING RATE INTERESTS: NON-INVESTMENT | |||||||
| GRADE♦ - 0.2% | |||||||
| Information - 0.1% | |||||||
| UPC Financing Partnership | |||||||
| $ | 1,657 | 2.18%, 12/31/2017 ± | $ | 1,522 | |||
| WideOpenWest Finance LLC | |||||||
| 5,631 | 6.61%, 06/29/2015 ± | 4,913 | |||||
| 6,435 | |||||||
| Utilities - 0.1% | |||||||
| NRG Energy, Inc. | |||||||
| 4,118 | 2.28%, 02/01/2013 ± | 3,936 | |||||
| 3,936 | |||||||
| Total senior floating rate interests: non- | |||||||
| investment grade | |||||||
| (cost $10,875) | $ | 10,371 | |||||
| U.S. GOVERNMENT AGENCIES - 27.4% | |||||||
| Federal Home Loan Mortgage Corporation - 7.0% | |||||||
| $ | 7,825 | 5.03%, 06/01/2035 Δ | $ | 8,298 | |||
| 18,667 | 5.33%, 08/01/2037 Δ | 19,773 | |||||
| 11,984 | 5.43%, 01/01/2037 Δ | 12,683 | |||||
The accompanying notes are an integral part of these financial statements.
| Shares or Principal Amount ╬ | Market Value ╪ | ||||||
| U.S. GOVERNMENT AGENCIES - 27.4% - (continued) | |||||||
| Federal Home Loan Mortgage Corporation - 7.0% - | |||||||
| (continued) | |||||||
| $ | 1,831 | 5.47%, 05/01/2036 Δ | $ | 1,955 | |||
| 54,770 | 5.50%, 10/01/2018 - 11/01/2038 | 58,903 | |||||
| 47,779 | 6.00%, 04/01/2017 - 05/01/2038 | 52,370 | |||||
| 159,028 | 6.00%, 05/15/2040 †☼ | 172,562 | |||||
| 12,432 | 6.50%, 07/01/2031 - 03/01/2038 | 13,652 | |||||
| 7 | 7.50%, 09/01/2029 - 11/01/2031 | 8 | |||||
| 340,204 | |||||||
| Federal National Mortgage Association - 8.9% | |||||||
| 40,118 | 4.50%, 09/01/2024 - 04/01/2025 | 42,401 | |||||
| 1,900 | 4.65%, 06/01/2034 Δ | 1,970 | |||||
| 6,167 | 4.68%, 09/01/2035 Δ | 6,489 | |||||
| 1,773 | 4.72%, 03/01/2035 Δ | 1,863 | |||||
| 5,438 | 4.75%, 04/01/2035 - 05/01/2035 Δ | 5,700 | |||||
| 1,753 | 4.83%, 07/01/2035 Δ | 1,858 | |||||
| 2,686 | 4.85%, 04/01/2035 Δ | 2,817 | |||||
| 168,651 | 5.00%, 02/01/2018 - 09/01/2037 | 179,733 | |||||
| 4,662 | 5.02%, 07/01/2035 Δ | 4,985 | |||||
| 7,368 | 5.19%, 02/01/2038 Δ | 7,848 | |||||
| 8,895 | 5.23%, 01/01/2038 Δ | 9,471 | |||||
| 150,124 | 5.50%, 12/01/2013 - 07/15/2040 ☼ | 161,648 | |||||
| 15,686 | 6.00%, 07/01/2012 - 03/01/2033 | 17,268 | |||||
| 100 | 6.50%, 11/01/2014 - 07/01/2032 | 110 | |||||
| 2,579 | 7.00%, 02/01/2016 - 10/01/2037 | 2,869 | |||||
| 698 | 7.50%, 11/01/2015 - 05/01/2032 | 796 | |||||
| 2 | 8.00%, 04/01/2032 | 2 | |||||
| 447,828 | |||||||
| Government National Mortgage Association - 9.5% | |||||||
| 256,029 | 4.50%, 02/20/2039 - 05/20/2040 | 266,687 | |||||
| 159,198 | 5.00%, 06/15/2039 - 06/20/2040 | 169,827 | |||||
| 17,364 | 5.50%, 03/15/2033 - 10/20/2034 | 18,895 | |||||
| 11,567 | 6.50%, 06/15/2028 - 09/15/2032 | 12,938 | |||||
| 31 | 7.00%, 06/20/2030 - 08/15/2031 | 34 | |||||
| 5 | 8.50%, 11/15/2024 | 5 | |||||
| 468,386 | |||||||
| Other Government Agencies - 2.0% | |||||||
| Small Business Administration | |||||||
| Participation Certificates: | |||||||
| 18,934 | 3.88%, 06/01/2030 | 19,541 | |||||
| 20,900 | 4.11%, 05/01/2030 | 21,862 | |||||
| 24,111 | 4.14%, 02/01/2030 | 25,237 | |||||
| 16,541 | 4.19%, 03/01/2030 | 17,384 | |||||
| 15,894 | 4.36%, 04/01/2030 | 16,853 | |||||
| 100,877 | |||||||
| Total U.S. government agencies | |||||||
| (cost $1,300,836) | $ | 1,357,295 | |||||
| U.S. GOVERNMENT SECURITIES - 24.3% | |||||||
| U.S. Treasury Securities - 24.3% | |||||||
| U.S. Treasury Bonds - 2.8% | |||||||
| $ | 123,290 | 4.63%, 02/15/2040 | $ | 138,586 | |||
| U.S. Treasury Notes - 21.5% | |||||||
| 391,250 | 1.00%, 10/31/2011 ‡ | 393,986 | |||||
| 315,650 | 1.38%, 03/15/2012 ╦ | 320,224 | |||||
| 235,340 | 2.13%, 05/31/2015 | 239,385 | |||||
| 104,210 | 3.50%, 05/15/2020 | 109,062 | |||||
| 1,062,657 | |||||||
| 1,201,243 | |||||||
| Total U.S. government securities | |||||||
| (cost $1,184,880) | $ | 1,201,243 | |||||
| Contracts | Market Value ╪ | ||||||
| CALL OPTIONS PURCHASED - 0.0% | |||||||
| Long Call Foreign Currency Option Contract - 0.0% | |||||||
| AUD/USD/MXN Binary | |||||||
| 6 | Expiration: December, 2010 и | $ | 166 | ||||
| Total call options purchased | |||||||
| (cost $570) | $ | 166 | |||||
| PUT OPTIONS PURCHASED - 0.1% | |||||||
| Long Put Foreign Currency Option Contract - 0.1% | |||||||
| 10 Year Swaption | |||||||
| 253 | Expiration: September, 2010, Exercise Price: | ||||||
| $3.40 Ø | $ | 1,616 | |||||
| 253 | Expiration: September, 2010, Exercise Price: | ||||||
| $3.90 Ø | 392 | ||||||
| AUD/MXN Currency Swap | |||||||
| 66 | Expiration: December, 2010, Exercise Price: | ||||||
| $10.50 Ø | 1,243 | ||||||
| 3,251 | |||||||
| Long Put Interest Rate Option Contract - 0.0% | |||||||
| 10 Year U.S. Treasury | |||||||
| 4 | Expiration: August, 2010, Exercise Price: | ||||||
| $116.00 Ø | 341 | ||||||
| Total put options purchased | |||||||
| (cost $13,880) | $ | 3,592 | |||||
| Shares or Principal Amount | Market Value ╪ | ||||||
| COMMON STOCKS - 0.0% | |||||||
| Telecommunication Services - 0.0% | |||||||
| – | XO Holdings, Inc. ● | $ | – | ||||
| Total common stocks | |||||||
| (cost $–) | $ | – | |||||
| PREFERRED STOCKS - 0.0% | |||||||
| Banks - 0.0% | |||||||
| 330 | Federal Home Loan Mortgage Corp., 8.38% | $ | 112 | ||||
The accompanying notes are an integral part of these financial statements.
| Hartford Total Return Bond HLS Fund |
| Schedule of Investments – (continued) |
| June 30, 2010 (Unaudited) |
| (000’s Omitted) |
| Shares or Principal Amount ╬ | Market Value ╪ | ||||||||
| PREFERRED STOCKS - 0.0% - (continued) | |||||||||
| Finance - 0.0% | |||||||||
| 2 | US Bancorp, 7.19% ● | $ | 1,644 | ||||||
| Total preferred stocks | |||||||||
| (cost $9,862) | $ | 1,756 | |||||||
| Total long-term investments | |||||||||
| (cost $4,421,686) | $ | 4,573,441 | |||||||
| SHORT-TERM INVESTMENTS – 9.5% | |||||||||
| Commercial Paper - 0.9% | |||||||||
Foreign Governments - 0.9% | |||||||||
| Canada Treasury | |||||||||
| CAD | 47,994 | 0.29%, 8/19/2010 ○ | 45,056 | ||||||
| 45,056 | |||||||||
Investment Pools and Funds - 2.4% | |||||||||
| JP Morgan U.S. Government Money | |||||||||
| 118,356 | Market Fund | 118,357 | |||||||
| State Street Bank U.S. Government | |||||||||
| – | Money Market Fund | – | |||||||
| Wells Fargo Advantage Government | |||||||||
| – | Money Market Fund | – | |||||||
| 118,357 | |||||||||
| Repurchase Agreements - 3.1% | |||||||||
| BNP Paribas Securities Corp. Repurchase | |||||||||
| Agreement (maturing on 07/01/2010 in | |||||||||
| the amount of $65,209, collateralized by | |||||||||
| U.S. Treasury Bond 6.25%, 2030, U.S. | |||||||||
| Treasury Note 1.00%, 2011, value of | |||||||||
| $66,896) | |||||||||
| $ | 65,209 | 0.01%, 6/30/2010 | $ | 65,209 | |||||
| RBS Greenwich Capital Markets TriParty | |||||||||
| Joint Repurchase Agreement (maturing | |||||||||
| on 07/01/2010 in the amount of $26,367, | |||||||||
| collateralized by U.S. Treasury Bill | |||||||||
| 0.88%, 2011, value of $26,895) | |||||||||
| 26,367 | 0.01%, 6/30/2010 | 26,367 | |||||||
| UBS Securities, Inc. TriParty Joint | |||||||||
| Repurchase Agreement (maturing on | |||||||||
| 07/01/2010 in the amount of $60,105, | |||||||||
| collateralized by U.S. Treasury Note | |||||||||
| 2.13%, 2015, value of $61,308) | |||||||||
| 60,105 | 0.04%, 6/30/2010 | 60,105 | |||||||
| 151,681 | |||||||||
| U.S. Treasury Bills - 3.1% | |||||||||
| 4,000 | 0.15%, 7/15/2010□○ | 3,999 | |||||||
| 150,000 | 0.09%, 7/8/2010○ | 149,997 | |||||||
| 153,996 | |||||||||
| Total short-term investments | |||||||||
| (cost $470,325) | $ | 469,090 | |||||||
| Total investments | |||||||||
| (cost $4,892,011) ▲ | 101.9 | % | $ | 5,042,531 | |||||
| Other assets and liabilities | (1.9 | )% | (95,290 | ) | |||||
| Total net assets | 100.0 | % | $ | 4,947,241 | |||||
| Note: | Percentage of investments as shown is the ratio of the total market value to total net assets. Market value of investments in foreign securities represents 6.9% of total net assets at June 30, 2010. |
| ▲ | At June 30, 2010, the cost of securities for federal income tax purposes was $4,888,156 and the aggregate gross unrealized appreciation and depreciation based on that cost were: |
| Unrealized Appreciation | $ | 217,989 | ||
| Unrealized Depreciation | (63,614 | ) | ||
| Net Unrealized Appreciation | $ | 154,375 |
| † | The aggregate value of securities valued in good faith at fair value as determined under policies and procedures established by and under the supervision of the Fund's Board of Directors at June 30, 2010, was $179,089, which represents 3.62% of total net assets. |
| ● | Currently non-income producing. For long-term debt securities, items identified are in default as to payment of interest and/or principal. |
| ‡ | This security, or a portion of this security, has been segregated to cover funding requirements on investment transactions settling in the future. |
| Δ | Variable rate securities; the rate reported is the coupon rate in effect at June 30, 2010. |
| ■ | Securities issued within terms of a private placement memorandum, exempt from registration under Rule 144A under the Securities Act of 1933, as amended, and may be sold only to qualified institutional buyers. Pursuant to guidelines adopted by the Board of Directors, these issues are determined to be liquid. The aggregate value of these securities at June 30, 2010, was $524,504, which represents 10.60% of total net assets. |
| § | These securities were sold to the Fund under Regulation S, rules governing offers and sales made outside the United States without registration under the Securities Act of 1933. The Fund may only be able to resell these securities in the United States if an exemption from registration under the federal and state securities laws is available, or the Fund may only be able to sell these securities outside of the United States (such as on a foreign exchange) to a non-U.S. person. Unless otherwise indicated, these holdings are determined to be liquid. At June 30, 2010, these securities amounted to $34,346 or 0.69% of total net assets. |
| ♠ | Perpetual maturity security. Maturity date shown is the first call date. |
| ۞ | Convertible security. |
| ☼ | The cost of securities purchased on a when-issued, delayed delivery or delayed draw basis at June 30, 2010 was $219,804. |
| ► | Securities disclosed are interest-only strips. The interest rates represent effective yields based upon estimated future cash flows at June 30, 2010. |
| ╦ | This security, or a portion of this security, has been pledged as collateral in connection with swaps. |
The accompanying notes are an integral part of these financial statements.
| ○ | The interest rate disclosed for these securities represents the effective yield on the date of the acquisition. |
| ± | The interest rate disclosed for these securities represents the average coupon as of June 30, 2010. |
| Ψ | The company is in bankruptcy. The investment held by the fund is current with respect to interest payments. |
| ╬ | All principal amounts are in U.S. dollars unless otherwise indicated. |
CAD ─ Canadian Dollar
| ♦ | Senior loans in which the Fund invests generally pay interest rates which are periodically adjusted by reference to a base short-term, floating lending rate plus a premium. These base lending rates are generally (i) the lending rate offered by one or more major European banks, such as the London Inter-Bank Offered Rate (LIBOR), (ii) the prime rate offered by one or more major United States Banks, or (iii) the bank's certificate of deposit rate. Senior floating rate interests often require prepayments from excess cash flows or permit the borrower to repay at its election. The rate at which the borrower repays cannot be predicted with accuracy. As a result, the actual remaining maturity may be substantially less than the stated maturities shown. |
| □ | Security pledged as initial margin deposit for open futures contracts at June 30, 2010 |
Futures Contracts Outstanding at June 30, 2010
| Unrealized | |||||||||||
| Number of | Expiration | Appreciation/ | |||||||||
| Description | Contracts* | Position | Month | (Depreciation) | |||||||
| 5 Year U.S. | |||||||||||
| Treasury Note | 622 | Long | Sep 2010 | $ | 232 | ||||||
| 10 Year U.S. | |||||||||||
| Treasury Note | 203 | Long | Sep 2010 | 577 | |||||||
| U.S. Treasury Long | |||||||||||
| Bond | 322 | Long | Sep 2010 | 752 | |||||||
| $ | 1,561 | ||||||||||
| * | The number of contracts does not omit 000's. |
| Ø | At June 30, 2010, the maximum delivery obligation of the open put options written is $6,903. Securities valued at $1,618 collateralized the open put options written as follows: |
| Issuer/ Exercise | Unrealized | |||||||||||||||
| Price/ Expiration | Number of | Market | Premiums | Appreciation | ||||||||||||
| Date | Contracts* | Value ╪ | Received | (Depreciation) | ||||||||||||
| 10 Year Swaption, | ||||||||||||||||
| $3.65, Sep, | ||||||||||||||||
| 2010 | 506,000 | $ | 1,413 | $ | 7,138 | $ | 5,725 | |||||||||
| 10 Year U.S. | ||||||||||||||||
| Treasury | ||||||||||||||||
| Note, | ||||||||||||||||
| $114.00, Aug, | ||||||||||||||||
| 2010 | 4,364 | 205 | 2,169 | 1,964 | ||||||||||||
| EUR Currency, | ||||||||||||||||
| $1.16, Jul, | ||||||||||||||||
| 2010 | 70,000 | – | 792 | 792 | ||||||||||||
| $ | 1,618 | $ | 10,099 | $ | 8,481 | |||||||||||
| * | The number of contracts does not omit 000's. |
| и | This security has exercise limitations. It can only be exercised on expiration date, provided that two conditions are met: the Australian Dollar exchange rate is less than 0.805 and the Mexican Peso exchange rate is less than 12.55. If these conditions are not met, the option can not be exercised and premium paid is forfeited. |
| ⌂ | The following securities are considered illiquid. Illiquid securities are often purchased in private placement transactions, are often not registered under the Securities Act of 1933 and may have contractual restrictions on resale. A security may also be considered illiquid if the security lacks a readily available market or if its valuation has not changed for a certain period of time. |
| Period | Shares/ | ||||||||
| Acquired | Par | Security | Cost Basis | ||||||
| 04/2003 | $ | 75 | Americo Life, Inc., 7.88%, | ||||||
| 05/01/2013 - 144A | $ | 74 | |||||||
| 10/2004 | $ | 52,753 | Bear Stearns Commercial | ||||||
| Mortgage Securities, Inc., 4.07%, | |||||||||
| 07/11/2042 | 736 | ||||||||
| 12/2004 | $ | 44,382 | Bear Stearns Commercial | ||||||
| Mortgage Securities, Inc., 4.12%, | |||||||||
| 11/11/2041 | 538 | ||||||||
| 04/2006 - | $ | 31,873 | CBA Commercial Small Balance | ||||||
| 08/2007 | Commercial Mortgage, 3.96%, | ||||||||
| 07/25/2035 - 144A | – | ||||||||
| 04/2006 - | $ | 58,503 | CBA Commercial Small Balance | ||||||
| 06/2007 | Commercial Mortgage, 5.70%, | ||||||||
| 06/25/2038 - 144A | – | ||||||||
| 08/2007 | $ | 30,343 | Countrywide Home Loans, Inc., | ||||||
| 6.00%, 10/25/2037 | 29,793 | ||||||||
| 06/2006 | $ | 130,820 | GE Business Loan Trust, 0.44%, | ||||||
| 05/15/2034 - 144A | – | ||||||||
| 06/2006 - | $ | 8,670 | Intelsat Bermuda Ltd., 9.25%, | ||||||
| 08/2006 | 06/15/2016 | 8,763 | |||||||
| 03/2007 | $ | 1,675 | JP Morgan Automotive Receivable | ||||||
| Trust, 12.85%, 03/15/2012 | 1,675 | ||||||||
| 11/2004 | $ | 42,648 | Merrill Lynch Mortgage Trust, | ||||||
| 3.96%, 10/12/2041 - 144A | 588 | ||||||||
| 10/2005 - | $ | 15,286 | Morgan Stanley Dean Witter | ||||||
| 08/2006 | Capital I, 0.00%, 08/25/2032 - Reg D | 323 | |||||||
| 04/2007 | $ | 211 | Nationstar Home Equity Loan | ||||||
| Trust, 0.00%, 03/25/2037 - 144A | 211 | ||||||||
| 06/2009 | $ | 2,581 | Residential Funding Mortgage | ||||||
| Securities, Inc., 6.00%, 07/25/2037 | 1,890 | ||||||||
| 03/2008 | $ | 11,391 | Wells Fargo Alternative Loan | ||||||
| Trust, 6.25%, 11/25/2037 | 9,216 | ||||||||
The aggregate value of these securities at June 30, 2010 was $55,134 which represents 1.11% of total net assets.
IDA — Industrial Development Authority Bond
The accompanying notes are an integral part of these financial statements.
| Hartford Total Return Bond HLS Fund |
| Schedule of Investments – (continued) |
| June 30, 2010 (Unaudited) |
| (000’s Omitted) |
Forward Foreign Currency Contracts Outstanding at June 30, 2010
| Unrealized | |||||||||||||
| Market | Contract | Delivery | Appreciation/ | ||||||||||
| Description | Value ╪ | Amount | Date | (Depreciation) | |||||||||
| Australian Dollar (Buy) | $ | 48,330 | $ | 49,545 | 09/17/10 | $ | (1,215 | ) | |||||
| Australian Dollar (Sell) | 46,794 | 48,554 | 07/08/10 | 1,760 | |||||||||
| Australian Dollar (Sell) | 48,330 | 48,587 | 09/17/10 | 257 | |||||||||
| British Pound (Buy) | 97,197 | 98,976 | 08/11/10 | (1,779 | ) | ||||||||
| British Pound (Sell) | 97,196 | 98,243 | 08/11/10 | 1,047 | |||||||||
| Canadian Dollar (Sell) | 45,033 | 46,735 | 07/21/10 | 1,702 | |||||||||
| Euro (Sell) | 184,670 | 188,592 | 08/06/10 | 3,922 | |||||||||
| Euro (Sell) | 129,879 | 144,363 | 08/11/10 | 14,484 | |||||||||
| Euro (Buy) | 23,235 | 23,306 | 08/06/10 | (71 | ) | ||||||||
| Euro (Sell) | 42,801 | 42,663 | 08/06/10 | (138 | ) | ||||||||
| Euro (Buy) | 134,921 | 140,750 | 08/11/10 | (5,829 | ) | ||||||||
| Japanese Yen (Sell) | 49,608 | 48,820 | 07/08/10 | (788 | ) | ||||||||
| Japanese Yen (Buy) | 49,608 | 48,554 | 07/08/10 | 1,054 | |||||||||
| Mexican New Peso (Sell) | 48,137 | 49,959 | 08/11/10 | 1,822 | |||||||||
| Mexican New Peso (Buy) | 48,245 | 47,619 | 08/11/10 | 626 | |||||||||
| Mexican New Peso (Sell) | 47,707 | 48,818 | 09/17/10 | 1,111 | |||||||||
| Mexican New Peso (Buy) | 70,833 | 72,250 | 08/11/10 | (1,417 | ) | ||||||||
| Mexican New Peso (Sell) | 95,451 | 93,710 | 08/11/10 | (1,741 | ) | ||||||||
| Mexican New Peso (Buy) | 47,706 | 48,587 | 09/17/10 | (881 | ) | ||||||||
| Mexican Peso (Buy) | 24,510 | 24,033 | 08/11/10 | 477 | |||||||||
| Swedish Krona (Buy) | 44,770 | 47,156 | 08/06/10 | (2,386 | ) | ||||||||
| Swedish Krona (Sell) | 44,771 | 45,646 | 08/06/10 | 875 | |||||||||
| $ | 12,892 | ||||||||||||
| ╪ | See Significant Accounting Policies of accompanying Notes to Financial Statements regarding valuation of securities. |
Credit Default Swap Agreements Outstanding at June 30, 2010
| Unrealized | |||||||||||||||||
| Buy/Sell | Pay/Receive | Expiration | Notional | Appreciation/ | |||||||||||||
Counterparty | Reference Entity | Protection | Fixed Rate | Date | Amount | (Depreciation) | |||||||||||
| JP Morgan Chase | CDS ITRX Europe Index | Buy | 1.00 | % | 06/20/15 | $ | 23,600 | $ | (268 | ) | |||||||
| JP Morgan Chase | CDS ITRX Europe Index | Buy | 1.00 | % | 06/20/15 | 44,545 | 531 | ||||||||||
| JP Morgan Chase | CDS CDX North American High Yield Index | Buy | 5.00 | % | 06/20/15 | 24,350 | 418 | ||||||||||
| JP Morgan Chase | CDS CDX North American High Yield Index | Buy | 5.00 | % | 06/20/15 | 49,000 | (791 | ) | |||||||||
| UBS Securities | CDS CDX North American High Yield Index | Buy | 5.00 | % | 06/20/15 | 24,350 | 389 | ||||||||||
| $ | 279 | ||||||||||||||||
The accompanying notes are an integral part of these financial statements.
| Hartford Total Return Bond HLS Fund |
| June 30, 2010 (Unaudited) |
| (000’s Omitted) |
| Total | Level 1♦ | Level 2♦ | Level 3 | |||||||||||||
| Assets: | ||||||||||||||||
| Asset & Commercial Mortgage Backed Securities | $ | 467,278 | $ | – | $ | 404,062 | $ | 63,216 | ||||||||
| Call Options Purchased | 166 | – | – | 166 | ||||||||||||
| Common Stocks ‡ | – | – | – | – | ||||||||||||
| Corporate Bonds: Investment Grade | 1,137,588 | – | 1,128,137 | 9,451 | ||||||||||||
| Corporate Bonds: Non-Investment Grade | 368,389 | – | 360,313 | 8,076 | ||||||||||||
| Municipal Bonds | 25,763 | – | 25,763 | – | ||||||||||||
| Preferred Stocks | 1,756 | 112 | 1,644 | – | ||||||||||||
| Put Options Purchased | 3,592 | 1,584 | 2,008 | – | ||||||||||||
| Senior Floating Rate Interests: Non-Investment Grade | 10,371 | – | 10,371 | – | ||||||||||||
| U.S. Government Agencies | 1,357,295 | – | 1,184,733 | 172,562 | ||||||||||||
| U.S. Government Securities | 1,201,243 | 109,062 | 1,092,181 | – | ||||||||||||
| Short-Term Investments | 469,090 | 118,357 | 350,733 | – | ||||||||||||
| Total | $ | 5,042,531 | $ | 229,115 | $ | 4,559,945 | $ | 253,471 | ||||||||
| Credit Default Swaps * | 1,338 | – | 1,338 | – | ||||||||||||
| Forward Foreign Currency Contracts * | 29,137 | – | 29,137 | – | ||||||||||||
| Futures * | 1,561 | 1,561 | – | – | ||||||||||||
| Written Options * | 8,481 | 2,756 | 5,725 | – | ||||||||||||
| Total | $ | 40,517 | $ | 4,317 | $ | 36,200 | $ | – | ||||||||
| Liabilities: | ||||||||||||||||
| Credit Default Swaps * | 1,059 | – | 1,059 | – | ||||||||||||
| Forward Foreign Currency Contracts * | 16,245 | – | 16,245 | – | ||||||||||||
| Total | $ | 17,304 | $ | – | $ | 17,304 | $ | – | ||||||||
| ♦ | For the period ended June 30, 2010, there were no significant transfers between Level 1 and Level 2. |
| ‡ | The Fund has all or primarily all of these equity securities categorized in a single level. Refer to the Schedule of Investments for further industry breakout. |
| * | Derivative instruments not reflected in the Schedule of Investments are valued at the unrealized appreciation/depreciation on the investments. |
Following is a reconciliation of Level 3 assets for which significant unobservable inputs were used to determine fair value:
| Balance | Change in | |||||||||||||||||||||||||||||||||||
| as of | Realized | Unrealized | Transfers | Transfers | Balance as | |||||||||||||||||||||||||||||||
| December | Gain | Appreciation | Net | Into | Out of | of June 30, | ||||||||||||||||||||||||||||||
31, 2009 | (Loss) | (Depreciation) | Amortization | Purchases | Sales | Level 3 * | Level 3* | 2010 | ||||||||||||||||||||||||||||
| Assets: | ||||||||||||||||||||||||||||||||||||
Asset & Commercial Mortgage Backed Securities | $ | 44,899 | $ | (9,182 | ) | $ | 15,270 | † | $ | (866 | ) | $ | 27,842 | $ | (14,747 | ) | $ | — | $ | — | $ | 63,216 | ||||||||||||||
| Corporate Bonds | 9,567 | (1 | ) | 28 | ‡ | (34 | ) | 17,779 | (244 | ) | — | (9,568 | ) | 17,527 | ||||||||||||||||||||||
| Options Purchased | — | — | (404 | )§ | — | 570 | — | — | — | 166 | ||||||||||||||||||||||||||
| U.S. Government Agencies | — | — | 2,626 | ** | (21 | ) | 169,957 | — | — | — | 172,562 | |||||||||||||||||||||||||
| Total | $ | 54,466 | $ | (9,183 | ) | $ | 17,520 | $ | (921 | ) | $ | 216,148 | $ | (14,991 | ) | $ | — | $ | (9,568 | ) | $ | 253,471 | ||||||||||||||
| * | Securities are transferred into and out of Level 3 for a variety of reasons including, but not limited to: |
| 1) | Securities where trading has been halted- transfer into Level 3 versus securities where trading has resumed - transfer out of Level 3. |
| 2) | Broker quoted securities - transfer into Level 3 versus quoted prices in active markets - transfer out of Level 3. |
| 3) | Securities that have certain restrictions on trading - transfer into Level 3 versus securities where trading restrictions have expired - transfer out of Level 3. |
† | Change in unrealized gains or losses in the current period relating to assets still held at June 30, 2010 was $6,308. |
| ‡ | Change in unrealized gains or losses in the current period relating to assets still held at June 30, 2010 was $28. |
| § | Change in unrealized gains or losses in the current period relating to assets still held at June 30, 2010 was $(404). |
| ** | Change in unrealized gains or losses in the current period relating to assets still held at June 30, 2010 was$2,626 |
The accompanying notes are an integral part of these financial statements.
| Hartford Total Return Bond HLS Fund |
| June 30, 2010 (Unaudited) |
| (000’s Omitted) |
| Assets: | ||||
| Investments in securities, at market value (cost $4,892,011) | $ | 5,042,531 | ||
| Foreign currency on deposit with custodian (cost $51,523) | 53,107 | |||
| Unrealized appreciation on forward foreign currency contracts | 29,137 | |||
| Unrealized appreciation on swap contracts | 1,338 | |||
| Receivables: | ||||
| Investment securities sold | 256,725 | |||
| Fund shares sold | 5,647 | |||
| Dividends and interest | 38,801 | |||
| Variation margin | 124 | |||
| Swap premiums paid | 6,188 | |||
| Total assets | 5,433,598 | |||
| Liabilities: | ||||
| Unrealized depreciation on forward foreign currency contracts | 16,245 | |||
| Unrealized depreciation on swap contracts | 1,059 | |||
| Bank overdraft — U.S. Dollars | 310 | |||
| Payables: | ||||
| Investment securities purchased | 462,969 | |||
| Fund shares redeemed | 3,257 | |||
| Variation margin | 49 | |||
| Investment management fees | 496 | |||
| Distribution fees | 43 | |||
| Accrued expenses | 311 | |||
| Written options (proceeds $10,099) | 1,618 | |||
| Total liabilities | 486,357 | |||
| Net assets | $ | 4,947,241 | ||
| Summary of Net Assets: | ||||
| Capital stock and paid-in-capital | $ | 4,971,559 | ||
| Accumulated undistributed net investment income | 108,105 | |||
| Accumulated net realized loss on investments and foreign currency transactions | (307,097 | ) | ||
| Unrealized appreciation of investments and the translations of assets and liabilities denominated in foreign currency | 174,674 | |||
| Net assets | $ | 4,947,241 | ||
| Shares authorized | 5,000,000 | |||
| Par value | $ | 0.001 | ||
Class IA: Net asset value per share | $ | 11.17 | ||
| Shares outstanding | 372,830 | |||
| Net assets | $ | 4,164,499 | ||
Class IB: Net asset value per share | $ | 11.10 | ||
| Shares outstanding | 70,493 | |||
| Net assets | $ | 782,742 | ||
The accompanying notes are an integral part of these financial statements.
| Hartford Total Return Bond HLS Fund |
| For the Six-Month Period Ended June 30, 2010 (Unaudited) |
| (000’s Omitted) |
| Investment Income: | ||||
| Dividends | $ | 240 | ||
| Interest | 108,834 | |||
| Total investment income, net | 109,074 | |||
| Expenses: | ||||
| Investment management fees | 9,470 | |||
| Administrative service fees | 1,546 | |||
| Transfer agent fees | 2 | |||
| Distribution fees - Class IB | 979 | |||
| Custodian fees | 23 | |||
| Accounting services fees | 432 | |||
| Board of Directors' fees | 52 | |||
| Audit fees | 44 | |||
| Other expenses | 448 | |||
| Total expenses | 12,996 | |||
| Net investment income | 96,078 | |||
| Net Realized Gain on Investments, Other Financial Instruments and Foreign Currency Transactions: | ||||
| Net realized gain on investments | 51,539 | |||
| Net realized gain on futures | 11,329 | |||
| Net realized gain on written options | 4,837 | |||
| Net realized loss on swap contracts | (5,441 | ) | ||
| Net realized gain on forward foreign currency contracts | 6,500 | |||
| Net realized gain on other foreign currency transactions | 1,559 | |||
| Net Realized Gain on Investments, Other Financial Instruments and Foreign Currency Transactions | 70,323 | |||
| Net Changes in Unrealized Appreciation of Investments, Other Financial Instruments and Foreign Currency Transactions: | ||||
| Net unrealized appreciation of investments | 75,469 | |||
| Net unrealized appreciation of futures | 1,561 | |||
| Net unrealized appreciation of written options | 6,862 | |||
| Net unrealized appreciation of swap contracts | 279 | |||
| Net unrealized appreciation of forward foreign currency contracts | 9,778 | |||
| Net unrealized appreciation on translation of other assets and liabilities in foreign currencies | 768 | |||
| Net Changes in Unrealized Appreciation of Investments, Other Financial Instruments and Foreign Currency Transactions | 94,717 | |||
| Net Gain on Investments, Other Financial Instruments and Foreign Currency Transactions | 165,040 | |||
| Net Increase in Net Assets Resulting from Operations | $ | 261,118 | ||
The accompanying notes are an integral part of these financial statements.
| Hartford Total Return Bond HLS Fund |
| (000’s Omitted) |
| For the | ||||||||
| Six-Month | For the | |||||||
| Period Ended | Year Ended | |||||||
| June 30, 2010 | December 31, | |||||||
| (Unaudited) | 2009 | |||||||
| Operations: | ||||||||
| Net investment income | $ | 96,078 | $ | 195,309 | ||||
| Net realized gain (loss) on investments, other financial instruments and foreign currency transactions | 70,323 | (139,165 | ) | |||||
| Net unrealized appreciation of investments, other financial instruments and foreign currency transactions | 94,717 | 528,827 | ||||||
| Net increase in net assets resulting from operations | 261,118 | 584,971 | ||||||
| Distributions to Shareholders: | ||||||||
| From net investment income | ||||||||
| Class IA | — | (142,721 | ) | |||||
| Class IB | — | (27,279 | ) | |||||
| Total distributions | — | (170,000 | ) | |||||
| Capital Share Transactions: | ||||||||
| Class IA | ||||||||
| Sold | 351,229 | 816,260 | ||||||
| Issued on reinvestment of distributions | — | 142,721 | ||||||
| Redeemed | (309,041 | ) | (563,303 | ) | ||||
| Total capital share transactions | 42,188 | 395,678 | ||||||
| Class IB | ||||||||
| Sold | 71,696 | 143,380 | ||||||
| Issued on reinvestment of distributions | — | 27,279 | ||||||
| Redeemed | (120,259 | ) | (197,309 | ) | ||||
| Total capital share transactions | (48,563 | ) | (26,650 | ) | ||||
| Net increase (decrease) from capital share transactions | (6,375 | ) | 369,028 | |||||
| Net increase in net assets | 254,743 | 783,999 | ||||||
| Net Assets: | ||||||||
| Beginning of period | 4,692,498 | 3,908,499 | ||||||
| End of period | $ | 4,947,241 | $ | 4,692,498 | ||||
Accumulated undistributed (distribution in excess of) net investment income | $ | 108,105 | $ | 12,027 | ||||
| Shares: | ||||||||
| Class IA | ||||||||
| Sold | 32,226 | 79,486 | ||||||
| Issued on reinvestment of distributions | — | 13,402 | ||||||
| Redeemed | (28,414 | ) | (55,827 | ) | ||||
| Total share activity | 3,812 | 37,061 | ||||||
| Class IB | ||||||||
| Sold | 6,604 | 14,011 | ||||||
| Issued on reinvestment of distributions | — | 2,573 | ||||||
| Redeemed | (11,114 | ) | (19,528 | ) | ||||
| Total share activity | (4,510 | ) | (2,944 | ) | ||||
The accompanying notes are an integral part of these financial statements.
| Hartford Total Return Bond HLS Fund |
| June 30, 2010 (Unaudited) |
| (000’s Omitted) |
| 1. | Organization: |
Hartford Total Return Bond HLS Fund (the "Fund") serves as an underlying investment option for certain variable annuity and variable life insurance separate accounts of Hartford Life Insurance Company (“HLIC”) and its affiliates and certain qualified retirement plans. The Fund may also serve as an underlying investment option for certain variable annuity and variable life separate accounts of other insurance companies. Owners of variable annuity contracts and policyholders of variable life insurance contracts may choose the funds permitted in the variable insurance contract prospectus. In addition, participants in certain qualified retirement plans may choose the fund if permitted by their plans.
Hartford Series Fund, Inc. (the “Company”) is an open-end registered management investment company comprised of twenty-nine portfolios, one portfolio of which is included in these financial statements.
The Company is organized under the laws of the State of Maryland and is registered with the Securities and Exchange Commission (“SEC”) under the Investment Company Act of 1940, as amended (“1940 Act”). The Fund is organized as a diversified open-end management investment company.
The Fund is divided into Class IA and Class IB shares. Each class is offered at the per share net asset value (“NAV”) without a sales charge and is subject to the same expenses, except that the Class IB shares are subject to distribution and service fees charged pursuant to a Distribution and Service Plan adopted in accordance with Rule 12b-1 under the 1940 Act.
| 2. | Significant Accounting Policies: |
The following is a summary of significant accounting policies of the Fund, which are in accordance with U.S. Generally Accepted Accounting Principles (“GAAP”).
| a) | Security Transactions and Investment Income – Security transactions are recorded on the trade date (the date the order to buy or sell is executed). Security gains and losses are determined on the basis of identified cost. |
Trade date for senior floating rate interests purchased in the primary market is considered the date on which the loan allocations are determined. Trade date for senior floating rate interests purchased in the secondary market is the date on which the transaction is entered into.
Dividend income is accrued as of the ex-dividend date, except that certain dividends for foreign securities where the ex-dividend date may have passed are recorded as soon as the Fund is informed of the dividend in the exercise of reasonable diligence. Interest income, including amortization of premium and accretion of discounts, is accrued on a daily basis.
| b) | Security Valuation – The Fund generally uses market prices in valuing portfolio securities. If market prices are not readily available or are deemed unreliable, the Fund will use the fair value of the security as determined in good faith under policies and procedures established by and under the supervision of the Fund’s Board of Directors. Market prices may be deemed unreliable, for example, if a security is thinly traded or if an event has occurred after the close of the security’s primary market, but before the close of the New York Stock Exchange (the “Exchange”) (generally 4:00 p.m. Eastern Time, referred to as the “Valuation Time”) that is expected to affect the value of the portfolio security. The circumstances in which the Fund may use fair value pricing include, among others: (i) the occurrence of events that are significant to a particular issuer, such as mergers, restructuring or defaults; (ii) the occurrence of events that are significant to an entire market, such as natural disasters in a particular region or governmental actions; (iii) trading restrictions on securities; (iv) thinly traded securities and (v) market events such as trading halts and early market closings. In addition, with respect to the valuation of stocks primarily traded on foreign markets, the Fund uses a fair value pricing service approved by the Fund’s Board of Directors, which employs quantitative models that evaluate changes in the value of foreign market proxies (e.g., futures contracts, American Depositary Receipts (“ADRs”), exchange traded funds (“ETFs”)) after the close of the foreign markets but before the Valuation Time. Securities that are |
| Hartford Total Return Bond HLS Fund |
| Notes to Financial Statements – (continued) |
| June 30, 2010 (Unaudited) |
| (000’s Omitted) |
primarily traded on foreign markets may trade on days that are not business days of the Fund. The value of the foreign securities in which the Fund invests may change on days when a shareholder will not be able to purchase or redeem shares of the Fund. Fair value pricing is subjective in nature and the use of fair value pricing by the Fund may cause the NAV of its shares to differ significantly from the NAV that would have been calculated using market prices at the close of the exchange on which a portfolio security is primarily traded but before the Valuation Time. There can be no assurance that the Fund could obtain the fair value assigned to a security if the Fund were to sell the security at approximately the time at which the Fund determines its NAV.
Exchange-traded equity securities are valued at the last reported sale price or official close price on the exchange or market on which the security is primarily traded (the “Primary Market”) at the Valuation Time. If the security did not trade on the Primary Market, it may be valued at the Valuation Time at the last reported sale price on another exchange where it trades. The value of an equity security not traded on any exchange but traded on the Nasdaq Stock Market, Inc. or another over-the-counter market shall be valued at the last reported sale price or official closing price on the exchange or market on which the security is traded as of the Valuation Time.
Debt securities (other than short-term obligations and senior floating rate interests) held by the Fund are valued using bid prices or using valuations based on a matrix system (which considers factors such as security prices, yield, maturity and ratings) as provided by independent pricing services. Senior floating rate interests generally trade in over-the-counter markets and are priced through an independent pricing service utilizing market quotations from loan dealers or financial institutions. Securities for which prices are not available from an independent pricing service may be valued using market quotations obtained from one or more dealers that make markets in the securities in accordance with procedures established by the Fund’s Board of Directors. Generally, the Fund may use fair valuation in regard to debt securities when the Fund holds defaulted or distressed securities or securities in a company in which a reorganization is pending. Short-term investments with a maturity of more than 60 days when purchased are valued based on market quotations until the remaining days to maturity become less than 61 days. Investments that mature in 60 days or less are generally valued at amortized cost, which approximates market value.
Foreign-denominated assets, including investment securities, and liabilities are translated from the local currency into U.S. dollars using exchange rates obtained from an independent third party as of the Fund’s Valuation Time.
Options contracts on securities, currencies, indices, futures contracts, commodities and other instruments shall be valued at their last reported sale price at the Valuation Time on the Primary Market on which the instrument is traded. If the instrument did not trade on the Primary Market, it may be valued at the most recent sale price at the Valuation Time on another exchange or market where it did trade. If it is not possible to determine the last reported sale price on the Primary Market or another exchange or market at the Valuation Time, the value of the security shall be taken to be the most recent mean between bid and asked prices on such exchange or market at the Valuation Time. Absent both bid and asked prices on such exchange, the bid price may be used.
Financial instruments for which prices are not available from an independent pricing service may be valued using market quotations obtained from one or more dealers that make markets in securities in accordance with procedures established by the Fund’s Board of Directors.
Futures contracts are valued at the most recent settlement price reported by an exchange on which, over time, they are traded most extensively. If a settlement price is not available, futures contracts will be valued at the most recent trade price as of the Valuation Time. If there were no trades, the contract shall be valued at the mean of the closing bid and asked prices as of the Valuation Time.
Forward foreign currency contracts represent agreements to exchange currencies on specific future dates at predetermined rates. Forward foreign currency contracts are valued using foreign currency exchange rates and forward rates on the Valuation Date from an independent pricing service.
Swaps are valued based on custom valuations furnished by an independent pricing service. Swaps for which prices are not available from an independent pricing service are valued in accordance with procedures established by the Fund’s Board of Directors.
Other derivative or contractual type instruments shall be valued using market prices if such instruments trade on an exchange or market. If such instruments do not trade on an exchange or market, such instruments shall be valued at a price at which the counterparty to such contract would repurchase the instrument. In the event that the counterparty cannot provide a price, such valuation may be determined in accordance with procedures established by the Fund’s Board of Directors.
Investments in open-end mutual funds are valued at the respective NAV of each open-end mutual fund on the valuation date.
Various inputs are used in determining the value of the Fund’s investments. These inputs are summarized into three broad hierarchy levels. This hierarchy is based on whether the valuation inputs are observable or unobservable. These levels are:
| · | Level 1 – Quoted prices in active markets for identical securities. Level 1 may include exchange-traded instruments such as domestic equities, some foreign equities, options, futures, mutual funds, ETFs, and rights and warrants. |
| · | Level 2 – Observable inputs other than Level 1 prices, such as quoted prices for similar securities; quoted prices in markets that are not active; or other inputs that are observable or can be corroborated by observable market data. Level 2 may include debt securities that are traded less frequently than exchange-traded instruments and which are valued using third party pricing services. Prices for most level 2 securities are based on prices received from an independent pricing service. The following asset classes generally use valuation techniques and inputs as noted below: |
Asset Backed Securities and Collateralized Mortgage Obligations – Multi-dimensional spread/prepayment speed tables, with consideration of yield or price of bonds of comparable quality, coupon and maturity, attributes of the collateral, new issue data and monthly payment information.
Corporate Bonds – Multi-dimensional relational model based on observable market information such as yields, spreads, sector analysis, etc.
Foreign Currency – Based on rates determined at the close of the Exchange, provided by an independent pricing service.
Forward Currency Contracts – Valued based on the price of the underlying currency at the prevailing interpolated exchange rate, which is a combination of the spot currency rate and the forward currency rate, provided by an independent pricing service.
Foreign Equities – Certain foreign equities are priced using a multi-factor regression model with market observable inputs of a correlative nature (ADRs, futures contracts, ETFs, and currency exchange rates).
International Fixed Income – Multi-dimensional relational model based on observable market information such as benchmark yields, reported trades, bids and offers.
Money Market Instruments – Amortized cost.
| Hartford Total Return Bond HLS Fund |
Notes to Financial Statements – (continued) June 30, 2010 (Unaudited) |
| (000’s Omitted) |
Mortgage Backed Securities (“MBS”) – Matrix pricing using inputs of To-Be-Announced (“TBA”) prices, new issue data and monthly payment information, with consideration of yield or price of bonds of comparable quality, coupon and maturity, and attributes of the collateral.
Municipal Bonds – Multi-dimensional relational model and series of matrices based on observable market information such as Municipal Securities Rulemaking Board reported trades, comparable bonds, yields, spreads and credit analysis.
Preferred Stocks – Close mean of bid/ask or bid.
Repurchase Agreements – Priced at par.
Senior Floating Rate Interests – Composite of quotes from one or more contributing dealers.
Swaps – Price based upon observable market information from an independent pricing service.
U.S. Government Securities – Treasuries exclusively traded in the secondary market.
| · | Level 3 – Significant unobservable inputs that are supported by limited or no market activity. Level 3 may include financial instruments whose values are determined using broker quotes or require significant management judgment or estimation. While these securities are priced using unobservable inputs, the valuation of these securities reflects the best available data and management believes the prices are a reasonable representation of exit price. The following asset classes generally use valuation techniques and inputs as noted below: |
Asset Backed Securities & Commercial Mortgage Backed Securities – Certain other MBS with limited liquidity priced from an independent pricing service.
Common Stocks – Trading has been halted or there are restrictions on trading. Valuation is based on last trade with the application of a discount or premium, if applicable.
Long Dated Over-the-Counter Options – Terms greater than 10 years from current date, expected volatility is not observable. Prices are from an independent pricing service.
Long Term Debt Securities, including Senior Floating Rate Interests – Unobservable valuation inputs may include estimates for current yields, maturity/duration, prepayment speed, and broker quotes for comparable securities along with other assumptions relating to credit quality, collateral value, complexity of the security structure, general market conditions and liquidity.
Swaps – Terms greater than 10 years from current date, expected volatility is not observable. Prices are from an independent pricing service.
Individual securities within any of the above mentioned asset classes may be assigned a different hierarchical level than those that are presented above, as individual circumstances dictate.
For purposes of reporting transfers between different hierarchy levels, both transfers in and out of each level are shown as if they occurred at the beginning of the period.
Refer to the Investment Valuation Hierarchy Levels Summary and the Level 3 roll forward reconciliation found following the Schedules of Investments.
| c) | Foreign Currency Transactions – Assets and liabilities denominated in currencies other than U.S. dollars are translated into U.S. dollars at the exchange rates in effect on the valuation date. Purchases and sales of investment securities, income and expenses are translated into U.S. dollars at the exchange rates on the dates of such transactions. |
The Fund does not isolate that portion of portfolio security valuation resulting from fluctuations in the foreign currency exchange rates from the fluctuations arising from changes in the market prices of securities held. Exchange rate fluctuations are included with the net realized and unrealized gain or loss on investments in the accompanying financial statements.
Net realized foreign exchange gains or losses arise from sales of foreign currencies and the difference between asset and liability amounts initially stated in foreign currencies and the U.S. dollar value of the amounts actually received or paid. Net unrealized foreign exchange gains or losses arise from changes in the value of other assets and liabilities at the end of the reporting period, resulting from changes in the exchange rates.
| d) | Joint Trading Account – Pursuant to an exemptive order issued by the SEC, the Fund may transfer uninvested cash balances into a joint trading account managed by Hartford Investment Management Company (“Hartford Investment Management”), a wholly-owned indirect subsidiary of The Hartford Financial Services Group, Inc. (“The Hartford”). These balances may be invested in one or more repurchase agreements and/or short-term money market instruments. |
| e) | Repurchase Agreements – A repurchase agreement is an agreement by which a counterparty agrees to sell a security and agrees to repurchase the security sold at a mutually agreed upon time and price. At the time the Fund enters into a repurchase agreement, the value of the underlying collateral security(ies), including accrued interest, will be equal to or exceed the value of the repurchase agreement. To minimize counterparty risk, the securities that serve to collateralize the repurchase agreement are held by the Fund's custodian in book entry or physical form in the custodial account of the Fund or in a third party custodial account. Repurchase agreements are valued at cost plus accrued interest. The Fund, as shown on the Schedule of Investments, had outstanding repurchase agreements as of June 30, 2010. |
| f) | Forward Foreign Currency Contracts – The Fund may enter into forward foreign currency contracts that obligate the Fund to purchase or sell currencies at specified future dates. Forward foreign currency contracts may be used to hedge against adverse fluctuations in exchange rates between currencies. |
Forward foreign currency contracts involve elements of market risk in excess of the amounts reflected in the Statement of Assets and Liabilities. In addition, risks may arise upon entering into these contracts from the potential inability of the counterparties to meet the terms of the contracts and from unanticipated movements in the value of the foreign currencies relative to the U.S. dollar. The Fund had outstanding forward foreign currency contracts as shown on the Schedule of Investments as of June 30, 2010.
| g) | Fund Share Valuation and Dividend Distributions to Shareholders – Orders for the Fund’s shares are executed in accordance with the investment instructions of the contract holders or plan participants. The NAV of the Fund’s shares is determined as of the close of each business day of the Exchange. The NAV is determined separately for each class of the Fund by dividing the Fund’s net assets attributable to that class by the number of outstanding shares of the class. Orders for the purchase of the Fund’s shares received by an insurance company or plan prior to the close of the Exchange on any day on which the Exchange is open for business are priced at the NAV determined as of the close of the Exchange. Orders received by an insurance company or plan after the close of the Exchange, or on a day on which the Exchange and/or the Fund is not open for business, are priced at the next determined NAV. |
Dividends are declared pursuant to a policy adopted by the Fund’s Board of Directors based upon the investment performance of the Fund. The policy of the Fund is to pay dividends from net investment income and distribute realized capital gains, if any, at least once a year.
| Hartford Total Return Bond HLS Fund |
Notes to Financial Statements – (continued) June 30, 2010 (Unaudited) |
| (000’s Omitted) |
Distributions from net investment income, realized capital gains and capital are determined in accordance with federal income tax regulations, which may differ from U.S. GAAP with respect to character and timing. These differences may include but are not limited to losses deferred due to wash sale adjustments, foreign currency gains and losses, adjustments related to Passive Foreign Investment Companies (“PFICs”), Real Estate Investment Trusts (“REITs”), Regulated Investment Companies (“RICs”), certain derivatives and partnerships. Permanent book and federal income tax basis differences relating to shareholder distributions will result in reclassifications to certain of the Fund’s capital accounts (see Federal Income Taxes: Reclassification of Capital Accounts note).
| h) | Illiquid and Restricted Securities – The Fund is permitted to invest up to 15% of its net assets in illiquid securities. “Illiquid Securities” are those that may not be sold or disposed of in the ordinary course of business within seven days, at approximately the price used to determine the Fund’s NAV. The Fund may not be able to sell illiquid securities or other investments when its sub-adviser considers it desirable to do so or may have to sell such securities or investments at a price that is lower than the price that could be obtained if the securities or investments were more liquid. A sale of illiquid securities or other investments may require more time and may result in higher dealer discounts and other selling expenses than does the sale of those that are liquid. Illiquid securities and investments also may be more difficult to value, due to the unavailability of reliable market quotations for such securities or investments, and an investment in them may have an adverse impact on the Fund’s NAV. The Fund may also purchase certain restricted securities, commonly known as Rule 144A securities, that can be resold to institutions and which may be determined to be liquid pursuant to policies and guidelines established by the Fund’s Board of Directors. The Fund, as shown on the Schedule of Investments, had illiquid and/or restricted securities as of June 30, 2010. |
| i) | Securities Purchased on a When-Issued or Delayed-Delivery Basis – Delivery and payment for securities that have been purchased by the Fund on a forward commitment, or when-issued or delayed-delivery basis, take place beyond the customary settlement period. During this period, such securities are subject to market fluctuations, and the Fund identifies securities segregated in its records with value at least equal to the amount of the commitment. The Fund, as shown on the Schedule of Investments, had when-issued or delayed delivery securities as of June 30, 2010. |
| j) | Credit Risk – Credit risk depends largely on the perceived financial health of bond issuers. In general, the credit rating is inversely related to the credit risk of the issuer. Higher rated bonds generally are deemed to have less credit risk, while lower or unrated bonds are deemed to have higher risk of default. The share price, yield and total return of a Fund which holds securities with higher credit risk may be more volatile than funds holding bonds with lower credit risk. |
| k) | Senior Floating Rate Interests – The Fund, as shown in the Schedule of Investments, may invest in senior floating rate interests. Senior floating rate interests hold the most senior position in the capital structure of a business entity (the “Borrower”), are typically secured by specific collateral and have a claim on the assets and/or stock of the Borrower that is senior to that held by subordinated debtholders and stockholders of the Borrower. Senior floating rate interests are typically structured and administered by a financial institution that acts as the agent of the lenders participating in the senior floating rate interest. Senior floating rate interests are typically rated below-investment-grade, which suggests they are more likely to default and generally pay higher interest rates than investment-grade loans. A default could lead to non-payment of income which would result in a reduction of income to the Fund and there can be no assurance that the liquidation of any collateral would satisfy the Borrower’s obligation in the event of non-payment of scheduled interest or principal payments, or that such collateral could be readily liquidated. |
| l) | Prepayment/Interest Rate Risks – Most senior floating rate interests and certain debt securities allow for prepayment of principal without penalty. Senior floating rate interests and securities subject to prepayment risk generally offer less potential for gains when interest rates decline. In addition, with respect to securities, rising interest rates may cause prepayments to occur at a slower than expected rate, thereby effectively lengthening the maturity of the security and making the security more sensitive to interest rate changes. Prepayment risk is a major risk of mortgage backed securities and certain asset backed securities. Accordingly, the potential for the value of a senior floating rate interest or debt security to increase in response to interest rate declines is limited. For certain asset backed securities, the actual maturity may be less than the stated maturity shown in the Schedule of Investments. As a result, the timing of income recognition relating to these securities may vary based upon the actual maturity. |
Senior floating rate interests or debt securities purchased to replace a prepaid loan or a debt security may have lower yields than the yield on the prepaid loan or debt security. Senior floating rate interests generally are subject to mandatory and/or optional prepayment. These mandatory prepayment conditions and the possibility of significant economic incentives for the Borrower to repay, may cause prepayments of senior floating rate interests. As a result, the actual remaining maturity of senior floating rate interests held may be substantially less than the stated maturities shown in the Schedule of Investments.
The market value of senior floating rate interests and debt securities held by the Fund may be affected by fluctuations in market interest rates. The market value of these investments tends to decline when interest rates rise and tends to increase when interest rates fall.
| m) | Credit Default Swaps – The Fund is subject to credit risk in the normal course of pursuing its investment objectives. The Fund may enter into event linked swaps, including credit default swap contracts. The credit default swap market allows the Fund to manage its exposure to the market or certain sectors of the market, to reduce its risk exposure to defaults of corporate and sovereign issuers, or to create exposure to corporate or sovereign issuers to which it is not otherwise exposed. Certain credit default swaps involve the exchange of a fixed rate premium for protection against the loss in value of an underlying security in the event of a credit event, such as payment default or bankruptcy. |
Under a credit default swap agreement, one party acts as guarantor by receiving the fixed periodic payment in exchange for the commitment to purchase the underlying security at par if the defined credit event occurs. Upon the occurrence of a defined credit event, the difference between the value of the reference obligation and the swap’s notional amount is recorded as realized gain or loss on swap transactions in the Statement of Operations. A “buyer” of credit protection agrees to pay a counterparty to assume the credit risk of an issuer upon the occurrence of certain events. The “seller” of the protection receives periodic payments and agrees to assume the credit risk of an issuer upon the occurrence of certain events. Although specified events are contract specific, credit events are generally defined as bankruptcy, failure to pay, restructuring, obligation acceleration, obligation default, or repudiation/moratorium. A “seller’s” exposure is limited to the total notional amount of the credit default swap contract. These potential amounts would be partially offset by any recovery values of the respective referenced obligations or upfront payments received upon entering into the agreement. For credit default swap contracts on credit indices at June 30, 2010, the quoted market prices and resulting values serve as the indicator of the current status of the payment/performance risk. Increasing market values, in absolute terms when compared to the notional amount of the swap, represent a deterioration of the referenced equity’s credit soundness and a greater likelihood or risk of default or other credit event occurring as defined under the terms of the agreement. The Fund is also subject to counterparty credit risk. Both credit and counterparty risks are mitigated by having a master netting arrangement between the Fund and the counterparty (although such amounts are presented on a gross basis within the Statement of Assets and Liabilities, as applicable) or by the posting of collateral by the counterparty to the Fund to cover the Fund’s exposure to the counterparty. The Fund will generally not buy protection on issuers that are not currently held by the Fund. The Fund, as shown on the Schedule of Investments, had outstanding credit default swaps as of June 30, 2010.
| n) | Use of Estimates – The preparation of financial statements in conformity with U.S. GAAP requires management to make estimates and assumptions that affect the reported amounts of assets and liabilities as of the date of the financial statements and the reported amounts of income and expenses during the period. Operating results in the future could vary from the amounts derived from management’s estimates. |
| Hartford Total Return Bond HLS Fund |
| Notes to Financial Statements – (continued) |
| June 30, 2010 (Unaudited) |
| (000’s Omitted) |
| o) | Additional Derivative Instrument(s) Information |
Derivative Instrument(s) as of June 30, 2010.
Statement of Assets and Liabilities Location | |||||||||||
Risk Exposure Category | Asset Derivatives | Liability Derivatives | |||||||||
| Interest rate contracts | Unrealized appreciation on swap contracts | $ | 1,338 | Unrealized depreciation on swap contracts | $ | 1,059 | |||||
| Interest rate contracts | Written Options, Market Value | 205 | |||||||||
| Interest rate contracts | Summary of Net Assets - Unrealized appreciation | 1,561 | |||||||||
| Interest rate contracts | Investments in securities, at value (Purchased Options), Market Value | 341 | |||||||||
| Foreign exchange contracts | Investments in securities, at value (Purchased Options), Market Value | 3,417 | |||||||||
| Foreign exchange contracts | Written Options, Market Value | 1,413 | |||||||||
| Foreign exchange contracts | Unrealized appreciation on forward foreign currency contracts | 29,137 | Unrealized depreciation on forward foreign currency contracts | 16,245 | |||||||
The ratio of forward foreign currency contracts market value to net assets as of June 30, 2010, was 24.02%, compared to the six-month period average ratio of 13.23%. The volume of other derivatives that is presented in the Schedule of Investments is consistent with the derivative activity during the six-month period ended June 30, 2010.
Realized Gain/Loss and Change in Unrealized Appreciation (Depreciation) on Derivative Instruments for the six-month period ended June 30, 2010:
Amount of Realized Gain or (Loss) on Derivatives Recognized in Income | ||||||||||||||||||||||||
| Forward | ||||||||||||||||||||||||
| Purchased | Currency | |||||||||||||||||||||||
Risk Exposure Category | Written Options | Options | Futures | Contracts | Swaps | Total | ||||||||||||||||||
| Interest rate contracts | $ | 2,153 | $ | (9,849 | ) | $ | 11,797 | $ | — | $ | — | $ | 4,101 | |||||||||||
| Foreign exchange contracts | 2,684 | (5,879 | ) | — | 6,500 | — | 3,305 | |||||||||||||||||
| Credit contracts | — | — | — | — | (5,441 | ) | (5,441 | ) | ||||||||||||||||
| Equity contracts | — | — | (468 | ) | — | — | (468 | ) | ||||||||||||||||
| Total | $ | 4,837 | $ | (15,728 | ) | $ | 11,329 | $ | 6,500 | $ | (5,441 | ) | $ | 1,497 | ||||||||||
| Change in Unrealized Appreciation or (Depreciation) on Derivatives Recognized in Income | ||||||||||||||||||||||||
| Forward | ||||||||||||||||||||||||
| Purchased | Currency | |||||||||||||||||||||||
Risk Exposure Category | Written Options | Options | Futures | Contracts | Swaps | Total | ||||||||||||||||||
| Interest rate contracts | 6,070 | 2,492 | 1,561 | — | — | $ | 10,123 | |||||||||||||||||
| Foreign exchange contracts | 792 | (6,519 | ) | — | 9,778 | — | 4,051 | |||||||||||||||||
| Credit contracts | — | — | — | — | 279 | 279 | ||||||||||||||||||
| Total | $ | 6,862 | $ | (4,027 | ) | $ | 1,561 | $ | 9,778 | $ | 279 | $ | 14,453 | |||||||||||
| p) | Indemnifications – Under the Company’s organizational documents, the Company shall indemnify its officers and directors to the full extent required or permitted under Maryland General Corporation Law and the federal securities laws. In addition, the Company, on behalf of the Fund, may enter into contracts that contain a variety of indemnifications. The Company’s maximum exposure under these arrangements is unknown. However, the Company has not had prior claims or losses pursuant to these contracts and expects the risk of loss to be remote. |
| 3. | Futures and Options: |
The Fund is subject to equity price risk, interest rate risk and foreign currency exchange rate risk in the normal course of pursuing its investment objectives. The Fund may invest in futures and options contracts in order to gain exposure to or hedge against changes in the value of equities, interest rates or foreign currencies. A futures contract is an agreement between two parties to buy and sell an asset at a set price on a future date. When the Fund enters into such futures contracts, it is required to deposit with a futures commission merchant an amount of “initial margin” of cash, commercial paper or U.S. Treasury Bills. Subsequent payments, called variation margin, to and from the broker, are made on a daily basis as the price of the underlying asset fluctuates, making the long and short positions in the futures contract more or less valuable (i.e., mark-to-market), which results in an unrealized gain or loss to the Fund.
At any time prior to the expiration of the futures contract, the Fund may close the position by taking an opposite position, which would effectively terminate the position in the futures contract. A final determination of variation margin is then made, additional cash is required to be paid by or released to the Fund and the Fund realizes a gain or loss.
The use of futures contracts involves elements of market risk, which may exceed the amounts recognized in the Statement of Assets and Liabilities. Changes in the value of the futures contracts may decrease the effectiveness of the Fund’s strategy and potentially result in loss. With futures, there is minimal counterparty risk to the Fund since futures are exchange traded through a clearing house. The clearing house requires sufficient collateral to cover margins. The Fund, as shown on the Schedule of Investments, had outstanding futures contracts as of June 30, 2010.
An option contract is a contract sold by one party to another party that offers the buyer the right, but not the obligation, to buy (call) or sell (put) a security or other financial asset at an agreed-upon price during a specific period of time or on a specific date. The premium paid by the Fund for the purchase of a call or put option is included in the Fund’s Statement of Assets and Liabilities as an investment and subsequently “marked-to-market” through net unrealized appreciation (depreciation) of options to reflect the current market value of the option as of the end of the reporting period.
| Hartford Total Return Bond HLS Fund |
Notes to Financial Statements – (continued) June 30, 2010 (Unaudited) |
| (000’s Omitted) |
The Fund may write (sell) covered options. “Covered” means that so long as the Fund is obligated as the writer of an option, it will own either the underlying securities or currency or an option to purchase the same underlying securities or currency having an expiration date of the covered option and an exercise price equal to or less than the exercise price of the covered option, or will pledge cash or other liquid securities having a value equal to or greater than the fluctuating market value of the option securities or currencies. The Fund receives a premium for writing a call or put option, which is recorded on the Fund’s Statement of Assets and Liabilities and subsequently “marked-to-market” through net unrealized appreciation (depreciation) of options. There is a risk of loss from a change in the value of such options, which may exceed the related premiums received. The maximum amount of loss with respect to the Fund’s written put option is the cost of buying the underlying security or currency. The maximum loss may be offset by proceeds received from selling the underlying securities or currency. The Fund, as shown on the Schedule of Investments, had outstanding purchased option contracts as of June 30, 2010. Transactions involving written option contracts during the six-month period ended June 30, 2010, are summarized below:
| Options Contract Activity During the | ||||||||
| Six-Month Period Ended June 30, 2010 | ||||||||
| Call Options Written During the Period | Number of Contracts* | Premium Amounts | ||||||
| Beginning of the period | 6,290 | $ | 3,290 | |||||
| Written | 1,423 | 422 | ||||||
| Expired | — | — | ||||||
| Closed | (7,713 | ) | (3,712 | ) | ||||
| Exercised | — | — | ||||||
| End of Period | — | $ | — | |||||
| Put Options Written During the Period | Number of Contracts* | Premium Amounts | ||||||
| Beginning of the period | — | — | ||||||
| Written | 761,421 | 15,226 | ||||||
| Expired | (1,191 | ) | (145 | ) | ||||
| Closed | (179,866 | ) | (4,982 | ) | ||||
| Exercised | — | — | ||||||
| End of Period | 580,364 | 10,099 | ||||||
* The number of contracts does not omit 000's.
| 4. | Federal Income Taxes: |
| a) | Federal Income Taxes – For federal income tax purposes, the Fund intends to continue to qualify as a RIC under Subchapter M of the Internal Revenue Code (“IRC”) by distributing substantially all of its taxable net investment income and net realized capital gains to its shareholders and otherwise complying with the requirements of RICs. The Fund has distributed substantially all of its income and capital gains in prior years and intends to distribute substantially all of its income and capital gains prior to the next fiscal year end. Accordingly, no provision for federal income or excise taxes has been made in the accompanying financial statements. Distributions from short-term capital gains are treated as ordinary income distributions for federal income tax purposes. |
| b) | Net Investment Income (Loss), Net Realized Gains (Losses) – Net investment income (loss) and net realized gains (losses) may differ for financial statement and tax purposes primarily because of losses deferred due to wash sale adjustments, foreign currency gains and losses, adjustments related to PFICs, REITs, RICs, certain derivatives and partnerships. The character of distributions made during the year from net investment income or net realized gains may differ from their ultimate characterization for federal income tax purposes. Also, due to the timing of dividend distributions, the fiscal year in which amounts are distributed may differ from the year that the income or realized gains (losses) were recorded by the Fund. |
| c) | Distributions and Components of Distributable Earnings – The tax character of distributions paid by the Fund for the periods indicated is as follows (as adjusted for dividends payable): |
| For the Year Ended | For the Year Ended | |||||||
| December 31, 2009 | December 31, 2008 | |||||||
| Ordinary Income | $ | 170,000 | $ | 282,435 | ||||
As of December 31, 2009, the Fund’s components of distributable earnings (deficit) on a tax basis were as follows:
| Amount | ||||
| Undistributed Ordinary Income | $ | 15,144 | ||
| Accumulated Capital and Other Losses* | (379,656 | ) | ||
Unrealized Appreciation† | 79,079 | |||
| Total Accumulated Deficit | $ | (285,433 | ) | |
| * | The Fund has capital loss carryforwards that are identified in the Capital Loss Carryforward note that follows. |
| † | The difference between book-basis and tax-basis unrealized appreciation (depreciation) may be attributable to the losses deferred due to wash sale adjustments, foreign currency gains and losses, adjustments related to PFICs, REITs, RICs, certain derivatives and partnerships. |
| d) | Reclassification of Capital Accounts – The Fund may record reclassifications in its capital accounts. These reclassifications have no impact on the total net assets of the Fund. The reclassifications are a result of permanent differences between GAAP and tax accounting for such items as net operating losses that reduce distribution requirements. Adjustments are made to reflect the impact these items have on current and future distributions to shareholders. Therefore, the source of the Fund’s distributions may be shown in the accompanying Statement of Changes in Net Assets as from net investment income, from net realized gains on investments or from capital depending on the type of book and tax differences that exist. For the year ended December 31, 2009, the Fund recorded reclassifications to increase (decrease) the accounts listed below: |
| Amount | ||||
| Accumulated Undistributed Net Investment Income | $ | 1,723 | ||
| Accumulated Net Realized Loss on Investments | (1,723 | ) | ||
| e) | Capital Loss Carryforward – At December 31, 2009 (tax-year-end), the Fund had capital loss carryforwards for U.S. federal income tax purposes of approximately: |
| Year of Expiration | Amount | |||
| 2014 | $ | 22,202 | ||
| 2016 | 141,751 | |||
| 2017 | 215,497 | |||
| Total | $ | 379,450 | ||
As of December 31, 2009, the Fund elected to defer the following post October losses.
| Amount | ||||
| Long-Term Capital Gain | $ | 206 | ||
| f) | Accounting for Uncertainty in Income Taxes – Management has evaluated all open tax years and has determined there is no impact to the Fund’s financial statements related to uncertain tax positions. Generally, tax authorities can examine all tax returns filed for the last three years. |
| Hartford Total Return Bond HLS Fund |
Notes to Financial Statements – (continued) June 30, 2010 (Unaudited) |
| (000’s Omitted) |
| 5. | Expenses: |
| a) | Investment Management Agreement – HL Investment Advisors, LLC (“HL Advisors”), an indirect wholly-owned subsidiary of The Hartford, serves as investment manager to the Fund pursuant to an Investment Management Agreement with the Company. As investment manager, HL Advisors has overall investment supervisory responsibility for the Fund. In addition, HL Advisors provides administrative personnel, services, equipment, facilities and office space for proper operation of the Fund. |
HL Advisors has contracted with Hartford Investment Management for the provision of day-to-day investment management services to the Fund in accordance with the Fund’s investment objective and policies. The Fund pays a fee to HL Advisors, a portion of which may be used to compensate Hartford Investment Management.
| b) | Administrative Services Agreement – For the two-month period January 1, 2010 through February 28, 2010, under the Administrative Services Agreement between HLIC and the Company, on behalf of the Fund, HLIC provided administrative services to the Fund and received monthly compensation at the annual rate of 0.20% of the Fund’s average daily net assets. The Fund assumed and paid certain other expenses (including, but not limited to, accounting, custodian, state taxes and Directors’ fees). Effective March 1, 2010, the Investment Management Agreement was amended to include the administrative services for the Fund and the separate administrative services agreement was terminated. |
The schedule below reflects the rates of compensation paid to HL Advisors for investment management services and to HLIC for administrative services rendered from January 1, 2010 through February 28, 2010, and the rates of compensation paid to the HL Advisors for the combined services from March 1, 2010 through June 30, 2010; the rates are accrued daily and paid monthly.
| Average Daily Net Assets | Annual Fee | |||
| On first $250 million | 0.5250 | % | ||
| On next $250 million | 0.5000 | % | ||
| On next $500 million | 0.4750 | % | ||
| On next $4 billion | 0.4500 | % | ||
| On next $5 billion | 0.4300 | % | ||
| Over $10 billion | 0.4200 | % | ||
| c) | Accounting Services Agreement – Pursuant to the Fund Accounting Agreement between HLIC and the Company, on behalf of the Fund, HLIC provides accounting services to the Fund and receives monthly compensation on the Fund’s average net assets. The Fund’s accounting services fees are accrued daily and paid monthly. |
| Average Daily Net Assets | Annual Fee | |||
| On first $5 billion | 0.018 | % | ||
| On next $5 billion | 0.016 | % | ||
| Over $10 billion | 0.014 | % | ||
| d) | Operating Expenses – Allocable expenses incurred by the Company are allocated to each Fund and allocated to classes within the Fund in proportion to the average daily net assets of the Fund and each class, except where allocation of certain expenses is more fairly made directly to the Fund or to specific classes within a Fund. |
| e) | Fees Paid Indirectly – The Fund’s custodian bank has agreed to reduce its fees when the Fund maintains cash on deposit in a non-interest-bearing custody account. For the six-month period ended June 30, 2010, the Fund had no fee reductions. |
The ratio of expenses to average net assets in the accompanying financial highlights excludes the reduction in expenses related to fees paid indirectly. Had the fees paid indirectly been included, the annualized expense ratio for the periods listed below would have been as follows:
| Annualized | ||||||||||||||||||||||||
| Six-Month | Year Ended | Year Ended | Year Ended | Year Ended | Year Ended | |||||||||||||||||||
| Period Ended | December 31, | December 31, | December 31, | December 31, | December 31, | |||||||||||||||||||
June 30, 2010 | 2009 | 2008 | 2007 | 2006 | 2005 | |||||||||||||||||||
| Class IA | 0.50 | % | 0.51 | % | 0.49 | % | 0.49 | % | 0.49 | % | 0.50 | % | ||||||||||||
| Class IB | 0.75 | 0.76 | 0.74 | 0.74 | 0.74 | 0.75 | ||||||||||||||||||
| f) | Distribution Plan for Class IB shares – The Company, on behalf of the Fund, has adopted a Distribution Plan pursuant to Rule 12b-1 under the 1940 Act for the Class IB shares. Pursuant to the Distribution Plan, the Fund is authorized to compensate the Distributor, Hartford Securities Distribution Company, Inc. (a wholly owned, ultimate subsidiary of The Hartford), from assets attributable to the Class IB shares for services rendered and expenses borne in connection with activities primarily intended to result in the sale of the Class IB shares, subject to the Fund Board’s review and approval. |
The Distribution Plan provides that the Fund may pay annually up to 0.25% of the average daily net assets of the Fund attributable to its Class IB shares for activities primarily intended to result in the sale of Class IB shares. The Board has the authority to suspend or reduce these payments at any point in time. Under the terms of the Distribution Plan and the principal underwriting agreement, the Fund is authorized to make payments monthly to the Distributor which may be used to pay or compensate entities providing distribution and shareholder servicing with respect to the Class IB shares for such entities’ fees or expenses incurred or paid in that regard. These fees are accrued daily and paid monthly.
| g) | Other Related Party Transactions – Certain officers of the Fund are directors and/or officers of HL Advisors, and/or The Hartford or its subsidiaries. For the six-month period ended June 30, 2010, a portion of the Fund’s chief compliance officer’s salary was paid by all the investment companies in the Hartford fund complex. The portion allocated to the Fund was in the amount of $10. Hartford Investor Services Company, LLC ("HISC"), a wholly owned subsidiary of The Hartford, provides transfer agent services to the Fund. The amount HISC was compensated for providing such services can be found on the Statement of Operations. These fees are accrued daily and paid monthly. |
| h) | Payment from Affiliate – On November 8, 2006, the SEC issued an order setting forth the terms of a settlement reached with three subsidiaries of The Hartford that resolves the SEC’s Division of Enforcement’s investigation of aspects of The Hartford’s variable annuity and mutual fund operations related to directed brokerage and revenue sharing. The Hartford settled this matter without admitting or denying the findings of the SEC. |
The Fund is available for purchase by the separate accounts of different variable universal life policies, variable annuity products, and funding agreements and it is offered directly to certain qualified retirement plans (collectively “Products”). Although existing Products contain transfer restrictions, some Products, particularly older variable annuity products, do not contain restrictions on the frequency of transfers. In addition, as the result of the settlement of litigation against Hartford Life, Inc. (“Hartford Life”) (the issuers of such variable annuity products), the Fund’s ability to restrict transfers by certain owners of older variable annuity products was limited. During 2006, these annuity owners surrendered the older variable annuity contracts that were the subject of prior litigation. In February 2005, Hartford Life agreed with the Board of Directors of the Fund to indemnify the Fund for any material harm caused to the Fund from frequent trading by these contracts owners.
The total return in the accompanying financial highlights includes payment from affiliates. Had the payment from affiliates been excluded, the total return for the periods listed below would have been as follows:
| Hartford Total Return Bond HLS Fund |
Notes to Financial Statements – (continued) June 30, 2010 (Unaudited) |
| (000’s Omitted) |
| For the Year Ended December 31, 2006 | ||||||||
| Class IA | Class IB | |||||||
| Impact from Payment from Affiliate for SEC Settlement | — | % | — | % | ||||
| Total Return Excluding Payments from Affiliate | 4 .80 | 4 .54 | ||||||
| 6. | Investment Transactions: |
For the six-month period ended June 30, 2010, the cost of purchases and proceeds from sales of investment securities (excluding short-term investments) were as follows:
| Amount | ||||
| Cost of Purchases Excluding U.S. Government Obligations | $ | 3,702,489 | ||
| Sales Proceeds Excluding U.S. Government Obligations | 4,102,556 | |||
| Cost of Purchases for U.S. Government Obligations | 1,861,904 | |||
| Sales Proceeds for U.S. Government Obligations | 1,553,347 | |||
| 7. | Line of Credit: |
The Fund is one of several Hartford funds that participate in a $500 million committed revolving line of credit facility. The facility is to be used for temporary or emergency purposes. Under the arrangement, a fund is required to own securities having a market value in excess of 300% of the total bank borrowings. The interest rate on borrowings varies depending on the nature of the loan. The facility also requires a fee to be paid based on the amount of the commitment. This fee is allocated to all the funds participating in the line of credit based on the average net assets of the funds. During the six-month period ended June 30, 2010, the Fund did not have any borrowings under this facility.
| 8. | Industry Classifications: |
Other than the industry classifications “Other Investment Pools and Funds” and “Exchange Traded Funds”, equity industry classifications used in this report are the Global Industry Classification Standard, which was developed by and is the exclusive property and service mark of MSCI, Inc. and Standard & Poor’s.
[This page is intentionally left blank]
| Hartford Total Return Bond HLS Fund |
| - Selected Per-Share Date (A) - - |
| Class | Net Asset Value at Beginning of Period | Net Investment Income (Loss) | Payments from (to) Affiliate | Net Realized and Unrealized Gain (Loss) on Investments | Total from Investment Operations | Dividends from Net Investment Income | Distributions from Realized Capital Gains | Distributions from Capital | Total Distributions | Net Increase (Decrease) in Net Asset Value | Net Asset Value at End of Period | |||||||||||||||||||||||||||||||||
| For the Six-Month Period Ended June 30, 2010 (Unaudited) | ||||||||||||||||||||||||||||||||||||||||||||
| IA | $ | 10.58 | $ | 0.22 | $ | – | $ | 0.37 | $ | 0.59 | $ | – | $ | – | $ | – | $ | – | $ | 0.59 | $ | 11.17 | ||||||||||||||||||||||
| IB | 10.53 | 0.21 | – | 0.36 | 0.57 | – | – | – | – | 0.57 | 11.10 | |||||||||||||||||||||||||||||||||
| For the Year Ended December 31, 2009 | ||||||||||||||||||||||||||||||||||||||||||||
| IA | 9.54 | 0.46 | – | 0.98 | 1.44 | (0.40 | ) | – | – | (0.40 | ) | 1.04 | 10.58 | |||||||||||||||||||||||||||||||
| IB | 9.50 | 0.46 | – | 0.95 | 1.41 | (0.38 | ) | – | – | (0.38 | ) | 1.03 | 10.53 | |||||||||||||||||||||||||||||||
| For the Year Ended December 31, 2008 | ||||||||||||||||||||||||||||||||||||||||||||
| IA | 11.15 | 0.62 | – | (1.49 | ) | (0.87 | ) | (0.74 | ) | – | – | (0.74 | ) | (1.61 | ) | 9.54 | ||||||||||||||||||||||||||||
| IB | 11.09 | 0.67 | – | (1.55 | ) | (0.88 | ) | (0.71 | ) | – | – | (0.71 | ) | (1.59 | ) | 9.50 | ||||||||||||||||||||||||||||
| For the Year Ended December 31, 2007(G) | ||||||||||||||||||||||||||||||||||||||||||||
| IA | 11.24 | 0.60 | – | (0.08 | ) | 0.52 | (0.61 | ) | – | – | (0.61 | ) | (0.09 | ) | 11.15 | |||||||||||||||||||||||||||||
| IB | 11.19 | 0.57 | – | (0.09 | ) | 0.48 | (0.58 | ) | – | – | (0.58 | ) | (0.10 | ) | 11.09 | |||||||||||||||||||||||||||||
| For the Year Ended December 31, 2006(G) | ||||||||||||||||||||||||||||||||||||||||||||
| IA | 11.27 | 0.55 | – | (0.01 | ) | 0.54 | (0.57 | ) | – | – | (0.57 | ) | (0.03 | ) | 11.24 | |||||||||||||||||||||||||||||
| IB | 11.20 | 0.51 | – | – | 0.51 | (0.52 | ) | – | – | (0.52 | ) | (0.01 | ) | 11.19 | ||||||||||||||||||||||||||||||
| For the Year Ended December 31, 2005 | ||||||||||||||||||||||||||||||||||||||||||||
| IA | 11.94 | 0.44 | – | (0.14 | ) | 0.30 | (0.88 | ) | (0.09 | ) | – | (0.97 | ) | (0.67 | ) | 11.27 | ||||||||||||||||||||||||||||
| IB | 11.86 | 0.43 | – | (0.17 | ) | 0.26 | (0.83 | ) | (0.09 | ) | – | (0.92 | ) | (0.66 | ) | 11.20 | ||||||||||||||||||||||||||||
| (A) | Information presented relates to a share outstanding throughout the indicated period. |
| (B) | The figures do not include sales charges or other fees which may be applied at the variable life insurance, variable annuity or qualified retirement plan product level. Any such additional sales charges or other fees would lower the Fund's performance. |
| (C) | Ratios do not reflect reductions for fees paid indirectly. Please see Fees Paid Indirectly in the Notes to Financial Statements. |
| (D) | Portfolio turnover rate is calculated on the basis of the Fund as a whole without distinguishing between the classes of shares issued. |
| (E) | Not annualized. |
| (F) | Annualized. |
| (G) | Per share amounts have been calculated using the average shares method. |
| (H) | Total return without the inclusion of the Payment from (to) Affiliate can be found in Expenses in the accompanying Notes to Financial Statements. |
| - Ratios and Supplemental Data - - |
Ratio of Expenses to Average Net | Ratio of Expenses to Average Net | Ratio of Net Investment Income to | Portfolio Turnover | |||||||||||||||||||
Total Return(B) | Net Assets at End of Period | Assets Before Waivers(C) | Assets After Waivers(C) | Average Net Assets | Rate(D) | |||||||||||||||||
| 5.61 | %(E) | $ | 4,164,499 | 0.50 | %(F) | 0.50 | %(F) | 4.04 | %(F) | 80 | % | |||||||||||
| 5.48 | (E) | 782,742 | 0.75 | (F) | 0.75 | (F) | 3.79 | (F) | – | |||||||||||||
| 15.01 | 3,902,957 | 0.51 | 0.51 | 4.67 | 215 | |||||||||||||||||
| 14.72 | 789,541 | 0.76 | 0.76 | 4.42 | – | |||||||||||||||||
| (7.62 | ) | 3,167,919 | 0.49 | 0.49 | 5.54 | 173 | ||||||||||||||||
| (7.85 | ) | 740,580 | 0.74 | 0.74 | 5.27 | – | ||||||||||||||||
| 4.67 | 3,458,709 | 0.49 | 0.49 | 5.27 | 223 | |||||||||||||||||
| 4.41 | 1,036,331 | 0.74 | 0.74 | 5.01 | – | |||||||||||||||||
| 4.80 | (H) | 3,041,321 | 0.50 | 0.50 | 4.82 | 344 | ||||||||||||||||
| 4.54 | (H) | 1,040,408 | 0.75 | 0.75 | 4.56 | – | ||||||||||||||||
| 2.45 | 2,745,115 | 0.50 | 0.50 | 4.09 | 190 | |||||||||||||||||
| 2.19 | 1,068,600 | 0.75 | 0.75 | 3.84 | – | |||||||||||||||||
| Hartford Total Return Bond HLS Fund |
The Board of Directors appoints officers who are responsible for the day-to-day operations of the Fund and who execute policies formulated by the Directors. Each director serves until his or her death, resignation, or retirement or until the next annual meeting of shareholders is held or until his or her successor is elected and qualifies.
Directors and officers who are employed by or who have a financial interest in The Hartford are considered “interested” persons of the Fund pursuant to the Investment Company Act of 1940, as amended. Each officer and two of the Company’s directors, as noted in the chart below, are “interested” persons of the Fund. Each director serves as a director for The Hartford Mutual Funds, Inc., The Hartford Mutual Funds II, Inc., The Hartford Income Shares Fund, Inc., Hartford Series Fund, Inc., and Hartford HLS Series Fund II, Inc., which, as of June 30, 2010, collectively consist of 88 funds. Correspondence may be sent to directors and officers c/o Hartford Mutual Funds, P.O. Box 2999, Hartford, Connecticut 06104-2999, except that correspondence to Ms. Fagely may be sent to 500 Bielenberg Drive, Woodbury, Minnesota 55125.
The table below sets forth, for each director and officer, his or her name, year of birth, current position with the Company and date first elected or appointed to Hartford Series Fund, Inc. (“HSF”), and Hartford HLS Series Fund II, Inc. (“HSF2”), principal occupation, and, for directors, other directorships held. The Fund’s statement of additional information contains further information on the directors and is available free of charge by calling 1-800-862-6668 or writing to Hartford HLS Funds, c/o Individual Annuity Services, P.O. Box 5085, Hartford, CT 06102-5085.
Information on the aggregate remuneration paid to the directors of the Company can be found in the Statement of Operations herein. The Fund pays to The Hartford a portion of the chief compliance officer’s compensation, but does not pay salaries or compensation to any of their other officers or directors who are employed by The Hartford.
Non-Interested Directors
Lynn S. Birdsong (1946) Director since 2003, Co-Chairman of the Investment Committee
Mr. Birdsong is a private investor. Since 2003, Mr. Birdsong has been an independent director of The Japan Fund and has served as a Director of the Sovereign High Yield Fund since April 2010. From 2003 to March 2005, Mr. Birdsong was an independent director of the Atlantic Whitehall Funds. From 1979 to 2002, Mr. Birdsong was a managing director of Zurich Scudder Investments, an investment management firm. During his employment with Scudder, Mr. Birdsong was an interested director of The Japan Fund. Since 1981, Mr. Birdsong has been a partner in Birdsong Company, an advertising specialty firm.
Robert M. Gavin, Jr. (1940) Director since 2002 (HSF) and 1986 (HSF2), Chairman of the Board since 2004
Dr. Gavin is an educational consultant. Prior to September 1, 2001, he was President of Cranbrook Education Community and prior to July 1996, he was President of Macalester College, St. Paul, Minnesota.
Duane E. Hill (1945) Director since 2001 (HSF) and 2002 (HSF2), Chairman of the Nominating Committee
Mr. Hill is Partner of TSG Ventures L.P., a private equity investment company. Mr. Hill is a former partner of TSG Capital Group, a private equity investment firm that served as sponsor and lead investor in leveraged buyouts of middle market companies.
Sandra S. Jaffee (1941) Director since 2005
Ms. Jaffee served as Chairman (2008 to 2009) and Chief Executive Officer of Fortent (formerly Searchspace Group), a leading provider of compliance/regulatory technology to financial institutions from August 2005 to August 2009. From August 2004 to August 2005, Ms. Jaffee served as an Entrepreneur in Residence with Warburg Pincus, a private equity firm. From September 1995 to July 2004, Ms. Jaffee served as Executive Vice President at Citigroup, where she was President and Chief Executive Officer of Citibank’s Global Securities Services (1995 to 2003).
William P. Johnston (1944) Director since 2005, Chairman of the Compliance Committee
In June 2006, Mr. Johnston was appointed as Senior Advisor to The Carlyle Group, a global private equity investment firm. In July 2006, Mr. Johnston was elected to the Board of Directors of MultiPlan, Inc. In August 2007, Mr. Johnston was elected to the Board of Directors of LifeCare Holdings, Inc. In February 2008, Mr. Johnston was elected to the Board of Directors of HCR-ManorCare, Inc. In May 2006, Mr. Johnston was elected to the Supervisory Board of Fresenius Medical Care AG & Co. KGaA, after its acquisition of Renal Care Group, Inc. in March 2006. Mr. Johnston joined Renal Care Group in November 2002 as a member of the Board of Directors and served as Chairman of the Board from March 2003 through March 2006. From September 1987 to December 2002, Mr. Johnston was with Equitable Securities Corporation (and its successors, SunTrust Equitable Securities and SunTrust Robinson Humphrey) serving in various investment banking and managerial positions, including Managing Director and Head of Investment Banking, Chief Executive Officer and Vice Chairman.
Phillip O. Peterson (1944) Director since 2002 (HSF) and 2000 (HSF2), Chairman of the Audit Committee
Mr. Peterson is a mutual fund industry consultant. He was a partner of KPMG LLP (an accounting firm) until July 1999. Mr. Peterson joined William Blair Funds in February 2007 as a member of the Board of Trustees. From January 2004 to April 2005, Mr. Peterson served as Independent President of the Strong Mutual Funds.
Lemma W. Senbet (1946) Director since 2005
Dr. Senbet is the William E. Mayer Chair Professor of Finance and Director, Center for Financial Policy, at the University of Maryland, Robert H. Smith School of Business. He was chair of the Finance Department during 1998 to 2006. Previously he was a chaired professor of finance at the University of Wisconsin-Madison. Also, he was director of the Fortis Funds from March 2000 to July 2002. Dr. Senbet served the finance profession in various capacities, including as director of the American Finance Association and President of the Western Finance Association. In 2006, Dr. Senbet was inducted Fellow of Financial Management Association International for his career-long distinguished scholarship and professional service.
Interested Directors and Officers
Lowndes A. Smith (1939) Director since 1996 (HSF) and 2002 (HSF2), Co-Chairman of the Investment Committee
Mr. Smith served as Vice Chairman of The Hartford from February 1997 to January 2002, as President and Chief Executive Officer of Hartford Life, Inc. from February 1997 to January 2002, and as President and Chief Operating Officer of The Hartford Life Insurance Companies from January 1989 to January 2002. Mr. Smith serves as a Director of White Mountains Insurance Group, Ltd., One Beacon Insurance, Symetra Financial and as a Managing Director of Whittington Gray Associates.
John C. Walters 1, 2 (1962) Director since 2008
Mr. Walters currently serves as President, Chief Executive Officer and Director for Hartford Life, Inc. (“HL, Inc.”). Mr. Walters also serves as President, Chairman of the Board, Chief Executive Officer and Director for Hartford Life Insurance Company (“Hartford Life”), and as Executive Vice President of The Hartford. In addition, Mr. Walters is a Manager of HL Investment Advisors, LLC (“HL Advisors”). Mr. Walters previously served as President of the U.S. Wealth Management Division of HL, Inc. (2006-2007) and as Co-Chief Operating Officer of Hartford Life (2007-2008).
| 1 | Mr. Walters previously served as President and Chief Executive Officer (2007 to 2009). |
| 2 | Effective July 31, 2010, Mr. Walters retired from The Hartford. Mr. Walters resigned his position as a Director of the Fund effective July 30, 2010. |
Other Officers
Robert M. Arena, Jr. (1968) President and Chief Executive Officer since 2009 (served as Vice President of the Fund (2006-2009))
Mr. Arena serves as Executive Vice President of Hartford Life. Additionally, Mr. Arena is Senior Vice President and Director of Hartford Administrative Services Company, (“HASCO”), President, Chief Executive Officer and Manager of Hartford Investment Financial Services, LLC (“HIFSCO”) and President, Chief Executive Officer and Manager of HL Advisors. Mr. Arena joined The Hartford in 2004.
Tamara L. Fagely (1958) Vice President, Treasurer and Controller since 2002 (HSF) 1993 (HSF2)
Ms. Fagely has been a Vice President of HASCO since 1998 and Chief Financial Officer since 2006. Currently Ms. Fagely is a Vice President of Hartford Life. She served as Assistant Vice President of Hartford Life from December 2001 through March 2005. In addition, Ms. Fagely is Controller and Chief Financial Officer of HIFSCO.
Brian Ferrell (1962) AML Compliance Officer since 2008
Mr. Ferrell has served as Assistant Vice President and AML Compliance Officer for The Hartford since 2006, and as AML Compliance Officer for HASCO and Hartford Investor Services Company, LLC (“HISC”) since 2008. Prior to joining The Hartford in 2006, Mr. Ferrell held various positions at the U.S. Department of the Treasury (the “Treasury”) from 2001 to 2006, where he served as Chief Counsel for the Treasury’s Financial Crimes Enforcement Network from 2005-2006.
Dr. Robert J. Froehlich (1953) Senior Managing Director since 2009
Dr. Froehlich joined The Hartford as Senior Managing Director in September 2009. Prior to joining The Hartford, Dr. Froehlich served as Vice Chairman of Deutsche Asset Management from 1997-2009.
| Hartford Total Return Bond HLS Fund |
| Directors and Officers (Unaudited) – (continued) |
Thomas D. Jones, III (1965) Vice President and Chief Compliance Officer since 2006
Mr. Jones serves as Chief Compliance Officer for the Hartford Mutual Funds and Vice President and Director of Securities Compliance for The Hartford. Mr. Jones joined The Hartford in 2006 from SEI Investments, where he served as Chief Compliance Officer for its mutual funds and investment advisers. Prior to joining SEI, Mr. Jones was First Vice President and Compliance Director for Merrill Lynch Investment Managers (Americas) (“MLIM”), where he worked from 1992-2004.
Edward P. Macdonald (1967) Vice President, Secretary and Chief Legal Officer since 2005
Mr. Macdonald serves as Assistant Vice President of Hartford Life and Chief Legal Officer and Vice President of HIFSCO. He also serves as Vice President and Secretary of HASCO, and Chief Legal Officer, Secretary and Vice President of HL Advisors. Mr. Macdonald joined The Hartford in 2005.
Vernon J. Meyer (1964) Vice President since 2006
Mr. Meyer serves as Senior Vice President of Hartford Life. He also serves as Senior Vice President of HIFSCO and HL Advisors. Mr. Meyer joined The Hartford in 2004.
D. Keith Sloane (1960) Vice President since 2009
Mr. Sloane is a Senior Vice President of Hartford Life. Additionally, Mr. Sloane currently serves as Senior Vice President of HIFSCO, HL Advisors, and HASCO. Prior to joining The Hartford in 2007, Mr. Sloane was Director of product marketing and led the mutual fund business for Wachovia Securities (“Wachovia”) in their investment products group. Mr. Sloane joined Wachovia in 1995.
Jane Wolak (1961) Vice President since 2009
Ms. Wolak currently serves as Vice President of Hartford Life. Ms. Wolak joined Hartford Life as Vice President, Retail Product Services in May 2007. She is also Vice President of HASCO. Previously, Ms. Wolak was with Sun Life Financial where she held the position of Vice President, Service Center Operations from 2001-2007.
A description of the policies and procedures that the Fund uses to determine how to vote proxies relating to portfolio securities and a record of how the Fund voted any proxies for the twelve-month period ended June 30, 2010 is available (1) without charge, upon request, by calling 800-862-6668 and (2) on the Securities and Exchange Commission’s website at http://www.sec.gov.
The Fund files a complete schedule of portfolio holdings with the Commission for the first and third quarters of each fiscal year on Form N-Q. The Fund’s Forms are available (1) without charge, upon request, by calling 800-862-6668 and (2) on the Securities and Exchange Commission’s website at http://www.sec.gov. The Form N-Q may be reviewed and copied at the Commission’s Public Reference Room in Washington, DC. Information on the operation of the Public Reference Room may be obtained by calling 1-800-SEC-0330.
| Hartford Total Return Bond HLS Fund |
The following proposal was addressed and approved at a Special Meeting of Shareholders held on February 12, 2010.
Proposal to approve amendments to the Investment Management Agreement between the Fund and HL Investment Advisors, the purpose of which were to combine the administrative services for the Fund with the management services for the Fund under a single agreement.
| Fund | For | Against | Abstain | |||
| Hartford Total Return Bond HLS Fund | 381,164,232.460 | 11,700,479.471 | 11,216,002.353 |
Proposal to elect Lemma Senbet and John Walters, each currently a Director, as Directors of Hartford Series Fund Inc.
Lemma W. Senbet
| Funds | For | Withheld | ||
| Hartford Series Fund, Inc. | 5,079,578,022.902 | 241,839,974.106 |
John C. Walters
| Funds | For | Withheld | ||
| Hartford Series Fund, Inc. | 5,081,138,302.186 | 240,279,694.822 |
| Hartford Total Return Bond HLS Fund |
Your Fund's Expenses
As a shareholder of the Fund, you incur two types of costs: (1) transaction costs, including sales charges (loads) on purchase payments and contingent deferred sales charges (CDSC) (2) ongoing costs including management fees; distribution fees; and other fund expenses. This example is intended to help you understand your ongoing costs (in dollars) of investing in the Fund and to compare these costs with the ongoing costs of investing in other mutual funds. The example is based on an investment of $1,000 invested at the beginning of the period and held for the period of December 31, 2009 through June 30, 2010.
Actual Expenses
The first set of columns of the table below provides information about actual account values and actual expenses. You may use the information in this column, together with the amount you invested, to estimate the expenses that you paid over the period. Simply divide your account value by $1,000 (for example, an $8,600 account value divided by $1,000 = 8.6), then multiply the result by the number in the line under the heading entitled "Expenses Paid During Period" to estimate the expenses you paid on your account during this period.
Hypothetical Example for Comparison Purposes
The second set of columns of the table below provides information about hypothetical account values and hypothetical expenses based on the Fund's actual expense ratio and an assumed rate of return of 5% per year before expenses, which is not the Fund's actual return. The hypothetical account values and expenses may not be used to estimate the actual ending account balance or expenses you paid for the period. You may use this information to compare the ongoing costs of investing in the Fund and other funds. To do so, compare this 5% hypothetical example with the 5% hypothetical examples that appear in the shareholder reports of the other funds.
Please note that the expenses shown in the table are meant to highlight your ongoing costs only and do not reflect any transactional costs, such as sales charges (loads) and CDSC. Therefore, the second set of columns of the table is useful in comparing ongoing costs only, and will not help you determine the relative total costs of owning different funds. In addition, if these transactional costs were included, your costs would be higher. Expenses are equal to the Fund's annualized expense ratios multiplied by average account value over the period, multiplied by 181/365 (to reflect the one-half year period).
| Actual return | Hypothetical (5% return before expenses) | |||||||||||||||||||||||||||||||||||
Beginning Account Value December 31, 2009 | Ending Account Value June 30, 2010 | Expenses paid during the period December 31, 2009 through June 30, 2010 | Beginning Account Value December 31, 2009 | Ending Account Value June 30, 2010 | Expenses paid during the period December 31, 2009 through June 30, 2010 | Annualized expense ratio | Days in the current 1/2 year | Days in the full year | ||||||||||||||||||||||||||||
| Class IA | $ | 1,000.00 | $ | 1,056.10 | $ | 2.55 | $ | 1,000.00 | $ | 1,022.32 | $ | 2.51 | 0.50 | % | 181 | 365 | ||||||||||||||||||||
Class IB | $ | 1,000.00 | $ | 1,054.82 | $ | 3.82 | $ | 1,000.00 | $ | 1,021.08 | $ | 3.76 | 0.75 | % | 181 | 365 | ||||||||||||||||||||
| Hartford Total Return Bond HLS Fund |
The Board approved the annual continuation of the Investment Management Agreement (the “Agreement”) between Hartford Series Fund, Inc. (“HSF”) and HL Investment Advisors, LLC (“HL Advisors”) with respect to the Fund at its meeting on August 4-5, 2009. The Board’s considerations in approving the renewal of the Agreement are disclosed in the December 31, 2009 Annual Report for HSF.
At the November 4-5, 2009 meeting, the Board considered and approved amendments to the Agreement to include administrative services, which had been provided pursuant to a separate agreement, and investment management services under one agreement. The Board, including all of the Independent Directors, approved the amendments to the Agreement with respect to the Fund.
In approving the amendments, in addition to the information presented at the August meeting in connection with the annual review of the Agreement and the additional information provided throughout the year, the Board also considered the fact that the amendments did not result in an overall increase in fees to shareholders. The Board took note of the fact that the management of HL Advisors believes that the proposal to combine the administrative services with the investment management services under a single agreement will produce streamlined fee disclosure, resulting in greater transparency and clarity in the Fund’s prospectuses and financial reports. The Board further noted management's belief that the change would result in consistency across all of the Hartford Funds in the complex in that the funds of HSF are the only funds in the complex (other than the R share classes of the Hartford retail funds) that are subject to a separate administrative services fee. Finally, the Board noted management's view that the proposed changes to the Agreement should also serve to simplify the Board's annual consideration of the investment management arrangements for the Fund in that the investment management and administrative fees would be presented as a single fee for fee comparison purposes, which should facilitate the Board's analysis.
The shareholders of the Fund approved the amendments at a Special Meeting of Shareholders held on February 12, 2010. The amendments were effective as of March 1, 2010.
41
The Hartford
P.O. Box 5085
Hartford, CT 06102–5085
Hartford Series Fund, Inc. is underwritten and distributed by Hartford Securities Distribution Company, Inc.
“The Hartford” is The Hartford Financial Services Group, Inc. and its subsidiaries.
Hartford Series Fund, Inc. inception dates range from 1977 to date. Hartford Series Fund, Inc. is not a subsidiary of The Hartford but is underwritten, distributed by and advised by subsidiaries of The Hartford. Investments in Hartford Series Fund, Inc. are not guaranteed by The Hartford or any other entity.
This material is authorized for distribution only when preceded or accompanied by a current prospectus. The prospectus contains detailed information about the Funds, including investment objectives, risks and charges and expenses. Please read it carefully before you invest or send money.
HLSSAR-TRB10 Printed in U.S.A ©2010 The Hartford, Hartford, CT 06115 |
| Hartford Value HLS Fund |
|
Hartford Value HLS Fund
| Manager Discussions (Unaudited) | 2 |
| Financial Statements | |
| 4 | |
| 7 | |
| 8 | |
| 9 | |
| 10 | |
| 11 | |
| 22 | |
| 24 | |
| 26 | |
| 26 | |
| 27 | |
| 28 | |
| 29 |
This report is prepared for the general information of contract owners and qualified retirement plan participants. It is not an offer of contracts or of qualified retirement plans. It should not be used in connection with any offer, except in conjunction with the appropriate prospectus which contains all pertinent information including the applicable sales, administrative and other charges.
The views expressed in the Fund’s Manager Discussion under ‘‘Why did the Fund perform this way?’’ and ‘‘What is the outlook?’’ are views of the Fund’s subadvisers and portfolio management team through the end of the period and is subject to change based on market and other conditions.
Hartford Value HLS Fund inception 04/30/2001
(subadvised by Wellington Management Company, LLP)
Investment objective – Seeks long-term total return.
Performance Overview(1) 4/30/01 - 6/30/10
Growth of $10,000 investment

Russell 1000 Value Index is an unmanaged index measuring the performance of those Russell 1000 Index companies with lower price-to-book ratios and lower forecasted growth values.
You cannot invest directly in an index.
The chart represents a hypothetical investment in the Fund. Performance data represents past performance and current performance could be higher or lower.
Average Annual Returns (as of 6/30/10)
| 6 | 1 | 5 | Since | |
| Month† | Year | Year | Inception | |
| Value IA | -7.03% | 12.60% | 1.53% | 2.07% |
| Value IB | -7.15% | 12.32% | 1.28% | 1.82% |
| Russell 1000 Value Index | -5.12% | 16.92% | -1.64% | 1.50% |
| † | Not Annualized |
PAST PERFORMANCE IS NOT INDICATIVE OF FUTURE RESULTS.
| (1) | Growth of a $10,000 investment in Class IB shares will vary from the results seen on this page due to differences in the expense charged to this share class. |
Performance information may reflect historical or current expense waivers from the investment adviser, without which performance would have been lower. For information on current expense waivers/reimbursements, please see the prospectus.
The value of the contract will fluctuate so that when redeemed, it may be worth more or less than the original investment. The chart and table do not reflect the deduction of taxes that a shareholder would pay on portfolio distributions or the redemption of portfolio shares. The figures do not include sales charges or other fees which may be applied at the variable life insurance, variable annuity or qualified retirement plan product level. Any such additional sales charges or other fees would lower the Fund’s performance.
| Portfolio Managers | ||
| Karen H. Grimes, CFA | W. Michael Reckmeyer, III, CFA | Ian R. Link, CFA |
| Senior Vice President, Partner | Senior Vice President, Partner | Vice President |
How did the Fund perform?
The Class IA shares of the Hartford Value HLS Fund returned -7.03% for the six-month period ended June 30, 2010, underperforming its benchmark, the Russell 1000 Value Index, which returned -5.12% for the same period. The Fund also underperformed the -6.71% return of the average fund in the Lipper Large Cap Value Funds VP-UF peer group, a group of funds with investment strategies similar to those of the Fund.
Why did the Fund perform this way?
After posting positive results early in the period, global equity markets came under pressure in the later part of the period as credit fears resurfaced, especially in Europe. There were also early indications of a coming global growth slowdown. With inflation generally absent, we expect no rate hikes from any of the major central banks in the near future. The sovereign debt crisis in Europe is likely only a precursor of the fiscal challenges many developed countries may face in coming years.
Overall equity market performance was negative for the period across all market capitalizations: large cap equities (-7%), mid cap equities (-1%), and small cap equities (-2%) all declined as represented by the S&P 500, S&P 400 MidCap, and Russell 2000 indices, respectively. During the six-month period nine of ten sectors fell within the Russell 1000 Value Index, led by Energy (-11%), Health Care (-10%), and Materials (-10%). Consumer Staples (+1%) was the only sector to post positive absolute returns.
The Fund’s underperformance versus its benchmark was primarily due to weak stock selection. Stock selection was particularly weak in Financials, Consumer Staples, and Information Technology, more than offsetting stronger selection in Industrials and Energy. The Fund’s overweights (i.e. the Fund’s sector position was greater than the benchmark position) to Health Care and Information Technology also detracted from benchmark-relative results.
Dean Foods (Consumer Staples), Baxter International (Health Care), and Microsoft (Information Technology) detracted most from benchmark-relative returns. Shares of U.S.-based food and beverage company Dean Foods declined due to lower-than-
expected earnings as retailers continued to promote less-expensive store brand milk over more profitable premium milk. Diversified healthcare company Baxter saw its shares decline as management cut the 2010 outlook due to weakness in the company’s plasma business. Shares of global technology company Microsoft fell on concerns about sluggish enterprise spending and a slow uptake of the new Windows 7 operating system. Top absolute detractors for the period also included Pfizer (Health Care).
Among the top contributors to benchmark-relative returns were Cummins (Industrials), Cliffs Natural Resources (Materials), and Exxon Mobil (Energy). Shares of Cummins, a global leader in energy efficient and low emission engine technology for commercial vehicles, rose on continued strength in emerging markets businesses and signs of recovery in the U.S. Cliffs Natural Resources, an iron ore mining company, saw its shares rise early in the period as the company reported above-consensus quarterly results. Shares of Exxon Mobil, the world’s largest publicly traded international oil and gas company, fell amid concerns about potential dilution from the firm’s acquisition of XTO. Exxon’s exclusion from the Russell Value Index also weighed on the stock. On average, we were underweight (i.e. the Fund’s sector position was less than the benchmark position) the stock during the period, which contributed positively to relative results. Top absolute contributors for the period also included Boeing (Industrials).
What is the outlook?
The second quarter of 2010 saw a resurgence of risk aversion. During the quarter, investors were forced to confront the impacts of negative news on several fronts: sovereign debt and solvency issues in Europe, concerns about a double-dip global recession and an open-ended oil spill in the Gulf of Mexico. Following on the heels of strong appreciation in risk assets, these events served to reintroduce fear into the investment lexicon, and risk-related assets reacted accordingly: equities fell, fixed income spreads widened and safe havens like gold and the dollar rose.
While there will be inevitable challenges as we emerge from the recession of 2008-2009, we believe the global economy will continue to expand. Fiscal and monetary stimulus are still working their way through the system and emerging markets continue to grow, driving demand and production higher. In our view, this early stage self-reinforcing cycle is likely to underpin growth, albeit at levels below those experienced in many prior recoveries.
From a portfolio perspective, relative sector exposures continue to be informed by bottom-up (i.e. stock by stock fundamental research) investment decisions. Based on bottom-up stock decisions, we ended the period most overweight the Energy, Consumer Discretionary, and Information Technology sectors; our largest underweights were in Financials, Utilities, and Consumer Staples.
Diversification by Industry
as of June 30, 2010
| Percentage of | ||||
| Industry (Sector) | Net Assets | |||
| Automobiles & Components (Consumer Discretionary) | 0.6 | % | ||
| Banks (Financials) | 5.7 | |||
| Capital Goods (Industrials) | 10.3 | |||
| Commercial & Professional Services (Industrials) | 1.0 | |||
| Consumer Durables & Apparel (Consumer Discretionary) | 3.2 | |||
| Diversified Financials (Financials) | 10.3 | |||
| Energy (Energy) | 15.2 | |||
| Food & Staples Retailing (Consumer Staples) | 2.1 | |||
| Food, Beverage & Tobacco (Consumer Staples) | 4.8 | |||
| Health Care Equipment & Services (Health Care) | 3.8 | |||
| Household & Personal Products (Consumer Staples) | 0.6 | |||
| Insurance (Financials) | 7.1 | |||
| Materials (Materials) | 4.6 | |||
| Media (Consumer Discretionary) | 2.5 | |||
| Pharmaceuticals, Biotechnology & Life Sciences (Health Care) | 7.5 | |||
| Retailing (Consumer Discretionary) | 5.2 | |||
| Semiconductors & Semiconductor Equipment (Information Technology) | 3.9 | |||
| Software & Services (Information Technology) | 1.4 | |||
| Technology Hardware & Equipment (Information Technology) | 3.5 | |||
| Telecommunication Services (Services) | 2.7 | |||
| Utilities (Utilities) | 3.6 | |||
| Short-Term Investments | 0.7 | |||
| Other Assets and Liabilities | (0.3 | ) | ||
| Total | 100.0 | % | ||
| Hartford Value HLS Fund |
June 30, 2010 (Unaudited)
(000’s Omitted)
| Shares or Principal Amount | Market Value ╪ | ||||||
| COMMON STOCKS - 99.6% | |||||||
| Automobiles & Components - 0.6% | |||||||
| 462 | Ford Motor Co. ● | $ | 4,655 | ||||
| Banks - 5.7% | |||||||
| 304 | PNC Financial Services Group, Inc. | 17,181 | |||||
| 1,091 | Wells Fargo & Co. | 27,919 | |||||
| 45,100 | |||||||
| Capital Goods - 10.3% | |||||||
| 138 | Boeing Co. | 8,659 | |||||
| 164 | Cummins, Inc. | 10,694 | |||||
| 1,214 | General Electric Co. | 17,503 | |||||
| 157 | Illinois Tool Works, Inc. | 6,498 | |||||
| 375 | Ingersoll-Rand plc | 12,937 | |||||
| 183 | PACCAR, Inc. | 7,312 | |||||
| 455 | Textron, Inc. | 7,723 | |||||
| 307 | Tyco International Ltd. | 10,823 | |||||
| 82,149 | |||||||
| Commercial & Professional Services - 1.0% | |||||||
| 258 | Waste Management, Inc. | 8,076 | |||||
| Consumer Durables & Apparel - 3.2% | |||||||
| 95 | Coach, Inc. | 3,480 | |||||
| 433 | Mattel, Inc. | 9,162 | |||||
| 252 | Stanley Black & Decker, Inc. | 12,741 | |||||
| 25,383 | |||||||
| Diversified Financials - 10.3% | |||||||
| 217 | Ameriprise Financial, Inc. | 7,844 | |||||
| 1,217 | Bank of America Corp. | 17,493 | |||||
| 356 | Bank of New York Mellon Corp. | 8,781 | |||||
| 178 | Credit Suisse Group ADR | 6,674 | |||||
| 104 | Goldman Sachs Group, Inc. | 13,678 | |||||
| 706 | JP Morgan Chase & Co. | 25,855 | |||||
| 94 | Solar Capital Ltd. | 1,810 | |||||
| 230 | Solar Cayman Ltd. ⌂●† | 91 | |||||
| 82,226 | |||||||
| Energy - 15.2% | |||||||
| 63 | Anadarko Petroleum Corp. | 2,284 | |||||
| 119 | Apache Corp. | 9,977 | |||||
| 300 | Baker Hughes, Inc. | 12,458 | |||||
| 318 | Chevron Corp. | 21,566 | |||||
| 328 | ConocoPhillips Holding Co. | 16,088 | |||||
| 72 | EOG Resources, Inc. | 7,084 | |||||
| 211 | Exxon Mobil Corp. | 12,040 | |||||
| 142 | Hess Corp. | 7,161 | |||||
| 285 | Marathon Oil Corp. | 8,870 | |||||
| 269 | Occidental Petroleum Corp. | 20,715 | |||||
| 80 | Southwestern Energy Co. ● | 3,091 | |||||
| 121,334 | |||||||
| Food & Staples Retailing - 2.1% | |||||||
| 304 | CVS/Caremark Corp. | 8,916 | |||||
| 278 | Sysco Corp. | 7,931 | |||||
| 16,847 | |||||||
| Food, Beverage & Tobacco - 4.8% | |||||||
| 402 | Dean Foods Co. ● | 4,044 | |||||
| 132 | General Mills, Inc. | 4,674 | |||||
| 271 | Kraft Foods, Inc. | 7,591 | |||||
| 122 | Molson Coors Brewing Co. | 5,151 | |||||
| 144 | PepsiCo, Inc. | 8,783 | |||||
| 193 | Philip Morris International, Inc. | 8,844 | |||||
| 39,087 | |||||||
| Health Care Equipment & Services - 3.8% | |||||||
| 181 | Baxter International, Inc. | 7,372 | |||||
| 159 | Covidien plc | 6,381 | |||||
| 359 | UnitedHealth Group, Inc. | 10,201 | |||||
| 113 | Zimmer Holdings, Inc. ● | 6,102 | |||||
| 30,056 | |||||||
| Household & Personal Products - 0.6% | |||||||
| 83 | Kimberly-Clark Corp. | 5,045 | |||||
| Insurance - 7.1% | |||||||
| 313 | ACE Ltd. | 16,093 | |||||
| 257 | Chubb Corp. | 12,846 | |||||
| 377 | Marsh & McLennan Cos., Inc. | 8,493 | |||||
| 297 | Principal Financial Group, Inc. | 6,966 | |||||
| 583 | Unum Group | 12,660 | |||||
| 57,058 | |||||||
| Materials - 4.6% | |||||||
| 135 | Agrium U.S., Inc. | 6,607 | |||||
| 107 | Cliff's Natural Resources, Inc. | 5,046 | |||||
| 122 | Dow Chemical Co. | 2,882 | |||||
| 255 | E.I. DuPont de Nemours & Co. | 8,824 | |||||
| 146 | Mosaic Co. | 5,691 | |||||
| 641 | Rexam plc | 2,883 | |||||
| 68 | Rexam plc ADR | 1,529 | |||||
| 235 | Steel Dynamics, Inc. | 3,098 | |||||
| 36,560 | |||||||
| Media - 2.5% | |||||||
| 508 | CBS Corp. Class B | 6,567 | |||||
| 793 | Comcast Corp. Class A | 13,768 | |||||
| 20,335 | |||||||
| Pharmaceuticals, Biotechnology & Life Sciences - 7.5% | |||||||
| 155 | Abbott Laboratories | 7,232 | |||||
| 183 | Amgen, Inc. ● | 9,631 | |||||
| 164 | Johnson & Johnson | 9,704 | |||||
| 313 | Merck & Co., Inc. | 10,942 | |||||
| 1,012 | Pfizer, Inc. | 14,437 | |||||
| 152 | Teva Pharmaceutical Industries Ltd. ADR | 7,887 | |||||
| 59,833 | |||||||
| Retailing - 5.2% | |||||||
| 3,040 | Buck Holdings L.P. ⌂●† | 6,855 | |||||
| 316 | Home Depot, Inc. | 8,867 | |||||
| 169 | Kohl's Corp. ● | 8,042 | |||||
| 355 | Staples, Inc. | 6,763 | |||||
| 212 | Target Corp. | 10,429 | |||||
| 40,956 | |||||||
| Semiconductors & Semiconductor Equipment - 3.9% | |||||||
| 693 | Intel Corp. | 13,479 | |||||
| 328 | Maxim Integrated Products, Inc. | 5,490 | |||||
| 404 | Taiwan Semiconductor Manufacturing Co., Ltd. ADR | 3,941 | |||||
| 361 | Texas Instruments, Inc. | 8,411 | |||||
| 31,321 | |||||||
| Software & Services - 1.4% | |||||||
| 481 | Microsoft Corp. | 11,066 | |||||
The accompanying notes are an integral part of these financial statements.
Shares or Principal Amount | Market Value ╪ | |||||||
| COMMON STOCKS - 99.6% - (continued) | ||||||||
| Technology Hardware & Equipment - 3.5% | ||||||||
| 548 | Cisco Systems, Inc. ● | $ | 11,681 | |||||
| 245 | Hewlett-Packard Co. | 10,604 | ||||||
| 179 | Qualcomm, Inc. | 5,878 | ||||||
| 28,163 | ||||||||
| Telecommunication Services - 2.7% | ||||||||
| 685 | AT&T, Inc. | 16,569 | ||||||
| 183 | Verizon Communications, Inc. | 5,118 | ||||||
| 21,687 | ||||||||
| Utilities - 3.6% | ||||||||
| 230 | Edison International | 7,292 | ||||||
| 160 | Entergy Corp. | 11,481 | ||||||
| 65 | NextEra Energy, Inc. | 3,181 | ||||||
| 269 | Northeast Utilities | 6,859 | ||||||
| 28,813 | ||||||||
| Total common stocks | ||||||||
| (cost $840,420) | $ | 795,750 | ||||||
| Total long-term investments | ||||||||
| (cost $840,420) | $ | 795,750 | ||||||
| SHORT-TERM INVESTMENTS - 0.7% | ||||||||
| Repurchase Agreements - 0.7% | ||||||||
| Bank of America TriParty Joint Repurchase | ||||||||
| Agreement (maturing on 07/01/2010 in the | ||||||||
| amount of $1,783, collateralized by | ||||||||
| FHLMC 5.50%, 2039, FNMA 4.50% - | ||||||||
| 5.50%, 2038 - 2040, GNMA 5.00%, 2040, | ||||||||
| value of $1,818) | ||||||||
| $ | 1,783 | 0.05%, 6/30/2010 | $ | 1,783 | ||||
| BNP Paribas Securities Corp. TriParty Joint | ||||||||
| Repurchase Agreement (maturing on | ||||||||
| 07/01/2010 in the amount of $305, | ||||||||
| collateralized by FNMA 4.50% - 6.50%, | ||||||||
| 2024 - 2040, GNMA 5.00% - 6.50%, 2038 - | ||||||||
| 2040, value of $312) | ||||||||
| 305 | 0.04%, 6/30/2010 | 305 | ||||||
| Deutsche Bank Securities TriParty Joint | ||||||||
| Repurchase Agreement (maturing on | ||||||||
| 07/01/2010 in the amount of $1,350, | ||||||||
| collateralized by GNMA 3.13% - 7.00%, | ||||||||
| 2023 - 2052, value of $1,377) | ||||||||
| 1,350 | 0.05%, 6/30/2010 | 1,350 | ||||||
| JP Morgan Chase TriParty Joint Repurchase | ||||||||
| Agreement (maturing on 07/01/2010 in the | ||||||||
| amount of $305, collateralized by FHLMC | ||||||||
| 2.38% - 5.83%, 2033 - 2038, value of $312) | ||||||||
| 305 | 0.06%, 6/30/2010 | 305 | ||||||
| Morgan Stanley & Co., Inc. TriParty Joint | ||||||||
| Repurchase Agreement (maturing on | ||||||||
| 07/01/2010 in the amount of $1,331, | ||||||||
| collateralized by FHLMC 5.00% - 5.50%, | ||||||||
| 2038 - 2039, FNMA 5.00%, 2039, value of | ||||||||
$1,363) | ||||||||
| 1,331 | 0.03%, 6/30/2010 | 1,331 | ||||||
| UBS Securities, Inc. Repurchase Agreement | ||||||||
| (maturing on 07/01/2010 in the amount of | ||||||||
| $16, collateralized by U.S. Treasury Bill | ||||||||
| 0.88%, 2011, value of $16) | ||||||||
| 16 | 0.02%, 6/30/2010 | 16 | ||||||
| UBS Securities, Inc. TriParty Joint Repurchase | ||||||||
| Agreement (maturing on 07/01/2010 in the | ||||||||
| amount of $337, collateralized by FNMA | ||||||||
| 5.00% - 6.00%, 2033 - 2036, value of $344) | ||||||||
| 337 | 0.09%, 6/30/2010 | 337 | ||||||
| 5,427 | ||||||||
Total short-term investments (cost $5,427) | $ | 5,427 | ||||||
Total investments (cost $845,847) ▲ | 100.3 | % | $ | 801,177 | ||||
| Other assets and liabilities | (0.3 | )% | (2,683 | ) | ||||
| Total net assets | 100.0 | % | $ | 798,494 | ||||
| Note: | Percentage of investments as shown is the ratio of the total market value to total net assets. Market value of investments in foreign securities represents 3.6% of total net assets at June 30, 2010. |
Foreign securities that are principally traded on certain foreign markets are adjusted daily pursuant to a third party pricing service methodology approved by the Board of Directors in order to reflect an adjustment for factors occurring after the close of the foreign market but before the close of the New York Stock Exchange.
| ▲ | At June 30, 2010, the cost of securities for federal income tax purposes was $848,499 and the aggregate gross unrealized appreciation and depreciation based on that cost were: |
| Unrealized Appreciation | $ | 34,374 | ||
| Unrealized Depreciation | (81,696 | ) | ||
| Net Unrealized Depreciation | $ | (47,322 | ) |
| † | The aggregate value of securities valued in good faith at fair value as determined under policies and procedures established by and under the supervision of the Fund's Board of Directors at June 30, 2010, was $6,946, which represents 0.87% of total net assets. This amount excludes securities that are principally traded in certain foreign markets and whose prices are adjusted pursuant to a third party pricing service methodology approved by the Board of Directors. |
| ● | Currently non-income producing. |
| ⌂ | The following securities are considered illiquid. Illiquid securities are often purchased in private placement transactions, are often not registered under the Securities Act of 1933 and may have contractual restrictions on resale. A security may also be considered illiquid if the security lacks a readily available market or if its valuation has not changed for a certain period of time. |
| Period | Shares/ | |||||||||
| Acquired | Par | Security | Cost Basis | |||||||
| 06/2007 | 3,040 | Buck Holdings L.P. | $ | 2,599 | ||||||
| 03/2007 | 230 | Solar Cayman Ltd. - 144A | 171 | |||||||
The aggregate value of these securities at June 30, 2010 was $6,946 which represents 0.87% of total net assets.
The accompanying notes are an integral part of these financial statements.
| Hartford Value HLS Fund |
Schedule of Investments – (continued)
June 30, 2010 (Unaudited)
(000’s Omitted)
| ╪ | See Significant Accounting Policies of accompanying Notes to Financial Statements regarding valuation of securities. |
The accompanying notes are an integral part of these financial statements.
| Hartford Value HLS Fund |
June 30, 2010 (Unaudited)
(000’s Omitted)
| Total | Level 1♦ | Level 2♦ | Level 3 | |||||||||||||
| Assets: | ||||||||||||||||
| Common Stocks ‡ | $ | 795,750 | $ | 785,921 | $ | 2,883 | $ | 6,946 | ||||||||
| Short-Term Investments | 5,427 | – | 5,427 | – | ||||||||||||
| Total | $ | 801,177 | $ | 785,921 | $ | 8,310 | $ | 6,946 | ||||||||
| ♦ | For the period ended June 30, 2010, there were no significant transfers between Level 1 and Level 2. |
| ‡ | The Fund has all or primarily all of these equity securities categorized in a single level. Refer to the Schedule of Investments for further industry breakout. |
Following is a reconciliation of Level 3 assets for which significant unobservable inputs were used to determine fair value:
| Balance as | Change in | |||||||||||||||||||||||||||||||||||
| of | Realized | Unrealized | Transfers | Transfers | Balance | |||||||||||||||||||||||||||||||
| December | Gain | Appreciation | Net | Into | Out of | as of June | ||||||||||||||||||||||||||||||
31, 2009 | (Loss) | (Depreciation) | Amortization | Purchases* | Sales | Level 3 | Level 3 | 30, 2010 | ||||||||||||||||||||||||||||
| Assets: | ||||||||||||||||||||||||||||||||||||
| Common Stock | $ | — | $ | 504 | $ | 56 | † | $ | — | $ | 7,175 | $ | (789 | ) | $ | — | $ | — | $ | 6,946 | ||||||||||||||||
| Total | $ | — | $ | 504 | $ | 56 | $ | — | $ | 7,175 | $ | (789 | ) | $ | — | $ | — | $ | 6,946 | |||||||||||||||||
| * | Securities totaling $3,056 were acquired through fund merger. The market value of these securities on merger date was $7,175. |
| † | Change in unrealized gains or losses in the current period relating to assets still held at June 30, 2010 was $56. |
The accompanying notes are an integral part of these financial statements.
| Hartford Value HLS Fund |
June 30, 2010 (Unaudited)
(000’s Omitted)
| Assets: | ||||
| Investments in securities, at market value (cost $845,847) | $ | 801,177 | ||
| Cash | 1 | |||
| Receivables: | ||||
| Fund shares sold | 110 | |||
| Dividends and interest | 1,142 | |||
| Other assets | 9 | |||
| Total assets | 802,439 | |||
| Liabilities: | ||||
| Payables: | ||||
| Investment securities purchased | 3,260 | |||
| Fund shares redeemed | 503 | |||
| Investment management fees | 132 | |||
| Distribution fees | 8 | |||
| Accrued expenses | 42 | |||
| Total liabilities | 3,945 | |||
| Net assets | $ | 798,494 | ||
| Summary of Net Assets: | ||||
| Capital stock and paid-in-capital | $ | 1,062,892 | ||
| Accumulated undistributed net investment income | 4,323 | |||
| Accumulated net realized loss on investments and foreign currency transactions | (224,051 | ) | ||
| Unrealized depreciation of investments | (44,670 | ) | ||
| Net assets | $ | 798,494 | ||
| Shares authorized | 800,000 | |||
| Par value | $ | 0.001 | ||
Class IA: Net asset value per share | $ | 8.84 | ||
| Shares outstanding | 74,217 | |||
| Net assets | $ | 655,796 | ||
Class IB: Net asset value per share | $ | 8.82 | ||
| Shares outstanding | 16,186 | |||
| Net assets | $ | 142,698 | ||
The accompanying notes are an integral part of these financial statements.
| Hartford Value HLS Fund |
For the Six-Month Period Ended June 30, 2010 (Unaudited)
(000’s Omitted)
| Investment Income: | ||||
| Dividends | $ | 6,388 | ||
| Interest | 5 | |||
| Less: Foreign tax withheld | (20 | ) | ||
| Total investment income, net | 6,373 | |||
| Expenses: | ||||
| Investment management fees | 2,261 | |||
| Administrative service fees | 98 | |||
| Transfer agent fees | 1 | |||
| Distribution fees - Class IB | 145 | |||
| Custodian fees | 5 | |||
| Accounting services fees | 32 | |||
| Board of Directors' fees | 5 | |||
| Audit fees | 5 | |||
| Other expenses | 36 | |||
| Total expenses (before fees paid indirectly) | 2,588 | |||
| Commission recapture | (5 | ) | ||
| Total fees paid indirectly | (5 | ) | ||
| Total expenses, net | 2,583 | |||
| Net investment income | 3,790 | |||
| Net Realized Gain on Investments and Foreign Currency Transactions: | ||||
| Net realized gain on investments | 32,753 | |||
| Net realized gain on forward foreign currency contracts | 278 | |||
| Net realized loss on other foreign currency transactions | (232 | ) | ||
| Net Realized Gain on Investments and Foreign Currency Transactions | 32,799 | |||
| Net Changes in Unrealized Depreciation of Investments: | ||||
| Net unrealized depreciation of investments | (129,703 | ) | ||
| Net Changes in Unrealized Depreciation of Investments | (129,703 | ) | ||
| Net Loss on Investments and Foreign Currency Transactions | (96,904 | ) | ||
| Net Decrease in Net Assets Resulting from Operations | $ | (93,114 | ) | |
The accompanying notes are an integral part of these financial statements.
| Hartford Value HLS Fund |
(000’s Omitted)
| For the | ||||||||
| Six-Month | For the | |||||||
| Period Ended | Year Ended | |||||||
| June 30, 2010 | December 31, | |||||||
| (Unaudited) | 2009 | |||||||
| Operations: | ||||||||
| Net investment income | $ | 3,790 | $ | 4,533 | ||||
| Net realized gain (loss) on investments and foreign currency transactions | 32,799 | (36,616 | ) | |||||
| Net unrealized appreciation (depreciation) of investments | (129,703 | ) | 93,365 | |||||
| Payment from affiliate | — | 13 | ||||||
| Net increase (decrease) in net assets resulting from operations | (93,114 | ) | 61,295 | |||||
| Distributions to Shareholders: | ||||||||
| From net investment income | ||||||||
| Class IA | — | (4,102 | ) | |||||
| Class IB | — | (918 | ) | |||||
| Total distributions | — | (5,020 | ) | |||||
| Capital Share Transactions: | ||||||||
| Class IA | ||||||||
| Sold | 40,026 | 29,879 | ||||||
| Issued in merger | 531,323 | — | ||||||
| Issued on reinvestment of distributions | — | 4,102 | ||||||
| Redeemed | (83,023 | ) | (51,208 | ) | ||||
| Total capital share transactions | 488,326 | (17,227 | ) | |||||
| Class IB | ||||||||
| Sold | 18,318 | 5,033 | ||||||
| Issued in merger | 97,765 | — | ||||||
| Issued on reinvestment of distributions | — | 918 | ||||||
| Redeemed | (20,713 | ) | (17,885 | ) | ||||
| Total capital share transactions | 95,370 | (11,934 | ) | |||||
| Net increase (decrease) from capital share transactions | 583,696 | (29,161 | ) | |||||
| Net increase in net assets | 490,582 | 27,114 | ||||||
| Net Assets: | ||||||||
| Beginning of period | 307,912 | 280,798 | ||||||
| End of period | $ | 798,494 | $ | 307,912 | ||||
| Accumulated undistributed (distribution in excess of) net investment income | $ | 4,323 | $ | 533 | ||||
| Shares: | ||||||||
| Class IA | ||||||||
| Sold | 3,916 | 3,824 | ||||||
| Issued in merger | 52,973 | — | ||||||
| Issued on reinvestment of distributions | — | 442 | ||||||
| Redeemed | (8,439 | ) | (6,471 | ) | ||||
| Total share activity | 48,450 | (2,205 | ) | |||||
| Class IB | ||||||||
| Sold | 1,904 | 629 | ||||||
| Issued in merger | 9,763 | — | ||||||
| Issued on reinvestment of distributions | — | 99 | ||||||
| Redeemed | (2,116 | ) | (2,247 | ) | ||||
| Total share activity | 9,551 | (1,519 | ) | |||||
The accompanying notes are an integral part of these financial statements.
| Hartford Value HLS Fund |
June 30, 2010 (Unaudited)
(000’s Omitted)
| 1. | Organization: |
Hartford Value HLS Fund (the "Fund") serves as an underlying investment option for certain variable annuity and variable life insurance separate accounts of Hartford Life Insurance Company (“HLIC”) and its affiliates and certain qualified retirement plans. The Fund may also serve as an underlying investment option for certain variable annuity and variable life separate accounts of other insurance companies. Owners of variable annuity contracts and policyholders of variable life insurance contracts may choose the funds permitted in the variable insurance contract prospectus. In addition, participants in certain qualified retirement plans may choose the fund if permitted by their plans.
Hartford Series Fund, Inc. (the “Company”) is an open-end registered management investment company comprised of twenty-nine portfolios, one portfolio of which is included in these financial statements.
The Company is organized under the laws of the State of Maryland and is registered with the Securities and Exchange Commission (“SEC”) under the Investment Company Act of 1940, as amended (“1940 Act”). The Fund is organized as a diversified open-end management investment company.
The Fund is divided into Class IA and Class IB shares. Each class is offered at the per share net asset value (“NAV”) without a sales charge and is subject to the same expenses, except that the Class IB shares are subject to distribution and service fees charged pursuant to a Distribution and Service Plan adopted in accordance with Rule 12b-1 under the 1940 Act.
| 2. | Significant Accounting Policies: |
The following is a summary of significant accounting policies of the Fund, which are in accordance with U.S. Generally Accepted Accounting Principles (“GAAP”).
| a) | Security Transactions and Investment Income – Security transactions are recorded on the trade date (the date the order to buy or sell is executed). Security gains and losses are determined on the basis of identified cost. |
Dividend income is accrued as of the ex-dividend date, except that certain dividends for foreign securities where the ex-dividend date may have passed are recorded as soon as the Fund is informed of the dividend in the exercise of reasonable diligence. Interest income, including amortization of premium and accretion of discounts, is accrued on a daily basis.
| b) | Security Valuation – The Fund generally uses market prices in valuing portfolio securities. If market prices are not readily available or are deemed unreliable, the Fund will use the fair value of the security as determined in good faith under policies and procedures established by and under the supervision of the Fund’s Board of Directors. Market prices may be deemed unreliable, for example, if a security is thinly traded or if an event has occurred after the close of the security’s primary market, but before the close of the New York Stock Exchange (the “Exchange”) (generally 4:00 p.m. |
Eastern Time, referred to as the “Valuation Time”) that is expected to affect the value of the portfolio security. The circumstances in which the Fund may use fair value pricing include, among others: (i) the occurrence of events that are significant to a particular issuer, such as mergers, restructuring or defaults; (ii) the occurrence of events that are significant to an entire market, such as natural disasters in a particular region or governmental actions; (iii) trading restrictions on securities; (iv) thinly traded securities and (v) market events such as trading halts and early market closings. In addition, with respect to the valuation of stocks primarily traded on foreign markets, the Fund uses a fair value pricing service approved by the Fund’s Board of Directors, which employs quantitative models that evaluate changes in the value of foreign market proxies (e.g., futures contracts, American Depositary Receipts (“ADRs”), exchange traded funds (“ETFs”)) after the close of the foreign markets but before the Valuation Time. Securities that are primarily traded on foreign markets may trade on days that are not business days of the Fund. The value of the foreign securities in which the Fund invests may change on days when a shareholder will not be able to purchase or redeem shares of the Fund. Fair value pricing is subjective in nature and the use of fair value pricing by the Fund may cause the NAV of its shares to differ significantly from the NAV that would have been calculated using market prices at the close of the exchange on which a portfolio security is primarily traded but before the Valuation Time. There can be no
| Hartford Value HLS Fund |
Notes to Financial Statements – (continued)
June 30, 2010 (Unaudited)
(000’s Omitted)
assurance that the Fund could obtain the fair value assigned to a security if the Fund were to sell the security at approximately the time at which the Fund determines its NAV.
Exchange-traded equity securities are valued at the last reported sale price or official close price on the exchange or market on which the security is primarily traded (the “Primary Market”) at the Valuation Time. If the security did not trade on the Primary Market, it may be valued at the Valuation Time at the last reported sale price on another exchange where it trades. The value of an equity security not traded on any exchange but traded on the Nasdaq Stock Market, Inc. or another over-the-counter market shall be valued at the last reported sale price or official closing price on the exchange or market on which the security is traded as of the Valuation Time.
Foreign-denominated assets, including investment securities, and liabilities are translated from the local currency into U.S. dollars using exchange rates obtained from an independent third party as of the Fund’s Valuation Time.
Financial instruments for which prices are not available from an independent pricing service may be valued using market quotations obtained from one or more dealers that make markets in securities in accordance with procedures established by the Fund’s Board of Directors.
Forward foreign currency contracts represent agreements to exchange currencies on specific future dates at predetermined rates. Forward foreign currency contracts are valued using foreign currency exchange rates and forward rates on the Valuation Date from an independent pricing service.
Other derivative or contractual type instruments shall be valued using market prices if such instruments trade on an exchange or market. If such instruments do not trade on an exchange or market, such instruments shall be valued at a price at which the counterparty to such contract would repurchase the instrument. In the event that the counterparty cannot provide a price, such valuation may be determined in accordance with procedures established by the Fund’s Board of Directors.
Various inputs are used in determining the value of the Fund’s investments. These inputs are summarized into three broad hierarchy levels. This hierarchy is based on whether the valuation inputs are observable or unobservable. These levels are:
| · | Level 1 – Quoted prices in active markets for identical securities. Level 1 may include exchange-traded instruments such as domestic equities, some foreign equities, options, futures, mutual funds, ETFs, and rights and warrants. |
| · | Level 2 – Observable inputs other than Level 1 prices, such as quoted prices for similar securities; quoted prices in markets that are not active; or other inputs that are observable or can be corroborated by observable market data. Level 2 may include debt securities that are traded less frequently than exchange-traded instruments and which are valued using third party pricing services. Prices for most level 2 securities are based on prices received from an independent pricing service. The following asset classes generally use valuation techniques and inputs as noted below: |
Asset Backed Securities and Collateralized Mortgage Obligations – Multi-dimensional spread/prepayment speed tables, with consideration of yield or price of bonds of comparable quality, coupon and maturity, attributes of the collateral, new issue data and monthly payment information.
Corporate Bonds – Multi-dimensional relational model based on observable market information such as yields, spreads, sector analysis, etc.
Foreign Currency – based on rates determined at the close of the Exchange, provided by an independent pricing service.
Forward Currency Contracts – valued based on the price of the underlying currency at the prevailing interpolated exchange rate, which is a combination of the spot currency rate and the forward currency rate, provided by an independent pricing service.
Foreign Equities – Certain foreign equities are priced using a multi-factor regression model with market observable inputs of a correlative nature (ADRs, futures contracts, ETFs, and currency exchange rates).
International Fixed Income – Multi-dimensional relational model based on observable market information such as benchmark yields, reported trades, bids and offers.
Money Market Instruments – Amortized cost.
Mortgage Backed Securities (“MBS”) – Matrix pricing using inputs of To-Be-Announced (“TBA”) prices, new issue data and monthly payment information, with consideration of yield or price of bonds of comparable quality, coupon and maturity, and attributes of the collateral.
Municipal Bonds – Multi-dimensional relational model and series of matrices based on observable market information such as Municipal Securities Rulemaking Board reported trades, comparable bonds, yields, spreads and credit analysis.
Preferred Stocks – Close mean of bid/ask or bid.
Repurchase Agreements – Priced at par.
Senior Floating Rate Interests – Composite of quotes from one or more contributing dealers.
Swaps – Price based upon observable market information from an independent pricing service.
U.S. Government Securities – Treasuries exclusively traded in the secondary market.
· | Level 3 – Significant unobservable inputs that are supported by limited or no market activity. Level 3 may include financial instruments whose values are determined using broker quotes or require significant management judgment or estimation. While these securities are priced using unobservable inputs, the valuation of these securities reflects the best available data and management believes the prices are a reasonable representation of exit price. The following asset classes generally use valuation techniques and inputs as noted below: |
Asset Backed Securities & Commercial Mortgage Backed Securities – Certain other MBS with limited liquidity priced from an independent pricing service.
Common Stocks – Trading has been halted or there are restrictions on trading. Valuation is based on last trade with the application of a discount or premium, if applicable.
Long Dated Over-the-Counter Options – Terms greater than 10 years from current date, expected volatility is not observable. Prices are from an independent pricing service.
Long Term Debt Securities, including Senior Floating Rate Interests – Unobservable valuation inputs may include estimates for current yields, maturity/duration, prepayment speed, and broker quotes for comparable securities along with other assumptions relating to credit quality, collateral value, complexity of the security structure, general market conditions and liquidity.
| Hartford Value HLS Fund |
Notes to Financial Statements – (continued)
June 30, 2010 (Unaudited)
(000’s Omitted)
Swaps – Terms greater than 10 years from current date, expected volatility is not observable. Prices are from an independent pricing service.
Individual securities within any of the above mentioned asset classes may be assigned a different hierarchical level than those that are presented above, as individual circumstances dictate.
For purposes of reporting transfers between different hierarchy levels, both transfers in and out of each level are shown as if they occurred at the beginning of the period.
Refer to the Investment Valuation Hierarchy Levels Summary and the Level 3 roll forward reconciliation found following the Schedules of Investments.
| c) | Foreign Currency Transactions – Assets and liabilities denominated in currencies other than U.S. dollars are translated into U.S. dollars at the exchange rates in effect on the valuation date. Purchases and sales of investment securities, income and expenses are translated into U.S. dollars at the exchange rates on the dates of such transactions. |
The Fund does not isolate that portion of portfolio security valuation resulting from fluctuations in the foreign currency exchange rates from the fluctuations arising from changes in the market prices of securities held. Exchange rate fluctuations are included with the net realized and unrealized gain or loss on investments in the accompanying financial statements.
Net realized foreign exchange gains or losses arise from sales of foreign currencies and the difference between asset and liability amounts initially stated in foreign currencies and the U.S. dollar value of the amounts actually received or paid. Net unrealized foreign exchange gains or losses arise from changes in the value of other assets and liabilities at the end of the reporting period, resulting from changes in the exchange rates.
| d) | Joint Trading Account – Pursuant to an exemptive order issued by the SEC, the Fund may transfer uninvested cash balances into a joint trading account managed by Wellington Management Company, LLP (“Wellington Management”). These balances may be invested in one or more repurchase agreements and/or short-term money market instruments. |
| e) | Repurchase Agreements – A repurchase agreement is an agreement by which a counterparty agrees to sell a security and agrees to repurchase the security sold at a mutually agreed upon time and price. At the time the Fund enters into a repurchase agreement, the value of the underlying collateral security(ies), including accrued interest, will be equal to or exceed the value of the repurchase agreement. To minimize counterparty risk, the securities that serve to collateralize the repurchase agreement are held by the Fund's custodian in book entry or physical form in the custodial account of the Fund or in a third party custodial account. Repurchase agreements are valued at cost plus accrued interest. The Fund, as shown on the Schedule of Investments, had outstanding repurchase agreements as of June 30, 2010. |
| f) | Forward Foreign Currency Contracts – The Fund may enter into forward foreign currency contracts that obligate the Fund to purchase or sell currencies at specified future dates. Forward foreign currency contracts may be used to hedge against adverse fluctuations in exchange rates between currencies. |
Forward foreign currency contracts involve elements of market risk in excess of the amounts reflected in the Statement of Assets and Liabilities. In addition, risks may arise upon entering into these contracts from the potential inability of the counterparties to meet the terms of the contracts and from unanticipated movements in the value of the foreign currencies relative to the U.S. dollar. The Fund had no outstanding forward foreign currency contracts as of June 30, 2010.
| g) | Fund Share Valuation and Dividend Distributions to Shareholders – Orders for the Fund’s shares are executed in accordance with the investment instructions of the contract holders or plan participants. The NAV of the Fund’s shares is determined as of the close of each business day of the Exchange. The NAV is determined separately for each class of the Fund by dividing the Fund’s net assets attributable to that class by the number of outstanding shares of the class. Orders for the purchase of the Fund’s shares received by an insurance company or plan prior to the close of the Exchange on any |
day on which the Exchange is open for business are priced at the NAV determined as of the close of the Exchange. Orders received by an insurance company or plan after the close of the Exchange, or on a day on which the Exchange and/or the Fund is not open for business, are priced at the next determined NAV. Dividends are declared pursuant to a policy adopted by the Fund’s Board of Directors based upon the investment performance of the Fund. The policy of the Fund is to pay dividends from net investment income and distribute realized capital gains, if any, at least once a year. |
Distributions from net investment income, realized capital gains and capital are determined in accordance with federal income tax regulations, which may differ from U.S. GAAP with respect to character and timing. These differences may include but are not limited to losses deferred due to wash sale adjustments, foreign currency gains and losses, adjustments related to Passive Foreign Investment Companies (“PFICs”), Real Estate Investment Trusts (“REITs”), Regulated Investment Companies (“RICs”), certain derivatives and partnerships. Permanent book and federal income tax basis differences relating to shareholder distributions will result in reclassifications to certain of the Fund’s capital accounts (see Federal Income Taxes: Reclassification of Capital Accounts note). |
| h) | Illiquid and Restricted Securities – The Fund is permitted to invest up to 15% of its net assets in illiquid securities. “Illiquid Securities” are those that may not be sold or disposed of in the ordinary course of business within seven days, at approximately the price used to determine the Fund’s NAV. The Fund may not be able to sell illiquid securities or other investments when its sub-adviser considers it desirable to do so or may have to sell such securities or investments at a price that is lower than the price that could be obtained if the securities or investments were more liquid. A sale of illiquid securities or other investments may require more time and may result in higher dealer discounts and other selling expenses than does the sale of those that are liquid. Illiquid securities and investments also may be more difficult to value, due to the unavailability of reliable market quotations for such securities or investments, and an investment in them may have an adverse impact on the Fund’s NAV. The Fund may also purchase certain restricted securities, commonly known as Rule 144A securities, that can be resold to institutions and which may be determined to be liquid pursuant to policies and guidelines established by the Fund’s Board of Directors. The Fund, as shown on the Schedule of Investments, had illiquid and/or restricted securities as of June 30, 2010. |
| i) | Securities Purchased on a When-Issued or Delayed-Delivery Basis – Delivery and payment for securities that have been purchased by the Fund on a forward commitment, or when-issued or delayed-delivery basis, take place beyond the customary settlement period. During this period, such securities are subject to market fluctuations, and the Fund identifies securities segregated in its records with value at least equal to the amount of the commitment. As of June 30, 2010, the Fund had no outstanding when-issued or delayed delivery securities. |
| j) | Use of Estimates – The preparation of financial statements in conformity with U.S. GAAP requires management to make estimates and assumptions that affect the reported amounts of assets and liabilities as of the date of the financial statements and the reported amounts of income and expenses during the period. Operating results in the future could vary from the amounts derived from management’s estimates. |
| k) | Additional Derivative Instrument(s) Information |
The volume of derivative activity was minimal during the six-month period ended June 30, 2010.
| Hartford Value HLS Fund |
Notes to Financial Statements – (continued)
June 30, 2010 (Unaudited)
(000’s Omitted)
Realized Gain/Loss on Derivative Instruments for the six-month period ended June 30, 2010:
| Amount of Realized Gain or (Loss) on Derivatives Recognized in Income | ||||||||||||||||||||||||
| Forward | ||||||||||||||||||||||||
| Purchased | Currency | |||||||||||||||||||||||
| Risk Exposure Category | Written Options | Options | Futures | Contracts | Swaps | Total | ||||||||||||||||||
| Foreign exchange contracts | $ | — | $ | — | $ | — | $ | 278 | $ | — | $ | 278 | ||||||||||||
| Total | $ | — | $ | — | $ | — | $ | 278 | $ | — | $ | 278 | ||||||||||||
| l) | Indemnifications – Under the Company’s organizational documents, the Company shall indemnify its officers and directors to the full extent required or permitted under Maryland General Corporation Law and the federal securities laws. In addition, the Company, on behalf of the Fund, may enter into contracts that contain a variety of indemnifications. The Company’s maximum exposure under these arrangements is unknown. However, the Company has not had prior claims or losses pursuant to these contracts and expects the risk of loss to be remote. | |
| 3. | Federal Income Taxes: |
| a) | Federal Income Taxes – For federal income tax purposes, the Fund intends to continue to qualify as a RIC under Subchapter M of the Internal Revenue Code (“IRC”) by distributing substantially all of its taxable net investment income and net realized capital gains to its shareholders and otherwise complying with the requirements of RICs. The Fund has distributed substantially all of its income and capital gains in prior years and intends to distribute substantially all of its income and capital gains prior to the next fiscal year end. Accordingly, no provision for federal income or excise taxes has been made in the accompanying financial statements. Distributions from short-term capital gains are treated as ordinary income distributions for federal income tax purposes. | |
| b) | Net Investment Income (Loss), Net Realized Gains (Losses) – Net investment income (loss) and net realized gains (losses) may differ for financial statement and tax purposes primarily because of losses deferred due to wash sale adjustments, foreign currency gains and losses, adjustments related to PFICs, REITs, RICs, certain derivatives and partnerships. The character of distributions made during the year from net investment income or net realized gains may differ from their ultimate characterization for federal income tax purposes. Also, due to the timing of dividend distributions, the fiscal year in which amounts are distributed may differ from the year that the income or realized gains (losses) were recorded by the Fund. |
| c) | Distributions and Components of Distributable Earnings – The tax character of distributions paid by the Fund for the periods indicated is as follows (as adjusted for dividends payable): |
| For the Year Ended | For the Year Ended | |||||||
| December 31, 2009 | December 31, 2008 | |||||||
| Ordinary Income | $ | 5,020 | $ | 12,907 | ||||
| Long-Term Capital Gains* | — | 19,554 | ||||||
| * | The Fund designates these distributions as long-term capital dividends pursuant to IRC code Sec. 852(b)(3)(C). |
As of December 31, 2009, the Fund’s components of distributable earnings (deficit) on a tax basis were as follows:
| Amount | ||||
| Undistributed Ordinary Income | $ | 533 | ||
| Accumulated Capital and Other Losses* | (50,236 | ) | ||
Unrealized Appreciation† | 27,025 | |||
| Total Accumulated Deficit | $ | (22,678 | ) | |
| * | The Fund has capital loss carryforwards that are identified in the Capital Loss Carryforward note that follows. |
| † | The difference between book-basis and tax-basis unrealized appreciation (depreciation) may be attributable to the losses deferred due to wash sale adjustments, foreign currency gains and losses, adjustments related to PFICs, REITs, RICs, certain derivatives and partnerships. |
| d) | Reclassification of Capital Accounts – The Fund may record reclassifications in its capital accounts. These reclassifications have no impact on the total net assets of the Fund. The reclassifications are a result of permanent differences between GAAP and tax accounting for such items as net operating losses that reduce distribution requirements. Adjustments are made to reflect the impact these items have on current and future distributions to shareholders. Therefore, the source of the Fund’s distributions may be shown in the accompanying Statement of Changes in Net Assets as from net investment income, from net realized gains on investments or from capital depending on the type of book and tax differences that exist. For the year ended December 31, 2009, the Fund recorded reclassifications to increase (decrease) the accounts listed below: |
| Amount | ||||
| Accumulated Undistributed Net Investment Income | $ | (13 | ) | |
| Accumulated Net Realized Gain on Investments | 13 | |||
| e) | Capital Loss Carryforward – At December 31, 2009 (tax-year-end), the Fund had capital loss carryforwards for U.S. federal income tax purposes of approximately: |
| Year of Expiration | Amount | |||
| 2016 | $ | 4,650 | ||
| 2017 | 44,243 | |||
| Total | $ | 48,893 | ||
| As of December 31, 2009, the Fund elected to defer the following post October losses. | ||||
| Amount | ||||
| Long-Term Capital Gain | $ | 1,343 | ||
| f) | Accounting for Uncertainty in Income Taxes – Management has evaluated all open tax years and has determined there is no impact to the Fund’s financial statements related to uncertain tax positions. Generally, tax authorities can examine all tax returns filed for the last three years. | |
| 4. | Expenses: |
| a) | Investment Management Agreements – HL Investment Advisors, LLC (“HL Advisors”), an indirect wholly-owned subsidiary of The Hartford Financial Services Group, Inc. (“The Hartford”), serves as investment manager to the Fund pursuant to an Investment Management Agreement with the Company. As investment manager, HL Advisors has overall investment supervisory responsibility for the Fund. In addition, HL Advisors provides administrative personnel, services, equipment, facilities and office space for proper operation of the Fund. |
| Hartford Value HLS Fund |
Notes to Financial Statements – (continued)
June 30, 2010 (Unaudited)
(000’s Omitted)
HL Advisors has contracted with Wellington Management for the provision of day-to-day investment management services to the Fund in accordance with the Fund’s investment objective and policies. The Fund pays a fee to HL Advisors, a portion of which may be used to compensate Wellington Management.
| b) | Administrative Services Agreement – For the two-month period January 1, 2010 through February 28, 2010, under the Administrative Services Agreement between HLIC and the Company, on behalf of the Fund, HLIC provided administrative services to the Fund and received monthly compensation at the annual rate of 0.20% of the Fund’s average daily net assets. The Fund assumed and paid certain other expenses (including, but not limited to, accounting, custodian, state taxes and Directors’ fees). Effective March 1, 2010, the Investment Management Agreement was amended to include the administrative services for the Fund and the separate administrative services agreement was terminated. |
The schedule below reflects the rates of compensation paid to HL Advisors for investment management services and to HLIC for administrative services rendered from January 1, 2010 through February 28, 2010, and the rates of compensation paid to the HL Advisors for the combined services from March 1, 2010 through June 30, 2010; the rates are accrued daily and paid monthly.
| Average Daily Net Assets | Annual Fee | |||
| On first $250 million | 0.7750 | % | ||
| On next $250 million | 0.7250 | % | ||
| On next $500 million | 0.6750 | % | ||
| On next $4 billion | 0.6250 | % | ||
| On next $5 billion | 0.6225 | % | ||
| Over $10 billion | 0.6200 | % | ||
Effective March 19, 2010, HL Advisers agreed to reduce its contractual management fee by 0.05% at all breakpoints. Prior to March 19, 2010, the management fee breakpoints were as follows:
| Average Daily Net Assets | Annual Fee | |||
| On first $250 million | 0.8250 | % | ||
| On next $250 million | 0.7750 | % | ||
| On next $500 million | 0.7250 | % | ||
| On next $4 billion | 0.6750 | % | ||
| On next $5 billion | 0.6725 | % | ||
| Over $10 billion | 0.6700 | % | ||
| c) | Accounting Services Agreement – Pursuant to the Fund Accounting Agreement between HLIC and the Company, on behalf of the Fund, HLIC provides accounting services to the Fund and receives monthly compensation on the Fund’s average net assets. The Fund’s accounting services fees are accrued daily and paid monthly. |
| Average Daily Net Assets | Annual Fee | |||
| All Assets | 0.010 | % | ||
| d) | Operating Expenses – Allocable expenses incurred by the Company are allocated to each Fund and allocated to classes within the Fund in proportion to the average daily net assets of the Fund and each class, except where allocation of certain expenses is more fairly made directly to the Fund or to specific classes within a Fund. | |
e) | Fees Paid Indirectly – The Company, on behalf of the Fund has entered into agreements with State Street Global Advisers, LLC and Russell Implementation Securities, Inc. to partially recapture non-discounted trade commissions. Such rebates are used to pay a portion of the Fund’s expenses. In addition, the Fund’s custodian bank has also agreed to |
reduce its fees when the Fund maintains cash on deposit in a non-interest-bearing custody account. For the six-month period ended June 30, 2010, these amounts are included in the Statement of Operations.
The ratio of expenses to average net assets in the accompanying financial highlights excludes the reduction in expenses related to fees paid indirectly. Had the fees paid indirectly been included, the annualized expense ratio for the periods listed below would have been as follows:
| Annualized | ||||||||||||||||||||||||
| Six-Month | Year Ended | Year Ended | Year Ended | Year Ended | Year Ended | |||||||||||||||||||
| Period Ended | December 31, | December 31, | December 31, | December 31, | December 31, | |||||||||||||||||||
June 30, 2010 | 2009 | 2008 | 2007 | 2006 | 2005 | |||||||||||||||||||
| Class IA | 0.76 | % | 0.86 | % | 0.84 | % | 0.84 | % | 0.84 | % | 0.85 | % | ||||||||||||
| Class IB | 1.01 | 1.11 | 1.09 | 1.09 | 1.09 | 1.10 | ||||||||||||||||||
| f) | Distribution Plan for Class IB shares – The Company, on behalf of the Fund, has adopted a Distribution Plan pursuant to Rule 12b-1 under the 1940 Act for the Class IB shares. Pursuant to the Distribution Plan, the Fund is authorized to compensate the Distributor, Hartford Securities Distribution Company, Inc. (a wholly owned, ultimate subsidiary of The Hartford), from assets attributable to the Class IB shares for services rendered and expenses borne in connection with activities primarily intended to result in the sale of the Class IB shares, subject to the Fund Board’s review and approval. | |
| The Distribution Plan provides that the Fund may pay annually up to 0.25% of the average daily net assets of the Fund attributable to its Class IB shares for activities primarily intended to result in the sale of Class IB shares. The Board has the authority to suspend or reduce these payments at any point in time. Under the terms of the Distribution Plan and the principal underwriting agreement, the Fund is authorized to make payments monthly to the Distributor which may be used to pay or compensate entities providing distribution and shareholder servicing with respect to the Class IB shares for such entities’ fees or expenses incurred or paid in that regard. These fees are accrued daily and paid monthly. | |
| g) | Other Related Party Transactions – Certain officers of the Fund are directors and/or officers of HL Advisors, and/or The Hartford or its subsidiaries. For the six-month period ended June 30, 2010, a portion of the Fund’s chief compliance officer’s salary was paid by all the investment companies in the Hartford fund complex. The portion allocated to the Fund was in the amount of $1. Hartford Investor Services Company, LLC ("HISC"), a wholly owned subsidiary of The Hartford, provides transfer agent services to the Fund. The amount HISC was compensated for providing such services can be found on the Statement of Operations. These fees are accrued daily and paid monthly. |
| h) | Payment from Affiliate – In July of 2007, The Hartford entered into a settlement with the Attorneys General of the states of New York, Connecticut and Illinois relating to market timing and the company's individual variable annuity contracts in which certain payments would be made directly to the variable annuity contract holders. The distribution plan provides that unclaimed money from the settlement would be distributed to certain HLS Funds that are investment options through a Hartford individual variable annuity contract. The unclaimed money was distributed to the Fund on September 18, 2009, as follows: |
| Amount | ||||
| Reimbursement | $ | 13 | ||
On November 8, 2006, the SEC issued an order setting forth the terms of a settlement reached with three subsidiaries of The Hartford that resolves the SEC’s Division of Enforcement’s investigation of aspects of The Hartford’s variable annuity and mutual fund operations related to directed brokerage and revenue sharing. The Hartford settled this matter without admitting or denying the findings of the SEC.
| Hartford Value HLS Fund |
Notes to Financial Statements – (continued)
June 30, 2010 (Unaudited)
(000’s Omitted)
The Fund is available for purchase by the separate accounts of different variable universal life policies, variable annuity products, and funding agreements and it is offered directly to certain qualified retirement plans (collectively “Products”). Although existing Products contain transfer restrictions, some Products, particularly older variable annuity products, do not contain restrictions on the frequency of transfers. In addition, as the result of the settlement of litigation against Hartford Life, Inc. (“Hartford Life”) (the issuers of such variable annuity products), the Fund’s ability to restrict transfers by certain owners of older variable annuity products was limited. During 2006, these annuity owners surrendered the older variable annuity contracts that were the subject of prior litigation. In February 2005, Hartford Life agreed with the Board of Directors of the Fund to indemnify the Fund for any material harm caused to the Fund from frequent trading by these contracts owners.
The total return in the accompanying financial highlights includes payment from affiliates. Had the payment from affiliates been excluded, the total return for the periods listed below would have been as follows:
| For the Year Ended December 31, 2009 | ||||||||
| Class IA | Class IB | |||||||
| Impact from Payment from Affiliate for Attorneys General Settlement | — | % | — | % | ||||
| Total Return Excluding Payments from Affiliate | 24.37 | 24.05 | ||||||
| For the Year Ended December 31, 2006 | ||||||||
| Class IA | Class IB | |||||||
| Impact from Payment from Affiliate for SEC Settlement | 0.01 | % | 0.01 | % | ||||
| Total Return Excluding Payments from Affiliate | 21.81 | 21.51 | ||||||
| 5. | Investment Transactions: |
For the six-month period ended June 30, 2010, the cost of purchases and proceeds from sales of investment securities (excluding short-term investments) were as follows:
| Amount | ||||
| Cost of Purchases Excluding U.S. Government Obligations | $ | 931,381 | ||
| Sales Proceeds Excluding U.S. Government Obligations | 399,961 | |||
| 6. | Line of Credit: |
| The Fund is one of several Hartford funds that participate in a $500 million committed revolving line of credit facility. The facility is to be used for temporary or emergency purposes. Under the arrangement, a fund is required to own securities having a market value in excess of 300% of the total bank borrowings. The interest rate on borrowings varies depending on the nature of the loan. The facility also requires a fee to be paid based on the amount of the commitment. This fee is allocated to all the funds participating in the line of credit based on the average net assets of the funds. During the six-month period ended June 30, 2010, the Fund did not have any borrowings under this facility. |
| 7. | Fund Merger: |
Reorganization of Hartford Equity Income HLS Fund and Hartford Value Opportunities HLS Fund into Hartford Value HLS Fund: At a meeting held on August 5, 2009, the Board of Directors of the Company approved a Form of Agreement and Plan of Reorganization (“Reorganization Agreement”) that provided for the reorganization of a series of the Company, Hartford Equity Income HLS Fund (“Target Fund #1”) into another series of the Company, Hartford Value HLS Fund (“Acquiring Fund”) (the “Reorganization”). The reorganization did not require shareholder approval by the shareholders of Hartford Equity Income HLS Fund or Hartford Value HLS Fund. At a separate meeting held on August 5, 2009, the Board of Directors of Hartford HLS Series Fund II, Inc. approved a Form of Agreement and Reorganization Agreement that provided for the reorganization of a series of Hartford HLS Series Fund II, Inc., Hartford Value Opportunities HLS Fund
(Target Fund #2) into a series of the Company, Hartford Value HLS Fund (“Acquiring Fund”) (the “Reorganization”). The reorganization of Hartford Value Opportunities HLS Fund was subject to a shareholder vote which occurred at a special meeting of Hartford Value Opportunities HLS Fund shareholders on January 26, 2010 and the reorganization of Hartford Value Opportunities HLS Fund into Hartford Value HLS Fund was approved.
Pursuant to the Reorganization Agreements, on March 19, 2010, each holder of Class IA and Class IB shares of Hartford Equity Income HLS Fund and Hartford Value Opportunities HLS Fund became the owner of full and fractional shares of the corresponding class in Hartford Value HLS Fund having an equal aggregate value.
This merger was accomplished by tax free exchange as detailed below:
| Acquiring | Net assets of | |||||||||||||||||||||||||||
| Fund shares | Acquiring | Net assets of | ||||||||||||||||||||||||||
| Net assets of | Net assets of | issued to the | Fund | Acquiring | ||||||||||||||||||||||||
| Target Fund | Target Fund | Target Fund | Target Fund | Target | immediately | Fund | ||||||||||||||||||||||
| #1 on Merger | #2 on Merger | #1 shares | #2 shares | Funds' | before | immediately | ||||||||||||||||||||||
| Date | Date | exchanged | exchanged | shareholders | merger | after merger | ||||||||||||||||||||||
| Class IA | $ | 261,089 | $ | 270,234 | 24,063 | $ | 20,105 | 52,973 | $ | 250,350 | $ | 781,673 | ||||||||||||||||
| Class IB | 37,783 | 59,982 | 3,480 | 4,480 | 9,763 | 63,311 | 161,076 | |||||||||||||||||||||
| Total | $ | 298,872 | $ | 330,216 | 27,543 | $ | 24,585 | 62,736 | $ | 313,661 | $ | 942,749 | ||||||||||||||||
| Unrealized Appreciation | Accumulated Net | |||||||||||
| Fund | (Depreciation) | Realized Gains (Losses) | Capital Stock | |||||||||
| Target Fund #1 | $ | 21,521 | $ | (49,232 | ) | $ | 326,583 | |||||
| Target Fund #2 | $ | 33,835 | $ | (154,730 | ) | $ | 451,111 | |||||
Assuming the acquisition had been completed on January 1, 2010, the beginning of the annual reporting period of the Funds, Hartford Value HLS Fund’s pro forma results of operations for the semi-annual period ended June 30, 2010, are as follows:
| Net Decrease in Net | ||||||||||||
| Assets Resulting from | ||||||||||||
| Fund | Net Investment��Income | Net Gain on Investments | Operations | |||||||||
| Acquiring Fund | $ | 5,840 | $ | 41,420 | $ | (63,263 | ) | |||||
Because the combined investment portfolios have been managed as a single integrated portfolio since the acquisition was completed, it is not practical to separate the amounts of revenue and earnings of Hartford Equity Income HLS Fund and Hartford Value Opportunities HLS Fund that have been included in Hartford Value HLS Fund’s statement of operations since March 19, 2010.
| 8. | Industry Classifications: |
Other than the industry classifications “Other Investment Pools and Funds” and “Exchange Traded Funds”, equity industry classifications used in this report are the Global Industry Classification Standard, which was developed by and is the exclusive property and service mark of MSCI, Inc. and Standard & Poor’s.
| Hartford Value HLS Fund |
| - Selected Per-Share Date (A) - - |
| Net Asset | Net Realized | Net Increase | ||||||||||||||||||||||||||||||||||||||||||
| Value at | Payments | and Unrealized | Total from | Dividends from | Distributions | (Decrease) in | Net Asset | |||||||||||||||||||||||||||||||||||||
| Beginning of | Net Investment | from (to) | Gain (Loss) on | Investment | Net Investment | from Realized | Distributions | Total | Net Asset | Value at End | ||||||||||||||||||||||||||||||||||
| Class | Period | Income (Loss) | Affiliate | Investments | Operations | Income | Capital Gains | from Capital | Distributions | Value | of Period | |||||||||||||||||||||||||||||||||
For the Six-Month Period Ended June 30, 2010 (Unaudited) | ||||||||||||||||||||||||||||||||||||||||||||
IA | $ | 9.50 | $ | 0.03 | $ | – | $ | (0.69 | ) | $ | (0.66 | ) | $ | – | $ | – | $ | – | $ | – | $ | (0.66 | ) | $ | 8.84 | |||||||||||||||||||
IB | 9.50 | 0.02 | – | (0.70 | ) | (0.68 | ) | – | – | – | – | (0.68 | ) | 8.82 | ||||||||||||||||||||||||||||||
For the Year Ended December 31, 2009 | ||||||||||||||||||||||||||||||||||||||||||||
IA | 7.77 | 0.14 | – | 1.75 | 1.89 | (0.16 | ) | – | – | (0.16 | ) | 1.73 | 9.50 | |||||||||||||||||||||||||||||||
IB | 7.77 | 0.13 | – | 1.74 | 1.87 | (0.14 | ) | – | – | (0.14 | ) | 1.73 | 9.50 | |||||||||||||||||||||||||||||||
For the Year Ended December 31, 2008 | ||||||||||||||||||||||||||||||||||||||||||||
IA | 12.83 | 0.20 | – | (4.36 | ) | (4.16 | ) | (0.20 | ) | (0.70 | ) | – | (0.90 | ) | (5.06 | ) | 7.77 | |||||||||||||||||||||||||||
IB | 12.81 | 0.20 | – | (4.37 | ) | (4.17 | ) | (0.17 | ) | (0.70 | ) | – | (0.87 | ) | (5.04 | ) | 7.77 | |||||||||||||||||||||||||||
For the Year Ended December 31, 2007 | ||||||||||||||||||||||||||||||||||||||||||||
IA | 13.06 | 0.17 | – | 1.02 | 1.19 | (0.17 | ) | (1.25 | ) | – | (1.42 | ) | (0.23 | ) | 12.83 | |||||||||||||||||||||||||||||
IB | 13.03 | 0.16 | – | 1.00 | 1.16 | (0.13 | ) | (1.25 | ) | – | (1.38 | ) | (0.22 | ) | 12.81 | |||||||||||||||||||||||||||||
For the Year Ended December 31, 2006 | ||||||||||||||||||||||||||||||||||||||||||||
IA | 11.18 | 0.15 | – | 2.23 | 2.38 | (0.15 | ) | (0.35 | ) | – | (0.50 | ) | 1.88 | 13.06 | ||||||||||||||||||||||||||||||
IB | 11.14 | 0.13 | – | 2.21 | 2.34 | (0.10 | ) | (0.35 | ) | – | (0.45 | ) | 1.89 | 13.03 | ||||||||||||||||||||||||||||||
For the Year Ended December 31, 2005 | ||||||||||||||||||||||||||||||||||||||||||||
IA | 10.73 | 0.15 | – | 0.71 | 0.86 | (0.27 | ) | (0.14 | ) | – | (0.41 | ) | 0.45 | 11.18 | ||||||||||||||||||||||||||||||
IB | 10.67 | 0.10 | – | 0.73 | 0.83 | (0.22 | ) | (0.14 | ) | – | (0.36 | ) | 0.47 | 11.14 | ||||||||||||||||||||||||||||||
| (A) | Information presented relates to a share outstanding throughout the indicated period. |
| (B) | The figures do not include sales charges or other fees which may be applied at the variable life insurance, variable annuity or qualified retirement plan product level. Any such additional sales charges or other fees would lower the Fund's performance. |
| (C) | Ratios do not reflect reductions for fees paid indirectly. Please see Fees Paid Indirectly in the Notes to Financial Statements. |
| (D) | Portfolio turnover rate is calculated on the basis of the Fund as a whole without distinguishing between the classes of shares issued. |
| (E) | Not annualized. |
| (F) | Annualized. |
| (G) | During the six-moth period ended June 30, 2010, the Fund incurred $269.8 million in sales associated with the transition of assets from Hartford Equity Income HLS Fund and Hartford Value Opportunities HLS Fund, which merged into the Fund on March 19, 2010. These sales were excluded from the portfolio turnover calculation. |
| (H) | Total return without the inclusion of the Payment from (to) Affiliate can be found in Expenses in the accompanying Notes to Financial Statements. |
| - Ratios and Supplemental Data - | ||||||||||||||||||||||
| Net Assets at | Ratio of Expenses to Average Net | Ratio of Expenses to Average Net | Ratio of Net Investment Income to | Portfolio Turnover | ||||||||||||||||||
| Total Return(B) | End of Period | Assets Before Waivers(C) | Assets After Waivers(C) | Average Net Assets | Rate(D) | |||||||||||||||||
| (7.03 | )%(E) | $ | 655,796 | 0.76 | %(F) | 0.76 | %(F) | 1.29 | %(F) | 46 | %(G) | |||||||||||
| (7.15 | )(E) | 142,698 | 1.01 | (F) | 1.01 | (F) | 1.04 | (F) | – | |||||||||||||
| 24.37 | (H) | 244,909 | 0.87 | 0.87 | 1.65 | 50 | ||||||||||||||||
| 24.06 | (H) | 63,003 | 1.12 | 1.12 | 1.40 | – | ||||||||||||||||
| (34.03 | ) | 217,460 | 0.84 | 0.84 | 1.87 | 57 | ||||||||||||||||
| (34.20 | ) | 63,338 | 1.09 | 1.09 | 1.62 | – | ||||||||||||||||
| 8.98 | 327,689 | 0.84 | 0.84 | 1.42 | 35 | |||||||||||||||||
| 8.70 | 131,651 | 1.09 | 1.09 | 1.14 | – | |||||||||||||||||
| 21.82 | (H) | 277,982 | 0.85 | 0.85 | 1.37 | 40 | ||||||||||||||||
| 21.52 | (H) | 148,135 | 1.10 | 1.10 | 1.10 | – | ||||||||||||||||
| 8.13 | 193,655 | 0.86 | 0.86 | 1.42 | 30 | |||||||||||||||||
| 7.86 | 129,771 | 1.11 | 1.11 | 1.17 | – | |||||||||||||||||
| Hartford Value HLS Fund |
The Board of Directors appoints officers who are responsible for the day-to-day operations of the Fund and who execute policies formulated by the Directors. Each director serves until his or her death, resignation, or retirement or until the next annual meeting of shareholders is held or until his or her successor is elected and qualifies.
Directors and officers who are employed by or who have a financial interest in The Hartford are considered “interested” persons of the Fund pursuant to the Investment Company Act of 1940, as amended. Each officer and two of the Company’s directors, as noted in the chart below, are “interested” persons of the Fund. Each director serves as a director for The Hartford Mutual Funds, Inc., The Hartford Mutual Funds II, Inc., The Hartford Income Shares Fund, Inc., Hartford Series Fund, Inc., and Hartford HLS Series Fund II, Inc., which, as of June 30, 2010, collectively consist of 88 funds. Correspondence may be sent to directors and officers c/o Hartford Mutual Funds, P.O. Box 2999, Hartford, Connecticut 06104-2999, except that correspondence to Ms. Fagely may be sent to 500 Bielenberg Drive, Woodbury, Minnesota 55125.
The table below sets forth, for each director and officer, his or her name, year of birth, current position with the Company and date first elected or appointed to Hartford Series Fund, Inc. (“HSF”), and Hartford HLS Series Fund II, Inc. (“HSF2”), principal occupation, and, for directors, other directorships held. The Fund’s statement of additional information contains further information on the directors and is available free of charge by calling 1-800-862-6668 or writing to Hartford HLS Funds, c/o Individual Annuity Services, P.O. Box 5085, Hartford, CT 06102-5085.
Information on the aggregate remuneration paid to the directors of the Company can be found in the Statement of Operations herein. The Fund pays to The Hartford a portion of the chief compliance officer’s compensation, but does not pay salaries or compensation to any of their other officers or directors who are employed by The Hartford.
Non-Interested Directors
Lynn S. Birdsong (1946) Director since 2003, Co-Chairman of the Investment Committee
Mr. Birdsong is a private investor. Since 2003, Mr. Birdsong has been an independent director of The Japan Fund and has served as a Director of the Sovereign High Yield Fund since April 2010. From 2003 to March 2005, Mr. Birdsong was an independent director of the Atlantic Whitehall Funds. From 1979 to 2002, Mr. Birdsong was a managing director of Zurich Scudder Investments, an investment management firm. During his employment with Scudder, Mr. Birdsong was an interested director of The Japan Fund. Since 1981, Mr. Birdsong has been a partner in Birdsong Company, an advertising specialty firm.
Robert M. Gavin, Jr. (1940) Director since 2002 (HSF) and 1986 (HSF2), Chairman of the Board since 2004
Dr. Gavin is an educational consultant. Prior to September 1, 2001, he was President of Cranbrook Education Community and prior to July 1996, he was President of Macalester College, St. Paul, Minnesota.
Duane E. Hill (1945) Director since 2001 (HSF) and 2002 (HSF2), Chairman of the Nominating Committee
Mr. Hill is Partner of TSG Ventures L.P., a private equity investment company. Mr. Hill is a former partner of TSG Capital Group, a private equity investment firm that served as sponsor and lead investor in leveraged buyouts of middle market companies.
Sandra S. Jaffee (1941) Director since 2005
Ms. Jaffee served as Chairman (2008 to 2009) and Chief Executive Officer of Fortent (formerly Searchspace Group), a leading provider of compliance/regulatory technology to financial institutions from August 2005 to August 2009. From August 2004 to August 2005, Ms. Jaffee served as an Entrepreneur in Residence with Warburg Pincus, a private equity firm. From September 1995 to July 2004, Ms. Jaffee served as Executive Vice President at Citigroup, where she was President and Chief Executive Officer of Citibank’s Global Securities Services (1995 to 2003).
William P. Johnston (1944) Director since 2005, Chairman of the Compliance Committee
In June 2006, Mr. Johnston was appointed as Senior Advisor to The Carlyle Group, a global private equity investment firm. In July 2006, Mr. Johnston was elected to the Board of Directors of MultiPlan, Inc. In August 2007, Mr. Johnston was elected to the Board of Directors of LifeCare Holdings, Inc. In February 2008, Mr. Johnston was elected to the Board of Directors of HCR-ManorCare, Inc. In May 2006, Mr. Johnston was elected to the Supervisory Board of Fresenius Medical Care AG & Co. KGaA, after its acquisition of Renal Care Group, Inc. in March 2006. Mr. Johnston joined Renal Care Group in November 2002 as a member of the Board of Directors and served as Chairman of the Board from March 2003 through March 2006. From September 1987 to December 2002, Mr. Johnston was with Equitable Securities Corporation (and its successors, SunTrust Equitable Securities and SunTrust Robinson Humphrey) serving in various investment banking and managerial positions, including Managing Director and Head of Investment Banking, Chief Executive Officer and Vice Chairman.
Phillip O. Peterson (1944) Director since 2002 (HSF) and 2000 (HSF2), Chairman of the Audit Committee
Mr. Peterson is a mutual fund industry consultant. He was a partner of KPMG LLP (an accounting firm) until July 1999. Mr. Peterson joined William Blair Funds in February 2007 as a member of the Board of Trustees. From January 2004 to April 2005, Mr. Peterson served as Independent President of the Strong Mutual Funds.
Lemma W. Senbet (1946) Director since 2005
Dr. Senbet is the William E. Mayer Chair Professor of Finance and Director, Center for Financial Policy, at the University of Maryland, Robert H. Smith School of Business. He was chair of the Finance Department during 1998 to 2006. Previously he was a chaired professor of finance at the University of Wisconsin-Madison. Also, he was director of the Fortis Funds from March 2000 to July 2002. Dr. Senbet served the finance profession in various capacities, including as director of the American Finance Association and President of the Western Finance Association. In 2006, Dr. Senbet was inducted Fellow of Financial Management Association International for his career-long distinguished scholarship and professional service.
Interested Directors and Officers
Lowndes A. Smith (1939) Director since 1996 (HSF) and 2002 (HSF2), Co-Chairman of the Investment Committee
Mr. Smith served as Vice Chairman of The Hartford from February 1997 to January 2002, as President and Chief Executive Officer of Hartford Life, Inc. from February 1997 to January 2002, and as President and Chief Operating Officer of The Hartford Life Insurance Companies from January 1989 to January 2002. Mr. Smith serves as a Director of White Mountains Insurance Group, Ltd., One Beacon Insurance, Symetra Financial and as a Managing Director of Whittington Gray Associates.
John C. Walters 1, 2 (1962) Director since 2008
Mr. Walters currently serves as President, Chief Executive Officer and Director for Hartford Life, Inc. (“HL, Inc.”). Mr. Walters also serves as President, Chairman of the Board, Chief Executive Officer and Director for Hartford Life Insurance Company (“Hartford Life”), and as Executive Vice President of The Hartford. In addition, Mr. Walters is a Manager of HL Investment Advisors, LLC (“HL Advisors”). Mr. Walters previously served as President of the U.S. Wealth Management Division of HL, Inc. (2006-2007) and as Co-Chief Operating Officer of Hartford Life (2007-2008).
| 1 | Mr. Walters previously served as President and Chief Executive Officer (2007 to 2009). |
| 2 | Effective July 31, 2010, Mr. Walters retired from The Hartford. Mr. Walters resigned his position as a Director of the Fund effective July 30, 2010. |
Other Officers
Robert M. Arena, Jr. (1968) President and Chief Executive Officer since 2009 (served as Vice President of the Fund (2006-2009)) Mr. Arena serves as Executive Vice President of Hartford Life. Additionally, Mr. Arena is Senior Vice President and Director of Hartford Administrative Services Company, (“HASCO”), President, Chief Executive Officer and Manager of Hartford Investment Financial Services, LLC (“HIFSCO”) and President, Chief Executive Officer and Manager of HL Advisors. Mr. Arena joined The Hartford in 2004.
Tamara L. Fagely (1958) Vice President, Treasurer and Controller since 2002 (HSF) 1993 (HSF2)
Ms. Fagely has been a Vice President of HASCO since 1998 and Chief Financial Officer since 2006. Currently Ms. Fagely is a Vice President of Hartford Life. She served as Assistant Vice President of Hartford Life from December 2001 through March 2005. In addition, Ms. Fagely is Controller and Chief Financial Officer of HIFSCO.
Brian Ferrell (1962) AML Compliance Officer since 2008
Mr. Ferrell has served as Assistant Vice President and AML Compliance Officer for The Hartford since 2006, and as AML Compliance Officer for HASCO and Hartford Investor Services Company, LLC (“HISC”) since 2008. Prior to joining The Hartford in 2006, Mr. Ferrell held various positions at the U.S. Department of the Treasury (the “Treasury”) from 2001 to 2006, where he served as Chief Counsel for the Treasury’s Financial Crimes Enforcement Network from 2005-2006.
Dr. Robert J. Froehlich (1953) Senior Managing Director since 2009
Dr. Froehlich joined The Hartford as Senior Managing Director in September 2009. Prior to joining The Hartford, Dr. Froehlich served as Vice Chairman of Deutsche Asset Management from 1997-2009.
| Hartford Value HLS Fund |
Directors and Officers (Unaudited) – (continued)
Thomas D. Jones, III (1965) Vice President and Chief Compliance Officer since 2006
Mr. Jones serves as Chief Compliance Officer for the Hartford Mutual Funds and Vice President and Director of Securities Compliance for The Hartford. Mr. Jones joined The Hartford in 2006 from SEI Investments, where he served as Chief Compliance Officer for its mutual funds and investment advisers. Prior to joining SEI, Mr. Jones was First Vice President and Compliance Director for Merrill Lynch Investment Managers (Americas) (“MLIM”), where he worked from 1992-2004.
Edward P. Macdonald (1967) Vice President, Secretary and Chief Legal Officer since 2005
Mr. Macdonald serves as Assistant Vice President of Hartford Life and Chief Legal Officer and Vice President of HIFSCO. He also serves as Vice President and Secretary of HASCO, and Chief Legal Officer, Secretary and Vice President of HL Advisors. Mr. Macdonald joined The Hartford in 2005.
Vernon J. Meyer (1964) Vice President since 2006
Mr. Meyer serves as Senior Vice President of Hartford Life. He also serves as Senior Vice President of HIFSCO and HL Advisors. Mr. Meyer joined The Hartford in 2004.
D. Keith Sloane (1960) Vice President since 2009
Mr. Sloane is a Senior Vice President of Hartford Life. Additionally, Mr. Sloane currently serves as Senior Vice President of HIFSCO, HL Advisors, and HASCO. Prior to joining The Hartford in 2007, Mr. Sloane was Director of product marketing and led the mutual fund business for Wachovia Securities (“Wachovia”) in their investment products group. Mr. Sloane joined Wachovia in 1995.
Jane Wolak (1961) Vice President since 2009
Ms. Wolak currently serves as Vice President of Hartford Life. Ms. Wolak joined Hartford Life as Vice President, Retail Product Services in May 2007. She is also Vice President of HASCO. Previously, Ms. Wolak was with Sun Life Financial where she held the position of Vice President, Service Center Operations from 2001-2007.
A description of the policies and procedures that the Fund uses to determine how to vote proxies relating to portfolio securities and a record of how the Fund voted any proxies for the twelve-month period ended June 30, 2010 is available (1) without charge, upon request, by calling 800-862-6668 and (2) on the Securities and Exchange Commission’s website at http://www.sec.gov.
The Fund files a complete schedule of portfolio holdings with the Commission for the first and third quarters of each fiscal year on Form N-Q. The Fund’s Forms are available (1) without charge, upon request, by calling 800-862-6668 and (2) on the Securities and Exchange Commission’s website at http://www.sec.gov. The Form N-Q may be reviewed and copied at the Commission’s Public Reference Room in Washington, DC. Information on the operation of the Public Reference Room may be obtained by calling 1-800-SEC-0330.
| Hartford Value HLS Fund |
The following proposals were addressed and approved at a Special Meeting of Shareholders held on February 12, 2010.
Proposal to approve amendments to the Investment Management Agreement between the Fund and HL Investment Advisors, the purpose of which were to combine the administrative services for the Fund with the management services for the Fund under a single agreement.
| Fund | For | Against | Abstain | ||||||
| Hartford Value HLS Fund | 30,814,371.274 | 645,775.216 | 909,617.349 |
Proposal to elect Lemma Senbet and John Walters, each currently a Director, as Directors of Hartford Series Fund Inc.
Lemma W. Senbet
| Funds | For | Withheld | ||||
| Hartford Series Fund, Inc. | 5,079,578,022.902 | 241,839,974.106 |
John C. Walters
| Funds | For | Withheld | ||||
| Hartford Series Fund, Inc. | 5,081,138,302.186 | 240,279,694.822 |
| Hartford Value HLS Fund |
Your Fund's Expenses
As a shareholder of the Fund, you incur two types of costs: (1) transaction costs, including sales charges (loads) on purchase payments and contingent deferred sales charges (CDSC) (2) ongoing costs including management fees; distribution fees; and other fund expenses. This example is intended to help you understand your ongoing costs (in dollars) of investing in the Fund and to compare these costs with the ongoing costs of investing in other mutual funds. The example is based on an investment of $1,000 invested at the beginning of the period and held for the period of December 31, 2009 through June 30, 2010.
Actual Expenses
The first set of columns of the table below provides information about actual account values and actual expenses. You may use the information in this column, together with the amount you invested, to estimate the expenses that you paid over the period. Simply divide your account value by $1,000 (for example, an $8,600 account value divided by $1,000 = 8.6), then multiply the result by the number in the line under the heading entitled "Expenses Paid During Period" to estimate the expenses you paid on your account during this period.
Hypothetical Example for Comparison Purposes
The second set of columns of the table below provides information about hypothetical account values and hypothetical expenses based on the Fund's actual expense ratio and an assumed rate of return of 5% per year before expenses, which is not the Fund's actual return. The hypothetical account values and expenses may not be used to estimate the actual ending account balance or expenses you paid for the period. You may use this information to compare the ongoing costs of investing in the Fund and other funds. To do so, compare this 5% hypothetical example with the 5% hypothetical examples that appear in the shareholder reports of the other funds.
Please note that the expenses shown in the table are meant to highlight your ongoing costs only and do not reflect any transactional costs, such as sales charges (loads) and CDSC. Therefore, the second set of columns of the table is useful in comparing ongoing costs only, and will not help you determine the relative total costs of owning different funds. In addition, if these transactional costs were included, your costs would be higher. Expenses are equal to the Fund's annualized expense ratios multiplied by average account value over the period, multiplied by 181/365 (to reflect the one-half year period).
| Actual return | Hypothetical (5% return before expenses) | |||||||||||||||||||||||||||||||||||
| Expenses paid | Expenses paid | Days in | ||||||||||||||||||||||||||||||||||
| during the period | during the period | the | Days | |||||||||||||||||||||||||||||||||
| Beginning | Ending | December 31, 2009 | Beginning | Ending | December 31, 2009 | Annualized | current | in the | ||||||||||||||||||||||||||||
| Account Value | Account Value | through | Account Value | Account Value | through | expense | 1/2 | full | ||||||||||||||||||||||||||||
December 31, 2009 | June 30, 2010 | June 30, 2010 | December 31, 2009 | June 30, 2010 | June 30, 2010 | ratio | year | year | ||||||||||||||||||||||||||||
| Class IA | $ | 1,000.00 | $ | 929.65 | $ | 3.64 | $ | 1,000.00 | $ | 1,021.03 | $ | 3.81 | 0.76 | % | 181 | 365 | ||||||||||||||||||||
Class IB | $ | 1,000.00 | $ | 928.50 | $ | 4.83 | $ | 1,001.00 | $ | 1,019.79 | $ | 5.06 | 1.01 | % | 181 | 365 | ||||||||||||||||||||
| Hartford Value HLS Fund |
The Board approved the annual continuation of the Investment Management Agreement (the “Agreement”) between Hartford Series Fund, Inc. (“HSF”) and HL Investment Advisors, LLC (“HL Advisors”) with respect to Fund at its meeting on August 4-5, 2009. The Board’s considerations in approving the renewal of the Agreement are disclosed in the December 31, 2009 Annual Report for HSF.
At the November 4-5, 2009 meeting, the Board considered and approved amendments to the Agreement to include administrative services, which had been provided pursuant to a separate agreement, and investment management services under one agreement. The Board, including all of the Independent Directors, approved the amendments to the Agreement with respect to the Fund.
In approving the amendments, in addition to the information presented at the August meeting in connection with the annual review of the Agreement and the additional information provided throughout the year, the Board also considered the fact that the amendments did not result in an overall increase in fees to shareholders. The Board took note of the fact that the management of HL Advisors believes that the proposal to combine the administrative services with the investment management services under a single agreement will produce streamlined fee disclosure, resulting in greater transparency and clarity in the Fund’s prospectuses and financial reports. The Board further noted management's belief that the change would result in consistency across all of the Hartford Funds in the complex in that the funds of HSF are the only funds in the complex (other than the R share classes of the Hartford retail funds) that are subject to a separate administrative services fee. Finally, the Board noted management's view that the proposed changes to the Agreement should also serve to simplify the Board's annual consideration of the investment management arrangements for the Fund in that the investment management and administrative fees would be presented as a single fee for fee comparison purposes, which should facilitate the Board's analysis.
The shareholders of the Fund approved the amendments at a Special Meeting of Shareholders held on February 12, 2010. The amendments were effective as of March 1, 2010.
29
The Hartford
P.O. Box 5085
Hartford, CT 06102–5085
Hartford Series Fund, Inc. is underwritten and distributed by Hartford Securities Distribution Company, Inc.
“The Hartford” is The Hartford Financial Services Group, Inc. and its subsidiaries.
Hartford Series Fund, Inc. inception dates range from 1977 to date. Hartford Series Fund, Inc. is not a subsidiary of The Hartford but is underwritten, distributed by and advised by subsidiaries of The Hartford. Investments in Hartford Series Fund, Inc. are not guaranteed by The Hartford or any other entity.
This material is authorized for distribution only when preceded or accompanied by a current prospectus. The prospectus contains detailed information about the Funds, including investment objectives, risks and charges and expenses. Please read it carefully before you invest or send money.
HLSSAR-V10 Printed in U.S.A ©2010 The Hartford, Hartford, CT 06115 |
Item 2. Code of Ethics.
Not applicable to this semi-annual filing.
Item 3. Audit Committee Financial Expert.
Not applicable to this semi-annual filing.
Item 4. Principal Accountant Fees and Services.
Not applicable to this semi-annual filing.
Item 5. Audit Committee of Listed Registrants.
Not applicable to this semi-annual filing.
Item 6. Schedule of Investments
The Schedule of Investments is included as part of the annual report filed under Item 1 of this form.
Item 7. Disclosure of Proxy Voting Policies and Procedures for Closed-End Management Investment Companies.
Not applicable.
Item 8. Portfolio Managers of Closed-End Management Investment Companies.
Not applicable.
Item 9. Purchases of Equity Securities by Closed-End Management Investment Company and Affiliated Purchasers.
Not applicable.
Item 10. Submission of Matters to a Vote of Security Holders
There have been no material changes to the procedures by which shareholders may recommend nominees to the registrant’s board of directors since registrant last provided disclosure in response to this requirement.
Item 11. Controls and Procedures.
| (a) | Based on an evaluation of the Registrant's Disclosure Controls and Procedures as of a date within 90 days of the filing date of this report, the Disclosure Controls and Procedures are effectively designed to ensure that information required to be disclosed by the Registrant is recorded, processed, summarized and reported by the date of this report, including ensuring that information required to be disclosed in the report is accumulated and communicated to the Registrant's management, including the Registrant's officers, as appropriate, to allow timely decisions regarding required disclosure. |
| (b) | There was no change in the Registrant's internal control over financial reporting that occurred during the Registrant’s last fiscal half year that has materially affected, or is reasonably likely to materially affect, the registrant’s internal control over financial reporting. |
Item 12. Exhibits.
| 11(a) (2) | Section 302 certifications of the principal executive officer and principal financial officer of Registrant. |
| (b) | Section 906 certification. |
SIGNATURES
Pursuant to the requirements of the Securities Exchange Act of 1934 and the Investment Company Act of 1940, the registrant has duly caused this report to be signed on its behalf by the undersigned, thereunto duly authorized.
| HARTFORD SERIES FUND, INC. | |
| Date: August 16, 2010 | By: /s/ Robert M. Arena, Jr. |
| Robert M. Arena, Jr. | |
| Its: President |
Pursuant to the requirements of the Securities Exchange Act of 1934 and the Investment Company Act of 1940, this report has been signed below by the following persons on behalf of the registrant and in the capacities and on the dates indicated.
| Date: August 16, 2010 | By: /s/ Robert M. Arena, Jr. |
| Robert M. Arena, Jr. | |
| Its: President | |
| Date: August 16, 2010 | By: /s/ Tamara L. Fagely |
| Tamara L. Fagely | |
| Its: Vice President, Controller and Treasurer |
EXHIBIT LIST
| 99.CERT | 11(a)(2) | Certifications |
| (i) Section 302 certification of principal executive officer | ||
| (ii) Section 302 certification of principal financial officer | ||
| 99.906CERT | 11(b) | Section 906 certification of principal executive officer and principal financial officer |